Embed Size (px)
Citation preview

ESTIMATING EXTRACTABLE SOIL MOISTURECONTENT FOR AUSTRALIAN SOILS
TECHNICAL REPORTReport 04/3
June 2004
Tony Ladson / James Lander / Andrew Western / Rodger Grayson
C O O P E R A T I V E R E S E A R C H C E N T R E F O R C A T C H M E N T H Y D R O L O G Y

Estimating Extractable Soil Moisture Content forAustralian Soils
Bibliography
ISBN 1 920813 08 X
1. Soil moisture - Measurement. I. Ladson, Anthony Richard, 1963-. II.Cooperative Research Centre for Catchment Hydrology. (Series: Report(Cooperative Research Centre for Catchment Hydrology); 04/3)
631.4320994
Keywords
Soil moistureSoil water balanceField testsSoil propertiesTime seriesSoil profilesSoil water relations
© Cooperative Research Centre for Catchment Hydrology, 2004

COOPERAT IVE RESEARCH CENTRE FOR CATCHMENT HYDROLOGY
i
EstimatingExtractable SoilMoisture Contentfor Australian Soils
Tony Ladson / James Lander / AndrewWestern / Rodger Grayson
Technical Report 04/3June 2004
Preface
This report uses an unconventional approach toestimating plant available water content for Australiansoils. Instead of using laboratory measurements ofsoil properties, these authors have collected actualmeasurements of soil moisture from a wide range offield studies around Australia. In total, extractable soilwater capacity is presented for 180 locations thatinclude the six States and two Territories. They havealso compared estimates of extractable soil moisturefrom field measurements with those from the Atlas ofAustralian Soils.
The 'active' soil store - the amount of water than canbe evaporated from soils or used by plants - is a keyparameter in hydrologic models. The work presentedhere is an important contribution to the catchmentmodelling effort that is core business of theCooperative Research Centre (CRC) for CatchmentHydrology. I commend this report to anyoneinterested in the interaction between water andAustralian soils.
Geoff Podger, Program Leader Predicting Catchment BehaviourCRC for Catchment Hydrology

COOPERAT IVE RESEARCH CENTRE FOR CATCHMENT HYDROLOGY
ii

COOPERAT IVE RESEARCH CENTRE FOR CATCHMENT HYDROLOGY
iii
Preface i
Table of Contents iii
List of Figures iv
List of Tables v
1. Introduction 1
1.1 Extractable Soil Moisture 1
2. Our Approach to Estimating Extractable Soil Moisture 3
2.1 Searching for Soil Moisture Data 3
2.2 Types of Soil Moisture Data Available 4
2.2.1 Time Series of the Soil Moisture Profile Measurements 4
2.2.2 Time Series of the Total Moisture Content in a Soil Profile 4
2.2.3 Artificial Manipulation to Produce Maximally Wet or Dry Soils 7
3. How Dry is Dry and How Wet is Wet? 9
4. A Database of Soil Moisture Store Information 13
4.1 General Information about the Database 13
4.2 Description of Database Fields 13
4.3 Example 15
5. Comparison with the Atlas of Australian Soils 17
6. Conclusion 23
7. References 25
APPENDIX 1 31
APPENDIX 2 35
APPENDIX 3 37
APPENDIX 4 63
APPENDIX 5 73

COOPERAT IVE RESEARCH CENTRE FOR CATCHMENT HYDROLOGY
iv
List of Figures
Figure 1 Sites where Extractable Soil Moisture Estimates are Available 5
Figure 2 Wettest and Driest Soil Moisture Profiles for Lidsdale, NSW 5
Figure 3 Time Series of Soil Moisture Storage for Lidsdale, NSW 7
Figure 4 Monthly Rainfall During the Period of Measurement at Lidsdale (October 1968 to April 1971) compared to the 25th and 75th Percentiles, and the Median, for Monthly Rainfall from January 1940 to December 1999 10
Figure 5 Rank of the Driest Month when Comparing RainfallDuring the Period when Soil Moisture was Measured with 60 Years of Rainfall Data (1940 – 1999) 10
Figure 6 Rank of the Wettest Month when Comparing Rainfall during the Period when Soil Moisture wasMeasured with 60 Years of Rainfall Data (1940 – 1999) 11
Figure 7 Difference in Rank of Wettest and Driest Months for the 45 Sites 11
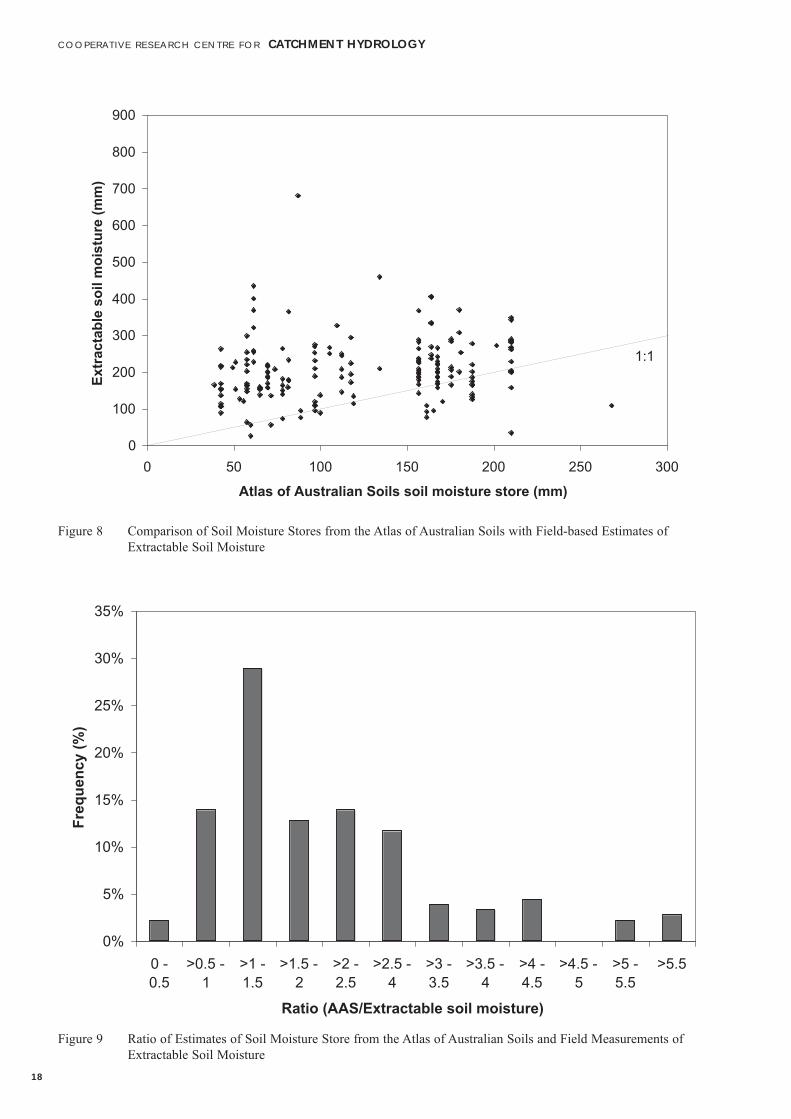
Figure 8 Comparison of Soil Moisture Stores from the Atlas of Australian Soils with Field-Based Estimates ofExtractable Soil Moisture 18
Figure 9 Ratio of Estimates of Soil Moisture Store from the Atlas of Australian Soils and Field Measurements of Extractable Soil Moisture 18
Figure 10 Comparison of Field-Based Estimates of ExtractableSoil Moisture with the Estimates of Available Water Capacity from the Atlas of Australian Soils 19
Figure 11 A Comparison of Soil Moisture Store per Unit Depth 20
Figure 12 A Comparison of Solum Depth from the Atlas ofAustralian Soils and Active Soil Depth from FieldMeasurements 20
Figure 13 Active Soil Depths Based on Field Measurements of Extractable Soil Moisture for Three Vegetation Types and Fallow Conditions 21

COOPERAT IVE RESEARCH CENTRE FOR CATCHMENT HYDROLOGY
v
List of Tables
Table 1 Types of Soil Moisture Information 6
Table 2 Fields in the Database 13

COOPERAT IVE RESEARCH CENTRE FOR CATCHMENT HYDROLOGY
vi

COOPERAT IVE RESEARCH CENTRE FOR CATCHMENT HYDROLOGY
1
1. Introduction
The amount of water that can be stored in soil andevaporated or used by plants is a key parameter inhydrologic models, weather prediction models and isimportant for crop and pasture production. Broadscale estimates of the dynamic soil store are availableusing data from the Atlas of Australian Soils (AAS)but there has been limited validation of the results.This report describes the collection of soil moisturestorage data, based on field measurements, and acomparison with AAS values.
1.1 Extractable Soil Moisture
A key feature of this project is the estimation ofextractable soil moisture from field measurements.This contrasts with the standard approach where themaximum available soil water store is determinedfrom parameters estimated in a laboratory. Generally,soil samples are analysed in a laboratory to determinethe moisture content at the lower limit of availabilityto plants (–15 bar) and at “field capacity” (commonly–0.10 bar to –0.33 bar). The difference between thesevalues, often called plant available water (PAW), givesan estimate of the maximum amount of water that canbe stored in the soil and used by plants, provided a soil(or rooting) depth is assumed. It is common forrelationships to be formed between laboratory derivedPAW, and soil properties such as soil texture. Thisprocedure, known as the pedo-transfer approach,allows information from standard soils maps to beused to infer, and map, PAW (Williams, 1983).
The concept of a maximum soil store is also importantin hydrologic models. In these models, the soil waterstore is often represented by a bucket that receiveswater from rain and loses water to evaporation,evapotranspiration and deep drainage. Surface runoffoccurs if the bucket overflows. In spatially explicitmodels the maximum soil store at any grid cell willdepend on the soil properties at that location. Oftenthe plant available water is used as an estimate of thesize of the bucket and a good estimate of this value isimportant if models are to behave in a way thatmatches known physical processes.
Ritchie (1981) noted the practical problems associatedwith the estimation of plant available water using the
standard approach. Accurate estimates depend onknowledge of field capacity, permanent wilting pointand bulk density for the whole profile within the rootzone. In reality these parameters are likely to changevertically within the profile and between profiles.Estimates of the rooting depth are also likely to besubject to error. There is also the issue of which soilwater potentials used in the analysis actuallycorrespond to ‘true’ field capacity and permanentwilting point.
As an alternative approach, Ritchie (1981) suggestedthe concept of extractable soil moisture as a practicalway of overcoming some of the problems associatedwith estimating available soil moisture fromlaboratory measurements. The extractable moisture isdefined as the difference between the highestmeasured volumetric water content in the field and thelowest measured volumetric water content. This couldoccur for example when plants are very dry and leavesare either dead or dormant, or in fallow conditionsfollowing a long period of dry weather. Extractablesoil water takes the root distribution into accountprovided the measured soil moisture profile is deeperthan the rooting depth. Estimates do not require soilwater content/potential relationships for each soildepth where physical properties change. Ritchie(1981) found that field measurements of the totalextractable water are often less variable spatially thanavailable water estimated from water content-potentialmeasurements.
Ratliff et al., (1983) compared field and laboratorymeasurements of the limits of soil water availability.Field measured wettest and driest profiles werecompared with laboratory measurements of soilmoisture content at –15 bar (401 observations) and–0.33 bar (282 observations). Results showedlaboratory measurements of the lower limit of soilmoisture availability underestimated the field valuesfor sands, silt loams and sandy clay loams andoverestimated values for loams, silty clays, and clays.For the upper limit, laboratory estimates were less thanthe field measurements for sands, sandy loams, andsandy clay loams and were greater than laboratorymeasurements for silt loams, silty clay loams, and siltyclays. They concluded that field estimates of soilwater availability should be preferred over laboratorymeasurements for water balance calculations.

COOPERAT IVE RESEARCH CENTRE FOR CATCHMENT HYDROLOGY
2

COOPERAT IVE RESEARCH CENTRE FOR CATCHMENT HYDROLOGY
3
2. Our Approach to Estimating Extractable Soil Moisture
Our approach has been to estimate extractable soilmoisture capacity from field measurements of soilmoisture content. A time series of soil moisture valuesover the depth of the soil, shows the actual changes insoil moisture so the extractable soil moisture can beestimated from the difference between the wettest anddriest profiles.
In simple terms, our methodology involved:
• Obtaining a time series of profile soil moisture data;and
• Defining the ‘wettest’ and ‘driest’ profiles and usingthese to estimate extractable soil moisture.
The extractable soil moisture depends on the soil typeand the vegetation type. Deeper-rooted vegetationwill be able to extract larger amounts of soil moisturebecause it has access to more of the soil profile.Conversely, even fallowed soils will experiencewettest and driest profiles so it is possible to estimatea value for extractable soil moisture when there is novegetation.
2.1 Searching for Soil Moisture Data
There have been many, perhaps hundreds, of projectsin Australia that have involved measurement of soilmoisture. These include studies of the performance ofcrop types, cropping systems, water balance studies,analysis of recharge associated with salinityinvestigations and studies of water yield followingfires or forest cutting. Profile soil moisturemeasurements have been measured using NeutronMoisture Meters, Time Domain Reflectometry, andGravimetric Sampling. Originally we intended to trackdown raw data from a large number of studies wherethere were long time-series of profile measurements ofsoil moisture. This turned out to be impossible.Although over 90 researchers were contacted (seeAppendix 1), and we received excellent cooperation,few usable datasets were obtained (see Appendix 2).
Commonly, the data used by hydrologists aremeasured and managed by organisations with aparticular mandate, and the resources necessary to
archive and make available their information.Meteorological and streamflow data are two obviousexamples. But information where there are nocoordinated monitoring networks is difficult to trackdown. Much of the information we have been seekingwas collected as part of individual research projects bya researcher, or a small group of researchers. Themotivations in these sorts of projects are to answersome specific questions and make the results availablethrough publications. Indeed we have gained a lot ofthe information we need from published papers andreports. However, the basic data normally reside infield books or computer media of different sorts,depending on the age of the study. These data havebeen used by the research team at the time, but, fromthe point of view of the researchers (and likely theclients), once the appropriate analysis and publicationshave been completed, there is little need to doanything more. That makes the data difficult forothers to obtain and use, especially when corporatememory starts to fade.
In this project, the way forward was to use soilmoisture data and results from published reports andjournal articles. Generally these data are welldocumented and cleaned up, although probably only asmall amount of the total data collected is available.Over 200 journal articles were examined andinformation from about 75 articles contributed to ourdatabase. A particularly valuable source of data wasthe work of Agricultural Production Systems ResearchUnit in Toowoomba, Queensland, which has publishedan extensive guide to soil water availability forsouthern Queensland. In all, storage capacities wereobtained for 180 unique soil, crop, location,combinations (Figure 1).

COOPERAT IVE RESEARCH CENTRE FOR CATCHMENT HYDROLOGY
4
2.2 Types of Soil Moisture Data Available
There are three types of data available that could beused to calculate the extractable soil moisture content.
1. A time series of profile measurements that showhow the soil moisture varies with depth;
2. A time series of the total amount of moisture in aparticular depth of soil at a site; and
3. Information on profile moisture content where asoil had been artificially manipulated to be as wetand as dry as possible.
2.2.1 Time Series of the Soil Moisture ProfileMeasurements
A time series of soil moisture profiles can provideinformation on the extractable soil moisture. Ifprofiles are measured on a number of dates, the wettestand driest profiles can be identified and the differencebetween them used to estimate extractable soilmoisture and active soil depth. An example is show inFigure 2. Soil moisture storage was measured aboutevery two weeks in the top 2.2 m of the soil profileunder a Pinus radiata plantation near Lidsdale, NSW(33.43S, 150.07E) between October 1968 and April1971 (Smith, 1972). Soils are hard setting loams withmottled yellow clayey subsoil derived from bothDevonian and Permian parent material: Northcote(1966) classifications Dy 3.41 and Dy 2.61.
The driest profile occurred on the 4th February 1969and the wettest profile on the12th February 1971. Themaximum active soil moisture store is the differencebetween the wettest and driest profiles (Figure 2) i.e.234 mm.
An active soil depth can also be defined. For thisexample, most of the soil moisture change occurs inthe upper part of the profile. Below about 1200 mmthere is little change so we define 1200 mm as theactive depth (Figure 2). Our estimate of theextractable soil store is the difference between thewettest and driest profile between the soil surface andthe active depth.
There are two features of this data set that are worthnoting and which mean the estimate of extractable soilmoisture, is this case, is likely to be accurate.
1. The active depth can be clearly defined, that is,there is little soil moisture change in the profilebelow the depth of 1100 mm; and
2. The active depth occurs within the range of soil thatwas measured i.e. the top 2.2 m.
Not all the profile measures we used share thesedesirable features. In fact, we divided the profilemeasurements into four types depending howaccurately the active soil store and active depth couldbe estimated. These four profile types are listed anddefined in Table 1. In addition, to the four profiletypes, there were two other sources of soil moisturedata which are discussed in the next sections anddefined in Table 1.
2.2.2 Time Series of the Total MoistureContent in a Soil Profile
Extractable soil moisture is estimated, with varyingaccuracies, from the four types of profilemeasurements, as explained above. A time series oftotal soil moisture data is the fifth type of data that wasused (Table 1) to estimate the active soil storage. Anexample of this type of data is shown in Figure 3which is a time series of moisture storage at Lidsdale(Smith, 1972). For Lidsdale, time series of both thesoil profiles and the total moisture content wereavailable, but for most sites this type of informationwas not provided as only a summary is recorded in thejournal papers or reports that we could access.
From the time series, the driest conditions occurred onthe 4th February 1969 and the wettest on the 12th
February 1971. An estimate of the extractable soilmoisture is the difference between the soil moisturestorage on these dates i.e. 234 mm, the same as thevalue calculated from the difference in the soil profiles(Figure 2).
If only a time series is available then there is noindication of the active depth of soil. Themeasurement depth may be reported but the activedepth and the measurement depth may not coincide.In these cases, the measured depth is recorded as theactive depth in the data base.
If the true active depth happens to be greater than themeasurement depth, our estimate of extractable soilmoisture will be less than the true value since some ofthe soil store is unmeasured.

COOPERAT IVE RESEARCH CENTRE FOR CATCHMENT HYDROLOGY
5
Figure 1 Sites where Extractable Soil Moisture Estimates are Available
Figure 2 Wettest and Driest Soil Moisture Profiles for Lidsdale, NSW

COOPERAT IVE RESEARCH CENTRE FOR CATCHMENT HYDROLOGY
6
No Definition Profile Type
1 Active depth < measured depth.
Clearly defined active depth with no active storage below thisdepth.
This type of profile provides the most accurate estimate of theextractable soil moisture.
2 Active depth > measured depth but there is limited storagebelow the measured depth.
Measurement of soil moisture within the profile was made atan insufficient depth to capture the whole active storage.However, the difference between the wettest and driestprofiles at the maximum measured depth is less than 10%.
This type of profile provides a reasonable but underestimate ofthe extractable soil moisture and the active depth.
3 Active depth is defined as being less than measured depth.
Soil moisture differences between wettest and driest profilesoccur down to the bottom of the measured profile, but there islittle change below a particular depth (-------). This depth wasdefined as the active depth for this soil type. Extractable soilmoisture was calculated for the soil between the surface andthe active depth.
4 Active depth > measured depth and there is a substantialstorage below the measured depth.
Values of extractable soil moisture and active depth from theseprofiles will be underestimates.
5 Time series of soil moisture measurements.
Active soil storage can be estimated from the differencebetween the wettest and driest measurements but, withoutadditional information, the active depth can not be estimated(see Section 2.2.1).
6 Artificial manipulation to produce maximally wet or dry soils.Extractable soil moisture can be estimated from soil profilesthat have been manipulated to be maximally wet or dry (seeSection 2.2.3).
Table 1 Types of Soil Moisture Information

COOPERAT IVE RESEARCH CENTRE FOR CATCHMENT HYDROLOGY
7
2.2.3 Artificial Manipulation to ProduceMaximally Wet or Dry Soils
The sixth type of data we have used is where there isinformation on soil moisture profiles in soils that havebeen artificially wetted or dried to obtain an estimateof the maximum active soil store, or where there isopportunistic sampling of what is believed to be thewettest and driest profiles. The AgriculturalProduction Systems Research Unit in Toowoomba,Queensland, has routinely collected this type of data.Procedures for wetting the soil to determine theDrained Upper Limit include ponding water on thesurface, which is suitable for light textured soils, ortrickle irrigation at just below the surface infiltration
rate, for heavier soils. Dry profiles can be obtained byexcluding rain from a vigorously growing crop andthen sampling the profile at flowering and cropmaturity (Dalgliesh and Cawthray, 1998). This type ofdata does provide information on active soil depthbecause profiles are measured under wettest and driestconditions.
Of the 180 active soil moisture storage measurementsin our database, 91 are based on time series measuresof profiles or total soil storage. The other 89 valuesare from situations where the soil was artificiallywetted and dried to obtain an estimate of themaximum active soil store.
Figure 3 Time Series of Soil Moisture Storage for Lidsdale, NSW

COOPERAT IVE RESEARCH CENTRE FOR CATCHMENT HYDROLOGY
8

COOPERAT IVE RESEARCH CENTRE FOR CATCHMENT HYDROLOGY
9
3. How Dry is Dry And How Wet is Wet?
Field measurements of the wettest and driest profiles,which occur under natural conditions, will only give agood estimate of the total active soil moisture store ifthese profiles are indeed close to the wettest and driestthe soils are likely to get. Extreme profiles will largelydepend on the weather conditions during themeasurement period. Clearly, the longer themeasurement period the more likely that extremes willbe encountered. For this reason, where we based theactive soil store estimate on a time series of soilmoisture measurements, a minimum of two years ofdata has been used.
We have also analysed the rainfall during themeasurement period. For each of the locations (91measurements at 45 sites), the rainfall during themeasurement period was compared to long-termrainfall data. Comparisons were made using sixtyyears of monthly rainfall data (1940 to 1999),provided by the Bureau of Meteorology. These datacome from a monthly rainfall gridded dataset, whichhas been developed by the Bureau, where rainfall hasbeen estimated for square cells of 0.25 degrees(approximately 25 km x 25 km) depending onlatitude).
The median, 25th and 75th percentile rainfalls for theperiod 1940 to 1999 were compared to the rainfallduring the soil moisture measurement period at the 45sites (see Appendix 3). For example, the rainfallduring the 31 months when soil moisture wascollected at Lidsdale, NSW (October 1968 to May1971) can be compared to summary statistics forJanuary 1940 to December 1999 for the grid cellcentred on the Lidsdale site (see Figure 4).
The wettest and driest months during the measurementperiod were also compared to the long-term rainfalldata. The rank of the wettest and driest month wascalculated based on the 720 months of long-term data.For example, at Lidsdale, only 0.4% of monthsbetween 1940 and 1999 were drier than the driestmonth during the measurement period, and only 4% ofmonths were wetter than the wettest month. Extremeranks increase the likelihood that the measured wettest
and driest profiles are close to the extreme values sothat the estimate of the soil moisture store isapproximately correct. For the 45 sites where rankswere calculated, 82% of the driest months were in thedriest 5% of all months and 87% of wettest monthswhere in the wettest 5% of all months (Figure 5 andFigure 6). The difference between the rank of thewettest and driest months was also calculated such thata difference of 100% would mean the highest rankedwettest and the highest ranked driest months occurredduring the measurement period. Eighty nine percentof sites had a difference in ranks of greater than 90%(Figure 7).
One limitation of this analysis is specification of thestart and end of the measurement period. This wastaken from the source documents where possible. Ifonly the start and end year were specified, the startingand ending months were taken to be January andDecember respectively, which may lead to anunderestimation of the ranks of the wettest and driestmonth. Full results of the analysis of rainfall are listedin Appendix 4. A macro was developed in MicrosoftExcel to facilitate the analysis.

COOPERAT IVE RESEARCH CENTRE FOR CATCHMENT HYDROLOGY
10
Figure 4 Monthly Rainfall During the Period of Measurement at Lidsdale (October 1968 to April 1971) Compared to
the 25th, and 75th Percentiles, and the Median, for Monthly Rainfall from January 1940 to December 1999.
Figure 5 Rank of the Driest Month when Comparing Rainfall During the Period when Soil Moisture was Measuredwith 60 Years of Rainfall Data (1940 – 1999). Results are for 45 Locations.

COOPERAT IVE RESEARCH CENTRE FOR CATCHMENT HYDROLOGY
11
Figure 6 Rank of the Wettest Month when Comparing Rainfall during the Period when Soil Moisture was Measuredwith 60 Years of Rainfall Data (1940 – 1999). Results are for 45 Locations.
Figure 7 Difference in Rank of Wettest and Driest Months for the 45 Sites (where 100% would mean the highest-ranked wettest and the highest- ranked driest months occurred during the measurement period).

COOPERAT IVE RESEARCH CENTRE FOR CATCHMENT HYDROLOGY
12

COOPERAT IVE RESEARCH CENTRE FOR CATCHMENT HYDROLOGY
13
4. A Database of Soil Moisture Store Information
4.1 General Information about the Database
Information on soil moisture has been collected in aMicrosoft Access database. This information ismainly based on journal articles, conference papersand reports as noted in Section 2.
4.2 Description of Database Fields
There are 25 fields in the database for each record asdetailed in Table 2. Each record corresponds to aparticular combination of soil type, vegetation typeand location.
Field Brief Explanation
Site location The name of the site as referred to the source documentation
State Australian state or territory
Latitude Latitude in decimal degrees
Longitude Longitude in decimal degrees
Reliability of location 1 – reliable location as determined from the source document or measureddirectly from a map.
2 – location may be unreliable as there was limited information in thesource document
Site map Is a site map available in the source document? (Yes/No)
Vegetation type Vegetation type as recorded in the source document
Generalised vegetation type 1 - Trees
2 - Crops
3 - Pasture
4 - Fallow
Land use Land use as noted in the source document
Terrain Terrain as noted in the source document
Soil type Soil type as noted in the source document
Data type Type of soil moisture information as documented in Table 1.
Horizon depth Is information on horizon depth recorded in the source document?(Yes/No)
Porosity/bulk density In information on porosity and/or bulk density recorded in the sourcedocument? (Yes/No)
Soil depth Soil depth as noted in the source document, or the depth of measurement
Table 2 Fields in the Database (continued next page)

COOPERAT IVE RESEARCH CENTRE FOR CATCHMENT HYDROLOGY
14
Field Brief Explanation
Stored soil moisture The total stored soil moisture as determined from the source document
Active soil depth Best estimate of active soil depth based on soil moisture data provided in thesource document (see Section 2.2.1 for details of analysis)
Active soil moisture store Best estimate of the active soil moisture store (the extractable soil moisture).In some cases this may be different from the stored soil moisture,particularly for profiles of type 3 (see Table 1 and Section 2.2.1)
Missing water Was the whole active soil moisture store measured (Yes/No). This refersparticularly to profiles of type 4 (Table 1) where the active storage appearsto extend below the measured depth
Start/Stop The beginning and end of the measurement period. This information comesfrom the source document. The month and year is listed where it is availablein the source document
Rainfall Has rainfall data been used to test the representativeness of the period whensoil moisture was measured (see section 3 for details)? This test was donewherever possible that is, where dates of soil moisture measurements werenoted in the source document
Rank of the driest month This is the rank (scaled between 0 and 1) of the driest month in the periodwhen the soil moisture was measured compared to all the monthly rainfal1in 740 months between 1940 and 1999 (see Section 3). The driest monthbetween 1940 and 1999 is ranked as zero
Rank of the wettest month This is the rank (scaled between 0 and 1) of the wettest month in the periodwhen the soil moisture was measured compared to all the monthly rainfal1in 740 months between 1940 and 1999 (see Section 3). The wettest monthbetween 1940 and 1999 is ranked as zero
Monitoring frequency Frequency that soil moisture was measured as noted in the source document
References Reference to source document(s)
Table 2 Fields in the Database (cont.d)

COOPERAT IVE RESEARCH CENTRE FOR CATCHMENT HYDROLOGY
15
4.3 Example
An example is presented below for extractable soilmoisture data from Lidsdale, NSW
Site location: Lidsdale
State: NSW
Latitude: 33.43 S
Longitude: 150.07W
Reliability of location: 1 - reliable
Site map: True (available)
Vegetation type: Radiata pine
Generalised vegetation type: Forestry
Terrain: Hills
Soil type: Dy 3.41/Dy 2.61 (Northcote)
Data type: 3
Information on Horizon depth: True (Yes)
Information on Porosity/bulk density: False (No)
Soil depth: 2.2 m
Stored soil moisture: 234 mm
Active soil depth: 1200 mm
Active soil moisture store: 234
Missing water: False
Start/Stop: October 1968 to April 1971
Rainfall: True (Rainfall data is available and has been used to test representativeness of the measurementperiod)
Rank of the driest month: 0.004 (scaled from 0 to 1, where 0 implies driest on record)
Rank of the wettest month: 0.041 (scaled from 0 to 1, where 0 implies the wettest on record)
Monitoring frequency: Weekly
References: Pilgrim et al., (1982), Smith et al., (1974), Smith (1974)

COOPERAT IVE RESEARCH CENTRE FOR CATCHMENT HYDROLOGY
16

COOPERAT IVE RESEARCH CENTRE FOR CATCHMENT HYDROLOGY
17
5. Comparison with the Atlas of Australian Soils
The Atlas of Australian Soils (Northcote et al., 1960-1968) provides spatial information on soil landscapesfor the whole of Australia based on soil characteristicsthat can be observed in the field. This has been animportant resource for over three decades, andremains the only consistent source of data for thewhole continent. However until recently it has notbeen straightforward to use the Atlas to establish thesoil physical properties that are important forhydrologic analysis.
McKenzie et al., (2000) (following from McKenzieand Hook, 1992) have addressed this problem andprovide data on soil physical properties for the 725soils in the Digital Atlas of Australian Soils (BRS,1991). Soil properties have been estimated using asimple two-layer soil model consisting of A and Bhorizons. Soil water retention properties werecalculated for each soil, based on estimates ofthickness, texture, bulk density and pedality, usingWilliams (1983) approach. The available watercapacity for each layer was calculated from fitted soilwater retention curves assuming upper and lowerlimits of –0.1 bar and –15 bar respectively.
The Digital Atlas of Australian Soils provides data forpolygons (there are 22,560 in total) that represent soilsin particular regions. Each of the polygons isattributed with one of 3060 soil landscape types, manyof which occur more than once. For each map unit,the dominant soil type is described (referred to as thedominant Principle Profile Form) along with anysubdominant Principle Profile Forms. McKenzie etal., (2000) records up to five Principle Profile Formsfor each soil landscape. Each of the Principle ProfileForms includes an estimate of solum thickness (thesum of the depth of the A and B horizons) and theavailable water capacity over that depth. Wheninterrogating the data on soil physical properties,specifying a location, will link to a polygon and returninformation on the dominant and subdominantPrinciple Profile Forms.
Our estimates of the active soil moisture store, basedon field measurements, provide an opportunity for
comparison with the available water capacity from theinterpretation of the Atlas of Australian Soilsinformation. For each of the locations in our database(Figure 1) the available water capacity estimated forcorresponding dominant Principle Profile Form wascompared to the extractable soil moisture store (Figure8). In several cases, there is more than one estimate ofextractable soil moisture store for a particular locationbecause measurements were made under more thanone vegetation type. All the available estimates havebeen included in Figure 8. The outlying high storagevalue shown in Figure 8 of 680 mm is from a site inthe Brindabellas, ACT where soil moisture wasmeasured under a mixed Eucalypt forest during adrought (Talsma and Gardner, 1986).
The results show that the soil moisture store from theAtlas of Australian Soils is generally smaller than theestimate from field measurements. A comparison ofthe ratio of the differences (Figure 9) showed that 42%of the estimates of extractable soil moisture weregreater than twice the value from the Atlas ofAustralian Soils. In general, estimates of availablewater capacity from McKenzie et al., (2000) could beconsidered a reasonable lower bound on field-basedestimates of the actual dynamic soil moisture store. Itshould be noted that the information on location in ourdatabase is of variable quality and depends on theprecision in the original reference, supplementedwhere appropriate (and possible) by direct discussionswith researchers. Errors in location will contribute asmall amount of the variance shown in Figure 8.
The comparison in Figures 8 and 9 is made using thedominant Principle Profile Form for each polygon thatmatches a particular location. In most cases there willalso be subdominant Principle Profile Forms with theirown associated estimates of available water capacity.These provide a greater spread of estimates as shownin Figure 10 where the extreme variability is apparent,although the extractable soil moisture store is stillgenerally much larger than the estimate using AASdata.
Estimates of the available water capacity provided byMcKenzie et al., (2000) are the product of the depth ofthe soil profile and the soil moisture storage capacityper unit depth. Equivalent parameters are alsoavailable from our database where an active soil depth
COOPERAT IVE RESEARCH CENTRE FOR CATCHMENT HYDROLOGY
18
Figure 8 Comparison of Soil Moisture Stores from the Atlas of Australian Soils with Field-based Estimates ofExtractable Soil Moisture
Figure 9 Ratio of Estimates of Soil Moisture Store from the Atlas of Australian Soils and Field Measurements ofExtractable Soil Moisture

COOPERAT IVE RESEARCH CENTRE FOR CATCHMENT HYDROLOGY
19
is defined based on where the wettest and driestprofiles meet or the maximum depth of soil moisturemeasurement; whichever is less (Table 1).
The soil moisture store per unit depths are comparedin Figure 11 using only the dominant Principle ProfileForm for each location. In this case the estimates fromMcKenzie et al., (2000) and the field measurementscluster around the 1:1 line suggesting reasonableagreement, although clearly the scatter is large.
The active soil depth from field measurements, and thesolum thickness from the Atlas of Australian Soils arecompared in Figure 12. Active soil depths aregenerally much larger than solum thickness estimates.It is the underestimate of active soil depth thatexplains the low estimate of soil moisture store fromthe AAS interpretation shown in Figure 8.
McKenzie et al., (2000) acknowledges that solumthickness estimates are likely to be subject to error.Unfortunately, the thickness of individual soil layers,and the depth of the soil profile, are often not recordedas part of the Northcote classification and there is only
imprecise definition of the depth of soil that can beexploited by plants. Often plants will extract moisturefrom below the A and B horizons and historicaldatasets do not provide any consistent information ondeeper soil layers. Data in existing soils databasesalso tends to be censored because of the method usedto collect soil profile information, for example, soilpits and augers, are often restricted to one to twometres. Often soil surveys for agricultural purposesrestrict examination to the first 1 m of the soil profileand some Principle Profile Forms are only comprisedof an A horizon, yet roots can penetrate deeper soils(McKenzie et al., 2000).
Clearly, estimates of available water capacity could beimproved by better soil descriptions but it is alsonecessary to use appropriate estimates of active soildepth. The active soil depth is partly determined byrooting depth of vegetation but it is also possible formoisture to be withdrawn from the soil under fallowconditions. Estimates of active soil depth from ourdatabase for trees, crops, grass and fallow are shownin Figure 13.
Figure 10 Comparison of Field-based Estimates of Extractable Soil Moisture with the Estimates of Available WaterCapacity from the Atlas of Australian Soils. Estimates for the Dominant and Subdominant Principle ProfileForms are shown for each Location

COOPERAT IVE RESEARCH CENTRE FOR CATCHMENT HYDROLOGY
20
Figure 11 A Comparison of Soil Moisture Store Per Unit Depth
Figure 12 A Comparison of Solum Depth from the Atlas of Australian Soils and Active Soil Depth from FieldMeasurements

COOPERAT IVE RESEARCH CENTRE FOR CATCHMENT HYDROLOGY
21
The active soil depth for crop, grass, and fallow aregenerally one to two metres with some outliers that areprobably explained by soil type. Our data suggests thatwherever there are deep sandy soils active depths maybe very large. For example, the two active soil depthsfor crop, (of about 5 m) are for Lucerne grown on deepsandy soils near Keith, South Australia (Holmes,1960). The active soil depths for grass of around fivemetres were measured on deep sands near Pinjarra,WA (75 km south of Perth) (Carbon et al., 1982) andthe high active soil depth for fallow conditions (ofabout 3.7 m) was for a deep sandy soil near WonganHills in Western Australia about 170 km north-east ofPerth where there may have been interaction withgroundwater.
The active soil depth for trees is more variable than forcrop, grass and fallow, ranging from 1 to 12 m. Again,the largest active depths are for deep sandy soils.Further work is required before the active soil depthcan be predicted from soil types and tree taxa.
Figure 13 Active Soil Depths based on Field Measurements of Extractable Soil Moisture for three Vegetation Typesand Fallow Conditions

COOPERAT IVE RESEARCH CENTRE FOR CATCHMENT HYDROLOGY
22

COOPERAT IVE RESEARCH CENTRE FOR CATCHMENT HYDROLOGY
23
6. Conclusion
Information on extractable soil moisture has beengathered for 180 unique combinations of location, soiland vegetation types. This dataset provides estimatesof the soil moisture storage based on fieldmeasurements of wettest and driest soil moistureprofiles.
Our search for this profile information revealeddeficiencies in the way data from experimental studiesis archived in Australia. For parts of the hydrologiccycle, such as rainfall and streamflow, there isaccurate current and historical information that iseasily accessible. This contrasts with soil moisturedata that are usually gathered for specific projects sothere is little incentive to archive it in a form that canbe interpreted by others. Most of the data we havegathered were from published sources, whichprobably represents only a small proportion of the soilmoisture measurements that have been collected but isalso probably the proportion that researchers are mostconfident in.
Analysis of rainfall during the periods when soilmoisture was measured, suggests that observed driestand wettest profiles are good estimates of theminimum and maximum storage values. In over 80%of cases, the wettest and driest months during themeasurement periods were ranked within 5% of thewettest and driest months of a 60-year rainfall record(1940 to 1999). Around 40% of the time they wereranked within the top 1%.
The extractable soil moisture stores were comparedwith the available water capacity estimated byMcKenzie et al., (2000) for the Atlas of AustralianSoils (AAS). Preliminary results show that data fromthe Atlas of Australian Soils provide a useful lowerbound for measured dynamic soil moisture storage,but of the sites examined, 42% had extractable storesgreater than two times the AAS values. Our analysisshows that estimates of available water capacity fromthe Atlas of Australian Soils must be treated withcaution particularly where there are trees. There is thepotential of using information on vegetation type tobetter estimate active soil depths but further work isneeded to quantify these relationships.

COOPERAT IVE RESEARCH CENTRE FOR CATCHMENT HYDROLOGY
24

COOPERAT IVE RESEARCH CENTRE FOR CATCHMENT HYDROLOGY
25
7. References
Aitchison, G. D. and Holmes, J. W. (1953). “Aspectsof swelling in the soil profile.” Australian Journal ofApplied Science. 4.: 245-259.
Alksnis, H., Daniel, P. and Kalma, J. D. (1990). Theregional evaporation project: Soil moisture andrainfall data. CSIRO Division of Water Resources.Canberra: 1-15.
Allen, G. H. and George, Q. D. A. (1956). “Wheatinvestigations at Biloela regional experiment station.”Queensland Journal of Agricultural Science. 13.: 19-46.
Angus, J. F., Gault, R. R., Peoples, M. B., Strapper, M.and van Herwaaden, A. F. (2001). “Soil waterextraction by dryland crops, annual pastures, andlucerne in south-eastern Australia.” AustralianJournal of Agricultural Research. 52.: 183-192.
Anon. (2000) "Journey to the centre of the earth"American Scientist, Vol 88 No. 5: p 401-402.
APSIM (Agricultural Production Systems Simulator)(2002). The APSIM SoilWat Module.http://www.apsim.info/Documentation/modules/soilwat2_science.pdf (17 March 2003)
BRS (Bureau of Rural Sciences after CommonwealthScientific and Industrial Research Organisation)(1991) Digital Atlas of Australian Soils (ARC/INFO®vector format). [Online]: http://www.brs.gov.au/data/datasets (14 December, 2001)
Bullock, P. R. (1987). Hydrological data for theYarralaw seepage scald, Southern Tablelands, NewSouth Wales. CSIRO Australia. Institute of NaturalResources and Environment. Division of WaterResources Research. Canberra: 1-67.
Bullock, P. R. and Neil, D. T. (1990). “Thecatastrophic nature of seepage scald formation insoutheastern Australia.” Catena. Supplement 17.: 195-208.
Burch, G. J., Bath, R. K., Spate, A. P., Nicholls, A. O.and O'Loughlin, E. M. (1983). Soil water andinfiltration and runoff characteristics of forest andgrassland catchments at Puckapunyal in centralVictoria. Hydrology and Water Resources SymposiumI.E. Australia., November, 1983, Hobart: 293-299.National Conference Publications.
Carbon, B. A., Roberts, F. J., Farrington, P. andBeresford, J. D. (1982). “Deep drainage and water useof forests and pastures grown on deep sands in aMediterranean environment.” Journal of Hydrology55: 53-64.
Chan, K. Y. and Hodgson, A. S. (1981). “Moistureregimes of a cracking clay soil under furrow irrigatedcotton.” Australian Journal of ExperimentalAgriculture and Animal Husbandry. 21: 538-542.
Creaner, S. J. (1988). The effects of uniform thinningand patch cutting on the water balance of a regrowthmountain ash (Eucalyptus regnans) forest. Departmentof Geography. The University of Melbourne.Melbourne.: 1-84.
Dalgliesh, N. and M. Foale (1998) Soil Matters.Monitoring soil water and nutrients in drylandfarming, Agricultural Production Systems ResearchUnit, Toowoomba.
Dalgliesh, N. P. and S. Cawthray (1998). Determiningplant available water capacity. Soil matters:monitoring soil water and nutrients in drylandfarming. N. Dalgliesh and M. Foale. Toowoomba,CSIRO: 71-92
Dewar, R. C. (1997). “A simple model of light andwater use evaluated for Pinus radiata.” TreePhysiology. 17.: 259-265.
Dolling, P. J. (2001). “Water use and drainage underphalaris, annual pasture and crops on a duplex soil inWestern Australia.” Australian Journal of AgriculturalResearch. 52.: 305-316.
Farrington, P. and Bartle, G. A. (1989). “Water andchloride balances of banksia woodland on coastal deepsands of south western Australia.” : 185-196.
Fischer, R. A., Mason, I. B. and Howe, G. N. (1988).“Tillage practices and growth and yield of wheat insouthern New South Wales: Yanco, in a 425mmrainfall region.” Australian Journal of ExperimentalAgriculture 28: 223-236.

COOPERAT IVE RESEARCH CENTRE FOR CATCHMENT HYDROLOGY
26
Fitzpatrick, E. A. and Nix, H. A. (1969). “A model forsimulating soil water regime in alternative falow-cropsystems.” Agricultural Meteorology. 6.: 303-319.
Gregory, P. J. (1998). “Alternative crops for duplexsoils: growth and water some cereal, legume, and oilseed crops, and pastures.” Australian Journal ofAgricultural Research. 49.: 21-32.
Gregory, P. J., Tennant, D. and Belford, R. K. (1992).“Root and shoot growth, and water and light useefficiency of barley and wheat crops grown on ashallow duplex soil in a Mediterranean-typeenvironment.” Australian Journal of AgriculturalResearch. 43.: 555-573.
Hamblin, A., Richards, Q. and Blake, J. (1988). “Cropgrowth across a toposequence controlled by depth ofsand over clay.” Australian Journal of Soil Research.26.: 623-635.
Hodgson, A. S. and Chan, K. Y. (1987). “Fieldcalibration of a neutron moisture meter in a crackinggrey clay.” Irrigation Science. 8.: 233-244.
Holmes, J. W. (1960). “Water balance and the water-table in deep sandy soils of the upper south-east, SouthAustralia.” Australian Journal of AgriculturalResearch 11: 970-988.
Holmes, J. W. and Colville, J. S. (1970). “Foresthydrology in a karstic region of southern Australia.”Journal of Hydrology 10: 59-74.
Holmes, J. W. and Colville, J. S. (1970). “Grasslandhydrology in a karstic region of southern Australia.”Journal of Hydrology. 10.: 38-58.
Honeysett, J. L., Beadle, C. L. and Turnbull, C. R. A.(1992). “Evaportranspiration and growth of twocontrasting species of eucalypts under non-limitingand limiting water availability.” Forest Ecology andManagement. 50.: 203-216.
Honeysett, J. L., White, D. A., Worledge, D. andBeadle, C. L. (1996). “Growth and water use ofEucalyptus globus and E. nitens in irrigated andrainfed plantations.” Australian Forestry. 59.: 64-73.
Howard, N. and Langford, K. J. (1971). Coanderrkexperimental area. First progress report. Pretreatmentcalibration. Melbourne and Metropolitan Board ofWorks. Melbourne.: 1-177.
Johnston, C. D. (1987). “Preferred water flow andlocalised recharge in a variable regolith.” Journal ofHydrology. 94.: 129-142.
Kalma, J. D., Bates, B. C. and Woods, R. A. (1995).“Predicting catchment-scale soil moisture status withlimited field measurements.” Hydrological Processes9: 445-467.
Langford, K. J. and O'Shaughnessy, P. J. O. (1977).First progress report. North Maroondah. MelbourneMetropolitan Board of Works. Melbourne.: 155-167.
Langford, K. J. and O'Shaughnessy, P. J. O. (1980).Second progress report. Coranderrk. Melbourne andMetropolitan Board of Works. Melbourne.
Latta, R. A., Blacklow, L. J. and Cocks, P. S. (2001).“Comparative soil water, pasture production, and cropyields in phase farming systems with lucerne andannual pasture in Western Australia.” AustralianJournal of Agricultural Research. 52.: 295-303.
Lawrence, P. A., Radford, B. J., Thomas, G. A.,Sinclair, D. P. and Key, A. J. (1994). “Effect of tillagepractices on wheat performance in a semi-aridenvironment.” Soil and Tillage Research. 28.: 347-367.
Lefroy, E. C., Pate, J. S. and Stirzaker, R. J. (2001).“Growth, water use efficiency and adaptive features ofthe tree legume tagasaste (Chamaecytisus proliferusLink.) on deep sands in south-western Australia.”Australian Journal of Agricultural Research. 52.: 221-234.
Littleboy, M. (1997). Spatial generalisation ofbiophysical simulation models for quantitative landevaluation: a case study for dryland wheat growingareas of Queensland. Ph.D. thesis. Department ofGeographical Sciences and Planning. Brisbane,University of Queensland: 255.
Littleboy, M., Silburn, D. M., Freebairn, D. M.,Woodruff, D. R., and Hammer, G. L. (1989).PERFECT A computer simulation model ofProductivity Erosion Runoff Functions to EvaluateConservation Techniques. Brisbane, QueenslandDepartment of Primary Industries: 119.

COOPERAT IVE RESEARCH CENTRE FOR CATCHMENT HYDROLOGY
27
Littleboy, M., Silburn, D. M., Freebairn, D. M.,Woodruff, D. R., Hammer, G. L. and Leslie, J. K.(1992). "Impact of soil erosion on production incropping systems. I. Development and validation of asimulation model." Australian Journal of SoilResearch 30: 757-774.
Mason, I. B. and Fischer, R. A. (1986). “Tillagepractices and the growth and yield of wheat insouthern NSW: Lockhart, in a 450mm rainfallregion.” Australian Journal of ExperimentalAgriculture 26: 457-468.
McCown, R. L. (1971). “Available water storage in arange of soils in north-eastern Queensland.”Australian Journal of Experimental Agriculture andAnimal Husbandry 11: 343-348.
McCown, R. L., Murtha, G. G. and Smith, G. D.(1976). “Assessment of available soil water storagecapacity of soils with restricted subsoil permeability.”Water Resources Research 12(6): 1255-1259.
McKenzie, D. C., Hucker, K. W., Morthorpe, L. J. andBaker, P. J. (1990). “Field calibration of a neutron-gamma probe in three agriculturally important soils ofthe lower Macquarie Valley.” Australian Journal ofExperimental Agriculture 30: 115-122.
McKenzie, N. and Hook, J (1992) Interpretations ofthe Atlas of Australian Soils, Consulting Report to theEnvironmental Resources Information Network.CSIRO, Technical Report 94/1992.
McKenzie, N. J., Jacquier, D. W., Ashton L. J., andCresswell H. P. (2000) Estimation of soil propertiesusing the Atlas of Australian Soils. Canberra, CSIROLand and Water: 11.
Meyer, W. S. (1992). Neutron and gamma probecalibration and calculation of plant available water forwheat on field 100W, Farm 459, CSIRO Griffith,NSW. CSIRO Division of Water Resources. Griffith:1-17.
Meyer, W. S., Dunin, F. X., Smith, R. C. G., Shell, G.S. G. and White, N. S. (1987). “Characterizing wateruse by irrigated wheat at Griffith, New South Wales.”Australian Journal of Soil Research 25: 499-515.
Meyer, W. S., Tan, C. S., Barrs, H. D. and Smith, R. C.G. (1990). “Root growth and water uptake by wheatduring drying of undisturbed and repacked soil indrainage lysimeters.” Australian Journal of
Agricultural Research 41: 253-265.
Myers, B. J. and Talsma, T. (1992). “Site waterbalance and tree water status in irrigated and fertilisedstands of Pinus Radiata.” Forest Ecology andManagement. 52.: 17-42.
Nicholls, K. D., Honeysett, J. L. and Graley, A. M.(1982). Soil Storage of water under Eucalypt forest insouth east Tasmania. The First National Symposiumon Forest Hydrology, 11-13 May, Melbourne: 39-42.
NLWRA (National Land and Water Resources Audit)(1999). Australian Soil Resource Information System.Fast Facts 12.
http://www.nlwra.gov.au/minimal/15_publications/22_fast_facts/fast_facts_12.html (December 11, 2001).
Northcote, K. H. (1966) Atlas of Australian Soils,Explanatory Data for Sheet 3, Sydney – Canberra –Bourke – Armidale Area, CSIRO and MelbourneUniversity Press, Melbourne.
Northcote, K. H., Beckmann, G. G., Bettenay, E.,Churchward, H. M., Van Dijk, D. C., Dimmock, G.M., Hubble, G. D., Isbell, R.F., McArthur, W. M.,Murtha, G.G., Nicholls, K. D., Paton, T. R.,Thompson, C. H., Webb, A. A. and Wright, M. J.(1960-1968) Atlas of Australian Soils, Sheets 1 to 10with explanatory data, CSIRO and MelbourneUniversity Press, Melbourne.
O'Leary, G. J. and Connor, D. J. (1996). “A simulationmodel of the wheat crop in response to water andnitrogen supply. 2. Model validation.” AgriculturalSystems. 52.: 31-55.
O'Leary, G. J. and Connor, D. J. (1997). “Stubbleretention and tillage in a semi-arid environment: 1.Soil water accumulation during fallow.” Field CropsResearch. 52.: 209-219.
Peck and Williamson, D. R. (1987). “Effects of forestclearing on groundwater.” Journal of Hydrology94(1): 47-66.
Pilgrim, D. H., Doran, D. G., Rowbottom, I. A.,Mackay, S. M. and Tjendana, J. (1982). Water balanceand runoff characteristics of mature and cleared Pineand Eucalypt catchments at Lidsdale, New SouthWales. The First National Symposium of ForestHydrology, 11-13 May, 1982, Melbourne: 103-110.

COOPERAT IVE RESEARCH CENTRE FOR CATCHMENT HYDROLOGY
28
Ratliff, L. F., Ritchie, J. T. and Cassel, D. K. (1983)“Field-measured limits of soil water availability asrelated to laboratory-measured properties”, SoilScience Society of American Journal 47, 770-775.
Ridley, A. M., Christy, B., Dunin, F. X., Haines, P. J.,Wilson, K. F. and Ellington, A. (2001). “Lucerne incrop rotations on the Riverine Plains. 1. The soilwater balance.” Australian Journal of AgriculturalResearch. 52: 263-277.
Ridley, A. M., White, R. E., Simpson, R. J. andCallinan, L. (1997). “Water use and drainage underphalaris, cocksfoot and annual ryegrass pastures.”Australian Journal of Agricultural Research 48: 1011-1023.
Ritchie J. T. (1981) Water dynamics in the soil-plant-atmosphere system. Plant and Soil 58:81-96.
Ruprecht, J. K. and Schofield, N. J. (1990). “Seasonalsoil water dynamics in the Jarrah forest, WesternAustralia. 1. Results form a hillslope transect withcoarse-textured soil profiles.” Hydrological Processes4: 241-258.
Schultz, J. E. (1971). “Soil water changes underfallow-crop treatments in relation to soil type, rainfalland yield of wheat.” Australian Journal ofExperimental Agriculture and Animal Husbandry 11:236-242.
Schultz, J. E. (1972). “The effect of surface treatmentson soil water storage and yield of wheat.” AustralianJournal of Experimental Agriculture and AnimalHusbandry 12: 299-305.
Sharma, M. L. and Craig, A. B. (1989). “Comparativerecharge rates beneath banksia woodland and two pineplantations on the Gnangara Mound, WesternAustralia.” : 171-184.
Sharma, M. L., Bari, M. and Byrne, J. (1989). Ananalysis of groundwater recharge beneath a nativesemi-arid vegetation. Hydrology and Water ResourcesSymposium, November, 1989, University ofCanterbury, New Zealand: 314-319. The Institute ofEngineers, Australia.
Sharma, M. L., Barron, R. J. W. and Williamson, D. R.(1987). “Soil water dynamics of lateritic catchmentsas affected by forest clearing for pasture.” Journal ofHydrology 94: 29-46.
Sharma, M. L., Johnston, C. D. and Barron, R. J. W.(1982). Soil water and groundwater responses toforest clearing in a paired catchment study in south-Western Australia. The First National Symposium onForest Hydrology, 11-13 May, Melbourne: 118-123.
Smith, M. K. (1972) A comparative study of thehydrology of radiata pine and Eucalypt forests atLidsdale, NSW. Master of Science thesis, TheUniversity of New South Wales.
Smith, M. K. (1974). A comparative study of thehydrology of radiata pine and eucalypt forests atLidsdale, NSW. University of New South Wales.Sydney: 1-244.
Smith, M. K., Watson, K. K. and Pilgrim, D. H.(1974). “A comparative study of the hydrology ofRadiata Pine and Eucalypt forests at Lidsdale, NewSouth Wales.” Hydrology of Forests. 16: 82-86.
Talsma, T. (1983). “Soils of the Cotter catchment area,ACT. Distribution, chemical and physical properties.”Australian Journal of Soil Research. 21: 241-255.
Talsma, T. and Gardner, E. A. (1986) “Soil waterextraction by a mixed forest during a drought period”,Australian Journal of Soil Research 24, 24-32.
Talsma, T. and Gardner, E. A. (1986). “Soil waterextraction by a mixed eucalypt forest during a droughtperiod.” Australian Journal of Soil Research. 24: 25-32.
Tennant, D., Scholz, G., Dixon, J. and Purdie, B.(1992). “Physical and chemical characteristics ofduplex soils and their distribution in the south-west ofWestern Australia.” Australian Journal ofExperimental Agriculture. 32: 827-843.
Walker, J. P. (1999). Estimating soil moisture profiledynamics from near-surface soil moisturemeasurements and standard meteorological data. TheDepartment of Civil, Surveying and EnvironmentalEngineering. The University of Newcastle. Newcastle:1-446.
Western, A. W. and Grayson, R. B. (1998). “TheTarrawarra dataset. Soil moisture patterns, soilcharacteristics and hydrological flux measurements.”Water Resources Research. 34 (10): 2765-2768.

COOPERAT IVE RESEARCH CENTRE FOR CATCHMENT HYDROLOGY
29
Western, A. W. and Grayson, R. B. (1999). “TheTarrawarra project: high resolution spatialmeasurement, modeling and analysis of soil moistureand hydrological processes.” Hydrological Processes.13: 633-652.
Williams, J. (1983) Physical properties and waterrelations: soil hydrology. In: Soils: an Australiaviewpoint. CSIRO Division of Soils, Melbourne andAcademic Press, London.
Williamson, R. J. (1979). Soil moisture and hydrologyof the basalt plains of western Victoria. A field andcomputer study of surface hydrology. Department ofCivil Engineering. The University of Melbourne.Melbourne.: 1-315.
Winkworth (1970). “The soil water regime of an aridgrassland (Eragrostis eriopoda Benth.) community inCentral Australia.” Agricultural Meteorology. 7: 378-399.
Winkworth, R. E. (1966). “The composition of severalarid spinifex grasslands of central Australia in relationto rainfall, soil water relations and nutrients.”Australian Journal of Botany. 15: 107-130.
Zhang, L., Dawes, W. R., Hatton, T. J., Hume, I. H.,O'Connell, M. G., Mitchell, D. C., Milthorpe, P. L.and Yee, M.(1999). "Estimating episodic rechargeunder different crop/pasture rotations in the Malleeregion. Part 2. Recharge control by agronomicpractices." Agricultural Water Management. 42: 237-249.

COOPERAT IVE RESEARCH CENTRE FOR CATCHMENT HYDROLOGY
30

COOPERAT IVE RESEARCH CENTRE FOR CATCHMENT HYDROLOGY
31
Appendix 1 - Information Sources
The following people were contacted regarding soilmoisture
Haralds Alksnis, CSIRO Land and Water, Canberra
Mohammed Bari, Water and Rivers CommissionWestern Australia
Geoff Beale, Department of Land and WaterConservation
Geoff Beecher, NSW Agriculture
Craig Beverly, DPI
Martin Bluml, DPI CLPR
Leith Bowya, Water and Rivers Commission, WesternAustralia
Andrew Bradford, CSIRO
Leon Bren, The University of Melbourne
Joost Brouwer, now based in the Netherlands
Ken Bubb, Queensland Forestry Research Institute,Gympie
Bruce Carey, QNR Toowoomba
Greg Chapman, DIPNR
Colin Chartres, AGSO Canberra
David Chittleborough, Waite, University of Adelaide
Brendan Christy, DPI
David Connor, The University of Melbourne
John Cooke, DPI Mildura
Peter Crapper, CSIRO Land and Water
Hamish Creswell, CSIRO
Trevor Daniels, University of Adelaide
Peter Dowling, NSW Agriculture
Frank Dunin, CSIRO
Derek Eamus, University of Technology Sydney(CRC for Tropical Savannas)
Richard Eckard, DPI Dairy Research Centre
Brian Finlayson, The University of Melbourne
David Freebairn, Queensland Natural Resources,Mines and Energy
Guy Geeves, DIPNR Cowra
Iain Grierson, University of Adelaide
Peter Hairsine, CSIRO Land and Water, Canberra
Barry Hart, Monash University
D. Hall, NSW Agriculture
Keith Hellier, NSW Agriculture
Bill Heslop, Goulburn-Murray Water
Cliff Hignett, former CSIRO now consulting
Robert Hoogers, NSW Agriculture
John Hornbuckle, CSIRO
Ian Hume, CSIRO
Lindsay Hutley, CRC Savannas, Northern TerritoryUniversity
Ron Hutton, NSW Agriculture
Andrew Johnson, CSIRO
Bill Johnson, DIPNR
Patrick Lane, DSE
Alan Lavis, Goulburn-Murray Water
Mark Littleboy, DIPNR
Greg Lodge, NSW Agriculture
Alicia Lucas, DSE
Warwick McDonald, National Land and WaterResources Audit
David McKenzie, (former CSIRO)
Neil McKenzie, CSIRO
Tom McMahon, The University of Melbourne
Russell Mein, Monash University
Wayne Meyer, CSIRO Land and Water, Glen Osmond
Geoffrey Miller, NSW Agriculture
Peter Milthorpe, NSW Agriculture
Angela Murray, CSIRO Sustainable EcosystemsTownsville
Sean Murphy, NSW Agriculture
Nanda Nandadumar, DIPNR
David Nash, DPI, Victoria
Sam North, NSW Agriculture

COOPERAT IVE RESEARCH CENTRE FOR CATCHMENT HYDROLOGY
32
Garry O’Leary, CSIRO
Cuan Petheran, CSIRO Land and Water
Geoff Podger, DIPNR
Derek Poulton, Goulburn-Murray Water
Mike Raupach, CSIRO Land and Water
Harald Richter, Bureau of Meteorology
Anna Ridley, DPI
John Ruprecht, Water and Rivers Commission,Western Australia
Mark Sallaway, Natural Resources Mines and Energy,Bundaberg Qld
P. Sandford, Agriculture Western Australia
Mark Silburn, APSRU, Queensland NaturalResources, Mines and Energy
Murugesu Sivapalan, University of Western Australia
Keith Smettem, University of Western Australia
Chris Smith, CSIRO Land and Water, Canberra
Richard Stirzaker, CSIRO
John Thompson, NSW Agriculture
Hugh Turral, The University of Melbourne
Narendra Tuteja, DIPNR Queanbyan
Nick Uren, Latrobe University
Robert van de Graaff, Melbourne
Rob Vertessy, CSIRO Land and Water
Glen Walker, CRC for Catchment Hydrology, GlenOsmond, SA
QJ Wang, DPI Tatura
Phil Ward, CSIRO
Ian Watson, Melbourne Water
Bob White, The University of Melbourne
Des Whitfield, DPI
Mark Wood, Goulburn-Murray Water
Clive Yates, Frank Wise Research Institute, Kununurra
Rick Young, NSW Agriculture
Steve Zegelin, CSIRO
Lu Zhang, CSIRO
Databases Searched
The following databases have been searched to locateprojects that measured profile soil moisture:
• CSIRO database of scientific publications for 1990-2000;
• CSIRO database of technical reports for 1997-2000;
• AGRICOLA;
• Australian Journal of Soil Research 1997-2000;
• All electronic journals in The University of Melbourne database.
Models
Several models have been developed to describe soilwetting and drying and moisture availability. Some ofthese have been calibrated or developed by analysingsoil moisture data sets. Despite searching for thecalibration data from the following models nothingwas found that contributed to the database developedfor this project.
PERFECT
PERFECT - Productivity Erosion Runoff Functions toEvaluate Conservation Techniques (Littleboy et al.,1992). A users guide has been published as acomputer simulation model of Productivity ErosionRunoff Functions to Evaluate ConservationTechniques, Queensland Department of PrimaryIndustries Bulletin, QB 89005 (Littleboy et al., 1989).PERFECT was reviewed by Littleboy (1997).PERFECT requires information on plant availablewater content as related to soil properties. PAWCERis one model that has been used to provide the soilmoisture submodel of PERFECT.
APSIM
Agricultural Production System Simulator - seehttp://apsim-help.tag.csiro.au/main_what_is_apsim.asp. APSIM requires information about soil-waterproperties for each soil type. These include thedrained upper limit, the -15 bar lower limit of soilmoisture and the saturated water content (APSIM,2002). Not likely to be a source of information forthis project.

COOPERAT IVE RESEARCH CENTRE FOR CATCHMENT HYDROLOGY
33
PAWCER
PAWCER - Plant Available Water Capacity EstimationRoutine developed by Mark Littleboy as part of hisPh.D. thesis (Littleboy, 1997, p151). Available soilmoisture is partly based on laboratory measurementsof the -15 bar water content so data is not likely to berelevant for direct estimates of extractable soilmoisture although calibration of the PAWCER modelwas based on estimation of plant available watercapacities from field measurements on 63 soils(Littleboy, 1997). These measurements have beenincluded in our database where the information wasavailable.
WAVES
CSIRO model of water, carbon and energy seehttp://www.clw.csiro.au/waves. As part of theWAVES project there was extensive data collection inthe Mallee region of NSW and Victoria, at Hilston andWalpeup. The Walpeup data has been included in theextractable soil moisture database. The Hilston datawas not in a form that could be used.

COOPERAT IVE RESEARCH CENTRE FOR CATCHMENT HYDROLOGY
34

COOPERAT IVE RESEARCH CENTRE FOR CATCHMENT HYDROLOGY
35
Appendix 2 - Issues with the Collectionand Archiving of Soil Moisture Data
Published in Catchword (Cooperative ResearchCentre for Catchment Hydrology Newsletter, April2001).
In search of the perfect profile…
Report by Tony Ladson, Rodger Grayson and AndrewWestern
Background
Back in October 2000, we began looking for researchsites around Australia where there were measurementsof root-zone soil moisture storage. This information isof general importance to many modelling studies andwill help us specifically with the modelling beingundertaken in CRC Project 2.3 (on predictingcatchment water yield and salinity under differentvegetation and climate scenarios), and CRC Project5.2 (which aims to improve the land surfacecomponent in the Bureau of Meteorology’s NumericalWeather Prediction model).
Finding the wettest and driest profile at any particularsite gives an indication of the soil water storage forthat soil and vegetation type - provided spatial andtemporal scales of sampling are appropriate. We planto compare measured soil profile information with thesoil hydraulic characteristics from other work such asthe commonly used “pedotransfer function” (PTF)approach. In PTF approaches, physical characteristicsof soil, such as the percentage of sand, silt and clay,are used to estimate hydraulic characteristics,including soil water storage.
Soil moisture data
Tony Ladson and James Lander are now trackingdown as much soil moisture information as possibleby talking to researchers, reviewing the literature, andsearching for technical reports. We have receivedexcellent assistance from many CRC for CatchmentHydrology personnel, and others from withinorganizations party to the CRC. To date we havecontacted over 100 individuals, collected 35 relevantpapers and reports from which we can derive theinformation of interest, and received 10 data sets. Weare expecting to receive several more data sets soon,
and many others have been mentioned, but as yet theiravailability is unclear. While we will continue tochase more information, we have enough now to begina pilot study to see whether the comparisons yielduseful results. We hope to get this pilot phasecomplete by the middle of the year.
Timing and issues
The search for information has taken a lot longer thanwe expected and has raised some interestingphilosophical and practical issues that are of widerrelevance to the CRC for Catchment Hydrology, itspartners and beyond. These largely relate to dataarchiving and management. The assistance we havehad from all concerned to date has been terrific, butthere are some broader issues that warrant discussion.
Data from individual research
Commonly, the data we use as hydrologists aremeasured and managed by organisations with aparticular mandate, and the resources necessary, toarchive and make available their information.Meteorological and streamflow data are two obviousexamples. But information where there are nocoordinated monitoring networks is difficult to trackdown. Much of the information we have been seekinghas been collected as part of individual researchprojects by a researcher, or small group of researcherslike ourselves. The motivations in these sorts ofprojects are to answer some specific questions andmake the results available through publications.Indeed we have gained a lot of the information weneed from published papers and reports. However, thebasic data normally reside in field books or computermedia of different sorts, depending on the age of the study.
These data have been used by the research team at thetime, but, from the researcher (and likely the client’s)point of view, once the appropriate analysis andpublications have been completed, there is little needto do anything more with them. We have found thisproblem with our own work especially where wenever envisaged any further use for data, and usuallythe clients at the time were not funding us to archive itin any special way. It is also difficult to retrieveinformation from studies that are stored on out-of-datemedia like ‘unexercised’ magnetic tapes or even 5 1/4inch discs. These problems must ring true for many ofyou.

COOPERAT IVE RESEARCH CENTRE FOR CATCHMENT HYDROLOGY
36
Rescuing data
This is not a unique issue for CRC researchers. Forexample between 1965 and 1978 there was a vastdeployment of seismometers in parts of the US tomonitor Soviet nuclear tests. All data were stored ontapes but, given they had served their purpose, thecustodian intended to dump them, until “rescued” bysome USGS personnel (Anon., 2000). We need notlook overseas to see disappointing losses ofinformation. Many of the river cross-sectionssurveyed during the late 1930s in Victoria have beenlost, including all those for the Mitchell River, alongwith the complete photo collection of the Mitchell thatwas held by the Rivers and Streams Section of theRural Water Commission. In our own group, wewould be hard pressed to locate the data from anypost-graduate study that was undertaken more than 10years ago, unless the original data ended up in a thesisappendix. Our experience from talking withindividuals in other organisations is that the chances oflocating data are very slim once those who did thecollection or measurement move on. Even wherespecific databases have been established they can belost because of changes in computer systems andpersonnel.
Resources for archiving data
From the point of view of individual researchers orresearch groups, it is difficult to justify the expenseand time needed to archive and maintain data beyondthe initial analysis and reporting. This is a task thatmust be tackled at a higher level. The obvious successin data management of groups like the BoM has comefrom major investments in the business of storing andmaintaining data. There has been a vast amount ofinformation collected over the last century or more aspart of graduate projects, university, agency andCSIRO studies, but it is largely inaccessible today –simply because it was never envisaged that it might beuseful later, and/or there were no resources availableand/or the responsibility for archiving andmaintenance activities was unclear.
‘Data notes’
There are however some encouraging developments.Leading international journals such as WaterResources Research, now have a form of publicationcalled “data notes”. These provide a vehicle for
writing up and making generally available, data setsfrom field studies. These serve not only to maximiseuse of the results of (expensive) field studies, but also,being journal publications, provide motivation and‘brownie points’ for researchers. There is a steadyincrease in the number of “data notes” which has to bea good sign. There are also World and National (US)Data Centres that are committed to 1) providing openaccess to scientists, 2) archiving data sets indefinitely(or to migrating the data to a permanent archive if thecentre ceases operation) and 3) providing services atreasonable cost. For more information see<http://www.agu.org/pubs/datacent.html>.
Managing data for future use
Do we need some archiving and data maintenancecapability for research projects within the CRC forCatchment Hydrology? Should the CRC forCatchment Hydrology become a data centre for someof the key data that we measure and process? Aconsortium of researchers is ideally placed to developstorage protocols and procedures. The CRC forCoastal Zone, Estuary and Waterway Management isdeveloping a centralised approach to data storageincluding development of protocols and rules for dataaccess, and the CRC for Catchment Hydrology iscurrently exploring ways to be involved.Alternatively, should we lobby for a FederalGovernment Data Centre dedicated to archiving datafrom government (and other) funded research projects.Depositing data (maybe with an appropriatequarantine period preventing access by competitors)could be a condition of funding and appropriate MetaData requirements could ensure continued usefulnessof the data.
In twenty year’s time when someone wants data froma CRC for Catchment Hydrology project they’d readabout in a journal or report, what chance would theyhave of getting a copy?
References
Anon. (2000) “Journey to the centre of the earth”American Scientist, Vol 88 No.5:p 401-402.

COOPERAT IVE RESEARCH CENTRE FOR CATCHMENT HYDROLOGY
37
Appendix 3 - Analysis of Rainfall Data
For each of the sites where a time series of soilmoisture measurements was available the extractablesoil moisture was estimated from the differencebetween the wettest and driest recorded profiles. Thiswill only result in an accurate estimate if the measuredwetted and driest profiles are close to the maximallywet and dry profiles that occur at this site.
An indication of how extreme the wettest and driestprofiles are likely to be can be determined from themonthly rainfall at the site in comparison with thelong-term rainfall. In this appendix, the 25th, medianand 75th percentile rainfalls are compared to rainfallrecorded at the sites during the period the soil moisturewas measured. The percentiles are based on monthlyrainfall from 1940 to 1999. Sites are listed inalphabetical order based on the "Site Location" field inthe database. Dates are based on the "Start/Stop" field(see Table 1). For further discussion of this analysissee Section 3.

COOPERAT IVE RESEARCH CENTRE FOR CATCHMENT HYDROLOGY
38

COOPERAT IVE RESEARCH CENTRE FOR CATCHMENT HYDROLOGY
39

COOPERAT IVE RESEARCH CENTRE FOR CATCHMENT HYDROLOGY
40

COOPERAT IVE RESEARCH CENTRE FOR CATCHMENT HYDROLOGY
41

COOPERAT IVE RESEARCH CENTRE FOR CATCHMENT HYDROLOGY
42

COOPERAT IVE RESEARCH CENTRE FOR CATCHMENT HYDROLOGY
43

COOPERAT IVE RESEARCH CENTRE FOR CATCHMENT HYDROLOGY
44

COOPERAT IVE RESEARCH CENTRE FOR CATCHMENT HYDROLOGY
45

COOPERAT IVE RESEARCH CENTRE FOR CATCHMENT HYDROLOGY
46

COOPERAT IVE RESEARCH CENTRE FOR CATCHMENT HYDROLOGY
47

COOPERAT IVE RESEARCH CENTRE FOR CATCHMENT HYDROLOGY
48

COOPERAT IVE RESEARCH CENTRE FOR CATCHMENT HYDROLOGY
49

COOPERAT IVE RESEARCH CENTRE FOR CATCHMENT HYDROLOGY
50

COOPERAT IVE RESEARCH CENTRE FOR CATCHMENT HYDROLOGY
51

COOPERAT IVE RESEARCH CENTRE FOR CATCHMENT HYDROLOGY
52

COOPERAT IVE RESEARCH CENTRE FOR CATCHMENT HYDROLOGY
53

COOPERAT IVE RESEARCH CENTRE FOR CATCHMENT HYDROLOGY
54

COOPERAT IVE RESEARCH CENTRE FOR CATCHMENT HYDROLOGY
55

COOPERAT IVE RESEARCH CENTRE FOR CATCHMENT HYDROLOGY
56

COOPERAT IVE RESEARCH CENTRE FOR CATCHMENT HYDROLOGY
57

COOPERAT IVE RESEARCH CENTRE FOR CATCHMENT HYDROLOGY
58

COOPERAT IVE RESEARCH CENTRE FOR CATCHMENT HYDROLOGY
59

COOPERAT IVE RESEARCH CENTRE FOR CATCHMENT HYDROLOGY
60

COOPERAT IVE RESEARCH CENTRE FOR CATCHMENT HYDROLOGY
61

COOPERAT IVE RESEARCH CENTRE FOR CATCHMENT HYDROLOGY
6 2

COOPERAT IVE RESEARCH CENTRE FOR CATCHMENT HYDROLOGY
6 3
Appendix 4 - Extractable SoilsDatabase

COOPERAT IVE RESEARCH CENTRE FOR CATCHMENT HYDROLOGY
64
Site location State Latitude Longitude Reliability Site map Vegetation type Generalised Landuse Terrain Soil type Data Info on
of location veg type type horizon depth
Adelaide
(Black Earth) SA -34.97 138.63 1 FALSE grassland/pasture 3 Grazing Gentle Slopes Black Earth 3 TRUE
Adelaide
(Red-Brown Earth) SA -34.97 138.63 1 FALSE annual pasture 3 Grazing Gentle Slopes Red-Brown Earth 3 TRUE
Alice Springs NT -23.7 133.87 2 FALSE grassland 3 Grazing Undulating Plains Gradational 5 TRUE
Ballarat VIC -37.83 143.88 1 TRUE pasture 3 Grazing Undulating Plains Dd 1.72/Dy 5.23 5 TRUE
Banana QLD -24.43 150.14 1 FALSE sorghum 2 Cropping Plains Dark 2 FALSE
Banana 2 QLD -24.43 150.14 1 FALSE sorghum 2 Cropping Plains Brown Clay 4 FALSE
Banana 3 QLD -24.58 150.15 1 FALSE maize 2 Cropping Plains Black Vertosol 4 FALSE
Banana 3 QLD -24.58 150.15 1 FALSE sunflower 2 Cropping Plains Black Vertosol 4 FALSE
Banana 3 QLD -24.58 150.15 1 FALSE wheat 2 Cropping Plains Black Vertosol 4 FALSE
Belconnen ACT -35.35 148.9 2 FALSE radiata pine 1 Forestry Hilly Sandy Yellow Podzolic 4 TRUE
Beverly QLD -27.18 151.1 1 FALSE cotton 2 Cropping Plains Grey Vertosol 1 FALSE
Beverly QLD -27.18 151.1 1 FALSE chickpea 2 Cropping Plains Grey Vertosol 1 FALSE
Beverly QLD -27.18 151.1 1 FALSE wheat 2 Cropping Plains Grey Vertosol 1 FALSE
Billa Billa QLD -28.17 150.2 1 FALSE wheat 2 Cropping Plains Red Chromosol 4 FALSE
Biloela QLD -24.4 150.3 1 FALSE wheat 2 Cropping Alluvial Plain Alluvial Clay Loam 5 FALSE
Bongeen QLD -27.63 151.4 1 FALSE cotton 2 Cropping Plains Black Vertosol 4 FALSE
Bongeen QLD -27.63 151.4 1 FALSE sorghum 2 Cropping Plains Black Vertosol 4 FALSE
Bongeen 2 QLD -27.6 151.44 1 FALSE mungbean 2 Cropping Plains Black Vertosol 1 FALSE
Bongeen 2 QLD -27.6 151.44 1 FALSE sorghum 2 Cropping Plains Black Vertosol 4 FALSE
Bongeen 2 QLD -27.6 151.44 1 FALSE cotton 2 Cropping Plains Black Vertosol 4 FALSE
Bongeen 3 QLD -27.7 151.46 1 FALSE cotton 2 Cropping Plains Black Vertosol 4 FALSE
Bongeen 3 QLD -27.7 151.46 1 FALSE sorghum 2 Cropping Plains Black Vertosol 4 FALSE
Borden WA -34.08 118.25 2 FALSE lucerne 2 Gropping/Grazing Plains Solodic (Dg 2.33) 5 FALSE
Borden WA -34.08 118.25 2 FALSE clover 3 Cropping/Grazing Plains Solodic (Dg 2.33) 5 FALSE
Brindabellas ACT -35.5 148.77 2 TRUE eucalypt dominated 1 Forestry Mountain Range Yellow Earth (Gn 2.24) 3 TRUE
Brookstead QLD -27.74 151.46 1 FALSE mungbean 2 Cropping Plains Grey Vertosol 1 FALSE
Brookstead QLD -27.74 151.46 1 FALSE cotton 2 Cropping Plains Grey Vertosol 4 FALSE
Brookstead QLD -27.74 151.46 1 FALSE sorghum 2 Cropping Plains Grey Vertosol 4 FALSE
Capella QLD -22.97 147.8 1 FALSE wheat 2 Cropping Plains Black Vertosol 2 FALSE
Chances Plains QLD -26.73 150.78 1 FALSE wheat 2 Cropping Plains Grey Vertosol 4 FALSE
Chances Plains QLD -26.73 150.78 1 FALSE chickpea 2 Cropping Plains Grey Vertosol 1 FALSE
Chances Plains 2 QLD -26.7 150.74 1 FALSE wheat 2 Cropping Plains Grey Vertosol 1 FALSE
Chances Plains 2 QLD -26.7 150.74 1 FALSE sorghum 2 Cropping Plains Grey Vertosol 4 FALSE
Collie WA -33.42 115.98 1 TRUE eucalyptus 1 Forestry Dissected Lateritic Duplex 1 TRUE
dominated Plateau
et
Coranderrk VIC -37.68 145.58 1 TRUE eucalyptus 1 Forestry Hilly Loam over Clay 5 FALSE
(Blue Jacket) dominated
Coranderrk
(Picaninny) VIC -37.68 145.58 1 TRUE eucalyptus 1 Forestry Hilly Loam over Clay 5 FALSE
dominated

COOPERAT IVE RESEARCH CENTRE FOR CATCHMENT HYDROLOGY
65
Porosity/ Soil depth Stored Active Active soil Missing water Start/stop Rainfall Rank of Rank of Monitoring References
bulk (m) soil soil moisture driest month wettest month frequency
density moisture depth store (mm)
(mm) (m)
FALSE 2.4 164.3 1.85 154.5 FALSE 1948 - 1950 TRUE 0.025 0.026 Weekly/Daily Aitchison and Holmes (1953),
Aitchison and Holmes (1952)
FALSE 3.1 180.4 1.85 152.1 FALSE 1948 - 1950 TRUE 0.025 0.026 Weekly/Daily Aitchison and Holmes (1953),
Aitchison and Holmes (1952)
FALSE 1.5 94.43 1.5 94.43 FALSE Oct 1954-Dec 1956 TRUE 0.171 0.032 Weekly Winkworth (1970),
Winkworth (1967)
FALSE 2 212.4 2 212.4 FALSE 1976 - 1977 TRUE 0.029 0.016 Fortnightly Williamson (1979)
TRUE 1.8 244.5 1.8 244.5 FALSE N/A FALSE #N/A #N/A N/A Dalgleish and Foale (1998)
TRUE 1.2 186 1.2 186 TRUE N/A FALSE #N/A #N/A N/A Dalgleish and Foale (1998)
TRUE 0.6 109.5 0.6 109.5 TRUE N/A FALSE #N/A #N/A N/A Dalgleish and Foale (1998)
TRUE 0.6 94.5 0.6 94.5 TRUE N/A FALSE #N/A #N/A N/A Dalgleish and Foale (1998)
TRUE 0.6 108 0.6 108 TRUE N/A FALSE #N/A #N/A N/A Dalgleish and Foale (1998)
TRUE 2 272.2 2 272.2 TRUE 1983 - 1986 TRUE 0.016 0.002 Fortnightly Dewar (1997),
Meyers and Talsma (1992)
TRUE 1.8 277.5 1.8 277.5 FALSE N/A FALSE #N/A #N/A N/A Dalgleish and Foale (1998)
TRUE 1.8 165 1.8 165 FALSE N/A FALSE #N/A #N/A N/A Dalgleish and Foale (1998)
TRUE 1.8 186 1.8 186 FALSE N/A FALSE #N/A #N/A N/A Dalgleish and Foale (1998)
TRUE 1.4 185 1.4 185 TRUE N/A FALSE #N/A #N/A N/A Dalgleish and Foale (1998)
FALSE 1.22 126.88 1.22 126.88 FALSE 1948 - 1951 TRUE 0.006 0.006 Fortnightly Fitzpatrick and Nix (1969),
Allen and George (1956)
TRUE 1.8 280.5 1.8 280.5 TRUE N/A FALSE #N/A #N/A N/A Dalgleish and Foale (1998)
TRUE 1.8 285 1.8 285 TRUE N/A FALSE #N/A #N/A N/A Dalgleish and Foale (1998)
TRUE 1.8 157.5 1.2 157.5 FALSE N/A FALSE #N/A #N/A N/A Dalgleish and Foale (1998)
TRUE 1.8 261 1.8 261 TRUE N/A FALSE #N/A #N/A N/A Dalgleish and Foale (1998)
TRUE 1.8 348 1.8 348 TRUE N/A FALSE #N/A #N/A N/A Dalgleish and Foale (1998)
TRUE 1.8 342 1.8 342 TRUE N/A FALSE #N/A #N/A N/A Dalgleish and Foale (1998)
TRUE 1.8 267 1.8 267 TRUE N/A FALSE #N/A #N/A N/A Dalgleish and Foale (1998)
FALSE 1.5 135.16 1.5 135.16 FALSE Oct 1996-Dec 1999 TRUE 0.025 0.049 Every 3 Months Latta et al., (2001)
FALSE 1.5 56.04 1.5 56.04 FALSE Oct 1996-Dec 1999 TRUE 0.025 0.049 Every 3 Months Latta et al., (2001)
FALSE 10 871.1 6 828.5 FALSE Apr 1981-Oct 1983 TRUE 0.004 0.048 Monthly Talsma and Gardner (1986),
Talsma (1983)
TRUE 1.8 142.5 1.2 142.5 FALSE N/A FALSE #N/A #N/A N/A Dalgleish and Foale (1998)
TRUE 1.8 288 1.8 288 TRUE N/A FALSE #N/A #N/A N/A Dalgleish and Foale (1998)
TRUE 1.8 282 1.8 282 TRUE N/A FALSE #N/A #N/A N/A Dalgleish and Foale (1998)
TRUE 1.5 145.5 1.5 145.5 FALSE N/A FALSE #N/A #N/A N/A Dalgleish and Foale (1998)
TRUE 1.8 223.5 1.8 223.5 TRUE N/A FALSE #N/A #N/A N/A Dalgleish and Foale (1998)
TRUE 1.8 186 1.5 186 FALSE N/A FALSE #N/A #N/A N/A Dalgleish and Foale (1998)
TRUE 1.8 157.5 1.5 157.5 FALSE N/A FALSE #N/A #N/A N/A Dalgleish and Foale (1998)
TRUE 1.8 169.5 1.8 169.5 TRUE N/A FALSE #N/A #N/A N/A Dalgleish and Foale (1998)
FALSE 14 332.05 12 327.1 FALSE Jan 1974-May 1979 TRUE 0.02 0.013 Monthly/3 Months Peck and Williamson (1987),
Johnston (1987), (seasonal)
Sharma et al., (1987), Sharma
al. (1982)
TRUE 3.1 237.01 3.1 237.01 FALSE 1970 - 1978 TRUE 0.005 0.005 2-6 Weeks Howard and Langford (1971),
Langford and O' Shaughnessy
(1980)
TRUE 3.1 334.5 3.1 334.5 FALSE 1970 - 1978 TRUE 0.005 0.005 2-6 Weeks Howard and Langford (1971),
Langford and O' Shaughnessy
(1980)

COOPERAT IVE RESEARCH CENTRE FOR CATCHMENT HYDROLOGY
66
Site location State Latitude Longitude Reliability Site map Vegetation type Generalised Landuse Terrain Soil type Data Info on
of location veg type type horizon depth
Coranderrk (Slip) VIC -37.68 145.58 1 TRUE eucalyptus 1 Forestry Hilly Loam over Clay 5 FALSE
dominated
Croppa Creek NSW -29.1 150.38 1 FALSE chickpea 2 Cropping Plains Grey Vertosol 4 FALSE
Croppa Creek NSW -29.1 150.37 1 FALSE fabas 2 Cropping Plains Grey Vertosol 4 FALSE
Croppa Creek NSW -29.1 150.37 1 FALSE cotton 2 Cropping Plains Grey Vertosol 4 FALSE
Croppa Creek NSW -29.1 150.37 1 FALSE wheat 2 Cropping Plains Grey Vertosol 4 FALSE
Dalby QLD -27.12 151.3 1 FALSE sorghum 2 Cropping Plains Black Vertosol 4 FALSE
Dalby QLD -27.12 151.3 1 FALSE cotton 2 Cropping Plains Black Vertosol 4 FALSE
Dalby QLD -27.12 151.3 1 FALSE barley 2 Cropping Plains Black Vertosol 1 FALSE
Dooen VIC -36.67 142.3 2 FALSE wheat 2 Cropping Undulating Plains Grey Cracking Clay 4 FALSE
(Ug 5.2)
Dwellingup WA -32.65 116.07 2 FALSE eucalyptus 1 Forestry Hillslope Sand (coarse textured) 1 FALSE
dominated
East Beverly WA -32.13 117.17 1 FALSE barley and wheat 2 Cropping Plain Dy 2.82 3 TRUE
(good growth soil)
East Beverly WA -32.13 117.17 1 FALSE barley and wheat 2 Cropping Plain Dy 2.82 1 TRUE
(poor growth soil)
Edgeroi NSW -29.99 149.89 1 FALSE wheat 2 Cropping Plains Brown Clay 1 FALSE
Edgeroi NSW -29.99 149.89 1 FALSE cotton 2 Cropping Plains Brown Clay 3 FALSE
Esperance Valley TAS -43.3 146.92 2 FALSE eucalypt forest 1 Forestry Assumed Hilly Yellow Podzolic 5 TRUE
(E. nitens)
Greenmount QLD -27.77 151.92 1 FALSE wheat 2 Cropping Plains Black Vertosol 4 FALSE
Griffith NSW -34.28 146.05 1 FALSE wheat 2 Cropping Plains Hanwood Loam 3 FALSE
Gurley NSW -29.8 149.83 1 FALSE wheat 2 Cropping Plains Box/Belah 4 FALSE
Hastings TAS -43.42 146.88 1 FALSE eucalypt forest 1 Forestry Undulating Yellow Podzolic 5 FALSE
Haystack QLD -26.84 150.85 1 FALSE wheat 2 Cropping Plains Grey Vertosol 1 FALSE
Hermitage QLD -28.21 152.1 1 FALSE sorghum 2 Cropping Plains Brown Vertosol 3 FALSE
Hopelands QLD -26.87 150.56 1 FALSE chickpea 2 Cropping Plains Grey Vertosol 1 FALSE
Hopelands QLD -26.87 150.56 1 FALSE wheat 2 Cropping Plains Grey Vertosol 1 FALSE
Hopelands QLD -26.87 150.56 1 FALSE cotton 2 Cropping Plains Grey Vertosol 2 FALSE
Hopelands 2 QLD -26.86 150.64 1 FALSE sorghum 2 Cropping Plains Grey Vertosol 4 FALSE
Hopelands 2 QLD -26.86 150.64 1 FALSE cotton 2 Cropping Plains Grey Vertosol 4 FALSE
Hopelands 2 QLD -26.86 150.64 1 FALSE wheat 2 Cropping Plains Grey Vertosol 1 FALSE
Hopelands 2 QLD -26.86 150.64 1 FALSE chickpea 2 Cropping Plains Grey Vertosol 1 FALSE
Huon A TAS -43.05 146.72 1 FALSE eucalypt forest 1 Forestry Assumed Hilly Krasnozem 5 FALSE
(1934 regrowth)
Huon B TAS -43.1 146.77 1 FALSE eucalypt forest 1 Forestry Assumed Hilly Krasnozem 5 FALSE
(1966 regrowth)
Huon C TAS -43.08 146.73 1 FALSE eucalypt forest 1 Forestry Assumed Hilly Krasnozem 5 FALSE
(1975 regrowth)
Jambin QLD -24.18 150.37 1 FALSE wheat 2 Cropping Plains Cracking Clay 4 FALSE
Jambin 2 QLD -24.18 150.43 1 FALSE wheat 2 Cropping Plains Scrub 1 FALSE
Jandowae QLD -26.79 151.05 1 FALSE wheat 2 Cropping Plains Grey Vertosol 1 FALSE
Jandowae QLD -26.79 151.05 1 FALSE cotton 2 Cropping Plains Grey Vertosol 4 FALSE
Jandowae QLD -26.79 151.05 1 FALSE sorghum 2 Cropping Plains Grey Vertosol 2 FALSE
Jandowae 2 QLD -26.87 151.09 1 FALSE barley 2 Cropping Plains Grey Vertosol 1 FALSE

COOPERAT IVE RESEARCH CENTRE FOR CATCHMENT HYDROLOGY
67
Porosity/ Soil depth Stored Active Active soil Missing water Start/stop Rainfall Rank of Rank of Monitoring References
bulk (m) soil soil moisture driest month wettest month frequency
density moisture depth store (mm)
(mm) (m)
TRUE 3.1 332.3 3.1 332.3 FALSE 1970 - 1978 TRUE 0.005 0.005 2-6 Weeks Howard and Langford (1971),
Langford and O' Shaughnessy
(1980)
TRUE 1.8 205.5 1.8 205.5 TRUE N/A FALSE #N/A #N/A N/A Dalgleish and Foale (1998)
TRUE 1.8 187.5 1.8 187.5 TRUE N/A FALSE #N/A #N/A N/A Dalgleish and Foale (1998)
TRUE 1.8 289.5 1.8 289.5 TRUE N/A FALSE #N/A #N/A N/A Dalgleish and Foale (1998)
TRUE 1.8 283.5 1.8 283.5 TRUE N/A FALSE #N/A #N/A N/A Dalgleish and Foale (1998)
TRUE 1.8 199.5 1.8 199.5 TRUE N/A FALSE #N/A #N/A N/A Dalgleish and Foale (1998)
TRUE 1.8 283.5 1.8 283.5 TRUE N/A FALSE #N/A #N/A N/A Dalgleish and Foale (1998)
TRUE 1.8 204 1.5 204 FALSE N/A FALSE #N/A #N/A N/A Dalgleish and Foale (1998)
TRUE 2 367 2 367 TRUE 1988 - 1991 TRUE 0 0.002 Irregular O'Leary and Connor (1997),
O'Leary and Connor (1996)
FALSE 15 519.19 9.25 459.2 FALSE May 1984 -Oct 1986 TRUE 0.062 0.034 Fortnightly/Weekly Ruprecht and Schofield (1990),
(upslope) Ruprecht and Schofield (1990)
FALSE 1.5 84.1 0.7 76.5 FALSE 1992 - 1994 TRUE 0.023 0.039 Fortnightly Gregory (1998), Gregory et al.,
(1992), Tennant et al., (1992)
FALSE 1.5 94.7 0.5 94.7 FALSE 1992 - 1994 TRUE 0.023 0.039 Fortnightly Gregory (1998), Gregory et al.,
(1992), Tennant et al., (1992)
TRUE 1.8 208.5 1.5 208.5 FALSE N/A FALSE #N/A #N/A N/A Dalgleish and Foale (1998)
TRUE 1.8 240 1.2 228 FALSE N/A FALSE #N/A #N/A N/A Dalgleish and Foale (1998)
FALSE 1.2 232.88 1.2 232.88 FALSE Nov 1986-Apr 1988 TRUE 0.011 0.098 Fortnightly Honeysett et al., (1992)
TRUE 1.5 267 1.5 267 TRUE N/A FALSE #N/A #N/A N/A Dalgleish and Foale (1998)
TRUE 1.7 180.5 1.6 172 FALSE 1981 - 1984 TRUE 0.012 0 Weekly Meyer (1992), Meyer et al.,
(1990), Meyer et al., (1987)
TRUE 1.8 175.5 1.8 175.5 TRUE N/A FALSE #N/A #N/A N/A Dalgleish and Foale (1998)
FALSE 3 369.05 3 369.05 FALSE 1976 - 1980 TRUE 0.002 0.048 2-3 Weeks Nicolls et al., (1982)
TRUE 1.8 220.5 1.5 220.5 FALSE N/A FALSE #N/A #N/A N/A Dalgleish and Foale (1998)
TRUE 1.8 216 1.2 208 TRUE N/A FALSE #N/A #N/A N/A Dalgleish and Foale (1998)
TRUE 1.8 157.5 1.5 157.5 FALSE N/A FALSE #N/A #N/A N/A Dalgleish and Foale (1998)
TRUE 1.8 174 1.5 174 FALSE N/A FALSE #N/A #N/A N/A Dalgleish and Foale (1998)
TRUE 1.8 168 1.8 168 FALSE N/A FALSE #N/A #N/A N/A Dalgleish and Foale (1998)
TRUE 1.8 220.5 1.8 220.5 TRUE N/A FALSE #N/A #N/A N/A Dalgleish and Foale (1998)
TRUE 1.8 229.5 1.8 229.5 TRUE N/A FALSE #N/A #N/A N/A Dalgleish and Foale (1998)
TRUE 1.8 208.5 1.5 208.5 FALSE N/A FALSE #N/A #N/A N/A Dalgleish and Foale (1998)
TRUE 1.8 201 1.5 201 FALSE N/A FALSE #N/A #N/A N/A Dalgleish and Foale (1998)
FALSE 2 178.6 2 178.6 FALSE 1976 - 1980 TRUE 0 0.017 2-3 Weeks Nicolls et al., (1982)
FALSE 2 253.8 2 253.8 FALSE 1976 - 1980 TRUE 0 0.017 2-3 Weeks Nicolls et al., (1982)
FALSE 2 176.25 2 176.25 FALSE 1976 - 1980 TRUE 0 0.017 2-3 Weeks Nicolls et al., (1982)
TRUE 1.5 156 1.5 156 TRUE N/A FALSE #N/A #N/A N/A Dalgleish and Foale (1998)
TRUE 1.8 138 1.5 138 FALSE N/A FALSE #N/A #N/A N/A Dalgleish and Foale (1998)
TRUE 1.8 199.5 1.5 199.5 FALSE N/A FALSE #N/A #N/A N/A Dalgleish and Foale (1998)
TRUE 1.8 241.5 1.8 241.5 TRUE N/A FALSE #N/A #N/A N/A Dalgleish and Foale (1998)
TRUE 1.8 199.5 1.8 199.5 FALSE N/A FALSE #N/A #N/A N/A Dalgleish and Foale (1998)
TRUE 1.8 186 1.5 186 FALSE N/A FALSE #N/A #N/A N/A Dalgleish and Foale (1998)

COOPERAT IVE RESEARCH CENTRE FOR CATCHMENT HYDROLOGY
68
Site location State Latitude Longitude Reliability Site map Vegetation type Generalised Landuse Terrain Soil type Data Info on
of location veg type type horizon depth
Jandowae 2 QLD -26.87 151.09 1 FALSE cotton 2 Cropping Plains Grey Vertosol 3 FALSE
Jimbour QLD -26.98 151.12 1 FALSE chickpea 2 Cropping Plains Black Vertosol 4 FALSE
Jimbour QLD -26.98 151.12 1 FALSE cotton 2 Cropping Plains Black Vertosol 4 FALSE
Jimbour QLD -26.98 151.12 1 FALSE wheat 2 Cropping Plains Black Vertosol 1 FALSE
Kaimkillenbun QLD -27.07 151.41 1 FALSE wheat 2 Cropping Plains Black Vertosol 4 FALSE
Kaimkillenbun QLD -27.07 151.41 1 FALSE sorghum 2 Cropping Plains Black Vertosol 4 FALSE
Keith 1 SA -35.88 139.58 2 FALSE lucerne 2 2 Cropping/Grazing Dunes Sand 3 TRUE
Keith 1 SA -35.88 139.58 2 FALSE lucerne 1 2 Cropping/Grazing Dunes Sand 4 TRUE
Keith 2 SA -35.9 139.68 2 FALSE heath 4 1 Not Specified Dunes Sand 2 TRUE
Keith 2 SA -35.9 139.68 2 FALSE heath 1 1 Not Specified Dunes Sand 3 TRUE
Keith 2 SA -35.9 139.68 2 FALSE heath 3 1 Not Specified Dunes Sand 3 TRUE
Keith 2 SA -35.9 139.68 2 FALSE heath 2 1 Not Specified Dunes Sand 3 TRUE
Kojonup WA -33.75 116.75 1 FALSE perennial pasture 3 Cropping/Grazing. Plains Sandy Duplex Soil 5 TRUE
(Dy 5.52)
Kojonup WA -33.75 116.75 1 FALSE annual pasture 3 Cropping/Grazing Plains Sandy Duplex Soil 5 TRUE
(Dy 5.52)
Koomamurra QLD -27.22 151.36 1 FALSE barley 2 Cropping Plains Grey Vertosol 4 FALSE
Koomamurra QLD -27.22 151.36 1 FALSE cotton 2 Cropping Plains Grey Vertosol 4 FALSE
Koomamurra QLD -27.22 151.36 1 FALSE sorghum 2 Cropping Plains Grey Vertosol 4 FALSE
Kupunn QLD -27.23 151.11 1 FALSE chickpea 2 Cropping Plains Grey Vertosol 1 FALSE
Kupunn QLD -27.23 151.11 1 FALSE cotton 2 Cropping Plains Grey Vertosol 2 FALSE
Kupunn QLD -27.23 151.11 1 FALSE wheat 2 Cropping Plains Grey Vertosol 1 FALSE
Lawes QLD -27.54 152.34 1 FALSE sorghum 2 Cropping Plains Black Vertosol 4 FALSE
Lawes QLD -27.54 152.34 1 FALSE chickpea 2 Cropping Plains Black Vertosol 2 FALSE
Lawes 2 QLD -27.54 152.34 1 FALSE chickpea 2 Cropping Plains Prarie Soil 3 FALSE
Lawes 2 QLD -27.54 152.34 1 FALSE wheat 2 Cropping Plains Prarie Soil 1 FALSE
Lemon Tree QLD -27.75 151.24 1 FALSE cotton 2 Cropping Plains Brown Clay 4 FALSE
Lemon Tree QLD -27.75 151.24 1 FALSE barley 2 Cropping Plains Brown Clay 3 FALSE
Lidsdale NSW -33.43 150.07 1 TRUE radiata pine 1 Forestry Hills Dy 3.41/Dy 2.61 4 TRUE
(Catchment 2)
Lidsdale NSW -33.43 150.07 1 TRUE eucalyptus 1 Forestry Hills Dy 3.41/Dy 2.61 4 TRUE
(Catchment 6) dominated
Lockhart NSW -35.2 146.7 2 FALSE wheat 2 Cropping Plains Red-Brown Earth 2 TRUE
Lockyersleigh NSW -34.69 145.92 1 TRUE grassland 3 Grazing Undulating Plains Duplex 6 TRUE
(site A)
Lockyersleigh NSW -34.69 145.92 1 TRUE grassland 3 Grazing Undulating Plains Duplex 6 TRUE
(site B)
Lockyersleigh NSW -34.69 145.92 1 TRUE grassland 3 Grazing Undulating Plains Duplex 6 FALSE
(site C)
Massie QLD -28.14 151.93 1 FALSE sorghum 2 Cropping Plains Black Vertosol 4 FALSE
Moura QLD -24.83 149.78 1 FALSE Zero Tillage 4 Cropping Plains Sandy Clay Loam 6 TRUE
(Dy 3.33/Db 2.33)
Moura QLD -24.83 149.78 1 FALSE Reduced Tillage 4 Cropping Plains Sandy Clay Loam 6 TRUE
(Dy 3.33/Db 2.33)
Moura QLD -24.83 149.78 1 FALSE Conventional Tillage 4 Cropping Plains Sandy Clay Loam 6 TRUE
(Dy 3.33/Db 2.33)
Mt Carmel QLD -28.13 150.4 1 FALSE sorghum 2 Cropping Plains Mt Carmel 4 FALSE
Mt Carmel QLD -28.13 150.4 1 FALSE faba bean 2 Cropping Plains Mt Carmel 1 FALSE
Mt Carmel QLD -28.13 150.4 1 FALSE wheat 2 Cropping Plains Mt Carmel 1 FALSE

COOPERAT IVE RESEARCH CENTRE FOR CATCHMENT HYDROLOGY
69
Porosity/ Soil depth Stored Active Active soil Missing water Start/stop Rainfall Rank of Rank of Monitoring References
bulk (m) soil soil moisture driest month wettest month frequency
density moisture depth store (mm)
(mm) (m)
TRUE 1.8 207 1.2 204 FALSE N/A FALSE #N/A #N/A N/A Dalgleish and Foale (1998)
TRUE 1.8 201 1.8 201 TRUE N/A FALSE #N/A #N/A N/A Dalgleish and Foale (1998)
TRUE 1.8 267 1.8 267 TRUE N/A FALSE #N/A #N/A N/A Dalgleish and Foale (1998)
TRUE 1.8 228 1.5 228 FALSE N/A FALSE #N/A #N/A N/A Dalgleish and Foale (1998)
TRUE 1.8 34.5 1.8 34.5 TRUE N/A FALSE #N/A #N/A N/A Dalgleish and Foale (1998)
TRUE 1.8 289.5 1.8 289.5 TRUE N/A FALSE #N/A #N/A N/A Dalgleish and Foale (1998)
FALSE 5.7 262.2 4.5 227.3 FALSE Apr 1956-Mar1958 TRUE 0.004 0.039 Every 3 Weeks Holmes (1960)
FALSE 5.7 434.52 5.7 434.52 TRUE Apr 1956 -Mar 1958 TRUE 0.004 0.039 Every 3 Weeks Holmes (1960)
FALSE 5.7 368.2 5.7 368.2 TRUE Apr 1956-Mar 1958 TRUE 0.004 0.039 Every 3 Weeks Holmes (1960)
FALSE 5.7 287.5 3.3 254.4 TRUE Apr 1956-Mar 1958 TRUE 0.004 0.039 Every 3 Weeks Holmes (1960)
FALSE 5.7 324.3 4.5 321 FALSE Apr 1956-Mar 1958 TRUE 0.004 0.039 Every 3 Weeks Holmes (1960)
FALSE 5.7 282.8 3.6 257.3 TRUE Apr 1956-Mar 1958 TRUE 0.004 0.039 Every 3 Weeks Holmes (1960)
FALSE 1 136.97 1 136.97 FALSE July 1995-Mar 1999 TRUE 0.009 0.014 2-5 Weeks Dolling (2001)
FALSE 1 88.49 1 88.49 FALSE July 1995-Mar 1999 TRUE 0.009 0.014 2-5 Weeks Dolling (2001)
TRUE 1.8 187.5 1.8 187.5 TRUE N/A FALSE #N/A #N/A N/A Dalgleish and Foale (1998)
TRUE 1.8 225 1.8 225 TRUE N/A FALSE #N/A #N/A N/A Dalgleish and Foale (1998)
TRUE 1.8 178.5 1.8 178.5 TRUE N/A FALSE #N/A #N/A N/A Dalgleish and Foale (1998)
TRUE 1.8 192 1.5 195 FALSE N/A FALSE #N/A #N/A N/A Dalgleish and Foale (1998)
TRUE 1.8 231 1.8 231 FALSE N/A FALSE #N/A #N/A N/A Dalgleish and Foale (1998)
TRUE 1.8 163.5 1.5 166.5 FALSE N/A FALSE #N/A #N/A N/A Dalgleish and Foale (1998)
TRUE 1.8 189 1.8 189 TRUE N/A FALSE #N/A #N/A N/A Dalgleish and Foale (1998)
TRUE 1.8 210 1.8 210 FALSE N/A FALSE #N/A #N/A N/A Dalgleish and Foale (1998)
TRUE 1.8 234 1.5 231 FALSE N/A FALSE #N/A #N/A N/A Dalgleish and Foale (1998)
TRUE 1.8 274.5 1.5 274.5 FALSE N/A FALSE #N/A #N/A N/A Dalgleish and Foale (1998)
TRUE 1.8 153 1.8 153 TRUE N/A FALSE #N/A #N/A N/A Dalgleish and Foale (1998)
TRUE 1.8 162 1.5 159 FALSE N/A FALSE #N/A #N/A N/A Dalgleish and Foale (1998)
FALSE 2.2 233.9 2.2 233.9 TRUE Oct 1968-Apr 1971 TRUE 0.004 0.041 Weekly Pilgrim et al., (1982), Smith et
al. (1974), Smith et al., (1974)
FALSE 2.2 298.4 2.2 298.4 TRUE Oct 1968-Apr 1971 TRUE 0.004 0.041 Weekly Pilgrim et al., (1982), Smith et
al. (1974), Smith et al., (1974)
TRUE 1.6 164 1.6 164 TRUE 1980 - 1983 TRUE 0.005 0.032 Weekly Mason and Fischer (1986)
TRUE 1.5 150.4 1.5 150.4 FALSE Jan 1987-Jul 1990 TRUE 0.114 0.009 1-2 Weekly Kalma et al., (1995), Alksnis et
al. (1990)
TRUE 1.5 264.5 1.5 264.5 FALSE Jan 1987-Jul 1990 TRUE 0.114 0.009 1-2 Weekly Kalma et al., (1995), Alksnis et
al. (1990)
TRUE 1.5 181.1 1.5 181.1 FALSE Jan 1987-Jul 1990 TRUE 0.114 0.009 1-2 Weekly Kalma et al., (1995), Alksnis et
al. (1990)
TRUE 1.8 249 1.8 249 TRUE N/A FALSE #N/A #N/A N/A Dalgleish and Foale (1998)
TRUE 1.8 264 1.8 264 FALSE 1986 - 1989 TRUE 0.062 0.024 6 Weeks Lawrence et al., (1994)
TRUE 1.8 237 1.8 237 FALSE 1986 - 1989 TRUE 0.062 0.024 6 Weeks Lawrence et al., (1994
TRUE 1.8 236 1.8 236 FALSE 1986 - 1989 TRUE 0.062 0.024 6 Weeks Lawrence et al., (1994)
TRUE 1.8 216 1.8 216 TRUE N/A FALSE #N/A #N/A N/A Dalgleish and Foale (1998)
TRUE 1.8 157.5 1.5 157.5 FALSE N/A FALSE #N/A #N/A N/A Dalgleish and Foale (1998)
TRUE 1.8 219 1.5 219 FALSE N/A FALSE #N/A #N/A N/A Dalgleish and Foale (1998)

COOPERAT IVE RESEARCH CENTRE FOR CATCHMENT HYDROLOGY
70
Site location State Latitude Longitude Reliability Site map Vegetation type Generalised Landuse Terrain Soil type Data Info on
of location veg type type horizon depth
Mt Carmel QLD -28.13 150.4 1 FALSE cotton 2 Cropping Plains Mt Carmel 1 FALSE
Mt Gambier SA -37.83 140.83 1 FALSE pasture 3 Grazing Plains Dy 5.42 6 TRUE
(Grassland)
Mt Gambier SA -37.58 140.75 2 FALSE monterey pine 1 Forestry Plains Dy 5.42 1 FALSE
(Kalangadoo Sand)
Mt Gambier SA -37.83 140.67 2 FALSE monterey pine 1 Forestry Plains Uc 2.33 1 TRUE
(Young Sand)
Narrabri NSW -30.22 149.78 1 FALSE cotton 2 Cropping Plains Ug 5.25 4 FALSE
Nerrigundah NSW -32.3 151.72 2 TRUE pasture 3 Grazing Undulating Loam Based 5 TRUE
North Maroondah VIC -37.6 145.63 1 TRUE mountain ash 1 Forestry Hilly Krasnozem 5 FALSE
(Black Spur 1)
North Maroondah VIC -37.6 145.63 1 TRUE mountain ash 1 Forestry Hilly Krasnozem 5 FALSE
(Black Spur 2)
North Maroondah VIC -37.6 145.63 1 TRUE mountain ash 1 Forestry Hilly Krasnozem 5 FALSE
(Black Spur 3)
North Maroondah VIC -37.6 145.63 1 TRUE mountain ash 1 Forestry Hilly Krasnozem 5 FALSE
(Black Spur 4)
North Moree NSW -29.09 149.97 1 FALSE cotton 2 Cropping Plains Grey Vertosol 4 FALSE
North Moree NSW -29.09 149.97 1 FALSE wheat 2 Cropping Plains Grey Vertosol 1 FALSE
North Moree 2 NSW -29.04 149.93 1 FALSE barley 2 Cropping Plains Grey Vertosol 2 FALSE
North Moree 2 NSW -29.04 149.93 1 FALSE chickpea 2 Cropping Plains Grey Vertosol 1 FALSE
North Moree 2 NSW -29.04 149.93 1 FALSE faba bean 2 Cropping Plains Grey Vertosol 1 FALSE
Northfield SA -34.85 138.63 2 FALSE plain fallow 4 Cropping/Grazing Plains Black Earth (Ug 5.11) 5 TRUE
Northfield SA -34.85 138.63 2 FALSE fallow then wheat 2 Cropping/Grazing Plains Black Earth (Ug 5.11) 5 TRUE
Northfield SA -34.85 138.63 2 FALSE plain grassland 3 Cropping/Grazing Plains Black Earth (Ug 5.11) 5 TRUE
Northfield SA -34.85 138.63 2 FALSE grassland then wheat2 Cropping/Grazing Plains Black Earth (Ug 5.11) 5 TRUE
Old Junee NSW -34.83 147.5 2 FALSE annual pasture 3 Cropping/Grazing Undulating Plains Red-Brown Earth 5 FALSE
(Dr 2.42)
Old Junee NSW -34.83 147.5 2 FALSE lucerne 2 Cropping/Grazing Undulating Plains Red-Brown Earth 5 FALSE
(Dr 2.42)
Old Junee NSW -34.83 147.5 2 FALSE wheat 2 Cropping/Grazing Undulating Plains Red-Brown Earth 5 FALSE
(Dr 2.42)
Pallamallawa NSW -29.36 150.07 1 FALSE wheat 2 Cropping Plains Brown Clay 2 FALSE
Parafield SA -34.8 138.62 2 FALSE grassland then wheat2 Cropping/Grazing Plains Dr 2.13 5 TRUE
Parafield SA -34.8 138.62 2 FALSE fallow + straw 2 Cropping/Grazing Plains Dr 2.13 5 TRUE
then wheat
Parafield SA -34.8 138.62 2 FALSE fallow then wheat 2 Cropping/Grazing Plains Dr 2.13 5 TRUE
Parafield SA -34.8 138.62 2 FALSE fallow and straw 4 Cropping/Grazing Plains Dr 2.13 5 TRUE
Parafield SA -34.8 138.62 2 FALSE fallow 4 Cropping/Grazing Plains Dr 2.13 5 TRUE
Parafield SA -34.8 138.62 2 FALSE grassland 3 Cropping/Grazing Plains Dr 2.13 5 TRUE
Pingrup WA -33.53 118.5 2 FALSE lucerne 2 Cropping/Grazing Plains Solodized Solonetz 5 FALSE
(Db 4.33)
Pingrup WA -33.53 118.5 2 FALSE medic 3 Cropping/Grazing Plains Solodized Solonetz 5 FALSE
(Db 4.33)
Pinjarra WA -32.62 115.87 2 FALSE pasture 3 Cropping/Grazing Plains Spearwood Sand 1 FALSE
(Eragrostis curvula)
Pinjarra WA -32.62 115.87 2 FALSE pasture 3 Cropping/Grazing Plains Spearwood Sand 1 FALSE
(Bromus Mollis)
Point Nepean VIC -38.42 144.92 1 TRUE pasture 3 Grazing Undulating Sand Based (Uc 1) 2 FALSE
Puckapunyal VIC -37 145.12 2 FALSE forest 1 Forestry Undulating Not Stated 4 TRUE
(Depression)
Puckapunyal VIC -37 145.12 2 FALSE grassland 3 Grazing Undulating Not Stated 2 TRUE
(Depression)

COOPERAT IVE RESEARCH CENTRE FOR CATCHMENT HYDROLOGY
71
Porosity/ Soil depth Stored Active Active soil Missing water Start/stop Rainfall Rank of Rank of Monitoring References
bulk (m) soil soil moisture driest month wettest month frequency
density moisture depth store (mm)
(mm) (m)
TRUE 1.8 217.5 1.5 217.5 FALSE N/A FALSE #N/A #N/A N/A Dalgleish and Foale (1998)
FALSE 2.25 209 2.25 209 FALSE 1960 - 1965 TRUE 0.006 0 Monthly Holmes and Colville (1970),
Holmes and Colville (1970)
FALSE 7.5 642.9 2.7 400 FALSE Apr 1963 May 1966 TRUE 0.006 0 Monthly Holmes and Colville (1970),
Holmes and Colville (1970)
FALSE 8.7 233 5.4 200 FALSE Apr 1963-May 1966 TRUE 0.006 0 Monthly Holmes and Colville (1970),
Holmes and Colville (1970)
TRUE 1.5 199.4 1.5 199.4 TRUE Sept 1979 June 1980 TRUE 0.083 0.102 Every 6 Weeks Hodgson and Chan (1987),
Chan and Hodgson (1981)
FALSE 0.43 159 0.43 159 TRUE Aug 1997-Oct 1998 TRUE 0.045 0.039 Weekly/Fortnightly Walker (1999)
FALSE 5.2 405.22 5.2 405.22 TRUE July 1973 - 1976 TRUE 0.027 0.031 Monthly/Weekly Creaner (1988), Langford and
O' Shaughnessy (1977)
FALSE 3 246.05 3 246.05 TRUE July 1973 - 1976 TRUE 0.027 0.031 Monthly/Weekly Creaner (1988), Langford and
O' Shaughnessy (1977)
FALSE 5.2 405.02 5.2 405.02 TRUE July 1973 - 1976 TRUE 0.027 0.031 Monthly/Weekly Creaner (1988), Langford and
O' Shaughnessy (1977)
FALSE 3 268.55 3 268.55 TRUE July 1973 - 1976 TRUE 0.027 0.031 Monthly/Weekly Creaner (1988), Langford and
O' Shaughnessy (1977)
TRUE 1.8 220 1.8 220 TRUE N/A FALSE #N/A #N/A N/A Dalgleish and Foale (1998)
TRUE 1.8 201 1.5 201 FALSE N/A FALSE #N/A #N/A N/A Dalgleish and Foale (1998)
TRUE 1.8 165 1.8 165 FALSE N/A FALSE #N/A #N/A N/A Dalgleish and Foale (1998)
TRUE 1.8 132 1.2 132 FALSE N/A FALSE #N/A #N/A N/A Dalgleish and Foale (1998)
TRUE 1.8 126 1.5 126 FALSE N/A FALSE #N/A #N/A N/A Dalgleish and Foale (1998)
FALSE 1.8 168.4 1.8 168.4 FALSE 1963 - 1966 TRUE 0.002 0.021 2-3 Weekly Schultz (1971)
FALSE 1.8 214 1.8 214 FALSE 1963 - 1966 TRUE 0.002 0.021 2-3 Weekly Schultz (1971)
FALSE 1.8 262.5 1.8 262.5 FALSE 1963 - 1966 TRUE 0.002 0.021 2-3 Weekly Schultz (1971)
FALSE 1.8 217.7 1.8 217.7 FALSE 1963 - 1966 TRUE 0.002 0.021 2-3 Weekly Schultz (1971)
FALSE 2 194.5 2 194.5 FALSE Jan 1992-Jan 1998 TRUE 0 0.019 Twice Yearly Angus et al., (2001)
FALSE 2 224.3 2 224.3 FALSE Jan 1992-Jan 1998 TRUE 0 0.019 Twice Yearly Angus et al., (2001)
FALSE 2 294.5 2 294.5 FALSE Jan 1992-Jan1998 TRUE 0 0.019 Twice Yearly Angus et al., (2001)
TRUE 1.8 139.5 1.8 139.5 FALSE N/A FALSE #N/A #N/A N/A Dalgleish and Foale (1998)
FALSE 1.95 106.9 1.95 106.9 FALSE Oct 1966 -Oct 1968 TRUE 0.015 0.01 2-3 Weeks Schultz (1972)
FALSE 1.95 113.2 1.95 113.2 FALSE Oct 1966-Oct 1968 TRUE 0.015 0.01 2-3 Weeks Schultz (1972)
FALSE 1.95 88.8 1.95 88.8 FALSE Oct 1966-Oct 1968 TRUE 0.015 0.01 2-3 Weeks Schultz (1972)
FALSE 1.95 136.4 1.95 136.4 FALSE Oct 1966-Oct 1968 TRUE 0.015 0.01 2-3 Weeks Schultz (1972)
FALSE 1.95 106.4 1.95 106.4 FALSE Oct 1966-Oct 1968 TRUE 0.015 0.01 2-3 Weeks Schultz (1972)
FALSE 1.95 106.5 1.95 106.5 FALSE Oct 1966-Oct 1968 TRUE 0.015 0.01 2-3 Weeks Schultz (1972)
FALSE 1.5 56.04 1.5 56.04 FALSE Oct 1996-Dec 1999 TRUE 0.011 0.053 Every 3 Months Latta et al., (2001)
FALSE 1.5 26.3 1.5 26.3 FALSE Oct 1996-Dec 1999 TRUE 0.011 0.053 Every 3 Months Latta et al., (2001)
FALSE 6 250.3 5 252.6 FALSE Nov 1965-Nov 1967 TRUE 0.137 0.01 Every 6 Weeks Carbon et al., (1982)
FALSE 6 265.2 5.67 269.3 FALSE Nove 1965-Nov 1967TRUE 0.137 0.01 Every 6 Weeks Carbon et al., (1982)
TRUE 2.29 120 2.29 120 FALSE Sept 1998-Feb 2000 TRUE #N/A #N/A Monthly/2 Monthly Andrew Western (pers.comm.)
FALSE 1 220.4 1 220.4 TRUE Apr 1981-Jun 1983 TRUE 0.012 0.017 Fortnightly Burch et al., (1983)
FALSE 1 163 1 163 TRUE Apr 1981-Jun 1983 TRUE 0.012 0.017 Fortnightly Burch et al., (1983)

COOPERAT IVE RESEARCH CENTRE FOR CATCHMENT HYDROLOGY
72
Site location State Latitude Longitude Reliability Site map Vegetation type Generalised Landuse Terrain Soil type Data Info on
of location veg type type horizon depth
Puckapunyal VIC -37 145.12 2 FALSE grassland 3 Grazing Undulating Not Stated 4 TRUE
(Lower Slope)
Puckapunyal VIC -37 145.12 2 FALSE forest 1 Forestry Undulating Not Sated 4 TRUE
(Lower Slope)
Redvale QLD -26.54 151.84 1 FALSE peanuts 2 Cropping Plains Red Ferrosol 4 FALSE
Roma Res Stn QLD -26.63 148.87 1 FALSE wheat 2 Cropping Plains Brown Vertosol 4 FALSE
Rutherglen VIC -36.1 146.5 1 FALSE continuous lucerne 2 Cropping/Grazing Plains Red-Brown Earth 5 TRUE
(Dr 3.22)
Rutherglen VIC -36.1 146.5 1 FALSE annual pasture 3 Cropping/Grazing Plains Red-Brown Earth 5 TRUE
(Dr 3.22)
Simmonds Marsh TAS -43.12 147.9 1 FALSE eucalypt forest 1 Forestry Flat Krasnozem 5 FALSE
Sorell TAS -42.78 147.57 1 FALSE eucalypt forest 1 Forestry Undulating Chocolate Soil 5 FALSE
(E. globus)
Sorell TAS -42.78 147.57 1 FALSE eucalypt forest 1 Forestry Undulating Chocolate Soil 5 FALSE
(E. nitens)
Spring Ridge NSW -31.33 150.23 1 FALSE sorghum 2 Cropping Plains Black Vertosol 3 FALSE
Spring Ridge NSW -31.33 150.23 1 FALSE sunflower 2 Cropping Plains Black Vertosol 2 FALSE
Storm Hill TAS -43.28 146.97 1 FALSE eucalypt forest 1 Forestry Assumed Hilly Krasnozem 5 FALSE
Tarrawarra VIC -37.65 145.43 1 FALSE pasture 3 Grazing Undulating Hills Duplex/Gradational 6 TRUE
Three Springs WA -30.5 115.75 1 FALSE wheat 2 Cropping Plains Sand Based 1 TRUE
(upslope) (site dependent)
Three Springs WA -30.5 115.75 1 FALSE lupin 2 Cropping Plains Sand Based 4 TRUE
(upslope) (site dependent)
Three Springs WA -30.5 115.75 1 FALSE cereal rye 2 Cropping Plains Sand Based 4 TRUE
(upslope) (site dependent)
Townsville (soil 1) QLD -19.65 146.83 2 FALSE townsville stylo 3 Grazing Plains Landsdown Sandy Loam 3 TRUE
pods, legumes, (Solodized Solonetz)
annual grasses
Townsville (soil 2) QLD -19.65 146.83 2 FALSE townsville stylo 3 Grazing Plains Stockyard Loam 2 TRUE
pods, legumes, (Solodic)
annual grasses
Townsville (soil 3) QLD -19.65 146.83 2 FALSE townsville stylo 3 Grazing Plains Double Barrel Loam 4 TRUE
pods, legumes, (Red Podzol)
annual grasses
Trangie NSW -31.98 147.95 1 FALSE soybean 2 Cropping Plains Grey-Brown Clay 1 TRUE
(Ug 6.3)
Wallumbilla QLD -26.49 149.1 1 FALSE wheat 2 Cropping Plains Brown Sodosol 4 FALSE
Wallumbilla QLD -26.49 149.1 1 FALSE buffel/medic 2 Cropping Plains Brown Sodosol 4 FALSE
Walpeup VIC -35.12 142.02 1 FALSE wheat 2 Cropping Undulating Plains Sandy Loam (Gc 1.22) 4 FALSE
Warra QLD -26.9 150.9 1 FALSE cotton 2 Cropping Plains Grey Vertosol 3 FALSE
Wellcamp QLD -27.57 151.86 1 FALSE wheat 2 Cropping Plains Black Vertosol 1 FALSE
West of Brigalow QLD -26.82 150.75 1 FALSE wheat 2 Cropping Plains Grey Vertosol 3 FALSE
West of Brigalow QLD -26.82 150.75 1 FALSE cotton 2 Cropping Plains Grey Vertosol 4 FALSE
Wongan Hills WA -30.75 116.67 1 FALSE tagasaste 1 Forestry/Grazing Plains Sand 5 TRUE
Wongan Hills WA -30.75 116.67 1 FALSE fallow 4 Cropping/Grazing Plains Sand 5 TRUE
Yanchep WA -31.63 115.9 1 FALSE banksia 1 Not Specified Plains Garvin Sand 5 TRUE
Yanco NSW -34.66 146.38 2 FALSE wheat 2 Cropping Gentle Slope Red-Brown Earth 3 TRUE
Yarralaw NSW -34.27 149.88 1 TRUE grassland 3 Grazing Undulating Plains Duplex 4 TRUE

COOPERAT IVE RESEARCH CENTRE FOR CATCHMENT HYDROLOGY
73
Porosity/ Soil depth Stored Active Active soil Missing water Start/stop Rainfall Rank of Rank of Monitoring References
bulk (m) soil soil moisture driest month wettest month frequency
density moisture depth store (mm)
(mm) (m)
FALSE 1 163.6 1 163.6 TRUE Apr 1981-Jun 1983 TRUE 0.012 0.017 Fortnightly Burch et al., (1983)
FALSE 1 202.4 1 202.4 TRUE Apr 198 -Jun 1983 TRUE 0.012 0.017 Fortnightly Burch et al., (1983)
TRUE 1.8 109 1.8 109 TRUE N/A FALSE #N/A #N/A N/A Dalgleish and Foale (1998)
TRUE 0.7 119 0.7 119 TRUE N/A FALSE #N/A #N/A N/A Dalgleish and Foale (1998)
FALSE 1.8 226.76 1.8 226.76 FALSE Sept 1995-Dec 1999 TRUE 0.018 0.07 Fortnightly Ridley et al., (2001),
Ridley et al., (1997)
FALSE 1.8 153.52 1.8 153.52 FALSE Sept 1995-Dec1999 TRUE 0.018 0.07 Fortnightly Ridley et al., (2001), Ridley et
al. (1997)
FALSE 2 164.5 2 164.5 FALSE 1976 - 1980 TRUE 0.015 0.041 2-3 Weeks Nicolls et al., (1982)
FALSE 1 134.12 1 134.12 FALSE July 1991-July 1994 TRUE 0.004 0.006 Fortnightly Honeysett et al., (1996)
FALSE 1 114.12 1 114.12 FALSE July 1991-July 1994 TRUE 0.004 0.006 Fortnightly Honeysett et al., (1996)
TRUE 1.8 171 1.2 165 FALSE N/A FALSE #N/A #N/A N/A Dalgleish and Foale (1998)
TRUE 1.8 213 1.8 213 FALSE N/A FALSE #N/A #N/A N/A Dalgleish and Foale (1998)
FALSE 2 364.25 2 364.25 FALSE 1976 - 1980 TRUE 0.001 0.058 2-3 Weeks Nicolls et al., (1982)
TRUE 1.19 208 1.19 208 FALSE Sept 1995-Nov 1997 TRUE 0.008 0.073 Fortnightly Western et al., (1999), Western
and Grayson (1998)
TRUE 1.9 72.7 1.7 77.3 FALSE Jan 1984-Dec1985 TRUE 0.050 0.019 Fortnightly Hamblin et al., (1988)
TRUE 1.9 92.1 1.9 92.1 FALSE Jan 1984-Dec 1985 TRUE 0.050 0.019 Fortnightly Hamblin (upslope) et al., (1988)
TRUE 1.9 108.9 1.9 108.9 FALSE Jan 1984-Dec 1985 TRUE 0.050 0.019 Fortnightly Hamblin et al., (1988)
FALSE 0.87 73.03 0.5 63.4 FALSE Feb 1968-Aug 1968 TRUE 0.02 0.013 Weekly McCown et al., (1976),
McCown (1971)
FALSE 1.06 146.8 1.06 146.8 TRUE Feb 1968- Aug 1968 TRUE 0.02 0.013 Weekly McCown et al., (1976),
McCown (1971)
FALSE 1.49 168.1 1.49 168.1 TRUE Feb 1968-Aug 1968 TRUE 0.02 0.013 Weekly McCown et al., (1976),
McCown (1971)
FALSE 1.2 72.9 1.07 72.9 FALSE 1982 - 1984 TRUE 0.006 0.01 not stated McKenzie et al., (1990)
TRUE 1.5 199 1.5 199 TRUE N/A FALSE #N/A #N/A N/A Dalgleish and Foale (1998)
TRUE 1.5 189 1.5 189 TRUE N/A FALSE #N/A #N/A N/A Dalgleish and Foale (1998)
TRUE 1.5 121 1.5 121 FALSE 1988 - 1991 TRUE 0.004 0.027 Irregular O'Leary and Connor (1997),
O'Leary and Connor (1996)
TRUE 1.8 207 1.5 201 FALSE N/A FALSE #N/A #N/A N/A Dalgleish and Foale (1998)
TRUE 1.8 250.5 1.5 250.5 TRUE N/A FALSE #N/A #N/A N/A Dalgleish and Foale (1998)
TRUE 1.8 190.5 1.5 187.5 FALSE N/A FALSE #N/A #N/A N/A Dalgleish and Foale (1998)
TRUE 1.8 265.5 1.8 265.5 TRUE N/A FALSE #N/A #N/A N/A Dalgleish and Foale (1998)
FALSE 3.7 254 3.7 254 FALSE July 1996-Dec 1998 TRUE 0 0.041 Monthly/Fortnightly Lefroy et al., (2001)
FALSE 3.7 154 3.7 154 FALSE July 1996-Dec 1998 TRUE 0 0.041 Monthly/Fortnightly Lefroy et al., (2001)
FALSE 5.8 307.31 5.8 307.31 FALSE Aut 1982-Aut 1985 TRUE 0.022 0.02 Monthly Sharma et al., (1989), Sharma
and Craig (1989), Farrington
and Bartle (1989)
TRUE 1.4 143 1.2 140 FALSE Sept 1981-June 1984 TRUE 0.011 0.006 Weekly Fischer et al., (1988)
FALSE 1.6 168.5 1.6 168.5 TRUE May 1985-Oct 1986 TRUE 0.052 0.014 Weekly Bullock and Neil (1990),
Bullock (1987)

COOPERAT IVE RESEARCH CENTRE FOR CATCHMENT HYDROLOGY
74

COOPERAT IVE RESEARCH CENTRE FOR CATCHMENT HYDROLOGY
75
Appendix 5 – Conference Paper
Ladson, A. R., Lander, J., Western, A., Grayson, R. B.,Zhang, L. (2002) Estimating extractable soil moisturecontent for Australian Soils. 27th Hydrology andWater Resources Symposium. Melbourne. May 2003.(Conference proceedings published on CD).Institution of Engineers, Australia
ESTIMATING EXTRACTABLE SOIL MOISTURECONTENT FOR AUSTRALIAN SOILS
Anthony Ladson,1 James Lander,2 Andrew Western,3
Rodger Grayson,4 Lu Zhang5
1 Research Fellow, Cooperative Research Centre for Catchment Hydrology
2 Research Scholar, Department of Physical Geography, Macquarie University
3,4 Senior Research Fellow, Cooperative Research Centre for Catchment Hydrology
5 Senior Research Scientist, CSIRO Land and Water
Abstract
The amount of water that can be stored in soil andactively used by plants, is a key parameter inhydrologic models and is important for crop andpasture production. Often the active soil moisturestore is estimated from laboratory measurements ofsoil properties. An alternative approach, described inthis paper, is to estimate the extractable soil moisturecapacity from direct measurements of soil moisturecontent in the field. A time series of soil moisturevalues, over the depth of the soil, shows the actualchanges in water content. The difference between thewettest and driest profiles is an estimate of thedynamic soil moisture store. We have gathered dataon extractable soil water capacity for 180 locationsover Australia and have compared our values withpublished results from the Atlas of Australian Soils,derived from profile descriptions and pedo-transferfunctions. Preliminary results show that data from theAtlas of Australian soils provide a useful lower boundfor measured dynamic soil moisture storage, but of thesites examined, 42% had extractable stores greaterthan two-times the AAS values. This was due to
estimates of total soil depth that were underestimatedin the AAS results compared to the active depthsapparent in the data. These depths were stronglyrelated to vegetation type.
Key Words: extractable soil moisture, soil water,dynamic soil store, Atlas of Australian Soils.
Introduction
The amount of water that can be stored in soil andactively used by plants is a key parameter inhydrologic models, weather prediction models and isimportant for crop and pasture production. Broadscale estimates of the dynamic soil store are availableusing data from the Atlas of Australian Soils (AAS)but there has been limited validation of the results.This paper describes the collection of soil moisturestorage data, based on field measurements, and apreliminary comparison with AAS values.
Extractable Soil Moisture
A key feature of this project is the estimation ofextractable soil moisture from field measurements.This contrasts with the standard approach where, themaximum available soil water store is determinedfrom parameters estimated in a laboratory. Generally,soil samples are analysed in a laboratory to determinethe moisture content at the lower limit of availabilityto plants (–15 bar) and at “field capacity” (commonly–0.10 bar to -0.33 bar). The difference between thesevalues, often called plant available water (PAW), givesan estimate of the maximum amount of water that canbe stored in the soil and used by plants, provided a soil(or rooting) depth is assumed. It is common forrelationships to be formed between laboratory derivedPAW, and soil properties such as soil texture. Thisprocedure, known as the pedo-transfer approach,allows information from standard soils maps to beused to infer, and map, PAW (Williams, 1983).
Ritchie (1981) noted the practical problems associatedwith the estimation of plant available water using thisapproach. Accurate estimates depend on knowledgeof field capacity, permanent wilting point and bulkdensity for the whole profile within the root zone. Inreality these parameters are likely to change verticallywithin the profile and between profiles. Estimates ofthe rooting depth are also likely to be subject to error.

COOPERAT IVE RESEARCH CENTRE FOR CATCHMENT HYDROLOGY
76
There is also the issue of which soil water potentialsused in the analysis actually correspond to ‘true’ fieldcapacity and permanent wilting point.
As an alternative approach, Ritchie (1981) suggestedthe concept of extractable soil moisture as a practicalway of overcoming some of the problems associatedwith estimating available soil moisture fromlaboratory measurements. The extractable moisture isdefined as the difference between the highestmeasured volumetric water content in the field (afterdrainage) and the lowest measured volumetric watercontent when plants are very dry and leaves are eitherdead or dormant. Extractable soil water takes the rootdistribution into account provided the measured soilmoisture profile is deeper than the rooting depth.Extractable soil moisture does not require soil watercontent/potential relationships for each soil depthwhere physical properties change. Ritchie (1981)found that field measurements of the total extractablewater are often less variable spatially than availablewater estimated from water content-potentialmeasurements.
Ratliff et al., (1983) compared field and laboratorymeasurements of the limits of soil water availability.Field measured wettest and driest profiles werecompared with laboratory measurements of soilmoisture content at –15 bar (401 observations) and–0.33 bar (282 observations). Results showedlaboratory measurements of the lower limit of soilmoisture availability underestimated the field valuesfor sands, silt loams and sandy clay loams andoverestimated values for loams, silty clays, and clays.For the upper limit, laboratory estimates were less thanthe field measurements for sands, sandy loams, andsandy clay loams and were greater than laboratorymeasurements for silt loams, silty clay loams, and siltyclays. They concluded that field estimates of soilwater availability should be preferred for waterbalance calculations.
Our Approach to Estimating Extractable SoilMoisture
The approach we have used is to obtain the extractablesoil moisture capacity from field measurements of soilmoisture content. A time series of soil moisture valuesover the depth of the soil, shows the actual changes insoil moisture so the extractable soil moisture can be
estimated from the difference between the wettest anddriest profiles.
In simple terms, our methodology involved:
• Obtaining time series of profile soil moisture data;and
• Defining the ‘wettest’ and ‘driest’ profiles and usingthese to estimate extractable soil moisture.
The extractable soil moisture depends on the soil typeand the vegetation type. Deeper-rooted vegetationwill be able to extract larger amounts of soil moisturebecause it has access to more of the soil profile.Conversely, even fallowed soils will experiencewettest and driest profiles so it is possible to estimatea value for extractable soil moisture when there is novegetation.
Searching for Soil Moisture Data
There have been many, perhaps hundreds, of projectsin Australia that have involved measurement of soilmoisture. These include studies of the performance ofcrop types, cropping systems, water balance studies,analysis of recharge associated with salinityinvestigations and studies of water yield followingfires or forest cutting. Profile soil moisturemeasurements have been measured using NeutronMoisture Meters, Time Domain Reflectometry, andGravimetric Sampling. Originally we intended to trackdown raw data from a large number of studies wherethere were long time-series of profile measurements ofsoil moisture. This turned out to be impossible.Although over 90 researchers were contacted, and wereceived excellent cooperation, few usable datasetswere obtained. Commonly, the data used byhydrologists are measured and managed byorganisations with a particular mandate, and theresources necessary, to archive and make availabletheir information. Meteorological and streamflowdata are two obvious examples. But informationwhere there are no coordinated monitoring networks isdifficult to track down. Much of the information wehave been seeking was collected as part of individualresearch projects by a researcher, or small group ofresearchers. The motivations in these sorts of projectsare to answer some specific questions and make theresults available through publications. Indeed wehave gained a lot of the information we need from

COOPERAT IVE RESEARCH CENTRE FOR CATCHMENT HYDROLOGY
77
published papers and reports. However, the basic datanormally reside in field books or computer media ofdifferent sorts, depending on the age of the study.These data have been used by the research team at thetime, but, from the researcher (and likely the client’s)point of view, once the appropriate analysis andpublications have been completed, there is little needto do anything more with them. That makes the datadifficult for others to obtain and use, especially whencorporate memory starts to fade.
In this project, the way forward was to use soilmoisture data and results from published reports andjournal articles. Generally these data are welldocumented and cleaned up, although probably only asmall amount of the total data collected is available inthis form. Over 200 journal articles were examinedand information from about 75 articles contributed toour database. A particularly valuable source of datawas the work of Agricultural Production SystemsResearch Unit in Toowoomba, Queensland, which haspublished an extensive guide to soil water availabilityfor southern Queensland. In all, storage capacitieswere obtained for 180 unique soil, crop, location,combinations (Figure 1).
An example of the data we have used is shown inFigure 2, which is a time series of moisture storage inthe top 2.2 m of the soil profile under a Pinus radiataplantation near Lidsdale, NSW (33.43S, 150.07E)between October 1968 and April 1971 (Smith, 1972).
Soil moisture measurements were made about every 2weeks. Soils are hard setting loams with mottledyellow clayey subsoil derived from both Devonian andPermian parent material: Northcote (1966)classifications Dy 3.41 and Dy 2.61.
From the time-series, the driest conditions occurred on4 February 1969 and the wettest on 12 February 1971.In this case, soil moisture profile data were availablefor the wettest and driest observations and are shownon Figure 3. More commonly, only a small subset ofthe measured data was included in the sources we usedto populate our database.
The maximum active soil moisture store is thedifference between the maximum and minimumvalues in the time series of soil moisture data (Figure2), which is equivalent to the difference between thewettest and driest profiles (Figure 3) i.e. 234 mm.
Of the 180 active soil moisture storage measurementsin our database, 91 are based on similar data to thatshown in Figures 2 and 3. That is, the soil moisturewas measured under natural climatic conditions withthe wettest and driest profiles determined by theweather and cropping cycle. The other 89 values arefrom situations where the soil was artificially wettedand dried to obtain an estimate of the maximum activesoil store. Field procedures are documented inDalgiesh and Foale (1998) for the artificiallymanipulated conditions.
Figure 1 Sites Where Extractable Soil MoistureEstimates are Available
Figure 2 Time Series of Soil Moisture Storage forLidsdale, NSW

COOPERAT IVE RESEARCH CENTRE FOR CATCHMENT HYDROLOGY
78
The database also includes information on: location,vegetation type, landuse, soil type, active soil moisturestore, soil depth, horizon depth, porosity, bulk density,dates when soil moisture measurements where made,soil moisture monitoring frequency, and the referencesused to derive the data. There is also an assessment ofthe accuracy of the soil moisture measurements interms of their ability to represent the soil moisturestore.
How dry is dry and how wet is wet?
Field measurements of the wettest and driest profiles,which occur under natural conditions, will only give agood estimate of the total active soil moisture store ifthe weather was wet and dry during the measurementperiod. For this reason, where we based the active soilstore estimate on a time-series of soil moisturemeasurements, a minimum of 2 years of data havebeen used. For each of these locations (45 sites), therainfall during the measurement period was comparedto long-term rainfall data. Comparisons were madeusing sixty years of monthly rainfall data (1940 to1999), provided by the Bureau of Meteorology. Thesedata come from a monthly rainfall grided dataset,which has been developed by the Bureau, whererainfall has been estimated for square cells of 0.25degrees (approximately 25 km depending on latitude).
The median, 25th and 75th percentiles were comparedto the rainfall during the soil moisture measurementperiod at the 45 sites. For example, the rainfall duringthe 31 months when soil moisture was collected atLidsdale, NSW (October 1968 to May 1971) can becompared to summary statistics for January 1940 to
December 1999 (see Figure 4).
The wettest and driest months during the measurementperiod were also compared to the long-term rainfalldata. The rank of the wettest and driest month wascalculated based on the 720 months of long-term data.For example, at Lidsdale, only 0.4% of monthsbetween 1940 and 1999 were drier than the driestmonth during the measurement period, whereas 96%of months were drier than the wettest month. Extremeranks increase the likelihood that the active soilmoisture storage has been captured by the measureddata. For the 45 sites where ranks were calculated,82% of the driest months were in the driest 5% of allmonths and 87% of wettest months where in thewettest 5% of all months. The distribution of the ranksof the driest months is shown in Figure 5. Data for thewettest months is similar. Only 5 sites had adifference between the wettest and driest ranks of lessthan 90%. These results provide justification for usingthe difference between the wettest and driest profiles,in our dataset, as an estimate of the active soil store.
Figure 3 Wettest and Driest Soil Moisture Profiles forLidsdale, NSW
Figure 4 Rainfall During the Period of Measurement atLidsdale (October, 1968 to April 1971)
Compared to the 25th, and 75th Percentiles,and the Median, for Data from January 1940to December 1999.

COOPERAT IVE RESEARCH CENTRE FOR CATCHMENT HYDROLOGY
79
Comparison with the Atlas of Australian Soils
The Atlas of Australian Soils (Northcote et al., 1960-1968) provides spatial information on soil landscapesfor the whole of Australia based on soil characteristicsthat can be observed in the field. This has been animportant resource for over three decades, andremains the only consistent source of data for thewhole continent. However until recently it has notbeen straightforward to use the Atlas to establish thesoil physical properties that are important forhydrologic analysis.
McKenzie et al., (2000) (following from Hooke &McKenzie, 1992) have addressed this problem andprovide data on soil physical properties for the 725soils in the Digital Atlas of Australian Soils (BRS,1991). Soil properties have been estimated using asimple two-layer soil model consisting of A and Bhorizons. Soil water retention properties werecalculated for each soil, based on estimates ofthickness, texture, bulk density and pedality (usingWilliams (1993) approach). The available watercapacity for each layer was calculated from fitted soilwater retention curves assuming upper and lowerlimits of –0.1 bar and –15 bar respectively.
The Digital Atlas of Australian Soils provides data forpolygons (there are 22,560 in total) that represent soilsin particular regions. Each of the polygons isattributed with one of 3060 soil landscape types, manyof which occur more than once. For each map unit,
the dominant soil type is described (referred to as thedominant Principle Profile Form) along with anysubdominant Principle Profile Forms. McKenzie etal., (2000) records up to 5 Principle Profile Forms foreach soil landscape. Each of the Principle ProfileForms includes an estimate of solum thickness (thesum of the depth of the A and B horizons) and theavailable water capacity over that depth. Wheninterrogating the data on soil physical properties,specifying a location, will link to a polygon and returninformation on the dominant and subdominantPrinciple Profile Forms.
Our estimates of the active soil moisture store, basedon field measurements, provide an opportunity forcomparison with the available water capacity from theinterpretation of the Atlas of Australian Soilsinformation. For each of the locations in our database(Figure 1) the available water capacity estimated forcorresponding dominant Principle Profile Form wascompared to the extractable soil moisture store (Figure6). In several cases, there is more than one estimate ofextractable soil moisture store for a particular locationbecause measurements were made under more thanone vegetation type. All the available estimates havebeen included in Figure 6. The outlying high storagevalue shown Figure 6 of 680 mm is from a site in theBrindabellas, ACT where soil moisture was measuredunder a mixed Eucalypt forest during a drought(Talsma & Gardner, 1986).
The results show that the soil moisture store from theAtlas of Australian Soils is generally smaller than theestimate from field measurements. A comparison ofthe ratio of the differences (Figure 7) showed that 42%of the estimates of extractable soil moisture weregreater than twice the value from Atlas of AustralianSoils. In general, estimates of available water capacityfrom McKenzie et al., (2000) could be considered areasonable lower bound on field-based estimates ofthe actual dynamic soil moisture store. It should benoted that the information on location in our databaseis of variable quality and depends on the precision inthe original reference, supplemented whereappropriate (and possible) by direct discussions withresearchers. Errors in location will contribute a smallamount of the variance shown in Figure 6.
Figure 5 Rank of the driest month when comparingrainfall during the period when soil moisturewas measured with 60 years of rainfall data(1940 – 1999). Data are for 45 locations.

COOPERAT IVE RESEARCH CENTRE FOR CATCHMENT HYDROLOGY
80
The comparison in Figures 6 and 7 is made using thedominant Principle Profile Form for each polygon thatmatches a particular location. In most cases there willalso be subdominant Principle Profile Forms with theirown associated estimates of available water capacity.These provide a greater spread of estimates as shownin Figure 8 where the extreme variability is apparent,although the extractable soil moisture store is stillgenerally much larger than the estimate using AASdata.
Estimates of the available water capacity provided byMcKenzie et al., (2000) are the product of the depth ofthe soil profile and the soil moisture storage capacityper unit depth. Equivalent parameters are alsoavailable from our database where an active soil depthis defined based on the where the wettest and driestprofiles meet or the maximum depth of soil moisturemeasurement; which ever is less (Figure 3).
The soil moisture store per unit depths are comparedin Figure 9 using only the dominant Principle ProfileForm for each location. In this case the estimates fromMcKenzie et al., (2000) and the field measurementscluster around the 1:1 line suggesting reasonableagreement, although clearly the scatter is large.
The active soil depth from field measurements, and thesolum thickness from the Atlas of Australian Soils arecompared in Figure 10. Active soil depths aregenerally much larger than solum thickness estimates.It is the underestimate of active soil depth thatexplains the low estimate of soil moisture store fromAAS interpretation shown in Figure 6.
McKenzie et al., (2000) acknowledges that solumthickness estimates are likely to be subject to error.Unfortunately, the thickness of individual soil layers,and the depth of the soil profile, are often not recordedas part of the Northcote classification and there is onlyimprecise definition of the depth of soil that can beexploited by plants. Often plants will extract moisture
Figure 6 Comparison of Soil Moisture Stores from theAtlas of Australian Soils with Field-basedEstimates of Extractable Soil Moisture
Figure 7 Ratio of Estimates of Soil Moisture Storefrom the Atlas of Australian Soils and FieldMeasurements of Extractable Soil Moisture
Figure 8 Comparison of Field-based Estimates ofExtractable Soil Moisture with the Estimatesof Available Water Capacity from the Atlas ofAustralian Soils. Estimates for the Dominantand Subdominant Principle Profile Forms areShown for Each Location

COOPERAT IVE RESEARCH CENTRE FOR CATCHMENT HYDROLOGY
81
from below the A and B horizons and historicaldatasets do not provide any consistent information ondeeper soil layers. Data in existing soils databasesalso tends to be censored because of the method usedto collect soil profile information, for example, soilpits and augers are often restricted to 1 to 2 metres.Often soil surveys for agricultural purposes restrictexamination to the first 1 m of the soil profile andsome Principle Profile Forms are only comprised of anA horizon, yet roots can penetrate deeper soils(McKenzie et al., 2000).
Clearly, estimates of available water capacity could beimproved by better soil descriptions but it is alsonecessary to use appropriate estimates of active soildepth. The active soil depth is partly determined byrooting depth of vegetation but it is also possible formoisture to be withdrawn from the soil under fallowconditions. Estimates of active soil depth from ourdatabase for trees, crops, grass and fallow are shownin Figure 11. The active soil depth for crop, grass, andfallow are generally one to two metres with someoutliers that are probably explained by soil type. Forexample, the two large active soil depths for crop, (ofabout 5 m) are for lucerne grown on deep sandy soilsnear Keith, South Australia (Holmes, 1960). Theactive soil depths for grass of around 5 metres weremeasured on deep sands near Pinjarra, WA (75 kmsouth of Perth) (Carbon et al., 1982) and the highactive soil depth for fallow conditions (of about 3.7 m)was for a deep sandy soil near Wongan Hills inWestern Australia about 170 km north-east of Perth
where there may have been interaction withgroundwater.
The active soil depth for trees is more variable than forcrop, grass and fallow, ranging from 1 to 12 m. Again,the largest active depths are for deep sandy soils.Further work is required before the active soil depthcan be predicted from soil types and tree taxa.
Conclusion
Information on extractable soil moisture has beengathered for 180 unique combinations of location, soiland vegetation types. This dataset provides estimatesof the soil moisture storage based on fieldmeasurements of wettest and driest soil moistureprofiles.
Figure 9 A Comparison of Soil Moisture Store Per UnitDepth
Figure 10 A comparison of solum depth from the Atlasof Australian Soils and active soil depth fromfield measurements
Figure 11 Active Soil Depths Based on FieldMeasurements of Extractable Soil Moisturefor 3 Vegetation Types and Fallow Conditions
COOPERAT IVE RESEARCH CENTRE FOR CATCHMENT HYDROLOGY
82
Our search for this profile information revealeddeficiencies in the way data from experimental studiesis archived in Australia. For parts of the hydrologiccycle, such as rainfall and streamflow, there isaccurate current and historical information that iseasily accessible. This contrasts with soil moisturedata that are usually gathered for specific projects sothere is little incentive to archive it in a form that canbe interpreted by others. Most of the data we havegathered was from published sources, which probablyrepresents only a small proportion of the soil moisturemeasurements that have been collected.
Analysis of rainfall during the periods when soilmoisture was measured, suggests that observed driestand wettest profiles are good estimates of theminimum and maximum storage values. In over 80%of cases, the wettest and driest months during themeasurement periods were ranked within 5% thewettest and driest months of a 60-year rainfall record(1940 to 1999). Around 40% of the time they wereranked within the top 1%.
The extractable soil moisture stores were comparedwith the available water capacity estimated byMcKenzie et al., (2000) for the Atlas of AustralianSoils (AAS). Preliminary results show that data fromthe Atlas of Australian soils provide a useful lowerbound for measured dynamic soil moisture storage,but of the sites examined, 42% had extractable storesgreater than two-times the AAS values.
In the future we plan to compare estimates ofextractable soil moisture with data from Australia SoilResource Information System (ASRIS) that is beingprepared as part of the National Land and WaterResources Audit and is planned for release in 2002.ASRIS will provide detailed information on soilproperties in the intensively used areas of Australiaand will include information that has been collectedsince the preparation of the Atlas of Australian Soilsduring the 1960s (NLWRA, 1999). However, theAtlas of Australian Soils and additional interpretationssuch as those by McKenzie et al., (2000) will remainthe best sources of information for much of Australia.Our analysis shows that estimates of available watercapacity from the Atlas of Australian Soils must betreated with caution particularly where there are trees.There is the potential of using information on
vegetation type to better estimate active soil depths butfurther work is needed to quantify these relationships
Acknowledgements
The assistance of the Bureau of Meteorology inproviding rainfall data is gratefully acknowledged.The cooperation of all the people who provided accessto data or reports is acknowledged with thanks. Thiswork is funded through the CRC for CatchmentHydrology.
References
BRS (Bureau of Rural Sciences after CommonwealthScientific and Industrial Research Organisation)(1991) Digital Atlas of Australian Soils(ARC/INFO® vector format). [Online]:http://www.brs.gov.au/data/datasets (14 December,2001)
Carbon, B. A., Roberts, F. J., Farrington, P. andBeresford, J. D. (1982) “Deep drainage and water useof forests and pastures grown on deep sands in aMediterranean environment”, Journal of Hydrology55,53-64.
Dalgliesh, N. and M. Foale (1998) Soil Matters.Monitoring soil water and nutrients in drylandfarming, Agricultural Production Systems ResearchUnit, Toowoomba.
Holmes, J. W. (1960) “Water balance and the water-table in deep sandy soils of the upper south-east,South Australia”, Australian Journal of Soil Research11,970-988.
McKenzie, N. and Hook, J (1992) Interpretations ofthe Atlas of Australian Soils, Consulting Report tothe Environmental Resources Information Network.CSIRO, Technical Report 94/1992.
McKenzie, N. J., Jacquier, D. W., Ashton L. J., andCresswell H. P. (2000) Estimation of soil propertiesusing the Atlas of Australian Soils. Canberra, CSIROLand and Water: 11.
NLWRA (National Land and Water Resources Audit)(1999). Australian Soil Resource Information System.

COOPERAT IVE RESEARCH CENTRE FOR CATCHMENT HYDROLOGY
83
Fast Facts 12.http://www.nlwra.gov.au/minimal/15_publications/22_fast_facts/fast_facts_12.html (December 11, 2001).
Northcote, K. H. (1966) Atlas of Australian Soils,Explanatory Data for Sheet 3, Sydney – Canberra –Bourke – Armidale Area, CSIRO and MelbourneUniversity Press, Melbourne.
Northcote, K. H., Beckmann, G. G., Bettenay, E.,Churchward, H. M., Van Dijk, D. C., Dimmock, G.M., Hubble, G. D., Isbell, R.F., McArthur, W. M.,Murtha, G.G., Nicholls, K. D., Paton, T. R.,Thompson, C. H., Webb, A. A., Wright, M. J. (1960-1968) Atlas of Australian Soils, Sheets 1 to 10 withexplanatory data, CSIRO and Melbourne UniversityPress, Melbourne.
Ratliff, L. F., Ritchie, J. T. and Cassel, D. K. (1983)“Field-measured limits of soil water availability asrelated to laboratory-measured properties”, SoilScience Society of American Journal 47, 770-775.
Ritchie, J. T. (1981) “Water dynamics in the soil-plant-atmosphere system”, Plant and Soil 58, 81-96.
Smith, M. K. (1972) A comparative study of thehydrology of radiata pine and Eucalypt forests atLidsdale, NSW. Master of Science thesis, TheUniversity of New South Wales.
Talsma, T. and Gardner, E. A. (1986) “Soil waterextraction by a mixed forest during a drought period”,Australian Journal of Soil Research 24, 24-32.
Williams, J. (1983) Physical properties and waterrelations: soil hydrology. In: Soils: an Australiaviewpoint. CSIRO Division of Soils, Melbourne andAcademic Press, London.
Author(s) Biography(ies)
Tony Ladson is a project leader with the CooperativeResearch Centre for Catchment Hydrology. Heundertook research on terrain analysis and microwaveremote sensing of soil moisture at the University ofMinnesota where he completed his master’s degreeand then worked on spatial organisation of soilmoisture at the Geographic Information and AnalysisCentre at Montana State University. He is currentlyworking on a project to estimate soil moisture storagecharacteristics from field measurements of soilmoisture profiles.
Postal Address: CRC for Catchment Hydrology,Department of Civil Engineering, Building 60,Monash University VIC 3800.
E-mail: [email protected]

C O O P E R A T I V E R E S E A R C H C E N T R E F O R C A T C H M E N T H Y D R O L O G Y
Established and supportedunder the Australian
Government’s CooperativeResearch Centre Program
The Cooperative Research Centre forCatchment Hydrology is a cooperativeventure formed under the AustralianGovernment’s CRC Programmebetween:
• Brisbane City Council
• Bureau of Meteorology
• CSIRO Land and Water
• Department of Infrastructure,Planning and Natural Resources,NSW
• Department of Sustainability andEnvironment, Vic
• Goulburn-Murray Water
• Griffith University
• Melbourne Water
• Monash University
• Murray-Darling Basin Commission
• Natural Resources, Mines andEnergy, Qld
• Southern Rural Water
• The University of Melbourne
• Wimmera Mallee Water
ASSOCIATE:
• Water Corporation of WesternAustralia
RESEARCH AFFILIATES:
• Australian National University
• National Institute of Water andAtmospheric Research, New Zealand
• Sustainable Water ResourcesResearch Center, Republic of Korea
• University of New South Wales
INDUSTRY AFFILIATES:
• Earth Tech
• Ecological Engineering
• Sinclair Knight Merz
• WBM
CENTRE OFFICECRC for Catchment HydrologyDepartment of Civil EngineeringBuilding 60 Monash University Victoria 3800 Australia
Tel +61 3 9905 2704Fax +61 3 9905 5033email [email protected]