Embed Size (px)
Citation preview
DNV GL © 2015 SAFER, SMARTER, GREENER DNV GL © 2015
ESTIMATING ENERGY LOSSES CAUSED BY BLADE ICING FROM PRE-CONSTRUCTION WIND DATA
1
WINTERWIND 2015, Piteå
Till Beckford
3 February 2015
(UNDERSTANDING, PREDICTING, ADJUSTING)
DNV GL © 2015
Contents
2
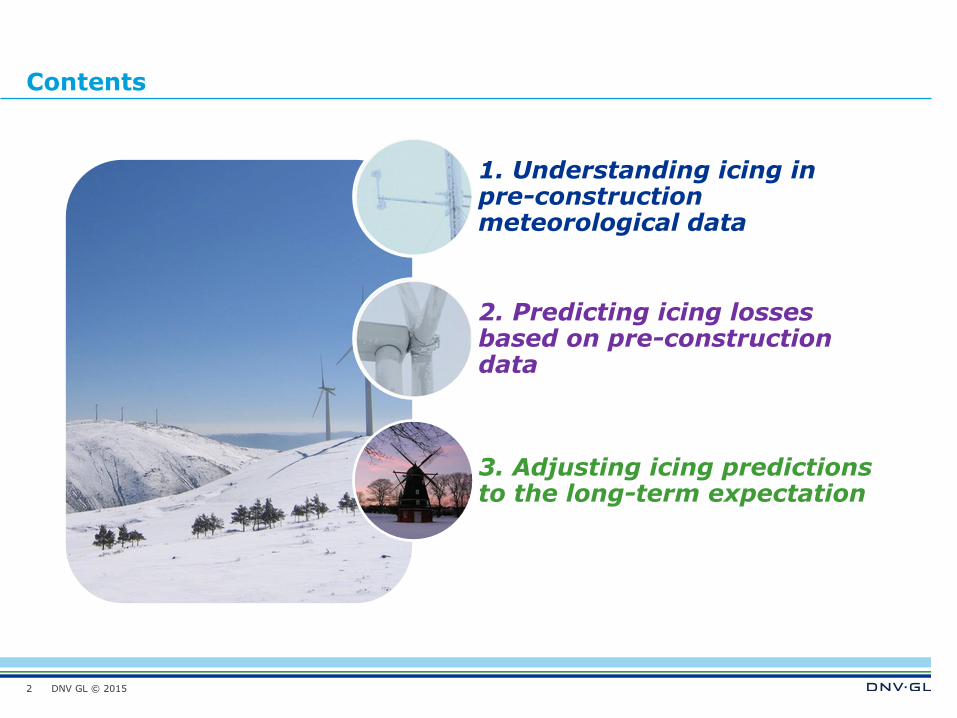
1. Understanding icing in pre-construction meteorological data
2. Predicting icing losses based on pre-construction data
3. Adjusting icing predictions to the long-term expectation
DNV GL © 2015
Introduction
3
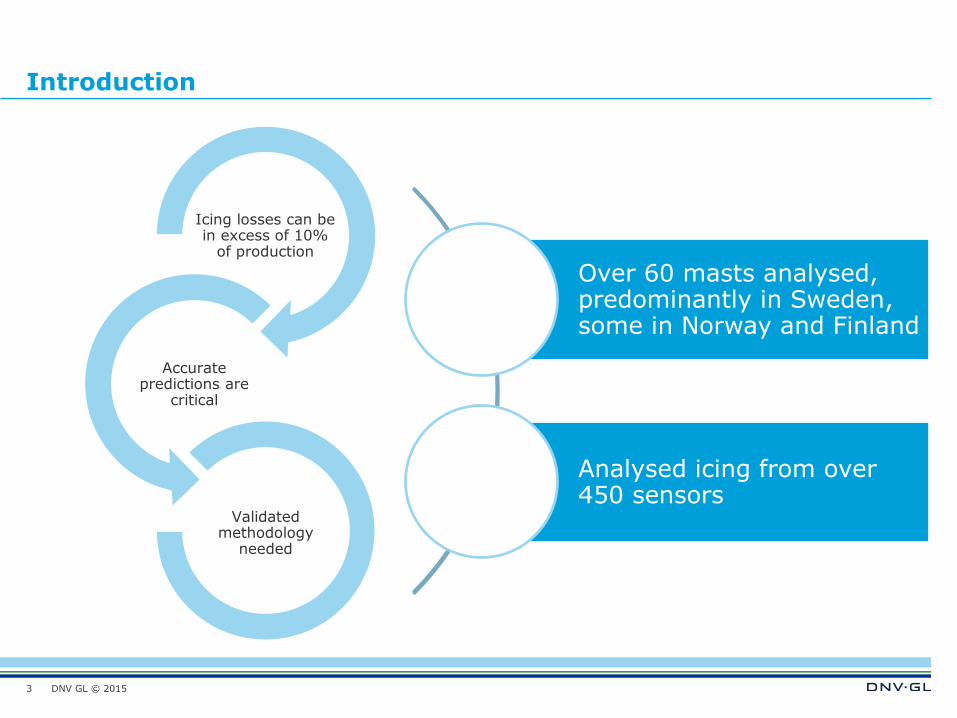
Icing losses can be in excess of 10%
of production
Accurate predictions are
critical
Validated methodology
needed
Over 60 masts analysed, predominantly in Sweden, some in Norway and Finland
Analysed icing from over 450 sensors
DNV GL © 2015
Contents
4
1. Understanding icing in pre-construction meteorological data
2. Predicting icing losses based on pre-construction data
3. Adjusting icing predictions to the long-term expectation
DNV GL © 2015
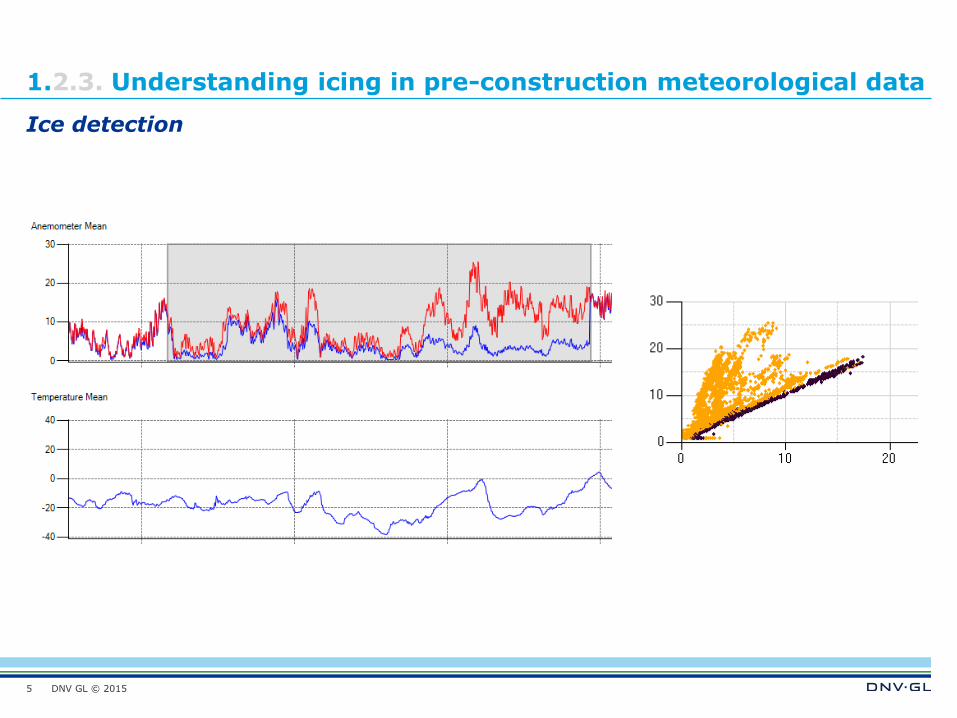
1.2.3. Understanding icing in pre-construction meteorological data
5
Ice detection
DNV GL © 2015
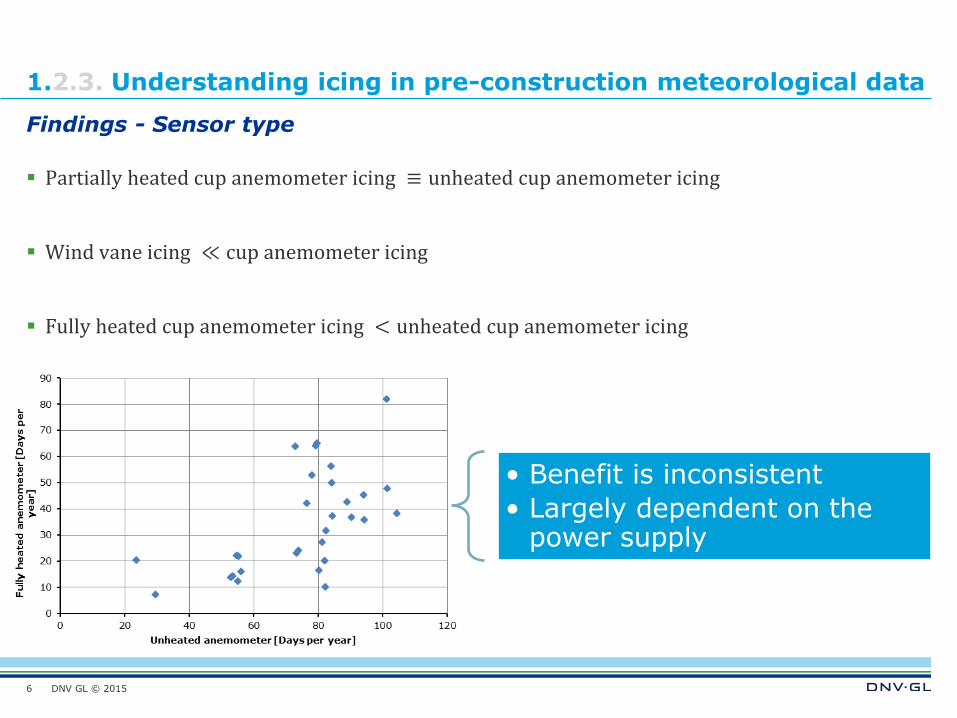
1.2.3. Understanding icing in pre-construction meteorological data
Partially heated cup anemometer icing ≡ unheated cup anemometer icing
Wind vane icing ≪ cup anemometer icing
Fully heated cup anemometer icing < unheated cup anemometer icing
6
Findings - Sensor type
• Benefit is inconsistent
• Largely dependent on the power supply
DNV GL © 2015
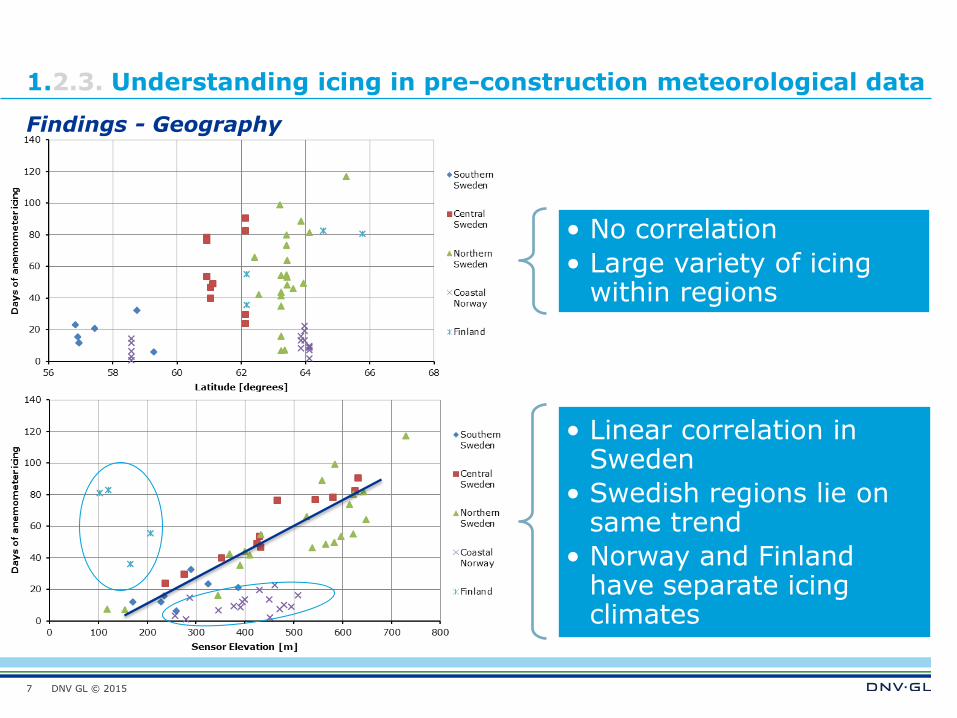
1.2.3. Understanding icing in pre-construction meteorological data
7
Findings - Geography
• No correlation
• Large variety of icing within regions
• Linear correlation in Sweden
• Swedish regions lie on same trend
• Norway and Finland have separate icing climates
DNV GL © 2015
Contents
8
1. Understanding icing in pre-construction meteorological data
2. Predicting icing losses based on pre-construction data
3. Adjusting icing predictions to the long-term expectation
DNV GL © 2015
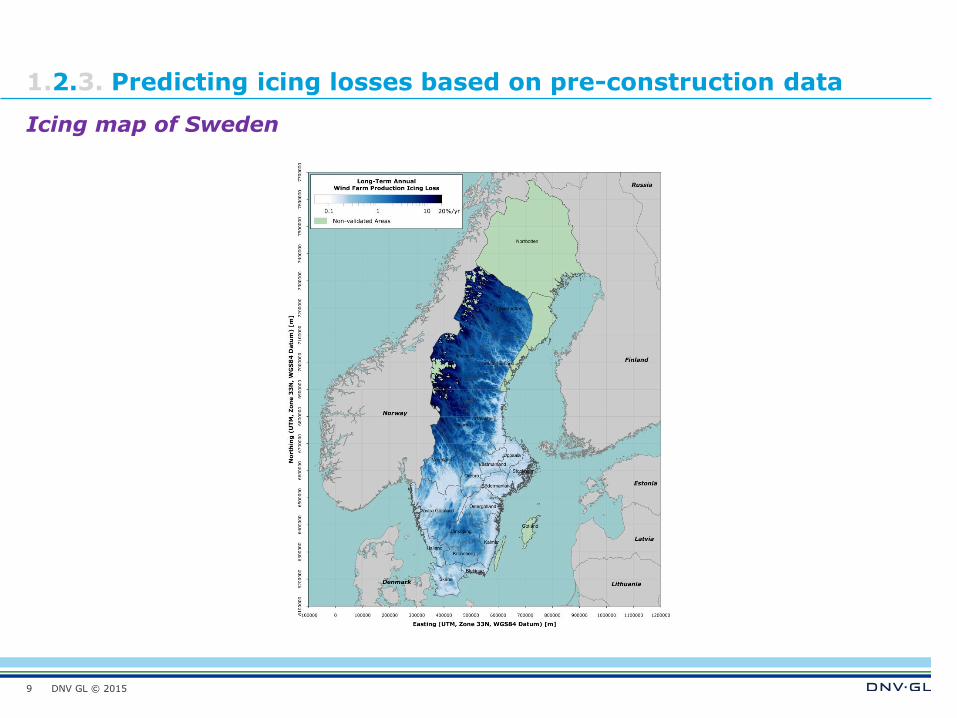
1.2.3. Predicting icing losses based on pre-construction data
9
Icing map of Sweden
DNV GL © 2015
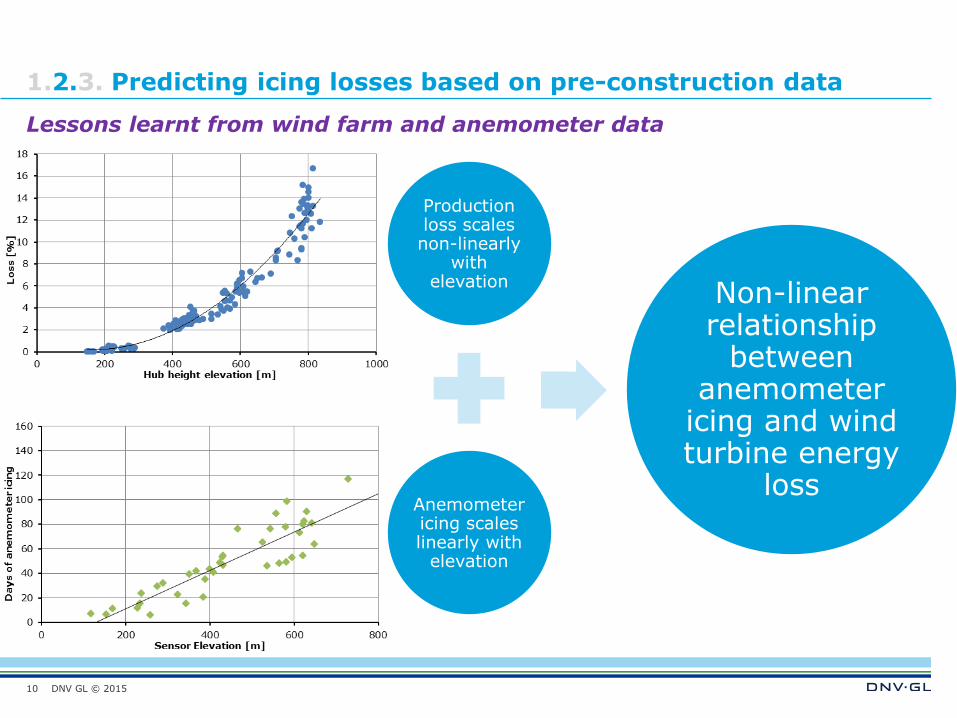
1.2.3. Predicting icing losses based on pre-construction data
10
Lessons learnt from wind farm and anemometer data
Production loss scales non-linearly
with elevation
Anemometer icing scales linearly with
elevation
Non-linear relationship
between anemometer
icing and wind turbine energy
loss
DNV GL © 2015
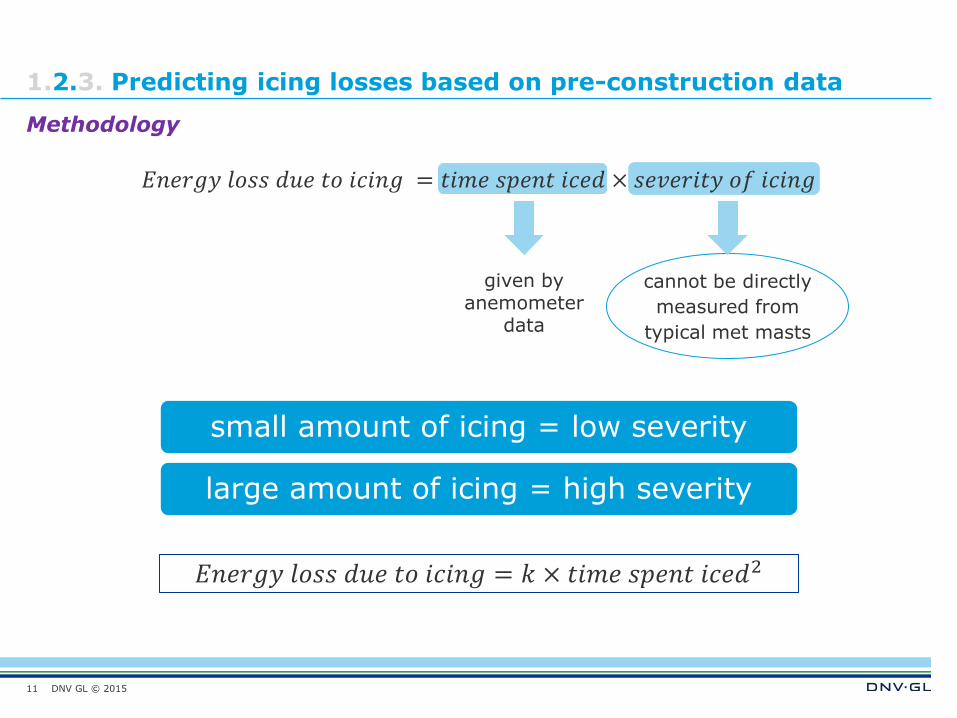
1.2.3. Predicting icing losses based on pre-construction data
𝐸𝑛𝑒𝑟𝑔𝑦 𝑙𝑜𝑠𝑠 𝑑𝑢𝑒 𝑡𝑜 𝑖𝑐𝑖𝑛𝑔 = 𝑡𝑖𝑚𝑒 𝑠𝑝𝑒𝑛𝑡 𝑖𝑐𝑒𝑑 × 𝑠𝑒𝑣𝑒𝑟𝑖𝑡𝑦 𝑜𝑓 𝑖𝑐𝑖𝑛𝑔
11
𝐸𝑛𝑒𝑟𝑔𝑦 𝑙𝑜𝑠𝑠 𝑑𝑢𝑒 𝑡𝑜 𝑖𝑐𝑖𝑛𝑔 = 𝑘 × 𝑡𝑖𝑚𝑒 𝑠𝑝𝑒𝑛𝑡 𝑖𝑐𝑒𝑑2
given by anemometer
data
cannot be directly
measured from
typical met masts
Methodology
small amount of icing = low severity
large amount of icing = high severity
DNV GL © 2015
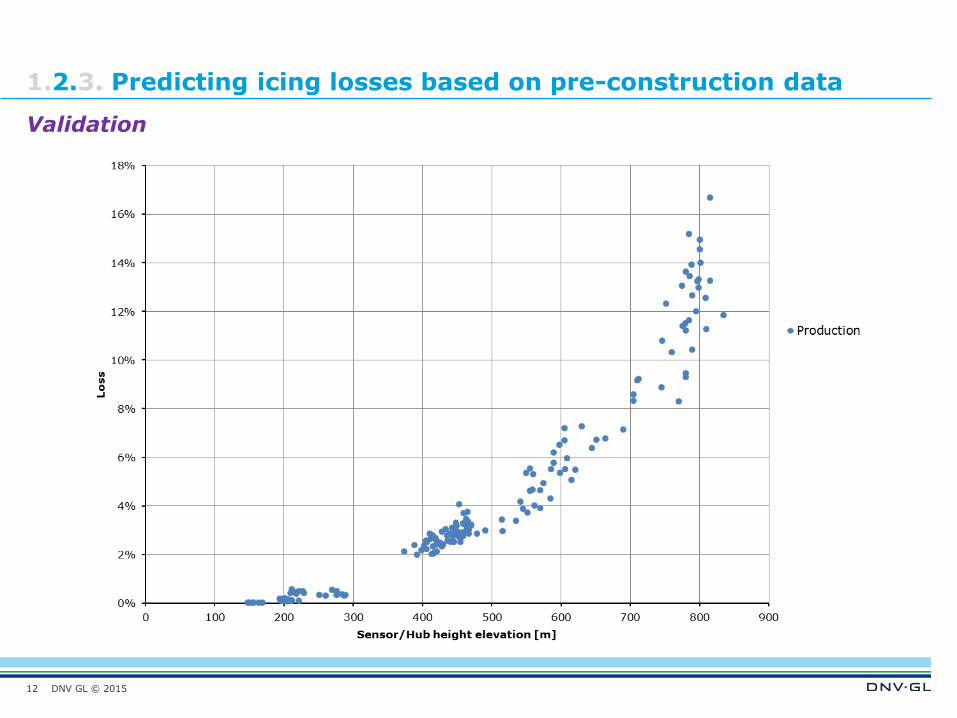
1.2.3. Predicting icing losses based on pre-construction data
12
Validation
DNV GL © 2015
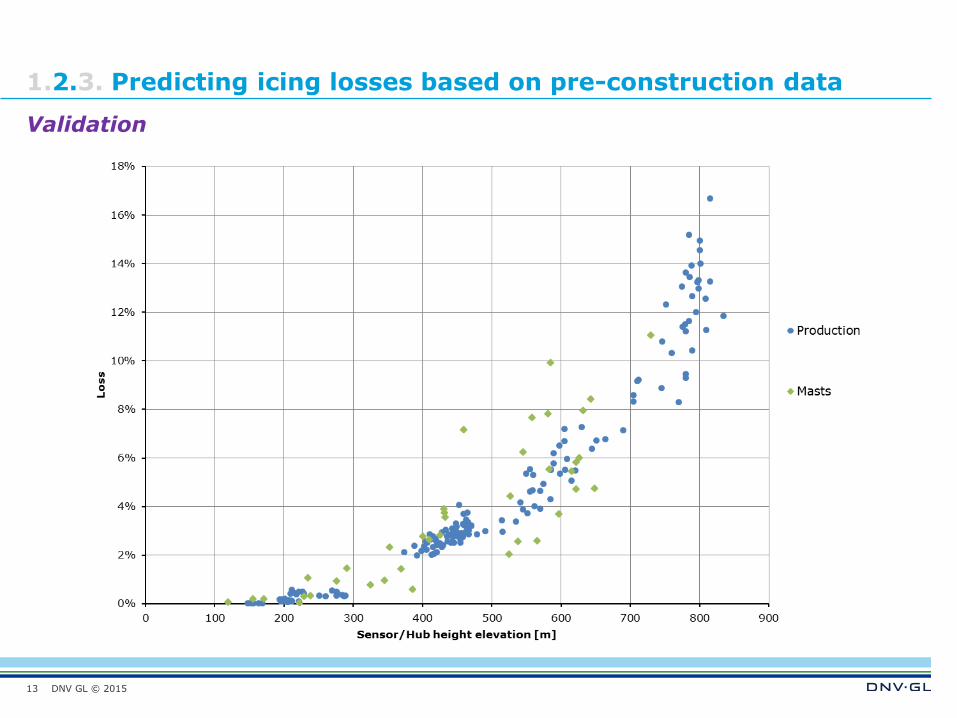
1.2.3. Predicting icing losses based on pre-construction data
13
Validation
DNV GL © 2015
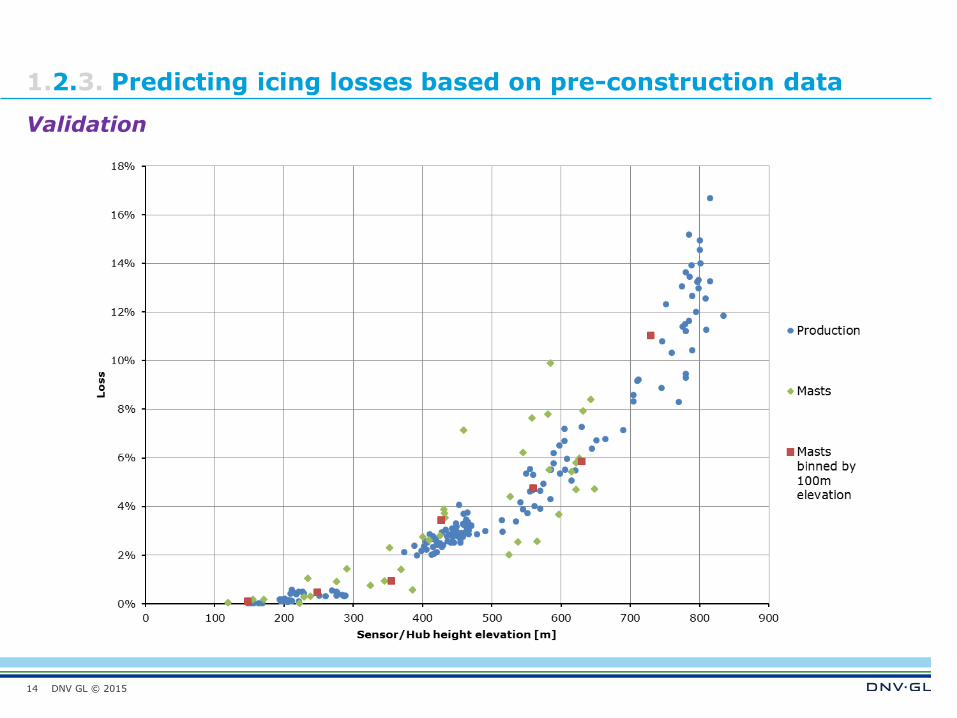
1.2.3. Predicting icing losses based on pre-construction data
14
Validation
DNV GL © 2015
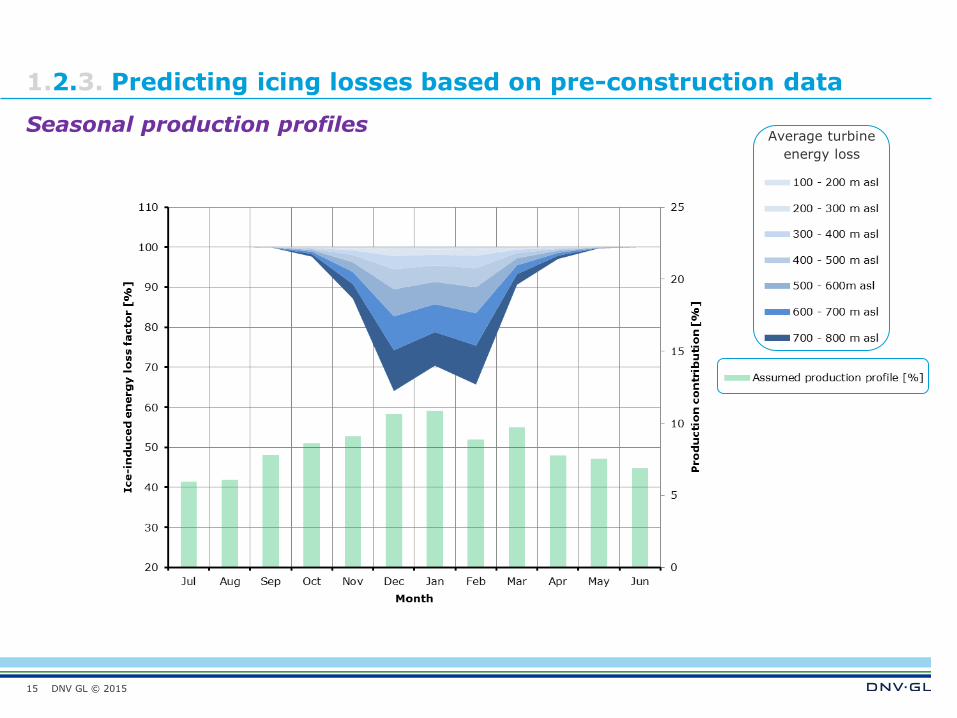
1.2.3. Predicting icing losses based on pre-construction data
15
Seasonal production profiles Average turbine
energy loss
DNV GL © 2015
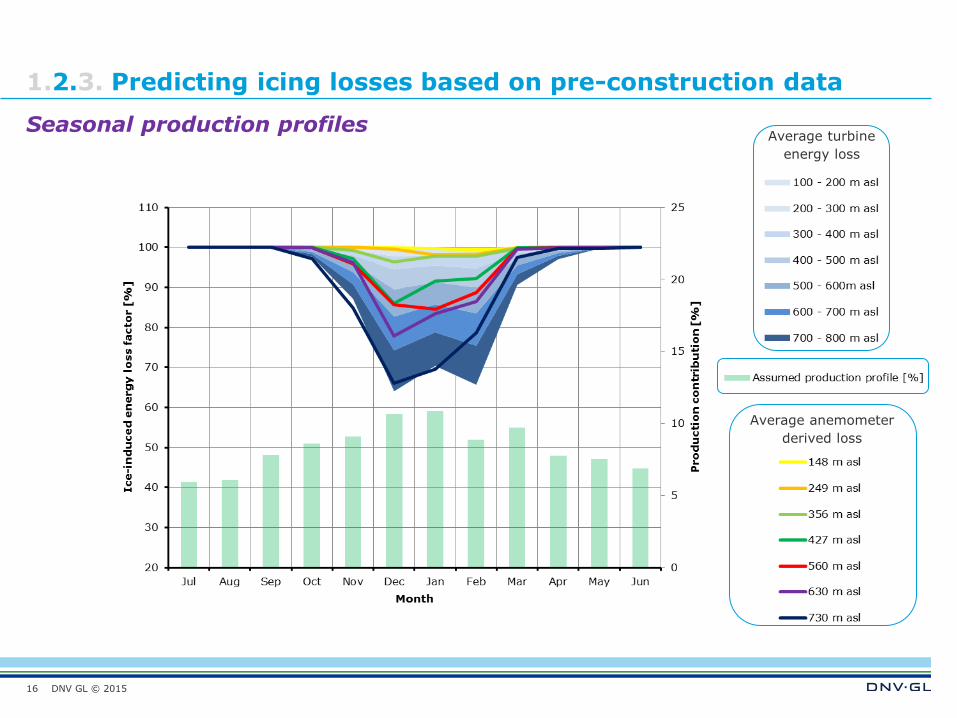
1.2.3. Predicting icing losses based on pre-construction data
16
Seasonal production profiles Average turbine
energy loss
Average anemometer
derived loss
DNV GL © 2015
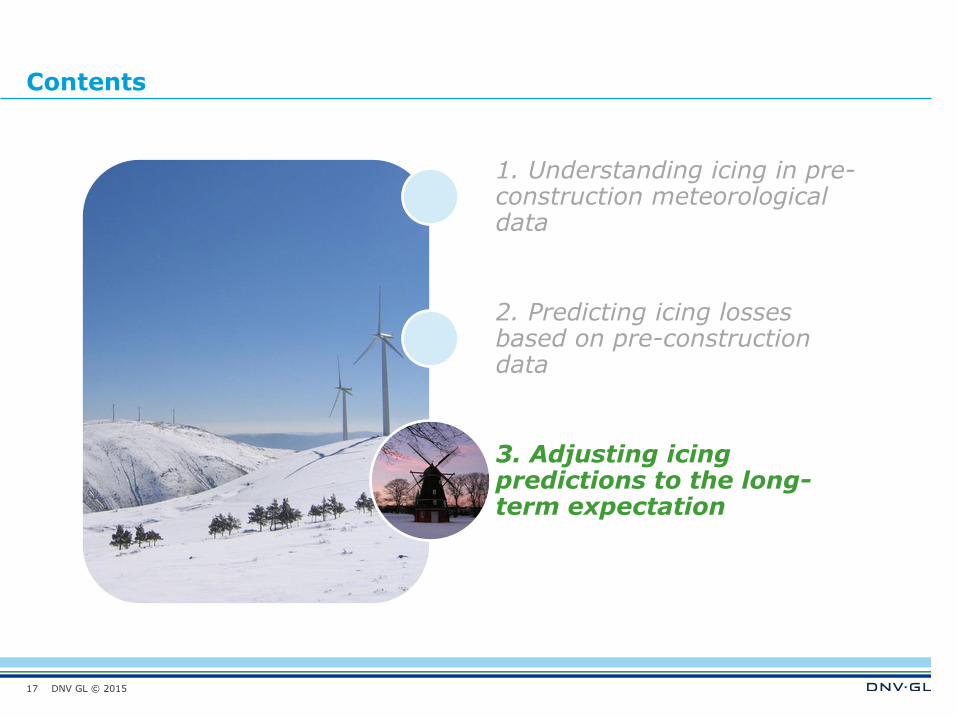
Contents
17
1. Understanding icing in pre-construction meteorological data
2. Predicting icing losses based on pre-construction data
3. Adjusting icing predictions to the long-term expectation
DNV GL © 2015
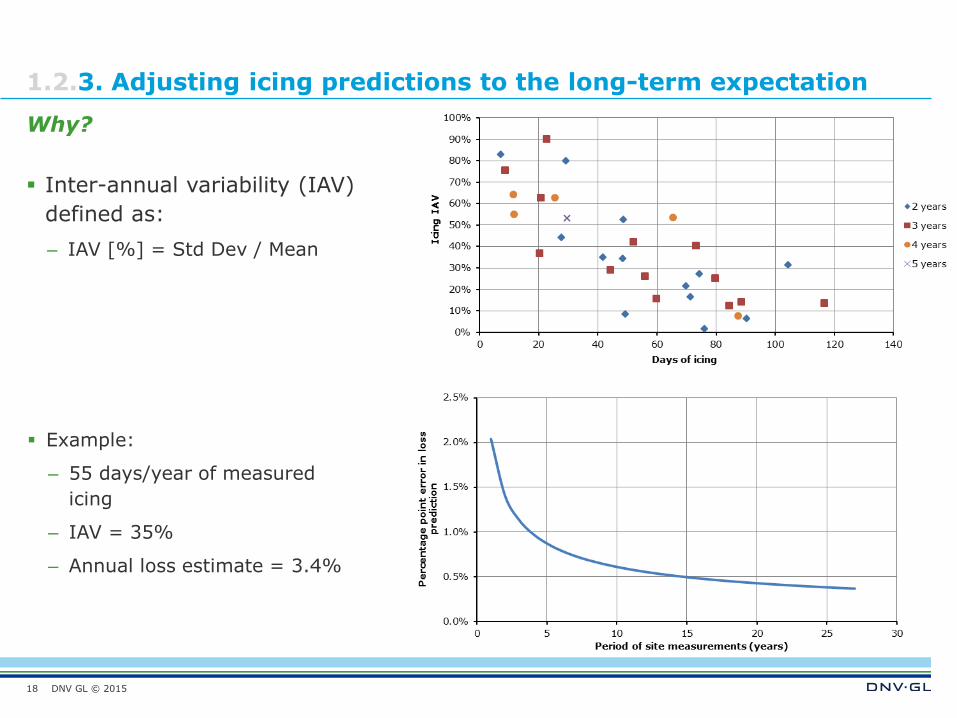
1.2.3. Adjusting icing predictions to the long-term expectation
Inter-annual variability (IAV)
defined as:
– IAV [%] = Std Dev / Mean
18
Example:
– 55 days/year of measured
icing
– IAV = 35%
– Annual loss estimate = 3.4%
Why?
DNV GL © 2015
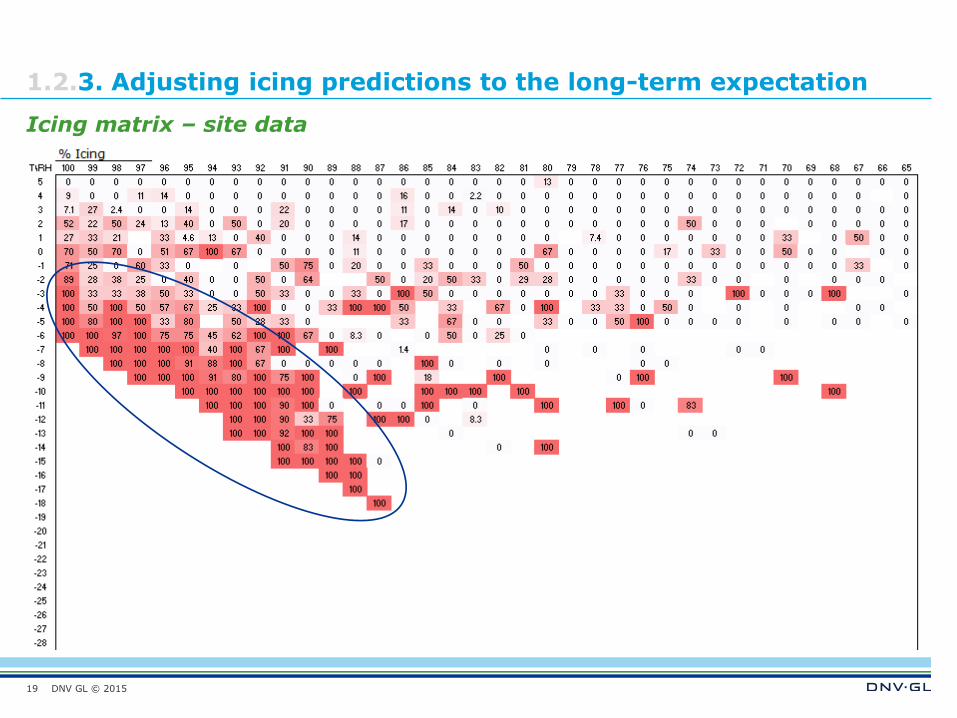
1.2.3. Adjusting icing predictions to the long-term expectation
19
Icing matrix – site data
DNV GL © 2015
1.2.3. Adjusting icing predictions to the long-term expectation
20
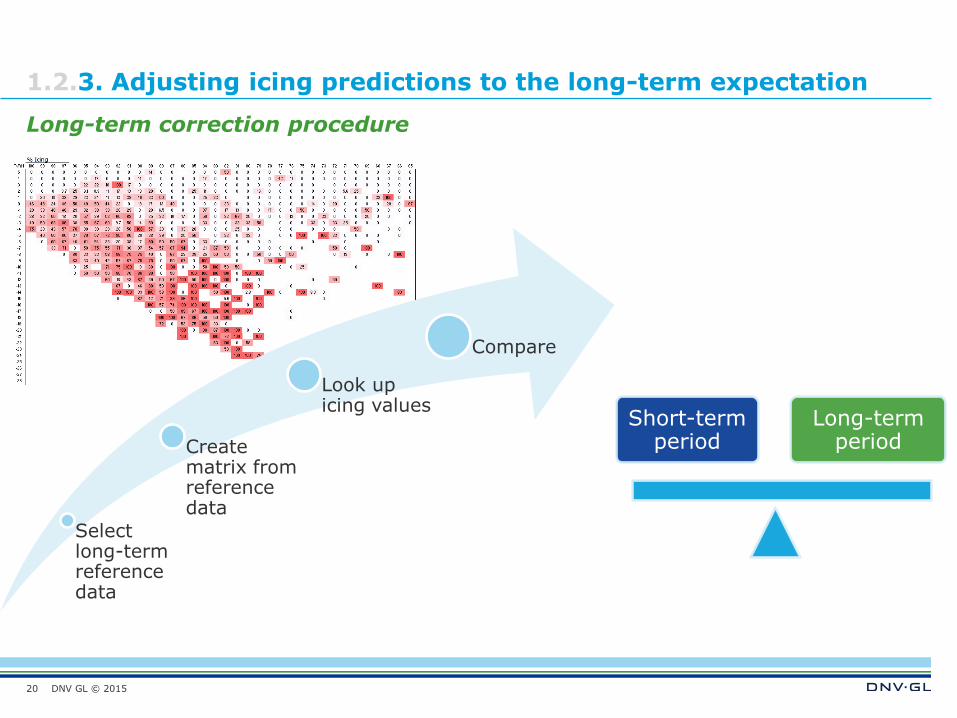
Long-term correction procedure
Select long-term reference data
Create matrix from reference data
Look up icing values
Compare
Short-term period
Long-term period
DNV GL © 2015
1.2.3. Adjusting icing predictions to the long-term expectation
21
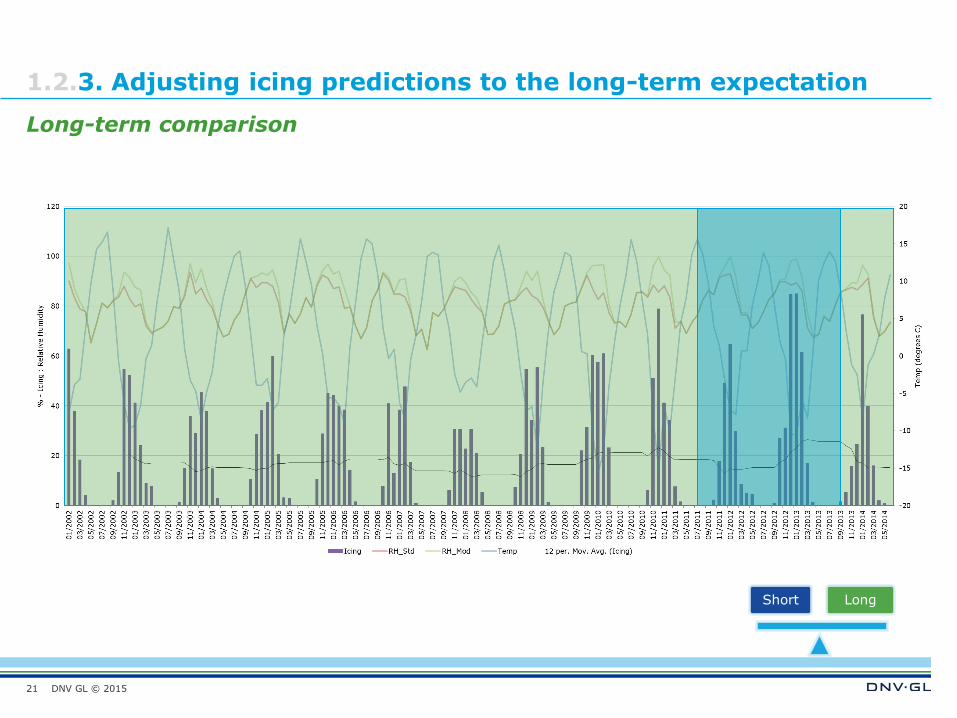
Long-term comparison
Short Long
DNV GL © 2015
Conclusions
22
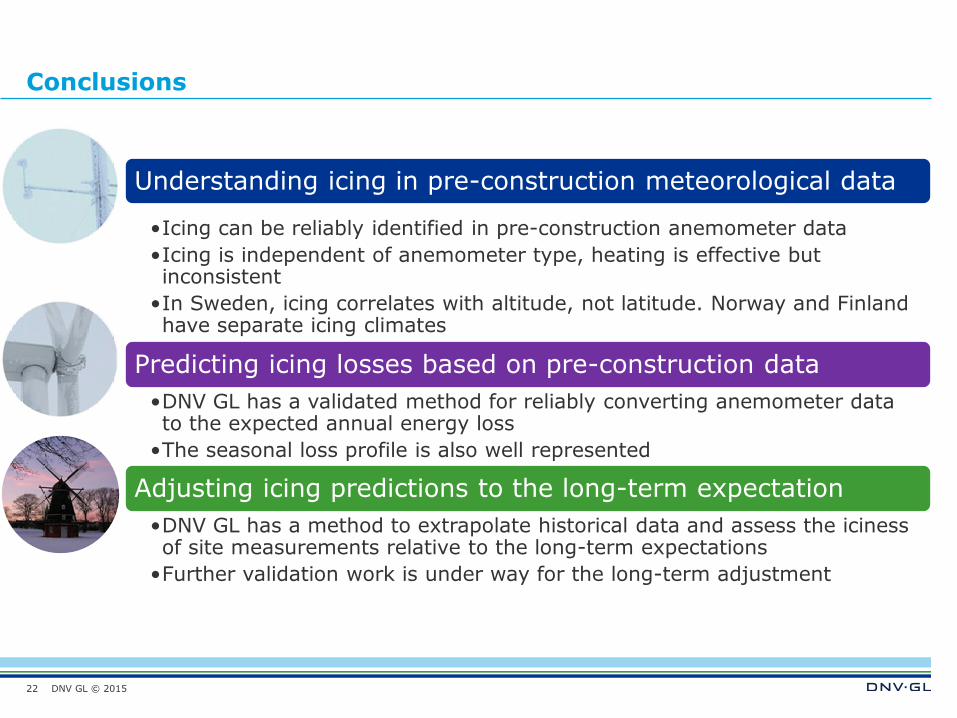
Understanding icing in pre-construction meteorological data
•Icing can be reliably identified in pre-construction anemometer data
•Icing is independent of anemometer type, heating is effective but inconsistent
•In Sweden, icing correlates with altitude, not latitude. Norway and Finland have separate icing climates
Predicting icing losses based on pre-construction data
•DNV GL has a validated method for reliably converting anemometer data to the expected annual energy loss
•The seasonal loss profile is also well represented
Adjusting icing predictions to the long-term expectation
•DNV GL has a method to extrapolate historical data and assess the iciness of site measurements relative to the long-term expectations
•Further validation work is under way for the long-term adjustment
DNV GL © 2015
SAFER, SMARTER, GREENER
www.dnvgl.com
Questions?
23
Till Beckford
+44 (0) 117 972 9900
Thanks to Carla Ribeiro and Staffan Lindahl
ESTIMATING ENERGY LOSSES CAUSED BY BLADE ICING FROM PRE-CONSTRUCTION WIND DATA (UNDERSTANDING, PREDICTING, ADJUSTING)


![SWEDEN'S BOLD ACTIVITIES IN MEASUREMENTS …...Winterwind 2011 in [1]. Keywords: wind energy, icing, measurements, mapping of icing, de-icing, production losses LEGEND AND ABBREVIATIONS](https://img.dokumen.tips/doc/110x75/5fc882ecda226022c914dc53/swedens-bold-activities-in-measurements-winterwind-2011-in-1-keywords-wind.jpg)