Embed Size (px)
Citation preview

6/29/2016
1
Estimating Climate-Change Impacts on Groundwater Recharge for the Island of Maui, Hawai‘i
Alan Mair
Pacific Islands Water Science Center
2016 Pacific Water Conference
Honolulu, Hawai‘i
February 4, 2016
U.S. Department of the Interior
U.S. Geological Survey
This information is preliminary and is subject to revision. It is being provided to meet the need for timely best science. The information is provided on the condition that neither the U.S. Geological Survey nor the U.S. Government shall be held liable for any damages resulting from the authorized or unauthorized use of the information.
Transformers
Flow of Downscaled Climate Information
Preliminary Information—Subject to Revision 2
Climate Scientists
Downscaled Climate
Projections
Decision Makers
Meaningful
Information
General Circulation Models

6/29/2016
2
Objectives
• Estimate spatial distribution of groundwater recharge for projected future climate conditions – Groundwater recharge is critical input to groundwater
models used to assess groundwater availability
– Groundwater recharge is used by State of Hawai‘i, Commission on Water Resource Management to compute sustainable yield
• Quantify differences in groundwater-recharge estimates between control (current) climate and future climate
3 Preliminary Information—Subject to Revision
Highlights for Maui
Preliminary Information—Subject to Revision 4
Water-Budget Component -Mean Annual
Island-Wide Percentage Change
Projected Dry Climate
Projected Wet Climate
Rainfall (from climate models) -20% +20% Runoff -18% +34% Total evapotranspiration -12% +5% Groundwater recharge -21% +21%

6/29/2016
3
Why Maui?
‘Īao & Waihe‘e Aquifers
Hawai‘i
Maui
Available tools
5 Preliminary Information—Subject to Revision
Water-Budget
Modeling
Atlas Rainfall
and Evapotranspiration
Water-Budget Modeling Framework
Control Recharge
Climate-Data Transformation
6
2010 Land Cover
High-Resolution Downscaled
Climate Projections
Preliminary Information—Subject to Revision
Future Recharge

6/29/2016
4
Rainfall • Interpolated maps of monthly
rainfall during 1978-2009 • Daily rain-gage data for synthesizing
daily rainfall
Atlas Rainfall and Evapotranspiration
Preliminary Information—Subject to Revision 7
http://evapotranspiration.geography.hawaii.edu/
http://rainfall.geography.hawaii.edu/
Evapotranspiration (ET) • Interpolated maps of mean
monthly reference ET for grass
High-Resolution Downscaled Climate Projections
Statistical Approach Dynamical Approach
8
Elison Timm and others, 2015 Zhang and others, 2012; http://apdrc.soest.hawaii.edu/projects/HRCM/
Preliminary Information—Subject to Revision

6/29/2016
5
Statistical Approach
Preliminary Information—Subject to Revision 9
Figure from O.E. Timm
temperature humidity
horizontal wind
sea-level pressure
geopotential
sea-surface temperature
Trade winds
Moisture
Domain 3
10
Dynamical Approach
Preliminary Information—Subject to Revision
Figure from C. Zhang

6/29/2016
6
Downscaled Climate Datasets
Feature Statistical Approach Dynamical Approach
Coupled Model Intercomparison Project (CMIP) Phase
Phase 5 (CMIP5) Phase 3 (CMIP3)
Control Climate Atlas mean monthly rainfall
during 1978-2007 Simulated climate during 1990-
2009
IPCC Scenario Representative Concentration
Pathway (RCP) 4.5 & 8.5 Special Report on Emissions
Scenario (SRES) A1B
Projection Periods
2011-2041, 2041-2071, and 2071-2099
2080-2099
11 Preliminary Information—Subject to Revision
12
Statistical Approach – Mean Annual Rainfall Anomalies
Preliminary Information—Subject to Revision
RCP8.5, 2071-99
RCP8.5, 2041-71 RCP4.5, 2041-71
RCP4.5, 2071-99
-13%
-20%
-14%
-15%
Elison Timm and others, 2015; 250-m grid maps provided by O.E. Timm

6/29/2016
7
Preliminary Information—Subject to Revision 13
Dynamical Approach – Mean Annual Rainfall Anomalies
SRES A1B, 2080-99
+20%
Computed from daily rainfall data set provided C. Zhang
Which set of future rainfall projections should be used for water-resource planning?
• Statistical approach and dynamical approach show opposite trends in mean annual rainfall in many areas
• Simulating the driest and wettest rainfall conditions captures the range of uncertainty in existing set of climate projections
Preliminary Information—Subject to Revision 14

6/29/2016
8
Selected Future Climate Scenarios
Projected
“Wet” Climate Scenario
Projected
“Dry” Climate Scenario
Preliminary Information—Subject to Revision 15
Dynamical Approach SRES A1B, 2080-99
Statistical Approach RCP8.5, 2071-99
+20% -20%
Other Challenges with Estimating and Comparing Hydrologic Impacts
• Issues related to dynamical approach – Represents only one emission scenario (SRES A1B) – Represents only one future time period (2080-2099) – Planning horizon for water managers typically less than 30 years
• Issues related to statistical approach – Method is not process-based – Does not provide all climatological elements needed for
simulating water budget; independent estimates of future reference ET are needed
• Different control climate periods – Statistical approach uses 30-year period during 1978-2007 – Dynamical approach uses 20-year period during 1990-2009
16 Preliminary Information—Subject to Revision

6/29/2016
9
Statistical Approach - Climate-Data Transformation
• Rainfall – Apply seasonal rainfall anomalies to time series of
monthly rainfall maps (Frazier and others, 2015)
– Assume no change in rainfall frequency
• ET – Assume no change in reference ET
– Assume no change in mean evaporation-to-rainfall rates
• Runoff – Modify runoff-to-rainfall relations to reflect projected
rainfall and approximate changes in runoff-to-rainfall relations
17 Preliminary Information—Subject to Revision
Dynamical Approach - Climate-Data Transformation
• Rainfall – Apply mean monthly rainfall anomalies to time series of monthly
rainfall maps (Frazier and others, 2015) – Develop input datasets to characterize daily rainfall frequency
during control and projected climate scenarios
• ET – Estimate reference ET for control and projected climate scenarios,
and compute mean monthly reference ET anomalies – Apply mean monthly reference ET anomalies to mean monthly
reference ET maps (Giambellucca and others, 2014) – Develop mean evaporation-to-rainfall rates for projected climate
scenario
• Runoff – Modify runoff-to-rainfall relations to reflect projected rainfall and
approximate changes in runoff-to-rainfall relations
18 Preliminary Information—Subject to Revision
6/29/2016
10
Preliminary Information—Subject to Revision 19
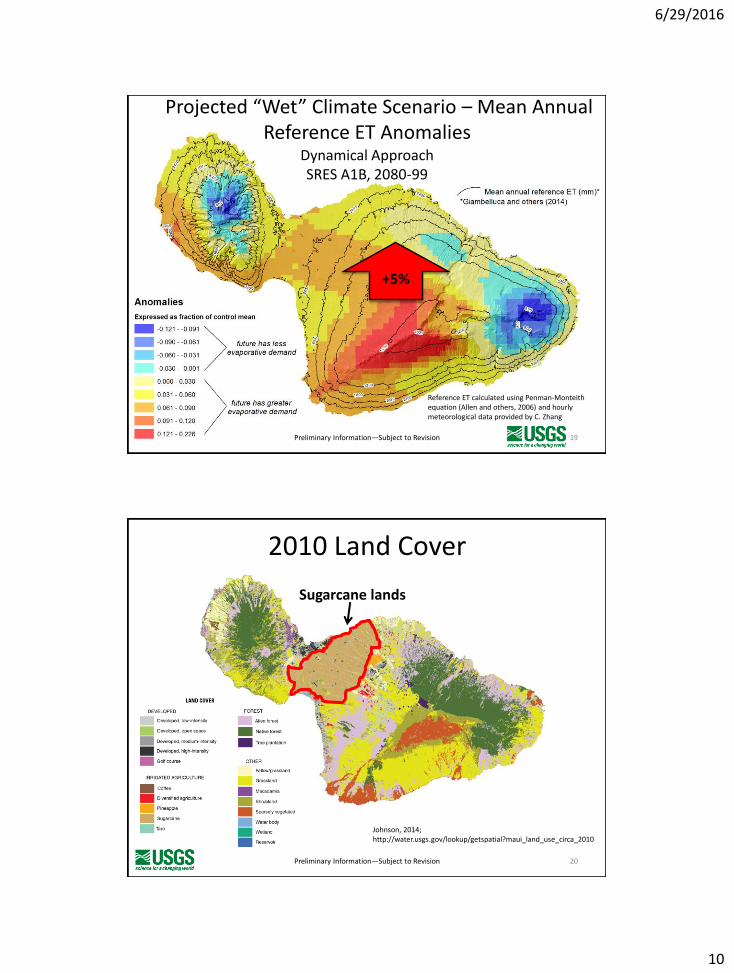
Projected “Wet” Climate Scenario – Mean Annual Reference ET Anomalies
Dynamical Approach SRES A1B, 2080-99
+5%
Reference ET calculated using Penman-Monteith equation (Allen and others, 2006) and hourly meteorological data provided by C. Zhang
2010 Land Cover
Preliminary Information—Subject to Revision 20
Johnson, 2014; http://water.usgs.gov/lookup/getspatial?maui_land_use_circa_2010
Sugarcane lands

6/29/2016
11
Water-Budget Model
Preliminary Information—Subject to Revision 21
Johnson and others, 2014; http://dx.doi.org/10.3133/sir20145168
FOR NONFOREST LAND COVERS
FOR FOREST LAND COVERS
• Model developed for islands to estimate spatially distributed groundwater recharge
• Model has been applied in Hawai‘i, American Samoa, and Guam • Required model input datasets:
– Rainfall – Reference ET – Direct runoff – Land cover – Soil properties
• Since 2005, model has been modified to accommodate improved rainfall and reference ET datasets, and more robust methods to estimate canopy interception, total ET, and direct runoff
Water-Budget Model Development
22
These datasets are modified during climate-data transformation for estimating climate-change impacts
Preliminary Information—Subject to Revision

6/29/2016
12
Groundwater Recharge Decreases by 21% for Projected Dry Climate Scenario
1978-2007 Climate Statistical Approach
RCP8.5 2071-2099 Climate
Preliminary Information—Subject to Revision 23
Areas where mean annual
recharge is between 455 and
1,894 inches and includes
taro fields and reservoirs
24
Haikū Honopou
Waikamoi
Ke‘anae
Kūhiwa
Kawaipapa
Waiho‘i
Kipahulu
Kaupō Nakula
Luala‘ilua
Kama‘ole
Waikapū Ukumehame
Olowalu
Launiupoko
Honokōwai
Honolua
Honokōhau Kahakuloa
Waihe‘e
‘Īao
Kahului
Pā‘ia
Makawao
Change in Mean Annual Recharge for Projected Dry Climate Scenario Greatest decreases in
recharge occur in the wettest parts of Maui
Preliminary Information—Subject to Revision

6/29/2016
13
Change in Recharge by Aquifer System, Mgal/d
25 Preliminary Information—Subject to Revision
Percentage Change in Recharge by Aquifer System
26 Preliminary Information—Subject to Revision
6/29/2016
14
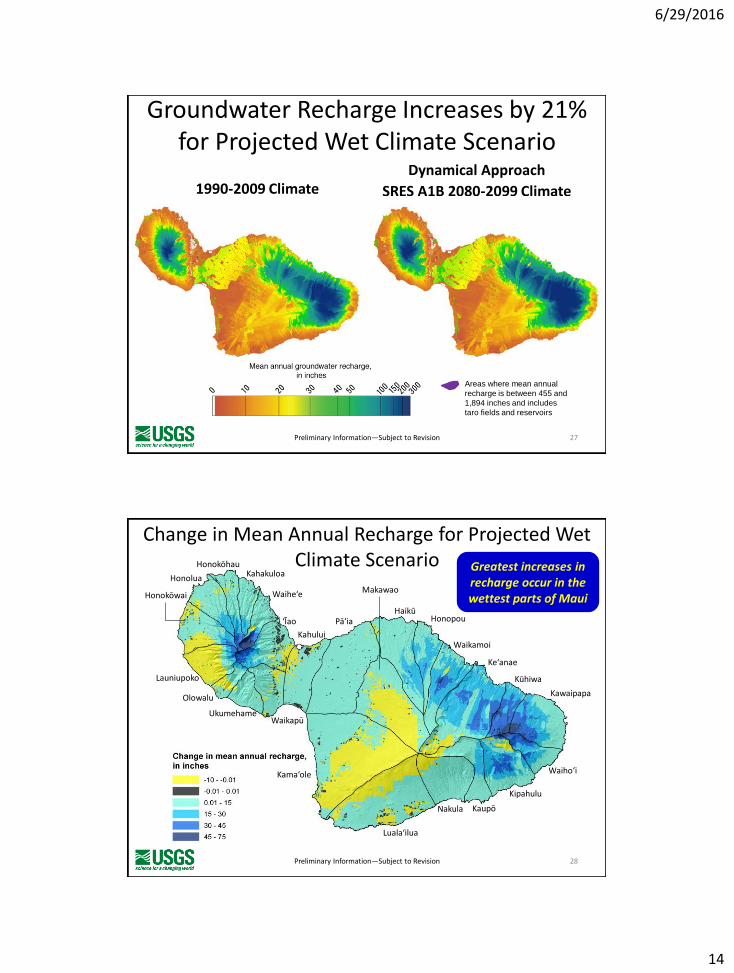
Groundwater Recharge Increases by 21% for Projected Wet Climate Scenario
1990-2009 Climate Dynamical Approach
SRES A1B 2080-2099 Climate
Preliminary Information—Subject to Revision 27
Areas where mean annual
recharge is between 455 and
1,894 inches and includes
taro fields and reservoirs
28
Haikū Honopou
Waikamoi
Ke‘anae
Kūhiwa
Kawaipapa
Waiho‘i
Kipahulu
Kaupō Nakula
Luala‘ilua
Kama‘ole
Waikapū Ukumehame
Olowalu
Launiupoko
Honokōwai
Honolua
Honokōhau Kahakuloa
Waihe‘e
‘Īao
Kahului
Pā‘ia
Makawao
Change in Mean Annual Recharge for Projected Wet Climate Scenario Greatest increases in
recharge occur in the wettest parts of Maui
Preliminary Information—Subject to Revision

6/29/2016
15
Change in Recharge by Aquifer System, Mgal/d
29 Preliminary Information—Subject to Revision
Percentage Change in Recharge by Aquifer System
30 Preliminary Information—Subject to Revision

6/29/2016
16
Preliminary Information—Subject to Revision 31
Island –Wide Comparison: Mgal/d
Preliminary Information—Subject to Revision 32
Island-Wide Comparison: Change in Mgal/d

6/29/2016
17
Preliminary Information—Subject to Revision 33
Island-Wide Comparison: Percentage Change
Summary for Maui
• Two existing projections indicate contrasting effects on estimated recharge across most of Maui – Estimated changes to recharge in ‘Īao and Waihe‘e aquifers
vary from a decrease of 31% (‘Īao) to an increase of 51% (Waihe‘e)
– Estimated changes to island-wide recharge vary by plus or minus 21%
• Greatest changes to recharge occur in west Maui mountains and wet windward areas of Haleakalā
• Uncertainty in climate projections likely will improve over time, which will lead to better-defined actionable science directions
Preliminary Information—Subject to Revision 34

6/29/2016
18
Water-Budget
Modeling
Atlas Rainfall
and Evapotranspiration
Next Steps – Water-Budget Modeling
Control Recharge
Climate-Data Transformation
35
2010 Land Cover
High-Resolution Downscaled
Climate Projections
Preliminary Information—Subject to Revision
Plausible Future Land-Cover Scenarios
Pacific RISA
Future Recharge
Next Steps – Publishing
• Publish estimated impacts to groundwater recharge for future climate/land-cover scenarios in scientific journal article
• Publish geospatial datasets presenting water-budget modeling results for each climate/land-cover scenario
– USGS water resources NSDI node
36 Preliminary Information—Subject to Revision

6/29/2016
19
Next Steps – Reducing Uncertainty
• Additional set of climate projections being developed for Hawai‘i by National Center of Atmospheric Research (NCAR)
– Available by end of 2016 or early 2017
• Continued dialogue between climate scientists using statistical and dynamical downscaling approaches needed to better understand differences in projections
Preliminary Information—Subject to Revision 37
Acknowledgments
• Chunxi Zhang, IPRC
• Oliver Elison Timm, State University of New York at Albany
• Adam Johnson, USGS
• Maoya Bassiouni, Oregon State University
• Victoria Keener and Laura Brewington, Pacific RISA
Preliminary Information—Subject to Revision 38
Pacific RISA

6/29/2016
20
QUESTIONS?
39 Preliminary Information—Subject to Revision
References Allen, R.G., Pruitt, W.O., Wright, J.L., Howell, T.A., Ventura, F., Snyder, R., Itenfisu, D., Steduto, P.,
Berengena, J., Yrisarry, J.B., Smith, M., Pereira, L.S., Raes, D., Perrier, A., Alves, I., Walter, I., and Elliott, R., 2006, A recommendation on standardized surface resistance for hourly calculation of reference ETo by the FAO56 Penman-Monteith method: Agricultural Water Management, v. 81, no. 1–2, p. 1 – 22.
Elison Timm, O., Giambelluca, T.W., and Diaz, H.F., 2015, Statistical downscaling of rainfall changes in Hawai‘i based on the CMIP5 global model projections, J. Geophys. Res. Atmos., 120, 92–112, doi:10.1002/2014JD022059.
Frazier, A.G., Giambelluca, T.W., Diaz, H.F., and Needham, H.L., 2015, Comparison of geostatistical approaches to spatially interpolate month-year rainfall for the Hawaiian Islands: International Journal of Climatology.
Giambelluca, T.W., Chen, Q., Frazier, A.G., Price, J.P., Chen, Y.-L., Chu, P.-S., Eischeid, J.K., and Delparte, D.M., 2013, Online rainfall atlas of Hawai‘i: Bulletin of the American Meteorological Society, v. 94, no. 3, p. 313–316, http://rainfall.geography.hawaii.edu/.
Giambelluca, T.W., Shuai, X., Barnes, M.L., Alliss, R.J., Longman, R.J., Miura, T., Chen, Q., Frazier, A.G., Mudd, R.G., Cuo, L., and Businger, A.D., 2014, Evapotranspiration of Hawai‘i: University of Hawai‘i at Mānoa, http://evapotranspiration.geography.hawaii.edu/.
Johnson, A.G., 2014, Land use for the island of Maui, Hawaii, circa 2010: U.S. Geological Survey Spatial Data Set, http://water.usgs.gov/lookup/getspatial?maui_land_use_circa_2010.
Johnson, A.G., Engott, J.A., and Bassiouni, M., 2014, Spatially distributed groundwater recharge estimated using a water-budget model for the Island of Maui, Hawai‘i, 1978–2007: U.S. Geological Survey Scientific Investigations Report 2014–5168, 53 p., http://dx.doi.org/10.3133/sir20145168.
Zhang, C., Wang, Y., Lauer, A., and Hamilton, K., 2012, Configuration and evaluation of the WRF model for the study of Hawaiian regional climate, Monthly Weather Review, 140, 3259-3277.
Preliminary Information—Subject to Revision 40