Embed Size (px)
Citation preview
Anim. Behav., 1998, 55, 1685–1706
Estimating ancestral states of a communicative display: a comparative studyof Cyclura rock iguanas
EMIuLIA P. MARTINS & JENNY LAMONTDepartment of Biology, University of Oregon at Eugene
(Received 15 August 1997; initial acceptance 22 September 1997;final acceptance 16 October 1997; MS. number: 7862)
Abstract. In this study we describe the signature headbob displays of seven of the eight extant speciesof Cyclura iguanas using data collected from the field and from captive animals. We used phylogeneticcomparative methods to estimate the ancestral states of several measures of the headbob displays,including number of headbobs and the duration of headbobs and inter-bob pauses. Divergence in theheadbob display among species has been substantial, with some major changes occurring within only afew (about six) generations. Otherwise, results are consistent with those obtained previously for otherlizards which suggest that there is an evolutionary limit on the total duration of headbob displays.Differences in the results obtained using different phylogenetic methods suggest that although estimatesof ancestral states are reasonably robust to violations of evolutionary assumptions, we cannotdetermine the standard errors of those ancestral phenotypes accurately without more detailedinformation about the types of forces (e.g. selection, drift) underlying evolutionary change in thesetraits. In particular, within-species variation had a substantial impact on the standard errors ofestimated ancestral states, and should be included in such estimations whenever possible. Finally, ourresults emphasize the importance of conserving behavioural as well as genetic diversity in trying topreserve endangered species for possible reintroduction into the wild.
? 1998 The Association for the Study of Animal Behaviour
Correspondence: E. P. Martins, Department of Biology,University of Oregon, Eugene OR 97403, U.S.A. (email:[email protected]).
The phylogenetic comparative method has beenused throughout animal behaviour, but has beenparticularly useful in generating hypotheses andguiding experimental studies of the evolution ofcommunication systems (e.g. Sillen-Tullberg 1988;Basolo 1990; Prum 1994, 1997; Ryan 1995; Endler& Thery 1996). Although communicative displaysare often defined by their stereotyped nature, theyare also quite variable, with different species,populations, and even individuals producingremarkably different displays. This variationmay be due to a number of factors, includingecological, genetic and behavioural differences.Phylogenetic comparative studies provide us witha uniquely powerful tool to begin to tease apartthese possibilities and to highlight species andtraits that may be particularly important infuture empirical studies (see reviews in Brooks &McLennan 1991; Losos 1996; Martins 1996c). Byreconstructing the communicative behaviour of
0003–3472/98/061685+22 $25.00/0/ar970722 ? 19
1685
hypothetical ancestors on a phylogeny, we candetermine the order of evolutionary changes anduncover any evidence of long-term trends in theevolutionary history of the displays. We can alsodetermine the general time scale at which changesare occurring, thereby providing information onwhether it would be more profitable to conductfuture studies at the population, species, genus,or higher taxonomic level. In the current study,we use a phylogenetic comparative analysis ofCyclura lizards to consider evolutionary changesin display structure. In doing so, we illustrate theuse of a new phylogenetic comparative method forestimating ancestral states (Martins & Hansen1997), and discuss its application to the study ofanimal behaviour.
Cyclura iguanas exhibit an impressive diversityof social behaviour and communicative displays,and thus offer an excellent opportunity to studythe evolution of these traits. The eight species ofCyclura rock iguanas are found on several islandsin the Caribbean, including Cuba, Jamaica,Hispaniola and the Bahamas. These iguanas are
98 The Association for the Study of Animal Behaviour
Animal Behaviour, 55, 61686
quite large (ranging from 30.6 to 74.5 cm maxi-mum male snout–vent length, Schwartz &Henderson 1991), primarily herbivorous, andendangered due both to habitat destruction and tothe introduction of exotic predators (e.g. feralcats, dogs and pigs) which prey on eggs andjuvenile lizards (Iverson 1978). Studies of Cyclurabehaviour are thus of considerable practical inter-est to conservation agencies raising these animalsin captivity for future reintroduction into the field.Although two species of Cyclura are found onHispaniola, most of the Cyclura are not sym-patric, and the genus exhibits an impressivediversity of social behaviour types. In somespecies (e.g. Cyclura cornuta stejnegeri: Wiewandt1977), both sexes defend all or most of their homeranges against other individuals of their sex.This is the pattern found in most lizards, and isconsidered to be evolutionarily primitive (Martins1994). Other species (e.g. Cyclura cychlura:Windrow 1977) exhibit personal space aggression,in which individuals do not defend any particu-lar geographical range, but will aggressivelydefend the area immediately around them. Stillother species (e.g. the Cuban Cyclura nubilanubila: A. Alberts, personal communication) livein groups of up to 20 individuals which interactfrequently.
Although Cyclura iguanas produce severalvisual displays including tail waves and variousbody postures, we concentrated entirely on theirbobbing displays, in particular, the BroadcastDisplay (also termed ‘signature bob’ or ‘Assertiondisplay’) for each species. Most other lizards ofthe Iguania group use headbob and push-up dis-plays in both territorial defence and maintenance(e.g. Carpenter & Ferguson 1977). Although somespecies have more than one pattern of bobbingdisplay, most produce a single broadcast displaymost often, and several studies have shown thatthese displays contain information about the indi-vidual identity of the animals (e.g. Crews 1975;Rothblum & Jenssen 1978; Martins 1991). Duringthese displays, animals move their heads in astereotyped fashion, usually raising and loweringthem in a series of headbobs or tosses. Unlikesome smaller lizards which produce the up-and-down motion by extending and flexing their legs(i.e. a ‘push-up’ display), iguanas produce themotion using primarily the muscles in their necks.In the current study, we focused on the ‘bobpattern’, that is, the number of times the head was
raised and lowered and the relative durationof up-and-down motions and pauses. In otherspecies of Iguania, bobbing displays are oftenspecies-typical, with the number and type ofbobs in each display containing informationabout the individual, sex and species identity ofthe animal as well as about the type of socialcontext in which the animal is engaged (Carpenter& Ferguson 1977; Martins 1993a; DeCourcy &Jenssen 1994).
The phylogenetic comparative method is a pow-erful tool for inferring the evolutionary history ofbehavioural phenotypes (see Brooks & McLennan1991; Harvey & Pagel 1991; or Martins & Hansen1996 for review). Nevertheless, early techniques(e.g. parsimony) developed primarily for theanalysis of molecular or morphological charactersare not well suited for inferring the evolution ofmany behavioural traits. Behavioural traits areusually thought to be more flexible, respondingquickly to the action of natural and sexual selec-tion (but see de Queiroz & Wimberger 1993; Irwin1996; Wimberger & de Queiroz 1996). Morerecently, we (Martins & Hansen 1997) developed aform of phylogenetic regression which can be usedto estimate several parameters (e.g. the correlationbetween two traits, the rate of phenotypicevolution, ancestral states) from comparativedata while applying any one of a variety ofassumptions developed for the specific charactersunder analysis. Using this method, we can esti-mate various evolutionary parameters whileassuming more realistic models of behaviouralevolution such as the models of stabilizing selec-tion, fluctuating directional selection and randomgenetic drift summarized by Hansen & Martins(1996).
In the current study, we collected informationon the bobbing displays of nine populations(seven of the eight species) of Cyclura, filminganimals in the field and in captivity and analysingvideotapes gathered by other researchers. Over-laying these data on an independent phylogeny(Malone & Davis, unpublished data), we inferthe sequence of evolutionary changes underlyingpresent day diversity of communicative behav-iour. We consider a variety of assumptionsregarding the evolutionary processes underlyingphenotypic evolution and incorporate within-species variation into the analysis using general-ized least-squares regression (Martins & Hansen1997), and thus also illustrate the application of a

Martins & Lamont: Ancestral states of displays in Cyclura iguanas 1687
new phylogenetic comparative method to thestudy of animal behaviour.
METHODS
Data Collection
We conducted behavioural observations in thefield during two short trips to the Caribbean,gathered videotapes made by other researchers inthe field, and observed some animals in captivity.Together, the data set consists of 204 displaysproduced by approximately 101 animals. Allbehavioural observations were made from a dis-tance of at least 5 m during the main activityperiod (0900–1200 hours and 1400–1800 hours).Whenever possible, these observations wererecorded on videotape and in field notes duringfocal animal samples. Videotaped recordings weremade using a Canon L-2 Hi-8 video camera witha Canon 15# macro zoom lens. Hand-writtennotes concentrated on describing bobbing displaysin terms of the number and type of bobs in thedisplay, and did not include estimates of temporalduration. The observer’s (E.P.M.) ability todescribe the bobbing displays in hand-writtennotes was tested periodically against videotapedrecordings, and was found to be completely accu-rate in 20 of 20 trials. In most cases, individualswere easily distinguished on the basis of uniquemorphological features, and an attempt was madeto observe as many different animals as possible.Because adult males are substantially more activethan other age and sex groups in most species,more data were collected from males than fromfemales of most species, and very few juvenile andhatchling animals are represented. Total numbersof individuals above are estimates based both onour ability to distinguish individuals and on thegeographical distance between animals.
During about 20 h of observation in August1995, we recorded 30 displays (four on videotape,26 in hand-written notes) produced by approxi-mately 23 individual C. carinata on Water Cay inthe Turks and Caicos Islands. Cyclura carinata israther unusual in that the typical headbob displayis produced more often by females and juvenileanimals than by adult males, and because thedisplay is often produced in what appears to be anappeasement rather than an aggressive or broad-cast context (Iverson 1979). Nineteen of the 30recorded displays were produced by adult females,
an additional 10 were produced by juvenile males,and only one display was produced by a large,adult male. With the exception of the displayproduced by the large male, all headbob displayswere produced by animals either approaching orbeing approached by larger individuals of eithersex, as this seems to be the C. carinata equivalentof a signature display.
Also in August 1995, we recorded 17 displaysfrom 15 adult male C. nubila nubila during about15 h of observation on Isla Magueyes in PuertoRico. Cyclura nubila nubila is native to Cuba, buta small group of animals was released from a zooon Isla Magueyes in the mid 1960s (Christian1986) and have been reproducing there as afree-ranging population. Alison Alberts alsogenerously provided videotapes from herlong-term field study of C. nubila nubila onGuantanamo Bay, Cuba (unpublished data) fromwhich we obtained recordings of 40 displays from24 animals. In November 1995, we observedC. rileyi for about 13 h on Green Cay (near SanSalvador Island) in the Bahamas, recording a totalof 17 displays produced by 12 individuals (11adult males and one hatchling) on videotape.
Thomas Wiewandt provided a film he madeduring a long-term field study of C. cornuta stej-negeri on Mona Island, Puerto Rico (Wiewandt1977, 1981). This film includes 14 displays pro-duced by about 10 adult animals. Because theseanimals are sexually monomorphic (Wiewandt1977), it is impossible to determine from the filmexactly how many males and females displayed.From the narration, it appears that displays wereobtained from both males and females in bothaggressive interactions (males defending theirmates and females defending nest sites) and court-ship contexts. Thus, here, as in C. carinata, thedisplays are not necessarily all ‘signature’ head-bobs, and may be subject to more within-speciesvariation because of the combined contexts.Finally, it is important to note that the MonaIsland iguana is quite distinct in many ways fromthe Hispaniolan C. cornuta cornuta, such thatthese data should not be considered necessarilyrepresentative of the species as a whole.
John Iverson also provided videotapes ofC. cychlura made during his long-term field studyon Allen’s Cay, Bahamas (unpublished data). Atotal of 17 signature displays produced byabout 11 adult males was extracted from thesevideotapes.

Animal Behaviour, 55, 61688
It was not possible to observe the behaviourof two exceedingly rare species (C. collei andC. ricordi) in the wild. Thus, videotapes of a verysmall number of individuals were obtained atthe Indianapolis Zoo in March 1996. The Zoohas three juvenile (two females and one male)C. collei, and three C. ricordi (one adult male‘Robbie’, and two juvenile females). All of thejuvenile animals were quite wary and relativelyinactive. During about 8 h of observation, werecorded only three displays produced by thejuvenile male C. collei. In contrast, 54 displayswere recorded from the adult male C. ricordiduring about 6 h of observation. Videotapes ofthree individuals of the rare Grand CaymanIsland subspecies, C. nubila lewisi, were also madeat the Indianapolis Zoo. During about 3 h ofobservation, we recorded 10 signature displaysfrom one adult male and one adult female.Although C. pinguis can still be observed onAnegada Island in the British Virgin Islands, wewere unable to do so during this study. Becausethese animals are also not in captivity at any zoo(Christie 1995), we did not obtain any videotapedrecordings at all from this species.
Although we tried to consider only signatureheadbobs, displays in this study were produced byanimals in very different conditions, includinganimals in captivity and animals that had beensubjected to a large degree of human contact.Thus, we make no attempt to interpret the func-tion or meaning of displays from this data set.Furthermore, because the sample size of displayswithin any one species was small, and occasionallycame from measures of a single individual, cau-tion should be used in interpreting the fine struc-ture of these displays in any detail. Fortunately,despite the variability among individuals andpopulations of lizards, interspecific differences inthe bobbing displays of other lizards are usuallyfar greater than that within species even acrosscontexts (e.g. Martins 1993a, b). Estimates of thestandard error of existing measures (see Results)show that the same is usually true of Cycluraiguanas. In other words, although the sample sizeis small, it is sufficient to discover a number ofinteresting evolutionary patterns.
Videotape Analysis
Videotapes were digitized on a computer andsubjected to frame-by-frame analysis. First, we
transferred clips of videotaped headbob displaysonto a PowerPC using Radius Videofusion hard-ware to capture 15 frames/s of the image. We thenrecorded the vertical height of the tip of thelizard’s nose (in the case of headbob displays) orthe highest point of an eye ridge (in the case ofhead rolls, see description of C. cornuta displaysbelow) for each frame of the videotape. We alsorecorded the vertical height of a stationary objecton the film (usually a stationary part of theanimal’s body), and calculated the relative verticalmotion of the lizard’s head as vertical deviationbetween the stationary spot and the tip of thelizard’s nose or eye ridge. We then plotted relativevertical motion against time to obtain a Display-Action-Pattern graph (DAPgraph, Carpenter &Grubitz 1961) for each display (e.g. Fig. 1) fromwhich measures such as the number and timingof headbobs could be recorded. Note thatalthough this procedure minimizes the effects ofany small camera motion during the filming of thedisplay, we did not record detailed informationabout the distance from the animal at each pointin time nor the angle at which the camera washeld, and thus were unable to determine absolutevertical height of the head motion from ourrecordings. We have schematized the DAPgraphsprimarily to emphasize the lack of accuracy in ourmeasurements of the vertical height of displaycomponents.
The term ‘headbob’ in this paper refers to anup-and-down motion in which the tip of the noseis raised vertically until the jaw forms an angle ofat least 30) with the substrate the animal isstanding on. The nose may be held up for ashort time before again being lowered to thehorizontal position and pulled in towards thebody. Each up-and-down motion (‘headbob’)takes slightly less than 1 s to complete, and mayoccur in a series of two or more produced in rapidsuccession. The term ‘bout’ will be used to refer toeach series of up-and-down motions, separatedfrom other headbobs by pauses of at least 0.13 s(two frames of the digitized videotape). A boutmight thus be a double headbob, triple headbob,or even a long trill of up to 15 up-and-downmotions separated by pauses of no more than0.07 s (one frame of the videotape). Thus, eachdisplay consists of one or more bouts of head-bobs. Iguanas often hold their mouths open,raise their tails, or adopt other special bodypostures while producing headbobs, but during

Martins & Lamont: Ancestral states of displays in Cyclura iguanas 1689
the headbob display, the rest of the body is heldquite still.
C. cornuta
C. ricordi
C. collei
C. carinata
C. rileyi
C. cychlura
C. nubila lewisi
C. nubila (P.R.)
C. nubila (Cuba)
Figure 1. Examples of ‘typical’ displays for the seven species of Cyclura observed in this study. Horizontal axis is time(in seconds), and vertical axis is a schematic depiction of the height of the animal’s nose or eye ridge (for C. cornutastejnegeri) during the display. These figures are comparable to DAPgraphs (Carpenter & Grubitz 1961).
Phylogenetic Comparative Analyses
We used phylogenetic comparative analyses toreconstruct ancestral states of various measures ofthe headbob pattern (headbob, pause, and totaldurations, total number of up-and-down motionsand bob type), and also to estimate correlationcoefficients between these measures. Given thevariation in headbob displays present even withina species, parsimony methods do not seem appro-priate for reconstructing ancestral states. Instead,we applied a generalized least-squares approachto estimating ancestral phenotypes (Martins &Hansen 1997). This method offers flexibilityas to the assumptions underlying a phylogeneticstatistical analysis. Because the original paper
(Martins & Hansen 1997) leaves out many of thedetails for estimating ancestral states, we gothrough this procedure in some detail below.
This generalized least-squares approach(Martins & Hansen 1997) requires first that wedescribe the questions of interest in terms ofstandard regression models. Thus, we estimatedancestral states using the model: A=WY+å,where A is a vector of the ancestral states, Y is avector of the extant species phenotypes relative tothe grand mean, W is a matrix derived from thephylogeny, and å is vector of error terms (seeMartins & Hansen 1997, equations 3, 10–12 fordetails). Specifically, we measured the traits (Y0)in nine populations of Cyclura and calculated thegrand mean for each trait across the whole clade(MG) using MG=(J*Var[Y]"1J)"1J*Var[Y]"1Y0,where J is a column of 1 s, and Var[Y] is a matrixof the expected similarities among extant taxa

Animal Behaviour, 55, 61690
C. cornuta
C. ricordi
C. collei
C. carinata
C. rileyi
C. cychlura
C. nubila lewisi
C. nubila (P.R.)
C. nubila (Cuba)
0.056
0.043
0.020
0.012
0.026
0.008
0.002
0.013
0.015
0.002
0.002
0.013
0.016
0.062
0.023
0.026
Figure 2. Phylogeny from Malone & Davis (unpublished data) based on parsimony analysis of mtDNA sequences.Numbers refer to branch lengths in units of per cent nucleotide sequence divergence. Bootstrap values for all nodesare over 90%.
(discussed below). The standard error of thisgrand mean is given by the square roots of theelements of J*Var[Y]"1Y0. We then transformthe empirical measures (Y0) into deviations fromthe grand mean to form Y (=Y0"MG), andcalculate W as the product of the expected simi-larity between extant and ancestral phenotypes(Var[A,Y], see below for details) and the inverse ofVar[Y] (such that W=Var[A,Y]Var[Y]"1). Thevector A (containing the estimated ancestralstates) is calculated as the product of W and Y,and we add the grand mean to back transformeach estimated ancestor to the scale of Y0. Vari-ances (and therefore, standard errors) for theseancestral states were estimated using generalizedleast squares, specifically:
Var[A| ]=Var[A]"Var[A,Y]*Var[Y]"1Var[Y,A]
where these variance matrices are calculated fromthe phylogeny and error variance as discussedbelow.
In calculating both W and the standard errors,we need to calculate three variance–covariancematrices describing the expected degree of simi-larity between different taxon phenotypes (Var[Y],Var[A,Y]=Var[Y,A], and Var[A]). Expected simi-larities between taxon phenotypes are due to atleast three factors: (1) within species variability ormeasurement error (åM); (2) error due to shared,stochastic evolution of taxa along a phylogenetic
tree (åS); and (3) error due to incorrect specifi-cation of the phylogeny (åP). First, to includemeasurement error, we calculated the within-species variance for each character and taxon forwhich data were available from more than oneindividual. We used these within-species variancesto create an error variance matrix, Var[åM], foreach trait with variances on the diagonals and allother elements set equal to zero.
Second, we used a preliminary phylogeny (C. L.Malone & S. K. Davis, unpublished data; Fig. 2)to calculate the expected similarity due to shared,stochastic evolution (Var[åS]). Malone & Davis’phylogeny is part of a larger study examiningrelationships among several genera of iguanas(Sites et al. 1996) using a parsimony analysis ofmitochondrial DNA data (ND4 and three tRNAgenes). It is completely independent of the behav-ioural information presented in the current study,and although the phylogeny is a preliminaryestimate, nodes are quite well supported, withbootstrap values exceeding 90% in all cases.Branch lengths on the phylogeny are also avail-able in units of DNA sequence divergence. Thefact that branch lengths at the tips do not allline up at one end of the phylogeny suggest thatthere is some rate heterogeneity in the molecularsequence data, and that measures of sequencedivergence provide only rough estimates of rela-tive time. In the present study, however, weassume that sequence divergence is a reasonable

Martins & Lamont: Ancestral states of displays in Cyclura iguanas 1691
estimate of time, and that the behavioural charac-ters evolved along this phylogeny using one of twopossible forms of phenotypic evolution: (1) suchthat phenotypic divergence is linearly related tophylogenetic distance; and (2) such that pheno-typic divergence is exponentially related to phylo-genetic distance. As shown by Hansen & Martins(1996), these two possibilities describe the result ofphenotypic evolution under a wide variety ofscenarios, including random genetic drift, direc-tional selection and stabilizing selection. Notethat since we consider a variety of possibilitiesand focus on the robustness of our results acrossthese options, small errors in the original branchlengths or in the assumption that branch lengthsare reasonable estimates of relative time, arelikely to have little impact on the conclusions ofthis study.
For a linear relationship between phenotypicand phylogenetic divergence, we calculated thematrix Var[åS] with each element correspondingto a constant (ó2
S) multiplied by the phylogeneticdistance (d) from the root of the tree to the mostrecent common ancestor of the taxon pair. Thismodel is often used to describe phenotypic evolu-tion under random genetic drift or under direc-tional selection when the direction of selectionvaries randomly over time. The constant ó2
S is afunction of the mutation rate and other forcescausing taxa to diversify. For an exponentialrelationship, we calculated each element ofVar[åS] as ó2
S exp("át) for each pair of taxa,where á and ó2
S are estimated constants, and t isthe phylogenetic distance between the two taxa.This latter model is most often used to describethe evolution of phenotypes subjected to arestraining force, such as stabilizing selectionpushing the character towards a fixed optimum.The parameter, á, can be interpreted as a measureof the strength of that restraining force.
We estimated ó2S using an iterative Fisher scor-
ing procedure. We began by calculating the Fisherinformation matrix, F, as one-half the trace of thematrix PV"1PV"1, where P equals V"1 (I"HV"1 [J V"1J]), V"1 is the inverse of the totalerror matrix (Var[åS]+Var[åM]), I is an identitymatrix, H is a matrix of 1 s, and J is a vector of1 s. We calculated each new value of ó2
S using thefollowing equation:
where ó2S(t) is the present, estimated value of ó2
S
and ó2S(t+1) is the next value. The trace of a matrix
(PV2) is denoted by tr[PV2], where V2 is Var[åS]divided by ó2
S. Most times, this iterative procedureconverged on a single value of ó2
S within a fewhundred iterations. When it did not converge, itwas usually because the values bounced betweentwo or more peak values that were fairly similar inmagnitude (i.e. within 10) and thus had littleimpact on estimates of the standard error. At veryhigh or very low levels of á, values for ó2
S maynever converge at all, making it impossible toestimate the standard error. Note that estimates ofó2
S cancel out of the equation for estimatingancestral states. Therefore, their only impact is onestimates of the standard errors of the ancestralstates. Unfortunately, with the relatively smallnumber of taxa in this study, we were not able toestimate á effectively from the measured dataat all. Instead, we applied a range of possibleás, as a way of determining the robustness of ourestimates to different á values (i.e. differentassumptions about the strength of stabilizingselection and the phenotypic response to thatselection).
For each character, we estimated the pheno-types of hypothetical ancestors and the standarderrors of those phenotypes using forms of Var[åS]to create the Var[Y], Var[A,Y] and Var[A] matri-ces. We also conducted separate analyses usingthe sum of Var[åS] and Var[åM] matrices to formthe Var[Y] matrix. Doing both analyses allowsus to illustrate the difference in results obtainedby incorporating within-species variation in theanalyses versus assuming that within-species vari-ation is negligible. The matrix Var[Y] consistsof the expected similarities between all possiblepairs of the extant taxon phenotypes, Y, whereasVar[Y,A] consists of the expected similaritiesbetween extant taxon phenotypes and ancestralstates and Var[A] contains the expected simi-larities between ancestral taxa. We assumed thatwithin-species variation in extant taxa was inde-pendent of such variation in ancestral taxa, andincluded within-species variability only in esti-mates of the expected similarity between extanttaxa (Var[Y]). In both cases, expected similaritieswere calculated as linear or exponential functionsof phylogenetic distance (as discussed above).Note that this analysis does not take error due toincorrect specification of the phylogeny (åP) intoaccount, simply because no good estimates of this
Animal Behaviour, 55, 61692
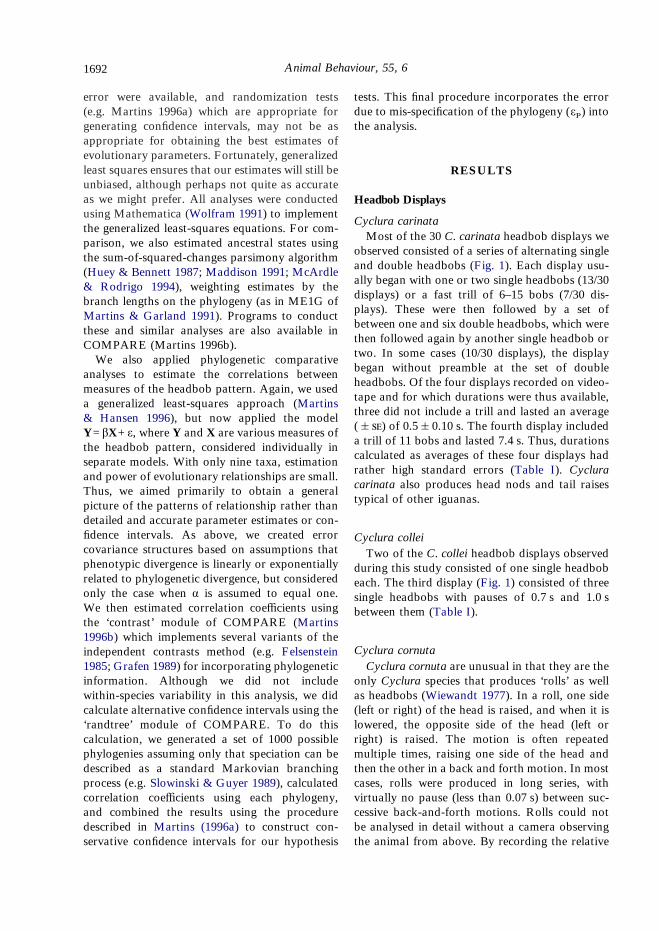
error were available, and randomization tests(e.g. Martins 1996a) which are appropriate forgenerating confidence intervals, may not be asappropriate for obtaining the best estimates ofevolutionary parameters. Fortunately, generalizedleast squares ensures that our estimates will still beunbiased, although perhaps not quite as accurateas we might prefer. All analyses were conductedusing Mathematica (Wolfram 1991) to implementthe generalized least-squares equations. For com-parison, we also estimated ancestral states usingthe sum-of-squared-changes parsimony algorithm(Huey & Bennett 1987; Maddison 1991; McArdle& Rodrigo 1994), weighting estimates by thebranch lengths on the phylogeny (as in ME1G ofMartins & Garland 1991). Programs to conductthese and similar analyses are also available inCOMPARE (Martins 1996b).
We also applied phylogenetic comparativeanalyses to estimate the correlations betweenmeasures of the headbob pattern. Again, we useda generalized least-squares approach (Martins& Hansen 1996), but now applied the modelY=âX+å, where Y and X are various measures ofthe headbob pattern, considered individually inseparate models. With only nine taxa, estimationand power of evolutionary relationships are small.Thus, we aimed primarily to obtain a generalpicture of the patterns of relationship rather thandetailed and accurate parameter estimates or con-fidence intervals. As above, we created errorcovariance structures based on assumptions thatphenotypic divergence is linearly or exponentiallyrelated to phylogenetic divergence, but consideredonly the case when á is assumed to equal one.We then estimated correlation coefficients usingthe ‘contrast’ module of COMPARE (Martins1996b) which implements several variants of theindependent contrasts method (e.g. Felsenstein1985; Grafen 1989) for incorporating phylogeneticinformation. Although we did not includewithin-species variability in this analysis, we didcalculate alternative confidence intervals using the‘randtree’ module of COMPARE. To do thiscalculation, we generated a set of 1000 possiblephylogenies assuming only that speciation can bedescribed as a standard Markovian branchingprocess (e.g. Slowinski & Guyer 1989), calculatedcorrelation coefficients using each phylogeny,and combined the results using the proceduredescribed in Martins (1996a) to construct con-servative confidence intervals for our hypothesis
tests. This final procedure incorporates the errordue to mis-specification of the phylogeny (åP) intothe analysis.
RESULTS
Headbob Displays
Cyclura carinataMost of the 30 C. carinata headbob displays we
observed consisted of a series of alternating singleand double headbobs (Fig. 1). Each display usu-ally began with one or two single headbobs (13/30displays) or a fast trill of 6–15 bobs (7/30 dis-plays). These were then followed by a set ofbetween one and six double headbobs, which werethen followed again by another single headbob ortwo. In some cases (10/30 displays), the displaybegan without preamble at the set of doubleheadbobs. Of the four displays recorded on video-tape and for which durations were thus available,three did not include a trill and lasted an average(&) of 0.5&0.10 s. The fourth display includeda trill of 11 bobs and lasted 7.4 s. Thus, durationscalculated as averages of these four displays hadrather high standard errors (Table I). Cycluracarinata also produces head nods and tail raisestypical of other iguanas.
Cyclura colleiTwo of the C. collei headbob displays observed
during this study consisted of one single headbobeach. The third display (Fig. 1) consisted of threesingle headbobs with pauses of 0.7 s and 1.0 sbetween them (Table I).
Cyclura cornutaCyclura cornuta are unusual in that they are the
only Cyclura species that produces ‘rolls’ as wellas headbobs (Wiewandt 1977). In a roll, one side(left or right) of the head is raised, and when it islowered, the opposite side of the head (left orright) is raised. The motion is often repeatedmultiple times, raising one side of the head andthen the other in a back and forth motion. In mostcases, rolls were produced in long series, withvirtually no pause (less than 0.07 s) between suc-cessive back-and-forth motions. Rolls could notbe analysed in detail without a camera observingthe animal from above. By recording the relative

Martins & Lamont: Ancestral states of displays in Cyclura iguanas 1693
height of one eye ridge, though, we were able todetermine the number of times each side of thehead was raised or lowered during each roll anddescribe these motions in much the same way aswe described headbobs.
Rolls occurred at the beginning of nine of the 14displays, at the end of one display, and not at allin four displays. In all but one case, rolls wereaccompanied by one or two series of standardheadbobs. There was an average (&) of4.0&0.42 back and forth motions per roll(Fig. 1), and up to six up and down motions perheadbob series (mean&=2.0&0.42). Averagedurations were obtained by treating up-and-downheadbobs and back-and-forth rolls as equivalentunits (Table I). Again, these data were obtainedonly from C. c. stejnegeri. Some observations ofC. c. cornuta at the Indianapolis Zoo show thatthese animals also produce head rolls, but detailedmeasures of the cadence of these displays were notavailable.
Cyclura cychluraThe 17 C. cychlura headbob displays obtained
from Iverson’s videotapes (unpublished data) con-sisted of short bouts of mostly single, but occa-sionally double, headbobs (mean&=1.2&0.07;Fig. 1, Table I), with no obvious pattern to thechoice of single or double headbobs.
Cyclura nubilaCyclura nubila is unique among Cyclura in that
it produces an S-roll similar to the ‘roll’ (Dugan1982), or ‘rotary head nodding’ (Distel & Veazey
1982; Dugan 1982) of green iguanas. In an S-roll,the nose is raised and lowered as in a headbob,but is also moved in a horizontal plane duringthe lowering motion. Although some individualsappeared to be producing standard headbobs inaddition to the S-rolls, the twisting motion is notas dramatic as the full rolling motion produced byC. cornuta, and can hardly be seen from a lateralview. Thus, we scored all up-and-down motionsproduced by C. nubila as S-rolls.
Displays for the two different subspecies andtwo populations of the same subspecies did notdiffer substantially in most measures. All C. nubilaproduced series of about five S-rolls separated bypauses of about 0.7 s, leading to a total durationof about 4 s (Table I, Fig. 1). The one exceptionwas that headbobs produced by animals in thePuerto Rican population lasted more than twiceas long (mean&=1.0&0.42) as those fromthe other two populations (mean&=0.3&0.06for Cuban C. n. nubila; mean&=0.2&0.02 forC. n. lewisi at the zoo).
Cyclura ricordi
The headbob displays of the single C. ricordimale consisted of long series of headbobs withprogressively longer pauses between them (Fig. 1,Table I). The display usually began with a seriesof about seven headbobs (mean&=6.6&0.37)with virtually no pauses. The initial series wasusually followed by an additional set of aboutthree single headbobs (mean&=2.5&0.24)with inter-bob pauses of about 0.2 s each(mean&=0.2&0.02 s). Frequently, these would
Table I. Means (&) of several measures of the headbob display for seven species of Cyclura
Totalduration
(s)
Pauseduration
(s)
Headbobduration
(s)Numberof bouts
Numberof bobs
C. carinata 2.20 (1.735) 0.63 (0.129)* 0.34 (0.086) 1.97 (0.215) 6.00 (4.673)C. collei 0.98 (0.953) 0.87 (0.133)* 0.24 (0.058) 1.67 (0.667) 1.67 (0.667)C. cornuta 2.83 (0.447) 0.75 (0.139) 0.38 (0.027) 2.14 (0.206) 5.50 (0.489)C. cychlura 1.98 (0.399) 0.82 (0.118) 0.30 (0.023) 2.35 (0.242) 2.88 (0.193)C. nubila nubila (Cuba) 3.22 (0.406) 0.67 (0.048) 0.28 (0.058) 3.63 (0.344) 4.85 (0.540)C. nubila nubila (P.R.) 4.23 (0.711) 0.74 (0.053) 0.98 (0.415) 3.77 (0.474) 4.29 (0.520)C. nubila lewisi 3.43 (0.896) 0.59 (0.104) 0.22 (0.022) 3.50 (0.749) 5.50 (1.851)C. ricordi 3.37 (0.243) 0.30 (0.021) 0.27 (0.006) 3.48 (0.239) 9.72 (0.590)C. rileyi 3.14 (0.556) 0.22 (0.060) 0.88 (0.007) 3.17 (0.345) 5.22 (0.721)
*Standard errors based on variation within one display by a single lizard.

Animal Behaviour, 55, 61694
be followed by one long pause (mean&
duration=0.5&0.03 s), and then another seriesof about two headbobs (mean&=1.7&0.12).Thus, inter-bob pauses slowly increased in dura-tion throughout the display. Sometimes, the entireseries of headbobs was followed immediately byanother set, and it was difficult to distinguish theend of one display and the start of the next.
Cyclura rileyiThe 17 displays recorded for C. rileyi in this
study consisted of series of up to seven single anddouble headbobs (Table I, Fig. 1). These head-bobs were mixed, with no obvious pattern to thechoice of single or double headbobs.
Phylogenetic Analyses
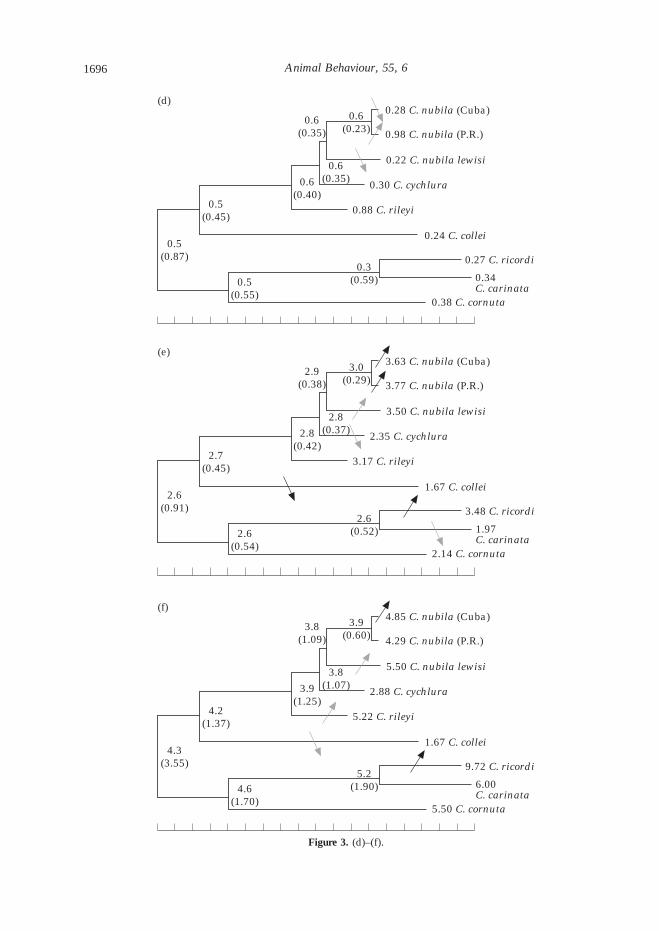
Overlaying measures of the headbob displayson the phylogeny, we found that headbob displayshave evolved frequently and dramatically amongthe Cyclura, with major changes in the displayoccurring in almost every branch leading to a tipspecies (Fig. 3, Table II). Some aspects of thedisplay are less malleable than others, evolvingonly once in the genus. For example, three speciesproduced series of fast up-and-down motions(‘trills’), and in all three cases, these trills wereproduced at the beginning (rather than in themiddle or at the end) of displays. Because thethree species that exhibit trills are also their ownclosest relatives, it seems likely that trills haveevolved a single time in the ancestor leading toC. ricordi, C. carinata and C. cornuta. In contrast,although many species of Cyclura exhibit someslight horizontal motion in their headbob dis-plays, the S-rolls of C. nubila and the long rolls ofC. cornuta are clearly quite different from eachother and those of any other species of Cyclura.Given the phylogenetic distance between thesetwo taxa, it would seem that the roll has evolvedat least twice within Cyclura. Because greeniguanas also use rolling motions in their displays,it may be that iguanas in general have someevolutionary predisposition towards using hori-zontal motion in their head-bob displays.
Pause duration was remarkably constantthroughout the genus in an absolute sense, rang-ing between 0.2 and 0.9 s, and not undergoing anyevolutionary shifts greater than one standarderror in magnitude (Fig. 3c). All other measures
(total duration, headbob duration, and thenumber of bouts or headbobs per display) under-went three to seven major evolutionary changes(at least one standard error) within the genus(Fig. 3). These measures of the headbob displayincreased and decreased through evolutionarytime in various lineages, but there were no long-term trends holding steady throughout the phyl-ogeny. In fact, the most striking pattern is that allof these changes are concentrated among the tipsof the phylogeny, with none occurring near theroot of the tree. This suggests that change ishappening quite quickly, with phenotypes rarelyremaining intact past a speciation event. Focus-ing, for example, on the headbob displays of thetwo populations of C. nubila, we find major dif-ferences in the total duration, headbob durationand number of headbobs. The introduced popu-lation at Isla Magueyes (Puerto Rico) hold theirheads up for an unusually long period of timeduring each headbob, leading to a much longerheadbob display, even though it contains fewerheadbobs. This difference has happened quiterecently, no longer than the time separating twopopulations of animals on Cuba, and possibly asrecently as when the Puerto Rican population wasestablished (30 years ago).
Evolutionary Assumptions
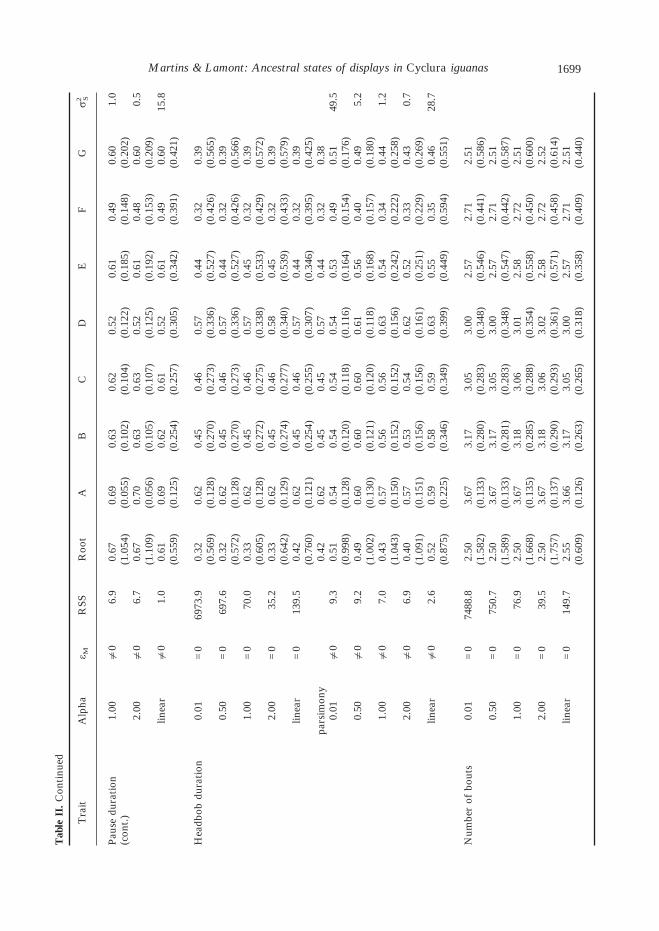
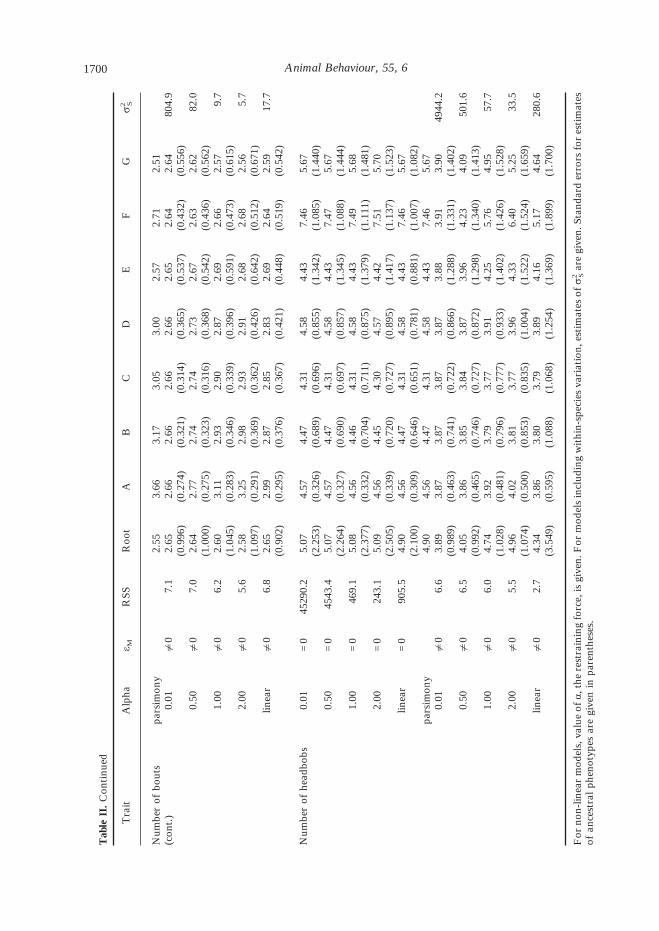
Estimates of ancestral states were remarkablyconsistent, whether calculated using the linear orexponential models, and regardless of the value ofthe restraining force (á) in the exponential model(Table II). For ancestors of the most recentlydiverged taxa (the two C. nubila populations),these estimates were often identical for all models,and never differed by more than 5% of the traitvalue. Differences among results for differentmodels were more apparent when consideringestimates of ancestral states deeper in the phy-logeny. These estimates occasionally varied by asmuch as 50% of the trait value. Not surprisingly,standard errors of estimated ancestral states alsousually increased upon approaching the root ofthe phylogeny.
Measures of the fit of the statistical models alsodepended in large part on the underlying choiceof evolutionary assumptions (i.e. linear versusexponential) and whether or not within-speciesvariation was included. Most dramatically, the res-idual sum of squares often decreased substantially

Martins & Lamont: Ancestral states of displays in Cyclura iguanas 1695
C. cornuta
C. carinata
C. ricordi
C. collei
C. rileyi
C. cychlura
C. nubila lewisi
C. nubila (P.R.)
C. nubila (Cuba)Bt,Bo
T,Bt
Bt
Roll
T
T,Bt
Bt,Bo
RollTrill
(a)
2.83 C. cornuta
2.20C. carinata
3.37 C. ricordi
0.98 C. collei
3.14 C. rileyi
1.98 C. cychlura
3.43 C. nubila lewisi
4.23 C. nubila (P.R.)
3.22 C. nubila (Cuba)3.0(0.31)
(b)
2.9(0.32)
2.9(0.32)2.9
(0.35)2.9
(0.33)
3.1(0.47)3.0
(0.40)
2.9(0.79)
0.75 C. cornuta
0.63C. carinata
0.30 C. ricordi
0.87 C. collei
0.22 C. rileyi
0.82 C. cychlura
0.59 C. nubila lewisi
0.74 C. nubila (P.R.)
0.67 C. nubila (Cuba)0.7(0.13)
(c)
0.6(0.25)
0.6(0.26)0.5
(0.31)0.6
(0.34)
0.5(0.39)0.6
(0.42)
0.6(0.56)
Figure 3. (a)–(c).
Animal Behaviour, 55, 61696
0.38 C. cornuta
0.34C. carinata
0.27 C. ricordi
0.24 C. collei
0.88 C. rileyi
0.30 C. cychlura
0.22 C. nubila lewisi
0.98 C. nubila (P.R.)
0.28 C. nubila (Cuba)0.6(0.23)
(d)
0.6(0.35)
0.6(0.35)0.6
(0.40)0.5
(0.45)
0.3(0.59)0.5
(0.55)
0.5(0.87)
2.14 C. cornuta
1.97C. carinata
3.48 C. ricordi
1.67 C. collei
3.17 C. rileyi
2.35 C. cychlura
3.50 C. nubila lewisi
3.77 C. nubila (P.R.)
3.63 C. nubila (Cuba)3.0(0.29)
(e)
2.9(0.38)
2.8(0.37)2.8
(0.42)2.7
(0.45)
2.6(0.52)2.6
(0.54)
2.6(0.91)
5.50 C. cornuta
6.00C. carinata
9.72 C. ricordi
1.67 C. collei
5.22 C. rileyi
2.88 C. cychlura
5.50 C. nubila lewisi
4.29 C. nubila (P.R.)
4.85 C. nubila (Cuba)3.9(0.60)
(f)
3.8(1.09)
3.8(1.07)3.9
(1.25)4.2
(1.37)
5.2(1.90)4.6
(1.70)
4.3(3.55)
Figure 3. (d)–(f).
w(ssewme
rabtdtnw
Martins & Lamont: Ancestral states of displays in Cyclura iguanas 1697
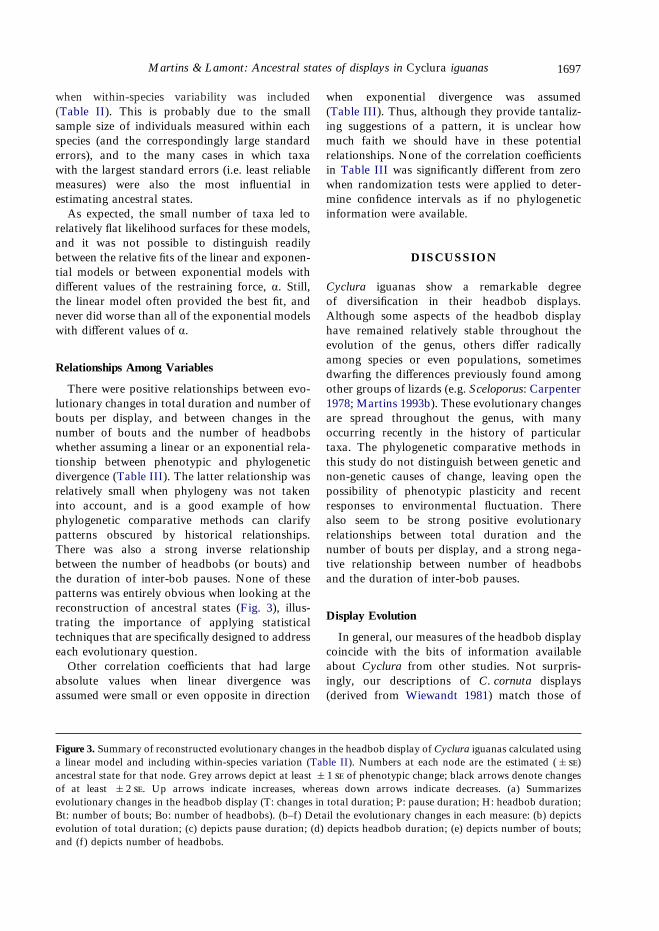
hen within-species variability was includedTable II). This is probably due to the smallample size of individuals measured within eachpecies (and the correspondingly large standardrrors), and to the many cases in which taxaith the largest standard errors (i.e. least reliableeasures) were also the most influential in
stimating ancestral states.As expected, the small number of taxa led to
elatively flat likelihood surfaces for these models,nd it was not possible to distinguish readilyetween the relative fits of the linear and exponen-ial models or between exponential models withifferent values of the restraining force, á. Still,he linear model often provided the best fit, andever did worse than all of the exponential modelsith different values of á.
Relationships Among Variables
There were positive relationships between evo-lutionary changes in total duration and number ofbouts per display, and between changes in thenumber of bouts and the number of headbobswhether assuming a linear or an exponential rela-tionship between phenotypic and phylogeneticdivergence (Table III). The latter relationship wasrelatively small when phylogeny was not takeninto account, and is a good example of howphylogenetic comparative methods can clarifypatterns obscured by historical relationships.There was also a strong inverse relationshipbetween the number of headbobs (or bouts) andthe duration of inter-bob pauses. None of thesepatterns was entirely obvious when looking at thereconstruction of ancestral states (Fig. 3), illus-trating the importance of applying statisticaltechniques that are specifically designed to addresseach evolutionary question.
Other correlation coefficients that had largeabsolute values when linear divergence wasassumed were small or even opposite in direction
when exponential divergence was assumed(Table III). Thus, although they provide tantaliz-ing suggestions of a pattern, it is unclear howmuch faith we should have in these potentialrelationships. None of the correlation coefficientsin Table III was significantly different from zerowhen randomization tests were applied to deter-mine confidence intervals as if no phylogeneticinformation were available.
DISCUSSION
Cyclura iguanas show a remarkable degreeof diversification in their headbob displays.Although some aspects of the headbob displayhave remained relatively stable throughout theevolution of the genus, others differ radicallyamong species or even populations, sometimesdwarfing the differences previously found amongother groups of lizards (e.g. Sceloporus: Carpenter1978; Martins 1993b). These evolutionary changesare spread throughout the genus, with manyoccurring recently in the history of particulartaxa. The phylogenetic comparative methods inthis study do not distinguish between genetic andnon-genetic causes of change, leaving open thepossibility of phenotypic plasticity and recentresponses to environmental fluctuation. Therealso seem to be strong positive evolutionaryrelationships between total duration and thenumber of bouts per display, and a strong nega-tive relationship between number of headbobsand the duration of inter-bob pauses.
Display Evolution
In general, our measures of the headbob displaycoincide with the bits of information availableabout Cyclura from other studies. Not surpris-ingly, our descriptions of C. cornuta displays(derived from Wiewandt 1981) match those of
Figure 3. Summary of reconstructed evolutionary changes in the headbob display of Cyclura iguanas calculated usinga linear model and including within-species variation (Table II). Numbers at each node are the estimated (&)ancestral state for that node. Grey arrows depict at least &1 of phenotypic change; black arrows denote changesof at least &2 . Up arrows indicate increases, whereas down arrows indicate decreases. (a) Summarizesevolutionary changes in the headbob display (T: changes in total duration; P: pause duration; H: headbob duration;Bt: number of bouts; Bo: number of headbobs). (b–f) Detail the evolutionary changes in each measure: (b) depictsevolution of total duration; (c) depicts pause duration; (d) depicts headbob duration; (e) depicts number of bouts;and (f) depicts number of headbobs.

Animal Behaviour, 55, 61698
Tab
leII
.E
stim
ates
ofph
enot
ypes
for
hypo
thet
ical
ance
stor
sw
ithi
nth
ege
nus
Cyc
lura
calc
ulat
edus
ing
mod
els
ofph
enot
ypic
evol
utio
nth
atas
sum
eei
ther
linea
ror
expo
nent
ial
rela
tion
ship
sbe
twee
nph
enot
ypic
and
phyl
ogen
etic
dive
rgen
ce
Tra
itA
lpha
å MR
SSR
oot
AB
CD
EF
Gó
2 S
Tot
aldu
rati
on0.
01=
022
505.
42.
493.
673.
052.
912.
892.
442.
782.
65(1
.578
)(0
.230
)(0
.486
)(0
.490
)(0
.603
)(0
.946
)(0
.765
)(1
.015
)0.
50=
022
53.3
2.49
3.67
3.05
2.91
2.89
2.44
2.78
2.65
(1.5
86)
(0.2
30)
(0.4
86)
(0.4
91)
(0.6
03)
(0.9
47)
(0.7
66)
(1.0
17)
1.00
=0
228.
22.
493.
683.
062.
912.
902.
452.
792.
65(1
.664
)(0
.232
)(0
.491
)(0
.496
)(0
.610
)(0
.962
)(0
.775
)(1
.033
)2.
00=
011
5.7
2.49
3.68
3.06
2.92
2.90
2.45
2.79
2.66
(1.7
53)
(0.2
34)
(0.4
96)
(0.5
02)
(0.6
17)
(0.9
78)
(0.7
85)
(1.0
51)
linea
r=
045
0.0
2.52
3.68
3.05
2.91
2.89
2.44
2.78
2.65
(1.0
55)
(0.2
18)
(0.4
56)
(0.4
59)
(0.5
51)
(0.6
21)
(0.7
10)
(0.7
63)
pars
imon
y2.
563.
683.
052.
912.
892.
442.
752.
640.
01|
09.
63.
033.
033.
023.
023.
023.
033.
033.
0338
4.3
(0.9
89)
(0.2
92)
(0.2
92)
(0.2
88)
(0.3
21)
(0.4
20)
(0.4
02)
(0.4
32)
0.50
|0
8.9
3.02
3.00
2.99
2.99
2.99
3.00
3.06
3.02
46.4
(0.9
93)
(0.3
01)
(0.3
06)
(0.3
02)
(0.3
39)
(0.4
53)
(0.4
32)
(0.4
67)
1.00
|0
6.9
2.94
3.00
2.90
2.88
2.89
2.87
3.13
2.97
8.6
(1.0
34)
(0.3
30)
(0.3
65)
(0.3
61)
(0.4
17)
(0.5
89)
(0.5
55)
(0.6
15)
2.00
|0
6.1
2.89
3.05
2.88
2.85
2.86
2.81
3.14
2.93
5.8
(1.0
82)
(0.3
46)
(0.4
05)
(0.4
01)
(0.4
69)
(0.6
78)
(0.6
31)
(0.7
13)
linea
r|
06.
22.
952.
972.
922.
912.
922.
923.
112.
9922
.1(0
.790
)(0
.313
)(0
.325
)(0
.320
)(0
.350
)(0
.330
)(0
.472
)(0
.402
)
Pau
sedu
rati
on0.
01=
080
0.8
0.69
0.70
0.64
0.64
0.52
0.62
0.49
0.61
(0.8
29)
(0.0
43)
(0.0
92)
(0.0
93)
(0.1
14)
(0.1
78)
(0.1
44)
(0.1
91)
0.50
=0
80.2
0.69
0.70
0.64
0.64
0.52
0.62
0.49
0.61
(0.8
32)
(0.0
43)
(0.0
92)
(0.0
93)
(0.1
14)
(0.1
79)
(0.1
45)
(0.1
92)
1.00
=0
8.2
0.68
0.70
0.64
0.64
0.52
0.62
0.49
0.61
(0.8
70)
(0.0
44)
(0.0
93)
(0.0
94)
(0.1
16)
(0.1
82)
(0.1
47)
(0.1
96)
2.00
=0
4.2
0.67
0.70
0.64
0.64
0.52
0.61
0.48
0.60
(0.9
12)
(0.0
44)
(0.0
94)
(0.0
95)
(0.1
17)
(0.1
86)
(0.1
49)
(0.2
00)
linea
r=
016
.00.
610.
700.
640.
640.
520.
620.
490.
61(0
.549
)(0
.041
)(0
.086
)(0
.087
)(0
.104
)(0
.117
)(0
.134
)(0
.144
)pa
rsim
ony
0.63
0.70
0.65
0.65
0.55
0.64
0.49
0.62
0.01
|0
7.9
0.67
0.66
0.65
0.65
0.64
0.68
0.54
0.62
85.7
(1.0
00)
(0.0
52)
(0.0
94)
(0.0
96)
(0.1
11)
(0.1
67)
(0.1
34)
(0.1
83)
0.50
|0
7.9
0.66
0.67
0.61
0.60
0.55
0.62
0.49
0.59
8.7
(1.0
05)
(0.0
52)
(0.0
95)
(0.0
96)
(0.1
12)
(0.1
68)
(0.1
35)
(0.1
84)
Martins & Lamont: Ancestral states of displays in Cyclura iguanas 1699
Table
II.
Con
tinu
ed
Tra
itA
lpha
å MR
SSR
oot
AB
CD
EF
Gó
2 S
Pau
sedu
rati
on(c
ont.
)1.
00|
06.
90.
670.
690.
630.
620.
520.
610.
490.
601.
0(1
.054
)(0
.055
)(0
.102
)(0
.104
)(0
.122
)(0
.185
)(0
.148
)(0
.202
)2.
00|
06.
70.
670.
700.
630.
630.
520.
610.
480.
600.
5(1
.109
)(0
.056
)(0
.105
)(0
.107
)(0
.125
)(0
.192
)(0
.153
)(0
.209
)lin
ear
|0
1.0
0.61
0.69
0.62
0.61
0.52
0.61
0.49
0.60
15.8
(0.5
59)
(0.1
25)
(0.2
54)
(0.2
57)
(0.3
05)
(0.3
42)
(0.3
91)
(0.4
21)
Hea
dbob
dura
tion
0.01
=0
6973
.90.
320.
620.
450.
460.
570.
440.
320.
39(0
.569
)(0
.128
)(0
.270
)(0
.273
)(0
.336
)(0
.527
)(0
.426
)(0
.565
)0.
50=
069
7.6
0.32
0.62
0.45
0.46
0.57
0.44
0.32
0.39
(0.5
72)
(0.1
28)
(0.2
70)
(0.2
73)
(0.3
36)
(0.5
27)
(0.4
26)
(0.5
66)
1.00
=0
70.0
0.33
0.62
0.45
0.46
0.57
0.45
0.32
0.39
(0.6
05)
(0.1
28)
(0.2
72)
(0.2
75)
(0.3
38)
(0.5
33)
(0.4
29)
(0.5
72)
2.00
=0
35.2
0.33
0.62
0.45
0.46
0.58
0.45
0.32
0.39
(0.6
42)
(0.1
29)
(0.2
74)
(0.2
77)
(0.3
40)
(0.5
39)
(0.4
33)
(0.5
79)
linea
r=
013
9.5
0.42
0.62
0.45
0.46
0.57
0.44
0.32
0.39
(0.7
60)
(0.1
21)
(0.2
54)
(0.2
55)
(0.3
07)
(0.3
46)
(0.3
95)
(0.4
25)
pars
imon
y0.
420.
620.
450.
450.
570.
440.
320.
380.
01|
09.
30.
510.
540.
540.
540.
540.
530.
490.
5149
.5(0
.998
)(0
.128
)(0
.120
)(0
.118
)(0
.116
)(0
.164
)(0
.154
)(0
.176
)0.
50|
09.
20.
490.
600.
600.
600.
610.
560.
400.
495.
2(1
.002
)(0
.130
)(0
.121
)(0
.120
)(0
.118
)(0
.168
)(0
.157
)(0
.180
)1.
00|
07.
00.
430.
570.
560.
560.
630.
540.
340.
441.
2(1
.043
)(0
.150
)(0
.152
)(0
.152
)(0
.156
)(0
.242
)(0
.222
)(0
.258
)2.
00|
06.
90.
400.
570.
530.
540.
620.
520.
330.
430.
7(1
.091
)(0
.151
)(0
.156
)(0
.156
)(0
.161
)(0
.251
)(0
.229
)(0
.269
)lin
ear
|0
2.6
0.52
0.59
0.58
0.59
0.63
0.55
0.35
0.46
28.7
(0.8
75)
(0.2
25)
(0.3
46)
(0.3
49)
(0.3
99)
(0.4
49)
(0.5
94)
(0.5
51)
Num
ber
ofbo
uts
0.01
=0
7488
.82.
503.
673.
173.
053.
002.
572.
712.
51(1
.582
)(0
.133
)(0
.280
)(0
.283
)(0
.348
)(0
.546
)(0
.441
)(0
.586
)0.
50=
075
0.7
2.50
3.67
3.17
3.05
3.00
2.57
2.71
2.51
(1.5
89)
(0.1
33)
(0.2
81)
(0.2
83)
(0.3
48)
(0.5
47)
(0.4
42)
(0.5
87)
1.00
=0
76.9
2.50
3.67
3.18
3.06
3.01
2.58
2.72
2.51
(1.6
68)
(0.1
35)
(0.2
85)
(0.2
88)
(0.3
54)
(0.5
58)
(0.4
50)
(0.6
00)
2.00
=0
39.5
2.50
3.67
3.18
3.06
3.02
2.58
2.72
2.52
(1.7
57)
(0.1
37)
(0.2
90)
(0.2
93)
(0.3
61)
(0.5
71)
(0.4
58)
(0.6
14)
linea
r=
014
9.7
2.55
3.66
3.17
3.05
3.00
2.57
2.71
2.51
(0.6
09)
(0.1
26)
(0.2
63)
(0.2
65)
(0.3
18)
(0.3
58)
(0.4
09)
(0.4
40)
Animal Behaviour, 55, 61700
Tab
leII
.C
onti
nued
Tra
itA
lpha
å MR
SSR
oot
AB
CD
EF
Gó
2 S
Num
ber
ofbo
uts
pars
imon
y2.
553.
663.
173.
053.
002.
572.
712.
51(c
ont.
)0.
01|
07.
12.
652.
662.
662.
662.
662.
652.
642.
6480
4.9
(0.9
96)
(0.2
74)
(0.3
21)
(0.3
14)
(0.3
65)
(0.5
37)
(0.4
32)
(0.5
56)
0.50
|0
7.0
2.64
2.77
2.74
2.74
2.73
2.67
2.63
2.62
82.0
(1.0
00)
(0.2
75)
(0.3
23)
(0.3
16)
(0.3
68)
(0.5
42)
(0.4
36)
(0.5
62)
1.00
|0
6.2
2.60
3.11
2.93
2.90
2.87
2.69
2.66
2.57
9.7
(1.0
45)
(0.2
83)
(0.3
46)
(0.3
39)
(0.3
96)
(0.5
91)
(0.4
73)
(0.6
15)
2.00
|0
5.6
2.58
3.25
2.98
2.93
2.91
2.68
2.68
2.56
5.7
(1.0
97)
(0.2
91)
(0.3
69)
(0.3
62)
(0.4
26)
(0.6
42)
(0.5
12)
(0.6
71)
linea
r|
06.
82.
652.
992.
872.
852.
832.
692.
642.
5917
.7(0
.902
)(0
.295
)(0
.376
)(0
.367
)(0
.421
)(0
.448
)(0
.519
)(0
.542
)
Num
ber
ofhe
adbo
bs0.
01=
045
290.
25.
074.
574.
474.
314.
584.
437.
465.
67(2
.253
)(0
.326
)(0
.689
)(0
.696
)(0
.855
)(1
.342
)(1
.085
)(1
.440
)0.
50=
045
43.4
5.07
4.57
4.47
4.31
4.58
4.43
7.47
5.67
(2.2
64)
(0.3
27)
(0.6
90)
(0.6
97)
(0.8
57)
(1.3
45)
(1.0
88)
(1.4
44)
1.00
=0
469.
15.
084.
564.
464.
314.
584.
437.
495.
68(2
.377
)(0
.332
)(0
.704
)(0
.711
)(0
.875
)(1
.379
)(1
.111
)(1
.481
)2.
00=
024
3.1
5.09
4.56
4.45
4.30
4.57
4.42
7.51
5.70
(2.5
05)
(0.3
39)
(0.7
20)
(0.7
27)
(0.8
95)
(1.4
17)
(1.1
37)
(1.5
23)
linea
r=
090
5.5
4.90
4.56
4.47
4.31
4.58
4.43
7.46
5.67
(2.1
00)
(0.3
09)
(0.6
46)
(0.6
51)
(0.7
81)
(0.8
81)
(1.0
07)
(1.0
82)
pars
imon
y4.
904.
564.
474.
314.
584.
437.
465.
670.
01|
06.
63.
893.
873.
873.
873.
873.
883.
913.
9049
44.2
(0.9
89)
(0.4
63)
(0.7
41)
(0.7
22)
(0.8
66)
(1.2
88)
(1.3
31)
(1.4
02)
0.50
|0
6.5
4.05
3.86
3.85
3.84
3.87
3.96
4.23
4.09
501.
6(0
.992
)(0
.465
)(0
.746
)(0
.727
)(0
.872
)(1
.298
)(1
.340
)(1
.413
)1.
00|
06.
04.
743.
923.
793.
773.
914.
255.
764.
9557
.7(1
.028
)(0
.481
)(0
.796
)(0
.777
)(0
.933
)(1
.402
)(1
.426
)(1
.528
)2.
00|
05.
54.
964.
023.
813.
773.
964.
336.
405.
2533
.5(1
.074
)(0
.500
)(0
.853
)(0
.835
)(1
.004
)(1
.522
)(1
.524
)(1
.659
)lin
ear
|0
2.7
4.34
3.86
3.80
3.79
3.89
4.16
5.17
4.64
280.
6(3
.549
)(0
.595
)(1
.088
)(1
.068
)(1
.254
)(1
.369
)(1
.899
)(1
.700
)
For
non-
linea
rm
odel
s,va
lue
ofá,
the
rest
rain
ing
forc
e,is
give
n.F
orm
odel
sin
clud
ing
wit
hin-
spec
ies
vari
atio
n,es
tim
ates
ofó
2 Sar
egi
ven.
Stan
dard
erro
rsfo
res
tim
ates
ofan
cest
ral
phen
otyp
esar
egi
ven
inpa
rent
hese
s.

Martins & Lamont: Ancestral states of displays in Cyclura iguanas 1701
Table III. Pair-wise correlation coefficients to describe the relationship between charac-ters estimated assuming that phenotypic divergence is linearly, exponentially (with á=1),or not at all related to phylogenetic distance on the tree in Fig. 2
Pauseduration
Headbobduration
Numberof bouts
Number ofheadbobs
Total durationLinear "0.20 0.78** 0.75** 0.31Exponential "0.70** 0.39 0.88** 0.77**No phylogeny "0.44 0.53 0.89** 0.54
Pause durationLinear 0.35 "0.64* "0.98**Exponential "0.20 "0.86** "0.98**No phylogeny "0.29 "0.47 "0.72**
Bob durationLinear 0.22 "0.23Exponential 0.07 "0.12No phylogeny 0.38 "0.06
Number of boutsLinear 0.66*Exponential 0.85**No phylogeny 0.44
*P<0.05.**P<0.01.
Wiewandt (1977). Our conclusions do differslightly from his in that we have no evidence tosuggest that C. cornuta displays are more variablethan those of other Cyclura species. Our descrip-tions of C. carinata displays also match those ofIverson (1979, which involved animals from adifferent cay from those observed in the currentstudy) except that Iverson does not mention therapid trill-like motions at the beginning of somedisplays. Further studies are needed to determinewhether this difference is due to the small samplesize in both studies or to true population differ-ences. Carpenter (1982) provided data from a verysmall number of C. cychlura displays which alsocoincide generally with our results.
Data from other lizards are also sparse, withSceloporus and Anolis being the only other generafor which quantitative information on a largenumber of species is available. Although it wouldalso be interesting to make comparisons with thevisual displays of anoles, such comparison is seri-ously complicated by the existence of multipleheadbob and dewlap displays within each species(e.g. Jenssen 1977). Thus, we make comparisonsonly with Sceloporus. Although Cyclura are quitediverse in the larger aspects of their headbob
displays (e.g. using headbob displays in a novelcontext as does C. carinata, and producing at leasttwo types of rolling motions as in C. nubila andC. cornuta), Cyclura headbob displays are quitesimilar to the push-up displays of Sceloporuslizards (Carpenter 1978; Martins 1993b) in manysmall ways. Cyclura displays fall roughly withinthe range of Sceloporus displays in terms of pauseduration (range=0.2–3 s for Sceloporus; 0.2–0.9 sfor Cyclura) and the number of bobs per display(range=2–15 bobs/display for Sceloporus; 1–10bobs/display for Cyclura). Because mutations,replication errors and responses to environmentalchange accumulate at each generation, variationis expected to increase with phylogenetic time.Furthermore, if the frequency of speciation is alsorelated to time, we expect phenotypic variationto increase with increasing numbers of species.Thus, given that these species means are basedon data from 42 species of Sceloporus and onlyseven species of Cyclura, it is not surprising thatSceloporus are also more variable. Even takingthis difference into account, Cyclura displays aresomewhat shorter than Sceloporus displays (rangeof species means for total duration=3–21 s forSceloporus as opposed to 1–4 s for Cyclura).

Animal Behaviour, 55, 61702
Other similarities between Sceloporus andCyclura lie in the positive relationship betweennumber of headbobs and total duration andthe negative relationship between number ofheadbobs and pause duration (cf. Martins 1993b).These relationships support the suggestion thatthere is an evolutionary constraint on the totalduration of displays, such that animals can pro-duce either several headbobs with short pausesbetween them or short series of headbobs withlong inter-bob pauses. With only seven species, itwas not possible to test the further suggestion(Martins 1993b) that the shape of the headbob(i.e. degree of jaggedness) is also negatively relatedto the number of headbobs. However, futurestudies considering possible anatomical or physi-ological mechanisms of a constraint on totaldisplay duration are warranted.
In studies of Anolis auratus, Fleishman(1988a, b) suggested that rapid motion at thebeginning of lizard visual displays may be a meansof getting the attention of conspecifics beforeproceeding with the information-rich body of themessage. Our finding that rapid trill-like motionsonly occur at the beginning of headbob displaysin at least some populations of C. ricordi andC. carinata support this hypothesis. That the roll-ing motions of C. cornuta also seem more likely tooccur at the beginning rather than at the ends ofdisplays also provides some evidence that animportant function of the beginning of displaysis to get the attention of other animals in thevicinity. The Cyclura system may be particularlyuseful in pursuing this question further because itincludes some species and even populations thatproduce trills and others that do not. Studiesof these populations could determine whetheranimals that produce trills (or that produce themmore often) live in environments with thickervegetation, more wind, or other factors whichmay increase the visual interference and the needfor attention-getting devices.
Rates of Behavioural Evolution
In several aspects, headbob displays of theCuban population (C. n. nubila) are more similarto those of the Grand Cayman subspecies(C. n. lewisii) than they are to displays of thePuerto Rican population (C. n. nubila). ThePuerto Rican population has been isolated fromCuban founders only since the mid 1960s (about
30 years or about six generations), but probablyoriginated from a population that has been sepa-rated for some time from the Guantanamo Bayanimals measured in this study. Although it is notknown how long ago the Grand Cayman animalsdiverged from C. n. nubila, genetic differencesbetween the two subspecies are quite large (Fig.2), suggesting that they have been separated forquite some time.
Cyclura n. nubila from Puerto Rico producesmuch longer displays with longer and fewer head-bobs than either of the other two populations.This distinction in their displays makes the Cubananimals more similar to their geographic neigh-bours (C. n. lewisii) than they are to the PuertoRican population. One possibility is that thePuerto Rican (C. n. nubila) population may beevolving more rapidly than either of the other twopopulations due to random genetic drift. ThePuerto Rican population is quite small (estimatedat 157 adults in Christian 1986; Christian et al.1986), and small island populations are subject torandom genetic drift and other forces which maycause very rapid evolutionary change. Anotherpossibility is that trait variation is subject primar-ily to environmental rather than genetic control,and that the differences are due either to ecologi-cal differences among the three populations (sug-gesting that the headbob display is far moreplastic than is generally believed) or to culturalevolution (such as is often hypothesized for popu-lation differences in bird song, e.g. Lynch & Baker1994). The phylogenetic analysis herein does notdistinguish between these possibilities.
Because headbob displays are frequently usedin courtship and defence of territories, majordifferences in the headbob display could lead toreproductive isolation and speciation. Furtherresearch is needed to determine whether iguanascan distinguish the difference between the differenttypes of headbob displays and whether thesedifferences have an impact on mate attraction ormating success. The finding that such dramaticchanges in duration occurred between two popu-lations, however, suggests that these variables arequite plastic, and seems in superficial conflict withour finding that only a few changes in durationhave occurred across the genus as a whole. Onepossibility is that multiple small changes haveoccurred throughout the evolution of the genus,but we cannot detect them at the phylogeneticscale because most changes did not proceed in a

Martins & Lamont: Ancestral states of displays in Cyclura iguanas 1703
consistent direction through evolutionary time.Frequent evolutionary changes in which the direc-tion of change moves back and forth at random isconsistent with the linear (Brownian motion) modelof phenotypic evolution applied in this study.
Phylogenetic Analyses
In this study, we used phylogenetic comparativemethods to reconstruct the ancestral states ofseveral characters. Instead of applying the usualparsimony methods, we applied a generalizedleast-squares approach (Martins & Hansen 1996)which allows both for the incorporation ofmeasurement error and for the use of a moreflexible set of assumptions regarding the underly-ing evolutionary process. Reassuringly, we foundonly small differences in the ancestral states esti-mated by various different types of assumptions.This result suggests that when the main goal is toestimate the phenotype of a hypothetical ancestoror to uncover general trends in the evolution ofa clade, most of the assumptions suggested byexisting phylogenetic methods will probably givereasonably accurate results. These results coincidewith the theoretical expectations of the method.Generalized least-squares regression is expected togive unbiased estimates regardless of the underly-ing error structure (phylogeny, model of evolu-tionary change, within-species variation, etc.),which affects primarily confidence intervals andhypothesis tests. On the other hand, we also foundmajor differences in the standard errors producedby analyses with different assumptions. Thus, ifthe goal is to determine exactly where evolution-ary changes occurred on a phylogeny, whether asingle change in one trait really did precedechanges in a second trait, or whether one ancestralstate is significantly different from another, onemust have rather precise information about themicroevolutionary process underlying each traitand the types of within-species variability involved.
The incorporation of measurement error oftenreduced the standard errors of the ancestral statesand allowed us to find some patterns that wouldotherwise have been totally obscured. This reduc-tion in standard errors is probably due in part tothe small sample size used in this study. Many ofthe species means had large standard errors, withthe most unusual values being obtained for taxathat were poorly represented in the data. Incor-poration of measurement error into the analysis
allowed us to weight those taxa more lightly thansome of the other taxa in which we had greaterconfidence, and to obtain more accurate esti-mates. We expect that within-species variabilitywould have a much smaller impact on the stan-dard errors in studies that included more accuratemeasures of each species mean, but this remains tobe shown.
We also applied two sets of assumptions (andseveral possible values) to span a wide range ofpossible microevolutionary scenarios underlyingthe data. In doing so, we found that a linearmodel usually fitted reasonably well, and oftenprovided the best fit to the data. Thus, the linear,Brownian motion assumption seems to be a goodone for headbob data, supporting the use of theindependent contrasts method (Felsenstein 1985)with these data. In several cases, however, one ofthe exponential models provided a better fit (lowerresidual sum of squares), suggesting that thismay also be a reasonably good model for somebehavioural characters. Unfortunately, it was notpossible to estimate the restraining force in theexponential model (á) effectively and chooseamong exponential models with so few taxa. Fur-thermore, all of the models we considered assumethat the chosen microevolutionary scenario is con-stant throughout the phylogeny. Future studiesmight improve on the situation by consideringchanging scenarios, such as stabilizing selectionabout a fluctuating optimum (e.g. Hansen 1997).
In its simplest form (assuming a linear model ofevolutionary change and excluding within-speciesvariation), our method gives ancestral state esti-mates that are virtually identical to those providedby the popular sum-of-squared-changes parsi-mony algorithm. This result is not surprisinggiven the similarities between the assumptions ofthe sum-of-squared-changes parsimony algorithmand the Brownian motion model (Maddison1991). Our method, however, also provides esti-mates of the standard errors of ancestral states,allowing us to determine where relatively large,statistically significant evolutionary changes occurand to conduct hypothesis tests involving thosechanges. It also allows us to incorporate measuresof within-species variation. Note that parsimonyestimates of an ancestral state will never exceedthe range of the two immediate daughtersof the ancestor, whereas, ancestral estimates ob-tained using the generalized least-squares methodand incorporating within-species variation will

Animal Behaviour, 55, 61704
occasionally do so. Furthermore, our generalizedleast-squares method can incorporate a wide vari-ety of other microevolutionary models, providinga measure of the robustness of the results topossible violations of evolutionary assumptions.Thus, sum-of-squared-changes parsimony mightbe considered as a specific case of our method,which provides a more thorough, more flexibleapproach to ancestral estimation.
Impact on Conservation Efforts
Several aspects of our results should be ofinterest to conservation agencies raising endan-gered species of lizards in captivity for possiblereintroduction to the wild. First, our results gen-erally support the idea that major changes in theheadbob display exist, even at the populationlevel. From a practical perspective, this suggeststhat care should be taken when mixing animalsfrom different populations in captive situations.These animals may not interact with each othereffectively, or in the same ways that they wouldinteract with animals from their own population.
Second, such differences can occur exceedinglyquickly, even in stereotyped displays which arelikely to be of considerable importance to repro-ductive behaviour. Our results suggest that majorchanges in the headbob display might occur in aslittle as six generations (about 30 years), exhibit-ing far more plasticity than we might have pre-dicted. There are several possible explanations forsuch plasticity, such as: (1) headbob displays maychange quickly in small populations subject torandom genetic drift (e.g. most captive popula-tions); (2) headbob displays may depend substan-tially on ecological rather than genetic factorssuch that captive animals need to be presentedwith appropriate ecological contexts in order topreserve their behavioural phenotypes; and (3)headbob displays may be evolving culturally withdialects of the sort found in many songbirds,such that different populations of iguanas arebehaviourally unique and worthy of independentconservation. Further research is needed todistinguish between these possibilities.
ACKNOWLEDGMENTS
Most of all, we would like to thank AlisonAlberts, Scott Davis, John Iverson and Tom
Wiewandt for their generosity with videotapesand unpublished data, Thomas Hansen for con-siderable help with the statistical analyses, andJana Broecking for digitizing the videotapes. Thework could also not have been done without thehelp of Fred Burton, Eric Carey, Bill Christie,the Grand Cayman National Trust, the BahamianDepartment of Agriculture, the Bahamian FieldStation, the International Iguana Society, theIndianapolis Zoo and the University of PuertoRico Isla Magueyes Laboratories in providinglogistical support while collecting data. AlisonAlberts, Ron Carter, Bob Ehrig, Glenn Gerber,Bill Hayes, John Iverson and Allan Lewis pro-vided much useful information and helpful sug-gestions about Cyclura. Thanks are also due toMike Lynch, Heitor and Marlene Martins forfriendly advice, logistical support and help in thefield. Finally, we thank Alison Alberts, AhrashBissell, Danielle Hall, Thomas Hansen, JohnIverson, Jonathan Losos and Pete Zani for helpfulcomments on the manuscript.
REFERENCES
Basolo, A. 1990. Female preference predates the evolu-tion of the sword in swordtail fish. Science, 250,808–810.
Brooks, D. R. & McLennan, D. A. 1991. Phylogeny,Ecology and Behavior: A Research Program in Compara-tive Biology. Chicago: The University of Chicago Press.
Carpenter, C. C. 1978. Comparative display behavior inthe genus Sceloporus (Iguanidae). Contrib. Biol. Geol.Milwaukee Publ. Mus., 18, 1–71.
Carpenter, C. C. 1982. The aggressive displays of igua-nine lizards. In: Iguanas of the World (Ed. by G. M.Burghardt & A. S. Rand), pp. 215–231. Park Ridge,New Jersey: Noyes Publications.
Carpenter, C. C. & Ferguson, G. W. 1977. Variationand evolution of stereotyped behavior in reptiles. In:Biology of the Reptilia: Ecology and Behavior A. Vol. 7(Ed. by C. Gans & D. W. Tinkle), pp. 335–554. NewYork: Academic Press.
Carpenter, C. C. & Grubitz, G., III. 1961. Time motionstudy of a lizard. Ecology, 421, 199–200.
Christian, K. A. 1986. Aspects of the life history ofCuban Iguanas on Isla Magueyes, Puerto Rico. Carib.J. Sci., 22, 159–164.
Christian, K. A., Clavijo, I. E., Cordero-Lopez, N.,Elias-Maldonado, E. E., Franco, M. A., Lugo-Ramirez, M. V. & Marengo, M. 1986. Thermoregula-tion and energetics of a population of Cuban iguanas(Cyclura nubila) on Isla Magueyes, Puerto Rico.Copeia, 1986, 65–69.
Christie, B. 1995. West Indian Rock Iguana, GenusCyclura: North American Regional Studbook.Indianapolis, Indiana: Indianapolis Zoo.

Martins & Lamont: Ancestral states of displays in Cyclura iguanas 1705
Crews, D. 1975. Inter- and intra-individual variation indisplay patterns in the lizard, Anolis carolinensis.Herpetologica, 31, 7–37.
DeCourcy, K. R. & Jenssen, T. A. 1994. Structure anduse of male territorial headbob signals by the lizardAnolis carolinensis. Anim. Behav., 47, 251–262.
Distel, H. & Veazey, J. 1982. The behavioral inventoryof the green iguana, Iguana iguana. In: Iguanas of theWorld (Ed. by G. M. Burghardt & A. S. Rand),pp. 252–270. Park Ridge, New Jersey: NoyesPublications.
Dugan, B. 1982. A field study of the headbob displays ofmale green iguanas (Iguana iguana): variation in formand context. Anim. Behav., 30, 327–338.
Endler, J. A. & Thery, M. 1996. Interacting effects of lekplacement, display behavior, ambient light and colorpatterns in three Neotropical forest-dwelling birds.Am. Nat., 148, 421–452.
Felsenstein, J. 1985. Phylogenies and the comparativemethod. Am. Nat., 125, 1–15.
Fleishman, L. J. 1988a. Sensory and environmentalinfluences on display form in Anolis auratus, a grassanole from Panama. Behav. Ecol. Sociobiol., 22, 309–316.
Fleishman, L. J. 1988b. Sensory influences on physicaldesign of a visual display. Anim. Behav., 36, 1420–1424.
Grafen, A. 1989. The phylogenetic regression. Phil.Trans. R. Soc. Ser. B, 326, 119–157.
Hansen, T. F. 1997. Stabilizing selection and the com-parative analysis of adaptation. Evolution. 51, 1341–1351.
Hansen, T. F. & Martins, E. P. 1996. Translatingbetween microevolutionary process and macroevolu-tionary patterns: the correlation structure of inter-specific data. Evolution, 50, 1404–1417.
Harvey, P. H. & Pagel, M. D. 1991. The ComparativeMethod in Evolutionary Biology. Oxford: OxfordUniversity Press.
Huey, R. B. & Bennett, A. F. 1987. Phylogenetic studiesof coadaptation: preferred temperatures versus opti-mal performance temperatures of lizards. Evolution,41, 1098–1115.
Irwin, R. E. 1996. The phylogenetic content of aviancourtship display and song evolution. In: Phylogeniesand the Comparative Method in Animal Behaviour (Ed.by E. P. Martins), pp. 234–252. New York: OxfordUniversity Press.
Iverson, J. B. 1978. The impact of feral cats and dogs onpopulations of the West Indian rock iguana, Cycluracarinata. Biol. Conserv., 14, 63–73.
Iverson, J. B. 1979. Behavior and ecology of the rockiguana, Cyclura carinata. Bull. Fla St. Mus., 24,176–358.
Jenssen, T. A. 1977. Evolution of anoline lizard displaybehavior. Am. Zool., 17, 203–215.
Losos, J. B. 1996. Phylogenies and comparative biology,stage II: testing causal hypotheses derived from phyl-ogenies with data from extant taxa. Syst. Biol., 45,259–322.
Lynch, A. & Baker, A. J. 1994. A population memeticsapproach to cultural evolution in chaffinch song:differentiation among populations. Evolution, 48,351–359.
McArdle, B. & Rodrigo, A. G. 1994. Estimating theancestral states of a continuous-valued characterusing squared-change parsimony: an analytical solu-tion. Syst. Biol., 43, 573–578.
Maddison, W. P. 1991. Squared-change parsimonyreconstructions of ancestral states for continuous-valued characters on a phylogenetic tree. Syst. Zool.,40, 304–314.
Martins, E. P. 1991. A field study of individual and sexdifferences in the push-up display of the sagebrushlizard, Sceloporus graciosus. Anim. Behav., 41, 403–416.
Martins, E. P. 1993a. Contextual use of the push-updisplay by the sagebrush lizard, Sceloporus graciosus.Anim. Behav., 45, 25–36.
Martins, E. P. 1993b. A comparative study of theevolution of Sceloporus push-up displays. Am. Nat.,142, 994–1018.
Martins, E. P. 1994. Phylogenetic perspectives on theevolution of lizard territoriality. In: Lizard Ecology:Historical and Experimental Perspectives (Ed. by L. J.Vitt & E. R. Pianka), pp. 118–144. Princeton, NewJersey: Princeton University Press.
Martins, E. P. 1996a. Conducting phylogenetic com-parative studies when the phylogeny is not known.Evolution, 50, 12–22.
Martins, E. P. 1996b. COMPARE 1.0: Statistical Analy-sis of Comparative Data. [Computer program avail-able via the WWW at http://evolution.uoregon.edu/2COMPARE/]. Eugene: University of Oregon.
Martins, E. P. 1996c. Phylogenies and the ComparativeMethod in Animal Behavior. New York: OxfordUniversity Press.
Martins, E. P. & Garland, T., Jr. 1991. Phylogeneticanalyses of the correlated evolution of continuouscharacters: a simulation study. Evolution, 45, 534–557.
Martins, E. P. & Hansen, T. F. 1996. The statisticalanalysis of interspecific data: a review and evaluationof phylogenetic comparative methods. In: Phylogeniesand the Comparative Method in Animal Behaviour (Ed.by E. P. Martins), pp. 22–75. New York: OxfordUniversity Press.
Martins, E. P. & Hansen, T. F. 1997. Phylogenies andthe comparative method: a general approach to incor-porating phylogenetic information into the analysis ofinterspecific data. Am. Nat., 149, 646–667.
Prum, R. O. 1994. Phylogenetic analysis of the evolutionof alternative social behavior in the manakins (Aves:Pipridae). Evolution, 48, 1657.
Prum, R. O. 1997. Phylogenetic tests of alternativeintersexual selection mechanisms: trait macroevolu-tion in a polygynous clade (Aves: Pipridae). Am. Nat.,149, 668.
de Queiroz, A. & Wimberger, P. H. 1993. The usefulnessof behavior for phylogeny estimation: levels of homo-plasy in behavioral and morphological characters.Evolution, 47, 46–60.
Rothblum, L. & Jenssen, T. A. 1978. Display repertoireanalysis of Sceloporus undulatus hyacinthus (Sauria:Iguanidae) from south-western Virginia. Anim.Behav., 26, 130–137.
Ryan, M. J. 1985. Variation in iguanine social organi-zation: mating systems in chuckawallas (Sauromalus).

Animal Behaviour, 55, 61706
In: Iguanas of the World (Ed. by G. M. Burghardt &A. S. Rand), pp. 380–390. Park Ridge, New Jersey:Noyes Publications.
Schwartz, A. & Henderson, R. W. 1991. Amphibians andReptiles of the West Indies: Descriptions, Distributionsand Natural History. Gainesville: University ofFlorida Press.
Sillen-Tullberg, B. 1988. Evolution of gregariousness inaposematic butterfly larvae: a phylogenetic analysis.Evolution, 42, 293–305.
Sites, J. W., Jr, Davis, S. K., Guerra, T., Iverson, J. B. &Snell, H. L. 1996. Character congruence and phylo-genetic signal in molecular and morphological datasets: a case study in the living iguanas (Squamata:Iguanidae). Molec. Biol. Evol., 13, 1087–1105.
Slowinski, J. B. & Guyer, C. 1989. Testing the stochas-ticity of patterns of organismal diversity: an improvednull model. Am. Nat., 134, 907–921.
Wiewandt, T. A. 1977. Ecology, behavior and manage-ment of the Mona Island ground iguana, Cyclurastejnegeri. Ph.D. thesis, Cornell University.
Wiewandt, T. A. 1981. An island shall a monster make.25-min. videotape. Tucson, Arizona: T. A. Wiewandt.
Wimberger, P. H. & de Queiroz, A. 1996. Comparingbehavioral and morphological characters as indicatorsof phylogeny. In: Phylogenies and the ComparativeMethod in Animal Behaviour (Ed. by E. P. Martins),pp. 206–233. New York: Oxford University Press.
Windrow, S. L. 1977. Winter activity and behavior ofthe Exuman Rock Iguana, Cyclura cychlura figginsi.M.S. thesis, Rutgers University.
Wolfram, S. 1991. Mathematica: A System for DoingMathematics by Computer. Champaign, Illinois:Addison-Wesley.