Embed Size (px)
Citation preview
EE
KAa
Gb
Mc
d
e
f
a
ARRAA
KMHBEE
AaM
0d
Small Ruminant Research 105 (2012) 154– 160
Contents lists available at SciVerse ScienceDirect
Small Ruminant Research
jou rna l h omepa g e: www.elsev ier .com/ locate /smal l rumres
stimates of economic values for important traits of two indigenousthiopian sheep breeds
.T. Gebrea,b,∗, B. Fuerst-Waltlb, M. Wurzingerb, J. Philipssonc, G. Dugumad, T. Mirkenae,
. Haile f, J. Sölknerb
Mekelle University, College of Dryland Agriculture and Natural Resources, Department of Animal, Rangeland and Wildlife Sciences, Animal Breeding andenetics Team, P.O. Box 231 Mekelle, EthiopiaUniversity of Natural Resources and Life Sciences Vienna, Department of Sustainable Agricultural Systems, Division Livestock Sciences, Gregorendel-Strasse 33, A-1180 Vienna, Austria1
Swedish University of Agricultural Sciences, Department of Animal Breeding and Genetics, P.O. Box 7023, S-750 07 Uppsala, Sweden2
Oromia Agricultural Research Institute, Bako Agricultural Research Center, P.O. Box 03 Bako, Ethiopia3
Hawassa University, College of Agriculture, Department of Animal and Rangeland Sciences, P.O. Box 05 Hawassa, Ethiopia4
International Livestock Research Institute (ILRI), P.O. Box 5689 Addis Ababa, Ethiopia5
r t i c l e i n f o
rticle history:eceived 14 April 2010eceived in revised form 5 December 2011ccepted 17 January 2012vailable online 10 February 2012
eywords:enz sheeporro sheepio-economic modelconomic valuethiopia
a b s t r a c t
A bio-economic model was adapted to estimate economic values for important traits of twoEthiopian indigenous sheep breeds, the Menz and Horro breeds. To do so, a meat sheep herdfor fattening lambs and rearing young replacement sheep was simulated. Traits includedin the analysis were: daily gain (fattening trait), live weight of ewes, length of productivelife, lambing interval, litter size, stillbirths and lamb survival (functional traits). To avoiddouble counting, the economic value for each trait was derived while keeping all othertraits constant. Economic values were obtained per ewe place, year, and genetic standarddeviation. For the Menz breed, economic values in D per genetic standard deviation were0.63 (daily gain), −0.77 (mature ewe live weight), −0.97 (length of productive life), 1.57(lambing interval), 0.98 (litter size), 0.41 (stillbirths) and 2.20 (lamb survival). Economicvalues (in D ) of 1.35 (daily gain), −1.26 (mature ewe live weight), −1.15 (length of produc-tive life), 1.98 (lambing interval), 3.67 (litter size), 0.56 (stillbirth) and 3.25 (lamb survival)were derived for the Horro breed. Negative economic values for length of productive life
and mature ewe live weight were estimated for both breeds. After setting the economic val-ues of length of productive life and mature ewe live weight to zero, the economic values (in%) for the ratio of the trait complexes fattening: functional traits were 11:89 and 12.5:87.5for Menz and Horro, respectively. Economic values for litter size, lambing interval and lambsurvival traits were sensitive to changes in price for breeding rams in both breeds.∗ Corresponding author at: Mekelle University, College of Drylandgriculture and Natural Resources, Department of Animal, Rangelandnd Wildlife Sciences, Animal Breeding and Genetics Team, P.O. Box 231ekelle, Ethiopia. Fax: +251 034 4 409304.
E-mail address: [email protected] (K.T. Gebre).1 Fax: +43 1 47654 3254.2 Fax: +46 18 67 12 01.3 Fax: +251 57 665 0184.4 Fax: +251 46 220 5421.
921-4488/$ – see front matter © 2012 Elsevier B.V. All rights reserved.oi:10.1016/j.smallrumres.2012.01.009
© 2012 Elsevier B.V. All rights reserved.
1. Introduction
Even though livestock production in the tropics and
subtropics is mostly influenced by the seasonal scarcityand low quality of feed resources, livestock make a sub-stantial contribution to the well-being of the people. Small5 Fax: +251 11 617 2001.

K.T. Gebre et al. / Small Ruminant Research 105 (2012) 154– 160 155
Table 1Proportions (in %) of ewe classes by lactation and outcome for the reference herd of Menz and Horro sheep.
Lactation
Breed 1 2 3 4 5 6 7 8 9
Involuntary Menz 1.10 0.54 0.36 0.11 0.11 0.31 0.39 0.63 7.81Horro 1.11 0.55 0.36 0.11 0.11 0.31 0.39 0.63 7.76
Fertility Menz 0.98 0.54 0.27 0.11 0.11 0.23 0.39 0.56 0.00Horro 0.99 0.55 0.27 0.11 0.11 0.23 0.39 0.56 0.00
Voluntary Menz 0.00 0.41 0.36 0.22 0.11 0.00 0.00 0.00 0.00Horro 0.00 0.69 0.36 0.22 0.11 0.00 0.00 0.00 0.00
Survivor Menz 13.58 12.09 11.09 10.65 10.33 9.79 9.00 7.81 0.00Horro 13.8 12.01 11.02 10.58 10.26 9.72 8.94 7.76 0.00
1111
Total Menz 15.66 13.58 12.09
Horro 15.91 13.80 12.01
ruminants are particularly important in feeding the rapidlyexpanding population of the developing world. They canbe kept under harsh environmental conditions due totheir low feed and space requirements. The advantages ofsmall ruminants are their short generation intervals, fastergrowth rates and higher environmental adaptability com-pared to the large ruminants (Tibbo, 2006).
Ethiopia is home to an estimated 25 million sheep (CSA,2007), made up of 9 sheep breeds and 6 sheep breed groups(Solomon et al., 2007a). These breeds and breed groupsare distributed in different agro-ecological zones and areraised both in the highlands and the lowlands (MOA, 2000).There is substantial genetic variation within and betweenbreeds, which can be exploited through selective breed-ing for further genetic improvement of the sheep breeds(Tibbo, 2006; Solomon et al., 2007a).
In spite of the large population of sheep and the impor-tance of sheep both to the livelihood of resource-poorfarmers and the national economy as a whole, the currentlevel of on-farm productivity in the smallholder produc-tion systems is low, with an off-take rate of about 33%(FAO, 2009) and an average lamb carcass weight of 10 kg.Although there is a large population of sheep with adequategenetic variation, national sheep breeding programs havenot resulted in a major genetic improvement of the popula-tion. Among several factors for this failure, lack of a clearlydefined breeding objective is the most likely obstacle.
The primary step in designing a breeding program isdefining a clear breeding objective. In the selection indextheory, the aggregate genotype (i.e. the breeding goal) isusually defined as a linear function of traits to be improved,each multiplied by its economic value, which is the valueof a unit change in the trait while keeping the other traitsin the aggregate genotype constant (Hazel, 1943).
Animal breeding is largely concerned with the selectionof animals based on well-defined breeding goals, whichshould meet future production and market requirements.Moreover, a breeding goal provides the basis for breed-ing programs, which may be defined within the contextof economic theory (Amer et al., 1998). However, in tropi-
cal areas, detailed assessments of costs and revenues arescarce, and derivations of economic values for breedinggoal traits is rare due to a lack of records, farmers’ illiteracyand small flock sizes (Kosgey et al., 2003)..09 10.65 10.33 9.79 9.00 7.81
.02 10.58 10.26 9.72 8.94 7.76
According to Amer et al. (1996), economic values areneeded for each trait in the aggregate genotype to ensurethat selection emphasis is proportional to the economicimportance of each of these traits. Thus, the objective ofthis study was to derive economic values for some impor-tant traits of the Horro and Menz sheep breeds of Ethiopia.Sensitivity analyses for different scenarios were carried outto determine the robustness of economic values.
2. Methods and materials
2.1. Model description and herd structure
For the derivation of economic values, a computer program basedon a bio-economic model was used. It was originally designed to opti-mize management-related decisions in cattle farms (Amer et al., 1996),and was then modified for the estimation of economic values in cattle(Miesenberger, 1997), and further in sheep (Fuerst-Waltl and Baumung,2009). A meat sheep herd with lamb fattening and rearing of replace-ment sheep was simulated in a steady state over an infinite planning termaccording to Miesenberger (1997).
The economic values were derived by calculating the difference inherd profit before (reference scenario) and after the change in geneticmerit. For this purpose, daily results weighted by the proportion of therespective ewe class were summarized over the lambing interval oruntil culling. The proportion of ewes in different lactations dependedon the percentage culled for infertility, involuntary or voluntary reasons(Tables S1 and 2). Voluntarily culled animals are those removed from theherd due to insufficient performance, while involuntarily culled animalsare those removed from the herd due to health problems. In the case ofinfertility, animals are removed from the herd due to reproductive failure.Within each scenario, the distribution of animals in the different classesstayed constant over time.
The functions of Wood (1967) and Gompertz (Fitzhugh, 1976) wereused to estimate daily milk, fat, and protein yield (Table S3), and liveweight and daily gain, respectively. For the calculation of milk yield inhigher lactations, the average milk yield of the first lactation was mul-tiplied by aging factors (Table S4). The growth rates and live weightsof different sheep categories were calculated according to Miesenberger(1997). Energy and protein requirements and energy deficits were calcu-lated according to AFRC (1993), GfE (1996, 2001) and Kirchgessner (2004).A linear planning algorithm was used to select the lowest cost ration meet-ing the protein and energy requirements (Press et al., 1986) for each day.Differences in requirements because of live weight changes (growth andmobilization of body reserves) and gestation were taken into account.
All results were expressed per average ewe place and year. To avoid
double counting, economic values were derived separately for each trait,keeping all other traits constant (Dempfle, 1992). For each trait, the resultswere expressed as marginal utility in euro (D ) referring to an improve-ment of a trait by one unit (e.g. 1% lamb survival, 1 g of daily gain) and aseconomic value in euro (D ) per genetic standard deviation (sa).
156 K.T. Gebre et al. / Small Ruminant Research 105 (2012) 154– 160
Table 2Assumptions made for Menz and Horro sheep.
Traits (unit) Values
Menz Horro
Standard lactation (days) 112 112Age at first lambing (days) 470 400Minimum days dry (days) 55 55Proportion of singles/twins/triples (%) 98/2/0 60/36/4Stillbirth rate (%) 2 2Male lambs fattened (%) 50 70Proportion of breeding ram sold (%) 10 20Fattening period (kg) 15–20 15–22Fattening period (days) 90 90
2
tpugeb
itcthaap
asIet
Hrsa
wamtlt
aDiac(tpw
2
Gam
t
Table 3Revenues and expenses for Menz and Horro sheep.
Traits (unit) Breed
Menz Horro
RevenuesEwe carcass weight (D /kg) 1.5 1.5Price per kg of carcass weight (D /kg) 4 4Breeding ram price (D /ram) 20 21
ExpensesLabor (D /hr) 0.144 0.144Veterinary care per lamb
fattened/replacement (D )0.13/0.13 0.13/0.13
Cost per insemination (D ) 0.07 0.07Barn unit costs (D per ewe/year) 0.11 0.24
Mature ewe weight (kg) 25 28Lamb survival to 12 months (%) 78 80
.2. Assumptions
A semi-structured questionnaire was developed for the farmers inhe Menz and Shambu areas to describe the Menz and Horro meat sheepopulation as accurately as possible. Further, literature values were alsosed to obtain data (Edea et al., 2008, 2009; Getachew et al., 2010) andenetic parameters (Fürst-Waltl et al., 2006; Hassen et al., 2003; Solomont al., 2007b) on important traits and reproduction performance of thereeds.
The assumption for the description of the age structure in the models based on analyses of data from a questionnaire (Table 1). The age struc-ure results from the probabilities of voluntary, involuntary and infertileulling. The assumptions applied are shown in Table 2. It was assumedhat all carcasses have the same grade and different cuts of the carcassave the same price. Seasonal variations in sheep price, feed availability,nd feed price were disregarded by assuming that all sheep in the samege category have the same price, and feed stuffs are available for the samerice throughout the whole year.
It was also assumed that sheep are kept in the same barn all yearround, even though farmers may have different barns for the dry and weteason. For this study, only the housing for the wet season was considered.t was also assumed that infertile females were culled at 270 days of age,ven though farmers tend to keep infertile females in the herd longer thanhis.
Farmers normally fatten castrated rams at an age of over 2 years.owever, fattening of 180-day-old lambs was practiced to optimize the
eference situation. It was also assumed that farmers worm, vaccinate andpray fattening lambs once per fattening period. Thus, health managementctivities were also applied for replacement sheep once a year.
All relevant revenues and costs were calculated per day, and all costsere treated as variable. Revenues resulted from selling fattened lambs
nd animals for herd replacement. However, revenue from wool andanure was not included in the study. Lambing occurred at any time of
he year as uncontrolled mating was predominant in both areas, and allambings were assumed to be without complications, so that costs relatedo lambing were not taken into consideration.
Ten percent of Menz and 20% of Horro male lambs were considereds breeding rams and sold at an age of 300 days at a price of D 20 and
21 per ram, respectively. To account for the costs of breeding rams,nsemination costs of D 0.07 per insemination and ewe were assumed,lthough artificial insemination is not practiced in the study areas. Toalculate the costs for each fattened animal, the costs of lamb rearingphase), housing, feeding, veterinary care, labor and other expenses wereaken into consideration. Revenues and expenses taken into account areresented in Table 3. Different kinds of feed stuffs (Table 4) were also used,hich may not always be affordable by farmers.
.3. Traits
The traits considered were taken from Edea et al. (2008, 2009) and
etachew et al. (2010), where farmers ranked the most important traitsccording to their preference. Therefore, the following traits were deter-ined to be important for the derivation of the economic values:Fattening and live weight traits - daily gain and mature ewe live weight:o increase daily gain, the parameters of the Gompertz curve (Fitzhugh,
Housing (D per fattening lamb/day) 0.0003 0.00067Barn unit costs (D per replacement
stock/year)0.084 0.183
1976) were changed in lambs (Tables S5 and 6) without changing adultewe size. With constant proceeds for each fattening lamb, marginal util-ities could be derived directly from the profit difference at two differentperformance levels. In the case of mature ewe live weight, the economicvalues were calculated by increasing mature ewe weight by one unit(Tables S7 and 8).
Functional traits - length of productive life, lambing interval, stillbirths,litter size, and lamb survival: for length of productive life, economic val-ues were derived by decreasing the probability of involuntary culling byone percent in all lactations (Tables S9 and 10). This resulted in a changeof the herd distribution and thus in a different profit per average eweplace and year. The economic value for lambing interval was derivedby reducing days to first service rather than improving the conceptionrate (Tables S11 and 12). As litter size is a categorical trait, the economicvalues were calculated assuming a standard normal distribution withsingle, twin and triple bearers and the proportion of ewes in these cat-egories. Class limits (U-value) were assigned by shifting approximatelyone genetic standard deviation towards the desired proportions (twinsand triples) resulting in new U-values and thus new class ratios. Both U-values and class ratios may be found in the U-table for standard normaldistribution (e.g. Essl, 1987). From the original and new ratios, weightedmeans for litter size and price were calculated (Tables S13 and 14). Fur-thermore, economic values for stillbirths and lamb survival traits werecalculated by changing the trait towards the desired and unfavorabledirection by one unit (1%), resulting in a different profit per ewe placeand year (Tables S15–18).
2.4. Genetic parameters
Genetic parameters for mature ewe weight, daily gain, lamb survival,and litter size were taken from Hassen et al. (2003), Abegaz et al. (2002)and Solomon et al. (2007b). However, genetic parameters for length of pro-ductive life, stillbirths, and lambing interval were not available for thosebreeds or other Ethiopian sheep breeds (Table 5). Therefore, those param-eters were taken from other meat sheep populations (Fürst-Waltl et al.,2006) to calculate the genetic standard deviation (sa).
3. Results and discussion
Table 6 provides an overview of the reference scenario.A profit of D 2.02 and D 11.77 per average ewe place andyear were achieved for Menz and Horro sheep respectively.Thus, a higher profit per average ewe place and year wasachieved in Horro; this could be due to the higher twinningrate and better growth potential of the breed compared toMenz.
Main revenues for the Menz and Horro breeds resultedfrom selling fattened lambs (D 36.1 and D 39.7, respec-tively), female replacements (D 18 for both breeds) andbreeding rams (D 20 and D 21, respectively), while main
K.T. Gebre et al. / Small Ruminant Research 105 (2012) 154– 160 157
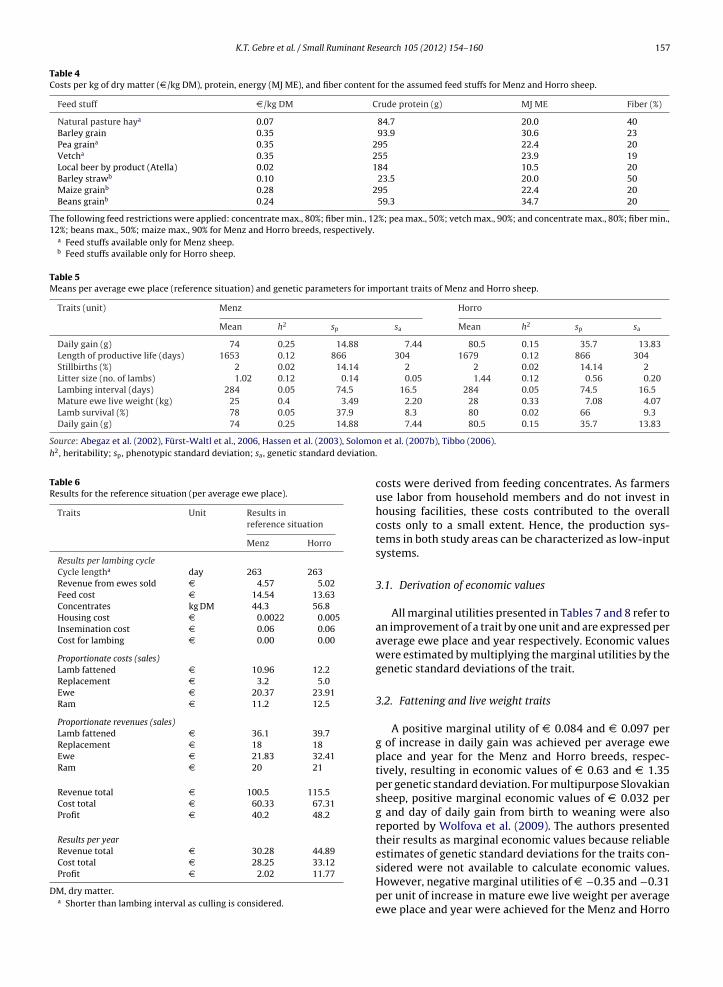
Table 4Costs per kg of dry matter (D /kg DM), protein, energy (MJ ME), and fiber content for the assumed feed stuffs for Menz and Horro sheep.
Feed stuff D /kg DM Crude protein (g) MJ ME Fiber (%)
Natural pasture haya 0.07 84.7 20.0 40Barley grain 0.35 93.9 30.6 23Pea graina 0.35 295 22.4 20Vetcha 0.35 255 23.9 19Local beer by product (Atella) 0.02 184 10.5 20Barley strawb 0.10 23.5 20.0 50Maize grainb 0.28 295 22.4 20Beans grainb 0.24 59.3 34.7 20
The following feed restrictions were applied: concentrate max., 80%; fiber min., 12%; pea max., 50%; vetch max., 90%; and concentrate max., 80%; fiber min.,12%; beans max., 50%; maize max., 90% for Menz and Horro breeds, respectively.
a Feed stuffs available only for Menz sheep.b Feed stuffs available only for Horro sheep.
Table 5Means per average ewe place (reference situation) and genetic parameters for important traits of Menz and Horro sheep.
Traits (unit) Menz Horro
Mean h2 sp sa Mean h2 sp sa
Daily gain (g) 74 0.25 14.88 7.44 80.5 0.15 35.7 13.83Length of productive life (days) 1653 0.12 866 304 1679 0.12 866 304Stillbirths (%) 2 0.02 14.14 2 2 0.02 14.14 2Litter size (no. of lambs) 1.02 0.12 0.14 0.05 1.44 0.12 0.56 0.20Lambing interval (days) 284 0.05 74.5 16.5 284 0.05 74.5 16.5Mature ewe live weight (kg) 25 0.4 3.49 2.20 28 0.33 7.08 4.07Lamb survival (%) 78 0.05 37.9 8.3 80 0.02 66 9.3Daily gain (g) 74 0.25 14.88
Source: Abegaz et al. (2002), Fürst-Waltl et al., 2006, Hassen et al. (2003), Solomoh2, heritability; sp, phenotypic standard deviation; sa, genetic standard deviation
Table 6Results for the reference situation (per average ewe place).
Traits Unit Results inreference situation
Menz Horro
Results per lambing cycleCycle lengtha day 263 263Revenue from ewes sold D 4.57 5.02Feed cost D 14.54 13.63Concentrates kg DM 44.3 56.8Housing cost D 0.0022 0.005Insemination cost D 0.06 0.06Cost for lambing D 0.00 0.00
Proportionate costs (sales)Lamb fattened D 10.96 12.2Replacement D 3.2 5.0Ewe D 20.37 23.91Ram D 11.2 12.5
Proportionate revenues (sales)Lamb fattened D 36.1 39.7Replacement D 18 18Ewe D 21.83 32.41Ram D 20 21
Revenue total D 100.5 115.5Cost total D 60.33 67.31Profit D 40.2 48.2
Results per yearRevenue total D 30.28 44.89Cost total D 28.25 33.12Profit D 2.02 11.77
DM, dry matter.a Shorter than lambing interval as culling is considered.
7.44 80.5 0.15 35.7 13.83
n et al. (2007b), Tibbo (2006)..
costs were derived from feeding concentrates. As farmersuse labor from household members and do not invest inhousing facilities, these costs contributed to the overallcosts only to a small extent. Hence, the production sys-tems in both study areas can be characterized as low-inputsystems.
3.1. Derivation of economic values
All marginal utilities presented in Tables 7 and 8 refer toan improvement of a trait by one unit and are expressed peraverage ewe place and year respectively. Economic valueswere estimated by multiplying the marginal utilities by thegenetic standard deviations of the trait.
3.2. Fattening and live weight traits
A positive marginal utility of D 0.084 and D 0.097 perg of increase in daily gain was achieved per average eweplace and year for the Menz and Horro breeds, respec-tively, resulting in economic values of D 0.63 and D 1.35per genetic standard deviation. For multipurpose Slovakiansheep, positive marginal economic values of D 0.032 perg and day of daily gain from birth to weaning were alsoreported by Wolfova et al. (2009). The authors presentedtheir results as marginal economic values because reliableestimates of genetic standard deviations for the traits con-
sidered were not available to calculate economic values.However, negative marginal utilities of D −0.35 and −0.31per unit of increase in mature ewe live weight per averageewe place and year were achieved for the Menz and Horro
158 K.T. Gebre et al. / Small Ruminant Research 105 (2012) 154– 160
Table 7Marginal utilities (D /unit), economic values (D /genetic standard deviation sa) and relative economic values (setting economic value for functional longevityand mature ewe live weight to 0) for all important traits and trait groups considered for Menz sheep.
Traits (unit) Marginal utilityin D
Economic valuein D /sa
Relative economicvalue (%)
Relative economic valuefor trait complex (%)
FatteningAverage daily gain (g) 0.084 0.63 11 11Mature ewe live weight (kg) −0.35 −0.77 0.00Productive life (days) −0.0032 −0.97 0.00Lambing interval (days) 0.095 1.57 27 Functional
bonewfwee
3
Msamoaatfl
ipgmig5a
ip
TMa
Stillbirths (%) 0.205 0.41Litter size (no. of lambs) 20 0.98Lamb survival (%) 0.26 2.20
reeds respectively, resulting in negative economic valuesf D −0.77 and D −1.26 per genetic standard deviation. Thisegative economic value is presumably caused by heavierwes requiring more feed for maintenance and growth,hich results in increase of feed cost and reduces revenues
rom selling ewes for culling. This result is in agreementith Kosgey et al. (2003) who obtained a slightly negative
conomic value of $ −0.03 for mature ewe live weight perwe place and year in the base situation.
.3. Functional traits
The functional trait with the highest economic value forenz sheep (D 2.20) was lamb survival, while in Horro
heep, the trait with the highest economic value (D 3.67)mong functional traits was litter size. The correspondingarginal utilities were D 0.26 per unit (1%) improvement
f the trait and D 18.62 per lamb born for lamb survivalnd litter size, respectively. The highest economic valuechieved for litter size in Horro could be due to the higherwinning rate, which resulted in an increase of revenuerom selling more herd replacement animals and fattenedambs.
For Menz sheep, lambing interval was the second mostmportant functional trait with a marginal utility of D 0.095er day, resulting in an economic value of D 1.57 perenetic standard deviation. Furthermore, in Horro sheep, aarginal utility of D 0.12 per day was obtained for lambing
nterval, which resulted in an economic value of D 1.98 perenetic standard deviation. A positive economic value of D.35 for lambing interval was also reported by Fuerst-Waltl
nd Baumung (2009) for dairy sheep in Austria.In Horro sheep, lamb survival was the second mostmportant functional trait, with a marginal utility of D 0.35er unit (1%), resulting in an economic value of D 3.25 per
able 8arginal utilities (D /unit), economic values (D /genetic standard deviation sa) and
nd mature ewe live weight to 0) for all important traits and trait groups conside
Traits (unit) Marginal utilityin D
Economic valueD /sa
Average daily gain (g) 0.097 1.35
Mature ewe live weight (kg) −0.31 −1.26
Productive life (days) −0.0038 −1.15
Lambing interval (days) 0.12 1.98
Stillbirths (%) 0.28 0.56
Litter size (no. of lambs) 18.62 3.67
Lamb survival (%) 0.35 3.25
7.0 891738
genetic standard deviation. The positive economic valuefor lamb survival could be due to higher body weight oflambs at birth and the occurrence of more lambing in thefavorable season, when enough feed is available for lamb-ing ewes to produce enough milk. However, Kosgey et al.(2003) reported low economic values of $ 0.00 and $ 0.10per ewe place and year for pre-weaning and post-weaninglamb survival, respectively, based on meat sheep produc-tion in tropical conditions.
Economic values for litter size were derived indepen-dently from other traits to avoid double counting (Dempfle,1992). Thus, a possible correlated increase in milk yield dueto higher litter size is not included in the economic value.For Menz sheep, a marginal utility of D 20 per lamb bornwas obtained, resulting in an economic value of D 0.98 pergenetic standard deviation. Under two different situations,one with fixed feed resources and one with no costs forfeed, positive economic values of $ 12.94 and $ 15.04 forlitter size were calculated, while in the base situation theeconomic value was negative (Kosgey et al., 2003).
Marginal utilities of D 0.205 and D 0.28 per one unitimprovement of stillbirths per average ewe place and yearwere obtained for the Menz and Horro breeds, respectively.The values resulted in economic values of D 0.41 and D0.56, respectively. Positive economic values of D 1.77 werealso reported in Austrian dairy sheep (Fuerst-Waltl andBaumung, 2009).
A negative marginal utility of D −0.0032 per day wasobtained for length of productive life in Menz sheep, whilein Horro sheep, the marginal utility was D −0.0038. Therespective economic values are D −0.97 and D −1.15 per
genetic standard deviation. The negative economic val-ues obtained for length of productive life may have beencaused by the large proportion of ewes in higher age classesin the reference scenarios (Table 1). Reduced fertility ofrelative economic values (setting economic value for functional longevityred for Horro sheep.
in Relative economicvalue (%)
Relative economic valuefor trait complex (%)
Fattening12.5 12.5
0.000.00
18.3 Functional5.2 87.5
3430

K.T. Gebre et al. / Small Ruminant Research 105 (2012) 154– 160 159
Table 9Economic values (D per ewe and year) for the reference situation with changes in price levels for breeding rams, feed and labor costs for Menz sheep.
Scenarios Price level Daily gain Mature ewelive weight
Lambsurvival
Lambinginterval
Length ofproductive life
Litter size Stillbirths
Breeding ram price +100% 0.62 −0.78 2.28 1.57 −1.00 0.98 0.45
Feed cost+20% 0.68 −0.76 2.16 1.49 −0.94 0.98 0.41−20% 0.56 −0.78 2.24 1.57 −0.97 0.98 0.43
Labor cost+20% 0.63 −0.77 2.25 1.57 −0.97 0.98 0.41−20% 0.63 −0.78 2.25 1.49 −0.97 0.82 0.41
Table 10Economic values (D per ewe and year) for the reference situation with changes in price levels for breeding rams, feed and labor costs for Horro sheep.
Scenarios Price level Daily gain Mature ewelive weight
Lambsurvival
Lambinginterval
Length ofproductive life
Litter size Stillbirths
Breeding ram price +100% 1.36 −1.22 3.57 2.12 −1.20 4.13 0.62
Feed cost+20% 1.44 −1.30 3.16 1.80 −1.15 3.60 0.54
3.25
3.20
3.20
−20% 1.25 −1.20
Labor cost+20% 1.38 −1.25
−20% 1.38 −1.22
ewes in higher age classes result in increased lambingintervals and a smaller number of lambs available for fat-tening, as well as for breeding. In addition, as the fertilityof older ewes is reduced, more female replacements arerequired, which results in an increase of rearing costs.Besides, milk production declines at higher ages, requiringmore costly feed to rear lambs. Fuerst-Waltl and Baumung(2009) also reported a slightly negative economic value(D −0.28) with a marginal utility of D −0.0015 per day oflength of productive life for dairy sheep in Austria. There-fore, litter size, lambing interval, and lamb survival werethe most economically important traits, followed by dailygain and stillbirths. Consequently, including these traitsin the breeding goals and selecting for those traits canincrease the profitability of the flock. However, selectionfor medium-size breeding ewes is necessary, even if farm-ers are interested in ewes with larger body size. In addition,the introduction of culling practices at the smallholder levelis necessary in order to avoid keeping unproductive ewestoo long.
3.4. Relative economic values
In Tables 7 and 8, not only the absolute economic valuesbut also relative economic values are shown. The economicvalues of mature ewe live weight and length of productivelife were set to zero. Hence, functional traits had the high-est relative economic value of 89% and 87.5% for Menz andHorro sheep, respectively. This shows that functional traitshave to be considered while defining breeding goal traits,even if their heritability is rather low. Furthermore, aver-age daily gain had a positive relative economic value of 11%and 12.5% for the Menz and Horro breeds respectively; thisshows that farmers should select for large and fast-growingbreeding rams from fertile ewes.
3.5. Sensitivity analyses
Sensitivity of economic values for different price levelsgives information on the likely direction of future economic
2.00 −1.15 3.69 0.56
1.90 −1.15 3.67 0.552.00 −1.15 3.68 0.55
values and thus genetic improvement, which has importantimplications for practical breeding programs. The resultsin Tables 9 and 10 are discussed relative to the referencesituation. In both breeds, increasing the selling price ofbreeding rams resulted in higher revenues, meaning thateconomic values increased with increasing breeding ramprices for most traits. The economic values of lamb sur-vival and stillbirth rate were sensitive to breeding ram priceby D 0.08 and D 0.04, respectively, for Menz sheep. Lit-ter size, lamb survival, lambing interval, and stillbirth ratefor Horro sheep responded to the breeding ram price by D0.46, D 0.32, D 0.14 and D 0.06, respectively. This showsthat an increasing value of breeding rams may have a pos-itive impact on the future market circumstances of malebreeding animals.
Increasing feed costs for Menz sheep resulted indecreasing economic values for most of the consideredtraits, except for litter size and stillbirths, which remainedmore or less stable. In Horro sheep, increased concentratecosts resulted in a small decrease in the economic values forlambing interval, lamb survival, litter size, and stillbirths.However, economic values for average daily gain increasedwith increasing feed cost; this could be due to the higherintake of fiber-rich feed stuffs, which are cheaper than con-centrate feed stuffs, resulting in lower feed costs. Whenconcentrate feed costs went down, the economic value ofaverage daily gain decreased, which also could be due toincreased intake of concentrate rather than fiber-rich feedstuffs when feed gets cheaper, resulting in a slightly highertotal feed cost. For most of the considered traits, economicvalues in both breeds were not sensitive to changed pricelevels for labor; this could be due to farmers spend short-time in herd management and relatively low labor costs.
4. Conclusions
Functional traits had the highest absolute and relativeeconomic values in both breeds when the economic val-ues of length of productive life and mature ewe live weight

1 inant Re
wbilleitrhapfafe
A
aNfsR
A
cj
R
A
A
A
A
C
D
E
60 K.T. Gebre et al. / Small Rum
ere set to zero. This shows that not only production traitsut also functional traits have to be considered when defin-
ng breeding goal traits, even if their heritability is ratherow. However, for length of productive life and mature eweive weight, negative economic values were obtained. Theconomic value estimates were fairly robust to changesn the price of feed and labor. Economic values of func-ional traits were improved when the price of breedingams was increased. Therefore, this indicates that small-olders should give a higher value to breeding rams, since
breeding ram is genetically valuable as parent. This studyresented economic values for some important traits, buturther derivation of economic value for other traits, likedaptation and wool traits, is also advisable. In addition,urther refinement of the model to account for smallhold-rs’ situations is suggested.
cknowledgements
Funding by the European Masters in Animal Breedingnd Genetics program and support by the University ofatural Resources and Life Sciences of Vienna is grate-
ully acknowledged. Birgit Fuerst-Waltl was financiallyupported by the Austrian Science Fund (FWF, Elise-ichter-Program V43-B12).
ppendix A. Supplementary data
Supplementary data associated with this articlean be found, in the online version, at doi:10.1016/.smallrumres.2012.01.009.
eferences
begaz, S., Negussie, E., Duguma, G., Rege, J.E.O., 2002. Genetic parameterestimates for growth traits in Horro sheep. J. Anim. Breed. Genet. 119,35–45.
FRC (Agricultural Food and Research Council), 1993. Energy and Pro-tein Requirements of Ruminants. An advisory manual prepared bythe AFRC Technical Committee on Responses to Nutrients. CAB Inter-national, Wallingford, UK.
mer, P.R., Kaufmann, A., Kuenzi, N., 1996. Breed choice and pricing systemimplications for farmers and political institutions from a Swiss cattlefarm model. In: Dent, J.B., Mcgregor, M.J., Sibbald, A.R. (Eds.), LivestockFarming Systems. Research, Development, Socio-economics and theLand Manager. EAAP Publ. No. 79. Wageningen Acadamic Puplisher,Wageningen, The Netherlands, pp. 253–258.
mer, P.R., Mpofu, N., Bondoc, O., 1998. Definition of breeding objectivesfor sustainable production system. In: Proceedings of the 6th WorldCongress on Genetics Applied to Livestock Production, vol. 27, Armi-dale, Australia, pp. 470–478.
SA (Central Statistics Authority), 2007. Agricultural sample survey,2004/05 (1997 E.C). Volume II, report on livestock and livestock char-acteristics. Statistical bulletin, 331, Addis Ababa, Ethiopia.
empfle, L., 1992. Berücksichtigung von Fruchtbarkeit und Eutergesund-
heit in der Rinderzüchtung. Züchtungskunde 64, 447–457.dea, Z., Haile, A., Tibbo, M., Sharma, A.K., Sölkner, J., Wurzinger,M., 2008. Breeding practices of indigenous sheep breeds ofsmallholders for designing community based -breeding strategiesin Ethiopia. In: Proceedings of the 16th Annual Conference of
search 105 (2012) 154– 160
Ethiopian Society of Animal Production (ESAP), Addis Ababa, Ethiopia,pp. 241–249.
Edea, Z., Haile, A., Tibbo, M., Sharma, A.K., Sölkner, J., Wurzinger, M., 2009.Relationship of live body weight and other linear body measurementsin two sheep breeds of Ethiopia. In: Proceedings of the 17th Annualconference of the Ethiopian Society of Animal Production (ESAP), heldin Addis Ababa, Ethiopia, September 24–26, pp. 105–112.
Essl, A., 1987. Statistische Methoden in der Tierproduktion. Österr.Agrarverlag, Wien, Austria.
FAO, 2009. The State of Food and Agriculture 2009: Livestock in the Bal-ance. FAO (Food and Agricultural Organization of the United Nations),Rome, Italy, http://www.fao.org/docrep/012/i0680e/i0680e.pdfAccessed on December 5, 2011.
Fitzhugh, H.A., 1976. Analysis of growth curves and strategies for alteringtheir shape. J. Anim. Sci. 42, 1036–1051.
Fuerst-Waltl, B., Baumung, R., 2009. Economic values for performance andfunctional traits in dairy sheep. Ital. J. Anim. Sci. 8, 341–357.
Fürst-Waltl, B., Willam, A., Baumung, R., 2006. Entwicklung nationalerZuchtprogramme für Schafrassen in Österreich. Abschlussbericht desProjektes 1330 im Auftrag des BM für Land- und Forstwirtschaft,Umwelt und Wasserwirtschaft und des Österreichischen Bun-desverbandes für Schafe und Ziegen. Home page address: http://www.dafne.at/dafne plus homepage/download.php?t=Project-ReportAttachment&k=214. Accessed on December 5, 2011.
Getachew, T., Haile, A., Tibbo, M., Sharma, A.K., Sölkner, J., Wurzinger, M.,2010. Herd management and breeding practices of sheep owners ina mixed crop-livestock and a pastoral system of Ethiopia. Afr. J. Agric.Res. 5 (8), 685–691.
GfE (Gesellschaft für Ernaehrungsphysiologie - Ausschuss für Bedarfsnor-men), 1996. Energiebedarf von Schafen. Proc. Soc. Nutr. Physiol. 5,149–152.
GfE (Gesellschaft für Ernährungsphysiologie - Ausschuss für Bedarfsnor-men), 2001. Energie-Nährstoffbedarf landwirtschaftlicher NutztiereNr. 8: Empfehlungen zur Energie- und Nährstoffversorgung derMilchkühe und Aufzuchtrinder. DLG-Verlag, Frankfurt, Germany.
Hassen, Y., Fuerst-Waltl, B., Sölkner, J., 2003. Genetic parameter estimatesfor birth weight, weaning weight and average daily gain in pure andcrossbred sheep in Ethiopia. J. Anim. Breed. Genet. 120, 29–38.
Hazel, L.N., 1943. The genetic basis for constructing selection indexes.Genetics 28, 476–490.
Kirchgessner, M., 2004. Tierernährung. DLG-Verlag, Frankfurt, Germany.Kosgey, I.S., van Arendonk, J.A.M., Baker, R.L., 2003. Economic values for
traits of meat sheep in medium to high production potential areas ofthe Tropics. Small Rumin. Res. 50, 187–202.
MOA (Ministry of Agriculture), 2000. Forage Extension Manual. Depart-ment of Animal and Fishery Resources. Addis Ababa, Ethiopia.
Miesenberger, J., 1997. Zuchtzieldefinition und Indexselektion fürdie österreichische Rinderzucht. Ph.D. Dissertation, Universität fürBodenkultur, Wien, Austria.
Press, W.H., Flannery, B.P., Teukolsky, S.A., Vetterling, W.T., 1986. Numer-ical Recipies: The Art of Scientific Computing. Cambridge UniversityPress, Cambridge, UK.
Solomon, G., van Arendonk, J.A.M., Komen, H., Windig, J.J., Hanotte, O.,2007a. Population structure, genetic variation and morphologicaldiversity in indigenous sheep of Ethiopia. Anim. Genet. 38, 621–628.
Solomon, G., Sisay, L., Komen, H., van Arendonk, J.A.M., 2007b. Estimate ofgenetic parameters and genetic trends for live weight and fleece traitsin Menz sheep. Small Rumin. Res. 70, 145–153.
Tibbo, M., 2006. Productivity and health of indigenous sheepbreeds and crossbreds in the central Ethiopian highlands. Ph.D.Dissertation, Department of Animal Breeding and Genetics,Faculty of Veterinary Medicine and Animal Sciences. SwedishUniversity of Agricultural Sciences (SLU), Uppsala, Sweden.http://pub.epsilon.slu.se/1142/1/Markos Tibbo corrected.pdfAccessed on December 5, 2011.
Wolfova, M., Wolf, J., Krupova, Z., Margetin, M., 2009. Estimates ofeconomic values for traits of dairy sheep. II. Model application to a pro-duction system with one lambing per year. J. Dairy Sci. 92, 2195–2203.
Wood, P.D.P., 1967. Algebraic model of the lactation curve in cattle. Nature216, 164–165.