Embed Size (px)
Citation preview

ñ
â
INTERPRETATION
Estimates for the Cost
of Interpretation Services
for Connecticut Medicaid
Recipients
August 2006

T A B L E O F C O N T E N T S
Executive Summary . . . . . . . . . . . . . . . . . . . . . . . . . . . . . . . . . . . . . . . . . 3The Findings . . . . . . . . . . . . . . . . . . . . . . . . . . . . . . . . . . . . . . . . 4
Introduction and Background . . . . . . . . . . . . . . . . . . . . . . . . . . . . . . . . . 5The Increasing Need for Interpreter Services . . . . . . . . . . . . . . . . 5Legal Supports for Interpreter Services . . . . . . . . . . . . . . . . . . . . . 6The Availability of Federal Matching Funds . . . . . . . . . . . . . . . . . 6Study Goals . . . . . . . . . . . . . . . . . . . . . . . . . . . . . . . . . . . . . . . . . 7
Research Findings . . . . . . . . . . . . . . . . . . . . . . . . . . . . . . . . . . . . . . . . . . . 8Estimated Size of the Limited English Proficient
Population on Medicaid . . . . . . . . . . . . . . . . . . . . . . . . . . . . . 9Existing Access to Interpreter Services . . . . . . . . . . . . . . . . . . . . . 9Volume of Care Received by Persons with LEP . . . . . . . . . . . . . 10The Estimated Cost of Interpreter Services for
Limited English Proficient Medicaid Recipients . . . . . . . . . . 11
Future Action . . . . . . . . . . . . . . . . . . . . . . . . . . . . . . . . . . . . . . . . . . . . . 12
Appendix A . . . . . . . . . . . . . . . . . . . . . . . . . . . . . . . . . . . . . . . . . . . . . . . 15
Appendix B . . . . . . . . . . . . . . . . . . . . . . . . . . . . . . . . . . . . . . . . . . . . . . . 16
Footnotes . . . . . . . . . . . . . . . . . . . . . . . . . . . . . . . . . . . . . . . . . . . . . . . . . 22
References . . . . . . . . . . . . . . . . . . . . . . . . . . . . . . . . . . . . . . . . . . . . . . . . 23
Editor-in-Chief: Monette Goodrich
Consultant/Proofing: Carol E. Macdonald
Design: E.K. Weymouth Design
Printing: Hitchcock Printing

3
Changing demographic and immigration
patterns in the United States have produced a
growing number of people who cannot easily
access basic health services because they cannot
adequately speak or understand English. Limited
English proficiency (LEP) thus contributes to
racial and ethnic disparities in health. The use of
trained interpreters in health care encounters can
significantly improve access to high-quality care
by facilitating accurate diagnosis, treatment and
follow-up. Because LEP is more predominant
among people with low incomes, their need for
interpreter services is particularly acute.1
éE X E C U T I V E S U M M A R Y
Limited English
Proficiency (LEP)
contributes to
racial and ethnic
disparities in
health.

4
The Findings
This report summarizes analyses that calculate the size of the limited English profi-cient population within Connecticut’s Medicaid program. It also estimates the costof providing these enrollees with face-to-face interpreters in compliance with feder-al laws and guidelines.2 Using a range of federal, state and local resources as well asqualitative and quantitative research methods, this report estimated that:
1. Connecticut’s Medicaid program covers 22,353 people with LEP.
2. Limited English proficient Medicaid recipients use 4.6 percent of Medicaid services.
3. Assuming that the state arranges for matching federal funds, the total expense to the ConnecticutMedicaid program would be $2.35 million.3
4. The annual cost for providing interpreter services through Connecticut’s Medicaid program would be $4.7 million (the total of $3.2 million for Medicaid managed care enrollees and $1.5 million for Medicaid fee-for-service enrollees).
5. Of the three mechanisms available to secure federal matching funds, it appears that the most advantageous mechanism would be for the state to reimburse interpreter services as a “coveredexpense” that would pay for 50 percent of the cost.
Further, contacts with Connecticut providers revealed that they do not track thenumber of limited English proficient patients they serve and are not aware of medicalinterpretation resources for these patients. In order to raise awareness of the need forand availability of interpreters, and create an effective system for implementing aninterpretation program across provider types, a work group comprised of key stake-holders should be formed to identify the: (1) obstacles to the provision of services, (2) successful approaches to meeting the needs of the limited English proficient community and (3) possible educational and outreach activities that could increasethe use of existing services.
Recent public hearings reveal that many Connecticut residents not fluentin English usually see health careproviders without trained interpreters.The Connecticut Health Foundation’s 2005 Policy Panel on Racial and EthnicHealth Disparities recognized thisunmet need and recommended that the Connecticut Department of SocialServices (DSS) use Medicaid funds,subject to federal match, to reimburseproviders for interpreter services. Thiswould reduce the state’s financial bur-den for these services.
Developing this recommendationrequires answers to the following questions:
1. How many Connecticut Medicaid recipients havelimited proficiency in English?
2. What are the existing levels of access to interpreterservices among the state’s Medicaid populationwith LEP?
3. How much would it cost the state to reimburseinterpreter services for all health encounters withlimited English proficient Medicaid recipients?
4. How could the state implement the federal match to help offset the cost of providing interpreter services to Medicaid enrollees with LEP?
5
I N T R O D U C T I O N A N D B A C K G R O U N D
Changing demographic and immigration
patterns in the United States are producing a
growing number of people who cannot easily
access basic health services because they cannot
adequately speak or understand English (Shin
and Bruno 2003).4 Limited English proficiency
thus contributes to racial and ethnic disparities
in health. A system in which health care
providers are poorly equipped to provide cultur-
ally competent care in languages other than
English can result in substandard care and poor
health outcomes (Leyva et al. 2005; Brach et al.
2005; Carter-Pokras et al. 2004; Derose and
Baker 2000; Preciado and Henry 1997).
The IncreasingNeed forInterpreterServices

6
Legal Supports for InterpreterServices
Over the past several decades, the feder-al government has erected legal supportsfor linguistically appropriate health care.All federally funded entities providingsocial services, including health care,must provide language assistance totheir clients. This requirement stemsfrom successive interpretations of TitleVI of the 1964 Civil Rights Act, whichprohibits discrimination on the basis ofrace, color or national origin under anyprogram or activity receiving federalfinancial assistance. In 1974, the U.S.Supreme Court ruled that Title VI protections apply to any conduct thatdisproportionately affects people withLEP because such practices discriminateon the basis of national origin.5
The Availability of FederalMatching Funds
Alongside the requirement to provide“meaningful access,” the federal govern-ment offers matching funds to help offset state costs for interpreter servicesfor the Medicaid program. Medicaidrecipients may receive interpreter servic-es from face-to-face interpreters on staff,interpreters contracted through agenciesor through a telephone service.6 Statesmay claim these matching funds in oneof three ways:
1. as a Medicaid-covered expense where the costs ofinterpreter services are reimbursed at the state’sMedicaid federal matching rate the same as anymedical service;
2. as an “administrative” expense with reimburse-ment of half the cost of the interpreter services; or
3. through payments to Disproportionate-ShareHospitals (DSHs) that provide services to largenumbers of Medicaid recipients and the uninsured.Currently, only 11 states use these funds and eachstate structures the benefit differently (NationalHealth Law Program and Access Project 2004).7
This report will develop estimates todetermine whether it would be cost-effective for Connecticut to join them.
The use of trained interpreters in health care encounters can significantly improveaccess to quality services by facilitating accurate diagnosis, treatment and follow-up(Brach et al. 2005). Interpreter services also can cut health care costs over the longterm through reductions in medical errors and unnecessary procedures. The need for interpreter services will only increase as the size of the limited English proficientpopulation grows.
The need for interpreter services
will only increase as the size of
the limited English proficient
population grows.

Study Goals
Recent public hearings reveal that manyConnecticut residents with LEP oftensee health care providers without atrained interpreter (Connecticut HealthFoundation 2005). The Foundation’s2005 Policy Panel on Racial and EthnicHealth Disparities recognized thisunmet need and recommended thatDSS reimburse providers for interpreterservices using the federal Medicaidmatch. This would reduce the state’sfinancial burden for these services(Connecticut Health Foundation 2005).To help inform the Policy Panel’s rec-ommendations, the Connecticut HealthFoundation (CHF) asked MathematicaPolicy Research, Inc., to answer the following questions:
1. How many Connecticut Medicaid recipients havelimited proficiency in English?
2. What are the existing levels of access to interpreterservices among the state’s Medicaid population thathas limited proficiency in English?
3. How much would it cost the state to reimburseface-to-face interpreter services for all health careencounters with limited English proficient Medicaidrecipients?
4. How could the state implement the federal match tohelp offset the cost of providing interpreter servicesto Medicaid enrollees with LEP?
To answer these questions, analyses wereperformed using information from arange of federal, state and local databas-es; information from telephone contacts
with Connecticut health care providersand information from officials in statesthat already participate in the federalmatch. Appendixes A and B provide adetailed explanation of the sources ofdata and the process used in calculatingthe estimates.
7
ü

8
R E S E A R C H F I N D I N G S
Determining the possible cost of reimbursement
for interpreter services in Connecticut requires
estimation of four figures: (1) the number of
Medicaid recipients with little or no proficiency
in English, (2) the share of health services these
Medicaid enrollees use, (3) the average time it
takes for each provider-patient encounter (where
interpreters will be needed), and (4) the cost of
using an interpreter for a standard period of
time. With this information, it is possible to
estimate the cost of paying for interpreter servic-
es for Connecticut’s Medicaid population not
fluent in English.

9
Estimated Size of the LimitedEnglish Proficient Population onMedicaid
Low-income Connecticut residentsshare at least 79 different languages.People speaking 65 of those languagesinclude low-income persons not fluent inEnglish. While approximately 4.6 per-cent of Connecticut residents are of lim-ited English proficiency, the proportionvaries by language group. About 48.7percent of low-income Spanish-speakingConnecticut residents have limitedEnglish proficiency, while 43 percent of low-income persons speaking “other”languages have difficulties with English.8
Applying these statistics, the ConnecticutMedicaid program provided services toan estimated 22,353 persons with LEPin 2003. Of these Medicaid recipientswith LEP, 16,793 are enrolled in theHUSKY A (Healthcare for UninsuredKids and Youth) managed care programand 5,560 in the fee-for-service (FFS)or HUSKY B program. Hartford, Bridgeport and Stamford have thehighest percentages of people not fluent in English (27.6 percent, 26 percent, and 30.7 percent respectively);Litchfield County has the lowest (2.1percent of the population).
Low-income Connecticut residents share at least 79 different languages.
People speaking 65 of those languages include low-incomepersons not fluent in English.
Existing Access to InterpreterServices
Some Connecticut Medicaid recipientsalready are eligible to receive interpreterservices. Eligibility depends on the typeof Medicaid program. The ConnecticutMedicaid program consists of two parts:three-quarters of Medicaid recipients arein managed care plans while the remain-der participate in traditional FFSarrangements.
The FFS Medicaid program does notcover interpreter services for FFS recipi-ents; however, Medicaid managed careplans do.9 The managed care plans offerinterpreter services as an administrativecost under their contracts with DSS.Enrollees who need an interpreter callthe member services department toschedule appointments that includeinterpreter services. The MedicaidManaged Care Organizations (MCOs)generally require 48 hours notice to setup the appointment and provide inter-preter coverage through either a tele-phone language line or face-to-faceinterpretation from an outside vendor.10
Unfortunately, the plans do not main-tain records on how often enrollees useinterpreter services. Calls to several private Medicaid managed care physi-cians reveal that few are aware the planprovides interpreters for Medicaidpatients with LEP, even though thisinformation is in their provider manuals.

10
Volume of Care Received byPersons with LEP
Medicaid recipients with low Englishproficiency, like their counterparts whoare fluent in English, use a wide varietyof health care services. Table 1 shows thetypes and number of services used byMedicaid recipients, as well as the shareused by limited English proficientenrollees. The data indicate that,Medicaid recipients with LEP enrolledin managed care made office visits muchmore frequently than they used otherservices. Inpatient services were a distant second, followed closely bybehavioral health care visits. The data on FFS Medicaid recipients is brokeninto greater detail. Here, too, physician services, clinic services and outpatienthospital services are heavily used byMedicaid recipients not fluent inEnglish.12 This suggests that interpreterservices are strongly needed in outpa-tient settings.
Since costs for interpretation services arecalculated on the basis of the time theinterpreter spends translating the med-ical encounter, the cost of such servicesused by Medicaid recipients not fluentin English depends on the time spentdelivering the care. Several studies sug-gest that people with LEP spend anaverage of 40.5 minutes per encounterwith a provider (Kravitz et al. 2000;Fagan et al. 2003).13 One hour of face-to-face interpreter services costs $50(based on estimates provided by otherstates’ Medicaid programs, as well as on estimates from interpreter serviceproviders across several market areas inConnecticut).14 The cost of interpreterservices multiplied by the volume ofhealth care services used by Medicaidrecipients with LEP (the number ofservices and the time it took to providethem) gives an estimate of the cost ofproviding interpreter services to the limited English proficient Medicaidpopulation.
Preliminary exploration of the scope of interpreter services indicates thatinstitutional health care providers (forexample, hospitals and communityhealth clinics) are better equipped thanprivate physician offices to provideinterpretation services through their
bilingual staff or telephone interpreterbanks. Private physician offices usetheir bilingual physicians and staff (ifavailable) for interpretation or rely onfamily members to translate for thepatient but do not use telephone banksas a backup.11
Medicaid recipients not fluent in English heavily used physician
services, clinic services and outpatient hospital services. This suggests
a strong need for interpreter services in outpatient settings.

11
TABLE 1ESTIMATED NUMBER OF SERVICES USED BY ENROLLEES WITH LEP
Panel 1: Managed Care Enrollees
Well-Child Care Visits 218,855 10,693
Office Visits 808,690 37,532
Behavioral Health Care Visits 294,427 12,126
Emergency Visits 215,201 11,933
Inpatient Days 194,501 13,792
Panel 2: FFS Enrollees
Clinic Services 35,828 1,637
Dental Services 41,141 1,880
Home Health Services 23,092 1,055
Intermediate Care Facilities for the Mentally Retarded 1,406 64
Inpatient Hospital Services 33,202 1,517
Lab and X-Ray Services 76,238 3,484
Mental Health Facility Services 500 23
Nursing Facility Services 40,681 1,859
Other Care 87,298 3,990
Outpatient Hospital Services 96,349 4,403
Other Practitioner Services 50,667 2,315
Prescribed Drugs 123,704 5,653
Physician Services 99,954 4,568
Personal Support Services 33,844 1,547
Sterilizations 241 11
Sources: Medicaid Statistical Information System (MSIS); Centers for Medicare & Medicaid Services 2005b (CMS); Connecticut Voices for Children, 2003 Enrollment Data.
The Estimated Cost of Interpreter Services for Limited English ProficientMedicaid Recipients
The cost of providing face-to-face interpreter services for Medicaid recipients notfluent in English would total $4.7 million annually based on $3.2 million among managed care enrollees and $1.5 million for FFS enrollees. If Connecticut begins toparticipate in the federal match program, it would do so at a rate of 50 percent, thefederal government’s Medicaid reimbursement rate for Connecticut. Such participa-tion would reduce the total annual cost to Connecticut’s Medicaid program to about$2.35 million.15
Total Number ofServices Used
Number ofServices Used byPersons with LEP
12
This cost estimate of providing interpreter servic-
es to Medicaid recipients with LEP is the first
step in determining how Connecticut’s Medicaid
program can broaden access to appropriate care
for enrollees not fluent in English. Several
options exist to structure the program in ways
that can reduce the cost to the state. The options
include reimbursing interpreter services as a
Medicaid-covered expense, as an administrative
expense or through payments to providers that
care for a disproportionate share of limited
English proficient patients. States that already
provide Medicaid coverage for interpreters have
made different choices. Descriptions of program
designs in three New England states help illus-
trate the options.
F U T U R E A C T I O N
Several optionsexist to structurethe program inways that canreduce the cost to the state.

13
Maine
Maine has one of the smallest limitedEnglish proficient populations (2 per-cent) of all the states currently receivingfederal matching funds for interpreterservices. Maine treats interpreter servicesas a Medicaid-covered expense and usesstate-established billing codes to reim-burse health care providers directly forthe costs of interpretation by in-personor telephone services. Interpreters receive$30 (for business hours) or $40 (fornonbusiness hours) for the first hour ofservice, with reimbursement rates of$7.50 per each additional 15-minuteincrement. The reimbursement includestravel time to and from the location butnot waiting time. Hospitals, privatenonmedical institutions, nursing facili-ties, and intermediate-care facilities forthe mentally retarded cannot bill sepa-rately for interpreter costs, which alreadyare part of the providers’ payment rates.
Massachusetts
With 7.7 percent of its total populationwith LEP, Massachusetts has the largestnumber of persons with LEP amongstates currently participating in the federal match. Massachusetts has a long history of providing language services in health encounters through its determination of need process. The state sought and received federalapproval for an amendment to itsMedicaid program to fund coverage forinterpreter services. It also uses federalpayments to cover interpreter costs inhospitals that receive DSH payments.
New Hampshire
Despite having an limited English proficient population similar to Maine’sin size (2.4 percent of its population),New Hampshire has elected to partici-pate in the federal match by billinginterpreter services as an administrativeexpense. Interpreters enroll as Medicaidproviders and bill the state directly fortheir services, but only for recipients inthe state’s FFS Medicaid plan. Languageinterpreters receive $15 for the firsthour of service and $2.25 for each subsequent 15-minute increment.
Recommendations for Connecticut
Several factors would suggest that reimbursement of interpreter services as a covered expense would be the mostappropriate choice for Connecticut.Reimbursement as a covered serviceovercomes some disadvantages posed by the other two options. First, choosing to fund interpreter servicesthrough payments to DSHs presumesthat most of the need for interpreterservices is for hospital patients. However,limited English proficient patients inConnecticut use a variety of health careproviders. Moreover, under this option,funds for interpreter services are paidthrough the general DSH funds andmight not necessarily be allocated forthis specific purpose.

14
The second option, receiving reimburse-ment as an administrative expense, posesa similar issue. In addition, neither ofthese options allows for monitoring thecost and trends in interpreter services forthe Medicaid program. The third optionhas the most advantages. Covering interpreter services as a Medicaid-coveredexpense builds on an existing paymentstructure that would be easier to imple-ment. Creating a separate billing codefor interpreter services, furthermore,would provide an incentive to use theseservices. It would help provide greateraccountability and transparency to theprocess.
Besides the securing of reimbursement,other policies can help broaden access tolinguistically appropriate care. Contactswith Connecticut health care providersrevealed that participants in the healthcare system are not always aware of thelimited English proficient populationthey serve or the medical interpretationresources available. Many managed careprivate physicians were apparentlyunaware that the MCOs would arrangeand cover the cost of interpreter servicesin health care encounters with patientsnot fluent in English. And finally, even
though the Medicaid enrollment appli-cations include a question on preferred language, the data on the size and residential patterns of different languagegroups are not routinely reported.
A work group comprised of key stake-holders, including individual physicians,personnel from community health clinics and hospitals, representatives ofminority outreach organizations, andmedical interpreters, should be formedin order to raise awareness of the availability of interpreters and create an effective system for implementing an interpretation program acrossprovider types. The work group couldidentify additional obstacles to the provision of services, discuss successfulapproaches to meeting the needs of the limited English proficient commu-nity, and recommend educational andoutreach activities that could increasethe use of interpretation services.Accurate and consistent tracking of language needs and services in healthcare encounters is an important step in developing policies that eliminatehealth disparities arising from languagebarriers.
Accurate and consistent tracking of language needs and
services in health care encounters is an important step
in developing policies to eliminate health disparities arising
from language barriers.

15
APPENDIX A
Details of the Data Sources
As noted earlier, Connecticut Medicaid recipientsreceive care either through managed care plans orthrough traditional fee-for-service (FFS) arrange-ments. Given this division of services, several datasources were used to collect information and derivethe cost estimates. Connecticut Voices for Children(hereafter referred to as “CT Voices”) and CMS’Medicaid Statistical Information System (MSIS)offered quantitative data on the numbers ofMedicaid enrollees and levels of health care utiliza-tion for the managed care and FFS populations,respectively. CT Voices provided MPR with quanti-tative data from Medicaid’s managed care program,Healthcare for UninSured Kids and Youth (HUSKY).The specific files were for the HUSKY A program,which covers children and their families withincomes below 185 percent of the federal povertylevel (FPL).16 The data included information on lev-els of service use across health care settings andwere broken down by language groups.17 Data fromMSIS provided information on sites of care andhealth care use for Connecticut’s FFS enrollees.
Several limitations in both sources influenced themethodological approach taken. First, because nei-ther the CT Voices data nor the MSIS files includeinformation on English proficiency, it was necessaryto supplement these data with information from theCensus Bureau’s 5 Percent Public Use MicrodataSample (PUMS) files to estimate the number ofpeople with LEP in Connecticut’s Medicaid program(U.S. Census Bureau 2003a and 2003b). The PUMSfiles include information from non-native Englishspeakers on how well they speak English (with pos-sible responses of “very well,” “well,” “not verywell,” and “not at all”). All persons who respondedless than “very well” were counted as having LEP.Estimates of the size of Connecticut’s limitedEnglish proficient population were also limited byincome level because lower-income households aremore representative of the population eligible forMedicaid benefits.
Second, CT Voices organizes its data differentlyfrom the MSIS data, so the information from thetwo sources was not directly comparable. Forexample, CT Voices organizes its data by languagegroup, while the MSIS data present information byracial/ethnic group. However, because they are rep-resentative of the state’s population, the PUMS filesare useful to create valid and reliable estimates ofthe number of people with LEP across a widevariety of variables, including geographic area,language group, age, racial/ethnic group, and dis-ability status. The PUMS files were used to checkthe reliability of the assumptions about the compa-rability of estimates from these two data sources.
Another organizational difference between the twofiles was that the CT Voices data present five cate-gories of service, while the MSIS data include 15different treatment or service categories. Becausethere was no easy way to overcome this limitation,the analysis relied on separate estimates for volumeand types of services used, and interpreter costs formanaged care and FFS populations. The two sepa-rate cost estimates were combined to arrive at atotal estimated cost to the Medicaid program forinterpreter services.
The data from CT Voices have two additional limita-tions that deserve mention. First, as describedabove, they are limited to health care visits forHUSKY A enrollees only. However, because mostHUSKY enrollees are in the part A program, the datarepresent actual health care encounters for the bulkof Connecticut’s Medicaid managed care recipients.Second, because the language data represent thelanguage spoken by the applicant, the languageidentifier may not apply to the individual receivingcare. However, because the HUSKY program coversmostly children, who in most cases are accompa-nied to health care visits by a parent for whom thelanguage indicator is relevant, the language infor-mation in the CT Voices data is still useful foridentifying health care encounters with limitedEnglish proficient persons.

HUSKY A EnrolleesEnglishSpanishOther
FFS and Other ManagedCare Enrollees
Total
TotalEnrollees
366,601331,40729,1136,081
121,388
487,989
PercentWith LEP
4.6N/A
48.743.0
4.6
4.6
EnrolleesWith LEP
16,793N/A
14,1782,615
5,560
22,353
ConnecticutLanguage
SpanishOther
TotalPopulation
340,633
69,67537,531
PopulationWith LEP
50,031
33,90916,122
PercentWith LEP
14.7
48.743.0
16
Qualitative data collection included an in-depth liter-ature review of academic papers and governmentaland policy reports, as well as e-mail exchanges andtelephone calls with a number of knowledgeableinformants. They included the director ofConnecticut’s Medicaid program, representatives ofother states’ Medicaid programs who have beendirectly involved with designing or implementingreimbursement for interpreter services, businessesoffering interpreter services, the ConnecticutMedicaid managed care providers,18 administratorsof Connecticut hospital and provider associations,and personnel from individual health care facilities(hospitals and community health clinics) andprivate physician offices.
APPENDIX B
Derivation of Estimates on the Cost of Interpreter Services
Estimated Size of the Connecticut’s Limited English Proficient Population
As noted above, because the quantitative Medicaiddata files do not include information on English pro-ficiency, the PUMS files were used to estimate thenumber of Medicaid beneficiaries with LEP. Limitingthese estimates to households with incomes at orbelow 100 percent of the FPL, nearly 15 percent ofConnecticut’s population (50,031 persons) ratestheir English-speaking ability as less than “verywell” (Table B.1). However, the percentage of limit-ed English proficient people varies somewhat bylanguage group. Among Spanish-speaking personsliving at or below the poverty line, 48.7 percentreport limited English proficiency, while the estimatefor all other languages combined is 43 percent.
TABLE B.1
ESTIMATES OF CONNECTICUT’S POPULATION WITHLEP AMONG THOSE LIVING IN POVERTY
Sources: 2000 U.S. Census Bureau 5 Percent Public Use Microdata Sample(PUMS) files.
Persons with LEP Enrolled in Connecticut Medicaid
Total Medicaid enrollment in 2003 was 487,989.Because the data from CT Voices include languagegroups for HUSKY A enrollees, the U.S. CensusBureau-derived percentage of people with LEP per-sons by language group was used to estimate thetotal number of limited English proficient peoplereceiving services through the HUSKY A program.19
In 2003, 366,601 people were enrolled in HUSKY A,among whom 29,113 (8 percent) were from house-holds whose primary language was Spanish andanother 6,081 (1.7 percent) were from householdsspeaking all other non-English languages (TableB.2). Applying these data and the U.S. CensusBureau estimates reported above, HUSKY Aenrolled 16,793 persons with LEP in 2003. Overall,people with LEP accounted for less than 5 percentof all HUSKY A managed care program participants.Subtracting the 366,601 enrolled in HUSKY A leavesan estimated 121,388 FFS and other managed careMedicaid enrollees. Assuming that a similar per-centage of these enrollees (4.6 percent) are oflimited English proficiency,20 this suggests thatConnecticut Medicaid enrolled 5,560 additionalpersons with LEP in 2003, bringing the totalnumber of persons with LEP to 22,353.
TABLE B.2
ESTIMATED NUMBER OF PERSONS WITH LEPENROLLED IN CONNECTICUT MEDICAID
Sources: Medicaid Statistical Information System; Centers for Medicare &Medicaid Services 2005b; CT Voices for Children, 2003 Enrollment Data. N/A =not applicable.

17
Geographic Distribution of Persons with LEP
Table B.3 presents estimates of the size of the limited English proficient population within Public UseMicrodata Areas (PUMAs)21 across Connecticut. The U.S. Census Bureau does not provide names forthe PUMAs, but the table includes the names of principal cities in each PUMA, as well as the Census’ PUMAreference numbers.
Total Population Population
With LEP Percent
With LEP
TABLE B.3
ESTIMATES OF THE LIMITED ENGLISH PROFICIENT POPULATION ACROSS CONNECTICUT’S PUMAS AND AMONG
PERSONS LIVING IN POVERTY
PUMA Descriptor and Number
Litchfield County (00100) 10,448 215 2.1
Windsor (00200) 10,979 930 8.5
East Hartford/Manchester (00300) 9,498 1,169 12.3
West Hartford (00400) 11,856 823 6.9
Bristol (00500) 6,415 747 11.6
New Britain (00600) 13,612 2,647 19.5
Newington/Wethersfield/Glastonbury (00700) 5,395 573 10.6
Hartford (00800) 36,703 10,114 27.6
Vernon/Storrs (00900) 17,520 955 5.5
Willimantic/Killingly (01000) 11,837 1,265 10.7
Norwich (01100) 9,554 674 7.1
New London (01200) 16,796 968 5.8
Middletown (01300) 12,085 541 4.5
Naugatuck/Cheshire (01400) 8,892 653 7.3
Meriden (01500) 10,099 1,981 19.6
Hamden (01600) 11,505 799 6.9
West Haven/Milford (01700) 8,626 830 9.6
Branford (01800) 4,226 413 9.8
Waterbury (01900) 17,117 3,579 20.9
New Haven (02000) 35,401 4,540 12.8
Danbury (02100) 12,910 3,101 24.0
Fairfield (02200) 12,527 616 4.9
Norwalk/Greenwich (02300) 11,492 2,292 19.9
Bridgeport (02400) 24,790 6,433 26.0
Stamford (02500) 10,350 3,173 30.7
Source: The 2000 U.S. Census Bureau 5 Percent Public Use Microdata Sample (PUMS) files.

18
Number of
Speakers
Albanian 1,132 921 81.4Algonquian 24 0 0.0Amharic 111 92 82.9Arabic 621 266 42.8Armenian 156 67 42.9Bantu 248 60 24.2Bengali 137 9 6.6Bulgarian 180 114 63.3Cantonese 136 17 12.5Chinese 1,740 946 54.4Choctaw 40 0 0.0Croatian 122 105 86.1Cushite 132 132 100.0Czech 89 89 100.0Danish 66 36 54.5Dutch 42 11 26.2Finnish 15 0 0.0Formosan 140 49 35.0French 4,009 880 22.0French Creole 1,345 609 45.3German 1,787 395 22.1Greek 691 194 28.1Gujarathi 259 83 32.0Hebrew 312 91 29.2Hindi 591 197 33.3Hungarian 351 135 38.5India, not elsewhere classified 242 185 76.4Indonesian 113 90 79.6Irish Gaelic 65 45 69.2Italian 4,993 1,485 29.7Jamaican Creole 268 75 28.0Japanese 632 370 58.5Kannada 41 41 100.0Korean 975 671 68.8Kru, Ibo, Yoruba 231 33 14.3Kurdish 208 149 71.6Laotian 183 77 42.1Lettish 57 0 0.0Lithuanian 304 149 49.0Malay 45 17 37.8Malayalam 20 0 0.0
Mandarin 235 50 21.3Miao, Hmong 95 25 26.3Mon-Khmer, Cambodian 117 69 59.0Navajo 54 21 38.9Nepali 56 43 76.8Norwegian 108 0 0.0Other Asian 20 0 0.0Other Indic 89 45 50.6Other languages 106 22 20.8Other Native American languages 36 21 58.3Other Philippine 33 0 0.0Other Slavic 22 22 100.0Other specified African 18 0 0.0Pakistan, not elsewhere classified 70 70 100.0Panjabi 20 20 100.0Patois 161 50 31.1Persian 76 0 0.0Polish 4,158 1,398 33.6Portuguese 3,959 2,851 72.0Romanian 121 75 62.0Russian 1,178 656 55.7Samoan 104 17 16.3Serbocroatian 603 502 83.3Sinhalese 17 0 0.0Slovak 85 20 23.5South/Central American Indian 53 0 0.0Spanish 69,675 33,909 48.7Swahili 18 0 0.0Swedish 197 22 11.2Tagalog 267 39 14.6Tamil 154 27 17.5Telugu 57 0 0.0Thai 201 108 53.7Turkish 529 178 33.6Ukrainian 345 291 84.3Urdu 345 289 83.8Vietnamese 365 220 60.3Yiddish 606 86 14.2
Total 107,206 50,031 46.7
Languages Spoken by Persons with LEP in Connecticut
Table B.4 presents the list of languages spoken among impoverished Connecticut residents, as well as thenumber and percentage of persons with LEP.
TABLE B.4
LANGUAGES SPOKEN AND ESTIMATED POPULATION WITH LEP AMONG THOSE LIVING IN POVERTY
Number of
Speakers
Number ofPersons
With LEP
Percent With LEP
Source: The 2000 U.S. Census Bureau 5 Percent Public Use Microdata Sample (PUMS) files.
Number ofPersons
With LEP
Percent With LEP
19
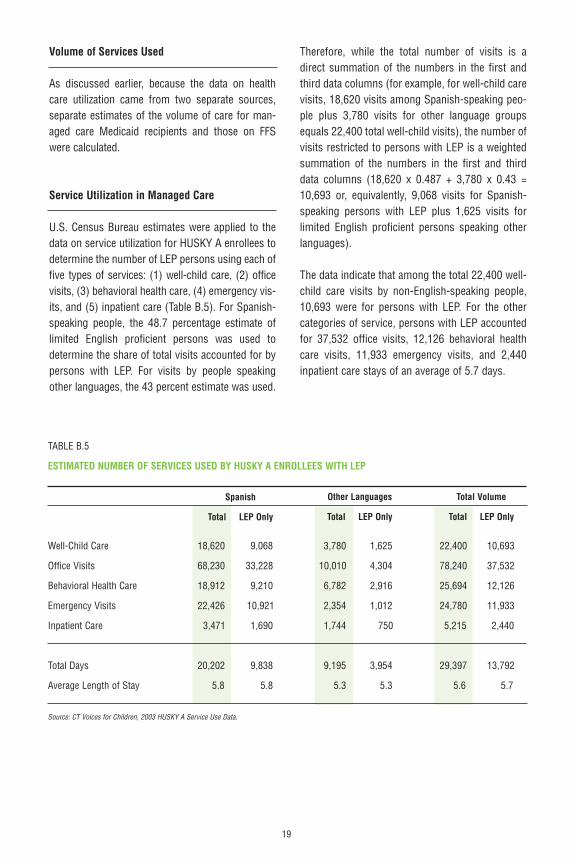
Volume of Services Used
As discussed earlier, because the data on healthcare utilization came from two separate sources,separate estimates of the volume of care for man-aged care Medicaid recipients and those on FFSwere calculated.
Service Utilization in Managed Care
U.S. Census Bureau estimates were applied to thedata on service utilization for HUSKY A enrollees todetermine the number of LEP persons using each offive types of services: (1) well-child care, (2) officevisits, (3) behavioral health care, (4) emergency vis-its, and (5) inpatient care (Table B.5). For Spanish-speaking people, the 48.7 percentage estimate oflimited English proficient persons was used todetermine the share of total visits accounted for bypersons with LEP. For visits by people speakingother languages, the 43 percent estimate was used.
Therefore, while the total number of visits is adirect summation of the numbers in the first andthird data columns (for example, for well-child carevisits, 18,620 visits among Spanish-speaking peo-ple plus 3,780 visits for other language groupsequals 22,400 total well-child visits), the number ofvisits restricted to persons with LEP is a weightedsummation of the numbers in the first and thirddata columns (18,620 x 0.487 + 3,780 x 0.43 =10,693 or, equivalently, 9,068 visits for Spanish-speaking persons with LEP plus 1,625 visits forlimited English proficient persons speaking otherlanguages).
The data indicate that among the total 22,400 well-child care visits by non-English-speaking people,10,693 were for persons with LEP. For the othercategories of service, persons with LEP accountedfor 37,532 office visits, 12,126 behavioral healthcare visits, 11,933 emergency visits, and 2,440inpatient care stays of an average of 5.7 days.
TABLE B.5
ESTIMATED NUMBER OF SERVICES USED BY HUSKY A ENROLLEES WITH LEP
Well-Child Care 18,620 9,068 3,780 1,625 22,400 10,693
Office Visits 68,230 33,228 10,010 4,304 78,240 37,532
Behavioral Health Care 18,912 9,210 6,782 2,916 25,694 12,126
Emergency Visits 22,426 10,921 2,354 1,012 24,780 11,933
Inpatient Care 3,471 1,690 1,744 750 5,215 2,440
Total Days 20,202 9,838 9,195 3,954 29,397 13,792
Average Length of Stay 5.8 5.8 5.3 5.3 5.6 5.7
Source: CT Voices for Children, 2003 HUSKY A Service Use Data.
Spanish
Total LEP Only
Other Languages
Total LEP Only
Total Volume
Total LEP Only

20
Service Utilization for Fee-for-Service Recipients
The data on FFS utilization came from the MSIS files and included detailed categories of service. However,because service use data are not broken down by language groups, estimates derived earlier for the overallmanaged care population (4.6 percent) were applied to estimate the volume of services used by FFS Medicaidrecipients with LEP (Table B-6).
TABLE B.6ESTIMATED MEDICAID SERVICE UTILIZATION BY MEDICAID RECIPIENTS WITH LEP IN FEE-FOR-SERVICE
Clinic Services 35,828 1,637
Dental Services 41,141 1,880
Home Health Services 23,092 1,055
ICF/MR 1,406 64
Inpatient Hospital Services 33,202 1,517
Lab and X-Ray Services 76,238 3,484
Mental Health Facility Services 500 23
Nursing Facility Services 40,681 1,859
Other Care 87,298 3,990
Outpatient Hospital Services 96,349 4,403
Other Practitioner Services 50,667 2,315
Prescribed Drugs 123,704 5,653
Physician Services 99,954 4,568
Personal Support Services 33,844 1,547
Sterilizations 241 11
Source: Medicaid Statistical Information System; Centers for Medicare & Medicaid Services 2005b. ICF/MR = intermediate care facilities for the mentally retarded.
Estimated Cost of Providing Face-to-FaceInterpreters
One of the most important factors influencing thecost of interpreter services is the average length ofthe patient-provider interaction. Estimates of theinteraction time for various types of services camefrom three sources: (1) a federal Office ofManagement and Budget (OMB) report that gener-ated a model for estimating the costs of interpreterservices in health care settings (OMB 2002), (2) aliterature review of studies on limited English profi-cient patient interaction time with providers and (3)data that Minnesota’s Medicaid program providedon the use and costs of interpreter services for itsFFS Medicaid recipients. The OMB report assumespatient-provider interaction times of 10 minutes foremergency room and office-based visits and onehour per day for hospital inpatient stays. Researchsuggests, however, that the OMB estimates for
office visits are conservative and that people withLEP actually spend between 34 and 47 minutes inexamination rooms with providers, for an averageof 40.5 minutes (Kravitz et al. 2000; Fagan et al.2003). Data provided by representatives ofMinnesota’s Medicaid program offered additionalinsights into the length of patient-provider interac-tions. These data are restricted to FFS MinnesotaMedicaid recipients22 and include many of the sametypes of services reported in the MSIS datadescribed above. The data include the unduplicatednumber of LEP enrollees who received interpreterservices the total number of payments made foreach service, and the number of units paid (whereunits were defined as 15-minute increments ofinterpreter time). These data were used to calculatethe average number of hours per claim for use inthe cost estimates. For services included in both theMinnesota data and the MSIS files (for example,inpatient hospital services), time estimates from the
Total Number of Services Used Service Used by Enrollees With LEP

21
Minnesota data files were used because they werethe most directly comparable. In other cases, theanalysis used the average time for all services asreported in the Minnesota data, the inpatient timesfrom the OMB report, or an average for providertime based on the literature review, depending onthe equivalency of the data sources.
The costs of interpreter services for managed careand FFS enrollees were calculated separately. Basedon calls to interpreter service providers and figuresreported for other states’ Medicaid programs, theanalysis assumed face-to-face interpreter chargesof $50 an hour. Interpreter costs for each type ofservice were calculated by multiplying the number
of limited English proficient visits by average inter-action time (expressed as portion of an hour) andcosts per hour of interpretation time. For managedcare enrollees, the analysis assumed 42 minutesof interaction time for outpatient and emergencyroom visits and one hour for inpatient stays, basedon the estimates provided through OMB and a liter-ature review. For FFS recipients, where the types ofservices were comparable, the time estimates werebased on the calculations from the Minnesota FFSdata. The analysis used 42 minutes as the standardfor outpatient visits in the FFS program when therewas nothing comparable from Minnesota’s data(see resulting estimates in Table B.7).
TABLE B.7ESTIMATED COSTS FOR INTERPRETER SERVICES FOR THE CONNECTICUT MEDICAID PROGRAM
Panel 1: Managed Care EnrolleesWell-Child Care 10,693 0.70 $374,255Office Visits 37,532 0.70 1,313,620Behavioral Health Care 12,126 0.70 424,410Emergency Visits 11,933 0.70 417,655Inpatient Days 13,792 1.00 689,600
Total Managed Care Costs $3,219,540
Panel 2: Fee-For-Service (FFS) EnrolleesClinic Services 1,637 0.70 $57,307Dental Services 1,880 0.52 48,884Home Health Services 1,055 1.01 53,293Intermediate Care Facilities for the Mentally Retarded 64 1.79 5,751Inpatient Hospital Services 1,517 0.65 49,313Lab and X-Ray Services 3,484 1.03 179,430Mental Health Facility Services 23 1.14 1,302Nursing Facility Services 1,859 0.88 81,801Other Care 3,990 1.03 205,460Outpatient Hospital Services 4,403 0.70 154,110Other Practitioner Services 2,315 0.70 81,042Prescribed Drugs 5,653 1.03 291,144Physician Services 4,568 0.81 185,000Personal Support Services 1,547 0.89 68,827Sterilizations 11 2.66 1,465
Total Fee-For-Service Costs $1,464,129
Sources: Medicaid Statistical Information System; Centers for Medicare & Medicaid Services 2005b; CT Voices for Children, 2003 Enrollment Data.
Number of Services Usedby Persons With LEP
Interaction Timein Hours
Cost in DollarsAssuming $50/Hour

22
FOOTNOTES
1 Estimates derived from U.S. Census Bureau data indicate that,in Connecticut, while almost 15 percent of people with incomesat or below 100 percent federal poverty level are limitedEnglish proficient, the percentage of people with LEP is only4.5 percent among individuals with incomes at 300 percent orgreater of the federal poverty level.
2 The analysis focused specifically on the cost of face-to-faceinterpretation because this represents the “gold standard” forpatient care. Face-to-face interpreters can read body languageand expressions that are inaccessible to telephone interpreters.However, telephone interpretation is the only viable means ofproviding interpretation services in some cases, for example,when health care providers encounter an infrequently spokenlanguage.
3 This figure includes the cost of interpreter services thatMedicaid managed care plans are already in the practice ofdelivering and are already being paid for by the state.
4 The number of U.S. residents with LEP grew from 14 million in1990 to more than 21 million in 2000 (Shin and Bruno 2003;U.S. Census Bureau 2006).
5 Lau v. Nichols, 414 U.S. 563.
6 The federal guidelines for culturally and linguistically appropri-ate services (known as CLAS standards) recommend the useof face-to-face interpreters because these service providerscan read body language and expressions that are inaccessibleto telephone interpreters. However, the CLAS standards recog-nize that telephone interpretation may be necessary in caseswhere patients speak languages infrequently encountered inthe United States.
7 These states are Idaho, Hawaii, Maine, Minnesota, Montana,New Hampshire, Utah, Washington, Kansas, Massachusetts,and Virginia (National Health Law Program and The AccessProject 2004).
8 The estimates were limited to limited English proficient peoplewith low incomes, because low-income individuals and familiesare more representative of the population eligible for Medicaidbenefits.
9 Personal communication with David Parella of DSS.
10 It appears that only the Community Health Network ofConnecticut (CHNCT) provides face-to-face interpreters, and that telephone interpretation is rarely, if ever, used formedical encounters. In general, CHNCT appears to represent a best-practice approach because they provide for face-to-faceinterpretation and information on how to make appointments is prominently displayed in their handbook (on the first page,before the Table of Contents).
11 Translation by family members or friends is discouraged by the CLAS standards because these individuals generally lackproper training in medical interpretation.
12 Comparable across the two Medicaid programs.
13 Comparable data for English-speaking patients were not available.
14 The cost estimates were based solely on face-to-face interpretation since in-person interpretation represents the“gold standard” for service delivery. Telephone interpretation is a less expensive means of providing interpreter services.Estimates incorporating costs for telephone interpretationwould, therefore, presumably be lower.
15 This figure includes the cost of interpreter services thatMedicaid managed care plans might already be delivering in practice and are already being paid for by the state.
16 HUSKY B, another managed care program, covers the state’ssomewhat-higher income State Children’s Health InsuranceProgram (SCHIP) enrollees. HUSKY Plus, the third program,provides coverage for children with special health and behav-ioral health care needs who are also eligible for HUSKY B.
17 Both the managed care and FFS Medicaid applications ask thepotential enrollee to identify the “language [they] speak best.”Indicators for this response were included in the managed carefiles received from CT Voices but were not available for FFSenrollees.
18 The Connecticut Medicaid program works with only four man-aged care providers: (1) Anthem Blue Care from Blue CrossBlue Shield (with Medicaid enrollment of 126,981 in FY 2004),(2) Community Health Network (enrollment of 54,388), (3)First Choice Health Plan Preferred One (enrollment of 25,650),and (4) Health Net Healthy Options (serving only HUSKY Awith Medicaid enrollment of 96,385 in FY 2004). Enrollmentdata provided by the Centers for Medicare & Medicaid Services2005c.
19 Language was reported as Spanish or “other.” The data alsoincluded a category for “unknown” languages; to be conserva-tive, these people were assumed to be non-English speakersand were grouped with people speaking “other” languages.
20 Analyses from the U.S. Census Bureau’s PUMS files suggestthat this estimate may be somewhat conservative and that thepercentage of persons with LEP among FFS and other Medicaidbeneficiaries actually may be lower. The FFS Medicaid popula-tion in Connecticut comprises primarily elderly and disabledpeople. PUMS estimates of the elderly and disabled popula-tions with LEP indicate that among people living in poverty,only 1.6 percent of elderly Connecticut residents are of limitedEnglish proficiency, and that among people with any sensory,physical, mental, self-care, or other disabilities, this figure isabout 4.6 percent.
21 PUMAs are a “decennial census area for which the U.S.Census Bureau provides specially selected extracts of raw data from a small sample of long-term census records” (U.S.Census Bureau 2003a, A-19). Each PUMA contains a minimumpopulation of 100,000 residents and cannot cross state lines.
22 The data, therefore, exclude the two-thirds of Minnesota’sMedicaid recipients in managed care. Minnesota pays a healthplan to administer interpreter benefits in its managed care program.

23
REFERENCES
Access Project, The, and The Cultural Imperative. 2004. AssessingLanguage Interpretation Capacity Among New Hampshire HealthCare Providers. Funded by the Endowment for Health.
Brach, Cindy, Irene Fraser, and Kathy Paez. “Crossing theLanguage Chasm.” Health Affairs, vol. 24, no. 2, 2005, pp.424–434.
Carter-Pokras, Olivia, M.J. O’Neill, V. Cheanvechai, M. Menis, T.Fan, and A. Solera. “Providing Linguistically Appropriate Servicesto Persons with Limited English Proficiency: A Needs andResources Investigation.” American Journal of Managed Care, vol.10 (special issue), 2004, pp. SP29–SP36.
Centers for Medicare & Medicaid Services. “Table 07: FY 2002Medicaid Eligibles by Race/Ethnicity.” Available at[www.cms.hhs.gov/medicaid/msis/02_table07.pdf]. 2005a.
Centers for Medicare & Medicaid Services. “Table 10: FY 2002Medicaid Beneficiaries by Service Category.” Available at[www.cms.hhs.gov/medicaid/msis/02_table07.pdf]. 2005b.
Centers for Medicare & Medicaid Services. “Medicaid ManagedCare Program Summary, June 30, 2004.” Available at[www.cms.hhs.gov/medicaid/managedcare/er04net.pdf]. 2005c.
Children’s Health Council. Health and Health Care DisparitiesAssociated with Race/Ethnicity: A Persistent Problem in HUSKY A.Hartford, Conn.: CHC, 2003.
Citizens’ Research Education Network. Access to Healthcare forSpanish Speakers. Final report to the Connecticut HealthFoundation, 2005.
Connecticut Health Foundation. Pathways to Equal Health:Eliminating Racial and Ethnic Health Disparities in Connecticut.New Britain, Conn.: CHF, 2005.
Cossio-Molina, Tania, Elizabeth G. Bayne, Susan Nappi, and TaraRizzo. “Qualitative Assessment of the Need for Medical InterpreterServices for Spanish Speaking Residents of the Naugatuck Valley.”Presented at the 133rd Annual Meeting and Exposition of theAmerican Public Health Association, December 10–14, 2005, inPhiladelphia, Pa.
Derose, K.P., and D.W. Baker. “Limited English Proficiency andLatinos’ Use of Physician Services.” Medical Care Research andReview, vol. 57, no. 1, 2000, pp. 76–91.
Fagan, Mark J., Joseph A. Diaz, Steven E. Reinert, Christopher N.Sciamanna, and Dylan M. Fagan. 2003. “Impact of InterpretationMethod on Clinic Visit Length.” Journal of General InternalMedicine, vol. 18, pp. 634–638.
Guzman-Dyrseth, Nora. Program Manager, Washington StateDepartment of Social and Health Services. Personal communica-tion. November 3, 2005.
Health Resources and Services Administration. Bureau of PrimaryHealth Care Section 330 Grantees Uniform Data System (UDS)Calendar Year 2004 Data: Connecticut Rollup Report. Washington,D.C.: Bureau of Primary Health Care, 2005.
Henry J. Kaiser Family Foundation. Connecticut Individual StateProfile: Medicaid and SCHIP. Available at [www.statehealthfacts.kff.org/cgibin/healthfacts.cgi?action=profile&area=Connecticut&category=Medicaid+%26+SCHIP]. Accessed August 29, 2005.
Institute of Medicine. Unequal Treatment: Confronting Racial andEthnic Disparities in Health Care. Washington, D.C.: NationalAcademies Press, 2002.
Kravitz, Richard L., L. Jay Helms, Rahman Azari, Deirdre Antonius,and Joy Melnikow. “Comparing the Use of Physician Time andHealth Care Resources Among Patients Speaking English, Spanish,and Russian.” Medical Care, vol. 38, no. 7, 2000, pp. 728–738.
Ku, Leighton, and Glenn Flores. “Pay Now or Pay Later: ProvidingInterpreter Services in Health Care.” Health Affairs, vol. 24, no. 2,2005, pp. 435–451.
Leyva, M., I. Sharif, and P.O. Ozuah. “Health Literacy amongSpanish-Speaking Latino Parents with Limited EnglishProficiency.” Ambulatory Pediatrics, vol. 5, no. 1, 2005, pp. 56–59.
Minnesota Population Center. Connecticut PUMAs and Super-PUMAs in 2000. Available at [www.ipums.umn.edu/usa/volii/PUMA_composition_CT.html]. 2005.
National Health Law Program. Medicaid/SCHIP ReimbursementModels for Language Services. Available at [www.healthlaw.org/library.cfm?fa=download&resourceID=63134&appView=folder&print]. Accessed August 29, 2005.
National Health Law Program and The Access Project. LanguageServices Action Kit: Interpreter Services in Health Care Settings forPeople with Limited English Proficiency. Available at [www.health-law.org]. Accessed August 29, 2005.
Parrella, David. Director, Connecticut Department of SocialServices. Personal communication. January 4, 2006.
Preciado, Juan, and Manuel Henry. “Linguistic Barriers in HealthEducation and Services.” In Psychological Interventions andResearch with Latino Populations, edited by Jorge Garcia andMaria Cecilia Zea, pp. 235–254. Needham Heights, Mass.: Allynand Bacon, 1997.
Shin, Hyon B., and Rosalind Bruno. Language Use and English-Speaking Ability, 2000. Washington, D.C.: U.S. Census Bureau,2003.
U.S. Census Bureau. Census 2000, Public Use Microdata Sample(PUMS), Technical Documentation. Washington, D.C.: 2003a.
U.S. Census Bureau. 2003b. Census 2000, Public Use MicrodataSample (PUMS), Files. Washington, D.C.: 2003b.
U.S. Census Bureau. Ability to Speak English: 2000. Available at[factfinder.census.gov]. 2006, Table QT-P17.
U.S. Department of Health and Human Services. NationalStandards for Culturally and Linguistically Appropriate Services inHealth Care. Washington, D.C.: Office of Minority Health, 2001.
U.S. Department of Health and Human Services. “Policy Guidanceon the Prohibition Against National Origin Discrimination as ItAffects Persons with Limited English Proficiency.” FederalRegister, vol. 67, no. 22, 2002, pp. 4968–4982.
U.S. Office of Management and Budget, Report to Congress.“Assessment of the Total Benefits and Costs of ImplementingExecutive Order No. 13166: Improving Access to Services forPersons with Limited English Proficiency.” Washington, D.C.: U.S.Government Printing Office, March 14, 2002.

74B Vine StreetNew Britain, CT 06052www.cthealth.org
A B O U T T H E AU T H O R S :
Ann Bagchi, Ph.D., is a researcher at Mathematica Policy Research,Inc., (MPR), with expertise in demography and health care access, aswell as utilization among immigrant and native racial and ethnicgroups. Her recent work includes a study of how limited English profi-ciency (LEP) and citizenship status interact to create disadvantages inaccessing health care among residents of California; and a separateinvestigation of how acculturation level influences racial and ethnicdifferences in self-rated health. Both studies were presented in poster
sessions at the 2006 Population Association of America annual meeting. Prior to joiningMPR, the University of Wisconsin-Madison alum was an assistant research professor at theInstitute for Health, Health Care Policy and Aging Research at Rutgers University. Herwork at Rutgers focused on racial and ethnic disparities in accessing treatments for majormental disorders and HIV/AIDS.
Beth Stevens, Ph.D., is a senior health researcher at MPR and area leader for work with foundations specializing in health care. She works in the area of health disparities and directed the WorkingGroup on Culturally-Appropriate Medicare Education Materials for the Center for Medicare Education and wrote an issue brief fornational distribution. Prior to joining MPR, Stevens was a member ofthe research staff of the Robert Wood Johnson Foundation (RWJF),where she concentrated on programs to expand access to care, improve
the health care workforce and educate vulnerable populations about the health care system.While at RWJF she designed the evaluation for the Opening Doors Program, an $8 millionprogram with 11 sites to encourage improved cultural competence in maternal and childhealth care. The Harvard University graduate also designed the Native American BreastCancer Research Project, an effort to evaluate the effectiveness of culturally appropriatebreast cancer screening and counseling.
The authors would like to thank Mary Alice Lee, who is a Senior Policy Fellow at ConnecticutVoices for Children, for her tireless efforts in providing data and other information for this report.