Embed Size (px)
Citation preview

ESTCPCost and Performance Report
ENVIRONMENTAL SECURITYTECHNOLOGY CERTIFICATION PROGRAM
U.S. Department of Defense
(RC-200610)
Application of a Solvent Emulsion Technology for PCB Removal from Older Structures on DoD Facilities
November 2011

i
COST & PERFORMANCE REPORT Project: RC-200610
TABLE OF CONTENTS
Page
EXECUTIVE SUMMARY ............................................................................................................ 1
1.0 INTRODUCTION .............................................................................................................. 5 1.1 BACKGROUND .................................................................................................... 5 1.2 OBJECTIVES OF THE DEMONSTRATION ....................................................... 5 1.3 REGULATORY DRIVERS ................................................................................... 6
2.0 TECHNOLOGY DESCRIPTION ...................................................................................... 7 2.1 TECHNOLOGY OVERVIEW ............................................................................... 7 2.2 TECHNOLOGY DEVELOPMENT ....................................................................... 8 2.3 ADVANTAGES AND LIMITATIONS ................................................................. 9
3.0 PERFORMANCE OBJECTIVES .................................................................................... 11 3.1 DISTRIBUTION AND ADHERENCE OF THE BTS ........................................ 11 3.2 ADHERENCE OF SEALANTS ........................................................................... 11 3.3 EASE OF IMPLEMENTATION .......................................................................... 13 3.4 REDUCTION IN PCB CONCENTRATIONS IN TREATED PAINT TO
LESS THAN 50 MG/KG ...................................................................................... 13 3.5 REDUCTION IN PCB CONCENTRATIONS IN BTS PASTE TO LESS
THAN 50 MG/KG ................................................................................................ 13 3.6 IMPACT TO PAINT ADHERENCE ................................................................... 14
4.0 FACILITY/SITE DESCRIPTION .................................................................................... 15 4.1 VERTICAL INTEGRATION BUILDING .......................................................... 15 4.2 BADGER ARMY AMMUNITION PLANT........................................................ 15 4.3 JAPANESE MACHINE OIL SITE, YOKOSUKA, JAPAN ............................... 16
5.0 TEST DESIGN ................................................................................................................. 17 5.1 CONCEPTUAL EXPERIMENTAL DESIGN ..................................................... 17 5.2 BASELINE CHARACTERIZATION AND TREATABILITY STUDY
RESULTS ............................................................................................................. 17 5.2.1 Vertical Integration Building .................................................................... 17 5.2.2 Badger Army Ammunition Plant .............................................................. 18
5.3 DESIGN AND LAYOUT OF TECHNOLOGY COMPONENTS ...................... 18 5.4 OPERATIONAL TESTING ................................................................................. 19 5.5 SAMPLING METHODS ...................................................................................... 20
5.5.1 Vertical Integration Building .................................................................... 20 5.5.2 Badger Army Ammunition Plant .............................................................. 28
5.6 ANALYTICAL METHODS ................................................................................ 29 5.7 SAMPLING RESULTS ........................................................................................ 29

TABLE OF CONTENTS (continued)
Page
ii
5.7.1 Adhesion Testing ...................................................................................... 29 5.7.2 Vertical Integration Building .................................................................... 32 5.7.3 Badger Army Ammunition Plant .............................................................. 32 5.7.4 Paste Optimization Studies ....................................................................... 37
6.0 PERFORMANCE ASSESSMENT .................................................................................. 41 6.1 DISTRIBUTION AND ADHERENCE OF THE BTS ........................................ 41 6.2 ADHERENCE OF SEALANTS ........................................................................... 41 6.3 EASE OF IMPLEMENTATION .......................................................................... 42 6.4 REDUCTION IN PCB CONCENTRATIONS IN TREATED PAINT TO
LESS THAN 50 MG/KG ...................................................................................... 42 6.5 REDUCTION IN PCB CONCENTRATIONS IN BTS PASTE TO LESS
THAN 50 MG/KG ................................................................................................ 43 6.6 IMPACT TO PAINT ADHERENCE ................................................................... 43
7.0 COST ASSESSMENT ...................................................................................................... 45 7.1 COST MODEL ..................................................................................................... 45 7.2 COST DRIVERS .................................................................................................. 48 7.3 COMPARISON OF COST ANALYSIS .............................................................. 50
8.0 IMPLEMENTATION ISSUES ........................................................................................ 53 8.1 POTENTIAL ENVIRONMENTAL ISSUES ...................................................... 53
8.1.1 Regulatory Issues ...................................................................................... 53 8.1.2 Air Discharge ............................................................................................ 53 8.1.3 Waste Storage, Treatment, and Disposal .................................................. 53
8.2 END-USER ISSUES ............................................................................................ 53 8.3 PROCUREMENT ISSUES .................................................................................. 53 8.4 DESIGN ISSUES.................................................................................................. 53 8.5 FOLLOW-ON WORK.......................................................................................... 55
9.0 REFERENCES ................................................................................................................. 57 APPENDIX A POINTS OF CONTACT......................................................................... A-1

iii
LIST OF FIGURES
Page Figure 1. Schematic showing the one-step-process method of applying BTS. ...................... 7 Figure 2. Schematic showing the two-step-process method of applying BTS.. ..................... 8 Figure 3. Sampling diagrams for test panels 1-6 and test I-beam 7.8. ................................. 21 Figure 4. Bunker/Press house 6810-11................................................................................. 22 Figure 5. Press building 6810-36. ........................................................................................ 23 Figure 6. Nitrating house 6657-02. ...................................................................................... 24 Figure 7. BTS paste applied to presses. ................................................................................ 25 Figure 8. Representative quality of the paint in concrete bunker 6810-11. ......................... 26 Figure 9. PCB in paint concentrations after 1, 2, and 3 weeks of exposure to BTS. ........... 26 Figure 10. Average concentrations of PCBs in paint during treatment times of 0-3
weeks..................................................................................................................... 27 Figure 11. Average PCB concentrations in paint samples from 6810-36. ............................. 27 Figure 12. Average PCB concentrations in paint samples from 657-02. ............................... 33 Figure 13. Average PCB concentrations in paint samples from various staging area
equipment at Weeks 0, 1, and 3 after BTS exposure. ........................................... 33 Figure 14. Average PCB concentration in paste for Weeks 1-3. ........................................... 35 Figure 15. Average PCB concentrations in paste sampled at Weeks 1-3 after BTS
application. ............................................................................................................ 35 Figure 16. Average PCB concentration in pastes from building 6657-02 for
Weeks 1-3. ............................................................................................................ 36 Figure 17. PCB concentration in paste from staging area (all presses) for
Weeks 1 and 3. ...................................................................................................... 36 Figure 18. Results of PCB degradation by Mg and Mg/Pd particles added to the NM
badger paste samples. ............................................................................................ 39

iv
LIST OF TABLES
Page Table 1. Performance objectives ......................................................................................... 12 Table 2. BTS ingredients (including %) for active paste. ................................................... 19 Table 3. Summary of sample handling and laboratory analytical details. .......................... 30 Table 4. Qualitative analysis of adhesion properties using ASTM D3359-02 for both
treated and untreated sample areas. ...................................................................... 31 Table 5. Quantitative analysis of adhesion properties using ASTM D4541-02 for
both treated and untreated sample areas. .............................................................. 31 Table 6. Actual costs for BTS technology dem/val. ........................................................... 45 Table 7. Comparison of cost scenariosCPorous ................................................................. 47 Table 8. Comparison of cost scenariosCMetal ................................................................... 52

v
ACRONYMS AND ABBREVIATIONS AMTS Activated Metal Treatment System ASTM American Society for Testing and Materials Badger Badger Army Ammunition Plant BTS bimetallic treatment system CAS Columbia Analytical Services CCAFS Cape Canaveral Air Force Station dem/val demonstration/validation DoD Department of Defense ESTCP Environmental Security Technology Certification Program KSC Kennedy Space Center LUT Launch Umbilical Tower Mg magnesium MgO magnesium oxide NASA National Aeronautics and Space Administration NFESC Naval Facilities Engineering Service Center NM non-metal Pd palladium PCB polychlorinated biphenyl Sil silicone-based roof sealant SRF-JRMC U.S. Naval Ship Repair Facility and Japan Regional Maintenance Center TSCA Toxic Substances Control Act UCF University of Central Florida USEPA U.S. Environmental Protection Agency VIB Vertical Integration Building VP vinyl polymer

This page left blank intentionally.

Technical material contained in this report has been approved for public release. Mention of trade names or commercial products in this report is for informational purposes only;
no endorsement or recommendation is implied.
vii
ACKNOWLEDGEMENTS Funding of this work was provided by the U.S. Department of Defense’s Environmental Security Technology Certification Program (ESTCP). The authors wish to thank Dr. Robert Holst, Dr. John Hall, and Dr. Jeffrey Marqusee of ESTCP for their support during the demonstration and for comments provided on the work and on the report. The work would not have been possible without the cooperation and support from many individuals at the Cape Canaveral Air Force Station, the Navy’s Inactive Ship Program, and Badger Army Ammunition Plant, including Mr. Mark Kershner of the USAF, Glen Clark of the Navy, and Ms. Joan Kenney of Badger Army Ammunition Plant.

This page left blank intentionally.

1
EXECUTIVE SUMMARY
Polychlorinated biphenyls (PCBs) are a group of synthetic aromatic compounds with the general formula C12H10-xClx that were historically used by industry because of their excellent dielectric properties and their resistance to heat and chemical degradation. PCBs were commonly used as additives in paints and asphaltic-based adhesives that were subsequently applied to Department of Defense (DoD) structures. Prior to 1979, PCBs were extensively used in industrial paints, caulking material, and adhesives, as their properties enhanced structural integrity, reduced flammability, and boosted antifungal properties. Numerous DoD facilities have older metal structures upon which paints containing PCB were applied. These painted structures may present risks to human health or the environment because of inhalation or ingestion concerns, as the paint degrades and becomes brittle and can become airborne or impact soil, surface water, or groundwater. To date, no reliable methods are available that allow for the removal of PCBs from painted structures and equipment without damaging the coating or the structures and equipment. The overall objective of this project was to refine and deploy a safe, cost-effective, in situ treatment method for the removal and destruction of PCBs found on DoD structures. This overall project objective was addressed by the following specific objectives:
Determine the protocol for formulating bimetallic treatment system (BTS) for site specific conditions to enhance applicability to various PCB-containing materials found across numerous DoD facilities while maximizing safety and efficacy with the ultimate goal of reducing PCB concentrations to less than 50 mg/kg.
Demonstrate the effectiveness of BTS on a wide range of actual contaminated structures at three DoD facilities. Evaluate the relationships between dose applied, repeated applications, and reaction kinetics with the intention of specifically identifying the factors influencing treatment and limiting reaction rates for a specific media (e.g., different painted structures). Evaluate environmental condition effects (temperature and humidity, weathering) and impact of BTS on material appearance and adhesion.
Research and development work at the National Aeronautics and Space Administration Kennedy Space Center (NASA-KSC) and University of Central Florida (UCF) has led to the development of a BTS consisting of elemental magnesium (Mg) coated with a small amount of palladium (Pd) that is utilized in conjunction with a solvent solution capable of donating hydrogen atoms. BTS as a treatment technology has two functions: (1) to extract the PCBs from weathered coating materials and other PCB-containing materials such as insulation, rubber gaskets, and asphaltic compounds and (2) to degrade the extracted PCBs. The chemical reductant and catalyst system has been optimized for use in BTS and typically consists of 0.1% Pd on zero-valent or metallic Mg. It is hypothesized that the interaction of the bimetallic Mg/Pd system with a solvent containing available hydrogen moieties (i.e., alcohols) results in the generation of atomic hydrogen at particular sites on the metal surface. The bound atomic hydrogen is available for reaction with PCB molecules in solution yielding a reductive dehalogenation reaction. The BTS technology demonstrations were conducted at two DoD facilities: (1) the Vertical Integration Building (VIB) at the Cape Canaveral Air Force Station (CCAFS), FL; and

2
(2) the Badger Army Ammunition Plant (Badger), Sauk County, WI. Primary and secondary performance objectives were developed that were evaluated using either qualitative or quantitative performance criteria to determine success. These performance criteria included: Distribution and adherence of the BTS. One of the qualitative performance objectives is that the BTS applicator is able to evenly distribute the paste on the surface to be treated. The metric was evaluated by assessing the adherence of the BTS to an object in a 0.25- to 0.5-inch layer over the time period of exposure to treated surfaces. BTS was applied using a spray applicator and hand trowel application method. This objective was met although the spray application did not work well in the cold weather implementation. Adherence of sealants. The metric was evaluated by assessing the adherence of the sealant to the BTS, the ability to apply the sealant evenly over the surface of the paste, and its ability to dry to a non-tacky, nonporous layer that reduced volatilization of BTS solvent. Two sealants were tested: (1) a vinyl polymer (VP) truck bed liner and (2) a silicone-based roof sealant (Sil). This objective was met using both sealants. Ease of implementation. The ease of use of this technology was evaluated based on our experience in the field. This objective was met with respect to both the ease of handling and applying both the paste and sealant on the various surfaces and locations that were treated. Reduction in PCB concentrations in treated paint to less than 50 mg/kg. A key performance objective is the reduction of PCB concentrations in the treated material to less than 50 mg/kg. This objective was partially met. One application of paste was effective in achieving this target after only one week of treatment in all cases where the starting concentration in the paint was less than approximately 500 mg/kg, especially if the surface being treated was metal and not concrete. In cases where the starting concentrations in the paint were greater than 500 mg/kg, significant reductions (93%) in PCB concentrations were achieved, but more than one application of paste is necessary to reduce concentrations below 50 mg/kg. Reduction in PCB concentrations in BTS paste to less than 50 mg/kg. The reduction of PCB concentrations in the paste to less than 50 mg/kg is another key performance objective. This objective was partially met. For the active paste (metal in the paste), if the starting paint concentrations were below roughly 2500 mg/kg, then the concentrations in the paste were less than 50 mg/kg. If the pretreatment paint concentrations were very high (>20,000 mg/kg), then the active metal paste was not able to degrade all the PCBs in the paste to below 50 mg/kg although degradation did occur in the paste. Even when Mg/Pd and additional ethanol was added in the laboratory to the active paste that had been exposed to the very high starting concentrations, it was not possible to get the concentrations in the paste to below 50 mg/kg after 21 days. For the nonmetal paste, which was activated in the lab after removal from the field by the addition of ethanol and the active metal (Mg and acid or Mg/Pd), the concentrations were reduced to below 50 mg/kg for all samples using the acidified ethanol and Mg and/or ethanol and the Mg/Pd.

3
Follow-on work Studies conducted at UCF after the project was initiated have shown that the Pd catalyst can be removed from the BTS paste and a small amount of acid added to make a paste that is less expensive and more reactive. The addition of a small amount of acetic acid to the ethanol significantly increased the rate of PCB degradation. These studies also showed that acidified ethanol with Mg particles was as effective or in some cases more effective than the Mg/Pd particles in non-acidified ethanol at degrading PCBs.

This page left blank intentionally.

5
1.0 INTRODUCTION
1.1 BACKGROUND
PCBs are a group of synthetic aromatic compounds with the general formula C12H10-xClx that were historically used by industry because of their excellent dielectric properties and their resistance to heat and chemical degradation. Although the U.S. Environmental Protection Agency (USEPA) has banned the manufacture of PCBs since 1979, they have been found in at least 500 of the 1598 National Priorities List (Superfund) sites identified by the USEPA. Prior to the USEPA’s ban on PCB production, PCBs were commonly used as additives in paints and asphaltic-based adhesives that were subsequently applied to DoD structures. Prior to 1979, PCBs were extensively used in industrial paints, caulking material, and adhesives, as their properties enhanced structural integrity, reduced flammability, and boosted antifungal properties. Numerous DoD facilities have older metal structures upon which paints containing PCB were applied. To date, no reliable methods are available that allow for the removal of PCBs from painted structures and equipment without damaging the coating or the structures and equipment. In 2004, NASA-KSC began investigating the potential of using a solvent-based system to remove PCBs found in paints located on a number of structures at three of their operating centers. This innovative research was initially funded by NASA’s Environmental Program Office and NASA’s Office of Space Flight. The funding included the preliminary proof of concept laboratory research and the demonstration of a BTS on parts set aside from NASA’s Launch Umbilical Tower (LUT) at KSC. This project seeks to demonstrate the application of a BTS to remove and degrade PCBs found on structures and equipment at DoD facilities. The project involved the collection of PCB- containing materials from various DoD structures, followed by the laboratory evaluation of the PCB removal efficiency by BTS for each location. This included determining the number of BTS applications required to reach predetermined cleanup goals stipulated by the various installations. The work then proceed into the field where the BTS was applied to PCB-containing structures at the VIB at the CCAFS, FL, and the Badger, Sauk County, WI. Both sites had PCBs identified in the paint on the structures and equipment, appropriate site conditions, and a suitable on-site support network for execution of the demonstration/validation (dem/val).
1.2 OBJECTIVES OF THE DEMONSTRATION
The overall objective of this project was to refine and deploy a safe, cost-effective, in situ treatment method for the removal and destruction of PCBs found on DoD structures. This overall project objective was addressed by the following specific objectives:
Determine the protocol for formulating BTS for site-specific conditions to enhance applicability to various PCB-containing materials found across numerous DoD facilities while maximizing safety and efficacy with the ultimate goal of reducing PCB concentrations to less than 50 mg/kg. This objective was met.
Demonstrate the effectiveness of BTS on a wide range of actual contaminated structures at three DoD facilities. Evaluate the relationships between dose applied, repeated applications, and reaction kinetics with the intention of specifically

6
identifying the factors influencing treatment and limiting reaction rates for a specific media (e.g., different painted structures). Evaluate environmental condition effects (temperature and humidity, weathering) and impact of BTS on material appearance and adhesion. This objective was met at the two facilities where testing was conducted.
Review BTS application and handling process and develop appropriate on-site safety protocols for institutions to implement during its application, including the handling of any site-specific waste products generated by BTS and the application process. The BTS process itself produces non-toxic waste. This objective was met and this information is included in the project reports.
Develop full-scale cost and performance reports for DoD facility end users to utilize when addressing PCBs found on existing structures. These reports have been prepared.
1.3 REGULATORY DRIVERS
Although USEPA has banned the manufacture of PCBs since 1979, they have been found in at least 500 of the 1598 National Priorities List (Superfund) sites identified by USEPA. Prior to USEPA’s ban on PCB production, PCBs were commonly used as additives in paints and asphaltic-based adhesives that were subsequently applied to DoD structures. DoD facilities constructed as early as 1930 utilized PCB-containing binders or PCB-containing paints, which are now leaching into the environment and posing ecological and worker health concerns. During the 1950 to 1960 time frame, PCBs were added to paint formulations as drying oils and plasticizers or softening agents in concentrations that range from 10-12% PCBs (100,000–120,000 mg/kg) to 20-30% PCBs (200,000–300,000 mg/kg). Data provided to USEPA indicate that PCBs have been found in dried paint at concentrations that range from <1 mg/kg to 97,000 mg/kg (USEPA, 1999). In order to dispose of materials containing PCBs in a nonhazardous waste landfill, the concentrations must be below 50 mg/kg as per the requirements of the Toxic Substances Control Act (TSCA). Disposal of materials containing >50 mg/kg of PCBs in a hazardous waste landfill is expensive and also has the additional and potentially expensive complication of the long-term liability of those wastes. In order for the materials to be recycled or reused, which is a preferable option to landfilling from an environmental and economic standpoint, elevated concentrations of PCBs must be reduced in order to allow the materials be handled safely. For instance, scrap metal recovery ovens operating in conformance with 40 CFR 761.72(a) could be used for structures containing PCB concentrations greater than 500 mg/kg. However, the ovens are typically very small, and structures would have to be cut into small sections and a special permit for cutting the structures would be required due to the potential environmental and human exposure risks. There are few viable options, other than the use of the BTS technology, for removing and degrading PCBs from structures and equipment with coatings such as paint and adhesives utilizing an in situ approach. With BTS, PCBs are removed from the structure within hours and are degraded on site to benign end products. There are no future environmental liabilities associated with off-site disposal and no potential loss of PCB-containing materials to the environment during the removal or treatment process.
7
2.0 TECHNOLOGY DESCRIPTION
The following sections provide an overview of the technology (Section 2.1), technology development (Section 3.2), and advantages and limitations of the technology (Section 2.3).
2.1 TECHNOLOGY OVERVIEW
Research and development work at NASA-KSC and UCF has led to the development of a BTS comprised of elemental magnesium (Mg) coated with a small amount of palladium (Pd) that is utilized in conjunction with a solvent solution capable of donating hydrogen atoms. BTS as a treatment technology has two functions: (1) to extract the PCBs from weathered coating materials and other PCB-containing materials such as insulation, rubber gaskets, and asphaltic compounds and (2) to degrade the extracted PCBs (Figure 1). BTS can be used in a one-step process with the paste, including the active metal reductant, being applied to the surface of the material to be treated. The PCBs are extracted from the material being treated by the solvent paste and the PCBs are degraded by the metal reductant within the paste. The BTS can also be use in a two-step process where the solvent paste is applied to the surface to be treated but the paste does not contain the active metal. PCBs are extracted from the material being treated, the paste is removed, and the active metal reductant is added to the paste in a separate container to perform the degradation step. Figure 2 is a schematic that shows these two methods.
One-Step Process of Extraction and Treatment in Applied Paste
Figure 1. Schematic showing the one-step-process method of applying BTS. The extraction and degradation of the PCBs occurs in this one step
using an active (metal-in) paste.

8
Two-Step Process of Extraction of PCBs into Solvent Paste and then Treatment of the Solvent Paste
Figure 2. Schematic showing the two-step-process method of applying BTS.
In this method the extraction is the first step using an inactive (no metal) paste that extract the PCBs. The paste is then removed and put into a container where reactive metal is mixed into the
inactive paste and the degradation step proceeds. The process for removing PCBs from any type material is accomplished as an independent step to the degradation process. With painted material, the goal is to remove the PCBs from the paint without destroying the paint and collect the PCBs in an environmentally friendly solvent. For some materials being treated, the removal of PCBs may cause a degradation of the materials (e.g., loss of flexibility in caulking materials) making reuse of the material difficult. PCBs are extremely hydrophobic (organophilic) and will partition strongly into the BTS from hardened paint or binder material. The solvent assists in opening, but not destroying, the paint’s polymeric lattice structure, allowing pathways for PCB movement out of the paint and partition into the solvent. The Mg/Pd bimetallic reductant and catalyst system is a potent dechlorination reagent capable of removing the chlorine from high concentration solution of chlorocarbons in minutes (Engelmann, 2003). It is hypothesized that the interaction of the bimetallic Mg/Pd system with a solvent containing available hydrogen moieties (i.e., alcohols) results in the generation of atomic hydrogen at particular sites on the metal surface. The bound atomic hydrogen is available for reaction with PCB molecules in solution yielding a reductive dehalogenation reaction.
2.2 TECHNOLOGY DEVELOPMENT
In 2004, NASA-KSC began investigating the potential of using a solvent-based system to remove PCBs found in paints on a number of structures at three of their operating centers. This innovative research was initially funded by NASA’s Environmental Program Office and NASA’s Office of Space Flight. The funding included preliminary proof-of-concept laboratory research and the demonstration of a BTS on painted parts containing PCBs set aside from

9
NASA’s LUT at KSC. Data indicated that significant if not complete PCB extraction and degradation from paint chips containing as high as 11,000 mg/kg total PCBs could be achieved with as little as 48 hours of exposure. The original BTS formulation developed by NASA-KSC and UCF was intended for application to structures that were dismantled and could be treated by immersion of parts of the structures into a liquid treatment bath. In order to treat structures that were not scheduled to be demolished, a treatment system capable of being “painted on and wiped off” was needed. In response to this need, further formulation work was conducted in 2004 and 2005 and an improved formulation of BTS was developed and tested in the laboratory at Marshall Space Flight Center in Huntsville, AL, using LUT components. This formulation used a thickened paste BTS system rather than a liquid emulsion-based system to allow the BTS paste to be applied directly to structures in their original location. The data from testing BTS paste suggests that for painted structures the paste (1) is an easier and safer form of BTS to manufacture, (2) can be painted on and wiped-off, and (3) is effective in removing PCBs from the coating material. The technology was further developed with the ESTCP funding for this project. A BTS formulation that can be effectively applied using either a paint sprayer or hand application (trowel) and then sealed with either a VP or silicone sealant was developed. BTS was applied to a variety of painted materials (concrete, metal sheeting, metal tanks, and machine parts) with a large range in PCB concentrations. The BTS application and handling process was developed with appropriate on-site safety protocols for institutions to implement during its application. Full-scale costs and performance reports were developed for DoD facility end users to utilize when addressing PCBs found on existing structures. Further details on the development of the technology are provided in the Final Technical Report (RC-200610, 2010).
2.3 ADVANTAGES AND LIMITATIONS
A number of options can be considered for disposal of structures containing PCB-laden materials (such as paints). The following is a list of alternative remediation or disposal options that may be considered for PCB impacted structures:
1. Nonhazardous state-approved landfill (performance-based disposal). In this option, PCB concentrations must be less than 50 mg/kg.
2. Hazardous waste landfills (performance-based disposal). These landfills can accept material with higher concentrations of PCBs, but the costs for disposal of material at hazardous waste landfills can be very high and this option may be cost-prohibitive for large structures. This option does not eliminate the long-term environmental liability associated with the material.
3. Smelters (performance-based disposal, decontamination provisions). Metal may be recovered by recycling that material at metal smelters. The concentrations of PCBs on structures to be smelted must be less than 500 mg/kg. If the structures must be cut into manageable sizes, a special permit is required to perform the cutting operations.

10
4. Scrap metal recovery ovens (decontamination provisions). Metal may also be recovered by recycling at scrap metal recovery ovens. This option can be used for material containing PCB concentrations greater than 500 mg/kg; however, the ovens are typically very small, and structures would have to be cut into extremely small sections. A special permit for cutting the structures would be required.
5. Physical removal of paint. Paint containing PCBs can be removed from surfaces using approaches such as (1) sandblasting, (2) water blasting, or (3) chemical paint removers and physical scraping. Sandblasting and water blasting may be difficult to control in the open and could result in the release of PCBs into the air or onto surrounding natural media. Chemical paint removers typically contain hazardous chemicals. All these options still require disposal of the PCB-laden material removed from the surfaces. If the PCBs have migrated into the surface in contact with the paint (concrete), then the surface must be scarified to remove the impacted building material.
The BTS technology that was tested in study provides an effective process to remove PCBs from structures and degrade them without transportation to another location. The main advantages of the BTS technology over other treatment technologies include:
Potential for lower overall costs than alternative approaches in some situations
Elimination of long-term liabilities because PCBs are destroyed rather than being transferred to another medium
Ability to destroy PCBs on site without the need to transport the PCB containing material from the site
Ability to treat PCBs without needing to destroy the building or structure so that the option exists for reuse of the building or structure.
The main limitations of using the BTS technology are:
It may be difficult to effectively and quickly distribute the viscous BTS to all surfaces impacted with PCBs, especially if they are on irregular surfaces (machine parts, painted pipes running along walls or ceilings). If applying BTS in cold temperature where the paste is more viscous, it may not be possible to apply BTS using a spray application and will need to be applied using a trowel.
The application of BTS to paints and binder materials containing PCBs does have the potential to alter the adhesive qualities of the material while removing and degrading the PCBs. It may not always be possible to leave paints in place and have them function as an effective coating material. Paints, caulking materials, or binders containing PCBs may require reapplication of a new coating after the application of BTS.

11
3.0 PERFORMANCE OBJECTIVES
Primary and secondary performance objectives were developed and evaluated using either qualitative or quantitative performance criteria to determine success. The performance objectives are provided in Table 1. The primary objectives are discussed in detail in Sections 3.1 to 3.5, and the secondary objectives are discussed in Section 3.6.
3.1 DISTRIBUTION AND ADHERENCE OF THE BTS
One of the qualitative performance objectives is that the BTS applicator is able to evenly distribute the paste on the surface to be treated. The metric was evaluated by assessing the adherence of the BTS to an object in a 0.25- to 0.5-inch layer over the time period of exposure to treated surfaces. BTS paste was applied to surfaces to be treated using two types of application methods and its thickness estimated. The paste was visually inspected periodically (every 2 to 5 days for the first week and then weekly for up to a month) to determine if it was able to adhere to the surfaces (both vertical and horizontal treated surfaces) by inspecting for leaks, sections of paste pulling away from the surface, or bubbling up off the surface. This objective was met. BTS was applied using a spray applicator and hand trowel application method. These results are discussed further in Section 6.1.
3.2 ADHERENCE OF SEALANTS
The BTS, once applied, needs to be sealed for the duration of the treatment. The purpose of the sealant is to keep the ethanol-limonene solvent from evaporating. Evaporation of the solvent must be prevented or at least the rate of evaporation reduced so that the paste remains moist. PCB removal from the paint as well as degradation stops if the paste dries. It was decided that a sprayable sealant would be the easiest to apply to cover large surface areas and uneven or complicated (multiple folds or layers such as pipes, pieces of equipment, etc.) surfaces. The metric was evaluated by assessing the adherence of the sealant to the BTS, the ability to apply the sealant evenly over the surface of the paste, and its ability to dry to a non-tacky, nonporous layer that reduced volatilization of BTS solvent. Two sealants were tested: (1) a VP truck bed liner and (2) a Sil. This objective was met using both sealants. Both sealants were able to provide an effective seal to minimize ethanol evaporation from the BTS paste for the 3 weeks of application. These results are discussed further in Section 6.2.

12
Table 1. Performance objectives.
Performance Objective Performance Metric Data Requirements Success Criteria Results
Qualitative Performance Objectives Ease and versatility of application of BTS
Adhering to object in a 0.25- to 0.50-inch layer
Measuring layer thickness with a calibrated probe and visual inspection of adherence
Ability to apply BTS to different shaped surfaces using different application technique and have it adhere evenly
Criteria met – (see Section 7.1 for details)
Ability to seal BTS after application
Adhering to BTS and drying to non-tacky, nonporous layer
Samples will be taken every week and/or visual and manual inspections conducted to verify BTS solvent content of paste (see Table 3 for analytical methods)
Ability to apply surface coating over BTS such that volatilization is minimized
Criteria met – (see Section 7.2 for details)
Paint adherence post BTS application
Impact to paint adherence Using an ASTM pull-test procedure and visual inspection of paint condition
BTS will have minimal effect on painted surface. Structure of paint will maintain basic adhesive properties.
Criteria partially met – (see Section 7.3 for details)
Ease of use Ability of a technician-level individual to use the technology
Feedback from the technicians on usability of the BTS paste and sealant
BTS will be relatively easy to handle and apply in the field with proper operator training.
Criteria met – (see Section 7.3 for details)
Quantitative Performance Objectives Reduce PCB concentrations in paint
mg/kg PCBs. Remove samples and analyze for PCBs
Pre- and post-BTS application sampling and analysis (See Table 3 for analytical methods)
Reduction in PCB concentrations in treated paint to less than 50 mg/kg in no less than two applications of BTS
Criteria partially met – dependent on starting PCB concentrations (see Section 7.4 for details)
Reduce PCB concentrations in paste
mg/kg PCBs. Remove samples and analyze for PCBs
Pre- and post-BTS application sampling and analysis (See Table 3 for analytical methods)
Reduction of PCB levels within BTS to less than 50 mg/kg in no more than 30 days
Criteria partially met – (see Section 7.5 for details)
Notes: ASTM - American Society for Testing and Materials

13
3.3 EASE OF IMPLEMENTATION
The ease of use of this technology was evaluated based on our experience in the field. The implementability was evaluated by the qualitative assessment of the ease with which the operator was trained to handle and apply both the paste and the sealant in the various field situations. This objective was met with respect to both the ease of handling and applying both the paste and sealant on the various surfaces and locations that were treated. These results are discussed in greater detail in Section 6.3.
3.4 REDUCTION IN PCB CONCENTRATIONS IN TREATED PAINT TO LESS THAN 50 MG/KG
A key performance objective is the reduction of PCB concentrations in the treated material to less than 50 mg/kg. The metric was evaluated by collecting samples of the paint pre-BTS application and then weekly for up to a month for analysis of PCB concentrations. This was a destructive analysis and was done on one section of the test area on a weekly basis until all sections had been analyzed. This objective was partially met. One application of paste was effective in achieving this target after only one week of treatment in all cases where the starting concentration in the paint was less than approximately 500 mg/kg, especially if the surface being treated was metal and not concrete. In cases where the starting concentrations in the paint were greater than 500 mg/kg, significant reductions (93%) in PCB concentrations were achieved but more than one application of paste is necessary to reduce concentrations below 50 mg/kg. These results are discussed further in Section 6.4.
3.5 REDUCTION IN PCB CONCENTRATIONS IN BTS PASTE TO LESS THAN 50 MG/KG
The reduction of PCB concentrations in the paste to less than 50 mg/kg is another key performance objective. The metric was evaluated by collecting samples of the paste weekly for up to a month for analysis of PCB concentrations. This was a destructive analysis that was done on one section of the test area on a weekly basis until all sections had been analyzed. For BTS that did not contain the activated metals for degradation (non-active paste) a subset of the paste sample was analyzed for PCBs and then the activated metal and, if necessary, additional ethanol, were added to the non-active paste to promote degradation (post-application activated paste). Samples of the post-application activated paste were then analyzed for PCB concentrations. This objective was partially met. For the active paste (metal in the paste) if the starting paint concentrations were below roughly 2500 mg/kg, then the concentrations in the paste were less than 50 mg/kg with the one exception of where concentrations were still slightly above the 50 mg/kg target. If the pretreatment paint concentrations were very high (>20,000 mg/kg) then the active metal paste was not able to degrade all of the PCBs in the paste to below 50 mg/kg although degradation did occur in the paste. Even when Mg/Pd and additional ethanol was added in the laboratory to the active paste that had been exposed to the very high starting concentrations, it was not possible to get the concentrations in the paste to below 50 mg/kg after 21 days.

14
For the non-metal (NM) paste, which was activated in the lab after removal from the field by the addition of ethanol and the active metal (Mg and acid or Mg/Pd), the concentrations were reduced to below 50 mg/kg for all samples using the acidified ethanol and Mg and/or ethanol and the Mg/Pd. Further discussion on this objective is presented in Section 6.5.
3.6 IMPACT TO PAINT ADHERENCE
One of the secondary objectives was to evaluate the impact to the paint adherence after exposure to BTS. The metric was evaluated by visually assessing the condition of the paint after BTS application as well as by using the field test for pull-off strength of coatings (ASTM D3359-02). When the paint at the Badger test sites was subjected to the ASTM D3359-02 procedure prior to application of BTS, the paint at all the test sites failed. Thus, the effect of BTS on the integrity of the painted surfaces at Badger could not be assessed. There were difficulties in using ASTM D3359-02 at the VIB on post-treatment samples due to preparation of the surface prior to testing, and ASTM D4541-02 was also used to evaluate the paint adherence for the VIB panels. This objective was not met in that BTS negatively affected the adherence and strength of at least the surface layer of paint. These results are discussed further in Section 6.6.

15
4.0 FACILITY/SITE DESCRIPTION
The BTS technology demonstrations were conducted at two DoD facilities: (1) the VIB at the CCAFS, FL, and (2) the Badger, Sauk County, WI. A third demonstration site was evaluated, the ex-USS Charles F. Adams in Philadelphia, PA, which is part of the Navy Inactive Ships Program. Samples of painted metal, caulking, wire insulation material, and gaskets were collected in February 2007 and indicated that none of the materials tested contained PCBs at high enough concentrations to warrant a demonstration of the BTS technology. Therefore, the funds that were to be used to perform the field demonstration at this site were instead used to develop a methodology to apply a variation of BTS to treat PCB-impacted oil from U.S. Naval Ship Repair Facility and Japan Regional Maintenance Center (SRF-JRMC), located in Yokosuka, Japan.
4.1 VERTICAL INTEGRATION BUILDING
The VIB was located at the CCAFS, FL. Facility 70500 (VIB) was built in 1964 and was used in support of the U.S. Air Force Titan Missile Program, which ceased launch operations in 2005. The entire VIB facility was scheduled to be dismantled in 2007. As part of the dismantlement efforts, conventional and explosive demolition approaches were planned for the VIB, an approximately 98,990 sq ft steel framed facility with an 18-level high bay extending to a height of over 230 ft. Portions of the paint on the steel in the VIB High Bay area were documented to contain PCBs greater than or equal to 50 mg/kg that were presumably added during manufacture or the original construction in 1964. The VIB deactivation included the demolition, recycling, or disposal of the entire VIB facility. As part of the demolition efforts, steel components with PCB paint concentrations in excess of 50 mg/kg were handled as bulk product waste in accordance with USEPA TSCA requirements. The dismantling of the VIB was expedited and started in late May of 2007 due to concerns with building structural integrity in the upcoming hurricane season. Advance notice was provided to the research team to allow for the arrangement of sufficiently large sections of the painted structures to be removed and transported to Hangar S Storage Building #66232 at CCAFS/KSC for testing (approximately 5 miles from the VIB). The building components that were to be treated were from inside the structure and as such had not been exposed to significant weathering due to sun or rain exposure. The components that were treated during the demonstration (large sections of painted I-beams or similar structural sections) were removed from the VIB structure and treated within Hangar S to maintain a similar environmental setting. Care was taken when removing the structural components of the VIB that were tested to ensure that no damage was done to the paint on the sections to be tested.
4.2 BADGER ARMY AMMUNITION PLANT
The Badger is located on the eastside of US 12, south of Baraboo and north of Sauk City in Sauk County, WI. Badger was established in 1942 and operated intermittently over a 55-year period to produce single- and double-base propellants for cannon, rocket, and small arms ammunition. Plant operations were terminated in March 1975 and all production facilities and many support functions were placed on standby. In 1997 the Army determined that Badger was no longer necessary for national defense. Future reuse, ownership, and management of the Badger facility

16
depends on the level and extent of explosive decontamination that can be achieved by the U.S. Army. The contamination that needs to be addressed is the removal, by open burning or “flashing,” of explosive potential from the buildings that were exposed to open, uncontained explosives. Those explosives include nitrocellulose and nitroglycerine. The explosive potential is due to the residual explosives that fell on floors, collected in concrete pores, settled or condensed onto pipes, beams and equipment during production of ammunition (Plexus Scientific, 2002). Further investigation into the buildings and equipment that needed treatment indicated the presence of PCBs in the paint on the structures and equipment. The concern with the PCBs is that the open burning will not produce a sufficiently hot enough flame to destroy the PCBs thus releasing PCBs into the atmosphere and possibly leaving residual PCBs in the burn residue. The building components that were treated are from both inside and outside the structures at the site and as such some had not been exposed to significant weathering due to sun or rain exposure, and other components were highly weathered. Prior to the Badger facility being selected as one of the BTS test sites, the Army conducted an extensive testing program for the purpose of determining the level and location of heavy metal and PCB contamination. This surveillance program documented that high levels of PCBs were present at several locations at the Badger site. For example, the rocket propellant press house buildings had PCB levels as high as 11,000 mg/kg in the painted surfaces of the concrete structure. Some of the painted pipes and tanks of the nitroglycerine Nitrating and Separator houses had as much as 59,000 mg/kg of PCBs in the paint. The buildings and materials that were treated at Badger are no longer in use and are scheduled for demolition, recycling, or disposal.
4.3 JAPANESE MACHINE OIL SITE, YOKOSUKA, JAPAN
A Navy operation located in Yokosuka, Japan has a series of machines for operations in milling and cutting industrial materials. Over the years, oils containing PCBs have been used for lubrication in these machines, and during this time, PCBs have contaminated the interior of the surfaces of the equipment, including seals and gaskets. Attempts have been made to “clean” the PCBs out of the equipment by replacing the contaminated oil with new oil (wash oil) but a PCB concentration above the regulatory limit (Japanese limit of 0.5 mg/kg) persists even in the new oil. Materials or equipment containing oils or fluids that exceed the maximum PCB concentration of 0.5 mg/kg will not be allowed into the Japanese economy and must be excessed or disposed via the United States economy. Facilities managers are exploring options to treat PCB-containing oils and fluids so excess equipment can be released locally rather than requiring costly shipment to United States jurisdiction. UCF obtained a limited amount of lubricating oil from several milling and cutting machines owned by the U.S. Navy. The funding from this project was used only to refine the methodology for treating the PCBs in the oil through laboratory testing. There was no field testing component to this portion of the project. The development of the methodology for treatment of PCB impacted oil was not part of the original project and therefore was not part of the Demonstration Plans. Rather than trying to fit the description of the work plan and results in the structure of the body of this report, the Final Report for Development a Field Deployable Methodology for Safely and Effectively Degrading PCB Contaminated Oils and Machine Shop Equipment Located at the U.S. Navy Shipyard in Yokosuka, Japan, is included as Appendix of the Final Technical Report (RC-200610, 2010).

17
5.0 TEST DESIGN
This section provides the detailed description of the system design and testing conducted during the demonstration.
5.1 CONCEPTUAL EXPERIMENTAL DESIGN
For this demonstration a set of baseline samples were collected from the demonstration sites to evaluate which materials contained PCBs and at what concentrations. Samples were collected of the PCB-impacted materials (painted metal, concrete, and wood) and taken back to the laboratory to test the BTS formulation and sealant options. Once laboratory testing was complete, the field demonstration was conducted. Pretreatment samples were collected and then BTS was applied to the painted surfaces and sealed. Both active BTS paste (one-step processCpaste containing metal; see Figure 1) and non-active BTS paste (two-step processCno active metal in paste; see Figure 2) were used and two types of sealant were tested (VP truck bed liner and a Sil). Over a 3-week period, sections of BTS were then removed and samples of the paint, BTS, sealant, and concrete were collected and tested for PCBs.
5.2 BASELINE CHARACTERIZATION AND TREATABILITY STUDY RESULTS
5.2.1 Vertical Integration Building
The VIB deactivation included the demolition, recycling, or disposal of the entire VIB facility. As part of the demolition efforts, steel components with PCB paint concentrations in excess of 50 mg/kg were handled as bulk product waste in accordance with USEPA TSCA requirements. The VIB is located approximately 10 miles from the NASA laboratory where the treatability testing was being conducted, so rather than collecting samples for work in the laboratory, BTS was applied to small sections of the infrastructure at the VIB itself. Samples of paint were collected from the structural components (I-beams) and taken to the NASA laboratory for PCB testing. Samples of the structures to be treated, sections of painted materials, were used to determine the range of PCB concentrations. BTS was then applied in situ on small sections of the painted metal beams to determine the optimal BTS formulation, and the residual PCB concentration after BTS was applied. The conclusions made based on the results of the laboratory treatability study are presented below.
There is a large variability in the PCB concentrations in paint that is visually the same and collected from similar sections or structural components of the building.
There were issues working in the building while it was under demolition (lack of power, access restrictions), and the BTS paste in the in situ tests was not completely sealed (the VP liner was applied in too thin a layer).
Despite less than optimal seal, PCBs were extracted from the paints before the paste dried out.
A series of sealant tests were also conducted in the KSC paint booth testing room, located behind the KSC laboratory. The tests were conducted using the Sil, and

18
this material was able to provide an adequate seal and maintain the moisture in the BTS paste for the duration of the test (over a week).
Tests were conducted on the application of BTS paste using a textured spray apparatus similar to those used for drywall installation. Using this method, an even ¼- to ½-inch layer of BTS paste could be applied on a vertical metal surface.
5.2.2 Badger Army Ammunition Plant
In November of 2006, NASA and the UCF team members traveled to Badger to collect samples from previously identified locations of PCB contamination. The purpose of the visit was to take samples of material that could be tested in the laboratory with BTS to establish the optimum formulation and conditions for PCB degradation. During the November 2006 visit to Badger, samples were collected from six major PCB contaminated sites. These sites consisted of two press houses, Buildings 6810-11 and 6810-36; a wooden rest house, Building 6815-08; a nitrating house, Building 6657-02; a roll house, Building 687-20; and various parts collected from presses located in the staging area. Based upon analysis and treatment of the collected samples, it was decided that field testing of the BTS technology would be focused on only four locationsCpress houses 6810-11 and 6810-36, the nitrating tanks in 6657-02, and the press staging area. The following conclusions were made based on the results of the laboratory treatability study.
PCB concentrations in paint were higher than had been tested previously with BTS.
A sprayable sealant was selected because of ease of application and of the many tested; the VP truck bed liner was selected as the best sealant. The Sil was tested at the VIB and therefore not on the Badger samples.
It was determined that applying BTS on porous surfaces such as wood and concrete that is not completely sealed with paint resulted in the loss of ethanol from the paste into the treated surface. This resulted in a modification of the paste to include an absorbent material, sodium polyacrylate and cellulose pulp, in the paste to hold extra ethanol but maintain the paste consistency.
All of the previous tests with BTS paste were conducted at moderate temperatures between 23 to 27 °C. Because the average temperatures during the fall, winter, and spring at Badger are much lower than this, it was decided to conduct a series of tests on the Badger samples at lower temperatures. It was determined that BTS could perform PCB extractions at lower temperatures but that the rate of extraction might be slower.
5.3 DESIGN AND LAYOUT OF TECHNOLOGY COMPONENTS
BTS used in the field was the same as that used in the laboratory treatability tests. BTS was composed of 95% ethanol and 5% limonene by volume. The mass percentages for the formulations using an active paste are presented in Table 2. A maximum of 20 gal of BTS was applied on the structural components from the VIB and 20 gal at Badger. These estimates were
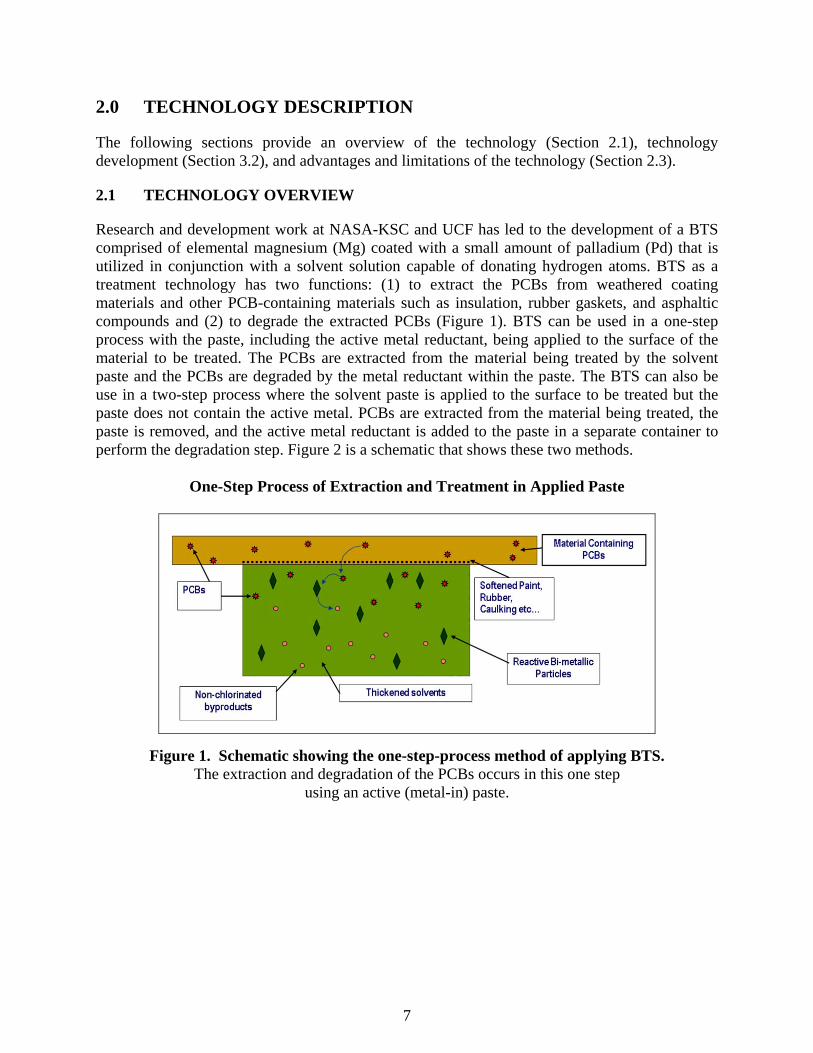
19
based on the results of the treatability testing done (thickness of BTS applied), including a safety factor. The amount of BTS applied is a function of the covering rate and is not a function of the reaction kinetics, with the exception of needing to apply a second coat if degradation is not complete after approximately 3 weeks.
Table 2. BTS ingredients (including %) for active paste.
Component Weight % Sodium polyacrylate 3.4 Cellulose pulp 3.4 Glycerin 14.8 Calcium stearate 6.8 Polyethylene glycol 8000 3.4 90% Ethanol - 10% limonene 58.2 Mg/Pd metal powder 10
In preparation for field-scale deployment, the catalyst was manufactured at UCF for inclusion in the BTS active metal paste. The Mg/Pd reductant/catalyst was manufactured using mechanical alloying techniques. There is no commercial vendor currently identified to produce the reductant/catalyst that has been developed; however, there are a number of potential milling vendors that have this capability for future large-scale production. Once the reductant/catalyst had been manufactured, the BTS reagent was prepared at KSC for the VIB demonstration. The BTS paste was prepared at UCF and shipped to Badger for application and evaluation by the research team. Structural components tested were oriented in both vertical and horizontal positions for application testing. BTS was applied using a texture sprayer and manually using a trowel to a minimum thickness of ¼ inch. Both the VP and silicone sealants were tested for sealing the BTS paste. For inactive paste, the BTS was removed at the end of 3 weeks, placed in a pail and shipped to UCF. Once in the lab at UCF, the inactive paste was activated in pails by adding Mg/Pd in an ethanol solution. If moisture levels declined significantly, additional solvent was added to the BTS. The number and location of BTS application area for each test structural sample varied based on the size and shape of the structural samples available for testing and other site constraints.
5.4 OPERATIONAL TESTING
There were two main operational phases to this technology demonstration: the in situ field demonstration and the follow-up laboratory testing for paste optimization. The field application for both sites involved baseline sampling, BTS paste application, and performance monitoring at 1, 2, and 3 weeks after BTS application (one structural component from the VIB site was monitored at 4 weeks post-BTS application). All components that were to be tested (paint, paste, sealant, and concrete) were taken back to the laboratory at UCF for PCB analysis. All the paste and sealant that was applied at the field sites was removed; no equipment or materials were left at the field sites.

20
5.5 SAMPLING METHODS
Prior to treatment, predemonstration samples of paint were collected from each section that was to be tested. Samples were also collected after 1 week, 2 weeks, and 3 weeks of treatment to evaluate the performance. Samples of the paint from each component that was tested (painted metal or concrete) were obtained via the cold-scraping method in order to accurately determine the starting concentration levels of PCBs in the paint. In accordance with ASTM E1729-05, paint samples were collected for analysis using the cold-scraping method with a metal chisel or equivalent scraping tool. Sample bags were attached to the surface with tape below (vertical surfaces) or adjacent to (horizontal surfaces) the section of paint to be sampled. Care was taken to collect all the paint scrapings in the sample bag, which was then sealed and labeled with the date, contents, and sampling location. Predemonstration sample locations are shown on Figures 3, 4, 5, 6, and 7.
5.5.1 Vertical Integration Building
Based on the predemonstration laboratory testing that was conducted on paint samples from structural steel components within VIB and on the painted I-beams themselves within VIB, it was determined that a number of painted surfaces could be used to validate the efficacy of BTS to remove and degrade PCBs. All testing was done on portions of the structural components at least 3 inches from any cut edge or disturbed surfaces to minimize the risk of testing BTS on nonrepresentative materials. A variety of structures and surface features (vertical walls, horizontal) was treated. A grid was established on each of the different structural components for an overall treatment area of up to 100 ft2 to allow for the collection of ten predeployment samples and up to 30 post-BTS deployment samples (Figure 3). Each square of the grid was large enough to collect both a pre-BTS-deployment sample (Figure 8) and up to three post-BTS-deployment samples. BTS formulations were applied to the type of structural material where known values of PCBs in paint above 50 mg/kg had already been verified using a grid sampling technique described above. Once all predeployment samples were acquired, the structural components were coated with BTS using either the spray texture applicator or via manual application (Figure 9 and 10). BTS was then sealed with one of two spray sealants to minimize volatilization from the paste (Figure 11). Of the 100 ft2 area to be treated, 50% of the painted surface area was to be subjected to inactive BTS paste and 50% treated with active BTS. The BTS application technique ensured that a minimum BTS thickness of ¼ inch is achieved.

21
Figure 3. Sampling diagrams for test panels 1-6 and test I-beam 7.8.

22
Figure 4. Bunker/Press house 6810-11.

23
Figure 5. Press building 6810-36.

24
Figure 6. Nitrating house 6657-02.
25
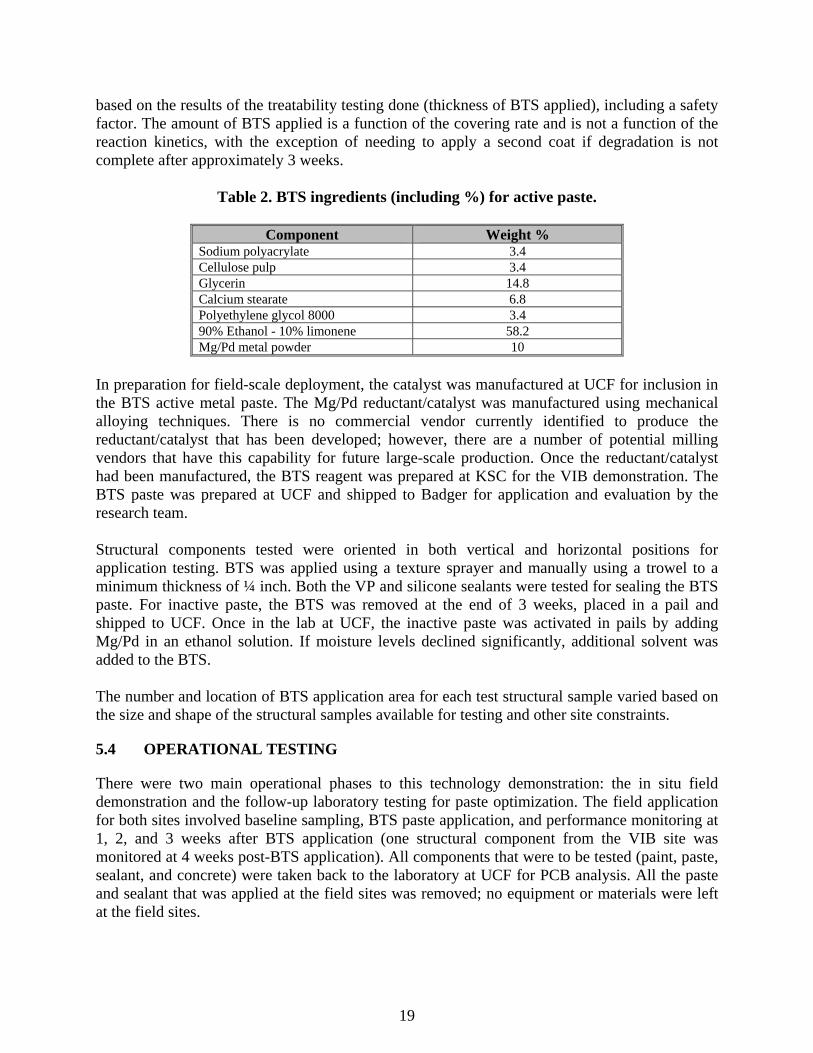
Figure 7. BTS paste applied to presses.

26
Figure 8. Representative quality of the paint in concrete bunker 6810-11.
Figure 9. PCB in paint concentrations after 1, 2 and 3 weeks of exposure to BTS. Average of samples (two samples at Week 1 and Week 2 and 10 to 20 samples at Week 3).

27
Figure 10. Average concentrations of PCBs in paint during treatment times of 0-3 weeks.
Figure 11. Average PCB concentrations in paint samples from 6810-36.

28
The treated structural components were monitored daily for the first week and then weekly for two to three additional weeks for moisture levels and sealant integrity. After 1 week, 2 weeks, 3 weeks, and 4 weeks, several samples of the paint, the paste, and the sealant from within the grid pattern were analyzed for PCB concentration in order to track extraction efficiency from the paint and degradation capability of the paste. After 4 weeks at VIB, all sealant and BTS paste was removed. The inactive paste and its sealant were placed in a drum or pail, shipped back to UCF, and the reductant/catalyst and additional ethanol were added to initiate PCB degradation in the recovered inactive paste. The active paste and sealant were subjected to analysis for PCBs in the NASA laboratory.
5.5.2 Badger Army Ammunition Plant
BTS formulations were applied to structural material at the four locations identified in the baseline testing (press houses 6810-11 and 6810-36, the nitrating tanks in 6657-02, and the press staging areaCFigure 4, Figure 5, Figure 6, and Figure 7, respectively) where known values of PCBs above 50 mg/kg have already been verified using the grid sampling technique described below. Once all predeployment samples were acquired, the structural components were coated with BTS using either the spray texture applicator or via manual application. A grid was established on each of the different structural components for an overall treatment area of up to 100 ft2 to allow for the collection of predeployment samples and post-BTS deployment samples (Figure 4, Figure 5, Figure 6, and Figure 7). Each square of the grid was large enough to collect both a pre-BTS-deployment sample and up to three post-BTS deployment samples. Of the area treated, one-third of the painted surface area was subjected to inactive BTS paste sealed with VP, one-third was subjected to active BTS sealed with VP, and one-third treated with active BTS sealed with the Sil. The BTS application technique ensured that a minimum BTS thickness of ¼ inch was achieved. In addition, at Badger, in order to evaluate the potential for the BTS to transfer PCBs from the paint into concrete, samples of concrete were collected prior to BTS application. The paint was scraped off of a roughly 1 inch section of concrete where the concrete was to be tested. A sample bag was the taped to the wall below the section to be tested to collect the concrete dust. An electric drill with a concrete drill bit was then used to drill out a section of the concrete to a depth of 3/8 inch. All the concrete dust from the drill bit was collected in the sample bag, which was then sealed and labeled with the date, contents, and sampling location. Samples of concrete to a depth of 3/8 inch were taken from each treatment location before and after 3 weeks of BTS treatment. The treated structural components were monitored daily for the first week and then weekly for 3 weeks for moisture levels and sealant integrity. After 2 weeks, several samples from within the grid pattern were analyzed for PCB concentration in order to track extraction efficiency from the paint. The BTS paste was also analyzed for PCB concentration. After 3 weeks, all sealant and BTS paste were removed and samples of the paint were taken. The inactive paste and its sealant were placed in a drum or pail, shipped back to UCF, and the reductant/catalyst and additional ethanol were added to initiate PCB degradation in the recovered

29
inactive paste. The active paste and sealant were subjected to analysis for PCBs in the UCF laboratory.
5.6 ANALYTICAL METHODS
Table 3 presents a summary of the analytical methods used in the demonstrations. Information pertaining to calibration of analytical equipment, quality assurance, decontamination, and sample documentation can be found in Appendix B and C of the Final Technical Report (RC-200610, 2010).
5.7 SAMPLING RESULTS
This section provides a summary of all sampling results. Section 5.6.1 provides the results of the adhesion tests; Section 5.6.2 provides the results of VIB; Section 5.6.2 provides the results of the Badger demonstration; and Section 5.6.3 presents the results of the paste optimization studies. Tables summarizing sampling results can be found in Appendix D of the Final Technical Report (RC-200610, 2010).
5.7.1 Adhesion Testing
Qualitative and quantitative analysis of the painted surfaces were performed following the application and removal of BTS from the different test panels at the VIB. Initially, a visual inspection indicated that the paint appeared to remain intact following exposure to BTS, however a closer look showed that the upper coat of paint was softened. This indicated that adhesion and integrity of at least the surface layer of paint was negatively impacted from exposure to the BTS solvent system. A qualitative method for measuring adhesion of coatings is ASTM D3359-02, in which pressure sensitive tape is applied and removed from cuts made into the coating surface. This consists of making an X-cut through the film to the substrate, followed by applying pressure-sensitive tape over the cut and removing it. A qualitative assessment of the adhesion is then made by visually inspecting the amount of coating removed by the tape and a score of 0 (complete removal) to 5 (no peeling/removal) is given. See Table 4. Untreated areas of panel 3 and 4 were tested as a control to determine the adhesion qualities of the paint prior to BTS exposure. Both panels (untreated) were scored a 5, indicating no peeling or removal of the paint upon removal of the pressure-sensitive tape as expected, since neither sample had been exposed to the paint softening effects of BTS. Treated areas of panels 3, 4, and 5 were tested using this qualitative method. These three samples showed varying amounts of impairment of the adhesion qualities of upper layer of paint. Initial testing seems to indicate a loss of adhesion to samples exposed to BTS.

30
Table 3. Summary of sample handling and laboratory analytical details.
Parameter Analytical Method
Method Number
Analytical Laboratory(1)
Quantitation Limit
Sample Container Preservative
Holding Time
PA
ST
E PCB and degradation
products in paste Gas chromatography
USEPA 8082
UCF/KSC 0.10 mg/kg Plastic bottle for collection/glass for extraction
None N/A
Moisture content of BTS
Visual inspection manual inspection
N/A N/A N/A N/A N/A N/A
PA
INT
PCB and degradation products in paint
Gas chromatography USEPA
8082 UCF/KSC 0.10 mg/kg
Plastic bottle for collection/glass for extraction
None N/A
Adhesion of paint Field test of pull-off strength of coatings
ASTM - D4541-02
N/A N/A N/A N/A N/A
SE
AL
AN
T
Sealant integrity Visual inspection N/A N/A N/A N/A N/A N/A
Paint and degradation products in sealant
Gas chromatography USEPA
8082 UCF/KSC 0.10 mg/kg
Plastic bottle for collection/glass for extraction
None N/A
Notes: N/A - Not applicable UCF - University of Central Florida KSC - Kennedy Space Center (1) 10% of the samples will be sent to a commercial laboratory (to be determined) for confirmatory analysis. TBD - To be determined

31
Table 4. Qualitative analysis of adhesion properties using ASTM D3359-02 for both treated and untreated sample areas.
Panel Treated Score
3 Yes 0 4 Yes 5 No 5
5 Yes 0 No 5
In several cases, tests were not deemed accurate due to an inability to form sufficient contact between the pressure-sensitive tape and coated surface, leading to a skewing in the results. It was decided that a second test method should be employed to further evaluate the effects of BTS on the adhesion of the paint. A quantitative analysis method of adhesion properties is given in ASTM D4541-02. A loading fixture is affixed to the sample site using an epoxy adhesive. The final values are presented as force (psi) required to remove the loading fixture from the coated material. Quantitative assessments are made to the amount of material affixed to the loading fixture. This data is presented in Table 5.
Table 5. Quantitative analysis of adhesion properties using ASTM D4541-02 for both treated and untreated sample areas.
Sample ID Treated (Y/N) Force (psi) Comments
3-1a Y 459.77 N 329.15 Overspray from coating may have affected adhesion
3-1b Y 845.48 Poor coating caused BTS to dry out quickly
4-5a Y 208.74 N 1353.64
4-5b Y 157.72 N 382.21 Didn’t removal all paint, possibly poor adhesion
5-1 N 804.66 5-7 N 1282.21
7-1a Y 196.50 N 761.81
7-1b N 623.03
Less force was necessary to remove the loading fixtures after BTS application had occurred compared to the force necessary to remove the fixtures from untreated samples. A few samples didn’t follow this trend, but this was likely due to the sample surface not being properly prepared, resulting in an incomplete bonding of the epoxy material used. This is indicative of loss of the adhesive forces between the surface coat and material below the surface. It is interesting to note that in the majority of the tests (both qualitative and quantitative) the loss of adhesion was found to occur primarily between the surface coat and the primer coat. The primer coat itself remained intact after prolonged exposure to BTS, indicating that the majority of structural integrity loss is occurring within the surface coat. It may be that while the surface coat may need reapplication post-exposure to BTS, the primer coat would be suitable for use without removal or replacement. Qualitative and quantitative analysis of painted surfaces at the various Badger test sites were to be performed following the application and removal of BTS from the
32
test surfaces. Initial visual inspection of the painted surfaces at the four different test sites, two concrete press bunkers, the nitrating house, and the staging area indicated that the paint was in poor condition prior to treatment with BTS. Significant peeling and flaking of the paint was evident at each of the test sites. Figure 8 gives a representative view of the quality of the paint in the concrete bunkers. As with the VIB, ASTM D3359-02 was used to evaluate the adhesion of the paint pre- and post-treatment. However, when the paint at the Badger test sites was subjected to this procedure prior to any exposure to BTS, they all failed (all scored 0). Thus, the effect of the BTS on the integrity of the painted surfaces could not be assessed.
5.7.2 Vertical Integration Building
Pre-demonstration PCB concentrations in the VIB samples ranged from ~10 to ~100 mg PCB/kg paint, and all samples tested were identified as PCB congener mix 1260. The data clearly shows that high levels of removal of PCBs from the paint were achieved with both the active and inactive paste formulations (Figure 9). The average removal of PCBs from the paint from the entire test site was nearly 80% with a single application. Several samples were remediated to below PCB detection limits. The loss of PCBs in the paint and the presence of PCBs within the BTS confirm the technology’s ability to remove chlorinated contaminants from building materials such as paint to below 50 mg/kg. However, even though we can say BTS efficiently removes PCBs from the paint, it is difficult to make a quantitative analysis of this removal capacity from an examination of the paste due to the low levels of PCBs originally found in the VIB paint (and consequently in the BTS material). The low levels found within the paste are not surprising considering the relative volumes of treated paint and BTS used (thin layer of paint, thick layer of paste resulting in dilution of the PCB concentrations). Dechlorination of the original PCB envelope (mixture of PCB congeners) was demonstrated by the formation of the lower chlorinated by-products and a corresponding PCB envelope shift. Results from the Badger demonstration, where starting concentrations of PCBs in the paint and subsequently in the paste were higher, are presented in Section 5.7.3.
5.7.3 Badger Army Ammunition Plant
PCB Analyses The PCB concentrations in the paint located at the different treatment sites at Badger at times of pre-demonstration, and after 1, 2, and 3 weeks of treatment are shown in Figures 10, 11, 12, and 13. As can be seen from the data, the major drop in PCB concentration occurs in the first week. The concentrations of PCBs in the paint do not change significantly between Week 1 and Week 3.

33
Figure 12. Average PCB concentrations in paint samples from 657-02.
Figure 13. Average PCB concentrations in paint samples from various staging area
equipment at Weeks 0, 1, and 3 after BTS exposure.

34
PCB concentrations in paint in Building 6810-11 were between 1800 mg/kg and 3880 mg/kg in the pre-demonstration samples. Post-treatment concentrations (1 to 3 weeks of treatment) in paint were between 96 mg/kg and 200 mg/kg. PCB concentrations in paint in Building 6810-36 were between ~400 mg/kg to as high as ~900 mg/kg prior to treatment. Post-treatment concentrations in paint were between 96 mg/kg and 200 mg/kg. In Building 6657-02, PCB concentrations in paint were between 20,000 mg/kg to as high as 33,000 mg/kg prior to treatment. These are the highest PCB concentrations that the BTS paste has ever been tested on. Post-treatment concentrations in paint were between 10,000 mg/kg and 16,000 mg/kg. The PCB concentrations in the pre-demonstration paint samples collected from the presses in the staging area were between 10 mg/kg and 160 mg/kg. The PCB concentrations in the paint on the presses are much lower than those that were observed at other test locations on the walls and on the tanks. At all the sample sites that were treated, the PCB levels were reduced to very low levels, below the regulatory limit of 50 mg/kg after only one week of exposure. The target of 50 mg/kg in the paint was not achieved with high starting concentrations (>1500 mg/kg) in the paint because the PCBs extracted into the paste exceeded the degradation capabilities of the Mg/Pd and then the paste became saturated with PCBs. The paste was no longer able to further extract PCBs from the paint. It may require multiple applications to get all concentrations below 50 mg/kg with starting concentrations above 1500 mg/kg. Also, when the paste was applied to a porous surface such as a concrete wall with poor paint coverage, the amount of ethanol available in the paste was reduced due to some loss of ethanol to the concrete. This can been seen by comparing the similar starting concentrations of PCBs in the painted concrete in Building 6810-36 and the painted metal presses, but the paste wasn’t able to reduce the concentrations as effectively in the painted concrete. In addition, there were issues with some of the sealant performance at the low temperatures that added to the inability to meet the 50 mg/kg target in the pain. Observations during this demonstration suggest that the low winter temperatures during the demonstration at Badger caused cracking in the sealant and made it difficult to control evaporation of the solvent. It is recommended that future applications not be conducted during cold winter months. The BTS paste was also analyzed for PCB concentrations after application and removal. Samples of BTS paste were collected from each test location at the same time after treatment that paint samples were collected. The data from these analyses is plotted in Figures 14, 15, 16, and 17.

35
Figure 14. Average PCB concentration in paste for Weeks 1-3.
Figure 15. Average PCB concentrations in paste sampled at Weeks 1-3 after BTS application.

36
Figure 16. Average PCB concentration in pastes from building 6657-02 for Weeks 1-3.
Figure 17. PCB concentration in paste from staging area (all presses) for Weeks 1 and 3.

37
The PCB concentrations in the Mg/Pd BTS were lower than the NM paste. This is as expected because the active Mg/Pd particles are continuously degrading PCBs as they enter the paste. The concentrations of the PCBs in the paste are those that were present in the paste soon after the samples were collected and returned to UCF for analysis. The PCB concentration in the paste continued to increase in Weeks 2 and 3 even though few or no additional PCBs were being removed from the paint. It is believed that there was still some solvent evaporation from the paste over time and after sampling, which led to a concentrating effect. Because the PCB concentration in paste is reported on a weight basis, as the solvent in the paste evaporates, the PCB concentration increases. Samples of concrete were taken prior to treatment and after three weeks of treatment to determine if the BTS paste would transport any PCBs into the concrete. The samples were taken from the surface (after paint removal) to a depth of d inches into the concrete at several locations in the 6810-11 and 6810-36 test area. The data suggest that BTS paste does not transport PCBs from the paint into the concrete but rather transports PCBs from the concrete into the paste. This property of BTS paste has also been observed and confirmed in laboratory studies.
Building 6810-36 Concrete Pre-Treatment Post Treatment
Sample ID Active (Y/N)
Conc (mg/kg)
TR AVG
STD DEV
Treatment Time (wks)
Conc (mg/kg)
TR AVG
STD DEV
Average %
RemovalMgPd Sil 1 wk concrete Y 85
139 49
1 17
18 3 87% MgPd Sil 1 wk concrete Y 110 1 16 MgPd Sil 1 wk concrete Y 183 1 23 MgPd Sil 1 wk concrete Y 178 1 17 MgPd VP Concrete Y 50
59 18
3 10
20 10 66%
MgPd VP Concrete Y 60 3 37 MgPd VP Concrete Y 43 3 16 MgPd VP Concrete Y 39 3 15 MgPd VP Concrete Y 75 3 28 MgPd VP Concrete Y 84 3 14
Notes: AVG - Four to six samples were taken from the same sample container, extracted separately, and analyzed; these numbers are averaged. mg/kg - milligrams per kilogram Mg/Pd - magnesium/palladium Sil - silcone sealant STD DEV - standard deviation of data set TR AVG - treatment average VP - vinyl polymer sealant
Both the VP and the Sil sealants from the Badger test sites were removed and returned to UCF for analysis. Analysis of the sealant samples showed that there were no detectable PCBs found in any of the sealant.
5.7.4 Paste Optimization Studies
As discussed in previous sections of this report, all the BTS paste that was used in the Badger field test was returned to UCF for further study. Two types of paste were used in the field test, one contained Mg/Pd particles (Mg/Pd BTS) and the other contained no metal particles (NM BTS). Immediately after the paste samples were returned to UCF, they were analyzed for PCB

38
concentrations. Samples of the paste that contained more than 10 mg/kg of PCBs were chosen for further degradation studies. The additional degradation studies involved adding ethanol containing 1% acetic acid to the paste to re-wet the Mg/Pd containing paste. Sufficient acidified ethanol was added to make the paste take on a bread dough type of consistency. Ethanol had to be added to the paste because some of the paste had dried out in situ before removal from the test site. Some of the paste dried out during the field test because some of the sealant developed cracks allowing the ethanol to evaporate. This is believed to have been caused by the cold weather conditions during the demonstration at Badger. At the test sites where the sealant remained intact, the paste did not dry out during 3 weeks of exposure. In order for PCB degradation to take place, a proton donor solvent such as ethanol must be present. The reason for adding the acetic acid is that studies conducted at UCF after the Demonstration Plans were submitted showed that the addition of a small amount of acetic acid to the ethanol significantly increased the rate of PCB degradation. These studies also showed that acidified ethanol with Mg particles was as effective or, in some cases, more effective than the Mg/Pd particles in non-acidified ethanol at degrading PCBs. This discovery is extremely important because it means that Pd is not required in the BTS formulation, which reduces the cost of the BTS paste significantly. Plain acidified Mg particles were not used during the Badger test because the Demonstration Plan called for using BTS with Mg/Pd particles and BTS without any Mg/Pd particles. However, acidified Mg particles were tested on the BTS paste that was returned to UCF from the Badger test site. The data obtained for the PCB degradation performance of the acidified Mg particles are reported in this section along with the data obtained for the Mg/Pd particles. Treatment of the Badger BTS paste was performed using both Mg/Pd and Mg in conjunction with the use of ethanol containing 1% acetic acid. Only samples from sites 6810-36, 6810-11 and 6657-02 were tested because, as shown in the previous section, the PCB concentration in the paste samples taken from the staging area were so low (less than 2 mg/kg) that degradation studies on them would have been of no value. A bar graph showing the change in PCB concentration upon treatment for the samples is shown in Figure 18. Significant PCB degradation was observed in the paste even after only 3 days of treatment. Evidence of this can be seen in the NM- 6657-02 2-week sample, where the PCB levels dropped from an initial value of 2797 mg/kg to 46 mg/kg after only 3 days of treatment with Mg. The other piece of information that is of significant importance is that the Mg particles performed as well as or better than the Mg/Pd particles. This is extremely important because the removal of the Pd from the BTS system reduces the cost of the treatment metal particles by more than 50%. In addition, it eliminates potential concerns related to the release of Pd into the environment.

39
Figure 18. Results of PCB degradation by Mg and Mg/Pd particles added to the NM
badger paste samples.

This page left blank intentionally.

41
6.0 PERFORMANCE ASSESSMENT
The section provides a summary of all data analysis conducted in support of the assessment of performance objectives.
6.1 DISTRIBUTION AND ADHERENCE OF THE BTS
One of the qualitative performance objectives is that the BTS applicator is able to evenly distribute the paste on the surface to be treated. The metric was evaluated by assessing the adherence of a 0.25- to 0.5-inch layer of BTS to an object over the time period of exposure to treated surfaces. BTS paste was applied to surfaces to be treated using two types of application methods and its thickness estimated. The paste was visually inspected periodically (every 2 to 5 days for the first week and then weekly for up to a month) to determine if it was able to adhere to the surfaces (both vertical and horizontal treated surfaces) by inspecting for leaks, sections of paste pulling away from the surface, or bubbling up off the surface. This objective was met. BTS was applied using a spray applicator and hand trowel application method. In some cases the paste did not adhere well to the vertical painted surfaces but this was due to adhesion issues with the paint (old and friable paint on concrete surface) and not due to the paste’s ability to adhere to the surface. Applications were done using the hand trowel method at Badger due to the paste thickening in the cold. At the VIB, where both the spray applicator method and hand trowel application were used, the spray applicator resulted in a much thinner layer of BTS being applied compared with the trowel application, which did affect the treatment ability of the BTS, so preference was given to the hand application method. At the VIB, the paste adhered to vertical and horizontal surfaces without any problems in a consistency that could be spray applied or spread with a trowel by hand. It was determined that it was faster to apply the paste with the trowel in a layer of the desired thickness rather than using a spray applicator, which required multiple passes to get the desired thickness.
6.2 ADHERENCE OF SEALANTS
The metric was evaluated by assessing the adherence of the sealant to the BTS, the ability to apply the sealant evenly over the surface of the paste, and its ability to dry to a non-tacky, nonporous layer that reduced volatilization of BTS solvent. Two sealants were tested, a VP truck bed liner and a silicone-based roof sealant (Sil). The sealant and underlying BTS paste were inspected every 1 to 2 days, depending on location, for the first 5 days, and samples were collected of the paste and sealant weekly for up to a month after application. The sealant’s ability to adhere to the BTS and to reduce volatilization of the ethanol in the BTS was evaluated by visual inspection (looking for leaks around the edges of the sealant, looking for bubbles or drooping of sealant away from BTS surface) and manual inspection by pressing lightly on the sealed surface to test the fluidity of the paste. This objective was met using both sealants but some difficulties were encountered with old friable paint and cold temperatures. Both sealants were able to provide an effective seal to minimize ethanol evaporation from the BTS paste for the 3 weeks of application. In the cases where there were issues with the condition of the paint (old and friable paint on concrete), there were issues with both the sealant and paste sticking to the surface and the seal failed. However,

42
this had to do with the paint itself being unable to adhere to the surface and not the sealant. In addition, the cold temperatures during the Badger deployment did affect the ability of the sealant to remain flexible and some cracking of the sealant did occur. If possible, it would be preferable to apply BTS in above freezing conditions to avoid the risk of sealant failure. If applications must be done in below freezing temperatures, additional care must be taken to inspect and repair cracks in the sealant as they appear.
6.3 EASE OF IMPLEMENTATION
The ease of use of this technology was evaluated based on our experience in the field. The implementability was evaluated by the qualitative assessment of the ease with which the operator was trained to handle and apply both the paste and the sealant in the various field situations. This objective was met with respect to both the ease of handling and applying both the paste and sealant on the various surfaces and locations that were treated. The equipment required for the manufacturing of BTS on site using the acidified ethanol and Mg would be readily available through the paint industry. The application equipment used to apply BTS and the sealants was all readily available through local hardware suppliers or the paint industry. The procedures used to manufacture the BTS were well established procedures and were simple enough to be conducted by field technicians with training in the manufacturing techniques. The procedures used to apply the BTS were standard and well established procedures and the procedures were simple enough to be conducted by field technicians with training in basic application techniques and handling techniques of the BTS and sealants.
6.4 REDUCTION IN PCB CONCENTRATIONS IN TREATED PAINT TO LESS THAN 50 MG/KG
A key performance objective is the reduction of PCB concentrations in the treated material to less than 50 mg/kg. The metric was evaluated by collecting samples of the paint pre-BTS application and then weekly for up to a month for analysis of PCB concentrations. This was a destructive analysis and was done on one section of the test area on a weekly basis until all sections had been analyzed. This objective was partially met. One application of paste was effective in achieving this target after only one week of treatment in all cases where the starting concentration in the paint was less than approximately 500 mg/kg, especially if the surface being treated was metal and not concrete. In cases where the starting concentrations in the paint were greater than 500 mg/kg, significant reductions (93%) in PCB concentrations were achieved but more than one application of paste is necessary to reduce concentrations below 50 mg/kg. It is believed that in part this was because the PCBs extracted into the paste may have exceeded the degradation capabilities of the Mg/Pd in the paste for the Mg/Pd BTS, and then the paste became concentrated with PCBs. For the NM BTS the paste became concentrated with PCBs before complete extraction of PCBs from the paint could occur. The PCB-saturated paste was no longer able to further extract PCBs from the paint. The performance of the BTS paste was also negatively impacted by the conditions of the paint at Buildings 6810-36 and 6810-11. The paint was friable and peeling, which prevented BTS from achieving a good adherence to the wall and prevented the sealant from providing an effective seal of the paste, which resulted in the loss of ethanol from the paste. In addition, the

43
paste was applied to a porous surface that reduced the amount of ethanol available in the paste (loss of ethanol to the concrete, magnified by the amount of concrete that was treated that was exposed without any paint to seal it).
6.5 REDUCTION IN PCB CONCENTRATIONS IN BTS PASTE TO LESS THAN 50 MG/KG
The reduction of PCB concentrations in the paste to less than 50 mg/kg is another key performance objective. The metric was evaluated by collecting samples of the paste weekly for up to a month for analysis of PCB concentrations. This was a destructive analysis that was done on one section of the test area on a weekly basis until all sections had been analyzed. For BTS that did not contain the activated metals for degradation (non-active paste), a subset of the paste sample was analyzed for PCBs and then the activated metal and, if necessary, additional ethanol, were added to the non-active paste to promote degradation (post-application activated paste). Samples of the post-application activated paste were then analyzed for PCB concentrations. This objective was partially met. For the active paste (metal in the paste), if the starting paint concentrations were below roughly 2500 mg/kg, then the concentrations in the paste were less than 50 mg/kg with the exception of the 3-week samples from Badger Building 6810-11 where concentrations were still slightly above the 50 mg/kg target (60 mg/kg;). If the pretreatment paint concentrations were very high (>20,000 mg/kg) then the active metal paste was not able to degrade all the PCBs in the paste to below 50 mg/kg although some dechlorination did occur in the paste. If very high concentrations are present in the paint, this yields a situation where more PCBs are present than can be handled by the Mg/Pd available in the paste or that can degraded sufficiently in the time period that solvent remains in the paste to facilitate treatment. As mentioned above, the paste becomes concentrated with PCBs. Even when Mg/Pd and additional ethanol was added in the laboratory to the active paste that had been exposed to the very high starting concentrations, it was not possible to get the concentrations in the paste to below 50 mg/kg after 21 days. The rates of dechlorination were enhanced somewhat by the addition of acidified ethanol, but they only reached a level of one-fourth that of fresh Mg/Pd still being studied, but present evidence suggests that a hard layer of impervious magnesium oxide (MgO) is formed on the outside of the particle. The use of acidified ethanol after the MgO layer is formed is only effective at penetrating a small fraction of the layer. However, when acidified ethanol is used during the initial preparation of the BTS paste, the formation of the impervious layer of MgO appears to be minimized to a level where reaction rates remain high. For the NM paste, which was activated in the lab after removal from the field by the addition of ethanol and the active metal (Mg and acid or Mg/Pd), the concentrations were reduced to below 50 mg/kg for all samples using either the acidified ethanol and Mg and/or ethanol and the Mg/Pd.
6.6 IMPACT TO PAINT ADHERENCE
One of the secondary objectives was to evaluate the impact to the paint adherence after exposure to BTS. The metric was evaluated by visually assessing the condition of the paint after BTS application as well as by using the field test for pull-off strength of coatings (ASTM D3359-02).

44
When the paint at the Badger test sites was subjected to the ASTM D3359-02 procedure prior to application of BTS, the paint at all the test sites failed. Thus, the effect of the BTS on the integrity of the painted surfaces at Badger could not be assessed. There were difficulties in using ASTM D3359-02 at the VIB on post-treatment samples due to preparation of the surface prior to testing, and ASTM D4541-02 was also used to evaluate the paint adherence for the VIB panels. This objective was not met in that the BTS negatively affected the adherence and strength of at least the surface layer of paint.

45
7.0 COST ASSESSMENT
This section presents the results of a cost assessment to implement remediation of PCB containing painted structures using BTS. Cost data collected during the technology demonstration were evaluated as described in the following sections. Section 7.1 describes a cost model that was developed for the application of BTS with a comparison to disposal of structures without treatment; Section 7.2 presents an assessment of the cost drivers for the application of the technology; and Section 7.3 presents the results of an analysis of the cost model.
7.1 COST MODEL
A cost model was developed to assist remediation professionals in understanding costs associated with the BTS technology. The cost model identified the major cost elements required to implement the BTS technology at typical structures. A summary of the actual costs for pilot- scale implementation of the BTS technology at Badger and the VIB is presented in Table 6.
Table 6. Actual costs for BTS technology dem/val.
Cost Element Data Tracked During the Demonstration/
Per Site Cost Capital Costs
Design & planning – Personnel required and associated labor Labor $1433Other costs $270
Treatability testing – Personnel required and associated labor for treatability activities
Labor $27,300Other costs $12,000
Manufacturing of the catalyst system and BTS reagent for field testing
– Personnel required and associated labor for BTS application activities
– Mobilization costs – Costs for BTS and application equipment
Labor $8568Other costs $7000
Application of BTS to DoD test structures/materials
– Personnel required and associated labor for BTS application activities
– Mobilization costs – Costs for BTS and application equipment
Labor $7600Other costs $9300
Removal of BTS to DoD test structures/materials
– Personnel required and associated labor for BTS removal activities
– Demobilization costs
Labor $2400Other costs $1200
Performance Monitoring Baseline characterization – Personnel required and associated labor
– Mobilization costs – Supplies and equipment for sampling – Sample shipment and laboratory analytical costs – Labor associated with data reporting
Labor $7400Other costs $3900
Performance monitoring – Personnel required and associated labor – Mobilization costs – Supplies and equipment for sampling – Sample shipment and laboratory analytical costs – Labor associated with data reporting
Labor $18,800Other costs $17,800

46
The major cost categories tracked during the field demonstrations at Badger and VIB were: Capital Costs Design and Planning – This cost element includes activities required to scope the project, such as site visits required to evaluate size and configuration of the surface coating that may impact the application process of the solvent paste, how many applications of solvent paste may be required, and whether a single-phase treatment (active solvent paste containing catalyst) or two- phase (inactive solvent paste with catalyst added later) treatment may be more cost effective. Treatability Testing – This cost element includes the labor required to collect and analyze samples of PCB-containing material samples before and after bench-scale treatment. This laboratory evaluation will inform the final design of the application of the solvent paste, number of probable applications required, and whether to use a single-phase or two-phase treatment. This cost element provides scale-up information required for the manufacture of the catalyst and the solvent paste. Manufacturing of the Catalyst System and BTS Reagent for Field Testing – Based on scale-up information developed during treatability testing, the volume and consistency of solvent paste required and whether it will be applied as an inactive or active paste have been determined. The amount of catalyst required to treat the expected PCB concentrations has also been determined. Costs include raw materials for the solvent paste and catalyst and manufacturing labor. Application/Removal of BTS to DoD Test Structures/Materials – In this cost element, the catalyst, solvent paste, and sealant are mobilized to the site, along with the appropriate application/removal and waste handling equipment and demobilization costs. Costs include labor hours to apply/remove the solvent paste and sealant. Performance Monitoring Costs Baseline Characterization – This cost element addresses activities and equipment required to collect and analyze samples of coating material to assess and report the presence and concentration of PCBs prior to any treatment. Information developed during this process informs initial design for the project. Performance Monitoring – This cost element addresses activities and equipment required to collect and analyze samples of coating material to assess and report the presence and concentration of PCBs during in situ treatment. Results inform the number of applications of solvent paste that may be required. The cost models shown in Table 7 were based on the actual costs that were tracked in the demonstrations. More weight was given to the costs from the Badger demonstration since this one occurred at a more remote facility (VIB demonstration was done at a facility located very near the NASA office and laboratory).

47
Table 7. Comparison of cost scenariosCPorous
Painted Porous Surface (Concrete Building)
Concrete Building UntreatedC Demolished, Sent for Disposal
Directly to TSCA Landfill
Concrete Building Treated with BTSCDemolished, Sent for
Disposal in Non-Haz Landfill, and Concrete Recycled
Concrete Building Treated with BTS and Reused
Unit Quantity
Unit Price Cost Quantity
Unit Price Cost Quantity
Unit Price Cost
Start-Up/Shut Down Mobilization LS 1 $4000 $4000 1 $5500 $5500 1 $1500 $1500
Sample collection and treatability tests LS 0 - 1 $12,500 $12,500 1 $12,500 $12,500Permitting, approvals LS 1 $3200 $3200 1 $4000 $4000 1 $4000 $4000
Site preparation (disconnect/abandon utilities, dust anderosion control) LS 1 $7400 $7400 1 $5500 $5500 0
Train BTS operators HR 0 $255 - 8 $255 $2040 8 $255 $2040Demobilization LS 1 $4000 $4000 1 $5500 $5500 1 $1500 $1500
Subtotal $18,600 $35,040 $21,540Operations and Maintenance
Labor - BTS application HR 0 $55 - 20 $55 $1100 20 $55 $1100Labor - demolition and segregation of debris LS 1 $6200 $6200 1 $6200 $6200 1 $6200 $6200
Consumables and supplies (PCB-impacted dust mitigation, etc.) LS 1 $1400 $1400 0 0Lab analysis of progress of PCB degradation Sample 0 $65 - 8 $65 $520 8 $65 $520
BTS materials including sealant SF 0 $15 - 8000 $15 $120,000 8000 $15 $120,000Consumables and supplies (application of BTS) LS 0 $1500 - 1 $1500 $1500 1 $1500 $1500
Equipment decontamination LS 1 $1000 $1000 0 0 -Test/analysis of waste streams Sample 0 - 8 $100 $800 8 $100 $800
Subtotal $8600 $130,120 $130,120Waste Handling
Transportation of demolition debris to non-haz landfill Ton 118 $22 $2596 118 $22 $2956 0 $22Disposal of demolition waste in non-haz landfill Ton 118 $80 $9440 118 $80 $9440 0 $80
Delivery of bins and transportation of demolition debris toTSCA landfill Ton 182 $530 $96,460 0 0
Disposal of demolition waste in TSCA landfill Ton 182 $350 $63,700 0 0Transportation of decontamination/wash fluid (non-haz) Gal 100 $5 $500 100 $5 $500 50 $5 $250
Disposal of decontamination/wash fluid (non-haz) Gal 100 $1 $100 100 $1 $100 50 $1 $50Transportation of concrete for recycling (~60% of material) Ton 0 - 182 $22 $4004 0 $22 -
Transportation of BTS waste (non-haz) Ton 0 - 0.5 $22 $11 0.5 $22 $11Disposal of BTS waste in non-haz landfill Ton 0 - 0.5 $80 $40 0.5 $80 $40
Subtotal $172,796 $16,691 $351TOTAL $199,996 $180,811 $152,011Notes: Assume starting concentration in paint is 250 mg/kg Assumes treatment of 8000 sq ft surface area for both building and tank Large variability in transportation and disposal costs depending on distance to landfill and the concentrations in the waste, but cost for transportation and disposal to TSCA landfill is based on average of quotes received for various states. Assumes that state/USEPA regulations would require the porous substrate to be disposed as hazardous waste in TSCA-regulated landfill if painted surface has >50 ppm PCBs Assume for painted concrete 45 lbs of substrate per sq ft of painted area of 44 sq ft per ton of substrate LS - lump sum SF - square foot HR - hour

48
The cost model was then applied for two template sites requiring disposal or demolition of buildings or structures covered in paint containing 250 mg/kg PCBs. Two model structures were usedCthe first a painted concrete (porous surface) building that was to be demolished and the second a painted metal tank (nonporous surface) that required disposal. For ease of comparison, both structures were assumed to have a painted surface area of 8000 sq ft. The starting PCB concentration of 250 mg/kg was chosen because, during this demonstration, this concentration has been shown to be able to be treated in place with one application of an active paste. It was assumed that it will require one week of exposure of the BTS to the painted surface to completely extract the PCBs from the paint. BTS would then be transferred to drums or roll-off bins and allowed to sit for another week to allow for complete degradation of the PCBs in the BTS paste prior to disposal as nonhazardous waste. A set of eight pretreatment paint and concrete samples are assumed to be required to characterize the site (8000 ft2 to be treated) prior to treatment and eight post-treatment samples of the paint, concrete, and paste to evaluate the performance of the treatment. Cost estimates for the BTS technology were prepared for both painted concrete and painted metal because of the potential differences in how these materials may need to be handled. Based on USEPA’s PCB Site Revitalization Guidance Under the TSCA (November 2005), porous and nonporous surfaces are treated differently. If disposal or reuse is considered for a building where PCB-containing paint is used on a porous surface, the paint must be removed and treated as PCB bulk product waste. The porous material must then be tested (i.e., concrete core samples) and, if PCBs have migrated into the porous surface, then the porous materials must be handled as PCB remediation waste and disposed of in a TSCA-approved landfill. For nonporous surfaces, the paint can be removed and treated as a PCB bulk product waste, and, if the nonporous surface is shown to be clean, the item can be reused, recycled, or disposed of as nonhazardous waste. Costs have been organized into three major categories: Start-up/Shut Down, Operations and Maintenance, and Waste Handling. Start-up/Shut Down includes materials and labor costs associated with mobilization and demobilization, permitting, BTS operator training, site preparation, sample collection, and treatability testing. Operations and Maintenance includes materials and labor costs associated with BTS preparation, application, and analysis, demolition or paint removal, equipment decontamination, and the testing/analysis of waste streams and metal surfaces, as appropriate. Waste Handling includes materials and labor costs associated with transportation and disposal of hazardous and nonhazardous demolition debris and waste, decontamination/wash fluids, BTS waste, and metal recycling.
7.2 COST DRIVERS
The costs to implement the BTS technology for treatment of PCBs in paint will vary significantly from site to site. The key costs drivers are listed below, along with a brief discussion of their impact on cost.

49
Nature and Extent of Contamination
Concentrations of PCBs in paint – The higher the PCB concentrations are in the painted surfaces, the more likely it will be that multiple applications of BTS may be required to achieve removal and/or degradation of the PCBs to below 50 mg/kg.
Conditions of the surface to be treated – If the paint to be treated is old, weathered, damaged, or friable, proper adherence of the BTS and sealant to the surface may be difficult to achieve. This may make it difficult to achieve removal of PCBs to below 50 mg/kg with a single application of BTS.
Geometry and simplicity of the surface to be treated – If the surface of the structure to be treated is very convoluted, with many grooves or hard-to-access surfaces (pipes strapped to walls that are painted with PCB paint) this will increase the effort required to properly apply the BTS to the surfaces to be treated.
Additional constituents which require treatment – For example, at Badger, materials with the potential of containing residue of explosive or energetic compounds must be incinerated prior to disposal. However, the presence of PCBs in concentrations >50 mg/kg require incineration in an oven operating in conformance with 40 CFR 761.72(a), and if the material must be cut into manageable sizes, a special permit is required to perform the cutting operations. These conditions may make BTS application more favorable.
Environmental Conditions
Temperature and weather conditions – Although BTS has been shown to degrade PCBs at cold temperatures (4 ºC), the rate is slower and there may be difficulties with the performance of the sealants in cold temperatures that could affect the number of times sealant or BTS may need to be applied.
Available Infrastructure & Site Access
Available infrastructure – The availability of existing infrastructure (e.g., on site or nearby landfills, storage buildings, and utilities) can reduce the cost of technology implementation.
Site access – Sites having limited access for equipment and personnel (e.g., difficult terrain, obstructions, or other complicating factors such as explosives storage) may incur higher costs when implementing the technology.
Site location – If the site is located in a remote area, there will be additional mobilization costs. However, there will also be a significant increase in costs for transport to and disposal of hazardous waste in a properly permitted landfill, which may make the cost benefit of treating a structure with BTS more favorable. The costs for transportation and disposal of PCB-impacted waste could be much more significant if the distances are greater or the site is very remote or difficult to access such as on an island or in the arctic.

50
7.3 COMPARISON OF COST ANALYSIS
BTS, when deployed at the perceived end of a facility’s life cycle, may represent an additional rather than an alternative cost in that facility’s final disposition. As such, an extremely simplified cost model has been applied to the costs associated with alternative facility disposal methods and a BTS treatment scenario. For the purposes of this costs analysis, only those costs and environmental liability due to PCB concentrations in excess of the regulatory limit of 50 mg/kg are being considered. However, given that BTS can extend structure reuse by removing PCBs without damaging the structure may also be considered an alternative to final disposition. The most probable scenarios associated with the application of BTS are as follows:
1. Baseline conditions (untreated facility). Environmental liability due to PCB concentrations is retained.
Demolition of facility or structure. Steel and concrete is not recycled due to PCB concentrations. Demolition debris is landfilled as hazardous waste.
2. BTS is applied to the facility’s coatings and other materials as appropriate. Environmental liability due to PCB concentrations is eliminated. Two scenarios may be available: structure reuse or demolition.
Structure reuse: Life cycle of building is extended, reducing unit capital cost associated with the structure.
Demolition of facility or structure.
– Steel and concrete may be recycled, providing an opportunity to defray costs associated with PCB treatment or demolition.
– Demolition debris is landfilled as non-hazardous waste.
The success of BTS was evaluated by comparing the added cost of BTS treatment to the reduced costs associated with the landfilling of demolition debris, the potential revenue generation from steel and concrete recycling, and perhaps the extended life or reuse of the facility that would not otherwise be cost-effective. Using the template site conditions described above, estimates of costs were developed for each of the following alternatives:
Concrete structure demolition, untreated and disposed of in a TSCA landfill
Concrete structure demolition, treated prior to demolition with BTS, disposed of nonhazardous landfill and concrete recycled
Concrete structure treated with BTS and reused. This alternative addresses those structures where PCB concentration in paints or other materials drive the requirement for demolition
Metal tank, untreated and disposed of in a TSCA landfill

51
Metal tank, conventional paint removal using sandblasting, sandblast waste sent to TSCA landfill and metal tank recycled
Metal tank, treated with BTS and then recycled. Based on the cost models shown in Table 7 and 8, it appears that it would be cost effective to apply BTS to a concrete building prior to demolition compared with the costs of demolishing the building and disposing of the waste in a TSCA landfill. Demolition and disposal costs of the untreated concrete building are estimated to be approximately $200,000, while the cost of treating the painted concrete with BTS, followed by demolishing the building and recycling the concrete, is estimated to be approximately $180,000. In the third scenario, BTS treatment and building reuse rather than demolition, estimated costs are even lower at approximately $150,000. In contrast, if the structure to be treated is a metal tank, then it does not seem to be cost effective to address the PCB-containing paint by either conventional sandblasting or BTS treatment in order to recycle the tank. Straight disposal of the untreated tank is estimated to cost approximately $25,000 versus removal of the paint with sandblasting and recycling the tank, which is estimated to cost $105,000, and treatment with BTS and recycling the tank, which is estimated to cost $140,000. It must be noted that both untreated tank debris and sandblast waste will retain PCBs and associated environmental liability issues, while there are no long-term liability issues if the tank is treated with BTS before disposal. As mentioned above, the cost for transportation and disposal of PCB-impacted waste could be much more significant if the distances are greater or the site is very remote or difficult to access such as on an island or in the arctic. All the scenarios evaluated in the costs models have assumed the treatment of PCB-containing materials down to the federal regulatory limit of 50 mg/kg. However, some states or countries may have stricter regulations with respect to the disposal of PCB-impacted wastes. According to http://www.ehso.com/EHSO_PCB.htm (Environmental Health and Safety online), the federal regulation for non-PCB waste is 50 mg/kg, but some state regulations are 5 mg/kg. For the situation with the Navy properties in Japan, the regulations are very strict and any waste with PCB concentrations >0.5 mg/kg cannot be disposed of in Japan. This requires that the U.S. Navy transport all materials impacted by PCBs to another location for disposal, greatly increasing the costs. Thus, a more restrictive regulatory limit will tend to increase the cost effectiveness of BTS treatment of facilities over straight demolition and disposal. BTS can reduce PCB concentrations down to non-detect (detection limit of 1 mg/kg), but the lower the target treatment concentration is the greater the potential exists for the need for additional applications of BTS, and therefore greater costs, to achieve these targets.
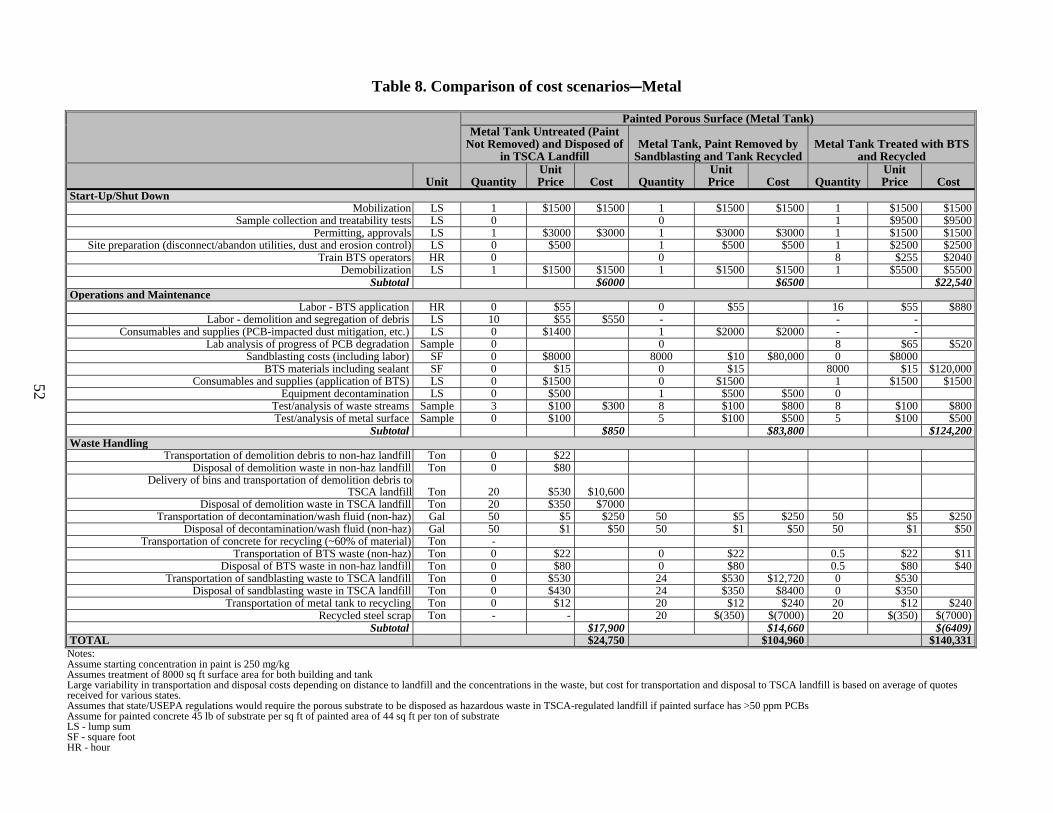
52
Table 8. Comparison of cost scenariosCMetal
Painted Porous Surface (Metal Tank)Metal Tank Untreated (Paint
Not Removed) and Disposed of in TSCA Landfill
Metal Tank, Paint Removed by Sandblasting and Tank Recycled
Metal Tank Treated with BTS and Recycled
Unit Quantity
Unit Price Cost Quantity
Unit Price Cost Quantity
Unit Price Cost
Start-Up/Shut Down Mobilization LS 1 $1500 $1500 1 $1500 $1500 1 $1500 $1500
Sample collection and treatability tests LS 0 0 1 $9500 $9500Permitting, approvals LS 1 $3000 $3000 1 $3000 $3000 1 $1500 $1500
Site preparation (disconnect/abandon utilities, dust and erosion control) LS 0 $500 1 $500 $500 1 $2500 $2500Train BTS operators HR 0 0 8 $255 $2040
Demobilization LS 1 $1500 $1500 1 $1500 $1500 1 $5500 $5500Subtotal $6000 $6500 $22,540
Operations and Maintenance Labor - BTS application HR 0 $55 0 $55 16 $55 $880
Labor - demolition and segregation of debris LS 10 $55 $550 - - -Consumables and supplies (PCB-impacted dust mitigation, etc.) LS 0 $1400 1 $2000 $2000 - -
Lab analysis of progress of PCB degradation Sample 0 0 8 $65 $520Sandblasting costs (including labor) SF 0 $8000 8000 $10 $80,000 0 $8000
BTS materials including sealant SF 0 $15 0 $15 8000 $15 $120,000Consumables and supplies (application of BTS) LS 0 $1500 0 $1500 1 $1500 $1500
Equipment decontamination LS 0 $500 1 $500 $500 0Test/analysis of waste streams Sample 3 $100 $300 8 $100 $800 8 $100 $800Test/analysis of metal surface Sample 0 $100 5 $100 $500 5 $100 $500
Subtotal $850 $83,800 $124,200Waste Handling
Transportation of demolition debris to non-haz landfill Ton 0 $22 Disposal of demolition waste in non-haz landfill Ton 0 $80
Delivery of bins and transportation of demolition debris to TSCA landfill Ton 20 $530 $10,600
Disposal of demolition waste in TSCA landfill Ton 20 $350 $7000 Transportation of decontamination/wash fluid (non-haz) Gal 50 $5 $250 50 $5 $250 50 $5 $250
Disposal of decontamination/wash fluid (non-haz) Gal 50 $1 $50 50 $1 $50 50 $1 $50Transportation of concrete for recycling (~60% of material) Ton -
Transportation of BTS waste (non-haz) Ton 0 $22 0 $22 0.5 $22 $11Disposal of BTS waste in non-haz landfill Ton 0 $80 0 $80 0.5 $80 $40
Transportation of sandblasting waste to TSCA landfill Ton 0 $530 24 $530 $12,720 0 $530Disposal of sandblasting waste in TSCA landfill Ton 0 $430 24 $350 $8400 0 $350
Transportation of metal tank to recycling Ton 0 $12 20 $12 $240 20 $12 $240Recycled steel scrap Ton - - 20 $(350) $(7000) 20 $(350) $(7000)
Subtotal $17,900 $14,660 $(6409)TOTAL $24,750 $104,960 $140,331Notes: Assume starting concentration in paint is 250 mg/kg Assumes treatment of 8000 sq ft surface area for both building and tank Large variability in transportation and disposal costs depending on distance to landfill and the concentrations in the waste, but cost for transportation and disposal to TSCA landfill is based on average of quotes received for various states. Assumes that state/USEPA regulations would require the porous substrate to be disposed as hazardous waste in TSCA-regulated landfill if painted surface has >50 ppm PCBs Assume for painted concrete 45 lb of substrate per sq ft of painted area of 44 sq ft per ton of substrate LS - lump sum SF - square foot HR - hour

53
8.0 IMPLEMENTATION ISSUES
This section provides information that will aid in the future implementation of the technology.
8.1 POTENTIAL ENVIRONMENTAL ISSUES
8.1.1 Regulatory Issues
Permits would be required to treat and dispose of wastes that have been or are impacted with PCBs. The type of permit and limits of PCB concentrations in the waste for disposal will vary by state and sufficient time should be allowed to get the permits.
8.1.2 Air Discharge
The BTS process described will not normally result in discharge of chemicals to the atmosphere with the exception of some loss of solvent (ethanol) from the paste.
8.1.3 Waste Storage, Treatment, and Disposal
The BTS process will result in the generation of a small amount of waste that can be allowed to dry and then disposed of as nonhazardous waste that must be managed consistent with other nonhazardous waste.
8.2 END-USER ISSUES
Potential end users of this technology include responsible parties for sites where PCBs are present in structures in paint or other building components. End users will have an interest in the technology because it can potentially treat PCBs in situ and allow for reuse of buildings and other structures without concern regarding the future liabilities related to PCBs or allow for a lower cost less than for conventional demolition and disposal approaches and other PCB handling technologies like sandblasting. End users and other stakeholders may have concerns regarding (1) the effectiveness of the technology in reducing concentrations of PCBs below appropriate criteria and (2) the costs of the treatment versus disposal of untreated materials and the evaluation of the long-term liability associated with disposal of untreated materials.
8.3 PROCUREMENT ISSUES
There are no specialized equipment components required to implement BTS and no specialized services required. There are a number of magnesium powder and other ingredient vendors. There are no significant procurement issues with the application of this technology.
8.4 DESIGN ISSUES
Application in cold weather (i.e., below freezing). This may be difficult because of difficulties in maintaining an effective seal with the sealant used to prevent the solvent from evaporating during treatment.

54
Treatment of paint with high concentrations of PCB (i.e., greater than ~ 500 mg/Kg). This may require multiple applications of BTS paste or the use of thicker layers of BTS paste to achieve treated paint criteria of 50 mg/Kg. Treatment of painted surfaces where the paint is friable or is not adhering to the surface to be treated. In these situations it may be appropriate to remove loose paint from the surface prior to treatment of the surface with the BTS paste. The paint removed from the surface prior to application of the BTS paste could be treated on site using a non-thickened version of the BTS reagent to extract PCBs from the paint chips and degrade the PCB. Application of BTS paste to irregular surface areas. These situations require a thinner, sprayable form of the solvent paste to adequately cover the exterior. Sealants tested in this demonstration are all sprayable materials and do not pose any application difficulty and will maintain required moisture levels for PCB extraction from the surface coating. As with any surface, the need for removal of spent solvent and reapplication of fresh solvent paste is dependent upon initial PCB concentrations and required final PCB concentrations. If the irregular surface to be treated is small and accessible, it may be removed and placed in a tank of solvent paste (dip tank) to ensure complete saturation of the coating. Application of BTS paste to large, flat surfaces, such as a vertical wall. This may be most easily accomplished with a sprayable form of the paste, then covered with a sprayable sealant to maintain required moisture levels for PCB extraction. Formulation of BTS paste to be applied to the painted surface. This work has demonstrated that it is possible to use a treatment formulation that contains Mg in an acidified ethanol solvent. This formulation of Activated Metal Treatment System (AMTS) may be more attractive than the Mg/Pd formulation because of lower cost and avoiding the use of Pd. Use of a single-step or two-step process for the treatment of surfaces. This work has suggested that it is possible to use a two-step process of extraction of PCBs using a NM paste and then activating the NM paste in a separate container following extraction (Figures 1 and 2, Section 6.1). Regulatory limits and therefore target treatment concentrations are also an important design issue. The federal regulation for the disposal of a waste as a non-PCB waste is 50 mg/kg, but some state regulations are 5 mg/kg. For the situation with the Navy properties in Japan, the regulations are very strict and any waste with PCB concentrations >0.5 mg/kg cannot be disposed of in Japan. This requires that the U.S. Navy transport all materials impacted by PCBs to another location for disposal greatly increasing the costs. Thus, a more restrictive regulatory limit will tend to increase the cost effectiveness of BTS treatment of facilities over straight demolition and disposal. When designing a treatment where regulatory or target treatment concentrations are very low, it is important to design for the potential need of additional applications of BTS to achieve the remediation target. For instance, for an application with a starting concentration of 500 mg/kg, one application of BTS may be sufficient to get the concentrations below 50 mg/kg but a second application may be necessary to get it below 5 mg/kg.

55
8.5 FOLLOW-ON WORK
Studies conducted at UCF after the project was initiated have shown that the Pd catalyst can be removed from the BTS paste and a small amount of acid added to make a paste that is less expensive and more reactive. The addition of a small amount of acetic acid to the ethanol significantly increased the rate of PCB degradation. These studies also showed that acidified ethanol with Mg particles was as effective or in some cases more effective than the Mg/Pd particles in non-acidified ethanol at degrading PCBs. Present evidence suggests that a hard layer of impervious MgO is formed on the outside of the Mg particles over time. The use of acidified ethanol after the MgO layer is formed is only effective at penetrating a small fraction of the layer. However, when acidified ethanol is used during the initial preparation of the BTS paste, the formation of the impervious layer of MgO appears to be minimized to a level where reaction rates remain high. This discovery is extremely important because it means that Pd is not required in the BTS formulation, which reduces the cost of the BTS paste significantly. BTS has been modified by removing the Pd and is referred to as AMTS. AMTS consists of activated elemental magnesium in a green-solvent solution capable of hydrogen donation. As mentioned above, the AMTS is less expensive than BTS through further modifications to the formula (i.e., different sorbent material as well as removal of the Pd). If the costs for AMTS are used in place of BTS in the cost tables in Section 7, it would be cost effective to apply AMTS to a concrete building prior to demolition compared with the costs of demolishing the building and disposing of the waste in a TSCA landfill. Demolition and disposal costs of the untreated concrete building are estimated to be approximately $200,000, while the cost of treating the painted concrete with BTS, followed by demolishing the building and recycling the concrete, is estimated to be approximately $180,000. If AMTS is used in this scenario instead of BTS, the cost is estimated to be approximately $75,000. In contrast, if the structure to be treated is a metal tank, then it does not seem to be cost effective to address the PCB-containing paint by either conventional sandblasting, BTS treatment, or AMTS treatment in order to recycle the tank. Straight disposal of the untreated tank is estimated to cost approximately $25,000 versus removal of the paint with sandblasting and recycling the tank, which is estimated to cost $105,000, and treatment with BTS and recycling the tank, which is estimated to cost $140,000. Treatment with AMTS and recycling the tank is estimated to cost $33,000. NASA and Scientific Specialists jointly hold the patents for both BTS and AMTS and there is already commercial sector interest; the technologies are licensed to two companies with other licenses in process.

This page left blank intentionally.

57
9.0 REFERENCES
American Society for Testing and Materials (ASTM) D4541-02. 2002. Standard Test Method for Pull-off Strength of Coatings Using Portable Adhesion Tester.
ASTM D3359-02. Standard Test Methods for Measuring Adhesion by Tape Test. ASTM
International, West Conshohocken, PA, DOI:10.1520/03359-02. ASTM E1729-05. 2005. Standard Practice for Field Collection of Dried Paint Samples for
Subsequent Lead Determination. Engelmann, M.D.; Hutcheson, R.; Henschield, K.; Neal, R.; Cheng, I.F., 2003. Microchemical
Journal. 2003, 74, 19-25. USEPA. 1999. Use Authorization for and Distribution in Commerce of Non-Liquid
Polychlorinated Biphenyls; Notice of Availability; Partial Reopening of Comment Period - Proposed Rule, December 10, 1999 (69358-69364).
ESTCP Project RC-200610. January 2009. Application of a Bimetallic Treatment System (BTS)
for PCB Removal from Older Structures on DoD Facilities. Demonstration Plan 1: Vertical Integration Building, Cape Canaveral Air Force Station, FL.
ESTCP Project RC-200610. February 2009. Application of a Bimetallic Treatment System
(BTS) for PCB Removal from Older Structures on DoD Facilities. Demonstration Plan 2: Badger Army Ammunition Plant.
ESTCP Project RC-200610. November 2010. Application of a Bimetallic Treatment System
(BTS) for PCB Removal from Older Structures on DoD Facilities. Final Technical Report. United States Environmental Protection Agency (USEPA).
Plexus Scientific. 2002. Report prepared for Wisconsin Department of Natural Resources.
Badger Army Ammunition Plant Building Decontamination and Demolition Process Information Initial Submission Document.
SW-846 – Method 3550C Ultrasonic Extraction and Method 3665A Sulfuric Acid/Permanganate
Cleanup.

This page left blank intentionally.

A-1
APPENDIX A
POINTS OF CONTACT
Point of Contact Organization
Phone Fax
E-Mail Role In Project Dr. Nancy Ruiz NFESC Phone: (805) 982-1155
Fax: (805) 982-4304 E-mail: [email protected]
Principal Investigator
Tom Krug Geosyntec Consultants
Phone: (519) 822-2230, Ext. 242 Fax: (519) 822-3151 E-mail: [email protected]
Technical Advisor
Suzanne O’Hara Geosyntec Consultants
Phone: (519) 822-2230, Ext. 234 Fax: (519) 822-3151 E-mail: [email protected]
Project Manager
Dr. Jacqueline Quinn NASA Phone: (321) 867-8410 Fax: (321) 867-9161 E-mail: [email protected]
Technical Advisor and Project Direction at NASA
James Captain NASA/UCF Phone: (321) 867-8185 Fax: (321) 861-2925 E-mail: [email protected]
Technical Advisor/Field QA/QC
Dr. Cherie Geiger UCF Phone: (407) 823-2135 Fax: (407) 823-2252 E-mail: [email protected]
Technical Advisor and Project Direction at UCF
Dr. Chris Clausen UCF Phone: (407) 823-2293 Fax: (407) 823-2252 E-mail: [email protected]
Technical Advisor and Project Direction at UCF

ESTCP Office901 North Stuart StreetSuite 303Arlington, Virginia 22203
(703) 696-2117 (Phone)(703) 696-2114 (Fax)
E-mail: [email protected]