Embed Size (px)
Citation preview

Establishment and proteomic characterization of patient-derivedclear cell sarcoma xenografts and cell lines
Marimu Sakumoto1 & Rieko Oyama1 & Mami Takahashi2 & Yoko Takai1 & Fusako Kito1 &
Kumiko Shiozawa3 & Zhiwei Qiao3 & Makoto Endo4 & Akihiko Yoshida5 & Akira Kawai4 &
Tadashi Kondo1,3
Received: 18 August 2017 /Accepted: 10 October 2017 /Published online: 1 December 2017 / Editor: Tetsuji Okamoto# The Society for In Vitro Biology 2017
Abstract Clear cell sarcoma (CCS) is an aggressive mesen-chymal malignancy characterized by the unique chimericEWS-ATF1 fusion gene. Patient-derived cancer models areessential tools for the understanding of tumorigenesis andthe development of anti-cancer drugs; however, only a limitednumber of CCS cell lines exist. The objective of this study wasto establish patient-derived CCS models. We establishedpatient-derived CCS models from a 43-yr-old female patient.We prepared the patient-derived xenografts (PDXs) from tu-mor tissues obtained through biopsy or surgery and isolatedstable cell lines from PDXs and the original tumor tissue. Thepresence of gene fusions was examined by RT-PCR, andSanger sequencing. The established cell lines were character-ized by short tandem repeat, viability, colony and spheroidformation, and invasion analyses. Differences in gene enrich-ment between the primary tumor and cell lines were examinedby mass spectrometry and KEGG pathway analysis. The celllines were maintained for more than 80 passages, and had
tumorigenic characteristics such as colony and spheroid for-mation and invasion. Mass spectrometric proteome analysisdemonstrated that the cell lines were enriched for similar butdistinct molecular pathways, compared to those in the xeno-grafts and original tumor tissue. Next, tyrosine kinase inhibi-tors were screened for their suppressive effects on viability.We found that ponatinib, vandetanib, and doxorubicin sup-pressed the growth of cell lines, and had equivalent IC50
values. Further in-depth investigation and understanding ofdrug-sensitivity mechanisms will be important for the clinicalapplications of our cell lines.
Keywords Clear cell sarcoma . Xenografts . Primary culturecells . Proteome . Drug response
Introduction
Clear cell sarcoma (CCS) is a mesenchymal malignancy of thetendons and aponeuroses that exhibits melanocytic differenti-ation (Enzinger 1965; Fletcher et al. 2013; JR et al. 2013).This disease arises in the extremities of young adults,appearing as a deep-seated, slowly-growing mass, and resultsin an aggressive malignancy; approximately 50% of patientsdevelop lung or nodal metastases, and show resistance to con-ventional chemotherapy and radiation therapy. The prognosisof CCS is dismal, and the 5-year overall survival remains at30–70% (Sara et al. 1990; el-Naggar et al. 1991; Lucas et al.1992; EA et al. 1993; Deenik et al. 1999; Finley et al. 2001;Ferrari et al. 2002; Takahira et al. 2004; Kawai et al. 2007).Characteristic genetic aberrations such as the clonal chromo-somal translocation, specifically t(12;22)(q13;q12), and EWS-ATF1 gene fusions have been reported (Bridge et al. 1991;Zucman et al. 1993). Although the gene fusion might playan important role in the carcinogenesis of CCS, molecular
Electronic supplementary material The online version of this article(https://doi.org/10.1007/s11626-017-0207-5) contains supplementarymaterial, which is available to authorized users.
* Tadashi [email protected]
1 Department of Innovative Seeds Evaluation, National Cancer CenterResearch Institute, 5-1-1 Tsukiji, Chuo-ku, Tokyo 104-0045, Japan
2 Central Animal Division, National Cancer Center Research Institute,5-1-1 Tsukiji, Chuo-ku, Tokyo 104-0045, Japan
3 Division of Rare Cancer Research, National Cancer Center ResearchInstitute, 5-1-1 Tsukiji, Chuo-ku, Tokyo 104-0045, Japan
4 Division of Musculoskeletal Oncology, National Cancer CenterHospital, 5-1-1 Tsukiji, Chuo-ku, Tokyo 104-0045, Japan
5 Department of Pathology and Clinical Laboratories, National CancerCenter Hospital, 5-1-1 Tsukiji, Chuo-ku, Tokyo 104-0045, Japan
In Vitro Cell.Dev.Biol.—Animal (2018) 54:163–176https://doi.org/10.1007/s11626-017-0207-5

targeting drugs specific for the associated products have notbeen developed. Recently, the novel multi-tyrosine kinase in-hibitor pazopanib was approved for the treatment of soft-tissue sarcoma (van der Graaf et al. 2012). However, therehas been no conclusive report regarding the response ofCCS to such treatments. Therefore, a novel therapeutic strat-egy is required to improve clinical outcome in CCS.
Patient-derived cancer models are valuable tools for study-ing the molecular backgrounds of malignant phenotypes, ex-amining the roles of genes in carcinogenesis, and investigatingthe effects and mode of actions of anti-cancer drugs (Iorioet al. 2016). Despite the urgent need for novel therapeuticstrategies in CCS, a small number of derived cell lines havebeen successfully established (Epstein et al. 1984; Sonobeet al. 1993; Takenouchi et al. 1994; Brown et al. 1995; Liaoet al. 1996; Hiraga et al. 1997; Crnalic et al. 2002; Moritakeet al. 2002; Schaefer et al. 2002; Schaefer et al. 2004; Daviset al. 2006; Outani et al. 2014). Establishing additional CCScell lines as well as xenograft models is thus required for thedevelopment of novel therapeutic strategies for this disease.
In this study, we established two patient-derived xenografts(PDXs) and three stable cell lines from CCS. We then exam-ined their morphological and functional characteristics, pro-tein expression profile, and response to anti-cancer drugs. Theuse of these preclinical models might help to elucidate themolecular mechanisms underlying the poor prognosis associ-ated with CCS, and facilitate the development of novel thera-peutic strategies for this malignancy.
Materials and Methods
Patient background The patient-derived cancer models weregenerated from a 43-yr-old female patient with CCS in theNational Cancer Center Hospital. The tumor wasmultinodularand located in the left thigh with invasion into the femur(Fig. 1a). Multiple lymph node metastases were found bycomputed tomography (Fig. 1b). RT-PCR suggested the fu-sion of EWSR1 with ATF1 in the tumor cells from the biopsysample and surgically resected specimen (Supplementary Fig.1). Tumor histology is shown in Fig. 1c. Sanger sequencingconfirmed the presence of this fusion in the biopsy sample(Fig. 1d) and surgically resected specimen (Fig. 1e). The pa-tient was treated with left hip disarticulation and postoperativeradiotherapy targeting lymph node metastases inside the pel-vis. The patient died from the disease two mo after surgery.This study was approved by the ethics committee of theNational Cancer Center, and written informed consent wasobtained from the patient.
Patient-derived xenografts Several CCS tissue pieces, ob-tained by biopsy or surgical resection, were subcutaneouslyengrafted with a 13-gauge transplant needle into the hind
bilateral flanks of 6–12-wk-old female severe immunodefi-cient NOD.Cg-Prkdcscid Il2rgtm1Sug/Jic (also known asNOD/Shi-scid IL-2Rγnull or NOG) mice (Central Institute forExperimental Animals, Tokyo, Japan). When the tumorsreached 500–1000 mm3, they were transplanted into anotherrecipient mouse. Tumor size was measured periodically usingdigital calipers (SuperCaliper, Mitutoyo, Kanagawa, Japan).Tumor volume was calculated as π/6 × length × width ×thickness (Tomayko and Reynolds 1989). After two passages,the tumors were cryopreserved using Cellbanker 1 plus(Takara Bio, Shiga, Japan) in liquid nitrogen. All animal ex-periments were performed in accordance with the guidelinesfor Animal Experiments of the National Cancer Center andapproved by the Institutional Committee for Ethics of AnimalExperimentation.
Primary tissue culture Tumor tissue was minced with scis-sors and the cells were seeded in a tissue culture plate (ThermoFisher Scientific, Waltham, MA). The cells were maintainedin DMEM medium (Sigma-Aldrich, St. Louis, MO) supple-mented with 10% heat-inactivated fetal bovine serum (FBS;Gibco, Grand Island, NY), 100 U penicillin G, and 100 μg/mlstreptomycin (Gibco) at 37°C in a humidified atmosphere of5% CO2. The culture medium was changed once or twice perwk. When cells reached sub-confluence, they were dispersedwith 0.1% trypsin-EDTA (Gibco) and seeded in a new cultureplate. Cells were maintained for more than 30 mo and 100passages.
Immunohistochemical analysis of CCS cells Tumor cellswere detached through trypsin treatment, and cell suspensionswere solidified using iPGell (Genostaff, Tokyo, Japan) ac-cording to the manufacturer’s instructions. Cell masses werefixed with 10% formalin and embedded in paraffin. Cellblocks were cut into sections, which were processed forimmunolabeling and H&E staining. Sections were incubatedwith antibodies against the following proteins: S100 (poly-clonal, 1:2000), HMB45 (1:100), and MelanA (1:100) (allfrom Dako). Immunoreactivity was detected with theEnVision system (Dako).
Authentication and quality control of established cell lineGenomic DNA was extracted from the tumor tissues or celllines using AllPrep DNA/RNA Mini kits (Qiagen, Hilden,Germany), quantified using a NanoDrop 8000 (ThermoFisher Scientific), and stored at −80°C until use. To authenti-cate the cells, we analyzed short tandem repeats (STRs) at 10loci using STR multiplex assays (GenePrint 10; Promega,Madison, WI), according to the manufacturer’s instructions.Genomic DNA (500 pg) was amplified and then examinedusing a 3500xL Genetic Analyzer (Applied Biosystems,Foster City, CA). The data were analyzed usingPeakScanner software (Applied Biosystems) and the STR
164 SAKUMOTO ETAL.

profiles were compared with those recorded in public cellbanks including the American Type Culture Collection(ATCC), Deutsche Sammlung von Mikroorganismen undZellkulturen (DSMZ), and the Japanese Collection ofResearch Bioresources Cell Bank (JCRB) for referencematching.
DNA in the culture medium was examined to rule out thepossibility of contamination by mycoplasma. Briefly, DNAwas isolated from the medium of cultures at 70–90%confluency, heated at 95°C for 10 min, and then amplifiedusing the e-Myco Mycoplasma PCR Detection Kit (IntronBiotechnology, Gyeonggi-do, Korea). The amplified DNAwas separated by 1.5% agarose gel electrophoresis, stainedwith Midori Green Advanced (Nippon Genetics, Tokyo,Japan), and detected using an Amersham Imager 600 (GEHealthcare Biosciences, Little Chalfont, UK).
Detection of fusion gene product by RT-PCR and sangersequencing Total RNA (1 μg) was used for the reverse tran-scription (RT) reaction with Superscript III reverse transcrip-tase (Invitrogen, Carlsbad, CA) according to the manufac-turer’s instructions. PCR amplifications were performed usinga 25-μl reaction volume containing 1 unit of PlatinumTaqpolymerase (Thermo Fisher Scientific, Waltham, MA),0.5 μM each of the EWS1 forward primer EWS225F, 5′-ACAGTTATCCCCAGGTACCTGGG-3′ and the ATF1 re-verse primer ATF803R, 5′-GGGGGTCATCTGTCTTAGTTGTCTG-3′, and 1 μl of cDNA (Panagopoulos et al. 2002).
The amplification program consisted of an initial denaturationat 94°C for 2 min and then 40 cycles of denaturation at 94°Cfor 15 s, annealing at 57°C for 30 s, extension at 68°C for 30 s,and a final extension at 72°C for 5 min using the GeneAmpPCR System 9700 (Applied Biosystems). The sequence datawere matched against the EWSR1 (NM_001163285.1) andATF1 (NM_005171.4) sequences, using BLAST (NIH,Bethesda, MD).
Cell growth analysis The growth characteristics of the cellline were analyzed as follows. Cells were seeded in triplicatein 96-well culture plates at 2 or 4 × 10³ cells/well. Over thenext 1–4 days, tumor cell proliferation was evaluated usingthe Cell Counting Kit (CCK)-8 kit (Dojindo MolecularTechnologies, Kumamoto, Japan), according to the manufac-turer’s protocol. Briefly, CCK-8 reagent was added to eachwell, which was followed by incubation at 37°C for 2 h. Theabsorbance at 450 nmwasmeasured using a microplate reader(Bio-Rad, Hercules, CA) and plotted as a function of daysafter cell seeding. The PCR products were purified withExoSAP-IT (Affymetrix) and direct sequencing was per-formed using BigDye v3.1 Cycle Sequencing Kit (AppliedBiosystems) on the Applied Biosystems 3130xL by Eurofingenomics (Japan).
Colony formation assay For colony formation assays, thebottom of a 35-mm dish was coated with 0.5% low meltingagarose (Noble agar; Sigma-Aldrich) with Dulbecco’s
Fig. 1 Characteristics of original clear cell sarcoma tumor tissue in thisstudy. (a) T2-weighted magnetic resonance image showing amultinodular soft tissue mass in the left thigh (arrow). (b) Commutedtomography showed an enlarged external iliac lymph node (arrow).
H&E staining of the surgically resected sample (c). Original magnifica-tion is 400×. Sanger sequencing of the gene fusion in surgically resectedtumor (d) and biopsied (e) tissues.
PATIENT-DERIVED CLEAR CELL SARCOMA MODEL 165

Modified Eagle’s Medium (DMEM) supplemented with 10%FBS and penicillin/streptomycin (Thermo Fisher Scientific).Wells were then covered with 0.33% agarose containing5 × 104 cells. The plates were incubated at 37°C and 5%CO2 for 4 weeks, and colonies containing more than 50 cellswere identified using a Primo Vert inverted microscope(Keyence). The assay was performed in duplicate.
Spheroid formation assay For spheroid formation assays,1 × 105 cells were seeded with DMEM containing 10% FBSin 6-cm plates (Ultra Low Culture Dish, Thermo FisherScience). The cells were incubated in a humidified atmospherecontaining 5% CO2 at 37°C. Two weeks after inoculation, thepresence of spheroids was confirmed by microscopic observa-tion (Keyence). All assays were performed in duplicate.
Cell invasion assay Invasion assays were performed usingBD Biocoat Matrigel Invasion Chambers (BD Biosciences,Bedford, MA) according to the manufacturer’s instructions.Briefly, cells were plated with number of 2 × 10⁵, 1.0 × 10⁵,or 0.5 × 10⁵ were plated in serum-free DMEM in the upperchamber. DMEM containing 10% FBS was added to the bot-tom chamber. After 5 days of culturing, invading cells on thebottom surface were fixed and stained; three separate areaswere counted at ×100 magnification. Percent invasion wascalculated by subtracting the control chamber ratio from thenumber of cells in the Matrigel chamber.
Proteomic analysis Filter-aided sample preparation (FASP)was performed to digest the proteins as previously described(Wisniewski et al. 2009). Briefly, proteins were loaded onmicrocon-30 kDa filters. Following two washes with urea,proteins were alkylated with 50 mM iodoacetamide. Filterswere washed twice with urea and twice with 40 mM ammo-nium bicarbonate, and digested overnight with trypsin (1∶50;w/w) at 37°C. The resulting peptides were collected by
centrifugation. The filters were rinsed twice with 40 μlNH4HCO3 and 0.5 M NaCl, and dried using a SpeedVac con-centrator (Thermo Fisher Scientific).
Peptides were separated by reverse-phase chromatographyusing a 15-cm column (inner diameter 75 μm, 3 μm C18-AQmedia), using a nanoflow high performance liquid chromatog-raphy (HPLC) system (AMR, Tokyo, Japan). HPLC wascoupled on-line, via a nanoelectrospray ion source, to aLTQ-Orbitrap mass spectrometer (Thermo Fisher Scientific).Peptides were loaded onto the column with a 170-min gradi-ent from 5% to 45% of 90% (v/v) CH3CN and 0.1% (v/v)formic acid at a flow rate of 250 nl/min. Mass spectra wereacquired in the positive ion mode applying a data-dependentautomatic switch between survey scan and tandemmass spec-tra (MS/MS) acquisition. Samples were analyzed using the‘top 10’ method, acquiring one Orbitrap survey scan in themass range of m/z 350–1800 followed by MS/MS of the fivemost intense ions in the LTQ. The target value in the Orbitrapwas 500,000 ions for the survey scan at a resolution of60,000 at m/z 400. Fragmentation in the LTQ was performedby collision-induced dissociation with a target value of 10,000ions. The ion selection threshold was 500 counts.
MS/MS spectra were searched against the Swiss-Prot data-base (Homo sapiens, 20,205 sequences in the SwissProt_2015_09.fasta file) using the MASCOT search engine(version 2.5.1; Matrix Science, UK). The search included var-iable modifications of methionine oxidation and serine, thre-onine, and tyrosine phosphorylations, and fixed modificationof cysteine carbamidomethylation. A maximum of onemiscleavage was allowed. The maximal precursor ion masstolerance was set to ±10 ppm, whereas the fragment ion masstolerance was set to ±0.8 Da. Peptide charge was 2+ and 3 + .
Sensitivity to anti-cancer drugs Cells were seeded in a 384-well plate at 5× 10³ cells/well inDMEMsupplementedwith 10%FBS and 1% antibiotic-antimycotic (Thermo Fisher Scientific)
Biopsy sampleBiopsy
SurgeryTumor tissue
xenograft
NCC-CCS1B-X2-C1
xenograft NCC-CCS1B-C1
NCC-CCS1-X4-C1
Cell linesFig. 2 Overall work flow for celland xenograft passage from clearcell sarcoma specimen.Xenografts were established fromboth biopsy and surgically-resected tumor tissues. The celllines were established from xe-nografts using biopsy andsurgically-resected samples. Thenames of the cell lines are shownunder the pictures of the cell lines.
166 SAKUMOTO ETAL.

and incubated at 37°C in a humidified atmosphere of 5% CO2.The following day, cells were treated with various concentrationsof anti-cancer reagents (Selleck Chemicals, Houston, TX). After72 h, survival rates were assessed using CCK-8, according to themanufacturer’s protocol. Anti-cancer drugs used in this study arelisted in Supplementary Table 1.
Kinase activity assay Each sample was lysed and analyzedindependently on a separate array. Kinomic profiling of 10 μgof protein lysate (lysed inM-Per lysis buffer, Pierce Scientific,containing 1:100 Halt’s protease and phosphatase inhibitors(Pierce Scientific)) was conducted on the PamStation 12 plat-form, manufactured by PamGene (‘s-Hertogenbosch,
Netherlands). Protein concentrations were determined byperforming a Bradford protein assay (BioRad, Hercules,CA), and the lysates were dissolved in kinase buffer.Subsequently, the lysates were loaded onto the PamChipPTK, on which tyrosine kinase substrate peptides are arrayed.FITC-conjugated phospho-specific antibodies (PamGene)were used for the detection of phospho-tyrosine during andafter pumping lysates through the array. The status of peptidephosphorylation was monitored using a computer-controlledCCD camera. The phosphorylation status of substrate peptideswas analyzed using Evolve (PamGene) and BioNavigator(PamGene). Peptide spot intensity was captured across multi-ple exposure times (10, 20, 50,100, 200 ms) and calculated as
Fig. 3 Histological analysis and growth curves of xenograft tumorsderived from biopsy or surgical specimens of clear cell sarcoma and theirfusion gene analysis the tumor consisted of intersecting fascicles ofpleomorphic, spindle-shaped cells exhibiting an eosinophilic cytoplasm.H&E staining of the second generation xenograft tissue derived from
biopsy sample (a) and the fourth generation xenograft tissue derived fromsurgically resected sample (b). Original magnification: 400× (a, b). Thexenograft tumors started to increase in size around 20 d after transplantation(c, d). Sanger sequencing revealed the presence of a unique fusion gene inboth xenograft tissues (e, f).
PATIENT-DERIVED CLEAR CELL SARCOMA MODEL 167

described previously (Anderson et al. 2015). The intensity ofpeptide phosphorylation was used for unsupervised hierarchi-cal clustering using heatmap.2 R script (https://cran.r-project.org/web/packages/gplots/index.html). The prediction ofupstream kinases was achieved using the Kinexus KinasePredictor (www.phosphonet.ca). Pathways involving thepredicted kinases were predicted by DAVID functionalannotation tools (Huang et al. 2009a, b).
Statistical analysis Kyoto Encyclopedia of Genes andGenomes (KEGG) pathway annotations were inferred usingthe Database for Annotation, Visualization and IntegrationDiscovery (DAVID) software (http://david.abcc.ncifcrf.gov/)(Altermann and Klaenhammer 2005). Significance is indicat-ed based on the p-value for each category and differences wereconsidered significant at p < 0.05. The R package ‘treemap’was used for plotting (Tyanova et al. 2016).
Results
The overall work flow for establishing the patient-derivedcancer model in this study is illustrated in Fig. 2. We usedboth biopsy samples and surgically resected tumor tissue.We also established cell lines from biopsy samples andPDXs from biopsy samples or surgically-resected tissue.
b
200 μm
a c
ed f
hg i
Fig. 4 Phenotypic analysis of the clear cell sarcoma-derived cell lines.Phase-contrast images of NCC-CCS1 (a), NCC-CCS1B-X2-C1 (b), andNCC-CCS1-X4-C1 (c) cells cultured in a serum-containing medium.Phase-contrast images of NCC-CCS1-C1 (d), NCC-CCS1B-X2-C1 (e),
and NCC-CCS1-X4-C1 ( f ) cells cultured in ultra-low attachment culturedishes. Morphology of NCC-CCS1 (g), NCC-CCS1B-X2-C1 (h), andNCC-CCS1-X4-C1 (i) cells in soft agar. NCC-CCS1 and NCC-CCS1B-X2-C1Cells exhibited anchorage-independent growth on soft agar.
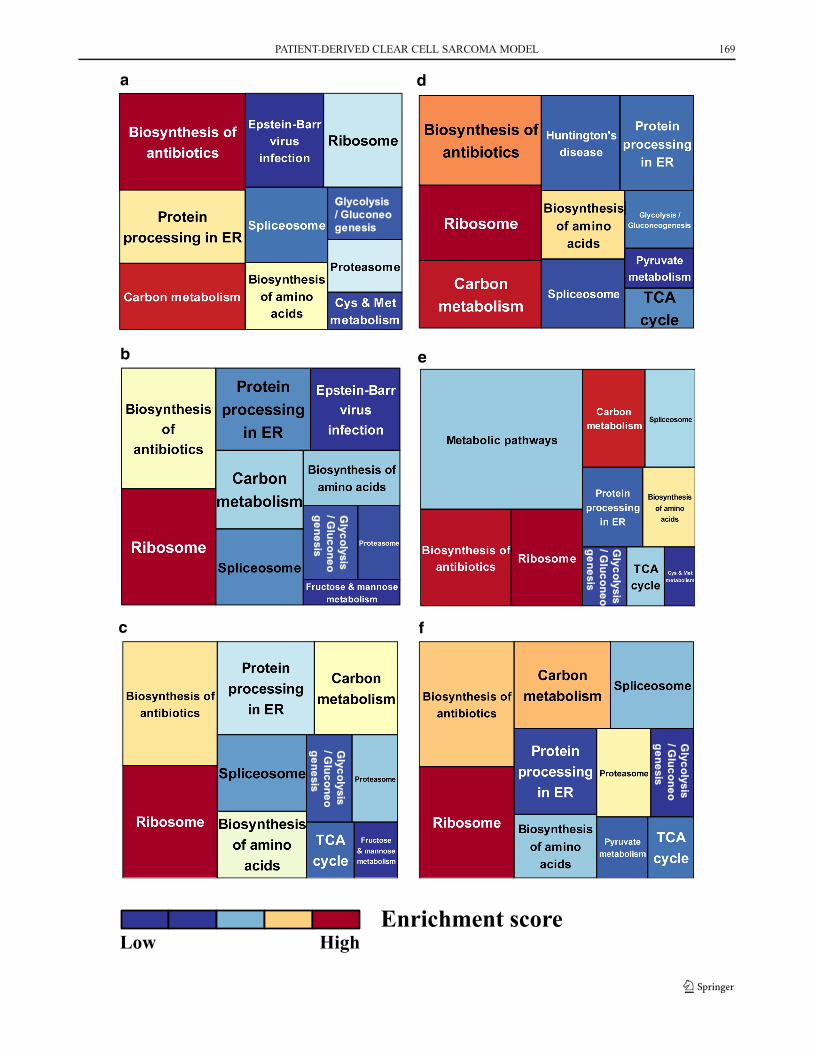
�Fig. 5 Tree map view of Kyoto encyclopedia of genes and genomes(KEGG) pathway categories for proteins identified by mass spectrometryfrom clear cell sarcoma-derived cell lines and xenografts. (a–f) KEGG path-way categories for proteins enriched in surgically resected tumor tissue (a),NCC-CCS1B-X2 cells (b), NCC-CCS1-X4 tissue (c), NCC-CCS1B-X2-C1cells (d), NCC-CCS1B-C1 cells (e), and NCC-CCS1-X4-C1 cells ( f ) areshown as a tree map. The names of the pathways are shown in each rectan-gle. The color and size of individual areas correspond to the degree ofenrichment and the number of proteins assigned to the category, respectively.P < 0.05 was considered statistically significant for pathway enrichment.
168 SAKUMOTO ETAL.
a
GGlycolysis
/ Gluconeo
genesis
Glycolysis
/Gluconeo
genesis
Glycolysis
/Gluconeo
genesis
Glycolysis
/Gluconeo
genesis
Glycolysis
/Gluconeo
genesis
Enrichment scoreLow High
b
c
d
e
f
PATIENT-DERIVED CLEAR CELL SARCOMA MODEL 169

Although we tried to establish cell lines from surgicallyresected tumor tissue, the cells did not grow with in vitrotissue culture conditions. The names of the cell lines are pro-vided in Fig. 2. The cell line directly established from thebiopsied tumor tissue was named NCC-CCS1B-C1. The cellline derived from xenograft tumor tissue passaged once wasnamed NCC-CCS1B-X2-C1. The xenograft from surgically-resected tumor samples (e.g. the first generation xenograft)was further passaged twice, frozen once in liquid nitrogen,and subcutaneously engrafted. The cell line prepared fromthe corresponding tumor tissue was named NCC-CCS1-X4-C1.
PDX growth and morphology The patient-derived biopsysamples and surgically resected tumor tissue were subcutane-ously inoculated into immune-deficient mice. After propaga-tion in vivo, they were serially transplanted twice. Xenografttumor histology of the second generation is shown in Fig. 3a,and that of the fourth generation of the PDX from surgicallyresected tissue is shown in Fig. 3b. Histological features werequite similar between the two samples, and the original tumortissue (Fig. 1c). Both in the PDXs from biopsy sample and thesurgically-resected ones, the tumors started to increase in sizearound 20 d after transplantation, and reached the size enoughfor transplantation (Figs. 3c and d). Third-generation xeno-graft tissues of both PDXs were frozen and later inoculatedin mice; this confirmed successful tumor propagation afterprolonged storage. RT-PCR identified the gene fusion in bothPDXs (Supplementary Fig. 1). Sanger sequencing confirmedthe presence of the fusion gene transcript, EWSR1-ATF1, inboth xenograft tumors (Fig. 3e and f).
Authentication of established cell lines We examined thestatus of 10 STRs in the original tumor tissue, PDXs, and celllines (Supplementary Table 2). All samples exhibited the iden-tical STR pattern, except at the TH01 loci. We therefore con-cluded that the established PDXs and cell lines were derivedfrom the same patient. A database search confirmed that theobtained STR patterns did not match any STR signatures fromcell lines in public cell banks such as ATCC, DSMZ, andJRCB. Therefore, we concluded that the established PDXsand cell lines were novel.
We investigated the presence of mycoplasma DNA in thecell lines by PCR, and found no evidence of contamination(data not shown).
Phenotypic characterization of established cell lines Thepresence of unique fusion gene products in the cell lines wasconfirmed by both RT-PCR (Supplementary Fig. 1) andSanger sequencing (Supplementary Fig. 2). The threeestablished cell lines were spindle shaped (Fig. 4a–c), consis-tent with the morphology of cells in the original tumor tissue.When the cells were seeded on low-attachment tissue culture
dishes, cell lines from the biopsied tumor tissues formedspheroids, whereas the cell line from surgically resected tis-sue, NCC-CCS1-X4-C1, did not (Fig. 4d–f). Also NCC-CCS1B-C1 and NCC-CCS1B-X2-C1cells formed coloniesbut NCC-CCS1-X4-C1 cells did not when they were seededin soft agar (Fig. 4g–i). These observations might suggest thattumor tissues and xenografts are heterogeneous. We then con-firmed the presence of the fusion gene, EWSR1-ATF1, in allthree cell lines by Sanger sequencing (Supplementary Fig. 2).In addition, the cells showed continual growth when differentnumbers were seeded (Supplementary Fig. 3a–c), indicatingthat these cells would be useful for cell growth experiments.The population doubling times of individual cell lines werefound to be 20, 20, and 17 h for NCC-CCS1B-X2-C1, NCC-CCS1B-C1, and NCC-CCS1-X4-C1 cells, respectively. Wefound that all three cell lines had equivalent invasion ability(Supplementary Fig. 3d–g). The expression of typical bio-marker gene products was evaluated by immunohistochemis-try staining (Supplementary Fig. 4). Positive expression ofS100 was observed in NCC-CCS1B-X2-C1, NCC-CCS1B-C1, and NCC-CCS1-X4-C1 cells. Positive but sparse expres-sion of HMB45 was observed in NCC-CCS1B-C1 cells, and100% of cells exhibited positive expression of HMB45 inNCC-CCS1B-X2-C1 and NCC-CCS1-X4-C1 cell lines.NCC-CCS1-X4-C1 cells showed negative expression ofMelan A; however, a subset of NCC-CCS1B-X2-C1 cellsexhibited positive expression of this marker. In addition, 70–80% of NCC-CCS1-X4-C1 cells showed positive expressionof Melan A.
Proteomic profiling Protein expression profiles of the prima-ry tumor and a cell line were obtained by mass spectrometry(Supplementary Table 3–8). The proteins identified in the in-dividual samples were classified according to their possiblefunctions based on data from the KEGG database, and the top10 most enriched pathways are presented in treemap format(Fig. 5 and Supplementary Table 7), wherein area size is in-dicative of the number of proteins allocated, and the colorsindicate the degree of statistical enrichment. In the primarytumor, proteins in the biosynthesis of antibiotics pathwaywerepredominantly detected and enriched (Fig. 5a). In the PDXlines, the overall appearance of the treemap was very similarto that of the primary tumor. Proteins from the biosynthesis ofantibiotics pathway were mostly detected, and the ribosomepathway was the most significantly enriched pathway (Fig.5b–c).
In the cell line, the overall appearance of the treemap wassimilar to that of PDX lines rather than that of the primarytumor. Proteins from the biosynthesis of antibiotics or meta-bolic pathway were mostly detected, and the ribosome path-way was the most significantly enriched pathway (Fig. 5d–f).The enrichment scores for the biosynthesis of antibiotics, car-bonmetabolism, protein processing in endoplasmic reticulum,
170 SAKUMOTO ETAL.

Shared pathwaysa
b
c
Enrichment score
Low High
NCC-CCS1B-X2-C1
NCC-CCS1B-C1
NCC-CCS1-X4-C1
NCC-CCS1B-X2
NCC-CCS1-X4
PDXMerged data of
PDX
Merged data of cell lines
Unique pathways
Fig. 6 Tree map view of Kyoto encyclopedia of genes and genomes(KEGG) pathway categories for proteins identified by mass spectrometryfrom clear cell sarcoma-derived cell lines and xenografts. (left panel)Venn diagrams showing a comparison among all cell lines (a), amongall patient-derived xenograft (PDX) lines (b), and between integrated celllines and integrated PDX lines (c). (middle panel) KEGG pathway cate-gories for proteins common to all cell lines (a), all PDX lines (b), and bothintegrated cell lines and integrated PDX lines (b) are shown as a tree map.
(right panel) KEGG pathway categories for proteins unique to all celllines (a), all PDX lines (b), and both integrated cell lines and integratedPDX lines (c) are shown as a tree map. The names of pathways are shownin each rectangle. The color and size of individual areas correspond to thedegree of enrichment and the number of proteins assigned to the category,respectively. P < 0.05 was considered statistically significant for pathwayenrichment.
PATIENT-DERIVED CLEAR CELL SARCOMA MODEL 171

[doxorubicin] μM
)%(
ytilibaivlleC
0
50
100
10-4 10-3 10-2 10-1 100 101 102
b
[ponatinib] μM
)%(
ytilibaivlleC
0
50
100
10-2 10-1 10-0 101 102
[vandetanib] μM
Cell
viab
ility
(%)
0
50
100
10-2 10-1 10-0 101 102
cIC
50(µ
M)
10
5
0
ed
NCC-CCS1B-X2-C1
)%(
ytilibaivlleC
50
100
150
0
a
NCC-CCS1B1-C1 NCC-CCS1-X4-C1
172 SAKUMOTO ETAL.

and cysteine and methionine metabolism pathways were de-creased in the PDX and cell lines compared to those in theoriginal tumor, and the enrichment score for the ribosomepathway was higher in the cell lines (Fig. 5).
A treemap of common pathways among all samples isshown in Fig. 6. Biosynthesis of antibiotics, ribosome, andcarbon metabolism pathways were for the most part enrichedin all cell lines, indicating representative pathways for thesesamples (Fig. 6a). Ribosome, biosynthesis of antibiotics, andbiosynthesis of amino acids pathways were enriched in both
PDX models (Fig. 6b). Ribosome, biosynthesis of antibiotics,and carbon metabolism pathways were enriched, when com-paring PDX lines and cells (Fig. 6c). The enriched pathwaysin the primary and established cell lines, as well as the com-mon ones, are shown in Supplementary Table 9.
Sensitivity of established cell lines to anti-cancer drugsSensitivity to treatments with tyrosine kinase inhibitors wasassessed in the cells (Fig. 7a, Supplementary Table 1). Thecells were treated with tyrosine kinase inhibitors at a fixedconcentration of 10 μM. Among tyrosine kinase inhibitorsexamined, two reduced the cell viability by more than 90%(Supplementary Table 10). The half-maximal inhibitory con-centrations of these tyrosine kinase inhibitors as well as doxo-rubicin, dacarbazine, ifosfamide, mesna, and cisplatin werecalculated by treating the cells with different concentrations,and the results are summarized in Supplementary Table 11.We found that the three cell lines showed sensitivity toponatinib, vandetanib, and doxorubicin (Fig.7b–d). The IC50
�Fig. 7 Effects of tyrosine kinase inhibitors on clear cell sarcoma (CCS) cellgrowth. The effects of tyrosine kinase inhibitors, at fixed concentrations, oncell growth were monitored in established CCS cell lines using CCK-8assays (a). The anti-cancer drugs examined are listed in supplementaryTable 1. Two tyrosine kinase inhibitors reduced cell growth by more than90% (supplementary Table 10). The half-maximal inhibitory concentrationvalues were monitored for these two tyrosine kinases and commonly usedanti-cancer drugs for clear cell sarcomas (b) (supplementary Table 11). TheIC50 values for ponatinib, vandetanib, and doxorubicin were calculated, andthere was no significant difference among the cell lines (c).
10.7
a b
c
Cluster ACluster B
XenograftCell line Intensity0 15
Prin
ciple
com
pone
nt 2
Principle component 1
Xenograft Cell lineXenograftCell line Correlation
coefficiency
Fig 8. Kinase activity wassimilar in clear cell sarcomaxenografts and cell lines.Similarities in phosphorylationactivity among xenograft and cellline samples were examined bymeasuring correlation coefficientsafter utilizing a PamChip PTKarray (a). Principal componentanalysis of phosphorylationactivity for the xenografts and celllines (b). Unsupervisedhierarchical clustering analysisfor the xenografts and cell lines(c).
PATIENT-DERIVED CLEAR CELL SARCOMA MODEL 173
values were not significantly different among the three celllines (Supplementary Table 11, Fig. 7e).
Profiling of tyrosine kinase activity Phosphorylation activityin each lysate sample was analyzed using immobilized sub-strate peptide arrays of tyrosine kinases. Each sample wascharacterized based on the phosphorylation status of 140 sub-strate peptides using PamChip. The degree of phosphorylationof substrate peptides was considered as the phosphorylationactivity of each sample. Similarities in phosphorylation activ-ity between xenograft and cell line samples were examined bymeasuring correlation coefficients (Fig. 8a). One versus onecomparison between the samples was performed, and the xe-nografts and cell lines showed obviously high similarity with-in the same sample groups (Fig. 8a). Principal componentanalysis using phosphorylation activity revealed that the xe-nografts and cell lines had distinct profiles, and that phosphor-ylation activity among the cell lines was more similar (Fig.8b). When the samples were grouped by unsupervised hierar-chical clustering analysis based on phosphorylation activity,the xenografts and cell lines were clearly separated (Fig. 8c).Substrate peptides were grouped into clusters A and B (Fig.8c). Cluster A and B comprised 28 and 112 substrate peptides,respectively. Peptides in cluster Awere phosphorylated by allsamples examined in this study. In addition, the kinase activityfor these peptides was preserved among xenografts and celllines. In contrast, phosphorylation of peptides in cluster B wasenhanced when treated with protein lysates from the cell lines.The kinase activities for these peptides were considerably dif-ferent between xenografts and cell lines. These observationssuggested that although all cancer models in this study origi-nated from the same cancer patient, the kinase activities ofxenografts and cell lines were substantially different. In addi-tion, among the same model type, the overall kinase activitywas similar. This highlights the need to understand the molec-ular characteristics of cancer models, and select these accord-ing to experimental purposes.
Discussion
In vitro and in vivo cancer models are inevitably required toinvestigate the molecular basis of carcinogenesis and cancerprogression, and develop novel therapies. Although the num-ber of patients with CCS is quite limited, CCS cell lines werereported in previous studies (Epstein et al. 1984; Sonobe et al.1990; Takenouchi et al. 1994; Brown et al. 1995; Liao et al.1996; Hiraga et al. 1997; Crnalic et al. 2002; Moritake et al.2002; Schaefer et al. 2002; Davis et al. 2006; Outani et al.2014). Our cell lines are unique because PDXs and cell lineswere derived from the same CCS patient. The cell lines andPDXs have unique characters, and their complementary usewill be helpful to further our understanding of diseases. For
example, the cell lines consistently and indefinitely replicate,and we can easily obtain in vitro results with the expectationthat the results can be reproduced by other researchers.Moreover, the functional effects of gene expression and treat-ments with reagents on cell behavior can be monitored usingliving cells. Additionally, high throughput drug assays can beperformed using cell lines and lab automation. However, con-ditions for growing cells in culture are different from those ofnative tumors, and the limitation of cell lines as pre-clinicalmodels has been pointed out (Li et al. 2008; Paul et al. 2010).PDXs can provide more natural experimental conditions(Wang et al. 2017). Although the presence of unique muta-tions can serve as a predictive biomarker, there remains aconsiderable number of cases where genetic biomarkers failto identify effective drugs or applicable clinical trials. Theutility of PDXs as a platform to establish predictive bio-markers has been expected, and concordant responses to treat-ment were reported between PDXs and patients (Byrne et al.2017). However, drug response monitoring requires increasedefforts using PDX models, as opposed to cell lines; however,high throughput drug screening using PDXs might not alwaysbe feasible. Thus, the combined use of cell lines and PDXsshould be considered. In this sense, paired PDXs and cell linesrepresent a unique and intriguing model system.
Our proteomic studies suggested that established PDXsand cell lines have similar but distinct proteome profiles,which also differed from those of the original tumor. Theproteome data suggested that although the histological appear-ances of PDXs were maintained, the molecular backgroundschange during the process of tissue implantation. It is naturalthat the proteomes of cell lines are different from those oforiginal and PDX tumors, because tissue culture conditionsare artificial. Novel protocols to establish model systems withmore similar molecular backgrounds are desirable.Alternatively, by identifying common molecular back-grounds, we will be able to determine the best use ofestablished models.
This study included only one case of CCS. Considering theheterogeneity of clinical CCS, tumor tissues from more CCSpatients should be subjected to the establishment of modelsystems. Because CCS is a rare cancer, continuous and per-sistent efforts will be required to obtain sufficient numbers ofPDXs and cell lines. However, this is worthwhile to achieve abetter understanding of CCS and to improve clinical outcomesin CCS patients.
Conclusions
The present study details the establishment and proteomiccharacterization of patient-derived cancer models of CCS.Notably, during the process of establishment, the modelsretained the original characteristics of CCS, including gene
174 SAKUMOTO ETAL.

fusion expression, morphology, and immunohistochemicalfeatures. Proteomic analysis revealed similar, but not identical,protein expression patterns between the original tumor tissueand models. Among tyrosine kinase inhibitors examined inthis study, ponatinib and vandetanib exhibited suppressiveeffects on cell proliferation at significantly low concentrations.These anti-cancer drugs are candidates for the treatment ofCCS, and the molecular mechanisms associated with theirinhibitory effects are worth investigating in pre-clinical stud-ies. For this, our CCS cell lines will be useful models to in-vestigate the molecular basis of the anti-cancer effects of suchtyrosine kinase inhibitors. Accumulating clinical outcome andin vitro drug sensitivity data will be required to evaluate theutility of the established models. Our study included a singleCCS case, and conclusive results cannot be obtained from alimited number of cases. The establishment of more cell lineswith detailed clinical and pathological data frommultiple CCScases will facilitate translational research for CCS.
Acknowledgments We thank Drs. Y. Minami, K. Shimizu, T. Mori, T.Uehara, M. Sugawara, Y. Araki, S. Toki, andMs. R. Nakano (Division ofMusculoskeletal Oncology, National Cancer Center Hospital) for sam-pling tumor tissue specimens from surgically-resected materials. Wewould like to thank Editage (www.editage.jp) for English languageediting and constructive comments regarding the manuscript.
Funding This work was supported by the National Cancer CenterResearch and Development Fund [26-A-3, 26-A-9, and 29-A-2].
Compliance with ethical standards
Conflict of interest There is no conflict of interest to declare regardingthis study.
Abbreviations DAVID, Database for Annotation, Visualization andIntegration Discovery; KEGG, Kyoto Encyclopedia of Genes andGenomes; LC-MS/MS, liquid-chromatography combinedmass spectrometry
References
Altermann E, Klaenhammer TR (2005) PathwayVoyager: pathway map-ping using the Kyoto encyclopedia of genes and genomes (KEGG)database. BMC Genomics 6:60
Anderson JC, Willey CD, Mehta A, Welaya K, Chen D, Duarte CW,Ghatalia P, Arafat W, Madan A, Sudarshan S, Naik G, GrizzleWE, Choueiri TK, Sonpavde G (2015) High throughput Kinomicprofiling of human clear cell renal cell carcinoma identifies kinaseactivity dependent molecular subtypes. PLoS One 10:e0139267
Bridge JA, Sreekantaiah C, Neff JR, Sandberg AA (1991) Cytogeneticfindings in clear cell sarcoma of tendons and aponeuroses.Malignant melanoma of soft parts. Cancer Genet Cytogenet 52:101–106
Brown AD, Lopez-Terrada D, Denny C, Lee KA (1995) Promoters con-taining ATF-binding sites are de-regulated in cells that express theEWS/ATF1 oncogene. Oncogene 10:1749–1756
Byrne AT, Alferez DG, Amant F, Annibali D, Arribas J, Biankin AV,Bruna A, Budinska E, Caldas C, Chang DK, Clarke RB, CleversH, Coukos G, Dangles-Marie V, Eckhardt SG, Gonzalez-Suarez E,Hermans E, HidalgoM, JarzabekMA, de Jong S, Jonkers J, Kemper
K, Lanfrancone L, Maelandsmo GM, Marangoni E, Marine JC,Medico E, Norum JH, Palmer HG, Peeper DS, Pelicci PG, Piris-Gimenez A, Roman-Roman S, Rueda OM, Seoane J, Serra V,Soucek L, Vanhecke D, Villanueva A, Vinolo E, Bertotti A,Trusolino L (2017) Interrogating open issues in cancer precisionmedicine with patient-derived xenografts. Nat Rev Cancer 17:254–268
Crnalic S, Panagopoulos I, Boquist L, Mandahl N, Stenling R,Lofvenberg R (2002) Establishment and characterisation of a humanclear cell sarcoma model in nude mice. Int J Cancer 101:505–511
Davis IJ, Kim JJ, Ozsolak F, Widlund HR, Rozenblatt-Rosen O, GranterSR, Du J, Fletcher JA, Denny CT, Lessnick SL, LinehanWM, KungAL, Fisher DE (2006) Oncogenic MITF dysregulation in clear cellsarcoma: defining the MiT family of human cancers. Cancer Cell 9:473–484
Deenik W, Mooi WJ, Rutgers EJ, Peterse JL, Hart AA, Kroon BB (1999)Clear cell sarcoma (malignant melanoma) of soft parts: a clinico-pathologic study of 30 cases. Cancer 86:969–975
EAM, JMM, AG R, DM F, KL M (1993) Clear cell sarcoma of tendonsand aponuroses: a clinicopathologic study of 58 cases with analysisof prognostic factors. Int J Surg Pathol 1:89–100
el-Naggar AK, Ordonez NG, Sara A, McLemore D, Batsakis JG (1991)Clear cell sarcomas and metastatic soft tissue melanomas. A flowcytometric comparison and prognostic implications. Cancer 67:2173–2179
Enzinger FM (1965) Clear-cell sarcoma of tendons and aponeuroses. Ananalysis of 21 cases. Cancer 18:1163–1174
Epstein AL, Martin AO, Kempson R (1984) Use of a newly establishedhuman cell line (SU-CCS-1) to demonstrate the relationship of clearcell sarcoma to malignant melanoma. Cancer Res 44:1265–1274
Ferrari A, Casanova M, Bisogno G, Mattke A, Meazza C, Gandola L,Sotti G, Cecchetto G, Harms D, Koscielniak E, Treuner J, Carli M(2002) Clear cell sarcoma of tendons and aponeuroses in pediatricpatients: a report from the Italian and German soft tissue sarcomacooperative group. Cancer 94:3269–3276
Finley JW, Hanypsiak B, McGrath B, Kraybill W, Gibbs JF (2001) Clearcell sarcoma: the Roswell Park experience. J Surg Oncol 77:16–20
Fletcher CDM, Bridge JA, Hogendoorn P, Mertens F (2013) WHO clas-sification of Tumours of soft tissue and bone, 4th Edition edn. WHOPress, Geneva
Hiraga H, Nojima T, Abe S, Yamashiro K, Yamawaki S, Kaneda K,Nagashima K (1997) Establishment of a new continuous clear cellsarcoma cell line. Morphological and cytogenetic characterizationand detection of chimaeric EWS/ATF-1 transcripts. Virchows Arch431:45–51
Huang d W, Sherman BT, Lempicki RA (2009a) Bioinformatics enrich-ment tools: paths toward the comprehensive functional analysis oflarge gene lists. Nucleic Acids Res 37:1–13
Huang d W, Sherman BT, Lempicki RA (2009b) Systematic and integra-tive analysis of large gene lists using DAVID bioinformatics re-sources. Nat Protoc 4:44–57
Iorio F, Knijnenburg TA, Vis DJ, Bignell GR, Menden MP, Schubert M,Aben N, Goncalves E, Barthorpe S, Lightfoot H, Cokelaer T,Greninger P, van Dyk E, Chang H, de Silva H, Heyn H, Deng X,Egan RK, Liu Q, Mironenko T, Mitropoulos X, Richardson L, WangJ, Zhang T, Moran S, Sayols S, Soleimani M, Tamborero D, Lopez-Bigas N, Ross-Macdonald P, Esteller M, Gray NS, Haber DA,Stratton MR, Benes CH, Wessels LF, Saez-Rodriguez J, McDermottU, Garnett MJ (2016) A landscape of pharmacogenomic interactionsin cancer. Cell 166:740–754
JR G, AL F, SW W (2013) Soft tissue tumors showing melanocyticdifferentiation, 6th edn. Elsevier, Philadelphia
Kawai A, Hosono A, Nakayama R, Matsumine A,Matsumoto S, Ueda T,Tsuchiya H, Beppu Y,MoriokaH,Yabe H (2007) Clear cell sarcomaof tendons and aponeuroses: a study of 75 patients. Cancer 109:109–116
PATIENT-DERIVED CLEAR CELL SARCOMA MODEL 175
Li A, Walling J, Kotliarov Y, Center A, Steed ME, Ahn SJ, RosenblumM, Mikkelsen T, Zenklusen JC, Fine HA (2008) Genomic changesand gene expression profiles reveal that established glioma cell linesare poorly representative of primary human gliomas. Mol CancerRes 6:21–30
Liao SK, Perng YP, Lee LA, Chang KS, Lai GM,Wong E, Ho YS (1996)Newly established MST-1 tumour cell line and tumour-infiltratinglymphocyte culture from a patient with soft tissue melanoma (clearcell sarcoma) and their potential applications to patient immunother-apy. Eur J Cancer 32a:346–356
Lucas DR, Nascimento AG, Sim FH (1992) Clear cell sarcoma of softtissues.Mayo Clinic experience with 35 cases. Am J Surg Pathol 16:1197–1204
Moritake H, Sugimoto T, Asada Y, YoshidaMA,Maehara Y, Epstein AL,Kuroda H (2002) Newly established clear cell sarcoma (malignantmelanoma of soft parts) cell line expressing melanoma-associatedMelan-a antigen and overexpressing C-MYC oncogene. CancerGenet Cytogenet 135:48–56
Outani H, Tanaka T, Wakamatsu T, Imura Y, Hamada K, Araki N, Itoh K,Yoshikawa H, Naka N (2014) Establishment of a novel clear cellsarcoma cell line (Hewga-CCS), and investigation of the antitumoreffects of pazopanib on Hewga-CCS. BMC Cancer 14:455
Panagopoulos I, Mertens F, Debiec-Rychter M, Isaksson M, Limon J,Kardas I, Domanski HA, Sciot R, Perek D, Crnalic S, Larsson O,Mandahl N (2002) Molecular genetic characterization of the EWS/ATF1 fusion gene in clear cell sarcoma of tendons and aponeuroses.Int J Cancer 99:560–567
Paul SM, Mytelka DS, Dunwiddie CT, Persinger CC, Munos BH,Lindborg SR, Schacht AL (2010) How to improve R&D productiv-ity: the pharmaceutical industry's grand challenge. Nat Rev DrugDiscov 9:203–214
Sara AS, Evans HL, Benjamin RS (1990) Malignant melanoma of softparts (clear cell sarcoma). A study of 17 cases, with emphasis onprognostic factors. Cancer 65:367–374
Schaefer KL, Brachwitz K, Wai DH, Braun Y, Diallo R, Korsching E,Eisenacher M, Voss R, Van Valen F, Baer C, Selle B, Spahn L, LiaoSK, Lee KA, Hogendoorn PC, Reifenberger G, Gabbert HE,Poremba C (2004) Expression profiling of t(12;22) positive clearcell sarcoma of soft tissue cell lines reveals characteristic up-regulation of potential new marker genes including ERBB3.Cancer Res 64:3395–3405
Schaefer KL, Wai DH, Poremba C, Korsching E, van Valen F, Ozaki T,BoeckerW, Dockhorn-Dworniczak B (2002) Characterization of the
malignant melanoma of soft-parts cell line GG-62 by expressionanalysis using DNA microarrays. Virchows Arch 440:476–484
Sonobe H, Furihata M, Iwata J, Ohtsuki Y, Mizobuchi H, Yamamoto H,Kumano O (1993) Establishment and characterization of a new hu-man clear-cell sarcoma cell-line, HS-MM. J Pathol 169:317–322
Sonobe H, Manabe Y, Furihata M, Iwata J, Hikita T, Tanimoto T, KiunaO, Oka T, Ohtsuki Y, Mizobuchi H et al (1990) Establishment andcharacterization of a human cell line, HS-MM, derived from a caseof clear cell sarcoma. Hum Cell 3:352–356
Takahira T, Oda Y, Tamiya S, Yamamoto H, Kawaguchi K, Kobayashi C,Iwamoto Y, Tsuneyoshi M (2004) Alterations of the p16INK4a/p14ARF pathway in clear cell sarcoma. Cancer Sci 95:651–655
Takenouchi T, Ito K, Kazama T, Ito M (1994) Establishment and charac-terization of a clear-cell sarcoma (malignant melanoma of soft parts)cell line. Arch Dermatol Res 286:254–260
Tomayko MM, Reynolds CP (1989) Determination of subcutaneous tu-mor size in athymic (nude) mice. Cancer Chemother Pharmacol 24:148–154
Tyanova S, Albrechtsen R, Kronqvist P, Cox J, MannM, Geiger T (2016)Proteomic maps of breast cancer subtypes. Nat Commun 7:10259
van der Graaf WT, Blay JY, Chawla SP, Kim DW, Bui-Nguyen B, CasaliPG, Schoffski P, Aglietta M, Staddon AP, Beppu Y, Le Cesne A,GelderblomH, Judson IR, Araki N, Ouali M,Marreaud S, Hodge R,Dewji MR, Coens C, Demetri GD, Fletcher CD, Dei Tos AP,Hohenberger P (2012) Pazopanib for metastatic soft-tissue sarcoma(PALETTE): a randomised, double-blind, placebo-controlled phase3 trial. Lancet 379:1879–1886
Wang D, Pham NA, Tong J, Sakashita S, Allo G, Kim L, Yanagawa N,Raghavan V, Wei Y, To C, Trinh QM, Starmans MH, Chan-Seng-Yue MA, Chadwick D, Li L, Zhu CQ, Liu N, Li M, Lee S,Ignatchenko V, Strumpf D, Taylor P, Moghal N, Liu G, BoutrosPC, Kislinger T, Pintilie M, Jurisica I, Shepherd FA, McPhersonJD, Muthuswamy L, MoranMF, Tsao MS (2017) Molecular hetero-geneity of non-small cell lung carcinoma patient-derived xenograftsclosely reflect their primary tumors. Int J Cancer 140:662–673
Wisniewski JR, Zougman A, Nagaraj N, Mann M (2009) Universal sam-ple preparation method for proteome analysis. Nat Methods 6:359–362
Zucman J, Delattre O, Desmaze C, Epstein AL, Stenman G, Speleman F,Fletchers CD, Aurias A, Thomas G (1993) EWS and ATF-1 genefusion induced by t(12;22) translocation in malignant melanoma ofsoft parts. Nat Genet 4:341–345
176 SAKUMOTO ETAL.