Embed Size (px)
Citation preview

EN EN
EUROPEAN COMMISSION
Brussels, 14.7.2021
COM(2021) 564 final
2021/0214 (COD)
Proposal for a
REGULATION OF THE EUROPEAN PARLIAMENT AND OF THE COUNCIL
establishing a carbon border adjustment mechanism
(Text with EEA relevance)
{SWD(2021) 643 final} - {SWD(2021) 644 final} - {SWD(2021) 647 final} -
{SEC(2021) 564 final}
EN 0 EN
EXPLANATORY MEMORANDUM
1. CONTEXT OF THE PROPOSAL
• Reasons for and objectives of the proposal
The world is facing a profound climate crisis and the challenges of climate change require a
global response. Strong international cooperation will strengthen the joint climate action
needed by all the Parties of the Paris Agreement to meet the goal of holding the increase in
the global average temperature to well below 2°C above pre-industrial levels and pursuing
efforts to limit the temperature increase to 1.5°C above pre-industrial levels1.
The European Union’s international leadership must go hand in hand with bold domestic
action. To meet the objective of a climate-neutral EU by 2050 in line with the
Paris Agreement, the Union needs to increase its ambition for the coming decade and update
its climate and energy policy framework. This process is already projected to start under the
existing EU legislation. Furthermore, as announced in the European Green Deal2, the
Commission has proposed a new EU target for 2030 of reducing greenhouse gas (‘GHG’)
emissions by at least 55 per cent compared to levels in 19903, based on a comprehensive
impact assessment4. This objective has been endorsed by the European Council5 and
communicated to the United Nations Framework Convention on Climate Change making it
internationally binding6. The European Climate Law, as agreed with the co-legislators, sets
the new 2030 target while making the EU’s climate neutrality objective legally binding7.
To deliver on these GHG emissions reductions in line with the European Climate Law, the
Commission proposes to revise where necessary all relevant policy instruments by July 2021
in a ‘Fit for 55 Package’, which covers in particular the review of sectoral legislation in the
fields of climate, energy, transport, and taxation8. A carbon border adjustment mechanism
(‘CBAM’), announced in the European Green Deal, is part of that package and will serve as
an essential element of the EU toolbox to meet the objective of a climate-neutral EU by 2050
in line with the Paris Agreement by addressing risks of carbon leakage as a result of the
increased Union climate ambition. The European Parliament adopted in March 2021 a
resolution advocating for the introduction of a WTO-compatible carbon border adjustment
mechanism9.
1 Article 2(1)(a) of the Paris Agreement. 2 Communication from the Commission of 11 December 2019 on The European Green Deal
(COM(2019) 640 final, p. 4. 3 The Commission put forward the proposal COM(2020) 563 final, amending the initial Commission
proposal on the European climate law to include a revised EU emission reduction target of at least 55 %
by 2030. On 10-11 December 2020, the European Council in its conclusions endorsed this increased EU
target. 4 Communication from the Commission of 17 September 2020 on Stepping up Europe’s 2030 climate
ambition. (COM(2020) 562 final: Part 1/2). 5 Conclusions of the European Council of 11 December 2020. (EUCO 22/20 CO EUR 17 CONCL 8). 6 German Presidency of the Council of the EU (2020). The update of the nationally determined
contribution of the European Union and its Member States. 7 Regulation (EU) 2021/1119 of the European Parliament and of the Council of 30 June 2021 establishing
the framework for achieving climate neutrality and amending Regulation (EU) 2018/1999 (‘European
Climate Law’) (OJ L 243, 9.7.2021, p. 1). 8 Commission Work Programme 2021. (COM(2020) 690 final). Annex I outlines all the instruments
under the package. 9 European Parliament resolution of 10 March 2021 ‘Towards a WTO-compatible EU carbon border
adjustment mechanism’.
EN 1 EN
The Commission also announced in its EU Action Plan: Towards Zero Pollution for Air,
Water and Soil10 the promotion of relevant instruments and incentives to better implement the
polluter pays principle11 and thus complete the phasing out of ‘pollution for free’ with a view
to maximising synergies between decarbonisation and the zero pollution ambition.
The Commission announced its intention to propose a CBAM in the European Green Deal. As
indicated in the Communication ‘Should differences in levels of ambition worldwide persist,
as the EU increases its climate ambition, the Commission will propose a carbon border
adjustment mechanism, for selected sectors, to reduce the risk of carbon leakage. This would
ensure that the price of imports reflect more accurately their carbon content. This measure
will be designed to comply with World Trade Organization rules and other international
obligations of the EU12’.
This mechanism is an alternative to the measures that address the risk of carbon leakage in the
EU’s Emissions Trading System13 (‘EU ETS’) and is meant to avoid that the emissions
reduction efforts of the Union are offset by increasing emissions outside the Union through
relocation of production or increased imports of less carbon-intensive products. Without such
a mechanism, carbon leakage could result in an overall increase in global emissions.
The Paris Agreement commits the international community to a continuous increase in the
ambition of climate action to limit global average temperature rise in order to significantly
reduce the risks and impacts of climate change. Each Party must prepare its own nationally
determined contribution (‘NDC’) towards this global goal, reflecting its ‘highest possible
ambition’ as well as its ‘common but differentiated responsibilities and respective
capabilities, in the light of different national circumstances14.
As long as significant numbers of the EU’s international partners have policy approaches that
do not result in the same level of climate ambition as the Union, and differences in the price
applied to GHG emissions remain, there is a risk of carbon leakage. Carbon leakage occurs if,
for reasons of differing ambitions related to climate policies, businesses in certain industry
sectors or subsectors were to transfer production to other countries with less stringent
emission constraints or imports from these countries would replace equivalent but less
GHG emissions intensive products due to the difference in climate policy. That would risk
undermining the effectiveness of the EU’s emission mitigation policies, and could also lead to
an increase in their total emissions globally, thus jeopardising the reduction of GHG
emissions that is urgently needed if the world is to keep the global average temperature to
well below 2°C above pre-industrial levels.
Currently, the risk of carbon leakage is being addressed in the Union under the EU ETS. This
is the world's first international GHG emissions trading system and has been in place since
2005. For the sectors covered by this system and most at risk of carbon leakage, this risk is
currently managed through the granting of free allowances and compensations for the increase
in electricity costs under state aid rules. However, free allocation under the EU ETS weakens
the price signal that the system provides for the installations receiving it compared to full
10 Communication from the Commission of 12 May 2021 on Pathway to a Healthy Planet for All
(COM(2021) 400 final). 11 Article 191(2) of the Treaty on the Functioning of the European Union. 12 Commission Communication. (2019). The European Green Deal (COM(2019) 640 final), p. 4. 13 Directive 2003/87/EC of the European Parliament and of the Council of 13 October 2003 establishing a
system for greenhouse gas emission allowance trading within the Union and amending Council
Directive 96/61/EC (OJ L 275, 25.10.2003, p. 32). 14 Article 4(3) of the Paris Agreement.
EN 2 EN
auctioning. It thus affects the incentives for investment into further abatement of GHG
emissions.
At the same time, as the Union increases its climate ambitions, the divergence with third
countries’ level of climate action is expected to widen, with an increased risk of carbon
leakage for the EU. This would stem from the EU’s increasingly ambitious GHG emissions
reduction targets that should reduce the overall number of ETS allowances. As a consequence,
the carbon price signal from the EU ETS is strengthened, incentivising Union producers to
reduce their emissions, but widening the difference with countries without carbon pricing
mechanisms. Moreover, overall free allocation will also decline over time, in line with the
reduction of the emission cap.
Considering the problems described above, this proposal addresses the problem of reducing
GHG emissions in the Union, while at the same avoiding that these emissions reduction
efforts are offset globally by emissions increase outside the Union. In this context, a CBAM is
proposed with the overarching objective of addressing the risk of carbon leakage in order to
fight climate change by reducing GHG emissions in the Union and globally.
• Consistency with existing policy provisions in the policy area
In the context of the ‘Fit for 55 Package’ the CBAM is not a self-standing measure. It is a
climate policy measure aiming at preserving the integrity of the EU’s climate ambition
towards the ultimate goal of climate neutrality. The role of the CBAM is to address the risk of
carbon leakage and reinforce the EU ETS. There is thus a strong relation between the EU ETS
and the CBAM.
As part of the ‘Fit for 55 Package’ the EU ETS is also proposed for revision15. This involves
the extension of the EU ETS to maritime transport, as well as the introduction of emissions
trading to the buildings and road transport sectors. Most notably, the higher climate ambition
of the proposed amendments of the EU ETS appears in a more stringent cap on emissions,
meaning that the overall number of allowances available will decline. A more stringent cap
implies a stronger carbon price signal. The EU objective of climate neutrality and the decision
to raise the climate ambition for 2030 also lead to a broader reconsideration of existing
measures against the risk of carbon leakage. In particular, while free allocation of allowances
effectively prevents carbon leakage risks, it weakens the carbon price signal for the Union
industry compared to full auctioning.
As indicated by the European Green Deal, the CBAM would ensure that the price of imports
reflects more accurately their carbon content. This measure has been designed to comply with
World Trade Organization (‘WTO’) rules and other international obligations of the Union.
Furthermore, President von der Leyen has underlined that ‘carbon must have its price –
because nature cannot pay the price anymore. The Carbon Border Adjustment Mechanism
should also motivate foreign producers and EU importers to reduce their carbon emissions16’.
To this end active outreach to third countries would be important with regard to the
understanding of and compliance with CBAM requirements. Moreover, the EU will engage
with third countries whose trade to the EU is affected by this Regulation to explore
possibilities for dialogue and cooperation with regard to the implementation of specific
elements of the Mechanism. It should also explore possibilities for concluding agreements to
take into account their carbon pricing mechanism. Agreements with third countries could be
15 [OP please insert the number of the proposed EU ETS revision when available] 16 State of the Union Address by President von der Leyen at the European Parliament Plenary on 16
September 2020. https://ec.europa.eu/commission/presscorner/detail/en/SPEECH_20_1655
EN 3 EN
considered as an alternative to the application of CBAM in case they ensure a higher degree
of effectiveness and ambition to achieve decarbonisation of a sector.
The existing mechanisms to address the risk of carbon leakage are free allocation of EU ETS
allowances and in some cases financial measures to compensate for indirect emission costs
from increases in electricity prices due to the EU ETS (indirect emission costs). A CBAM is
an alternative to those measures and would therefore have to replace them over time.
However, to allow producers, importers and traders to adjust to the new regime, the reduction
of free allocation should be implemented gradually while the CBAM is phased-in, in order to
ensure that they are not cumulative.
• Consistency with other Union policies
The Union is extremely active in international fora to strengthen environmental global rules
and to accompany trade partners and less developed countries on a path to decarbonise.
CBAM will complement the international environmental action of the Union and favour
decarbonisation in third countries.
Since 1992, the Union has worked to develop joint solutions and drive forward global action
to tackle climate change. More specifically, action at EU level should aim to provide for cost
effective delivery of long-term climate objectives, while ensuring fairness and environmental
integrity. The establishment of a robust governance of the EU 2050 climate-neutrality
objective will help to ensure that the Union remains on track to achieve this target.
The Commission also announced the promotion of relevant instruments and incentives to
better implement the polluter pays principle17 and thus complete the phasing out of ‘pollution
for free’ in the EU Action Plan: Towards Zero Pollution for Air, Water and Soil18 with a view
to maximising synergies between decarbonisation and the zero pollution ambition.
2. LEGAL BASIS, SUBSIDIARITY AND PROPORTIONALITY
• Legal basis
Articles 191 to 193 of the Treaty on the Functioning of the European Union (‘TFEU’) confirm
and specify EU competencies in the area of climate change. The legal basis for this proposal
is Article 192(1) of TFEU. In accordance with Articles 191 and 192(1) of TFEU, the Union
shall contribute to the pursuit, inter alia, of the following objectives: preserving, protecting
and improving the quality of the environment, promoting measures at international level to
deal with regional or worldwide environmental problems, and in particular combating climate
change.
• Subsidiarity (for non-exclusive competence)
Climate change is by its very nature a trans-boundary challenge that cannot be solved by
national or local action alone. Coordinated EU action can effectively supplement and
reinforce national and local action and enhances climate action. Coordination of climate
action is necessary at Union level and, where possible, at global level, and EU action is
justified on grounds of subsidiarity.
17 Article 191(2) of the Treaty on the Functioning of the European Union. 18 Commission Communication. (2021). Pathway to a Healthy Planet for All. (COM(2021), 400 final).
EN 4 EN
The introduction of an EU-wide CBAM will create a common and uniform framework to
ensure an equivalence between the carbon pricing policy applied in the EU’s internal market
and the carbon pricing policy applied on imports. Its aim is purely environmental and has a
cross-border dimension, so it cannot be tackled independently by Member States. Due to its
environmental nature and in order to avoid trade diversion, the CBAM should be more
efficient applied at Union level in a uniform way, mirroring EU ETS and designed in a
compatible way with WTO rules.
Moreover, should the CBAM not be applied in a uniform way, it would incentivise
behaviours resulting in trade diversion and forum shopping, as third country exporters would
import goods through EU jurisdictions applying the CBAM in the most lenient way.
This is not in contrast with deferring implementation and enforcement to competent national
authorities, however this should be limited to implementation and enforcement.
Proportionality
The proposal seeks to address the challenge of reducing GHG emissions in the Union while at
the same time avoiding that these emissions reduction efforts are offset by emissions increase
outside the Union. The policy choices therefore are clearly dictated by the aim to achieve the
objectives of the CBAM, namely to address the risk of carbon leakage in order to fight
climate change by reducing GHG emissions in the Union and globally.
The proposed product coverage of the CBAM is framed by the sectors and emissions covered
by the EU ETS, the sector coverage of which is in turn based on various quantitative and
qualitative criteria linked to the environmental objectives of the EU ETS, and the CBAM
scope should be laid down by a reference to certain goods by way of their classification in the
Combined nomenclature19. This serves the motivation for the measure, namely to ensure that
risks of carbon leakage for certain energy intensive sectors are mitigated. The CBAM, builds
on the climate logic of the EU ETS starting with sectors where emissions are the highest in
absolute numbers and therefore where it would matter most.
The carbon content of products is an essential element of the CBAM as it indicates the GHG
emissions (in carbon dioxide equivalent, ‘CO2e’) released during their production abroad.
This is used to ensure that imported products are treated no less favourably than domestic
products produced in EU ETS installations. As installations covered by the EU ETS are
subject to a carbon price assessed on their actual emissions, imported products in the scope of
the CBAM should also be assessed based on their actual GHG emissions. However, in order
to allow businesses to adjust to such an approach it is proposed to start with a transitional
period without financial adjustment.
As regards the administration of the measure empowering national competent authorities
would maximise the effectiveness of the implementation and enforcement by taking into
account national experiences in managing the EU ETS. A set-up with national competent
climate authorities playing a key role mirrors to a large extent the set-up successfully used for
almost a decade in the EU ETS.
• Choice of the instrument
The objectives of the present proposal can best be pursued through a Regulation. This will
ensure direct applicability of a number of provisions concerning goods imported in the
Customs Union. Moreover, this Regulation requires uniform and consistent application and
19 Council Regulation (EEC) No 2658/87 of 23 July 1987 on the tariff and statistical nomenclature and on
the Common Customs Tariff (OJ L 256, 7.9.1987, p. 1).

EN 5 EN
enforcement throughout the Union in order to pursue the objectives of Articles 32 and 207
of TFEU.
Differing exposures to the risk of carbon leakage would provide limited justification for
action at national level. Carbon emissions are not localised and like the EU ETS, the CBAM
can achieve greater efficiency when uniformly applied on a broader scale.
For this reason, the objectives of the present proposal can best be pursued through a
Regulation. This will ensure direct applicability of its provisions.
Besides, conferring certain tasks related to implementation and enforcement to authorities in
charge of climate and customs in Member States would address technical and methodological
constraints and increase effectiveness.
3. RESULTS OF EX-POST EVALUATIONS, STAKEHOLDER
CONSULTATIONS AND IMPACT ASSESSMENTS
Stakeholder consultations
For the preparation of this proposal, the Commission designed and implemented a
stakeholder’s consultation strategy, which encompassed both public and targeted
consultations.
An inception impact assessment was published for feedback on 4 March 2020. A consultation
took place until 1 April 202020 with the aim to collect feedback on the initial considerations of
the project. In total 219 responses were submitted during this consultation period broken
down into approximately 150 responses by trade federations, business associations and
individual businesses, 20 NGOs, 20 citizens and the remaining from think tanks,
academic/research institutions, trade unions and public authorities. The majority of responses
came from the EU, with 24 from third countries.
Overall, the majority of replies expressed support for the CBAM, with the remaining being
roughly divided equally between limited and no support. The vast majority of responses
expressed cautiousness in the design of the measure requesting to consider all options
possible. Among others, key areas emphasized were the impact on value chains and reliance
on imports of raw materials, avoidance of excessive effects on final consumers, links to
EU ETS and free allowances, distributional impact in affected sectors and across countries,
especially developing economies and interaction with existing trade defence measures on raw
materials.
In line with the Commission’s Better Regulations Guidelines an open public consultation21
was also carried out between 22 July and 28 October 2020. The consultation aimed to gather
opinions from citizens and organisations on the justifications, objectives, potential design and
scope as well as impacts of the initiative. Respondents were also allowed to upload position
papers. A total of 615 respondents participated in the public consultation. Of these,
6 responses were duplicates, leading to 609 valid contributions.
20 https://ec.europa.eu/info/law/better-regulation/have-your-say/initiatives/12228-EU-Green-Deal-carbon-
border-adjustment-mechanism-_en 21 https://ec.europa.eu/info/law/better-regulation/have-your-say/initiatives/12228-EU-Green-Deal-carbon-
border-adjustment-mechanism-_en
EN 6 EN
With respect to the problem of carbon leakage, most respondents state that carbon leakage is a
real issue and that the CBAM can address carbon leakage, foster consumption of low-carbon
products in the EU, and stimulate the deployment of low-carbon technologies and ambitious
climate policies in third countries. On the effectiveness of current measures in the context of
the EU ETS and state aid rules to limit carbon leakage, and on the ability of other regulatory
measures to reduce GHG emissions companies, business associations and public authorities
have a positive belief whereas citizens and other stakeholders are more critical. Respondents
suggest that the CBAM should focus on products from activities already included in the
EU ETS (especially those with the highest risk of carbon leakage) and account for entire value
chains.
In addition to the above, the Commission services engaged in extensive bilateral consultations
with public authorities within the EU and third countries, business associations, individual
companies and NGOs. At the same time targeted consultations were undertaken by an
external contractor who conducted a total of 25 in-depth interviews with senior managers and
associations from the basic materials sectors, manufacturers, NGOs and policymakers. There
were two rounds of interviews. First, 17 informal interviews were conducted at an early stage
and served to identify relevant points of concern and open questions for further research. In a
second step, eight additional interviews were conducted in order to test whether the
judgements and concerns from the informal interviews were shared among a wider group of
stakeholders. 17 stakeholders came from industry, 5 from NGOs and 3 from Member State
institutions.
The results of the public and targeted consultations allowed the Commission to collect a
significant number of views and opinions on the initiative. Both public and targeted
consultations showed agreement on the necessity of a CBAM to address the risk of carbon
leakage and help the Union to achieve its increased climate ambitions. The feedback received
throughout these consultations has been used to inform the choice of the design elements and
the preferred policy options. Result of the stakeholder consultation is summarised in the
relevant annex to the impact assessment.
• Collection and use of expertise
The preparatory steps for the proposal rest on an array of studies and expert advice, analysing
the potential design and scope of the CBAM as well as its environmental, social and
economic impacts.
In particular, a study on the optimal design of the mechanism and its sectoral coverage was
conducted with the support of external expertise to the Commission. The study reviewed the
logic of intervention, assessed a range of alternative options and their feasibility, provided
technical advice on technical design elements and provided support on the selection of sectors
to be covered by the mechanism. Elements of this study are presented in the impact
assessment22, while the full study is also published by the Commission23.
In addition to the qualitative study of the CBAM, a dedicated quantitative assessment of
impacts was also conducted with support from the Joint Research Centre of the Commission
and from external expertise, the first focusing on the CBAM’s impacts on material products
and the later focusing on the CBAM’s impacts on electricity. These quantitative assessments
22 [OP please insert the link to the impact assessment after publication] 23 [OP please insert the link to the study after its publication]
EN 7 EN
provided insight into the environment, economic and social impacts of the initiative and are
made publicly available as part of the impact assessment.
Finally, the analysis rests on additional literature review, studies and research papers
submitted by academics in the open public consultation and other independent studies.
• Impact assessment
The Regulatory Scrutiny Board issued a positive opinion with reservations on the impact
assessment, including suggestions for improvement24. The Impact Assessment report was
further revised along these lines, in particular, an effort was made to ensure that it is self-
standing with regards to the problem of carbon leakage, while strengthening its coherence
with the proposal for the revision of the EU ETS, as well as providing better clarity on the key
impacts and institutional choices and presenting in greater detail the views of different
stakeholder groups.
The problem addressed by the CBAM is how to reduce GHG emissions in the EU, while at
the same time avoiding that these emissions reduction efforts are offset by emissions
increasing outside the Union (carbon leakage). To reflect this dynamic framework, the basis
against which the impact assessment was built reflected the fact that the CBAM is put forward
against the new agreed EU target of reducing net GHG emissions by at least 55 per cent
(relative to 1990).
Six different options were assessed against this dynamic framework, all of which were
designed to take account of WTO requirements and of the EU’s international commitments
such as free trade agreements concluded by the EU or the Energy Community Treaty.
The first option for a CBAM is an import carbon tax, paid by the importer when products
enter the EU. The tax would be collected by customs at the border based on a tax reflecting
the price of carbon in the Union combined with a default carbon intensity of the products.
Importers would have the opportunity to claim a reduction of the CBAM based on their
individual carbon footprint and any carbon price paid in the country of production.
The second option involves the application on imports of a system that replicates the EU ETS
regime applicable to domestic production. This option entails – similar to the system of
allowances under the EU ETS – the surrendering of certificates (‘CBAM certificates’) by
importers based on embedded emission intensity of the products they import into the Union,
and purchased at a price corresponding to that of the EU ETS allowances at any given point in
time. These certificates will not be linked to the EU ETS system of allowances but will mirror
the price of these allowances to ensure a coherent approach to the pricing under the EU ETS.
National climate authorities will administer the sale of the CBAM certificates and importers
will submit declarations of verified embedded emissions in the imported products to these
authorities tasked with managing the CBAM and surrender a number of CBAM certificates
corresponding to the declared emissions. Such declaration and surrendering will occur –
similar to that under the EU ETS – at a yearly reconciliation exercise taking place in the year
following the year of importation and based on yearly trade import volumes. The carbon
emission intensity of products would be based on default values; however, importers would
be given the opportunity, at the moment of the yearly reconciliation exercise, to claim a
reduction of the CBAM on the basis of their individual emission performance. They would
24 [OP please insert the links to the summary sheet and the positive opinion of the RSB after their
publication.]
EN 8 EN
also be entitled to claim a reduction of the CBAM for any carbon price paid in the country of
production (which is not rebated or in other way compensated upon export).
Option 3 operates in the same way as option 2, however the carbon price of imports is based
on actual emissions from third country producers rather than on a default value based on EU
producers’ averages. Under this option, the importer will have to report the actual emissions
embedded in the product and surrender a corresponding number of CBAM certificates.
Option 4 would apply in the same way as option 3. It consists of surrendering CBAM
certificates on imported products. However, this option considers also a 10 years phasing in
period starting in 2026 during which the free allocations of allowances under the EU ETS
would be gradually phased out by 10 percentage points each year and the CBAM would be
phased in. During this phasing in period, the CBAM would be reduced proportionally to the
amount of free allowances distributed in a given sector.
Option 5 is a variant of Option 3 with a scope extended further down in the value chain.
Carbon-intensive materials that are part of semi-finished and finished products would be
covered along the value chain. For imports, the CBAM would again be based on the actual
emissions from third country producers.
Option 6 consists of an excise duty on carbon-intensive materials covering consumption in the
Union of both domestic and imported products, besides the continuation of the EU ETS
including the free allocation of allowances covering production in the EU.
With respect to the effectiveness of the CBAM against its overarching objective of addressing
the risk of carbon leakage in order to fight climate change by reducing GHG emissions in the
Union and globally, the impact assessment showed that all the policy options achieve positive
impact. In that respect, all CBAM options were found to achieve a stronger reduction of
emissions in the CBAM sectors in the Union, relative to the case of higher ambition and free
allocation. With regards to incentivising third country producers to move towards cleaner
production processes, all policy options bring about positive results. On that criteria, the
options allowing for the possibility to demonstrate actual emissions are particularly effective,
with options 3, 4 and 5 also showing strong positive results. All options were found to be
coherent with the EU ETS.
On providing protection against carbon leakage, option 4 followed by 3 and 5 bring about a
stronger positive impact, while options 1, 2 and 6 would be less effective. All policy options
are designed in a way that respects the EU’s international commitments.
The CBAM will apply on imports of goods at the price of carbon determined by the EU ETS
system through the system of auctions. Importers would either be charged on the basis of a
default value or based on the actual emissions embedded in the imports. The possibility to
demonstrate that the carbon efficiency of their product is better than the default value, would
increase the complexity of the system, but this also provides emission reduction incentives for
the share of materials that is exported to the EU.
Overall the impact of the CBAM on employment is limited. Changes in employment are
largely driven by the presence (or not) of free allocation. Retaining free allocation results in a
slight increase in employment in the CBAM sectors. The complete removal of free allocation
in the absence of a CBAM leads to the highest employment losses. The application of the
CBAM on material industrial products is likely to have limited impact on consumer prices
EN 9 EN
because the measure is targeted at products upstream in the value chain and affects goods for
final consumption only indirectly.
Compliance costs are assumed to arise for importers located in the Union that would be
subject to the CBAM obligations. This could be done either based on a default value or by
providing verified information about actual emissions. While the monitoring of these actual
emissions would take place outside the Union, the responsibility – and thus costs – of
providing the verification regarding this monitoring to authorities lies with the importers. For
options 1, 2, 3, 4 and 5, when emissions are declared at default value, monitoring of the
emissions from the production process is not necessary and therefore also limited costs are
incurred. However, if importers decide to claim to use the actual emissions from the
production process, the monitoring creates additional costs for the business. Under option 6,
default values have to be determined both for materials and manufactured goods.
Administrative effort is relatively low for producers of materials in the EU, which means
producers do not have to demonstrate the carbon intensity of their production.
Electricity generation is addressed separately to material products. Applying a CBAM to the
electricity sector requires taking into account its uniqueness that distinguishes it from basic
materials, including the methods for its transportation, through constrained, monopoly
networks, and the broad set of technologies employed for its production.
In line with approaches applied to the material products, a reference value for emissions
embedded in imported electricity needs to be established in the context of determining the
corresponding CBAM obligation. Two alternative options are employed to determine the
reference value for embedded emissions for electricity namely (a) average GHG emission
intensity of the EU electricity mix and (b) average GHG emission factor of the EU electricity
mix. As with other options, however, importers would still have the possibility to prove that
their installation level emissions are lower than the above reference values.
On the basis of the above, the impact assessment concluded that option 4 provides clear
benefits relative to all other options considered. It is therefore suggested to introduce a CBAM
on selected products in the form of CBAM certificates based on actual emissions. It is also
suggested to introduce CBAM progressively against a correspondent reduction of allowances
allocated for free in the corresponding EU ETS installations. This policy option ensures a high
level of effectiveness for the CBAM.
A system based on actual emissions on imported goods ensures a fair and equal treatment of
all imports and a close correlation to the EU ETS. The CBAM system will, however, need to
be complemented by a possibility to base calculations on a set of default values to be used in
situations when sufficient emission data will not be available. Moreover, during an initial
transitional phase, where importers may not be able to produce yet the data required by
system on actual emissions, a default value could also apply. This option will need to be
designed to fully respect the EU’s international commitments, in particular WTO rules, and
therefore it will be necessary to ensure that if a default value applies, importers are in all cases
given the opportunity to demonstrate that they perform better than such value based on their
actual emissions. Moreover, with regard to the phase in of the CBAM and the corresponding
phase out of the free allowances, it will need to be ensured that at no point in time over this
period, imports are afforded less favourable treatment than domestic EU production.
Further, the introduction of CBAM certificates based on actual emissions would protect
against the risk of carbon leakage while incentivising third country producers to move

EN 10 EN
towards cleaner production processes, with the support of Official Development Assistance
when applicable.
As regards electricity the preferred option is to apply the CBAM based on the carbon
emission factor including the possibility for importers to demonstrate lower emissions. Both
options contribute to mitigating the risks of carbon leakage by discouraging in the mid-term
the build-up of carbon-intensive power generation sources in the vicinity of EU borders which
might replace EU-based generators exposed to increasing carbon costs. However, the option
based on the carbon emission factor displays superior effectiveness in preventing carbon
leakage while keeping administrative costs low.
The choice of policy option 4 for material products and the carbon emission factor for
electricity would introduce a proportionate mechanism to address climate change by reducing
GHG emissions in the Union and avoiding that these emissions are replaced by emissions
outside the Union. In addition, the gradual phase out of free allocation under the EU ETS in
the sectors concerned, combined with the gradual phase in of CBAM, would ensure a prudent
and predictable transition for businesses and authorities.
• Regulatory fitness and simplification
The impact assessment indicates that a CBAM would result in relatively higher compliance
costs for SMEs compared to large enterprises. The exact degree of difference between the two
groups could not be quantified based on the currently available data.
The fact that a CBAM is initially introduced on imports of a few basic materials and basic
material products results in large businesses being the main impacted ones. Therefore, the
practical impact of import related measures would have little practical impact on SMEs, even
though that impact would be relatively higher than for large businesses if compared on the
amount imported. For that reason the impact assessment did not carry out a SME test, neither
did it perform a separate SME consultation, although the views of, and implications for,
SMEs have been assessed as part of the Commission’s Online Public Consultation,
For these reasons also, no special measures for SMEs are foreseen in this Regulation.
• Fundamental rights
The proposal respects the fundamental rights and observes the principles recognised in
particular by the Charter of Fundamental Rights of the European Union25. In particular, it
contributes to the objective of a high level of environmental protection in accordance with the
principle of sustainable development as laid down in Article 37 of the Charter.
4. BUDGETARY IMPLICATIONS
Most revenues generated by CBAM will go to the EU budget26. In the special European
Council of 17-21 July 202027, EU leaders agreed on the recovery instrument
NextGenerationEU. The instrument will provide the EU with necessary means to address the
challenges posed by the COVID-19 pandemic and, therein, support investment in the green
and digital transitions. In order to finance it, the Commission will be able to borrow up to
25 OJ C 326, 26.10.2012, p. 391. 26 Council Decision (EU, Euratom) 2020/2053 of 14 December 2020 on the system of own resources of
the European Union and repealing Decision 2014/335/EU, Euratom (OJ L 424, 15.12.2020, p. 1). 27 See European Council conclusions, 17-21 July 2020.
EN 11 EN
EUR 750 billion on financial markets. In that context, the European Parliament, the Council
and the Commission agreed that ‘the Institutions will work towards introducing sufficient new
own resources with a view to covering an amount corresponding to the expected expenditure
related to the repayment’ of NextGenerationEU28. The Commission committed to put forward
proposals on new own resources, which would include the CBAM in the first semester of
2021.
5. OTHER ELEMENTS
• Implementation plans and monitoring, evaluation and reporting arrangements
Within the framework of the overall package of environmental measures adopted and applied
by the EU, which illustrate the EU's continued pursuit of a higher level of environmental
ambition than many of our trading partners, it is considered appropriate to begin moving from
a system in which carbon leakage is addressed by free allowances to a system in which carbon
leakage with respect to imports is addressed by a carbon border adjustment mechanism as
soon as this is reasonably possible, taking into account the technical and economic feasibility,
including administrative constraints and the legitimate expectations of all economic operators,
in an even-handed manner.
Concurrently balancing these multiple objectives pleads in favour of the gradual introduction
of a carbon border adjustment mechanism, as soon as is reasonably possible, so that during an
initial and relatively short pilot phase without any financial adjustment, operators can adjust
themselves to the new system, including its additional administrative requirements, and the
authorities can obtain experience with respect to the operation of the new system.
Once that pilot phase is complete, the process of transitioning from free allowances to a
carbon border adjustment mechanism will accelerate in earnest and in a manner that ensures
no discrimination between domestic and imported goods, or between imported goods from
different countries, in full compliance with the EU's international obligations and rights.
The Commission will ensure that arrangements are in place to monitor and evaluate the
functioning of the CBAM, including its enforcement against fraudulent practices, and
evaluate it against the main policy objectives. Given that the CBAM is one of the policy
proposals under the ‘Fit for 55 Package’, monitoring and evaluation could be carried out in
alignment with the other policies of the package.
Before the end of the transitional period, the Commission will report to the European
Parliament and the Council on the application of the Regulation and, if appropriate, will make
a legislative proposal to extend the CBAM to other goods than those listed in Annex I and
possibly also to other emissions, and introduce other possible changes to improve its
functioning. For that, it is necessary to firstly monitor the effect of the CBAM.
• Detailed explanation of the specific provisions of the proposal
Chapter I sets out general provisions, including the subject matter, the scope of the proposal
(Articles 1 and 2) and the definitions of the key terms (Article 3). Annex I defines in detail the
28 Interinstitutional Agreement of 16 December 2020 between the European Parliament, the Council of the
European Union and the European Commission on budgetary discipline, on cooperation in budgetary
matters and on sound financial management, as well as on new own resources, including a roadmap
towards the introduction of new own resources (OJ L 433I , 22.12.2020, p. 28).
EN 12 EN
scope of the proposal, listing the goods and the GHG emissions relating to each of those
goods. Annex II indicates the countries and territories of origin excluded from the application
of the measure.
Chapter II contains provisions on obligations and rights of declarants of goods. More
specifically, it contains provisions on the conditions to apply for an authorisation to import
CBAM goods (Articles 4 and 5), the obligation of an authorised declarant to submit an annual
CBAM declaration by 31 May of each year and the content of that declaration (Article 6), the
principles for the calculation of the emissions embedded in goods imported to the EU during
the previous calendar year (Article 7, as further outlined in Annex III) and the process of
verifying these emissions by accredited verifiers (Article 8, complemented by reporting
requirements and verification principles in Annexes IV and V). It also sets out the principles
for taking into account a carbon price paid in third countries (Article 9). Last, under Article
10, an operator of an installation in a third country has the possibility to request to the
Commission to be included in a central database. Once registered, the operator may opt to
disclose information about the embedded emissions verified to an authorised declarant. The
authorised declarant can use that disclosed information to fulfil the obligation to declare
verified information on embedded emissions when importing the goods produced in the
installation registered in the central database to the Union.
Under Chapter III, there are the general provisions on the administrative set up of the
competent national authorities, the role of the Commission – also as a central administrator -
and the disclosure of information (Articles 11, 12, 13 and 15). The chapter also contains
provisions on the main characteristics of the national registries and its accounts (Articles 14
and 16) and decisions of the authorities regarding the authorisation to import (Article 17), the
accreditation of verifiers (Article 18) and the review of CBAM declarations (Article 19).
Chapter IV contains provisions regarding the CBAM certificates. Articles 20 to 24 establish
detailed rules on the life cycle of the CBAM certificates, from their sale to the control of their
surrender or, if any, re-purchase, and their final cancellation. Article 20 concerns in detail the
sale of certificates by the competent authorities. Article 21 is about the calculation of the price
of the certificates, done by the Commission, on a weekly basis. Article 22 lays down the
procedures to ensure that each authorised declarant fulfils its obligation to surrender
certificates in the national registry. Article 23 establishes the right of an authorised declarant
to ask the competent authority to re-purchase a limited number of CBAM certificates
remaining on its account after surrender. Finally, Article 24 specifies that, by 30 June of each
year, the competent authority is required to cancel the certificates remaining in the account of
each declarant after surrender and re-purchase, if any.
Chapter V deals with how customs authorities should deal with the procedures for the
administration of goods at the border (Article 25). Under Chapter VI, penalties for no
compliance are set in Article 26 and a special provision on circumvention is provided in case
there are changes in the pattern of trade (Article 27).
Chapter VII contains provisions regarding the exercise of the delegation to the Commission to
adopt delegated acts (Article 28) and the examination procedure for implementing acts
(Article 29). The power to adopt delegated acts is referred to in Articles 2, 18 and 27.
Articles 2, 5 to 9, 21, 25, 31, 33 and 35 contain provisions on implementing powers.
Chapter VIII contains provisions in Article 30 on the evaluation of the Regulation and its
review.
EN 13 EN
Chapter IX (Article 31) deals with the reduction of the CBAM obligation to reflect the
transitional allocation of EU ETS allowances for free in installations producing, in the Union,
the same kinds of goods which are covered by the proposal.
Chapter X contains specific provisions to be applied during an initial transitional period. In
those provisions, a CBAM with no financial adjustment aiming at collecting data and raising
awareness of declarants will apply in the first years. That transitional period will have a
duration of three years, from 1 January 2023 to 31 December 2025, as established in
Article 32. Declarants will report on a quarterly basis the embedded emissions corresponding
to their imports of the previous quarter, detailing direct and indirect emissions and reporting
any carbon price paid abroad. Customs authorities will inform declarants of their CBAM
obligations and exchange information with competent authorities.
Last, Chapter XI indicates the entry into force of the proposal, with some of the provisions
applying only during the transitional period and others starting to be applied in 2026 (Article
36).
EN 14 EN
2021/0214 (COD)
Proposal for a
REGULATION OF THE EUROPEAN PARLIAMENT AND OF THE COUNCIL
establishing a carbon border adjustment mechanism
(Text with EEA relevance)
THE EUROPEAN PARLIAMENT AND THE COUNCIL OF THE EUROPEAN UNION,
Having regard to the Treaty on the Functioning of the European Union, and in particular
Article 192(1) thereof,
Having regard to the proposal from the European Commission,
After transmission of the draft legislative act to the national parliaments,
Having regard to the opinion of the European Economic and Social Committee1,
Having regard to the opinion of the Committee of the Regions2,
Acting in accordance with the ordinary legislative procedure,
Whereas:
(1) The Commission has, in its communication on the European Green Deal3, set out a
new growth strategy that aims to transform the Union into a fair and prosperous
society, with a modern, resource-efficient and competitive economy, where there are
no net emissions (emissions after deduction of removals) of greenhouse gases (‘GHG
emissions’) in 2050 and where economic growth is decoupled from resource use. The
European Green Deal also aims to protect, conserve and enhance the EU’s natural
capital, and protect the health and well-being of citizens from environment-related
risks and impacts. At the same time, that transformation must be just and inclusive,
leaving no one behind. The Commission also announced in its EU Action Plan:
Towards Zero Pollution for Air, Water and Soil4 the promotion of relevant instruments
and incentives to better implement the polluter pays principle as set out in
Article 191(2) of the Treaty on the Functioning of the European Union (‘TFEU’) and
thus complete the phasing out of ‘pollution for free’ with a view to maximising
synergies between decarbonisation and the zero pollution ambition.
(2) The Paris Agreement5, adopted in December 2015 under the United Nations
Framework Convention on Climate Change (‘UNFCCC’) entered into force in
November 2016. The Parties to the Paris Agreement, in its Article 2, have agreed to
1 OJ C, , p. . [OP please insert the number of the opinion] 2 OJ C, , p. . [OP please insert the number of the opinion] 3 Communication from the Commission of 11 December 2019 on the European Green Deal (COM(2019)
640 final). 4 Communication from the Commission of 12 May 2021 on Pathway to a Healthy Planet for All
(COM(2021) 400). 5 OJ L 282, 19.10.2016, p.4.
EN 15 EN
hold the increase in the global average temperature well below 2°C above pre-
industrial levels and to pursue efforts to limit the temperature increase to 1.5°C above
pre-industrial levels.
(3) Tackling climate and other environmental-related challenges and reaching the
objectives of the Paris Agreement are at the core of the European Green Deal. The
value of the European Green Deal has only grown in light of the very severe effects of
the COVID-19 pandemic on the health and economic well-being of the Union’s
citizens.
(4) The Union is committed to reducing its economy-wide GHG emissions by at least
55 per cent by 2030 below 1990 levels, as set out in the submission to the UNFCCC
on behalf of the European Union and its Member States on the update of the nationally
determined contribution of the European Union and its Member States6.
(5) Regulation (EU) 2021/1119 of the European Parliament and of the Council7 has
enshrined in legislation the target of economy-wide climate neutrality by 2050. That
Regulation also establishes a binding Union reduction commitment of GHG emissions
of at least 55 per cent below 1990 levels by 2030.
(6) The Special Report of the Intergovernmental Panel on Climate Change (IPCC) on the
impacts of global temperature increases of 1.5°C above pre-industrial levels and
related global GHG emission pathways8 provides a strong scientific basis for tackling
climate change and illustrates the need to step up climate action. That report confirms
that in order to reduce the likelihood of extreme weather events, GHG emissions need
to be urgently reduced, and that climate change needs to be limited to a global
temperature increase of 1.5°C.
(7) The Union has been pursuing an ambitious policy on climate action and has put in
place a regulatory framework to achieve its 2030 GHG emissions reduction target. The
legislation implementing that target consists, inter alia, of Directive 2003/87/EC of the
European Parliament and of the Council9, which establishes a system for
GHG emission allowance trading within the Union (‘EU ETS’) and delivers
harmonised pricing of GHG emissions at Union level for energy-intensive sectors and
subsectors, Regulation (EU) 2018/842 of the European Parliament and of the
Council10, which introduces national targets for reduction of GHG emissions by 2030,
6 Council of the European Union ST/14222/1/20/REV1. 7 Regulation (EU) 2021/1119 of the European Parliament and of the Council of 30 June 2021 establishing
the framework for achieving climate neutrality and amending Regulation (EU) 2018/1999 (‘European
Climate Law’) (OJ L 243, 9.7.2021, p. 1). 8 IPCC, 2018: Global Warming of 1.5°C. An IPCC Special Report on the impacts of global warming of
1.5°C above pre-industrial levels and related global greenhouse gas emission pathways, in the context
of strengthening the global response to the threat of climate change, sustainable development, and
efforts to eradicate poverty [Masson-Delmotte, V., P. Zhai, H.-O. Pörtner, D. Roberts, J. Skea, P.R.
Shukla, A. Pirani, W. Moufouma-Okia, C. Péan, R. Pidcock, S. Connors, J.B.R. Matthews, Y. Chen, X.
Zhou, M.I. Gomis, E. Lonnoy, T. Maycock, M. Tignor, and T. Waterfield (eds.)]. 9 Directive 2003/87/EC of the European Parliament and of the Council of 13 October 2003 establishing a
system for greenhouse gas emission allowance trading within the Union and amending Council
Directive 96/61/EC (OJ L 275, 25.10.2003, p. 32). 10 Regulation (EU) 2018/842 of the European Parliament and of the Council of 30 May 2018 on binding
annual greenhouse gas emission reductions by Member States from 2021 to 2030 contributing to
climate action to meet commitments under the Paris Agreement and amending Regulation (EU)
No 525/2013 (OJ L 156, 19.6.2018, p. 26).
EN 16 EN
and Regulation (EU) 2018/841 of the European Parliament and of the Council11,
which requires Member States to compensate GHG emissions from land use with
removals of emissions from the atmosphere.
(8) As long as a significant number of the Union’s international partners have policy
approaches that do not result in the same level of climate ambition, there is a risk of
carbon leakage. Carbon leakage occurs if, for reasons of costs related to climate
policies, businesses in certain industry sectors or subsectors were to transfer
production to other countries or imports from those countries would replace equivalent
but less GHG emissions intensive products. That could lead to an increase in their total
emissions globally, thus jeopardising the reduction of GHG emissions that is urgently
needed if the world is to keep the global average temperature to well below 2 °C above
pre-industrial levels.
(9) The initiative for a carbon border adjustment mechanism (‘CBAM’) is a part of the
‘Fit for 55 Package’. That mechanism is to serve as an essential element of the EU
toolbox to meet the objective of a climate-neutral Union by 2050 in line with the Paris
Agreement by addressing risks of carbon leakage resulting from the increased Union
climate ambition.
(10) Existing mechanisms to address the risk of carbon leakage in sectors or sub-sectors at
risk of carbon leakage are the transitional free allocation of EU ETS allowances and
financial measures to compensate for indirect emission costs incurred from GHG
emission costs passed on in electricity prices respectively laid down in Articles 10a(6)
and 10b of Directive 2003/87/EC. However, free allocation under the EU ETS
weakens the price signal that the system provides for the installations receiving it
compared to full auctioning and thus affects the incentives for investment into further
abatement of emissions.
(11) The CBAM seeks to replace these existing mechanisms by addressing the risk of
carbon leakage in a different way, namely by ensuring equivalent carbon pricing for
imports and domestic products. To ensure a gradual transition from the current system
of free allowances to the CBAM, the CBAM should be progressively phased in while
free allowances in sectors covered by the CBAM are phased out. The combined and
transitional application of EU ETS allowances allocated free of charge and of the
CBAM should in no case result in more favourable treatment for Union goods
compared to goods imported into the customs territory of the Union.
(12) While the objective of the CBAM is to prevent the risk of carbon leakage, this
Regulation would also encourage the use of more GHG emissions-efficient
technologies by producers from third countries, so that less emissions per unit of
output are generated.
(13) As an instrument to prevent carbon leakage and reduce GHG emissions the CBAM
should ensure that imported products are subject to a regulatory system that applies
carbon costs equivalent to the ones that otherwise would have been borne under the
EU ETS. The CBAM is a climate measure which should prevent the risk of carbon
leakage and support the Union’s increased ambition on climate mitigation, while
ensuring WTO compatibility.
11 Regulation (EU) 2018/841 of the European Parliament and of the Council of 30 May 2018 on the
inclusion of greenhouse gas emissions and removals from land use, land use change and forestry in the
2030 climate and energy framework, and amending Regulation (EU) No 525/2013 and Decision
No 529/2013/EU (OJ L 156, 19.6.2018, p. 1).
EN 17 EN
(14) This Regulation should apply to goods imported into the customs territory of the
Union from third countries, except where their production has already been subject to
the EU ETS, whereby it applies to third countries or territories, or to a carbon pricing
system fully linked with the EU ETS.
(15) In order to exclude from the CBAM third countries or territories fully integrated into,
or linked, to the EU ETS in the event of future agreements, the power to adopt acts in
accordance with Article 290 of TFEU should be delegated to the Commission in
respect of amending the list of countries in Annex II. Conversely, those third countries
or territories should be excluded from the list in Annex II and be subject to CBAM
whereby they do not effectively charge the ETS price on goods exported to the Union.
(16) This Regulation should apply to the continental shelf and to the exclusive economic
zone declared by Member States pursuant to the United Nations Convention on the
Law of the Sea12, with a view to preventing the risk of carbon leakage in offshore
installations.
(17) The GHG emissions to be regulated by the CBAM should correspond to those GHG
emissions covered by Annex I to the EU ETS in Directive 2003/87/EC, namely carbon
dioxide (‘CO2’) as well as, where relevant, nitrous oxide (‘N2O’) and perfluorocarbons
(‘PFCs’). The CBAM should initially apply to direct emissions of those GHG from the
production of goods up to the time of import into the customs territory of the Union,
and after the end of a transition period and upon further assessment, as well to indirect
emissions, mirroring the scope of the EU ETS.
(18) The EU ETS and the CBAM have a common objective of pricing GHG emissions
embedded in the same sectors and goods through the use of specific allowances or
certificates. Both systems have a regulatory nature and are justified by the need to curb
GHG emissions, in line with the environmental objective set out in Union.
(19) However, while the EU ETS sets an absolute cap on the GHG emissions from the
activities under its scope and allows tradability of allowances (so called ‘cap and trade
system’), the CBAM should not establish quantitative limits to import, so as to ensure
that trade flows are not restricted. Moreover, while the EU ETS applies to installations
based in the Union, the CBAM should be applied to certain goods imported into the
customs territory of the Union.
(20) The CBAM system has some specific features compared with the EU ETS, including
on the calculation of the price of CBAM certificates, on the possibilities to trade
certificates and on their validity over time. These are due to the need to preserve the
effectiveness of the CBAM as a measure preventing carbon leakage over time and to
ensure that the management of the system is not excessively burdensome in terms of
obligations imposed on the operators and of resources for the administration, while at
the same time preserving an equivalent level of flexibility available to operators under
the EU ETS.
(21) In order to preserve its effectiveness as a carbon leakage measure, the CBAM needs to
reflect closely the EU ETS price. While on the EU ETS market the price of allowances
is determined through auctions, the price of CBAM certificates should reasonably
reflect the price of such auctions through averages calculated on a weekly basis. Such
weekly average prices reflect closely the price fluctuations of the EU ETS and allow a
reasonable margin for importers to take advantage of the price changes of the EU ETS
12 Convention on the Law of the Sea, Montego Bay, 10 December 1982.

EN 18 EN
while at the same ensuring that the system remains manageable for the administrative
authorities.
(22) Under the EU ETS, the total number of allowances issued (the ‘cap’) determines the
supply of emission allowances and provides certainty about the maximum emissions
of GHG. The carbon price is determined by the balance of this supply against the
demand of the market. Scarcity is necessary for there to be a price incentive. As it is
not possible to impose a cap on the number of CBAM certificates available to
importers, if importers had the possibility to carry forward and trade CBAM
certificates, this could result in situations where the price for CBAM certificates would
no longer reflect the evolution of the price in the EU ETS. That would weaken the
incentive for decarbonisation between domestic and imported goods, favouring carbon
leakage and impairing the overarching climate objective of the CBAM. It could also
result in different prices for operators of different countries. Therefore, the limits to
the possibilities to trade CBAM certificates and to carry them forward is justified by
the need to avoid undermining the effectiveness and climate objective of the CBAM
and to ensure even handed treatment to operators from different countries. However,
in order to preserve the possibility for importers to optimise their costs, this Regulation
should foresee a system where authorities can re-purchase a certain amount of excess
certificates from the importers. Such amount is set at a level which allows a reasonable
margin for importers to leverage their costs over the period of validity of the
certificates whilst preserving the overall price transmission effect, ensuring that the
environmental objective of the measure is preserved.
(23) Given that the CBAM applies to imports of goods into the customs territory of the
Union rather than to installations, certain adaptations and simplifications would also
need to apply in the CBAM regime. One of those simplifications should consist in a
declarative system where importers should report the total verified GHG emissions
embedded in goods imported in a given calendar year. A different timing compared to
the compliance cycle of the EU ETS should also be applied to avoid any potential
bottleneck resulting from obligations for accredited verifiers under this Regulation and
the EU ETS.
(24) In terms of sanctions, Member States should apply penalties to infringements of this
Regulation and ensure that they are implemented. The amount of those penalties
should be identical to penalties currently applied within the Union in case of
infringement of EU ETS according to Article 16(3) and (4) of Directive 2003/87/EC.
(25) While the EU ETS applies to certain production processes and activities, the CBAM
should target the corresponding imports of goods. That requires clearly identifying
imported goods by way of their classification in the Combined nomenclature13 (‘CN’)
and linking them to embedded GHG emissions.
(26) The product coverage of the CBAM should reflect the activities covered by the
EU ETS as that scheme is based on quantitative and qualitative criteria linked to the
environmental objective of Directive 2003/87/EC and is the most comprehensive GHG
emissions regulatory system in the Union.
13 Council Regulation (EEC) No 2658/87 of 23 July 1987 on the tariff and statistical nomenclature and on
the Common Customs Tariff (OJ L 256, 7.9.1987, p. 1).
EN 19 EN
(27) Setting a product scope for the CBAM reflecting the activities covered by the EU ETS
would also contribute to ensuring that imported products are granted a treatment that is
not less favourable than that accorded to like products of domestic origin.
(28) Whilst the ultimate objective of the CBAM is a broad product coverage, it would be
prudent to start with a selected number of sectors with relatively homogeneous
products where there is a risk of carbon leakage. Union sectors deemed at risk of
carbon leakage are listed in Commission Delegated Decision 2019/70814.
(29) The goods under this Regulation should be selected after a careful analysis of their
relevance in terms of cumulated GHG emissions and risk of carbon leakage in the
corresponding EU ETS sectors while limiting complexity and administrative burden.
In particular, the actual selection should take into account basic materials and basic
products covered by the EU ETS with the objective of ensuring that imports of energy
intensive products into the Union are on equal footing with EU products in terms of
EU ETS carbon pricing, and to mitigate risks of carbon leakage. Other relevant criteria
to narrow the selection should be: firstly, relevance of sectors in terms of emissions,
namely whether the sector is one of the largest aggregate emitters of GHG emissions;
secondly, sector’s exposure to significant risk of carbon leakage, as defined pursuant
to Directive 2003/87/EC; thirdly, the need to balance broad coverage in terms of GHG
emissions while limiting complexity and administrative effort.
(30) The use of the first criterion allows listing the following industrial sector in terms of
cumulated emissions: iron and steel, refineries, cement, organic basic chemicals, and
fertilisers.
(31) However, certain sectors listed in Commission Delegated Decision (EU) 2019/708
should not at this stage be addressed in this Regulation, due to their particular
characteristics.
(32) In particular, organic chemicals are not included in the scope of this Regulation due to
technical limitations that do not allow to clearly define the embedded emissions of
imported goods. For these goods the applicable benchmark under the EU ETS is a
basic parameter, which does not allow for an unambiguous allocation of emissions
embedded in individual imported goods. A more targeted allocation to organic
chemicals will require more data and analysis.
(33) Similar technical constraints apply to refinery products, for which it is not possible to
unambiguously assign GHG emissions to individual output products. At the same
time, the relevant benchmark in the EU ETS does not directly relate to specific
products, such as gasoline, diesel or kerosene, but to all refinery output.
(34) However, aluminium products should be included in the CBAM as they are highly
exposed to carbon leakage. Moreover, in several industrial applications they are in
direct competition with steel products because of characteristics closely resembling
those of steel products. Inclusion of aluminium is also relevant as the scope of the
CBAM may be extended to cover also indirect emissions in the future.
(35) Similarly, tubes and pipe fittings should be included in the scope of the CBAM despite
their low level of embedded emissions, as their exclusion would increase the
14 Commission Delegated Decision (EU) 2019/708 of 15 February 2019 supplementing Directive
2003/87/EC of the European Parliament and of the Council concerning the determination of sectors and
subsectors deemed at risk of carbon leakage for the period 2021 to 2030 (OJ L 120, 8.5.2019, p. 2).

EN 20 EN
likelihood of circumventing the enclosure of steel products in the CBAM by
modifying the pattern of trade towards downstream products.
(36) Conversely, this Regulation should not apply to certain products whose production
does not entail meaningful emissions like ferrous scrap (under CN code 7204), ferro-
alloys (CN code 7202) and certain fertilisers (under CN code 3105 60 00).
(37) Import of electricity should be included in the scope of this Regulation, as this sector
is responsible for 30 per cent of the total GHG emissions in the Union. The enhanced
Union climate ambition would increase the gap in carbon costs between electricity
production in the Union and abroad. That increase combined with the progress in
connecting the Union electricity grid to that of its neighbours would increase the risk
of carbon leakage due to increased imports of electricity, a significant part of which is
produced by coal-fired power plants.
(38) As importers of goods covered by this Regulation should not have to fulfil their
CBAM obligations under this Regulation at the time of importation, specific
administrative measures should be applied to ensure that the obligations are fulfilled at
a later stage. Therefore, importers should only be entitled to import CBAM goods after
they have been granted an authorisation by competent authorities responsible for the
application of this Regulation.
(39) The CBAM should be based on a declarative system where an authorised declarant,
who may represent more than one importer, submits annually a declaration of the
embedded emissions in the goods imported to the customs territory of the Union and
surrenders a number of CBAM certificates corresponding to those declared emissions.
(40) An authorised declarant should be allowed to claim a reduction in the number of
CBAM certificates to be surrendered corresponding to the carbon price already paid
for those emissions in other jurisdictions.
(41) The embedded declared emissions should be verified by a person accredited by a
national accreditation body appointed in accordance with Article 4(1) of Regulation
No 765/2008 of the European Parliament and of the Council15 or pursuant to
Commission Implementing Regulation (EU) 2018/206716.
(42) The system should allow operators of production installations in third countries to
register in a central database and to make their verified embedded GHG emissions
from production of goods available to authorised declarants. An operator should be
able to choose not to have its name, address and contact details in the central database
made accessible to the public.
(43) CBAM certificates differ from EU ETS allowances for which daily auctioning is an
essential feature. The need to set a clear price for CBAM certificates makes a daily
publication excessively burdensome and confusing for operators, as daily prices risk
becoming obsolete upon publication. Thus, the publication of CBAM prices on a
weekly basis would accurately reflect the pricing trend of EU ETS allowances and
pursue the same climate objective. The calculation of the price of CBAM certificates
15 Regulation (EC) No 765/2008 of the European Parliament and of the Council of 9 July 2008 setting out
the requirements for accreditation and market surveillance relating to the marketing of products and
repealing Regulation (EEC) No 339/93 (OJ L 218, 13.8.2008, p. 30). 16 Commission Implementing Regulation (EU) 2018/2067 of 19 December 2018 on the verification of
data and on the accreditation of verifiers pursuant to Directive 2003/87/EC of the European Parliament
and of the Council (OJ L 334, 31.12.2018, p. 94).

EN 21 EN
should therefore be set on the basis of a longer timeframe (on a weekly basis) than in
the timeframe established by the EU ETS (on a daily basis). The Commission should
be tasked to calculate and publish that average price.
(44) In order to give the authorised declarants flexibility in complying with their CBAM
obligations and allow them to benefit from fluctuations in the price of EU ETS
allowances, the CBAM certificates should be valid for a period of two years from the
date of purchase. The authorised declarant should be allowed to re-sell to the national
authority a portion of the certificates bought in excess. The authorised declarant
should build up during the year the amount of certificates required at the time of
surrendering, with thresholds set at the end of each quarter.
(45) The physical characteristics of electricity as a product, in particular the impossibility
to follow the actual flow of electrons, justifies a slightly different design for the
CBAM. Default values should be used as a standard approach and it should be
possible for authorised declarants to claim the calculation of their CBAM obligations
based on actual emissions. Electricity trade is different from trade in other goods,
notably because it is traded via interconnected electricity grids, using power exchanges
and specific forms of trading. Market coupling is a densely regulated form of
electricity trade which allows to aggregate bids and offers across the Union.
(46) To avoid risks of circumvention and improve the traceability of actual CO2 emissions
from import of electricity and its use in goods, the calculation of actual emissions
should only be permitted through a number of strict conditions. In particular, it should
be necessary to demonstrate a firm nomination of the allocated interconnection
capacity and that there is a direct contractual relation between the purchaser and the
producer of the renewable electricity, or between the purchaser and the producer of
electricity having lower than default value emissions. .
(47) Contracting Parties to the Treaty establishing the Energy Community17 or Parties to
Association Agreements including Deep and Comprehensive Free Trade Areas are
committed to decarbonisation processes that should eventually result in the adoption
of carbon pricing mechanisms similar or equivalent to the EU ETS or in their
participation in the EU ETS.
(48) Integration of third countries into the Union electricity market is an important drive for
those countries to accelerate their transition to energy systems with high shares of
renewable energies. Market coupling for electricity, as set out in Commission
Regulation (EU) 2015/122218, enables third countries to better integrate electricity
from renewable energies into the electricity market, to exchange such electricity in an
efficient manner within a wider area, balancing supply and demand with the larger
Union market, and reduce the carbon intensity of their electricity generation.
Integration of third countries into the Union electricity market also contributes to the
security of electricity supplies in those countries and in the neighbouring Member
States.
(49) Once third countries will be closely integrated into the Union electricity market via
market coupling, technical solutions should be found to ensure the application of the
CBAM to electricity exported from such countries into the customs territory of the
17 Council Decision 2006/500/EC of 29 May 2006 on the conclusion by the European Community of the
Energy Community Treaty (OJ L 198, 20.7.2006, p. 15). 18 Commission Regulation (EU) 2015/1222 of 24 July 2015 establishing a guideline on capacity allocation
and congestion management (OJ L 197, 25.7.2015, p. 24).
EN 22 EN
Union. If technical solutions cannot be found, third countries that are market coupled
should benefit from a time limited exemption from the CBAM until at the latest 2030
with regard solely to the export of electricity, provided that certain conditions are
satisfied. However, those third countries should develop a roadmap and commit to
implement a carbon pricing mechanism providing for an equivalent price as the EU
ETS, and should commit to achieving carbon neutrality by 2050 [as well as?] to align
with Union legislation in the areas of environment, climate, competition and energy.
That exemption should be withdrawn at any time if there are reasons to believe that
the country in question does not fulfil its commitments or it has not adopted by 2030
an ETS equivalent to the EU ETS.
(50) A transitional period should apply during the period 2023 until 2025. A CBAM
without financial adjustment should apply, with the objective to facilitate a smooth roll
out of the mechanism hence reducing the risk of disruptive impacts on trade.
Declarants should have to report on a quarterly basis the actual embedded emissions in
goods imported during the transitional period, detailing direct and indirect emissions
as well as any carbon price paid abroad.
(51) To facilitate and ensure a proper functioning of the CBAM, the Commission should
provide support to the competent authorities responsible for the application of this
Regulation in carrying out their obligations.
(52) The Commission should evaluate the application of this Regulation before the end of
the transitional period and report to the European Parliament and the Council. The
report of the Commission should in particular focus on possibilities to enhance climate
actions towards the objective of a climate neutral Union by 2050. The Commission
should, as part of that evaluation, initiate collection of information necessary to
possibly extend the scope to indirect emissions, as well as to other goods and services
at risk of carbon leakage, and to develop methods of calculating embedded emissions
based on the environmental footprint methods19 .
(53) In light of the above, a dialogue with third countries should continue and there should
be space for cooperation and solutions that could inform the specific choices that will
be made on the details of the design of the measure during the implementation, in
particular during the transitional period.
(54) The Commission should strive to engage in an even handed manner and in line with
the international obligations of the EU, with the third countries whose trade to the EU
is affected by this Regulation, to explore possibilities for dialogue and cooperation
with regard to the implementation of specific elements of the Mechanism set out this
Regulation and related implementing acts. It should also explore possibilities for
concluding agreements to take into account their carbon pricing mechanism.
(55) As the CBAM aims to encourage cleaner production processes, the EU stands ready to
work with low and middle-income countries towards the de-carbonisation of their
manufacturing industries. Moreover, the Union should support less developed
countries with the necessary technical assistance in order to facilitate their adaptation
to the new obligations established by this regulation.
19 Commission Recommendation 2013/179/EU of 9 April 2013 on the use of common methods to
measure and communicate the life cycle environmental performance of products and organisations (OJ
L 124, 4.5.2013, p. 1).

EN 23 EN
(56) The provisions of this Regulation are without prejudice to Regulation (EU) 2016/679
of the European Parliament and of the Council20 and 2018/1725 of the European
Parliament and of the Council21.
(57) In the interest of efficiency, the provisions of Council Regulation (EC) No 515/9722
should apply.
(58) In order to remedy circumvention of the provisions of this Regulation, the power to
adopt acts in accordance with Article 290 of TFEU should be delegated to the
Commission in respect of supplementing the list of goods in Annex I.
(59) It is of particular importance that the Commission carry out appropriate consultations
during its preparatory work, including at expert level, and that those consultations be
conducted in accordance with the principles laid down in the Interinstitutional
Agreement on Better Law-Making of 13 April 201623. In particular, to ensure equal
participation in the preparation of delegated acts, the European Parliament and the
Council receive all documents at the same time as Member States' experts, and their
experts systematically have access to meetings of Commission expert groups dealing
with the preparation of delegated acts.
(60) In order to ensure uniform conditions for the implementation of this Regulation,
implementing powers should be conferred on the Commission. Those powers should
be exercised in accordance with Regulation (EU) No 182/2011 of the European
Parliament and of the Council24.
(61) The financial interests of the Union should be protected through proportionate
measures throughout the expenditure cycle, including the prevention, detection and
investigation of irregularities, the recovery of funds lost, wrongly paid or incorrectly
used and, where appropriate, administrative and financial penalties.
20 Regulation (EU) 2016/679 of the European Parliament and of the Council of 27 April 2016 on the
protection of natural persons with regard to the processing of personal data and on the free movement of
such data, and repealing Directive 95/46/EC (General Data Protection Regulation) (OJ L 119, 4.5.2016,
p. 1). 21 Regulation (EU) 2018/1725 of the European Parliament and of the Council of 23 October 2018 on the
protection of natural persons with regard to the processing of personal data by the Union institutions,
bodies, offices and agencies and on the free movement of such data, and repealing Regulation (EC)
No 45/2001 and Decision No 1247/2002/EC (OJ L 295, 21.11.2018, p. 39). 22 Council Regulation (EC) No 515/97 of 13 March 1997 on mutual assistance between the administrative
authorities of the Member States and cooperation between the latter and the Commission to ensure the
correct application of the law on customs and agricultural matters (OJ L 82, 22.3.1997, p. 1). 23 Interinstitutional Agreement between the European Parliament, the Council of the European Union and
the European Commission on Better Law-Making (OJ L 123, 12.5.2016, p. 1). 24 Regulation (EU) No 182/2011 of the European Parliament and of the Council of 16 February 2011
laying down the rules and general principles concerning mechanisms for control by the Member States
of the Commission's exercise of implementing powers (OJ L 55, 28.2.2011, p. 13).

EN 24 EN
HAVE ADOPTED THIS REGULATION:
Chapter I
Subject matter, scope and definitions
Article 1
Subject matter
1. This Regulation establishes a carbon border adjustment mechanism (the ‘CBAM’)
for addressing greenhouse gas emissions embedded in the goods referred to in Annex
I, upon their importation into the customs territory of the Union, in order to prevent
the risk of carbon leakage.
2. The CBAM complements the system established for greenhouse gas emission
allowance trading within the Union by Directive 2003/87/EC by applying an
equivalent set of rules to imports into the customs territory of the Union of goods
referred to in Article 2.
3. The mechanism will progressively become an alternative to the mechanisms
established under Directive 2003/87/EC to prevent the risk of carbon leakage,
notably the allocation of allowances free of charge in accordance with Article 10a of
that Directive.
Article 2
Scope
1. This Regulation applies to goods as listed in Annex I, originating in a third country,
when those goods, or processed products from those goods as resulting from the
inward processing procedure referred to in Article 256 of Regulation (EU)
No 952/2013 of the European Parliament and of the Council25, are imported into the
customs territory of the Union.
2. This Regulation applies to the goods referred to in paragraph 1 where those goods
are brought to the continental shelf or the exclusive economic zone of a Member
State.
3. By way of derogation from paragraphs 1 and 2, this Regulation does not apply to
goods originating in countries and territories listed in Annex II, Section A.
4. Imported goods shall be considered as originating in third countries in accordance
with non-preferential rules of origin as defined in Article 59 of Regulation (EU)
No 952/2013.
5. Countries and territories shall be listed in Annex II, Section A, subject to the
cumulative fulfilment of the following conditions: :
(a) the EU ETS established pursuant to Directive 2003/87/EC applies to that
country or territory or an agreement has been concluded between that third
country or territory and the Union fully linking the EU ETS and the third
country or territory emission trading system;
25 Regulation (EU) No 952/2013 of the European Parliament and of the Council of 9 October 2013 laying
down the Union Customs Code (OJ L 269, 10.10.2013, p. 1).
EN 25 EN
(b) the price paid in the country where the goods are originating in is effectively
charged on those goods without any rebate beyond those also applied in the
EU ETS.
6. The Commission is empowered to adopt implementing acts in order to determine the
conditions for applying the CBAM to goods referred to in paragraph 2. Those
implementing acts shall be adopted in accordance with the examination procedure
referred to in Article 29(2).
7. If a third country or territory has an electricity market which is integrated with the
Union internal market for electricity through market coupling, and it has not been
possible to find a technical solution for the application of the CBAM to the
importation of electricity into the Union, from that third country or territory, such the
importation of electricity from the country or territory shall be exempt from the
application of the CBAM, provided all of the following conditions are satisfied:
(a) the third country or territory has concluded an agreement with the Union,
setting out an obligation to apply the Union law in the field of electricity,
including the legislation on the development of renewable energy sources, as
well as other rules in the field of energy, environment and competition;
(b) the national law in that third country or territory implements the main
provisions of the Union electricity market legislation, including on the
development of renewable energy sources and the coupling of electricity
markets;
(c) the third country or territory has submitted a roadmap to the Commission,
containing a timetable for the adoption of measures to implement the
conditions set out in points (d) and (e);
(d) the third country or territory has committed to climate neutrality by 2050 and
has accordingly formally formulated and communicated, where applicable, to
the United Nations Framework Convention on Climate Change a mid-century,
long-term low greenhouse gas emissions development strategy aligned with
that objective, and has implemented that obligation in its domestic legislation;
(e) the third country or territory has, when implementing the roadmap pursuant to
point (c), demonstrated substantial progress towards the alignment of domestic
legislation with Union law in the field of climate action on the basis of that
roadmap, including towards carbon pricing at an equivalent level as the Union
at least insofar as the generation of electricity is concerned. The
implementation of an emission trading system for electricity, with a price
equivalent to the EU ETS, shall be finalised by 1 January 2030;
(f) the third country or territory has put in place an effective systems to prevent
indirect import of electricity in the Union from other third countries not
meeting the requirements set out in points (a) to (e).
8. A third country or territory satisfying the conditions set out in paragraph 7, points (a)
to (f), shall be listed in Annex II, Section B, of this Regulation, and shall submit two
reports on the fulfilment of the conditions pursuant to paragraph 7, points (a) to (f),
one before 1 July 2025 and another before 1 July 2029. By 31 December 2025 and
by 31 December 2029, the Commission shall assess, notably on the basis of the
roadmap pursuant to paragraph 7, point (c), and the reports received from the third
country or territory, whether that third country or territory continues to respect the
conditions set out in paragraph 7.
EN 26 EN
9. A third country or territory listed in Annex II, Section B of this Regulation, shall be
removed from that list:
(a) if the Commission has reasons to consider that the country or territory has not
shown sufficient progress to comply with one of the requirements listed in
paragraph 7, points (a) to (f), or if the country or territory has taken action
incompatible with the objectives set out in the Union climate and
environmental legislation;
(b) if the third country or territory has taken steps contrary to its decarbonisation
objectives, such as providing public support for the establishment of new
generation capacity that emits more than 550 g of CO2 of fossil fuel origin per
kWh of electricity.
10. The Commission is empowered to adopt delegated acts in accordance with Article 28
to set out requirements and procedures for countries or territories that are deleted
from the list in Annex II, Section B, to ensure the application of this Regulation to
their territories with regard to electricity. If in such cases market coupling remains
incompatible with the application of this Regulation, the Commission may decide to
exclude the third countries or territories from Union market coupling and require
explicit capacity allocation at the border between the Union and the third country, so
that the CBAM can apply.
11. The Commission is empowered to adopt delegated acts in accordance with Article 28
to amend the lists in Annex II, Sections A or B, depending on whether the conditions
in paragraphs 5, 7 or 9 are satisfied.
12. The Union, may conclude agreements with third countries with a view to take
account of carbon pricing mechanisms in these countries in the application of Article
9.
Article 3
Definitions
For the purposes of this Regulation, the following definitions apply:
(1) ‘goods’ mean goods listed in Annex 1;
(2) ‘greenhouse gases’ mean greenhouse gases as specified in Annex I in relation to each
of the goods listed in that Annex;
(3) ‘emissions’ mean the release of greenhouse gases into the atmosphere from the
production of goods;
(4) ‘importation’ means the release for free circulation provided for in Article 201 of
Regulation (EU) No 952/2013;
(5) ‘EU ETS’ means the system for greenhouse gas emissions allowance trading within
the Union in respect of activities listed in Annex I to Directive 2003/87/EC other
than aviation activities;
(6) ‘third country’ means a country or territory outside the customs territory of the
Union;
(7) ‘continental shelf’ means the continental shelf as defined in the United Nations
Convention on the Law of the Sea;
EN 27 EN
(8) ‘exclusive economic zone’ means the exclusive economic zone as defined in the
United Nations Convention on the Law of the Sea and which has been declared as
exclusive economic zone by a Member State pursuant to that convention;
(9) ‘market coupling’ means allocation of transmission capacity via an Union system
which simultaneously matches orders and allocates cross-zonal capacities as set out
in Commission Regulation (EU) 2015/1222;
(10) ‘explicit capacity allocation’ means the allocation of cross-border transmission
capacity separate from the trade of electricity;
(11) ‘competent authority’ means the authority, designated by each Member State in
accordance with Article 11 of this Regulation;
(12) ‘customs authorities’ mean the customs administrations of Member States as defined
in Article 5(1) of Regulation (EU) No 952/2013;
(13) ‘declarant’ means a person lodging a customs declaration for release for free
circulation in its own name or the person in whose name such a declaration is lodged
in accordance with Regulation (EU) No 952/2013;
(14) ‘person’ means a natural person, a legal person and any association of persons which
is not a legal person but which is recognised under Union or national law as having
the capacity to perform legal acts;
(15) ‘direct emissions’ mean emissions from the production processes of goods over
which the producer has direct control;
(16) ‘embedded emissions’ mean direct emissions released during the production of
goods, calculated pursuant to the methods set out in Annex III;
(17) ‘tonne of CO2e’ means one tonne of carbon dioxide (‘CO2’) or CO2, nitrous oxide
and perfluorocarbons as referred for goods in Annex I;
(18) ‘CBAM certificate’ means a certificate in electronic format corresponding to one
tonne of embedded emissions in goods;
(19) ‘surrender’ means offsetting of CBAM certificates against the declared embedded
emissions in imported goods;
(20) ‘production processes’ mean the chemical and physical processes carried out to
produce goods in an installation;
(21) ‘default value’ means a value that is calculated or drawn from secondary data
representing embedded emissions in goods;
(22) ‘actual emissions’ mean the emissions calculated based on primary data from the
production processes of goods;
(23) ‘carbon price’ means the monetary amount paid in a third country in the form of a
tax or emission allowances under a greenhouse gas emissions trading system,
calculated on greenhouse gases covered by such a measure and released during the
production of goods;
(24) ‘installation’ means a stationary technical unit where a production process is carried
out;
(25) ‘operator’ means any person who operates or controls an installation in a third
country;
EN 28 EN
(26) ‘national accreditation body’ means a national accreditation body as appointed by
each Member State in accordance with Article 4(1) of Regulation (EC) No 765/2008;
(27) ‘EU ETS allowance’ means an allowance referred to in Article 3(a) of
Directive 2003/87/EC in respect of activities listed in Annex I of that Directive other
than aviation activities;
(28) ‘indirect emissions’ mean emissions from the production of electricity, heating and
cooling, which is consumed during the production processes of goods.
Chapter II
Obligations and rights of authorised declarants of goods
Article 4
Importation of goods
Goods shall only be imported into the customs territory of the Union by a declarant that is
authorised by the competent authority in accordance with Article 17 (‘authorised declarant’).
Article 5
Application for an authorisation
1. Any declarant shall, prior to importing goods as referred to in Article 2, apply to the
competent authority at the place where it is established, for an authorisation to import
those goods into the customs territory of the Union.
2. By way of derogation from paragraph 1, where transmission capacity for the import
of electricity is allocated via explicit capacity allocation, the person to which
capacity has been allocated for import and which nominates this capacity for import
shall, for the purposes of this Regulation, be regarded as an authorised declarant in
the Member State where the person declares the import of electricity. Imports are to
be measured per border for time periods not longer than one hour and no deduction
of export or transit in the same hour is possible.
3. The application for an authorisation shall include the following information about the
declarant which must be established in the Union:
(a) name, addresses and contact information;
(b) Economic Operators Registration and Identification number (‘EORI’) in
accordance with Article 9 of Regulation (EU) No 952/2013;
(c) main economic activity carried out in the Union;
(d) certification by the tax authority in the Member State, where the declarant is
established, that the declarant is not subject to an outstanding recovery order
for national tax debts;
(e) declaration on honour that the declarant was not involved in any serious
infringements or repeated infringements of customs legislation, taxation rules
and market abuse rules during the five years preceding the year of the
application, including that it has no record of serious criminal offences relating
to its economic activity;

EN 29 EN
(f) information necessary to demonstrate the declarant’s financial and operational
capacity to fulfil its obligations under this Regulation and, if decided by the
competent authority on the basis of a risk assessment, supporting documents
confirming that information, such as the profit and loss account and the balance
sheet for up to the three last financial years for which the accounts were closed;
(g) estimated monetary value and volume of imports of goods to the customs
territory of the Union by the type of goods, for the calendar year during which
the application is submitted and for the following calendar year;
(h) names and contact information of the persons on behalf of whom the declarant
is acting, if applicable.
4. The applicant may at any time withdraw its application.
5. The authorised declarant shall inform the competent authority without delay of any
changes of the information provided under paragraph 3, arising after the decision was
taken, which may influence the decision taken pursuant to Article 17 or content of
the authorisation in accordance with Article 17.
6. The Commission is empowered to adopt implementing acts, concerning the standard
format of the application and the delays and procedure to be followed by the
competent authority when processing applications for authorisation in accordance
with paragraph 1 and the rules for identification by the competent authority of the
declarants for the importation of electricity. Those implementing acts shall be
adopted in accordance with the examination procedure referred to in Article 29(2).
Article 6
CBAM declaration
1. By 31 May of each year, each authorised declarant shall submit a declaration
(‘CBAM declaration’), for the calendar year preceding the declaration, to the
competent authority.
2. The CBAM declaration shall contain the following:
(a) the total quantity of each type of goods imported during the calendar year
preceding the declaration, expressed in megawatt hours for electricity and in
tonnes for other goods;
(b) the total embedded emissions, expressed in tonnes of CO2e emissions per
megawatt-hour of electricity or for other goods per tonne of CO2e emissions
per tonne of each type of goods, calculated in accordance with Article 7;
(c) the total number of CBAM certificates corresponding to the total embedded
emissions, to be surrendered, after the reduction due on the account of the
carbon price paid in a country of origin in accordance with Article 9 and the
adjustment necessary of the extent to which EU ETS allowances are allocated
free of charge in accordance with Article 31.
3. Where the imported goods are processed products resulting from the inward
processing procedure as referred to in Article 256 of Regulation (EU) No 952/2013,
the authorised declarant shall report in the CBAM declaration the total emissions
embedded in the goods placed under the inward processing procedure that are listed
in Annex I to this Regulation, even if the processed product is not listed in that
Annex.
EN 30 EN
4. Where the imported goods are processed products resulting from the outward
processing procedure as referred to in Article 259 of Regulation (EU) No 952/2013,
the authorised declarant shall report in the CBAM declaration only the emissions of
the processing operation undertaken outside the customs territory of the Union,
provided that the processed product is listed in Annex I to this Regulation.
5. Where the imported goods are returned goods as referred to in Article 203 of
Regulation (EU) No 952/2013, the authorised declarant shall report separately, in the
CBAM declaration, ‘zero’ for the total embedded emissions corresponding to those
goods.
6. The Commission is empowered to adopt implementing acts concerning the standard
format and the procedure for submitting the CBAM declaration and the arrangements
for surrendering CBAM certificates provided for in paragraph 2, point (c). Those
implementing acts shall be adopted in accordance with the examination procedure
referred to in Article 29(2).
Article 7
Calculation of embedded emissions
1. Embedded emissions in goods shall be calculated pursuant to the methods set out in
Annex III.
2. Embedded emissions in goods other than electricity shall be determined based on the
actual emissions in accordance with the methods set out in Annex III, points 2 and 3.
When actual emissions cannot be adequately determined, the embedded emissions
shall be determined by reference to default values in accordance with the methods set
out in Annex III, point 4.1.
3. Embedded emissions in imported electricity shall be determined by reference to
default values in accordance with the method set out in Annex III, point 4.2, unless
the authorised declarant chooses to determine the embedded emissions based on the
actual emissions in accordance with that annex, point 5.
4. The authorised declarant shall keep records of the information required to calculate
the embedded emissions in accordance with the requirements laid down in Annex IV.
Those records shall be sufficiently detailed to enable verifiers accredited pursuant to
Article 18 to verify the embedded emissions in accordance with Article 8 and
Annex V and to enable the competent authority to review the CBAM declaration in
accordance with Article 19(1).
5. The authorised declarant shall keep those records of information referred to in
paragraph 4, including the report of the verifier, until the end of the fourth year after
the year in which the CBAM declaration has been or should have been submitted.
6. The Commission is empowered to adopt implementing acts concerning detailed rules
regarding the elements of the calculation methods set out in Annex III, including
determining system boundaries of production processes, emission factors,
installation-specific values of actual emissions and default values and their respective
application to individual goods as well as laying down methods to ensure the
reliability of data on the basis of which the default values shall be determined,
including the level of detail and the verification of the data. Where necessary, those
acts shall provide that the default values can be adapted to particular areas, regions or
countries to take into account specific objective factors such as geography, natural
resources, market conditions, prevailing energy sources, or industrial processes. The
EN 31 EN
implementing acts shall build upon existing legislation for the verification of
emissions and activity data for installations covered by Directive 2003/87/EC, in
particular Implementing Regulation (EU) No 2018/2067.
7. The implementing acts referred to in paragraph 6 shall be adopted in accordance with
the examination procedure referred to in Article 29(2).
Article 8
Verification of embedded emissions
1. The authorised declarant shall ensure that the total embedded emissions declared in
the CBAM declaration submitted pursuant to Article 6 are verified by a verifier
accredited pursuant to Article 18, based on the verification principles set out in
Annex V.
2. For embedded emissions in goods produced in registered installations in a third
country in accordance with Article 10, the authorised declarant may choose to use
verified information disclosed to it in accordance with Article 10(7) to fulfil the
obligation referred to in paragraph 1.
3. The Commission is empowered to adopt implementing acts concerning the principles
of verification referred to in paragraph 1 as regards the possibility to waive the
obligation for the verifier to visit the installation where relevant goods are produced
and the obligation to set thresholds for deciding whether misstatements or non-
conformities are material and concerning the supporting documentation needed for
the verification report.
The implementing acts referred to in the first subparagraph shall be adopted in
accordance with the examination procedure referred to in Article 29(2).
Article 9
Carbon price paid in a country of origin
1. An authorised declarant may claim in its CBAM declaration a reduction in the
number of CBAM certificates to be surrendered in order for the carbon price paid in
the country of origin for the declared embedded emissions to be taken into account.
2. The authorised declarant shall keep records of the documentation, certified by an
independent person, required to demonstrate that the declared embedded emissions
were subject to a carbon price in the country of origin of the goods and keep
evidence of the proof of the actual payment for that carbon price which should not
have been subject to an export rebate or any other form of compensation on
exportation.
3. The authorised declarant shall keep those records referred to in paragraph 2 until the
end of the fourth year after the year during which the CBAM declaration has been or
should have been submitted.
4. The Commission is empowered to adopt implementing acts establishing the
methodology for calculating the reduction in the number of CBAM certificates to be
surrendered, regarding the conversion of the carbon price paid in foreign currency
into euro at yearly average exchange rate in accordance with paragraph 1, and
regarding the qualifications of the independent person certifying the information as
well as elements of proof of the carbon price paid and the absence of export rebates
or other forms of compensation on exportation being applied as referred to in
EN 32 EN
paragraph 2. Those implementing acts shall be adopted in accordance with the
examination procedure referred to in Article 29(2).
Article 10
Registration of operators and installations in third countries
1. The Commission shall, upon request by an operator of an installation located in a
third country, register the information on that operator and on its installation in a
central database referred to in Article 14(4).
2. The request for registration referred to in paragraph 1 shall include the following
information to be included in the database upon registration:
(a) the name, address and contact details of the operator;
(b) the location of each installation including complete address and coordinates
expressed in longitude and latitude including 6 decimals;
(c) the main economic activity of the installation in the third country;
3. The Commission shall notify the operator on the registration in the database. The
registration shall be valid for a period of five years from the date of its notification to
the operator of the installation.
4. The operator shall inform the Commission without delay of any changes in the
information referred to in paragraph 2 arising after the registration and the
Commission shall update the relevant information.
5. The operator referred to in paragraph 1 shall be obliged to:
(a) determine the embedded emissions calculated in accordance with the methods
set out in Annex III, by type of goods produced at the installation referred to in
paragraph 1;
(b) ensure that the embedded emissions referred to in point (a) are verified in
accordance with the verification principles set out in Annex V by a verifier
accredited pursuant to Article 18;
(c) keep a copy of the verifier’s report as well as records of the information
required to calculate the embedded emissions in goods as laid down in
Annex IV for a period of four years after the verification has been performed.
6. The records referred to in paragraph 5, point (c), shall be sufficiently detailed to
enable the verification in accordance with paragraph 5, point (b), and to enable any
competent authority to review, in accordance with Article 19(1), the CBAM
declaration made by an authorised declarant to whom the relevant information was
disclosed in accordance with paragraph 8.
7. An operator may disclose the information on the verification of embedded emissions
referred to in paragraph 5 to an authorised declarant. The authorised declarant shall
be entitled to avail itself of that disclosed information to fulfil the obligation referred
to in Article 8.
8. The operator may, at any time, ask to be deregistered from the database.
EN 33 EN
Chapter III
Competent authorities
Article 11
Competent authorities
1. Each Member State shall designate the competent authority to carry out the
obligations under this Regulation and inform the Commission thereof.
The Commission shall make available to the Member States a list of all competent
authorities and publish this information in the Official Journal of the European
Union.
2. Member States shall require that competent authorities exchange any information
that is essential or relevant to the exercise of their functions and duties.
Article 12
Commission
The Commission shall assist the competent authorities in carrying out their obligations under
this Regulation and coordinate their activities.
Article 13
Professional secrecy and disclosure of information
All information acquired by the competent authority in the course of performing its duty
which is by its nature confidential or which is provided on a confidential basis shall be
covered by an obligation of professional secrecy. Such information shall not be disclosed by
the competent authority without the express permission of the person or authority that
provided it. It may be shared with customs authorities, the Commission and the European
Public Prosecutors Office and shall be treated in accordance with Council Regulation (EC)
No 515/97.
Article 14
National registries and central database
1. The competent authority of each Member State shall establish a national registry of
declarants authorised in that Member State in the form of a standardised electronic
database containing the data regarding the CBAM certificates of those declarants,
and to provide for confidentiality in accordance with the conditions set out in
Article 13.
2. The database referred to in paragraph 1 shall contain accounts with information
about each authorised declarant, in particular:
(a) the name and contact details of the authorised declarant;
(b) the EORI number of the authorised declarant;
(c) the CBAM account number;
(d) the number, the price of sale, the date of purchase, the date of surrender, or the
date of re-purchase, or that of the cancellation by the competent authority, of
CBAM certificates for each authorised declarant.
EN 34 EN
3. The information in the database referred to in paragraph 2 shall be confidential.
4. The Commission shall establish a central database accessible to the public containing
the names, addresses and contact details of the operators and the location of
installations in third countries in accordance with Article 10(2). An operator may
choose not to have its name, address and contact details accessible to the public.
Article 15
Central administrator
1. The Commission shall act as central administrator to maintain an independent
transaction log recording the purchase of CBAM certificates, their holding,
surrender, re-purchase and cancellation and ensure coordination of national
registries.
2. The central administrator shall carry out risk-based controls on transactions recorded
in national registries through an independent transaction log to ensure that there are
no irregularities in the purchase, holding, surrender, re-purchase and cancellation of
CBAM certificates.
3. If irregularities are identified as a result of the controls carried out under paragraph 2,
the Commission shall inform the Member State or Member States concerned for
further investigation in order to correct the identified irregularities.
Article 16
Accounts in the national registries
1. The competent authority shall assign to each authorised declarant a unique CBAM
account number.
2. Each authorised declarant shall be granted access to its account in the registry.
3. The competent authority shall set up the account as soon as the authorisation referred
to in Article 17(1) is granted and notify the authorised declarant thereof.
4. If the authorised declarant has ceased its economic activity or its authorisation was
revoked, the competent authority shall close the account of that declarant.
Article 17
Authorisation of declarants
1. The competent authority shall authorise a declarant who submits an application for
authorisation in accordance with Article 5(1), if the following conditions are
fulfilled:
(a) the declarant has not been involved in a serious infringement or repeated
infringements of customs legislation, taxation rules and market abuse rules and
has no record of serious criminal offences relating to its economic activity
during the five years preceding the application;
(b) the declarant demonstrates its financial and operational capacity to fulfil its
obligations under this Regulation.
2. Where the competent authority finds that the conditions listed in paragraph 1 are not
fulfilled, or where the applicant has failed to provide the information listed in
Article 5(3), the authorisation of the declarant shall be refused.
EN 35 EN
3. If the competent authority refuses to authorise a declarant, the declarant requesting
the authorisation may, prior to an appeal, object to the relevant authority under
national law, who shall either instruct the national administrator to open the account
or uphold the refusal in a reasoned decision, subject to requirements of national law
that pursue a legitimate objective compatible with this Regulation and are
proportionate.
4. A decision of the competent authority authorising a declarant shall contain the
following information
(a) the name and the address of the authorised declarant;
(b) the EORI number of the authorised declarant;
(c) the CBAM account number.
5. An authorised declarant may, at any time, ask for its authorisation to be revoked.
6. The competent authority shall require the provision of a guarantee in order to
authorise a declarant in accordance with paragraph 1, if the declarant was not
established throughout the two financial years that precede the year when the
application in accordance with Article 5(1) was submitted.
The competent authority shall fix the amount of such guarantee at the maximum
amount, as estimated by the competent authority, of the value of the CBAM
certificates that the authorised declarant have to surrender, in accordance with
Article 22.
7. The guarantee shall be provided as a bank guarantee, payable at first demand, by a
financial institution operating in the Union or by another form of guarantee which
provides equivalent assurance. Where the competent authority establishes that the
guarantee provided does not ensure, or is no longer certain or sufficient to ensure the
amount of CBAM obligations, it shall require the authorised declarant either to
provide an additional guarantee or to replace the initial guarantee with a new
guarantee, according to its choice.
8. The competent authority shall release the guarantee immediately after 31 May of the
second year in which the authorised declarant has surrendered CBAM certificates in
accordance with Article 22.
9. The competent authority shall revoke the authorisation for a declarant who no longer
meets the conditions laid down in paragraph 1, or who fails to cooperate with that
authority.
Article 18
Accreditation of verifiers
1. Any person accredited pursuant to Implementing Regulation (EU) No 2018/2067
shall be regarded as an accredited verifier under this Regulation.
2. In addition to paragraph 1, a national accreditation body may on request accredit a
person as a verifier under this Regulation after checking the documentation attesting
its capacity to apply the verification principles referred to Annex V to perform the
obligations of control of the embedded emissions established in Articles 8, 10
and 38.
3. The Commission is empowered to adopt delegated acts in accordance with Article 28
for the accreditation referred to in paragraph 2, specifying conditions for the control

EN 36 EN
and oversight of accredited verifiers, for the withdrawal of accreditation and for
mutual recognition and peer evaluation of the accreditation bodies.
Article 19
Review of CBAM declarations
1. The competent authority may review the CBAM declaration within the period ending
with the fourth year after the year in which the declaration should have been
submitted. The review may consist in verifying the information provided in the
CBAM declaration on the basis of the information communicated by the customs
authorities in accordance with Article 25(2) and any other relevant evidence, and on
the basis of any audit deemed necessary, including at the premises of the authorised
declarant.
2. Where a CBAM declaration in accordance with Article 6 has not been submitted, the
competent authority of the Member State of establishment of the authorised declarant
shall assess the CBAM obligations of that declarant on the basis of the information at
its disposal and calculate the total number of CBAM certificates due at the latest by
the 31 December of the fourth year following that when the CBAM declaration
should have been submitted.
3. Where the competent authority has established that the declared number of CBAM
certificates to be surrendered is incorrect, or that no CBAM declaration has been
submitted pursuant to paragraph 2, it shall adjust the number of CBAM certificates
due by the authorised declarant. The competent authority shall notify the authorised
declarant of the adjustment and request that the authorised declarant shall surrender
the additional CBAM certificates within one month.
4. The recipient of the notification referred to in paragraph 3 may lodge an appeal of the
notification. The recipient of the notification shall be provided with information
regarding the procedure to be followed in the event of an appeal.
5. Where CBAM certificates have been surrendered in excess of the number due, the
competent authority shall, without delay, reimburse the authorised declarant the
value of CBAM certificates surrendered in excess, calculated at the average price
paid for CBAM certificates by the authorised declarant during the year of import.
Chapter IV
CBAM certificates
Article 20
Sale of CBAM certificates
1. The competent authority of each Member State shall sell CBAM certificates to
declarants authorised in that Member State at the price calculated in accordance with
Article 21.
2. The competent authority shall ensure that each CBAM certificate is assigned a
unique unit identification code upon its creation and shall register the unique unit
identification number, the price and date of sale of the certificate in the national
registry in the account of the authorised declarant purchasing it.
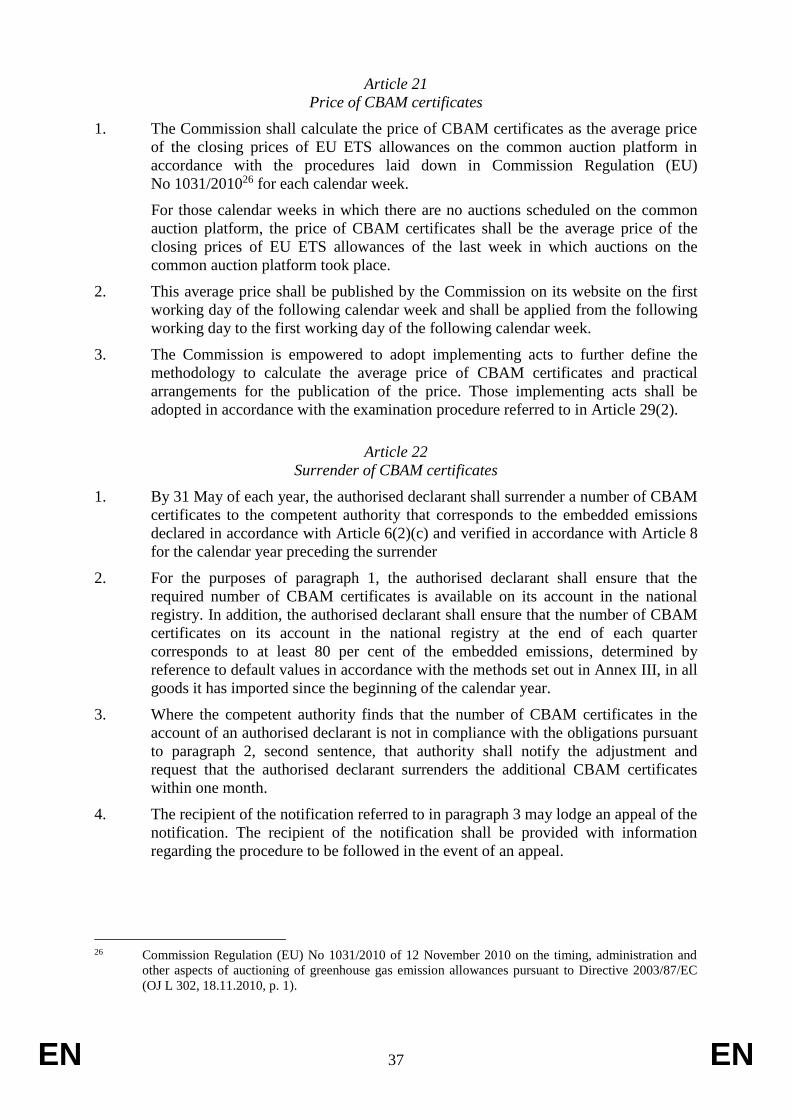
EN 37 EN
Article 21
Price of CBAM certificates
1. The Commission shall calculate the price of CBAM certificates as the average price
of the closing prices of EU ETS allowances on the common auction platform in
accordance with the procedures laid down in Commission Regulation (EU)
No 1031/201026 for each calendar week.
For those calendar weeks in which there are no auctions scheduled on the common
auction platform, the price of CBAM certificates shall be the average price of the
closing prices of EU ETS allowances of the last week in which auctions on the
common auction platform took place.
2. This average price shall be published by the Commission on its website on the first
working day of the following calendar week and shall be applied from the following
working day to the first working day of the following calendar week.
3. The Commission is empowered to adopt implementing acts to further define the
methodology to calculate the average price of CBAM certificates and practical
arrangements for the publication of the price. Those implementing acts shall be
adopted in accordance with the examination procedure referred to in Article 29(2).
Article 22
Surrender of CBAM certificates
1. By 31 May of each year, the authorised declarant shall surrender a number of CBAM
certificates to the competent authority that corresponds to the embedded emissions
declared in accordance with Article 6(2)(c) and verified in accordance with Article 8
for the calendar year preceding the surrender
2. For the purposes of paragraph 1, the authorised declarant shall ensure that the
required number of CBAM certificates is available on its account in the national
registry. In addition, the authorised declarant shall ensure that the number of CBAM
certificates on its account in the national registry at the end of each quarter
corresponds to at least 80 per cent of the embedded emissions, determined by
reference to default values in accordance with the methods set out in Annex III, in all
goods it has imported since the beginning of the calendar year.
3. Where the competent authority finds that the number of CBAM certificates in the
account of an authorised declarant is not in compliance with the obligations pursuant
to paragraph 2, second sentence, that authority shall notify the adjustment and
request that the authorised declarant surrenders the additional CBAM certificates
within one month.
4. The recipient of the notification referred to in paragraph 3 may lodge an appeal of the
notification. The recipient of the notification shall be provided with information
regarding the procedure to be followed in the event of an appeal.
26 Commission Regulation (EU) No 1031/2010 of 12 November 2010 on the timing, administration and
other aspects of auctioning of greenhouse gas emission allowances pursuant to Directive 2003/87/EC
(OJ L 302, 18.11.2010, p. 1).

EN 38 EN
Article 23
Re-purchase of CBAM certificates
1. The competent authority of each Member State shall, on request by a declarant
authorised in that Member State, re-purchase the excess of CBAM certificates
remaining on the account of the declarant in the national registry after the certificates
have been surrendered in accordance with Article 22. The request to re-purchase
shall be submitted by 30 June of each year when CBAM certificates were
surrendered.
2. The number of certificates subject to re-purchase as referred to in paragraph 1 shall
be limited to one third of the total CBAM certificates purchased by the authorised
declarant during the previous calendar year.
3. The re-purchase price for each CBAM certificate shall be the price paid by the
authorised declarant for that certificate at the time of purchase.
Article 24
Cancellation of CBAM certificates
By 30 June of each year, the competent authority of each Member State shall cancel any
CBAM certificates that were purchased during the year before the previous calendar year and
that remained in the accounts in the national registry of the declarants authorised in that
Member State.
Chapter V
Border administration of goods
Article 25
Procedures at the border when goods are imported
1. The customs authorities shall not allow the importation of goods unless the declarant
is authorised by a competent authority at the latest at the release for free circulation
of the goods.
2. The customs authorities shall periodically communicate information on the goods
declared for importation, which shall include the EORI number and the CBAM
account number of the declarant, the 8-digit CN code of the goods, the quantity, the
country of origin, the date of declaration and the customs procedure, to the
competent authority of the Member State where the declarant has been authorised.
3. The custom authorities shall carry out controls on the goods in accordance with
Article 46 of Regulation (EU) No 952/2013, including the 8-digit CN code, the
quantity and the country of origin of the imported goods. The Commission shall
include the risks relating to CBAM in the design of the common risk criteria and
standards pursuant to Article 50 of Regulation (EU) No 952/2013.
4. The customs authorities may communicate in accordance with Article 12(1) of
Regulation (EU) No 952/2013, confidential information acquired by the customs
authorities in the course of performing their duty or provided on a confidential basis,
to the competent authority of the Member State where the declarant has been
authorised. The competent authorities of the Member States shall treat and exchange
this information in accordance with Council Regulation (EC) No 515/97.
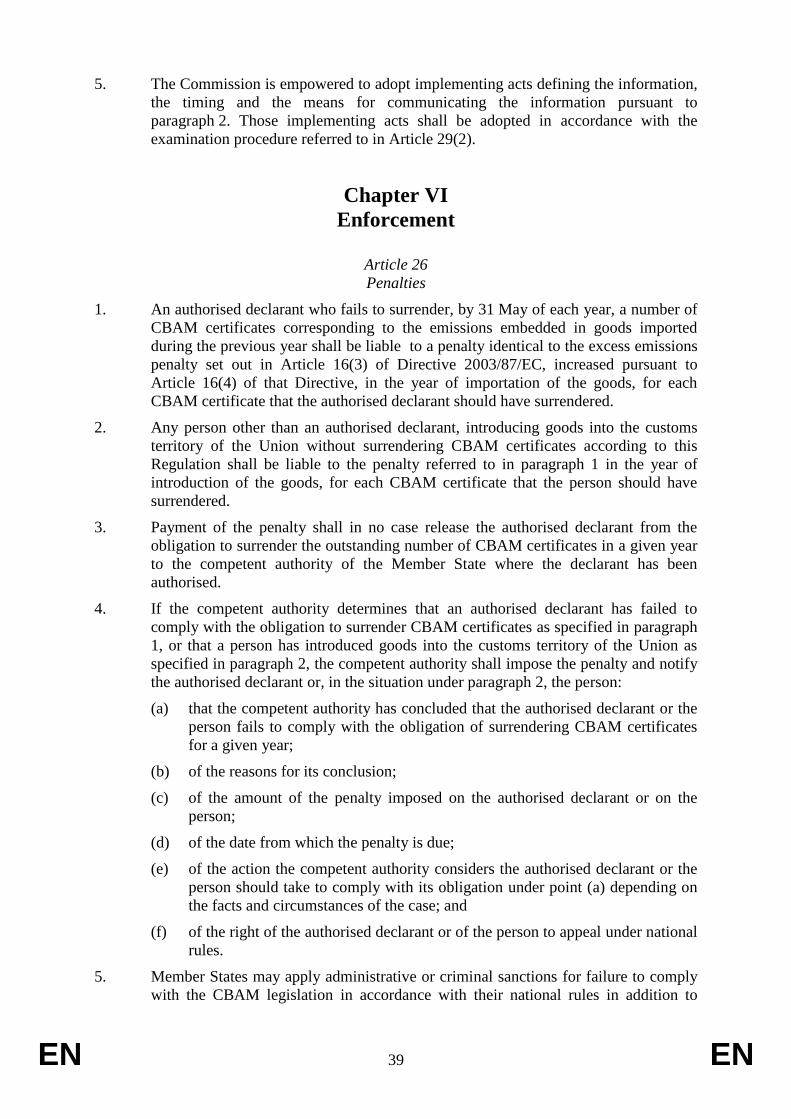
EN 39 EN
5. The Commission is empowered to adopt implementing acts defining the information,
the timing and the means for communicating the information pursuant to
paragraph 2. Those implementing acts shall be adopted in accordance with the
examination procedure referred to in Article 29(2).
Chapter VI
Enforcement
Article 26
Penalties
1. An authorised declarant who fails to surrender, by 31 May of each year, a number of
CBAM certificates corresponding to the emissions embedded in goods imported
during the previous year shall be liable to a penalty identical to the excess emissions
penalty set out in Article 16(3) of Directive 2003/87/EC, increased pursuant to
Article 16(4) of that Directive, in the year of importation of the goods, for each
CBAM certificate that the authorised declarant should have surrendered.
2. Any person other than an authorised declarant, introducing goods into the customs
territory of the Union without surrendering CBAM certificates according to this
Regulation shall be liable to the penalty referred to in paragraph 1 in the year of
introduction of the goods, for each CBAM certificate that the person should have
surrendered.
3. Payment of the penalty shall in no case release the authorised declarant from the
obligation to surrender the outstanding number of CBAM certificates in a given year
to the competent authority of the Member State where the declarant has been
authorised.
4. If the competent authority determines that an authorised declarant has failed to
comply with the obligation to surrender CBAM certificates as specified in paragraph
1, or that a person has introduced goods into the customs territory of the Union as
specified in paragraph 2, the competent authority shall impose the penalty and notify
the authorised declarant or, in the situation under paragraph 2, the person:
(a) that the competent authority has concluded that the authorised declarant or the
person fails to comply with the obligation of surrendering CBAM certificates
for a given year;
(b) of the reasons for its conclusion;
(c) of the amount of the penalty imposed on the authorised declarant or on the
person;
(d) of the date from which the penalty is due;
(e) of the action the competent authority considers the authorised declarant or the
person should take to comply with its obligation under point (a) depending on
the facts and circumstances of the case; and
(f) of the right of the authorised declarant or of the person to appeal under national
rules.
5. Member States may apply administrative or criminal sanctions for failure to comply
with the CBAM legislation in accordance with their national rules in addition to

EN 40 EN
penalties referred to in paragraph 2. Such sanctions shall be effective, proportionate
and dissuasive.
Article 27
Circumvention
1. The Commission shall take action, based on relevant and objective data, in
accordance with this Article, to address practices of circumvention of this
Regulation.
2. Practices of circumvention include situations where a change in the pattern of trade
in relation to goods included in the scope of this Regulation has insufficient due
cause or economic justification other than avoiding obligations as laid down in this
Regulation and consist in replacing those goods with slightly modified products,
which are not included in the list of goods in Annex I but belong to a sector included
in the scope of this Regulation.
3. A Member State or any party affected or benefitted by the situations described in
paragraph 2 may notify the Commission if it is confronted, over a two-month period
compared with the same period in the preceding year with a significant decrease in
the volume of imported goods included in the scope of this Regulation and an
increase of volume of imports of slightly modified products, which are not included
in the list of goods in Annex I. The Commission shall continually monitor any
significant change of pattern of trade of goods and slightly modified products at
Union level.
4. The notification referred to in paragraph 3 shall state the reasons on which it is based
and shall include relevant data and statistics regarding the goods and products
referred to in paragraph 2.
5. Where the Commission, taking into account the relevant data, reports and statistics,
including when provided by the customs authorities of Member States, has sufficient
reasons to believe that the circumstances referred to in paragraph 3 are occurring in
one or more Member States, it is empowered to adopt delegated acts in accordance
with Article 28 to supplement the scope of this Regulation in order to include slightly
modified products for anti-circumvention purposes.
Chapter VII
Exercise of delegation and committee procedure
Article 28
Exercise of the delegation
1. The power to adopt delegated acts is conferred on the Commission subject to the
conditions laid down in this Article.
2. The power to adopt delegated acts referred to in Articles 2(10), 2(11), 18(3) and
27(5) shall be conferred on the Commission for an indeterminate period of time.
3. The delegation of power referred to in Articles 2(10), 2(11), 18(3) and 27(5) may be
revoked at any time by the European Parliament or by the Council.

EN 41 EN
4. A decision to revoke shall put an end to the delegation of the power specified in that
decision. It shall take effect the day following the publication of the decision in the
Official Journal of the European Union or at a later date specified therein. It shall not
affect the validity of any delegated act already in force.
5. Before adopting a delegated act, the Commission shall consult experts designated by
each Member State in accordance with the principles laid down in the Inter-
institutional Agreement on Better Law-Making of 13 April 2016.
6. As soon as it adopts a delegated act, the Commission shall notify it simultaneously to
the European Parliament and to the Council.
7. A delegated act adopted pursuant to Articles 2(10), 2(11), 18(3) and 27(5) shall enter
into force only if no objection has been expressed either by the European Parliament
or by the Council within a period of two months of notification of that act to the
European Parliament and to the Council or if, before the expiry of that period, the
European Parliament and the Council have both informed the Commission that they
will not object. That period shall be extended by two months at the initiative of the
European Parliament or of the Council.
Article 29
Exercise of implementing powers by the Commission
1. The Commission shall be assisted by the CBAM Committee. The committee shall be
a committee within the meaning of Regulation (EU) No 182/2011.
2. Where reference is made to this paragraph, Article 5 of Regulation (EU)
No 182/2011 shall apply.
Chapter VIII
Reporting and review
Article 30
Review and reporting by the Commission
1. The Commission shall collect the information necessary with a view to extending the
scope of this Regulation to indirect emissions and goods other than those listed in
Annex I, and develop methods of calculating embedded emissions based on
environmental footprint methods.
2. Before the end of the transitional period, the Commission shall present a report to the
European Parliament and the Council on the application of this Regulation. The
report shall contain, in particular, the assessment of the possibilities to further extend
the scope of embedded emissions to indirect emissions and to other goods at risk of
carbon leakage than those already covered by this Regulation, as well as an
assessment of the governance system. It shall also contain the assessment of the
possibility to further extend the scope to embedded emissions of transportation
services as well as to goods further down the value chain and services that may be
subject to the risk of carbon leakage in the future.
3. The report by the Commission shall, if appropriate, be accompanied by a legislative
proposal.

EN 42 EN
Chapter IX
Coordination with free allocation of allowances under the EU ETS
Article 31
Free allocation of allowances under the EU ETS and obligation to surrender CBAM
certificates
1. The CBAM certificates to be surrendered in accordance with Article 22 shall be
adjusted to reflect the extent to which EU ETS allowances are allocated free of
charge in accordance with Article 10a of Directive 2003/87/EC to installations
producing, within the Union, the goods listed in Annex I.
2. The Commission is empowered to adopt implementing acts laying down a
calculation methodology for the reduction referred to in paragraph 1. Those
implementing acts shall be adopted in accordance with the examination procedure
referred to in Article 29(2).
Chapter X
Transitional provisions
Article 32
Scope
During the transitional period of this Regulation, the CBAM mechanism shall apply as a
reporting obligation as set out in Articles 33 to 35.
Article 33
Importation of goods
1. A declarant importing goods shall be obliged to fulfil a reporting obligation as set out
in Article 35.
2. The customs authorities shall, at the moment of the release of those goods for free
circulation at the latest, inform the declarant of the obligation referred to in
paragraph 1.
3. The customs authorities shall, by means of the surveillance mechanism established
pursuant to Article 56(5) of Regulation (EU) No 952/2013, communicate to the
competent authority of the Member State of importation information on imported
goods, including processed products resulting from the outward processing
procedure. Such information shall include the EORI number of the declarant, the 8-
digit CN code, the quantity, the country of origin and the declarant of the goods, the
date of declaration and the customs procedure.
Article 34
Reporting obligation for certain customs procedures
1. For processed goods resulting from the inward processing procedure as referred to in
Article 256 of Regulation (EU) No 952/2013, the reporting obligation referred to in
Article 33(1) shall include the goods placed under the inward processing procedure

EN 43 EN
that are listed in Annex I to this Regulation, even if the processed product is not
listed in that Annex.
2. The reporting obligation shall not apply to import of:
(a) processed products resulting from the outward processing procedure as referred
to in Article 259 of Regulation (EU) No 952/2013;
(b) imported goods qualifying as returned goods in accordance with Article 203 of
Regulation (EU) No 952/2013.
Article 35
Reporting obligation
1. Each declarant shall, for each quarter of a calendar year, submit a report (‘CBAM
report’) containing information on the goods imported during that quarter, to the
competent authority of the Member State of importation or, if goods have been
imported to more than one Member State, to the competent authority of the Member
State at the declarant’s choice, no later than one month after the end of each quarter.
2. The CBAM report shall include the following information:
(a) the total quantity of each type of goods, expressed in megawatt hours for
electricity and in tonnes for other goods, specified per installation producing
the goods in the country of origin;
(b) the actual total embedded emissions, expressed in tonnes of CO2e emissions
per megawatt-hour of electricity or for other goods in tonne of CO2e emissions
per tonne of each type of goods, calculated in accordance with the method set
out in Annex III;
(c) the actual total embedded indirect emissions, expressed in tonnes of CO2e
emissions per tonne of each type of other goods than electricity, calculated in
accordance with a method set out in an implementing act referred to in
paragraph 6;
(d) the carbon price due in a country of origin for the embedded emissions in the
imported goods, which is not subject to an export rebate or other form of
compensation on exportation.
3. The competent authority shall communicate the information referred to in paragraph
2 to the Commission at the latest two months after the end of the quarter covered by
a report.
4. The competent authority shall impose a proportionate and dissuasive penalty on
declarants who fail to submit a CBAM report.
5. If the competent authority determines that a declarant has failed to comply with the
obligation to submit a CBAM report as specified in paragraph 1, the competent
authority shall impose the penalty and notify the declarant:
(a) that the competent authority has concluded that the declarant fails to comply
with the obligation of submitting a report for a given quarter;
(b) of the reasons for its conclusion;
(c) of the amount of the penalty imposed on the declarant;
(d) of the date from which the penalty is due;
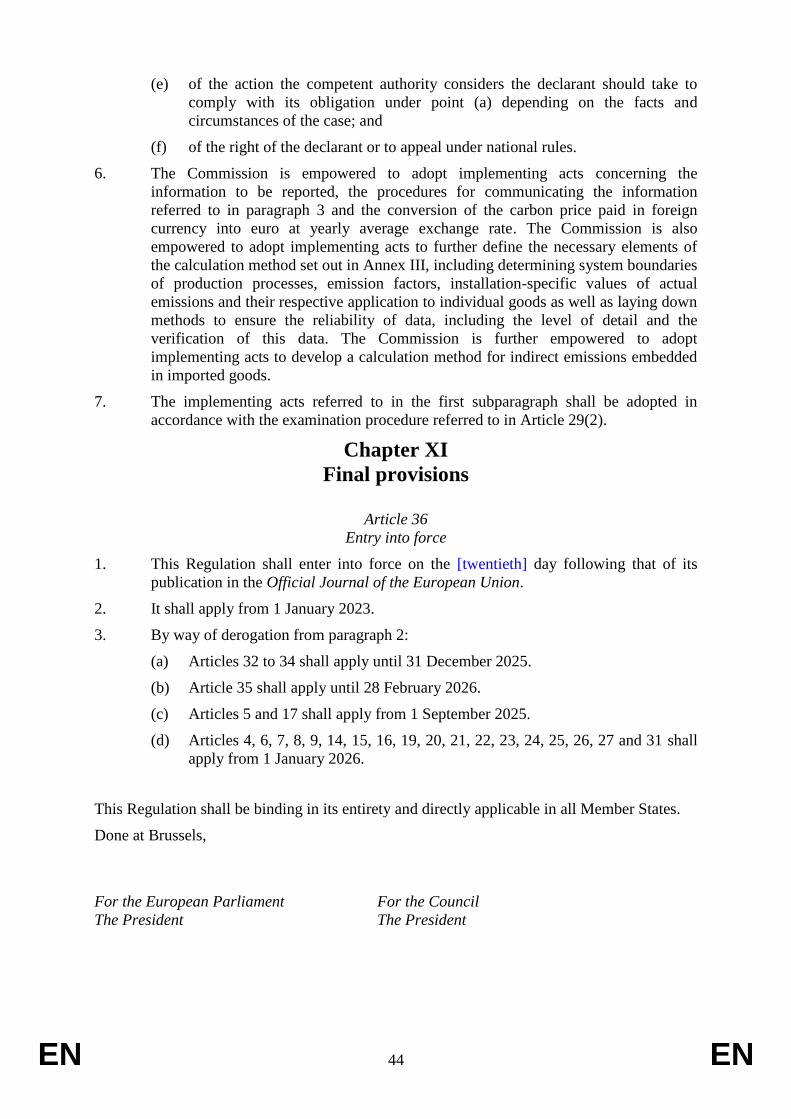
EN 44 EN
(e) of the action the competent authority considers the declarant should take to
comply with its obligation under point (a) depending on the facts and
circumstances of the case; and
(f) of the right of the declarant or to appeal under national rules.
6. The Commission is empowered to adopt implementing acts concerning the
information to be reported, the procedures for communicating the information
referred to in paragraph 3 and the conversion of the carbon price paid in foreign
currency into euro at yearly average exchange rate. The Commission is also
empowered to adopt implementing acts to further define the necessary elements of
the calculation method set out in Annex III, including determining system boundaries
of production processes, emission factors, installation-specific values of actual
emissions and their respective application to individual goods as well as laying down
methods to ensure the reliability of data, including the level of detail and the
verification of this data. The Commission is further empowered to adopt
implementing acts to develop a calculation method for indirect emissions embedded
in imported goods.
7. The implementing acts referred to in the first subparagraph shall be adopted in
accordance with the examination procedure referred to in Article 29(2).
Chapter XI
Final provisions
Article 36
Entry into force
1. This Regulation shall enter into force on the [twentieth] day following that of its
publication in the Official Journal of the European Union.
2. It shall apply from 1 January 2023.
3. By way of derogation from paragraph 2:
(a) Articles 32 to 34 shall apply until 31 December 2025.
(b) Article 35 shall apply until 28 February 2026.
(c) Articles 5 and 17 shall apply from 1 September 2025.
(d) Articles 4, 6, 7, 8, 9, 14, 15, 16, 19, 20, 21, 22, 23, 24, 25, 26, 27 and 31 shall
apply from 1 January 2026.
This Regulation shall be binding in its entirety and directly applicable in all Member States.
Done at Brussels,
For the European Parliament For the Council
The President The President

EN 45 EN
LEGISLATIVE FINANCIAL STATEMENT
1. FRAMEWORK OF THE PROPOSAL/INITIATIVE
1.1. Title of the proposal/initiative
1.2. Policy area(s) concerned in the ABM/ABB structure
1.3. Nature of the proposal/initiative
1.4. Objective(s)
1.5. Grounds for the proposal/initiative
1.6. Duration and financial impact
1.7. Management mode(s) planned
2. MANAGEMENT MEASURES
2.1. Monitoring and reporting rules
2.2. Management and control system
2.3. Measures to prevent fraud and irregularities
3. ESTIMATED FINANCIAL IMPACT OF THE PROPOSAL/INITIATIVE
3.1. Heading(s) of the multiannual financial framework and expenditure budget
line(s) affected
3.2. Estimated impact on expenditure
3.2.1. Summary of estimated impact on expenditure
3.2.2. Estimated impact on operational appropriations
3.2.3. Estimated impact on appropriations of an administrative nature
3.2.4. Compatibility with the current multiannual financial framework
3.2.5. Third-party contributions
3.3. Estimated impact on revenue

EN 46 EN
LEGISLATIVE FINANCIAL STATEMENT
1. FRAMEWORK OF THE PROPOSAL/INITIATIVE
1.1. Title of the proposal/initiative
Carbon Border Adjustment Mechanism.
1.2. Policy area(s) concerned
Climate policy.
1.3. The proposal/initiative relates to:
× a new action
a new action following a pilot project/preparatory action27
the extension of an existing action
a merger or redirection of one or more actions towards another/a new action
1.4. Objective(s)
1.4.1. General objective(s)
In light of the EU’s increased climate ambitions, the introduction of a CBAM has the
overarching objective of addressing climate change by reducing GHG emissions in
the EU and globally.
1.4.2. Specific objective(s)
Specific objective
The overarching objective of addressing climate change is further articulated in a
number of specific objectives, namely:
(i) Addressing the risk of carbon leakage under increased EU ambition.
(ii) Contributing to the provision of a stable and secure policy framework for
investments in low or zero carbon technologies.
(iii) Ensuring that domestic production and imports are subject to similar level of
carbon pricing.
(iv) Encouraging producers in third countries who export to the EU to adopt low
carbon technologies.
(v) Ensuring that the measure is effective, minimising the risk of being
circumvented, thus providing environmental integrity.
(vi) Ensuring a proportionate administrative burden for businesses and public
authorities in the application of the measure.
1.4.3. Expected result(s) and impact
Specify the effects which the proposal/initiative should have on the beneficiaries/groups targeted.
27 As referred to in Article 58(2)(a) or (b) of the Financial Regulation.
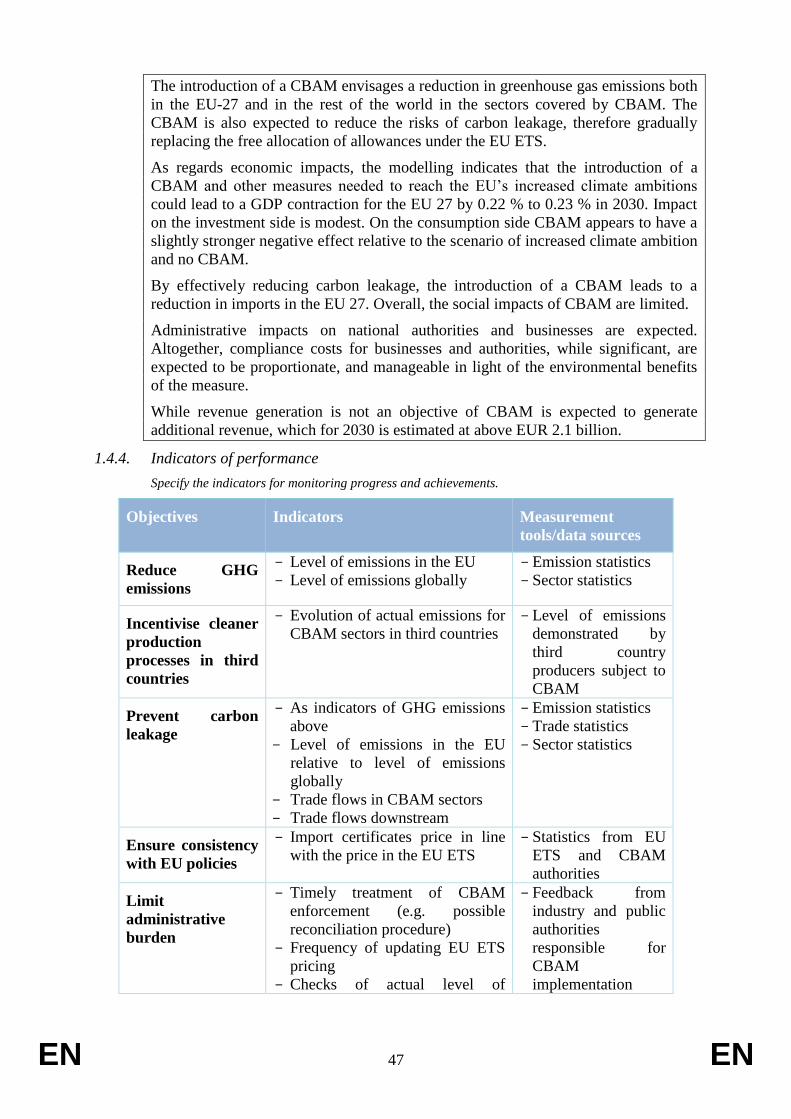
EN 47 EN
The introduction of a CBAM envisages a reduction in greenhouse gas emissions both
in the EU-27 and in the rest of the world in the sectors covered by CBAM. The
CBAM is also expected to reduce the risks of carbon leakage, therefore gradually
replacing the free allocation of allowances under the EU ETS.
As regards economic impacts, the modelling indicates that the introduction of a
CBAM and other measures needed to reach the EU’s increased climate ambitions
could lead to a GDP contraction for the EU 27 by 0.22 % to 0.23 % in 2030. Impact
on the investment side is modest. On the consumption side CBAM appears to have a
slightly stronger negative effect relative to the scenario of increased climate ambition
and no CBAM.
By effectively reducing carbon leakage, the introduction of a CBAM leads to a
reduction in imports in the EU 27. Overall, the social impacts of CBAM are limited.
Administrative impacts on national authorities and businesses are expected.
Altogether, compliance costs for businesses and authorities, while significant, are
expected to be proportionate, and manageable in light of the environmental benefits
of the measure.
While revenue generation is not an objective of CBAM is expected to generate
additional revenue, which for 2030 is estimated at above EUR 2.1 billion.
1.4.4. Indicators of performance
Specify the indicators for monitoring progress and achievements.
Objectives Indicators Measurement
tools/data sources
Reduce GHG
emissions
- Level of emissions in the EU
- Level of emissions globally
- Emission statistics
- Sector statistics
Incentivise cleaner
production
processes in third
countries
- Evolution of actual emissions for
CBAM sectors in third countries
- Level of emissions
demonstrated by
third country
producers subject to
CBAM
Prevent carbon
leakage
- As indicators of GHG emissions
above
- Level of emissions in the EU
relative to level of emissions
globally
- Trade flows in CBAM sectors
- Trade flows downstream
- Emission statistics
- Trade statistics
- Sector statistics
Ensure consistency
with EU policies
- Import certificates price in line
with the price in the EU ETS
- Statistics from EU
ETS and CBAM
authorities
Limit
administrative
burden
- Timely treatment of CBAM
enforcement (e.g. possible
reconciliation procedure)
- Frequency of updating EU ETS
pricing
- Checks of actual level of
- Feedback from
industry and public
authorities
responsible for
CBAM
implementation
EN 48 EN
emissions by exporter - Number of staff
necessary for
CBAM
administration
1.5. Grounds for the proposal/initiative
1.5.1. Requirement(s) to be met in the short or long term including a detailed timeline for
roll-out of the implementation of the initiative
The CBAM is expected to be introduced in 2023. A simplified system of the CBAM
scheme will be in place for the first years after the entry into force. Specifically, a
transitional period will apply to facilitate the smooth roll out of the CBAM and allow
traders and importers to adjust. Simplifications include the procedures applied at the
border when goods are imported and the use of default values to determination the
CBAM obligation.
1.5.2. Added value of Union involvement (it may result from different factors, e.g.
coordination gains, legal certainty, greater effectiveness or complementarities). For
the purposes of this point 'added value of Union involvement' is the value resulting
from Union intervention which is additional to the value that would have been
otherwise created by Member States alone.
Reasons for action at European level (ex-ante) Reducing GHG emissions is
fundamentally a trans-boundary issue that requires effective action at the largest
possible scale. The EU as a supranational organisation is well-placed to establish
effective climate policy in the EU, like it has done with the EU ETS.
There exists already a harmonised carbon price at EU level. This consists of the price
resulting from the EU ETS for the sectors covered by the system. These sectors are
energy-intensive and subject to international competition. In order to ensure a well-
functioning single market when the EU increases its climate ambition, it is essential
that a level playing field is created for the relevant sectors in the internal market. The
single effective way to do this is by taking action at the level of the EU. Any
initiative needs to be implemented in a way that provides importers, regardless of
country of origin and port of entry or destination within the EU, with uniform
conditions and incentives for GHG emission reductions that are equivalent to those
of domestic producers.
The only meaningful way to ensure equivalence between the carbon pricing policy
applied in the EU’s internal market and the carbon pricing policy applied on imports
is to take action at the level of the Union.
Expected generated Union added value (ex-post): In parallel to the EU ETS,
reduction of GHG emissions and protection against the risk of carbon leakage in the
EU single market can be established most adequately at the EU level. Additionally,
the need for minimal administrative costs is best achieved by establishing consistent
rules for the entire single market, further underlining the added value of an
intervention at the EU level.
The public consultation has confirmed the added value of taking action on the
CBAM at the EU level. In particular, stakeholders agree that an EU CBAM is needed
due to existing differences of ambition between the EU and the rest of the world and
in order to support the global climate efforts. In addition, in view of the EU’s
position in international trade, if it introduces a CBAM the environmental effect on
EN 49 EN
international climate ambitions will be most effective as a potential example to
follow.
Thus, the objective of reducing emissions and climate neutrality requires – without
equally ambitious global policies – action by the European Union.
1.5.3. Lessons learned from similar experiences in the past
The CBAM is a new mechanism. The preferred option in the Impact Assessment
draws from the EU Emissions Trading System and aims at replicating some of its
features.
1.5.4. Compatibility with the Multiannual Financial Framework and possible synergies
with other appropriate instruments
In the interinstitutonal agreement of 16 December 2020, signed in the context of the
negotiations, the European Parliament, the Council and the Commission agreed that
"the institutions will work towards introducing sufficient new own resources with a
view to covering an amount corresponding to the expected expenditure related to the
repayment" of NextGenerationEU28. As part of the mandate received, the
Commission was invited to put forward a proposal for a CBAM in the first semester
of 2021, with a view to its introduction at the latest by 1 January 2023.
1.5.5. Assessment of the different available financing options, including scope for
redeployment
Implementation costs for CBAM will be financed by the EU budget.
28 Interinstitutional Agreement of 16 December 2020 between the European Parliament, the Council of the
European Union and the European Commission on budgetary discipline, on cooperation in budgetary
matters and on sound financial management, as well as on new own resources, including a roadmap
towards the introduction of new own resources (OJ L 433I , 22.12.2020, p. 28).

EN 50 EN
1.6. Duration and financial impact of the proposal/initiative
limited duration
– in effect from [DD/MM]YYYY to [DD/MM]YYYY
– Financial impact from YYYY to YYYY for commitment appropriations and
from YYYY to YYYY for payment appropriations.
× unlimited duration
– Implementation with a start-up period from 1 January 2023
– followed by full-scale operation.
1.7. Management mode(s) planned29
Direct management by the Commission
– by its departments, including by its staff in the Union delegations;
– by the executive agencies.
Shared management with the Member States
Indirect management by entrusting budget implementation tasks to:
– third countries or the bodies they have designated;
– international organisations and their agencies (to be specified);
– the EIB and the European Investment Fund;
– bodies referred to in Articles 70 and 71 of the Financial Regulation;
– public law bodies;
– bodies governed by private law with a public service mission to the extent that
they provide adequate financial guarantees;
– bodies governed by the private law of a Member State that are entrusted with
the implementation of a public-private partnership and that provide adequate
financial guarantees;
– persons entrusted with the implementation of specific actions in the CFSP
pursuant to Title V of the TEU, and identified in the relevant basic act.
– If more than one management mode is indicated, please provide details in the ‘Comments’ section.
Comments
29 Details of management modes and references to the Financial Regulation may be found on the
BudgWeb site:
https://myintracomm.ec.europa.eu/budgweb/EN/man/budgmanag/Pages/budgmanag.aspx
EN 51 EN
2. MANAGEMENT MEASURES
2.1. Monitoring and reporting rules
Specify frequency and conditions.
The Commission will ensure that arrangements are in place to monitor and evaluate
the functioning of the CBAM and evaluate it against the main policy objectives.
Given that CBAM is one of the policy proposals under the ‘Fit for 55 Package’,
monitoring and evaluation could be carried out in alignment with the other policies
of the package.
The administration system should be evaluated after the first year of operation to
identify any issues also in terms of governance and potential improvements. In
addition, when more data is available, the Commission will also review the scope of
the CBAM to examine the possibility of extending it to cover emissions of additional
sectors and further down the value chain. For this, it is necessary to monitor the
effect of CBAM on the shortlisted sectors.
2.2. Management and control system(s)
2.2.1. Justification of the management mode(s), the funding implementation mechanism(s),
the payment modalities and the control strategy proposed
A set-up similar to the EU ETS building on national competent authorities allows a
swift implementation of the CBAM. In addition, limited functions in particular as
regards IT carried out at central level should ensure cooperation and collaboration in
the implementation of CBAM.
2.2.2. Information concerning the risks identified and the internal control system(s) set up
to mitigate them
The proposed CBAM will be based on a declarative system, which entails the risk of
non-declaration or misdeclaration.
In order to address the risk of non-declaration, the system requires an authorisation
before importing goods in the scope of the Regulation. National customs authorities
will be in charge of enforcing this rule by not releasing into free circulation these
goods as long as the declarant is not authorised according to this Regulation.
In order to address the risk of misdeclaration a system of auditing on risk assessment
criteria as well as random audits will be in place coupled with sanctions set up as a
sufficiently high level to serve as deterrent. Auditing will take place both at the level
of CBAM declaration by the national authorities and at the level of import
declarations by customs authorities.
2.2.3. Estimation and justification of the cost-effectiveness of the controls (ratio of "control
costs ÷ value of the related funds managed"), and assessment of the expected levels
of risk of error (at payment & at closure)
The role of the national authorities will be to control the correct application of
CBAM, in particular the surrender of CBAM certificates and the collection of funds.
A risk management system will be applied to ensure cost-effective controls.
2.3. Measures to prevent fraud and irregularities
Specify existing or envisaged prevention and protection measures, e.g. from the Anti-Fraud Strategy.
EN 52 EN
The financial interests of the Union should be protected through proportionate
measures throughout the expenditure cycle, including the prevention, detection and
investigation of irregularities, the recovery of funds lost, wrongly paid or incorrectly
used and, where appropriate, administrative and financial penalties.
An authorised declarant who fails to surrender, by 31 May of each year, a number of
CBAM certificates corresponding to the emissions embedded in goods imported
during the previous year or submits to the national competent authority false
information related to actual emissions with a view to obtain a favourable individual
treatment, shall be held liable for the payment of a penalty.
The amount of the penalty will be based on penalties in the EU ETS. Payment of the
penalty shall not release the authorised declarant from the obligation to surrender the
outstanding number of CBAM certificates to the national competent authority.
In case of repeated offences, the national competent authority may decide to suspend
the account of the declarant.
Implementing acts will provide more detail on the application of penalties.
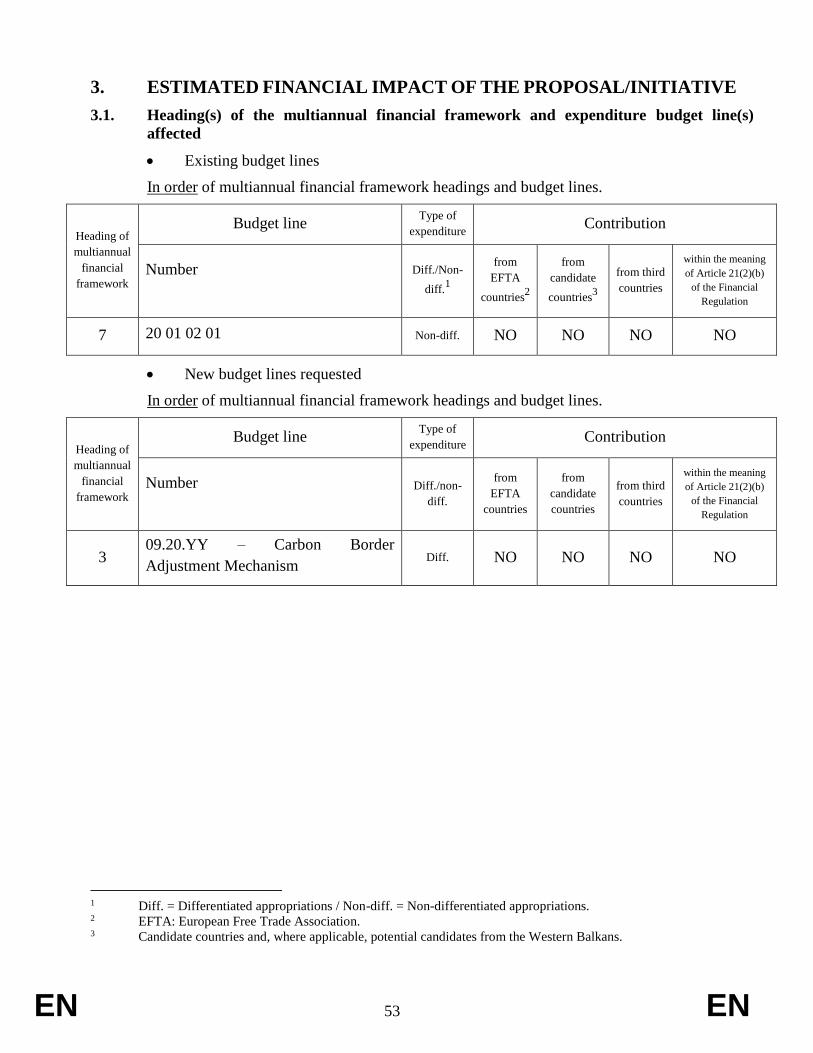
EN 53 EN
3. ESTIMATED FINANCIAL IMPACT OF THE PROPOSAL/INITIATIVE
3.1. Heading(s) of the multiannual financial framework and expenditure budget line(s)
affected
Existing budget lines
In order of multiannual financial framework headings and budget lines.
Heading of
multiannual
financial
framework
Budget line Type of
expenditure Contribution
Number
Diff./Non-
diff.1
from
EFTA
countries2
from
candidate
countries3
from third
countries
within the meaning
of Article 21(2)(b)
of the Financial
Regulation
7 20 01 02 01 Non-diff. NO NO NO NO
New budget lines requested
In order of multiannual financial framework headings and budget lines.
Heading of
multiannual
financial
framework
Budget line Type of
expenditure Contribution
Number
Diff./non-
diff.
from
EFTA
countries
from
candidate
countries
from third
countries
within the meaning
of Article 21(2)(b)
of the Financial
Regulation
3 09.20.YY – Carbon Border
Adjustment Mechanism Diff. NO NO NO NO
1 Diff. = Differentiated appropriations / Non-diff. = Non-differentiated appropriations. 2 EFTA: European Free Trade Association. 3 Candidate countries and, where applicable, potential candidates from the Western Balkans.
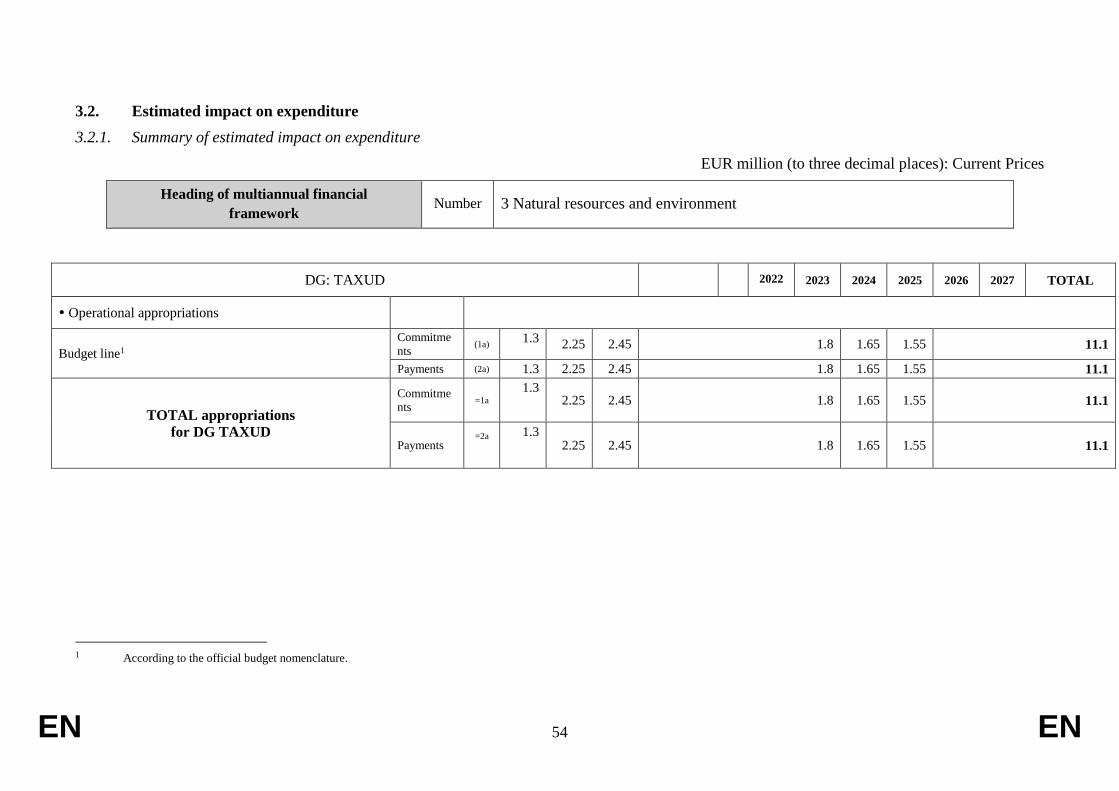
EN 54 EN
3.2. Estimated impact on expenditure
3.2.1. Summary of estimated impact on expenditure
EUR million (to three decimal places): Current Prices
Heading of multiannual financial
framework Number 3 Natural resources and environment
DG: TAXUD 2022 2023 2024 2025 2026 2027 TOTAL
Operational appropriations
Budget line1 Commitme
nts (1a)
1.3 2.25 2.45 1.8 1.65 1.55 11.1
Payments (2a) 1.3 2.25 2.45 1.8 1.65 1.55 11.1
TOTAL appropriations
for DG TAXUD
Commitme
nts =1a
1.3 2.25 2.45 1.8 1.65 1.55 11.1
Payments =2a
1.3 2.25 2.45 1.8 1.65 1.55 11.1
1 According to the official budget nomenclature.
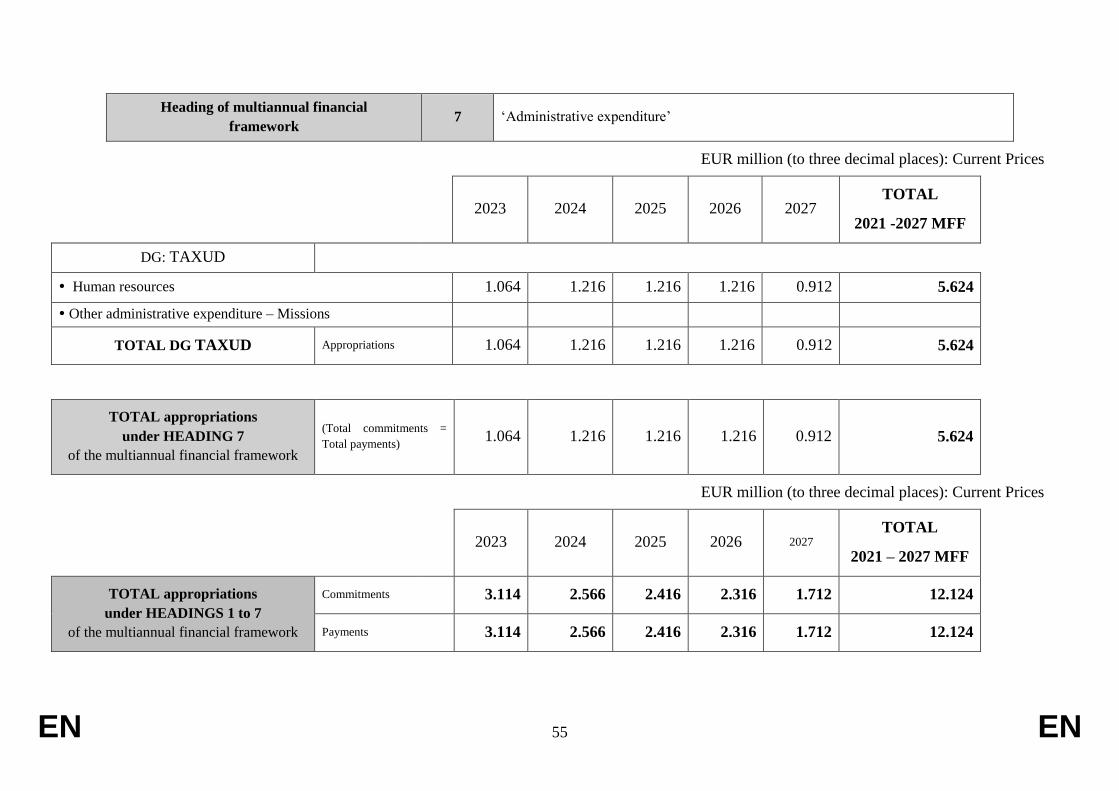
EN 55 EN
Heading of multiannual financial
framework 7 ‘Administrative expenditure’
EUR million (to three decimal places): Current Prices
2023 2024 2025 2026 2027 TOTAL
2021 -2027 MFF
DG: TAXUD
Human resources 1.064 1.216 1.216 1.216 0.912 5.624
Other administrative expenditure – Missions
TOTAL DG TAXUD Appropriations 1.064 1.216 1.216 1.216 0.912 5.624
TOTAL appropriations
under HEADING 7
of the multiannual financial framework
(Total commitments =
Total payments) 1.064 1.216 1.216 1.216 0.912 5.624
EUR million (to three decimal places): Current Prices
2023 2024 2025 2026 2027 TOTAL
2021 – 2027 MFF
TOTAL appropriations
under HEADINGS 1 to 7
of the multiannual financial framework
Commitments 3.114 2.566 2.416 2.316 1.712 12.124
Payments 3.114 2.566 2.416 2.316 1.712 12.124

EN 56 EN
3.2.2. Summary of estimated impact on Commission’s administrative appropriations
– The proposal/initiative does not require the use of appropriations of an
administrative nature
– × The proposal/initiative requires the use of appropriations of an administrative
nature, as explained below:
EUR million (to three decimal places)
Year
2021
Year
2022
Year 2023
Year 2024
Year 2025
Year 2026
Year
2027 TOTAL
HEADING 7 of the multiannual
financial framework
Human resources 1.064 1.216 1.216 1.216 0.912 5.624
Other administrative
expenditure
Subtotal HEADING 7 of the multiannual
financial framework
1.064 1.216 1.216 1.216 0.912 5.624
Outside HEADING 71 of the multiannual
financial framework
Human resources
Other expenditure of an administrative
nature
Subtotal outside HEADING 7 of the multiannual
financial framework
TOTAL 1.064 1.216 1.216 1.216 0.912 5.624
The appropriations required for human resources and other expenditure of an administrative nature will be met by
appropriations from the DG that are already assigned to management of the action and/or have been redeployed within the
DG, together if necessary with any additional allocation which may be granted to the managing DG under the annual
allocation procedure and in the light of budgetary constraints.
1 Technical and/or administrative assistance and expenditure in support of the implementation of EU programmes
and/or actions (former ‘BA’ lines), indirect research, direct research.
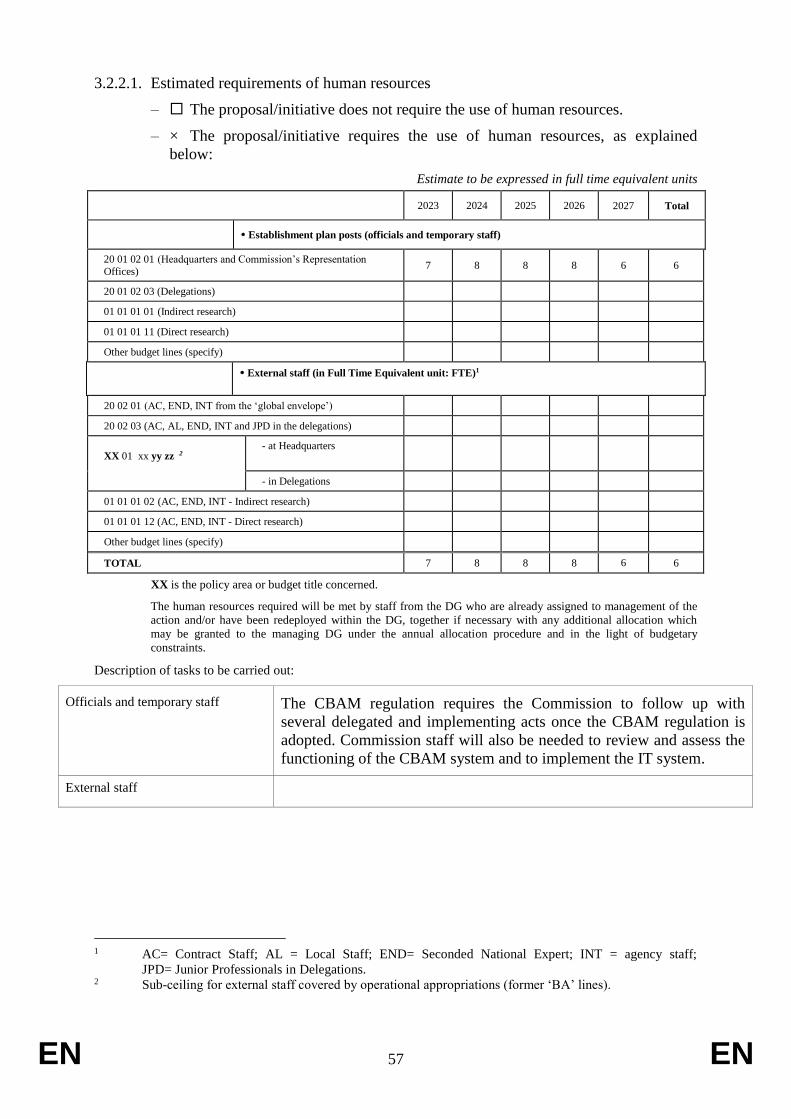
EN 57 EN
3.2.2.1. Estimated requirements of human resources
– The proposal/initiative does not require the use of human resources.
– × The proposal/initiative requires the use of human resources, as explained
below:
Estimate to be expressed in full time equivalent units
2023 2024 2025 2026 2027 Total
Establishment plan posts (officials and temporary staff)
20 01 02 01 (Headquarters and Commission’s Representation
Offices) 7 8 8 8 6 6
20 01 02 03 (Delegations)
01 01 01 01 (Indirect research)
01 01 01 11 (Direct research)
Other budget lines (specify)
External staff (in Full Time Equivalent unit: FTE)1
20 02 01 (AC, END, INT from the ‘global envelope’)
20 02 03 (AC, AL, END, INT and JPD in the delegations)
XX 01 xx yy zz 2
- at Headquarters
- in Delegations
01 01 01 02 (AC, END, INT - Indirect research)
01 01 01 12 (AC, END, INT - Direct research)
Other budget lines (specify)
TOTAL 7 8 8 8 6 6
XX is the policy area or budget title concerned.
The human resources required will be met by staff from the DG who are already assigned to management of the
action and/or have been redeployed within the DG, together if necessary with any additional allocation which
may be granted to the managing DG under the annual allocation procedure and in the light of budgetary
constraints.
Description of tasks to be carried out:
Officials and temporary staff The CBAM regulation requires the Commission to follow up with
several delegated and implementing acts once the CBAM regulation is
adopted. Commission staff will also be needed to review and assess the
functioning of the CBAM system and to implement the IT system.
External staff
1 AC= Contract Staff; AL = Local Staff; END= Seconded National Expert; INT = agency staff;
JPD= Junior Professionals in Delegations. 2 Sub-ceiling for external staff covered by operational appropriations (former ‘BA’ lines).
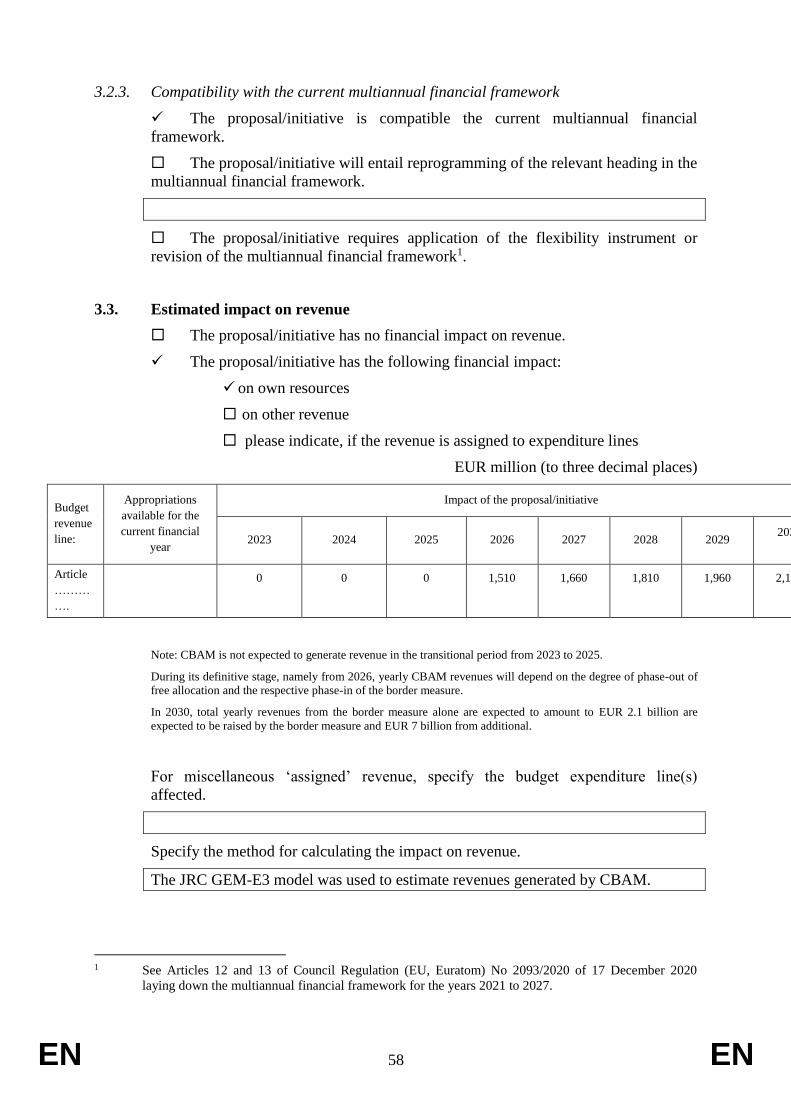
EN 58 EN
3.2.3. Compatibility with the current multiannual financial framework
The proposal/initiative is compatible the current multiannual financial
framework.
The proposal/initiative will entail reprogramming of the relevant heading in the
multiannual financial framework.
The proposal/initiative requires application of the flexibility instrument or
revision of the multiannual financial framework1.
3.3. Estimated impact on revenue
The proposal/initiative has no financial impact on revenue.
The proposal/initiative has the following financial impact:
on own resources
on other revenue
please indicate, if the revenue is assigned to expenditure lines
EUR million (to three decimal places)
Budget
revenue
line:
Appropriations
available for the
current financial
year
Impact of the proposal/initiative
2023 2024 2025 2026 2027 2028 2029 2030
Article
………
….
0 0 0 1,510 1,660 1,810 1,960 2,110
Note: CBAM is not expected to generate revenue in the transitional period from 2023 to 2025.
During its definitive stage, namely from 2026, yearly CBAM revenues will depend on the degree of phase-out of
free allocation and the respective phase-in of the border measure.
In 2030, total yearly revenues from the border measure alone are expected to amount to EUR 2.1 billion are
expected to be raised by the border measure and EUR 7 billion from additional.
For miscellaneous ‘assigned’ revenue, specify the budget expenditure line(s)
affected.
Specify the method for calculating the impact on revenue.
The JRC GEM-E3 model was used to estimate revenues generated by CBAM.
1 See Articles 12 and 13 of Council Regulation (EU, Euratom) No 2093/2020 of 17 December 2020
laying down the multiannual financial framework for the years 2021 to 2027.
EN EN
EUROPEAN COMMISSION
Brussels, 14.7.2021
COM(2021) 564 final
ANNEXES 1 to 5
ANNEXES
to the
REGULATION OF THE EUROPEAN PARLIAMENT AND OF THE COUNCIL
establishing a carbon border adjustment mechanism
{SEC(2021) 564 final} - {SWD(2021) 643 final} - {SWD(2021) 644 final} -
{SWD(2021) 647 final}
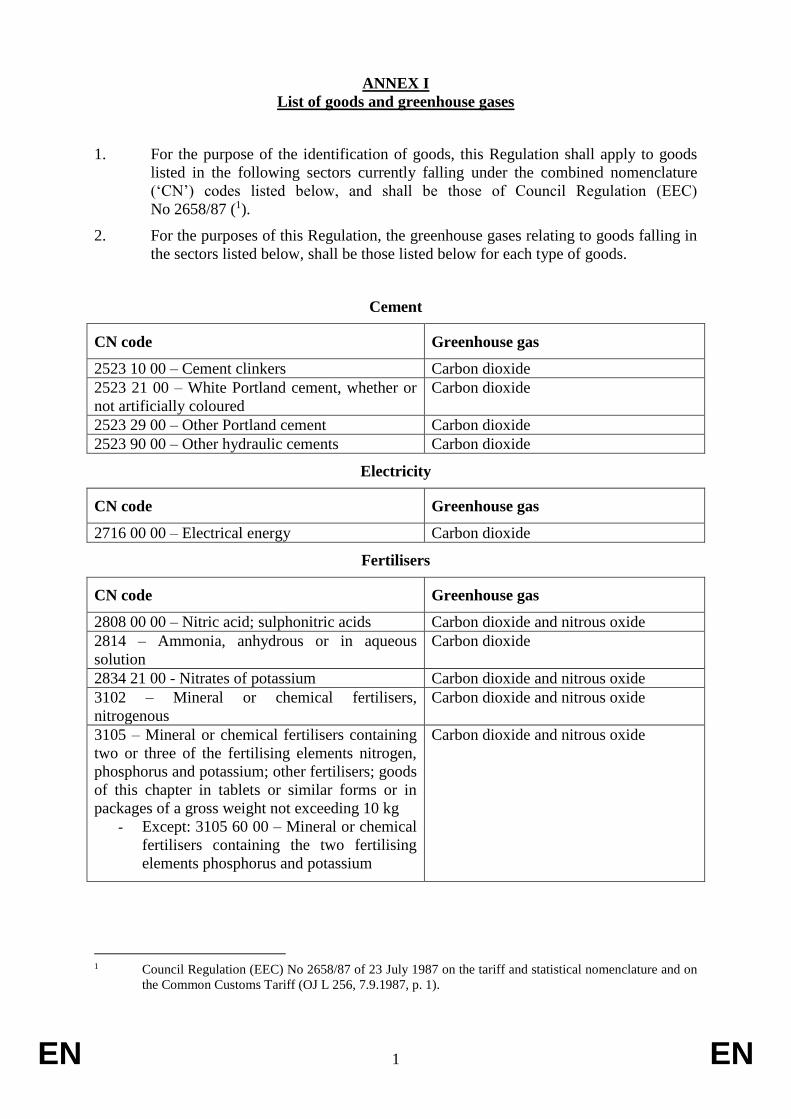
EN 1 EN
ANNEX I
List of goods and greenhouse gases
1. For the purpose of the identification of goods, this Regulation shall apply to goods
listed in the following sectors currently falling under the combined nomenclature
(‘CN’) codes listed below, and shall be those of Council Regulation (EEC)
No 2658/87 (1).
2. For the purposes of this Regulation, the greenhouse gases relating to goods falling in
the sectors listed below, shall be those listed below for each type of goods.
Cement
CN code Greenhouse gas
2523 10 00 – Cement clinkers Carbon dioxide
2523 21 00 – White Portland cement, whether or
not artificially coloured
Carbon dioxide
2523 29 00 – Other Portland cement Carbon dioxide
2523 90 00 – Other hydraulic cements Carbon dioxide
Electricity
CN code Greenhouse gas
2716 00 00 – Electrical energy Carbon dioxide
Fertilisers
CN code Greenhouse gas
2808 00 00 – Nitric acid; sulphonitric acids Carbon dioxide and nitrous oxide
2814 – Ammonia, anhydrous or in aqueous
solution
Carbon dioxide
2834 21 00 - Nitrates of potassium Carbon dioxide and nitrous oxide
3102 – Mineral or chemical fertilisers,
nitrogenous
Carbon dioxide and nitrous oxide
3105 – Mineral or chemical fertilisers containing
two or three of the fertilising elements nitrogen,
phosphorus and potassium; other fertilisers; goods
of this chapter in tablets or similar forms or in
packages of a gross weight not exceeding 10 kg
- Except: 3105 60 00 – Mineral or chemical
fertilisers containing the two fertilising
elements phosphorus and potassium
Carbon dioxide and nitrous oxide
1 Council Regulation (EEC) No 2658/87 of 23 July 1987 on the tariff and statistical nomenclature and on
the Common Customs Tariff (OJ L 256, 7.9.1987, p. 1).
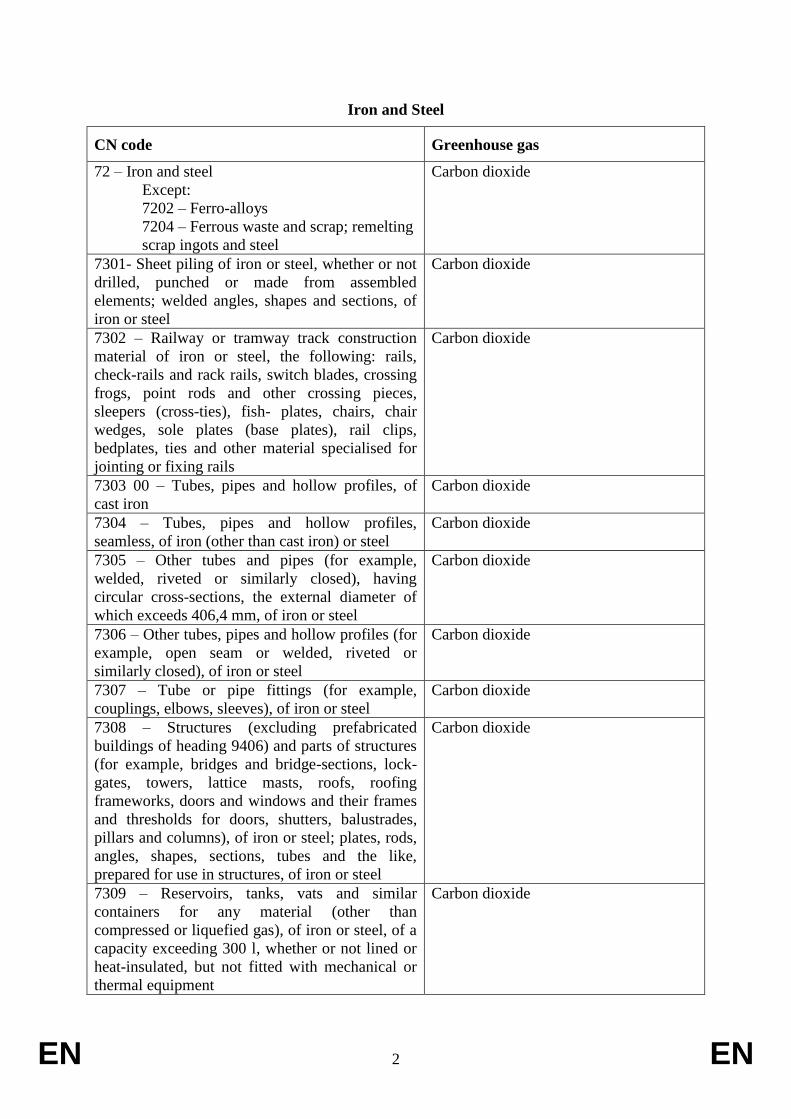
EN 2 EN
Iron and Steel
CN code Greenhouse gas
72 – Iron and steel
Except:
7202 – Ferro-alloys 7204 – Ferrous waste and scrap; remelting
scrap ingots and steel
Carbon dioxide
7301- Sheet piling of iron or steel, whether or not
drilled, punched or made from assembled
elements; welded angles, shapes and sections, of
iron or steel
Carbon dioxide
7302 – Railway or tramway track construction
material of iron or steel, the following: rails,
check-rails and rack rails, switch blades, crossing
frogs, point rods and other crossing pieces,
sleepers (cross-ties), fish- plates, chairs, chair
wedges, sole plates (base plates), rail clips,
bedplates, ties and other material specialised for
jointing or fixing rails
Carbon dioxide
7303 00 – Tubes, pipes and hollow profiles, of
cast iron
Carbon dioxide
7304 – Tubes, pipes and hollow profiles,
seamless, of iron (other than cast iron) or steel
Carbon dioxide
7305 – Other tubes and pipes (for example,
welded, riveted or similarly closed), having
circular cross-sections, the external diameter of
which exceeds 406,4 mm, of iron or steel
Carbon dioxide
7306 – Other tubes, pipes and hollow profiles (for
example, open seam or welded, riveted or
similarly closed), of iron or steel
Carbon dioxide
7307 – Tube or pipe fittings (for example,
couplings, elbows, sleeves), of iron or steel
Carbon dioxide
7308 – Structures (excluding prefabricated
buildings of heading 9406) and parts of structures
(for example, bridges and bridge-sections, lock-
gates, towers, lattice masts, roofs, roofing
frameworks, doors and windows and their frames
and thresholds for doors, shutters, balustrades,
pillars and columns), of iron or steel; plates, rods,
angles, shapes, sections, tubes and the like,
prepared for use in structures, of iron or steel
Carbon dioxide
7309 – Reservoirs, tanks, vats and similar
containers for any material (other than
compressed or liquefied gas), of iron or steel, of a
capacity exceeding 300 l, whether or not lined or
heat-insulated, but not fitted with mechanical or
thermal equipment
Carbon dioxide
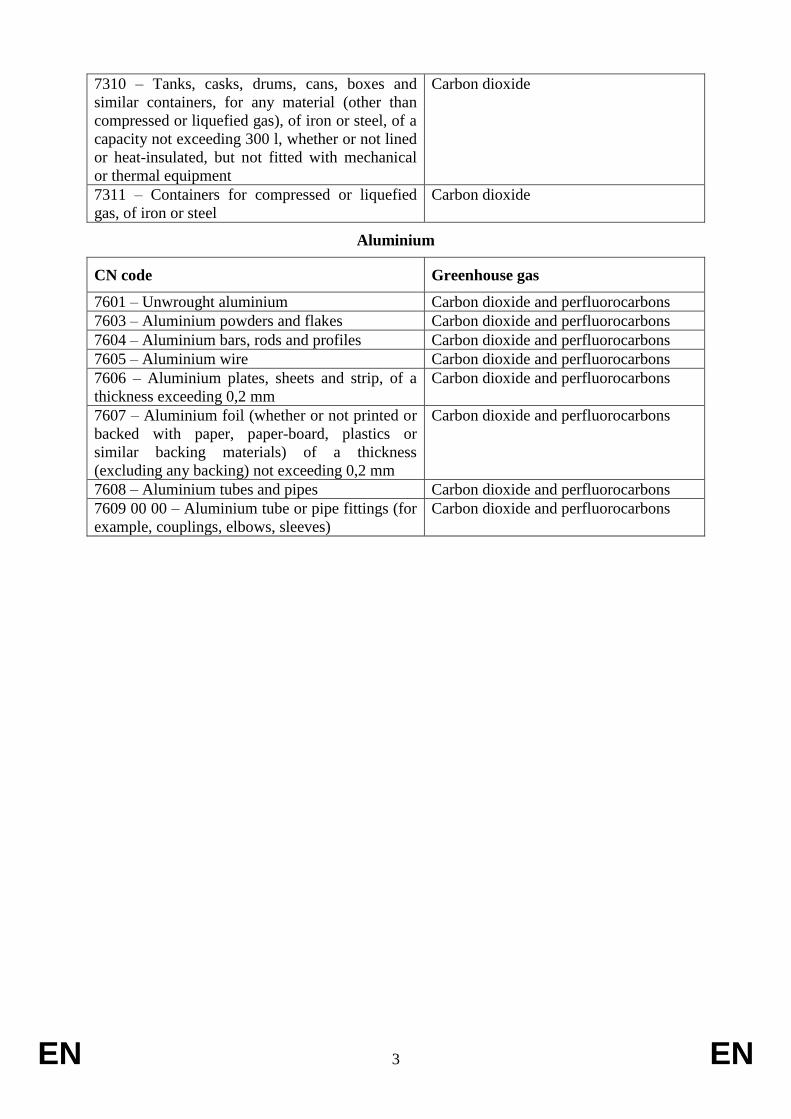
EN 3 EN
7310 – Tanks, casks, drums, cans, boxes and
similar containers, for any material (other than
compressed or liquefied gas), of iron or steel, of a
capacity not exceeding 300 l, whether or not lined
or heat-insulated, but not fitted with mechanical
or thermal equipment
Carbon dioxide
7311 – Containers for compressed or liquefied
gas, of iron or steel
Carbon dioxide
Aluminium
CN code Greenhouse gas
7601 – Unwrought aluminium Carbon dioxide and perfluorocarbons
7603 – Aluminium powders and flakes Carbon dioxide and perfluorocarbons
7604 – Aluminium bars, rods and profiles Carbon dioxide and perfluorocarbons
7605 – Aluminium wire Carbon dioxide and perfluorocarbons
7606 – Aluminium plates, sheets and strip, of a
thickness exceeding 0,2 mm
Carbon dioxide and perfluorocarbons
7607 – Aluminium foil (whether or not printed or
backed with paper, paper-board, plastics or
similar backing materials) of a thickness
(excluding any backing) not exceeding 0,2 mm
Carbon dioxide and perfluorocarbons
7608 – Aluminium tubes and pipes Carbon dioxide and perfluorocarbons
7609 00 00 – Aluminium tube or pipe fittings (for
example, couplings, elbows, sleeves)
Carbon dioxide and perfluorocarbons
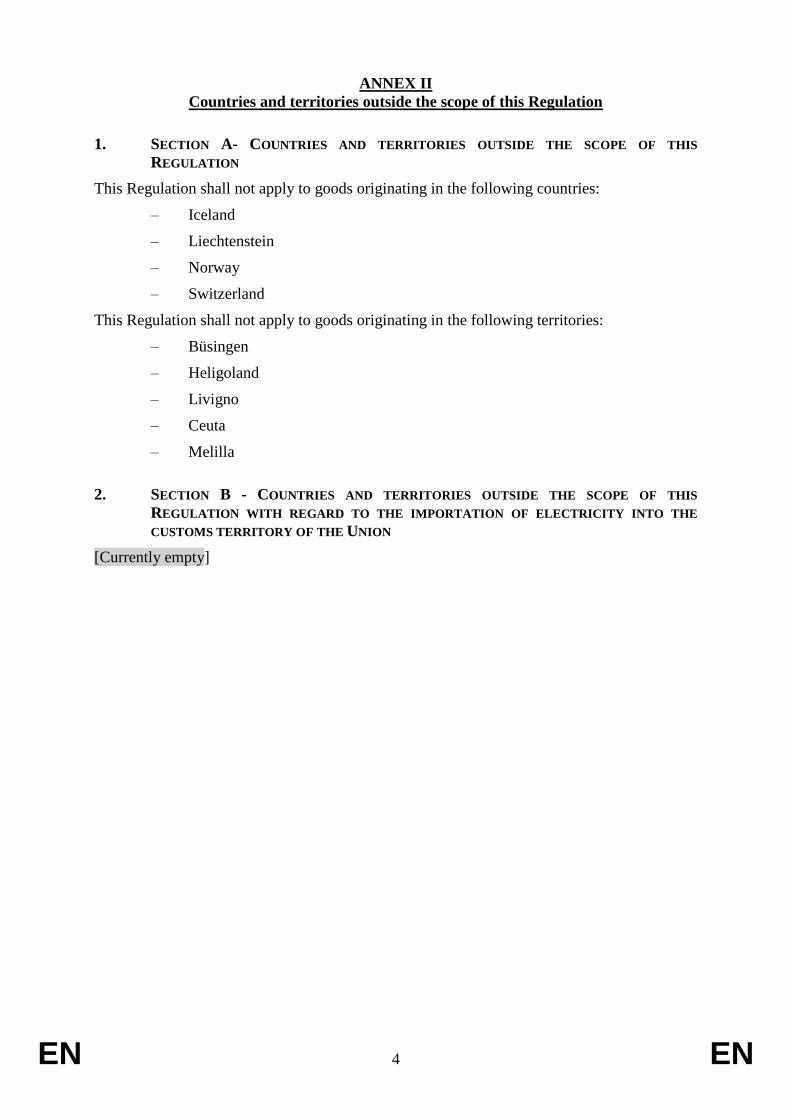
EN 4 EN
ANNEX II
Countries and territories outside the scope of this Regulation
1. SECTION A- COUNTRIES AND TERRITORIES OUTSIDE THE SCOPE OF THIS
REGULATION
This Regulation shall not apply to goods originating in the following countries:
– Iceland
– Liechtenstein
– Norway
– Switzerland
This Regulation shall not apply to goods originating in the following territories:
– Büsingen
– Heligoland
– Livigno
– Ceuta
– Melilla
2. SECTION B - COUNTRIES AND TERRITORIES OUTSIDE THE SCOPE OF THIS
REGULATION WITH REGARD TO THE IMPORTATION OF ELECTRICITY INTO THE
CUSTOMS TERRITORY OF THE UNION
[Currently empty]
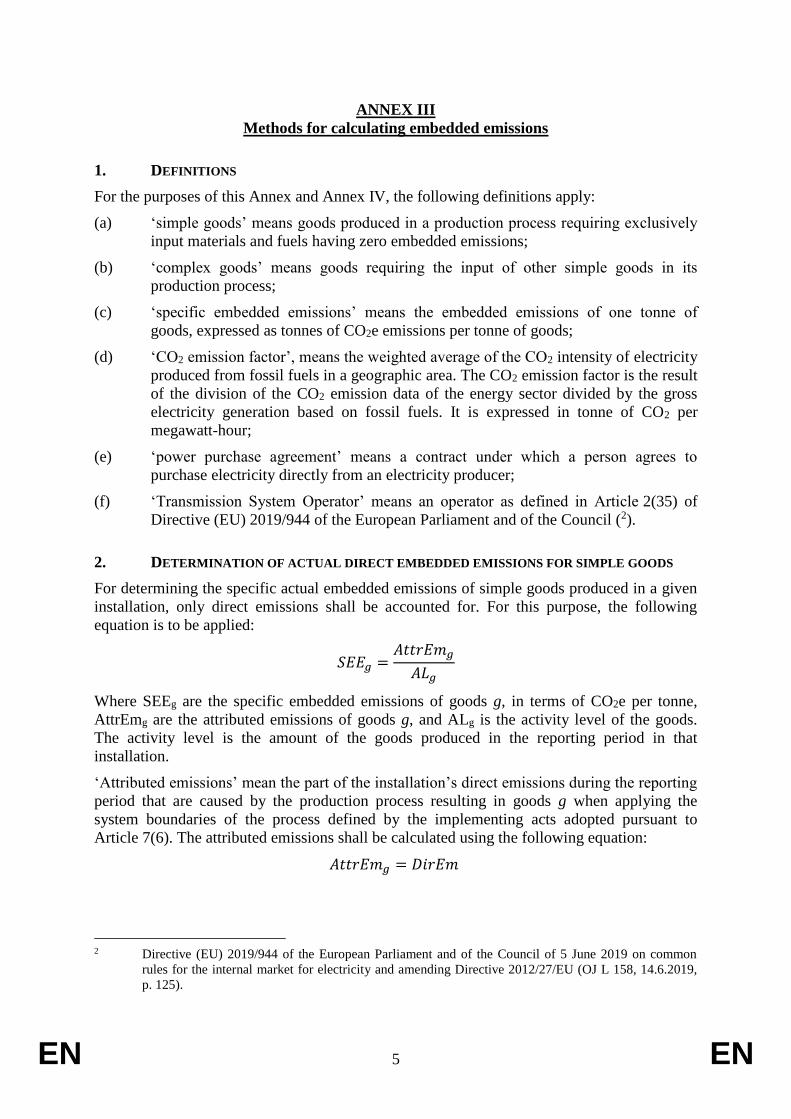
EN 5 EN
ANNEX III
Methods for calculating embedded emissions
1. DEFINITIONS
For the purposes of this Annex and Annex IV, the following definitions apply:
(a) ‘simple goods’ means goods produced in a production process requiring exclusively
input materials and fuels having zero embedded emissions;
(b) ‘complex goods’ means goods requiring the input of other simple goods in its
production process;
(c) ‘specific embedded emissions’ means the embedded emissions of one tonne of
goods, expressed as tonnes of CO2e emissions per tonne of goods;
(d) ‘CO2 emission factor’, means the weighted average of the CO2 intensity of electricity
produced from fossil fuels in a geographic area. The CO2 emission factor is the result
of the division of the CO2 emission data of the energy sector divided by the gross
electricity generation based on fossil fuels. It is expressed in tonne of CO2 per
megawatt-hour;
(e) ‘power purchase agreement’ means a contract under which a person agrees to
purchase electricity directly from an electricity producer;
(f) ‘Transmission System Operator’ means an operator as defined in Article 2(35) of
Directive (EU) 2019/944 of the European Parliament and of the Council (2).
2. DETERMINATION OF ACTUAL DIRECT EMBEDDED EMISSIONS FOR SIMPLE GOODS
For determining the specific actual embedded emissions of simple goods produced in a given
installation, only direct emissions shall be accounted for. For this purpose, the following
equation is to be applied:
𝑆𝐸𝐸𝑔 =𝐴𝑡𝑡𝑟𝐸𝑚𝑔
𝐴𝐿𝑔
Where SEEg are the specific embedded emissions of goods g, in terms of CO2e per tonne,
AttrEmg are the attributed emissions of goods g, and ALg is the activity level of the goods.
The activity level is the amount of the goods produced in the reporting period in that
installation.
‘Attributed emissions’ mean the part of the installation’s direct emissions during the reporting
period that are caused by the production process resulting in goods g when applying the
system boundaries of the process defined by the implementing acts adopted pursuant to
Article 7(6). The attributed emissions shall be calculated using the following equation:
𝐴𝑡𝑡𝑟𝐸𝑚𝑔 = 𝐷𝑖𝑟𝐸𝑚
2 Directive (EU) 2019/944 of the European Parliament and of the Council of 5 June 2019 on common
rules for the internal market for electricity and amending Directive 2012/27/EU (OJ L 158, 14.6.2019,
p. 125).
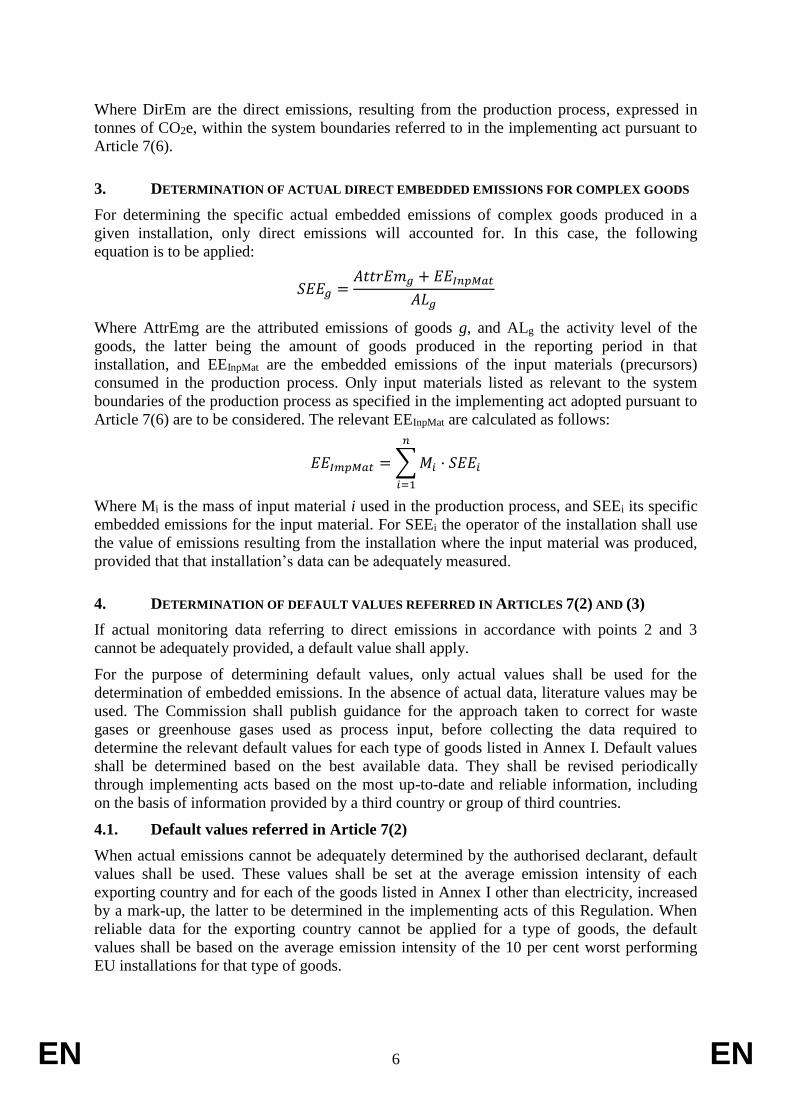
EN 6 EN
Where DirEm are the direct emissions, resulting from the production process, expressed in
tonnes of CO2e, within the system boundaries referred to in the implementing act pursuant to
Article 7(6).
3. DETERMINATION OF ACTUAL DIRECT EMBEDDED EMISSIONS FOR COMPLEX GOODS
For determining the specific actual embedded emissions of complex goods produced in a
given installation, only direct emissions will accounted for. In this case, the following
equation is to be applied:
𝑆𝐸𝐸𝑔 =𝐴𝑡𝑡𝑟𝐸𝑚𝑔 + 𝐸𝐸𝐼𝑛𝑝𝑀𝑎𝑡
𝐴𝐿𝑔
Where AttrEmg are the attributed emissions of goods g, and ALg the activity level of the
goods, the latter being the amount of goods produced in the reporting period in that
installation, and EEInpMat are the embedded emissions of the input materials (precursors)
consumed in the production process. Only input materials listed as relevant to the system
boundaries of the production process as specified in the implementing act adopted pursuant to
Article 7(6) are to be considered. The relevant EEInpMat are calculated as follows:
𝐸𝐸𝐼𝑚𝑝𝑀𝑎𝑡 = ∑ 𝑀𝑖 · 𝑆𝐸𝐸𝑖
𝑛
𝑖=1
Where Mi is the mass of input material i used in the production process, and SEEi its specific
embedded emissions for the input material. For SEEi the operator of the installation shall use
the value of emissions resulting from the installation where the input material was produced,
provided that that installation’s data can be adequately measured.
4. DETERMINATION OF DEFAULT VALUES REFERRED IN ARTICLES 7(2) AND (3)
If actual monitoring data referring to direct emissions in accordance with points 2 and 3
cannot be adequately provided, a default value shall apply.
For the purpose of determining default values, only actual values shall be used for the
determination of embedded emissions. In the absence of actual data, literature values may be
used. The Commission shall publish guidance for the approach taken to correct for waste
gases or greenhouse gases used as process input, before collecting the data required to
determine the relevant default values for each type of goods listed in Annex I. Default values
shall be determined based on the best available data. They shall be revised periodically
through implementing acts based on the most up-to-date and reliable information, including
on the basis of information provided by a third country or group of third countries.
4.1. Default values referred in Article 7(2)
When actual emissions cannot be adequately determined by the authorised declarant, default
values shall be used. These values shall be set at the average emission intensity of each
exporting country and for each of the goods listed in Annex I other than electricity, increased
by a mark-up, the latter to be determined in the implementing acts of this Regulation. When
reliable data for the exporting country cannot be applied for a type of goods, the default
values shall be based on the average emission intensity of the 10 per cent worst performing
EU installations for that type of goods.
EN 7 EN
4.2. Default values for imported electricity in Article 7(3)
Default values for imported electricity shall be determined based on either specific default
values for a third country, group of third countries or region within a third country, or if those
values are not available, on EU default values for similar electricity production in the EU,
according to point 4.2.2.
4.2.1. Specific default values for a third country, group of third countries or region within a
third country
Specific default values shall be based on the best data available to the Commission
determining the average CO2 emission factor in tonnes of CO2 per megawatt-hour of price-
setting sources in the third country, group of third countries or region within a third country.
Where specific default values are determined for a third country, a group of third countries or
a region within a third country, and electricity is imported from another third country or
another region into the third country, or another group of third countries or region within a
third country with the purpose of being re-exported to the Union, the same specific default
value shall not be used.
4.2.2. Alternative default values
Where no specific default value has been determined for a third country, a group of third
countries, or a region within a third country, the default value for electricity shall represent the
CO2 emission factor in the EU, in tonne of CO2 per megawatt-hour. That means the weighted
average of the CO2 intensity of electricity produced from fossil fuels in the EU. The weight
reflects the production mix of the fossil fuels in the EU. The CO2 factor is the result of the
division of the CO2 emission data of the energy industry divided by the gross electricity
generation based on fossil fuels in megawatt-hour.
Where authorised declarants of goods originating in a third country, or for a group of third
countries having a significant exchange of electricity with the EU, it can be demonstrated, on
the basis of reliable data, that the average CO2 emission factor of price-setting sources in that
third country or that group of third countries is lower than the one in the EU or lower than the
specific default value, an alternative default value based on that average CO2e emission factor
shall be established for that country or group of countries.
Where alternative default values are defined for a third country or region in a third country, or
a group of third countries or regions within third countries, and electricity is imported from
another third country or from another region within a third country, or another group of third
countries or regions within third countries into the third country subject to the alternative
default value, the same alternative default value may not be used.
5. CONDITIONS TO APPLYING ACTUAL EMBEDDED EMISSIONS IN ELECTRICITY
An authorised declarant may require to apply actual embedded emissions instead of default
values for the calculation referred to in Article 7(3) if the following cumulative criteria are
met:
(a) the authorised declarant has concluded a power purchase agreement with a producer
of electricity located in a third country for an amount of electricity that is equivalent
to the amount for which the use of a specific value is claimed;
(b) the installation producing electricity is either directly connected to the EU
transmission system or it can be demonstrated that at the time of export, there was no

EN 8 EN
physical network congestion at any point in the network between the installation and
the EU transmission system;
(c) an equivalent amount of electricity to the electricity for which the use of actual
embedded emissions is claimed has been firmly nominated to the allocated
interconnection capacity by all responsible transmission system operators in the
country of origin, the country of destination and, if relevant, each third country of
transit, and the nominated capacity and the production of electricity by the
installation referred to in point (b) refer to the same period of time which shall not be
longer than one hour;
(d) meeting the above criteria is certified by an accredited verifier. The verifier shall
receive at least monthly interim reports demonstrating how the above criteria are
fulfilled.
6. ADAPTATION OF DEFAULT VALUES BASED ON REGION SPECIFIC FEATURES
Default values can be adapted to particular areas, regions of countries where specific
characteristics prevail in terms of objective factors such as geography, natural resources,
market conditions, energy mix, or industrial production. When data adapted to those specific
local characteristics are available and can define more targeted default values, the latter may
be used instead of default values based on EU installations.
Where declarants for goods originating in a third country, or a group of third countries can
demonstrate, on the basis of reliable data, that alternative region specific adaptation of default
values are lower than the default values defined by the Commission the former can be used.
EN 9 EN
ANNEX IV
Book-keeping requirements for data used for the calculation of embedded emissions
1. MINIMUM DATA TO BE KEPT BY AN AUTHORISED DECLARANT FOR IMPORTED
GOODS:
1. Data identifying the authorised declarant:
(a) name;
(b) the unique identifier assigned by the competent national authority;
2. Data on imported goods:
(a) type and quantity of each type of goods;
(b) country of origin;
(c) actual emissions or default values.
2. MINIMUM DATA TO BE KEPT BY AN AUTHORISED DECLARANT FOR EMBEDDED
EMISSIONS IN IMPORTED GOODS BASED ON ACTUAL EMISSIONS
For each type of goods to which this Regulation applies, the following additional data has to
be kept:
(a) identification of the installation where the goods were produced;
(b) contact information of the operator of the installation where the goods were
produced;
(c) the verified emissions report including the data regarding the embedded emissions of
each type of declared goods as set out in Annex V;
(d) the specific embedded emissions of the goods.
EN 10 EN
ANNEX V
Verification principles and content of a verification report
1. PRINCIPLES OF VERIFICATION
The following principles shall apply for verifications requested according to Article 8:
(a) verifiers shall carry out verifications with an attitude of professional scepticism;
(b) an emissions report shall be considered as verified and fit for purpose only if the
verifier finds with reasonable assurance that the report is free of material
misstatements and of material non-conformities regarding the calculation rules of
Annex III;
(c) installation visits by the verifier shall be mandatory except where specific criteria for
waiving the installation visit are met;
(d) for deciding whether misstatements or non-conformities are material, the verifier
shall use thresholds given by the implementing acts adopted in accordance with
Article 8.
For parameters for which no such thresholds are defined, the verifier shall use expert
judgement to whether misstatements, individually or when aggregated with other
misstatements, justified by their size and nature, have to be considered material, i.e.
and could affect the use of the report by the intended users, in particular the
competent national authorities.
2. CONTENT OF A VERIFICATION REPORT
A verification report shall include, at least, the following information:
(a) identification of the installation where the goods were produced;
(b) contact information of the operator of the installation where the goods were
produced;
(c) the applicable reporting period;
(d) name and contact information of the verifier:
(e) ID of accreditation, name of the Accreditation Body;
(f) the date of the installation visit, if applicable, or the reasons for not carrying out an
installation visit;
(g) quantities of each type of declared goods produced in the reporting period;
(h) direct emissions of the installation during the reporting period;
(i) a description on how the installation’s emissions are attributed to different types of
goods;
(j) quantitative information on the goods, emissions and energy flows not associated
with those goods;
(k) in case of complex goods:
i. quantities of input materials (precursors) used;
ii. the specific embedded emissions;
EN 11 EN
iii. in case actual emissions are used: the identification of the installation where the
input material has been produced and the actual emissions from the production
on that material.
(l) the verification opinion statement;
(m) information on material misstatements found and not corrected, where applicable;
(n) information of non-conformities with calculation rules set out in Annex III, where
applicable.
EN EN
EUROPEAN COMMISSION
Brussels, 14.7.2021
SWD(2021) 647 final
COMMISSION STAFF WORKING DOCUMENT
Subsidiarity Grid
Accompanying the document
Proposal for a regulation of the European Parliament and of the Council
establishing a carbon border adjustment mechanism
{COM(2021) 564 final} - {SWD(2021) 643 final} - {SWD(2021) 644 final} -
{SEC(2021) 564 final}
1
Subsidiarity Grid
1. Can the Union act? What is the legal basis and competence of the Unions’ intended action?
1.1 Which article(s) of the Treaty are used to support the legislative proposal or policy initiative?
Articles 191 to 193 of the Treaty on the Functioning of the European Union (‘TFEU’) confirm and specify EU competencies in the area of climate change. The legal basis for this proposal is Article 192(1) TFEU. In accordance with Articles 191 and 192(1) TFEU, the EU shall contribute to the pursuit, inter alia, of the following objectives: preserving, protecting and improving the quality of the environment, promoting measures at international level to deal with regional or worldwide environmental problems, and in particular combating climate change.
1.2 Is the Union competence represented by this Treaty article exclusive, shared or supporting in nature?
In the case of environment, the Union’s competence is shared.
Subsidiarity does not apply for policy areas where the Union has exclusive competence as defined in Article 3 TFEU1. It is the specific legal basis which determines whether the proposal falls under the subsidiarity control mechanism. Article 4 TFEU2 sets out the areas where competence is shared between the Union and the Member States. Article 6 TFEU3 sets out the areas for which the Unions has competence only to support the actions of the Member States.
2. Subsidiarity Principle: Why should the EU act?
2.1 Does the proposal fulfil the procedural requirements of Protocol No. 24: - Has there been a wide consultation before proposing the act? - Is there a detailed statement with qualitative and, where possible, quantitative indicators
allowing an appraisal of whether the action can best be achieved at Union level?
The Commission engaged in an array of public and targeted consultations, for the preparation of this proposal. An inception impact assessment took place between 4 March and 1 April 2020 with the aim to collect initial feedback on the project. An open public consultation was also placed on the Commission website, from 22 July to 28 October 2020, aiming to gather opinions from citizens and organisations on the justifications, objectives, potential design and scope as well as impacts of the initiative. In addition to these, the Commission services engaged in extensive bilateral consultations with public authorities within the EU and third countries, as well as with business associations, individual companies and NGOs.
The impact assessment is explicit in stating that the only meaningful way to ensure equivalence between the carbon pricing policy applied in the EU’s internal market -by the EU ETS- and the carbon pricing policy applied on imports is to take action at the level of the Union. CBAM is inherently a border measure and therefore, there is clear added value of placing the intervention at the EU level, although its implementation and enforcement will be better performed at Member States level. These arguments are substantiated qualitatively in the impact assessment.
1 https://eur-lex.europa.eu/legal-content/EN/TXT/HTML/?uri=CELEX:12008E003&from=EN
2 https://eur-lex.europa.eu/legal-content/EN/TXT/HTML/?uri=CELEX:12008E004&from=EN
3 https://eur-lex.europa.eu/LexUriServ/LexUriServ.do?uri=CELEX:12008E006:EN:HTML
4 https://eur-lex.europa.eu/legal-content/EN/TXT/HTML/?uri=CELEX:12016E/PRO/02&from=EN

2
The explanatory memorandum of the proposal and the impact assessment, under chapters 3.2 and 3.3, contain sections on the principle of subsidiarity.
2.2 Does the explanatory memorandum (and any impact assessment) accompanying the Commission’s proposal contain an adequate justification regarding the conformity with the principle of subsidiarity?
Climate change is, by its very nature, a trans-boundary challenge that cannot be solved by national or local action alone. Coordinated EU action can effectively supplement and reinforce national and local action and enhances climate action. Coordination of climate action is necessary at EU level and, where possible, at global level, and EU action is justified on grounds of subsidiarity.
Since 1992, the EU has worked to develop joint solutions and to drive forward global action to tackle climate change. More specifically, action at EU level should aim to provide for cost effective delivery of long-term climate objectives, while ensuring fairness and environmental integrity. The establishment of a robust governance of the EU 2050 climate-neutrality objective will help to ensure that the EU remains on track to achieve the objective. Action on climate change adaptation at EU level enables the integration of adaptation policies and measures in key sectors, governance levels and EU policies.
There exists already a harmonised carbon pricing system at EU level: the EU ETS. The EU ETS applies to sectors that are energy-intensive and may be subject to international competition. In order to ensure a well-functioning single market when the EU increases its climate ambition, it is essential that a level playing field is created for the relevant sectors in the internal market. The single effective way to do this is by taking action at the level of the EU. Any initiative needs to be designed in a way that provides importers, regardless of country of origin and port of entry or destination within the EU, with uniform conditions and incentives for carbon emission reductions that are equivalent to those of domestic producers.
Additionally, the need for minimal administrative costs is best achieved by establishing consistent rules for the entire single market, further underlining the added value of an intervention at the EU level. Nevertheless, for the sake of minimising costs and ensuring effective action, national authorities should implement and enforce of the regulation, while a body at EU level could coordinate their actions and provide assistance. This architecture would draw the lessons of the successful experience of the EU ETS.
Moreover, as CBAM is inherently a border measure there is clear added value of placing the intervention at the EU level in view of the fact that external trade is an exclusive competence of the EU. At the same time, the CBAM also needs to be implemented consistently by Member States in the EU market and in view of its close links to the EU ETS, there is further justification of intervention at EU level. The public consultation has confirmed the added value of taking action on the CBAM at the EU level. In particular, stakeholders agree that a CBAM is needed due to existing differences of ambition between the EU and the rest of the world and in order to support the global climate efforts. In addition, in view of the EU’s position in international trade, if it introduces a CBAM the environmental effect on international climate ambitions will be most effective as a potential example to follow.
2.3 Based on the answers to the questions below, can the objectives of the proposed action be achieved sufficiently by the Member States acting alone (necessity for EU action)?
3
This proposal aims to reduce GHG emissions in the EU and avoiding that these emissions reduction efforts are offset by emissions increase outside the EU, as a result of carbon leakage, as well as ensure that the price of imports into the EU reflect more accurately their carbon content. This problem has a cross-border dimension, so it cannot be tackled independently by Member States. Due to its environmental nature and in order to avoid trade diversion, CBAM should be more efficient if designed at EU-level in a uniform way, mirroring EU ETS and designed in a compatible way with WTO rules.
(a) Are there significant/appreciable transnational/cross-border aspects to the problems being tackled? Have these been quantified?
The problem addressed by this proposal is how to succeed in reducing GHG emissions in the EU and avoiding that these emissions reduction efforts are offset by emissions increase outside the EU, as a result of carbon leakage. This risk increases as the EU raises the ambition of its climate policies above that of its trading partners. Therefore, the scale of the problem is commensurate to the raising of the EU climate ambition relative to that of others.
Based on the above, CBAM as a measure –like the problem it addresses - is cross-border one aiming to ensure that the price of imports into the EU reflect more accurately their carbon content. The impact assessment studied in detail the transnational aspects to the problem including impacts on imports and exports of goods subject to CBAM, as well as those indirectly related through upstream or downstream processes. Efficiency and administrative impacts on cross-border flows of goods were also studied in the impact assessment.
(b) Would national action or the absence of the EU level action conflict with core objectives of the Treaty5 or significantly damage the interests of other Member States?
National action would conflict with core objectives of the Treaty, including the ones in Article 32, which establishes in letter (c) ‘the objective of avoiding distorting conditions of competitions within the custom union’ and in letter (d) ‘the need to avoid serious disturbances in the economies of Member States’. These objectives would be impaired if Member States were left free to adopt individual decisions beyond implementation and enforcement in a matter that involves a number of provisions concerning goods imported in the Customs Union and a number of references to the custom union code.
Moreover, should Carbon Border Adjustment not be applied in a uniform way, it would incentivise behaviours resulting in trade diversion and forum shopping, as third country exporters would import goods through EU jurisdictions applying CBAM in the most lenient way.
Conversely, the absence of EU level action would significantly damage the interests of Member States as established in Article 191 TFEU as the objectives of ‘preserving, protecting and improving the quality of the environment’ and of avoiding carbon leakage can only be pursued at EU level.
(c) To what extent do Member States have the ability or possibility to enact appropriate measures?
5 https://europa.eu/european-union/about-eu/eu-in-brief_en
4
Member States do not have the possibility to enact appropriate measures. If they applied on their own a form of CBAM, they would very seriously risk diverting trade towards Member States not doing so. Moreover, CBAM is designed with a view to mirror the EU emission trading system, an EU wide and harmonised instrument, in terms of price of certificates, phasing out of existing carbon leakage measures and exclusion of third countries.
(d) How does the problem and its causes (e.g. negative externalities, spill-over effects) vary across the national, regional and local levels of the EU?
Member States are exposed to the risk of carbon leakage to different extent. This exposure would depend on whether their economies include industries covered by the EU ETS and more importantly on whether they host particular industrial installations in sectors that are at risk of carbon leakage. Whether a Member State is at EU’s external border it may also impact its exposure to carbon leakage.
Moreover, differing exposures to the risk of carbon leakage would provide limited justification for action at national level. Carbon emissions are not localised and like the EU ETS, the CBAM can achieve greater efficiency when uniformly applied on a broader scale.
(e) Is the problem widespread across the EU or limited to a few Member States?
Climate change and the need to address it is widespread across the EU.
(f) Are Member States overstretched in achieving the objectives of the planned measure?
No, the measure is proposed to support climate policy in the EU and in Member States.
(g) How do the views/preferred courses of action of national, regional and local authorities differ across the EU?
The European Council invited the Commission to propose a CBAM to ensure the environmental integrity of EU policies and avoid carbon leakage in a WTO-compatible way6. As agreed by the European Parliament, the Council and the Commission, the CBAM will also form part of new own resources feeding into the EU’s budget7. The European Parliament adopted a report on a WTO-compatible EU carbon border adjustment mechanism8. National authorities of several Member States also have called for the implementation of CBAM. Regional or local authorities have expressed very few views on CBAM.
2.4 Based on the answer to the questions below, can the objectives of the proposed action be better achieved at Union level by reason of scale or effects of that action (EU added value)?
Reducing GHG emissions is a trans-boundary issue that requires effective action at the largest
6 European Council. (2020). Conclusions of the European Council of 11 December 2020. (EUCO 22/20 CO EUR
17 CONCL 8). 7 Interinstitutional Agreement of 16 December 2020 between the European Parliament, the Council of the
European Union and the European Commission on budgetary discipline, on cooperation in budgetary matters and on sound financial management, as well as on new own resources, including a roadmap towards the introduction of new own resources (OJ L 433I , 22.12.2020, p. 28). 8 European Parliament resolution of 10 March 2021 towards a WTO-compatible EU carbon border adjustment
mechanism (2020/2043(INI))
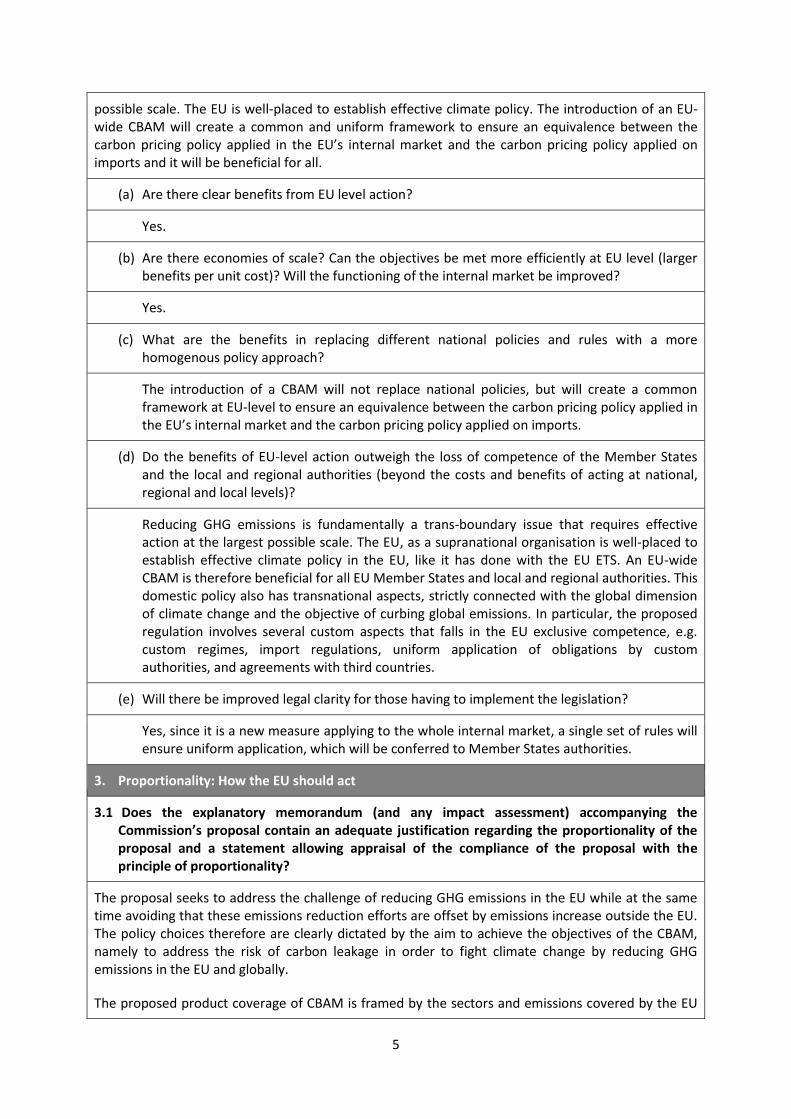
5
possible scale. The EU is well-placed to establish effective climate policy. The introduction of an EU-wide CBAM will create a common and uniform framework to ensure an equivalence between the carbon pricing policy applied in the EU’s internal market and the carbon pricing policy applied on imports and it will be beneficial for all.
(a) Are there clear benefits from EU level action?
Yes.
(b) Are there economies of scale? Can the objectives be met more efficiently at EU level (larger benefits per unit cost)? Will the functioning of the internal market be improved?
Yes.
(c) What are the benefits in replacing different national policies and rules with a more homogenous policy approach?
The introduction of a CBAM will not replace national policies, but will create a common framework at EU-level to ensure an equivalence between the carbon pricing policy applied in the EU’s internal market and the carbon pricing policy applied on imports.
(d) Do the benefits of EU-level action outweigh the loss of competence of the Member States and the local and regional authorities (beyond the costs and benefits of acting at national, regional and local levels)?
Reducing GHG emissions is fundamentally a trans-boundary issue that requires effective action at the largest possible scale. The EU, as a supranational organisation is well-placed to establish effective climate policy in the EU, like it has done with the EU ETS. An EU-wide CBAM is therefore beneficial for all EU Member States and local and regional authorities. This domestic policy also has transnational aspects, strictly connected with the global dimension of climate change and the objective of curbing global emissions. In particular, the proposed regulation involves several custom aspects that falls in the EU exclusive competence, e.g. custom regimes, import regulations, uniform application of obligations by custom authorities, and agreements with third countries.
(e) Will there be improved legal clarity for those having to implement the legislation?
Yes, since it is a new measure applying to the whole internal market, a single set of rules will ensure uniform application, which will be conferred to Member States authorities.
3. Proportionality: How the EU should act
3.1 Does the explanatory memorandum (and any impact assessment) accompanying the Commission’s proposal contain an adequate justification regarding the proportionality of the proposal and a statement allowing appraisal of the compliance of the proposal with the principle of proportionality?
The proposal seeks to address the challenge of reducing GHG emissions in the EU while at the same time avoiding that these emissions reduction efforts are offset by emissions increase outside the EU. The policy choices therefore are clearly dictated by the aim to achieve the objectives of the CBAM, namely to address the risk of carbon leakage in order to fight climate change by reducing GHG emissions in the EU and globally.
The proposed product coverage of CBAM is framed by the sectors and emissions covered by the EU

6
ETS and the CBAM scope should be laid down by a reference to certain goods by way of their classification in the Combined Nomenclature. This serves the motivation for the measure, namely to ensure that imports of energy intensive products into the EU are on equal footing with EU products in terms of EU ETS carbon pricing and to mitigate risks of carbon leakage. CBAM, as an alternative to free allocation of EU ETS allowances, builds on the logic of the EU ETS starting with sectors where emissions are the highest and therefore where it would matter most.
The carbon content of products is an essential element of the CBAM as it indicates the carbon dioxide equivalent emissions released during their production abroad. This is used to ensure that imported products are treated no less favourably than domestic products produced in EU ETS installations. As installations covered by the EU ETS are subject to a carbon price assessed on their actual emissions, imported products in the scope of CBAM should also be assessed based on their actual GHG emissions. However, such an approach may involve high administrative costs in the beginning and therefore for an initial transitory period it is proposed to use default values with the possibility for the importers to demonstrate that their products were produced with actual emissions lower than the default value, and therefore be subject to a lower CBAM obligation.
As regards the administration of the measure, the choice of empowering national climate CBAM Authorities is meant to minimise administrative costs associated with this task and increase effectiveness. This will require, however, in ensuring proper collaboration and coordination of the assessment of declarations of embedded emissions in imported goods at EU level.
3.2 Based on the answers to the questions below and information available from any impact assessment, the explanatory memorandum or other sources, is the proposed action an appropriate way to achieve the intended objectives?
The legal instrument of a Regulation was chosen to ensure direct applicability, uniform application and uniform enforcement throughout the EU, in order to avoid trade diversion and forum shopping. With a view to ensure a well-functioning measure meeting its climate objectives, a decentralised approach with some coordination and support functions at central level is envisaged in the proposal. Setting up a central CBAM body together with the national climate bodies will minimize the relevant administrative costs associated and will ensure a coherent application of CBAM to all imports. The revenues will finance the implementation costs of CBAM as well as generate new own resources for the EU.
(a) Is the initiative limited to those aspects that Member States cannot achieve satisfactorily on their own, and where the Union can do better?
Yes.
(b) Is the form of Union action (choice of instrument) justified, as simple as possible, and coherent with the satisfactory achievement of, and ensuring compliance with the objectives pursued (e.g. choice between regulation, (framework) directive, recommendation, or alternative regulatory methods such as co-legislation, etc.)?
The objectives of the present proposal can best be pursued through a Regulation. This will ensure direct applicability of a number of provisions concerning goods imported in the Customs Union, included on custom regimes, territorial application, anti-circumvention provisions, or sanctions. Moreover, this Regulation requires uniform and consistent application and enforcement throughout the EU by national authorities in order to pursue the objectives of Articles 32 and 207 TFUE. Any different legal instrument would impair the

7
needed uniform application throughout the European Union by disrupting competition among Member States and creating unwanted effect of trade diversion and forum shopping. As an example, by choosing the legal instrument of a directive, foreign companies could try to take advantage of different implementation rules of carbon border adjustment in different member states by choosing to import and release products into free practice in Member States applying a more lenient attitude in terms of verification of embedded emissions, sanctions, or guarantees.
(c) Does the Union action leave as much scope for national decision as possible while achieving satisfactorily the objectives set? (e.g. is it possible to limit the European action to minimum standards or use a less stringent policy instrument or approach?)
In order to ensure a well-functioning measure meeting its set climate objectives, a decentralised approach is envisaged. On the one hand, certain tasks where a single approach is key such as the publication of the price of certificates and the establishment default values will be carried out by the Commission, which will also play a role in coordination and advice. On the other hand, national climate authorities will take care of implementation and enforcement tasks, such us the sale of CBAM certificates, the reimbursement requests, the application of penalties. Such system will ensure a coherent application of the CBAM obligations to all imports of the relevant goods in a transparent way, safeguarding the EU’s trade obligations and at the same time ensuring an effective application as regards the climate effectiveness of the measure.
(d) Does the initiative create financial or administrative cost for the Union, national governments, regional or local authorities, economic operators or citizens? Are these costs commensurate with the objective to be achieved?
The implementation of CBAM will create limited administrative costs for the Union. The EU will benefit from the increased revenues stemming from the CBAM, which will finance the implementation costs related to the measure and borne by Member States’ authorities. It will also generate new own resources for the EU.
In terms of impacts to economic operators and citizens, CBAM would entail very limited negative impacts on GDP, investments and consumption in the EU as compared to the case of raising the EU climate ambition in its absence. At the same time, by capturing carbon leakage CBAM would limit output losses in the sectors to which it would apply in view of raising the level of climate ambition. It would also contribute to reduction in emissions in both the EU and in the rest of the world in CBAM sectors by 2030.
(e) While respecting the Union law, have special circumstances applying in individual Member States been taken into account?
Yes as part of the impact assessment the Commission analysis reflected, to the extent possible, the economic and industrial structures of individual Member States as well as their trade flows with third countries. In this context, individual specificities and differences between Member States were accounted for in the assessment of impacts by the Commission.

EN EN
EUROPEAN COMMISSION
Brussels, 14.7.2021
SWD(2021) 644 final
COMMISSION STAFF WORKING DOCUMENT
EXECUTIVE SUMMARY OF THE IMPACT ASSESSMENT REPORT
Accompanying the document
Proposal for a Regulation of the European Parliament and of the Council
establishing a carbon border adjustment mechanism
{COM(2021) 564 final} - {SWD(2021) 643 final} - {SWD(2021) 647 final} -
{SEC(2021) 564 final}
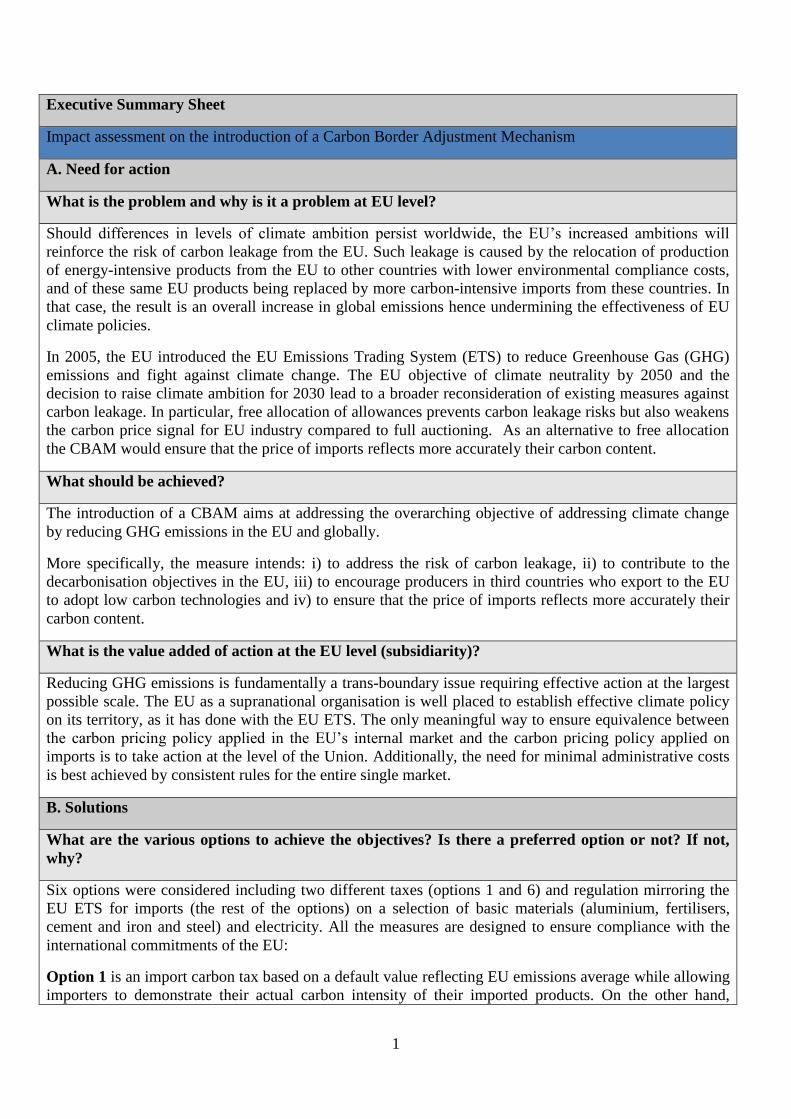
1
Executive Summary Sheet
Impact assessment on the introduction of a Carbon Border Adjustment Mechanism
A. Need for action
What is the problem and why is it a problem at EU level?
Should differences in levels of climate ambition persist worldwide, the EU’s increased ambitions will
reinforce the risk of carbon leakage from the EU. Such leakage is caused by the relocation of production
of energy-intensive products from the EU to other countries with lower environmental compliance costs,
and of these same EU products being replaced by more carbon-intensive imports from these countries. In
that case, the result is an overall increase in global emissions hence undermining the effectiveness of EU
climate policies.
In 2005, the EU introduced the EU Emissions Trading System (ETS) to reduce Greenhouse Gas (GHG)
emissions and fight against climate change. The EU objective of climate neutrality by 2050 and the
decision to raise climate ambition for 2030 lead to a broader reconsideration of existing measures against
carbon leakage. In particular, free allocation of allowances prevents carbon leakage risks but also weakens
the carbon price signal for EU industry compared to full auctioning. As an alternative to free allocation
the CBAM would ensure that the price of imports reflects more accurately their carbon content.
What should be achieved?
The introduction of a CBAM aims at addressing the overarching objective of addressing climate change
by reducing GHG emissions in the EU and globally.
More specifically, the measure intends: i) to address the risk of carbon leakage, ii) to contribute to the
decarbonisation objectives in the EU, iii) to encourage producers in third countries who export to the EU
to adopt low carbon technologies and iv) to ensure that the price of imports reflects more accurately their
carbon content.
What is the value added of action at the EU level (subsidiarity)?
Reducing GHG emissions is fundamentally a trans-boundary issue requiring effective action at the largest
possible scale. The EU as a supranational organisation is well placed to establish effective climate policy
on its territory, as it has done with the EU ETS. The only meaningful way to ensure equivalence between
the carbon pricing policy applied in the EU’s internal market and the carbon pricing policy applied on
imports is to take action at the level of the Union. Additionally, the need for minimal administrative costs
is best achieved by consistent rules for the entire single market.
B. Solutions
What are the various options to achieve the objectives? Is there a preferred option or not? If not,
why?
Six options were considered including two different taxes (options 1 and 6) and regulation mirroring the
EU ETS for imports (the rest of the options) on a selection of basic materials (aluminium, fertilisers,
cement and iron and steel) and electricity. All the measures are designed to ensure compliance with the
international commitments of the EU:
Option 1 is an import carbon tax based on a default value reflecting EU emissions average while allowing
importers to demonstrate their actual carbon intensity of their imported products. On the other hand,

2
Option 6 consists of an excise duty on carbon-intensive materials covering consumption of both domestic
and imported products, along with the continuation of the free allocation of allowances in the EU ETS.
The rest of the options involve the purchase and surrender of import certificates (CBAM certificates) on
the importation of a selection of basic materials mirroring the EU ETS. In option 2, the price of the
certificates would be based on a default value reflecting EU emissions average, with the option for
importers to demonstrate the actual carbon intensity of imported products. Option 3 assumes that the
carbon price of imports will be based on actual emissions from third country producers rather than on a
default value based on EU producers’ averages. Both these options assume that the CBAM sectors do not
receive free allowances under the ETS.
Option 4 is a variant of option 3. It considers a phase in of the CBAM with a phase out of free allowances
starting after 2025. Option 5 is another variant with an extension of the scope further down in the value
chain to cover also the basic materials as part of components and finished goods.
This impact assessment supports option 4 as the preferred option for its positive impacts and coherence
with the rest of the Fit for 55 Package.
What are different stakeholders' views? Who supports which option?
The public consultation suggested that carbon leakage is already perceived as a reality and that the risk is
likely to increase in view of the raising of the EU climate ambition. The respondents believe that the
following policy options are all at least somewhat relevant for the design of a CBAM (in order of best
scored): i) a tax applied on imports on sectors are at risk of carbon leakage (e.g. a border tax or customs
duty); ii) a carbon tax (e.g. excise or VAT type) at consumption level applied to EU production as well as
to imports; iii) the obligation to purchase CBAM certificates from a specific pool outside the EU ETS
dedicated to imports, which would mirror the EU ETS price or iv) the extension of the EU ETS to imports.
C. Impacts of the preferred option
What are the benefits of the preferred option (if any, otherwise of main ones)?
Option 4 provides clear benefits in terms of emission reductions in the EU and reduction of the risk of
carbon leakage for the sectors considered. Relative to a scenario, which assumes the continuation of free
allocation in the EU ETS and the new climate level of ambition, Option 4 would lead to a 1.0% emissions
reduction in the EU and a 0.4% in the rest of the world in CBAM sectors by 2030. In addition, under
option 4, carbon leakage is brought down to -29% in 2030.
What are the costs of the preferred option (if any, otherwise of main ones)?
In terms of economic impacts, option 4 would entail limited negative impacts on GDP (-0.223%) and
consumption (-0.558%) and slightly positive effects on investments (0.388%), as compared to the baseline
in 2030. Regarding social impacts, option 4 foresees small increase in employment by 0,3% in the sectors
covered by CBAM (as compared to baseline, in 2030). Limited negative impact on employment is
envisaged for downstream sectors.
Finally, administrative and compliance costs are expected for businesses and authorities. While it is
difficult to assess these costs with precision, estimates show that under option 4, aggregate costs for
businesses could amount to EUR 9.8 to 14.3 million yearly. Estimated enforcement costs for authorities
could amount to an aggregate of EUR 15 million per year.
What are the impacts on SMEs and competitiveness?
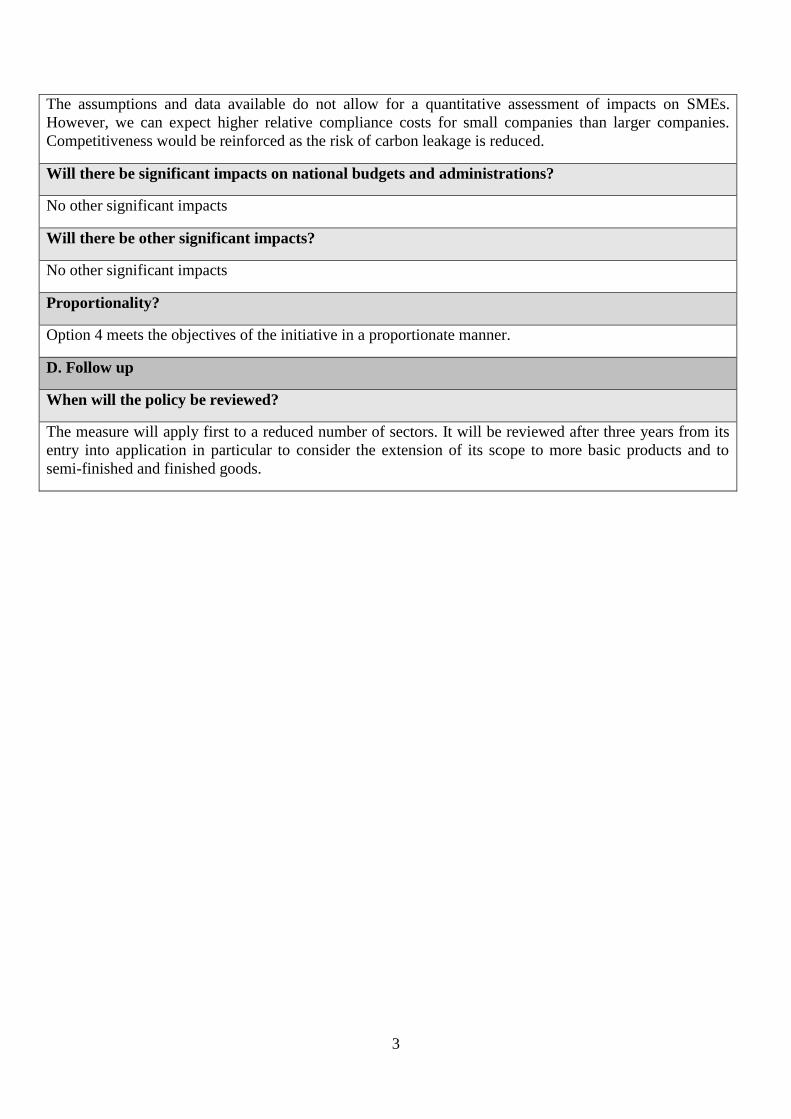
3
The assumptions and data available do not allow for a quantitative assessment of impacts on SMEs.
However, we can expect higher relative compliance costs for small companies than larger companies.
Competitiveness would be reinforced as the risk of carbon leakage is reduced.
Will there be significant impacts on national budgets and administrations?
No other significant impacts
Will there be other significant impacts?
No other significant impacts
Proportionality?
Option 4 meets the objectives of the initiative in a proportionate manner.
D. Follow up
When will the policy be reviewed?
The measure will apply first to a reduced number of sectors. It will be reviewed after three years from its
entry into application in particular to consider the extension of its scope to more basic products and to
semi-finished and finished goods.

EN EN
EUROPEAN COMMISSION
Brussels, 14.7.2021
SWD(2021) 643 final
PART 1/2
COMMISSION STAFF WORKING DOCUMENT
IMPACT ASSESSMENT REPORT
Accompanying the document
Proposal for a regulation of the European Parliament and of the Council
establishing a carbon border adjustment mechanism
{COM(2021) 564 final} - {SWD(2021) 644 final} - {SWD(2021) 647 final} -
{SEC(2021) 564 final}

1
Table of contents
1 INTRODUCTION: POLITICAL AND LEGAL CONTEXT ............................................................... 1
2 PROBLEM DEFINITION .................................................................................................................... 1
2.1 What is the problem? ......................................................................................... 1
2.2 How is the problem currently being addressed? ................................................ 1
2.3 What are the problem drivers? .......................................................................... 1
2.4 How will the problem evolve? .......................................................................... 1
3 WHY SHOULD THE EU ACT? .......................................................................................................... 1
3.1 Legal basis ......................................................................................................... 1
3.2 Subsidiarity: Necessity of EU action ................................................................. 1
3.3 Subsidiarity: Added value of EU action ............................................................ 1
4 OBJECTIVES: WHAT IS TO BE ACHIEVED? ................................................................................. 1
4.1 General objectives ............................................................................................. 1
4.2 Specific objectives ............................................................................................. 1
4.3 Ancillary effects ................................................................................................ 1
5 WHAT ARE THE AVAILABLE POLICY OPTIONS? ...................................................................... 1
5.1 What is the baseline from which options are assessed? .................................... 1
5.2 Description of the policy options ...................................................................... 1
5.3 Options discarded at an early stage ................................................................... 1
6 WHAT ARE THE IMPACTS OF THE POLICY OPTIONS? ............................................................. 1
6.1 Introduction ....................................................................................................... 1
6.2 Environmental Impacts ...................................................................................... 1
6.3 Impacts on the EU ETS ..................................................................................... 1
6.4 Economic Impacts ............................................................................................. 1
6.5 Social Impacts ................................................................................................... 1
6.6 Administrative Impacts ..................................................................................... 1
6.7 Revenue Generation Impacts ............................................................................. 1
7 HOW DO THE OPTIONS COMPARE? .............................................................................................. 1
8 PREFERRED OPTION ........................................................................................................................ 1
9 HOW WILL ACTUAL IMPACTS BE MONITORED AND EVALUATED? .................................... 1

2
Glossary
Term or acronym Meaning or definition
CAT Carbon Added Tax
CBAM Carbon Border Adjustment Mechanism
CN Combined Nomenclature
CO2 Carbon Dioxide
ETS Emissions Trading System
GDP Gross Domestic Product
GHG Greenhouse Gas
MRV Monitoring, Reporting and Verification
NDC Nationally Determined Contribution
PEF Product Environmental Footprint
SMEs Small and Medium-sized Enterprises
TFEU Treaty on the Functioning of the European Union
VAT Value Added Tax
WTO World Trade Organisation
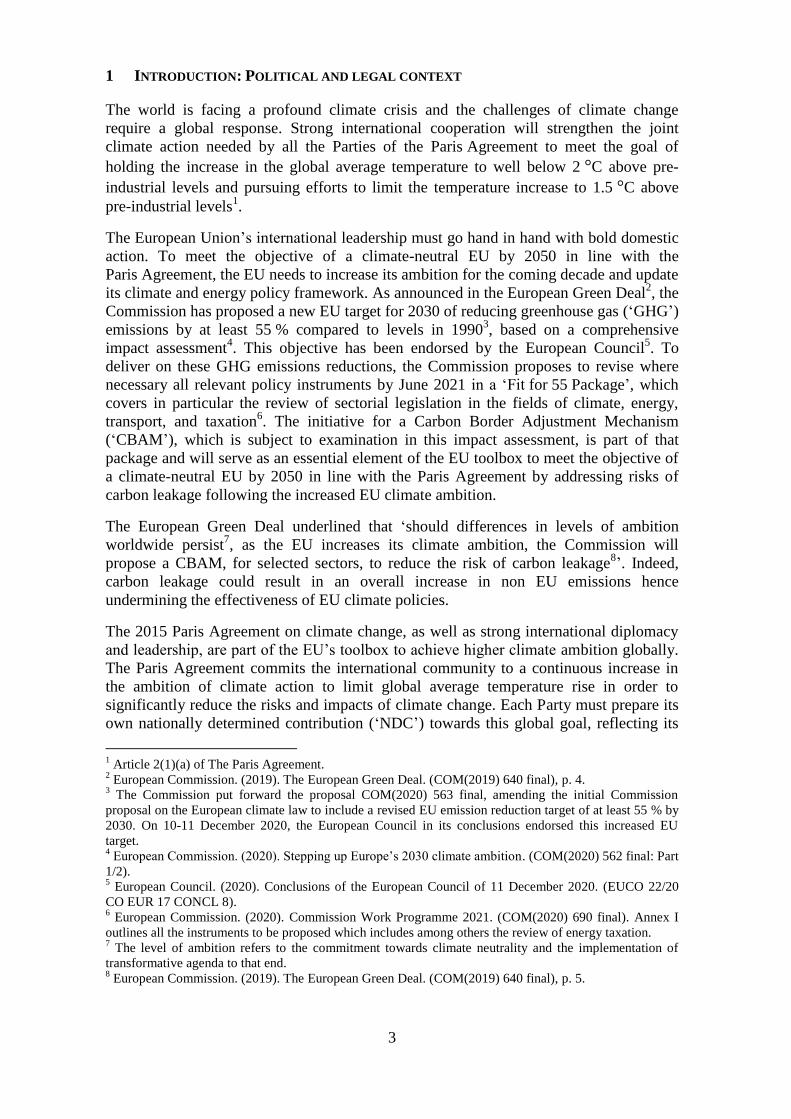
3
1 INTRODUCTION: POLITICAL AND LEGAL CONTEXT
The world is facing a profound climate crisis and the challenges of climate change
require a global response. Strong international cooperation will strengthen the joint
climate action needed by all the Parties of the Paris Agreement to meet the goal of
holding the increase in the global average temperature to well below 2 °C above pre-
industrial levels and pursuing efforts to limit the temperature increase to 1.5 °C above
pre-industrial levels1.
The European Union’s international leadership must go hand in hand with bold domestic
action. To meet the objective of a climate-neutral EU by 2050 in line with the
Paris Agreement, the EU needs to increase its ambition for the coming decade and update
its climate and energy policy framework. As announced in the European Green Deal2, the
Commission has proposed a new EU target for 2030 of reducing greenhouse gas (‘GHG’)
emissions by at least 55 % compared to levels in 19903, based on a comprehensive
impact assessment4. This objective has been endorsed by the European Council
5. To
deliver on these GHG emissions reductions, the Commission proposes to revise where
necessary all relevant policy instruments by June 2021 in a ‘Fit for 55 Package’, which
covers in particular the review of sectorial legislation in the fields of climate, energy,
transport, and taxation6. The initiative for a Carbon Border Adjustment Mechanism
(‘CBAM’), which is subject to examination in this impact assessment, is part of that
package and will serve as an essential element of the EU toolbox to meet the objective of
a climate-neutral EU by 2050 in line with the Paris Agreement by addressing risks of
carbon leakage following the increased EU climate ambition.
The European Green Deal underlined that ‘should differences in levels of ambition
worldwide persist7, as the EU increases its climate ambition, the Commission will
propose a CBAM, for selected sectors, to reduce the risk of carbon leakage8’. Indeed,
carbon leakage could result in an overall increase in non EU emissions hence
undermining the effectiveness of EU climate policies.
The 2015 Paris Agreement on climate change, as well as strong international diplomacy
and leadership, are part of the EU’s toolbox to achieve higher climate ambition globally.
The Paris Agreement commits the international community to a continuous increase in
the ambition of climate action to limit global average temperature rise in order to
significantly reduce the risks and impacts of climate change. Each Party must prepare its
own nationally determined contribution (‘NDC’) towards this global goal, reflecting its
1 Article 2(1)(a) of The Paris Agreement.
2 European Commission. (2019). The European Green Deal. (COM(2019) 640 final), p. 4.
3 The Commission put forward the proposal COM(2020) 563 final, amending the initial Commission
proposal on the European climate law to include a revised EU emission reduction target of at least 55 % by
2030. On 10-11 December 2020, the European Council in its conclusions endorsed this increased EU
target. 4 European Commission. (2020). Stepping up Europe’s 2030 climate ambition. (COM(2020) 562 final: Part
1/2). 5 European Council. (2020). Conclusions of the European Council of 11 December 2020. (EUCO 22/20
CO EUR 17 CONCL 8). 6 European Commission. (2020). Commission Work Programme 2021. (COM(2020) 690 final). Annex I
outlines all the instruments to be proposed which includes among others the review of energy taxation. 7 The level of ambition refers to the commitment towards climate neutrality and the implementation of
transformative agenda to that end. 8 European Commission. (2019). The European Green Deal. (COM(2019) 640 final), p. 5.
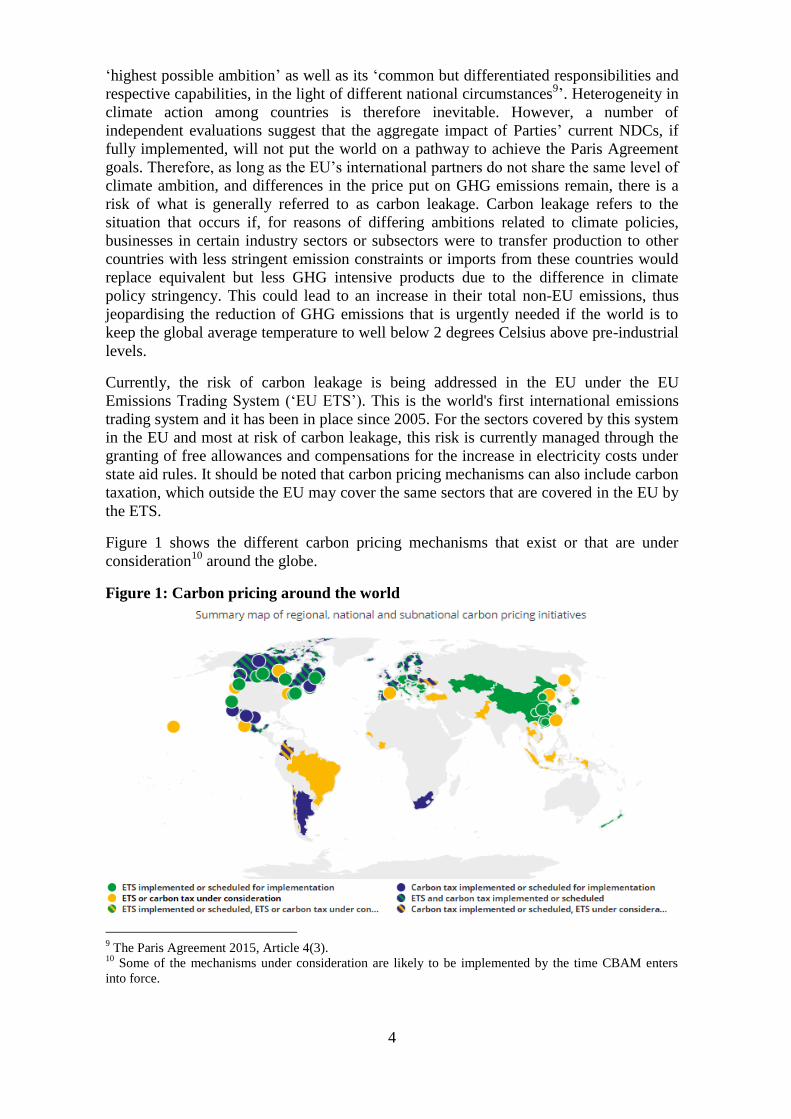
4
‘highest possible ambition’ as well as its ‘common but differentiated responsibilities and
respective capabilities, in the light of different national circumstances9’. Heterogeneity in
climate action among countries is therefore inevitable. However, a number of
independent evaluations suggest that the aggregate impact of Parties’ current NDCs, if
fully implemented, will not put the world on a pathway to achieve the Paris Agreement
goals. Therefore, as long as the EU’s international partners do not share the same level of
climate ambition, and differences in the price put on GHG emissions remain, there is a
risk of what is generally referred to as carbon leakage. Carbon leakage refers to the
situation that occurs if, for reasons of differing ambitions related to climate policies,
businesses in certain industry sectors or subsectors were to transfer production to other
countries with less stringent emission constraints or imports from these countries would
replace equivalent but less GHG intensive products due to the difference in climate
policy stringency. This could lead to an increase in their total non-EU emissions, thus
jeopardising the reduction of GHG emissions that is urgently needed if the world is to
keep the global average temperature to well below 2 degrees Celsius above pre-industrial
levels.
Currently, the risk of carbon leakage is being addressed in the EU under the EU
Emissions Trading System (‘EU ETS’). This is the world's first international emissions
trading system and it has been in place since 2005. For the sectors covered by this system
in the EU and most at risk of carbon leakage, this risk is currently managed through the
granting of free allowances and compensations for the increase in electricity costs under
state aid rules. It should be noted that carbon pricing mechanisms can also include carbon
taxation, which outside the EU may cover the same sectors that are covered in the EU by
the ETS.
Figure 1 shows the different carbon pricing mechanisms that exist or that are under
consideration10
around the globe.
Figure 1: Carbon pricing around the world
9 The Paris Agreement 2015, Article 4(3).
10 Some of the mechanisms under consideration are likely to be implemented by the time CBAM enters
into force.
5
Source: World Bank, summary map of regional, national and subnational carbon pricing initiatives (Last update: 1
April 2021), the World Bank Group, Washington. https://carbonpricingdashboard.worldbank.org/
The EU ETS revision is assessed by the European Commission in a separate impact
assessment. Among others, this involves the possible extension of the EU ETS to
maritime transport, as well as emissions from buildings and road transport11
. Most
notably, a higher environmental contribution of the EU ETS translates into a more
stringent cap on emissions, meaning that the volume of allowances available will decline.
A more stringent cap will likely imply an increase of the EU ETS carbon price at which
allowances’ supply and demand match. The EU objective of climate neutrality and the
decision to raise climate ambition for 2030 also lead to a broader reconsideration of
existing measures against carbon leakage. In particular, free allocation of allowances
prevents carbon leakage risks but also weakens the carbon price signal for EU industry
compared to full auctioning.
As an alternative to free allocation, as indicated by the Green Deal Communication, the
CBAM ‘would ensure that the price of imports reflects more accurately their carbon
content. This measure will be designed to comply with World Trade Organization
(WTO) rules, including as regards the principle of non-discrimination, and other
international obligations of the EU12
’. Further, President von der Leyen has underlined
that ‘Carbon must have its price – because nature cannot pay the price anymore. This
Carbon Border Adjustment Mechanism should motivate foreign producers and EU
importers to reduce their carbon emissions13
’. To this end, active outreach to third
countries and businesses would be important with regard to the understanding of and
compliance with CBAM requirements.
In the special European Council of 17-21 July 202014
, EU leaders agreed on the recovery
instrument NextGenerationEU. The instrument will provide the EU with the necessary
means to address the challenges posed by the COVID-19 pandemic and, therein, support
investment in the green and digital transitions. In order to finance it, the Commission will
be able to borrow up to EUR 750 billion on financial markets. In that context, EU leaders
agreed to provide the EU with new own resources, notably to facilitate the repayment of
NextGenerationEU funds.
As part of the mandate received, the Commission was invited to put forward a proposal
for a CBAM in the first semester of 2021, with a view to its introduction at the latest by 1
January 2023. The envisaged timetable was confirmed in the roadmap towards the
introduction of new own resources agreed by the European Parliament, the Council and
the Commission on 16 December 202015
.
11
European Commission 2020. Inception Impact Assessment: Amendment of the EU Emissions Trading
System (Directive 2003/87/EC). (Ares(2020)6081850). 12
European Commission. (2019). The European Green Deal. (COM(2019) 640 final), p. 5. 13
State of the Union Address by President von der Leyen at the European Parliament Plenary on 16
September 2020. https://ec.europa.eu/commission/presscorner/detail/en/SPEECH_20_1655 14
See European Council conclusions, 17-21 July 2020. 15
See Interinstitutional agreement between the European Parliament, the Council of the European Union
and the European Commission on budgetary discipline, on cooperation in budgetary matters and on sound
financial management, as well as on new own resources, including a roadmap towards the introduction of
new own resources, adopted on 16 December 2020.

6
2 PROBLEM DEFINITION
This section will define and analyse the problems and the problem drivers as well as
assess the evolution of the problems in the absence of EU policy intervention. The
‘Intervention Logic’ (
Figure 2 below) presents visually the problems, their drivers, as well as the objectives of
the proposed mechanism.
Figure 2: Intervention Logic
2.1 What is the problem?
2.1.1 Overall positioning of the problem
The problem addressed by this impact assessment is how to succeed in reducing GHG in
the EU and avoiding that these emissions reduction efforts are offset by emissions
increases outside the EU. As indicated in Section 1, if differences in levels of climate
ambition are to persist worldwide, the EU’s increased ambitions will reinforce the risk of
carbon leakage from the EU. Such leakage is caused by the relocation of production of
energy-intensive products from the EU to other countries with lower environmental
compliance costs, and of these same EU products being replaced by more carbon-
intensive imports from these countries16
. These manifestations of carbon leakage are
sometimes referred to as the increase or reallocation of GHG emissions embedded in
imported goods17
. GHG emissions embedded in imports are a great concern as they are
expected to increase both as a result of the relocation of production outside of the EU but
also as there might be increased demand of such products due to price differences. The
resulting overall increase in global emissions undermines the effectiveness of EU climate
policies. The risk of carbon leakage increases as the EU raises the ambition of its climate
policies above that of its trading partners.
The public consultation on the CBAM, for which the Commission received over 600
contributions from companies and business associations, EU and non-EU citizens, civil
society and public authorities suggested that carbon leakage is already perceived as a
reality and that the risk is likely to increase in view of the raising of the EU climate
16
The relocation of production is one of the channels leading to carbon leakage. 17
Embedded emissions refers to the production of goods but not physically incorporated in the goods.
7
ambition. Overall, respondents agreed that a CBAM can be justified by differences of
ambition between EU and third countries to fight against climate change and can
contribute to both EU and global climate efforts. The results of the consultation are
highlighted throughout this report and discussed in more detail under Annex 2.
Firstly, rising GHG emissions across the world are a global problem as they lead to
climate change, which has a devastating effect on the planet and its people. In particular,
carbon dioxide emissions from human activities contribute about 80 % to the
anthropogenic warming of the atmosphere together with other GHGs such as methane or
nitrous oxide. Recognising the need to address climate change, the EU and 189 countries
have become Parties to the Paris Agreement in order to keep global temperature rise well
below 2 °C above pre-industrial levels and to pursue efforts to limit the temperature
increase even further to 1.5 °C. To contribute to this objective, the EU has increased its
targets and efforts to reduce its GHG emissions, and to achieve climate neutrality (net
zero emissions) by 205018
.
Secondly, the risk of EU effort being offset by relocating production and increase of
carbon-intensive imports could increase due to a variety of factors19
. The evidence of the
existence of carbon leakage is not always conclusive or suggests that it is difficult to
isolate carbon leakage as a single factor in relocation decisions. One reason for this is
because different studies use different methodologies. In particular, as explained in
Annex 11, ex-post studies do not find substantial evidence of carbon leakage as a result
of free allocation under the EU ETS and of the low carbon price until phase 3 of the EU
ETS. By contrast ex-ante analyses using simulation models, often find a substantial risk
of carbon leakage in the absence of protection mechanisms such as free allocation of
carbon allowances. This is especially so, in studies focusing on specific industries (e.g.
partial equilibrium) which tend to focus on emission-intensive and trade-exposed sectors
and find higher leakage rates for these sectors in particular. The differences in results
between the types of studies indicate that carbon leakage protection measures have been
effective to date, while higher carbon prices and declining free allocation can result in an
increased leakage risk and thus alter the results. These considerations align the results of
ex-ante and ex-post studies by explaining the differences. Ex-ante studies often assume
the absence of carbon-leakage protection mechanisms. However, in practice carbon
pricing mechanisms have always been accompanied by special provisions, such as free
allowance allocation or carbon tax exemptions, to avoid the risk of carbon leakage. In ex-
post studies of existing carbon pricing mechanisms, these leakage protection measures
are therefore included. Additionally, analytic and empirical evidence shows that as a
result of the existing leakage protection mechanisms, the carbon price signal has been
significantly reduced. Notwithstanding the above considerations, as the EU increases its
climate ambitions, existing mechanisms in place to address carbon leakage are being
reconsidered, allowances available for free allocation will become scarce, the carbon
price signal will become stronger and industries will therefore have to reduce their
emissions. This view is also supported by the OECD which argues that ‘this literature,
however, has been, by definition, based on past climate policies, which have not
embodied the same level of ambition that is now being put forward by some countries.
Thus, while carbon leakage and competitiveness effects of climate policies have been
18
European Commission. (2020). Stepping up Europe’s 2030 climate ambition. (COM(2020) 562 final:
Part 1/2) p.8. European Council Conclusions of December 2020. (EUCO 22/20 CO EUR 17 CONCL 8). 19
See section 2.2 below.
8
very modest so far, increased policy stringency divergence in the future may amplify
these issues. The small effects identified may partly reflect the low stringency of climate
policies to date. Yet threats posed by climate change require policies that lie outside the
bounds of past experience. Another explanation for the small effects observed so far is
that the climate policies are designed so as to prevent potential competitiveness effects20
’.
2.1.2 The CBAM in the context of the Paris Agreement
While each Party to the Paris Agreement sets its own level of ambition, at the same time
we need to make sure that Parties are not undermining the effectiveness of each other’s
policies. By introducing a CBAM, the EU will ensure that goods imported into the EU
follow the same rules as the goods produced in the EU without interfering with policy
choices in third countries.
In order to respect the Paris Agreement and the principle of nationally determined
contributions (NDC) therein as well as the principle of Common but Differentiated
responsibility, the CBAM would be designed in such a manner that it does not directly
depend on the overall level of ambitions of a country nor on the policy choices made by a
country.
The CBAM would be designed to reduce the risk of carbon leakage resulting from the
climate ambition of the EU while taking into account the effects of the policies carried
out by our partners across the globe. As most of the CBAM options, considered in the
sections bellow, would apply to the actual emissions of imported goods or offer the
possibility to be applied to actual emissions of imported goods, this would imply that
when a country decides to reduce emissions through a regulatory approach, its goods
would be subject to a lesser CBAM obligation when exported to the EU. In addition, in
practice the possibility to account for any carbon price effectively paid outside the Union
will be taken into account when determining the CBAM obligation. Therefore, policies
based on carbon pricing approaches will be taken into account.
2.2 How is the problem currently being addressed?
The risk of carbon leakage is inherent to any carbon pricing policy carried out in an open
economy, unless all countries have the same level of ambition to fight against climate
change. This risk has been identified from the beginning of the EU ETS and addressed
through two mechanisms, namely the free allocation of ETS allowances to sectors at
highest risk of carbon leakage and the possibility for Member States to give state aid to
electro-intensive undertakings active in a sector exposed to international trade,
compensating the higher electricity costs resulting from the ETS. Both of these
mechanisms are described in the impact assessment of the ETS revision21
. The ETS
Directive, however, clearly states that both mechanisms are to be transitional and the
Commission is obliged to assess the effects of these measures by revision clauses in the
ETS Directive.
20
OECD (2020) Climate Policy Leadership in an interconnected world: What Role of Border Carbon
Adjustments? Paragraph 30. 21
See section 5.2.1.4 and Annex 9 in European Commission 2020. Inception Impact Assessment:
Amendment of the EU Emissions Trading System (Directive 2003/87/EC). (Ares(2020)6081850).
9
2.2.1 Free allocation of allowances
Free allowances are an effective way to deal with carbon leakage. However, the
combination of competition in global supply chains and the provision of free allowances
results in a reduced and uncertain carbon price incentive for climate-neutral production
processes and for the efficient use and choice of materials in manufacturing and
recycling. Furthermore, they result in a situation where carbon emissions embedded in
goods placed on the EU market are not priced consistently, but depending on the material
and its origin, thus limiting the incentives to reduce emissions.
The European Court of Auditors report 18/2020, ‘the EU’s ETS: free allocation of
allowances need better targeting’, found that the share of free allowances still represented
a very significant part of the total amount of ETS allowances, while the stated objective
of the ETS is that auctioning should be the default method for attribution of allowances.
In addition, the same report found that free allocation could have a negative effect on the
incentive to decarbonise. The ETS revision impact assessment compares the results of the
ETS in the power sector, where allocation is mostly auctioned, with the industry sector,
where the vast majority of allowances are allocated for free, to note that decarbonisation
has progressed faster in the former than in the latter.
It should be noted that carbon leakage risks through relocation of production are also
addressed in existing carbon pricing mechanisms outside the EU. The instrument of free
allowance allocation is used in all major jurisdictions with emission trading systems in
place. Besides the EU ETS, the emission trading schemes in California, Quebec, New
Zealand and the Republic of Korea allocate parts of their allowances for free at varying
methods and shares (between 21 % and 97 %22
). The same applies to the ETS pilots in
China, which also allocate allowances to the covered power plants for free23
.
All economic literature confirms that free allocation is an effective instrument to address
the risk of carbon leakage, however handing allowances for free has a cost both
financially and in terms of effectiveness of the ETS. As the EU is raising its climate
ambition, both these costs will increase, which will risk to make it more difficult for the
EU to reach the set climate targets.
2.2.2 Compensation of indirect carbon costs
The guidelines on certain State aid measures in the context of the system for greenhouse
gas emission allowance trading post 2021 identify the sectors found at risk of carbon
leakage due to their indirect emissions, and the Member States which are allowed to
provide compensation for indirect carbon costs24
.
Like free allowances, state aids by nature are a regime of exception. This is outlined in
the excerpt of the Communication: ‘The primary objective of State aid control in the
context of implementation of the EU ETS is to ensure that the positive effects of the aid
22
Acworth et al., Achieving Zero Emissions Under a Cap-And-Trade System, EUI Policy Brief, Issue
2020/26 June 2020, https://icapcarbonaction.com/en/?option=com_attach&task=download&id=695 23
IEA, The Role of China’s ETS in Power Sector Decarbonisation, 2020, April
https://www.iea.org/reports/the-role-of-chinas-ets-in-power-sector-decarbonisation 24
European Commission. (2020). Communication from the Commission Guidelines on certain State aid
measures in the context of the system for greenhouse gas emission allowance trading post-2021 (2020
C/2020/6400).
10
outweigh its negative effects in terms of distortions of competition in the internal market.
State aid must be necessary to achieve the environmental objective of the EU ETS
(necessity of the aid) and must be limited to the minimum needed to achieve the
environmental protection sought (proportionality of the aid) without creating undue
distortions of competition and trade in the internal market.’
It should be noted that only 13 Member States and Norway avail this possibility to grant
indirect cost compensation25
.
2.3 What are the problem drivers?
There are three interconnected drivers that may induce an increased risk of carbon
leakage, namely: the different levels of climate ambitions in the world and the actions in
place to achieve them, the increased EU ambitions and the reconsideration of existing
carbon leakage protection mechanisms, in particular the gradual decrease of allowances
available for free allocation under the EU ETS. When looking at those drivers in the
context of the globalised value chain, the risk of carbon leakage becomes even more
acute.
2.3.1 Different levels of climate achievements in the world
At present, international climate action is characterised by different stages of
achievements. The Paris Agreement, however, aims to create a coherent dynamic by
strengthening the global response to the threat of climate change. Each Party to the Paris
Agreement defines its own NDCs to reduce GHG emissions. While NDCs reflect Parties’
‘highest possible ambition’, they also reflect their ‘common but differentiated
responsibilities and respective capabilities in the light of different national
circumstances’. This means that the global response to the climate challenge will
inevitably differ between the Parties in the short and medium term perspectives.
However, this does not mean that these differentiated approaches should be an obstacle
to each Party’s achievement of its own objectives. As pricing carbon emissions is a key
instrument to reach emission reductions in a cost-effective way, global cooperation
aiming at agreements on such mechanisms could serve as a powerful tool in the fight
against climate change. Such agreements would also level the global playing field and
reduce potential negative effects following from differences in compliance costs across
the economies of different Parties.
2.3.2 Increased EU climate ambition
The EU is increasing its climate ambition consistently with the goal of reaching climate
neutrality by 2050, in accordance with its commitment to the Paris Agreement. This is
the key climate target set by the European Green Deal. In the process of achieving this
target, intermediate goals for 2030 have been proposed to reflect the increased
ambition26
. On 11 December 2020, the European Council raised the EU target for 2030
25
SWD/2020/0194 final - Evaluation accompanying the document Impact assessment on Guidelines on
certain State aid measures in the context of the system for greenhouse gas emission allowance trading post
2021. 26
European Commission. (2020). Amended proposal for a Regulation of the European Parliament and of
the Council on establishing the framework for achieving climate neutrality and amending Regulation (EU)
2018/1999 (European Climate Law). (COM(2020) 563 final), p. 1.
11
from 40 % to 55 %27
compared to 1990 and this new target was communicated to the
UNFCCC as the EU’s NDCs under the Paris Agreement. This new target will put the EU
on a path to climate neutrality. Higher emissions reduction targets require revisions of
existing climate policy instruments to achieve the new objectives.
2.3.3 Review of existing carbon leakage protection mechanisms
In order to achieve these targets, the EU considers the pricing of GHG emissions as an
important instrument of a cost-effective policy package to support the transformation of
industries towards climate neutrality. Since 2005, direct GHG emissions of industrial
installations and the power sectors are priced in the EU ETS. The risk of carbon leakage
has been effectively addressed for those sectors regulated under the EU ETS that are
exposed to the risk of carbon leakage. This was done by granting free emissions
allowances up to 100 % of determined benchmarks representing the average emissions
per unit of the relevant product of the best 10 % producers in the EU. The EU ETS
Directive provides for this system to continue at least until 203028
. Free allocation of
allowances is an effective tool to address the risk of carbon leakage; however, it has two
principal drawbacks: first it is a costly measure29
, second it limits the carbon price signal
for industry and hence the incentive to decarbonise. In addition, in the context of the
EU’s higher 2030 target and objective to become carbon neutral by 2050, the level of
free allowances available will decline further as a function of the overall declining EU
ETS cap. Moreover, since the carbon price is passed on in electricity prices and as such
on to consumers, possibly becoming an indirect driver of carbon leakage for some
energy-intensive sectors, Member States have the possibility to compensate some electro-
intensive industries for the increase in electricity prices resulting from the EU ETS,
provided they comply with EU state aid rules.
2.4 How will the problem evolve?
2.4.1 Carbon leakage in view of the evolution of leakage protection in the EU
The EU’s leadership in reducing its GHG emissions may result in higher carbon cost
differences with its trading partners. This increases the risk of carbon leakage.
As discussed in the previous section, the current approach to addressing the risk of
carbon leakage relies on free allocation of allowances, and in some cases financial
measures to compensate for the carbon cost of indirect emissions to operators of
installations from sectors and sub-sectors at a significant risk of carbon leakage. For that
purpose, the EU has established a list of such sectors and sub-sectors30
. This means that
there are currently mechanisms in place to address the risk of carbon leakage in these
sectors.
27
European Council. (2020). European Council Conclusions of December 2020. (EUCO 22/20 CO EUR
17 CONCL 8). 28
Directive (EU) 2018/410 of the European Parliament and of the Council of 14 March 2018
amending Directive 2003/87/EC to enhance cost-effective emission reductions and low-carbon
investments, and Decision (EU) 2015/1814, OJ L 76, 19.3.2018, pp. 3-37. 29
In 2020, 724 million allowances were allocated for free.- Report from the Commission to the European
Parliament and the Council on the functioning of the European carbon market (COM 2020(740) Final) 30
Commission Delegated Decision (EU) 2019/708 of 15 February 2019 supplementing Directive
2003/87/EC of the European Parliament and of the Council concerning the determination of sectors and
subsectors deemed at risk of carbon leakage for the period 2021 to 2030, OJ L 120/20, 8.5.2019, pp. 20-26.
12
However, two already ongoing developments may reduce leakage protection. First, as
laid out in the intervention logic, the increasingly ambitious GHG emissions reduction
targets should reduce the overall number of allowances. This may lead to a higher carbon
price in the EU ETS, which in turn creates an even larger difference to countries without
carbon pricing mechanisms. Second, the cap on emissions and therefore the total amount
of allowances will be reduced to meet new targets under the increased ambition. This
means that free allocation will also decline over time and therefore carbon costs should
increase for industrial installations, which may lead to an increase in the risk of carbon
leakage.
Therefore, domestic industries may face higher production costs compared to
international producers. In the absence of action, businesses could transfer their
production to countries with laxer emission constraints, thus increasing GHG emissions
in third countries, or import more as carbon-intensive products of EU firms are being
replaced by carbon-intensive imported products from non-EU firms. The effectiveness of
the EU’s climate policies could thus be undermined and the ultimate outcome could then
be no effect or even an increase in global emissions.
The above is also reflected in the views of stakeholders, as recorded in the CBAM public
consultation. On the whole, stakeholders participating in the consultation believe that
carbon leakage is already a reality and, to some extent, that the CBAM can address
carbon leakage, foster consumption of the less-carbon intensive product in the EU and
stimulate the deployment of low-carbon technologies and ambitious climate policies in
third countries. They have a mixed opinion on the effectiveness of current measures in
the context of the EU ETS and state aid rules to limit carbon leakage and on the ability of
other regulatory measures (e.g. performance standards for products placed on the EU
market) to effectively reduce greenhouse gas emissions. The analysis of the CBAM
public consultation results by geographic area indicates that respondents from bordering
countries are relatively more convinced that current mitigation measures for carbon
leakage in the context of the EU ETS are effective and will also stay effective in the
future. By contrast, stakeholders based in other non-EU countries are relatively more
sceptical about the current measures to address the risk of carbon leakage and more
convinced about the effectiveness of an EU CBAM.
2.4.2 Interdependence of the CBAM and the EU ETS revision in the context of problem
evolution
In the context of the ‘Fit for 55 Package’ the CBAM is not a self-standing measure. It is a
support measure aiming at enabling the climate ambition of the EU. Under the
assumptions of this impact assessment, the CBAM would be complementary to the EU
ETS, with a view to addressing the risk of carbon leakage and reinforcing the EU ETS
itself. There is a strong interdependence between the revision of the EU ETS and the
possible introduction of a CBAM. Indeed, in case a CBAM is introduced it will have an
effect on the share between auctioning and free allocation in the ETS.
Since phase 3 of the EU ETS, auctioning is the default approach to allocating allowances
and free allocation remains as a transitional derogation aiming at addressing the risk of
carbon leakage. Under phase 4, 43 % of allowances are still allocated for free. This
illustrates the size of the derogation, which is reflected in the ETS impact assessment
13
quoting the European Court of Auditors report on the ETS31
, whereby 94 % of the
emissions from industry come from sectors considered at risk of carbon leakage. The
ETS impact assessment presents approaches to better target free allocation, either to
sectors where the risk of carbon leakage is the highest or by reinforcing benchmarks. The
CBAM, as an alternative to free allocation, builds on the ETS logic that auctioning is the
default ETS approach, starting with sectors where emissions are the highest and therefore
where it would matter most. The criteria used in the CBAM impact assessment to select
sectors to which the CBAM should apply are aligned to the criteria used to better target
free allowances. Notwithstanding the above, the EU has set itself the very ambitious goal
of becoming climate neutral by 2050 and of reducing its emissions by 55 % by 2030.
This will necessarily have an impact on the availably of free allowances and will require
increasing the effectiveness of all instruments aiming at reducing greenhouse gas
emissions.
It is in this context of a phase-out of the current measures to avoid carbon leakage that
the CBAM becomes a necessary tool to mitigate the risk of carbon leakage as long as
third countries do not share the same level of ambition, or in other words that they do not
have a similar carbon price in place. The question is not whether one measure or the
other is more effective to deal with the risk of carbon leakage but whether the CBAM
will be an effective tool in a new scenario without the current measures. However, as also
stated in the ETS revision impact assessment, the CBAM and options presented in the
ETS revision impact assessment are complementary.
3 WHY SHOULD THE EU ACT?
3.1 Legal basis
The Treaty on the Functioning of the European Union (‘TFEU’) confers to the European
institutions the competence to lay down appropriate provisions intended, inter alia, to
preserve and protect the environment (Article 192(1) TFEU), including, in particular,
measures combating climate change at global level.
Appropriate provisions of fiscal nature intended for environmental purposes can be
adopted by the EU according to Article 192(2), first paragraph, of the TFEU.
Article 113 of the TFEU permits the EU to lay down harmonised rules in order to ensure
the proper functioning of the internal market.
Depending on the nature of the instrument proposed the legal basis may be Article 192 or
Article 113 of the TFEU.
3.2 Subsidiarity: Necessity of EU action
Reducing GHG emissions is fundamentally a trans-boundary issue that requires effective
action at the largest possible scale. The EU as a supranational organisation is well-placed
to establish effective climate policy in the EU, like it has done with the EU ETS.
31
European Court of Auditors, the EU’s Emission Trading System: free allocation of allowances need
better targeting, 2020.
14
There exists already a harmonised carbon price at EU level. This consists of the price
resulting from the EU ETS for the sectors covered by the system32
. These sectors are
energy-intensive and subject to international competition. In order to ensure a well-
functioning single market when the EU increases its climate ambition, it is essential that
a level playing field is created for the relevant sectors in the internal market. The single
effective way to do this is by taking action at the level of the EU. Any initiative needs to
be implemented in a way that provides importers, regardless of country of origin and port
of entry or destination within the EU, with uniform conditions and incentives for carbon
emission reductions that are equivalent to those of domestic producers.
The only meaningful way to ensure equivalence between the carbon pricing policy
applied in the EU’s internal market and the carbon pricing policy applied on imports is to
take action at the level of the Union.
3.3 Subsidiarity: Added value of EU action
In parallel to the EU ETS, reduction of GHG emissions and protection against the risk of
carbon leakage in the EU single market can be established most adequately at the EU
level. Additionally, the need for minimal administrative costs is best achieved by
establishing consistent rules for the entire single market, further underlining the added
value of an intervention at the EU level.
Moreover, as the CBAM is inherently a border measure there is a clear added value in
placing the intervention at EU level in view of the fact that external trade is an exclusive
competence of the EU. At the same time, as the CBAM also needs to be implemented
consistently in the EU market and in view of its close links to the EU ETS there is further
justification of intervention at EU level. The public consultation has confirmed the added
value of taking action on the CBAM at EU level. In particular, stakeholders agree that a
CBAM is needed due to existing differences of ambition between the EU and the rest of
the world and in order to support the global climate efforts. In addition, in view of the
EU’s position in international trade, if it introduces a CBAM the environmental effect on
international climate ambitions will be most effective as a potential example to follow.
Thus, the objective of reducing emissions and climate neutrality requires – without
equally ambitious global policies by third countries – action by the European Union.
4 OBJECTIVES: WHAT IS TO BE ACHIEVED?
4.1 General objectives
Considering the problems described above, a CBAM has the overarching objective of
addressing the risk of carbon leakage in order to fight climate change by reducing GHG
emissions in the EU and globally.
4.2 Specific objectives
The overarching objective of addressing climate change is further articulated in a number
of specific objectives, namely:
32
Directive (EU) 2018/410 of the European Parliament and of the Council of 14 March 2018 amending
Directive 2003/87/EC to enhance cost-effective emission reductions and low-carbon investments, and
Decision (EU) 2015/1814, OJ L 76, 19.3.2018, pp. 3-37.
15
– Addressing the risk of carbon leakage under increased EU ambition, which would
ensure that EU climate policies, as translated in the carbon price of the EU ETS,
can be fully effective without resulting in increasing emissions abroad, which
would undermine climate mitigation efforts. The applied carbon price reflects the
polluter-pays-principle33
and supports the reduction of GHG emissions from
industry through the internalisation of external costs from GHG emissions that is
achieved by the carbon price;
– Contributing to the provision of a stable and secure policy framework for
investments in low or zero carbon technologies;
– Ensuring that domestic production and imports are subject to similar level of
carbon pricing;
– Encouraging producers in third countries who export to the EU to adopt low
carbon technologies.
– Minimising the risk of the measure being circumvented, thus providing
environmental integrity;
4.3 Ancillary effects
The CBAM, as envisaged by the above-mentioned objectives, may also give rise to a
number of secondary and ancillary positive effects. These refer to the relevance of the
CBAM as a climate tool to push third countries to adopt more stringent climate
measures, as well as to the possibility to obtain revenues from the introduction of the
measure. Specifically the ancillary positive effects of the CBAM include:
– Strengthening the joint climate action needed by all the Parties of the Paris
Agreement to meet the goal of holding the increase in the global average
temperature to well below 2 °C above pre-industrial levels and pursuing efforts to
limit the temperature increase to 1.5 °C above pre-industrial levels;
– While not introduced with revenue raising as its purpose and it not playing a role
in the design of the measure, the CBAM will raise revenue on GHG emissions at
the border. This is acknowledged in the Interinstitutional agreement including the
CBAM in the list of future own resources in the context of NextGenerationEU34
.
The introduction of a CBAM would also incentivise key trading partners to
consider the revenue generation dimension of carbon pricing policies.
5 WHAT ARE THE AVAILABLE POLICY OPTIONS?
5.1 What is the baseline from which options are assessed?
The basis against which the different CBAM options are analysed in this impact
assessment reflects the dynamic framework against which the CBAM is proposed. In
particular, it aims at capturing the fact that the measure is put forward in the context of
existing climate legislation that implements the ‘at least 40 % GHG emission reduction
33
Article 191(2) TFEU – e.g. a principle of EU legislation. 34
See Interinstitutional agreement between the European Parliament, the Council of the European Union
and the European Commission on budgetary discipline, on cooperation in budgetary matters and on sound
financial management, as well as on new own resources, including a roadmap towards the introduction of
new own resources, adopted on 16 December 2020; European Council. (2020). Multiannual Financial
Framework 2021-2027 and NextGenerationEU. https://www.consilium.europa.eu/en/press/press-
releases/2020/12/17/multiannual-financial-framework-for-2021-2027-adopted/

16
target’ by 2030, but also against the new agreed upon EU target of reducing GHG
emissions by at least 55 %, and an evolving policy framework to implement the latter,
which at the time of preparing this impact assessment is under consideration within the
‘Fit for 55 Package’.
Calibrating the analysis and modelling of the CBAM, to account for the above
considerations necessitates a stepwise approach. This first involves setting the
foundations based on the current policy framework, and second an additional
counterfactual based on the new agreed climate targets for 2030 - the latter balanced to
account for policies that are under an ongoing assessment and which will, in turn, have
an impact on the specific objective of the CBAM, namely to address the risk of carbon
leakage.
The first step therefore involves setting the baseline of this assessment consistently with
all other exercises under the ‘Fit for 55 Package’. This consists of the EU Reference
Scenario 2020 (‘REF’), the main elements of which are depicted in Annex of the impact
assessment for the revision of EU ETS Directive.
The baseline as reflected in the REF assumes the continuation of free allocation of
allowances to operators of installations from sectors and sub-sectors at a significant risk
of carbon leakage. At the same time, the baseline includes current climate and energy
legislation that implements the ‘at least 40 % GHG emission reduction target’, notably
the revised EU ETS Directive which regulates GHG emissions mainly from the power
and industry sectors plus aviation, the Effort Sharing Regulation that sets national targets
for emissions outside of the EU ETS and the Regulation on the inclusion of GHG
emissions and removals from land use, land use change and forestry (‘LULUCF’). With
regard energy, the baseline includes the Energy Efficiency Directive and the Renewable
Energy Directive, as well as other key policies covered in the Energy Union and the
‘Clean Energy for All Europeans’ package, including the internal electricity market
policy.
The second step involves a counterfactual to account for the raising of EU ambition and
thereby the motivation for the CBAM itself. Under this counterfactual, emission
allowances under the EU ETS will be reduced in the coming years, to achieve an overall
reduction of at least 55 % by 2030 and beyond, so as to ensure a balanced pathway to
reaching climate neutrality by 2050. In the modelling, this result is achieved, until 2030,
through a mix of measures consisting of both an expansion in carbon pricing, be it via
EU ETS or other instruments, to the transport and buildings sectors and a moderate
ambition in regulatory-based measures including energy efficiency, renewables and
transport policies. For the purposes of modelling the impacts of alternative CBAM
options, this counterfactual is based on the MIX scenario as depicted in the impact
assessment for the revision of EU ETS Directive.
Under the MIX scenario the free allowances to industry at risk of carbon leakage
continues as the main instrument to address this risk. As such, free allowances are
assumed to cover 100 % of emissions at benchmark level of the industries in question. In
modelling terms, this results in the MIX scenario keeping carbon leakage at a relatively
low level35
. In view of this, the third step of the analysis involves a variant to the
counterfactual, which allows for the disentangling of impacts. Specifically a variant of
35
Except energy leakage as discussed below.
17
the MIX is also modelled depicting the case of complete removal of free allowances in
the CBAM sectors36
, in the absence of a CBAM.
This full auctioning variant of the MIX serves as an additional reference point to
compare different leakage protection options under the CBAM. The motivation of this
derives from the fact that under the European Green Deal free allocation in the CBAM
sectors and a CBAM at the border are clear alternatives. The impact assessment of the
EU ETS extension does not include any scenario in which free allocation is phased-out
by 2030. Therefore, it would not be possible to assess with fairness any of the CBAM
options if the case of full auctioning in the absence of a CBAM was not also presented
for comparative purposes.
5.2 Description of the policy options
5.2.1 Design elements common to all options
This sub-section outlines certain design elements which are common to all of the policy
options and are applied in a similar manner across the options. In identifying the options,
account has been taken of WTO requirements and of the EU’s international commitments
such as free trade agreements concluded by the EU or the Energy Community Treaty. It
should also be noted that a number of notions are used in the analysis below which call
for specified definitions which can be found in Annex 5.
5.2.1.1 Scope of emissions
The emissions to be covered by the CBAM should correspond to those covered by the
EU ETS Directive37
, namely carbon dioxide (CO2) as well as, where relevant, nitrous
oxide (N2O) and perfluorocarbons (PFCs). Regarding the scope of those emissions,
different possibilities can be envisaged:
– Direct emissions are emissions taking place as part of a production process on
which the producer has direct control. These include emissions from heating and
cooling.
– Indirect emissions refer to emissions from the production of electricity which is
consumed in a certain production process.
– Full carbon footprint (often termed a ‘cradle to grave’ approach) includes all
GHG emissions relating to the mining of raw materials, all emissions from the
production of materials and components needed for manufacture of the product,
the emissions caused by the production process, including emissions from
providing the necessary energy, emissions from the transport of raw materials and
interim products to the site of the production process and of the product to the
consumer, emissions caused during the use phase and emissions related to the
disposal / end-of-life phase of the product.
As an instrument to prevent carbon leakage, the CBAM seeks to ensure that imported
products are subject to a carbon price equivalent to the one they would have paid under
the EU ETS, had they been produced in the EU. In the EU, the EU ETS applies to the
36
By CBAM sectors the analysis considers the sectors where CBAM is considered possible alternative to
free allocation of allowances under the EU ETS. 37
Annex 2 of Directive 2003/87/EC of the European Parliament and of the Council of 13 October 2003
establishing a scheme for greenhouse gas emission allowance trading within the Community and amending
Council Directive 96/61/EC (OJ L 275, 25.10.2003, p. 32).
18
direct emissions of installations where carbon intensive products are produced. The EU
ETS also applies to the production of electricity that may be used in the production
process. Conversely, the EU ETS does not apply to mining activities in the EU38
, neither
does it, for now, directly apply to transport39
in the EU other than air transport. While the
EU ETS may apply to certain activities related to the disposal and recycling of products,
this is not related to whether these products are produced in the EU or imported.
Therefore, the most appropriate scope when the CBAM is applied in the EU is to include
direct emissions from the production of basic materials and basic material products up to
the time of import, as well as related indirect emissions when they are significant. A
threshold will have to be defined to determine when indirect emissions constitute an
important part of an imported product’s embedded emissions in order to limit the
administrative burden. This is the approach that will be followed in most CBAM options.
In the longer term, when the material scope of the CBAM would be extended, as more
information will be easily available on the carbon content of products and as carbon
pricing policies of different countries may become more easily comparable, an extension
of the carbon emission scope to cover the full carbon footprint of imported products may
be considered.
Such a possible future extension would also be of relevance to transport emissions as the
EU ETS may be extended to transport. Indeed, emissions resulting from transport may be
significant for imported goods and are certainly a relevant issue in the fight against
climate change. However, as long as emissions from transport are not included in the
scope of the EU ETS, it would be complicated to include them in the scope of the
CBAM. As the ETS revision impact assessment foresees such extension40
, there is a case
for including transport emissions in the CBAM. This could be done when the CBAM
will be revised. Respondents to the Open Public Consultation somewhat agree that the
CBAM should cover direct emissions and indirect emissions from electricity used in the
production process, emissions recorded in all links of the value chains and emissions
from international transport of goods. Conversely, they somewhat disagree that the
CBAM should differentiate the treatment of imports of finished products, intermediate
products and primary inputs.
5.2.1.2 Measuring the carbon content
The carbon content of products is an essential element of the CBAM as it indicates the
GHG emissions released during the production of the materials produced abroad. This is
used to ensure that imported products are treated no less favourably than domestic
products produced in EU ETS installations. The carbon content of products will be
multiplied by the reference carbon price for determining the obligation to be paid under
the CBAM.
Carbon content does not refer to carbon physically contained in a product in any
chemical state, but rather to the GHG emissions released during the production of the
material or product subject to the CBAM, or indirectly during the production of
electricity used in the process. A carbon content is usually expressed with respect to the
corresponding scope of emissions, products and sectors.
38
Unless the mining includes combustion units with a total rated thermal input of more than 20 MW. 39
The impact assessment on the revision of the EU ETS Directive considers the possible extension of the
EU ETS to transport and buildings. 40
Specifically under policy options EXT1 and EXT2

19
As installations covered by the EU ETS are subject to a carbon price assessed on their
actual emissions, imported products in the scope of CBAM may also be assessed based
on their actual GHG emissions. Such an approach offers advantages relating to a fair and
equal treatment and would also serve well to give incentives to foreign producers to
develop low-carbon production. Furthermore, requesting to document the carbon content
of all imports could serve well to fulfil the aim to closely mimic the functioning of the
EU ETS. It may, however, also entail a significant administrative burden for importers.
To limit this, a default value representing the emissions of imported products may be
established with the possibility for the importer to demonstrate that its products were
produced with actual emissions lower than the default value, and therefore be subject to a
lower adjustment. Both approaches will be explored in this impact assessment.
For options where imported products in the scope of the CBAM are to be assessed based
on actual GHG emissions, there would still be a need to set objectively determined
default values to be used in situations when sufficient data to determine the actual GHG
emissions are not available. This could be the case when importers cannot provide actual
emission data or when the CBAM monitoring and verification of those given are not
considered to fulfil laid down criteria.
For options where the default value is predominantly used, the level of this default value
for each covered sector/product will have to be set taking into account the level of
emissions attributable to a given sector in the EU, comparing it to the emissions of this
sector outside of the EU. In addition, the higher the default value will be set, the more
claims for individual treatment there may be, generating an additional administrative
burden. This latter element also needs to be taken into account in setting the level of the
default values.
The level of the default values may be defined as dynamic values, for example taking the
EU average or median per sector as a reference. Alternatively, it could be a fixed value
subject to revision after a defined number of years41
.
Both default values and actual emissions must be calculated on the basis of robust
Monitoring, Reporting and Verification (MRV) procedures. These can be based on major
elements of existing EU ETS mechanisms such as the Monitoring and Reporting
Regulation42
, Free Allocation Rules Regulation43
and Allocation Level Change
Regulation44
of the EU ETS, and complemented by further data requirements.
The reference flow/declared unit for the calculation of the carbon content should be the
unit of weight (e.g., tonne CO2eq/tonne material45
), specific per production site. Once the
41
Under the EU ETS values are recalculated every 5 years. 42
Commission Implementing Regulation (EU) 2018/2066 of 19 December 2018 on the monitoring and
reporting of greenhouse gas emissions pursuant to Directive 2003/87/EC of the European Parliament and
of the Council and amending Commission Regulation (EU) No 601/2012 (OJ L 334, 31.12.2018, pp. 1–
93). 43
Commission Implementing Regulation (EU) 2018/2067 of 19 December 2018 on the verification of data
and on the accreditation of verifiers pursuant to Directive 2003/87/EC of the European Parliament and of
the Council (OJ L 334, 31.12.2018, pp. 94–134). 44
Commission Implementing Regulation (EU) 2019/1842 of 31 October 2019 laying down rules for the
application of Directive 2003/87/EC of the European Parliament and of the Council as regards further
arrangements for the adjustments to free allocation of emission allowances due to activity level changes
(OJ L 282, 4.11.2019, p. 20–24). 45
Except in the case of electricity where different specifications apply.
20
digital product passport announced in the Circular economy action plan will have
become operational46
, the information could be specific to the produced consignment. In
the meantime, it could be acceptable to declare the yearly average carbon content.
It may be necessary to develop sectoral rules (for the sectors in the scope of the CBAM)
detailing how to calculate both direct and indirect emissions. These rules could be
developed following the approach already used for PEF Category Rules and international
standards on carbon footprint47
, focusing on the production steps in scope. For direct
emissions, the calculation should follow the principles of the EU ETS calculation rules.
For indirect emissions (related to electricity use), the approach may build on PEF rules.
The existing rules cover both the use of electricity from the grid and from specific
producers, as well as the production of own electricity (including through Guarantees of
Origin certificates). The sectoral rules would also include the verification procedure to be
followed.
The above considerations highlight the underlying compromises inherent in the design of
the CBAM. Determining the CBAM obligation based on actual GHG emissions could
more closely reflect the functioning of the EU ETS, but would involve higher
administrative costs. Methods need to be developed and communicated to traders, while
the costs associated with the management of the system are higher. In addition, verifiers
in third countries may be limited in number in the short term and this could create
bottlenecks for the verification of emission in these countries, which would have
consequences on the functioning of the system. Default values would allow for
determining the CBAM debt based on the volume of product imported according to an
average of emissions in the EU. Considering that the average carbon intensity outside the
EU is higher, most importers would accept these estimations, which would reduce costs
upon them but also upon the EU. In any case, importers would still have the possibility to
claim that the emissions embedded in their products are below the default value, however
the burden to prove it could be placed on them.
5.2.1.3 Sectors
The specification of the CBAM’s sectoral scope will be central to its effective
implementation. The methodological approach to the specification of this sectoral
coverage should not differ between the different options considered. In this respect, the
measure may be understood as sector-neutral in its design – allowing for its potential
extension to further sectors and products in the future. However, as discussed later, it is
also recognised that some of the design options would allow the measure to move further
down the value chain. Reaching further downstream of the supply chain may help
mitigating certain weaknesses of some CBAM options, such as the risk of substitution of
domestic products by imports downstream of the supply chain. In the modelling exercise,
variants of the main options considered allow for exploring this effect.
The focus of the measure is on basic materials and basic material products48
. The choice
of the CBAM’s coverage is framed by the sectors and emissions covered by the EU ETS.
46
See: https://ec.europa.eu/environment/circular-economy/pdf/new_circular_economy_action_plan.pdf 47
ISO 14067:2018, Greenhouse gases – Carbon footprint of products – Requirements and guidelines for
quantification. 48
Basic materials refer to materials that are either a (technically pure) substance or a mixture of substances
in a physical form that can be sold, which has been derived from raw materials in an industrial process,
during which their chemical composition is modified. By contrast basic material products are formed
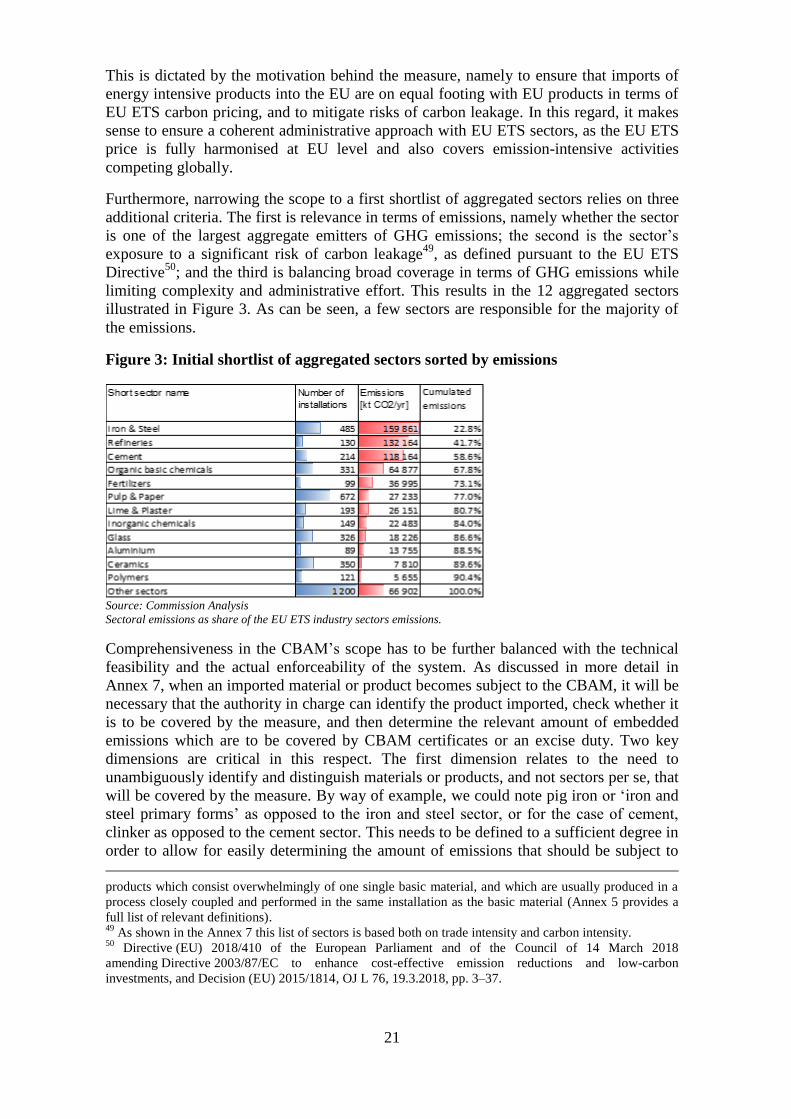
21
This is dictated by the motivation behind the measure, namely to ensure that imports of
energy intensive products into the EU are on equal footing with EU products in terms of
EU ETS carbon pricing, and to mitigate risks of carbon leakage. In this regard, it makes
sense to ensure a coherent administrative approach with EU ETS sectors, as the EU ETS
price is fully harmonised at EU level and also covers emission-intensive activities
competing globally.
Furthermore, narrowing the scope to a first shortlist of aggregated sectors relies on three
additional criteria. The first is relevance in terms of emissions, namely whether the sector
is one of the largest aggregate emitters of GHG emissions; the second is the sector’s
exposure to a significant risk of carbon leakage49
, as defined pursuant to the EU ETS
Directive50
; and the third is balancing broad coverage in terms of GHG emissions while
limiting complexity and administrative effort. This results in the 12 aggregated sectors
illustrated in Figure 3. As can be seen, a few sectors are responsible for the majority of
the emissions.
Figure 3: Initial shortlist of aggregated sectors sorted by emissions
Source: Commission Analysis
Sectoral emissions as share of the EU ETS industry sectors emissions.
Comprehensiveness in the CBAM’s scope has to be further balanced with the technical
feasibility and the actual enforceability of the system. As discussed in more detail in
Annex 7, when an imported material or product becomes subject to the CBAM, it will be
necessary that the authority in charge can identify the product imported, check whether it
is to be covered by the measure, and then determine the relevant amount of embedded
emissions which are to be covered by CBAM certificates or an excise duty. Two key
dimensions are critical in this respect. The first dimension relates to the need to
unambiguously identify and distinguish materials or products, and not sectors per se, that
will be covered by the measure. By way of example, we could note pig iron or ‘iron and
steel primary forms’ as opposed to the iron and steel sector, or for the case of cement,
clinker as opposed to the cement sector. This needs to be defined to a sufficient degree in
order to allow for easily determining the amount of emissions that should be subject to
products which consist overwhelmingly of one single basic material, and which are usually produced in a
process closely coupled and performed in the same installation as the basic material (Annex 5 provides a
full list of relevant definitions). 49
As shown in the Annex 7 this list of sectors is based both on trade intensity and carbon intensity. 50
Directive (EU) 2018/410 of the European Parliament and of the Council of 14 March 2018
amending Directive 2003/87/EC to enhance cost-effective emission reductions and low-carbon
investments, and Decision (EU) 2015/1814, OJ L 76, 19.3.2018, pp. 3–37.

22
the CBAM when goods enter in the EU. The second dimension relates to whether
materials or products can be sufficiently identified in practice to make the CBAM
enforceable. This means that for the effective application of the CBAM, it will be critical
that a product or material is unambiguously linkable to its definition and that sufficient
information is available to determine its reference values of embedded emissions. For
example, ‘clinker’ under the cement could be linked to the EU ETS benchmark of grey
cement clinker and, based on good availability of data, allow for the calculation of
embedded emissions based on clinker. These benchmarks could then be linked to specific
imported products determined at Combined Nomenclature (CN) codes level such as
cement clinkers (2523 10 00) and Portland cement (2523 29 00), cement, whether or not
coloured (2523 90 00).
Once products or materials are defined and it is ensured that they can be identified, the
next critical step involves the ability to define reference levels for the embedded
emissions of materials and products. The feasibility to define reference values for the
embedded emissions is indeed the decisive argument for a product or material’s inclusion
in the CBAM. Without such reference values it is impossible to calculate the CBAM
obligation to be paid upon import. Some high-emission industrial processes such as those
of refineries produce several products simultaneously. For such processes, in order to
define reference values that may be used for output products, a decision would first have
to be made on how to attribute the emissions of the industrial process to the different
output products. For this reason these products are not considered for the first stage of the
CBAM.
These considerations and key steps in assessing the feasibility of different sectors are
discussed in greater detail in Annex 7. On the basis of this, a possible initial shortlist of
materials and material products scope of the CBAM is presented below. Based on the
criteria set out above, in particular their carbon intensity, their trade intensity and the
availability of necessary reference data to apply a CBAM, the list includes specified
basic materials of the sectors of cement, iron & steel, aluminium and fertilisers. As noted
earlier, in the future and conditional on whether data requirements for determining
embedded emissions can be satisfied, further products in these sectors as well as other
sectors at risk of carbon leakage could be covered by the measure.
In addition, electricity generation may also be a relevant sector to include in our analysis,
although for different reasons. Electricity generation is the most important sector
included in the EU ETS in terms of direct carbon emissions, and is also the largest sector
responsible for carbon emissions in the wider economy. Additionally, electricity
generators in principle do not receive free allowances, but have to buy them via auctions
or on the secondary market. This distinguishes them from other EU ETS participants
whose exposure to the risks of carbon leakage are currently mitigated with the allocation
of free allowances. Finally, the infrastructure to exchange electricity with partner
countries outside of the EU has been expanding over the past years, and this trend is
expected to continue. Due to these physical characteristics and organisational aspects of
the electricity market, the approach to electricity generation and trade differs from the
approach proposed for material products. More details on this approach are given in
Annex 8.
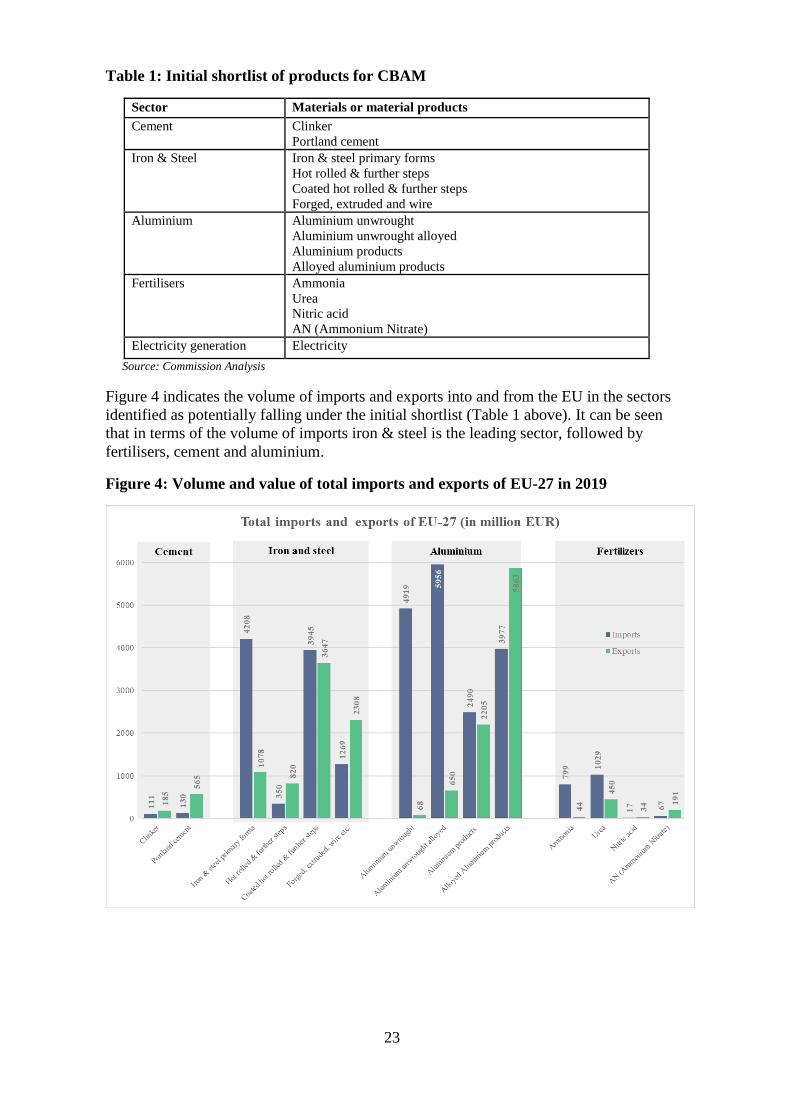
23
Table 1: Initial shortlist of products for CBAM
Sector Materials or material products
Cement Clinker
Portland cement
Iron & Steel Iron & steel primary forms
Hot rolled & further steps
Coated hot rolled & further steps
Forged, extruded and wire
Aluminium Aluminium unwrought
Aluminium unwrought alloyed
Aluminium products
Alloyed aluminium products
Fertilisers Ammonia
Urea
Nitric acid
AN (Ammonium Nitrate)
Electricity generation Electricity
Source: Commission Analysis
Figure 4 indicates the volume of imports and exports into and from the EU in the sectors
identified as potentially falling under the initial shortlist (Table 1 above). It can be seen
that in terms of the volume of imports iron & steel is the leading sector, followed by
fertilisers, cement and aluminium.
Figure 4: Volume and value of total imports and exports of EU-27 in 2019
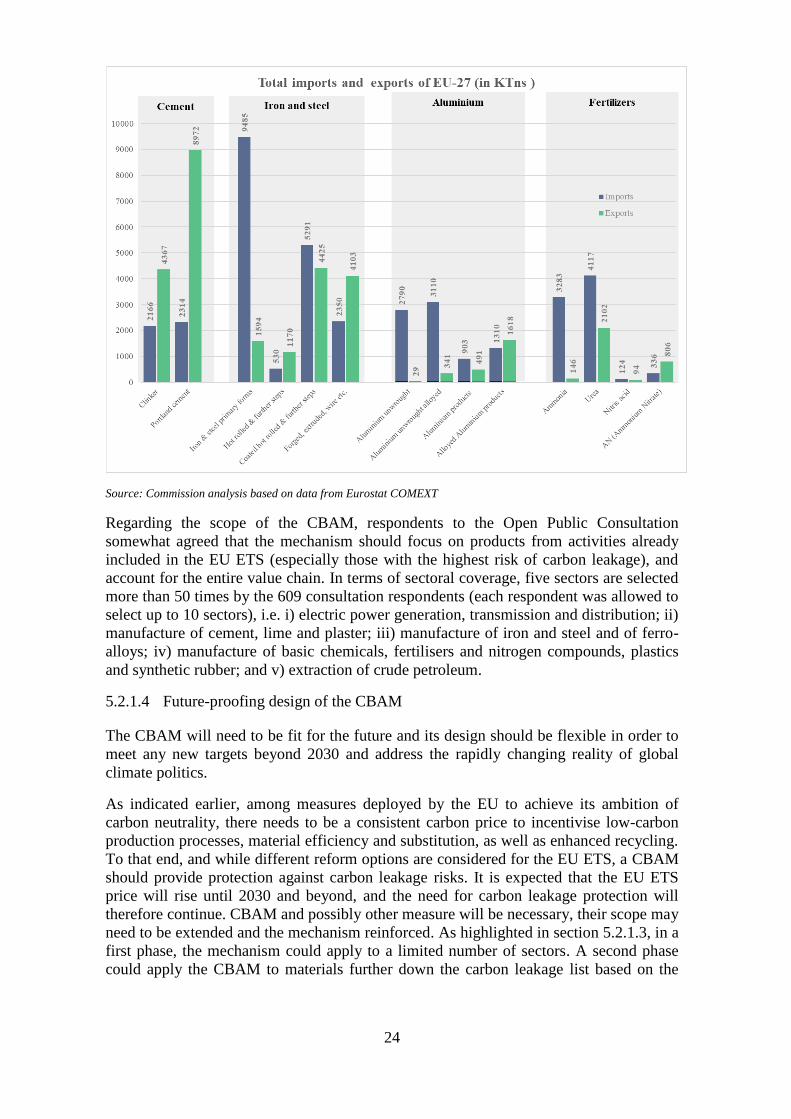
24
Source: Commission analysis based on data from Eurostat COMEXT
Regarding the scope of the CBAM, respondents to the Open Public Consultation
somewhat agreed that the mechanism should focus on products from activities already
included in the EU ETS (especially those with the highest risk of carbon leakage), and
account for the entire value chain. In terms of sectoral coverage, five sectors are selected
more than 50 times by the 609 consultation respondents (each respondent was allowed to
select up to 10 sectors), i.e. i) electric power generation, transmission and distribution; ii)
manufacture of cement, lime and plaster; iii) manufacture of iron and steel and of ferro-
alloys; iv) manufacture of basic chemicals, fertilisers and nitrogen compounds, plastics
and synthetic rubber; and v) extraction of crude petroleum.
5.2.1.4 Future-proofing design of the CBAM
The CBAM will need to be fit for the future and its design should be flexible in order to
meet any new targets beyond 2030 and address the rapidly changing reality of global
climate politics.
As indicated earlier, among measures deployed by the EU to achieve its ambition of
carbon neutrality, there needs to be a consistent carbon price to incentivise low-carbon
production processes, material efficiency and substitution, as well as enhanced recycling.
To that end, and while different reform options are considered for the EU ETS, a CBAM
should provide protection against carbon leakage risks. It is expected that the EU ETS
price will rise until 2030 and beyond, and the need for carbon leakage protection will
therefore continue. CBAM and possibly other measure will be necessary, their scope may
need to be extended and the mechanism reinforced. As highlighted in section 5.2.1.3, in a
first phase, the mechanism could apply to a limited number of sectors. A second phase
could apply the CBAM to materials further down the carbon leakage list based on the
25
intensity of their carbon leakage indicator51
. This gradual approach could then cover the
entire list of sectors subject to carbon leakage.
Additionally, downstream products in the EU may also be or become at risk of carbon
leakage. For example, if the mechanism covers basic materials and basic material
products, then downstream domestic producers whose products are not included in the
scope (e.g. manufacturers of components and final products) would face higher input
costs irrespective of whether they source their (covered) material inputs domestically or
from abroad. If climate ambitions diverge, carbon leakage may move down the supply
chain, as final consumers may decide to source their purchase from abroad. To avoid this
risk of carbon leakage further down the value chain, a broad product coverage is being
considered in the design of the mechanism, which could foresee an extension to
downstream sectors. Some of the options considered envisage including downstream
sectors in the scope of the CBAM from the beginning. In the options where it is not the
case, extension to downstream sectors should be considered at a later stage as the use of
international standards on defining carbon footprint will pick up and data will become
more easily available for all sorts of products.
Extending the CBAM to downstream products faces the challenge of the complexity of
value chains and the varying possibilities on the transformation of the product in later
stages. Certain CBAM imports such as fertilisers and electricity may reach directly the
final consumer with limited transformation or added value. However, for other CBAM
materials such as steel and aluminium, as more manufacturing steps included
downstream and the final product becomes more complex, the content of the basic
material in it becomes diluted. It thus becomes difficult to monitor and verify, as well as
easier to circumvent through minor transformation. At the same time, the value added of
the basic material in the value of the imported product is also critical, as it would
determine the importance of transferring of carbon pricing downstream.
Addressing these challenge would raise two key considerations in practice. The first
relates to the number of production steps involved in the manufacturing of each product
that uses the CBAM basic material downstream. This would involve intermediate
products, which use more than one material or product but require more complex
manufacturing steps, and final products, which are made of components and further
materials and is ready for sales to end consumers. Tracing the CBAM basic material
downstream of these products would involve an analysis of the value chains to determine
a reasonable limit for the reach of the measure. The second consideration relates to the
value of carbon relative to value generation downstream. At lower CO2 prices during
initial phases, this may be negligible. However, at higher carbon prices in the future,
more complex products down the value chain may become relevant for the CBAM.
5.2.1.5 Reference carbon price
All options refer to a carbon price so as to align, to the extent possible, the price paid
under the CBAM with the price paid under the EU ETS. Under different policy options,
the actual reference carbon price may differ depending on the administrative feasibility
51
https://ec.europa.eu/clima/sites/default/files/events/docs/0127/6_cll-ei-ti_results_en.pdf see also EU ETS
revision impact assessment Table 58. Carbon leakage list 2021-2030 – Carbon leakage indicators of
selected sectors at risk of carbon leakage.
26
and specific design of each option. However, it should be noted that the starting point
would be the price of allowances in the EU ETS.
This reference carbon price may be:
– The average EU ETS allowance auctioning price over a given period (previous
year, quarter, month or week).
– The daily allowance price based on the previous day auctioning price of the EU
ETS.
5.2.1.6 Taking into account carbon pricing in third countries
In an ideal world, all countries would put in place the measures necessary to phase out
fossil fuels in a fair and effective manner. While the Paris Agreement sets a shared goal
of limiting global emissions in order to avoid a dangerous rise in global average
temperature, each Party sets its own nationally determined contribution to limit its
greenhouse gas emissions, reflecting its highest possible ambition.
The EU has set ambitious targets in line with preventing dangerous climate change, and
among other measures has put in place a carbon pricing system, through the EU ETS, to
achieve its targets in as cost effective manner as possible. However, in order to achieve
its targets, the EU must also ensure that its efforts at home do not lead to emissions
increases elsewhere through the risk of carbon leakage. A CBAM that ensures that
covered imported products bear a comparable carbon price to domestically produced
products will help manage that risk.
The CBAM as proposed would use the EU ETS price as the default value for comparing
and adjusting prices at the border. Importers would have the opportunity to claim that the
prevailing explicit carbon price in the country of production have addressed the risk of
carbon leakage, and hence that their CBAM obligation should be reduced by this amount.
The CBAM should favour global cooperation in fighting climate change, and it should
avoid situations of double carbon pricing by subjecting goods which have already paid a
carbon price outside the EU based on GHG emissions in third countries to the CBAM.
Therefore, the CBAM should be designed in such way that it takes into account climate
policies in the form of explicit carbon pricing policies in our trading partner countries.
While we recognise that reduction of GHG emissions by countries all over the globe is
pursued through regulations other than carbon pricing, due to the conceptual difficulties
in determining the equivalence between carbon pricing and non-price regulatory
measures, and the fact that, like the EU, most countries will have both pricing and non-
pricing approaches to reducing carbon emissions, the CBAM only focuses on carbon
pricing. In practice, this means through a cost under an emission trading scheme or by a
carbon tax, in both cases covering emissions having occurred during the production of
imported materials. A carbon tax can be designed to tax the carbon content of fuels used
or be more targeted at actual emissions occurring from the combustion of such fuels. In
either case, the tax amount paid does not relate to the produced material being exported
to the EU, and the tax would normally not be reimbursed upon export to the EU of the
produced material (being for example steel).
Taking into account the carbon price paid abroad can be done either at country level or at
transaction level for each individual consignment of imported materials. At country level,
exemptions from having the CBAM applying to imports from such countries could be
granted to countries who have in place a carbon pricing system that imposes a carbon
27
price at least equivalent to the price resulting from the EU ETS on products subject to the
CBAM. In practice, and in view of current carbon pricing policies around the world, such
an approach may be considered for countries with an ETS linked to the EU ETS (e.g.
Switzerland).
At transaction level, the CBAM should allow importers to claim that they have paid a
carbon price abroad on the GHG emissions embedded in the production of the goods they
import. This carbon price effectively paid abroad should be deducted from the amount
they would have to pay under CBAM52
.
It should be noted that the different CBAM options – outlined in section 6 below – will
entail different obligations with regards to third countries pricing measures. Regulation-
based options (‘Import certificates’) will require taking into account such measures,
while indirect taxation options (‘Excise Duty’) will not.
5.2.1.7 The CBAM applied to imports and free allowances in the EU ETS
The CBAM and free allowances are two mechanism that serve a similar purpose,
preventing the risk of carbon leakage. The two mechanisms cannot offer ‘double
protection’ and should not coexist in the long run as this would diminish the
environmental objectives of both EU ETS and the CBAM. In the options considered,
either the CBAM replaces free allowances at once or the CBAM is phased in as free
allowances are phased out during a limited transition period. For sectors not covered by
the CBAM, protection against carbon leakage would remain under the EU ETS
framework. For sectors covered by the CBAM, protection against carbon leakage would
come from the CBAM.
5.2.1.8 Reconciliation procedure
As indicated under section 5.2.1.2 ‘Measuring the carbon content’, imported products in
the scope of the CBAM could either be assessed based on their actual GHG emissions or
by using a default value representing the emissions of the imported products. In the case
of setting default values, importers will be given the option to claim that the emissions
resulting from the production of their imports are below the default value by providing
verifiable data as to their actual emissions. Furthermore, even in an option where
imported products are assessed based on actual GHG emissions, there would still be a
need to set objective default values to be used in situations where sufficient data to
determine the actual GHG emissions is not available.
Claims that actual GHG emissions are below the default value may, depending on the
actual administrative design chosen for the CBAM, be treated either when goods are
imported for each individual shipment or through an annual reconciliation procedure
inspired by the procedure in place in the context of the EU ETS.
5.2.1.9 Elements related to administrative design
There are essentially two main options in the institutional design necessary to support the
implementation and management of the CBAM. The first rests on a centralised system
52
Taking into account possible rebates or free allowances in third countries; In case the carbon price paid
abroad is higher than under the CBAM, such imports would be exempt from the obligation to surrender
CBAM certificates.
28
and consists of a CBAM authority at EU level. This could rely on an existing agency or a
Commission service. The second is a decentralised system resting on Member States’
national authorities, which could be the national climate authorities or any authority
specifically appointed for this task.
Overall, both approaches have their respective merits and drawbacks. A decentralised
approach could facilitate faster implementation, as it would not require the establishment
of new institutional structures. It would rest and build upon the competencies and tasks
of the Member States’ existing national climate authorities. However, it may entail a long
lead time to a fully harmonised implementation of the rules. Depending on the functions
foreseen for the registration of traders and foreign industrial installations, the assessment
and verification of declarations of actual emissions and the collection of the CBAM
obligation, coordination across 27 different national authorities could be difficult to
manage. Moreover, a decentralised approach could face difficulties in view of the rigidity
of the national systems and respective IT infrastructure needs. Potential changes and fine-
tuning would require changes across Member States which could increase costs both at
national and central levels.
A centralised approach would be based on a Central Administrative CBAM Body. Such
an approach may reduce coordination burdens and have the merits of one unique
approach, which could facilitate the operation of the mechanism. It may also downsize
the necessary information flows, thus potentially simplifying system requirements.
However, such an authority does not exist at this moment and would need to be hosted
by an existing agency or a Commission service. A central authority at EU level would
also need to meet a number of specifications, which would affect the pace for this
establishment.
In view of the above, the envisaged institutional architecture for the CBAM would have
important implications as regards the costs of its operation. Commission research
estimates that the CBAM would in its first phase concern 1 000 traders realising 239 000
import transactions on an annual basis from 510 production sites outside the EU. While
this represents a large number of transactions, the estimate also indicates that they are
undertaken by a fairly a limited number of traders and concern a limited number of sites.
To obtain a rough estimate of the potential staffing needs to operate the CBAM at EU
level, we consider three core functional areas that will need to be supported. Depending
on the level of centralisation these could be carried out either by a Central CBAM
Authority or shared with the Member States’ national authorities. In the latter case,
estimates of staffing needs would depend on the capacities of the national authorities, and
thereby their ability to cover the necessary administrative requirements arising from the
CBAM with current staff - or if additional positions would be needed.
The first functional area relates to the core function of reviewing, assessing and
approving declarations presented by traders, including issuing requests for supplementary
information and clarification. Assuming a maximum of 10 working days for the handling
of each, this would require 50 full time equivalent positions. The second functional area
relates to the handling of complains submitted by traders. Assuming that around one third
of declarations could be subject to litigation and a maximum of 5 working days would be
needed for the handling of each, this would require an additional 7.5 full time equivalent
positions.
For these two functional areas, the impact of a centralised versus a decentralised
approach can vary. In the case of a decentralised approach, the estimated 57.5 full time
29
equivalent positions may not be equally distributed across Member States. Given the
location of traders, certain Member States may face higher administrative costs relative
to this function. In addition, a decentralised approach may possibly require a slightly
higher aggregated number of full time equivalent positions, due to forgone possibilities
of economies of scale.
The third functional area relates to the maintenance of the IT system, including the
keeping and updating of registries and handling of CBAM obligations (selling and buy
back of certificates). It is estimated that this would require an additional 18 full time
equivalent positions if the management system was fully centralised. In case of a
decentralised approach, the selling and buying of certificates would need to be carried
out by national authorities, which would imply a higher number of full time equivalent
positions in aggregate for this functional area, with only a portion retained centrally to
support the management of the central IT system.
The above considerations would imply a requirement of 75 staff on a full time basis to
implement the CBAM according to the centralised approach. This number would be
higher in aggregate under a decentralised approach, yet this would depend on the current
human resource capacities within the national authorities that would be tasked with
handling the CBAM.
5.2.1.10 Resource shuffling
Resource shuffling refers to the allocation or attribution of less emissions-intensive
materials production (including materials embedded in manufactured goods) towards
markets with higher carbon costs, while the overall carbon intensity of production in the
home market remains constant. There exist three main mechanisms through which
resource shuffling can take place:
- Attribution of low-carbon input factors (low-carbon electricity, low-carbon heat,
biomass) to imported materials.
- Attribution of GHG emissions of a production process to co-products (e.g. slag, heat,
flue-gases) to improve the reported carbon intensity of basic material production
(unless strict MRV rules would limit such approaches).
- Attribution of shares of recycled material to imported or exported goods.
Incentives for resource shuffling exist for any emissions-related policy that includes
traded goods (e.g. CBAM or product standards) where the carbon intensity of imported
or exported products does not rely on default values only, but on actual emissions. For a
CBAM, non-EU producers have an incentive to re-route carbon-intensive products to
other markets in the world economy to avoid the levy imposed by the border measure.
On the other hand, exporting low-carbon products to the EU would imply lowering the
carbon costs these importers face and therefore undermine the carbon leakage protection
which the CBAM provides, without leading to a decrease of global emissions.
Resource shuffling has emerged as an important problem in the Californian CBAM53
on
electricity. In addition, recent academic literature focusing on the EU approximates the
scale of potential risk from resource shuffling from a CBAM at around 50 % for steel and
53
California is the only jurisdiction that currently has implemented a CBAM as part of its climate policy
framework and is based on a transaction-based approach.
30
80 % for aluminium - the latter driven by the higher opportunities to source or attribute
the production of aluminium to clean electricity54
.
Notwithstanding the above, it should be noted that importers are perfectly entitled to
direct lower-carbon products to the EU. That being said, and while resource shuffling of
this scale would improve the EU’s carbon footprint, it could result in higher carbon
leakage, thereby undermining the effectiveness of the CBAM. At the same time, the
negative implications of resource shuffling should also be balanced with the fact that
third countries have to make an effort to produce low carbon-intensive products for the
EU market and this will be positive from a climate perspective. As a matter of fact,
beyond mere resource shuffling, third countries will have to invest in clean technologies
if they want to export less polluting goods to the EU, which could result in less overall
emissions and in internal synergies that will make it less expensive to shift to less
polluting production for all markets. This positive effect will be larger and trigger
changes more quickly the more relevant the EU market is for the total exports from that
particular country.
5.2.1.11 The CBAM for Least Developed Countries (LDCs)
LDCs currently account for a minimal share of EU-external trade in the commodities that
could be covered by a CBAM. Yet, it should be recognised that exports to the EU from
LDCs can provide important foreign exchange earnings for these countries and represent
a significant share of their GNI. Many countries in the Global South, and on the African
continent in particular, are exposed to possible risks (see more detailed data in Annex 3).
While preferential treatment for LDCs is an established procedure in other areas of trade
policy, it raises questions in the case of a CBAM. For example, blanket exemptions from
a CBAM should be avoided, as setting up a mechanism that will encourage LDCs to
increase their level of emission and run counter to the overarching objective of the
CBAM. In addition, these exemptions would be temporary in nature, and would therefore
prove counterproductive for LDCs in the long run: the carbon intensive industry would
have to be dismantled, and if exempted now, adaptation costs for LDCs would be higher.
To sum up, neither the EU nor the trading partners would have an interest in fostering the
growth of carbon-intensive, industries in these countries.
To avoid new global dividing lines between countries with a low and high-carbon export
structure, recent analyses55
have highlighted the need for targeted ways to support LDCs.
These could take the form of technical assistance, technology transfer, extensive capacity
building and financial support, with the objective to develop industrial production
structures that are compatible with long-term climate objectives. This assistance could be
carried out through existing support channels (e.g. bilaterally and multilaterally,
including through the mechanisms established under the UNFCCC). In the absence of
such compensating mechanisms, LDCs could argue that the introduction of a CBAM will
be a disproportionate burden for them and that they conflict with the UNFCCC principle
of common but differentiated responsibilities and respective capabilities, in light of
different national circumstances. Finally, to ease the transition, a gradual phasing in of
the CBAM could be considered for existing production capacities in LDCs.
54 Stede, J., Pauliuk, S., Hardadi, G. Neuhoff, K., Carbon pricing of basic materials: Incentives and risks
for the value chain and consumers, 2021, DIW Discussion Papers, No 1935. 55
See for example L. Lehne, O. Sartor: Navigating the politics of Borden Carbon Adjustments, E3G
Briefing Paper, September 2020.
31
5.2.2 Option 1: Import Carbon Tax on basic materials based on EU average
Box 1: Option 1 in Brief
Depth of value chain: Basic materials and basic material products
Coverage of CBAM: Imports only
Free allocation in the EU ETS: No (full auctioning of allowances for the CBAM
sectors)
Type of payment: Domestic producers buy EU ETS allowances; importers pay a tax
Reflection of actual emissions in carbon pricing: Yes for domestic production;
importers pay based on a default value reflecting EU average but may opt to demonstrate
actual carbon intensity of imported products
The first option for a CBAM is an import carbon tax, paid by the importer when products
enter the EU. Practically, the tax would be collected by customs at the border and based
on a tax reflecting the price of carbon in the EU combined with a default carbon intensity
of the products. An annual average price could be favoured over e.g. daily adjusted
prices, as this would provide for a simpler implementation and higher predictability for
importers. For simplicity considerations, the reference value for carbon intensity would
be a default value based on EU producers’ averages. However, importers will have the
opportunity to claim for individual treatment56
, which would be administered by a
reconciliation exercise and could result in a deduction or refund of a proportion of the
amount of tax to be paid. This involves the importer providing proof for any carbon price
paid abroad and/or actual performance from carbon efficient technologies. Information
will be subject to monitoring and verification procedures to assess whether a partial or
full reimbursement of the tax should be granted.
Under option 1, a credible enforcement mechanism must be established. This would
involve an existing entity with its seat in the EU, for instance an existing Agency or the
Commission, to be vested with additional powers for compliance with the CBAM. In
practice, the enforcement mechanism would require that for every import that falls within
the scope of the CBAM, the importer nominates in the customs declaration a ‘CBAM
importer’ (being in a similar situation as the installation operator in the EU ETS) with a
business address in the EU, who would be responsible for paying the CBAM tax
obligation and engaging in the reconciliation procedure.
This option assumes that the CBAM would be limited to specific imported carbon-
intensive materials and basic material products. In an initial phase, in order to keep the
measure simple and manageable, semi-finished and finished products would not be
covered, with regard to neither the emissions from their production, nor the fact that they
contain carbon-intensive materials. Option 1 reflects a scenario with full auctioning of
emission allowances for the concerned sectors under the ETS. The free allocation of
allowances contained in the current EU ETS would thus not be retained for the selected
sectors. Under Option 1, the leakage protection currently resulting from free allocation of
EU ETS allowances would therefore have to come from the CBAM.
56
This would allow producers to demonstrate their actual carbon intensity compared to the default value.

32
5.2.3 Option 2: Import certificates for basic materials based on EU average
Box 2: Option 2 in Brief
Depth of value chain: Basic materials and basic material products
Coverage of CBAM: Imports only
Free allocation in the EU ETS: No (full auctioning of allowances for the CBAM
sectors)
Type of payment: Domestic producers buy EU ETS allowances; importers buy import
certificates (CBAM certificates)
Reflection of actual emissions in carbon pricing: Yes for domestic production;
importers pay based on a default value reflecting EU average emissions or may opt to
demonstrate actual carbon intensity of imported products
The second option involves the application on imports of a system that replicates the
EU ETS regime applicable to domestic production. This option entails – similarly to the
system of allowances under the EU ETS – the surrendering of certificates (‘CBAM
certificates’) by importers, based on the embedded emission intensity of the products
they import in the EU and purchased at a price corresponding to that of the EU ETS
allowances at any given point in time. These certificates will not be linked to the EU ETS
system of allowances but will mirror the price of these allowances to ensure a coherent
approach to the pricing under the EU ETS.
There are a number of reasons not to use EU ETS allowances in the CBAM, all relating
to the possible impact on the ETS, in terms of the functioning but also of the underlying
logic. The ETS is a cap and trade system where the cap represents a total amount of
greenhouse gas emissions for a given year. In line with the principle of the Kyoto
protocol on accounting emissions of its parties, the cap is linked to the emissions taking
place as a result of releasing greenhouse gases on the territory of the EU exclusively.
Using ETS allowances to account for emissions taking place outside of the EU’s territory
would bring a significant number of new actors on the ETS market at the same time, as it
would require revising the logic used to set the ETS cap.
In general, it is preferable to carry out extensions of the ETS scope in a prudent manner
involving specific pools of allowances, as it was the case for aviation and as it may be the
case for buildings and transport. Finally, as the ETS sets a maximum to the emissions
taking place in the EU, using its allowance for imports could result in quantitative
restrictions on imports that would raise WTO concerns. In other words, the CBAM
cannot introduce a cap on emissions outside the EU, in order to avoid restricting
international trade.
Importers will submit declarations of verified embedded emissions in the imported
products and surrender a number of CBAM certificates corresponding to the declared
emissions to a CBAM authority. Depending on the level of centralisation, this authority
could be either the central CBAM authority or the national authorities tasked with
managing the CBAM. Such declaration and surrendering will occur – similar to that
under the EU ETS – at a yearly reconciliation exercise taking place in the year following
the year of importation and based on yearly trade import volumes. The carbon emission
intensity of products would be based on a default value; however, importers would be
33
given the opportunity, at the moment of the yearly reconciliation exercise, to claim a
reduction of the CBAM on the basis of their individual emission performance. They
would also be entitled to claim a reduction of the CBAM for any carbon price paid in the
country of production (which is not rebated nor compensated in other ways upon export).
The data necessary to calculate the amount of CBAM certificates to be surrendered
should be provided by the ‘CBAM importer’ to the CBAM authority57
. If the importer
intends to provide its own emission figures for the CBAM, the relevant information is
also to be provided. Depending on MRV requirements defined, the relevant information
here would be either:
– the confirmation from the CBAM authority that the imported good falls under the
CBAM;
– the specific embedded emissions determined in line with the CBAM requirements
on MRV, as well as information on the carbon price paid abroad – in this case,
some form of verification report would have to be attached by the importer.
At regular intervals (e.g. annually like in the EU ETS), the CBAM importer would
perform a calculation (or ‘reconciliation’) of its CBAM obligation by adding up all its
reported embedded emissions for the previous period (e.g. the calendar year) and for all
imported products covered by the CBAM, and report them.
5.2.4 Option 3: Import certificates for basic materials based on actual
emissions
Box 3: Option 3 in Brief
Depth of value chain: Basic materials and basic material products
Coverage of CBAM: Imports only
Free allocation in the EU ETS: No (full auctioning of allowances for the CBAM
sectors)
Type of payment: Domestic producers buy EU ETS allowances; importers buy import
certificates (CBAM certificates)
Reflection of actual emissions in carbon pricing: For both domestic production and
imports, importers declare the actual carbon intensity of imported products
Option 3 operates in the same way as option 2, however the carbon price of imports is
based on actual emissions from third country producers rather than on a default value
based on EU producers’ averages. Under this option, the importer will have to report the
actual emissions embedded in the product and surrender a corresponding number of
CBAM certificates. In the event that a carbon price was paid abroad, the importer would
be entitled to claim a reduction of his CBAM obligation corresponding to the carbon
price paid abroad. Information will be subject to monitoring and verification procedures
to assess the number of CBAM certificates to be purchased, as explained in option 2
above. Under this option, free allocation in the EU ETS would be discontinued.
57
See Annex 5: Definitions.

34
Even if the general principle in this option is that imported products in the scope of the
CBAM are to be assessed based on actual GHG emissions, there would still be a need to
set default values to be used in situations when sufficient data to determine the actual
GHG emissions is not available.
5.2.5 Option 4: Import certificates for basic materials based on actual
emissions with parallel continuation of free allowances for a
transitional period
Box 4: Option 4 in Brief
Depth of value chain: Basic materials and basic material products
Coverage of CBAM: Imports only
Free allocation in the EU ETS: Phased out for the CBAM sectors - gradual phased-out
after 2025 over 10 years
Mode of payment: Domestic producers buy EU ETS allowances needed beyond free
allocation; importers buy import certificates (CBAM certificates)
Reflection of actual emissions in carbon pricing: Only partially for domestic production
and imports during the transition period; importers declare the actual carbon intensity of
imported products
Option 4 would apply in the same way as option 3. It consists of surrendering CBAM
certificates on imported goods. However, this option considers a more gradual phasing
out of free allowances, which shall start after 2025, so that they decline up to 50 % in
2030 and eventually to 0 % by 2035 at the earliest. On the basis of this, the CBAM
would be phased in after 2025 and reduced proportionally to the amount of free
allowances distributed in a given sector.
The CBAM after 2025 would apply to the difference between actual emissions and the
proportion of emissions under the EU benchmark which remain covered by free
allowances. This way, at any point in time, imports benefit from the same level of free
allowances as domestic productions. Such a transitional period is designed to allow
businesses with installations subject to the EU ETS to have more time to adjust to a
situation where the carbon price will apply fully to their production.
5.2.6 Option 5: Import certificates for basic materials also as part of
components and finished products based on actual emissions
Box 5: Option 5 in Brief
Depth of value chain: Basic materials also as part of components and finished products
Coverage of CBAM: Imports only
Free allocation in the EU ETS: No (full auctioning of allowances for the CBAM
sectors)
Mode of payment: Domestic producers buy EU ETS allowances; importers buy import
certificates (CBAM certificates)
Reflection of actual emissions in carbon pricing: Yes for domestic production;
importers will declare the actual carbon intensity of imported products
35
Option 5 is a variant of Option 3 with a scope extended further down in the value chain.
Adjustments would not be limited to specific imported carbon-intensive materials and
basic material products. Instead, carbon-intensive materials that are part of semi-finished
as well as finished products would also be covered along the value chain. For imports,
the CBAM would again be based on the actual emissions from third country producers.
Under this option, no free allocation would be given to EU ETS operators.
5.2.7 Option 6: Excise duty
Box 6: Option 6 in Brief
Depth of value chain: Basic materials also as part of components and final products
Coverage of CBAM: Domestic products, imports and waiving of liability for exports of
EU producers (symmetric)
Free allocation in the EU ETS: Yes (continued)
Mode of payment: EU ETS coverage for domestic producers plus liability created upon
production and import, paid when product is released for consumption58
Reflection of actual emissions in carbon pricing: Yes for domestic production; not for
imports
Option 6 goes beyond the introduction of a CBAM reflecting the effects of the EU ETS
at the border. It consists of an excise duty on carbon-intensive materials covering
consumption of both domestic and imported products, besides the continuation of the EU
ETS including the free allocation of allowances covering production in the EU.
An excise duty would be levied on the consumption in the EU of carbon-intensive
materials, regardless of whether they are produced in the EU or imported. The excise
duty would be calculated by applying the relevant carbon price to the base of the
assessment, i.e. the quantity of the carbon intensive material produced or imported
multiplied by a carbon intensity factor. The latter would represent an irrefutable value, so
that only default values are used for embedded emissions of domestic and imported
goods. The carbon intensity factor should reflect the carbon content of each covered
material. In order to ensure administrative feasibility across the value chain, the carbon
content should not reflect the specific production processes of the specific material at
hand, but be determined according to material specific reference values. Initially, such
reference values could, where available, correspond to or be derived from the EU ETS
product benchmarks already used for free allocation of allowances59
. The relevant carbon
price should be determined in relation with the EU ETS allowance price.
For imports, the destination principle would be achieved by making the importation of
basic materials, as well as goods containing a significant share of such materials, a
taxable event. The importation would thus create the same liability as if the materials had
58
Release for consumption is a technical term defined in Article 7 of the EU Horizontal Excise Duty
Directive (Council Directive 2008/118/EC). It can be roughly described as the time when the product
leaves a tax warehouse and is transferred to the consumption sphere. 59
For example, for steel and aluminium, several product benchmarks would have to be combined to get the
carbon intensity factor.

36
been produced in the EU, i.e. dependent on the weight of the material and independent of
the actual production process.
Exports of materials and manufactured products, on the other hand, would not be subject
to the excise duty. Hence, as with the excise duties on alcoholic beverages, manufactured
tobacco products and energy products, firms could be allowed a duty suspension for the
liability created upon production or import. Thus, the excise duty could be waived where
materials, including as part of products, are exported.
Duty suspension arrangements allow authorised entities to produce, process, hold,
transport and trade excise duty goods between producers of different production stages
without triggering excise duty. The duty is transferred along the supply chain until excise
duty goods are finally released for consumption. As duty suspension arrangements allow
for the transfer of liabilities along the value chain, efficient control mechanisms need to
be in place.
As with other excise duties, this duty would become due when materials are released for
consumption, as part of more processed products. A system for monitoring and
verification of the carbon intensity of the products will have to be established, taking into
account the material composition of the products and the carbon intensity of the materials
contained therein.
Free allocation of allowances would continue, and operators of installations would
receive free allowances based on the benchmark levels and the production volume of
tonnes of the basic material. This approach would be compatible with the present system
whereby EU operators would need to buy allowances to cover emissions exceeding the
benchmark levels.
5.2.8 Options for the electricity sector
Electricity generation is analysed separately due to several factors which make it unique
among the sectors considered for inclusion in the CBAM. Not only is it the most
important sector included in the EU ETS in terms of direct carbon emissions, it is also
the largest sector responsible for carbon emissions in the wider economy60
. Additionally,
electricity generators in principle do not receive free allowances, but have to buy them
via auctions or on the secondary market. This distinguishes them from other EU ETS
participants, whose exposure to the risks of carbon leakage can be mitigated with the
allocation of free allowances. At the same time, as electricity generated in third countries
can only be delivered into the EU through interconnectors which are subject to capacity
constraints, the exported volumes are subject to the limitations of physical infrastructure.
Electricity imports in the EU make up 1–2 % of total EU consumption on average, which
means that exposure to international trade in this case is lower than in other EU ETS
sectors. The interconnection infrastructure has, however, been expanding over the past
years and the trend is expected to continue61
. The net physical inflows of electricity into
60
Electricity and heat generation accounted for 33 % of total CO2 emissions in the EU28 and for 42% of
total CO2 emissions in the world in 2018, according to IEA data. This was a larger share than any other
sector including transport.
https://www.iea.org/data-and-
statistics/?country=WORLD&fuel=CO2%20emissions&indicator=CO2BySector
61 A 2018 report by the Commission Expert Group on electricity interconnection targets identified 82
interconnectors between the EU and 10 third countries without a carbon pricing mechanism or its
37
the EU from third countries without an equivalent carbon pricing mechanism increased
from 3 TWh in 2017 to 20 TWh in 201962
. In fact, a growing body of evidence points to
carbon leakage already occurring in certain regions and intensifying with rising carbon
prices63
. The above-mentioned factors speak in favour of selecting electricity imports for
inclusion in the CBAM.
Applying the CBAM on electricity requires taking into account its uniqueness that
distinguishes it from basic materials, such as the way it is transported, a relatively broad
set of technologies used to produce it with various electricity generators working within a
network and the fact that only direct emissions associated with electricity generation are
factored in. In line with the methodology applied to other sectors and products, a
reference value for emissions embedded in imported electricity needs to be established in
the context of determining the corresponding CBAM obligation. In the absence of EU
ETS benchmarks for electricity generation (stemming from the absence of free allocation
in the sector), two main alternative options can be used to determine the reference value
for embedded emissions.
Option A: Average carbon emission intensity
The average carbon emission intensity of the EU electricity mix can be calculated as the
ratio between the total amount of CO2 emissions stemming from electricity production
and the total gross electricity production in the EU over a defined period of time. Annual
averages are the most widely used for measuring and comparison purposes. This metric
provides information about the average carbon content of all the electricity generated
within the EU in grams of CO2 per kWh. As a default value, it can be used for calculating
the corresponding CBAM obligation, after being multiplied by a concrete volume of
imports and a specific carbon price.
The average carbon emission intensity calculated on the basis of the EU electricity mix
would in practice very likely result in a default value that is significantly lower than the
real embedded emissions of electricity generated in neighbouring third countries. This is
due to the fact that the decarbonisation of the EU electricity sector (thanks to the EU
ETS) has progressed much more rapidly than in neighbouring countries where efforts to
fight climate change receive less attention64
. Additionally, this would not create
equivalents. With the completion of an interconnector between Italy and Montenegro in 2019, the list has
grown to 11 countries. See Electricity interconnections with neighbouring countries: Second report of the
Commission Expert Group on electricity interconnection targets, DG ENER, p. 10-18. Quarterly report on
European electricity markets, Volume 13, Issue 2, second quarter of 2020, DG ENER, p. 20.
62 Quarterly report on European electricity markets, Volume 13, Issue 2, second quarter of 2020, DG
ENER, pp. 20-21.
63 For an analysis of the situation in Romania, see Quarterly report on European electricity markets,
Volume 13, Issue 3, third quarter of 2020, DG ENER, p. 22. For the case of the Baltic countries, see
Quarterly report on European electricity markets, Volume 12, Issue 1, first quarter of 2019, DG ENER,
p. 24-25. For the case of Ireland, see Curtis, J, et al. ‘Climate Policy, Interconnection and Carbon Leakage:
The Effect of Unilateral UK Policy on Electricity and GHG Emissions in Ireland’. Economics of Energy &
Environmental Policy, vol. 3, no. 2, 2014, pp. 145–158. For a discussion on carbon leakage in the Balkans,
see Višković, V. et al. ‘Implications of the EU emissions trading system for the South-East Europe regional
electricity market’, Energy Economics, 65, 2017, pp. 251-261.
64 The average carbon emission intensity of the EU electricity generation decreased by 31% between 2000
and 2018. Meanwhile in Russia and Ukraine, which are the largest sources of extra-EU electricity imports
not covered by EU ETS or equivalent obligations, the average emission intensity in the electricity sector
fell only by 7 % and 8 % respectively. As the trend continued in 2019 and 2020, the EU’s average emission
intensity is currently one of the lowest worldwide. Data available at https://www.iea.org/data-and-
38
incentives for the exporting countries to decrease the emissions of their electricity mix.
Thus, a default value based on the average carbon intensity in the EU might not be
entirely appropriate to meaningfully mitigate the risks of carbon leakage in the electricity
sector.
Option B: Average CO2 emission factor
The option B takes into account the way electricity is dispatched from different types of
generation sources in a centralised management system of today. In order to minimise the
cost of generation, the sources are ranked according to their marginal costs of production
(the so called merit order) so that those with the lowest marginal costs are the first ones
to be brought online to meet demand, and the plants with the highest marginal costs are
the last to be brought online. In practice, renewable and nuclear sources with zero or low
marginal costs (and zero carbon emissions) are the first ones to be called upon, while
coal and gas power plants fill in the rest of the demand requirements and set the price for
the all generators online. Since export capacity is only available when internal demand is
satisfied, the additional demand spurred by exports is, as a rule, met with coal and gas
power plants on the far side of the merit order. Therefore, it can be assumed that extra-
EU electricity imports from third countries are by default generated by price-setting coal
and gas power plants with a measurable carbon footprint.
Variants of option B
Variant B.1: CO2 emission factor of the EU electricity mix
In order to establish a reference value of this footprint, an average CO2 emission factor of
corresponding price-setting fossil-based generators in the EU can be used. This CO2
emission factor, calculated in the context of state aid granted to compensate industrial
consumers for indirect costs contained in their electricity bills as a result of the EU
ETS65
, is defined as the division of the total carbon emissions of the electricity sector
divided by the gross electricity generation based on fossil fuels. It expresses the average
carbon content of electricity generated by price-setting sources (most typically coal and
gas power plants) in the EU, and better corresponds to the typical amount of emissions
embedded in electricity imports from third countries. As a default value, the CO2
emission factor can be used for calculating the corresponding CBAM obligation, after
being multiplied by a concrete volume of imports and a specific carbon price. The factor
could be subject to revision after a defined number of years.
The use of an EU based value would however not address the issue that countries with a
lower CO2 emission factor (with a less emitting electricity mix) would be treated equally
to countries with a higher CO2 factor (with usually a more emitting electricity mix), with
the latter benefiting from using an EU-level default value, which is lower and not
reflecting the real emissions of exported electricity. This is what we consider in variants
B.2 and B.3.
statistics?country=EU28&fuel=Electricity%20and%20heat&indicator=CO2IntensityPower
; and
https://www.iea.org/data-and-statistics/charts/development-of-co2-emission-intensity-of-electricity-
generation-in-selected-countries-2000-2020 65
See Commission Guidelines on certain State aid measures in the context of the system for greenhouse
gas emission allowance trading post 2021, C(2020) 6400.
39
Variant B.2: Countries below the CO2 emission factor of the EU electricity mix
claim to use the country factor
This variant of the Option B comprises the use of a reference value based on the CO2
emission factor of the exporting country in the case where an emission factor of this
country is below the default EU value. In other cases, the default EU value is used.
Variant B.3: The use of the exporting country electricity mix CO2 emission factor
In this variant, a CO2 emission factor of the electricity mix of the respective exporting
country is applied to all imports. The advantage of this variant is that it better reflects the
actual emissions of the country’s exported electricity and provides an incentive for
exporter countries to invest in clean generation of their electricity mix.
As in other sectors, importers will be given the possibility to claim that the carbon
content of their product is below the default value. In view of the technical challenges
associated with tracing the exact sources of electricity generated in third countries, a
robust and credible system of verification will need to be established to ensure that the
individual assessment procedure is reliable and reasonably accurate, without imposing
too great an administrative burden on importers. Additionally, importers will also have
the possibility to claim that they have paid a carbon price abroad that should reduce their
CBAM obligation.
5.2.9 Feedback from the Open Public Consultation
The Open Public Consultation considered four policy options for the introduction of a
CBAM: a tax applied on imports at the EU border (option 1 in the Impact Assessment),
an extension of the ETS to imports (not retained in the Impact Assessment), the
obligation to purchase allowances from a specific pool outside the ETS which would
mirror the ETS price (options 2, 3, 4, 5 in the Impact Assessment) and a carbon tax
(option 6 in the Impact Assessment). Differences in design between options 2, 3, 4 and 5
were not detailed in the questionnaire submitted to the Open Public Consultation, as
these precisions were introduced at a later stage, also following feedback from
stakeholders.
Consulted stakeholders on average believe that all four policy options submitted in the
questionnaire are at least somewhat relevant to the design of a CBAM. On average, a tax
applied on imported products belonging to sectors at risk of carbon leakage appears to be
the most relevant option for stakeholders, followed by a carbon tax at consumption level
applied to all products (both imported or produced in the EU) in the sectors that are at
risk of carbon leakage.
When looking at different stakeholder groups, citizens, civil society organisations and
public authorities seem to prefer a carbon tax on imported products, followed by a carbon
tax at the consumption level. Companies are relatively less enthusiastic about all the
proposed solutions and they attach limited relevance for the design of a CBAM to an
extension of the ETS or a carbon tax on consumption. Responses broken down by
geographical area do not show substantial differences between different clusters, except
for the carbon tax on imports, which has limited relevance for respondents based in
bordering countries.

40
Figure 5: Most appropriate options to design the CBAM (average score and number
of respondents in brackets)
Source: CEPS analysis of public consultation results.
1.10 (459)
1.05 (461)
0.98 (464)
1.30 (462)
0 1 2
d. Carbon tax (e.g. excise or VAT type) at
consumption level on a selection of products
whose production is in sectors that are at risk of
carbon leakage and applied to EU production, as
well as to imports
c. The obligation to purchase allowances from a
specific pool outside the ETS dedicated to imports,
which would mirror the ETS price
b. An extension of the EU Emissions Trading
System to imports, which could require the
purchasing of emission allowances under the EU
Emissions Trading System by either foreign
producers or importers
a. A tax applied on imports at the EU border on a
selection of products whose production is in
sectors that are at risk of carbon leakage (e.g. a
border tax or customs duty on selected carbon
intensive products)
Legend: 0 = Not relevant 1 = Somewhat relevant 2 = Highly relevant
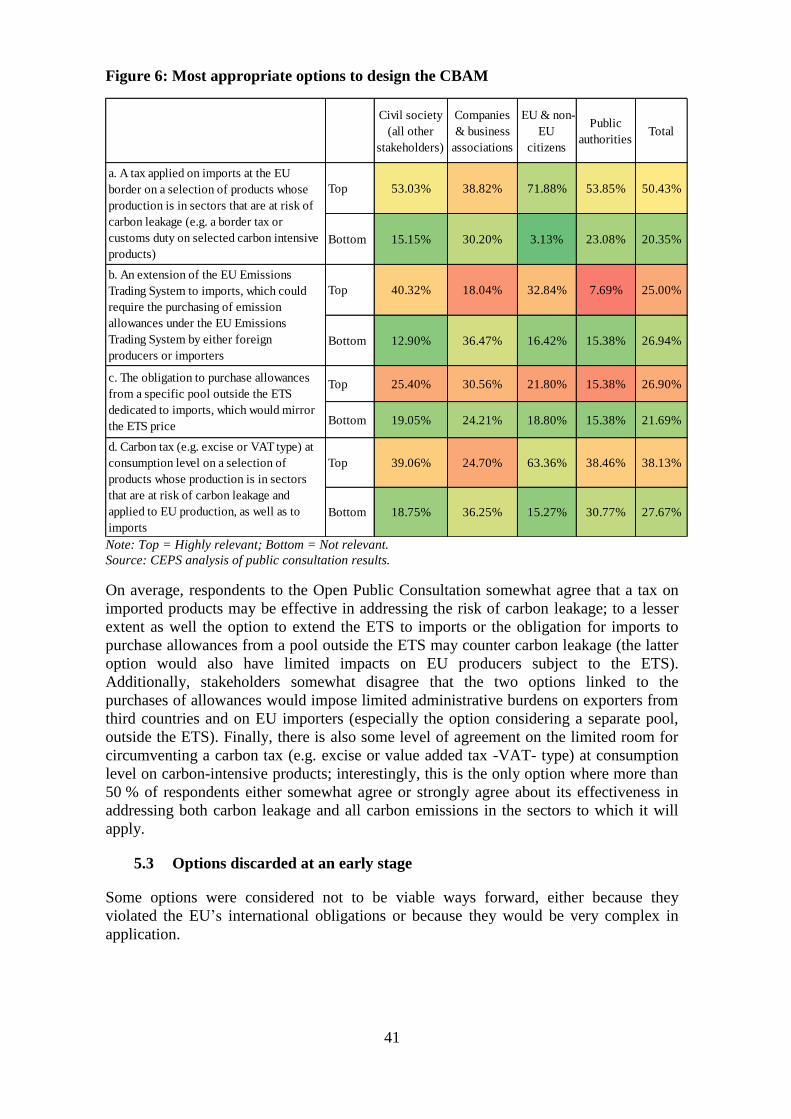
41
Figure 6: Most appropriate options to design the CBAM
Note: Top = Highly relevant; Bottom = Not relevant.
Source: CEPS analysis of public consultation results.
On average, respondents to the Open Public Consultation somewhat agree that a tax on
imported products may be effective in addressing the risk of carbon leakage; to a lesser
extent as well the option to extend the ETS to imports or the obligation for imports to
purchase allowances from a pool outside the ETS may counter carbon leakage (the latter
option would also have limited impacts on EU producers subject to the ETS).
Additionally, stakeholders somewhat disagree that the two options linked to the
purchases of allowances would impose limited administrative burdens on exporters from
third countries and on EU importers (especially the option considering a separate pool,
outside the ETS). Finally, there is also some level of agreement on the limited room for
circumventing a carbon tax (e.g. excise or value added tax -VAT- type) at consumption
level on carbon-intensive products; interestingly, this is the only option where more than
50 % of respondents either somewhat agree or strongly agree about its effectiveness in
addressing both carbon leakage and all carbon emissions in the sectors to which it will
apply.
5.3 Options discarded at an early stage
Some options were considered not to be viable ways forward, either because they
violated the EU’s international obligations or because they would be very complex in
application.
Civil society
(all other
stakeholders)
Companies
& business
associations
EU & non-
EU
citizens
Public
authoritiesTotal
Top 53.03% 38.82% 71.88% 53.85% 50.43%
Bottom 15.15% 30.20% 3.13% 23.08% 20.35%
Top 40.32% 18.04% 32.84% 7.69% 25.00%
Bottom 12.90% 36.47% 16.42% 15.38% 26.94%
Top 25.40% 30.56% 21.80% 15.38% 26.90%
Bottom 19.05% 24.21% 18.80% 15.38% 21.69%
Top 39.06% 24.70% 63.36% 38.46% 38.13%
Bottom 18.75% 36.25% 15.27% 30.77% 27.67%
a. A tax applied on imports at the EU
border on a selection of products whose
production is in sectors that are at risk of
carbon leakage (e.g. a border tax or
customs duty on selected carbon intensive
products)
b. An extension of the EU Emissions
Trading System to imports, which could
require the purchasing of emission
allowances under the EU Emissions
Trading System by either foreign
producers or importers
c. The obligation to purchase allowances
from a specific pool outside the ETS
dedicated to imports, which would mirror
the ETS price
d. Carbon tax (e.g. excise or VAT type) at
consumption level on a selection of
products whose production is in sectors
that are at risk of carbon leakage and
applied to EU production, as well as to
imports
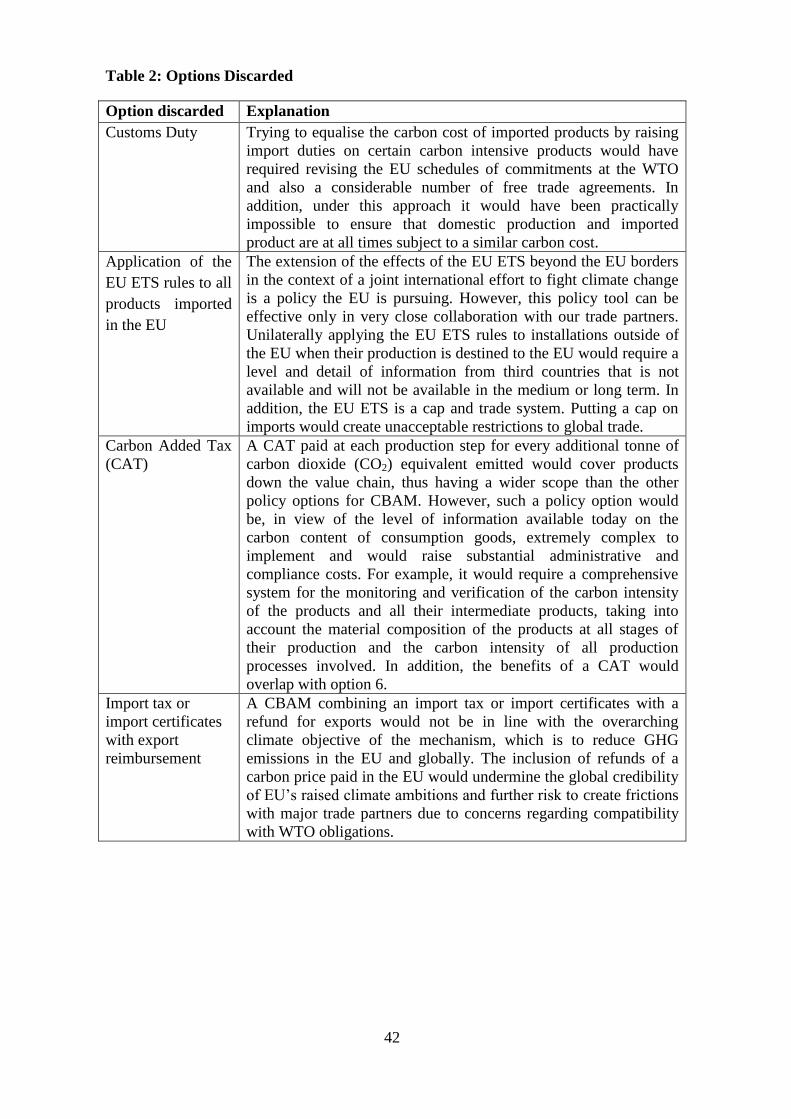
42
Table 2: Options Discarded
Option discarded Explanation
Customs Duty Trying to equalise the carbon cost of imported products by raising
import duties on certain carbon intensive products would have
required revising the EU schedules of commitments at the WTO
and also a considerable number of free trade agreements. In
addition, under this approach it would have been practically
impossible to ensure that domestic production and imported
product are at all times subject to a similar carbon cost.
Application of the
EU ETS rules to all
products imported
in the EU
The extension of the effects of the EU ETS beyond the EU borders
in the context of a joint international effort to fight climate change
is a policy the EU is pursuing. However, this policy tool can be
effective only in very close collaboration with our trade partners.
Unilaterally applying the EU ETS rules to installations outside of
the EU when their production is destined to the EU would require a
level and detail of information from third countries that is not
available and will not be available in the medium or long term. In
addition, the EU ETS is a cap and trade system. Putting a cap on
imports would create unacceptable restrictions to global trade.
Carbon Added Tax
(CAT)
A CAT paid at each production step for every additional tonne of
carbon dioxide (CO2) equivalent emitted would cover products
down the value chain, thus having a wider scope than the other
policy options for CBAM. However, such a policy option would
be, in view of the level of information available today on the
carbon content of consumption goods, extremely complex to
implement and would raise substantial administrative and
compliance costs. For example, it would require a comprehensive
system for the monitoring and verification of the carbon intensity
of the products and all their intermediate products, taking into
account the material composition of the products at all stages of
their production and the carbon intensity of all production
processes involved. In addition, the benefits of a CAT would
overlap with option 6.
Import tax or
import certificates
with export
reimbursement
A CBAM combining an import tax or import certificates with a
refund for exports would not be in line with the overarching
climate objective of the mechanism, which is to reduce GHG
emissions in the EU and globally. The inclusion of refunds of a
carbon price paid in the EU would undermine the global credibility
of EU’s raised climate ambitions and further risk to create frictions
with major trade partners due to concerns regarding compatibility
with WTO obligations.
43
6 WHAT ARE THE IMPACTS OF THE POLICY OPTIONS?
6.1 Introduction
6.1.1 Modelling approach and scope
This section gives an overview of the main impacts of the options considered under the
CBAM. As discussed in Section 5.1, options are compared to the baseline, which rests on
the EU reference scenario, the MIX as depicted in the the EU ETS revision impact
assessment and a variant of the MIX based on full auctioning of EU ETS emission
allowances for the sectors that will be subject to the CBAM. The motivation of this
approach, as emphasised earlier, derives from the European Green Deal, where the
CBAM and free allocation are clear alternatives. The MIX as depicted in the EU ETS
impact assessment does not foresee full auctioning for the sectors at risk of carbon
leakage. In modelling terms, for this impact assessment it would be impossible to
illustrate how the CBAM adjusts if it was not compared also to a situation where full
auctioning is introduced but the border adjustment is absent. Without such a comparison
the move to full auctioning, from the MIX, would blur the impact of the border measure
thus making it impossible to fairly assess its contribution.
In terms of sectoral scope, the analysis focuses on the sectors of four basic material
products identified earlier in the discussion (Section 5.2.1.3), namely aluminium,
fertilisers, cement (and lime) and iron and steel. As discussed in Annex 4, the sectoral
granularity of the JRC-GEM-E3 model was improved for the purposes of this impact
assessment to explicitly account for these sectors in the model’s baseline dataset. While
this has greatly facilitated the analytical insight of the model, it is recognized that in
modeling terms these sectors still represent more aggregate representations of the
products to which the CBAM would apply. This would imply that the sectors analyzed
bellow embed both the CBAM product and certain of its downstream processes.
For presentational purposes, these four material industrial sectors - namely aluminium,
fertilisers, cement (and lime) and iron and steel - are collectively referred to in the
analysis below as CBAM sectors. The CBAM’s impacts on electricity imports is
analysed separately under Annex 8, to reflect the sector’s distinct characteristic pertinent
to its technical character that distinguish it from material industrial sectors.
The CBAM sectors that form the scope of this analysis account for about 55 % of all
industrial emissions in the EU-27 in 2020. Iron and steel is the highest emitter,
accounting for nearly 30 % of industrial emissions, followed by cement and fertilisers.
Aluminium is last in terms of direct emissions, albeit the sector is more heavily geared in
generating indirect emissions due to its electro-intensive character. When looking at total
CO2 equivalent emissions, CBAM sectors together with electricity generated accounted
for nearly 40 % of emissions in 2020.

44
Figure 7: Direct CO2 equivalent emissions in the CBAM sectors – EU 27 in 2020
Share of direct CO2eq emissions in the CBAM
sectors in total CO2eq relative to other sectors
Share of direct CO2eq emissions in the CBAM
sectors relative to total industrial emissions
Source: JRC-GEM-E3 model
The options considered include the main options discussed in section 5.2.1.3, as well as
certain variations to provide greater insight on the sources and implication of impacts.
All options are assumed to apply simultaneously to the CBAM sectors from the start.
That is, no sequencing is introduced in the sectoral application of the measure in its
initial phase.
As regards the treatment of trade partners, the modelling assumes unilateral application
of the CBAM to all imports in the CBAM sectors. That is, no exemptions are granted to
countries who have in place or are considering to adopt a carbon pricing system imposing
a carbon price at least equivalent to the price resulting from the EU ETS on products
subject to the CBAM. The CBAM is indeed proposed against an evolving landscape both
internationally and in the EU. Adopting a static approach to policy developments in other
countries was an intentional assumption in the approach of the impact assessment. While
in practice accounting for other countries’ pricing policies that are equivalent or linked to
the EU ETS may be considered, this was not accounted for in the modelling. In the
modelling, we approximate the actual emissions of CO2e for the individual exporters
outlined in the detailed description of the options (Section 5.2), with the average
emission intensities of exporting country in the sectors concerned66.
While the risk of resource shuffling from the use actual carbon intensities is recognised,
this is not accounted for in the main modelling exercise. As emphasised earlier, the risk
of resource shuffling exists for any emissions-related policy that affects traded goods,
where the carbon intensity of imported products does not rely solely on default values,
but either gives the option to demonstrate actual emissions or requires full demonstration
of actual emissions from the outset. Therefore, the risk of resource shuffling is indeed
present for all CBAM options considered, with the exception of the excise duty option.
66
The average emissions of the sectors in the exporting countries are taken as a proxy to reflect actual
emissions of imports. In the modelling these are drawn from the JRC-GEM-E3 model, which in turn is
calibrated using the GTAP 10 database (Aguiar, A., Chepeliev, M., Corong, E., McDougall, R., & van der
Mensbrugghe, D. (2019). The GTAP Data Base: Version 10. Journal of Global Economic Analysis, 4(1),
1-27) as a starting point and projections from the Global Energy and Climate Outlook 2020 for non-EU
regions (Keramidas et al., Keramidas, K., Fosse, F., Diaz-Vazquez, A., Schade, B., Tchung-Ming, S.,
Weitzel, M., Vandyck, T., Wojtowicz, K. Global Energy and Climate Outlook 2020: A New Normal
Beyond Covid-19, Luxembourg: Publications Office of the European Union, 2021, EUR 30558, ISBN 978-
92-76-28417-8, doi:10.2760/608429, JRC123203).
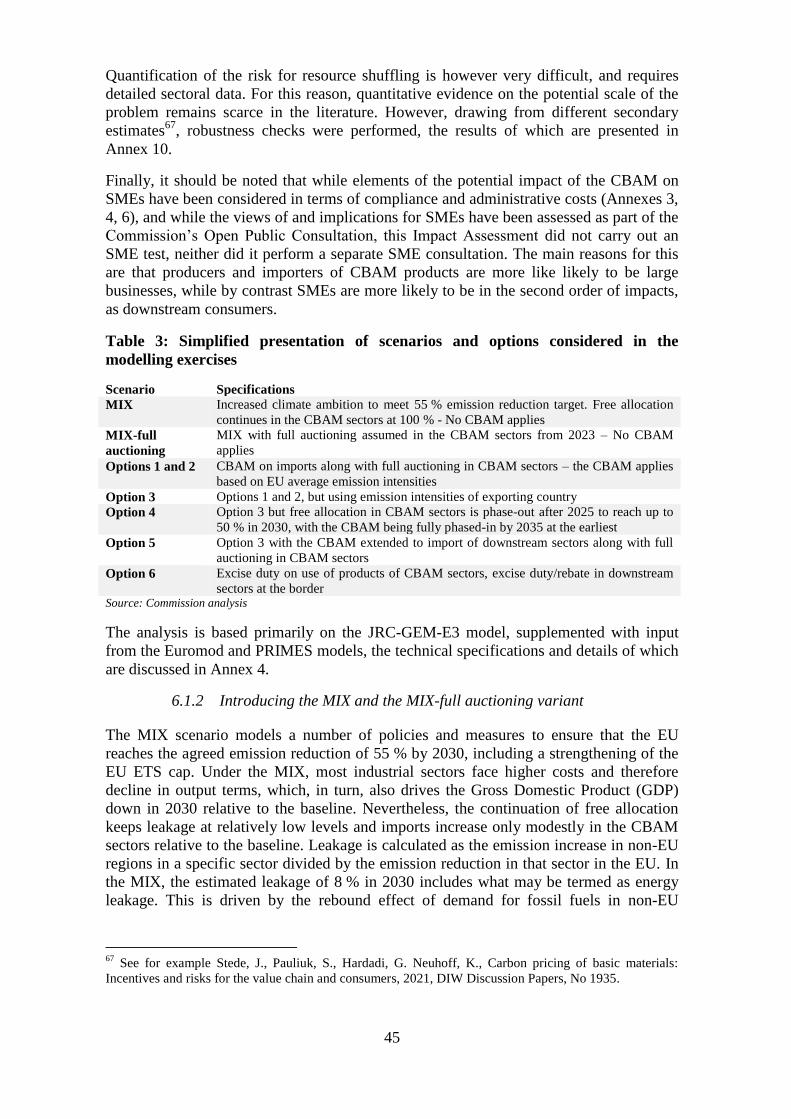
45
Quantification of the risk for resource shuffling is however very difficult, and requires
detailed sectoral data. For this reason, quantitative evidence on the potential scale of the
problem remains scarce in the literature. However, drawing from different secondary
estimates67
, robustness checks were performed, the results of which are presented in
Annex 10.
Finally, it should be noted that while elements of the potential impact of the CBAM on
SMEs have been considered in terms of compliance and administrative costs (Annexes 3,
4, 6), and while the views of and implications for SMEs have been assessed as part of the
Commission’s Open Public Consultation, this Impact Assessment did not carry out an
SME test, neither did it perform a separate SME consultation. The main reasons for this
are that producers and importers of CBAM products are more like likely to be large
businesses, while by contrast SMEs are more likely to be in the second order of impacts,
as downstream consumers.
Table 3: Simplified presentation of scenarios and options considered in the
modelling exercises
Scenario Specifications
MIX Increased climate ambition to meet 55 % emission reduction target. Free allocation
continues in the CBAM sectors at 100 % - No CBAM applies
MIX-full
auctioning
MIX with full auctioning assumed in the CBAM sectors from 2023 – No CBAM
applies
Options 1 and 2 CBAM on imports along with full auctioning in CBAM sectors – the CBAM applies
based on EU average emission intensities
Option 3 Options 1 and 2, but using emission intensities of exporting country
Option 4 Option 3 but free allocation in CBAM sectors is phase-out after 2025 to reach up to
50 % in 2030, with the CBAM being fully phased-in by 2035 at the earliest
Option 5 Option 3 with the CBAM extended to import of downstream sectors along with full
auctioning in CBAM sectors
Option 6 Excise duty on use of products of CBAM sectors, excise duty/rebate in downstream
sectors at the border Source: Commission analysis
The analysis is based primarily on the JRC-GEM-E3 model, supplemented with input
from the Euromod and PRIMES models, the technical specifications and details of which
are discussed in Annex 4.
6.1.2 Introducing the MIX and the MIX-full auctioning variant
The MIX scenario models a number of policies and measures to ensure that the EU
reaches the agreed emission reduction of 55 % by 2030, including a strengthening of the
EU ETS cap. Under the MIX, most industrial sectors face higher costs and therefore
decline in output terms, which, in turn, also drives the Gross Domestic Product (GDP)
down in 2030 relative to the baseline. Nevertheless, the continuation of free allocation
keeps leakage at relatively low levels and imports increase only modestly in the CBAM
sectors relative to the baseline. Leakage is calculated as the emission increase in non-EU
regions in a specific sector divided by the emission reduction in that sector in the EU. In
the MIX, the estimated leakage of 8 % in 2030 includes what may be termed as energy
leakage. This is driven by the rebound effect of demand for fossil fuels in non-EU
67
See for example Stede, J., Pauliuk, S., Hardadi, G. Neuhoff, K., Carbon pricing of basic materials:
Incentives and risks for the value chain and consumers, 2021, DIW Discussion Papers, No 1935.
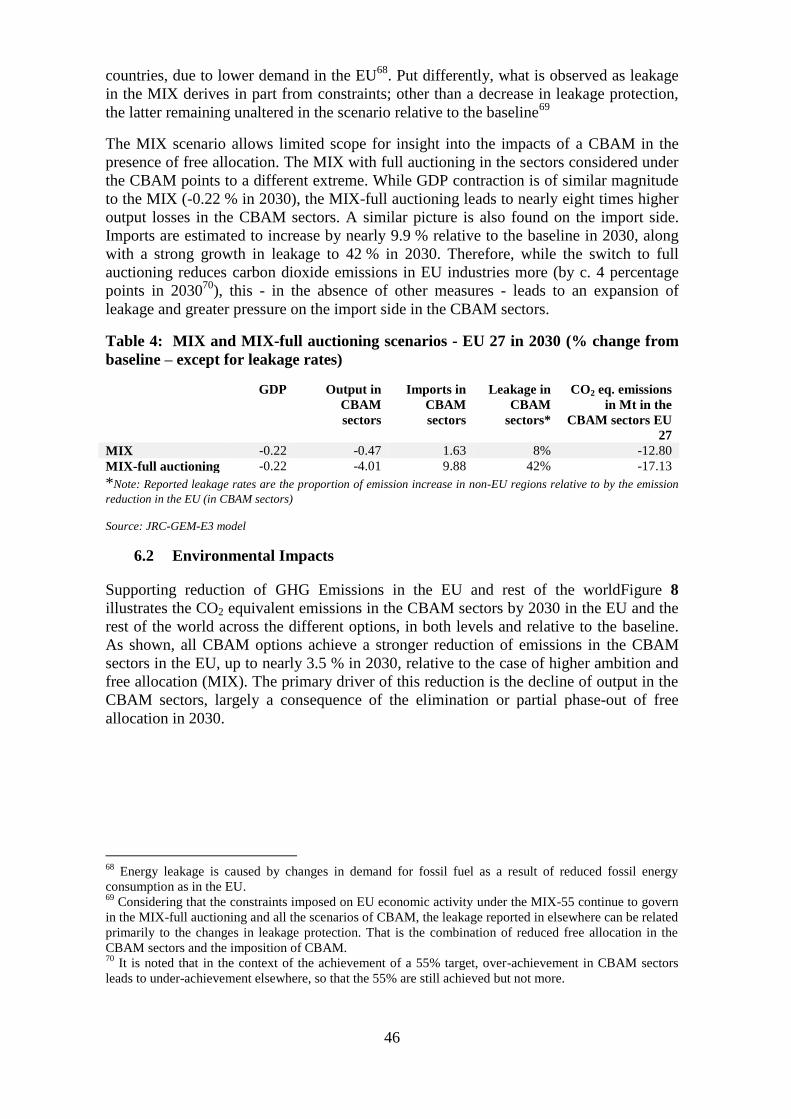
46
countries, due to lower demand in the EU68
. Put differently, what is observed as leakage
in the MIX derives in part from constraints; other than a decrease in leakage protection,
the latter remaining unaltered in the scenario relative to the baseline69
The MIX scenario allows limited scope for insight into the impacts of a CBAM in the
presence of free allocation. The MIX with full auctioning in the sectors considered under
the CBAM points to a different extreme. While GDP contraction is of similar magnitude
to the MIX (-0.22 % in 2030), the MIX-full auctioning leads to nearly eight times higher
output losses in the CBAM sectors. A similar picture is also found on the import side.
Imports are estimated to increase by nearly 9.9 % relative to the baseline in 2030, along
with a strong growth in leakage to 42 % in 2030. Therefore, while the switch to full
auctioning reduces carbon dioxide emissions in EU industries more (by c. 4 percentage
points in 203070
), this - in the absence of other measures - leads to an expansion of
leakage and greater pressure on the import side in the CBAM sectors.
Table 4: MIX and MIX-full auctioning scenarios - EU 27 in 2030 (% change from
baseline – except for leakage rates)
GDP Output in
CBAM
sectors
Imports in
CBAM
sectors
Leakage in
CBAM
sectors*
CO2 eq. emissions
in Mt in the
CBAM sectors EU
27
MIX -0.22 -0.47 1.63 8% -12.80
MIX-full auctioning -0.22 -4.01 9.88 42% -17.13
*Note: Reported leakage rates are the proportion of emission increase in non-EU regions relative to by the emission
reduction in the EU (in CBAM sectors)
Source: JRC-GEM-E3 model
6.2 Environmental Impacts
Supporting reduction of GHG Emissions in the EU and rest of the worldFigure 8
illustrates the CO2 equivalent emissions in the CBAM sectors by 2030 in the EU and the
rest of the world across the different options, in both levels and relative to the baseline.
As shown, all CBAM options achieve a stronger reduction of emissions in the CBAM
sectors in the EU, up to nearly 3.5 % in 2030, relative to the case of higher ambition and
free allocation (MIX). The primary driver of this reduction is the decline of output in the
CBAM sectors, largely a consequence of the elimination or partial phase-out of free
allocation in 2030.
68
Energy leakage is caused by changes in demand for fossil fuel as a result of reduced fossil energy
consumption as in the EU. 69
Considering that the constraints imposed on EU economic activity under the MIX-55 continue to govern
in the MIX-full auctioning and all the scenarios of CBAM, the leakage reported in elsewhere can be related
primarily to the changes in leakage protection. That is the combination of reduced free allocation in the
CBAM sectors and the imposition of CBAM. 70
It is noted that in the context of the achievement of a 55% target, over-achievement in CBAM sectors
leads to under-achievement elsewhere, so that the 55% are still achieved but not more.

47
Figure 8: Level of emissions in the EU-27 and the Rest of the World in CBAM
sectors and relative to the baseline in 2030 (in million tonnes of CO2 equivalent and
as % change from baseline)
EU-27 (CBAM sectors) Rest of the World (CBAM sectors)
Source: JRC-GEM-E3 model
In options 1 and 2, with the end of free allowances and the introduction of the CBAM on
import, the carbon costs increases for both imports and domestic production. Producers
of basic materials have to pay a carbon price on their emissions, therefore they have a
significant incentive for efficiency improvements, material recycling, more efficient use
of carbon-intense materials and material substitution from the EU ETS price. Indeed, a
less carbon intensive production requires purchase of fewer EU ETS allowances. Under
options 3, 4 and 5, where foreign producers must show their actual emissions, this
incentive is also present and this explains that under options 3, 4 and 5 in the absence of
resource shuffling, emissions reduce even in the rest of the world, with option 4
achieving the strongest reduction.
The incentives resulting from carbon pricing under option 4 during the transitional phase
is a combination of the increased effort achieved under the MIX and option 3. As the
free allowances are phased out, the incentive to reduce emissions in the EU becomes
stronger. In 2030, when free allowances are phased out by up to 50% (option 4), the
incentive appears to be stronger that the MIX, but slightly lower than under options 3
and 5.
The EU ETS price under option 5 incentivises both efficiency improvements of
production of basic materials, recycling and efficient material use and substitution
whenever materials or final goods containing basic materials are sold domestically. Due
to the wider product coverage, producers can more easily pass-through carbon costs
along the value chain. Domestic producers thus also face full incentives for implementing
climate neutral production processes.
Similarly, manufacturers and the construction industry profit from an efficient material
use and substitution when products are sold domestically, yet for exported goods there is
no such incentive.
Option 6 ensures a consistent carbon price signal along the value chain even in the
presence of free allocation, as it relies on a separate tax applying to domestic and
imported products regardless of the EU ETS. It introduces incentives similar to a CBAM
based on EU average emissions for an efficient use of raw and basic materials, and
substitution with low-carbon alternatives for construction and manufacturing along the
value chain. It ensures that the reference carbon intensity for basic materials is reflected
in product prices where products are sold domestically. Such incentives are not present in
exported products unless such a system is in place in the importing country. In addition,
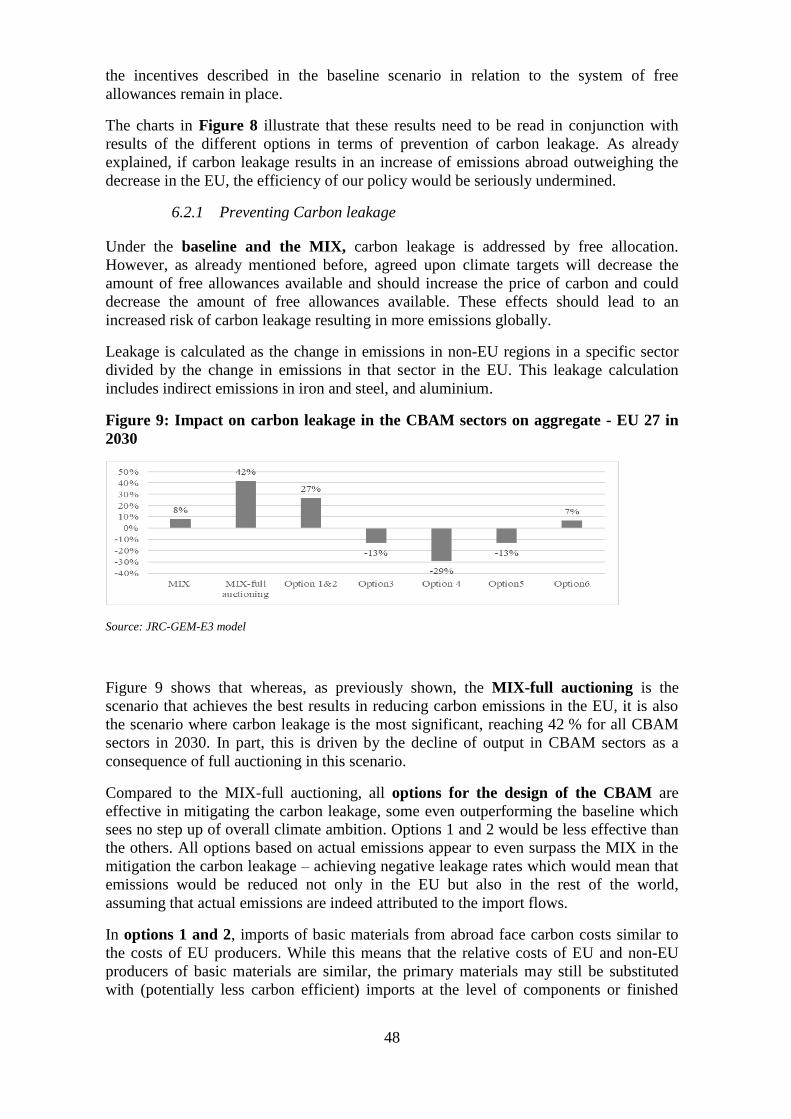
48
the incentives described in the baseline scenario in relation to the system of free
allowances remain in place.
The charts in Figure 8 illustrate that these results need to be read in conjunction with
results of the different options in terms of prevention of carbon leakage. As already
explained, if carbon leakage results in an increase of emissions abroad outweighing the
decrease in the EU, the efficiency of our policy would be seriously undermined.
6.2.1 Preventing Carbon leakage
Under the baseline and the MIX, carbon leakage is addressed by free allocation.
However, as already mentioned before, agreed upon climate targets will decrease the
amount of free allowances available and should increase the price of carbon and could
decrease the amount of free allowances available. These effects should lead to an
increased risk of carbon leakage resulting in more emissions globally.
Leakage is calculated as the change in emissions in non-EU regions in a specific sector
divided by the change in emissions in that sector in the EU. This leakage calculation
includes indirect emissions in iron and steel, and aluminium.
Figure 9: Impact on carbon leakage in the CBAM sectors on aggregate - EU 27 in
2030
Source: JRC-GEM-E3 model
Figure 9 shows that whereas, as previously shown, the MIX-full auctioning is the
scenario that achieves the best results in reducing carbon emissions in the EU, it is also
the scenario where carbon leakage is the most significant, reaching 42 % for all CBAM
sectors in 2030. In part, this is driven by the decline of output in CBAM sectors as a
consequence of full auctioning in this scenario.
Compared to the MIX-full auctioning, all options for the design of the CBAM are
effective in mitigating the carbon leakage, some even outperforming the baseline which
sees no step up of overall climate ambition. Options 1 and 2 would be less effective than
the others. All options based on actual emissions appear to even surpass the MIX in the
mitigation the carbon leakage – achieving negative leakage rates which would mean that
emissions would be reduced not only in the EU but also in the rest of the world,
assuming that actual emissions are indeed attributed to the import flows.
In options 1 and 2, imports of basic materials from abroad face carbon costs similar to
the costs of EU producers. While this means that the relative costs of EU and non-EU
producers of basic materials are similar, the primary materials may still be substituted
with (potentially less carbon efficient) imports at the level of components or finished

49
products. In the modelling, options 1 and 2 bring carbon leakage in the CBAM sectors
down to 27 % in 2030 when the default value is set at the level of the EU average
emissions per sector, but to -13 % under options 3, 4 and 5 where all imports would have
face a CBAM based on actual emissions. The main driver behind this difference is that
actual emissions are much higher than the EU average, which in turn increases
substantially the size of the CABM obligation for imports.
Under option 4, the risk of carbon leakage is addressed through a mixture of free
allowance allocation and the CBAM. As free allocation are replaced by the CBAM the
scenario gets closer and closer to option 3. In 2030, carbon leakage is addressed equally
by free allowances and the CBAM, the combination of which appears to result in the
strongest possible reduction of leakage.
Under option 6, the analysis should be split in two, EU ETS on one hand and excise duty
on the other hand. For the EU ETS part, the risk of carbon leakage is addressed by the
free allocation of allowances. Therefore, the scenario is much closer to the MIX scenario.
The consumption tax, being a pure destination based tax, does not affect trade flows and
does not lead to any carbon leakage.
Table 5: Impact on carbon leakage in the CBAM sectors (EU 27 in 2030)
Iron and Steel Cement Fertiliser Aluminium
MIX 8 % 4 % 24 % 24 %
MIX-full auctioning 37 % 31 % 98 % 36 %
Option 1 and 2 22 % 23 % 61 % 25 %
Option 3 -12 % 16 % -100 % -76 %
Option 4 -24 % 7 % -208 % -89 %
Option 5 -12 % 16 % -100 % -76 %
Option 6 7 % 3 % 18 % 25 %
Source: JRC-GEM-E3 model
In terms of sectoral effects, the highest risk of leakage when moving to the MIX-full
auctioning is observed in fertilisers and iron and steel, followed by aluminium and
cement. The proportional mitigation of this risk is similar across sectors when the CBAM
is introduced in all other scenarios. Fertilisers exhibit the highest level of mitigation with
leakage rates switching from 98 % in the MIX-full auctioning to -100 % in options 3
and 5, reaching -208 % in option 471
. Cement is the only sector that exhibits consistent
but weaker impacts relative to other sectors. These differences between sectors are driven
by the interplay of a range of factors – notably the relative levels of trade intensity, the
sector’s carbon intensity (both on the EU and with respect to partners) and the
substitutability of its composite product with others.
71
This implies emission reductions of about 2 tonnes CO2e in non-EU regions in addition to each tonne of
CO2eq avoided in the EU. The difference in emission intensities of EU and non-EU producers is
particularly high for fertilisers, hence a CBAM based on actual emissions is best suited to reduce emissions
abroad and discourage imports from the most emission intensive producers. Options 3-5 all achieve a
similar reduction of leakage on the import side; in addition, option 4 leads to less leakage on the export
side than options 3
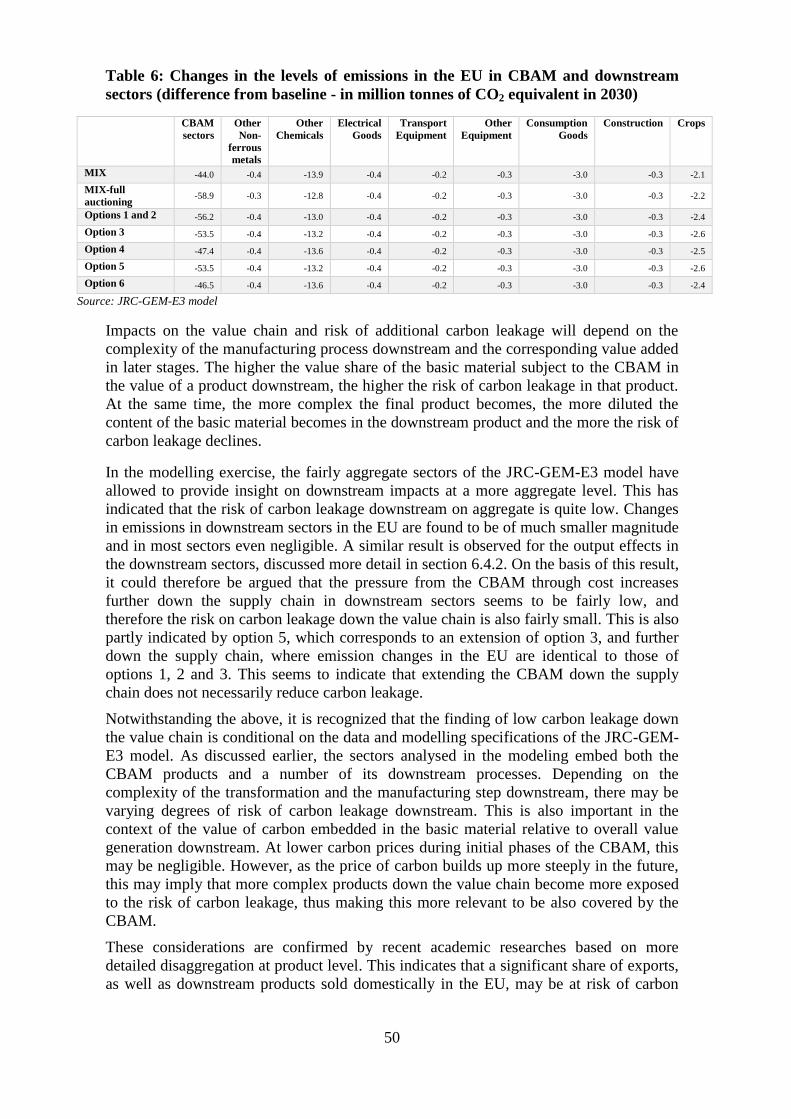
50
Table 6: Changes in the levels of emissions in the EU in CBAM and downstream
sectors (difference from baseline - in million tonnes of CO2 equivalent in 2030)
CBAM
sectors
Other
Non-
ferrous
metals
Other
Chemicals
Electrical
Goods
Transport
Equipment
Other
Equipment
Consumption
Goods
Construction Crops
MIX -44.0 -0.4 -13.9 -0.4 -0.2 -0.3 -3.0 -0.3 -2.1
MIX-full
auctioning -58.9 -0.3 -12.8 -0.4 -0.2 -0.3 -3.0 -0.3 -2.2
Options 1 and 2 -56.2 -0.4 -13.0 -0.4 -0.2 -0.3 -3.0 -0.3 -2.4
Option 3 -53.5 -0.4 -13.2 -0.4 -0.2 -0.3 -3.0 -0.3 -2.6
Option 4 -47.4 -0.4 -13.6 -0.4 -0.2 -0.3 -3.0 -0.3 -2.5
Option 5 -53.5 -0.4 -13.2 -0.4 -0.2 -0.3 -3.0 -0.3 -2.6
Option 6 -46.5 -0.4 -13.6 -0.4 -0.2 -0.3 -3.0 -0.3 -2.4
Source: JRC-GEM-E3 model
Impacts on the value chain and risk of additional carbon leakage will depend on the
complexity of the manufacturing process downstream and the corresponding value added
in later stages. The higher the value share of the basic material subject to the CBAM in
the value of a product downstream, the higher the risk of carbon leakage in that product.
At the same time, the more complex the final product becomes, the more diluted the
content of the basic material becomes in the downstream product and the more the risk of
carbon leakage declines.
In the modelling exercise, the fairly aggregate sectors of the JRC-GEM-E3 model have
allowed to provide insight on downstream impacts at a more aggregate level. This has
indicated that the risk of carbon leakage downstream on aggregate is quite low. Changes
in emissions in downstream sectors in the EU are found to be of much smaller magnitude
and in most sectors even negligible. A similar result is observed for the output effects in
the downstream sectors, discussed more detail in section 6.4.2. On the basis of this result,
it could therefore be argued that the pressure from the CBAM through cost increases
further down the supply chain in downstream sectors seems to be fairly low, and
therefore the risk on carbon leakage down the value chain is also fairly small. This is also
partly indicated by option 5, which corresponds to an extension of option 3, and further
down the supply chain, where emission changes in the EU are identical to those of
options 1, 2 and 3. This seems to indicate that extending the CBAM down the supply
chain does not necessarily reduce carbon leakage.
Notwithstanding the above, it is recognized that the finding of low carbon leakage down
the value chain is conditional on the data and modelling specifications of the JRC-GEM-
E3 model. As discussed earlier, the sectors analysed in the modeling embed both the
CBAM products and a number of its downstream processes. Depending on the
complexity of the transformation and the manufacturing step downstream, there may be
varying degrees of risk of carbon leakage downstream. This is also important in the
context of the value of carbon embedded in the basic material relative to overall value
generation downstream. At lower carbon prices during initial phases of the CBAM, this
may be negligible. However, as the price of carbon builds up more steeply in the future,
this may imply that more complex products down the value chain become more exposed
to the risk of carbon leakage, thus making this more relevant to be also covered by the
CBAM.
These considerations are confirmed by recent academic researches based on more
detailed disaggregation at product level. This indicates that a significant share of exports,
as well as downstream products sold domestically in the EU, may be at risk of carbon

51
leakage72
.
72
Stede, J., Pauliuk, S., Hardadi, G. Neuhoff, K., Carbon pricing of basic materials: Incentives and risks for
the value chain and consumers, 2021, DIW Discussion Papers, No 1935.

52
summarizes the main findings of this analysis - which was based on carbon intensities of
over 4 000 commodity groups covering basic materials, material products and
manufactured goods downstream (components and final products). It depicts the overall
value of sales of EU manufacturing productions, as well as the value and respective
shares of these sales for which carbon leakage risks exist at carbon prices of
30 EUR/tonne and 75 EUR/tonne. The analysis shows that the commodity groups
downstream (components and final products) at risk of carbon leakage could in fact
account for between 5 % and 15 % of all manufacturing value added.
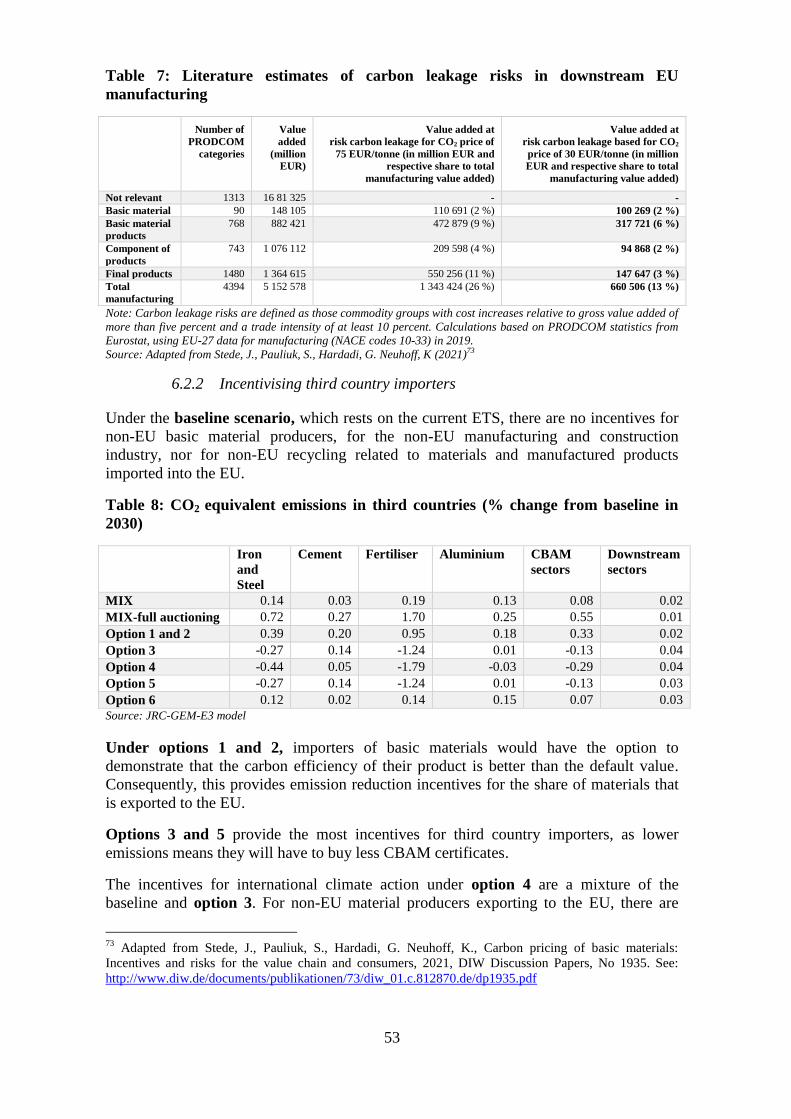
53
Table 7: Literature estimates of carbon leakage risks in downstream EU
manufacturing
Number of
PRODCOM
categories
Value
added
(million
EUR)
Value added at
risk carbon leakage for CO2 price of
75 EUR/tonne (in million EUR and
respective share to total
manufacturing value added)
Value added at
risk carbon leakage based for CO2
price of 30 EUR/tonne (in million
EUR and respective share to total
manufacturing value added)
Not relevant 1313 16 81 325 - -
Basic material 90 148 105 110 691 (2 %) 100 269 (2 %)
Basic material
products
768 882 421 472 879 (9 %) 317 721 (6 %)
Component of
products
743 1 076 112 209 598 (4 %) 94 868 (2 %)
Final products 1480 1 364 615 550 256 (11 %) 147 647 (3 %)
Total
manufacturing
4394 5 152 578 1 343 424 (26 %) 660 506 (13 %)
Note: Carbon leakage risks are defined as those commodity groups with cost increases relative to gross value added of
more than five percent and a trade intensity of at least 10 percent. Calculations based on PRODCOM statistics from
Eurostat, using EU-27 data for manufacturing (NACE codes 10-33) in 2019.
Source: Adapted from Stede, J., Pauliuk, S., Hardadi, G. Neuhoff, K (2021)73
6.2.2 Incentivising third country importers
Under the baseline scenario, which rests on the current ETS, there are no incentives for
non-EU basic material producers, for the non-EU manufacturing and construction
industry, nor for non-EU recycling related to materials and manufactured products
imported into the EU.
Table 8: CO2 equivalent emissions in third countries (% change from baseline in
2030)
Iron
and
Steel
Cement Fertiliser Aluminium CBAM
sectors
Downstream
sectors
MIX 0.14 0.03 0.19 0.13 0.08 0.02
MIX-full auctioning 0.72 0.27 1.70 0.25 0.55 0.01
Option 1 and 2 0.39 0.20 0.95 0.18 0.33 0.02
Option 3 -0.27 0.14 -1.24 0.01 -0.13 0.04
Option 4 -0.44 0.05 -1.79 -0.03 -0.29 0.04
Option 5 -0.27 0.14 -1.24 0.01 -0.13 0.03
Option 6 0.12 0.02 0.14 0.15 0.07 0.03
Source: JRC-GEM-E3 model
Under options 1 and 2, importers of basic materials would have the option to
demonstrate that the carbon efficiency of their product is better than the default value.
Consequently, this provides emission reduction incentives for the share of materials that
is exported to the EU.
Options 3 and 5 provide the most incentives for third country importers, as lower
emissions means they will have to buy less CBAM certificates.
The incentives for international climate action under option 4 are a mixture of the
baseline and option 3. For non-EU material producers exporting to the EU, there are
73
Adapted from Stede, J., Pauliuk, S., Hardadi, G. Neuhoff, K., Carbon pricing of basic materials:
Incentives and risks for the value chain and consumers, 2021, DIW Discussion Papers, No 1935. See:
http://www.diw.de/documents/publikationen/73/diw_01.c.812870.de/dp1935.pdf
54
limited incentives to increase production efficiency or invest into climate neutral
production as long as the CBAM covers only a small share of the EU reference carbon
intensity. These incentives increase as the share of the CBAM increases. Recycling
incentives outside of the EU also increase as free allocation is phased out (and replaced
with the CBAM).
Regarding the incentives for international producers and recycling, option 5 is similar to
option 3. However, due to the inclusion of the manufacturing value chain which uses
significant amounts of carbon-intensive materials, there are also incentives for efficient
and climate neutral material production where it is embodied in products, or for material
efficiency and substitution within manufacturing industries (for the share of products
exported to the EU). These effects are however fairly small, and hence not reflected in
the model results.
The default value for carbon intensity of basic materials under option 6 means that there
are no incentives for efficiency improvements, climate neutral production and recycling
of basic materials produced abroad. However, there are incentives to reduce the content
of carbon-intensive materials in semi-finished and final products exported to the EU.
6.2.3 Feedback from the Open Public Consultation
Stakeholders responding to the consultation somewhat agree that the CBAM would have
positive environmental impacts, improving the effectiveness of policies against climate
change, reducing carbon emissions globally, and promoting the adoption of ambitious
climate policies in third countries.
These results are confirmed across all stakeholder groups, although the highest level of
agreement is achieved among citizens and among civil society organisations, with the
lowest being in the group of stakeholders representing business organisations. Results
broken down by geographical area are very similar to those registered in the overall
sample, except for respondents based in bordering countries, who appear to disagree on
the effectiveness of the CBAM to reduce carbon emissions on a global scale, and are also
uncertain regarding other types of environmental impacts74
.
When estimating the environmental impacts generated by each of the policy options
under investigation, no policy option leads to significantly better environmental
outcomes according to the respondents.
6.3 Impacts on the EU ETS
As the CBAM is envisaged to complement the EU ETS, it is important to assess the
interaction between these two instruments. The main impact in this respect is that putting
in place a CBAM will allow the reduction of free allowances, which should reinforce the
price signal delivered by the EU ETS.
74
Results from bordering countries are, to some extent, affected by the view of six Russian stakeholders
that are part of campaign B (section Error! Reference source not found.), as they somewhat disagree
ith all impacts.

55
6.3.1 Coherence
An important issue is the risk of overlap between the CBAM and the EU ETS. The EU
ETS will cover the emissions of installations inside the EU. The CBAM, on the other
hand, is intended to put a price on GHG emissions taking place outside the EU, but
where the emissions are of interest to the EU, because the goods produced are used inside
the EU. The combination of the CBAM and the EU ETS should not lead to a double
pricing of carbon, neither should it lead to a situation where carbon is not subject to any
price.
In options 1, 2, 3 and 5, the respective scope of the CBAM and the EU ETS are clearly
defined, and overlaps between free allocation and the CBAM are avoided. In all cases
there is a risk of double charging when goods are initially produced in the EU subject to
the ETS, exported, and reimported potentially subject to the CBAM.
In option 4, for the period during which a CBAM would coexist with free allocation,
particular attention should be paid to the level of the CBAM to ensure that the
combination of the CBAM and free allocation does not undermine the incentive to emit
less carbon dioxide than the free allocation benchmark nor does it provide more
protection that needed to prevent carbon leakage.
In options 1 to 5, the method to establish the embedded emissions of imported products
will have to be designed to avoid double counting of carbon emissions.
In option 6, the excise duty is a complementary instrument to the EU ETS, and the main
element which matters is coordinating both instruments in delivering a price signal. One
possibility would be to set the level of the excise duty at the level of the free allocation
benchmark, so that the carbon price for EU production would reflect the full EU ETS
price. As an excise duty is not imposed on exports, the risks related to goods exported
and subsequently reimported do not apply.
6.3.2 Monitoring and compliance
As regards applicable rules in the CBAM, however, there is some desirable overlap
between the two instruments. The carbon price to be paid inside and outside the EU
should be as comparable as possible. Thus, system boundaries and MRV rules in general
should also be comparable for the determination of the emissions on which the carbon
price is based. Therefore, MRV rules for the CBAM should follow the same principles as
those in the EU ETS. To ensure synergies, there should be some coordination and
learning between the respective competent authorities, and deadlines for the compliance
cycle should be coordinated.
6.3.3 ETS price
The move from MIX to the MIX full auctioning reduces emissions in CBAM sectors as a
result of declining output, which reduces the scarcity of emission permits and hence the
carbon price. For all design options of a CBAM, the expectation would be that imports
of goods with a high ‘carbon content’ take place less frequently compared to the MIX-
full auctioning. As a result, emissions in the CBAM sectors are higher, and therefore
carbon prices increase slightly relative to the MIX full auctioning. Nevertheless, the
modeling confirms that the impact of a CBAM on the EU ETS price is relatively small
by 2030.

56
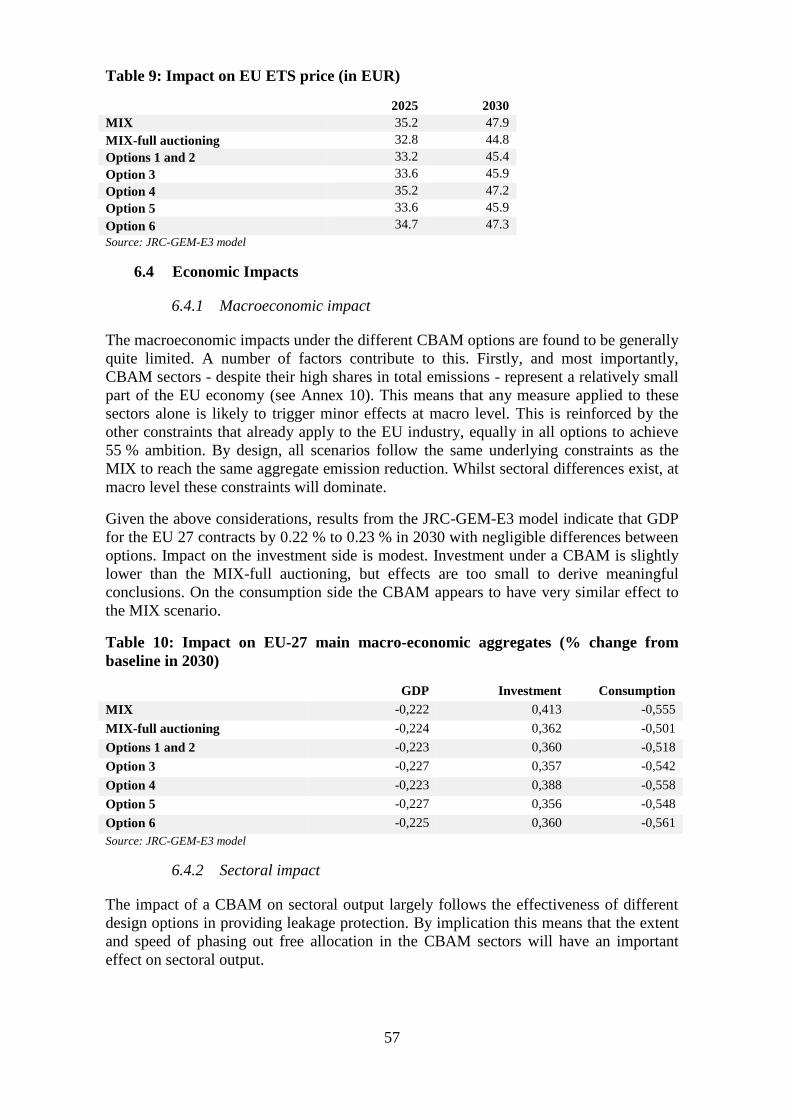
57
Table 9: Impact on EU ETS price (in EUR)
2025 2030
MIX 35.2 47.9
MIX-full auctioning 32.8 44.8
Options 1 and 2 33.2 45.4
Option 3 33.6 45.9
Option 4 35.2 47.2
Option 5 33.6 45.9
Option 6 34.7 47.3
Source: JRC-GEM-E3 model
6.4 Economic Impacts
6.4.1 Macroeconomic impact
The macroeconomic impacts under the different CBAM options are found to be generally
quite limited. A number of factors contribute to this. Firstly, and most importantly,
CBAM sectors - despite their high shares in total emissions - represent a relatively small
part of the EU economy (see Annex 10). This means that any measure applied to these
sectors alone is likely to trigger minor effects at macro level. This is reinforced by the
other constraints that already apply to the EU industry, equally in all options to achieve
55 % ambition. By design, all scenarios follow the same underlying constraints as the
MIX to reach the same aggregate emission reduction. Whilst sectoral differences exist, at
macro level these constraints will dominate.
Given the above considerations, results from the JRC-GEM-E3 model indicate that GDP
for the EU 27 contracts by 0.22 % to 0.23 % in 2030 with negligible differences between
options. Impact on the investment side is modest. Investment under a CBAM is slightly
lower than the MIX-full auctioning, but effects are too small to derive meaningful
conclusions. On the consumption side the CBAM appears to have very similar effect to
the MIX scenario.
Table 10: Impact on EU-27 main macro-economic aggregates (% change from
baseline in 2030)
GDP Investment Consumption
MIX -0,222 0,413 -0,555
MIX-full auctioning -0,224 0,362 -0,501
Options 1 and 2 -0,223 0,360 -0,518
Option 3 -0,227 0,357 -0,542
Option 4 -0,223 0,388 -0,558
Option 5 -0,227 0,356 -0,548
Option 6 -0,225 0,360 -0,561
Source: JRC-GEM-E3 model
6.4.2 Sectoral impact
The impact of a CBAM on sectoral output largely follows the effectiveness of different
design options in providing leakage protection. By implication this means that the extent
and speed of phasing out free allocation in the CBAM sectors will have an important
effect on sectoral output.
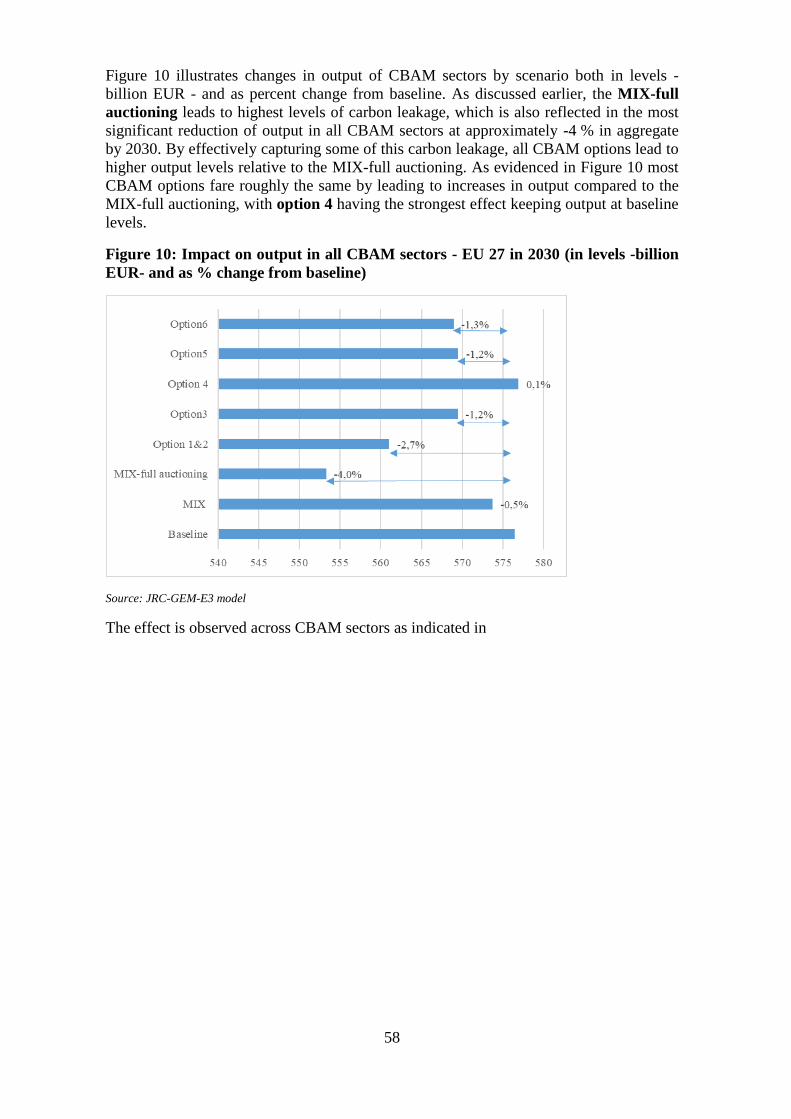
58
Figure 10 illustrates changes in output of CBAM sectors by scenario both in levels -
billion EUR - and as percent change from baseline. As discussed earlier, the MIX-full
auctioning leads to highest levels of carbon leakage, which is also reflected in the most
significant reduction of output in all CBAM sectors at approximately -4 % in aggregate
by 2030. By effectively capturing some of this carbon leakage, all CBAM options lead to
higher output levels relative to the MIX-full auctioning. As evidenced in Figure 10 most
CBAM options fare roughly the same by leading to increases in output compared to the
MIX-full auctioning, with option 4 having the strongest effect keeping output at baseline
levels.
Figure 10: Impact on output in all CBAM sectors - EU 27 in 2030 (in levels -billion
EUR- and as % change from baseline)
Source: JRC-GEM-E3 model
The effect is observed across CBAM sectors as indicated in
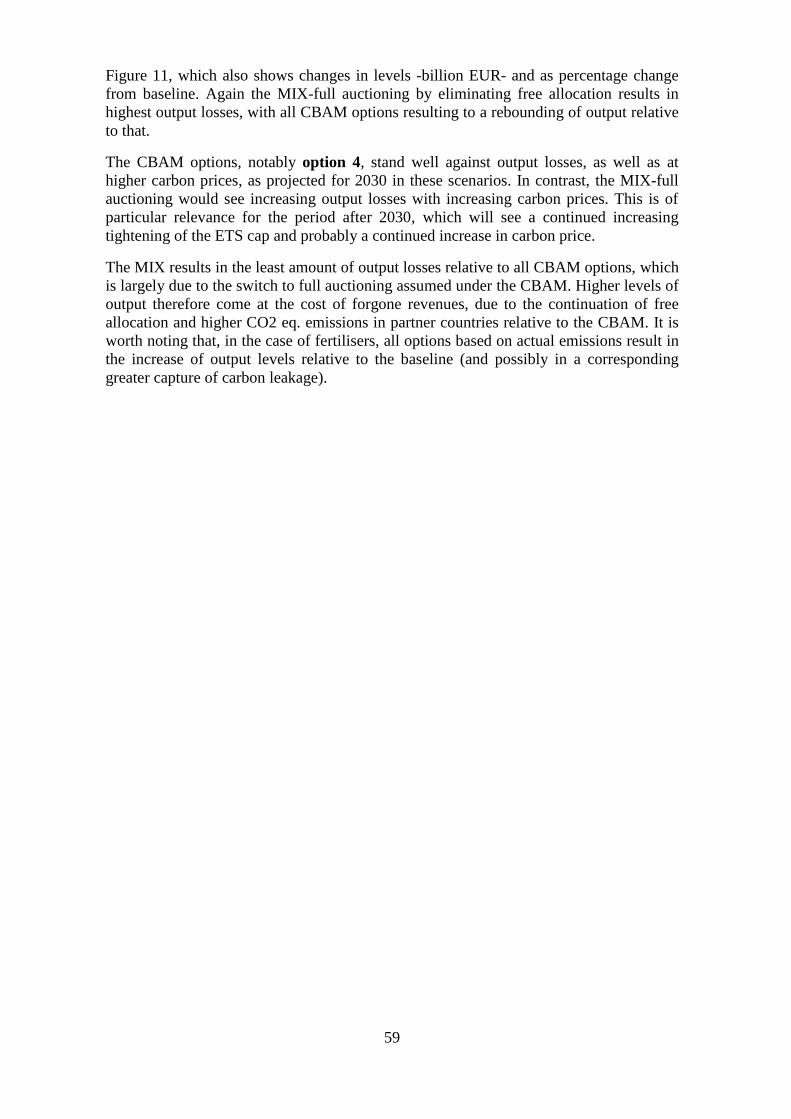
59
Figure 11, which also shows changes in levels -billion EUR- and as percentage change
from baseline. Again the MIX-full auctioning by eliminating free allocation results in
highest output losses, with all CBAM options resulting to a rebounding of output relative
to that.
The CBAM options, notably option 4, stand well against output losses, as well as at
higher carbon prices, as projected for 2030 in these scenarios. In contrast, the MIX-full
auctioning would see increasing output losses with increasing carbon prices. This is of
particular relevance for the period after 2030, which will see a continued increasing
tightening of the ETS cap and probably a continued increase in carbon price.
The MIX results in the least amount of output losses relative to all CBAM options, which
is largely due to the switch to full auctioning assumed under the CBAM. Higher levels of
output therefore come at the cost of forgone revenues, due to the continuation of free
allocation and higher CO2 eq. emissions in partner countries relative to the CBAM. It is
worth noting that, in the case of fertilisers, all options based on actual emissions result in
the increase of output levels relative to the baseline (and possibly in a corresponding
greater capture of carbon leakage).

60
Figure 11: Output in all CBAM sectors in the MIX, MIX-full auctioning and under
alternative CBAM options (in levels -billion EUR- and as % change from baseline) -
EU 27 in 2030
Source: JRC-GEM-E3 model

61
Figure 12 illustrates the effects on output by year for options 1, 2, 3 and 4. The figure
highlights how the gradual phase out of allowances (and respective phase in of CBAM)
under option 4 after 2025 relative to option 3 results in higher levels in 2030. The impact
of the phase in – phase out on output is more pronounced for iron and steel, cement, and
fertilisers, while it appears weaker for aluminium. By comparison, options 1 and 2 - by
adopting an immediate phase out as option 3 but applying a CBAM based on EU average
emissions - result in lower output relative to the options based on actual emissions
(options 3 and 4).
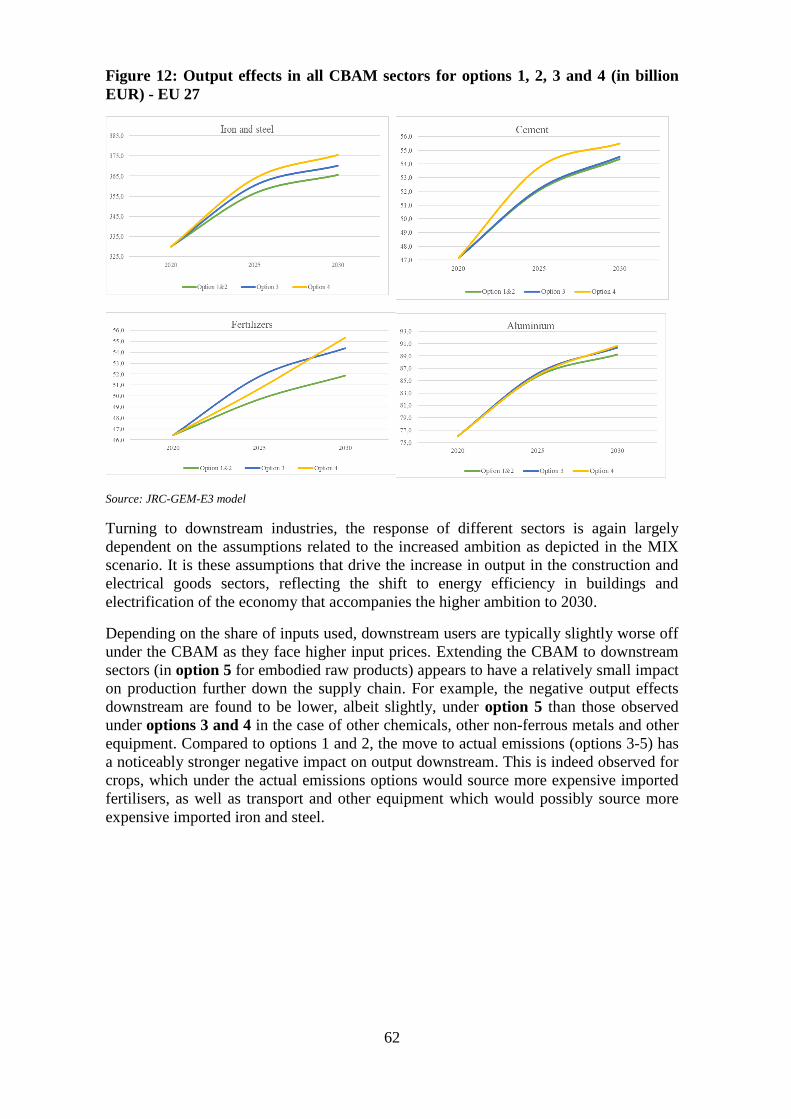
62
Figure 12: Output effects in all CBAM sectors for options 1, 2, 3 and 4 (in billion
EUR) - EU 27
Source: JRC-GEM-E3 model
Turning to downstream industries, the response of different sectors is again largely
dependent on the assumptions related to the increased ambition as depicted in the MIX
scenario. It is these assumptions that drive the increase in output in the construction and
electrical goods sectors, reflecting the shift to energy efficiency in buildings and
electrification of the economy that accompanies the higher ambition to 2030.
Depending on the share of inputs used, downstream users are typically slightly worse off
under the CBAM as they face higher input prices. Extending the CBAM to downstream
sectors (in option 5 for embodied raw products) appears to have a relatively small impact
on production further down the supply chain. For example, the negative output effects
downstream are found to be lower, albeit slightly, under option 5 than those observed
under options 3 and 4 in the case of other chemicals, other non-ferrous metals and other
equipment. Compared to options 1 and 2, the move to actual emissions (options 3-5) has
a noticeably stronger negative impact on output downstream. This is indeed observed for
crops, which under the actual emissions options would source more expensive imported
fertilisers, as well as transport and other equipment which would possibly source more
expensive imported iron and steel.
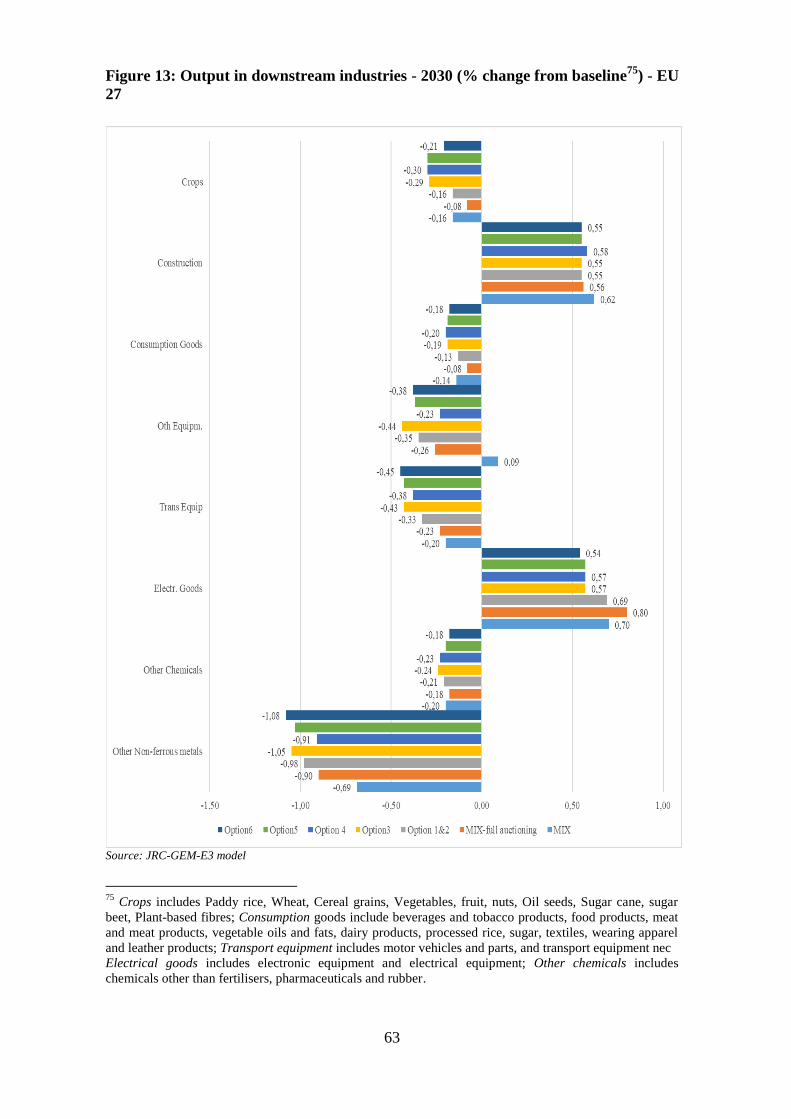
63
Figure 13: Output in downstream industries - 2030 (% change from baseline75
) - EU
27
Source: JRC-GEM-E3 model
75
Crops includes Paddy rice, Wheat, Cereal grains, Vegetables, fruit, nuts, Oil seeds, Sugar cane, sugar
beet, Plant-based fibres; Consumption goods include beverages and tobacco products, food products, meat
and meat products, vegetable oils and fats, dairy products, processed rice, sugar, textiles, wearing apparel
and leather products; Transport equipment includes motor vehicles and parts, and transport equipment nec
Electrical goods includes electronic equipment and electrical equipment; Other chemicals includes
chemicals other than fertilisers, pharmaceuticals and rubber.
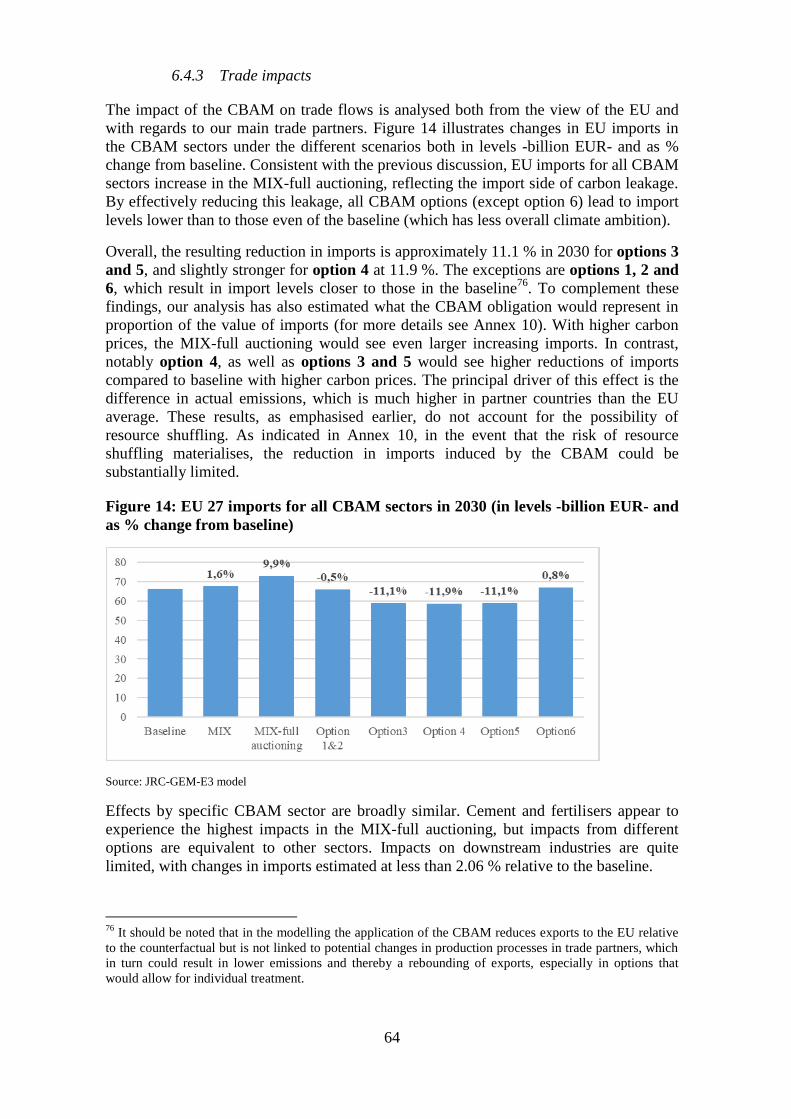
64
6.4.3 Trade impacts
The impact of the CBAM on trade flows is analysed both from the view of the EU and
with regards to our main trade partners. Figure 14 illustrates changes in EU imports in
the CBAM sectors under the different scenarios both in levels -billion EUR- and as %
change from baseline. Consistent with the previous discussion, EU imports for all CBAM
sectors increase in the MIX-full auctioning, reflecting the import side of carbon leakage.
By effectively reducing this leakage, all CBAM options (except option 6) lead to import
levels lower than to those even of the baseline (which has less overall climate ambition).
Overall, the resulting reduction in imports is approximately 11.1 % in 2030 for options 3
and 5, and slightly stronger for option 4 at 11.9 %. The exceptions are options 1, 2 and
6, which result in import levels closer to those in the baseline76
. To complement these
findings, our analysis has also estimated what the CBAM obligation would represent in
proportion of the value of imports (for more details see Annex 10). With higher carbon
prices, the MIX-full auctioning would see even larger increasing imports. In contrast,
notably option 4, as well as options 3 and 5 would see higher reductions of imports
compared to baseline with higher carbon prices. The principal driver of this effect is the
difference in actual emissions, which is much higher in partner countries than the EU
average. These results, as emphasised earlier, do not account for the possibility of
resource shuffling. As indicated in Annex 10, in the event that the risk of resource
shuffling materialises, the reduction in imports induced by the CBAM could be
substantially limited.
Figure 14: EU 27 imports for all CBAM sectors in 2030 (in levels -billion EUR- and
as % change from baseline)
Source: JRC-GEM-E3 model
Effects by specific CBAM sector are broadly similar. Cement and fertilisers appear to
experience the highest impacts in the MIX-full auctioning, but impacts from different
options are equivalent to other sectors. Impacts on downstream industries are quite
limited, with changes in imports estimated at less than 2.06 % relative to the baseline.
76
It should be noted that in the modelling the application of the CBAM reduces exports to the EU relative
to the counterfactual but is not linked to potential changes in production processes in trade partners, which
in turn could result in lower emissions and thereby a rebounding of exports, especially in options that
would allow for individual treatment.
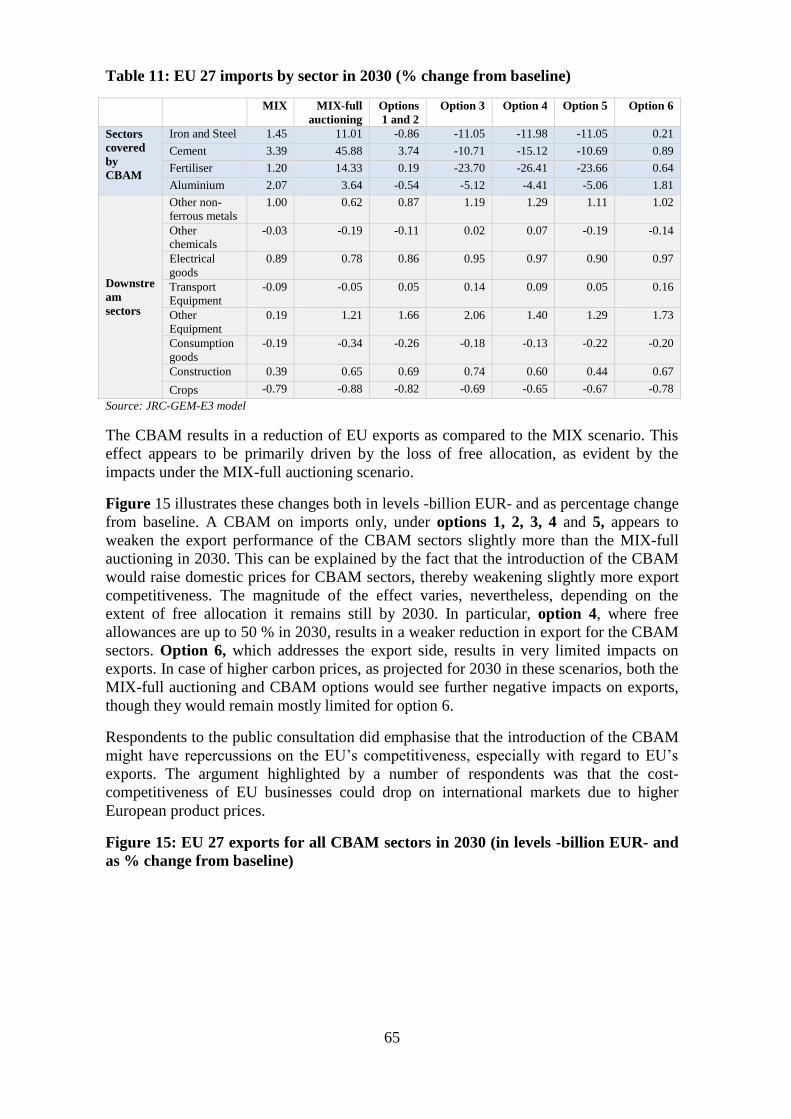
65
Table 11: EU 27 imports by sector in 2030 (% change from baseline)
MIX MIX-full
auctioning
Options
1 and 2
Option 3 Option 4 Option 5 Option 6
Sectors
covered
by
CBAM
Iron and Steel 1.45 11.01 -0.86 -11.05 -11.98 -11.05 0.21
Cement 3.39 45.88 3.74 -10.71 -15.12 -10.69 0.89
Fertiliser 1.20 14.33 0.19 -23.70 -26.41 -23.66 0.64
Aluminium 2.07 3.64 -0.54 -5.12 -4.41 -5.06 1.81
Downstre
am
sectors
Other non-
ferrous metals
1.00 0.62 0.87 1.19 1.29 1.11 1.02
Other
chemicals
-0.03 -0.19 -0.11 0.02 0.07 -0.19 -0.14
Electrical
goods
0.89 0.78 0.86 0.95 0.97 0.90 0.97
Transport
Equipment
-0.09 -0.05 0.05 0.14 0.09 0.05 0.16
Other
Equipment
0.19 1.21 1.66 2.06 1.40 1.29 1.73
Consumption
goods
-0.19 -0.34 -0.26 -0.18 -0.13 -0.22 -0.20
Construction 0.39 0.65 0.69 0.74 0.60 0.44 0.67
Crops -0.79 -0.88 -0.82 -0.69 -0.65 -0.67 -0.78
Source: JRC-GEM-E3 model
The CBAM results in a reduction of EU exports as compared to the MIX scenario. This
effect appears to be primarily driven by the loss of free allocation, as evident by the
impacts under the MIX-full auctioning scenario.
Figure 15 illustrates these changes both in levels -billion EUR- and as percentage change
from baseline. A CBAM on imports only, under options 1, 2, 3, 4 and 5, appears to
weaken the export performance of the CBAM sectors slightly more than the MIX-full
auctioning in 2030. This can be explained by the fact that the introduction of the CBAM
would raise domestic prices for CBAM sectors, thereby weakening slightly more export
competitiveness. The magnitude of the effect varies, nevertheless, depending on the
extent of free allocation it remains still by 2030. In particular, option 4, where free
allowances are up to 50 % in 2030, results in a weaker reduction in export for the CBAM
sectors. Option 6, which addresses the export side, results in very limited impacts on
exports. In case of higher carbon prices, as projected for 2030 in these scenarios, both the
MIX-full auctioning and CBAM options would see further negative impacts on exports,
though they would remain mostly limited for option 6.
Respondents to the public consultation did emphasise that the introduction of the CBAM
might have repercussions on the EU’s competitiveness, especially with regard to EU’s
exports. The argument highlighted by a number of respondents was that the cost-
competitiveness of EU businesses could drop on international markets due to higher
European product prices.
Figure 15: EU 27 exports for all CBAM sectors in 2030 (in levels -billion EUR- and
as % change from baseline)
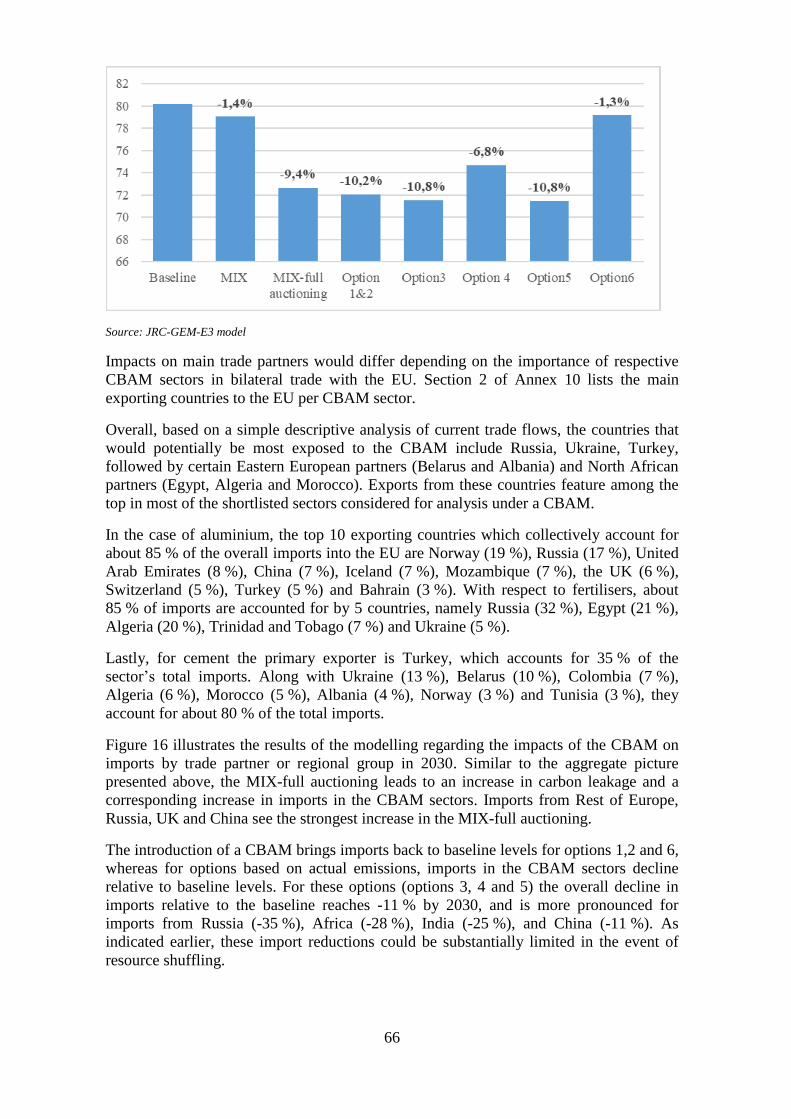
66
Source: JRC-GEM-E3 model
Impacts on main trade partners would differ depending on the importance of respective
CBAM sectors in bilateral trade with the EU. Section 2 of Annex 10 lists the main
exporting countries to the EU per CBAM sector.
Overall, based on a simple descriptive analysis of current trade flows, the countries that
would potentially be most exposed to the CBAM include Russia, Ukraine, Turkey,
followed by certain Eastern European partners (Belarus and Albania) and North African
partners (Egypt, Algeria and Morocco). Exports from these countries feature among the
top in most of the shortlisted sectors considered for analysis under a CBAM.
In the case of aluminium, the top 10 exporting countries which collectively account for
about 85 % of the overall imports into the EU are Norway (19 %), Russia (17 %), United
Arab Emirates (8 %), China (7 %), Iceland (7 %), Mozambique (7 %), the UK (6 %),
Switzerland (5 %), Turkey (5 %) and Bahrain (3 %). With respect to fertilisers, about
85 % of imports are accounted for by 5 countries, namely Russia (32 %), Egypt (21 %),
Algeria (20 %), Trinidad and Tobago (7 %) and Ukraine (5 %).
Lastly, for cement the primary exporter is Turkey, which accounts for 35 % of the
sector’s total imports. Along with Ukraine (13 %), Belarus (10 %), Colombia (7 %),
Algeria (6 %), Morocco (5 %), Albania (4 %), Norway (3 %) and Tunisia (3 %), they
account for about 80 % of the total imports.
Figure 16 illustrates the results of the modelling regarding the impacts of the CBAM on
imports by trade partner or regional group in 2030. Similar to the aggregate picture
presented above, the MIX-full auctioning leads to an increase in carbon leakage and a
corresponding increase in imports in the CBAM sectors. Imports from Rest of Europe,
Russia, UK and China see the strongest increase in the MIX-full auctioning.
The introduction of a CBAM brings imports back to baseline levels for options 1,2 and 6,
whereas for options based on actual emissions, imports in the CBAM sectors decline
relative to baseline levels. For these options (options 3, 4 and 5) the overall decline in
imports relative to the baseline reaches -11 % by 2030, and is more pronounced for
imports from Russia (-35 %), Africa (-28 %), India (-25 %), and China (-11 %). As
indicated earlier, these import reductions could be substantially limited in the event of
resource shuffling.

67
Figure 16: Value of imports into the EU-27 in all CBAM sectors in 2030 (in billion
EUR) 77
Source: JRC-GEM-E3 model
Figure 17 illustrates the impact of a CBAM on EU export by trade partner or regional
group in 2030. Overall, the CBAM has limited effects on exports relative to the MIX-full
auctioning. Both the scale and regional structure of exports are broadly the same under
options 1 to 5 and the MIX-full auctioning, with option 4 resulting in slightly higher
export levels overall, as also indicated earlier. Option 6, which addresses the export side,
also result in exports closer to baseline levels.
Figure 17: Value of exports from the EU-27 in all CBAM sectors in 2030 (in billion
EUR)
77
Rest of Europe includes EFTA countries, Western Balkans, Ukraine, Moldova and Belarus.
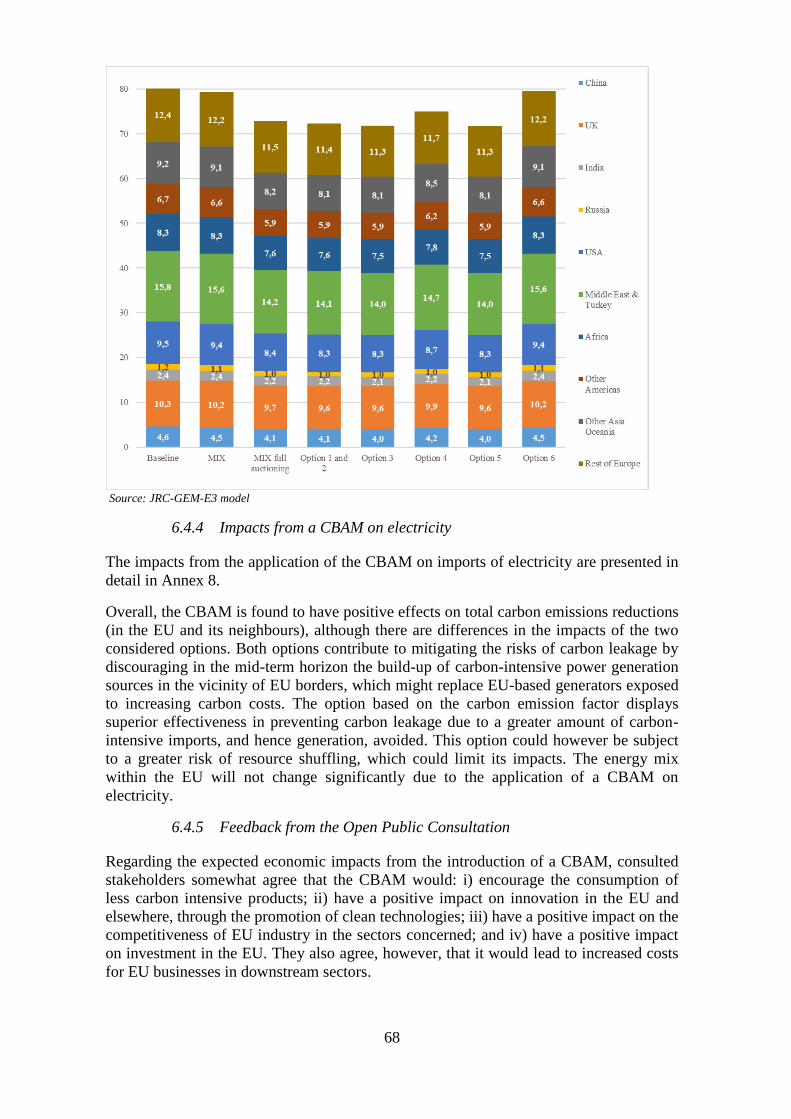
68
Source: JRC-GEM-E3 model
6.4.4 Impacts from a CBAM on electricity
The impacts from the application of the CBAM on imports of electricity are presented in
detail in Annex 8.
Overall, the CBAM is found to have positive effects on total carbon emissions reductions
(in the EU and its neighbours), although there are differences in the impacts of the two
considered options. Both options contribute to mitigating the risks of carbon leakage by
discouraging in the mid-term horizon the build-up of carbon-intensive power generation
sources in the vicinity of EU borders, which might replace EU-based generators exposed
to increasing carbon costs. The option based on the carbon emission factor displays
superior effectiveness in preventing carbon leakage due to a greater amount of carbon-
intensive imports, and hence generation, avoided. This option could however be subject
to a greater risk of resource shuffling, which could limit its impacts. The energy mix
within the EU will not change significantly due to the application of a CBAM on
electricity.
6.4.5 Feedback from the Open Public Consultation
Regarding the expected economic impacts from the introduction of a CBAM, consulted
stakeholders somewhat agree that the CBAM would: i) encourage the consumption of
less carbon intensive products; ii) have a positive impact on innovation in the EU and
elsewhere, through the promotion of clean technologies; iii) have a positive impact on the
competitiveness of EU industry in the sectors concerned; and iv) have a positive impact
on investment in the EU. They also agree, however, that it would lead to increased costs
for EU businesses in downstream sectors.
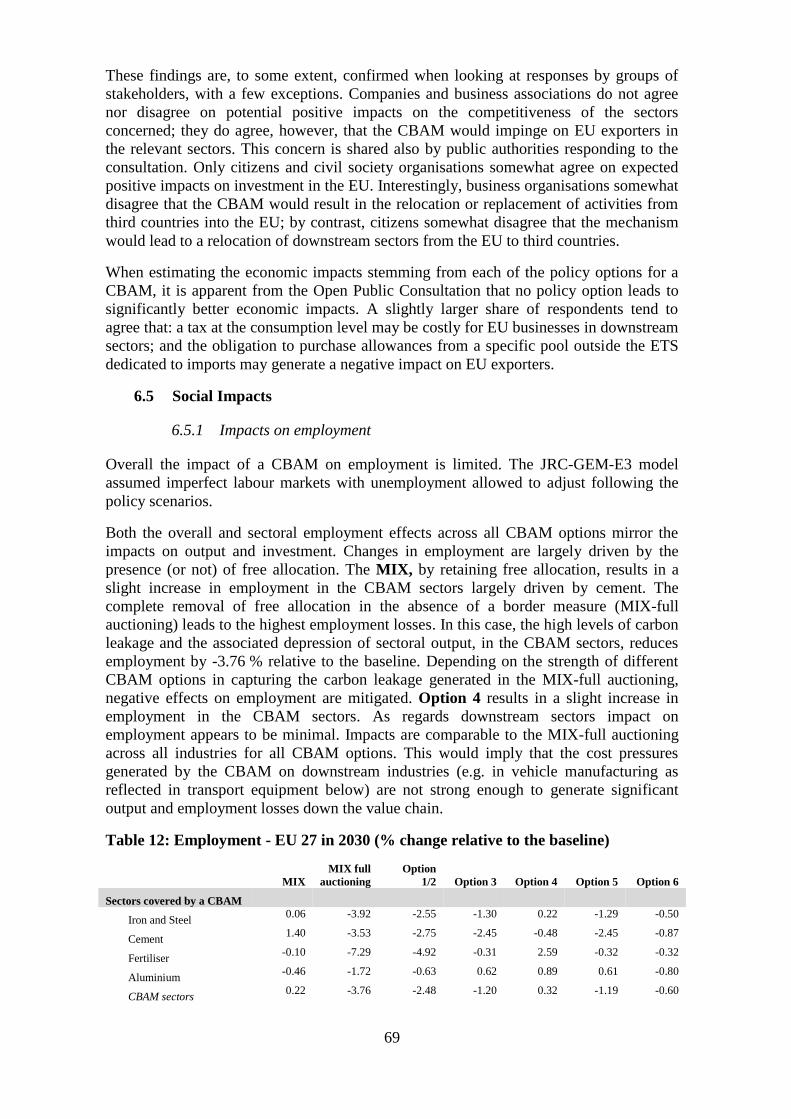
69
These findings are, to some extent, confirmed when looking at responses by groups of
stakeholders, with a few exceptions. Companies and business associations do not agree
nor disagree on potential positive impacts on the competitiveness of the sectors
concerned; they do agree, however, that the CBAM would impinge on EU exporters in
the relevant sectors. This concern is shared also by public authorities responding to the
consultation. Only citizens and civil society organisations somewhat agree on expected
positive impacts on investment in the EU. Interestingly, business organisations somewhat
disagree that the CBAM would result in the relocation or replacement of activities from
third countries into the EU; by contrast, citizens somewhat disagree that the mechanism
would lead to a relocation of downstream sectors from the EU to third countries.
When estimating the economic impacts stemming from each of the policy options for a
CBAM, it is apparent from the Open Public Consultation that no policy option leads to
significantly better economic impacts. A slightly larger share of respondents tend to
agree that: a tax at the consumption level may be costly for EU businesses in downstream
sectors; and the obligation to purchase allowances from a specific pool outside the ETS
dedicated to imports may generate a negative impact on EU exporters.
6.5 Social Impacts
6.5.1 Impacts on employment
Overall the impact of a CBAM on employment is limited. The JRC-GEM-E3 model
assumed imperfect labour markets with unemployment allowed to adjust following the
policy scenarios.
Both the overall and sectoral employment effects across all CBAM options mirror the
impacts on output and investment. Changes in employment are largely driven by the
presence (or not) of free allocation. The MIX, by retaining free allocation, results in a
slight increase in employment in the CBAM sectors largely driven by cement. The
complete removal of free allocation in the absence of a border measure (MIX-full
auctioning) leads to the highest employment losses. In this case, the high levels of carbon
leakage and the associated depression of sectoral output, in the CBAM sectors, reduces
employment by -3.76 % relative to the baseline. Depending on the strength of different
CBAM options in capturing the carbon leakage generated in the MIX-full auctioning,
negative effects on employment are mitigated. Option 4 results in a slight increase in
employment in the CBAM sectors. As regards downstream sectors impact on
employment appears to be minimal. Impacts are comparable to the MIX-full auctioning
across all industries for all CBAM options. This would imply that the cost pressures
generated by the CBAM on downstream industries (e.g. in vehicle manufacturing as
reflected in transport equipment below) are not strong enough to generate significant
output and employment losses down the value chain.
Table 12: Employment - EU 27 in 2030 (% change relative to the baseline)
MIX
MIX full
auctioning
Option
1/2 Option 3 Option 4 Option 5 Option 6
Sectors covered by a CBAM
Iron and Steel 0.06 -3.92 -2.55 -1.30 0.22 -1.29 -0.50
Cement 1.40 -3.53 -2.75 -2.45 -0.48 -2.45 -0.87
Fertiliser -0.10 -7.29 -4.92 -0.31 2.59 -0.32 -0.32
Aluminium -0.46 -1.72 -0.63 0.62 0.89 0.61 -0.80
CBAM sectors 0.22 -3.76 -2.48 -1.20 0.32 -1.19 -0.60

70
Downstream sectors
Other Non-ferrous metals
-0.34 -0.41 -0.46 -0.52 -0.43 -0.50 -0.58
Other Chemicals -0.12 -0.09 -0.12 -0.15 -0.14 -0.11 -0.10
Electrical Goods 0.87 1.02 0.91 0.77 0.76 0.76 0.72
Transport Equipment 0.00 0.09 -0.01 -0.13 -0.11 -0.13 -0.17
Other Equipment 0.23 -0.03 -0.11 -0.20 -0.03 -0.14 -0.14
Consumption Goods 0.05 0.23 0.19 0.13 0.07 0.12 0.11
Construction 0.05 0.23 0.19 0.13 0.07 0.12 0.11
Crops -0.20 -0.11 -0.17 -0.32 -0.07 -0.33 -0.44
Economy wide
0.04
0.04
0.05
0.04
0.05
0.04
0.05
Source: JRC-GEM-E3 model
6.5.2 Distributional impacts
The application of the CBAM on material industrial products is likely to have limited
impact on consumer prices because the measure is targeted at products upstream in the
value chain, and affects goods for final consumption only indirectly. The results from the
JRC-GEM-E3 model suggest that prices across most household consumption categories
increase only slightly across all options when compared to the MIX-full auctioning. The
highest increases are observed in fuels and power78
and under option 4. When compared
to the MIX with free allocation, price changes for certain energy-related consumption
categories decline slightly under the CBAM, following the changes in the carbon price
reported in
78
This is because CO2 prices are higher than in the MIX-full auctioning, and transport and buildings are
assumed to be included in the EU ETS in the MIX scenario.

71
Table 9. At the same time, more resource intensive products, such as household
appliances, vehicles (due to steel and aluminium) and to a lesser extent food (due to
fertilisers), experience small increases prices reflecting the increase in resource prices as
a consequence of full auction and the border measure CBAM. Nevertheless, the
estimated effects on final prices are particularly small to have a material impact on final
consumers.
This is reported in the table below.
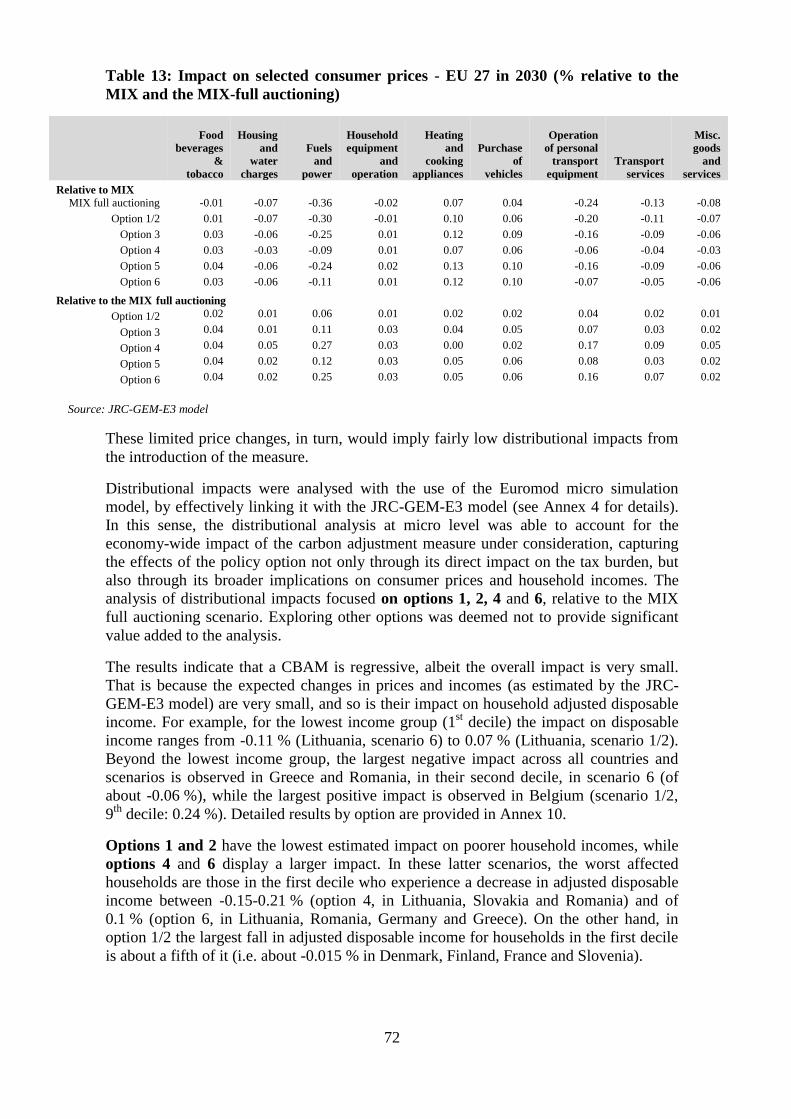
72
Table 13: Impact on selected consumer prices - EU 27 in 2030 (% relative to the
MIX and the MIX-full auctioning)
Food
beverages
&
tobacco
Housing
and
water
charges
Fuels
and
power
Household
equipment
and
operation
Heating
and
cooking
appliances
Purchase
of
vehicles
Operation
of personal
transport
equipment
Transport
services
Misc.
goods
and
services
Relative to MIX
MIX full auctioning -0.01 -0.07 -0.36 -0.02 0.07 0.04 -0.24 -0.13 -0.08
Option 1/2 0.01 -0.07 -0.30 -0.01 0.10 0.06 -0.20 -0.11 -0.07
Option 3 0.03 -0.06 -0.25 0.01 0.12 0.09 -0.16 -0.09 -0.06
Option 4 0.03 -0.03 -0.09 0.01 0.07 0.06 -0.06 -0.04 -0.03
Option 5 0.04 -0.06 -0.24 0.02 0.13 0.10 -0.16 -0.09 -0.06
Option 6 0.03 -0.06 -0.11 0.01 0.12 0.10 -0.07 -0.05 -0.06
Relative to the MIX full auctioning
Option 1/2 0.02 0.01 0.06 0.01 0.02 0.02 0.04 0.02 0.01
Option 3 0.04 0.01 0.11 0.03 0.04 0.05 0.07 0.03 0.02
Option 4 0.04 0.05 0.27 0.03 0.00 0.02 0.17 0.09 0.05
Option 5 0.04 0.02 0.12 0.03 0.05 0.06 0.08 0.03 0.02
Option 6 0.04 0.02 0.25 0.03 0.05 0.06 0.16 0.07 0.02
Source: JRC-GEM-E3 model
These limited price changes, in turn, would imply fairly low distributional impacts from
the introduction of the measure.
Distributional impacts were analysed with the use of the Euromod micro simulation
model, by effectively linking it with the JRC-GEM-E3 model (see Annex 4 for details).
In this sense, the distributional analysis at micro level was able to account for the
economy-wide impact of the carbon adjustment measure under consideration, capturing
the effects of the policy option not only through its direct impact on the tax burden, but
also through its broader implications on consumer prices and household incomes. The
analysis of distributional impacts focused on options 1, 2, 4 and 6, relative to the MIX
full auctioning scenario. Exploring other options was deemed not to provide significant
value added to the analysis.
The results indicate that a CBAM is regressive, albeit the overall impact is very small.
That is because the expected changes in prices and incomes (as estimated by the JRC-
GEM-E3 model) are very small, and so is their impact on household adjusted disposable
income. For example, for the lowest income group (1st decile) the impact on disposable
income ranges from -0.11 % (Lithuania, scenario 6) to 0.07 % (Lithuania, scenario 1/2).
Beyond the lowest income group, the largest negative impact across all countries and
scenarios is observed in Greece and Romania, in their second decile, in scenario 6 (of
about -0.06 %), while the largest positive impact is observed in Belgium (scenario 1/2,
9th
decile: 0.24 %). Detailed results by option are provided in Annex 10.
Options 1 and 2 have the lowest estimated impact on poorer household incomes, while
options 4 and 6 display a larger impact. In these latter scenarios, the worst affected
households are those in the first decile who experience a decrease in adjusted disposable
income between -0.15-0.21 % (option 4, in Lithuania, Slovakia and Romania) and of
0.1 % (option 6, in Lithuania, Romania, Germany and Greece). On the other hand, in
option 1/2 the largest fall in adjusted disposable income for households in the first decile
is about a fifth of it (i.e. about -0.015 % in Denmark, Finland, France and Slovenia).
73
Distributional impacts vary across countries. This is due to the different impact that the
same reform produces on prices of each good category and on incomes in each country.
Country disparities are also explained by the different consumption patterns across the
income distribution and the income structure of households. A detailed discussion of
distributional impacts by Member State is provided in Annex 10.
6.5.3 Feedback from the Open Public Consultation
On average, stakeholders participating in the consultation somewhat agree that the
CBAM would have both positive and negative social impacts. On the one hand,
respondents tend to agree that the mechanism would avoid job losses in the EU, which
would otherwise stem from the substitution of EU production with production from third
countries with lower climate ambition. On the other hand, they tend to agree that the
CBAM may: i) increase the price of consumer products, including those related to basic
needs (depending on the sectors covered); ii) lead to job losses in downstream sectors (by
increasing the cost of their inputs); and iii) generate potential negative effects on the
living standards of the poorer segments of the population.
The overall results are confirmed across all groups of stakeholders and regions, with a
few exceptions. Business organisations are more sceptical about the contribution of the
CBAM to avoiding job losses in the EU. By contrast, civil society organisations and
citizens neither agree nor disagree when it comes to negative impacts on jobs in
downstream sectors. When looking at the breakdown by geographical area, respondents
based in bordering countries show the highest level of agreement when it comes to
negative social impacts of the CBAM. Respondents from EEA countries, Switzerland
and the UK neither agree nor disagree on the expected negative impact on jobs in
downstream sectors.
Finally, when assessing the social impacts stemming from each of the policy options
under analysis, no policy option leads to significantly better social outcomes. A slightly
larger share of respondents tends to agree, however, that the obligation to purchase
allowances from a specific pool outside the ETS dedicated to imports (options 2, 3, 4, 5
in the Impact Assessment) may lead to job losses in downstream sectors and generate
negative effects on the living standards of the poorer segments of the population.
6.6 Administrative Impacts
In order to estimate the compliance costs for economic operators and determine the
drivers behind enforcement costs for authorities, data from cost assessment of existing
mechanisms is used. Cost elements are estimated based on similar elements in
instruments such as the EU ETS, national emissions trading systems, existing excise
duties or import taxes as well as the Clean Development Mechanism79 (CDM) as an
international instrument that monitors emissions from international installations and
projects. However, the CBAM will target imports of products and their embedded
emissions. Therefore, costs from existing mechanisms of monitoring installations’
emissions are generally doubled to create an estimation for the production of multiple
products in one installation.
79
See: https://cdm.unfccc.int/index.html
74
Generally speaking, compliance costs are assumed to arise for importers located in the
EU that would have to pay the CBAM obligation. This could be done either based on a
default value or by providing verified information about actual emissions. While the
monitoring of these actual emissions would take place outside the EU, the responsibility
– and thus costs – of providing the information regarding this monitoring to authorities
lies with the importers. More detailed data and analysis for this section can be found in
Annex 6.
6.6.1 Administrative burden for businesses
The baseline scenario would not change anything compared to the current situation as no
new obligations are introduced.
Design options 1 to 5 rely on an adjustment of carbon price at the border using the
payment options of an import tax or CBAM certificates. For these border instruments,
the cost elements are the following:
- First and most importantly, the quantification of the emissions value that forms
the basis of the calculation of the carbon price for design options that allow
claiming of actual emissions. This includes:
o monitoring the quantity of imported products;
o tracking the place of origin;
o monitoring the embedded GHG emissions of products stemming from the
production process;
o verification of the monitored emissions.
- Cost related to the documentation of the process, including the submission of
information to the CBAM registry.
- Costs related to making the payment.
- Costs related to the preparation for controls by the authorities.
The documentation and reporting of the quantities and emissions will also represent a
cost for businesses.
On the other hand, option 6 proposes to implement a CBAM with an excise duty system.
For this option, the cost elements differ and comprise the following steps:
- Again, the first important cost element is the quantification of the emissions value
and the related excise duty amount. As the excise duty option fully relies on
default values, this involves:
o monitoring the weight of basic materials, including imported and
domestically produced goods;
o accounting of the movement of the basic material along the value chain
including manufacturing businesses.
- Costs related to the administration of the processes, such as trading licenses or
requests for specific uses of the material.
- Costs related to the documentation of materials and goods.
- Costs related to the payment.
- Costs related to the verification of information by the authorities.
With respect to option 1, the first set of cost elements related to the quantification of
emissions, monitoring the quantity of imported products and their origin does not cause
substantial added burden to businesses. When emissions are declared at default value,
monitoring the emissions from the production process is not necessary and therefore also

75
cause limited costs. However, if importers decide to claim the use the actual emissions
from the production process, the monitoring creates additional costs for the business,
estimated to be between EUR 9.8 million and EUR 13.2 million in aggregate80
.
For options 2, 3, 4 and 5, as the cost assessment for an implementation using CBAM
certificates follows very similar requirements and thus also cost elements, the
considerations largely overlap with the one made above. For options 2 and 3, this cost
would amount to between EUR 9.8 million and EUR 14.3 million.
Administrative effort for option 4 is similar to option 3. However, there are additional
administrative costs for continuing to determine the level of free allocation that producers
should receive. Therefore, the combined administrative effort is higher than for options 3,
and would result in a cost increase for businesses.
For option 5, and as this option also relies on actual emissions, the total costs are similar
to option 3, although the broader coverage of the value chain adds more relevant
installations, importers and import transactions. This increases the compliance costs for
importers compared to similar designs only targeting basic materials (and basic material
products).
Under option 6, default values have to be determined both for materials and
manufactured goods. Administrative effort is relatively low for producers of materials in
the EU, since the excise duty relies on default values for basic materials, which means
producers do not have to demonstrate the carbon intensity of their production. However,
they will have to report production volumes to the competent authorities. Manufacturers
along the value chain would have some additional effort, since the use of duty suspension
arrangements would require them to report the weight of basic materials upon the sale of
their products, as well as submit periodic returns to the relevant national authorities81
.
However, where increased administrative costs outweigh the carbon costs of materials in
products, manufacturers would also have the option to pay the excise duty rather than
register under the duty suspension regime.
Administrative costs for international firms are relatively low, since importers would be
charged according to the weight of the material imported, without having to demonstrate
the carbon intensity of the production process. For the same reason, no verification
efforts for the carbon intensity of imported goods are needed for EU authorities.
Compliance risks are also low due to the absence of a need for extraterritorial
verification. For option 6, the estimated yearly total is between EUR 14.7 million and
EUR 28.7 million (detailed calculation in Annex 6).
In all options, a CBAM would result in relatively higher compliance costs for Small and
Medium-sized Enterprises (‘SMEs’) compared to large enterprises. Indeed, while the
available data does not allow for a quantitative assessment of impacts of a CBAM
specifically on SMEs, the literature suggests that there is a significant difference between
large and smaller companies when it comes to administrative burden of tax or customs
measures, or for MRV of carbon emissions (see Annex 6).
80
Calculated based on the estimates and the number of cases. 81
Ismer, R., Haussner, M., Neuhoff, K., & Acworth, W., ‘Inclusion of Consumption into Emissions
Trading Systems: Legal Design and Practical Administration’, 2016. http://climatestrategies.org/wp-
content/uploads/2016/05/CS-Administration-of-IoC-02052016-formatted3.pdf

76
6.6.2 Administrative impact for authorities
Authorities face comparable cost elements to the businesses, with the difference that
costs arise from assessing information and controlling the reports from economic
operators. Therefore, the options that have been found to be more costly for businesses
above, in general also create higher costs for authorities.
An overarching cost element is to have the necessary IT technology in place. Collected
data at the time of import by customs authorities needs to be shared with the authorities
in charge of assessing declared actual emissions and connecting the imported products to
CBAM certificates either already surrendered at that point or to be. A central CBAM
Authority or national authorities tasked with the CBAM will, in the design options
involving surrender of CBAM certificates, be assigned the task of selling these
certificates and conducting monitoring and verification of importers surrendering
sufficient CBAM certificates to cover for embedded emissions in imported materials. In
the case of a centralised system, the establishment of a central CBAM Authority would
not mean establishing a new agency, but the necessary tasks could be dealt with by an
existing body. For a decentralised CBAM, a limited number of functions would still need
to be carried out at central level, for example the supervision of national customs and
climate authorities, or the publication of CBAM certificate prices. The interaction
between the central CBAM Authority and national authorities, as well as how the
collection of necessary data for the operation of a well-functioning CBAM could be
shared between this body and other authorities, primarily national custom authorities, is a
matter to be closely evaluated during the finalization of the CBAM proposal. This also
relates to the way the CBAM revenue will be collected as an EU-own resource. The same
also applies to the option of implementation as an excise duty as this would also require
an interface between Member States and the Commission, including the customs
organisations.
According to experience collected through the management of tax administration, this
can represent a major share of the costs. Across the options assessed below, the need for
additional IT systems varies slightly depending on their complexity and need for
collaboration, but additional infrastructure would in all cases be necessary to process the
data and share it between customs and CBAM authorities. Similarly to some existing
requirements on imported goods, such as ozone-depleting substances or F-gases, the
CBAM could also be part of the recently launched Single Window Environment for
Customs which facilitates automatic assessment and sharing of import-related data.
Including the CBAM obligation in this environment would reduce costs for IT systems
and also for the processing of the documents. However, the process of setting this up
would require time and result in some limitations in the implementation. For example, a
centralised assessment of monitoring data would be necessary. A decentralised approach
involving Member States’ existing structures would not be supported by this
environment, as discussions with Commission experts have shown.
Under option 1, efforts are necessary for processing documents, administering payments
and controlling the correct declaration of goods. In the case of actual emissions reported,
these reports and validations would need to be assessed as well. Additional controls by
customs authorities would be necessary to ensure that the right product categories are
declared. A high level of carbon price may increase the risk of fraud by not declaring
products that should be subject to the CBAM. Therefore, the controls at entry points to
the EU on a sample of imports are necessary, and result in additional enforcement costs.
An import tax with the option to present actual emission values has a higher complexity
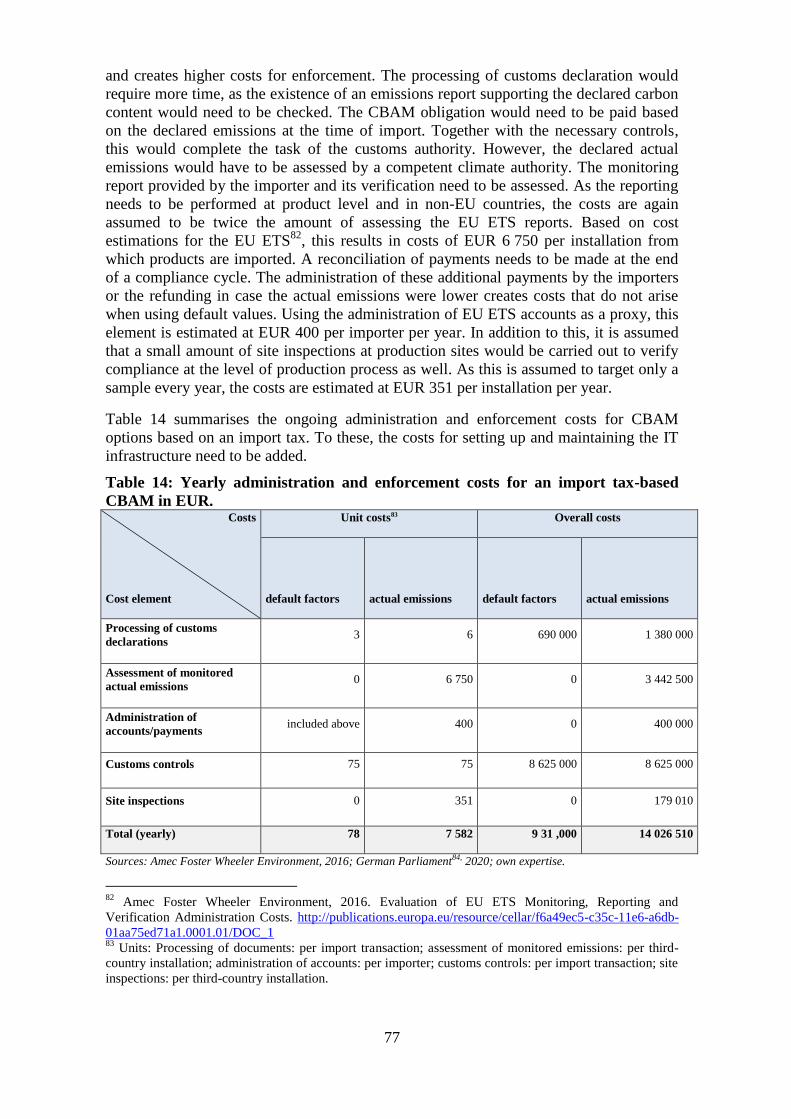
77
and creates higher costs for enforcement. The processing of customs declaration would
require more time, as the existence of an emissions report supporting the declared carbon
content would need to be checked. The CBAM obligation would need to be paid based
on the declared emissions at the time of import. Together with the necessary controls,
this would complete the task of the customs authority. However, the declared actual
emissions would have to be assessed by a competent climate authority. The monitoring
report provided by the importer and its verification need to be assessed. As the reporting
needs to be performed at product level and in non-EU countries, the costs are again
assumed to be twice the amount of assessing the EU ETS reports. Based on cost
estimations for the EU ETS82
, this results in costs of EUR 6 750 per installation from
which products are imported. A reconciliation of payments needs to be made at the end
of a compliance cycle. The administration of these additional payments by the importers
or the refunding in case the actual emissions were lower creates costs that do not arise
when using default values. Using the administration of EU ETS accounts as a proxy, this
element is estimated at EUR 400 per importer per year. In addition to this, it is assumed
that a small amount of site inspections at production sites would be carried out to verify
compliance at the level of production process as well. As this is assumed to target only a
sample every year, the costs are estimated at EUR 351 per installation per year.
Table 14 summarises the ongoing administration and enforcement costs for CBAM
options based on an import tax. To these, the costs for setting up and maintaining the IT
infrastructure need to be added.
Table 14: Yearly administration and enforcement costs for an import tax-based
CBAM in EUR. Costs
Cost element
Unit costs83 Overall costs
default factors actual emissions default factors actual emissions
Processing of customs
declarations 3 6 690 000 1 380 000
Assessment of monitored
actual emissions 0 6 750 0 3 442 500
Administration of
accounts/payments included above 400 0 400 000
Customs controls 75 75 8 625 000 8 625 000
Site inspections 0 351 0 179 010
Total (yearly) 78 7 582 9 31 ,000 14 026 510
Sources: Amec Foster Wheeler Environment, 2016; German Parliament84, 2020; own expertise.
82
Amec Foster Wheeler Environment, 2016. Evaluation of EU ETS Monitoring, Reporting and
Verification Administration Costs. http://publications.europa.eu/resource/cellar/f6a49ec5-c35c-11e6-a6db-
01aa75ed71a1.0001.01/DOC_1 83
Units: Processing of documents: per import transaction; assessment of monitored emissions: per third-
country installation; administration of accounts: per importer; customs controls: per import transaction; site
inspections: per third-country installation.
78
For options 2, 3, 4 and 5, the administration and enforcement costs are structured
similarly to option 1 described above. The main difference is the greater involvement of a
CBAM authority responsible for issuing and administering the surrender of the CBAM
certificates. Empowering a central CBAM authority for the entire Union would minimize
the relevant administrative costs associated with this task. In contrast to this, a set-up
similar to the EU ETS with national competent authorities could also be conceivable.
This is expected to result in higher costs because of the stronger need for collaboration
and coordination of the assessment of monitoring reports, but such a decentralised
approach could be easier to implement, as it would rely on existing capabilities in EU
Member States.
As the CBAM based on import certificates would also be charged in relation to import,
customs authorities need to process the information related to the imported product on
behalf of the Union. Sufficient data to calculate the amount of necessary CBAM
certificates would have to be included in the customs declaration and either certificates
would be directly surrendered or added up for a final balance covering a full calendar
year. In all cases, customs will always have an important role and will face costs. The
option of requiring a surrender or proof of surrender of the CBAM certificates at the time
of import will have a significantly higher impact on customs costs. If customs authorities
only collect this information on behalf of a CBAM authority that in turn performs the
yearly balance, reconciliation and ensures submission, the costs for customs authorities
are lower, as those costs would be shifted to the CBAM authority. The costs would arise
in both cases, either for customs authorities or for the CBAM authority, and are for this
assessment assumed to be similar to each other.
For the options based on import certificates, the administration of the importers’ accounts
would be the main cost difference to the costs of an import tax. The costs here are
estimated based on the assessment of such costs for the national implementation of the
ETS in Germany85
. Because of the higher complexity resulting from international
accounts that also need to be administered, the reported costs are again doubled. As a
result, EUR 400 per year and importer account are assumed for the administration of
accounts and payments such as the supervision of the surrender of allowances. Additional
customs controls are estimated similarly to the costs for the import tax.
The possibility to provide actual emissions as basis for the calculation of the CBAM
creates higher costs compared to the use of default values. The need for emission
monitoring reports to support the claimed actual emissions on which the self-declared
CBAM obligation is calculated creates further complexity for the processing of customs
declaration in the customs authorities. Similar to the import tax, the monitoring reports
and verifications need to be assessed by a responsible authority, for example the central
EU CBAM authority. The costs for this are – just as for the import tax above – estimated
at EUR 6 750 per report. This cost element could increase in the case of decentralised
assessment of the MRV documents. In this case, authorities on multiple Member States
would have to assess the documents of an installation, unless exchange and acceptance of
84
German Parliament, 2020a. Entwurf eines Jahressteuergesetzes 2020.
http://dipbt.bundestag.de/dip21/btd/19/228/1922850.pdf
See also: https://ec.europa.eu/taxation_customs/business/vat/modernising-vat-cross-border-ecommerce_en 85
See: German Parliament, 2020: Entwurf eines Gesetzes zur Anpassung der Rechtsgrundlagen für die
Fortentwicklung des Europäischen Emissionshandels.
https://www.bmu.de/fileadmin/Daten_BMU/Download_PDF/Glaeserne_Gesetze/19._Lp/tehg_novelle/ent
wurf/tehg-novelle_180801_rege_bf.pdf
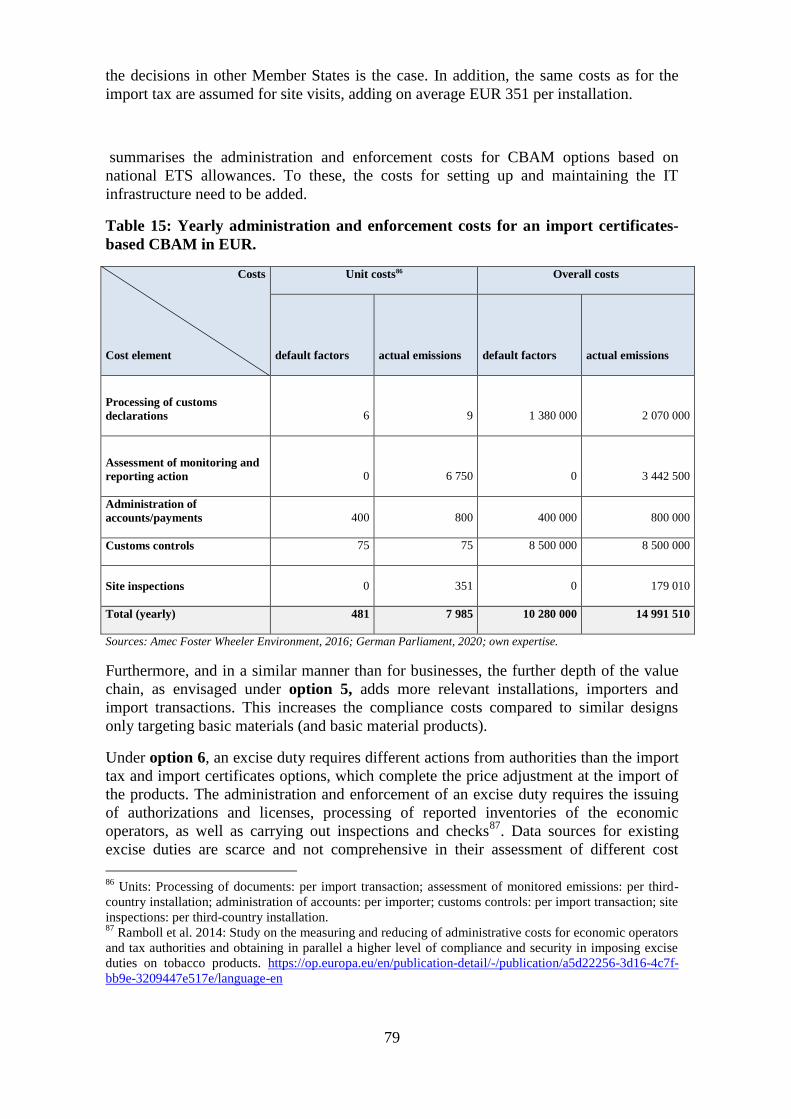
79
the decisions in other Member States is the case. In addition, the same costs as for the
import tax are assumed for site visits, adding on average EUR 351 per installation.
summarises the administration and enforcement costs for CBAM options based on
national ETS allowances. To these, the costs for setting up and maintaining the IT
infrastructure need to be added.
Table 15: Yearly administration and enforcement costs for an import certificates-
based CBAM in EUR.
Costs
Cost element
Unit costs86 Overall costs
default factors actual emissions default factors actual emissions
Processing of customs
declarations 6 9 1 380 000 2 070 000
Assessment of monitoring and
reporting action 0 6 750 0 3 442 500
Administration of
accounts/payments 400 800 400 000 800 000
Customs controls 75 75 8 500 000 8 500 000
Site inspections 0 351 0 179 010
Total (yearly) 481 7 985 10 280 000 14 991 510
Sources: Amec Foster Wheeler Environment, 2016; German Parliament, 2020; own expertise.
Furthermore, and in a similar manner than for businesses, the further depth of the value
chain, as envisaged under option 5, adds more relevant installations, importers and
import transactions. This increases the compliance costs compared to similar designs
only targeting basic materials (and basic material products).
Under option 6, an excise duty requires different actions from authorities than the import
tax and import certificates options, which complete the price adjustment at the import of
the products. The administration and enforcement of an excise duty requires the issuing
of authorizations and licenses, processing of reported inventories of the economic
operators, as well as carrying out inspections and checks87
. Data sources for existing
excise duties are scarce and not comprehensive in their assessment of different cost
86
Units: Processing of documents: per import transaction; assessment of monitored emissions: per third-
country installation; administration of accounts: per importer; customs controls: per import transaction; site
inspections: per third-country installation. 87
Ramboll et al. 2014: Study on the measuring and reducing of administrative costs for economic operators
and tax authorities and obtaining in parallel a higher level of compliance and security in imposing excise
duties on tobacco products. https://op.europa.eu/en/publication-detail/-/publication/a5d22256-3d16-4c7f-
bb9e-3209447e517e/language-en
80
elements. The central element influencing the costs for enforcement of an excise duty is
the requirement for movement control within a duty suspension arrangement, as well as
obtaining data from the producers and traders participating in this system. This is the case
for excise duties on highly taxed products like tobacco. The high costs – not only for
authorities but also for economic operators – are mentioned by the experts. As the excise
duty systems to implement a CBAM is assumed not to require such real-time tracking,
the costs of enforcement can be limited in this respect.
Still, the excise duties require processing data reported by businesses, maintaining the
data infrastructure and monitoring compliance through controls. Important factors
influencing the administration and enforcement costs are the complexity of products and
the number of producers obliged to pay the excise duty. A higher number of producers
increases costs for the authorities. The number of producers will be high compared to
other excisable goods, because of the nature of the covered products as basic materials
for many value chains.
Because of the nature of product and the similarity in set-up, consumption charges for
plastic provide a good reference point for the administration and enforcement of an
excise duty on carbon intensive basic materials. Currently, a plastic levy is in preparation
in the United Kingdom. This provides an estimation of the overall ongoing costs. The
impact assessment performed by the UK government foresees EUR 12.9 million per year
for ongoing costs. This includes implementing continuous changes in the collection
systems, compliance monitoring and support to customers. An EU CBAM system could
thus be expected to result in higher yearly costs than this. With the available evidence
base, a more precise quantification is difficult to achieve.
6.6.3 Administrative impact electricity
In view of the relatively limited number of undertakings engaged in the business of
importing electricity, the total administrative costs associated with compliance are
expected to be rather low.
6.6.4 Feedback from the Open Public Consultation
About 95 % of the respondents agree that the CBAM could increase administrative
burdens for exporters and importers. The lion’s share of respondents (430/478) indicating
an increase in administrative burdens believe that the CBAM could entail burdensome
verification and reporting procedures (430/478), and require a complex approach to
establish the carbon content of the product (376/478); more than half of them (265/478)
also believe that administrative burdens will increase due to the needed alignment with
measurement standards. Similar results are recorded across all stakeholder groups and
geographical areas.
Almost 93 % of respondents envisage an increase in administrative burdens borne by
public administrations in the EU. More specifically, a large share of respondents
indicating such an increase in administrative burdens believe that public administrations
will face monitoring needs (413/460) as well as the need to adjust customs systems
(328/460). Similar results are registered across all stakeholder groups and geographical
areas; public authorities and stakeholders based in other non-EU countries, however, give
more relevance to adjustments of customs systems than to monitoring needs to explain
such an increase in administrative burdens for public administrations.
81
Although the majority of respondents (336/480) confirm that the CBAM is expected to
generate relatively higher administrative burdens for small and medium-sized enterprises
(SMEs), almost one third of respondents (144/480) do not agree with this conclusion.
When looking at the breakdown by stakeholder cluster, the majority of companies
(225/268) and public authorities (11/14) believe that SMEs will face higher
administrative burdens; by contrast, slightly more than half of the respondents
representing civil society organisations (33/57) and less than half of citizens (67/141)
expect higher costs for SMEs. Results similar to those recorded in the entire sample are
consistent in all geographical areas, except for bordering countries, where the vast
majority of respondents indicate a stronger increase in administrative burdens for SMEs.
6.7 Revenue Generation Impacts
All options where free allocation is fully removed (1, 2, 3, and 5) as well as option 6
generate additional revenues, above EUR 14 billion per year in 2030. Option 5 provides
the highest revenue. Option 4, which is based on partial phase out of free allocation,
results in lower revenues in 2030 by comparison, at EUR 9.1 billion per year. Beyond
2030 and as free allocation is phased out and the CBAM is phased in, revenue should
continue to increase in the EU and at the border for this option, eventually reaching the
same levels as option 3.
Three main elements impact the revenue.
The first is the switch from free allocation to full auctioning. This explains why option 4,
where this effect is phased in after 2025 over 10 years, produces less revenue in 2030.
The second is the revenue collected at the border; this revenue in all options is
significantly lower than the revenue collected from auctioning in the EU ETS (at most
the CBAM revenue is less than one fifth of the EU ETS revenue in option 3). This
reflects the proportion between production in the EU and imports in the CBAM sectors.
Extending the CBAM down the supply chain, as envisaged under option 5, increases the
revenue generated at the border, which remains however limited compared to the revenue
generated by the termination of free allocations in all scenarios.
Overall, total revenues will depend on effective level of carbon prices. The CBAM can
have a limited effect on the demand for ETS allowances from industrial sectors and
hence on the carbon prices. This has an effect on ETS revenues not only in CBAM
sectors but in the whole ETS. This effect, however is not very significant.
Revenue impacts are presented below for 2030. In the longer term, the potential
evolution of revenues would depend on the future level of the carbon price and the
embedded emissions in the imported CBAM products. Whilst the carbon price may
continue to rise in the future, the emissions embedded in the CBAM products from the
EU’s trade partners may decline as a consequence of the application of the CBAM, the
latter expected to encourage the adoption of zero or low emission technologies in other
countries. This may result in lower revenue levels for all options in the longer term.
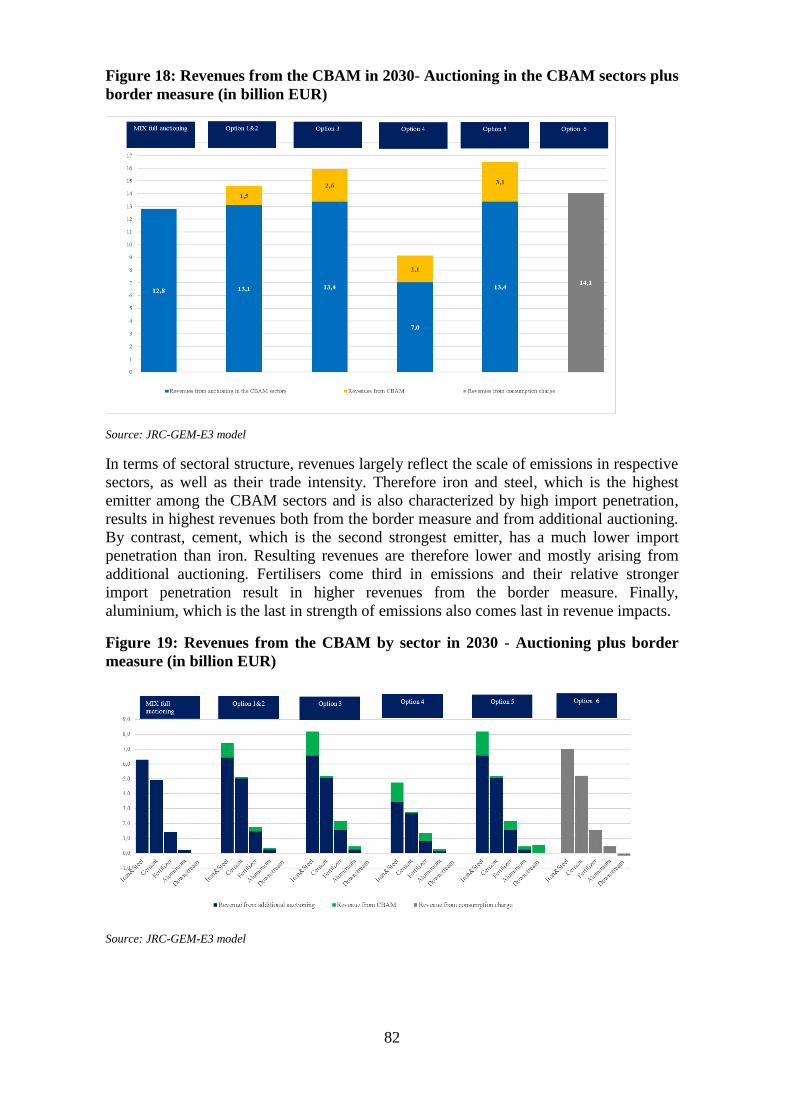
82
Figure 18: Revenues from the CBAM in 2030- Auctioning in the CBAM sectors plus
border measure (in billion EUR)
Source: JRC-GEM-E3 model
In terms of sectoral structure, revenues largely reflect the scale of emissions in respective
sectors, as well as their trade intensity. Therefore iron and steel, which is the highest
emitter among the CBAM sectors and is also characterized by high import penetration,
results in highest revenues both from the border measure and from additional auctioning.
By contrast, cement, which is the second strongest emitter, has a much lower import
penetration than iron. Resulting revenues are therefore lower and mostly arising from
additional auctioning. Fertilisers come third in emissions and their relative stronger
import penetration result in higher revenues from the border measure. Finally,
aluminium, which is the last in strength of emissions also comes last in revenue impacts.
Figure 19: Revenues from the CBAM by sector in 2030 - Auctioning plus border
measure (in billion EUR)
Source: JRC-GEM-E3 model
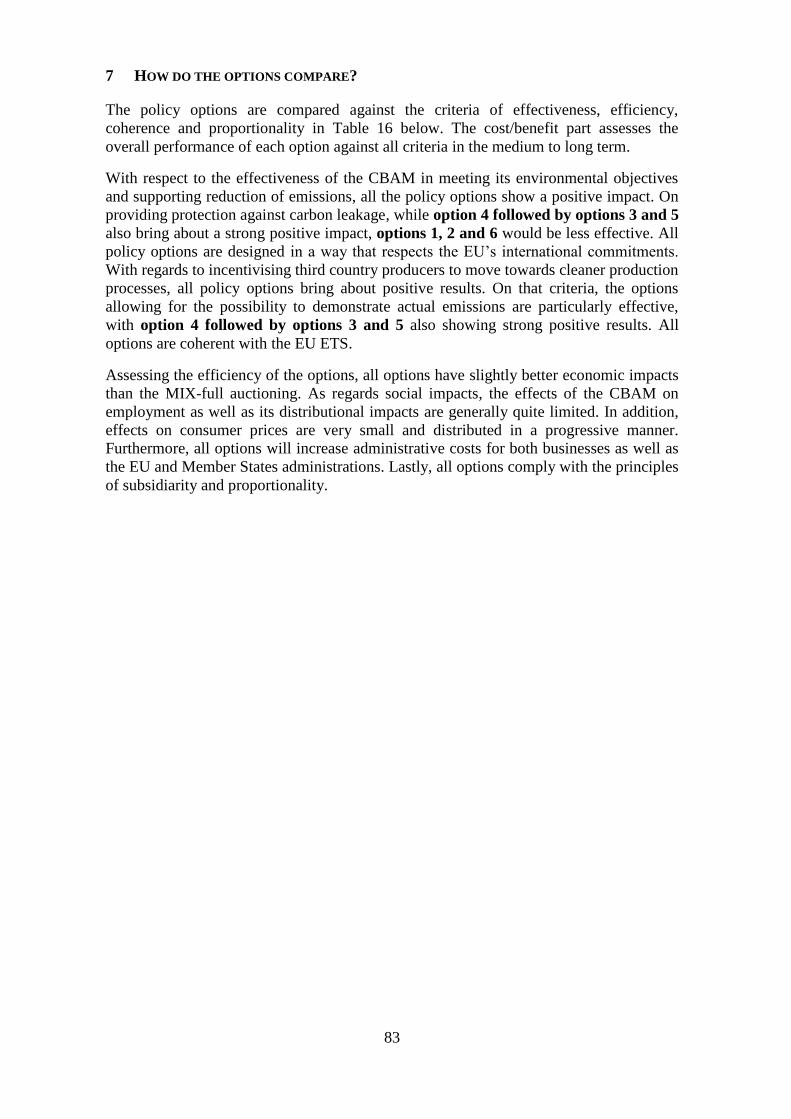
83
7 HOW DO THE OPTIONS COMPARE?
The policy options are compared against the criteria of effectiveness, efficiency,
coherence and proportionality in Table 16 below. The cost/benefit part assesses the
overall performance of each option against all criteria in the medium to long term.
With respect to the effectiveness of the CBAM in meeting its environmental objectives
and supporting reduction of emissions, all the policy options show a positive impact. On
providing protection against carbon leakage, while option 4 followed by options 3 and 5
also bring about a strong positive impact, options 1, 2 and 6 would be less effective. All
policy options are designed in a way that respects the EU’s international commitments.
With regards to incentivising third country producers to move towards cleaner production
processes, all policy options bring about positive results. On that criteria, the options
allowing for the possibility to demonstrate actual emissions are particularly effective,
with option 4 followed by options 3 and 5 also showing strong positive results. All
options are coherent with the EU ETS.
Assessing the efficiency of the options, all options have slightly better economic impacts
than the MIX-full auctioning. As regards social impacts, the effects of the CBAM on
employment as well as its distributional impacts are generally quite limited. In addition,
effects on consumer prices are very small and distributed in a progressive manner.
Furthermore, all options will increase administrative costs for both businesses as well as
the EU and Member States administrations. Lastly, all options comply with the principles
of subsidiarity and proportionality.
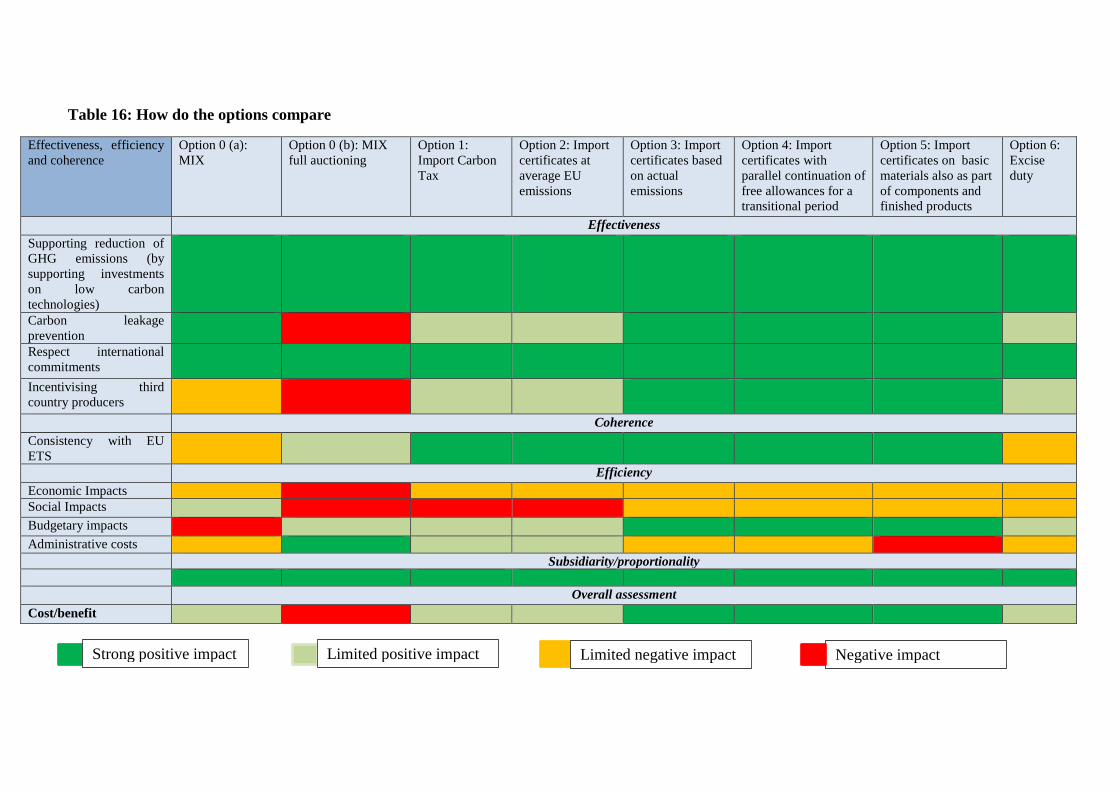
Table 16: How do the options compare
Effectiveness, efficiency
and coherence
Option 0 (a):
MIX
Option 0 (b): MIX
full auctioning
Option 1:
Import Carbon
Tax
Option 2: Import
certificates at
average EU
emissions
Option 3: Import
certificates based
on actual
emissions
Option 4: Import
certificates with
parallel continuation of
free allowances for a
transitional period
Option 5: Import
certificates on basic
materials also as part
of components and
finished products
Option 6:
Excise
duty
Effectiveness
Supporting reduction of
GHG emissions (by
supporting investments
on low carbon
technologies)
Carbon leakage
prevention
Respect international
commitments
Incentivising third
country producers
Coherence
Consistency with EU
ETS
Efficiency
Economic Impacts
Social Impacts
Budgetary impacts
Administrative costs
Subsidiarity/proportionality
Overall assessment
Cost/benefit
Strong positive impact Limited positive impact Limited negative impact
fimpaimimpaimpact
Negative impact
8 PREFERRED OPTION
When proposing its updated 2030 greenhouse gas emissions reduction target of at least
55 %88
, the European Commission also described the actions across all sectors of the
economy that would complement national efforts to achieve the increased ambition. A
number of impact assessments have been prepared to support the envisaged revisions of
key legislative instruments.
Against this background, this impact assessment has analysed the various options
through which the introduction of a Carbon Border Adjustment Mechanism could
effectively and efficiently contribute to the delivery of the updated target as part of a
wider ‘Fit for 55’ policy package.
8.1. Methodological approach
Drawing conclusions about preferred options from this analysis requires tackling two
methodological issues.
First, as is often the case in impact assessment analysis, ranking options may not be
straightforward as it may not be possible to compare options through a single metric and
no option may clearly dominate the others across relevant criteria. Ranking then requires
an implicit weighting of the different criteria that can only be justifiably established at
the political level. In such cases, an impact assessment should wean out as many inferior
options as possible while transparently provide the information required for political
decision- making. This is what this report does for the introduction of the CBAM, based
on the objectives of the measure and intervention logic.
Secondly, the ‘Fit for 55 Package’ involves a high number of interlinked initiatives
underpinned by individual impact assessments. Therefore, there is a need to ensure
coherence between the preferred options of various impact assessments.
8.2. Policy interactions
Given the complex interdependence across policy tools and the interplay with the
previous methodological issue outlined above, no simultaneous determination of a
preferred policy package is thus possible. A sequential approach was therefore necessary.
First, the common economic assessment8990
underpinning the ‘Communication on
Stepping up Europe’s 2030 climate ambition’ looked at the feasibility of achieving a
higher climate target and provided insights into the efforts that individual sectors would
have to make. It could not, however, discuss precise sectoral ambitions or detailed policy
tools. Rather, it looked at a range of possible pathways/scenarios to explore the delivery
of the increased climate ambition. It noted particular benefits in deploying a broad mix of
policy instruments, including strengthened carbon pricing, increased regulatory policy
ambition and the identification of the investments to step up the climate action.
An update of the pathway/scenario focusing on a combination of extended use of carbon
pricing and medium intensification of regulatory measures in all sectors of the economy,
88
Communication on Stepping up Europe’s 2030 climate ambition - Com(2020)562. 89
https://eur-lex.europa.eu/legal-content/EN/TXT/?uri=CELEX:52020SC0176 90
https://eur-lex.europa.eu/legal-content/EN/TXT/?uri=CELEX%3A52020SC0331
86
while also reflecting the COVID-19 pandemic and the National Energy and Climate
Plans, confirmed these findings.
Taking this pathway and the Communication on Stepping up Europe’s 2030 climate
ambition as central reference, individual impact assessments for all ‘Fit for 55’ initiatives
were then developed with a view to provide the required evidence base for the final step
of detailing an effective, efficient and coherent ‘Fit for 55 Package’.
At the aggregate level, these impact assessments provide considerable reassurances about
the policy indications adopted by the Commission in the Communication on Stepping up
Europe’s 2030 climate ambition. This concerns notably a stronger and more
comprehensive role of carbon pricing, energy efficiency and renewable energy policies,
and the instruments supporting sustainable mobility and transport. These would be
complemented by a Carbon Border Adjustment Mechanism and phasing out of free
allowances. This approach would allow reducing, in a responsible manner, the risk of
carbon leakage. It would also preserve the full scope of the Effort Sharing Regulation for
achieving the increased climate target.
Various elements of the analyses also suggest that parts of the revenues of a strengthened
and extended EU ETS should be used to counter any undesirable distributional impacts
such a package would entail (between and within Member States). While the best way to
do this is still to be determined, this would seem a superior alternative to foregoing the
relevant measures altogether or simply disregarding the uneven nature of their
distributional impacts. Under both these alternatives, the eventual success of any package
proposed would be at risk.
8.3. Preferred policy option
Preliminarily assuming the analysis above as the framework for the aggregate ‘Fit for 55
Package’, the specific analysis carried out in this impact assessment comes to the main
following conclusions and would suggest policy option 4: a Carbon Border Adjustment
Mechanism on selected sectors in the form of import certificates based on actual
emissions with parallel continuation of free EU ETS allowances for a transitional period
as the preferred option. A primary basis on actual emissions ensures a fair and equal
treatment of all imports as well as ensures a close correlation to the main features of the
EU ETS. The CBAM system will, however, need to be complemented by a possibility to
base calculations on a set default values to be used in situations when sufficient emission
data will not be available. This option will need be designed to fully respect the EU’s
international commitments, in particular WTO rules, and therefore it will be necessary to
ensure that the phase in of the CBAM and phase out of the free allowances do not, at any
point in time over the transitional period, afford double protection to EU producers.
As regards electricity, the preferred option is to apply a CBAM based on the carbon
emission factor (option b), and in particular the variant based on the carbon emission
factor of the electricity mix of the respective exporting country. Overall, option b is
efficient in reducing carbon leakage while keeping administrative costs low as discussed
in Annex 8.
This choice of options would best meet the objectives of the intervention and would
introduce a proportionate mechanism to address climate change by reducing GHG
87
emissions in the EU and avoiding that these emissions are replaced by emissions outside
the EU. In addition, the gradual phase out of EU ETS allowances would allow for
businesses and authorities to carry out a prudent and predictable transition.
Policy option 4 ensures a high level of effectiveness for the CBAM. The introduction of
import certificates based on actual emissions would provide stronger incentives to third
country producers to move towards cleaner production processes, and thereby provide a
stronger protection than all other options against the risk of carbon leakage, while
respecting the EU’s international commitments, among which WTO rules.
In terms of coherence with other EU policy goals, option 4 would be consistent with the
EU ETS, ensure a level-playing field on carbon pricing and participate to the
achievement of the EU’s increased climate ambitions.
The assessment in section 6 highlights that option 4 performs well from an economic and
social standpoint, with limited negative effects foreseen, and a better performance
compared to the MIX-full auctioning.
8.4. Ensuring coherence in the finalisation of the package
The final step of the sequential approach outlined above for the coherent design of the
‘Fit for 55’ proposals will be carried out on the basis of the analysis of this and the other
impact assessment reports. The choices left open for policy-makers will be taken,
measures fine-tuned and calibrated, and overall coherence ensured. Until that stage, all
indications of preferred measures are to be considered preliminary as preserving overall
effectiveness, efficiency and coherence may require adjustments as the final package
takes shape.
In particular, the policy choices made with regards to the revision of the EU ETS and the
Effort Sharing Regulation may affect the design of the CBAM. The compatibility of the
mechanism with the EU ETS needs to be safeguarded For instance, decisions on the
strengthening of the existing EU ETS, through the increased stringency of the cap and the
possible revision of the EU ETS benchmarks for free allocation may require adjusting the
design of the CBAM, to guarantee the even-handedness between EU and third country
producers. Similarly, the possible extension of the EU ETS to road transport and
buildings or all fossil fuel combustion may have consequences on the approach retained
for the CBAM, in particular on the scope of emissions covered. Finally, the different
initiatives of the ‘Fit for 55 Package’ should ensure a coherent policy framework to
address the risks of carbon leakage.
A comprehensive analysis will therefore be carried out to ensure consistency with all the
relevant initiatives under the ‘Fit for 55 Package’. To that end, a complementary
document to the full set of individual impact assessments, looking at the effectiveness,
efficiency and coherence of the final package, will accompany the ‘Fit for 55’ proposals.
8.5. Timing considerations
The objective to have the CBAM introduced at the latest by 2023, as agreed between the
European Council, the European Parliament and the Commission on 17 December 2020,
is indeed an ambitious one considering the length of the legislative procedure and the
88
time required to set up the necessary administrative functions for its effective
implementation.
In view of the time necessary for the legislators to adopt the Regulation and the
Implementing and Delegated Acts it may become necessary to consider a transitional
period whereby the measure could be introduced on a simplified basis before
implementing a full-fledged CBAM.
Such a stepwise approach would allow for swift implementation, but would involve
simplifications involving implementation options that are not optimal form outset. Such
simplifications could include the use of default values, which would allow determining
the CBAM obligation based on the volume of product imported according to an average
of emissions in the EU. Other simplifications could involve the administrative set-up,
which for the transitional period may need to rely more to Member States authorities and
less at central level.
9 HOW WILL ACTUAL IMPACTS BE MONITORED AND EVALUATED?
The Commission will ensure that arrangements are in place to monitor and evaluate the
functioning of the CBAM and evaluate it against the main policy objectives. Given that
the CBAM is one of the policy proposals under the ‘Fit for 55 Package’, monitoring and
evaluation could be carried out in alignment with the other policies of the package.
The administration system should be evaluated after the first year of operation to identify
any issues and potential improvements. In addition, when more data is available, the
Commission will also review the scope of the CBAM to examine the possibility of
extending it to cover emissions of additional sectors and further down the value chain.
For this, it is necessary to monitor the effect of the CBAM on the shortlisted sectors.
Table 17 provides the objectives, progress indicators and data sources/measurement tools
which would be used to inform against these indicators. The monitoring indicators are
expected to be collected on a yearly basis. For evaluation purposes, annual statistics will
be computed and compared between successive years.
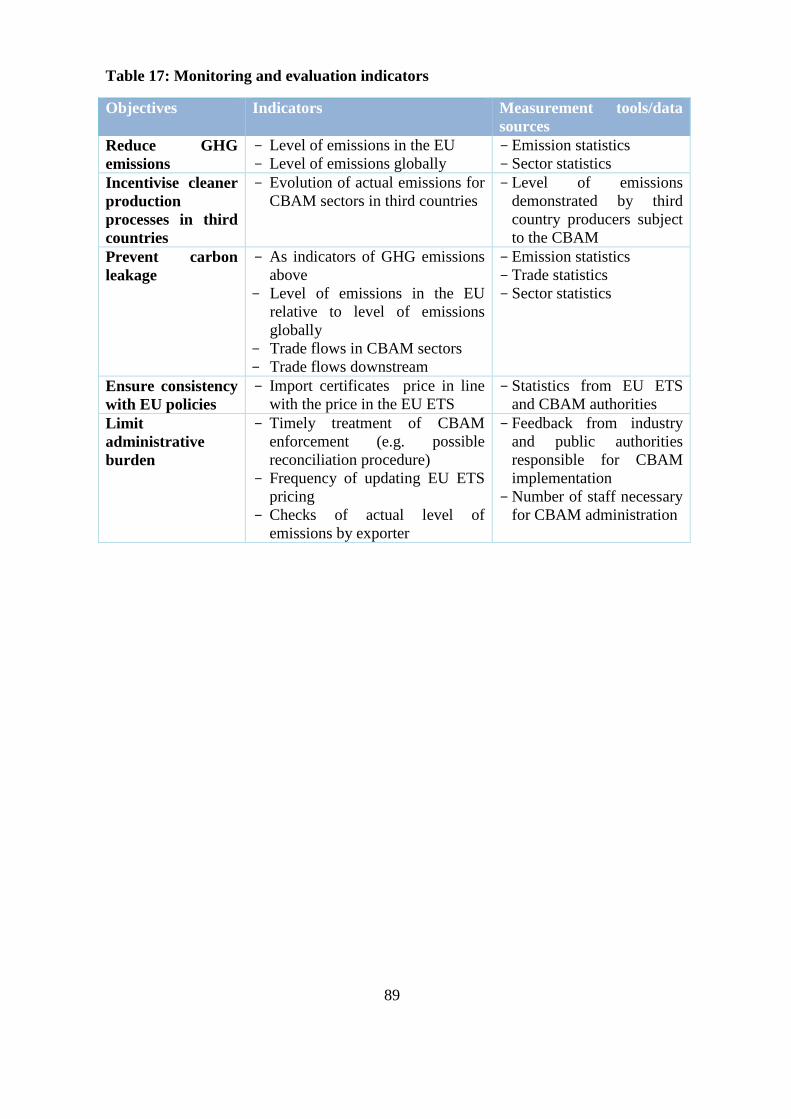
89
Table 17: Monitoring and evaluation indicators
Objectives Indicators Measurement tools/data
sources
Reduce GHG
emissions
- Level of emissions in the EU
- Level of emissions globally
- Emission statistics
- Sector statistics
Incentivise cleaner
production
processes in third
countries
- Evolution of actual emissions for
CBAM sectors in third countries
- Level of emissions
demonstrated by third
country producers subject
to the CBAM
Prevent carbon
leakage
- As indicators of GHG emissions
above
- Level of emissions in the EU
relative to level of emissions
globally
- Trade flows in CBAM sectors
- Trade flows downstream
- Emission statistics
- Trade statistics
- Sector statistics
Ensure consistency
with EU policies
- Import certificates price in line
with the price in the EU ETS
- Statistics from EU ETS
and CBAM authorities
Limit
administrative
burden
- Timely treatment of CBAM
enforcement (e.g. possible
reconciliation procedure)
- Frequency of updating EU ETS
pricing
- Checks of actual level of
emissions by exporter
- Feedback from industry
and public authorities
responsible for CBAM
implementation
- Number of staff necessary
for CBAM administration
EN EN
EUROPEAN COMMISSION
Brussels, 14.7.2021
SWD(2021) 643 final
PART 2/2
COMMISSION STAFF WORKING DOCUMENT
IMPACT ASSESSMENT REPORT
Accompanying the document
Proposal for a regulation of the European Parliament and of the Council
establishing a carbon border adjustment mechanism
{COM(2021) 564 final} - {SWD(2021) 644 final} - {SWD(2021) 647 final} -
{SEC(2021) 564 final}
1
Table of contents
ANNEX 1: PROCEDURAL INFORMATION .............................................................................................. 1
ANNEX 2: STAKEHOLDER CONSULTATION ......................................................................................... 1
ANNEX 3: WHO IS AFFECTED AND HOW? ............................................................................................ 1
ANNEX 4: ANALYTICAL METHODS ....................................................................................................... 1
ANNEX 5: DEFINITIONS ............................................................................................................................ 1
ANNEX 6: COMPLIANCE COSTS FOR BUSINESSES ............................................................................. 1
ANNEX 7: SELECTION OF SECTORS ....................................................................................................... 1
ANNEX 8: CASE OF ELECTRICITY – IMPACTS ..................................................................................... 1
ANNEX 9: ENERGY SYSTEM IMPACT OF AN IMPORT CBAM ON MATERIALS (IN THE
FORM OF A NOTIONAL ETS BASED ON EXPORTING COUNTRIES’ AVERAGE) .................. 1
ANNEX 10: STATISTICAL ANNEX (TABLES AND REFERENCES TO THE MAIN TEXT) ............... 1
ANNEX 11: EVIDENCE OF CARBON LEAKAGE .................................................................................... 1
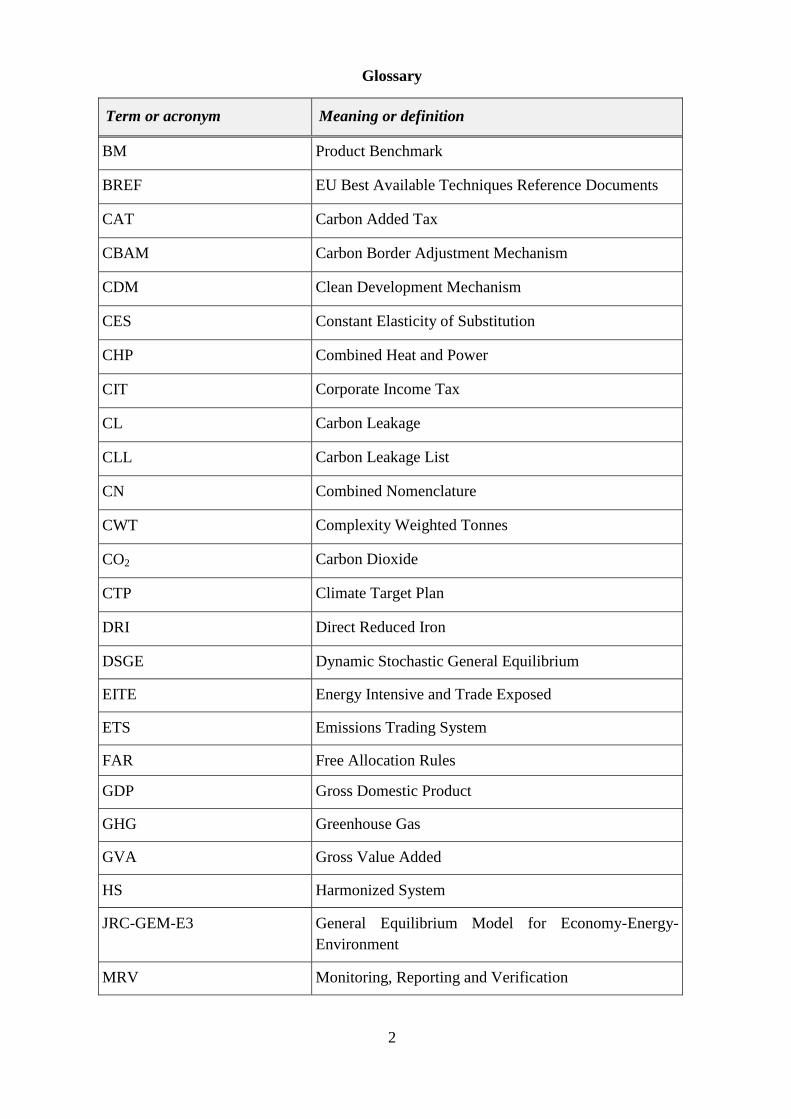
2
Glossary
Term or acronym Meaning or definition
BM Product Benchmark
BREF EU Best Available Techniques Reference Documents
CAT Carbon Added Tax
CBAM Carbon Border Adjustment Mechanism
CDM Clean Development Mechanism
CES Constant Elasticity of Substitution
CHP Combined Heat and Power
CIT Corporate Income Tax
CL Carbon Leakage
CLL Carbon Leakage List
CN Combined Nomenclature
CWT Complexity Weighted Tonnes
CO2 Carbon Dioxide
CTP Climate Target Plan
DRI Direct Reduced Iron
DSGE Dynamic Stochastic General Equilibrium
EITE Energy Intensive and Trade Exposed
ETS Emissions Trading System
FAR Free Allocation Rules
GDP Gross Domestic Product
GHG Greenhouse Gas
GVA Gross Value Added
HS Harmonized System
JRC-GEM-E3 General Equilibrium Model for Economy-Energy-
Environment
MRV Monitoring, Reporting and Verification

3
NACE Statistical Classification of Economic Activities in the
European Community
NGO Non-Governmental Organisation
NPK fertilisers Nitrogen-Phosphorus-Potassium fertilisers
SMEs Small and Medium-sized Enterprises
VAT Value Added Tax
VCM Vinyl Chloride Monomer
WTO World Trade Organisation

4
ANNEX 1: PROCEDURAL INFORMATION
1. Lead DG, Decide Planning/CWP references
The lead DG is the Directorate-General for Taxation and Customs Union. The Decide
reference of this initiative is PLAN/2020/6513.
The Commission Work Programme for 2021 provides, under heading A European Green
Deal, the policy objective of ‘Fit for 55 Package’, the initiative for a Carbon Border
Adjustment Mechanism (CBAM) and a proposal for CBAM as own resource (legislative,
incl. impact assessment, planned for Q2 2021).
2. Organisation and timing
The Inter-service Steering Group was set up by the Secretariat-General to assist in the
preparation of the initiative. The representatives of the following Directorates General
participated in the ISSG work: Legal Service, CLIMA, TRADE, JRC, COMP, GROW,
ECFIN, ENER, EEAS, INTPA, NEAR, MOVE, BUDG, ENV, AGRI, JUST, RTD,
REA, MARE.
A total of five Inter-Service Steering Group meeting took place, with the last being on 16
March 2021.
It should be noted that in addition to the Inter-Service Steering Group, DG TAXUD held
seven meetings to discuss the design and legal issues of the mechanism with
representatives from the following Directorates General: Legal Service, CLIMA,
TRADE, ENER, BUDG, NEAR. The last meeting of the group took place on 11 January
2021.
3. Consultation of the RSB
On 17 March 2021, DG TAXUD submitted the draft Impact Assessment to the
Regulatory Scrutiny Board and the Board meeting took place on 21 April 2021. The
opinion of the Board, as issued on 23 April 2021, was positive with reservations.
The Board’s recommendations have been addressed as presented below.
1) The report should be self-standing. It should describe the existing measures to prevent
carbon leakage and better identify their weaknesses.
The recommendation was addressed by expanding the discussion under the problem
definition of the impact assessment (Section 2). An addition subsection was introduced
(Section 2.2 ‘How is the problem currently being addressed?’) outlining how the risk of
carbon leakage has been identified from the beginning of the EU ETS and what have
been the two mechanisms, employed under the existing system to address it (i.e. free
allocation of ETS allowances and the possibility for Member States to give state aid to
electro-intensive undertakings active in a sector exposed to international trade). The
discussion on the evidence on the risk of carbon leakage as identified in the literature was
also improved and expanded drawing from the analysis previously detailed under Annex
11.
2) The report should strengthen the discussion on the coherence with the new ETS
proposal. It should explain to what extent the ETS revision depends on the CBAM

5
initiative. The report should justify why it deviates from the ETS on some aspects, such as
sectoral coverage and the inclusion of transport emissions. It should better explain why it
proposes a parallel system with CBAM certificates to match the carbon content of
imports, instead of ETS allowances. The report should be more explicit on the envisaged
timeframe for the gradual introduction of CBAM and its coherence with the revision of
the ETS.
The recommendation was addressed by expanding the analysis under Section 2.4 ‘How
will the problem evolve?’. The discussion now provides a more detailed account of the
fact that the CBAM would be complementary to the EU ETS, with a view to addressing
the risk of carbon leakage and reinforcing the EU ETS itself. It proceeds by explaining
the interdependence of CBAM proposal and the proposal of EU ETS revision in the
context of problem evolution. In this context, the report further explains, under Section
5.2.1.1 ‘Scope of emissions’, the reasons for not including transport emissions at this
stage. Specifically at this stage the details of the extension of the ETS to transport are not
fully known and will in any case depend on the outcome of the legislative process. It
would be more prudent to schedule the inclusion of transport emission to take place when
the scope of CBAM is next revised. On sectoral coverage the report is clear in that the
choice of CBAM’s coverage is framed by the sectors and emissions covered by the EU
ETS. Moreover, the discussion in Section 5.2.3 ‘Option 2: Import certificates for basic
materials based on EU average’ has been expanded to provide more insight on the
methodological choices regarding the design of CBAM certificates. Finally, the
discussion under Section 8 ‘Preferred option’ now discusses the main issues related to
the envisaged timeframe of the measure.
3) The report should better present and analyse the costs and benefits of different
administrative options, in particular centralised versus decentralised implementation, to
clearly inform the political choices. It should discuss the risks for a timely
implementation, in particular linked to the development of IT systems and the potential
set-up of a central administrative CBAM body.
The recommendation was addressed by expanding the analysis under Section 5.2.1
‘Design elements common to all options’ through the introduction of a new section on
5.2.1.9 ‘Elements related to administrative design’. The discussion now clarifies that
there are essentially two main options in the institutional design of CBAM -a centralised
system based on a Central CBAM authority at EU level and a decentralised system
resting on national authorities of Member States. The main characteristics, as well as the
benefits and costs of each are also discussed. Section 5.2.1.9 also provides a provisional
estimate of the costs and staffing needs related to the administrative set up for the
measure. Finally, the discussion under Section 8 ‘Preferred option’ discuss issues related
to timely implementation and the potential simplifications that may be necessary to
ensure CBAM is operational from 2023.
4) As CBAM is an alternative to free allowances, the initiative should be mainly
compared with the scenario with free allowances, and not with the counterfactual with
full auctioning.
The recommendation was addressed by comparing all the CBAM options to the MIX
scenario with free allowances. As indicated in the Board’s detailed technical comments
the full auctioning variant was maintained as an additional reference point to disentangle
the effect of removing free allowances from the specific effects of introducing CBAM.

6
5) The impact analysis should better highlight the effects of the introduction of CBAM on
the competitiveness of EU exporters on third-country markets. It should better integrate
the risks and consequences of resource shuffling and of carbon leakage down the value
chain.
The recommendation was addressed by expanding the analysis in different parts of the
impact assessment report. Specifically, section 6.4.3 ‘Trade impacts’ provides a more
detailed clarification on the effects of CBAM on EU export competitiveness, while the
analysis in the said section has been expanded to include also the views of stakeholders
on this matter as recorded in the Commission’s open public consultation. The report has
also been expanded to integrate more clearly and concretely the risks and consequences
of resource shuffling and carbon leakage down the value chain. Section 5.2.1.10
‘Resource shuffling’ now provides a more detailed analysis of the drivers and
implications of resource shuffling. References on the limitations posed by the problem
are also included in the impacts section. Nevertheless, the report also recognise that
resource shuffling is an unescapable fact, difficult to quantify ex ante. Equally, the report
seeks to balance the fact that even in the presence of resource shuffling, the fact that
those third countries have to make an effort to produce low carbon-intensive products for
the EU market will be positive from a climate perspective. Finally, section 6.2.2
‘Preventing Carbon leakage’ provides a more insight into the impacts on the value chain
and the drivers of this impact (complexity of manufacturing process downstream and
corresponding value added in later stages).
6) While global emissions and engaging with third countries are part of the (specific)
objectives, the relation with third countries should receive more attention. The report
should explain how the CBAM initiative is consistent with the Paris Agreement, and its
parties setting their own ambition levels.
The recommendation was addressed by expanding the analysis under Section 2.1 ‘What
is the problem?’ and the inclusion of a new section (2.1.1) on ‘CBAM in the context of
the Paris Agreement’.
7) The report should systematically take into account the comments made by the different
stakeholder groups throughout the report. In particular, it should be transparent on their
positions on the different options and confront any concerns with the findings of the
analysis.
The recommendation was addressed by including references and further insight from the
feedback obtained from different stakeholder on the Open Public Consultation. Views of
stakeholders on the different policy options, as well as on anticipated impacts on business
and consumers have been integrated in differentiated assessments in the body of the
report. The analysis now clarifies that by introducing a CBAM, the EU will ensure that
goods imported into the EU follow the same rules as the goods produced in the EU
without interfering with policy choices in third countries. In order to respect the Paris
Agreement and the principle of nationally determined contributions (NDC) therein as
well as the principle of Common but Differentiated responsibility, the CBAM would be
designed in such manner that it does not directly depend on the overall level of ambitions
of a country or on the policy choices made by a country.
8) The methodological section (in the annex), including methods, key assumptions, and
baseline, should be harmonised as much as possible across all ‘Fit for 55’ initiatives.
Key methodological elements and assumptions should be included concisely in the main
7
report under the baseline section and the introduction to the options. The report should
refer explicitly to uncertainties linked to the modelling. Where relevant, the
methodological presentation should be adapted to this specific initiative.
The recommendation was addressed by further clarifying the methods, key assumptions,
and baseline ensuing harmonised approach and presentation to other ‘Fit for 55’
initiatives. Key methodological elements and assumptions presented in the main report
under the baseline section and the introduction to the options have been further
strengthened and clarified.
4. Evidence, sources and quality
The evidence for the impact assessment report was gathered through various activities
and from different sources:
Studies on Carbon Leakage:
o 2030 Revised climate ambition impact assessment
o Carbon Leakage in the Emissions Trading System (ETS) Phase 3 and 4
o Alternatives to address carbon leakage – DG CLIMA
Studies on Carbon Border Adjustment:
o Design and effects
o Modelling – JRC and DG ECFIN
o World Trade Organisation (WTO) – DG TRADE
o OPC results analysis
o Effect of a CBAM on energy markets – DG ENER
Feedback on the Inception Impact Assessment
Desk research
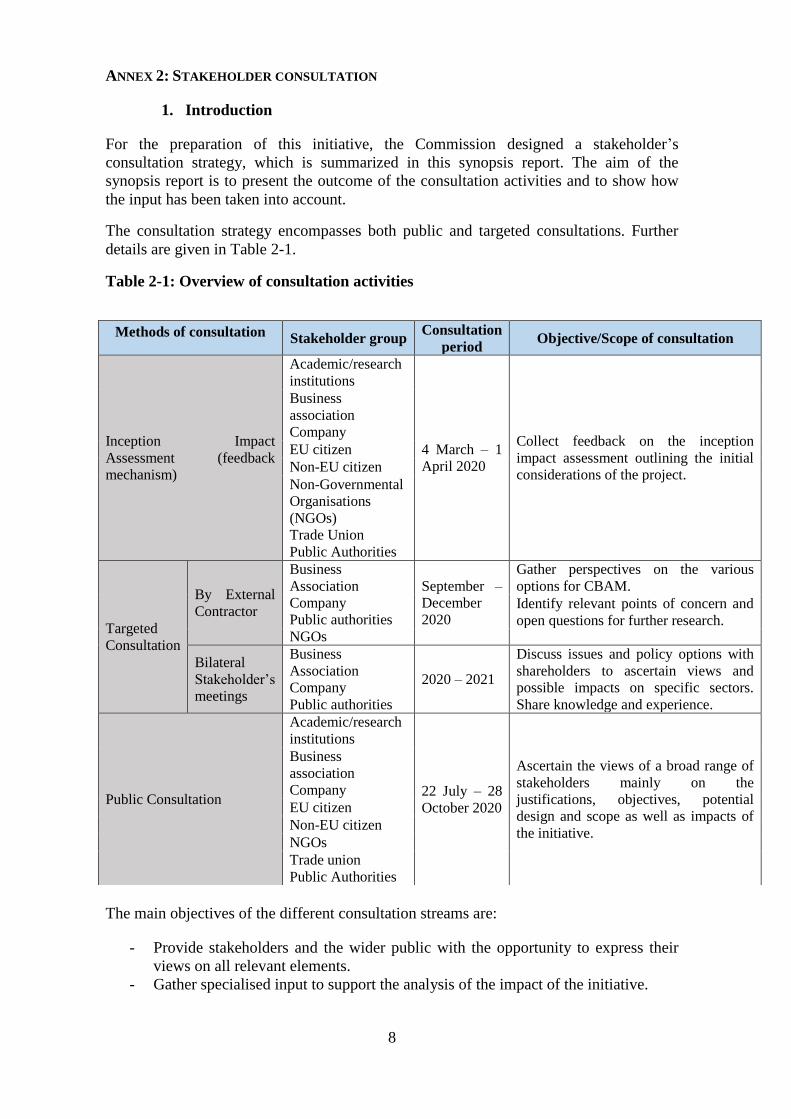
8
ANNEX 2: STAKEHOLDER CONSULTATION
1. Introduction
For the preparation of this initiative, the Commission designed a stakeholder’s
consultation strategy, which is summarized in this synopsis report. The aim of the
synopsis report is to present the outcome of the consultation activities and to show how
the input has been taken into account.
The consultation strategy encompasses both public and targeted consultations. Further
details are given in Table 2-1.
Table 2-1: Overview of consultation activities
The main objectives of the different consultation streams are:
- Provide stakeholders and the wider public with the opportunity to express their
views on all relevant elements.
- Gather specialised input to support the analysis of the impact of the initiative.
Methods of consultation Stakeholder group Consultation
period Objective/Scope of consultation
Inception Impact
Assessment (feedback
mechanism)
Academic/research
institutions
4 March – 1
April 2020
Collect feedback on the inception
impact assessment outlining the initial
considerations of the project.
Business
association
Company
EU citizen
Non-EU citizen
Non-Governmental
Organisations
(NGOs)
Trade Union
Public Authorities
Targeted
Consultation
By External
Contractor
Business
Association
Company
Public authorities
NGOs
September –
December
2020
Gather perspectives on the various
options for CBAM.
Identify relevant points of concern and
open questions for further research.
Bilateral
Stakeholder’s
meetings
Business
Association
Company
Public authorities
2020 – 2021
Discuss issues and policy options with
shareholders to ascertain views and
possible impacts on specific sectors.
Share knowledge and experience.
Public Consultation
Academic/research
institutions
22 July – 28
October 2020
Ascertain the views of a broad range of
stakeholders mainly on the
justifications, objectives, potential
design and scope as well as impacts of
the initiative.
Business
association
Company
EU citizen
Non-EU citizen
NGOs
Trade union
Public Authorities
9
- Contribute to design the technical aspects of the future initiative.
- Satisfy transparency principles and help to define priorities for the future
initiative.
As reflected above by the different methods of consultation used and stakeholders groups
reached, the stakeholder consultation strategy has formed an integral part of the policy
development process.
2. Consultation participation
1. Feedback on the inception impact assessment
The consultation period through this feedback mechanism took place between 4 March
and 1 April 2020 via the Commission website. The period started when the inception
impact assessment was published outlining the initial thinking and policy options of the
project. 219 responses were submitted during this consultation period broken down into:
approximately 150 responses by trade federations, business associations and individual
businesses, 20 NGOs, 20 citizens and the remaining from think tanks, academic/research
institutions, trade unions and public authorities. The majority of responses came from the
EU, with 24 from third countries.
2. Targeted consultation
The external contractor conducted a total of 25 in-depth interviews with senior managers
and associations from the basic materials sectors, manufacturers, NGOs and
policymakers. There were two rounds of interviews. First, 17 informal interviews were
conducted at an early stage of the study. In addition to gathering stakeholders’ opinions,
these interviews served to identify relevant points of concern and open question for
further research. In a second step, eight additional interviews were conducted in order to
test whether the judgements and concerns from the informal interviews were shared
among a wider group of stakeholders. 17 stakeholders came from industry, 5 from NGOs
and 3 from Member State institutions.
3. Public Consultation
The public consultation was placed on the Commission website, and remained open for
fourteen weeks from 22 July 2020 to 28 October 2020 in line with the Better Regulations
Guidelines. The consultation questionnaire consisted of 43 questions: 38 closed-ended
questions and 5 open-ended questions and aimed to gather opinions from citizens and
organisations on the justifications, objectives, potential design and scope as well as
impacts of the initiative. Respondents were also allowed to upload position papers.
A total of 615 respondents participated in the public consultation. Of these, 6 responses
were duplicates, leading to 609 valid contributions. Figure 2-1 presents the type and
countries of the stakeholders. From the point of view of the size of the organisations
involved, 120 are micro (1 to 9 employees), 108 small (10 to 49 employees), 53 medium
(50 to 249 employees) and 156 large (more than 250 employees).
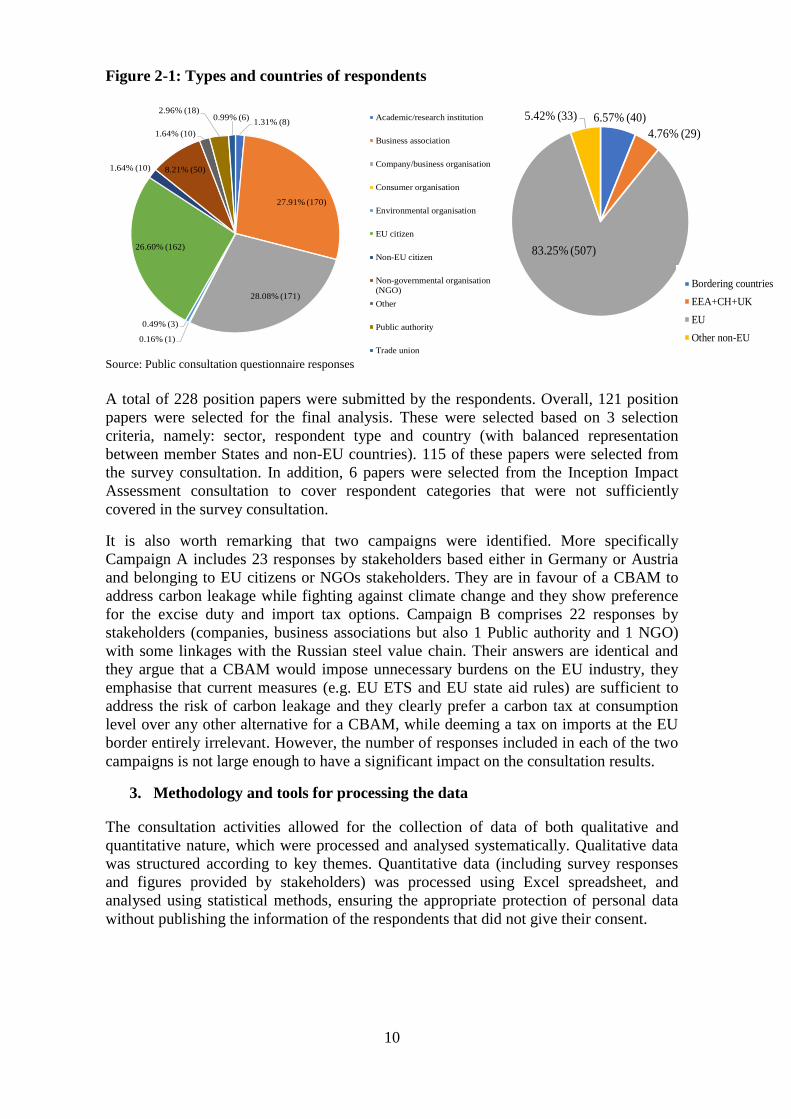
10
Figure 2-1: Types and countries of respondents
Source: Public consultation questionnaire responses
A total of 228 position papers were submitted by the respondents. Overall, 121 position
papers were selected for the final analysis. These were selected based on 3 selection
criteria, namely: sector, respondent type and country (with balanced representation
between member States and non-EU countries). 115 of these papers were selected from
the survey consultation. In addition, 6 papers were selected from the Inception Impact
Assessment consultation to cover respondent categories that were not sufficiently
covered in the survey consultation.
It is also worth remarking that two campaigns were identified. More specifically
Campaign A includes 23 responses by stakeholders based either in Germany or Austria
and belonging to EU citizens or NGOs stakeholders. They are in favour of a CBAM to
address carbon leakage while fighting against climate change and they show preference
for the excise duty and import tax options. Campaign B comprises 22 responses by
stakeholders (companies, business associations but also 1 Public authority and 1 NGO)
with some linkages with the Russian steel value chain. Their answers are identical and
they argue that a CBAM would impose unnecessary burdens on the EU industry, they
emphasise that current measures (e.g. EU ETS and EU state aid rules) are sufficient to
address the risk of carbon leakage and they clearly prefer a carbon tax at consumption
level over any other alternative for a CBAM, while deeming a tax on imports at the EU
border entirely irrelevant. However, the number of responses included in each of the two
campaigns is not large enough to have a significant impact on the consultation results.
3. Methodology and tools for processing the data
The consultation activities allowed for the collection of data of both qualitative and
quantitative nature, which were processed and analysed systematically. Qualitative data
was structured according to key themes. Quantitative data (including survey responses
and figures provided by stakeholders) was processed using Excel spreadsheet, and
analysed using statistical methods, ensuring the appropriate protection of personal data
without publishing the information of the respondents that did not give their consent.
1.31% (8)
27.91% (170)
28.08% (171)
0.16% (1)
0.49% (3)
26.60% (162)
1.64% (10) 8.21% (50)
1.64% (10)
2.96% (18)0.99% (6) Academic/research institution
Business association
Company/business organisation
Consumer organisation
Environmental organisation
EU citizen
Non-EU citizen
Non-governmental organisation
(NGO)
Other
Public authority
Trade union
6.57% (40)
4.76% (29)
83.25% (507)
5.42% (33)
Bordering countries
EEA+CH+UK
EU
Other non-EU
6.57% (40)
4.76% (29)
83.25% (507)
5.42% (33)
Bordering countries
EEA+CH+UK
EU
Other non-EU
11
4. Consultation results
1. Inception impact assessment feedback
Overall, the majority of replies (approximately 140) expressed support for the CBAM,
with the remaining being roughly divided equally between limited and no support. The
vast majority of responses expressed cautiousness in the design of the measure requesting
to consider all options possible. Among others, key areas emphasized were the impact on
value chains and reliance on imports of raw materials, avoidance of excessive effects on
final consumers, links to EU ETS and free allowances, distributional impact in affected
sectors and across countries, especially developing economies and interaction with
existing trade defence measures on raw materials.
In more specific terms, some of the main concerns highlighted by stakeholders included:
the negative impact on free trade and global supply chains, reduction of imports, harm to
cross-border electricity infrastructure investment, the questionable existence of carbon
leakage, WTO compatibility, the possibility of retaliatory trade measures and the need to
protect the competitiveness of the EU industry. There were suggestions as to the sectoral
scope and scope of emissions to be covered as well as the continuation of free
allowances. Lastly, concerns were also expressed on the methodology to be adopted in
the design of the measure and the potential administrative burden of the measure.
2. Targeted consultation
As he targeted consultation interviews focused on the perspective of stakeholders on the
policy options the results will be discussed for each option. Responses broken down by
stakeholder type and sector are presented in Table 2-2.
Regarding Option 1 there were major concerns regarding carbon leakage for European
exporters (all materials producers), downstream manufacturers (e.g. steel), as well as
resource shuffling (mostly steel and aluminium). While NGOs regarded abolishing free
allowance allocation as an attractive feature of this option, some industry players saw it
as an opportunity to mitigate leakage concerns in the short term if it was combined with
free allocation (Option 4), albeit less of a long-term solution.
Option 6 (excise duty) was seen as providing an attractive investment framework into
climate neutral production processes. It was named as the preferred option by several
industry and manufacturing representatives, but these interviewees also pointed out that
an adequate amount of free allocation was needed to guarantee an effective carbon
leakage protection. The administrative complexity was seen as manageable.
The carbon added tax (CAT) was seen as an attractive instrument theoretically. However,
stakeholders agreed that the administrative complexity of the tracing ruled out the
instrument in practice.
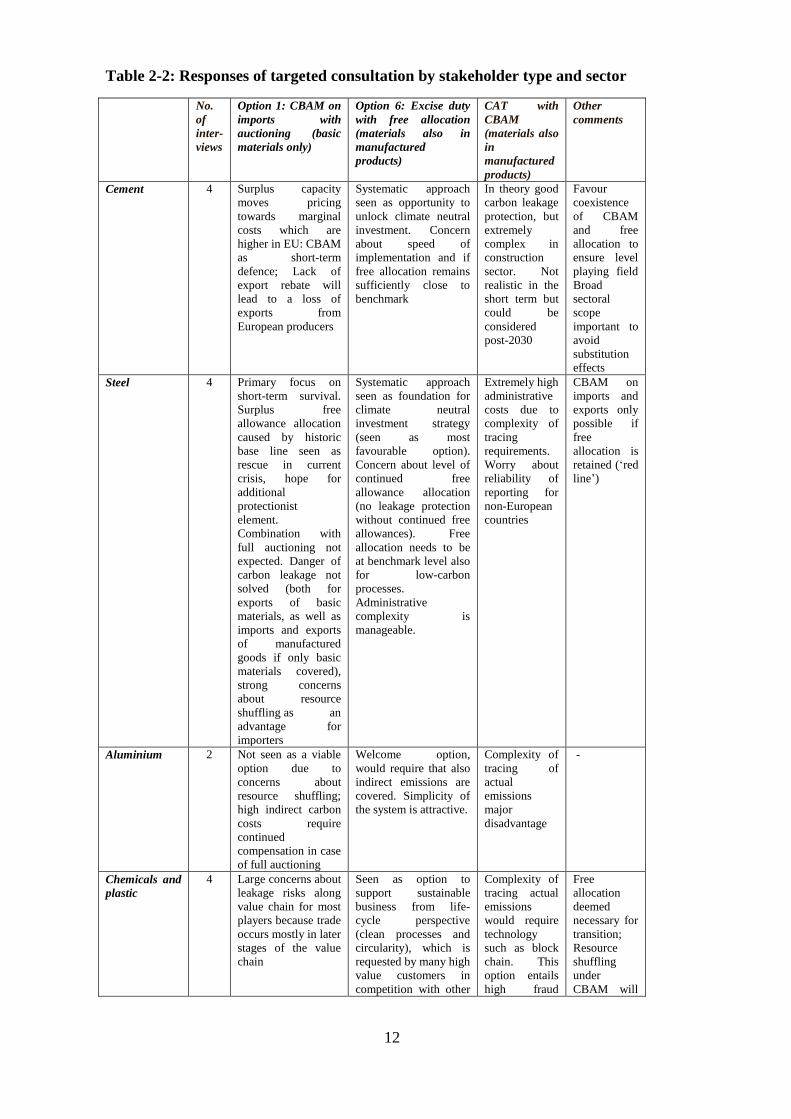
12
Table 2-2: Responses of targeted consultation by stakeholder type and sector
No.
of
inter-
views
Option 1: CBAM on
imports with
auctioning (basic
materials only)
Option 6: Excise duty
with free allocation
(materials also in
manufactured
products)
CAT with
CBAM
(materials also
in
manufactured
products)
Other
comments
Cement 4 Surplus capacity
moves pricing
towards marginal
costs which are
higher in EU: CBAM
as short-term
defence; Lack of
export rebate will
lead to a loss of
exports from
European producers
Systematic approach
seen as opportunity to
unlock climate neutral
investment. Concern
about speed of
implementation and if
free allocation remains
sufficiently close to
benchmark
In theory good
carbon leakage
protection, but
extremely
complex in
construction
sector. Not
realistic in the
short term but
could be
considered
post-2030
Favour
coexistence
of CBAM
and free
allocation to
ensure level
playing field
Broad
sectoral
scope
important to
avoid
substitution
effects
Steel 4 Primary focus on
short-term survival.
Surplus free
allowance allocation
caused by historic
base line seen as
rescue in current
crisis, hope for
additional
protectionist
element.
Combination with
full auctioning not
expected. Danger of
carbon leakage not
solved (both for
exports of basic
materials, as well as
imports and exports
of manufactured
goods if only basic
materials covered),
strong concerns
about resource
shuffling as an
advantage for
importers
Systematic approach
seen as foundation for
climate neutral
investment strategy
(seen as most
favourable option).
Concern about level of
continued free
allowance allocation
(no leakage protection
without continued free
allowances). Free
allocation needs to be
at benchmark level also
for low-carbon
processes.
Administrative
complexity is
manageable.
Extremely high
administrative
costs due to
complexity of
tracing
requirements.
Worry about
reliability of
reporting for
non-European
countries
CBAM on
imports and
exports only
possible if
free
allocation is
retained (‘red
line’)
Aluminium
2 Not seen as a viable
option due to
concerns about
resource shuffling;
high indirect carbon
costs require
continued
compensation in case
of full auctioning
Welcome option,
would require that also
indirect emissions are
covered. Simplicity of
the system is attractive.
Complexity of
tracing of
actual
emissions
major
disadvantage
-
Chemicals and
plastic
4 Large concerns about
leakage risks along
value chain for most
players because trade
occurs mostly in later
stages of the value
chain
Seen as option to
support sustainable
business from life-
cycle perspective
(clean processes and
circularity), which is
requested by many high
value customers in
competition with other
Complexity of
tracing actual
emissions
would require
technology
such as block
chain. This
option entails
high fraud
Free
allocation
deemed
necessary for
transition;
Resource
shuffling
under
CBAM will
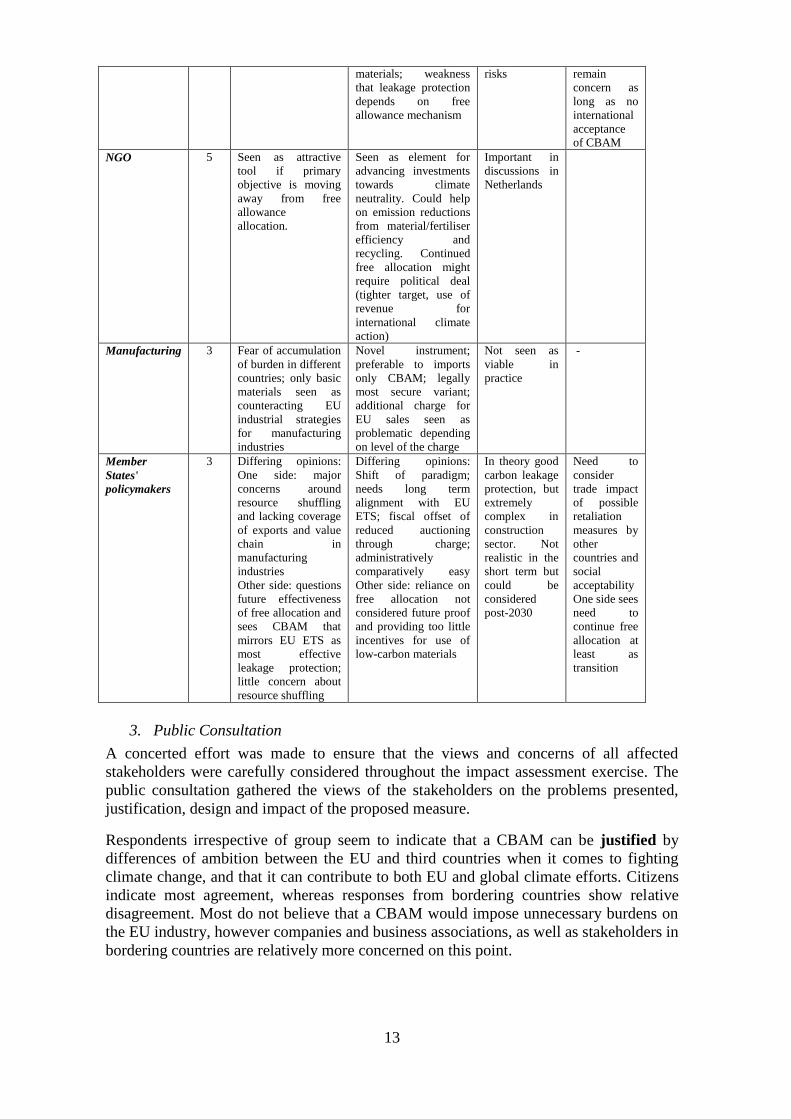
13
materials; weakness
that leakage protection
depends on free
allowance mechanism
risks remain
concern as
long as no
international
acceptance
of CBAM
NGO 5 Seen as attractive
tool if primary
objective is moving
away from free
allowance
allocation.
Seen as element for
advancing investments
towards climate
neutrality. Could help
on emission reductions
from material/fertiliser
efficiency and
recycling. Continued
free allocation might
require political deal
(tighter target, use of
revenue for
international climate
action)
Important in
discussions in
Netherlands
Manufacturing 3 Fear of accumulation
of burden in different
countries; only basic
materials seen as
counteracting EU
industrial strategies
for manufacturing
industries
Novel instrument;
preferable to imports
only CBAM; legally
most secure variant;
additional charge for
EU sales seen as
problematic depending
on level of the charge
Not seen as
viable in
practice
-
Member
States'
policymakers
3 Differing opinions:
One side: major
concerns around
resource shuffling
and lacking coverage
of exports and value
chain in
manufacturing
industries
Other side: questions
future effectiveness
of free allocation and
sees CBAM that
mirrors EU ETS as
most effective
leakage protection;
little concern about
resource shuffling
Differing opinions:
Shift of paradigm;
needs long term
alignment with EU
ETS; fiscal offset of
reduced auctioning
through charge;
administratively
comparatively easy
Other side: reliance on
free allocation not
considered future proof
and providing too little
incentives for use of
low-carbon materials
In theory good
carbon leakage
protection, but
extremely
complex in
construction
sector. Not
realistic in the
short term but
could be
considered
post-2030
Need to
consider
trade impact
of possible
retaliation
measures by
other
countries and
social
acceptability
One side sees
need to
continue free
allocation at
least as
transition
3. Public Consultation
A concerted effort was made to ensure that the views and concerns of all affected
stakeholders were carefully considered throughout the impact assessment exercise. The
public consultation gathered the views of the stakeholders on the problems presented,
justification, design and impact of the proposed measure.
Respondents irrespective of group seem to indicate that a CBAM can be justified by
differences of ambition between the EU and third countries when it comes to fighting
climate change, and that it can contribute to both EU and global climate efforts. Citizens
indicate most agreement, whereas responses from bordering countries show relative
disagreement. Most do not believe that a CBAM would impose unnecessary burdens on
the EU industry, however companies and business associations, as well as stakeholders in
bordering countries are relatively more concerned on this point.

14
With respect to the problem of carbon leakage, most respondents (apart from those
coming from bordering countries) appear to believe that carbon leakage is a real issue
and that the CBAM can address carbon leakage, foster consumption of low-carbon
products in the EU, and stimulate the deployment of low-carbon technologies and
ambitious climate policies in third countries. On the effectiveness of current measures in
the context of the EU ETS and state aid rules to limit carbon leakage, and on the ability
of other regulatory measures to reduce greenhouse gas (‘GHG’) emissions companies,
business associations and public authorities have a positive belief whereas citizens and
other stakeholders are more critical. Finally, all stakeholder groups apart from public
authorities which are neutral seem to disagree that the current measures under the EU
ETS can address carbon leakage sufficiently in regards to enhanced climate ambitions in
the EU.
Figure 2-2: Options for designing CBAM based on stakeholder group
Source: Public consultation questionnaire responses
Regarding the design of the mechanism, responses appear to indicate that all policy
options listed in the questionnaire are at least somewhat relevant for the design of a
CBAM as can be seen in Figure 2-2. Companies are relatively less enthusiastic about all
the proposed solutions and they attach limited relevance for the design of a CBAM to an
extension of the EU ETS or a carbon tax on consumption, but they show a greater
preference for the import tax. In addition, a carbon tax on imports has limited relevance
for respondents based on bordering countries
Responses on the product coverage of the measure are presented on Figure 2-3.
Respondents appear to suggest that the CBAM should focus on products from activities
already included in the EU ETS (especially those with the highest risk of carbon leakage)
and account for entire value chains.
1.08 (13)
1.00 (13)
0.92 (13)
1.31 (13)
1.48 (131)
1.03 (133)
1.16 (134)
1.69 (128)
0.88 (251)
1.06 (252)
0.82 (255)
1.09 (255)
1.20 (64)
1.06 (63)
1.27 (62)
1.38 (66)
0 1 2
d. Carbon tax (e.g. excise or VAT type) at
consumption level on a selection of products
whose production is in sectors that are at risk of
carbon leakage and applied to EU production, as
well as to imports
c. The obligation to purchase allowances from a
specific pool outside the ETS dedicated to
imports, which would mirror the ETS price
b. An extension of the EU Emissions Trading
System to imports, which could require the
purchasing of emission allowances under the EU
Emissions Trading System by either foreign
producers or importers
a. A tax applied on imports at the EU border on a
selection of products whose production is in
sectors that are at risk of carbon leakage (e.g. a
border tax or customs duty on selected carbon
intensive products)
Civil society (all other stakeholders) Companies & business associations
EU & non-EU citizens Public authorities
Legend: 0 = Not relevant 1 = Somewhat relevant 2 = Highly relevant
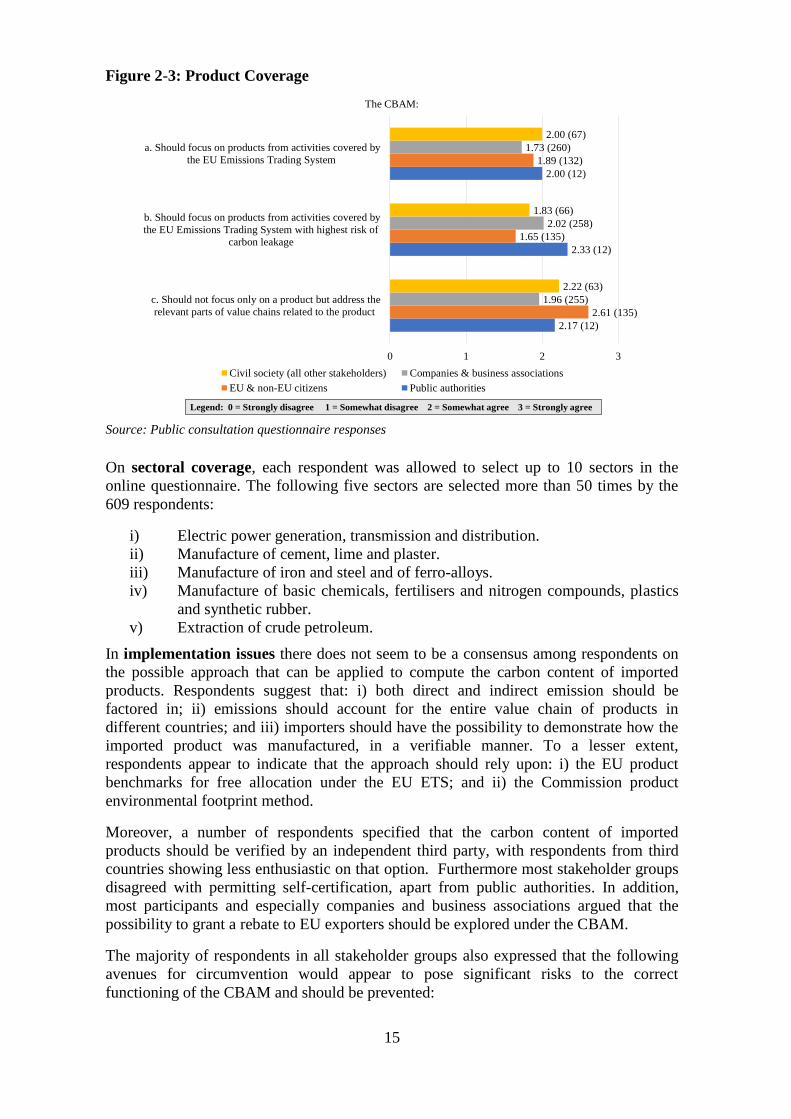
15
Figure 2-3: Product Coverage
Source: Public consultation questionnaire responses
On sectoral coverage, each respondent was allowed to select up to 10 sectors in the
online questionnaire. The following five sectors are selected more than 50 times by the
609 respondents:
i) Electric power generation, transmission and distribution.
ii) Manufacture of cement, lime and plaster.
iii) Manufacture of iron and steel and of ferro-alloys.
iv) Manufacture of basic chemicals, fertilisers and nitrogen compounds, plastics
and synthetic rubber.
v) Extraction of crude petroleum.
In implementation issues there does not seem to be a consensus among respondents on
the possible approach that can be applied to compute the carbon content of imported
products. Respondents suggest that: i) both direct and indirect emission should be
factored in; ii) emissions should account for the entire value chain of products in
different countries; and iii) importers should have the possibility to demonstrate how the
imported product was manufactured, in a verifiable manner. To a lesser extent,
respondents appear to indicate that the approach should rely upon: i) the EU product
benchmarks for free allocation under the EU ETS; and ii) the Commission product
environmental footprint method.
Moreover, a number of respondents specified that the carbon content of imported
products should be verified by an independent third party, with respondents from third
countries showing less enthusiastic on that option. Furthermore most stakeholder groups
disagreed with permitting self-certification, apart from public authorities. In addition,
most participants and especially companies and business associations argued that the
possibility to grant a rebate to EU exporters should be explored under the CBAM.
The majority of respondents in all stakeholder groups also expressed that the following
avenues for circumvention would appear to pose significant risks to the correct
functioning of the CBAM and should be prevented:
2.17 (12)
2.33 (12)
2.00 (12)
2.61 (135)
1.65 (135)
1.89 (132)
1.96 (255)
2.02 (258)
1.73 (260)
2.22 (63)
1.83 (66)
2.00 (67)
0 1 2 3
c. Should not focus only on a product but address the
relevant parts of value chains related to the product
b. Should focus on products from activities covered by
the EU Emissions Trading System with highest risk of
carbon leakage
a. Should focus on products from activities covered by
the EU Emissions Trading System
The CBAM:
Civil society (all other stakeholders) Companies & business associations
EU & non-EU citizens Public authorities
Legend: 0 = Strongly disagree 1 = Somewhat disagree 2 = Somewhat agree 3 = Strongly agree
16
i) substitution between primary inputs and semi-finished goods;
ii) resource shuffling in the form of allocating low carbon production only to the
EU;
iii) transhipment strategies via exempted third countries;
iv) avoidance based on minor modification of imported products.
The majority of the respondents seem to indicate that no exemption should be granted
and that all imports should be subject to a CBAM on an equal footing with citizens being
the greatest advocate of that and public authorities agreeing the least. Consulted
stakeholders in all groups though, leave room for exempting partner countries with
established climate policies that create incentives for emission reductions, similar to
those in force in the EU. In contrast, there is no agreement in respect to granting credits
for importing countries with climate policies generating carbon costs higher than in the
EU.
On expected impacts the public consultation looked at economic, environmental and
social impacts, as well as administrative burdens. On economic impacts, the respondents
collectively recognise that the CBAM would: i) encourage the consumption of low-
carbon products; ii) have a positive impact on innovation; iii) have a positive impact on
the competitiveness of the EU industry; and iv) have a positive impact on investment in
the EU. They also appear to agree, however, that it would lead to increased costs for EU
businesses in downstream sectors. However, companies, business associations and public
authorities believe that the CBAM would impinge on EU exporters in the relevant
sectors. In addition, respondents based in bordering countries argue the above effects to
be negative instead of positive.
Environmental impacts are positive across all respondents, as they suggest that the
CBAM would have positive would improve the effectiveness of policies against climate
change, reduce carbon emission globally, and promote the adoption of ambitious climate
policies in third countries. Business stakeholders are less convinced than other
stakeholders on the extent this will be achieved, whilst stakeholders from bordering
countries disagree on the effectiveness of CBAM to reduce carbon emissions on a global
scale.
Social impacts are perceived to be both positive and negative. On the positive side,
respondents seem to agree that the mechanism would avoid job losses in the EU, with
business stakeholders questioning that. However, all stakeholder groups also appear to
indicate that the CBAM may: i) increase the price of consumer products; ii) lead to job
losses in downstream sectors; and iii) generate potential negative effects on the living
standards of the poorer segments of the population.
Relating to the administrative burden:
About 95 % of respondents (478 out of 503) suggest that the CBAM could
increase administrative burdens for exporters and importers.
Almost 93 % of respondents (460 out of 495) envisage an increase in
administrative burdens borne by public administrations in the EU.
The majority of respondents (336 out of 480) appear to maintain that the CBAM
is expected to generate relatively higher administrative burdens for Small and
Medium-sized Enterprises (SMEs), however, almost one third of respondents
appear to disagree with this conclusion.
It should be noted that the stakeholder group disagreeing with the above is citizens.
17
Lastly, the positions papers gathered by all stakeholder groups raised the following key
challenges:
Consideration of economic and environmental impacts.
Technical design (e.g. Calculation of carbon content, default values).
Balance the burden between EU and non-EU companies.
Ensuring robust data collection and verification process.
Retaliation measures.
Implemented in a way to strengthen global climate ambition.
Ensure competitiveness of EU industry on global market.
Contributing to decarbonisation of sectors through innovation and investment.
Definition of sectoral scope of CBAM and maintaining free allowances.
Alignment with EU ETS.
5. Conclusions
The results of the public and targeted consultations allowed the Commission to collect a
significant number of views and opinions on the initiative. Both public and targeted
consultations showed agreement on the necessity of a CBAM to address the risk of
carbon leakage and help the EU to achieve its increased climate ambitions.
Regarding the design options an import tax and a tax at consumption level are the most
favoured by the public consultation. The targeted consultation shows greater preference
for the excise duty option largely because of its retention of free allocation and disproof
of the CAT due to its complexity and increased administrative burden. In addition, all
consultations largely point to the same initial sectors for CBAM coverage.
With respect to expected impacts, the public consultation provides for positive economic
and environmental impacts but mixed social impacts. This is partly confirmed by the
targeted consultation which shows that environmental and economic impacts vary
depending on the option. As for administrative costs the majority of respondents in both
consultations believe they will be increased, with the targeted consultation specifying
that for certain options.
Finally, it is worth noting that the feedback received throughout the public and the
targeted consultations has been used to inform the choice of the design elements and the
preferred policy options.
18
ANNEX 3: WHO IS AFFECTED AND HOW?
1. Practical implications of the initiative
The initiative would affect the following stakeholders:
- Private sector/industry.
- Public administration/Competent authorities.
- EU citizens.
- Least Developed Countries (LDCs).
(a) Private sector/industry
The proposal for a CBAM will increase costs for both imports and domestic production.
Producers of basic materials have to pay a carbon price on their emissions. Imports of
basic materials from third countries face carbon costs similar to the costs of European
producers. The possibility to demonstrate that the carbon efficiency of their product is
better than the default value, would increase costs, but this also provides emission
reduction incentives for the share of materials that is exported to the EU.
Producers will face the following costs:
- Increase in carbon costs.
- Monitoring the quantity of imported products.
- Tracking the place of origin.
- Monitoring the embedded GHG emissions of products stemming from the
production process.
- Verification of the monitored emissions.
- Cost related to the documentation of the process, including the submission of
information to the CBAM registry.
- Costs related to making the payment.
- Costs related to the preparation for controls by the authorities.
- Buying and surrendering of import certificates (CBAM certificates).
Compliance costs are likely to be higher for SMEs. These costs are detailed in Annex 6
for businesses and SMEs.
However, the investment in low carbon technologies will improve production efficiency
and prepare businesses for more sustainable production processes.
(b) Administrative management of the CBAM
The EU will benefit from the increased revenues stemming from the CBAM. A detailed
assessment can be found in Annex 6.
Public administration will face similar costs than businesses from a CBAM, with the
main differences arising from assessing information and controlling the reports from
economic operators. Costs linked to the establishment of a central CBAM registry are
also foreseen.
19
Monitoring, Reporting and Verification (MRV) rules for the CBAM should be based on
those in the EU ETS. To ensure synergies, there should be some coordination and
learning between the respective competent authorities, and deadlines for the compliance
cycle should be coordinated.
(c) EU citizens
Due to the implementation of a CBAM and the shift towards cleaner technologies, a
limited increase on consumer prices is expected. In fact, prices across household
consumption fall slightly with the exception of minor increases in vehicles and household
equipment. The distributional impact of CBAM, although small, is progressive.
There is a loss of employment in sectors covered by the CBAM, by -1.20 %. The effects
on other downstream sectors are minimal.
Altogether, and in line with the objective of the CBAM, EU citizens will benefit from a
reduction in GHG emissions.
(d) Least Developed Countries (LDCs)
CBAM may give rise to unintended economic risks due to additional costs for exporters
and deteriorating terms of trade. Many countries in the Global South, and on the African
continent in particular, are exposed to relatively high risks. In order to avoid new global
dividing lines between countries with a low- and high-carbon export structure, the EU
should carefully assess risk levels and support the transformative process that partner
countries would need to undertake to adjust to the CBAM .
LDCs are not among the EU’s main importers. Excluding intra EU-27 trade, LDCs
comprise less than 0.1 % of imports to the EU in Iron and Steel, Fertilisers, and Cement.
At the same time, the relative importance of these exports for LDCs’ economies can
conversely be quite large. Mozambique is an important exception to otherwise negligible
shares of LDCs in EU imports, as the country accounts for 7.7 %of the EU’s imports of
aluminium. In fact, 54.1 %of Mozambican Aluminium CBAM sector exports were to the
EU. While the Iron, Steel and Fertiliser sectors have 3-4 LDCs importing relatively
evenly, the Aluminium and Fertiliser sectors are dominated by Mozambique and
Senegalese imports respectively when it comes to LDCs.
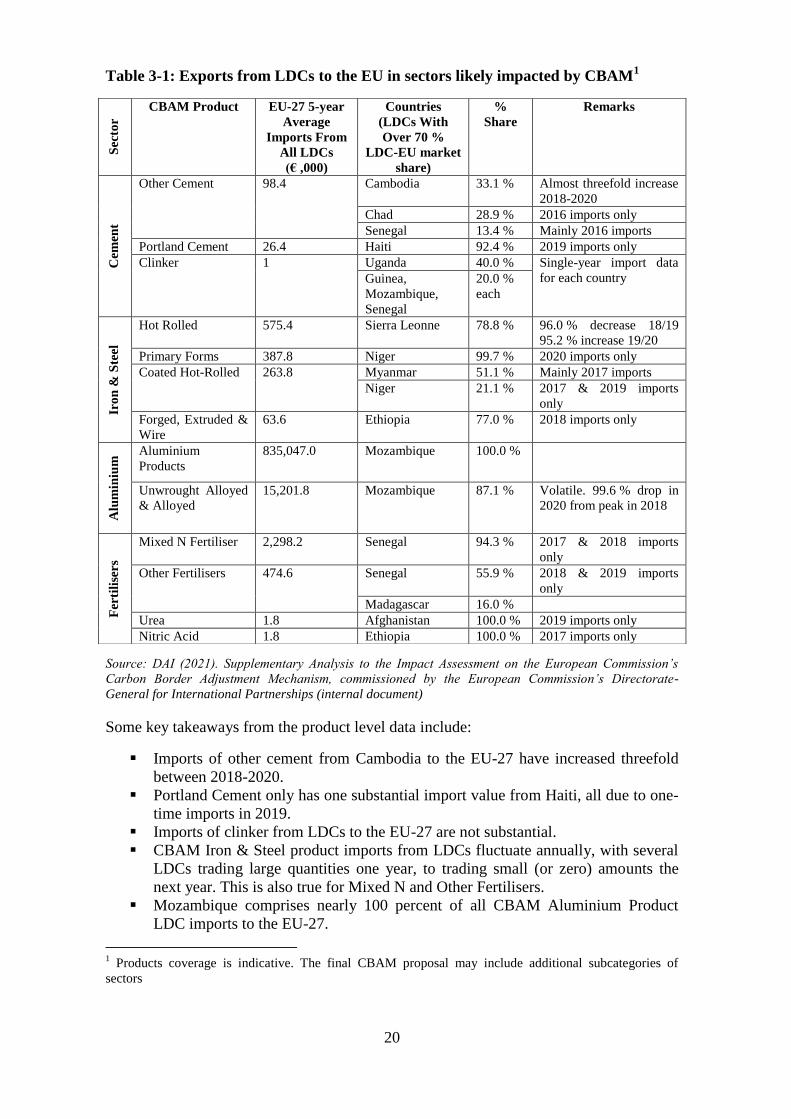
20
Table 3-1: Exports from LDCs to the EU in sectors likely impacted by CBAM1
Source: DAI (2021). Supplementary Analysis to the Impact Assessment on the European Commission’s
Carbon Border Adjustment Mechanism, commissioned by the European Commission’s Directorate-
General for International Partnerships (internal document)
Some key takeaways from the product level data include:
Imports of other cement from Cambodia to the EU-27 have increased threefold
between 2018-2020.
Portland Cement only has one substantial import value from Haiti, all due to one-
time imports in 2019.
Imports of clinker from LDCs to the EU-27 are not substantial.
CBAM Iron & Steel product imports from LDCs fluctuate annually, with several
LDCs trading large quantities one year, to trading small (or zero) amounts the
next year. This is also true for Mixed N and Other Fertilisers.
Mozambique comprises nearly 100 percent of all CBAM Aluminium Product
LDC imports to the EU-27.
1 Products coverage is indicative. The final CBAM proposal may include additional subcategories of
sectors
Sec
tor
CBAM Product EU-27 5-year
Average
Imports From
All LDCs
(€ ,000)
Countries
(LDCs With
Over 70 %
LDC-EU market
share)
%
Share
Remarks C
emen
t
Other Cement 98.4 Cambodia 33.1 % Almost threefold increase
2018-2020
Chad 28.9 % 2016 imports only
Senegal 13.4 % Mainly 2016 imports
Portland Cement 26.4 Haiti 92.4 % 2019 imports only
Clinker 1 Uganda 40.0 % Single-year import data
for each country Guinea,
Mozambique,
Senegal
20.0 %
each
Iro
n &
Ste
el
Hot Rolled 575.4 Sierra Leonne 78.8 % 96.0 % decrease 18/19
95.2 % increase 19/20
Primary Forms 387.8 Niger 99.7 % 2020 imports only
Coated Hot-Rolled 263.8 Myanmar 51.1 % Mainly 2017 imports
Niger 21.1 % 2017 & 2019 imports
only
Forged, Extruded &
Wire
63.6 Ethiopia 77.0 % 2018 imports only
Alu
min
ium
Aluminium
Products
835,047.0 Mozambique 100.0 %
Unwrought Alloyed
& Alloyed
15,201.8 Mozambique 87.1 % Volatile. 99.6 % drop in
2020 from peak in 2018
Fer
tili
sers
Mixed N Fertiliser 2,298.2 Senegal 94.3 % 2017 & 2018 imports
only
Other Fertilisers 474.6 Senegal 55.9 % 2018 & 2019 imports
only
Madagascar 16.0 %
Urea 1.8 Afghanistan 100.0 % 2019 imports only
Nitric Acid 1.8 Ethiopia 100.0 % 2017 imports only
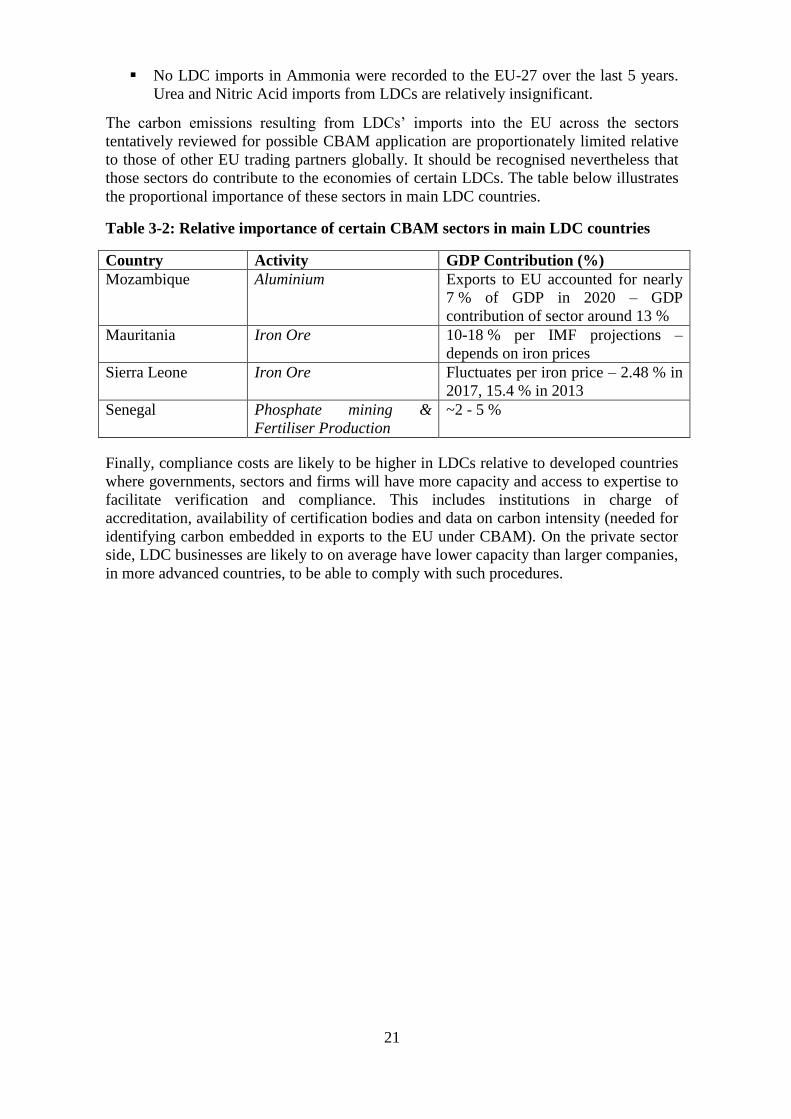
21
No LDC imports in Ammonia were recorded to the EU-27 over the last 5 years.
Urea and Nitric Acid imports from LDCs are relatively insignificant.
The carbon emissions resulting from LDCs’ imports into the EU across the sectors
tentatively reviewed for possible CBAM application are proportionately limited relative
to those of other EU trading partners globally. It should be recognised nevertheless that
those sectors do contribute to the economies of certain LDCs. The table below illustrates
the proportional importance of these sectors in main LDC countries.
Table 3-2: Relative importance of certain CBAM sectors in main LDC countries
Country Activity GDP Contribution (%)
Mozambique Aluminium Exports to EU accounted for nearly
7 % of GDP in 2020 – GDP
contribution of sector around 13 %
Mauritania Iron Ore 10-18 % per IMF projections –
depends on iron prices
Sierra Leone Iron Ore Fluctuates per iron price – 2.48 % in
2017, 15.4 % in 2013
Senegal Phosphate mining &
Fertiliser Production
~2 - 5 %
Finally, compliance costs are likely to be higher in LDCs relative to developed countries
where governments, sectors and firms will have more capacity and access to expertise to
facilitate verification and compliance. This includes institutions in charge of
accreditation, availability of certification bodies and data on carbon intensity (needed for
identifying carbon embedded in exports to the EU under CBAM). On the private sector
side, LDC businesses are likely to on average have lower capacity than larger companies,
in more advanced countries, to be able to comply with such procedures.
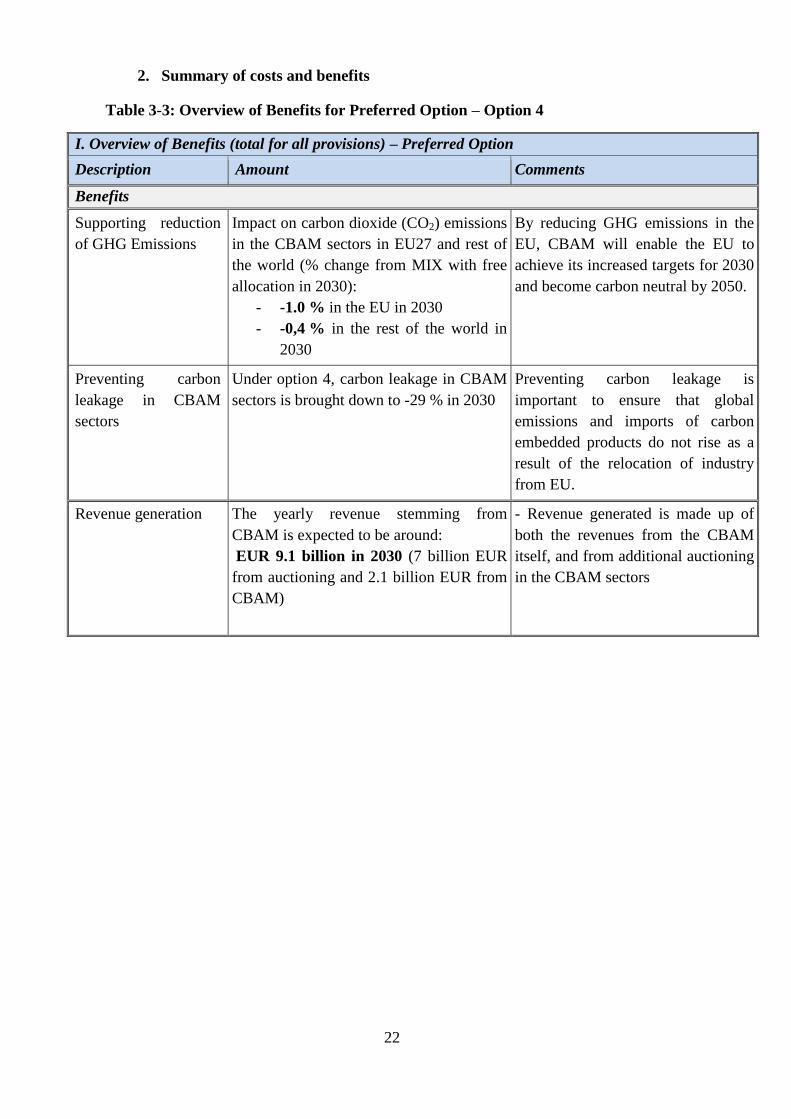
22
2. Summary of costs and benefits
Table 3-3: Overview of Benefits for Preferred Option – Option 4
I. Overview of Benefits (total for all provisions) – Preferred Option
Description Amount Comments
Benefits
Supporting reduction
of GHG Emissions
Impact on carbon dioxide (CO2) emissions
in the CBAM sectors in EU27 and rest of
the world (% change from MIX with free
allocation in 2030):
- -1.0 % in the EU in 2030
- -0,4 % in the rest of the world in
2030
By reducing GHG emissions in the
EU, CBAM will enable the EU to
achieve its increased targets for 2030
and become carbon neutral by 2050.
Preventing carbon
leakage in CBAM
sectors
Under option 4, carbon leakage in CBAM
sectors is brought down to -29 % in 2030
Preventing carbon leakage is
important to ensure that global
emissions and imports of carbon
embedded products do not rise as a
result of the relocation of industry
from EU.
Revenue generation The yearly revenue stemming from
CBAM is expected to be around:
EUR 9.1 billion in 2030 (7 billion EUR
from auctioning and 2.1 billion EUR from
CBAM)
- Revenue generated is made up of
both the revenues from the CBAM
itself, and from additional auctioning
in the CBAM sectors

23
II. Overview of costs – Preferred option
Citizens/Consumers Businesses Administrations
One-off Recurrent One-off Recurrent One-off Recurrent
Economic
and social
costs in the
EU
Direct
costs
- Overall small decrease in
aggregate consumption of
0,56 %
- expected limited increase in
electricity prices
- expected limited increase
vehicle and household
equipment products
Cost of new
technologies
Compliance costs (See
below)
None None
Indirect
costs
- minimal
loss of
employment
in
downstream
sectors
None None None None
Table 3-4: Overview of costs for Preferred Option – Option 4
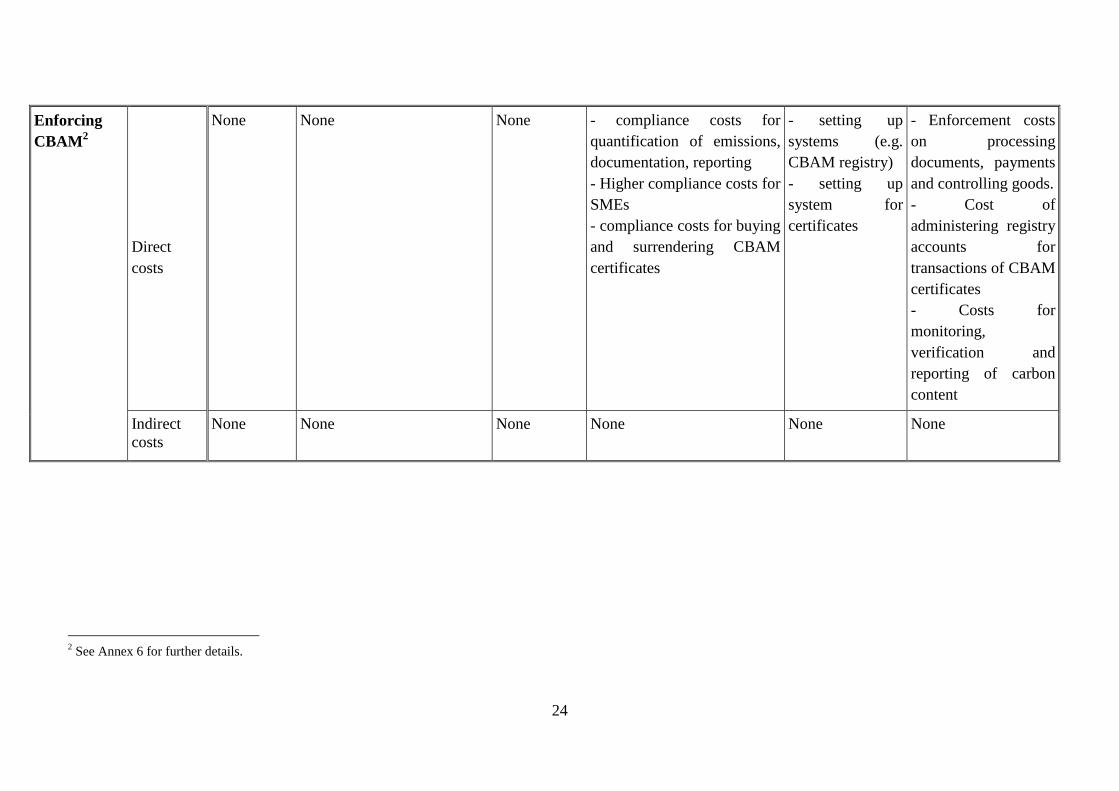
24
Enforcing
CBAM2
Direct
costs
None None None - compliance costs for
quantification of emissions,
documentation, reporting
- Higher compliance costs for
SMEs
- compliance costs for buying
and surrendering CBAM
certificates
- setting up
systems (e.g.
CBAM registry)
- setting up
system for
certificates
- Enforcement costs
on processing
documents, payments
and controlling goods.
- Cost of
administering registry
accounts for
transactions of CBAM
certificates
- Costs for
monitoring,
verification and
reporting of carbon
content
Indirect
costs
None None None None None None
2 See Annex 6 for further details.

25
ANNEX 4: ANALYTICAL METHODS
1. Introduction
In order to assess the environmental, macro-economic, and distributional impacts of the
CBAM, the analysis used three modelling tools: (1) JRC-GEM-E3, a computable general
equilibrium model; (2) Euromod, a static microsimulation model; (3) PRIMES model
(Price-Induced Market Equilibrium System), a large-scale applied energy system model
that was employed specifically for the modelling of the electricity sector.
2. The JRC-GEM-E3
Overview
JRC-GEM-E33 (General Equilibrium Model for Economy-Energy-Environment) is a
recursive dynamic Computable General Equilibrium model. It is a global model,
covering the EU, alongside 12 other major countries or world regions. With a detailed
sectoral disaggregation of energy activities (from extraction to production to distribution
sectors) as well as endogenous mechanisms to meet carbon emission constraints, the
JRC-GEM-E3 model has been extensively used for the economic analysis of climate and
energy policy impacts.
Divided into 31 sectors of activity, firms are cost-minimizing with Constant Elasticity of
Substitution (CES) production functions. Sectors are interlinked by providing goods and
services as intermediate production inputs to other sectors. Households are the owner of
the factors of production (skilled and unskilled labour and capital) and thereby receive
income, used to maximize utility through consumption. Government is considered
exogenous, while bilateral trade-flows are allowed between countries and regions using
the Armington trade formulation where goods from different goods are imperfect
substitutes.
In 5-year steps, an equilibrium is achieved at goods and services markets, and for factors
of production through adjustments in prices.
The model integrates (in particular for the baseline building) inputs from energy system
models (generally PRIMES for EU Member States and POLES-JRC for the rest of the
world) on a number of variables of interest, such as a detailed use of energy products by
consumers, global fuel prices, etc. More information on the integration of energy system
model inputs in macroeconomic modelling in JRC-GEM-E3, can be found in the Impact
Assessment of the Climate Target Plan (CTP) - Annex 9.34.
The JRC-GEM-E3 model is normally used to compare (various) policy options against a
baseline scenario, representing the evolution of the global economy under current energy
and climate policies.
3 https://ec.europa.eu/jrc/en/gem-e3/model
4 European Commission. (2020). Stepping up Europe’s 2030 climate ambition. (COM(2020) 562 final).
Part 2: https://ec.europa.eu/transparency/regdoc/rep/10102/2020/EN/SWD-2020-176-F1-EN-MAIN-
PART-2.PDF
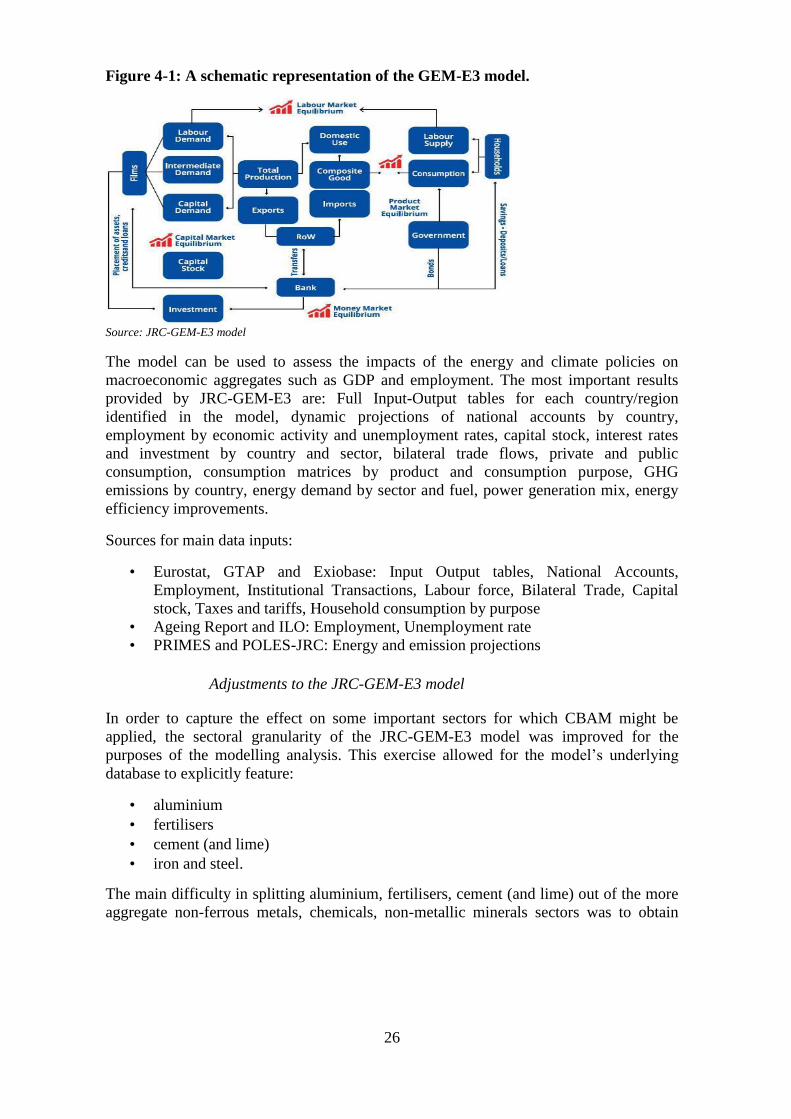
26
Figure 4-1: A schematic representation of the GEM-E3 model.
Source: JRC-GEM-E3 model
The model can be used to assess the impacts of the energy and climate policies on
macroeconomic aggregates such as GDP and employment. The most important results
provided by JRC-GEM-E3 are: Full Input-Output tables for each country/region
identified in the model, dynamic projections of national accounts by country,
employment by economic activity and unemployment rates, capital stock, interest rates
and investment by country and sector, bilateral trade flows, private and public
consumption, consumption matrices by product and consumption purpose, GHG
emissions by country, energy demand by sector and fuel, power generation mix, energy
efficiency improvements.
Sources for main data inputs:
• Eurostat, GTAP and Exiobase: Input Output tables, National Accounts,
Employment, Institutional Transactions, Labour force, Bilateral Trade, Capital
stock, Taxes and tariffs, Household consumption by purpose
• Ageing Report and ILO: Employment, Unemployment rate
• PRIMES and POLES-JRC: Energy and emission projections
Adjustments to the JRC-GEM-E3 model
In order to capture the effect on some important sectors for which CBAM might be
applied, the sectoral granularity of the JRC-GEM-E3 model was improved for the
purposes of the modelling analysis. This exercise allowed for the model’s underlying
database to explicitly feature:
• aluminium
• fertilisers
• cement (and lime)
• iron and steel.
The main difficulty in splitting aluminium, fertilisers, cement (and lime) out of the more
aggregate non-ferrous metals, chemicals, non-metallic minerals sectors was to obtain
27
adequate data to inform cost and use shares of the sectors5. Important aspects included
capturing the emission and trade intensities of the sub-sectors as these are determinants
of how effective leakage protection measures will be6. The GTAP 10 database
7 which is
used as the main economic data source of the JRC-GEM-E3 model does not break out
these subsectors. EXIOBASE8, another global input output table, does include these
subsectors, and is used to determine cost and trade shares, including the trade intensity of
the subsectors. It is however not advisable to run JRC-GEM-E3 with only relying on
Exiobase due to the richer representation of taxes, subsidies, trade costs, etc. in GTAP.
In view of the above, the analysis integrated the Exiobase information into the GTAP
database. In particular the analysis used GTAP data for the sectors not affected and
constrained the sums of the subsectors to match the overall GTAP data. For example in
the present data set aluminium and other non-ferrous metals sum up to the value of the
non-ferrous metals sector in GTAP. This exercise was further augmented by cross-
checking against additional data provided by DG CLIMA on emissions intensity of EU
ETS sectors by the Statistical Classification of Economic Activities in the European
Community (NACE) codes in the EU member states and adjusting where necessary. The
final dataset was compared again to the emissions reported in the European Union
Transaction Log database to confirm that key characteristics are captured.
Description of the baseline
The starting point of the analysis is the PRIMES EU Reference Scenario 2020, which is
the common baseline for the Fit for 55 impact assessments. It provides projections for
energy demand and supply, as well as GHG emissions in all sectors of the European
economy under the current EU and national policy framework. It embeds in particular the
EU legislation in place to reach the 2030 climate target of at least 40 % compared to
1990, as well as national contributions captured in the National Energy and Climate
Plans to reaching the EU 2030 energy targets on energy efficiency and renewables under
the Governance of the Energy Union. Projections for GDP, population and fossil fuel
prices take into account the impact of the COVID crisis and are aligned with the 2021
Ageing Report. A more detailed description can be found in the impact assessment
covering the revision of the ETS Directive.
The implementation of the EU Reference scenario into JRC-GEM-E3 is using the
Piramid methodology9, reproducing the energy balances of the PRIMES model for the
EU Reference scenario and being fully harmonized with the macro data used to drive
PRIMES for the EU (and UK)10
. For non-EU regions (except UK), energy balances were
taken from POLES-JRC, in particular the model runs produced for the Global Energy
5 Cost shares refer to the relative importance of different inputs in the cost of a sector to produce a unit of
output, while use shares refer to the share of which products are used by other sectors as intermediate
goods or as final goods. 6 https://doi.org/10.1016/j.eneco.2012.08.015
7 https://www.gtap.agecon.purdue.edu/
8 https://www.exiobase.eu/
9 See https://ec.europa.eu/jrc/en/macroeconomic.baselines.for.policy.assessments
10 As PRIMES energy balances do not explicitly specify the sub-sectors split out, assumptions are made to
project energy use and emissions in the subsectors. In general, it is assumed that sub-sectors experience the
same growth rates as the overall sector represented in PRIMES and that relative emission reductions are
equal in sub-sectors.

28
and Climate Outlook 202011
. These also take into account the macroeconomic
consequences of COVID-19 and likely (persistent) changes in the transportation sector.
The CBAM has to be seen in the context of a policy environment achieving -55 %
emission reductions. For the modelling underlying this impact assessment, this policy
context is mainly represented by the use of the MIX scenario. The MIX scenario achieves
a reduction in net greenhouse gas emissions of 55 % compared to 1990 levels and of
around 53 % excluding LULUCF. The GHG target includes intra-EU maritime and intra-
EU aviation emissions in its scope. The scenario relies on both carbon price signal
extension to road transport and buildings and strong intensification of energy and
transport policies to achieve the higher GHG target. In the JRC-GEM-E3 model, the EU
ETS is assumed to be expanded to also cover buildings and road transport, with full
auctioning in these sectors. Free allowances are assumed to cover 100 % of emissions of
energy intensive industries at risk of leakage. The scenario is implemented with a ‘soft
coupling’ to the PRIMES model. This means that the scenario is using certain input
values from the PRIMES model results for housing, transport and electricity sector, as
well as providing guidance to set emission targets for (expanded) EU ETS and emission
reduction potential for industrial process emissions.
As indicated in the main report, this impact assessment is drafted in parallel with the
impact assessment on the revision of the ETS directive that sets out a number of
scenarios for the strengthening of the existing EU ETS on power and industry
installations. Each of these options have an impact on the evolution of free allocation. In
view of this and to complement the analysis on the carbon leakage prevention
framework, a variant of the MIX is also modelled depicting the case of complete removal
of free allowances in the CBAM sectors12
, in the absence of a CBAM.
Closure rules and key assumptions
Various alternative modelling assumptions were explored with the JRC-GEM-E3 model.
For the purposes of this analysis, the focus is on the results based on budget neutrality,
where government budgets are held fixed to baseline values relative to GDP with
additional revenue provided as reductions of labour taxation13
and allowing for the
imperfect labour market to adjust after the policy shock.
Moreover, firms are assumed to fully pass on the value of free allowances to consumers
(‘market share maximisation’). This market share maximization behaviour implies a zero
pass though rate, i.e. firms are assumed to not pass through the opportunity cost of selling
permits that they have received for free. While the empirical literature provides evidence
of some pass through of opportunity costs depending on sector characteristics such as
11
Keramidas, K., Fosse, F., Diaz-Vazquez, A., Schade, B., Tchung-Ming, S., Weitzel, M., Vandyck, T.,
Wojtowicz, K. Global Energy and Climate Outlook 2020: A New Normal Beyond Covid-19, doi:
10.2760/608429, JRC123203. 12
CBAM sectors refer to sectors where CBAM is considered as a possible alternative to free allocation of
allowances under the EU ETS. 13
This modelling approach ensures budget neutrality, rather than defining how additional revenues from
CBAM as an own resource could be used. The introduction of CBAM and the associated own resource
hence lowers the need of Member States contributions to maintain the same budget, lowering the need to
raise revenue through (e.g. labour) taxes
29
market concentration14
, revisions to the EU ETS will couple free allowances tighter to
output values. The economic literature suggests that this would reduce or even eliminate
pass through. The modelling approach without pass through is conservative, as it
indicates larger consequences when moving from free allowances to full auctioning. The
effect of adding CBAM on top of full auctioning would however be very similar
regardless of the assumption on cost pass through.
3. Euromod
The estimates of the distributional impacts of the CBAM scenarios use Euromod, the
European Union tax-benefit microsimulation model15
. The Euromod model combines
country-specific coded policy rules with representative household microdata (mainly
from the European Union Statistics on Income and Living Conditions database, EU-
SILC). The model employs information on countries’ tax and benefit policy rules and on
household characteristics and economic circumstances to simulate tax liabilities and cash
benefit entitlements. Taxes and transfers that are not possible to simulate because of lack
of relevant information are used as recorded in the original surveys. The model
simulations take into account the role played by each tax-benefit instrument, their
possible interactions, and generate the disposable (i.e. after taxes and cash benefits)
household income16
. Therefore, the model results are particularly suitable for the analysis
of the distributional, inequality and poverty impact of tax changes, by households or
groups according to socio-economic variables of interest. Cross-country comparability is
enabled by coding the policy systems of the EU Member States according to a common
framework and from the harmonization of the underlying microdata. Euromod
simulations also provide estimations of the budgetary effects and indicators which are
commonly used to measure work incentive effects of the policy scenarios.
It should be kept in mind that Euromod simulations do not incorporate any behavioural
eff ects that may also aff ect the (second-round) fiscal as well as the distributional
outcomes of a policy change. Thus, the model is static and delivers the first-round effects
(`the overnight effect').
The analysis of the CBAM scenarios is based on the recently developed Indirect Tax
Tool version 3 (ITTv3) extension of the Euromod model17
. The ITT allows the
simulation of indirect taxes (VAT and excises) and their impact on household and
government budgets. In order to simulate these indirect tax liabilities, the ITT uses the
underlying microdata of Euromod (primarily based on EU-SILC) combined with imputed
private household expenditure information for more than 200 commodity categories from
the harmonised Eurostat Household Budget Surveys (EU HBS). The tool applies the
indirect taxation rules in place in each country (including VAT, specific and ad-valorem
excises) to compute households’ indirect tax liabilities based on their imputed
14
Cludius, Johanna & de Bruyn, Sander & Schumacher, Katja & Vergeer, Robert, 2020. ‘Ex-post
investigation of cost pass-through in the EU ETS - an analysis for six industry sectors’, Energy Economics,
Elsevier, vol. 91(C). 15
For more detail see https://euromod-web.jrc.ec.europa.eu/about/what-is-euromod 16
The main income inequality and poverty indicators which are used to evaluate the impact of CBAM are
generally based on equivalised household disposable income, considering economies of scale in
consumption within the household: equivalised income refers to the fact that household members are made
equivalent by weighting them according to their age, using the so-called modified OECD equivalence
scale. 17
For more detail see https://euromod-web.jrc.ec.europa.eu/about/extended-functionalities

30
consumption basket. Currently, the ITT rests on the assumption of full tax compliance
and of full pass-through, and it is available for 18 countries (BE, CY, CZ, DK, FI, FR,
DE, EL, ES, HU, IE, IT, LT, PL, PT, RO, SI and SK).
The simulations conducted in this analysis are based on Euromod version I2.0. The tax-
benefit systems simulated in the baseline refer to those in place in each country as of
June 2019, while the underlying input data mainly come from the 2010 EU-SILC18
and
the 2010 HBS. Incomes reported in the EU-SILC of 2010 refer to 2009-2010. Uprating
factors are used to update income and prices from the date of the input data to the year of
interest, in this case 2019.
The distributional impact of the CBAM scenarios is analysed by estimating the changes
in household adjusted disposable income (the disposable income19
after the payment of
indirect taxes) across the income distribution. Changes in household adjusted disposable
income in the CBAM scenario under consideration are compared against the
counterfactual (tax-benefit systems in place in 2019).
For the simulations of the CBAM options, the Euromod-ITT has been linked to the JRC-
GEM-E3 macroeconomic model to account for the economy-wide impact of the reforms.
Two main steps are followed to link the two models. In the first step, the baseline
scenarios of the two models are aligned20
. For this end, the consumption of each
household in the ITT is adjusted proportionally in order to ensure that the aggregate share
of consumption expenditure by each group of goods and services (e.g. ‘Education’ or
‘Food’) matches the one in the JRC-GEM-E3 model. In the second step, Euromod is fed
with the impact of the simulated carbon-adjustment mechanism over prices and incomes,
as simulated by JRC-GEM-E3. In more detail, the consumption expenditure of each
household is adjusted to account for the changes in prices, while keeping constant the
quantities consumed in each category. Furthermore, household income is also adjusted to
account for the changes in labour and capital income triggered by the introduction of
CBAM, as simulated by the JRC-GEM-E3. It should be noted that the recycling of the
revenues from the carbon-adjustment mechanism is done through a budget-neutral
reduction of labour income taxation, which is performed within the JRC-GEM-E3 model.
The changes in labour income that feed the micro simulations from the macro model
include the effect of this compensatory measure (alongside with the direct impact of the
CBAM on prices and incomes mentioned above).
This procedure rests on two key assumptions affecting the estimation of the change in the
indirect tax burden for households. First, in the CBAM scenarios, households are
assumed to continue consuming the same quantities of all goods and services as before.
This can be interpreted as consumers’ demand being inelastic or the ‘overnight effect’
(households do not adapt their consumption basket after the change in price
18
While there are more up to date EU-SILC data, the 2010 version was chosen to match the latest EU-HBS
dataset available for the imputation of consumption data. 19
Household market income net of direct taxes and cash benefits. 20
There are a number of reasons for the baselines of Euromod and JRC-GEM-E3 not to be necessarily
aligned in a given year. One of them is that Euromod and JRC-GEM-E3 variables are constructed in
accordance to different sets of statistics: for example, while in JRC-GEM-E3 household consumption is
aligned with National Account data, consumption is recorded from survey data in Euromod.
31
immediately). That effectively rules out any offsetting effects via reduced demand.21
Second, estimations of the changes in consumer prices resulting from the CBAM are
calculated with the JRC-GEM-E3 model. This means impacts on producer prices are
captured in the general equilibrium solution of the CGE model, but are exogenous to
Euromod.
4. PRIMES
The PRIMES model, was employed to assess CBAM for the electricity sector. PRIMES
model (Price-Induced Market Equilibrium System22
) is a large-scale applied energy
system model that provides detailed projections of energy demand, supply, prices and
investment to the future, covering the entire energy system including emissions. The
distinctive feature of PRIMES is the combination of behavioural modelling (following a
micro-economic foundation) with engineering aspects, covering all energy sectors and
markets. The model has a detailed representation of instruments policy impact
assessment related to energy markets and climate, including market drivers, standards,
and targets by sector or overall. It simulates the EU Emissions Trading System in its
current form. It handles multiple policy objectives, such as GHG emissions reductions,
energy efficiency, and renewable energy targets, and provides pan-European simulation
of internal markets for electricity and gas.
PRIMES offer the possibility of handling market distortions, barriers to rational
decisions, behaviours and market coordination issues and it has full accounting of costs
(CAPEX and OPEX) and investment on infrastructure needs. The model covers the
horizon up to 2070 in 5-year interval periods and includes all Member States of the EU
individually, as well as neighbouring and candidate countries. PRIMES is designed to
analyse complex interactions within the energy system in a multiple agent – multiple
markets framework. Decisions by agents are formulated based on microeconomic
foundation (utility maximization, cost minimization and market equilibrium) embedding
engineering constraints and explicit representation of technologies and vintages;
optionally perfect or imperfect foresight for the modelling of investment in all sectors.
PRIMES allows simulating long-term transformations/transitions and includes non-linear
formulation of potentials by type (resources, sites, acceptability, etc.) and technology
learning. It is a private model maintained by E3Modelling23
, originally developed in the
context of a series of research programmes co-financed by the European Commission.
The model has been successfully peer-reviewed and team members regularly participate
in international conferences and publish in scientific peer-reviewed journals.
For the simulation of the effects of the CBAM in the electricity sector, the PRIMES
electricity sector model is employed to project scenarios with and without the CBAM to
assess the impacts on the power generation mix, investment, costs, prices and carbon
emissions.
21
It is generally the case that when the price of a good rises (e.g. because an increase in taxation) the
demanded quantity decreases. Empirically, price elasticity of demand are typically found to be in the range
of (-1, 0). 22
More information and model documentation: https://e3modelling.com/modelling-tools/primes/ 23
E3Modelling (https://e3modelling.com/) is a private consulting, established as a spin-off inheriting staff,
knowledge and software-modelling innovation of the laboratory E3MLab from the National Technical
University of Athens (NTUA).

32
The basic projection for the EU countries reflects the assumptions of the MIX scenario,
based on the PRIMES model, as available in end January 2021. The alternative scenarios
assume that the CBAM mechanism increases the unit cost of imports of electricity from
third countries not applying carbon pricing, which induces a restructuring of electricity
trade and readjustment in the fuel and capacity mix in the EU countries.
The analysis considered the period of 2025–2030. The model simulates optimal
expansion and operation of the power system and handles power exchanges over the
interconnection system simultaneously. The simulation fully includes all the EU
countries, the UK, Norway, Switzerland and the Energy Community contracting parties
(with the exception of Georgia). Exports from Russia are part of the simulation and are
price elastic with respect to the CBAM obligation.
The PRIMES model of the power sector performs optimal (least-cost) capacity expansion
and system operation of the interconnected system inter-temporally in the period 2025–
2030. The unknown variables are investment in power generation plants and storage
facilities, the hourly operation of plants, storage facilities and the cross-border flows,
which respect a DC-linear power flow model. Demand for electricity is given, as
projected for the MIX scenario; similarly heat and steam produced by cogeneration units
is fixed, as projected in the MIX. Fuel costs, technical efficiencies and other parameters,
the EU ETS carbon prices and the non-linear cost-potential curves for resources and plant
siting are exogenous data. The model handles power plants individually, considers
various types of investment decisions (e.g. greenfield, brownfield or refurbishment
investment) and includes technical restrictions on their operation.
After projecting capacity expansion, operation and flows, the PRIMES power sector
model calculates costs and revenues following a simulation of stylised wholesale markets
and determines electricity tariffs per sector. The calculation of tariffs per sector of
consumption takes care to recover all generation and grid costs and considers
differentiation of prices by sector based on a simulation of retail supply that reflect a
matching of load profiles and generation portfolios profiles as in bilateral contracts.
Import and export prices reflect wholesale market prices.

33
ANNEX 5: DEFINITIONS
- Raw materials: Materials which are at the beginning of any value chain and are result
of mining or quarrying, or materials such as agricultural and forestry products (i.e.
biomass). Raw materials can be physically modified (e.g. in aggregate size) compared
to their natural form, but usually not chemically modified before used in a production
process. Zero carbon content is assigned to raw materials.
- (Basic) materials: A material is either a (technically pure) substance or a mixture of
substances in a physical form that can be sold, which has been derived from raw
materials in an industrial process, during which their chemical composition is
modified.
- Basic material products: Formed products which consist overwhelmingly of one
single basic material, and which are usually produced in a (sometimes energy-
intensive) process closely coupled and performed in the same installation as the basic
material.
- Components (also referred to as semi-finished products): This term refers to products
made of more than one basic material or basic material product, which require more
complex manufacturing steps. A component by itself is usually not intended for end
consumers but may replace parts of a final product.
- Final products: Every product that is made out of components and/or further basic
materials/products and is ready for sales to end consumers. In contrast to the other
products in the value chain, final products are not part of other final products.
- Production process/production step: a single operation which adds value to one of
the material or product categories listed above, resulting in another material or
product.
- Value chain: This is the sum of subsequent production steps. The value chains
discussed regarding embedded emissions are always understood to include the
processes from the raw material to the product discussed (i.e. relating to the specific
partial product carbon footprint which relates to EU ETS processes to result in the
product discussed). Longer value chains reach further downstream.
- Upstream processes: All the processes required to end up with the product or
material discussed.
- Downstream processes: All processes in which the discussed product or material can
be used. Downstream processes can reach as far as to include manufactured products
intended for the final consumer.
- Being covered by the EU ETS: Production processes or specific GHG emissions
from processes would be considered ‘covered by the EU ETS’, if those processes and
GHG emissions are listed as an activity in Annex I of the EU ETS Directive24
. Hence,
this term should be understood to apply to installations both inside and outside the
EU. This is because the term ‘embedded emissions’ relevant for CBAM design is
intended to be aligned with EU ETS emissions, no matter in which country they take
place.
24
Directive (EU) 2018/410 of the European Parliament and of the Council of 14 March 2018
amending Directive 2003/87/EC to enhance cost-effective emission reductions and low-carbon
investments, and Decision (EU) 2015/1814 (OJ L 76/3).
34
- Embedded emissions: Emissions relating to a specific partial product carbon
footprint of a material or product subject to the CBAM. The definition is intended
such that the CBAM obligation for a material or product can be calculated as:
Obligation = Embedded emissions x Tonnes product [x Carbon price].
- CBAM registry: secure electronic registry system of CBAM importers at EU level. It
would have to link to the relevant customs databases, manage the data of the ‘CBAM
importers’, allow access for the relevant competent authorities and verifiers, and
should store all emission data of installations in third countries which report emissions
for the purpose of the CBAM. For the CBAM designs involving the surrender of
CBAM certificates, the data stored in the CBAM registry will be used by the Central
Administrative CBAM Body to recognize CBAM importers eligible to buy CBAM
certificates and to fulfil the necessary monitoring and verification of surrendering
sufficient CBAM certificates and accounting for any carbon price paid abroad by the
importers.
- CBAM Authority/National authorities tasked with CBAM: Body(ies) assigned the
task of selling CBAM certificates and conducting monitoring and verification of
importers surrendering sufficient CBAM certificates to cover for embedded emissions
in imported materials. In a centralised model, the body would be a central CBAM
authority, while in a decentralised model these tasks would be carried out by national
authorities.
- CBAM certificate: One certificate covers one tonne of CO2 equivalent emissions
embedded in imported materials and is part of CBAM designs involving the surrender
of certificates to a Central Administrative CBAM Body as part of a reconciliation
process.
- Carbon pricing: A price on GHG emissions can take the form of an emissions
trading scheme or a carbon tax. Pricing of GHG emissions in the EU ETS is an
important instrument of the EU’s policy package to support the transformation of
industries towards climate neutrality. This is because it varies only slightly between
Member States and it also results in direct price differences between production at
different origins, creating the need to prevent the risk of carbon leakage. As a result of
the measures to mitigate the risk of carbon leakage, the impact of the carbon price to
foster innovation in low-carbon technology and resource efficiency is weakened and
not consistent across products. This is because the effective share of priced emissions
differs, as free allocation distorts the GHG price signal of EU ETS. The EU’s carbon
pricing policies need to provide fully effective incentives for efficient and climate
neutral production processes, efficient use and choice of materials as well as for
recycling to effectively achieve climate neutrality in the EU in the context of a need
for global emissions reductions as agreed in the Paris Agreement.
62
ANNEX 6: COMPLIANCE COSTS FOR BUSINESSES
Compliance and enforcement costs refer to the costs that are incurred by businesses for
complying with rules and obligations, and for authorities to administer the mechanism
and ensure the rules are respected. This section assesses the costs of the different CBAM
options following a standard cost model approach.
Structure
The assessment of compliance and enforcement costs considers the different design
elements of setting up the various options of CBAM. On the one hand, these can be
largely similar across options, but on the other, these also vary depending on the choice
of implementation. For all options, existing processes and their costs for businesses and
authorities have been considered to only quantify new costs additional to the business as
usual scenario.
This section assesses the following parameters to cover possible combinations of option
design and implementation set-up:
1. Whether the choice of instrument is an import tax, uses import certificates
(CBAM certificates) or an excise duty system;
2. Whether the mechanism relies fully on default values or is one in which
importers to claim individual treatment based on actual emission.
For each of these parameters, cost elements have been identified based on the necessary
process. Cost elements can be based on information obligations that define data that
economic operators need to be able to provide to authorities or transaction costs related
to the payment itself. These cost elements have been standardised to unit costs to reflect
single elements that can be multiplied by the number of yearly occurrences. The single
unit varies between the cost elements. Some occur on an installation level (e.g.
monitoring costs), while costs per declaration or per economic operator are the single
unit for other elements such as the surrender of the payment or certificates.
For enforcement costs of authorities, the same method is followed to the extent that data
is available. Wherever possible, similar sources of data to the costs for businesses have
been used to ensure comparable estimates. However, in particular for the implementation
as an excise duty, this data was not available in a similar way to the options using CBAM
certificates or an import tax.
Data
In order to estimate the compliance costs for economic operators and determine the
drivers behind enforcement costs for authorities, data from cost assessments of existing
mechanisms is used. Cost elements are estimated based on similar elements in
instruments such as the EU ETS, national emissions trading systems, existing excise
duties or import taxes as well as the Clean Development Mechanism (CDM25
) as an
international instrument that monitors emissions from international installations and
projects. Therefore, it is a central assumption of this assessment that CBAM cost
25
https://cdm.unfccc.int/index.html
83
elements are mainly comparable to the similar elements of existing mechanisms.
Important deviations from this assumption, notably in the case of emissions monitoring,
will be mentioned and discussed below.
For cost elements of EU instruments as well as excise duties, data on national
implementation in the Member States is the main source of information. In the
assessment activities, the most recent, comprehensive data is used to reflect process
simplifications from digitalization of customs and tax procedures in the EU. The
estimations on the number of imports, businesses or installations is based on data from
industry associations, reports prepared for the EU Commission as well as EU and
national databases on tax and customs.
Some data sources are academic papers, while many have been collected in public
databases or form part of impact assessments and evaluations at the national level.
Academic research, however, also provides important comparative assessments between
economic policy instruments that help to understand the context and validate the results
for an option in relation to the others. As such, research articles find that compliance
costs for customs and excise duty instruments are the lowest of all tax instruments2627
.
However, this relates to weight, volume or value-based instruments and does not
consider the monitoring of emissions in third countries. Moreover, the literature provides
evidence that important cost drivers for all types of instruments are the number of
taxpayers, the frequency of reporting and the number of exemptions and differing rates28
.
Overall, the estimations provided in this report are based on instruments that have been in
place for multiple years, which has led to reductions of problems in efficiency. A newly
established CBAM as the first of its kind would likely result in higher costs initially.
Thus, the estimations made in the sections below are approximations. While the absolute
costs of a CBAM could be higher, the assessment enables an evidence-based comparison
of the options and their implementations.
Assumptions
For the estimation of the costs for businesses and authorities, the assessment is based on
a set of assumptions. First, general assumptions underlying the assessment are:
Compliance costs are assumed to arise for importers located in the EU that would
have to pay the CBAM obligation. This could be done either based on a default
value or by providing verified information about actual emissions, if voluntarily
chosen by the importer. While the monitoring of these actual emissions would
take place outside the EU, the responsibility – and thus costs – of providing the
information to authorities lies with the importers.
26
Eichfelder, S., & Vaillancourt, F. (2014). Tax compliance costs: A review of cost burdens and cost
structures. arqus Discussion Paper No. 178. 27
Smulders, S., Stiglingh, M., Franzsen, R., & Fletcher, L. (2012). Tax compliance costs for the small
business sector in South Africa—Establishing a baseline. EJournal of Tax Research, 10(2), 44. 28
Barbone, L., Bird, R. M., & Vazquez-Caro, J. (2012). The Costs of VAT: A Review of the Literature.
CASE Network Reports.

83
For CBAM options which use default values, it is assumed that all importers
report such monitored actual emissions. For the initial phase, this is realistic in
the case that actual emission values are made mandatory by the legislator.
As already mentioned above, the CBAM is assumed to result in comparable costs
as existing, similar mechanisms. However, the CBAM will target imports of
products and their embedded emissions. Therefore, costs from existing
mechanisms of monitoring installations’ emissions are generally doubled to create
an estimation for the production of multiple products in one installation. This is
estimated based on own expertise and reflects the additional burden for
monitoring emissions related to the production process of the different products.
The number of occurrences for installations, imports and economic operators are
based on the sectors steel, cement, aluminium, polymers, fertilisers and
petrochemicals. A narrower or broader scope would therefore reduce or increase
the respective numbers. From these sectors, basic material imports are considered.
The inclusion of basic material products would increase the number of cases and
subsequently the costs, notably for the border mechanisms import tax and import
EU ETS.
For the assessment of the cost of individual treatment based on actual embedded
emissions, the number of relevant global installations is estimated based on the
number of EU installation and the relation between EU production and imports29
.
The total number could in reality be lower due to importers deciding to import
from fewer installations to increase efficiency of MRV obligations.
The number of import actions per year is estimated based on imported quantities
in relation to the average share of import modes for sea road and rail30
. Because
of the nature of basic materials, a high share of bulk shipments is assumed, which
results in a low number of import events in relation to the weight of imports. The
average capacities of bulk shipments for the modes of transport are based on
information from logistics service providers.
The number of importers is estimated based on the number of Authorised
Economic Operators31
. The share of affected importers is assumed to reflect the
share of import value of the mentioned basic materials out of the value of all EU
imports32
.
Importers are assumed to have existing relations and exchange with customs
authorities due to customs declarations, and also involving payments, because of
existing obligations such as import sales tax. Therefore, basic data on quantity
and origin is available, with the main information missing being the embedded
emission from the production process.
29
Data sources: publicly available industry data from European Aluminium, CEFIC, PetrochemistryEU,
Ecorys et al. 2019, and the US International Trade Administration. 30
Eurostat, 2020: https://ec.europa.eu/eurostat/statistics-
explained/index.php/International_trade_in_goods_by_mode_of_transport#Trade_by_mode_of_transport_i
n_value_and_quantity 31
See: https://ec.europa.eu/taxation_customs/general-information-customs/customs-security/authorised-
economic-operator-aeo/authorised-economic-operator-aeo_en 32
Data sources: industry data, Eurostat, 2020: https://ec.europa.eu/eurostat/statistics-
explained/index.php/International_trade_in_goods

83
The creation of an excise duty would oblige domestic producers and businesses in
the value chain. Therefore, the introduction of an excise duty is assumed to create
comparable cost elements as the existing excise duties (e.g. on tobacco or
alcohol). In contrast to other existing excise duties on goods like alcohol or
tobacco, it is assumed that real-time tracking through the Excise Movement
Control System33
is not necessary, because of the low excise duty value in
relation to the weight of the product.
Expressed in numbers, these assumptions translate into a number of estimated cases for
non-EU installations, importing operators and import actions. These numbers form the
basis for the multiplication of standardised unit costs to estimate the total costs of the
options.
Table 6-1: Number of estimated cases for third-country installations, importers and
import transactions.
Number of third-country installations 510
Number of importers 1 000
Number of import transactions per year 239 000
Source: estimations based on industry and statistical data34
For an excise duty option the number of cases expresses the number of businesses and
installations producing, importing, processing and storing goods containing the basic
materials covered by the CBAM. Because of the nature of basic materials as input in
different value chains, a number ten times the number of EU installations in the steel,
cement, aluminium and petrochemicals sectors plus the third-country installations is
33
See: https://ec.europa.eu/taxation_customs/business/excise-duties-alcohol-tobacco-energy/excise-
movement-control-system_en 34
Data on industries: https://legacy.trade.gov/steel/countries/pdfs/imports-eu.pdf; Ecorys et al. 2017:
http://publications.europa.eu/resource/cellar/07d18924-07ce-11e8-b8f5-01aa75ed71a1.0001.01/DOC_1;
European Aluminium: https://www.european-aluminium.eu/activity-report-2019-2020/market-overview/;
VCI 2020: https://www.vci.de/vci/downloads-vci/publikation/chemiewirtschaft-in-zahlen-print.pdf;
CEFIC: https://cefic.org/app/uploads/2019/01/The-European-Chemical-Industry-Facts-And-Figures-
2020.pdf
Importers: Based on number of overall AEOs in the EU:
https://ec.europa.eu/taxation_customs/dds2/eos/aeo_consultation.jsp?Lang=en; and the share of imports in
each sector (in terms of value) of the overall value of imports: https://ec.europa.eu/eurostat/statistics-
explained/index.php/International_trade_in_goods#:~:text=EU%2D27%20international%20trade%20in,ex
ports%20(EUR%2073%20billion)
Import transactions: Imported quantities taken for each industry from the sources above; Modal split of
imports: Eurostat, 2020: https://ec.europa.eu/eurostat/statistics-
explained/index.php/International_trade_in_goods_by_mode_of_transport#Trade_by_mode_of_transport_i
n_value_and_quantity; Cargo industry data, mainly: https://www.dsv.com/en/our-solutions/modes-of-
transport/sea-freight/shipping-container-dimensions/dry-container; https://www.marineinsight.com/types-
of-ships/different-types-of-bulk-carriers/;
https://www.csx.com/index.cfm/customers/resources/equipment/railroad-equipment/
83
assumed for this. This is again based on expertise in the project team and the common
use of the materials. The result is 10 000 cases for the excise duty system.
It should be noted that the numbers provided here and below as well as the corresponding
results are estimates with potentially significant margins of errors.
1. Assessment of compliance costs for businesses
Following the general remarks and assumptions laid out above, this section will assess
and estimate the compliance costs for businesses that arise from the different options and
their implementation.
When outlining the cost elements, it is important to note that they differ between the
border instruments and the excise duty option. The former comprises the implementation
through the surrender of import certificates (CBAM certificates) and the payment of an
import tax.
On the one hand, design options 1 to 5 rely on an adjustment of carbon price at the
border using the payment options of an import tax or import certificates. For those border
instruments, the cost elements are the following:
First and most importantly, the quantification of the emissions value that forms
the basis of the calculation of the carbon price for design options in which
importers claim of actual emissions. This includes:
o Monitoring the quantity of imported goods.
o Tracking the place of origin.
o Monitoring the embedded carbon emissions of goods stemming from the
production process.
o Verification of the monitored emissions.
Cost related to the documentation of the process, including the submission of
information to the CBAM registry.
Costs related to making the payment.
Costs related to the preparation for controls by the authorities.
Based on these cost elements, the options for implementation are assessed in the
following sections.
Import tax
For the first set of cost elements related to the quantification of emissions, based on the
outlined assumptions, monitoring the quantity of imported goods and their origin does
not cause substantial added burden to businesses. In a CBAM option that purely relies on
default values, monitoring of the emissions from the production process is not necessary
and therefore also cause no substantial costs. However, in an option that sees importers to
claim the actual emissions from the production process, the monitoring creates
substantial costs for the business. Based on estimates of the transaction costs of the
CDM, monitoring emissions of an installation are quantified at EUR 10 200 per year35
.
35
Krey, M. (2004). Transaction Costs of CDM Projects in India – An Empirical Survey. Hamburg Institute
of International Economics.

83
Assuming the doubled costs for monitoring production processes instead of entire
installations, this results in EUR 20 400 per year and non-EU installation.
The verification of claimed emissions adds further costs in the case of a possibility to
deviate from default values. A report on the national implementation of the EU ETS in
the United Kingdom estimates yearly verification costs for an installation at EUR 4 000.
Estimations for the CDM, however, indicate a span for verification costs36
between EUR
4 000 and EUR 15 300 per installation and verification cycle (Krey, 2004). It should be
noted that these figures relate to the monitoring and verification at the installation level.
As pointed out above, the differentiation between products from one plant would require
more granular tracking of emissions and is expected to increase the costs for both
monitoring and verification substantially. Therefore, the cost estimate presented here is
not a definite amount.
As second cost element, the documentation and reporting of the quantities and emissions
is assessed based on the reporting costs estimated under the EU ETS for UK businesses.
Based on this, the estimation is of EUR 900 per year and business (Talbot, 2016). As a
higher frequency of documentation is assumed for an import tax, this number is
estimated to be up to six times higher. This is based on fewer information needed to be
documented more often during a year.
The payment of the CBAM in the form of an import tax is considered to be a negligible
additional burden because an existing relation of the importer with authorities involving
tax and customs payments is assumed.
Finally, the costs of preparation for controls are included, for options of claimable actual
emissions, in the costs for MRV described before. For options relying on default values,
checks and audits do not involve substantially more information than existing
mechanisms and therefore the additional costs are negligible.
Table 6-2 summarises the above. In total, the sum of yearly standardised cost estimations
amounts to EUR 5 400 per importer for options entirely based on default values.
In contrast, options where claiming actual emissions is possible result in total yearly
costs between EUR 30 800 and EUR 43 800 for quantifying actual emission values. Data
on yearly MRV costs of the EU ETS implementation in Germany (on installation level,
not product specific) estimates EUR 23 700 per installation37
. This validates the
estimations for cost elements and indicates an amount closer to the higher end of the
range. In addition, the low costs for the default value option is in line with academic
findings on the low level of compliance costs with border tax measures, as outlined
above.
36
Talbot, A. (2016). ASSESSMENT OF COSTS TO UK PARTICIPANTS OF COMPLIANCE WITH
PHASE III OF THE EU EMISSIONS TRADING SYSTEM. Department for Business, Energy &
Industrial Strategy.
https://assets.publishing.service.gov.uk/government/uploads/system/uploads/attachment_data/file/799575/
Cost_of_Compliance_Report.pdf 37
Destatis OnDEA database, calculation for 1 900 EU ETS participants:
https://www.ondea.de/SiteGlobals/Functions/Datenbank/Vorgaben/Einzelansicht/Vorgabe_Einzelansicht.ht
ml?cms_idVorgabe=12746

83
Table 6-2: Annual compliance costs estimates per importer (in 1 000 EUR) for a
CBAM implemented as an import tax.
Determination of
emission
intensity
Cost elements
Default values only Possibility to present actual
emissions
Monitoring of basic material
quantities negligible extra burden negligible extra burden
Tracking of origin of goods negligible extra burden negligible extra burden
Monitoring of embedded
emissions from production
process
negligible extra burden 20.4 (for plant emissions)
Verification of monitored
emissions negligible extra burden 4-18 (for plant emissions)
Submission of documentation of
imports 5.4 5.4
Tax return and tax payment negligible extra burden negligible extra burden
Inspection and audit costs to be
prepared for verification by
authorities
negligible extra burden 1–2
Total (standardised costs38) 5.4 30.8–43.8
Sources: Krey 2004, Talbot 2016, Destatis OnDEA database
The result for overall yearly costs for EU businesses is calculated based on the estimates
and the number of cases. For an import tax relying entirely on default values, the
compliance costs amount to EUR 5.4 million per year.
For an import tax using actual emission values, it is assumed that all importers are
claiming actual emissions. The total cost for such a CBAM amount to EUR 18.84 million
to EUR 26.98 million. If only 50 % of importers are submitting actual emission values
while the other 50 % uses default values, the total compliance costs drop to between
EUR 11.8 million and EUR 15.7 million.
38
Unit differs between third-country installations for MRV and inspection costs, and importers for
documentation.
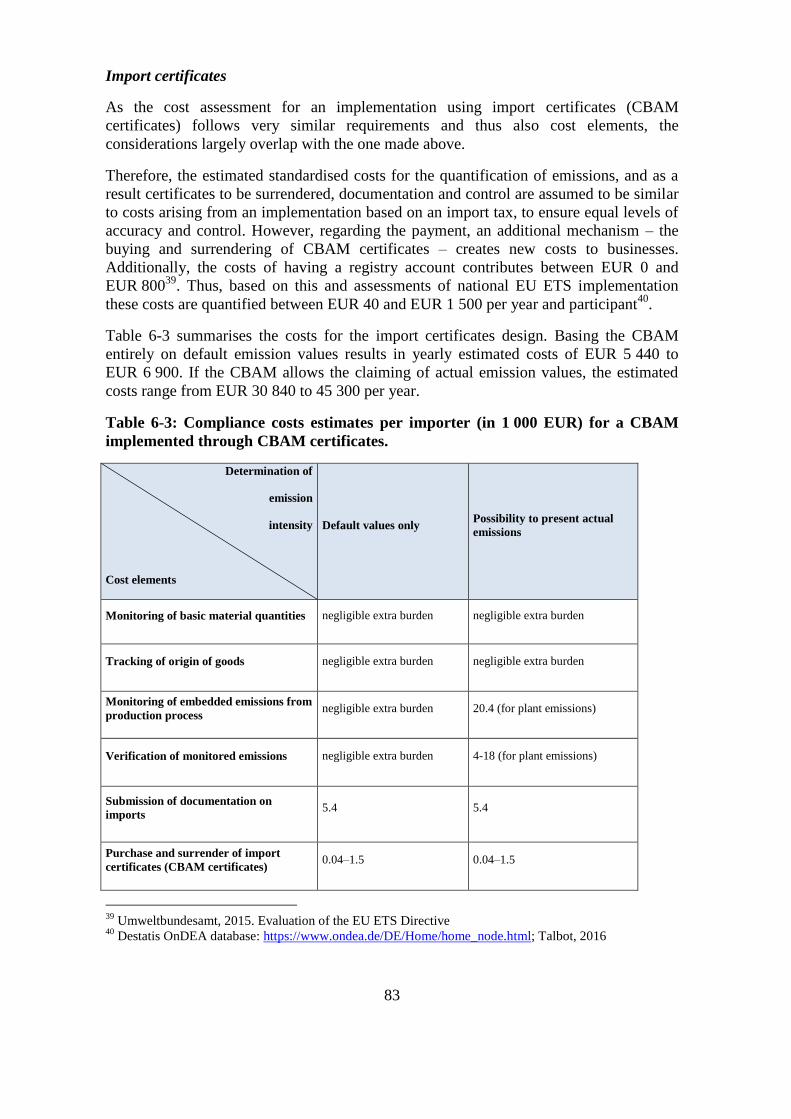
83
Import certificates
As the cost assessment for an implementation using import certificates (CBAM
certificates) follows very similar requirements and thus also cost elements, the
considerations largely overlap with the one made above.
Therefore, the estimated standardised costs for the quantification of emissions, and as a
result certificates to be surrendered, documentation and control are assumed to be similar
to costs arising from an implementation based on an import tax, to ensure equal levels of
accuracy and control. However, regarding the payment, an additional mechanism – the
buying and surrendering of CBAM certificates – creates new costs to businesses.
Additionally, the costs of having a registry account contributes between EUR 0 and
EUR 80039
. Thus, based on this and assessments of national EU ETS implementation
these costs are quantified between EUR 40 and EUR 1 500 per year and participant40
.
Table 6-3 summarises the costs for the import certificates design. Basing the CBAM
entirely on default emission values results in yearly estimated costs of EUR 5 440 to
EUR 6 900. If the CBAM allows the claiming of actual emission values, the estimated
costs range from EUR 30 840 to 45 300 per year.
Table 6-3: Compliance costs estimates per importer (in 1 000 EUR) for a CBAM
implemented through CBAM certificates.
Determination of
emission
intensity
Cost elements
Default values only Possibility to present actual
emissions
Monitoring of basic material quantities negligible extra burden negligible extra burden
Tracking of origin of goods negligible extra burden negligible extra burden
Monitoring of embedded emissions from
production process negligible extra burden 20.4 (for plant emissions)
Verification of monitored emissions negligible extra burden 4-18 (for plant emissions)
Submission of documentation on
imports 5.4 5.4
Purchase and surrender of import
certificates (CBAM certificates) 0.04–1.5 0.04–1.5
39
Umweltbundesamt, 2015. Evaluation of the EU ETS Directive 40
Destatis OnDEA database: https://www.ondea.de/DE/Home/home_node.html; Talbot, 2016
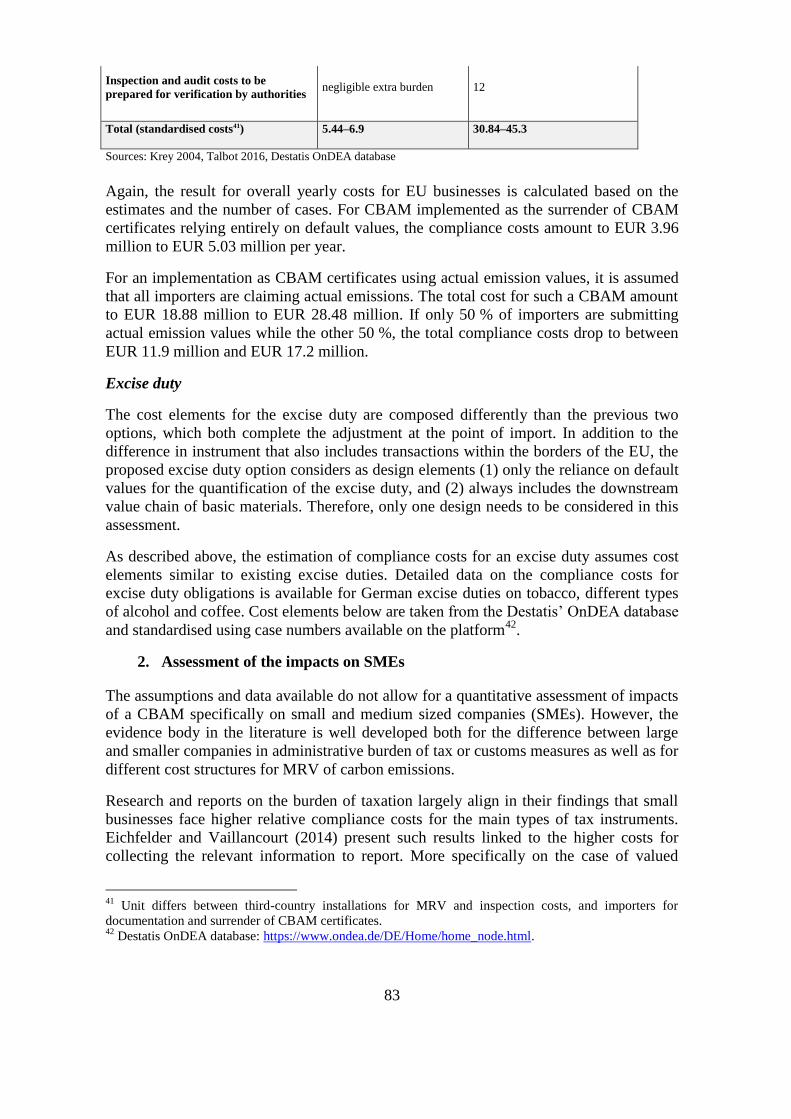
83
Inspection and audit costs to be
prepared for verification by authorities negligible extra burden 12
Total (standardised costs41) 5.44–6.9 30.84–45.3
Sources: Krey 2004, Talbot 2016, Destatis OnDEA database
Again, the result for overall yearly costs for EU businesses is calculated based on the
estimates and the number of cases. For CBAM implemented as the surrender of CBAM
certificates relying entirely on default values, the compliance costs amount to EUR 3.96
million to EUR 5.03 million per year.
For an implementation as CBAM certificates using actual emission values, it is assumed
that all importers are claiming actual emissions. The total cost for such a CBAM amount
to EUR 18.88 million to EUR 28.48 million. If only 50 % of importers are submitting
actual emission values while the other 50 %, the total compliance costs drop to between
EUR 11.9 million and EUR 17.2 million.
Excise duty
The cost elements for the excise duty are composed differently than the previous two
options, which both complete the adjustment at the point of import. In addition to the
difference in instrument that also includes transactions within the borders of the EU, the
proposed excise duty option considers as design elements (1) only the reliance on default
values for the quantification of the excise duty, and (2) always includes the downstream
value chain of basic materials. Therefore, only one design needs to be considered in this
assessment.
As described above, the estimation of compliance costs for an excise duty assumes cost
elements similar to existing excise duties. Detailed data on the compliance costs for
excise duty obligations is available for German excise duties on tobacco, different types
of alcohol and coffee. Cost elements below are taken from the Destatis’ OnDEA database
and standardised using case numbers available on the platform42
.
2. Assessment of the impacts on SMEs
The assumptions and data available do not allow for a quantitative assessment of impacts
of a CBAM specifically on small and medium sized companies (SMEs). However, the
evidence body in the literature is well developed both for the difference between large
and smaller companies in administrative burden of tax or customs measures as well as for
different cost structures for MRV of carbon emissions.
Research and reports on the burden of taxation largely align in their findings that small
businesses face higher relative compliance costs for the main types of tax instruments.
Eichfelder and Vaillancourt (2014) present such results linked to the higher costs for
collecting the relevant information to report. More specifically on the case of valued
41
Unit differs between third-country installations for MRV and inspection costs, and importers for
documentation and surrender of CBAM certificates. 42
Destatis OnDEA database: https://www.ondea.de/DE/Home/home_node.html.

83
added tax (VAT), Barbone et al. (2012) present a similar finding in the context of a
review of research papers. These finding is also confirmed by a study conducted by
KPMG and GfK on behalf of the European Commission43
. Data collection for tax
reporting is identified as the main cost driver. Total costs are found to be relatively
higher for smaller companies. However, the core focus of all these studies relates to VAT
and Corporate Income Tax (CIT). Customs and excise duties are less systematically
assessed. In the EU study, they are found to be one of the most burdensome taxation
types beyond VAT or CIT in a high-level analysis. In a South African study, Smulders et
al. (2012) still finds substantially lower compliance costs for customs and excise duties
than for VAT or CIT. Recording of information is also found to be a main factor in this
study, behind the familiarization with the tax instrument.
Literature sources on the compliance costs with carbon quantification instruments point
in a similar direction. Academic work finds substantially higher administrative costs per
tonne of CO2 for small emitters in emission quantification systems like the EU ETS44
or
the Clean Development Mechanism (c.f. Krey, 2004). The national compliance costs
study of EU ETS implementation in the UK confirms these results (Talbot, 2016). Small
emitters (< 25 000 tonnes per year) in the EU ETS face more than 8 times higher
compliance costs than emitters of 50 000–500 000 tonnes.
Overall, this indicates that a CBAM would result in relatively higher compliance costs
for SMEs compared to large enterprises. As mentioned above, the exact degree of
difference between the two groups could not be quantified based on the currently
available data.
Information on the structure of the sectors under consideration is not comprehensively
available for the entire EU because it is classified as confidential in many Member States.
Calculations based on Eurostat data45
for the sectors’ NACE codes (three digits) result in
a total number of 31 000 SMEs in the sectors considered for a CBAM in this study.
However, this number needs to be considered in context. First, the production value of
SMEs in the sectors of the dataset – based on the available data – amounts to 19 % of the
overall production value. Second, the data includes wider sector definitions than the
proposed product scope of this study. For instance, ceramics are included in the cement
sector. This can be expected to change the structure significantly, as some subsectors
(like ceramics) have a much higher share of SMEs than the considered raw materials46
.
The fact that a CBAM applies to imports of a few basic materials and basic material
products results in large businesses being the main mainly impacted ones. Therefore, the
practical impact of import related measures would have little practical impact on SMEs,
even though this impact would be relatively higher than for large businesses if compared
on the amount imported.
43
KPMG & GfK. (2018). Study on tax compliance costs for SMEs. EASME/COSME/2015/004. Brussels. European
Commission. https://op.europa.eu/en/publication-detail/-/publication/0ed32649-fe8e-11e8-a96d-01aa75ed71a1 44
Coria, J. & Jaraite, J. (2019). Transaction Costs of Upstream Versus Downstream Pricing of CO2
Emissions. Environmental and Resource Economics, 72(4), pp. 965-1001. 45
See
https://ec.europa.eu/eurostat/databrowser/view/SBS_SC_IND_R2__custom_553424/default/table?lang=en 46
EU-MERCI. Analysis of the industrial sectors in the European Union. http://www.eumerci-
portal.eu/documents/20182/38527/0+-+EU.pdf
83
An option that includes goods further along the value chain, or also EU internal
transactions like the proposed excise duty option, would result in a higher a substantially
larger share of SMEs targeted by the CBAM measures and therefore also in higher
compliance costs for SMEs overall. A study on the compliance costs of the REACH
Regulation47
which applies to EU manufacturers and importers highlights the higher
burden for SMEs, compared to large companies48
. The quantification of this effect for the
CBAM is however not possible at this point as available data is lacking.
3. Assessment of enforcement costs for the administration
The assessment of enforcement costs focuses on identifying the drivers of costs for
authorities in the enforcement of the CBAM options.
Essentially, the authorities face comparable cost elements as the businesses, with the
difference that costs arise from assessing information and controlling the reports from
economic operators. Literature describes the same cost drivers for administration and
enforcement costs as for compliance for taxation measures (Barbone et al., 2012). This is
most importantly the complexity of the system, including the number of different rates,
exemptions or documents required. Therefore, the options that have been found as more
costly for businesses above, in general also create higher costs for authorities.
As authorities are already assessing customs declarations for imported goods in the
volume and scope of this study, an existing infrastructure and processes are in place. This
assessment of enforcement costs will again provide estimations on the additional costs
compared to this business as usual scenario. This applies mostly to data processing and
exchange, but also to controls and payments. The following sections will provide details
on the specific options.
The sections provide estimations for the assessed administration and compliance costs. In
line with the compliance cost assessment, the estimations are based on studies published
by the European Commission49
as well as impact assessments at EU and national
levels50
. In cases where the enforcement effort was indicated in a time duration, the
average hourly wage costs of the EU51
were used to estimate the resulting costs.
IT infrastructure
An overarching cost element is to have the necessary IT technology in place. Collected
data at the time of import by customs authorities needs to be shared with the authorities
in charge of assessing declared actual emissions (if applicable) and connect the imported
goods to CBAM certificates either already surrendered at that point or to be surrendered
47
Regulation on the registration, evaluation, authorisation and restriction of chemicals. EC Regulation No
1907/2006. 48
See also SWD (2018) 58 final. 49
Amec Foster Wheeler Environment, 2016. Evaluation of EU ETS Monitoring, Reporting and
Verification Administration Costs. http://publications.europa.eu/resource/cellar/f6a49ec5-c35c-11e6-a6db-
01aa75ed71a1.0001.01/DOC_1 . 50
Impact assessment of EU customs and tax instruments, the implementation of EU legislation in
Germany, and of taxation initiatives in the UK. 51
https://ec.europa.eu/eurostat/statistics-explained/index.php/Wages_and_labour_costs

83
(also if applicable52
). In any case, data on the imported quantities and related pricing of
the CBAM certificates has to be shared with a central European system to collect the
CBAM revenue as an EU-own resource. The same also applies to the option of
implementation the CBAM as an excise duty as this would also require an interface
between Member States and the EU Commission, including the customs organisations.
This can represent a major share of the costs. The implementation of the EU VAT rules
for e-commerce support this indication with estimated costs of EUR 2.2 million per
Member State for the introduction of a one-stop shop system53
. Across the options
assessed below, the need for additional IT systems varies slightly depending on their
complexity and need for collaboration but additional infrastructure would in all cases be
necessary to process the data and share it between customs and CBAM authorities.
Similarly to some existing requirements on imported goods such as ozone-depleting
substances or F-gases, the CBAM could also be part of the recently launched Single
Window Environment for Customs54
that facilitates automatic assessment and sharing of
import-related data. Including the CBAM obligation in this environment would reduce
costs for IT systems and also for the processing of the documents. However, the process
of setting this up would require time and result in some limitations in the
implementation. For example, a centralised assessment of monitoring data would be
necessary. A decentralised approach involving Member States’ existing structures would
not be supported by this environment.
Depending on the inclusion in the Single Window or not, the costs will differ
substantially. Compared to the estimated EUR 2.2 million per year and Member State for
a decentralised IT system, the currently launching Single Window Environment can be
adapted to include the CBAM in its centralised data sharing. Individual Member States
would face lower costs, while the Commission bears a large part of the costs for
maintenance and support. The impact assessment for the Single Window Environment
EUR 9.2 million per year for the Commission during the gradual implementation (first
seven years) and between EUR 350 000 and EUR 680 000 per year and Member State55
.
As the central system will be in place by the time the CBAM enters into force, the yearly
costs for the IT infrastructure, in particular for the Commission, are expected to be lower
than this number.
52
See subsequent sections for the costs of the different set-ups 53
Deloitte (2016). VAT Aspects of cross-border ecommerce - Options for modernization. Final report –
Lot 3: Assessment of the implementation of the 2015 place of supply rules and the Mini-One Stop Shop.
Brussels. European Commission.
https://ec.europa.eu/taxation_customs/sites/taxation/files/vat_aspects_cross-border_e-
commerce_final_report_lot3.pdf . 54
See: https://ec.europa.eu/taxation_customs/general-information-customs/electronic-customs/eu-single-
window-environment-for-customs_en . 55
SWD(2020) 239 final,
https://ec.europa.eu/taxation_customs/sites/taxation/files/201028_single_window_impact_summary.pdf;
and SWD(2020) 238 final,
https://ec.europa.eu/taxation_customs/sites/taxation/files/201028_single_window_impact.pdf
83
Import tax
For CBAM options using an import tax, efforts are necessary for processing documents,
administering payments and controlling the correct declaration of goods. In the case of
actual emissions that are reported, these reports and validations would need to be
assessed as well. Except for the last cost element, customs authorities are already
performing these tasks. A CBAM that fully relies on default values would be based for
very large parts of its administrative needs on existing processes. The carbon price
applicable to an import transaction would be based on the product category and the
weight, both of which data points are already collected. This would be the only additional
requirement, which adds a small marginal amount of cost. The collection of the import
tax directly at the time of import would already be included in this figure. As a second
point, additional controls by customs authorities would be necessary to ensure the right
product categories are declared. The carbon price increases the risk of fraud by declaring
goods that are not covered by CBAM. Therefore, the controls at entry points to the EU
on a sample of imports are necessary and result in additional enforcement costs. These
costs are estimated based on the standardised estimations of costs for additional controls
to enforce the import elements of the VAT obligations of e-commerce56
.
In comparison, an import tax with the option or even expectation to present actual
emission values has a higher complexity and creates higher costs for enforcement. The
processing of customs declaration would require more time, as the existence of an
emissions report supporting the declared carbon content would need to be checked. The
CBAM obligation would need to be paid based on the declared emissions at the time of
import. Together with the necessary controls, this would complete the task of the
customs authority. However, the declared actual emissions would have to be assessed by
a competent climate authority. The monitoring report provided by the importer and its
verification need to be assessed. As the reporting needs to be performed at product level
and in non-EU countries, the costs are again assumed to be twice the amount of assessing
EU ETS reports. Based on cost estimations for the EU ETS57
, this results in costs of
EUR 6 750 per installation from which goods are imported. A reconciliation of payments
needs to be made at the end of a compliance cycle. The administration of these additional
payments by the importers or the refunding in case the actual emissions were lower
creates costs that do not arise when using default values. Using the administration of EU
ETS accounts as a proxy58
, this element is estimated at EUR 400 per importer per year.
In addition to this, it is assumed that a small amount of site inspections at production
sites would be carried out to verify compliance also at the level of production process. As
56
German Parliament, 2020a. Entwurf eines Jahressteuergesetzes 2020.
http://dipbt.bundestag.de/dip21/btd/19/228/1922850.pdf
See also: https://ec.europa.eu/taxation_customs/business/vat/modernising-vat-cross-border-ecommerce_en. 57
Amec Foster Wheeler Environment, 2016. Evaluation of EU ETS Monitoring, Reporting and
Verification Administration Costs. http://publications.europa.eu/resource/cellar/f6a49ec5-c35c-11e6-a6db-
01aa75ed71a1.0001.01/DOC_1 58
Amec Foster Wheeler Environment, 2016.
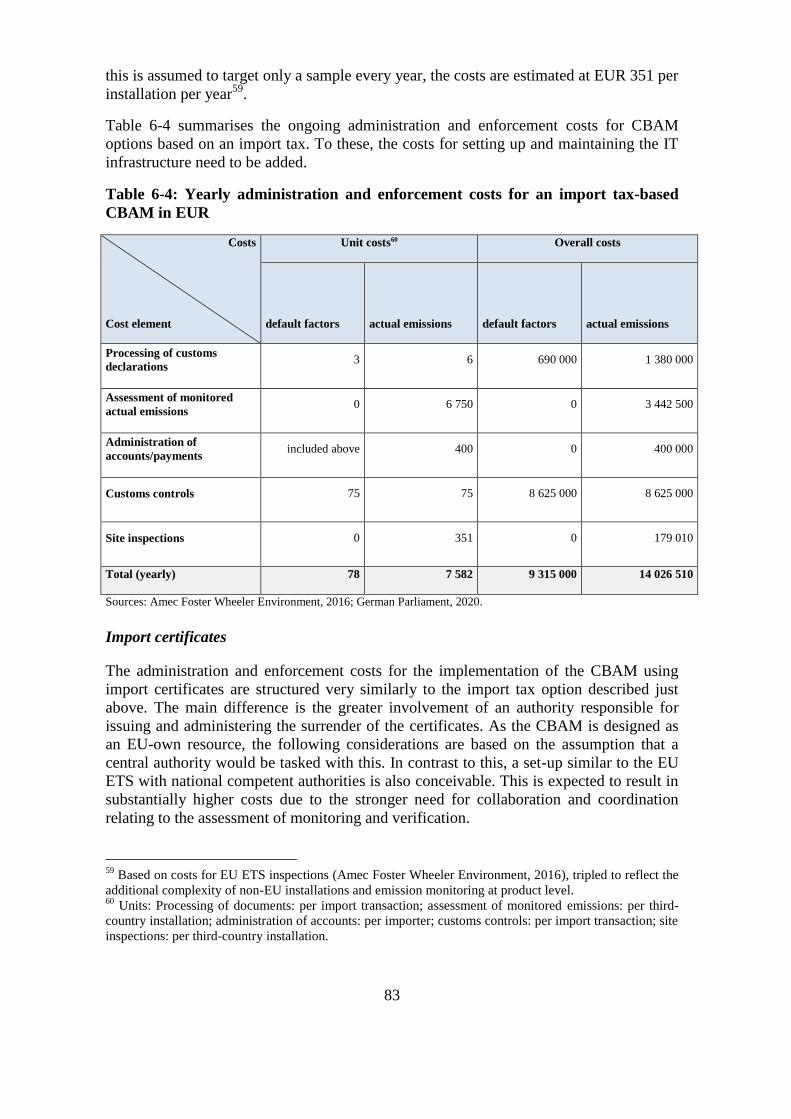
83
this is assumed to target only a sample every year, the costs are estimated at EUR 351 per
installation per year59
.
Table 6-4 summarises the ongoing administration and enforcement costs for CBAM
options based on an import tax. To these, the costs for setting up and maintaining the IT
infrastructure need to be added.
Table 6-4: Yearly administration and enforcement costs for an import tax-based
CBAM in EUR
Costs
Cost element
Unit costs60 Overall costs
default factors actual emissions default factors actual emissions
Processing of customs
declarations 3 6 690 000 1 380 000
Assessment of monitored
actual emissions 0 6 750 0 3 442 500
Administration of
accounts/payments included above 400 0 400 000
Customs controls 75 75 8 625 000 8 625 000
Site inspections 0 351 0 179 010
Total (yearly) 78 7 582 9 315 000 14 026 510
Sources: Amec Foster Wheeler Environment, 2016; German Parliament, 2020.
Import certificates
The administration and enforcement costs for the implementation of the CBAM using
import certificates are structured very similarly to the import tax option described just
above. The main difference is the greater involvement of an authority responsible for
issuing and administering the surrender of the certificates. As the CBAM is designed as
an EU-own resource, the following considerations are based on the assumption that a
central authority would be tasked with this. In contrast to this, a set-up similar to the EU
ETS with national competent authorities is also conceivable. This is expected to result in
substantially higher costs due to the stronger need for collaboration and coordination
relating to the assessment of monitoring and verification.
59
Based on costs for EU ETS inspections (Amec Foster Wheeler Environment, 2016), tripled to reflect the
additional complexity of non-EU installations and emission monitoring at product level. 60
Units: Processing of documents: per import transaction; assessment of monitored emissions: per third-
country installation; administration of accounts: per importer; customs controls: per import transaction; site
inspections: per third-country installation.
83
As the CBAM based on import certificates would also be calculated at the point of
import, customs authorities will need to collect and, depending on the roles given to
either customs authorities and the CBAM Authority/national authorities, process the
information related to the imported product. Data necessary to calculate the amount of
CBAM certificates to be surrendered would have to be included in the customs
declaration and either certificates will be directly surrendered or added up for a final
balance for a full calendar year. While customs will always have an important role, the
option of requiring a surrender or proof of surrender of the certificates at the time of
import will have a significantly higher impact on customs costs. If customs authorities
only collect this information on behalf of the CBAM authority/national authorities, which
would perform the yearly balance, reconciliation and ensure submission, the costs for
customs authorities are lower, as those costs would be shifted to the CBAM
authority/national authorities. The costs would arise in both cases, either for customs
authorities or for the CBAM authority/national authorities, and are for this assessment
assumed to be similar.
In the scenario where default values are used to calculate the certificates to be
surrendered, the administration of the importers’ accounts would be the main cost
difference to the costs of an import tax based on default values. The costs here are
estimated based on the assessment of such costs for the national implementation of the
EU ETS in Germany61
. Because of higher complexity that results from international
accounts that also need to be administered, the reported costs are again doubled. As a
result, EUR 400 per year and importer account are assumed for the administration of
accounts and payments such as the supervision of the surrender of certificates. Additional
customs controls are estimated similarly to the costs for the import tax.
As mentioned above for both compliance costs for industry and for enforcement costs of
the import tax, the possibility to provide actual emissions as basis for the calculation of
the CBAM creates higher costs compared to the use of default values. The need for
emission monitoring reports to support the claimed actual emissions on which the self-
declared CBAM obligation is calculated creates further complexity for the processing of
customs declaration before the customs authorities. Similar to the import tax, the
monitoring reports and verifications need to be assessed by a responsible authority, for
example the CBAM authority or in case of a decentralised system the national
authorities. The costs for this are – just as for the import tax above – estimated at EUR
6 750 per report. This cost element would increase in the case of decentralised
assessment of the MRV documents. In this case, authorities of multiple Member States
would have to assess the documents of an installation unless a system of information,
exchange and eventually acceptance of a decision taken in one Member States is put in
place. In addition, the same costs for site visits are as for the import tax are assumed,
adding on average EUR 351 per installation.
61
German Parliament, 2020: Entwurf eines Gesetzes zur Anpassung der Rechtsgrundlagen für die
Fortentwicklung des Europäischen Emissionshandels.
https://www.bmu.de/fileadmin/Daten_BMU/Download_PDF/Glaeserne_Gesetze/19._Lp/tehg_novelle/ent
wurf/tehg-novelle_180801_rege_bf.pdf
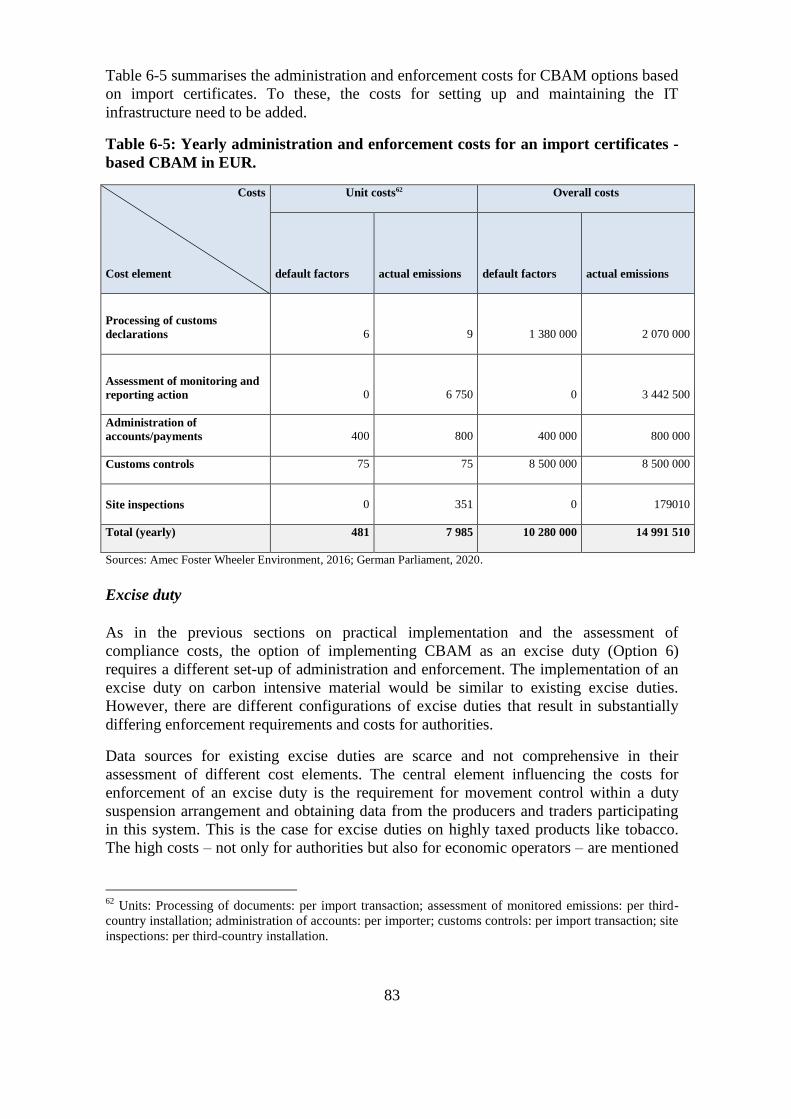
83
Table 6-5 summarises the administration and enforcement costs for CBAM options based
on import certificates. To these, the costs for setting up and maintaining the IT
infrastructure need to be added.
Table 6-5: Yearly administration and enforcement costs for an import certificates -
based CBAM in EUR.
Costs
Cost element
Unit costs62 Overall costs
default factors actual emissions default factors actual emissions
Processing of customs
declarations 6 9 1 380 000 2 070 000
Assessment of monitoring and
reporting action 0 6 750 0 3 442 500
Administration of
accounts/payments 400 800 400 000 800 000
Customs controls 75 75 8 500 000 8 500 000
Site inspections 0 351 0 179010
Total (yearly) 481 7 985 10 280 000 14 991 510
Sources: Amec Foster Wheeler Environment, 2016; German Parliament, 2020.
Excise duty
As in the previous sections on practical implementation and the assessment of
compliance costs, the option of implementing CBAM as an excise duty (Option 6)
requires a different set-up of administration and enforcement. The implementation of an
excise duty on carbon intensive material would be similar to existing excise duties.
However, there are different configurations of excise duties that result in substantially
differing enforcement requirements and costs for authorities.
Data sources for existing excise duties are scarce and not comprehensive in their
assessment of different cost elements. The central element influencing the costs for
enforcement of an excise duty is the requirement for movement control within a duty
suspension arrangement and obtaining data from the producers and traders participating
in this system. This is the case for excise duties on highly taxed products like tobacco.
The high costs – not only for authorities but also for economic operators – are mentioned
62
Units: Processing of documents: per import transaction; assessment of monitored emissions: per third-
country installation; administration of accounts: per importer; customs controls: per import transaction; site
inspections: per third-country installation.
83
by the experts. As the excise duty systems to implement a CBAM is assumed not to
require such real-time tracking, the costs of enforcement can be limited in this respect.
Still, the excise duty requires processing data reported by businesses, maintain the data
infrastructure, and monitor compliance through controls63
. Important factors influencing
the administration and enforcement costs are the complexity of products and the number
of producers obliged to pay the excise duty. A higher number of producers increases
costs for the authorities64
. As discussed in the assessment of compliance costs for
businesses, the number of producers will be high compared to other excisable goods,
because of the nature of the covered products as basic materials for many value chains.
Because of the nature of product and the similarity in set-up, excise duties or
consumption charges for plastic provide a good reference point for the administration and
enforcement of an excise duty on carbon intensive basic materials. Currently, plastic
levies are in preparation in Italy and Spain as well as in the United Kingdom. In the cases
of Italy and Spain, impact assessments for the charge are still to be performed. The case
of the UK provides an estimation of the overall ongoing costs. The impact assessment
performed by the UK government foresees EUR 12.9 million per year for ongoing
costs65
. This includes implementing continuous changes in the collection systems,
compliance monitoring and support to customers. An EU CBAM system could thus be
expected to result in higher yearly costs than that. With the available evidence base, a
more precise quantification is difficult to achieve.
Comparison with EU ETS
Under options 2, 3, 4 and 5, and while the import certificates options would differ in
comparison to the EU ETS (as the system for import certificates would cover goods and
not stationary installations, would involve third party verification, foresees an assessment
based on declared emissions, covers less goods, etc.), the administrative costs of the
current EU ETS may provide an interesting point of comparison. Indeed, under these
options, the setting up of a CBAM would need to consider selling the CBAM certificates
(using EU ETS auctioning prices as a proxy), a CBAM registry (as mentioned above
although simpler than the EU ETS registry) and Monitoring, Reporting and Verification
systems for taking into account actual emissions. In the case of EU ETS:
- The auctioning platform costs around EUR 1.6 million per year, of which EUR
1.5 million is covered by fees for auctioning participants, and EUR 150 000 paid
by the Commission (for reporting, etc.).
- About 2 full-time equivalent for auctioning in DG CLIMA.
- 24 full-time equivalent for handling the EU ETS Union Registry.
63
Ramboll et al. 2014: Study on the measuring and reducing of administrative costs for economic operators
and tax authorities and obtaining in parallel a higher level of compliance and security in imposing excise
duties on tobacco products. https://op.europa.eu/en/publication-detail/-/publication/a5d22256-3d16-4c7f-
bb9e-3209447e517e/language-en. 64
ECOTEC et al., 2001: Economic and Environmental Implications of the Use of Environmental Taxes
and Charges in the European Union and its Member States 65
Converted from GBP, https://www.gov.uk/government/publications/introduction-of-plastic-packaging-
tax/plastic-packaging-tax.
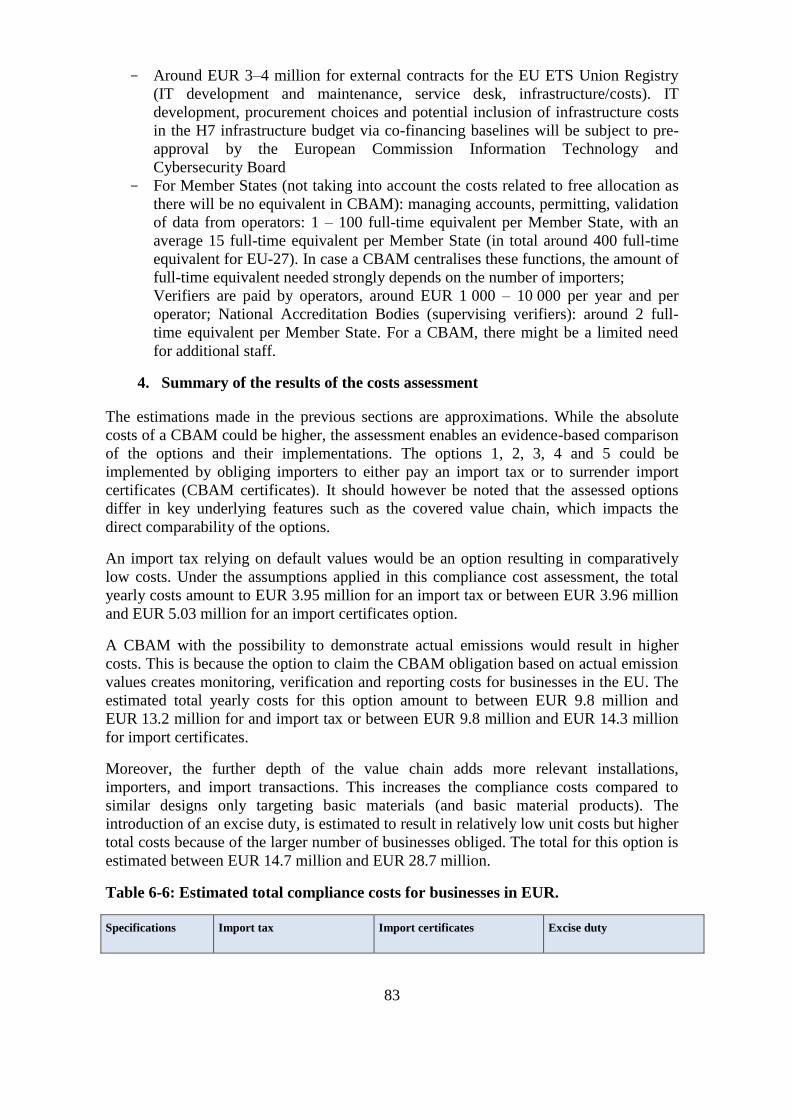
83
- Around EUR 3–4 million for external contracts for the EU ETS Union Registry
(IT development and maintenance, service desk, infrastructure/costs). IT
development, procurement choices and potential inclusion of infrastructure costs
in the H7 infrastructure budget via co-financing baselines will be subject to pre-
approval by the European Commission Information Technology and
Cybersecurity Board
- For Member States (not taking into account the costs related to free allocation as
there will be no equivalent in CBAM): managing accounts, permitting, validation
of data from operators: 1 – 100 full-time equivalent per Member State, with an
average 15 full-time equivalent per Member State (in total around 400 full-time
equivalent for EU-27). In case a CBAM centralises these functions, the amount of
full-time equivalent needed strongly depends on the number of importers;
Verifiers are paid by operators, around EUR 1 000 – 10 000 per year and per
operator; National Accreditation Bodies (supervising verifiers): around 2 full-
time equivalent per Member State. For a CBAM, there might be a limited need
for additional staff.
4. Summary of the results of the costs assessment
The estimations made in the previous sections are approximations. While the absolute
costs of a CBAM could be higher, the assessment enables an evidence-based comparison
of the options and their implementations. The options 1, 2, 3, 4 and 5 could be
implemented by obliging importers to either pay an import tax or to surrender import
certificates (CBAM certificates). It should however be noted that the assessed options
differ in key underlying features such as the covered value chain, which impacts the
direct comparability of the options.
An import tax relying on default values would be an option resulting in comparatively
low costs. Under the assumptions applied in this compliance cost assessment, the total
yearly costs amount to EUR 3.95 million for an import tax or between EUR 3.96 million
and EUR 5.03 million for an import certificates option.
A CBAM with the possibility to demonstrate actual emissions would result in higher
costs. This is because the option to claim the CBAM obligation based on actual emission
values creates monitoring, verification and reporting costs for businesses in the EU. The
estimated total yearly costs for this option amount to between EUR 9.8 million and
EUR 13.2 million for and import tax or between EUR 9.8 million and EUR 14.3 million
for import certificates.
Moreover, the further depth of the value chain adds more relevant installations,
importers, and import transactions. This increases the compliance costs compared to
similar designs only targeting basic materials (and basic material products). The
introduction of an excise duty, is estimated to result in relatively low unit costs but higher
total costs because of the larger number of businesses obliged. The total for this option is
estimated between EUR 14.7 million and EUR 28.7 million.
Table 6-6: Estimated total compliance costs for businesses in EUR.
Specifications Import tax Import certificates Excise duty
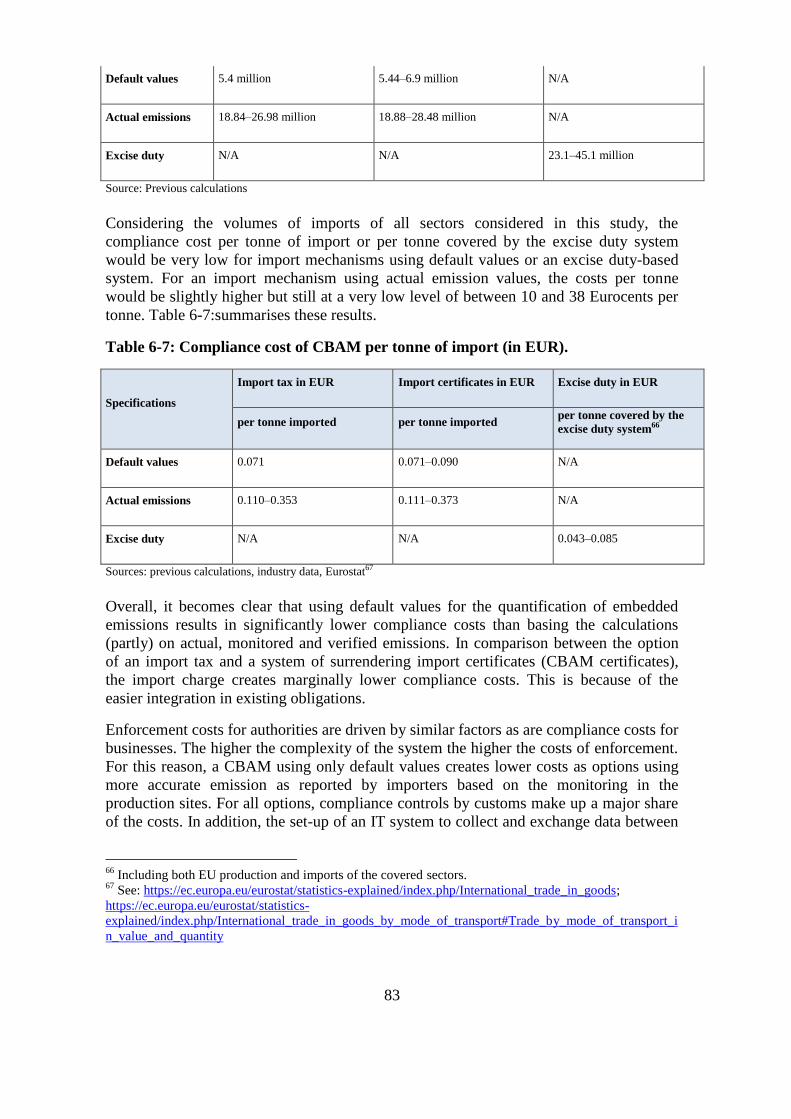
83
Default values 5.4 million 5.44–6.9 million N/A
Actual emissions 18.84–26.98 million 18.88–28.48 million N/A
Excise duty N/A N/A 23.1–45.1 million
Source: Previous calculations
Considering the volumes of imports of all sectors considered in this study, the
compliance cost per tonne of import or per tonne covered by the excise duty system
would be very low for import mechanisms using default values or an excise duty-based
system. For an import mechanism using actual emission values, the costs per tonne
would be slightly higher but still at a very low level of between 10 and 38 Eurocents per
tonne. Table 6-7:summarises these results.
Table 6-7: Compliance cost of CBAM per tonne of import (in EUR).
Specifications
Import tax in EUR Import certificates in EUR Excise duty in EUR
per tonne imported per tonne imported per tonne covered by the
excise duty system66
Default values 0.071 0.071–0.090 N/A
Actual emissions 0.110–0.353 0.111–0.373 N/A
Excise duty N/A N/A 0.043–0.085
Sources: previous calculations, industry data, Eurostat67
Overall, it becomes clear that using default values for the quantification of embedded
emissions results in significantly lower compliance costs than basing the calculations
(partly) on actual, monitored and verified emissions. In comparison between the option
of an import tax and a system of surrendering import certificates (CBAM certificates),
the import charge creates marginally lower compliance costs. This is because of the
easier integration in existing obligations.
Enforcement costs for authorities are driven by similar factors as are compliance costs for
businesses. The higher the complexity of the system the higher the costs of enforcement.
For this reason, a CBAM using only default values creates lower costs as options using
more accurate emission as reported by importers based on the monitoring in the
production sites. For all options, compliance controls by customs make up a major share
of the costs. In addition, the set-up of an IT system to collect and exchange data between
66
Including both EU production and imports of the covered sectors. 67
See: https://ec.europa.eu/eurostat/statistics-explained/index.php/International_trade_in_goods;
https://ec.europa.eu/eurostat/statistics-
explained/index.php/International_trade_in_goods_by_mode_of_transport#Trade_by_mode_of_transport_i
n_value_and_quantity
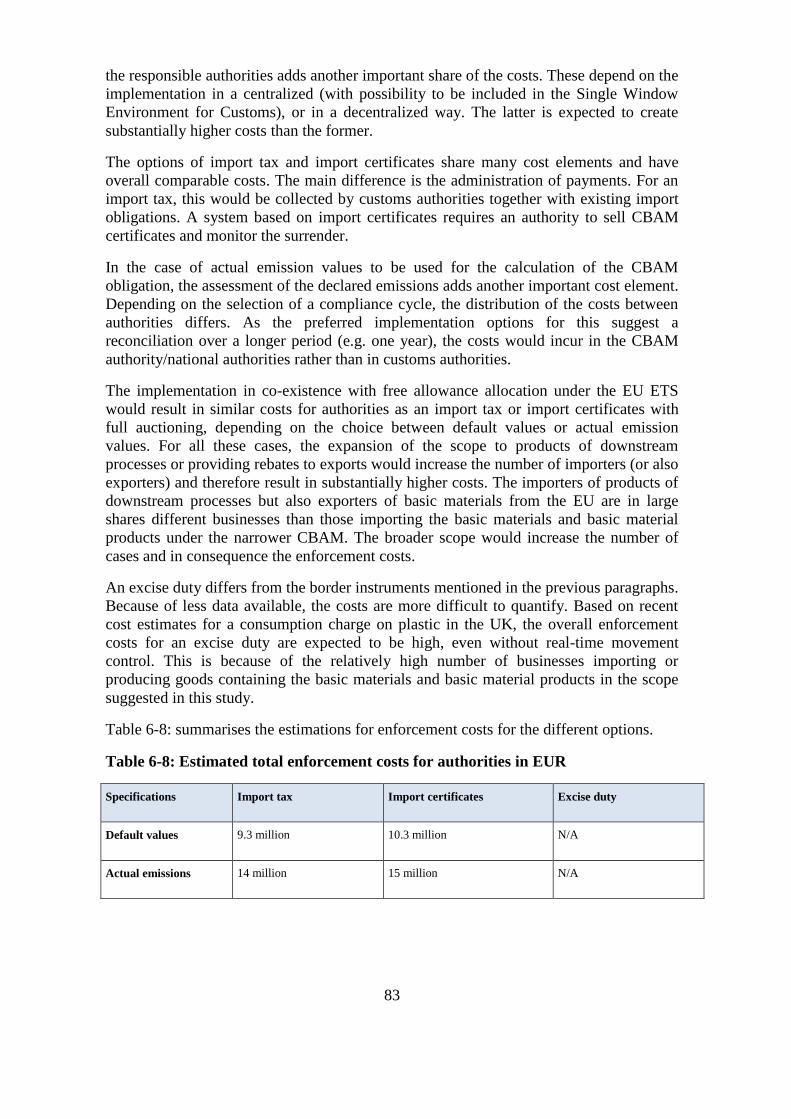
83
the responsible authorities adds another important share of the costs. These depend on the
implementation in a centralized (with possibility to be included in the Single Window
Environment for Customs), or in a decentralized way. The latter is expected to create
substantially higher costs than the former.
The options of import tax and import certificates share many cost elements and have
overall comparable costs. The main difference is the administration of payments. For an
import tax, this would be collected by customs authorities together with existing import
obligations. A system based on import certificates requires an authority to sell CBAM
certificates and monitor the surrender.
In the case of actual emission values to be used for the calculation of the CBAM
obligation, the assessment of the declared emissions adds another important cost element.
Depending on the selection of a compliance cycle, the distribution of the costs between
authorities differs. As the preferred implementation options for this suggest a
reconciliation over a longer period (e.g. one year), the costs would incur in the CBAM
authority/national authorities rather than in customs authorities.
The implementation in co-existence with free allowance allocation under the EU ETS
would result in similar costs for authorities as an import tax or import certificates with
full auctioning, depending on the choice between default values or actual emission
values. For all these cases, the expansion of the scope to products of downstream
processes or providing rebates to exports would increase the number of importers (or also
exporters) and therefore result in substantially higher costs. The importers of products of
downstream processes but also exporters of basic materials from the EU are in large
shares different businesses than those importing the basic materials and basic material
products under the narrower CBAM. The broader scope would increase the number of
cases and in consequence the enforcement costs.
An excise duty differs from the border instruments mentioned in the previous paragraphs.
Because of less data available, the costs are more difficult to quantify. Based on recent
cost estimates for a consumption charge on plastic in the UK, the overall enforcement
costs for an excise duty are expected to be high, even without real-time movement
control. This is because of the relatively high number of businesses importing or
producing goods containing the basic materials and basic material products in the scope
suggested in this study.
Table 6-8: summarises the estimations for enforcement costs for the different options.
Table 6-8: Estimated total enforcement costs for authorities in EUR
Specifications Import tax Import certificates Excise duty
Default values 9.3 million 10.3 million N/A
Actual emissions 14 million 15 million N/A

83
Excise duty N/A N/A >12.9 million
Source: Previous calculations, industry data, Eurostat68
68
See: https://ec.europa.eu/eurostat/statistics-explained/index.php/International_trade_in_goods;
https://ec.europa.eu/eurostat/statistics-
explained/index.php/International_trade_in_goods_by_mode_of_transport#Trade_by_mode_of_transport_i
n_value_and_quantity
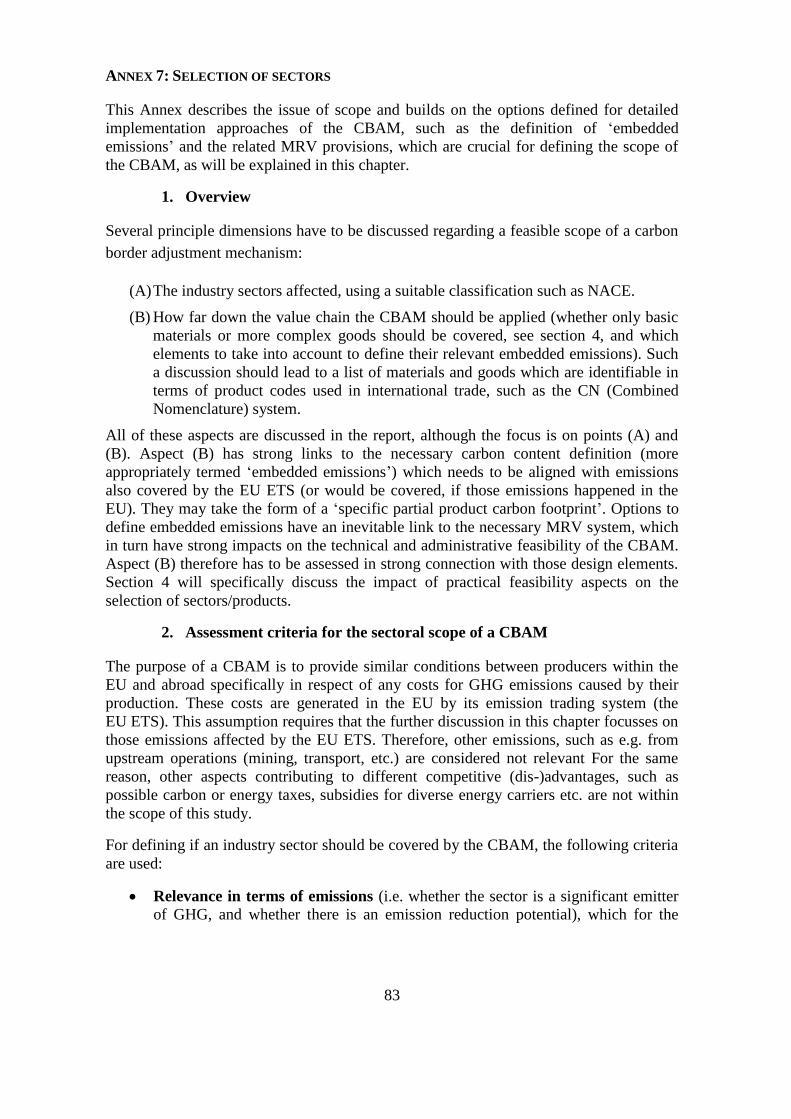
83
ANNEX 7: SELECTION OF SECTORS
This Annex describes the issue of scope and builds on the options defined for detailed
implementation approaches of the CBAM, such as the definition of ‘embedded
emissions’ and the related MRV provisions, which are crucial for defining the scope of
the CBAM, as will be explained in this chapter.
1. Overview
Several principle dimensions have to be discussed regarding a feasible scope of a carbon
border adjustment mechanism:
(A) The industry sectors affected, using a suitable classification such as NACE.
(B) How far down the value chain the CBAM should be applied (whether only basic
materials or more complex goods should be covered, see section 4, and which
elements to take into account to define their relevant embedded emissions). Such
a discussion should lead to a list of materials and goods which are identifiable in
terms of product codes used in international trade, such as the CN (Combined
Nomenclature) system.
All of these aspects are discussed in the report, although the focus is on points (A) and
(B). Aspect (B) has strong links to the necessary carbon content definition (more
appropriately termed ‘embedded emissions’) which needs to be aligned with emissions
also covered by the EU ETS (or would be covered, if those emissions happened in the
EU). They may take the form of a ‘specific partial product carbon footprint’. Options to
define embedded emissions have an inevitable link to the necessary MRV system, which
in turn have strong impacts on the technical and administrative feasibility of the CBAM.
Aspect (B) therefore has to be assessed in strong connection with those design elements.
Section 4 will specifically discuss the impact of practical feasibility aspects on the
selection of sectors/products.
2. Assessment criteria for the sectoral scope of a CBAM
The purpose of a CBAM is to provide similar conditions between producers within the
EU and abroad specifically in respect of any costs for GHG emissions caused by their
production. These costs are generated in the EU by its emission trading system (the
EU ETS). This assumption requires that the further discussion in this chapter focusses on
those emissions affected by the EU ETS. Therefore, other emissions, such as e.g. from
upstream operations (mining, transport, etc.) are considered not relevant For the same
reason, other aspects contributing to different competitive (dis-)advantages, such as
possible carbon or energy taxes, subsidies for diverse energy carriers etc. are not within
the scope of this study.
For defining if an industry sector should be covered by the CBAM, the following criteria
are used:
Relevance in terms of emissions (i.e. whether the sector is a significant emitter
of GHG, and whether there is an emission reduction potential), which for the
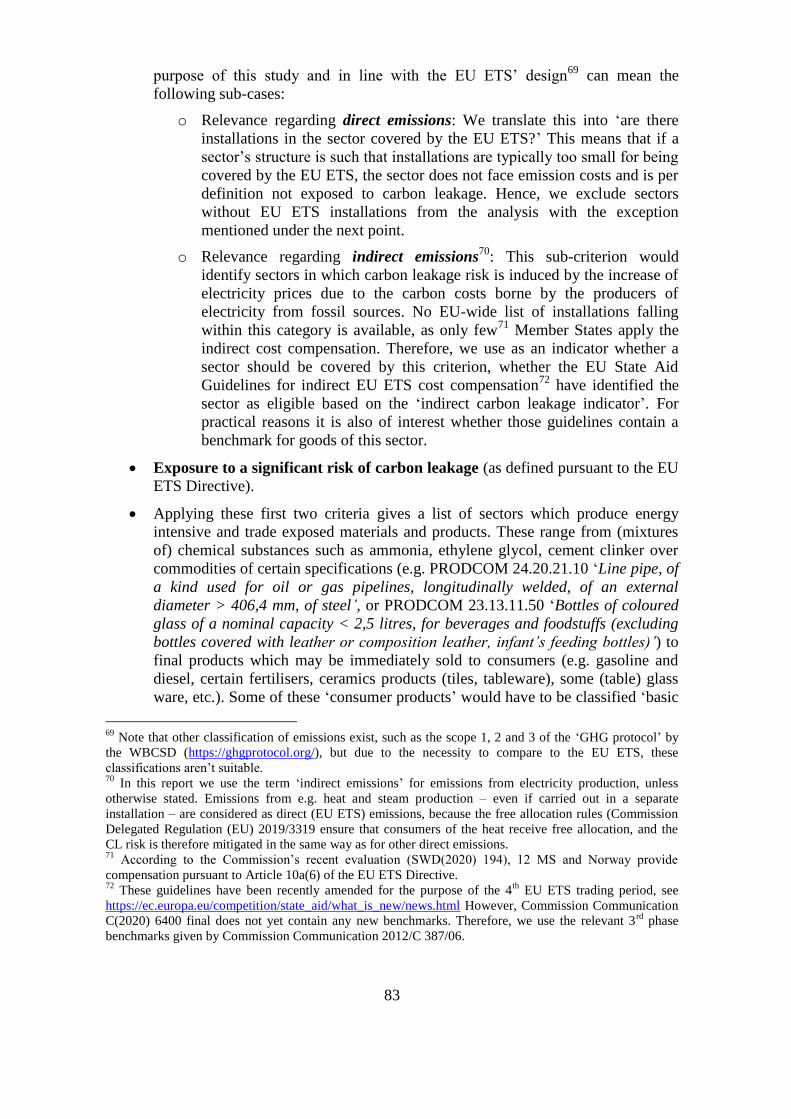
83
purpose of this study and in line with the EU ETS’ design69
can mean the
following sub-cases:
o Relevance regarding direct emissions: We translate this into ‘are there
installations in the sector covered by the EU ETS?’ This means that if a
sector’s structure is such that installations are typically too small for being
covered by the EU ETS, the sector does not face emission costs and is per
definition not exposed to carbon leakage. Hence, we exclude sectors
without EU ETS installations from the analysis with the exception
mentioned under the next point.
o Relevance regarding indirect emissions70
: This sub-criterion would
identify sectors in which carbon leakage risk is induced by the increase of
electricity prices due to the carbon costs borne by the producers of
electricity from fossil sources. No EU-wide list of installations falling
within this category is available, as only few71
Member States apply the
indirect cost compensation. Therefore, we use as an indicator whether a
sector should be covered by this criterion, whether the EU State Aid
Guidelines for indirect EU ETS cost compensation72
have identified the
sector as eligible based on the ‘indirect carbon leakage indicator’. For
practical reasons it is also of interest whether those guidelines contain a
benchmark for goods of this sector.
Exposure to a significant risk of carbon leakage (as defined pursuant to the EU
ETS Directive).
Applying these first two criteria gives a list of sectors which produce energy
intensive and trade exposed materials and products. These range from (mixtures
of) chemical substances such as ammonia, ethylene glycol, cement clinker over
commodities of certain specifications (e.g. PRODCOM 24.20.21.10 ‘Line pipe, of
a kind used for oil or gas pipelines, longitudinally welded, of an external
diameter > 406,4 mm, of steel’, or PRODCOM 23.13.11.50 ‘Bottles of coloured
glass of a nominal capacity < 2,5 litres, for beverages and foodstuffs (excluding
bottles covered with leather or composition leather, infant’s feeding bottles)’) to
final products which may be immediately sold to consumers (e.g. gasoline and
diesel, certain fertilisers, ceramics products (tiles, tableware), some (table) glass
ware, etc.). Some of these ‘consumer products’ would have to be classified ‘basic
69
Note that other classification of emissions exist, such as the scope 1, 2 and 3 of the ‘GHG protocol’ by
the WBCSD (https://ghgprotocol.org/), but due to the necessity to compare to the EU ETS, these
classifications aren’t suitable. 70
In this report we use the term ‘indirect emissions’ for emissions from electricity production, unless
otherwise stated. Emissions from e.g. heat and steam production – even if carried out in a separate
installation – are considered as direct (EU ETS) emissions, because the free allocation rules (Commission
Delegated Regulation (EU) 2019/3319 ensure that consumers of the heat receive free allocation, and the
CL risk is therefore mitigated in the same way as for other direct emissions. 71
According to the Commission’s recent evaluation (SWD(2020) 194), 12 MS and Norway provide
compensation pursuant to Article 10a(6) of the EU ETS Directive. 72
These guidelines have been recently amended for the purpose of the 4th
EU ETS trading period, see
https://ec.europa.eu/competition/state_aid/what_is_new/news.html However, Commission Communication
C(2020) 6400 final does not yet contain any new benchmarks. Therefore, we use the relevant 3rd
phase
benchmarks given by Commission Communication 2012/C 387/06.
83
material products’. Therefore, it is difficult to define a uniform criterion regarding
the depth of the value chain that can or should be covered by a CBAM.
Nevertheless, sections 4.b to 4.d approach this topic. The value chain issue is also
firmly linked to the options chosen for defining embedded emissions and impact
the administrative burden via the MRV system required.
Practical arguments need to be taken into consideration:
o Whether a material or product class can be clearly defined, and
whether materials or products can be unambiguously identified in
practice when the level of CBAM obligation needs to be determined.
o Ultimately, the conclusions on a proposed CBAM scope in section 6 are
drawn on our judgment that it will be feasible to define reference values
for the embedded emissions as the decisive argument for a product or
material’s inclusion in the CBAM. Without such reference values it is
impossible to calculate the CBAM obligation to be paid upon import.
o Furthermore, the choice of the scope will require certain design choices on
other elements (it is e.g. useless to demand the inclusion of more
downstream products in the scope, if MRV rules and the definition of
embedded emissions do not take into account more upstream emissions).
However, availability of data for defining reference values on embedded
emissions need to be balanced against the desire to limit administrative
burden, which may impact on the scope that can be covered by the
CBAM.
The width of the CBAM scope has an impact on the revenues raised by the
CBAM itself (as the EU’s own resources) as well as on Member States’ EU ETS
auctioning revenues, when free allocation is ended (or phased out) as
consequence of the CBAM’s introduction. However, for selecting sectors we
consider the revenues not as a primary criterion in this report. They would be a
secondary and ancillary positive effect of the design. We will therefore not use it
as criterion in the analysis here. Furthermore, revenues are also very strongly
influenced by whether indirect emissions and elements of the value chain are
taken into account for embedded emissions. It would therefore not be appropriate
to assess this topic in isolation based on only the materials and goods in the
CBAM scope.
3. Starting point: Industry sectors
a. Industrial sectors at risk of carbon leakage
The starting point is that the CBAM is intended as an instrument to establish a
comparable carbon price on goods produced in or imported to the EU with the objectives
of creating consistent incentives for emissions reduction, to limit the risk of Carbon
Leakage (CL) from the EU ETS, and to incentivise the use of carbon pricing as policy
measure to mitigate GHG emissions in other parts of the world. Consequently, the
CBAM should focus on those sectors that have already been identified as being at risk of
carbon leakage. The applicable criteria for defining the CL risk are laid down in Article
10b of the EU ETS Directive. The list of sectors adopted by the Commission based on

83
these criteria is given in Commission Delegated Decision (EU) 2019/708 (referred to as
‘the CL List’ or ‘CLL’ hereinafter). The CLL contains 50 sectors at 4-digit NACE level
and further 13 sectors at more disaggregated level (6 or 8 digit PRODCOM).
For successfully implementing a CBAM, those 63 sectors and the multitude of products
and materials produced by them might be too difficult to regulate. It is proposed to focus
on fewer sectors, at least for a pilot phase. This would make the CBAM simpler and
more manageable.
83
Figure 7-1 shows NACE sectors against these CL criteria. It is evident that only few
sectors contribute with significant emissions and are therefore at CL risk due to their
emission costs, while many sectors are on the list merely due to their trade intensity. The
CBAM should focus on those few sectors with significant emissions and where a CBAM
can provide the highest environmental impact at relatively low administrative effort. In
particular, this would allow to focus on the carbon intensive basic materials at the core of
each of these sectors’ activities (like cement clinker, steel, organic chemicals, etc.). This
approach is often found in literature.
Moreover, the discussion of MRV systems and the possibilities to define the ‘embedded
emissions’ of goods demonstrates that implementation of the CBAM becomes the more
difficult the more significant manufacturing steps are included after those which are
directly included in the EU ETS. This is another argument that justifies to focus on
industry sectors and products under the EU ETS.
However, for the purpose of this report it is important not to jump to conclusions too
quickly. On the contrary, the wide set of design considers that theoretically all goods
placed on the European market might be subject to a carbon price based on their partial
carbon footprint. Therefore, the analysis here starts from the assumption that all kinds of
goods could be theoretically included in a CBAM.
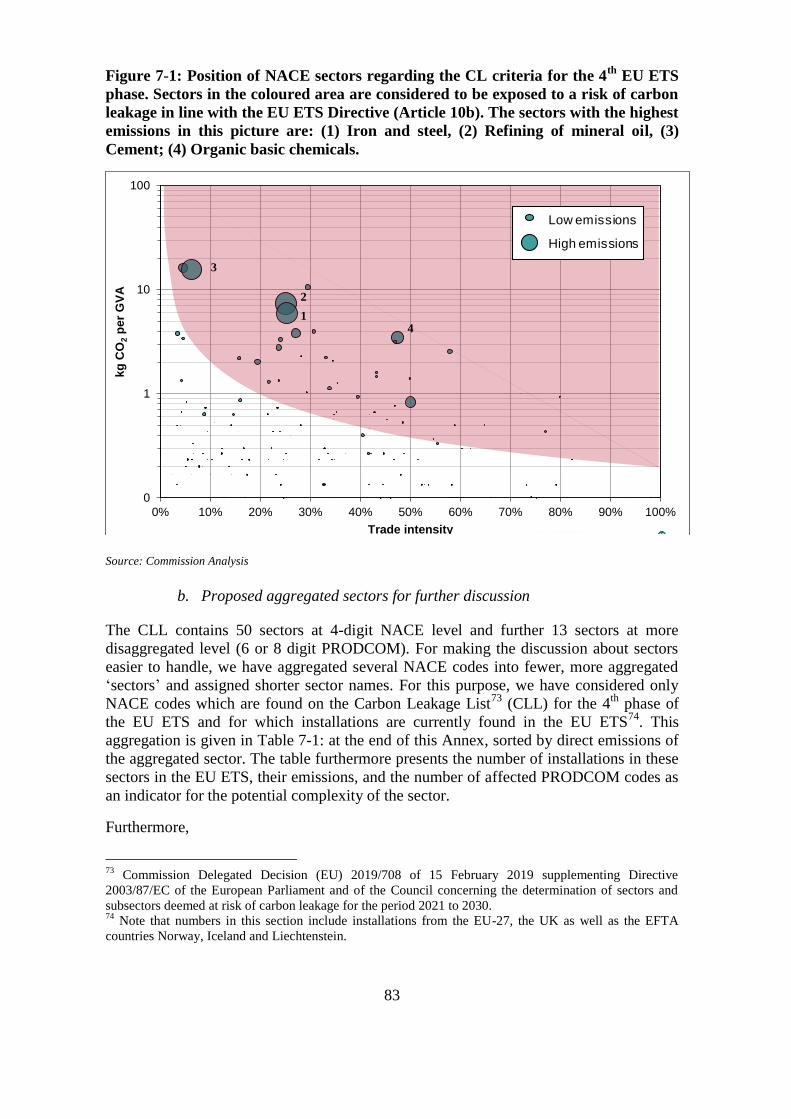
83
Figure 7-1: Position of NACE sectors regarding the CL criteria for the 4th
EU ETS
phase. Sectors in the coloured area are considered to be exposed to a risk of carbon
leakage in line with the EU ETS Directive (Article 10b). The sectors with the highest
emissions in this picture are: (1) Iron and steel, (2) Refining of mineral oil, (3)
Cement; (4) Organic basic chemicals.
Source: Commission Analysis
b. Proposed aggregated sectors for further discussion
The CLL contains 50 sectors at 4-digit NACE level and further 13 sectors at more
disaggregated level (6 or 8 digit PRODCOM). For making the discussion about sectors
easier to handle, we have aggregated several NACE codes into fewer, more aggregated
‘sectors’ and assigned shorter sector names. For this purpose, we have considered only
NACE codes which are found on the Carbon Leakage List73
(CLL) for the 4th
phase of
the EU ETS and for which installations are currently found in the EU ETS74
. This
aggregation is given in Table 7-1: at the end of this Annex, sorted by direct emissions of
the aggregated sector. The table furthermore presents the number of installations in these
sectors in the EU ETS, their emissions, and the number of affected PRODCOM codes as
an indicator for the potential complexity of the sector.
Furthermore,
73
Commission Delegated Decision (EU) 2019/708 of 15 February 2019 supplementing Directive
2003/87/EC of the European Parliament and of the Council concerning the determination of sectors and
subsectors deemed at risk of carbon leakage for the period 2021 to 2030. 74
Note that numbers in this section include installations from the EU-27, the UK as well as the EFTA
countries Norway, Iceland and Liechtenstein.
0
1
10
100
0% 10% 20% 30% 40% 50% 60% 70% 80% 90% 100%
kg
CO
2p
er
GV
A
Trade intensity
Source: Own calculations based on EC, EUTL
Low emissions
High emissions
Low emissions
High emissions
Low emissions
High emissions
Low emissions
High emissions
Low emissions
High emissions
1
2
3
4
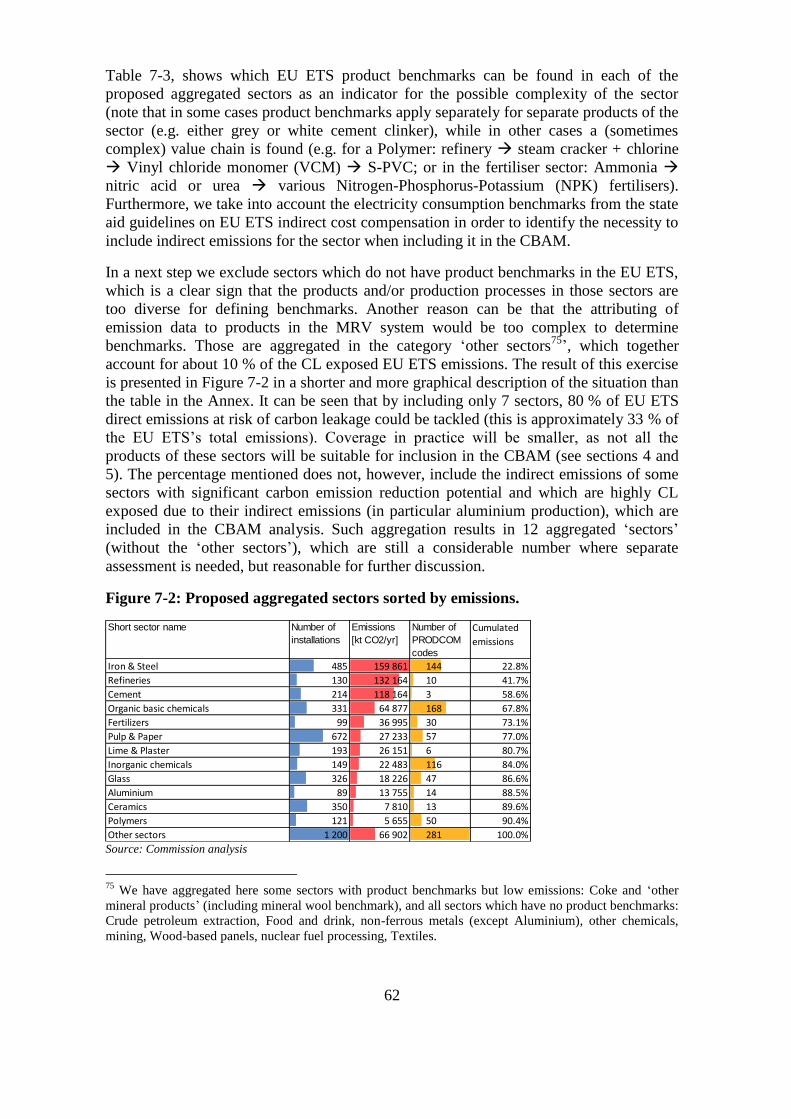
62
Table 7-3, shows which EU ETS product benchmarks can be found in each of the
proposed aggregated sectors as an indicator for the possible complexity of the sector
(note that in some cases product benchmarks apply separately for separate products of the
sector (e.g. either grey or white cement clinker), while in other cases a (sometimes
complex) value chain is found (e.g. for a Polymer: refinery steam cracker + chlorine
Vinyl chloride monomer (VCM) S-PVC; or in the fertiliser sector: Ammonia
nitric acid or urea various Nitrogen-Phosphorus-Potassium (NPK) fertilisers).
Furthermore, we take into account the electricity consumption benchmarks from the state
aid guidelines on EU ETS indirect cost compensation in order to identify the necessity to
include indirect emissions for the sector when including it in the CBAM.
In a next step we exclude sectors which do not have product benchmarks in the EU ETS,
which is a clear sign that the products and/or production processes in those sectors are
too diverse for defining benchmarks. Another reason can be that the attributing of
emission data to products in the MRV system would be too complex to determine
benchmarks. Those are aggregated in the category ‘other sectors75
’, which together
account for about 10 % of the CL exposed EU ETS emissions. The result of this exercise
is presented in Figure 7-2 in a shorter and more graphical description of the situation than
the table in the Annex. It can be seen that by including only 7 sectors, 80 % of EU ETS
direct emissions at risk of carbon leakage could be tackled (this is approximately 33 % of
the EU ETS’s total emissions). Coverage in practice will be smaller, as not all the
products of these sectors will be suitable for inclusion in the CBAM (see sections 4 and
5). The percentage mentioned does not, however, include the indirect emissions of some
sectors with significant carbon emission reduction potential and which are highly CL
exposed due to their indirect emissions (in particular aluminium production), which are
included in the CBAM analysis. Such aggregation results in 12 aggregated ‘sectors’
(without the ‘other sectors’), which are still a considerable number where separate
assessment is needed, but reasonable for further discussion.
Figure 7-2: Proposed aggregated sectors sorted by emissions.
Source: Commission analysis
75
We have aggregated here some sectors with product benchmarks but low emissions: Coke and ‘other
mineral products’ (including mineral wool benchmark), and all sectors which have no product benchmarks:
Crude petroleum extraction, Food and drink, non-ferrous metals (except Aluminium), other chemicals,
mining, Wood-based panels, nuclear fuel processing, Textiles.
Short sector name Number of
installations
Emissions
[kt CO2/yr]
Number of
PRODCOM
codes
Cumulated
emissions
Iron & Steel 485 159 861 144 22.8%
Refineries 130 132 164 10 41.7%
Cement 214 118 164 3 58.6%
Organic basic chemicals 331 64 877 168 67.8%
Fertilizers 99 36 995 30 73.1%
Pulp & Paper 672 27 233 57 77.0%
Lime & Plaster 193 26 151 6 80.7%
Inorganic chemicals 149 22 483 116 84.0%
Glass 326 18 226 47 86.6%
Aluminium 89 13 755 14 88.5%
Ceramics 350 7 810 13 89.6%
Polymers 121 5 655 50 90.4%
Other sectors 1 200 66 902 281 100.0%
63
If using these 12 aggregated sectors, there would be 658 product categories out of the
3 919 categories listed at 8-digit level in PRODCOM 2019. The PRODCOM system is
used here because the reporting rules for free allocation in the EU ETS are required
operators of installations to report their production in this system, and due to its
compatibility with the NACE classification of industry sectors used for determining the
CLL. However, in the administration of EU customs and taxes, CN76
numbers are used
for identifying product categories of imported or exported goods. Furthermore, the 8-
digit CN codes are an extension of the internationally used (6-digit) Harmonized System
(HS) classification developed under the UN. CN codes cover more commodities than
PRODCOM77
. In the following we will sometimes refer to CN codes, or where they are
easier to handle because of their higher aggregation level. Mapping tables for correlating
HS, CN and PRODCOM codes are available on Eurostat’s website78
. A final choice of
the most useful classification system will only have to be made when a CBAM will be
finally defined in a legal instrument.
The identified aggregated sectors build the starting point for further discussion in the next
sections. Whether an industry sector can or should be included in a CBAM depends on
many factors, and trade-offs between them must be carefully balanced. In particular, a
very comprehensive CBAM scope which could make the largest contribution towards
enhancing the effectiveness of the EU ETS carbon price signal in support of climate
neutrality while avoiding carbon leakage risks has to be balanced against the
administrative burden, the technical feasibility and the actual enforceability of such a
system. Therefore, the criteria listed in section 2 state that practical issues need to be
considered, linked in particular to MRV issues. For this purpose, it is necessary to look at
specific products, not the sectors, as at the custom offices decisions and calculation of the
CBAM obligation needs to be made based on the type of product. Therefore section c
first outlines some consideration on how products can be defined. Thereafter the central
question is discussed, namely for which products the embedded emissions can be
determined. For this purpose, a discussion of the most important value chains in the EU
ETS sectors is given in section 4.c.
c. Defining and identifying products
For the practical feasibility of a CBAM two aspects are relevant: Firstly, the products
and materials must be defined to a sufficient degree that the appropriate amount of the
obligation79
under the CBAM can be determined by the designated authority. For this
purpose it is not enough to clarify only the (carbon leakage exposed) sector using a
NACE or PRODCOM code like in the Carbon Leakage List, but to list specifically all the
products from within those sectors which are to be included in the CBAM. This has to
take into account that within the NACE sectors value chains can be found, with
76
Combined Nomenclature, which is the European statistical classification system compatible with the
United Nation’s HS (Harmonized System) used in international trade. 77
E.g., since 2005 PRODCOM does not contain codes for refinery products such as gasoline, diesel and
kerosene. 78
E.g. for CN 2019 and PRODCOM 2019:
http://ec.europa.eu/eurostat/ramon/documents/prodcom_2019/PRODCOM_2019_CN_2019_mapping.zip 79
I.e. the amount of tax to be paid, the emission data to be declared or the number of CBAM certificates to
be surrendered.
64
subsequent productions steps leading to different amounts of emissions. Focus on the
steps with highest emissions and including those products along the value chain that
satisfy the criterion of identifiable products will help to find the right balance between
administrative burden and effectiveness against carbon leakage. For applying the CBAM
in practice, all product categories which satisfy all criteria for including them in the
CBAM should be defined by specifying their PRODCOM codes or better: CN codes,
together with the applicable default reference values for the embedded emissions
required for defining the amount of obligation under the CBAM, if not the actual
emissions option is at hand.
Secondly, it must be considered whether materials and products can be sufficiently
identified in practice for making the CBAM enforceable. This means that it must be
possible that a product or material is unambiguously linkable to its definition and its
reference value for embedded emissions. Such distinction would be for example difficult
when the same basic material products can be made of primary or secondary (i.e.
recycled) materials, if differentiated treatment were allowed or required. Such
differentiation can create incentives for resource shuffling, and where distinction is
difficult to monitor, it may invite for fraud. The most prominent case here are metals in
general, which can be easily recycled, and in particular the different production routes
blast furnace (primary) and electric arc furnace (almost exclusively secondary) steel.
While it would be justifiable based on the EU ETS benchmark methodology to assign
different levels of embedded emissions to primary and secondary materials even in the
absence of verified emissions data, it might be quite appealing for importers to claim
their product to be recycled and therefore subject to the lower CBAM obligation. The
proposed approaches for avoiding incorrect claims in this regard are either to require
independently verified emissions data following strict MRV rules, or to rely fully on
default values for embedded emissions.
If those MRV rules are applied appropriately, only in rare cases of suspected fraud actual
(chemical) analyses would be required to distinguish primary and secondary
materials. Analytical methods would have to be made available to the designated
authorities together with reference data for selected tracer elements which would allow
identifying non-primary materials to a sufficient assurance level. For the moment it
seems an excessive effort to develop such methods. Instead, the MRV rules in the CBAM
applicable to emissions from foreign countries will require the importer to provide
credible evidence (confirmation with reasonable assurance by an accredited verifier
applying international standards and in line with relevant EU legislation), which would
also have to confirm what production process at which installation of provenance has
been applied. For other cases of doubt, e.g. whether a certain CN code has to be applied,
already now sufficient instruments exist, since all kinds of custom tariffs need to be
confirmed in practice, too.
If both criteria are satisfied, i.e. products are defined and it is ensured they can be
identified, the remaining issue is whether the embedded emissions of a material or
product can be determined. This question is intertwined with the design of the MRV
system and the approach chosen for determining default values. However, as will be
discussed there, a solution will almost always be possible if the system boundaries of
MRV are chosen reasonably. In order to understand what kind of ‘reasonable’ would be
65
meant here, we will discuss in the next section what kind of value chains have to be
considered in context of the EU ETS and CBAM.
4. Practical feasibility aspects
Most literature on CBAMs concentrates on only a handful of ‘Energy Intensive and
Trade Exposed’ (EITE) sectors, which are often not defined in detail80
. Furthermore,
most literature rightfully assumes that focus on basic materials may make the system
more realistically feasible than if taking into account more downstream products. This
goes hand in hand with the expectation that for basic materials the administrative burden
may remain limited. In this chapter we examine if these assumptions are correct. This is
in particular important, as in case only imports are included in a CBAM (options 1 and
2), a strong incentive will be generated for producing more semi-finished or finished
products outside the EU and thereafter importing them into the EU without being covered
by the CBAM. This would mean that bigger parts of value chains would become subject
to carbon leakage. If, however, it was possible to cover more complex products by the
CBAM, the carbon price would be more effective and carbon leakage risks better
addressed.
Value chains are very different in the sectors covered by the EU ETS and exposed to a
risk of carbon leakage. The differences concern both the typical depth as well as the
horizontal width of value chains. Therefore, it can be assumed that not all options of
CBAM designs will be equally suitable for the different sectors.
a. Overview
One difficulty of discussing complex topics such as a CBAM comes from the fact that
that many terms are difficult to define, used for different meanings in different contexts,
etc. For example, the term ‘value chain’, ‘upstream’ or ‘downstream’’ processes are used
in different ways in literature and by stakeholders from different industry sectors. In
order to provide as unambiguous information as possible in this report, there is reference
to the definitions found in Annex 5. We use a very pragmatic approach instead of an
80
Böhringer, C., Rosendahl, K. E., & Storrosten, H. B., ‘Robust policies to mitigate carbon leakage’,
Journal of Public Economics 149, 2017, 35-46 https://doi.org/10.1016/j.jpubeco.2017.03.006; Cosbey, A.,
Droege, S., Fischer, C., & Munnings, C., ‘Developing Guidance for Implementing Border Carbon
Adjustments: Lessons, Cautions, and Research Needs from the Literature’, Review of Environmental
Economics and Policy, 13(1), 2019, 3–22. https://doi.org/10.1093/reep/rey020; Flannery, B., Hillman, J.,
Mares, J. W., & Porterfield, M., ‘Framework Proposal for a US Upstream Greenhouse Gas Tax with WTO-
Compliant Border Adjustments’, Resources for the Future, 2018; Kortum, S., & Weisbach, D. J., ‘The
Design of Border Adjustments for Carbon Prices’, National Tax Journal, 70(2), 2017, 421–446.
https://doi.org/10.17310/ntj.2017.2.07; Das, K., ‘Can Border Adjustments Be WTO-Legal?’, Manchester
Journal of International Economic Law, 8(3), 2011, 65–97; Mehling, M. A., van Asselt, H., Das, K.,
Droege, S., & Verkuijl, C.. ‘Designing Border Carbon Adjustments for Enhanced Climate
Action’,American Journal of International Law, 113(3), 2019, pp.433–481.
https://doi.org/10.1017/ajil.2019.22; Sandbag, ‘The A-B-C Of BCAs’, 2019. https://ember-climate.org/wp-
content/uploads/2019/12/2019-SB-Border-Adjustments_DIGI-1.pdf; Branger, F., & Quirion, P., ‘Would
border carbon adjustments prevent carbon leakage and heavy industry competitiveness losses? Insights
from a meta-analysis of recent economic studies’, Ecological Economics, Vol 99, 2014, pp.29–39.
https://doi.org/10.1016/j.ecolecon.2013.12.010; Böhringer, C., Balistreri, E. J., & Rutherford, T. F., ‘The
role of border carbon adjustment in unilateral climate policy: Overview of an Energy Modeling Forum
study (EMF 29’, Energy Economic, 34, 2012, S97–S110. https://doi.org/10.1016/j.eneco.2012.10.003.
66
exact definition that would be universally applicable: We explain the terms in exactly the
way they are needed to discuss the scope and the related practicalities of MRV which are
closely connected to the scope definition.
From the definitions above it becomes clear that boundaries between the material and
product categories are often flexible and subjective. In some sectors the basic material
product can be identical to the final product sold to the end consumer (e.g. a bag of
Portland cement for the do-it-yourself market; a bag of NPK fertiliser, etc.), while other
sectors require to bring together a multitude of basic materials and semi-finished
products from various other sectors. Literature about CBAM often uses terms like the
above without further definition. It is therefore often not clear on the real scope implied
for the CBAM. In particular the boundaries between basic materials and semi-finished
products, and between the latter and manufactured products can be unclear. It is therefore
important that any legislation for implementing a CBAM provides clear definitions of the
products to be included, or at least clear criteria based on which some implementing acts
can later define the precise definitions. Due to the mentioned complexities the preferred
approach for defining materials and products is to provide a list of the CN codes which
would fall under the respective definition, instead of actually defining the product in a
descriptive way.
b. Impact of the value chains on CBAM product choice
The first and most obvious argument in favour of concentrating on basic
materials/products may be that the number of products to be administered by a CBAM
will strongly increase with every production step, while the energy intensive basic
materials (and their carbon costs) are ‘diluted’ in each manufacturing step. For example,
in the steel sectors found on the CL List (see Section 3) there are 144 PRODCOM
categories (including alloyed steels and ferroalloys which will differ from ‘normal’ steel
in terms of embedded emissions). These categories refer mostly to steel materials like
ingots, bars, coils, sheets, pipes etc. of various dimensions and steel qualities. They
mostly fit into the above definition of ‘basic material products’, where the larger part of
the material’s value actually is based on the production costs of the chemical steel
making process, while the effort for bringing the steel into the form and dimension sold
67
is some order of magnitude smaller. Therefore, several authors81
consider the additional
energy and thus carbon requirement for the additional refinement of basic materials to be
small compared to the carbon intensity of the conventional primary production process.
Furthermore, typically the increased value added of the subsequent refinement stages is
significantly higher. Hence the initial focus resides on enhancing the effectiveness of the
carbon price while avoiding carbon leakage risks for the basic material production stage.
Secondly, for practical reasons, only products should be included in a CBAM for which
the embedded emissions can be determined with reasonable robustness and credibility as
basis for the definition of reference values. For basic materials coming directly out of an
installation which monitors its emissions under a mandatory and publicly regulated
carbon pricing scheme such as the EU ETS or the Korean ETS, this will be the case in
principle, although it can be difficult in practice. Experience with the new allocation rules
for the 4th phase of the EU ETS shows that it is often very demanding to split the
emissions correctly along the boundaries of the so-called sub-installations which serve
for attributing emissions to the various products leaving the installation. The situation
gets the more complicated, the more manufacturing steps are subsequently carried out. It
is the nature of manufacturing of more complex products, that the content of the basic
materials in the final product will not always be 100 %. For example, a product may
consist e.g. of 60 % steel and 40 % other materials. Assuming that those other materials
would not lead to significant emissions during their production (they might be recycled
materials or biomass), the embedded emissions of that product would be only 60 % of
those found for a pure steel82
. On the other hand, for complex structures, extensive
machining may be required, such that e.g. only 25 % of the original steel material end up
in the product, while 75 % are wasted in the form of (recyclable) scrap. In this case, the
embedded emissions of the product would be 4 times higher based on the mass of the
product than for the original steel material83
. Furthermore, most manufactured products
81
Cosbey, A., Droege, S., Fischer, C., & Munnings, C., ‘Developing Guidance for Implementing Border
Carbon Adjustments: Lessons, Cautions, and Research Needs from the Literature’, Review of
Environmental Economics and Policy, 13(1), 2019, 3–22. https://doi.org/10.1093/reep/rey020; Mehling, M.
A., van Asselt, H., Das, K., Droege, S., & Verkuijl, C., ‘Designing Border Carbon Adjustments for
Enhanced Climate Action’, American Journal of International Law, 113(3), 2019, pp.433–481.
https://doi.org/10.1017/ajil.2019.22; Monjon, S., & Quirion, P., ‘How to design a border adjustment for the
European Union Emissions Trading System?’, Energy Policy, 38(9), 2010, 5199–5207; Droege, S.,
Tackling Leakage in a World of Unequal Carbon Prices, 2019, http://www2.centre-
cired.fr/IMG/pdf/cs_tackling_leakage_report_final.pdf; Sakai, M., & Barrett, J., ‘Border carbon
adjustments: Addressing emissions embodied in trade’, Energy Policy, 92, 2016 102–110.
https://doi.org/10.1016/j.enpol.2016.01.038; Gisselman, F., & Eriksson, E., ‘Border Carbon Adjustments.
An analysis of trade related aspects and the way forward’, National Board of Trade Sweden, 2020
https://www.kommerskollegium.se/contentassets/7a09d4cdb83a46feaf0c6ae6e5b02fff/border-carbon-
adjustments_final_.pdf; Böhringer, C., Carbone, J. C., & Rutherford, T. F., ‘Embodied Carbon Tariffs’,
The Scandinavian Journal of Economics, 120(1), 2018, pp.183–210. https://doi.org/10.1111/sjoe.12211;
Pauliuk, S., Neuhoff, K., Owen, A., & Wood, R., ‘Quantifying Impacts of Consumption Based Charge for
Carbon Intensive Materials on Products’, DIW Discussion Papers No. 1570, 2016.
http://www.ssrn.com/abstract=2779451 82
These are rough estimates which assume that the emissions of manufacturing steps for the compound
products are negligible, which is indeed often the case compared to the emissions of the base material
production. 83
One might argue that the 75% material cut off would be recyclable (through the EAF route) and would
then lead to significantly lower emissions than a virgin steel produced by the blast furnace route. However,
if the MRV effort should be kept reasonable, it would be easier to fully assign all 100% steel emissions to
68
(for end consumers) consist of far more than two basic materials and require many
production steps84
, which are often carried out by a multitude of different companies
across the globe, making the tracing of the associated emissions very onerous. It is
therefore desirable to find a reasonable limit regarding the number of production steps
which can still be taken into account when determining the embedded emissions of a
product. The term ‘semi-finished products’ is often found in the discussion of CBAMs as
the boundary of its scope, but it is rarely defined in detail. In our approach there is no
need for such ambiguity, since we propose to explicitly list which goods should be
included in the CBAM.
Thirdly, as has already been mentioned in the introduction to this chapter, it has to be
kept in mind that different industry sectors function very differently. In some cases, the
‘EITE85
product’ itself is a good for purchase by an end consumer. This is the case e.g.
for electricity production, refinery products (gasoline, diesel), most fertilisers, some
tissue or office papers, etc. In other cases, there are so many production steps before a
product is placed on the market that the final customer cannot reasonably know which
basic materials it consists of. Many simple and homogeneous appearing materials are in
fact complex mixtures (e.g. PVC contains significant mass fractions of stabilizers,
plasticizers and other additives such as pigments). Furthermore, there are products (e.g.
electronic equipment) of which the value stems more from the know-how in the
production process than from the materials used. The value of a microprocessor’s silicon
content, its gold wires etc. is several orders of magnitude lower than the final product’s.
These are cases where the embedded emissions are extremely ‘diluted’ throughout the
production process, so that any remaining potential carbon costs of the production
process would not merit any consideration for a CBAM.
From the above it becomes clear that basic materials, and in some sectors, basic material
products seem most appropriate for inclusion in the CBAM due to the relatively limited
administrative burden which it would entail regarding:
the number of products for which product definitions, MRV rules and reference
values need to be developed;
the number of transactions (imports) that need to be subject to the CBAM.
However, at least for those options which are import-oriented, the focus on basic
materials and products will provide an incentive to produce semi-finished and final
manufactured products outside the EU, as their import would then not fall under the
scope of the CBAM. In other words, value chains would be partly pushed outside the EU,
which would not only increase carbon leakage, but would lead to a further loss of value
generation within the EU. In order to mitigate this effect, a purely import-oriented
CBAM would benefit from inclusion of semi-finished products in its scope. This study
the product under consideration, while the emissions of recycling would be fully attributed to the EAF steel
which used the scrap as input. 84
More in general, the embodied emissions could be expressed as the sum of the products of the content
and the specific embodied emissions of all materials found in the product. However, often there are also
materials used in the manufacturing which do not end up in the product, such as cutting tools, solvents for
cleaning etc., the consumption of which would also have to be taken into account. 85
Energy Intensive and Trade Exposed.
69
therefore needs to discuss if that would be possible at reasonable administrative effort.
This is done by discussing the most important value chains in the EU ETS in the next
section.
c. Selected issues of value chains for basic materials
A crucial criterion which can impact the overall feasibility of a CBAM is the availability
of data for defining reference levels for the embedded emissions of a product or material.
If such data is unavailable, it would remain unknown how big the obligation for an
imported product in the CBAM would be.
At this point it is to be examined how embedded emissions of simple materials stemming
from EU ETS installations can be determined for the purpose of a CBAM. It might turn
out more complex than it appears at first sight. For defining a product’s embedded
emissions, literature86
often refers to the options (a) actual emissions or (b) reference
values such as the EU ETS benchmarks or the EU’s average emissions in a sector. This
appears convincing for materials which can be produced in one single step covered by
the EU ETS. However, if goods produced in the EU should be put on equal footing with
imported goods regarding embedded carbon costs, it is necessary to look whether
reasonably robust data in the EU could be obtained for the relevant value chains. In some
cases such value chains can be well-defined, which means that it is possible to combine
EU ETS benchmarks or average emission values for products which are usually produced
via relatively uniform routes, and where material consumption in the different production
steps can be well estimated. This approach is however not straightforward in the case that
materials can be obtained by different (chemical) routes, where a choice for one of the
possible routes will have to be made and may turn out controversial. Such considerations
may be of high importance in sectors where high emissions are caused by basic materials
or products which can be traded across borders. Some examples are given below:
For the steel industry, the typical production route for basic material products
(blast furnace route) can be described simplified as follows:
o Coke (product benchmark) is produced from coal.
o Some iron ores are treated in a sinter (product benchmark) or pelletisation
plant.
o Iron ore (or purchased pellets), coke and sinter are used in the blast
furnace for producing pig iron, from which residual carbon is removed in
86
Cosbey, A., Droege, S., Fischer, C., Reinaud, J., Stephenson, J., Weischer, L. and Wooders, P., ’ A
Guide For The Concerned: Guidance On The Elaboration And Implementation Of Border Carbon
Adjustment’, Entwined, 2012, https://www.iisd.org/system/files/publications/bca_guidance.pdf; Mehling,
M. A., van Asselt, H., Das, K., Droege, S., & Verkuijl, C.. ‘Designing Border Carbon Adjustments for
Enhanced Climate Action’,American Journal of International Law, 113(3), 2019, pp.433–481.
https://doi.org/10.1017/ajil.2019.22; Pauliuk, S., Neuhoff, K., Owen, A., & Wood, R., ‘Quantifying
Impacts of Consumption Based Charge for Carbon Intensive Materials on Products’, DIW Discussion
Papers No. 1570, 2016. http://www.ssrn.com/abstract=2779451; Böhringer, C., Carbone, J. C., &
Rutherford, T. F., ‘Embodied Carbon Tariffs’, The Scandinavian Journal of Economics, 120(1), 2018,
pp.183–210. https://doi.org/10.1111/sjoe.12211; Moran, D., Hasanbeigi, A., & Springer, C., ‘The carbon
loophole in climate policy. Quantifying the Embodied Carbon in Traded Products’ KGM & Associates,
Global Efficiency Intelligence, Climate Work Foundations, 2018.

70
the converter for producing steel (the ‘hot metal’ benchmark applies to the
whole process, although the calculation basis is the hot iron leaving the
blast furnace).
o For a more precise treatment, various additives (in particular lime) and the
often-significant amounts of scrap added to the process have to be
considered.
o Some more energy input is required (fall-back approach ‘fuel benchmark’)
for hot rolling, cold rolling, plating, etc., i.e. for arriving at the basic
material product.
From (confidential) EU ETS data, or by using information from the BAT reference
document, and with the support of the industry association, it could be possible to come
up with a reference value for typical steel products taking into account all the above
production steps.
However, an issue of high importance in the steel sector is the fact that there is another
production route (electric arc furnace) which leads to considerably lower GHG emissions
than the blast furnace route. This is a consequence of the use of already metallic iron
instead of iron ore in the process (either steel scrap or ‘Direct Reduced Iron’, DRI). For
EU ETS purposes it has been argued that blast furnace and EAF routes usually lead to
different products and different benchmarks for both production routes have been
introduced. The reason is due to the lower purity of scrap-based steels87
. They could
therefore be distinguishable based on chemical analyses. However, when using DRI, it is
doubtful if this distinction is possible. Therefore, the criterion of the possibility to
distinguish materials needs to be considered in the design and evaluation of CBAM
options (see section 3.c).
In the fertiliser industry, a few pure and emission-intensive substances are
traded (ammonia, nitric acid, ammonium nitrate and urea), and other typical
products are granulated NPK fertilisers of various nutrient mixtures. This is
because plant growth can be improved by providing three nutrients to soils which
might otherwise be insufficiently available: Nitrogen, phosphorous and potassium
(in chemical symbols: N-P-K). The only component which is produced with
significant GHG emissions is the nitrogen component (which can be either
ammonium or nitrate ions, urea, or mixtures thereof), and nitrogen components
are also traded as pure chemicals which can also be used by other industries. The
production chain is as follows:
o As a first step, ammonia is produced where natural gas is almost the
exclusive raw material88
. A dedicated EU ETS benchmark exists.
87
Ecofys et al., 2009, https://ec.europa.eu/clima/sites/clima/files/ets/allowances/docs/bm_study-
iron_and_steel_en.pdf 88
In fact, the first production step is hydrogen production, for which a dedicated product benchmark exists
in the EU ETS. However, this benchmark is only applicable where other substances than ammonia are
produced. It is worth to mention that the vast majority of hydrogen is currently produced from natural gas,
and only in few cases from heavy fractions in refineries. At this point in time ‘green' hydrogen from water
electrolysis using electricity from renewable sources is not yet an economically feasible option. However,
as soon as a ‘green hydrogen economy’ becomes reality, it would also feed the ammonia production.
71
o From ammonia, nitric acid (benchmark) or urea can be produced.
o The downstream process steps are less energy intensive and (if carried out
in standalone installations) not under the EU ETS: Urea can act as a solid
fertiliser on its own or be used for NPK production. Ammonia and nitric
acid can be reacted to form ammonium nitrate, which is a fertiliser on its
own, or a component in NPK fertilisers.
For a CBAM this means that for all the fertilisers mentioned, the nitrogen content
and the chemical form of the nitrogen component need to be known to determine
the emissions. For nitric acid and nitrates, it should be possible to determine
combined reference values based on the ammonia and nitric acid benchmarks. For
urea production, a reference value based on the necessary ammonia quantity
would be logical89
.
For polymers, which are highly tradable commodities, the actual emissions of the
polymerisation of monomers are relatively low, while the production of the
precursors (the monomers) is highly energy intensive. Hence, an approximation
to reality may be required by taking into account the upstream processes. For
example, the CBAM reference values for PE (Polyethylene) and PP
(Polypropylene), the two polymers most produced globally, may be reasonably
focused on the carbon emissions from refining and high value chemical
production (steam cracker). However, for PVC (the third-most produced
polymer), one of the most complex value chains in the EU ETS can be construed:
o The starting point are light fractions of the refinery products. Hence, some
emissions based on the refinery benchmark90
should be taken into
account.
o Production of simple olefins (ethylene, propylene, etc.) is usually using
steam cracking. The EU ETS benchmark for HVC (‘High Value
Chemicals91
’) applies. For the next step, only ethylene is relevant.
o For vinyl chloride (monomer) production there is again an EU ETS
benchmark. Input materials are ethylene (which ‘carries’ emissions from
refineries and HVC) and Chlorine92
.
o Chlorine production is an electrolytic process which is eligible for indirect
EU ETS compensation. A benchmark is found in the state aid guidelines
on power price compensation for the third phase, and its production is
89
Furthermore, the absorption of CO2 in the urea production process could be considered. However, at the
current stage the EU ETS monitoring regulation considers this CO2 quantity as emitted. 90
Note that the refinery benchmark based on the CWT (Complexity Weighted Tonnes) approach is rather
atypical, as it does not directly relate to the quantity of certain products such as gasoline, diesel or
kerosene, but on the complexity and throughput of the whole refinery and its actual configuration. Hence,
at this point in time there is not yet any agreed approach to assign CO2 quantities to each of the refinery
products. 91
This takes into account acetylene, ethylene, propylene, butadiene, benzene and hydrogen. Note that like
for refineries, no agreed methodology is available at this time for assigning specific emissions to each of
the individual products. 92
Alternative production routes use hydrochloric acid. However, although the latter may be by-product
from other reactions, at some point chlorine production is also required.

72
eligible for compensation in several Member States. Chlorine production
has no direct emissions and is therefore not covered by the EU ETS itself.
o For two of the existing three polymerisation processes (E-PVC and S-
PVC), EU ETS benchmarks exist.
In this case the determination of an encompassing reference value may be
difficult. Not only are the refinery and HVC benchmarks not directly useable, but
the final production step can be subject to different benchmarks. It is to be
expected that based on customs papers, no distinction between E and S-PVC can
be made. The latter may, however, be a less important issue, as the significantly
higher emissions stem from the other processes listed, in particular the steam
cracker.
d. Feasibility to determine embedded emissions of basic materials
As said before, the embedded emissions of a material or product are required to calculate
the CBAM obligation, and if the embedded emissions cannot be determined at least as a
reasonable default value, the material or product cannot be included in the CBAM scope.
This feasibility to determine embedded emissions is discussed here.
A generic formula for determining embedded emissions EEP of a material or product in a
value chain can be expressed as follows (without taking into account any carbon price
already paid or free allocation received93
):
Equation (1) 𝐸𝐸𝑃 = 𝐸𝑀𝑃 + 𝐼𝐸𝑃 + ∑ 𝑀𝐶𝑖 ∙ (𝐸𝑀𝑖 + 𝐼𝐸𝑖)𝑛𝑖=1
Where EMP are the direct emissions of the production process of the material or product
under consideration, IEP the indirect emissions of the production process. The formula
takes into account the emissions of upstream production processes, where the index i
indicates the upstream materials 1 to n, and MCi the amount of material i consumed for
one unit of the material or product for which the embedded emissions are to be
calculated. EMi are the direct emissions during the production of material i, and IEi the
respective indirect emissions. This formula is relatively simple to apply to a single
production step. If it is the first step of a value chain, i.e. if all raw materials used in the
process have embedded emissions of zero, it is simply 𝐸𝐸𝑃 = 𝐸𝑀𝑃 + 𝐼𝐸𝑃, and if the
CBAM design were such that indirect emissions were not included it would be reduced
to only 𝐸𝐸𝑃 = 𝐸𝑀𝑃. For applying it to a longer value chain, the formula can be used
either subsequently for one production step after the other, or by applying it in one go by
applying MCi values which take into account how much of the upstream produced
materials pass through the value chain to give the product or material under
consideration.
From that equation it becomes apparent what data are required to determine embedded
emissions, and what is required to decide if the product can be included in the CBAM:
In case of a basic material produced in one single step covered by the EU ETS
from raw materials:
93
As this here is only about the purely technical arguments and description of the important value chains,
there is no need to take carbon costs into account.
73
o A reference value for the direct emissions per tonne of the production
process (EMP);
o Where relevant, a reference value for indirect emissions per tonne related
to that production process (EMP).
o In order to determine those two values, the CBAM design needs to define
a set of rules to determine them. This will apply without prejudice whether
the reference values would be set at the EU ETS benchmark or at a higher
level such as the average emissions intensity in the EU, or even specific to
certain countries.
The key issue here is that for all types of production processes which lead
to more than one product, rules need to be defined for how to split
(‘attribute’) emissions to those goods. For those basic materials which are
covered by EU ETS product benchmarks, the FAR94
provide relatively
clear rules for defining system boundaries (so-called sub-installations),
and for attributing Combined Heat and Power (CHP) emissions into a part
for heat and a part for electricity. However, there are no rules for going
into more detail (e.g. splitting fall-back sub-installations into more
disaggregated product-specific values), and even some of the defined
product benchmarks do not provide sufficient detail to assign them to the
single products covered by the benchmark. For example, the refinery
benchmark applies to a whole ‘typical product mix’ of a refinery,
consisting of various fractions such as naphtha, gasoline, diesel, kerosene,
fuel oils etc. The same applies to the ‘HVC95
’ benchmark and some other
chemicals benchmarks. This is no obstacle in principle to include such
materials/products in the CBAM, but a considerable practical stumbling
block to making it happen in practice, as the definition of the required
rules may be quite controversial. Proposals for solving this specific issue
include to attribute the emissions to specific materials/products according
to:
the ratio of free reaction enthalpies of the chemical reactions
involved;
the molecular weights of the materials obtained;
the relative economic value of the materials/products produced;
a flat-rate approach (all materials/products are rated equal, e.g. a
tonne of gasoline would have the same embedded emissions as a
tonne of heavy fuel oil).
In case of basic materials or products which require more than one production
step covered by the EU ETS, Equation (1) can either be applied for combining all
the steps of the value chain in one calculation, or each step can be assessed
94
Free Allocation Rules, i.e. Commission Delegated Regulation (EU) 2019/331 of 19 December 2018
determining transitional Union-wide rules for harmonised free allocation of emission allowances pursuant
to Article 10a of Directive 2003/87/EC of the European Parliament and of the Council. 95
High value chemicals, defined as a typical output of the steam cracking process, which yields several
organic bulk chemicals which are input to polymer production and other organic syntheses.
74
separately. As in most of the cases each of the production steps itself leads to a
tradable material or product, it is most useful to carry out the calculation for each
step separately. An overview can be helpful to determine all relevant value
chains. The data and information needs for determining reference values of
embedded emissions for implementing a CBAM include:
o The reference value of the embedded emissions of each of the precursor
materials, as discussed under the previous main bullet point for ‘one-step’
basic materials.
o The typical quantity of the precursor required to produce one tonne of the
material or product under consideration (material consumption MCi). This
can be a stoichiometric factor, but more often this will have to be based on
a ‘typical consumption level’ that will require additional data collection or
expert judgement, e.g. based on BAT reference documents, other literature
or industry guidelines. Again, this is no obstacle in principle, but a
possible source of controversy.
o The definition of the reference production route in case of products or
materials that can be obtained by quite different production routes. For
example:
Aromatics (benzene, toluene, xylols) are basic chemicals typically
produced in refineries or subsequent chemical plants. However,
they are also side products of coke ovens.
Ethanol is best known in public as a product of a biological
process (fermentation). However, it can also be produced from
fossil feedstock.
Hydrogen and ammonia are currently produced almost exclusively
from fossil feedstock (natural gas or heavy refinery fractions) but
are expected to be produced via electrolyses at large scale in the
future. Already now hydrogen is a by-product of the Chloralkali
electrolysis96
.
In the steel sector, blast furnace and electric arc furnace routes are
important and can overlap regarding their product mix.
For several non-ferrous metals both primary and secondary
production routes are of importance.
Again, this issue is no obstacle for including products in the CBAM in
principle, but its solution will be difficult from a political perspective and
may draw considerable international attention.
It goes without saying that the above data demand becomes more complex with
every step down the value chain.
96
However, there is also a technology called ‘oxygen depolarised cathode’ which reduces significantly the
energy consumption of the electrolysis, which avoids the hydrogen production. This is useful only at
chemical sites where no use can be made of the produced hydrogen.
75
The application of the methodology to determine embedded emissions will need to
inform the implied next process steps. In the case where the reference value will be
applied to imports, a higher level of precision and robustness against potential legal
challenges will be required. The preferred approach for solving such issues would be that
a working group under the Commission’s lead consisting of Member State experts and
possible consultants and industry stakeholders would develop solutions. Ultimately, this
group would provide the technical basis for the decision on inclusions of materials or
products in the CBAM, and on default values for embedded emissions and their input
factors.
5. Candidates for materials and products to be included in the CBAM
The final step for defining the scope of the CBAM is to move from the ‘sector’ concept
used in the CLL for the EU ETS to the more tangible concept of ‘materials and products’.
For the EU ETS, it is important to use a concept that fits to the installations covered,
which often produce a multitude of different products. However, when an imported good
is to be subject of a CBAM, it is necessary that the authority in charge – a Member
State’s customs office or port authority, etc. – can identify the product imported, check
whether it is to be covered, and then determine the relevant amount of emissions which
are to be covered by certificates or a tax.
As has been raised in section 3.c, a clear definition of the CBAM will ultimately require
a list of materials and products (or product classes) which should be covered by the
CBAM. This list must ensure that products can be clearly identified, and emission
reference values will be required to be attached to each of these products.
In that respect, adopting implementing acts could be used. Implementing acts could be
further be used for defining other technical details such as specific monitoring procedures
and actual default values for the embedded emissions of various products. Thus,
technological progress and the development of new product groups, or the gradual
introducing of products along the value chain when more data becomes available can be
also envisaged.
Table 7-2 presents the candidate materials/products from which the scope of the CBAM
can be defined. The table follows the logic of starting with simple (‘single-process’)
basic materials and going along the value chain to basic material products and in rare
cases semi-finished products. The table provides an insight to what data is required and
whether is already available. In the column ‘Include in CBAM?’ the table gives a
recommendation on whether the material or product should be included in the CBAM.
The indicators ‘possible’ or ‘tbd’ (to be decided) show that the inclusion should in
principle be technically possible, but that at this stage the data is not sufficiently
available, i.e. it would be up to the data collection approach for embedded emission
default values to provide the basis for the decision if the material or product can be
included in the CBAM.
Larger groups of CN/HS codes have been gathered into material and product groups for
the purpose of Table 7-2. The materials/products are named in the first column of that
table.
76
Materials and products are considered to be within the same group where production
processes suggest that the level of embedded emissions (EEP) as similar. Separate
materials/products are listed where the embedded emissions are considered significantly
different. However, more work (involving industry experts) in the future would be
required for determining the relevant values. Where EEP turn out to be sufficiently on a
similar level, product groups might be combined into one material group, or extended by
adding further CN codes. Such design choices are also dependent on the main CBAM
option chosen. For an excise duty (option 6), EEP levels don’t have to be perfectly exact,
as they would not have to fully relate to true emissions. It would be sufficient if they
provide a reasonable differentiation between materials for incentivising the use of
materials with lower embedded emissions on average.
Table 7-2: Material and product categories, data requirements and considerations
for inclusion in the CBAM, for selected aggregated sectors.
Under ‘Include in CBAM?’ The meaning of the entries are as follows: ‘Yes’: Product can be included in
the CBAM based on practical feasibility considerations; ‘No’: Product does not appear suitable. ‘Tbd’ (to
be discussed): at the current stage it is unclear if practical obstacles can be solved; ‘possible’ means
inclusion should be possible in practice, but either data is not sufficient or the merits of inclusion are not
clear yet. Where ‘tbd’ is given in combination with yes or no, it means that ‘yes’ or ‘no’ are not as clear
cut as without ‘tbd’. The decision on inclusion of such products requires that more information is to be
collected.
CBAM
Product
name
Precursors Data needs Include in
CBAM?
Other comments
Iron and Steel (HS 72)
Pig iron Coke,
sintered ore
MCi of Coke, sintered
ore, EEP of coke and
Sintered ore; EEP of
‘hot metal’, correction
factor for not making
steel
No Reference EEP required for other steel
products; Don't include product in CBAM,
as imports are negligible
Ferro-
Alloys
No (tbd) Too diverse products, no EU ETS product
benchmark (BM) data. Inclusion can be re-
evaluated in a few years
DRI (Direct
Reduced
Iron)
Process route and
precursors, EEP
No (tbd) More efficient than conventional iron
making. May become increasingly
important as low carbon technology.
Inclusion can be re-evaluated in a few
years
Iron and
steel Scrap
No Too diverse, and no emissions attached
Iron and
steel
primary
forms
Coke,
sintered ore
MCi of Coke, sintered
ore, EEP of coke and
Sintered ore; EEP of
‘hot metal’ -
Alternatively EAF
steel different EEP?
possible Includes largest import category (720712 -
Semi-finished bars, iron or non-alloy steel
<0.25%C, rectangular, nes), which might
be EAF steel? Needs further information
from the sector;
Reference EEP required for calculating hot
rolled steel, i.e. is precondition for ‘hot
rolled steel’
Hot rolled
and further
‘Hot metal’
(EU ETS
MCi of hot metal (or
estimate as 100%),
possible Promising candidate (often mentioned in
literature). Proposal here to include also

77
CBAM
Product
name
Precursors Data needs Include in
CBAM?
Other comments
steps BM) / iron
and steel in
primary
forms
EEP for ‘hot metal’;
correction factor for
hot rolling (based on
fuel input, not
available from EU
ETS data)
cold-rolled products (which includes a step
after hot rolling)
Coated hot
rolled and
further steps
Hot rolled
steel
Use EEP of hot rolled
steel as proxy?
tbd. Coatings are very diverse, may have
significant impact on EEP. However, if not
enough data available, propose to use EEP
of hot rolled steel as a proxy. Would
require additional expertise on coating
processes. Inclusion might be interesting
due to including a step on the value chain.
If not included, re-evaluate in a few years
Forged,
extruded,
wire etc.
Hot rolled
steel or hot
metal
EEP of hot rolled steel
might serve as proxy
No (tbd.) Processes covered quite diverse. Imported
volume not too big.
Stainless
steel
scrap and
ferro-alloys
MCi levels of
precursors, EEP
thereof (unknown),
EEP of EAF high alloy
steel (EU ETS BM)
No (tbd.) Danger of too diverse products and lack of
reference data. Inclusion can be re-
evaluated in a few years
Other
alloyed steel
scrap and
ferro-alloys
MCi levels of
precursors, EEP
thereof (unknown),
EEP of EAF high alloy
steel (EU ETS BM)
No (tbd.) Danger of too diverse products and lack of
reference data. Inclusion can be re-
evaluated in a few years
Iron and steel articles (HS 73)
Note: These products seem to consist to a very high percentage of cast iron or steel. The reference value of the
corresponding basic material could serve as a proxy for embedded emissions of the (manufactured) product.
These products can be considered for inclusion if the goal is to include more steps down the value chain.
Article of
iron or steel
Composition data in
most cases not
specified, hence no
EEP data know.
Perhaps use ‘hot rolled
steel’ as proxy.
No (tbd) General problem here: Many products (the
most traded ones) are ‘n.e.s.’, hence too
diverse. Furthermore most product groups
cover both ‘iron or steel’, i.e. EEP quite
uncertain
Article of
cast iron
Pig iron
(hot metal
with
correction
factor)
Correction factor for
converting ‘hot metal’
into ‘cast iron’; MCi
assumed as 100%; EEP
for iron casting (EU
ETS BM)
No (tbd) Not very high imports
Article of
stainless or
alloy
Stainless
steel
use stainless steel EEP
as proxy
No (tbd) Not very high imports
Article of
Steel
(hot rolled)
steel
use hot rolled steel
EEP as proxy
No (tbd) Not very high imports
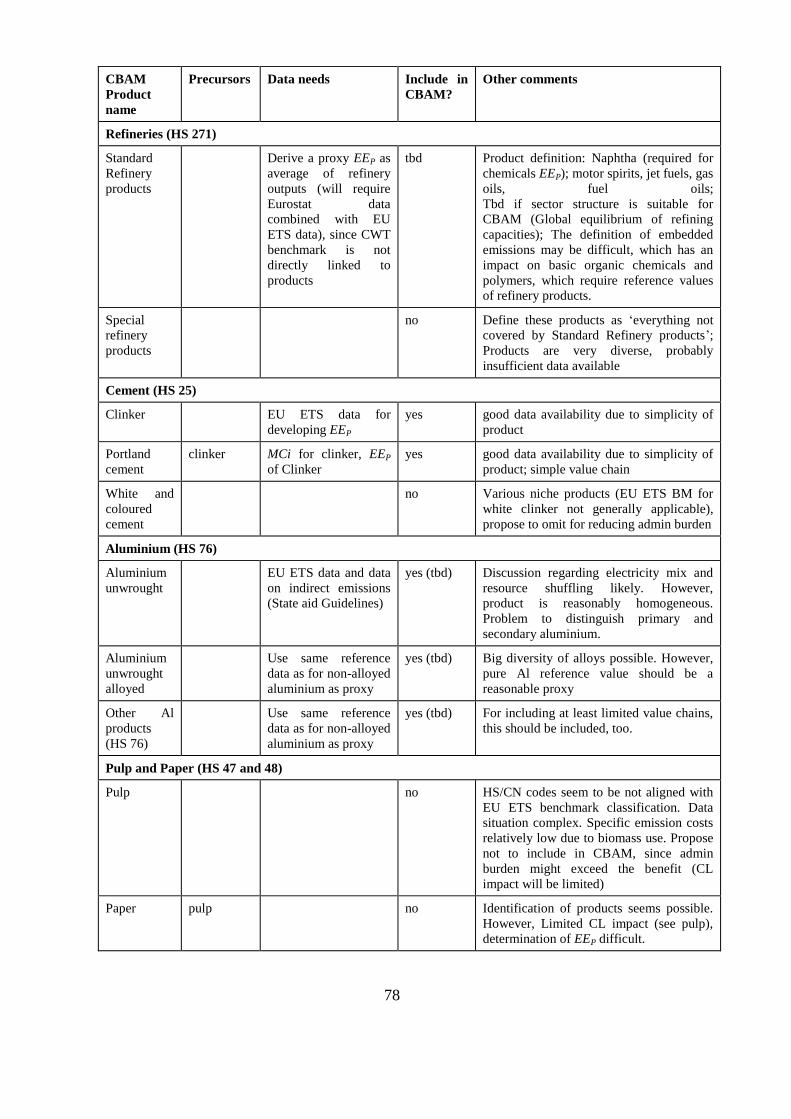
78
CBAM
Product
name
Precursors Data needs Include in
CBAM?
Other comments
Refineries (HS 271)
Standard
Refinery
products
Derive a proxy EEP as
average of refinery
outputs (will require
Eurostat data
combined with EU
ETS data), since CWT
benchmark is not
directly linked to
products
tbd Product definition: Naphtha (required for
chemicals EEP); motor spirits, jet fuels, gas
oils, fuel oils;
Tbd if sector structure is suitable for
CBAM (Global equilibrium of refining
capacities); The definition of embedded
emissions may be difficult, which has an
impact on basic organic chemicals and
polymers, which require reference values
of refinery products.
Special
refinery
products
no Define these products as ‘everything not
covered by Standard Refinery products’;
Products are very diverse, probably
insufficient data available
Cement (HS 25)
Clinker EU ETS data for
developing EEP
yes good data availability due to simplicity of
product
Portland
cement
clinker MCi for clinker, EEP
of Clinker
yes good data availability due to simplicity of
product; simple value chain
White and
coloured
cement
no Various niche products (EU ETS BM for
white clinker not generally applicable),
propose to omit for reducing admin burden
Aluminium (HS 76)
Aluminium
unwrought
EU ETS data and data
on indirect emissions
(State aid Guidelines)
yes (tbd) Discussion regarding electricity mix and
resource shuffling likely. However,
product is reasonably homogeneous.
Problem to distinguish primary and
secondary aluminium.
Aluminium
unwrought
alloyed
Use same reference
data as for non-alloyed
aluminium as proxy
yes (tbd) Big diversity of alloys possible. However,
pure Al reference value should be a
reasonable proxy
Other Al
products
(HS 76)
Use same reference
data as for non-alloyed
aluminium as proxy
yes (tbd) For including at least limited value chains,
this should be included, too.
Pulp and Paper (HS 47 and 48)
Pulp no HS/CN codes seem to be not aligned with
EU ETS benchmark classification. Data
situation complex. Specific emission costs
relatively low due to biomass use. Propose
not to include in CBAM, since admin
burden might exceed the benefit (CL
impact will be limited)
Paper pulp no Identification of products seems possible.
However, Limited CL impact (see pulp),
determination of EEP difficult.
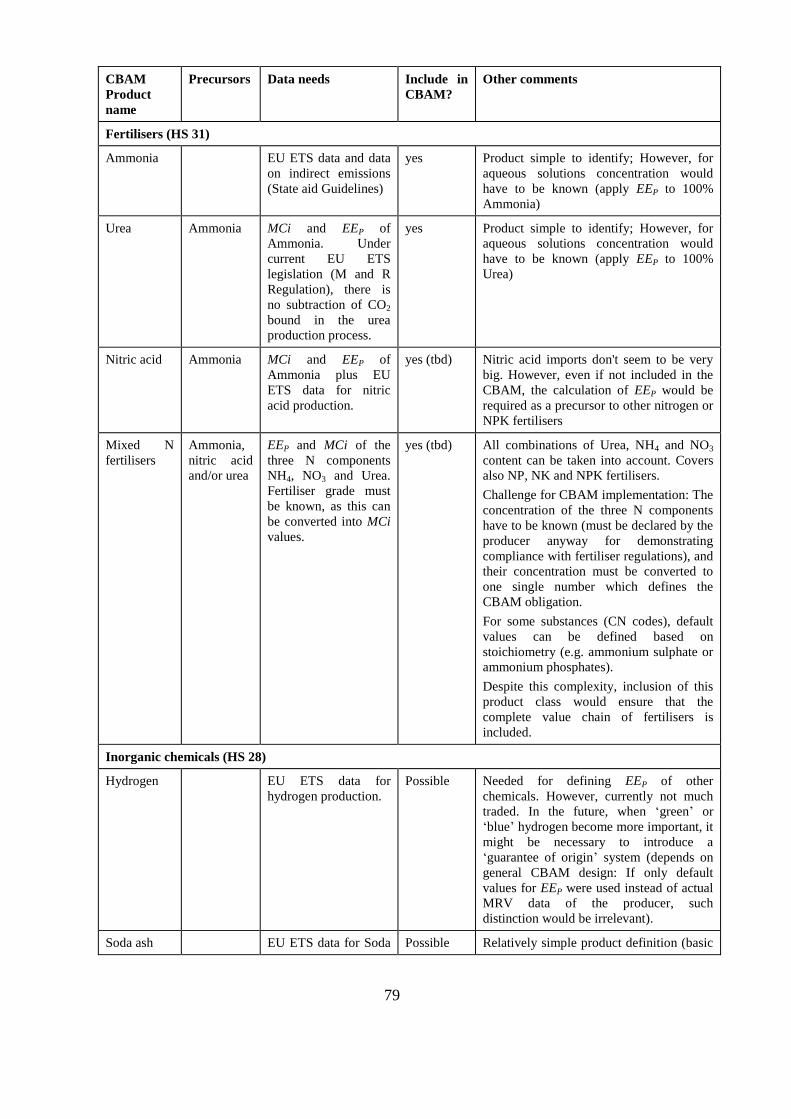
79
CBAM
Product
name
Precursors Data needs Include in
CBAM?
Other comments
Fertilisers (HS 31)
Ammonia EU ETS data and data
on indirect emissions
(State aid Guidelines)
yes Product simple to identify; However, for
aqueous solutions concentration would
have to be known (apply EEP to 100%
Ammonia)
Urea Ammonia MCi and EEP of
Ammonia. Under
current EU ETS
legislation (M and R
Regulation), there is
no subtraction of CO2
bound in the urea
production process.
yes Product simple to identify; However, for
aqueous solutions concentration would
have to be known (apply EEP to 100%
Urea)
Nitric acid Ammonia MCi and EEP of
Ammonia plus EU
ETS data for nitric
acid production.
yes (tbd) Nitric acid imports don't seem to be very
big. However, even if not included in the
CBAM, the calculation of EEP would be
required as a precursor to other nitrogen or
NPK fertilisers
Mixed N
fertilisers
Ammonia,
nitric acid
and/or urea
EEP and MCi of the
three N components
NH4, NO3 and Urea.
Fertiliser grade must
be known, as this can
be converted into MCi
values.
yes (tbd) All combinations of Urea, NH4 and NO3
content can be taken into account. Covers
also NP, NK and NPK fertilisers.
Challenge for CBAM implementation: The
concentration of the three N components
have to be known (must be declared by the
producer anyway for demonstrating
compliance with fertiliser regulations), and
their concentration must be converted to
one single number which defines the
CBAM obligation.
For some substances (CN codes), default
values can be defined based on
stoichiometry (e.g. ammonium sulphate or
ammonium phosphates).
Despite this complexity, inclusion of this
product class would ensure that the
complete value chain of fertilisers is
included.
Inorganic chemicals (HS 28)
Hydrogen EU ETS data for
hydrogen production.
Possible Needed for defining EEP of other
chemicals. However, currently not much
traded. In the future, when ‘green’ or
‘blue’ hydrogen become more important, it
might be necessary to introduce a
‘guarantee of origin’ system (depends on
general CBAM design: If only default
values for EEP were used instead of actual
MRV data of the producer, such
distinction would be irrelevant).
Soda ash EU ETS data for Soda Possible Relatively simple product definition (basic
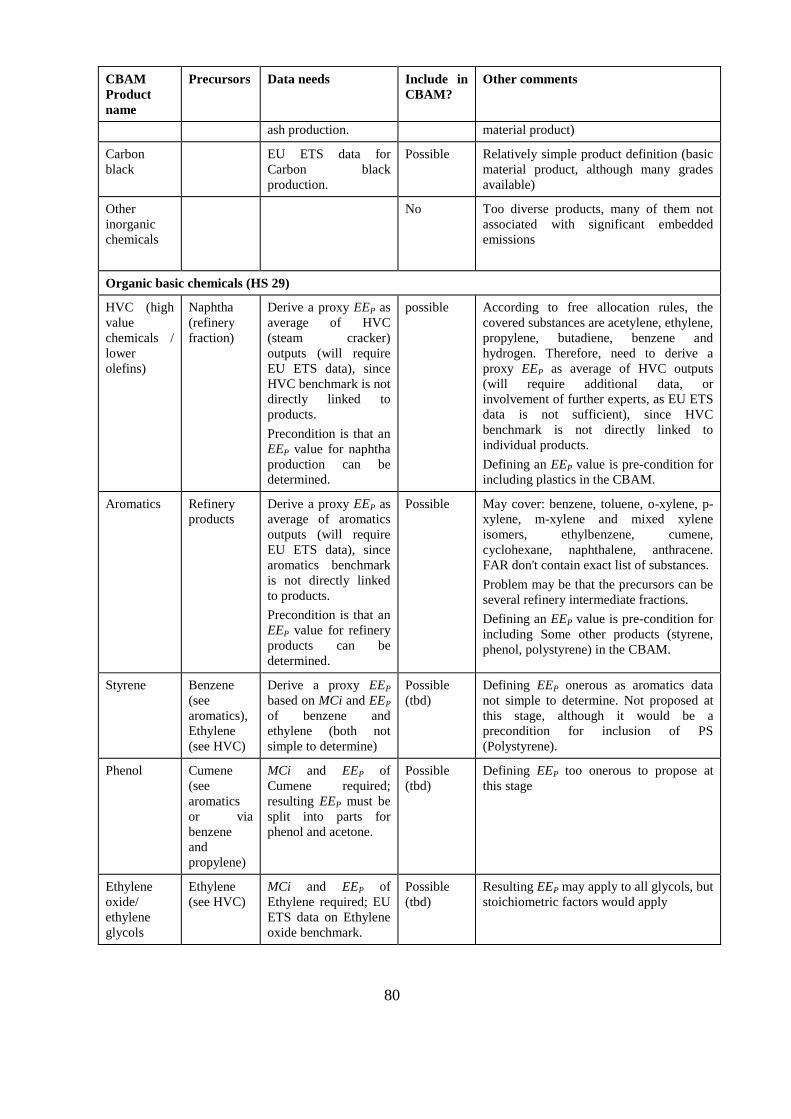
80
CBAM
Product
name
Precursors Data needs Include in
CBAM?
Other comments
ash production. material product)
Carbon
black
EU ETS data for
Carbon black
production.
Possible Relatively simple product definition (basic
material product, although many grades
available)
Other
inorganic
chemicals
No Too diverse products, many of them not
associated with significant embedded
emissions
Organic basic chemicals (HS 29)
HVC (high
value
chemicals /
lower
olefins)
Naphtha
(refinery
fraction)
Derive a proxy EEP as
average of HVC
(steam cracker)
outputs (will require
EU ETS data), since
HVC benchmark is not
directly linked to
products.
Precondition is that an
EEP value for naphtha
production can be
determined.
possible According to free allocation rules, the
covered substances are acetylene, ethylene,
propylene, butadiene, benzene and
hydrogen. Therefore, need to derive a
proxy EEP as average of HVC outputs
(will require additional data, or
involvement of further experts, as EU ETS
data is not sufficient), since HVC
benchmark is not directly linked to
individual products.
Defining an EEP value is pre-condition for
including plastics in the CBAM.
Aromatics Refinery
products
Derive a proxy EEP as
average of aromatics
outputs (will require
EU ETS data), since
aromatics benchmark
is not directly linked
to products.
Precondition is that an
EEP value for refinery
products can be
determined.
Possible May cover: benzene, toluene, o-xylene, p-
xylene, m-xylene and mixed xylene
isomers, ethylbenzene, cumene,
cyclohexane, naphthalene, anthracene.
FAR don't contain exact list of substances.
Problem may be that the precursors can be
several refinery intermediate fractions.
Defining an EEP value is pre-condition for
including Some other products (styrene,
phenol, polystyrene) in the CBAM.
Styrene Benzene
(see
aromatics),
Ethylene
(see HVC)
Derive a proxy EEP
based on MCi and EEP
of benzene and
ethylene (both not
simple to determine)
Possible
(tbd)
Defining EEP onerous as aromatics data
not simple to determine. Not proposed at
this stage, although it would be a
precondition for inclusion of PS
(Polystyrene).
Phenol Cumene
(see
aromatics
or via
benzene
and
propylene)
MCi and EEP of
Cumene required;
resulting EEP must be
split into parts for
phenol and acetone.
Possible
(tbd)
Defining EEP too onerous to propose at
this stage
Ethylene
oxide/
ethylene
glycols
Ethylene
(see HVC)
MCi and EEP of
Ethylene required; EU
ETS data on Ethylene
oxide benchmark.
Possible
(tbd)
Resulting EEP may apply to all glycols, but
stoichiometric factors would apply

81
CBAM
Product
name
Precursors Data needs Include in
CBAM?
Other comments
Vinyl
chloride
monomer
(VCM)
Ethylene
(see HVC),
Chlorine
(only
indirect
emissions)
MCi and EEP of
Ethylene required; EU
ETS data on VCM
benchmark. Tbd if
indirect emissions of
Chlorine production
should be included,
and how.
Possible
(tbd)
EEP value needed, if PVC is to be included
in CBAM.
Methanol Syngas EU ETS benchmark
data needed for
syngas, MCi and
emissions from
Methanol synthesis to
be determined from
other sources
Possible
(tbd)
Syngas as energy intensive product is not
traded but used on-site. Methanol and
Formaldehyde are the most common
products of syngas. Determination of EEP
not straightforward.
Formaldehy
de
Syngas EU ETS benchmark
data needed for
syngas, MCi and
emissions from
Formaldehyde
synthesis to be
determined from other
sources
Possible
(tbd)
Syngas as energy intensive product is not
traded but used on-site. Methanol and
Formaldehyde are the most common
products of syngas. Determination of EEP
not straightforward.
Ethanol Ethylene
(see HVC)
MCi and EEP of
Ethylene required
Possible
(tbd)
Ethanol can alternatively be produced by
fermentation of biomass. Treatment in
CBAM like distinction blast furnace/EAF
steel: If differentiation is desirable, a kind
of guarantee of origin system could be
envisaged.
Acetone Propylene
(see HVC)
or as by-
product
from
Phenol
MCi and EEP of
Propylene required, or
alternatively a
stoichiometric factor
for converting the EEP
value of Phenol.
Possible
(tbd)
Determination of appropriate EEP value
may be controversial.
Other
organic
basic
chemicals
no There are about 260 HS product categories
of this type. For some of them it might be
possible on the long run to define proxy
values for EEP. However, based on
experience from the EU ETS
benchmarking exercise, it is would be very
onerous.
Polymers (‘plastics’)
PE (Poly-
ethylene)
Ethylene
(see HVC)
MCi and EEP of
Ethylene required
possible Inclusion in CBAM depends on data
availability, but makes sense due to the big
amounts produced and traded. For a better
EEP value, additional emission data
(covering the polymerisation process)
would be required.
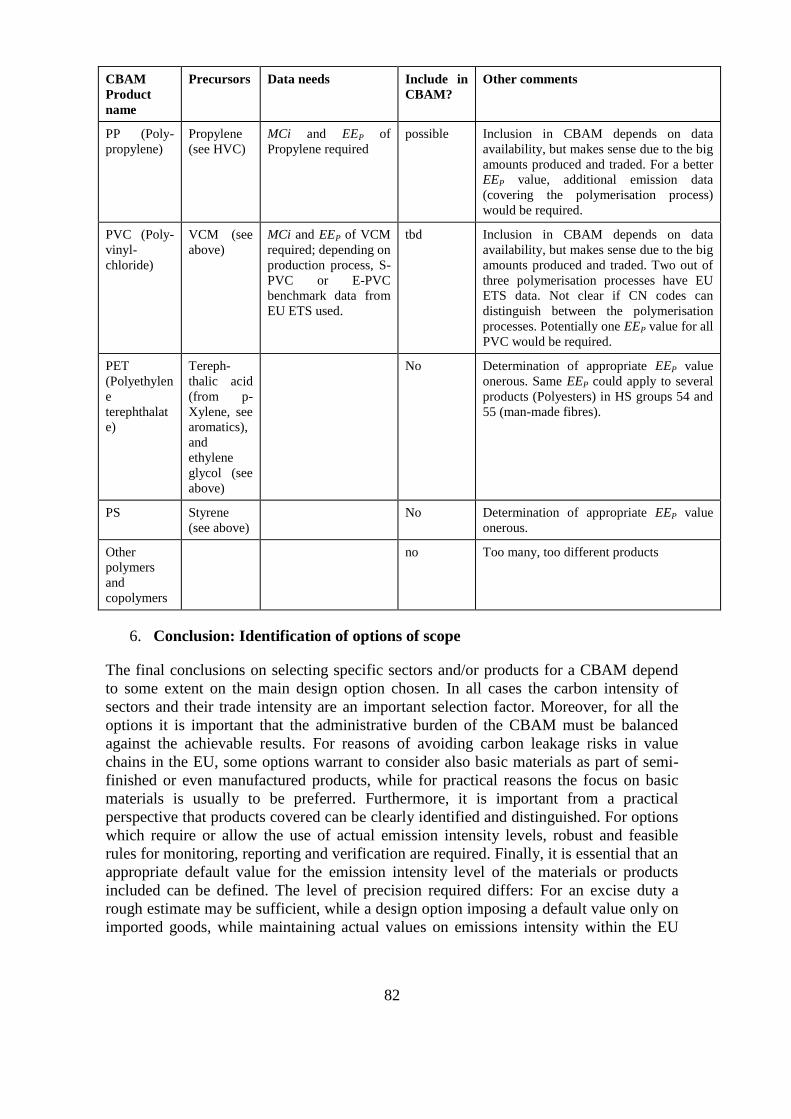
82
CBAM
Product
name
Precursors Data needs Include in
CBAM?
Other comments
PP (Poly-
propylene)
Propylene
(see HVC)
MCi and EEP of
Propylene required
possible Inclusion in CBAM depends on data
availability, but makes sense due to the big
amounts produced and traded. For a better
EEP value, additional emission data
(covering the polymerisation process)
would be required.
PVC (Poly-
vinyl-
chloride)
VCM (see
above)
MCi and EEP of VCM
required; depending on
production process, S-
PVC or E-PVC
benchmark data from
EU ETS used.
tbd Inclusion in CBAM depends on data
availability, but makes sense due to the big
amounts produced and traded. Two out of
three polymerisation processes have EU
ETS data. Not clear if CN codes can
distinguish between the polymerisation
processes. Potentially one EEP value for all
PVC would be required.
PET
(Polyethylen
e
terephthalat
e)
Tereph-
thalic acid
(from p-
Xylene, see
aromatics),
and
ethylene
glycol (see
above)
No Determination of appropriate EEP value
onerous. Same EEP could apply to several
products (Polyesters) in HS groups 54 and
55 (man-made fibres).
PS Styrene
(see above)
No Determination of appropriate EEP value
onerous.
Other
polymers
and
copolymers
no Too many, too different products
6. Conclusion: Identification of options of scope
The final conclusions on selecting specific sectors and/or products for a CBAM depend
to some extent on the main design option chosen. In all cases the carbon intensity of
sectors and their trade intensity are an important selection factor. Moreover, for all the
options it is important that the administrative burden of the CBAM must be balanced
against the achievable results. For reasons of avoiding carbon leakage risks in value
chains in the EU, some options warrant to consider also basic materials as part of semi-
finished or even manufactured products, while for practical reasons the focus on basic
materials is usually to be preferred. Furthermore, it is important from a practical
perspective that products covered can be clearly identified and distinguished. For options
which require or allow the use of actual emission intensity levels, robust and feasible
rules for monitoring, reporting and verification are required. Finally, it is essential that an
appropriate default value for the emission intensity level of the materials or products
included can be defined. The level of precision required differs: For an excise duty a
rough estimate may be sufficient, while a design option imposing a default value only on
imported goods, while maintaining actual values on emissions intensity within the EU

83
ETS will require default values which are established in a way that is compliant with
international rules.
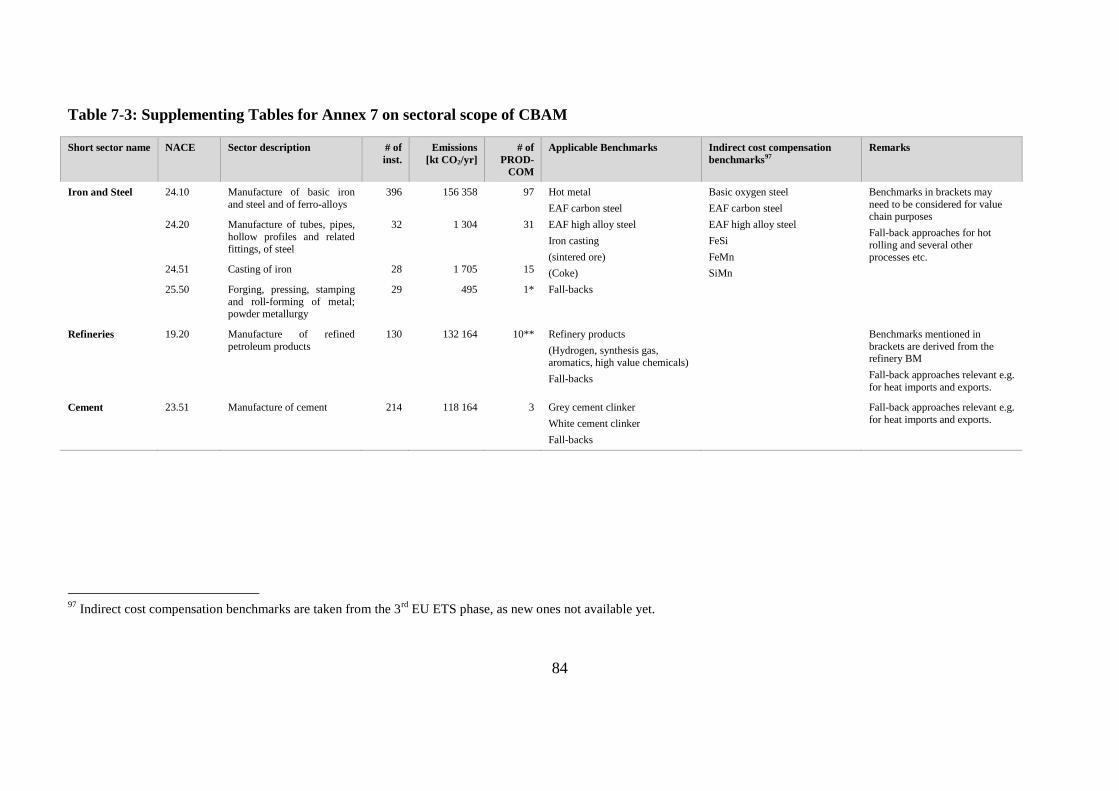
84
Table 7-3: Supplementing Tables for Annex 7 on sectoral scope of CBAM
Short sector name NACE Sector description # of
inst.
Emissions
[kt CO2/yr]
# of
PROD-
COM
Applicable Benchmarks Indirect cost compensation
benchmarks97
Remarks
Iron and Steel 24.10 Manufacture of basic iron
and steel and of ferro-alloys
396 156 358 97 Hot metal
EAF carbon steel
EAF high alloy steel
Iron casting
(sintered ore)
(Coke)
Fall-backs
Basic oxygen steel
EAF carbon steel
EAF high alloy steel
FeSi
FeMn
SiMn
Benchmarks in brackets may
need to be considered for value chain purposes
Fall-back approaches for hot
rolling and several other processes etc.
24.20 Manufacture of tubes, pipes,
hollow profiles and related
fittings, of steel
32 1 304 31
24.51 Casting of iron 28 1 705 15
25.50 Forging, pressing, stamping
and roll-forming of metal; powder metallurgy
29 495 1*
Refineries 19.20 Manufacture of refined
petroleum products
130 132 164 10** Refinery products
(Hydrogen, synthesis gas, aromatics, high value chemicals)
Fall-backs
Benchmarks mentioned in
brackets are derived from the refinery BM
Fall-back approaches relevant e.g.
for heat imports and exports.
Cement 23.51 Manufacture of cement 214 118 164 3 Grey cement clinker
White cement clinker
Fall-backs
Fall-back approaches relevant e.g.
for heat imports and exports.
97
Indirect cost compensation benchmarks are taken from the 3rd
EU ETS phase, as new ones not available yet.
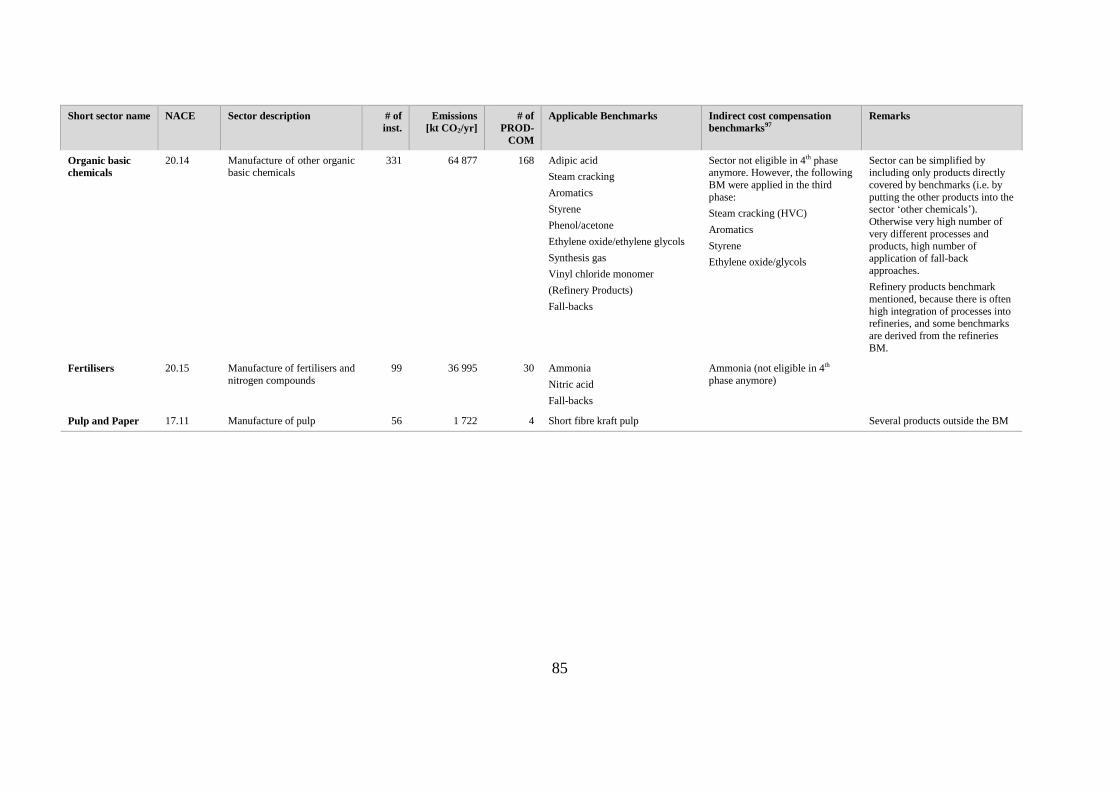
85
Short sector name NACE Sector description # of
inst.
Emissions
[kt CO2/yr]
# of
PROD-
COM
Applicable Benchmarks Indirect cost compensation
benchmarks97
Remarks
Organic basic
chemicals
20.14 Manufacture of other organic basic chemicals
331 64 877 168 Adipic acid
Steam cracking
Aromatics
Styrene
Phenol/acetone
Ethylene oxide/ethylene glycols
Synthesis gas
Vinyl chloride monomer
(Refinery Products)
Fall-backs
Sector not eligible in 4th phase anymore. However, the following
BM were applied in the third
phase:
Steam cracking (HVC)
Aromatics
Styrene
Ethylene oxide/glycols
Sector can be simplified by including only products directly
covered by benchmarks (i.e. by
putting the other products into the sector ‘other chemicals’).
Otherwise very high number of
very different processes and products, high number of
application of fall-back
approaches.
Refinery products benchmark
mentioned, because there is often
high integration of processes into refineries, and some benchmarks
are derived from the refineries
BM.
Fertilisers 20.15 Manufacture of fertilisers and
nitrogen compounds
99 36 995 30 Ammonia
Nitric acid
Fall-backs
Ammonia (not eligible in 4th
phase anymore)
Pulp and Paper 17.11 Manufacture of pulp 56 1 722 4 Short fibre kraft pulp Several products outside the BM
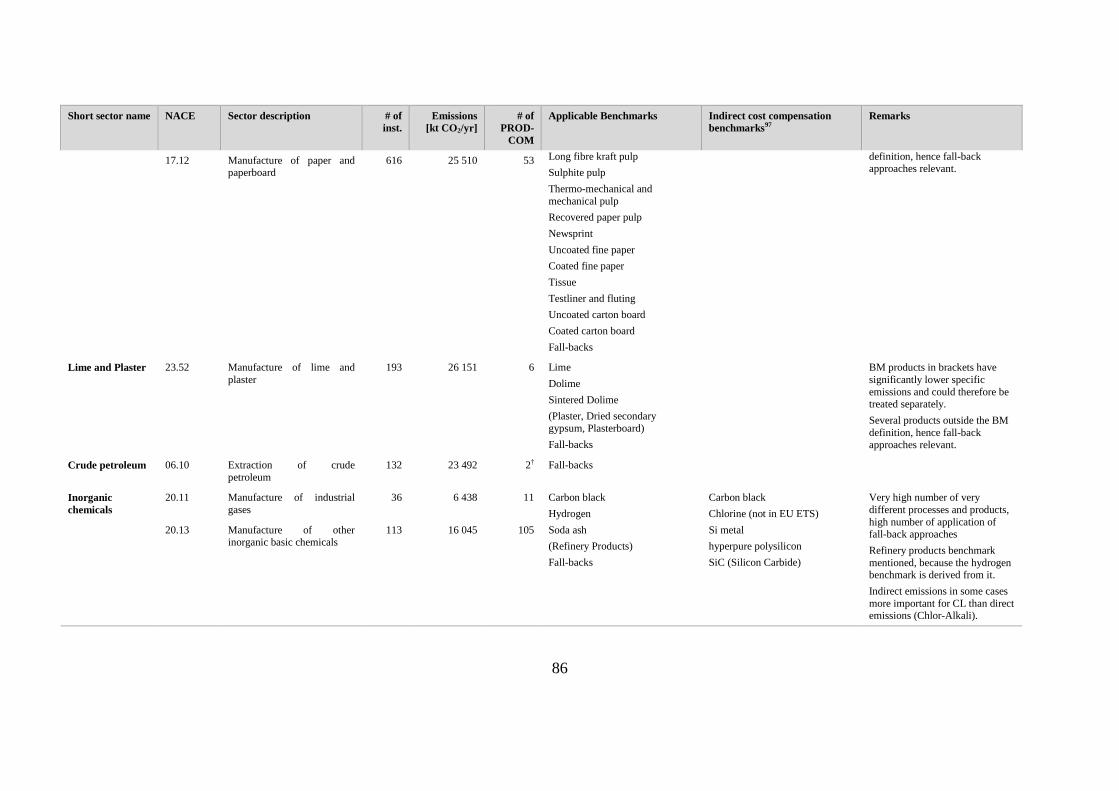
86
Short sector name NACE Sector description # of
inst.
Emissions
[kt CO2/yr]
# of
PROD-
COM
Applicable Benchmarks Indirect cost compensation
benchmarks97
Remarks
17.12 Manufacture of paper and paperboard
616 25 510 53 Long fibre kraft pulp
Sulphite pulp
Thermo-mechanical and
mechanical pulp
Recovered paper pulp
Newsprint
Uncoated fine paper
Coated fine paper
Tissue
Testliner and fluting
Uncoated carton board
Coated carton board
Fall-backs
definition, hence fall-back approaches relevant.
Lime and Plaster 23.52 Manufacture of lime and
plaster
193 26 151 6 Lime
Dolime
Sintered Dolime
(Plaster, Dried secondary
gypsum, Plasterboard)
Fall-backs
BM products in brackets have
significantly lower specific
emissions and could therefore be treated separately.
Several products outside the BM
definition, hence fall-back approaches relevant.
Crude petroleum 06.10 Extraction of crude
petroleum
132 23 492 2† Fall-backs
Inorganic
chemicals
20.11 Manufacture of industrial
gases
36 6 438 11 Carbon black
Hydrogen
Soda ash
(Refinery Products)
Fall-backs
Carbon black
Chlorine (not in EU ETS)
Si metal
hyperpure polysilicon
SiC (Silicon Carbide)
Very high number of very
different processes and products,
high number of application of
fall-back approaches
Refinery products benchmark
mentioned, because the hydrogen benchmark is derived from it.
Indirect emissions in some cases
more important for CL than direct emissions (Chlor-Alkali).
20.13 Manufacture of other inorganic basic chemicals
113 16 045 105
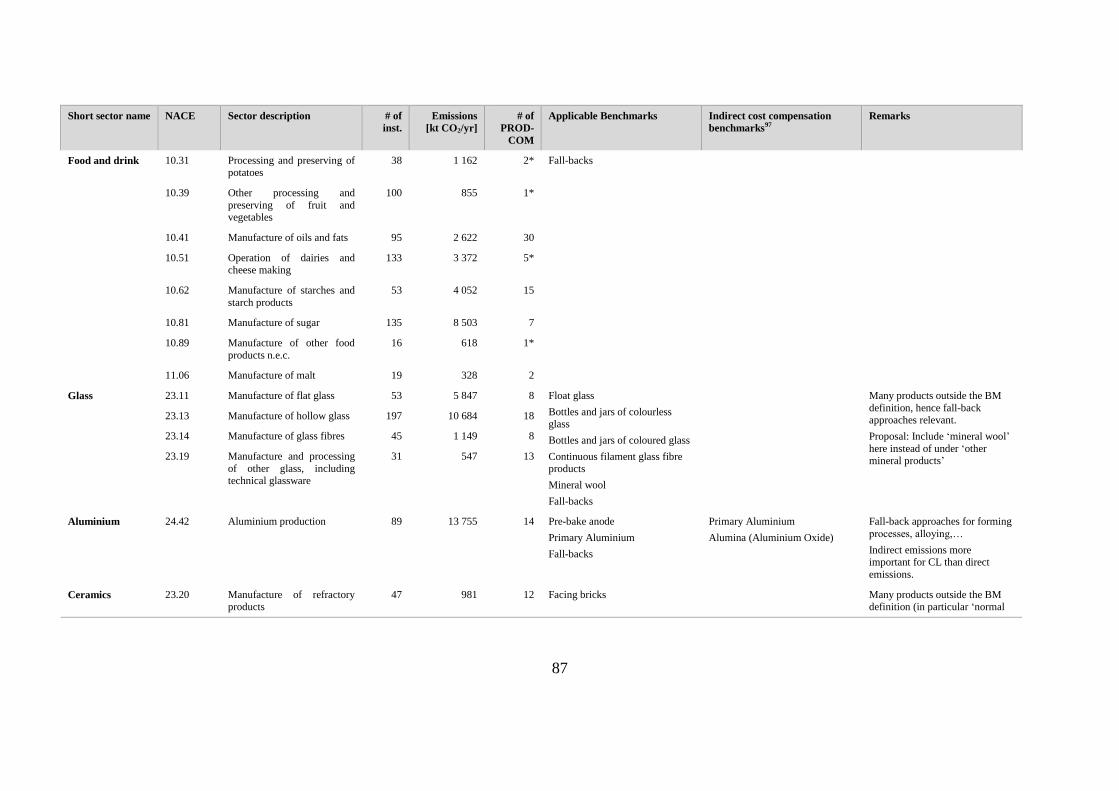
87
Short sector name NACE Sector description # of
inst.
Emissions
[kt CO2/yr]
# of
PROD-
COM
Applicable Benchmarks Indirect cost compensation
benchmarks97
Remarks
Food and drink 10.31 Processing and preserving of potatoes
38 1 162 2* Fall-backs
10.39 Other processing and
preserving of fruit and vegetables
100 855 1*
10.41 Manufacture of oils and fats 95 2 622 30
10.51 Operation of dairies and cheese making
133 3 372 5*
10.62 Manufacture of starches and
starch products
53 4 052 15
10.81 Manufacture of sugar 135 8 503 7
10.89 Manufacture of other food
products n.e.c.
16 618 1*
11.06 Manufacture of malt 19 328 2
Glass 23.11 Manufacture of flat glass 53 5 847 8 Float glass
Bottles and jars of colourless glass
Bottles and jars of coloured glass
Continuous filament glass fibre products
Mineral wool
Fall-backs
Many products outside the BM
definition, hence fall-back approaches relevant.
Proposal: Include ‘mineral wool’
here instead of under ‘other mineral products’
23.13 Manufacture of hollow glass 197 10 684 18
23.14 Manufacture of glass fibres 45 1 149 8
23.19 Manufacture and processing
of other glass, including technical glassware
31 547 13
Aluminium 24.42 Aluminium production 89 13 755 14 Pre-bake anode
Primary Aluminium
Fall-backs
Primary Aluminium
Alumina (Aluminium Oxide)
Fall-back approaches for forming
processes, alloying,…
Indirect emissions more important for CL than direct
emissions.
Ceramics 23.20 Manufacture of refractory products
47 981 12 Facing bricks Many products outside the BM definition (in particular ‘normal

88
Short sector name NACE Sector description # of
inst.
Emissions
[kt CO2/yr]
# of
PROD-
COM
Applicable Benchmarks Indirect cost compensation
benchmarks97
Remarks
23.31 Manufacture of ceramic tiles and flags
303 6 829 1 Pavers
Roof tiles
Spray dried powder
Fall-backs
building bricks’, tiles, table and sanitary ware, etc., hence fall-
back approaches relevant.
Coke 19.10 Manufacture of coke oven
products
16 5 833 1 Coke
Fall-backs
Coke by-products (aromatics) not
covered by aromatics benchmark
(see organic chemicals)
Polymers 20.16 Manufacture of plastics in
primary forms
112 4 789 48 S-PVC
E-PVC
(Steam cracking, Vinyl chloride monomer, Adipic acid, Synthesis
gas, Refinery Products)
Fall-backs
(Chlorine, Steam cracking) Potentially very high number of
very different processes and
products, high number of application of fall-back
approaches.
Benchmarks in brackets added for the production of the monomers
(i.e. pre-cursors of the polymers),
as those are the emission-
intensive processes, while the
polymers are the trade-intensive
ones.
Refinery products benchmark
mentioned, because there is often
high integration of processes into refineries.
20.17 Manufacture of synthetic rubber in primary forms
9 866 2
Non-ferrous
metals (except Al)
24.43 Lead, zinc and tin production 20 1 903 11 Fall-backs Zinc electrolysis Indirect emissions often more
important for CL than direct emissions. 24.44 Copper production 21 2 040 13
24.45 Other non-ferrous metal
production
–†† 190 42
Other mineral
products
23.99 Manufacture of other non-metallic mineral products
n.e.c.
212 3 691 15 Fall-backs
Other chemicals 20.12 Manufacture of dyes and pigments
22 1 779 31 Fall-backs
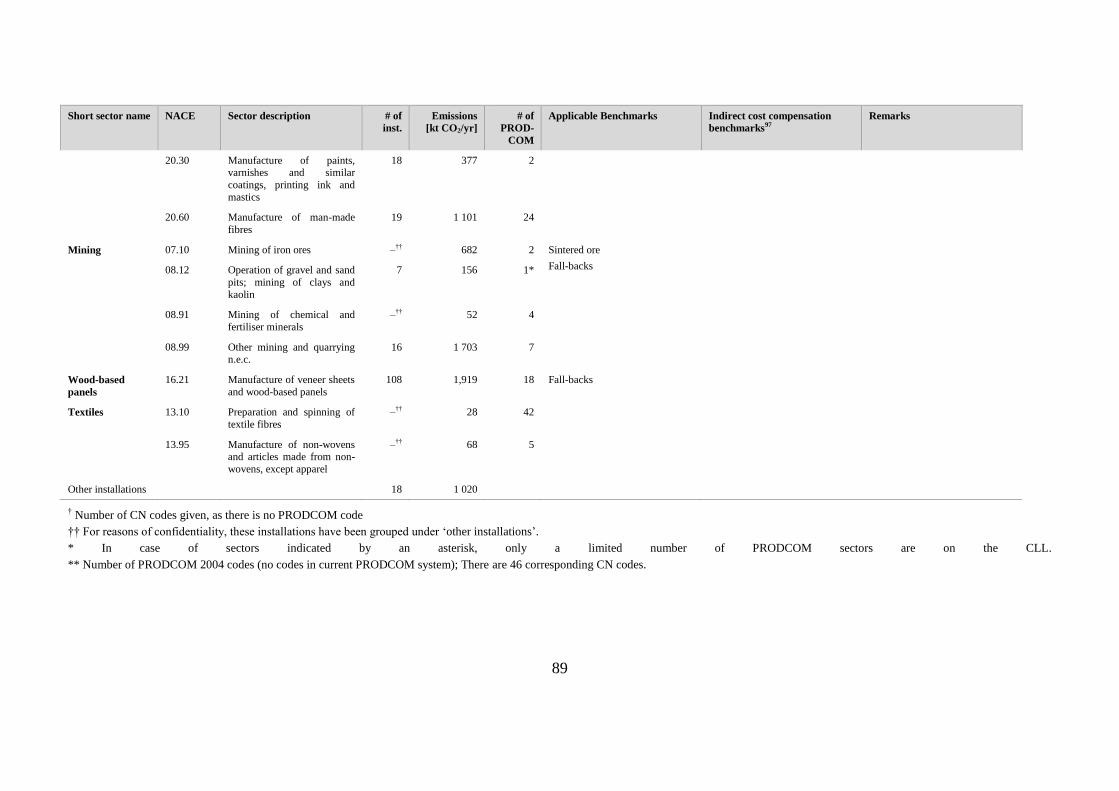
89
Short sector name NACE Sector description # of
inst.
Emissions
[kt CO2/yr]
# of
PROD-
COM
Applicable Benchmarks Indirect cost compensation
benchmarks97
Remarks
20.30 Manufacture of paints, varnishes and similar
coatings, printing ink and
mastics
18 377 2
20.60 Manufacture of man-made
fibres
19 1 101 24
Mining 07.10 Mining of iron ores –†† 682 2 Sintered ore
Fall-backs
08.12 Operation of gravel and sand
pits; mining of clays and
kaolin
7 156 1*
08.91 Mining of chemical and
fertiliser minerals
–†† 52 4
08.99 Other mining and quarrying n.e.c.
16 1 703 7
Wood-based
panels
16.21 Manufacture of veneer sheets
and wood-based panels
108 1,919 18 Fall-backs
Textiles 13.10 Preparation and spinning of
textile fibres
–†† 28 42
13.95 Manufacture of non-wovens and articles made from non-
wovens, except apparel
–†† 68 5
Other installations 18 1 020
† Number of CN codes given, as there is no PRODCOM code
†† For reasons of confidentiality, these installations have been grouped under ‘other installations’.
* In case of sectors indicated by an asterisk, only a limited number of PRODCOM sectors are on the CLL.
** Number of PRODCOM 2004 codes (no codes in current PRODCOM system); There are 46 corresponding CN codes.
90
ANNEX 8: CASE OF ELECTRICITY – IMPACTS
The PRIMES model, used for the purpose of simulating the application of the CBAM on
electricity imports, shows that the impacts of the considered options on total carbon
emissions reductions (in the EU and its neighbours) differ greatly.
Option A vs Option B
Under option A, there is no effect on total CO2 emissions until 2025 and very little until
2030 (see figure 8.1). The environmental impact of this option is therefore very limited
and significantly smaller than the impact of option B.
The large difference between the environmental impact of option B with regard to option
A stems largely from the fact that option A results in a relatively low estimated CBAM
obligation (5 €/MWh in 2030 compared to 20–30 €/MWh under option B in the same
year) which is insufficient to meaningfully affect cross-border electricity trade and
prevent carbon leakage.
Additionally, by exerting greater influence on trade patterns and by offering a degree of
protection against carbon leakage, option B incentivises more efficient investment in new
renewable capacities in certain Member States bordering third countries, which results in
higher renewable generation within the EU replacing part of the discouraged imports.
This represents another important channel through which CO2 emissions are avoided,
although its effect is much weaker under option A. Overall, option B displays superior
effectiveness in preventing carbon leakage due to a greater amount of carbon-intensive
imports, and hence generation, avoided.
The electricity mix within the EU does not change significantly due to the application of
the CBAM in the sector. Given its very limited effects on cross-border trade, option A
leaves the structure of power generation almost unchanged.
Option B therefore introduces a higher barrier for emission-intensive imports which
requires increased generation in the EU as replacement. Since the additional generation is
less emission-intensive, the overall effect on carbon emissions is positive. Consequently,
option B is considered to be preferable to option A.
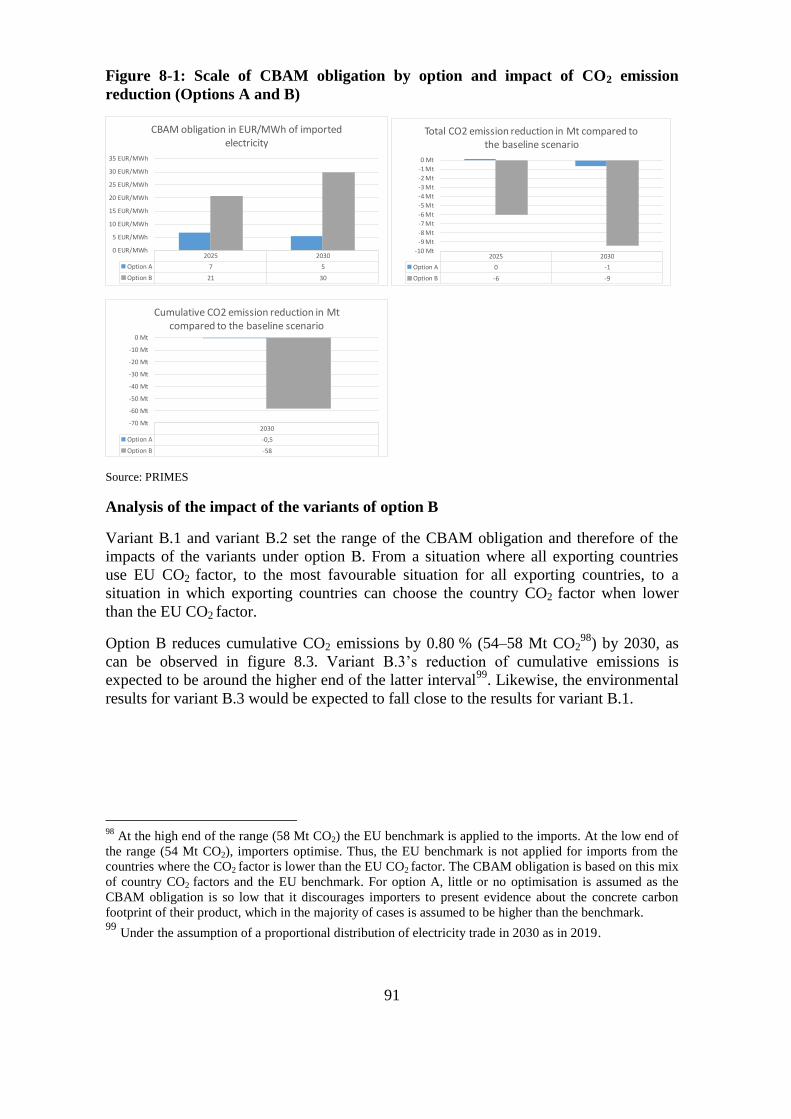
91
Figure 8-1: Scale of CBAM obligation by option and impact of CO2 emission
reduction (Options A and B)
Source: PRIMES
Analysis of the impact of the variants of option B
Variant B.1 and variant B.2 set the range of the CBAM obligation and therefore of the
impacts of the variants under option B. From a situation where all exporting countries
use EU CO2 factor, to the most favourable situation for all exporting countries, to a
situation in which exporting countries can choose the country CO2 factor when lower
than the EU CO2 factor.
Option B reduces cumulative CO2 emissions by 0.80 % (54–58 Mt CO298
) by 2030, as
can be observed in figure 8.3. Variant B.3’s reduction of cumulative emissions is
expected to be around the higher end of the latter interval99
. Likewise, the environmental
results for variant B.3 would be expected to fall close to the results for variant B.1.
98
At the high end of the range (58 Mt CO2) the EU benchmark is applied to the imports. At the low end of
the range (54 Mt CO2), importers optimise. Thus, the EU benchmark is not applied for imports from the
countries where the CO2 factor is lower than the EU CO2 factor. The CBAM obligation is based on this mix
of country CO2 factors and the EU benchmark. For option A, little or no optimisation is assumed as the
CBAM obligation is so low that it discourages importers to present evidence about the concrete carbon
footprint of their product, which in the majority of cases is assumed to be higher than the benchmark. 99
Under the assumption of a proportional distribution of electricity trade in 2030 as in 2019.
2025 2030
Option A 7 5
Option B 21 30
0 EUR/MWh
5 EUR/MWh
10 EUR/MWh
15 EUR/MWh
20 EUR/MWh
25 EUR/MWh
30 EUR/MWh
35 EUR/MWh
CBAM obligation in EUR/MWh of imported electricity
2025 2030
Option A 0 -1
Option B -6 -9
-10 Mt
-9 Mt
-8 Mt
-7 Mt
-6 Mt
-5 Mt
-4 Mt
-3 Mt
-2 Mt
-1 Mt
0 Mt
Total CO2 emission reduction in Mt compared to the baseline scenario
2030
Option A -0,5
Option B -58
-70 Mt
-60 Mt
-50 Mt
-40 Mt
-30 Mt
-20 Mt
-10 Mt
0 Mt
Cumulative CO2 emission reduction in Mt compared to the baseline scenario
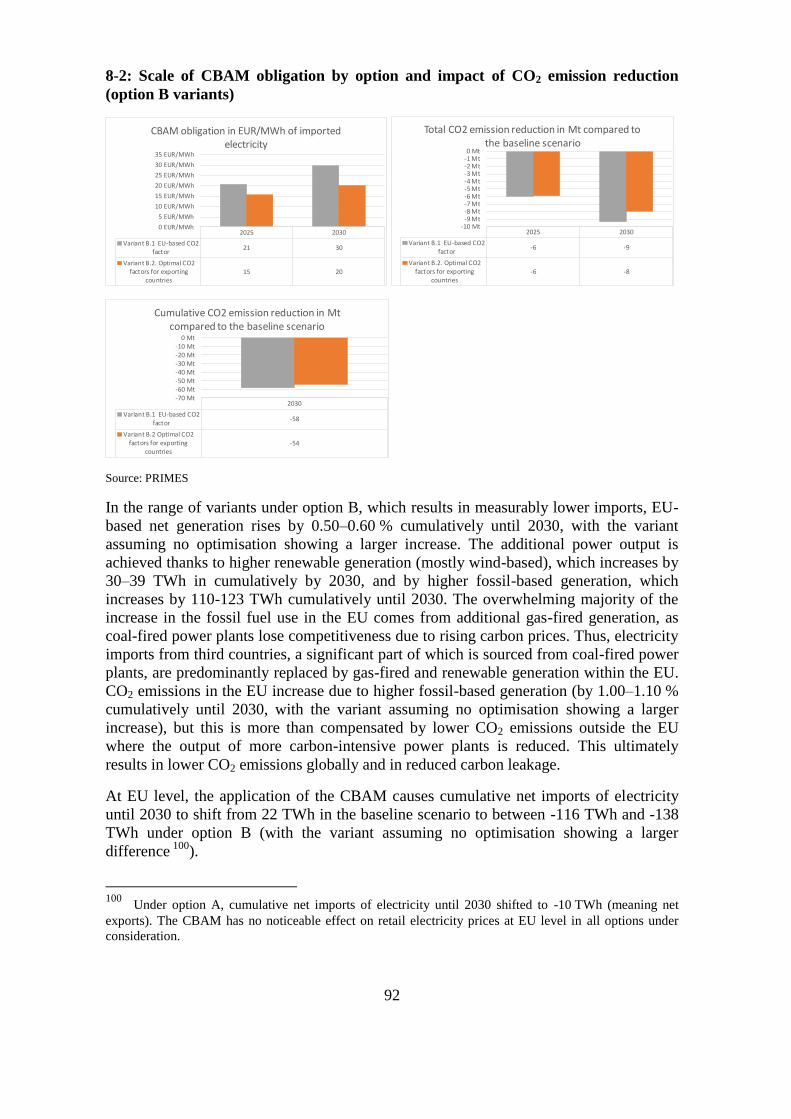
92
8-2: Scale of CBAM obligation by option and impact of CO2 emission reduction
(option B variants)
Source: PRIMES
In the range of variants under option B, which results in measurably lower imports, EU-
based net generation rises by 0.50–0.60 % cumulatively until 2030, with the variant
assuming no optimisation showing a larger increase. The additional power output is
achieved thanks to higher renewable generation (mostly wind-based), which increases by
30–39 TWh in cumulatively by 2030, and by higher fossil-based generation, which
increases by 110-123 TWh cumulatively until 2030. The overwhelming majority of the
increase in the fossil fuel use in the EU comes from additional gas-fired generation, as
coal-fired power plants lose competitiveness due to rising carbon prices. Thus, electricity
imports from third countries, a significant part of which is sourced from coal-fired power
plants, are predominantly replaced by gas-fired and renewable generation within the EU.
CO2 emissions in the EU increase due to higher fossil-based generation (by 1.00–1.10 %
cumulatively until 2030, with the variant assuming no optimisation showing a larger
increase), but this is more than compensated by lower CO2 emissions outside the EU
where the output of more carbon-intensive power plants is reduced. This ultimately
results in lower CO2 emissions globally and in reduced carbon leakage.
At EU level, the application of the CBAM causes cumulative net imports of electricity
until 2030 to shift from 22 TWh in the baseline scenario to between -116 TWh and -138
TWh under option B (with the variant assuming no optimisation showing a larger
difference 100
).
100
Under option A, cumulative net imports of electricity until 2030 shifted to -10 TWh (meaning net
exports). The CBAM has no noticeable effect on retail electricity prices at EU level in all options under
consideration.
2025 2030
Variant B.1 EU-based CO2factor
21 30
Variant B.2. Optimal CO2factors for exporting
countries15 20
0 EUR/MWh
5 EUR/MWh
10 EUR/MWh
15 EUR/MWh
20 EUR/MWh
25 EUR/MWh
30 EUR/MWh
35 EUR/MWh
CBAM obligation in EUR/MWh of imported electricity
2025 2030
Variant B.1 EU-based CO2factor
-6 -9
Variant B.2. Optimal CO2factors for exporting
countries-6 -8
-10 Mt-9 Mt-8 Mt-7 Mt-6 Mt-5 Mt-4 Mt-3 Mt-2 Mt-1 Mt0 Mt
Total CO2 emission reduction in Mt compared to the baseline scenario
2030
Variant B.1 EU-based CO2factor
-58
Variant B.2 Optimal CO2factors for exporting
countries-54
-70 Mt-60 Mt-50 Mt-40 Mt-30 Mt-20 Mt-10 Mt
0 Mt
Cumulative CO2 emission reduction in Mt compared to the baseline scenario
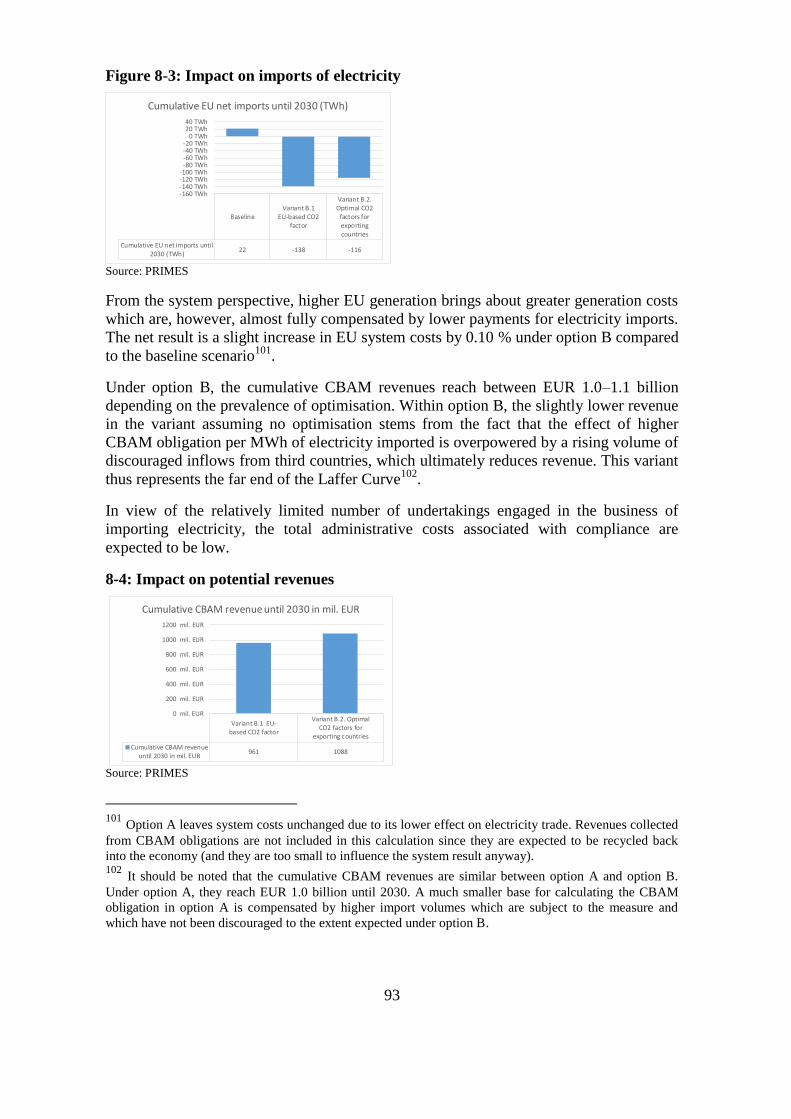
93
Figure 8-3: Impact on imports of electricity
Source: PRIMES
From the system perspective, higher EU generation brings about greater generation costs
which are, however, almost fully compensated by lower payments for electricity imports.
The net result is a slight increase in EU system costs by 0.10 % under option B compared
to the baseline scenario101
.
Under option B, the cumulative CBAM revenues reach between EUR 1.0–1.1 billion
depending on the prevalence of optimisation. Within option B, the slightly lower revenue
in the variant assuming no optimisation stems from the fact that the effect of higher
CBAM obligation per MWh of electricity imported is overpowered by a rising volume of
discouraged inflows from third countries, which ultimately reduces revenue. This variant
thus represents the far end of the Laffer Curve102
.
In view of the relatively limited number of undertakings engaged in the business of
importing electricity, the total administrative costs associated with compliance are
expected to be low.
8-4: Impact on potential revenues
Source: PRIMES
101
Option A leaves system costs unchanged due to its lower effect on electricity trade. Revenues collected
from CBAM obligations are not included in this calculation since they are expected to be recycled back
into the economy (and they are too small to influence the system result anyway). 102
It should be noted that the cumulative CBAM revenues are similar between option A and option B.
Under option A, they reach EUR 1.0 billion until 2030. A much smaller base for calculating the CBAM
obligation in option A is compensated by higher import volumes which are subject to the measure and
which have not been discouraged to the extent expected under option B.
BaselineVariant B.1
EU-based CO2factor
Variant B.2.Optimal CO2
factors forexportingcountries
Cumulative EU net imports until2030 (TWh)
22 -138 -116
-160 TWh-140 TWh-120 TWh-100 TWh
-80 TWh-60 TWh-40 TWh-20 TWh
0 TWh20 TWh40 TWh
Cumulative EU net imports until 2030 (TWh)
Variant B.1 EU-based CO2 factor
Variant B.2. OptimalCO2 factors for
exporting countries
Cumulative CBAM revenueuntil 2030 in mil. EUR
961 1088
0 mil. EUR
200 mil. EUR
400 mil. EUR
600 mil. EUR
800 mil. EUR
1000 mil. EUR
1200 mil. EUR
Cumulative CBAM revenue until 2030 in mil. EUR
94
Most preferred option
The modelling results point towards option B as the better option than option A since it
delivers a better outcome in overall terms of environmental benefits, which are the
overriding priority of the measure in question. While displaying superior qualities as far
as preventing carbon leakage is concerned, option B and its variants also do not introduce
sizeable additional system costs compared to option A. Variant B.3 appears the most
preferred because it reflects better the specific country’s carbon intensity of the exported
electricity and introduces an incentive for countries to invest in a cleaner power mix.
95
ANNEX 9: ENERGY SYSTEM IMPACT OF AN IMPORT CBAM ON MATERIALS (IN THE
FORM OF A NOTIONAL ETS BASED ON EXPORTING COUNTRIES’ AVERAGE103
)
The current scope of CBAM focuses on energy intensive goods and its application has an
impact on their production and price. This may have repercussions in the energy system.
Current demand centres may change, the fuels required to satisfy the demand may be
different and energy prices and costs may be impacted, too. In a longer-term perspective,
products used for the energy transition (e.g. wind turbines, solar panel) could be affected
due to the imposed adjustments on the primary materials required.
The analysis shows that these effects are rather limited at the EU level. Gross Inland
Consumption in 2030 is virtually the same (-0.02 %) in a scenario with import CBAM
compared to the MIX55 scenario104
. Final energy consumption shows a similar result
(+0.01 % in 2030). The fuel mix changes as some energy intensive goods are now
produced within the Member States that would otherwise have been produced outside the
EU. In final energy consumption, the most notable change is a slightly stronger shift
from coal (-0.47 % in 2030) and towards distributed heat (+0.47 % in 2030) and
hydrogen (after 2030). This shows that CBAM would have a positive impact in the
uptake of fuels that facilitate a more decarbonised and flexible energy system,
particularly for industry (also the sector strongest affected in energy terms by the
measure). However, given the increase in overall consumption, the shares of the fuels in
the energy mix stay the same. Because of the limited impacts on EU level, system costs
are expected to remain largely the same (average 2021-2030), also in relation to GDP.
Likewise, energy investments and energy related expenditures remain largely the same.
On a Member State level, these effects naturally depend on the relative importance of
particular industrial sectors in the overall energy consumption.
There is a limited impact on the products enabling the energy transition. The EU’s
production of batteries, electric vehicle transport equipment, equipment for wind power
technology, equipment for photovoltaics and equipment for Carbon Capture and
Sequestration (CCS) power technology decrease slightly compared to MIX55. The
changes are in the range of -0.27 % to -0.79 % in 2030. However, CBAM is beneficial
for the less mature clean technologies (hydrogen +0.33 %, and clean gas +0.31 % in
2030). Positive effects come mainly from increased domestic demand while negative
effects originate mostly in a decrease in exports of these products.
103
The results presented in this section are based on an energy system modelling exercise with FIMM,
GEM-E3 and PRIMES models. While based on similar assumptions, the results are not identical due to
differences in the models. 104
The MIX55 scenario includes free allocation while the CBAM scenario assumes the removal of free
allocation. The CBAM scenario modelled in this exercise is closest to option 3 of this impact assessment.
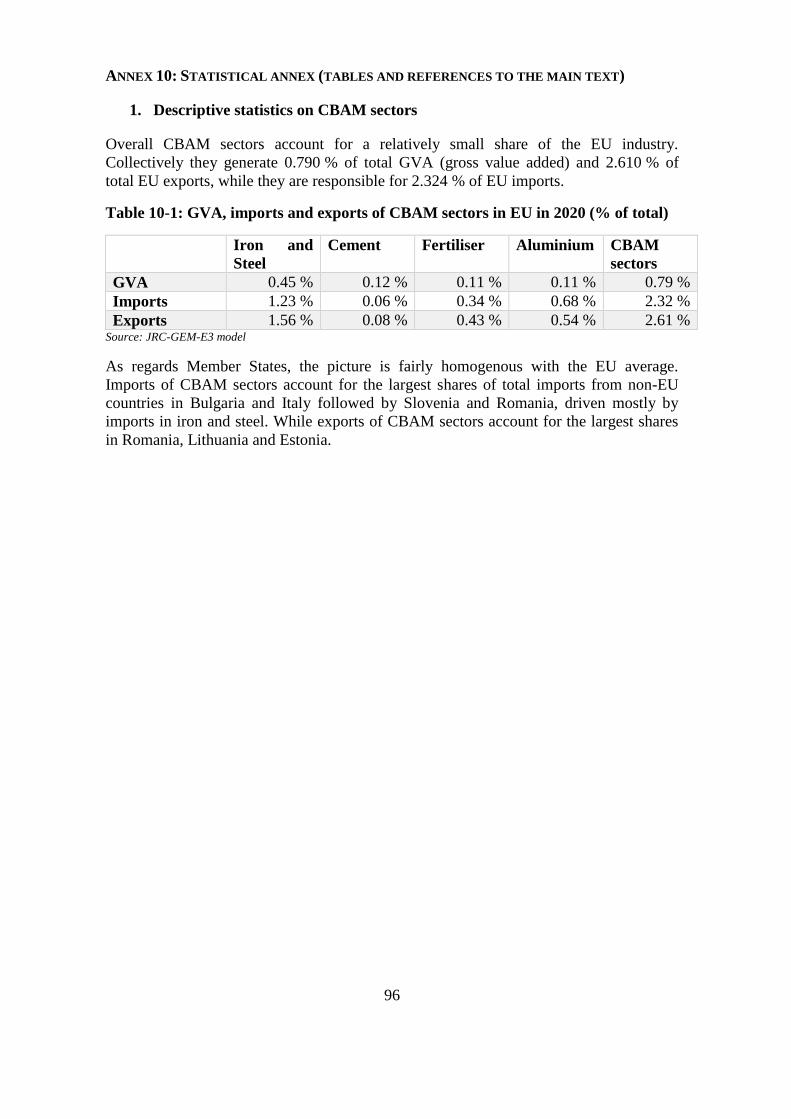
96
ANNEX 10: STATISTICAL ANNEX (TABLES AND REFERENCES TO THE MAIN TEXT)
1. Descriptive statistics on CBAM sectors
Overall CBAM sectors account for a relatively small share of the EU industry.
Collectively they generate 0.790 % of total GVA (gross value added) and 2.610 % of
total EU exports, while they are responsible for 2.324 % of EU imports.
Table 10-1: GVA, imports and exports of CBAM sectors in EU in 2020 (% of total)
Iron and
Steel
Cement Fertiliser Aluminium CBAM
sectors
GVA 0.45 % 0.12 % 0.11 % 0.11 % 0.79 %
Imports 1.23 % 0.06 % 0.34 % 0.68 % 2.32 %
Exports 1.56 % 0.08 % 0.43 % 0.54 % 2.61 % Source: JRC-GEM-E3 model
As regards Member States, the picture is fairly homogenous with the EU average.
Imports of CBAM sectors account for the largest shares of total imports from non-EU
countries in Bulgaria and Italy followed by Slovenia and Romania, driven mostly by
imports in iron and steel. While exports of CBAM sectors account for the largest shares
in Romania, Lithuania and Estonia.

97
Table 10-2: GVA, imports and exports of CBAM sectors in EU Member States in
2020 (as % of total)
Share of CBAM sectors in
imports from non-EU
countries
Share of CBAM sectors in
exports to non-EU
countries
Share of CBAM sectors’
GVA in total GVA
AUT 3.2 % 3.6 % 1.4 %
BEL 3.5 % 4.1 % 0.7 %
BGR 12.1 % 3.8 % 1.4 %
CYP 1.0 % 1.8 % 0.7 %
CZE 2.4 % 2.4 % 0.6 %
DEU 2.3 % 2.4 % 0.8 %
DNK 2.3 % 1.4 % 0.9 %
ESP 2.7 % 3.8 % 0.6 %
EST 4.9 % 4.8 % 0.8 %
FIN 3.5 % 4.0 % 1.3 %
FRA 1.5 % 2.2 % 1.1 %
GRC 2.6 % 4.0 % 0.6 %
HUN 2.5 % 1.4 % 0.8 %
IRL 1.3 % 1.2 % 0.7 %
ITA 6.5 % 4.4 % 0.5 %
LTU 4.4 % 5.1 % 1.0 %
LUX 0.3 % 3.3 % 0.6 %
LVA 3.0 % 2.3 % 0.7 %
MLT 0.6 % 0.5 % 0.5 %
NLD 2.0 % 2.2 % 0.5 %
POL 3.9 % 3.0 % 0.9 %
PRT 4.3 % 3.8 % 0.8 %
SVK 4.4 % 3.8 % 0.8 %
SVN 5.3 % 2.8 % 1.2 %
SWE 2.5 % 3.5 % 1.5 %
ROU 6.3 % 6.3 % 1.2 %
CRO 6.7 % 4.6 % 0.9 %
EU27 2.3 % 2.6 % 0.8 %
Source: JRC-GEM-E3 model
When it comes to distribution of imports and exports by Member State, data for 2020
indicate that Italy, Germany, Belgium are leading importers of iron and steel, Germany,
France, Italy and the Netherlands are the leading importers of cement, Germany,
Belgium, France and Italy are the leading importers of fertilisers, and Germany, Italy,
France and the Netherlands are the leading importers of aluminium.
On the export side Germany, France, Italy and Belgium are the biggest exporters of iron
and steel, Germany, Spain, Italy, Denmark and Ireland are the biggest exporters of
cement, Belgium, Germany and Ireland are the biggest exporters of fertilisers and
Germany, Italy, and Poland are the biggest exporters of aluminium.
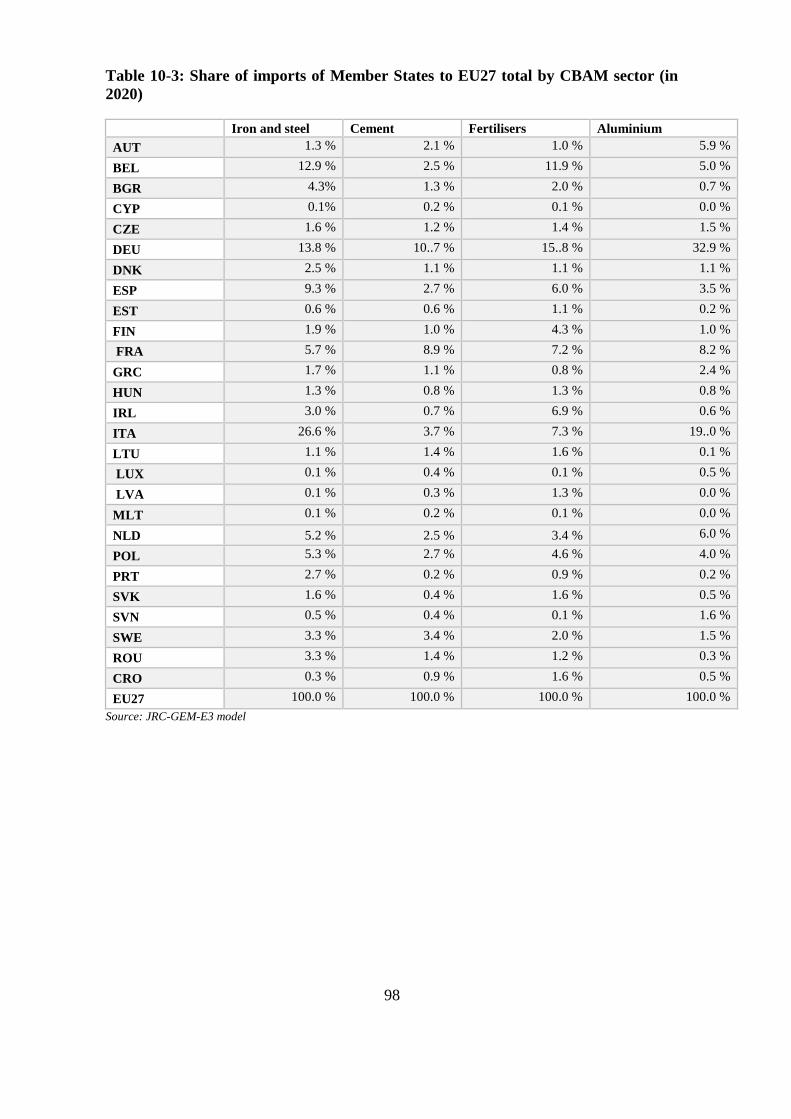
98
Table 10-3: Share of imports of Member States to EU27 total by CBAM sector (in
2020)
Iron and steel Cement Fertilisers Aluminium
AUT 1.3 % 2.1 % 1.0 % 5.9 %
BEL 12.9 % 2.5 % 11.9 % 5.0 %
BGR 4.3% 1.3 % 2.0 % 0.7 %
CYP 0.1% 0.2 % 0.1 % 0.0 %
CZE 1.6 % 1.2 % 1.4 % 1.5 %
DEU 13.8 % 10..7 % 15..8 % 32.9 %
DNK 2.5 % 1.1 % 1.1 % 1.1 %
ESP 9.3 % 2.7 % 6.0 % 3.5 %
EST 0.6 % 0.6 % 1.1 % 0.2 %
FIN 1.9 % 1.0 % 4.3 % 1.0 %
FRA 5.7 % 8.9 % 7.2 % 8.2 %
GRC 1.7 % 1.1 % 0.8 % 2.4 %
HUN 1.3 % 0.8 % 1.3 % 0.8 %
IRL 3.0 % 0.7 % 6.9 % 0.6 %
ITA 26.6 % 3.7 % 7.3 % 19..0 %
LTU 1.1 % 1.4 % 1.6 % 0.1 %
LUX 0.1 % 0.4 % 0.1 % 0.5 %
LVA 0.1 % 0.3 % 1.3 % 0.0 %
MLT 0.1 % 0.2 % 0.1 % 0.0 %
NLD 5.2 % 2.5 % 3.4 % 6.0 %
POL 5.3 % 2.7 % 4.6 % 4.0 %
PRT 2.7 % 0.2 % 0.9 % 0.2 %
SVK 1.6 % 0.4 % 1.6 % 0.5 %
SVN 0.5 % 0.4 % 0.1 % 1.6 %
SWE 3.3 % 3.4 % 2.0 % 1.5 %
ROU 3.3 % 1.4 % 1.2 % 0.3 %
CRO 0.3 % 0.9 % 1.6 % 0.5 %
EU27 100.0 % 100.0 % 100.0 % 100.0 %
Source: JRC-GEM-E3 model
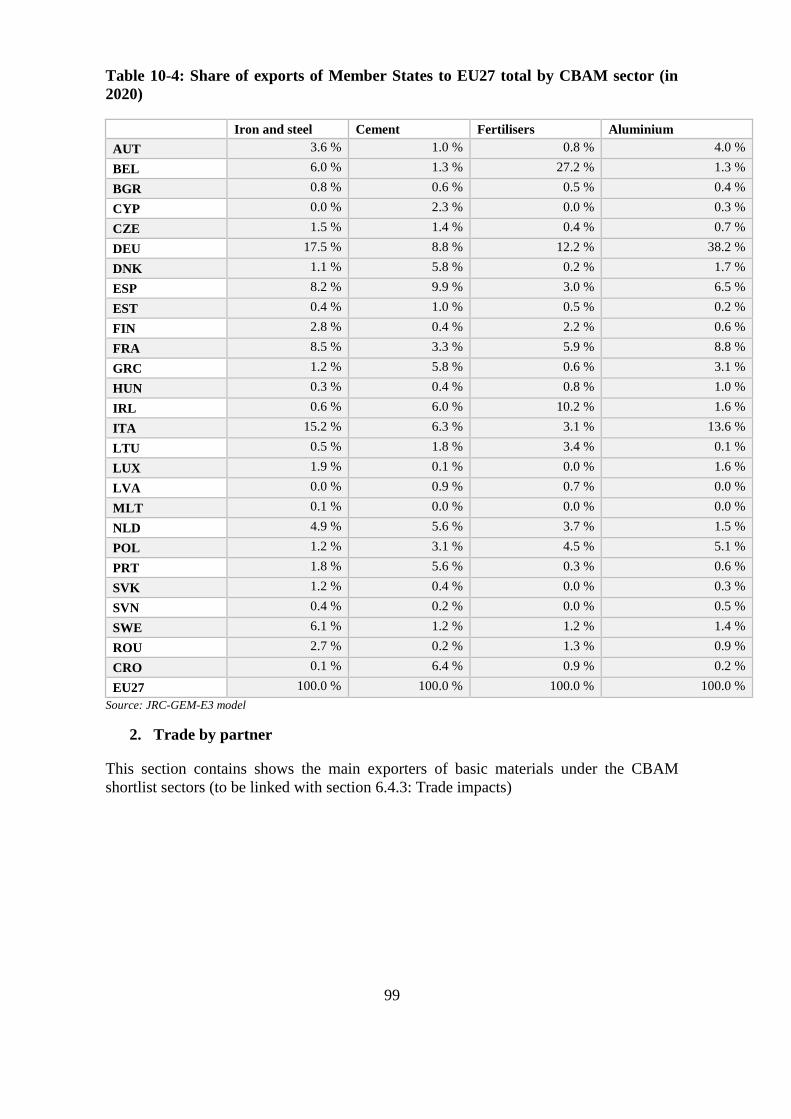
99
Table 10-4: Share of exports of Member States to EU27 total by CBAM sector (in
2020)
Iron and steel Cement Fertilisers Aluminium
AUT 3.6 % 1.0 % 0.8 % 4.0 %
BEL 6.0 % 1.3 % 27.2 % 1.3 %
BGR 0.8 % 0.6 % 0.5 % 0.4 %
CYP 0.0 % 2.3 % 0.0 % 0.3 %
CZE 1.5 % 1.4 % 0.4 % 0.7 %
DEU 17.5 % 8.8 % 12.2 % 38.2 %
DNK 1.1 % 5.8 % 0.2 % 1.7 %
ESP 8.2 % 9.9 % 3.0 % 6.5 %
EST 0.4 % 1.0 % 0.5 % 0.2 %
FIN 2.8 % 0.4 % 2.2 % 0.6 %
FRA 8.5 % 3.3 % 5.9 % 8.8 %
GRC 1.2 % 5.8 % 0.6 % 3.1 %
HUN 0.3 % 0.4 % 0.8 % 1.0 %
IRL 0.6 % 6.0 % 10.2 % 1.6 %
ITA 15.2 % 6.3 % 3.1 % 13.6 %
LTU 0.5 % 1.8 % 3.4 % 0.1 %
LUX 1.9 % 0.1 % 0.0 % 1.6 %
LVA 0.0 % 0.9 % 0.7 % 0.0 %
MLT 0.1 % 0.0 % 0.0 % 0.0 %
NLD 4.9 % 5.6 % 3.7 % 1.5 %
POL 1.2 % 3.1 % 4.5 % 5.1 %
PRT 1.8 % 5.6 % 0.3 % 0.6 %
SVK 1.2 % 0.4 % 0.0 % 0.3 %
SVN 0.4 % 0.2 % 0.0 % 0.5 %
SWE 6.1 % 1.2 % 1.2 % 1.4 %
ROU 2.7 % 0.2 % 1.3 % 0.9 %
CRO 0.1 % 6.4 % 0.9 % 0.2 %
EU27 100.0 % 100.0 % 100.0 % 100.0 %
Source: JRC-GEM-E3 model
2. Trade by partner
This section contains shows the main exporters of basic materials under the CBAM
shortlist sectors (to be linked with section 6.4.3: Trade impacts)

100
Figure 10-1: Main exporters of Iron and steel to EU27 - 2019
Source: Commission analysis based on data from Eurostat COMEXT
Figure 10-2: Main exporters of aluminium to EU27 - 2019
Source: Commission analysis based on data from Eurostat COMEXT
0 1000000 2000000 3000000 4000000 5000000
RussiaUkraineTurkeyChina
United KingdomBrazil
South KoreaIndia
SwitzerlandTaiwanNorwayBelarus
IranSerbia
MoldovaBosnia-Herzegovina
TunisiaMexico
VietnamNorth Macedonia
OmanVenezuela
EgyptMontenegro
United Arab EmiratesCanada
USAJapan
AustraliaSaudi Arabia
4849141 3336099
1685174 1511663
1367446 847173 837286
801140 336338
307436 301676
173564 137374 134488 125816 120149 97452 94294 80745 80583 66146 54510 50980 41656 39551 37604 37370 27037 18043 14359
Main exporters of iron and steel to EU27 (in tons)
tons
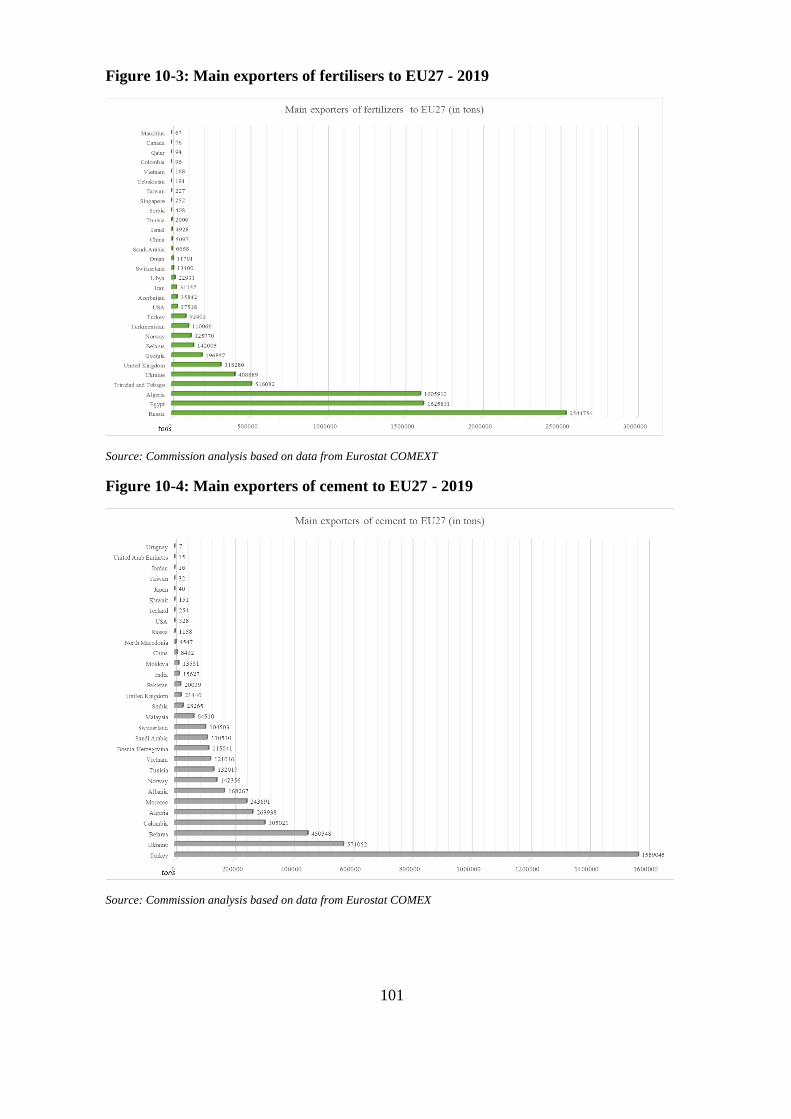
101
Figure 10-3: Main exporters of fertilisers to EU27 - 2019
Source: Commission analysis based on data from Eurostat COMEXT
Figure 10-4: Main exporters of cement to EU27 - 2019
Source: Commission analysis based on data from Eurostat COMEX
102
3. Distributional impacts
3.1 Methodological issues
Input microdata
This analysis uses Euromod’s ITT extension and microdata from two household surveys:
- The European Union Statistics on Income and Living Conditions database, EU-
SILC, which contains information on household income and other household- and
individual-level characteristics
- and the EU Household Budget Surveys, from where information on household
consumption expenditures at the 4 digits-COICOP categories of goods/services is
extracted.
The Euromod’s ITT extension uses as input a database obtained from matching these two
surveys, in order to compute indirect tax liabilities (VAT and specific excise duties) for
each household. These are calculated on top of the direct taxes, social contributions and
cash benefits simulated by the core Euromod model.
Link between GEM-E3 and Euromod
First, the macroeconomic impacts of the CBAM scenarios are simulated in the JRC-
GEM-E3 macro model. Then, in order to study the distributional impacts of the CBAM
on households at the micro level, key variables from the macro simulation are used to
feed the micro model. By linking the two models in this way, the distributional analysis
at the micro level is able to account for the economy-wide impact of the CBAM under
consideration, capturing the effects of the policy option not only through its direct impact
on the tax burden, but also through its broader implications on consumer prices and
household incomes.
It is important in this sense to mention the variables that are passed on from the macro
model JRC-GEM-E3 to the micro model Euromod, as this can help interpret the
microsimulation results. Firstly, on the expenditure side, Euromod is fed with the
consumer price changes relative to the MIX-full auctioning scenario induced by the
relevant CBAM option, as simulated by JRC-GEM-E3. This concerns 14 aggregate
consumption categories based on COICOP groups, which are generated using
consumption matrices embedded in the JRC-GEM-E3 model105
. Since expenditures are
imputed for each household at the commodity level, the mapping into these 14 categories
only requires aggregation in Euromod. These price changes include both direct effects of
carbon pricing and indirect price changes through inputs along the supply chain.
Secondly, on the household income side, the relative changes to the baseline for both
labour and capital income also feed the microsimulation. In this way, the economic
environment of Euromod is approximated to the one foreseen by the JRC-GEM-E3
model.
105 The 14 categories are: food beverages and tobacco, clothing and footwear, housing and water charges, fuels and
power, household equipment and operation excluding heating and cooking appliances, heating and cooking appliances,
medical care and health, purchase of vehicles, operation of personal transport equipment, transport services,
communication, recreational services, miscellaneous goods and services and education.
103
All policy options simulated in the macro model assume the recycling of revenues from
the CBAM based on a reduction of labour taxes to ensure budget neutrality within the
JRC-GEM-E3 environment106
. This is also reflected in the micro modelling through both
the direct effect of the CBAM on (labour and capital) incomes as mentioned above, and
the indirect effect from the recycling of CBAM revenues.
Drawing on this input from the JRC-GEM-E3 model, the distributional analysis is
performed in Euromod by comparing for each considered CBAM option the adjusted
disposable income (i.e. the disposable income net of indirect taxes) of households, by
deciles, against the baseline. The baseline scenario in Euromod refers to the tax-benefit
policy system in place as in 2019 in the Member State under consideration.
Furthermore, the impact of each CBAM scenario on household budgets, across the
income distribution, is disentangled across two effects:
- The ‘price effect’, which captures the distributional effect of the CBAM scenario
under analysis arising only from the predicted changes in consumer prices.
- The ‘price and income effect’, which adds to the price effect, the predicted
changes in market income, which includes the recycling of CBAM revenue
3.2 Overall results
Microsimulations show that the CBAM options under analysis are regressive albeit the
impacts are very small. The macro-simulated impact on labour/capital income and
consumer prices are such that richer households would experience the largest increase (or
lowest declines) of adjusted disposable income (disposable income after indirect taxes),
while the poorest are often the most adversely affected. The distributive impact depends
on the policy option and largely differs across countries.
In general, the three CBAM options considered show the following impacts on
household incomes across the income distribution, for each of the two drivers (price and
income, in both cases including the compensation mechanism):
i) A negative and regressive ‘price effect’. All the scenarios considered drive a
price rise in a number of consumption categories, mainly in transport, fuels
and power, as well as heating. Although prices of other categories are
expected to decrease (mostly in services related with housing and water,
communication, recreational services and education), overall, household
adjusted disposable incomes are expected to fall across the whole income
distribution through the price effect. In most countries, CBAM is regressive,
as this affects more heavily households at the bottom of the income
distribution, for their income share of consumption is notably larger.
ii) A positive and regressive ‘income effect’. All the options generally lead to an
increase of labour and capital income, which benefits more the households in
the second half of the income distribution.107
Differently from the ‘price
106
As emphasized earlier this approach ensures budget neutrality for modelling purposes, rather than defining how
additional revenues from CBAM as an own resource could be used. 107 It is worth noting that surveys data, such as EU-SILC, measure labour income much more accurately than capital
income. Therefore, changes in labour-earning are the main driver of the overall income effects in our analysis.
104
effect’, the ‘income effect’ produces a positive impact on household adjusted
disposable incomes across the board. However, it is regressive: poorer
households benefit relatively less, since they rely more on replacement
income (such as pensions or unemployment benefits) or non-contributory
cash benefits (such as social assistance). The revenue recycling possibly
reinforces this regressivity, since many households at the bottom do not pay
labour taxes, so they cannot benefit from this compensatory measure.
Nevertheless, the magnitude of the overall distributional impacts remains very
small.
The overall impact of all the CBAM options under consideration (cum the compensation
mechanism) is however very small. That is because the expected changes in prices and
incomes coming from the JRC-GEM-E3 model are very small and so is their impact on
household adjusted disposable income. For example, for the first decile the impact on
disposable income ranges from -0.11 % (Lithuania, option 6) to 0.07 % (Lithuania,
options 1 and 2). Beyond the first decile, the largest negative impact across all countries
and scenarios is observed in Greece and Romania, in their second decile, in option 6 (of
about -0.06 %), while the largest positive impact is observed in Belgium (options 1
and 2, 9th decile: 0.24 %).
Options 1 and 2 have the lowest estimated impact on poorer household incomes, while
options 4 and 6 display a larger impact. In these latter scenarios, the worst affected
households are those in the first decile who experience a decrease in adjusted disposable
income between -0.15-2.1 % (option 4, in Lithuania, Slovakia and Romania) and of
0.1 % (option 6, in Lithuania, Romania, Germany and Greece). On the other hand, in
option 1/2 the largest fall in adjusted disposable income for households in the first decile
is about a fifth of it (i.e. about -0.015 % in Denmark, Finland, France and Slovenia).
Within each CBAM scenario, results substantially vary across countries. This is due to
the different impact that the CBAM produces on prices of each good category and on
incomes in each country. Country disparities are also explained by the different
consumption patterns across the income distribution and the income structure of
households.
3.3 Distributional impacts of each policy option
Impacts of options 1 and 2
Figure 10-5 presents the change in equivalized household adjusted disposable income,
relative to disposable income, resulting from CBAM options 1 and 2.
Each figure groups six countries, which are classified according to the magnitude of the
impact of the CBAM option over the first decile of the income distribution (household
disposable income in the baseline). Figure 10-6(a) shows the group of countries with
mildest impact on the first decile; 10-6(c) the countries with the strongest impact and 10-
5(b) those in between.
Results for the 18 Member States suggest:
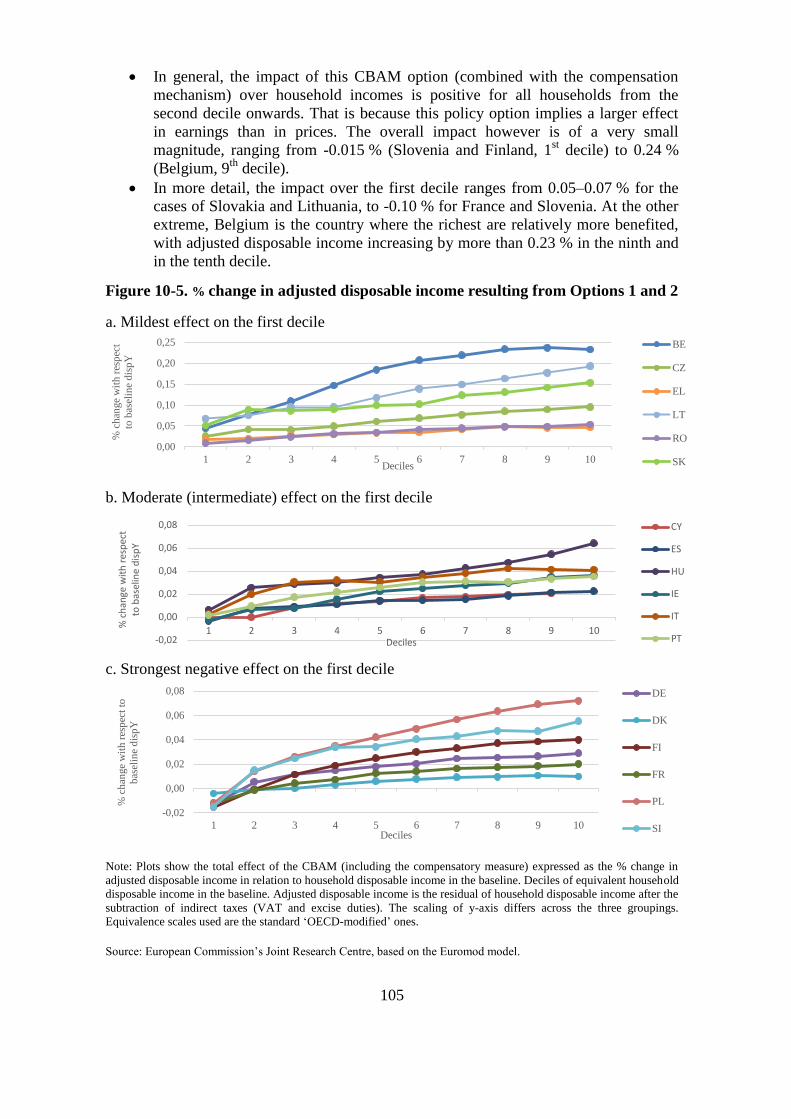
105
-0,02
0,00
0,02
0,04
0,06
0,08
1 2 3 4 5 6 7 8 9 10
% c
han
ge w
ith
res
pec
t to
bas
elin
e d
isp
Y
Deciles
CY
ES
HU
IE
IT
PT
In general, the impact of this CBAM option (combined with the compensation
mechanism) over household incomes is positive for all households from the
second decile onwards. That is because this policy option implies a larger effect
in earnings than in prices. The overall impact however is of a very small
magnitude, ranging from -0.015 % (Slovenia and Finland, 1st decile) to 0.24 %
(Belgium, 9th
decile).
In more detail, the impact over the first decile ranges from 0.05–0.07 % for the
cases of Slovakia and Lithuania, to -0.10 % for France and Slovenia. At the other
extreme, Belgium is the country where the richest are relatively more benefited,
with adjusted disposable income increasing by more than 0.23 % in the ninth and
in the tenth decile.
Figure 10-5. % change in adjusted disposable income resulting from Options 1 and 2
a. Mildest effect on the first decile
b. Moderate (intermediate) effect on the first decile
c. Strongest negative effect on the first decile
Note: Plots show the total effect of the CBAM (including the compensatory measure) expressed as the % change in
adjusted disposable income in relation to household disposable income in the baseline. Deciles of equivalent household
disposable income in the baseline. Adjusted disposable income is the residual of household disposable income after the
subtraction of indirect taxes (VAT and excise duties). The scaling of y-axis differs across the three groupings.
Equivalence scales used are the standard ‘OECD-modified’ ones.
Source: European Commission’s Joint Research Centre, based on the Euromod model.
0,00
0,05
0,10
0,15
0,20
0,25
1 2 3 4 5 6 7 8 9 10
% c
han
ge
wit
h r
esp
ect
to b
asel
ine
dis
pY
Deciles
BE
CZ
EL
LT
RO
SK
-0,02
0,00
0,02
0,04
0,06
0,08
1 2 3 4 5 6 7 8 9 10
% c
han
ge
wit
h r
esp
ect
to
bas
elin
e d
isp
Y
Deciles
DE
DK
FI
FR
PL
SI

106
Figure 10-6: % change in adjusted disposable income resulting from CBAM option
1/2: price and income effects country by country
Note: Plots show the total effect of the CBAM (including the compensatory measure) expressed as the % change in
adjusted disposable income in relation to household disposable income in the baseline. Deciles of equivalent household
disposable income in the baseline. Adjusted disposable income is the residual of household disposable income after the
subtraction of indirect taxes (VAT and excise duties). Equivalence scales used are the standard ‘OECD-modified’ ones.
Source: European Commission’s Joint Research Centre, based on the Euromod model.
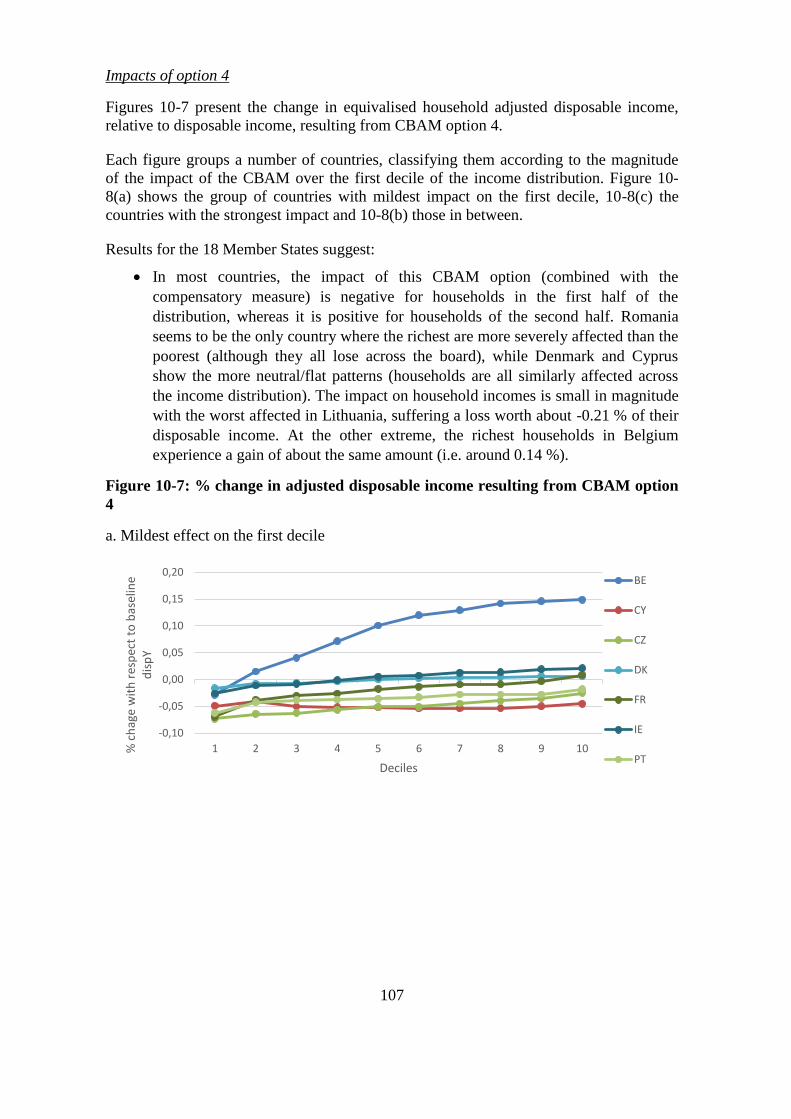
107
Impacts of option 4
Figures 10-7 present the change in equivalised household adjusted disposable income,
relative to disposable income, resulting from CBAM option 4.
Each figure groups a number of countries, classifying them according to the magnitude
of the impact of the CBAM over the first decile of the income distribution. Figure 10-
8(a) shows the group of countries with mildest impact on the first decile, 10-8(c) the
countries with the strongest impact and 10-8(b) those in between.
Results for the 18 Member States suggest:
In most countries, the impact of this CBAM option (combined with the
compensatory measure) is negative for households in the first half of the
distribution, whereas it is positive for households of the second half. Romania
seems to be the only country where the richest are more severely affected than the
poorest (although they all lose across the board), while Denmark and Cyprus
show the more neutral/flat patterns (households are all similarly affected across
the income distribution). The impact on household incomes is small in magnitude
with the worst affected in Lithuania, suffering a loss worth about -0.21 % of their
disposable income. At the other extreme, the richest households in Belgium
experience a gain of about the same amount (i.e. around 0.14 %).
Figure 10-7: % change in adjusted disposable income resulting from CBAM option
4
a. Mildest effect on the first decile
-0,10
-0,05
0,00
0,05
0,10
0,15
0,20
1 2 3 4 5 6 7 8 9 10% c
hag
e w
ith
res
pec
t to
bas
elin
e d
isp
Y
Deciles
BE
CY
CZ
DK
FR
IE
PT
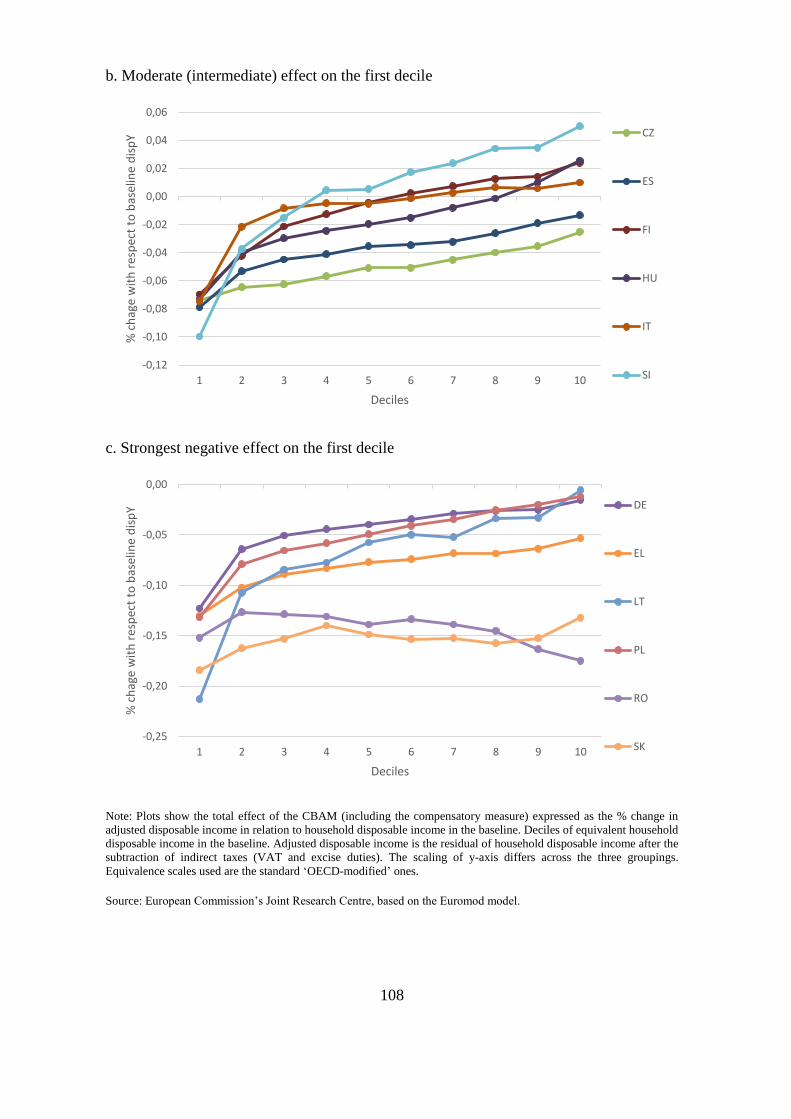
108
b. Moderate (intermediate) effect on the first decile
c. Strongest negative effect on the first decile
Note: Plots show the total effect of the CBAM (including the compensatory measure) expressed as the % change in
adjusted disposable income in relation to household disposable income in the baseline. Deciles of equivalent household
disposable income in the baseline. Adjusted disposable income is the residual of household disposable income after the
subtraction of indirect taxes (VAT and excise duties). The scaling of y-axis differs across the three groupings.
Equivalence scales used are the standard ‘OECD-modified’ ones.
Source: European Commission’s Joint Research Centre, based on the Euromod model.
-0,12
-0,10
-0,08
-0,06
-0,04
-0,02
0,00
0,02
0,04
0,06
1 2 3 4 5 6 7 8 9 10
% c
hag
e w
ith
res
pec
t to
bas
elin
e d
isp
Y
Deciles
CZ
ES
FI
HU
IT
SI
-0,25
-0,20
-0,15
-0,10
-0,05
0,00
1 2 3 4 5 6 7 8 9 10
% c
hag
e w
ith
res
pec
t to
bas
elin
e d
isp
Y
Deciles
DE
EL
LT
PL
RO
SK
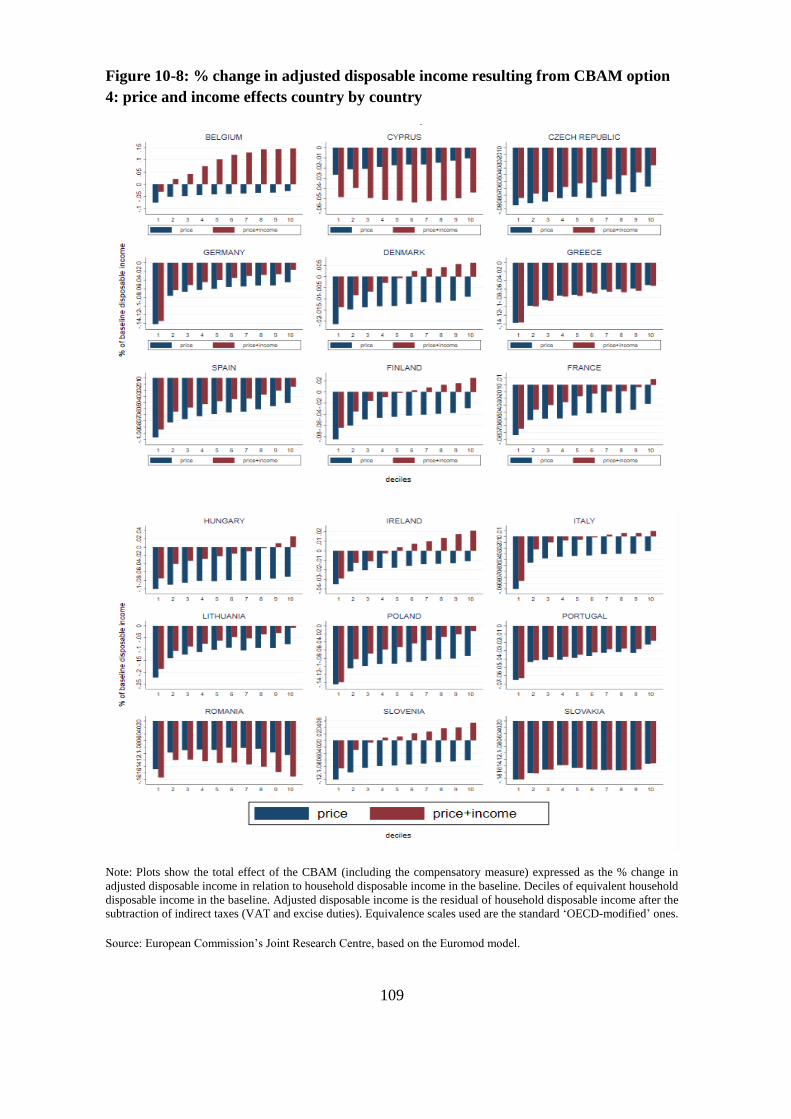
109
Figure 10-8: % change in adjusted disposable income resulting from CBAM option
4: price and income effects country by country
Note: Plots show the total effect of the CBAM (including the compensatory measure) expressed as the % change in
adjusted disposable income in relation to household disposable income in the baseline. Deciles of equivalent household
disposable income in the baseline. Adjusted disposable income is the residual of household disposable income after the
subtraction of indirect taxes (VAT and excise duties). Equivalence scales used are the standard ‘OECD-modified’ ones.
Source: European Commission’s Joint Research Centre, based on the Euromod model.
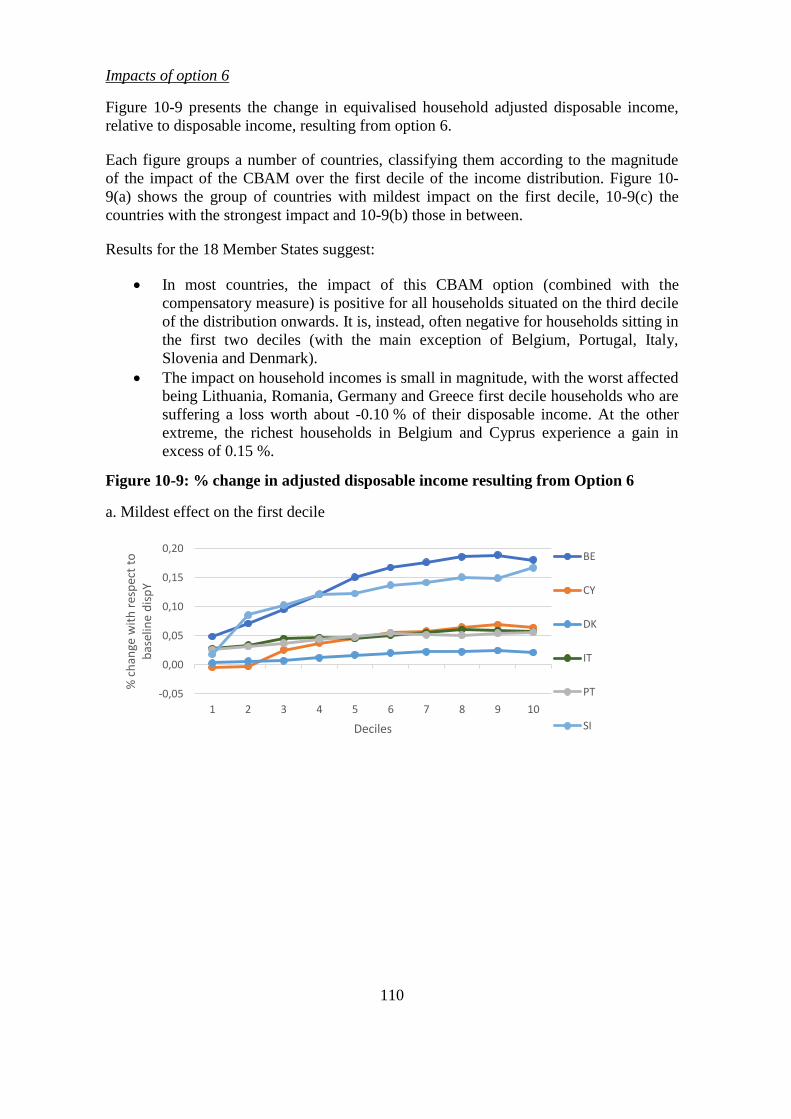
110
Impacts of option 6
Figure 10-9 presents the change in equivalised household adjusted disposable income,
relative to disposable income, resulting from option 6.
Each figure groups a number of countries, classifying them according to the magnitude
of the impact of the CBAM over the first decile of the income distribution. Figure 10-
9(a) shows the group of countries with mildest impact on the first decile, 10-9(c) the
countries with the strongest impact and 10-9(b) those in between.
Results for the 18 Member States suggest:
In most countries, the impact of this CBAM option (combined with the
compensatory measure) is positive for all households situated on the third decile
of the distribution onwards. It is, instead, often negative for households sitting in
the first two deciles (with the main exception of Belgium, Portugal, Italy,
Slovenia and Denmark).
The impact on household incomes is small in magnitude, with the worst affected
being Lithuania, Romania, Germany and Greece first decile households who are
suffering a loss worth about -0.10 % of their disposable income. At the other
extreme, the richest households in Belgium and Cyprus experience a gain in
excess of 0.15 %.
Figure 10-9: % change in adjusted disposable income resulting from Option 6
a. Mildest effect on the first decile
-0,05
0,00
0,05
0,10
0,15
0,20
1 2 3 4 5 6 7 8 9 10
% c
han
ge w
ith
res
pec
t to
b
asel
ine
dis
pY
Deciles
BE
CY
DK
IT
PT
SI

111
b. Moderate (intermediate) effect on the first decile
c. Strongest negative effect on the first decile
Note: Plots show the total effect of the CBAM (including the compensatory measure) expressed as the % change in
adjusted disposable income in relation to household disposable income in the baseline. Deciles of equivalent household
disposable income in the baseline. Adjusted disposable income is the residual of household disposable income after the
subtraction of indirect taxes (VAT and excise duties). The scaling of y-axis differs across the three groupings.
Equivalence scales used are the standard ‘OECD-modified’ ones.
Source: European Commission’s Joint Research Centre, based on the Euromod model.
-0,06
-0,04
-0,02
0,00
0,02
0,04
0,06
0,08
0,10
0,12
1 2 3 4 5 6 7 8 9 10
% c
han
ge w
ith
res
pec
t to
b
asel
ine
dis
pY
Deciles
CZ
ES
FI
FR
HU
IE
-0,15
-0,10
-0,05
0,00
0,05
0,10
0,15
0,20
0,25
1 2 3 4 5 6 7 8 9 10
% c
han
ge w
ith
res
pec
t to
b
asel
ine
dis
pY
Deciles
DE
EL
LT
PL
RO
SK
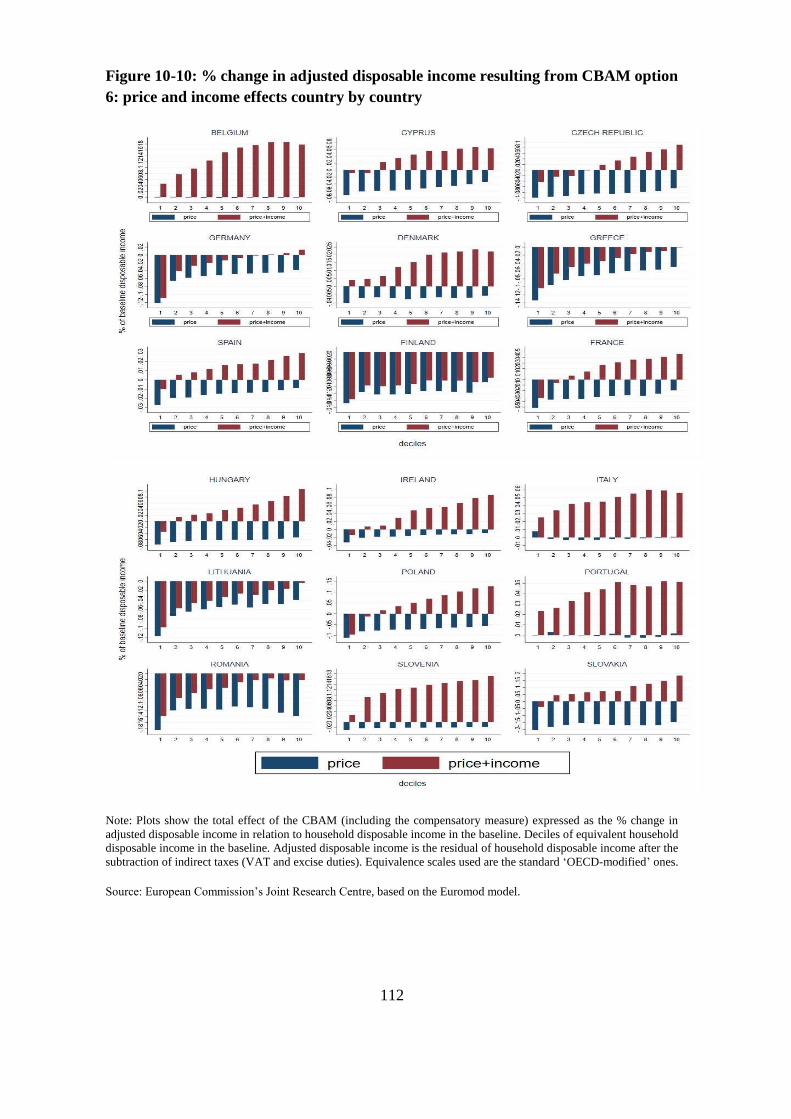
112
Figure 10-10: % change in adjusted disposable income resulting from CBAM option
6: price and income effects country by country
Note: Plots show the total effect of the CBAM (including the compensatory measure) expressed as the % change in
adjusted disposable income in relation to household disposable income in the baseline. Deciles of equivalent household
disposable income in the baseline. Adjusted disposable income is the residual of household disposable income after the
subtraction of indirect taxes (VAT and excise duties). Equivalence scales used are the standard ‘OECD-modified’ ones.
Source: European Commission’s Joint Research Centre, based on the Euromod model.
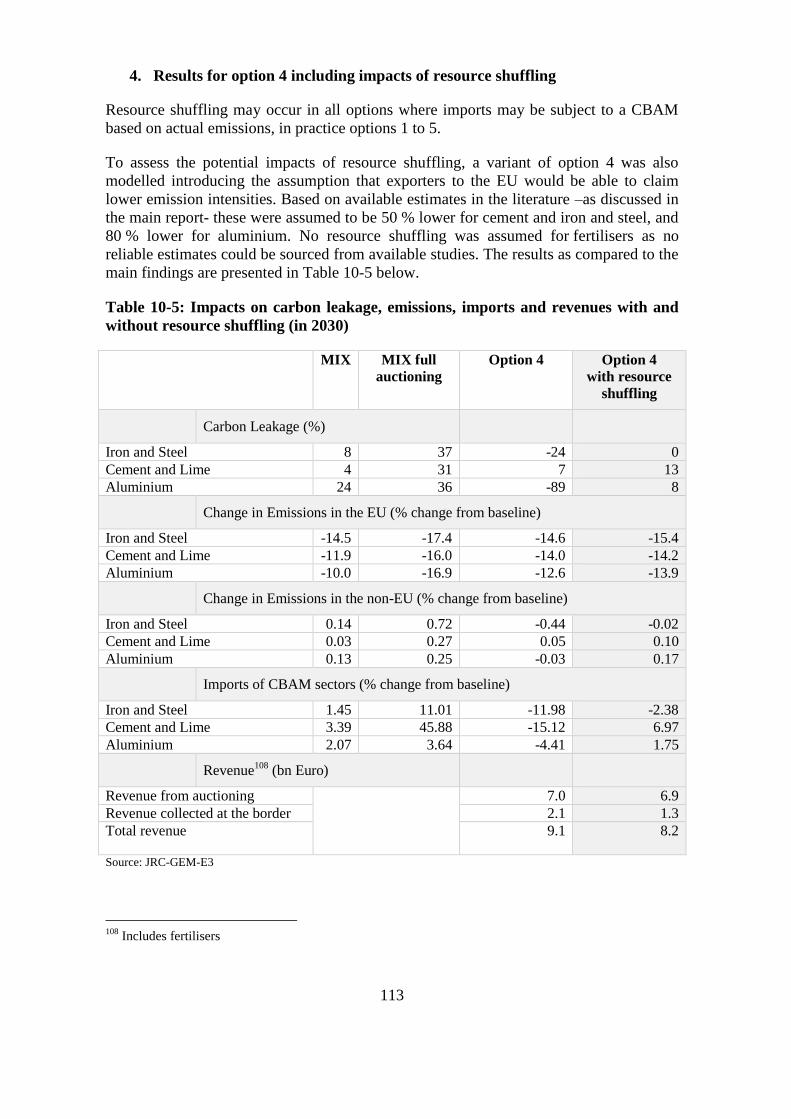
113
4. Results for option 4 including impacts of resource shuffling
Resource shuffling may occur in all options where imports may be subject to a CBAM
based on actual emissions, in practice options 1 to 5.
To assess the potential impacts of resource shuffling, a variant of option 4 was also
modelled introducing the assumption that exporters to the EU would be able to claim
lower emission intensities. Based on available estimates in the literature –as discussed in
the main report- these were assumed to be 50 % lower for cement and iron and steel, and
80 % lower for aluminium. No resource shuffling was assumed for fertilisers as no
reliable estimates could be sourced from available studies. The results as compared to the
main findings are presented in Table 10-5 below.
Table 10-5: Impacts on carbon leakage, emissions, imports and revenues with and
without resource shuffling (in 2030)
MIX MIX full
auctioning
Option 4 Option 4
with resource
shuffling
Carbon Leakage (%)
Iron and Steel 8 37 -24 0
Cement and Lime 4 31 7 13
Aluminium 24 36 -89 8
Change in Emissions in the EU (% change from baseline)
Iron and Steel -14.5 -17.4 -14.6 -15.4
Cement and Lime -11.9 -16.0 -14.0 -14.2
Aluminium -10.0 -16.9 -12.6 -13.9
Change in Emissions in the non-EU (% change from baseline)
Iron and Steel 0.14 0.72 -0.44 -0.02
Cement and Lime 0.03 0.27 0.05 0.10
Aluminium 0.13 0.25 -0.03 0.17
Imports of CBAM sectors (% change from baseline)
Iron and Steel 1.45 11.01 -11.98 -2.38
Cement and Lime 3.39 45.88 -15.12 6.97
Aluminium 2.07 3.64 -4.41 1.75
Revenue108
(bn Euro)
Revenue from auctioning
7.0 6.9
Revenue collected at the border 2.1 1.3
Total revenue 9.1 8.2
Source: JRC-GEM-E3
108
Includes fertilisers
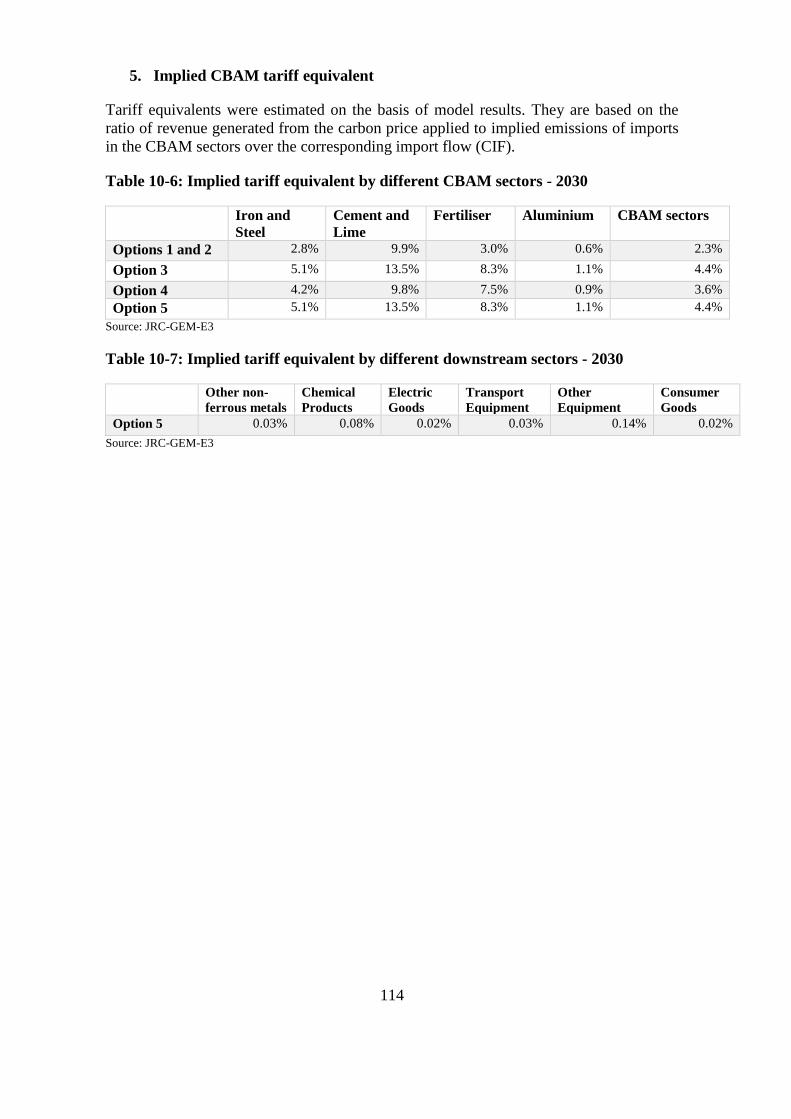
114
5. Implied CBAM tariff equivalent
Tariff equivalents were estimated on the basis of model results. They are based on the
ratio of revenue generated from the carbon price applied to implied emissions of imports
in the CBAM sectors over the corresponding import flow (CIF).
Table 10-6: Implied tariff equivalent by different CBAM sectors - 2030
Iron and
Steel
Cement and
Lime
Fertiliser Aluminium CBAM sectors
Options 1 and 2 2.8% 9.9% 3.0% 0.6% 2.3%
Option 3 5.1% 13.5% 8.3% 1.1% 4.4%
Option 4 4.2% 9.8% 7.5% 0.9% 3.6%
Option 5 5.1% 13.5% 8.3% 1.1% 4.4%
Source: JRC-GEM-E3
Table 10-7: Implied tariff equivalent by different downstream sectors - 2030
Other non-
ferrous metals
Chemical
Products
Electric
Goods
Transport
Equipment
Other
Equipment
Consumer
Goods
Option 5 0.03% 0.08% 0.02% 0.03% 0.14% 0.02%
Source: JRC-GEM-E3
115
ANNEX 11: EVIDENCE OF CARBON LEAKAGE
The existence of carbon leakage is assessed in different ways. A number of studies are
carried out as ex-ante analyses using simulation models. These often find a substantial
risk of carbon leakage in the absence of carbon leakage protection mechanisms such as
free allocation of carbon allowances. Böhringer et al. present the estimation of economy
wide carbon leakage models109
at an average of 10 % to 30 %. The percentage indicates
the share of saved domestic emissions that are offset by increased emissions in other
parts of the world. In a similar way, Branger and Quirion find a typical range of carbon
leakage estimates between 5 % and 25 % with a mean at 14 % without any adjusting
policy110
. In these models, prices are a central factor in the quantification of carbon
leakage as the simulations focus on the determination of price‐ elastic market supply and
demand111
. In other studies, partial equilibrium models are applied to specific industries.
These studies tend to focus on emission-intensive and trade-exposed sectors and find
higher leakage rates for these sectors in particular112
.
Ex-post studies quantify the existence of carbon leakage based on trade flows and
embodied GHG emissions. Many of these types of studies do not find substantial levels
of carbon leakage from existing mechanisms like the EU ETS. Branger et al. did not find
evidence for effects on trade in emission-intensive and trade-exposed sectors caused by
the EU ETS113
. Similarly, Naegele and Zaklan conclude that carbon leakage has not
occurred, based on input-output data and administrative data of the EU ETS114
. In a
review study, Dechezlepretre and Sato conclude the same but also explain that in existing
mechanisms, the cost of the environmental legislation has been relatively low in
comparison to overall trade volume and value115
. If other costs like tariffs and
transportation outweigh the carbon price, relocation of production is not attractive116
.
The differences in results between the types of studies indicate that carbon leakage
protection measures have been successful to date, while higher carbon prices and
109
Böhringer, C., Carbone, J. C., & Rutherford, T. F., ‘Embodied Carbon Tariffs’, The Scandinavian
Journal of Economics, 120(1), 2018, pp.183–210. https://doi.org/10.1111/sjoe.12211 110
Branger, F., & Quirion, P., ‘Would border carbon adjustments prevent carbon leakage and heavy
industry competitiveness losses? Insights from a meta-analysis of recent economic studies’, Ecological
Economics, Vol 99, 2014, pp.29–39. https://doi.org/10.1016/j.ecolecon.2013.12.010 111
Böhringer, C., Carbone, J. C., & Rutherford, T. F., ‘Embodied Carbon Tariffs’, The Scandinavian
Journal of Economics, 120(1), 2018, pp.183–210. https://doi.org/10.1111/sjoe.12211 112
Demailly, D., & Quirion, P., ‘European Emission Trading Scheme and competitiveness: A case study
on the iron and steel industry’, Energy Economics, 30(4), 2008, pp. 2009–2027.
https://doi.org/10.1016/j.eneco.2007.01.020 113
Branger F., Quirion, P., & Chevallier, J., ‘Carbon Leakage and Competitiveness of Cement and Steel
Industries Under the EU ETS: Much Ado About Nothing’, The Energy Journal, 37(3), 2016, pp. 109–135.
https://doi.org/10.5547/01956574.37.3.fbra 114
Naegele, H., & Zaklan, A., ‘Does the EU ETS cause carbon leakage in European manufacturing?’
Journal of Environmental Economics and Management, 93, 2019, pp. 125–147.
https://doi.org/10.1016/j.jeem.2018.11.004 115
Dechezleprêtre, A., & and Sato, M., ‘The Impacts of Environmental Regulations on Competitiveness’,
Review of Environmental and Economics and Policy, vol. 11(2), 2017, pp. 183-206. 116
Naegele, H., & Zaklan, A., ‘Does the EU ETS cause carbon leakage in European manufacturing?’
Journal of Environmental Economics and Management, 93, 2019, pp. 125–147.
https://doi.org/10.1016/j.jeem.2018.11.004
116
declining free allocation can result in an increased leakage risk and thus alter the results.
These considerations align the results of ex-ante and ex-post studies by explaining the
differences. Ex-ante studies often assume the absence of carbon-leakage protection
mechanisms. However, policy makers have always accompanied carbon pricing
mechanisms with special provisions, such as, free allowance allocation or carbon tax
exemptions, to avoid the risk of carbon leakage. In ex-post studies of existing carbon
pricing mechanisms, these leakage protection measures are therefore included.
Additionally, analytic and empirical evidence shows that as a result of the existing
leakage protection mechanisms, the carbon price signal has been significantly reduced117
.
117
Neuhoff, K., & Ritz, R., ‘Carbon cost pass-through in industrial sectors’, 2019.
https://doi.org/10.17863/CAM.46544