Embed Size (px)
Citation preview
Bosshard et al., Cogent Psychology (2016), 3: 1176691http://dx.doi.org/10.1080/23311908.2016.1176691
APPLIED PSYCHOLOGY | RESEARCH ARTICLE
Established liked versus disliked brands: Brain activity, implicit associations and explicit responsesShannon S. Bosshard1, Jesse D. Bourke1, Sajeev Kunaharan1, Monika Koller2 and Peter Walla1,3,4*
Abstract: Consumers’ attitudes towards established brands were tested using implicit and explicit measures. In particular, late positive potential (LPP) effects were assessed as an implicit neurophysiological measure of motivational significance. The Implicit Association Test (IAT) was used as an implicit behavioural measure of valence-related aspects (affective content) of brand attitude. We constructed individualised stimulus lists of liked and disliked brand types from participants’ subjective pre-assessment. Participants then re-rated these visually presented brands whilst brain potential changes were recorded via electroencephalography (EEG). First, self-report measures during the test confirmed pre-assessed attitudes underlining consistent explicit rating performance. Second, liked brands elicited significantly more positive going wave-forms (LPPs) than disliked brands over right parietal cortical areas starting at about 800 ms post stimulus onset (reaching statistical significance at around 1,000 ms) and lasting until the end of the recording epoch (2,000 ms). In accordance to the literature, this finding is interpreted as reflecting positive affect-related motivational aspects of liked brands. Finally, the IAT revealed that both liked and disliked brands indeed are associated with affect-related valence. The increased levels of motivation associated with liked brands is interpreted as potentially reflecting increased purchas-ing intention, but this is of course only speculation at this stage.
*Corresponding author: Peter Walla, School of Psychology, Centre for Translational Neuroscience and Mental Health Research, University of Newcastle, Callaghan, New South Wales, Australia; Department of Psychology, Webster Vienna Private University, Palais Wenkheim, Vienna, Austria; Faculty of Psychology, University of Vienna, Vienna, Austria E-mail: [email protected]
Reviewing editor:Jarmo Heinonen, Laurea University of Applied Sciences, Finland
Additional information is available at the end of the article
ABOUT THE AUTHORSShannon S. Bosshard completed this paper as a part of his PhD under the supervision of Peter Walla, an expert in Neurobiology (focus on non-conscious brain processes and human behaviour). Shannon currently studies at the University of Newcastle, Australia. He is interested in consumer behaviour and more specifically, the role that non-conscious processes play in consumer decisions. Peter is a professor of Psychology at the Webster Vienna Private University and head of the Psychology Department, while also running the CanBeLab (Cognitive and Affective Neuroscience & Behavior). He is a conjoint professor at the Newcastle University and senior research fellow at the University of Vienna. Besides their purely academic efforts they also offer neuroconsulting services, which is highly appreciated by various industries.
PUBLIC INTEREST STATEMENTWe are often confronted with well-established brands, some liked others disliked, a result of individual attitude. Traditional market research takes explicit responses (conscious and thoughtful) to measure brand attitude, but recent empirical evidence highlights the fact that implicit (rather unconscious) responses often don’t match with conscious decisions.
We compare three different kinds of responses to brand name presentations, two unconscious and one conscious. We found that unconscious measures (brain activity and a reaction time-based measure, the Implicit Association Test) match with conscious responses. It is concluded that established like and dislike are indeed established on various levels of information processing in the brain. Future studies will test whether attitude changes can vary as a function of processing level. This is of great interest to marketers and advertisers. The brain knows more than it admits to consciousness and getting access to unconscious knowledge increases our understanding of human behaviour.
Received: 10 November 2015Accepted: 17 March 2016First Published: 19 April 2016
© 2016 The Author(s). This open access article is distributed under a Creative Commons Attribution (CC-BY) 4.0 license.
Page 1 of 16
Page 2 of 16
Bosshard et al., Cogent Psychology (2016), 3: 1176691http://dx.doi.org/10.1080/23311908.2016.1176691
Subjects: Neurobiology; Neuroscience; Psychological Science
Keywords: attitudes; brands; EEG; neuromarketing; information technology; NeuroIS; con-sumer neuroscience and neuromarketing
1. Introduction
1.1. BackgroundEveryday we are presented with stimuli that require evaluation. Until recent years, the majority of attitude research was conducted within traditional social psychological studies. However, as compe-tition between businesses grew, and the need for product differentiation became a necessity, em-phasis was placed on investigating attitudes within consumer contexts. When making consumer-based decisions, our attitudes towards a brand play a major contributing role regarding whether we make a purchase or not. As a result, attitudes have recently received a large amount of interest within the field of consumer neuroscience. This field has progressively integrated novel methods of assessing attitudes in various consumer contexts (Morin, 2011).
Whether a company is trying to introduce a new brand or promote an existing brand, they are faced with the question of how to assess consumers’ attitudes, especially as a consequence of utilis-ing marketing strategies to modify attitudes. Current marketing literature refers to brand attach-ment when attempting to identify consumers’ attitude towards a brand. Brand attachment refers to the strength of the bond between the consumer and the specific brand/product (Park, MacInnis, Priester, Eisingerich, & Iacobucci, 2010). The strength of this bond is said to act as a good indicator of the brands’ profitability and the customers’ perceived value of the brand (Thomson, MacInnis, & Park, 2005).
It is crucial to use a multidimensional approach and use as many measures as possible to quantify the various aspects of brand attitude as brands themselves are considered to be multidimensional concepts (Aaker, 1997). This approach will complete traditional approaches that rely on surveys and other methodologies that require explicit responses only. The most familiar measures of attitudes are those traditionally used within marketing studies. Generally referred to as traditional measures, or explicit measures, these provide an insight into explicit attitudes, which are deliberate and con-templative evaluations formulated through reasoning (Gawronski & Bodenhausen, 2006). The act of reasoning has the potential to result in a form of cognitive pollution. Cognitive pollution is the pro-cess whereby an explicit response becomes polluted as a result of conscious evaluation of a stimulus (Walla, Brenner, & Koller, 2011; Walla & Panksepp, 2013). In order to overcome the effects of cogni-tive pollution, the use of implicit measures of attitude are suggested as they instead measure im-plicit attitudes. In contrast to explicit attitudes, implicit attitudes are associations that are automatically activated in the presence of relevant stimuli without any conscious awareness of evaluation (Cunningham, Raye, & Johnson, 2004).
The lack of acknowledgement of implicit factors consistently produced discrepant findings (for review, see De Houwer, Thomas, & Baeyens, 2001). Various recent cases demonstrate discrepancies between explicit and implicit measures (Geiser & Walla, 2011; Grahl, Greiner, & Walla, 2012; Walla, Rosser, Scharfenberger, Duregger, & Bosshard, 2013) and as a result, there has been a recent turn towards implicit measures of attitudes, which are able to provide an insight into non-conscious af-fective processing, whilst also providing researchers and practitioners with a more complete picture related to brand attitude. For instance, Geiser and Walla (2011) showed that virtually walking through urban environments can result in different effects depending on explicit or implicit meas-ures; Dunning, Auriemmo, Castille, and Hajcak (2010) found a non-linear relationship between the intensity of angry faces and non-conscious, physiological measures. More specifically, Dunning et al. reported that although participants in their study explicitly stated that images of angry faces were increasingly angry, implicit measures (startle amplitude) were only exhibited when the faces pre-sented were maximally angry. Similarly, Grahl et al. (2012) reported that even specific bottle shapes
Page 3 of 16
Bosshard et al., Cogent Psychology (2016), 3: 1176691http://dx.doi.org/10.1080/23311908.2016.1176691
can elicit a non-conscious affective change, whilst explicit ratings remain constant. In case implicit and explicit measures match up, the complete picture represents strong assurance, and if they don’t match up, there is reason to suggest that this discrepancy reflects differences between conscious and non-conscious processing. Those differences could be useful to help shape products and/or marketing strategies.
More recent research presented by Calvert and Brammer (2012) has suggested that attitudes are in many ways, driven by non-conscious processes, thus more comprehensive measures are needed. In contrast to explicit attitudes, implicit attitudes are evaluative associations automatically acti-vated in the presence of a relevant stimulus, regardless of conscious intentionality for evaluation (Cunningham, Espinet, DeYoung, & Zelazo, 2005). This means that both positive and negative evalu-ations can occur without conscious awareness (Devine, 1989). This automatic nature of implicit evaluations reinforces their conceptualisation as non-conscious processes (Dijksterhuis, 2004). Furthermore, implicit attitudes are shown to be considerably robust (Petty, Tormala, Briñol, & Jarvis, 2006) and better predictors of spontaneous behaviour (Gawronski & Bodenhausen, 2012). With re-gard to spontaneous behaviour, Wilson et al. (1993), showed that when choosing one of two posters, participants that were asked to provide reasoning for their decisions not only showed different pref-erences, but also reported being less satisfied with their selection three weeks after the study. Again, such findings reiterate the implication of cognitive pollution during consumer decision-making and the importance of including implicit approaches to consumer research.
1.2. Implicit measurementsOf the behavioural (non-physiological) implicit measures, the Implicit Association Test (IAT; see Greenwald, McGhee, & Schwartz, 1998) is arguably the most popular and effective response latency-based implicit measure. The IAT has been used primarily as a tool within social psychology to deter-mine implicit attitudes and stereotypes of social constructs including race (ecomorphological group) and gender (Banaji & Greenwald, 1995; Banaji & Hardin, 1996; Dovidio, Kawakami, & Gaertner, 2002; Fazio, Jackson, Dunton, & Williams, 1995; Greenwald & Banaji, 1995; Greenwald & Farnham, 2000; Greenwald et al., 1998, 2002). In recent times, however, the use of the IAT has extended into fields including marketing research (Brunel, Tietje, & Greenwald, 2004; Maison, Greenwald, & Bruin, 2001). Nevertheless, it has to be mentioned that the IAT has been met with a number of criticisms regard-ing legitimacy as a reliable and valid index of implicit attitudes (De Houwer, 2006; De Houwer, Beckers, & Moors, 2007; Fiedler, Messner, & Bluemke, 2006; Hofmann, Gawronski, Gschwendner, Le, & Schmitt, 2005). According to Rothermund and Wentura (2004), rather than the IAT measuring implicit associations, it may instead provide an indication of differences in salience between the two groups of target stimuli. Similarly, Mitchell (2004) found that when completing the IAT, participants sort the stimuli into two categories; one that is accepted and another that is rejected. From these findings, it is possible that the IAT does not measure attitudinal aspects of a stimulus, but instead reflects the means by which participants have sorted the stimuli.
Electroencephalography (EEG) has been demonstrated as a useful physiological technique for ob-taining implicit information through a number of approaches. For example, non-conscious verbal memory traces have been shown (e.g. Rugg et al., 1998). Although a limited number of papers have investigated attitudes using EEG, even few of these papers are related to consumer neuroscience (for review see, Wang & Minor, 2008). Of the few papers that are seen to investigate attitudes using EEG within consumer contexts, many have proposed that EEG can differentiate between brand-re-lated stimuli containing either a positive or negative valence. Handy, Smilek, Geiger, Liu, and Schooler (2010) found that when participants rated unfamiliar logos as positive, these stimuli elicited more activity than those that were rated as negative across frontal and parietal regions as late as 600 ms. Further evidence of EEG as suitable means in determining differences between positive and negative stimuli within marketing contexts was put forth by Vecchiato et al. (2010). Rather than investigating brain activity related to positive and negative logos, Vecchiato et al. investigated brain activity in relation to TV commercials. Their research revealed that TV commercials that were rated as pleasant resulted in increased levels of activity than those rated as unpleasant (Vecchiato et al., 2010). Again,
Page 4 of 16
Bosshard et al., Cogent Psychology (2016), 3: 1176691http://dx.doi.org/10.1080/23311908.2016.1176691
it was reported that frontal and parietal areas were largely involved in the processing of the com-mercials. Although the literature is scarce, it is clear that EEG reveals some insight into an individu-al’s attitudes and motivation. Through the analysis of asymmetrical activity across the prefrontal cortex, Davidson, Schwartz, Saron, Bennett, and Coleman (1979) suggested that greater activity across the left frontal hemisphere is associated with positive emotions, whereas greater activity across the right frontal hemisphere is associated with more negative emotions. Since this report, motivational components have also been identified with relative increased left and right activity be-ing associated with approach and avoidance systems, respectively (Harmon-Jones, 2004). The asymmetry model has recently proved informative in numerous consumer contexts (e.g. Brown, Randolph, & Burkhalter, 2012; Ohme, Reykowska, Wiener, & Choromanska, 2010; Ohme et al., 2010; Ravaja, Somervuori, & Salminen, 2013; Solnais, Andreu, Sánchez-Fernández, & Andréu-Abela, 2013). For instance, Ravaja et al. revealed that asymmetry over the prefrontal cortex predicts purchase decision when brand and price are varied with greater left frontal activation indicating greater intent to engage in a purchase. In addition, Brown et al. found that when presented with several beverag-es, participants explicitly stated a preference for one in particular; however brain activity showed no asymmetry effect across left frontal electrode sites, thus, suggesting they were processed as neu-tral. Brown et al. showed that participants who processed the brands as neutral were more likely to willingly switch from their explicitly stated brand preference when faced with a cheaper alternative.
From these findings, it can be inferred that through the use of EEG, we may be able to identify a link between brain activity and consumer brand attitude. Of most interest for the present study, the most empirically valid EEG approach as an index of motivation and affect has been a distinct event-related potential (ERP) component, the Late Positive Potential (LPP). It has not only been imple-mented in an expansive volume of research, but also recently received psychometric endorsement which revealed that the LPP demonstrated good to excellent reliability as a measure of emotion/affective processing (see Moran, Jendrusina, & Moser, 2013). According to the literature, stimuli that are emotionally arousing produce an enhanced LPP compared to neutral stimuli (Cacioppo, Crites, Berntson, & Coles, 1993; Cacioppo, Petty, Losch, & Crites, 1994; Cuthbert, Schupp, Bradley, Birbaumer, & Lang, 2000) and those with greater motivational significance produce larger LPPs (Lang, Simons, & Balaban, 1997). An overall greater LPP sensitivity has been found in the right hemisphere during evaluative tasks (Crites & Cacioppo, 1996).
1.3. The present studyThe rationale for the present study was to use the IAT to test whether explicitly rated brands that are liked are indeed associated with positive affect and disliked brands with negative affect. In addition, via EEG recordings we aimed at testing whether or not liked and disliked brands are further associ-ated with different motivational aspects. The present study also extends upon the study by Walla et al. (2011) in that it adds further implicit measures (specifically, EEG and the IAT) to measure brand attitude. They too investigated brand attitude, but focused on startle reflex modulation, heart rate and skin conductance. No studies addressing the sensitivity of ERPs as a measure of brand attitude were expressed in this paper, and to our knowledge remain absent in the current existing literature. Furthermore, in contrast to much of the existing literature, the current study focuses on individual’s perceptions of highly familiar brands. We used an online survey to produce individual lists of liked and disliked brands and then invited eligible participants to record brain potentials and take IAT measures. We first hypothesised that self-reported measures during physiological recording would strongly reflect explicit pre-assessment ratings. Following the existing literature, we expected the LPP component to vary as a function of brand attitude allowing us to make inferences about affect-based motivational aspects. Finally, we expected IAT data to also support differences between liked and disliked brands and thus demonstrate its reliably as a measure of brand attitude.
Page 5 of 16
Bosshard et al., Cogent Psychology (2016), 3: 1176691http://dx.doi.org/10.1080/23311908.2016.1176691
2. Methods
2.1. ParticipantsInitial recruitment for the study involved 27 participants, 3 of whom were excluded following pre-assessment of brand attitudes. The mean age of the remaining 24 participants (12 females) was 23.58 (SD = 2.39). All participants were tertiary education students recruited by word of mouth. They volunteered and gave their written informed consent. Participants were right handed, had normal or corrected to normal vision, were free of central nervous system affecting medications and had no history of neuropathology. They were also asked to not drink any alcohol or coffee and to not smoke for at least 24 h before the experiment. Participants were financially reimbursed for their time and travel. The study was approved by the Newcastle University Ethics Committee.
2.2. StimuliThe initial stimulus list for pre-assessment comprised 300 subjectively chosen common brands names, familiar to people from Australia (see Appendix A for list of presented brand names). Using an online survey, participants provided a subjective rating of like or dislike for each brand name on a 21-point Likert scale, ranging from −10 (Strong Dislike) to +10 (Strong Like). Upon initiation of the experiment, we created individualised stimulus lists using the subjective ratings obtained from the online survey. Each stimulus list comprised 200 brand names, including the participant’s 30 most liked brand names, 30 most disliked brand names, 60 neutral brand names and 80 non-target (filler) brand names. This accumulated 120 target brand names across three types; positive, negative and neutral. Brand names were presented in capital white letters, Tahoma font and on a black back-ground (no logos were presented). In the frame of this paper only measures related to liked and disliked brands are further analysed.
2.3. Individual pre-assessment of brand attitudesParticipants subjectively rated 300 brand names using an online survey (via www.limesurvey.com), prior to entering the lab. We required participants to read each brand name and indicate their atti-tude towards it using a mouse/track pad on the provided slider. Participants were explicitly instruct-ed to not adjust the slider if they were unfamiliar with a particular brand. Rating a brand as neutral required the participant to manually click “0”. This phase of the experiment occurred at a time of the participant’s choosing, with choice of computer also left to their discretion. The survey took on aver-age 15–20 min to complete. Participants who demonstrated adequate familiarity and attitude scope were eligible for the experimental phase of the study. That is, participants who were either unfamil-iar with the majority of the brands, or did not have a large spread of attitudes (ranging from strongly liked to strongly disliked) were excluded from the experiment. This came as a result of not being able to construct a stimulus list with discernable positive and negative target items. Three participants were unable to further participate due to such inadequate brand pre-assessment.
2.3.1. Lab experimentFollowing completion of pre-assessment, we invited eligible participants individually into the lab. Participants were encouraged to attend the lab within three days of having completed the online survey. During their visit, we collected all explicit and implicit measures of attitudes towards brand names. Explicit measurement involved subjective self report, whilst implicit measures were collect-ed using EEG and the IAT. Upon entering the lab, participants were seated comfortably in front of a 32 inch LED television (screen resolution of 1,024 × 768 pixels). We connected participants to a BioSemi ActiveTwo EEG system (BioSemi, Amsterdam, the Netherlands) and measured potential changes using 64 cranial electrodes, as well as 8 external reference electrodes placed lateral ocu-larly, supraocularly, infraocularly and on the mastoids.
We used the computer program Presentation (NeuroBehavioral Systems, Albany, United States) to visually present the appropriate instructions and individualised stimulus lists. The presentation of stimuli in addition to neurophysiological signal recording was conducted from a separate room. We commenced testing with the participant by themselves in a dimly lit room to ensure adequate focus
Page 6 of 16
Bosshard et al., Cogent Psychology (2016), 3: 1176691http://dx.doi.org/10.1080/23311908.2016.1176691
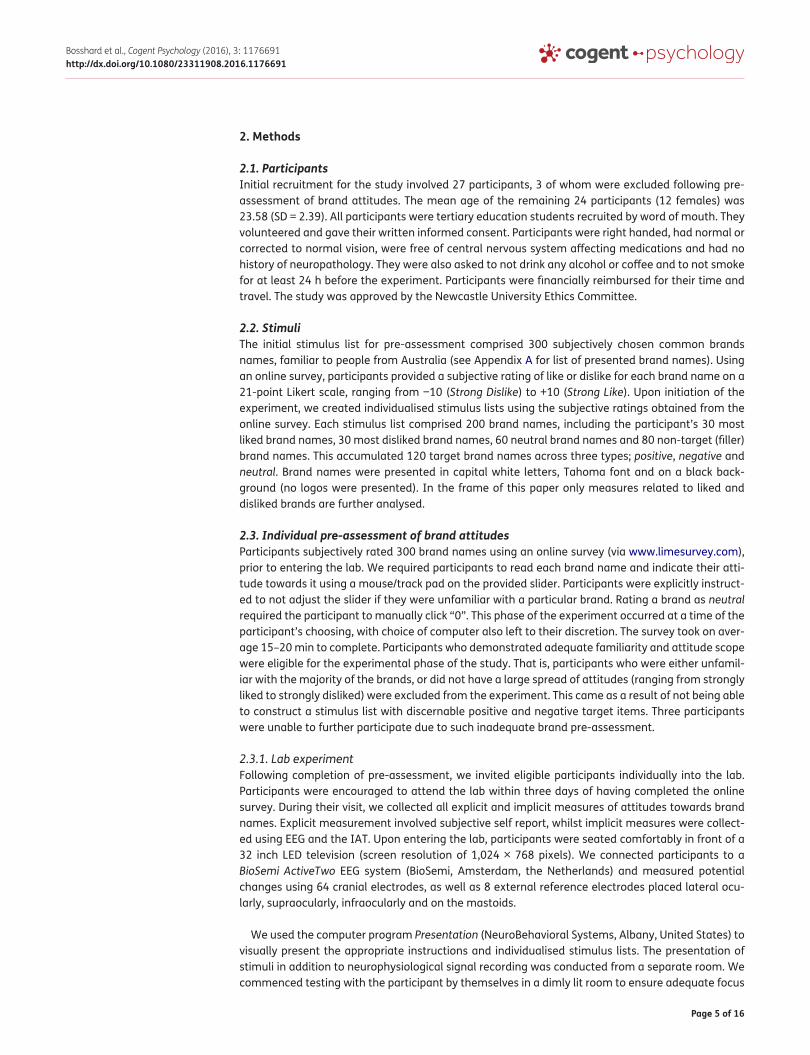
on the stimuli. A white fixation-cross appeared on a black background for 500 ms, followed by a brand name for 5 s. Participants provided a self-reported rating of 1 (Strong Dislike) to 9 (Strong Like) for the brand using a standard keyboard, whilst it was on screen. Brain potential changes and self-report were collected for the 120 target brands. To reduce fatigue effects, participants were provided a break halfway through this stage. Overall, it took approximately 30 min to complete. At this stage, participants had the EEG recording cap removed and were then asked to complete five rounds of the IAT (see Figure 1 for modified IAT).
2.4. Data recording and processing
2.4.1. Self-report and Implicit Association TestFor self-report data, mean ratings of liked and disliked brands were compared using paired-sampled t-tests. These analyses were completed at both the pre- and post assessment phases. As for the IAT, we used a modified version of the original test (Greenwald et al., 1998), which consisted of 5 sepa-rate discrimination tasks each with 30 visual presentations to be classified as either a target or non-target stimulus. Although the structure and administration of the IAT remained identical to the original IAT, rather than using stimuli that fall under the guise of social psychology (e.g. Faces of different races; Greenwald et al.,1998), we instead used brand names. In task 1 (initial target con-cept) study participants were asked to discriminate between a non-target brand (previously rated as neutral) and a target brand (individually rated liked or disliked brands). Study participants were re-quired to press the “A” key for target brand and the “L” key for non-target brand. In task 2 (associated attribute) participants were visually presented with valenced words and asked to press the “A” key for pleasant words (e.g. beautiful, healthy, happy and perfect) and the “L” key for unpleasant words (e.g. frighten, angry, sad and worthless). In task 3 (initial combined task) tasks 1 and 2 were com-bined. Study participants were asked to press the “A” key in case of target brand or pleasant words and the “L” key when presented with a negative word or a non-target brand. Task 4 (reversed target concept) was similar to task 1, however participants were asked to press the “A” key for non-target brands and the “L” key for target brands. Finally, task 5 (reversed combined task) was a combination of task 2 and task 4. Participants were required to press the “A” key in case of non-target brands and pleasant words and the “L” key when presented with a negative word or a non-target brand. In ac-cordance with the existing literature (De Houwer et al., 2001), a comparative analysis was made between reaction times of participants during task 3 and task 5. During each of the blocks, stimuli were presented for 300 ms; however, participants were given 1,500 ms to respond during each trial. Between each stimulus, a fixation cross was presented for 300 ms and between the fixation cross and the following stimulus, was another 700 ms gap. For a pictorial explanation of how the IAT was implemented (see Figure 1). Participants completed one IAT which included a liked brand as a target brand and second IAT which incorporated a disliked brand as a target brand. For a pictorial explana-tion of how the IAT was implemented (see Figure 1).
Figure 1. Modified version of the original IAT.
Notes: Filled black circles on the left of the stimulus indicate left button presses and vice versa. Task 3 = congruent, Task 5 = Incongruent condition.Source: Adapted from Greenwald et al. (1998).
Page 7 of 16
Bosshard et al., Cogent Psychology (2016), 3: 1176691http://dx.doi.org/10.1080/23311908.2016.1176691
2.4.2. Event related potentialsWe recorded EEG at a rate of 2,048 samples/s using a 64-channel Bio Semi Active Two system and ActiView software (BioSemi, Amsterdam, the Netherlands). Data-sets were processed individually using EEG-Display (version 6.3.13; Fulham, Newcastle, Australia). During processing, we reduced the sampling rate to 256 samples/s and applied a band pass filter of 0.1–30 Hz. Blink artefacts were cor-rected by referencing to the supraocular external electrode (excluding two sets referenced to Fpz due to unclean external signals). In order to eliminate noise generated by eye movements, we con-ducted horizontal, vertical and radial eye movement corrections (see Croft & Barry, 1999). The data was coded to brand type (i.e. liked and disliked). We established epochs from −100 ms prior to stimu-lus onset (a baseline), to 2,000 ms following stimulus onset. The resultant epochs were baseline corrected and an average was generated across single trials for each condition. The individual data-sets were then re-referenced to a mastoid electrode. Grand averaged ERPs were generated to dis-play brain activity differences. Grand averaged ERPs were then analysed in 200 ms (between 20 and 1,800 ms) blocks using t-tests to compare mean activity during these periods (200 ms–400 ms, 400 ms–600 ms, 600 ms–800 ms etc.)
3. Results
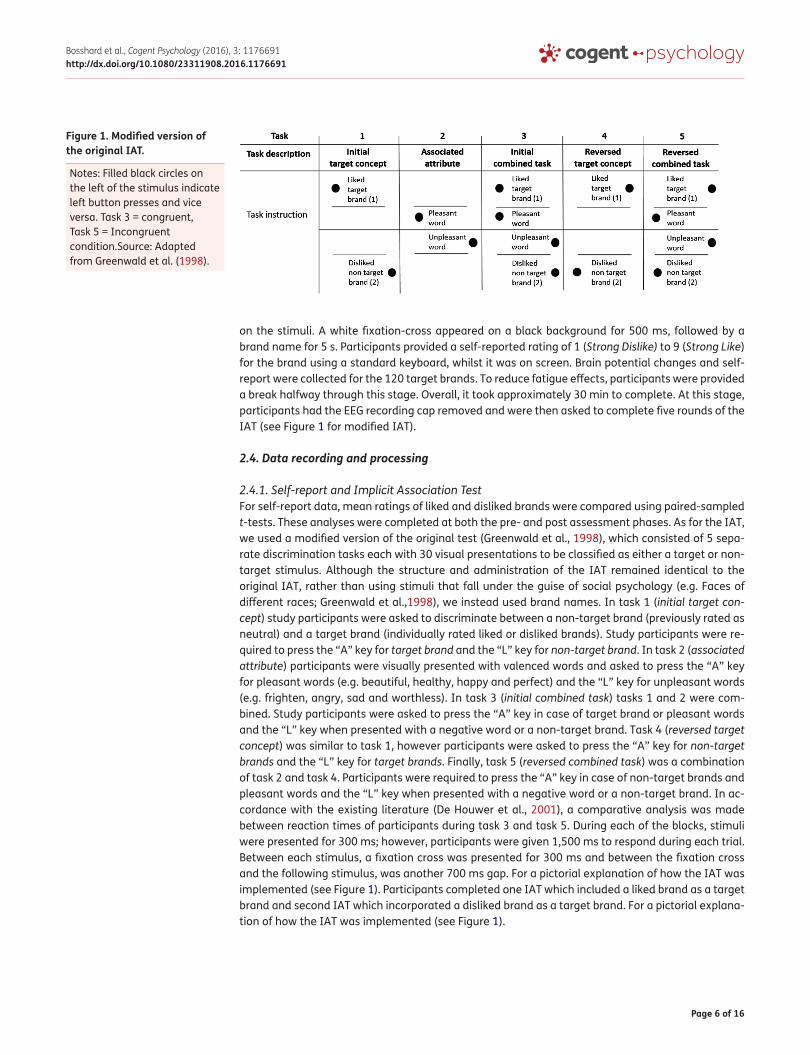
3.1. Self-report at pre-testingTo analyse the self-report data, the responses towards participants’ most liked and most disliked brands were collated. We then conducted a paired t-test on these two conditions and found that on average, the mean of self-reported liked brands (the top 30 most liked) was 9.44 (SD = 2.49) and the mean of disliked brands (30 least liked brands) was −4.56 (SD = 5.41; see Figure 2). As expected, this effect was seen to be highly significant (t = 25.765, df = 118, p < 0.001, two-tailed; d = 3.54).
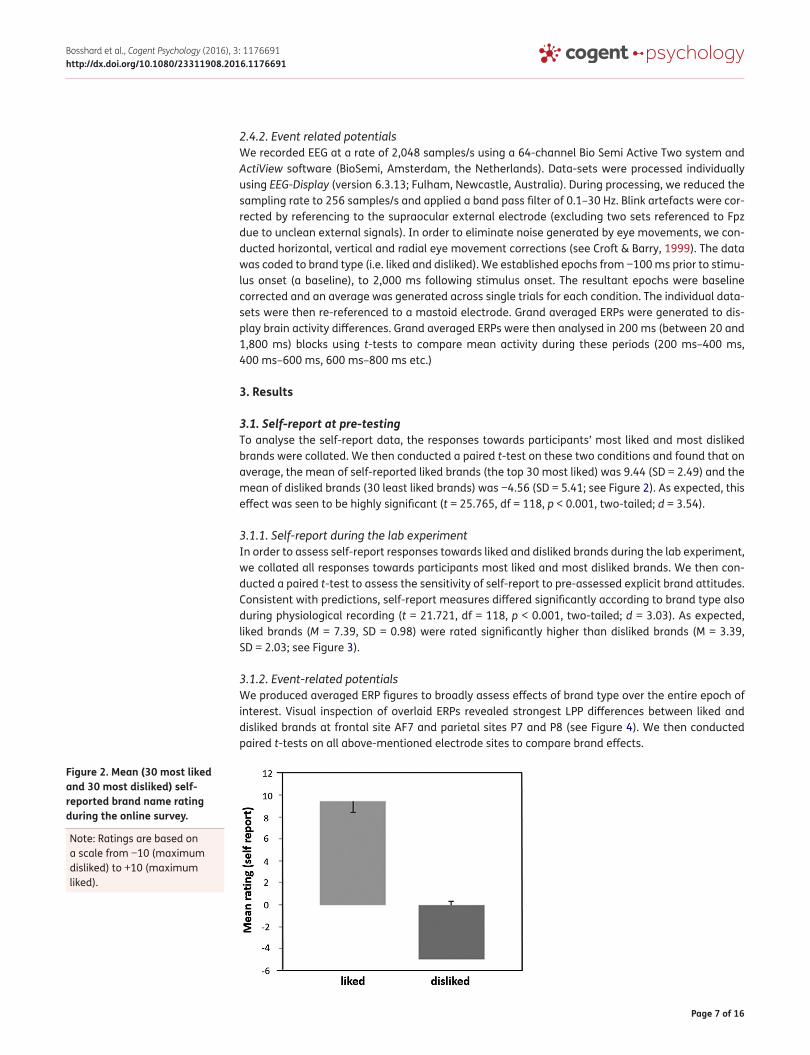
3.1.1. Self-report during the lab experimentIn order to assess self-report responses towards liked and disliked brands during the lab experiment, we collated all responses towards participants most liked and most disliked brands. We then con-ducted a paired t-test to assess the sensitivity of self-report to pre-assessed explicit brand attitudes. Consistent with predictions, self-report measures differed significantly according to brand type also during physiological recording (t = 21.721, df = 118, p < 0.001, two-tailed; d = 3.03). As expected, liked brands (M = 7.39, SD = 0.98) were rated significantly higher than disliked brands (M = 3.39, SD = 2.03; see Figure 3).
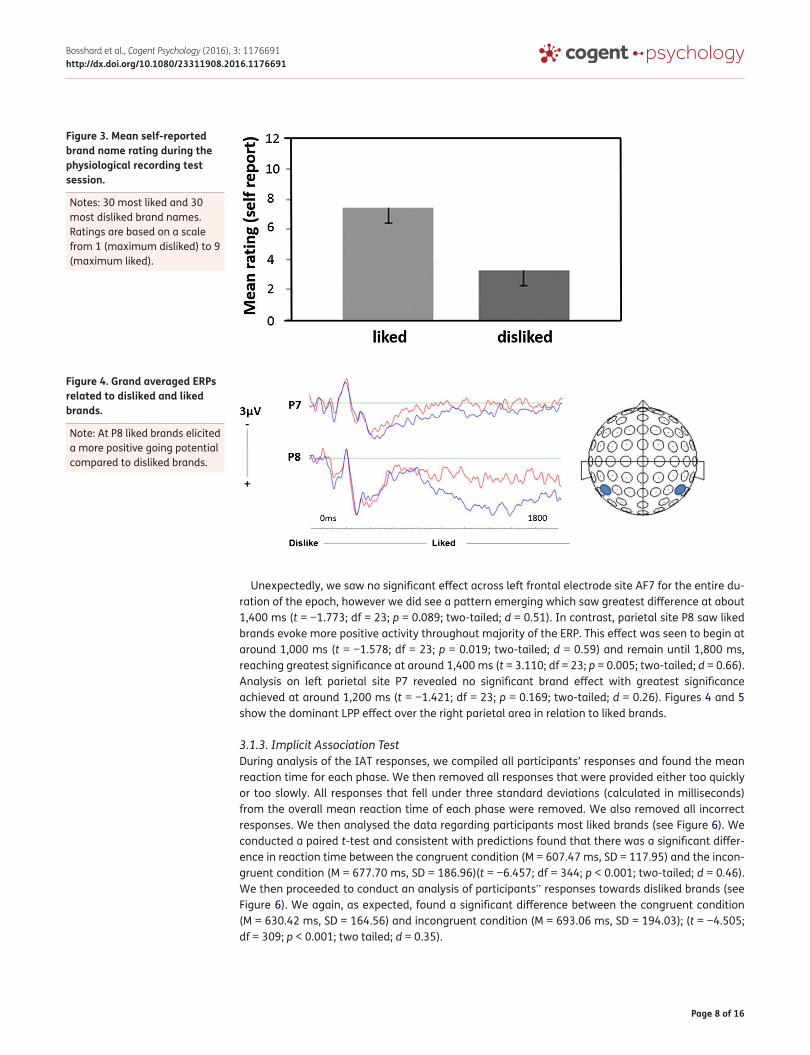
3.1.2. Event-related potentialsWe produced averaged ERP figures to broadly assess effects of brand type over the entire epoch of interest. Visual inspection of overlaid ERPs revealed strongest LPP differences between liked and disliked brands at frontal site AF7 and parietal sites P7 and P8 (see Figure 4). We then conducted paired t-tests on all above-mentioned electrode sites to compare brand effects.
Figure 2. Mean (30 most liked and 30 most disliked) self-reported brand name rating during the online survey.
Note: Ratings are based on a scale from −10 (maximum disliked) to +10 (maximum liked).
Page 8 of 16
Bosshard et al., Cogent Psychology (2016), 3: 1176691http://dx.doi.org/10.1080/23311908.2016.1176691
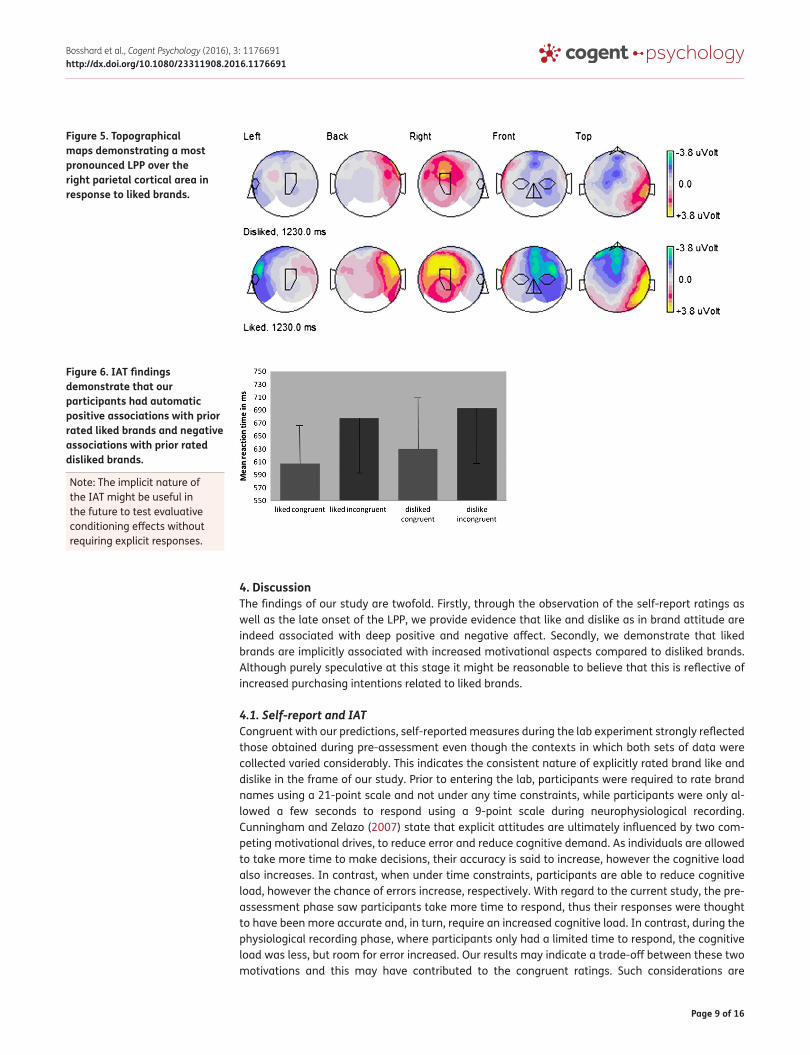
Unexpectedly, we saw no significant effect across left frontal electrode site AF7 for the entire du-ration of the epoch, however we did see a pattern emerging which saw greatest difference at about 1,400 ms (t = −1.773; df = 23; p = 0.089; two-tailed; d = 0.51). In contrast, parietal site P8 saw liked brands evoke more positive activity throughout majority of the ERP. This effect was seen to begin at around 1,000 ms (t = −1.578; df = 23; p = 0.019; two-tailed; d = 0.59) and remain until 1,800 ms, reaching greatest significance at around 1,400 ms (t = 3.110; df = 23; p = 0.005; two-tailed; d = 0.66). Analysis on left parietal site P7 revealed no significant brand effect with greatest significance achieved at around 1,200 ms (t = −1.421; df = 23; p = 0.169; two-tailed; d = 0.26). Figures 4 and 5 show the dominant LPP effect over the right parietal area in relation to liked brands.
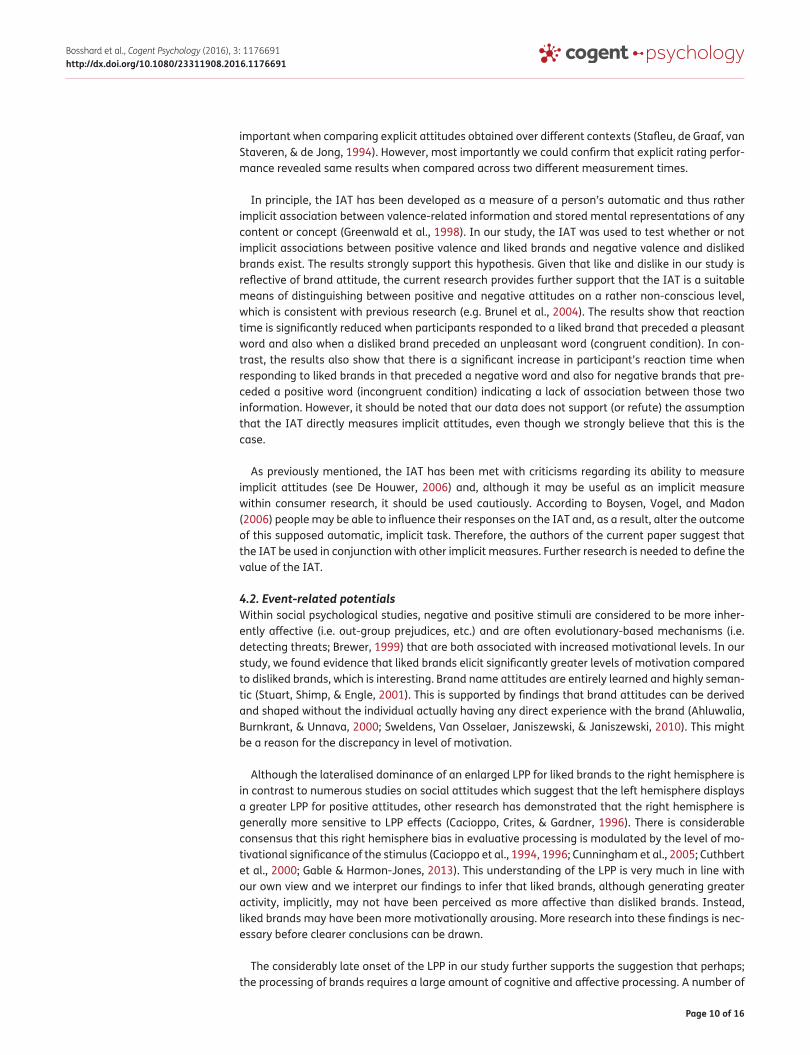
3.1.3. Implicit Association TestDuring analysis of the IAT responses, we compiled all participants’ responses and found the mean reaction time for each phase. We then removed all responses that were provided either too quickly or too slowly. All responses that fell under three standard deviations (calculated in milliseconds) from the overall mean reaction time of each phase were removed. We also removed all incorrect responses. We then analysed the data regarding participants most liked brands (see Figure 6). We conducted a paired t-test and consistent with predictions found that there was a significant differ-ence in reaction time between the congruent condition (M = 607.47 ms, SD = 117.95) and the incon-gruent condition (M = 677.70 ms, SD = 186.96)(t = −6.457; df = 344; p < 0.001; two-tailed; d = 0.46). We then proceeded to conduct an analysis of participants‟ responses towards disliked brands (see Figure 6). We again, as expected, found a significant difference between the congruent condition (M = 630.42 ms, SD = 164.56) and incongruent condition (M = 693.06 ms, SD = 194.03); (t = −4.505; df = 309; p < 0.001; two tailed; d = 0.35).
Figure 3. Mean self-reported brand name rating during the physiological recording test session.
Notes: 30 most liked and 30 most disliked brand names. Ratings are based on a scale from 1 (maximum disliked) to 9 (maximum liked).
Figure 4. Grand averaged ERPs related to disliked and liked brands.
Note: At P8 liked brands elicited a more positive going potential compared to disliked brands.
Page 9 of 16
Bosshard et al., Cogent Psychology (2016), 3: 1176691http://dx.doi.org/10.1080/23311908.2016.1176691
4. DiscussionThe findings of our study are twofold. Firstly, through the observation of the self-report ratings as well as the late onset of the LPP, we provide evidence that like and dislike as in brand attitude are indeed associated with deep positive and negative affect. Secondly, we demonstrate that liked brands are implicitly associated with increased motivational aspects compared to disliked brands. Although purely speculative at this stage it might be reasonable to believe that this is reflective of increased purchasing intentions related to liked brands.
4.1. Self-report and IATCongruent with our predictions, self-reported measures during the lab experiment strongly reflected those obtained during pre-assessment even though the contexts in which both sets of data were collected varied considerably. This indicates the consistent nature of explicitly rated brand like and dislike in the frame of our study. Prior to entering the lab, participants were required to rate brand names using a 21-point scale and not under any time constraints, while participants were only al-lowed a few seconds to respond using a 9-point scale during neurophysiological recording. Cunningham and Zelazo (2007) state that explicit attitudes are ultimately influenced by two com-peting motivational drives, to reduce error and reduce cognitive demand. As individuals are allowed to take more time to make decisions, their accuracy is said to increase, however the cognitive load also increases. In contrast, when under time constraints, participants are able to reduce cognitive load, however the chance of errors increase, respectively. With regard to the current study, the pre-assessment phase saw participants take more time to respond, thus their responses were thought to have been more accurate and, in turn, require an increased cognitive load. In contrast, during the physiological recording phase, where participants only had a limited time to respond, the cognitive load was less, but room for error increased. Our results may indicate a trade-off between these two motivations and this may have contributed to the congruent ratings. Such considerations are
Figure 5. Topographical maps demonstrating a most pronounced LPP over the right parietal cortical area in response to liked brands.
Figure 6. IAT findings demonstrate that our participants had automatic positive associations with prior rated liked brands and negative associations with prior rated disliked brands.
Note: The implicit nature of the IAT might be useful in the future to test evaluative conditioning effects without requiring explicit responses.
Page 10 of 16
Bosshard et al., Cogent Psychology (2016), 3: 1176691http://dx.doi.org/10.1080/23311908.2016.1176691
important when comparing explicit attitudes obtained over different contexts (Stafleu, de Graaf, van Staveren, & de Jong, 1994). However, most importantly we could confirm that explicit rating perfor-mance revealed same results when compared across two different measurement times.
In principle, the IAT has been developed as a measure of a person’s automatic and thus rather implicit association between valence-related information and stored mental representations of any content or concept (Greenwald et al., 1998). In our study, the IAT was used to test whether or not implicit associations between positive valence and liked brands and negative valence and disliked brands exist. The results strongly support this hypothesis. Given that like and dislike in our study is reflective of brand attitude, the current research provides further support that the IAT is a suitable means of distinguishing between positive and negative attitudes on a rather non-conscious level, which is consistent with previous research (e.g. Brunel et al., 2004). The results show that reaction time is significantly reduced when participants responded to a liked brand that preceded a pleasant word and also when a disliked brand preceded an unpleasant word (congruent condition). In con-trast, the results also show that there is a significant increase in participant’s reaction time when responding to liked brands in that preceded a negative word and also for negative brands that pre-ceded a positive word (incongruent condition) indicating a lack of association between those two information. However, it should be noted that our data does not support (or refute) the assumption that the IAT directly measures implicit attitudes, even though we strongly believe that this is the case.
As previously mentioned, the IAT has been met with criticisms regarding its ability to measure implicit attitudes (see De Houwer, 2006) and, although it may be useful as an implicit measure within consumer research, it should be used cautiously. According to Boysen, Vogel, and Madon (2006) people may be able to influence their responses on the IAT and, as a result, alter the outcome of this supposed automatic, implicit task. Therefore, the authors of the current paper suggest that the IAT be used in conjunction with other implicit measures. Further research is needed to define the value of the IAT.
4.2. Event-related potentialsWithin social psychological studies, negative and positive stimuli are considered to be more inher-ently affective (i.e. out-group prejudices, etc.) and are often evolutionary-based mechanisms (i.e. detecting threats; Brewer, 1999) that are both associated with increased motivational levels. In our study, we found evidence that liked brands elicit significantly greater levels of motivation compared to disliked brands, which is interesting. Brand name attitudes are entirely learned and highly seman-tic (Stuart, Shimp, & Engle, 2001). This is supported by findings that brand attitudes can be derived and shaped without the individual actually having any direct experience with the brand (Ahluwalia, Burnkrant, & Unnava, 2000; Sweldens, Van Osselaer, Janiszewski, & Janiszewski, 2010). This might be a reason for the discrepancy in level of motivation.
Although the lateralised dominance of an enlarged LPP for liked brands to the right hemisphere is in contrast to numerous studies on social attitudes which suggest that the left hemisphere displays a greater LPP for positive attitudes, other research has demonstrated that the right hemisphere is generally more sensitive to LPP effects (Cacioppo, Crites, & Gardner, 1996). There is considerable consensus that this right hemisphere bias in evaluative processing is modulated by the level of mo-tivational significance of the stimulus (Cacioppo et al., 1994, 1996; Cunningham et al., 2005; Cuthbert et al., 2000; Gable & Harmon-Jones, 2013). This understanding of the LPP is very much in line with our own view and we interpret our findings to infer that liked brands, although generating greater activity, implicitly, may not have been perceived as more affective than disliked brands. Instead, liked brands may have been more motivationally arousing. More research into these findings is nec-essary before clearer conclusions can be drawn.
The considerably late onset of the LPP in our study further supports the suggestion that perhaps; the processing of brands requires a large amount of cognitive and affective processing. A number of
Page 11 of 16
Bosshard et al., Cogent Psychology (2016), 3: 1176691http://dx.doi.org/10.1080/23311908.2016.1176691
studies have shown significant motivational discrepancies using the LPP as early as 300 ms to 400 ms (Olofsson, Nordin, Sequeira, & Polich, 2008; Pastor et al., 2008). The LPP onset of roughly 1,000 ms in our study infers that considerably more processing occurred before the stimuli were distinguished as either liked or disliked (see Falkenstein, Hohnsbein, & Hoormann, 1994). This late onset could also be a reflection of the use of well-known brands rather than those which are ficti-tious (as seen in Handy et al., 2010).
Finally, it has to be mentioned that our data regarding frontal sites, although only a trend and not significant, supports existing literature (Davidson et al., 1979; Harmon-Jones, 2004) that liked or positive stimuli evoke greater potentials than disliked or negative stimuli across the left prefrontal cortex. From this finding, we can infer that like other affective stimuli, brands that are liked or more motivationally arousing result in increased potentials across the left prefrontal cortex more so than do disliked or aversive brands; and that this greater level of activity may give an indication of a par-ticipant’s purchase intention. Although this is only speculation at this stage, it helps forming new hypotheses for future studies with a strong applied aspect.
Although the LPP has been explored in consumer contexts, to our knowledge previous studies have used only novel stimuli (Handy et al., 2010). Our study increased external validity by assessing brand attitudes previously formed in everyday life. The pre-assessment phase further increased the utility of this approach by ensuring strength of subjective participant attitudes. We acknowledge that experimental control is important and more easily obtained using unfamiliar stimuli. However, attitude formation and change does not occur in a vacuum and translatability of research is of par-ticular importance in consumer neuroscience. We therefore recommend further use of established brand stimuli such as those used in the present study. To further expand on the use of existing brands, we also suggest assessment of stimuli such as familiar brand logos and products. These have shown to strongly activate neural systems of familiarity in functional magnetic resonance im-aging paradigms (Schaefer, Berens, Heinze, & Rotte, 2006; Tusche, Bode, & Haynes, 2010) and may also demonstrate effects unique from brand names. Moreover, we emphasise the requirement of ensuring appropriate procedures during pre-assessment, such as controlling for factors that influ-ence evaluative error and cognitive demand.
The IAT is a cognitive index of implicit attitudes further higher order than ERP, to the point of being susceptible to cognitive bias (De Houwer, 2006). Given its popularity for attitude assessment (De Houwer, 2006; Gattol, Sääksjärvi, & Carbon, 2011; Hofmann et al., 2005), it may prove useful to con-solidate this traditional response-latency measure with such contemporary ERP techniques for a broader scope of attitudes.
4.3. ConclusionsIn the present study, self-report, ERP measures and the IAT were demonstrated to be sensitive to pre-assessed brand attitudes. The effects observed using ERP specifically affirms higher order moti-vational processes as potentially underlying contributors to our explicit results. A larger LPP effect over the right parietal cortex for liked brands inferred greater motivational significance for liked compared to disliked brands. The IAT results suggest that brand attitude is indeed associated with deep affective content. In summary, even though both liked and disliked brands are associated with affective content, liked brands elicited significantly higher levels of motivation levels, which might be reflective of increased purchasing intentions related to liked brands.
Further research expounding the different mechanisms involved in evaluative processes should likewise prove beneficial for understanding attitudes generally and in applied contexts. Broadly, the implications of our own, and prospective related research may also provide clinical insight into se-vere consumer behaviours such as gambling and substance abuse and dependence (Foxall, 2008). In conclusion, the present study demonstrates that as the field of behavioural sciences progresses, there is a dire need for the field of marketing research to keep up. Given the constant reports of discrepancies between traditional, self-report data and newer, implicit approaches (such as those
Page 12 of 16
Bosshard et al., Cogent Psychology (2016), 3: 1176691http://dx.doi.org/10.1080/23311908.2016.1176691
mentioned within this paper), it is obvious that the exclusive use of traditional measures must come to an end. It is our responsibility as researchers to promote the use of implicit measures, so that future evaluative research is as comprehensive as possible.
FundingThe authors received no direct funding for this research.
Competing InterestsThe authors declare no competing interests.
Author detailsShannon S. Bosshard1
E-mail: [email protected] D. Bourke1
E-mail: [email protected] Kunaharan1
E-mail: [email protected] Koller2
E-mail: [email protected] Walla1,3,4
E-mail: [email protected] School of Psychology, Centre for Translational Neuroscience
and Mental Health Research, University of Newcastle, Callaghan, New South Wales, Australia.
2 Institute for Marketing Management, Vienna University of Economics and Business, Vienna, Austria.
3 Department of Psychology, Webster Vienna Private University, Palais Wenkheim, Vienna, Austria.
4 Faculty of Psychology, University of Vienna, Vienna, Austria.
Citation informationCite this article as: Established liked versus disliked brands: Brain activity, implicit associations and explicit responses, Shannon S. Bosshard, Jesse D. Bourke, Sajeev Kunaharan, Monika Koller & Peter Walla, Cogent Psychology (2016), 3: 1176691.
ReferencesAaker, J. L. (1997). Dimensions of brand personality. Journal
of Marketing Research, 34, 347–356. doi:10.2139/ssrn.945432
Ahluwalia, R., Burnkrant, R. E., & Unnava, H. R. (2000). Consumer response to negative publicity: The moderating role of commitment. Journal of Marketing Research, 37, 203–214, doi:10.1016/stable/1558500
Banaji, M. R., & Greenwald, A. G. (1995). Implicit gender stereotyping in judgments of fame. Journal of Personality and Social Psychology, 68, 181–198. doi:10.1037/0022-3514.68.2.181
Banaji, M. R., & Hardin, C. D. (1996). Automatic stereotyping. Psychological Science, 7, 136–141. doi:10.1111/j.1467-9280.1996.tb00346.x
Boysen, G. A., Vogel, D. L., & Madon, S. (2006). A public versus private administration of the implicit association test. European Journal of Social Psychology, 36, 84556. doi:10.1111/j.1467-9280.1996.tb00346.x
Brewer, M. B. (1999). The psychology of prejudice: Ingroup love and outgroup hate? Journal of Social Issues, 55, 429–444. doi:10.1111/0022-4537.00126
Brown, C., Randolph, A. B., & Burkhalter, J. N. (2012). The story of taste: Using EEGs and self-reports to understand consumer choice. The Kennesaw Journal of Undergraduate Research, 2(1), 1–11. doi:10.1111/0022-4537.00126t
Brunel, F. F., Tietje, B. C., & Greenwald, A. G. (2004). Is the implicit association test a valid and valuable measure of implicit consumer social cognition? Journal of Consumer Psychology, 14, 385–404. http://dx.doi.org/10.1207/s15327663jcp1404_8
Cacioppo, J. T., Crites, S. L., Jr, Berntson, G. G., & Coles, M. G. H. (1993). If attitudes affect how stimuli are processed, should they not affect the event-related brain potential? Psychological Science, 4, 108–112. http://dx.doi.org/10.1111/psci.1993.4.issue-2
Cacioppo, J. T., Crites, S. L., & Gardner, W. L. (1996). Attitudes to the right: Evaluative processing is associated with lateralized late positive event-related brain potentials. Personality and Social Psychology Bulletin, 22, 1205–1219. doi:10.1177/01461672962212002
Cacioppo, J. T., Petty, R. E., Losch, M. E., & Crites, S. L. (1994). Psychophysiological approaches to attitudes: Detecting affective dispositions when people won’t say, can’t say, or don’t even know. In S. Shavitt & T. C. Brock (Eds.), Persuasion: Psychological insights and perspectives (pp. 43–69). Needham Heights, MA: Allyn & Bacon.
Calvert, G. A., & Brammer, M. J. (2012). Predicting consumer behavior: Using novel mind-reading. IEEE Pulse, 3, 38–41. doi:10.1109/MPUL.2012.2189167
Crites, S. L., & Cacioppo, J. T. (1996). Electrocortical differentiation of evaluative and non evaluative categorizations. Psychological Science, 7, 318–321. doi:10.1111/j.1467-9280.1996.tb00381
Croft, R. J., & Barry, R. J. (1999). Removal of occular artifact from the EEG: A review. Neurophysiologie Clinique, 30, 5–19. doi:10.1016/S0987-7053(00)00055-1
Cunningham, W. A., Espinet, S. D., DeYoung, C. G., & Zelazo, P. D. (2005). Attitudes to the right- and left: Frontal ERP asymmetries associated with stimulus valence and processing goals. NeuroImage, 28, 827–834. doi: http://dx.doi.org/10.1016/j.neuroimage.2005.04.044
Cunningham, W. A., Raye, C. L., & Johnson, M. K. (2004). Implicit and explicit evaluation: fMRI correlates of valence, emotional intensity, and control in the processing of attitudes. Journal of Cognitive Neuroscience, 16, 1717–1729.
Cunningham, W. A., & Zelazo, P. D. (2007). Attitudes and evaluations: A social cognitive neuroscience perspective [Research Support, Non-U.S. Gov’t Review]. Trends in Cognitive Sciences, 11, 97–104. doi:10.1016/j.tics.2006.12.005
Cuthbert, B. N., Schupp, H. T., Bradley, M. M., Birbaumer, N., & Lang, P. J. (2000). Brain potentials in affective picture processing: Covariation with autonomic arousal and affective report. Biological Psychology, 52, 95–111. doi:10.1016/S0301-0511(99)00044-7
Davidson, R. J., Schwartz, G. E., Saron, C., Bennett, J., & Coleman, D. (1979). Frontal versus parietal asymmetry during positive and negative affect (Abstract). Psychophysiology, 16, 2. doi:10.1037/0021-843X.98.2.127
De Houwer, J. (2006). Using the implicit association test does not rule out an impact of conscious propositional knowledge on evaluative conditioning. Learning and Motivation, 37, 176–187. doi:10.1016/j.lmot.2005.12.002
De Houwer, J., Thomas, S., & Baeyens, F. (2001). Association learning of likes and dislikes: A review of 25 years of research on human evaluative conditioning. Psychological Bulletin, 127, 853–869. doi:10.1037/0033-2909.127.6.853
Devine, P. G. (1989). Stereotypes and prejudice: Their automatic and controlled components. Journal of Personality and Social Psychology, 56, 5–18. doi:10.1037/0022-3514.56.1.5
De Houwer, J., Beckers, T., & Moors, A. (2007). Novel attitudes can be faked on the Implicit Association Test. Journal of Experimental Social Psychology, 43, 972–978. doi:10.1016/j.jesp.2006.10.007
Dijksterhuis, A. (2004). I like myself but I don’t know why: Enhancing implicit self-esteem by subliminal evaluative
Page 13 of 16
Bosshard et al., Cogent Psychology (2016), 3: 1176691http://dx.doi.org/10.1080/23311908.2016.1176691
conditioning [Randomized Controlled Trial Research Support, Non-U.S. Gov’t]. Journal of Personality and Social Psychology, 86, 345–355. doi:10.1037/0022-3514.86.2.345
Dovidio, J. F., Kawakami, K., & Gaertner, S. L. (2002). Implicit and explicit prejudice and interracial interaction. Journal of Personality and Social Psychology, 82, 62–68. doi:10.1037/0022-3514.82.1.62
Dunning, J., Auriemmo, A., Castille, C., & Hajcak, G. (2010). In the face of anger: Startle modulation to graded facial expressions. Psychophysiology, 47, 874–878.
Falkenstein, M., Hohnsbein, J., & Hoormann, J. (1994). Effects of choice complexity on different subcomponents of the late positive complex of the event-related potential. Electroencephalography and Clinical Neurophysiology/Evoked Potentials Section, 92, 148–160. doi:10.1016/0168-5597(94)90055-8
Fazio, R. H., Jackson, J. R., Dunton, B. C., & Williams, C. J. (1995). Variability in automatic activation as an unobtrusive measure of racial attitudes: A bona fide pipeline? Journal of Personality and Social Psychology, 69, 1013–1027. doi:10.1037/0022-3514.69.6.1013
Fiedler, K., Messner, C., & Bluemke, M. (2006). Unresolved problems with the “I”, the “A”, and the “T”: A logical and psychometric critique of the Implicit Association Test (IAT). European Review of Social Psychology, 17, 74–147. doi:10.1080/10463280600681248
Foxall, G. R. (2008). Reward, emotion and consumer choice: From neuroeconomics to neurophilosophy. Journal of Consumer Behaviour, 7, 368–396. doi:10.1002/cb.258
Gable, P. A., & Harmon-Jones, E. (2013). Does arousal per se account for the influence of appetitive stimuli on attentional scope and the late positive potential? Psychophysiology, 50, 344–350. doi:10.1111/psyp.12023
Gattol, V., Sääksjärvi, M., & Carbon, C. C. (2011). Extending the implicit association test (IAT): Assessing consumer attitudes based on multi-dimensional implicit associations. PLoS ONE, 6, e15849. doi:10.1371/journal.pone.0015849
Gawronski, B., & Bodenhausen, G. V., (2006). Associative and propositional processes in evaluation: An integrative review of implicit and explicit attitude change [Research Support, Non-U.S. Gov’t Review]. Psychological Bulletin, 132, 692–731. doi:10.1037/0033-2909.132.5.692
Gawronski, B., & Bodenhausen, G. V. (2012). Self-insight from a dual-process perspective handbook of self-knowledge (pp. 22–38). New York, NY: Guilford Press. ISBN 9781462505111.
Geiser, M., & Walla, P. (2011). Objective measures of emotion during virtual walks through urban environments. Applied Sciences, 1, 1–11. doi:10.3390/app1010001
Grahl, A., Greiner, U., & Walla, P. (2012). Bottle shape elicits gender-specific emotion: A startle reflex modulation study. Psychology, 3, 548–554. doi:10.4236/psych.2012.37081
Greenwald, A. G., & Banaji, M. R. (1995). Implicit social cognition: Attitudes, self-esteem, and stereotypes. Psychological Review, 102, 4–27. doi:10.1.1.304.6161
Greenwald, A. G., Banaji, M. R., Rudman, L. A., Farnham, S. D., Nosek, B. A., & Mellott, D. S. (2002). A unified theory of implicit attitudes, stereotypes, self-esteem, and self-concept. Psychological Review, 109, 3–25. doi:10.1.1.366.9580
Greenwald, A. G., & Farnham, S. D. (2000). Using the implicit association test to measure self-esteem and self-concept. Journal of Personality & Social Psychology, 79, 1022–1038. doi:10.1037/0022-3514.79.6.1022
Greenwald, A. G., McGhee, D. E., & Schwartz, J. L. (1998). Measuring individual differences in implicit cognition: The implicit association test. Journal of Personality and Social Psychology, 74, 1464–1480. doi:10.1037/0022-3514.74.6.1464
Handy, T. C., Smilek, D., Geiger, L., Liu, C., & Schooler, J. W.
(2010). ERP evidence for rapid hedonic evaluation of logos. Journal of Cognitive Neuroscience, 22, 124–138. doi:10.1162/jocn.2008.21180
Harmon-Jones, E. (2004). Contributions from research on anger and cognitive dissonance to understanding the motivational functions of asymmetrical frontal brain activity. Biological Psychology, 67, 51–76. doi:10.1016/j.biopsycho.2004.03.003
Hofmann, W., Gawronski, B., Gschwendner, T., Le, H., & Schmitt, M. (2005). A meta analysis on the correlation between the implicit association test and explicit self-report measures [Meta-Analysis Research Support, Non-U.S. Gov’t]. Personality and Social Psychology Bulletin, 31, 1369–1385. doi:10.1177/0146167205275613
Lang, P. J., Simons, R. F., & Balaban, M. T. (1997). Attention and orienting: Sensory and motivational processes. London: Psychology Press.
Maison, D., Greenwald, A. G., & Bruin, R. (2001). The implicit association test as a measure of implicit consumer attitudes. Polish Psychological Bulletin, 32, 61–69. doi: http://dx.doi.org/10.1.1.459.6351
Mitchell, C. J. (2004). Mere acceptance produces apparent attitude in the implicit association test. Journal of Experimental Social Psychology, 40, 366–373. doi: http://dx.doi.org/10.1016/j.jesp.2003.07.003
Moran, T. P., Jendrusina, A. A., & Moser, J. S. (2013). The psychometric properties of the late positive potential during emotion processing and regulation. Brain Research, 1516, 66–75. doi:10.1016/j.brainres.2013.04.018
Morin, C. (2011). Neuromarketing: The new science of consumer behavior. Society, 48, 131–135. doi: http://dx.doi.org/10.1007/s12115-010-9408-1
Ohme, R., Reykowska, D., Wiener, D., & Choromanska, A. (2010). Application of frontal EEG asymmetry to advertising research. Journal of Economic Psychology, 31, 785–793. doi:10.1016/j.joep.2010.03.008
Olofsson, J. K., Nordin, S., Sequeira, H., & Polich, J. (2008). Affective picture processing: An integrative review of ERP findings. Biological Psychology, 77, 247–265. doi:10.1016/j.biopsycho.2007.11.006
Park, C. W., MacInnis, D. J., Priester, J., Eisingerich, A. B., & Iacobucci, D. (2010). Brand attachment and brand attitude strength: Conceptual and empirical differentiation of two critical brand equity drivers. American Marketing Association, 74, 1–17. doi:10.1509/jmkg.74.6.1
Pastor, M. C., Bradley, M. M., Löw, A., Versace, F., Moltó, J., & Lang, P. J. (2008). Affective picture perception: Emotion, context, and the late positive potential. Brain Research, 1189, 145–151. doi:10.1016/j.brainres.2007.10.072
Petty, R. E., Tormala, Z. L., Briñol, P., & Jarvis, W. B. G. (2006). Implicit ambivalence from attitude change: An exploration of the PAST model. Journal of Personality and Social Psychology, 90, 21. doi:10.1037/0022-3514.90.1.21
Ravaja, N., Somervuori, O., & Salminen, M. (2013). Predicting purchase decision: The role of hemispheric asymmetry over the frontal cortex. Journal of Neuroscience, Psychology, and Economics, 6, 1–13. doi:10.1037/a0029949
Rothermund, K., & Wentura, D. (2004). Underlying processes in the implicit association test (IAT): Dissociating salience from associations. Journal of Experimental Psychology: General, 133, 139–165. doi:10.1037/0096-3445.133.2.139
Rugg, M. D., Mark, R. E., Walla, P., Schloerscheidt, A. M., Birch, C. S., & Allan, K. (1998). Dissociation of the neural correlates of implicit and explicit memory. Nature, 392, 595–598.
Schaefer, M., Berens, H., Heinze, H.-J., & Rotte, M. (2006). Neural correlates of culturally familiar brands of car manufacturers. NeuroImage, 31 861–865. doi:10.1016/j.neuroimage.2005.12.047
Solnais, C., Andreu, J., Sánchez-Fernández, J., & Andréu-Abela, J. (2013). The contribution of neuroscience to consumer research: A conceptual framework and empirical
Page 14 of 16
Bosshard et al., Cogent Psychology (2016), 3: 1176691http://dx.doi.org/10.1080/23311908.2016.1176691
review. Journal of Economic Psychology. doi:10.1016/j.joep.2013.02.011
Stafleu, A., de Graaf, C., van Staveren, W. A., & de Jong, M. A. (1994). Attitudes towards high-fat foods and their low-fat alternatives: Reliability and relationship with fat intake. Appetite, 22, 183–196. doi:10.1006/appe.1994.1018
Stuart, E. W., Shimp, T. A., & Engle, R. W. (2001). Classical conditioning of consumer attitudes: Four experiments in an advertising context. Journal of Consumer Research, 3, 334–349. doi:10.2307/2489480
Sweldens, S., Van Osselaer, S. M., Janiszewski, C., & Janiszewski, C. (2010). Evaluative conditioning procedures and the resilience of conditioned brand attitudes. Journal of Consumer Research, 37, 473–489. doi:10.1086/653656
Thomson, M., MacInnis, D. J., & Park, C. W. (2005). The ties that bind: Measuring the strength of consumers’ emotional attachment to brands. Journal of Consumer Psychology, 15, 77–91. doi:10.1207/s15327663jcp1501_10
Tusche, A., Bode, S., & Haynes, J.-D. (2010). Neural responses to unattended products predict later consumer choices. Journal of Neuroscience, 30, 8024–8031. doi:10.1523/JNEUROSCI.0064-10.2010
Vecchiato, G., Astolfi, L., Tabarrini, A., Salinari, S., Mattia, D., Cincotti, F., … Babiloni, F. (2010). EEG analysis of the brain
activity during the observation of commercial, political, or public service announcements. Computational Intelligence and Neuroscience, 1–7. doi:10.1155/2010/985867
Walla, P., Brenner, G., & Koller, M. (2011). Objective measures of emotion related to brand attitude: A new way to quantify emotion-related aspects relevant to marketing. PLoS ONE, 6, e26782. doi:10.1371/journal.pone.0026782
Walla, P., & Panksepp, J. (2013). Neuroimaging helps to clarify brain affective processing without necessarily clarifying emotions. In K. N. Fountas (Ed.), Novel frontiers of advanced neuroimaging. doi:10.4236/psych.2013.43A032
Walla, P., Rosser, L., Scharfenberger, J., Duregger, C., & Bosshard, S. (2013). Emotion ownership: Different effects on explicit ratings and implicit responses. Psychology, 3A, 213–216. doi:10.4236/psych.2013.43A032
Wang, J. Y., & Minor, M. S. (2008). Validity, reliability, and applicability of psychophysiological techniques in marketing research. Psychology and Marketing, 25, 197–232. doi:10.1002/mar.20206
Wilson, T. D., Lisle, D. J., & Schooler, J. W., Hodges, S. D., Klaaren, K. J., & LaFleur, S. J. (1993). Introspection can reduce post-choice satisfaction. Personality and Social Psychology Bulletin, 19, 331–339. http://dx.doi.org/10.1177/0146167293193010
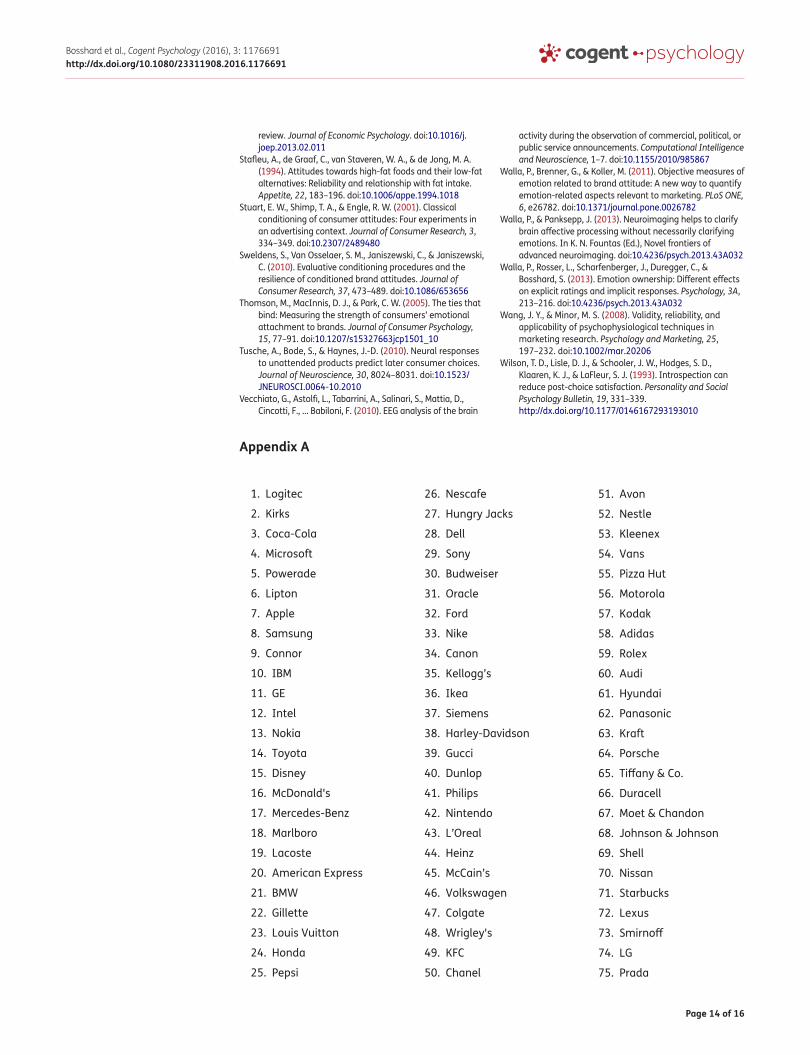
Appendix A
1. Logitec
2. Kirks
3. Coca-Cola
4. Microsoft
5. Powerade
6. Lipton
7. Apple
8. Samsung
9. Connor
10. IBM
11. GE
12. Intel
13. Nokia
14. Toyota
15. Disney
16. McDonald's
17. Mercedes-Benz
18. Marlboro
19. Lacoste
20. American Express
21. BMW
22. Gillette
23. Louis Vuitton
24. Honda
25. Pepsi
26. Nescafe
27. Hungry Jacks
28. Dell
29. Sony
30. Budweiser
31. Oracle
32. Ford
33. Nike
34. Canon
35. Kellogg’s
36. Ikea
37. Siemens
38. Harley-Davidson
39. Gucci
40. Dunlop
41. Philips
42. Nintendo
43. L’Oreal
44. Heinz
45. McCain’s
46. Volkswagen
47. Colgate
48. Wrigley's
49. KFC
50. Chanel
51. Avon
52. Nestle
53. Kleenex
54. Vans
55. Pizza Hut
56. Motorola
57. Kodak
58. Adidas
59. Rolex
60. Audi
61. Hyundai
62. Panasonic
63. Kraft
64. Porsche
65. Tiffany & Co.
66. Duracell
67. Moet & Chandon
68. Johnson & Johnson
69. Shell
70. Nissan
71. Starbucks
72. Lexus
73. Smirnoff
74. LG
75. Prada
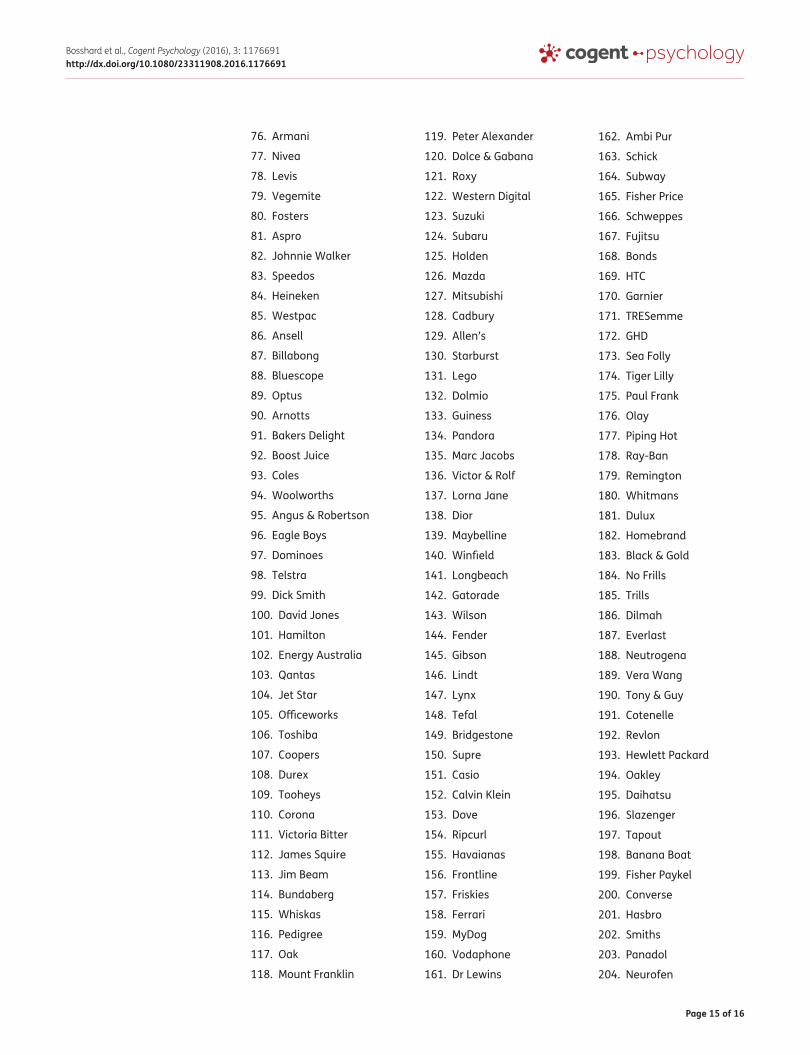
Page 15 of 16
Bosshard et al., Cogent Psychology (2016), 3: 1176691http://dx.doi.org/10.1080/23311908.2016.1176691
76. Armani
77. Nivea
78. Levis
79. Vegemite
80. Fosters
81. Aspro
82. Johnnie Walker
83. Speedos
84. Heineken
85. Westpac
86. Ansell
87. Billabong
88. Bluescope
89. Optus
90. Arnotts
91. Bakers Delight
92. Boost Juice
93. Coles
94. Woolworths
95. Angus & Robertson
96. Eagle Boys
97. Dominoes
98. Telstra
99. Dick Smith
100. David Jones
101. Hamilton
102. Energy Australia
103. Qantas
104. Jet Star
105. Officeworks
106. Toshiba
107. Coopers
108. Durex
109. Tooheys
110. Corona
111. Victoria Bitter
112. James Squire
113. Jim Beam
114. Bundaberg
115. Whiskas
116. Pedigree
117. Oak
118. Mount Franklin
119. Peter Alexander
120. Dolce & Gabana
121. Roxy
122. Western Digital
123. Suzuki
124. Subaru
125. Holden
126. Mazda
127. Mitsubishi
128. Cadbury
129. Allen’s
130. Starburst
131. Lego
132. Dolmio
133. Guiness
134. Pandora
135. Marc Jacobs
136. Victor & Rolf
137. Lorna Jane
138. Dior
139. Maybelline
140. Winfield
141. Longbeach
142. Gatorade
143. Wilson
144. Fender
145. Gibson
146. Lindt
147. Lynx
148. Tefal
149. Bridgestone
150. Supre
151. Casio
152. Calvin Klein
153. Dove
154. Ripcurl
155. Havaianas
156. Frontline
157. Friskies
158. Ferrari
159. MyDog
160. Vodaphone
161. Dr Lewins
162. Ambi Pur
163. Schick
164. Subway
165. Fisher Price
166. Schweppes
167. Fujitsu
168. Bonds
169. HTC
170. Garnier
171. TRESemme
172. GHD
173. Sea Folly
174. Tiger Lilly
175. Paul Frank
176. Olay
177. Piping Hot
178. Ray-Ban
179. Remington
180. Whitmans
181. Dulux
182. Homebrand
183. Black & Gold
184. No Frills
185. Trills
186. Dilmah
187. Everlast
188. Neutrogena
189. Vera Wang
190. Tony & Guy
191. Cotenelle
192. Revlon
193. Hewlett Packard
194. Oakley
195. Daihatsu
196. Slazenger
197. Tapout
198. Banana Boat
199. Fisher Paykel
200. Converse
201. Hasbro
202. Smiths
203. Panadol
204. Neurofen
Page 16 of 16
Bosshard et al., Cogent Psychology (2016), 3: 1176691http://dx.doi.org/10.1080/23311908.2016.1176691
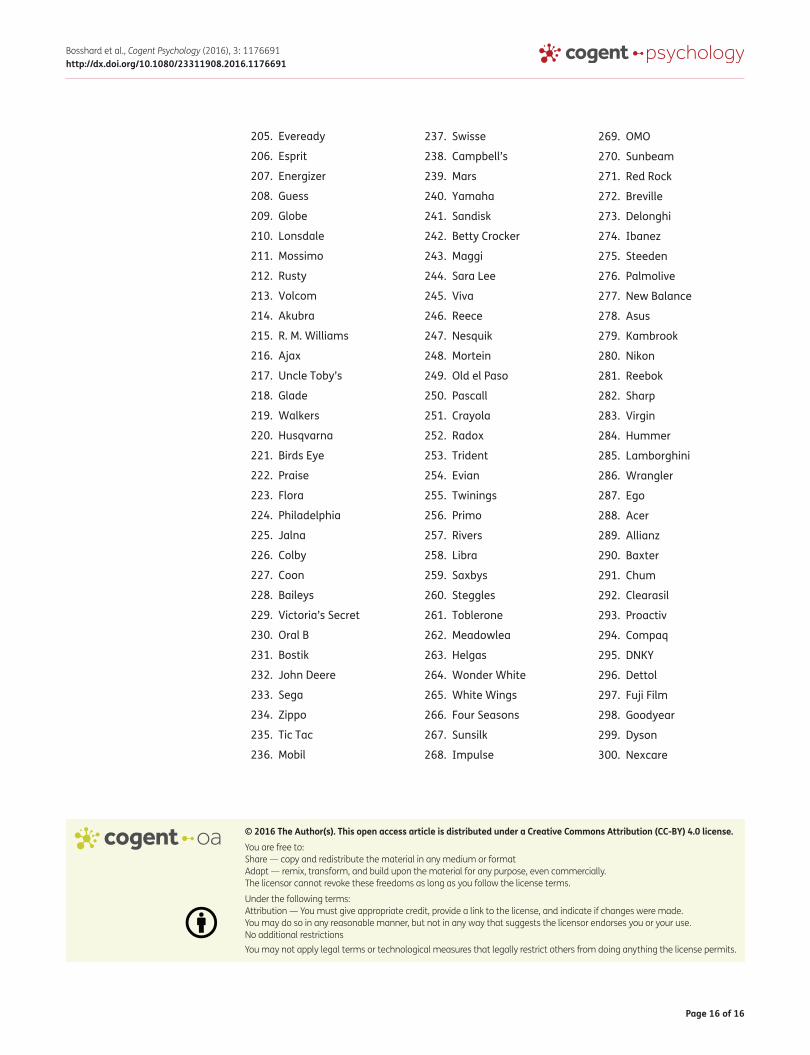
205. Eveready
206. Esprit
207. Energizer
208. Guess
209. Globe
210. Lonsdale
211. Mossimo
212. Rusty
213. Volcom
214. Akubra
215. R. M. Williams
216. Ajax
217. Uncle Toby’s
218. Glade
219. Walkers
220. Husqvarna
221. Birds Eye
222. Praise
223. Flora
224. Philadelphia
225. Jalna
226. Colby
227. Coon
228. Baileys
229. Victoria’s Secret
230. Oral B
231. Bostik
232. John Deere
233. Sega
234. Zippo
235. Tic Tac
236. Mobil
237. Swisse
238. Campbell’s
239. Mars
240. Yamaha
241. Sandisk
242. Betty Crocker
243. Maggi
244. Sara Lee
245. Viva
246. Reece
247. Nesquik
248. Mortein
249. Old el Paso
250. Pascall
251. Crayola
252. Radox
253. Trident
254. Evian
255. Twinings
256. Primo
257. Rivers
258. Libra
259. Saxbys
260. Steggles
261. Toblerone
262. Meadowlea
263. Helgas
264. Wonder White
265. White Wings
266. Four Seasons
267. Sunsilk
268. Impulse
269. OMO
270. Sunbeam
271. Red Rock
272. Breville
273. Delonghi
274. Ibanez
275. Steeden
276. Palmolive
277. New Balance
278. Asus
279. Kambrook
280. Nikon
281. Reebok
282. Sharp
283. Virgin
284. Hummer
285. Lamborghini
286. Wrangler
287. Ego
288. Acer
289. Allianz
290. Baxter
291. Chum
292. Clearasil
293. Proactiv
294. Compaq
295. DNKY
296. Dettol
297. Fuji Film
298. Goodyear
299. Dyson
300. Nexcare
© 2016 The Author(s). This open access article is distributed under a Creative Commons Attribution (CC-BY) 4.0 license.You are free to: Share — copy and redistribute the material in any medium or format Adapt — remix, transform, and build upon the material for any purpose, even commercially.The licensor cannot revoke these freedoms as long as you follow the license terms.
Under the following terms:Attribution — You must give appropriate credit, provide a link to the license, and indicate if changes were made. You may do so in any reasonable manner, but not in any way that suggests the licensor endorses you or your use. No additional restrictions You may not apply legal terms or technological measures that legally restrict others from doing anything the license permits.