Embed Size (px)
Citation preview

ESSENTIALSof Supply ChainManagement

The Essentials Series was created for busy business advisory and corporateprofessionals.The books in this series were designed so that these busy pro-fessionals can quickly acquire knowledge and skills in core business areas.
Each book provides need-to-have fundamentals for those profes-sionals who must:
• Get up to speed quickly, because they have been promoted to anew position or have broadened their responsibility scope
• Manage a new functional area
• Brush up on new developments in their area of responsibility
• Add more value to their company or clients
Other books in this series include:Essentials of Accounts Payable, by Mary S. Schaeffer
Essentials of Capacity Management, by Reginald Tomas Yu-Lee
Essentials of Cash Flow, by H.A. Schaeffer, Jr.
Essentials of Corporate Performance Measurement, by George T.Friedlob, Lydia L.F. Schleifer, and Franklin J. Plewa, Jr.
Essentials of Cost Management, by Joe and Catherine Stenzel
Essentials of CRM:A Guide to Customer RelationshipManagement, by Bryan Bergeron
Essentials of Credit, Collections, and Accounts Receivable,by Mary S. Schaeffer
Essentials of Financial Analysis, by George T. Friedlob and Lydia L.F. Schleifer
Essentials of Intellectual Property, by Paul J. Lerner and Alexander I. Poltorak
Essentials of Shared Services, by Bryan Bergeron
Essentials of Trademarks and Unfair Competition, by Dana Shilling
Essentials of XBRL: Financial Reporting in the 21st Century,by Miklos A.Vasarhelyi, Liv A.Watson, Brian L. McGuire, andRajendra P. Srivastava
For more information on any of the above titles, please visitwww.wiley.com.
Essentials Series

ESSENTIALSof Supply ChainManagement
Michael Hugos
John Wiley & Sons, Inc.

This book is printed on acid-free paper.
Copyright © 2003 by John Wiley & Sons, Inc. All rights reserved.
Published by John Wiley & Sons, Inc., Hoboken, New Jersey.
Published simultaneously in Canada.
No part of this publication may be reproduced, stored in a retrieval system, ortransmitted in any form or by any means, electronic, mechanical, photocopying,recording, scanning, or otherwise, except as permitted under Section 107 or 108 of the 1976 United States Copyright Act, without either the prior written permission of the Publisher, or authorization through payment ofthe appropriate per-copy fee to the Copyright Clearance Center, Inc.,222 Rosewood Drive, Danvers, MA 01923, 978-750-8400, fax 978-750-4470,or on the web at www.copyright.com. Requests to the Publisher for permissionshould be addressed to the Permissions Department, John Wiley & Sons, Inc.,111 River Street, Hoboken, NJ 07030, 201-748-6011, fax 201-748-6008,e-mail: [email protected].
Limit of Liability/Disclaimer of Warranty:While the publisher and author haveused their best efforts in preparing this book, they make no representations or warranties with respect to the accuracy or completeness of the contents ofthis book and specifically disclaim any implied warranties of merchantability or fitness for a particular purpose. No warranty may be created or extended bysales representatives or written sales materials. The advice and strategies con-tained herein may not be suitable for your situation. You should consult with aprofessional where appropriate. Neither the publisher nor author shall be liablefor any loss of profit or any other commercial damages, including but not limited to special, incidental, consequential, or other damages.
For general information on our other products and services, or technical support,please contact our Customer Care Department within the United States at 800-762-2974, outside the United States at 317-572-3993, or fax 317-572-4002.
Wiley also publishes its books in a variety of electronic formats. Some contentthat appears in print may not be available in electronic books.
For more information about Wiley products, visit our web site atwww.wiley.com.
ISBN 0-471-23517-2
Printed in the United States of America.
10 9 8 7 6 5 4 3 2 1
∞

To my wife,Venetia


Preface viii
Acknowledgments x
1 Basic Concepts of Supply Chain Management 1
2 Supply Chain Operations: Planning and Sourcing 43
3 Supply Chain Operations: Making and Delivering 77
4 Supply Chain Coordination and Use of Technology 103
5 Measuring Performance: Supply Chain Metrics 137
6 Defining Supply Chain Opportunities 173
7 Developing Supply Chain Systems 207
8 The Promise of the Real-Time Supply Chain 235
Additional Resources 249
Index 251
Contents

viii
All around us the networking and inter-networking of our economy
is taking place. Companies that do business together are linking up
electronically.They are doing this to better coordinate their actions
and drive costs out of their business operations.
Business in this emerging networked world is as much about process
as it is about product.This is because market forces, driven by the speed
of communications that electronic networks now make possible, are
making product life cycles shorter and shorter. Customer tastes and
requirements change quickly. Product inventories are always in danger of
becoming obsolete.
To counter this trend, companies are building up their expertise and
efficiencies in the process of designing and building new products and in
the process of delivering and servicing existing products. Companies that
develop higher skill levels in these areas are clearly better able to ride the
waves of change and profit from developments in the markets they serve.
The processes involved in the designing, building, and delivering of
products to the customers that need them have come to be collectively
referred to as supply chain management. No one company can develop
high skill levels in all areas of supply chain management so companies
are focusing on developing and building their particular strengths, their
core competencies. Companies are defining the roles they want to play
in the markets they serve and linking up with other companies that
have complementary skill sets. This is the dynamic that is driving the
formation of modern supply chains.
Preface

ix
This book is written especially for two groups of readers. It is writ-
ten for the senior executive who must decide what kind of supply
chain their organization needs and how much to spend to get it. It is
also written for the manager who is or soon will be responsible for
building and operating some part of his/her company’s supply chain.
The concepts and techniques presented here serve to create a common
frame of reference that both senior executives and line managers can
use when communicating with each other about supply chain man-
agement issues.
Chapters 1–3 provide an executive overview of the basic principles
and the business operations that drive supply chain performance.
Chapters 4–5 present techniques, technologies, and metrics to use in
coordinating your operations with those of your supply chain partners.
In Chapters 6 and 7 there is a pragmatic approach to use for defining
supply chain opportunities and for designing and building the systems
needed to effectively respond to those opportunities. The last chapter,
Chapter 8, outlines the profit potential now available to companies that
learn to harness the power of the real-time supply chain.
P r e f a c e

In numerous places in this book you will see mention made of a com-
pany named Network Services Company or “Network” for short.
Network (http://www.nsconline.com) is a national cooperative of
distribution companies who service national and local customers all over
North America. I am Network’s Chief Information Officer and have
had the opportunity these last several years to help the company design,
build, and deploy a suite of supply chain management and e-business
systems. These systems help us ride the wave of business developments
now shaping the markets we serve.We take an utterly pragmatic approach
to this undertaking.We have succeeded more often than not and have
learned much along the way.
I would like to thank the Network member companies who are also
the owners of the organization.Without their backing and active partic-
ipation there would be no success. I would like to thank the management
and staff of Network itself. They have built an outstanding company
that I am privileged to be a part of. I wish to give special thanks to the
managers and staff of the Information Technology groups of Network
and its member companies. They have done amazing things.
I am indebted (more than I even know) to my wife Venetia. She
patiently supported me while I wrote this book. She became a week-
end widow as I secluded myself in my study to write these pages. She read
chapters, kept me from going off on tangents, and provided sound advice.
I want to thank my friend Percy for all his input and assistance.Also
thank you to my friend Kelly David—his recent CD often provided the
music I needed to find the way through to the end of this book.
Acknowledgments
x
TEAMFLY
Team-Fly®
TEAMFLY
Team-Fly®

1
After read ing th is chapter you wi l l be ab le to
• Appreciate what a supply chain is and what it does
• Define the different organizations that participate in anysupply chain
• Discuss ways to align your supply chain with your businessstrategy
• Start an intelligent conversation about the supply chainmanagement issues in your company
Supply chains encompass the companies and the business activities
needed to design, make, deliver, and use a product or service.
Businesses depend on their supply chains to provide them with
what they need to survive and thrive. Every business fits into one or
more supply chains and has a role to play in each of them.
The pace of change and the uncertainty about how markets will
evolve has made it increasingly important for companies to be aware of
the supply chains they participate in and to understand the roles that
they play. Those companies that learn how to build and participate in
strong supply chains will have a substantial competitive advantage in
their markets.
CHAPTER 1
Basic Concepts of Supply Chain Management

Nothing Entirely New. . . Just a Significant Evolution
The practice of supply chain management is guided by some basic
underlying concepts that have not changed much over the centuries.
Several hundred years ago, Napoleon made the remark, “An army
marches on its stomach.” Napoleon was a master strategist and a skillful
general and this remark shows that he clearly understood the impor-
tance of what we would now call an efficient supply chain. Unless the
soldiers are fed, the army cannot move.
Along these same lines, there is another saying that goes,“Amateurs
talk strategy and professionals talk logistics.” People can discuss all sorts
of grand strategies and dashing maneuvers but none of that will be pos-
sible without first figuring out how to meet the day-to-day demands of
providing an army with fuel, spare parts, food, shelter, and ammunition.
It is the seemingly mundane activities of the quartermaster and the supply
sergeants that often determine an army’s success. This has many analogies
in business.
The term “supply chain management” arose in the late 1980s and
came into widespread use in the 1990s.Prior to that time,businesses used
terms such as “logistics” and “operations management” instead. Some
definitions of a supply chain are offered below:
• “A supply chain is the alignment of firms that bring productsor services to market.”—from Lambert, Stock, and Ellram in their book Fundamentals of Logistics Management (Lambert,Douglas M., James R. Stock, and Lisa M. Ellram, 1998,Fundamentals of Logistics Management, Boston, MA:Irwin/McGraw-Hill, Chapter 14)
• “A supply chain consists of all stages involved, directly or indirectly, in fulfilling a customer request. The supply chainnot only includes the manufacturer and suppliers, but alsotransporters, warehouses, retailers, and customers them-selves.”—from Chopra and Meindl in their book Supply
2
E S S E N T I A L S o f S u p p l y C h a i n M a n a g e m e n t

Chain Management: Strategy, Planning, and Operations (Chopra,Sunil, and Peter Meindl, 2001, Supply Chain Management:Strategy, Planning, and Operations, Upper Saddle River, NJ:Prentice-Hall, Inc. Chapter 1).
• “A supply chain is a network of facilities and distributionoptions that performs the functions of procurement ofmaterials, transformation of these materials into intermediateand finished products, and the distribution of these finishedproducts to customers.”—from Ganeshan and Harrison at Penn State University in their article An Introduction to Supply Chain Management published athttp://silmaril.smeal.psu.edu/supply_chain_intro.html(Ganeshan, Ram, and Terry P. Harrison, 1995, “AnIntroduction to Supply Chain Management,” Department ofManagement Sciences and Information Systems, 303 BeamBusiness Building, Penn State University, University Park, PA).
If this is what a supply chain is then we can define supply chain man-
agement as the things we do to influence the behavior of the supply chain
and get the results we want. Some definitions of supply chain manage-
ment are:
• “The systemic, strategic coordination of the traditional busi-ness functions and the tactics across these business functionswithin a particular company and across businesses within thesupply chain, for the purposes of improving the long-termperformance of the individual companies and the supply chainas a whole.”—from Mentzer, DeWitt, Deebler, Min, Nix,Smith, and Zacharia in their article Defining Supply ChainManagement in the Journal of Business Logistics (Mentzer, JohnT.,William DeWitt, James S. Keebler, Soonhong Min, NancyW. Nix, Carlo D. Smith, and Zach G. Zacharia, 2001,“Defining Supply Chain Management,” Journal of BusinessLogistics,Vol. 22, No. 2, p. 18).
3
B a s i c C o n c e p t s o f S u p p l y C h a i n M a n a g e m e n t
• “Supply chain management is the coordination of production,inventory, location, and transportation among the participantsin a supply chain to achieve the best mix of responsivenessand efficiency for the market being served.”—my own words.
There is a difference between the concept of supply chain manage-
ment and the traditional concept of logistics. Logistics typically refers to
activities that occur within the boundaries of a single organization and
supply chains refer to networks of companies that work together and
coordinate their actions to deliver a product to market. Also traditional
logistics focuses its attention on activities such as procurement, distribution,
maintenance, and inventory management. Supply chain management
acknowledges all of traditional logistics and also includes activities such as
marketing, new product development, finance, and customer service.
In the wider view of supply chain thinking, these additional activities
are now seen as part of the work needed to fulfill customer requests.
Supply chain management views the supply chain and the organizations
in it as a single entity. It brings a systems approach to understanding and
managing the different activities needed to coordinate the flow of products
and services to best serve the ultimate customer. This systems approach
provides the framework in which to best respond to business require-
ments that otherwise would seem to be in conflict with each other.
Taken individually, different supply chain requirements often have
conflicting needs. For instance, the requirement of maintaining high levels
of customer service calls for maintaining high levels of inventory, but then
the requirement to operate efficiently calls for reducing inventory levels. It
is only when these requirements are seen together as parts of a larger pic-
ture that ways can be found to effectively balance their different demands.
Effective supply chain management requires simultaneous improve-
ments in both customer service levels and the internal operating effi-
ciencies of the companies in the supply chain. Customer service at its
4
E S S E N T I A L S o f S u p p l y C h a i n M a n a g e m e n t
5
B a s i c C o n c e p t s o f S u p p l y C h a i n M a n a g e m e n t
most basic level means consistently high order fill rates, high on-time
delivery rates, and a very low rate of products returned by customers
for whatever reason. Internal efficiency for organizations in a supply
chain means that these organizations get an attractive rate of return on
their investments in inventory and other assets and that they find ways
to lower their operating and sales expenses.
There is a basic pattern to the practice of supply chain manage-
ment. Each supply chain has its own unique set of market demands and
operating challenges and yet the issues remain essentially the same in
every case. Companies in any supply chain must make decisions indi-
vidually and collectively regarding their actions in five areas:
1. Production—What products does the market want? How much of
which products should be produced and by when? This activity
includes the creation of master production schedules that take
into account plant capacities, workload balancing, quality control,
and equipment maintenance.
2. Inventory—What inventory should be stocked at each stage in a
supply chain? How much inventory should be held as raw mate-
rials, semifinished, or finished goods? The primary purpose of
inventory is to act as a buffer against uncertainty in the supply
chain. However, holding inventory can be expensive, so what are
the optimal inventory levels and reorder points?
3. Location—Where should facilities for production and inventory
storage be located? Where are the most cost efficient locations
for production and for storage of inventory? Should existing
facilities be used or new ones built? Once these decisions are
made they determine the possible paths available for product to
flow through for delivery to the final consumer.

6
E S S E N T I A L S o f S u p p l y C h a i n M a n a g e m e n t
4. Transportation—How should inventory be moved from one supply
chain location to another? Air freight and truck delivery are gener-
ally fast and reliable but they are expensive. Shipping by sea or rail
is much less expensive but usually involves longer transit times
and more uncertainty. This uncertainty must be compensated for
by stocking higher levels of inventory. When is it better to use
which mode of transportation?
5. Information—How much data should be collected and how much
information should be shared? Timely and accurate information
holds the promise of better coordination and better decision mak-
ing.With good information, people can make effective decisions
about what to produce and how much, about where to locate
inventory and how best to transport it.
The sum of these decisions will define the capabilities and effec-
tiveness of a company’s supply chain. The things a company can do and
the ways that it can compete in its markets are all very much depend-
ent on the effectiveness of its supply chain. If a company’s strategy is to
serve a mass market and compete on the basis of price, it had better have
a supply chain that is optimized for low cost. If a company’s strategy is
to serve a market segment and compete on the basis of customer serv-
ice and convenience, it had better have a supply chain optimized for
responsiveness.Who a company is and what it can do is shaped by its
supply chain and by the markets it serves.
How the Supply Chain Works
Two influential source books that define principles and practice of sup-
ply chain management are The Goal (Goldratt, Eliyahu M., 1984, The
Goal, Great Barrington, MA: The North River Press Publishing
Corporation); and Supply Chain Management: Strategy, Planning, and
Operation by Sunil Chopra and Peter Meindl. The Goal explores the
7
B a s i c C o n c e p t s o f S u p p l y C h a i n M a n a g e m e n t
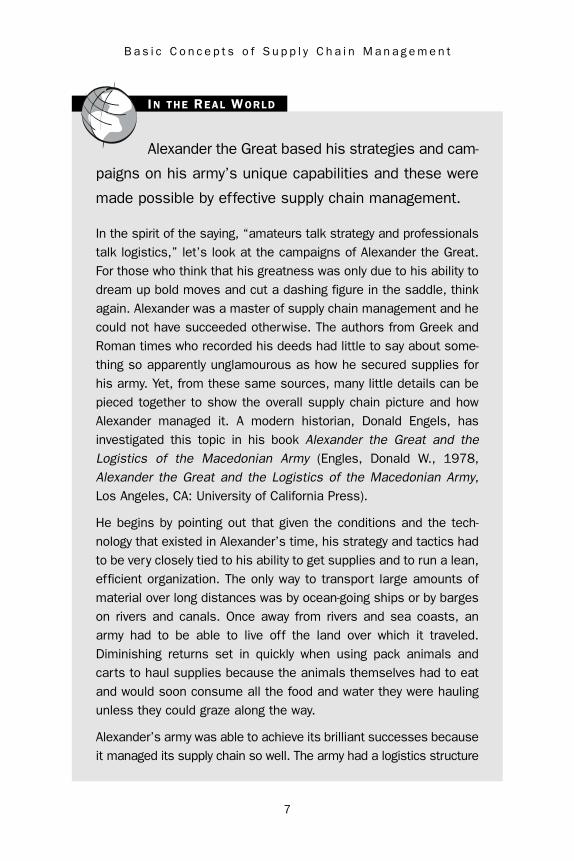
Alexander the Great based his strategies and cam-
paigns on his army’s unique capabilities and these were
made possible by effective supply chain management.
In the spirit of the saying, “amateurs talk strategy and professionalstalk logistics,” let’s look at the campaigns of Alexander the Great.For those who think that his greatness was only due to his ability todream up bold moves and cut a dashing figure in the saddle, thinkagain. Alexander was a master of supply chain management and hecould not have succeeded otherwise. The authors from Greek andRoman times who recorded his deeds had little to say about some-thing so apparently unglamourous as how he secured supplies forhis army. Yet, from these same sources, many little details can bepieced together to show the overall supply chain picture and howAlexander managed it. A modern historian, Donald Engels, hasinvestigated this topic in his book Alexander the Great and theLogistics of the Macedonian Army (Engles, Donald W., 1978,Alexander the Great and the Logistics of the Macedonian Army,Los Angeles, CA: University of California Press).
He begins by pointing out that given the conditions and the tech-nology that existed in Alexander’s time, his strategy and tactics hadto be very closely tied to his ability to get supplies and to run a lean,efficient organization. The only way to transport large amounts ofmaterial over long distances was by ocean-going ships or by bargeson rivers and canals. Once away from rivers and sea coasts, anarmy had to be able to live off the land over which it traveled.Diminishing returns set in quickly when using pack animals andcarts to haul supplies because the animals themselves had to eatand would soon consume all the food and water they were haulingunless they could graze along the way.
Alexander’s army was able to achieve its brilliant successes becauseit managed its supply chain so well. The army had a logistics structure
IN THE REAL WORLD

8
E S S E N T I A L S o f S u p p l y C h a i n M a n a g e m e n t
IN THE REAL WORLD (CONTINUED)
that was fundamentally different from other armies of the time. Inother armies the number of support people and camp followers wasoften as large as the number of actual fighting soldiers becausearmies traveled with huge numbers of carts and pack animals tocarry their equipment and provisions, as well as the people neededto tend them. In the Macedonian army the use of carts was severlyrestricted. Soldiers were trained to carry their own equipment andprovisions. Other contemporary armies did not require their soldiersto carry such heavy burdens but they paid for this because theresulting baggage trains reduced their speed and mobility.
The result of the Macedonian army’s logistics structure was that itbecame the fastest, lightest, and most mobile army of its time. It wascapable of making lightning strikes against an opponent often beforethey were even aware of what was happening. Because the army wasable to move quickly and suddenly, Alexander could use this capa-bility to devise strategies and employ tactics that allowed him to sur-prise and overwhelm enemies that were numerically much larger.
The picture that emerges of how Alexander managed his supplychain is an interesting one. For instance, time and again the histor-ical sources mention that before he entered a new territory, hewould receive the surrender of its ruler and arrange in advance withlocal officials for the supplies his army would need. If a region didnot surrender to him in advance, Alexander would not commit hisentire army to a campaign in that land. He would not risk putting hisarmy in a situation where it could be crippled or destroyed by a lackof provisions. Instead, he would gather intelligence about theroutes, the resources, and the climate of the region and then set offwith a small, light force to surprise his opponent. The main armywould remain behind at a well-stocked base until Alexander securedadequate supplies for it to follow.
Whenever the army set up a new base it looked for an area that pro-vided easy access to a navigable river or a seaport. Then ships

issues and provides answers to the problem of optimizing operations in
any business system whether it be manufacturing, mortgage loan pro-
cessing, or supply chain management. Supply Chain Management: Strategy,
Planning, and Operation is an in-depth presentation of the concepts and
techniques of the profession. Much of the material presented in this
chapter and in the next two chapters can be found in greater detail in
these two books.
The goal or mission of supply chain management can be defined
using Mr. Goldratt’s words as “Increase throughput while simultaneously
reducing both inventory and operating expense.” In this definition
throughput refers to the rate at which sales to the end customer occur.
Depending on the market being served, sales or throughput occurs for
different reasons. In some markets customers value and will pay for high
9
B a s i c C o n c e p t s o f S u p p l y C h a i n M a n a g e m e n t
IN THE REAL WORLD (CONTINUED)
would arrive from other parts of Alexander’s empire bringing in largeamounts of supplies. The army always stayed in its winter campuntil the first spring harvest of the new year so that food supplieswould be available. When it marched, it avoided dry or uninhabitedareas and moved through river valleys and populated regions when-ever possible so the horses could graze and the army could requi-sition supplies along the route.
Alexander had a deep understanding of the capabilities and limita-tions of his supply chain. He learned well how to formulate strate-gies and use tactics that built upon the unique strengths that hislogistics and supply chain capabilities gave him and he wisely tookmeasures to compensate for the limitations of his supply chain. Hisopponents often outnumbered him and were usually fighting on theirown home territory. Yet their advantages were undermined by clum-sy and inefficient supply chains that restricted their ability to act andlimited their options for opposing Alexander’s moves.

10
E S S E N T I A L S o f S u p p l y C h a i n M a n a g e m e n t
levels of service. In other markets customers seek simply the lowest
price for an item.
As we saw in the previous section, there are five areas where com-
panies can make decisions that will define their supply chain capabilities:
Production; Inventory; Location;Transportation; and Information. Chopra
and Meindl define these areas as performance drivers that can be managed
to produce the capabilities needed for a given supply chain.
Effective supply chain management calls first for an understanding
of each driver and how it operates. Each driver has the ability to directly
affect the supply chain and enable certain capabilities.The next step is to
develop an appreciation for the results that can be obtained by mixing
different combinations of these drivers. Let’s start by looking at the
drivers individually.
Production
Production refers to the capacity of a supply chain to make and store
products. The facilities of production are factories and warehouses. The
fundamental decision that managers face when making production
decisions is how to resolve the trade-off between responsiveness and
efficiency. If factories and warehouses are built with a lot of excess
capacity, they can be very flexible and respond quickly to wide swings
in product demand. Facilities where all or almost all capacity is being
used are not capable of responding easily to fluctuations in demand. On
the other hand, capacity costs money and excess capacity is idle capacity
not in use and not generating revenue. So the more excess capacity that
exists, the less efficient the operation becomes.
Factories can be built to accommodate one of two approaches to
manufacturing:
1. Product focus—A factory that takes a product focus performs the
range of different operations required to make a given product
TEAMFLY
Team-Fly®
TEAMFLY
Team-Fly®

line from fabrication of different product parts to assembly of
these parts.
2. Functional focus—A functional approach concentrates on per-
forming just a few operations such as only making a select group
of parts or only doing assembly. These functions can be applied
to making many different kinds of products.
A product approach tends to result in developing expertise about a
given set of products at the expense of expertise about any particular
function.A functional approach results in expertise about particular func-
tions instead of expertise in a given product. Companies need to decide
which approach or what mix of these two approaches will give them the
capability and expertise they need to best respond to customer demands.
As with factories, warehouses too can be built to accommodate dif-
ferent approaches. There are three main approaches to use in ware-
housing:
1. Stock keeping unit (SKU) storage—In this traditional approach, all
of a given type of product is stored together. This is an efficient
and easy to understand way to store products.
2. Job lot storage—In this approach, all the different products related
to the needs of a certain type of customer or related to the needs
of a particular job are stored together.This allows for an efficient
picking and packing operation but usually requires more storage
space than the traditional SKU storage approach.
3. Crossdocking—An approach that was pioneered by Wal-Mart in
its drive to increase efficiencies in its supply chain. In this approach,
product is not actually warehoused in the facility. Instead the
facility is used to house a process where trucks from suppliers
arrive and unload large quantities of different products. These
11
B a s i c C o n c e p t s o f S u p p l y C h a i n M a n a g e m e n t

large lots are then broken down into smaller lots. Smaller lots of
different products are recombined according to the needs of the
day and quickly loaded onto outbound trucks that deliver the
products to their final destination.
Inventory
Inventory is spread throughout the supply chain and includes every-
thing from raw material to work in process to finished goods that are
held by the manufacturers, distributors, and retailers in a supply chain.
Again, managers must decide where they want to position themselves
in the trade-off between responsiveness and efficiency. Holding large
amounts of inventory allows a company or an entire supply chain to be
very responsive to fluctuations in customer demand. However, the cre-
ation and storage of inventory is a cost and to achieve high levels of
efficiency, the cost of inventory should be kept as low as possible.
There are three basic decisions to make regarding the creation and
holding of inventory:
1. Cycle Inventory—This is the amount of inventory needed to sat-
isfy demand for the product in the period between purchases of
the product. Companies tend to produce and to purchase in large
lots in order to gain the advantages that economies of scale can
bring. However, with large lots also comes increased carrying
costs. Carrying costs come from the cost to store, handle, and
insure the inventory. Managers face the trade-off between the
reduced cost of ordering and better prices offered by purchasing
product in large lots and the increased carrying cost of the cycle
inventory that comes with purchasing in large lots.
2. Safety Inventory—Inventory that is held as a buffer against uncer-
tainty. If demand forecasting could be done with perfect accuracy,
12
E S S E N T I A L S o f S u p p l y C h a i n M a n a g e m e n t
then the only inventory that would be needed would be cycle
inventory. But since every forecast has some degree of uncer-
tainty in it, we cover that uncertainty to a greater or lesser degree
by holding additional inventory in case demand is suddenly
greater than anticipated. The trade-off here is to weigh the costs
of carrying extra inventory against the costs of losing sales due
to insufficient inventory.
3. Seasonal Inventory—This is inventory that is built up in anticipa-
tion of predictable increases in demand that occur at certain
times of the year. For example, it is predictable that demand for
anti-freeze will increase in the winter. If a company that makes
anti-freeze has a fixed production rate that is expensive to
change, then it will try to manufacture product at a steady rate
all year long and build up inventory during periods of low
demand to cover for periods of high demand that will exceed its
production rate. The alternative to building up seasonal inventory
is to invest in flexible manufacturing facilities that can quickly
change their rate of production of different products to respond
to increases in demand. In this case, the trade-off is between the
cost of carrying seasonal inventory and the cost of having more
flexible production capabilities.
Location
Location refers to the geographical siting of supply chain facilities. It
also includes the decisions related to which activities should be per-
formed in each facility. The responsiveness versus efficiency trade-off
here is the decision whether to centralize activities in fewer locations to
gain economies of scale and efficiency, or to decentralize activities in
many locations close to customers and suppliers in order for operations
to be more responsive.
13
B a s i c C o n c e p t s o f S u p p l y C h a i n M a n a g e m e n t

When making location decisions, managers need to consider a
range of factors that relate to a given location including the cost of
facilities, the cost of labor, skills available in the workforce, infrastructure
conditions, taxes and tariffs, and proximity to suppliers and customers.
Location decisions tend to be very strategic decisions because they
commit large amounts of money to long-term plans.
Location decisions have strong impacts on the cost and performance
characteristics of a supply chain. Once the size, number, and location of
facilities is determined, that also defines the number of possible paths
through which products can flow on the way to the final customer.
Location decisions reflect a company’s basic strategy for building and
delivering its products to market.
Transportation
This refers to the movement of everything from raw material to finished
goods between different facilities in a supply chain. In transportation
the trade-off between responsiveness and efficiency is manifested in the
choice of transport mode. Fast modes of transport such as airplanes are
very responsive but also more costly. Slower modes such as ship and rail
are very cost efficient but not as responsive. Since transportation costs can
be as much as a third of the operating cost of a supply chain, decisions
made here are very important.
There are six basic modes of transport that a company can choose
from:
1. Ship which is very cost efficient but also the slowest mode of
transport. It is limited to use between locations that are situated
next to navigable waterways and facilities such as harbors and canals.
2. Rail which is also very cost efficient but can be slow.This mode is
also restricted to use between locations that are served by rail lines.
14
E S S E N T I A L S o f S u p p l y C h a i n M a n a g e m e n t

3. Pipelines can be very efficient but are restricted to commodities
that are liquids or gases such as water, oil, and natural gas.
4. Trucks are a relatively quick and very flexible mode of transport.
Trucks can go almost anywhere. The cost of this mode is prone
to fluctuations though, as the cost of fuel fluctuates and the con-
dition of roads varies.
5. Airplanes are a very fast mode of transport and are very respon-
sive. This is also the most expensive mode and it is somewhat
limited by the availability of appropriate airport facilities.
6. Electronic Transport is the fastest mode of transport and it is very
flexible and cost efficient. However, it can only be used for move-
ment of certain types of products such as electric energy, data,
and products composed of data such as music, pictures, and text.
Someday technology that allows us to convert matter to energy
and back to matter again may completely rewrite the theory and
practice of supply chain management (“beam me up, Scotty. . .”).
Given these different modes of transportation and the location of
the facilities in a supply chain, managers need to design routes and net-
works for moving products. A route is the path through which prod-
ucts move and networks are composed of the collection of the paths
and facilities connected by those paths. As a general rule, the higher the
value of a product (such as electronic components or pharmaceuticals),
the more its transport network should emphasize responsiveness and
the lower the value of a product (such as bulk commodities like grain
or lumber), the more its network should emphasize efficiency.
Information
Information is the basis upon which to make decisions regarding the
other four supply chain drivers. It is the connection between all of the
15
B a s i c C o n c e p t s o f S u p p l y C h a i n M a n a g e m e n t

activities and operations in a supply chain. To the extent that this con-
nection is a strong one, (i.e., the data is accurate, timely, and complete),
the companies in a supply chain will each be able to make good deci-
sions for their own operations. This will also tend to maximize the
profitability of the supply chain as a whole. That is the way that stock
markets or other free markets work and supply chains have many of the
same dynamics as markets.
Information is used for two purposes in any supply chain:
1. Coordinating daily activities related to the functioning of the other
four supply chain drivers: production; inventory; location; and
transportation. The companies in a supply chain use available
data on product supply and demand to decide on weekly pro-
duction schedules, inventory levels, transportation routes, and
stocking locations.
2. Forecasting and planning to anticipate and meet future demands.
Available information is used to make tactical forecasts to guide
the setting of monthly and quarterly production schedules and
timetables. Information is also used for strategic forecasts to
guide decisions about whether to build new facilities, enter a
new market, or exit an existing market.
Within an individual company the trade-off between responsive-
ness and efficiency involves weighing the benefits that good information
can provide against the cost of acquiring that information. Abundant,
accurate information can enable very efficient operating decisions and
better forecasts but the cost of building and installing systems to deliver
this information can be very high.
Within the supply chain as a whole, the responsiveness versus effi-
ciency trade-off that companies make is one of deciding how much infor-
mation to share with the other companies and how much information
16
E S S E N T I A L S o f S u p p l y C h a i n M a n a g e m e n t

17
B a s i c C o n c e p t s o f S u p p l y C h a i n M a n a g e m e n t
The Five Major Supply Chain Drivers
Each market or group of customers has a specific set of needs. Thesupply chains that serve different markets need to respond effec-tively to these needs. Some markets demand and will pay for highlevels of responsiveness. Other markets require their supply chainsto focus more on efficiency. The overall effect of the decisions madeconcerning each driver will determine how well the supply chainserves its market and how profitable it is for the participants in thatsupply chain.
T IPS & TECHNIQUES

to keep private. The more information about product supply, customer
demand, market forecasts, and production schedules that companies
share with each other, the more responsive everyone can be. Balancing
this openness however, are the concerns that each company has about
revealing information that could be used against it by a competitor.The
potential costs associated with increased competition can hurt the prof-
itability of a company.
18
E S S E N T I A L S o f S u p p l y C h a i n M a n a g e m e n t
Wal-Mart is a company shaped by its supply chain
and the efficiency of its supply chain has made it a leader
in the markets it serves.
Sam Walton decided to build a company that would serve a massmarket and compete on the basis of price. He did this by creatingone of the world’s most efficient supply chains. The structure andoperations of this company have been defined by the need to lowerits costs and increase its productivity so that it could pass these sav-ings on to its customers in the form of lower prices. The techniquesthat Wal-Mart pioneered are now being widely adopted by its com-petitors and by other companies serving entirely different markets.
Wal-Mart introduced concepts that are now industry standards. Manyof these concepts come directly from the way the company buildsand operates its supply chain. Let’s look at four such concepts:
The strategy of expanding around distribution centers (DCs)
Using electronic data interchange (EDI) with suppliers
The “big box” store format
“Everyday low prices”
EXECUTIVE INSIGHT

19
B a s i c C o n c e p t s o f S u p p l y C h a i n M a n a g e m e n t
EXECUTIVE INSIGHT (CONTINUED)
The strategy of expanding around DCs is central to the way Wal-Martenters a new geographical market. The company looks for areasthat can support a group of new stores, not just a single new store.It then builds a new DC at a central location in the area and opensits first store at the same time. The DC is the supply chain bridge-head into the new territory. It supports the opening of more newstores in the area at a very low additional cost. Those savings arepassed along to the customers.
The use of EDI with suppliers provides the company two substantialbenefits. First of all this cuts the transaction costs associated withthe ordering of products and the paying of invoices. Ordering prod-ucts and paying invoices are, for the most part, well defined and rou-tine processes that can be made very productive and efficientthrough EDI. The second benefit is that these electronic links withsuppliers allow Wal-Mart a high degree of control and coordinationin the scheduling and receiving of product deliveries. This helps toensure a steady flow of the right products at the right time, deliveredto the right DCs, by all Wal-Mart suppliers.
The big box store format allows Wal-Mart to, in effect, combine astore and a warehouse in a single facility and get great operatingefficiencies from doing so. The big box is big enough to hold largeamounts of inventory like a warehouse. And since this inventory isbeing held at the same location where the customer buys it, thereis no delay or cost that would otherwise be associated with movingproducts from warehouse to store. Again, these savings are passedalong to the customer.
Everyday low prices are a way of doing two things. The first thing isto tell its price-conscious customers that they will always get thebest price. They need not look elsewhere or wait for special sales.The effect of this message to customers helps Wal-Mart do the second thing, which is to accurately forecast product sales. By eliminating special sales and assuring customers of low prices, it

The Evolving Structure of Supply Chains
The participants in a supply chain are continuously making decisions
that affect how they manage the five supply chain drivers. Each organ-
ization tries to maximize its performance in dealing with these drivers
through a combination of outsourcing, partnering, and in-house expertise.
In the fast-moving markets of our present economy a company usually
will focus on what it considers to be its core competencies in supply
chain management and outsource the rest.
This was not always the case though. In the slower moving mass
markets of the industrial age it was common for successful companies
to attempt to own much of their supply chain. That was known as ver-
tical integration. The aim of vertical integration was to gain maximum
efficiency through economies of scale (see Exhibit 1.1).
In the first half of the 1900s Ford Motor Company owned much
of what it needed to feed its car factories. It owned and operated iron
20
E S S E N T I A L S o f S u p p l y C h a i n M a n a g e m e n t
EXECUTIVE INSIGHT (CONTINUED)
smoothes out demand swings making demand more steady andpredictable. This way stores are more likely to have what customerswant when they want it.
Taken individually, these four concepts are each useful but their realpower comes from being used in connection with each other. Theycombine to form a supply chain that drives a self-reinforcing busi-ness process. Each concept builds on the strengths of the others tocreate a powerful business model for a company that has grown tobecome a dominant player in its markets.
There seem to be some similarities between Wal-Mart and Alexanderthe Great.
TEAMFLY
Team-Fly®
TEAMFLY
Team-Fly®

21
B a s i c C o n c e p t s o f S u p p l y C h a i n M a n a g e m e n t
Old Supply Chains versus NewVertically integrated companies serving slow-moving mass marketsonce attempted to own much of their supply chains. Today’s fast-moving markets require more flexible and responsive supply chains.
EXHIBIT 1 .1
Raw MaterialsCompany
TransportationCompany
ManufacturingCompany
IndependentDistributor
IndependentRetailer
Fragmented,Fast-Moving
Markets
Raw Material
Transportation
Manufacturing
Distribution
Retail Showroom
Slow-Moving, IndustrialMass Markets
Vertical integration has given wayto “virtual integration.”
Companiesnow focus ontheir corecompetencies,and partnerwith othercompanies tocreate supplychains forfast-movingmarkets.
Divisions of aVertically Integrated
Conglomerate

mines that extracted iron ore, steel mills that turned the ore into steel
products, plants that made component car parts, and assembly plants
that turned out finished cars. In addition, they owned farms where they
grew flax to make into linen car tops and forests that they logged and
sawmills where they cut the timber into lumber for making wooden car
parts. Ford’s famous River Rouge Plant was a monument to vertical
integration—iron ore went in at one end and cars came out at the other
end. Henry Ford in his 1926 autobiography, Today and Tomorrow, boasted
that his company could take in iron ore from the mine and put out a
car 81 hours later (Ford,Henry, 1926,Today and Tomorrow, Portland,OR:
Productivity Press, Inc.).
This was a profitable way of doing business in the more predictable,
one-size-fits-all industrial economy that existed in the early 1900s. Ford
and other businesses churned out mass amounts of basic products. But
as the markets grew and customers became more particular about the
kind of products they wanted, this model began to break down. It could
not be responsive enough or produce the variety of products that were
being demanded. For instance, when Henry Ford was asked about the
number of different colors a customer could request, he said,“they can
have any color they want as long as it’s black.” In the 1920s Ford’s market
share was over 50 percent but by the 1940s it had fallen to below 20
percent. Focusing on efficiency at the expense of being responsive to
customer desires was no longer a successful business model.
Globalization, highly competitive markets, and the rapid pace of
technological change are now driving the development of supply chains
where multiple companies work together, each company focusing on
the activities that it does best. Mining companies focus on mining, timber
companies focus on logging and making lumber, and manufacturing
companies focus on different types of manufacturing from making
component parts to doing final assembly.This way people in each com-
22
E S S E N T I A L S o f S u p p l y C h a i n M a n a g e m e n t

pany can keep up with rapid rates of change and keep learning the new
skills needed to compete in their particular business.
Where companies once routinely ran their own warehouses or
operated their own fleet of trucks, they now have to consider whether
those operations are really a core competency or whether it is more
cost effective to outsource those operations to other companies that
make logistics the center of their business. To achieve high levels of
operating efficiency and to keep up with continuing changes in tech-
nology, companies need to focus on their core competencies. It requires
this kind of focus to stay competitive.
Instead of vertical integration, companies now practice “virtual inte-
gration.” Companies find other companies who they can work with to
perform the activities called for in their supply chains. How a company
defines its core competencies and how it positions itself in the supply
chains it serves is one of the most important decisions it can make.
Participants in the Supply Chain
In its simplest form, a supply chain is composed of a company and the
suppliers and customers of that company.This is the basic group of par-
ticipants that creates a simple supply chain. Extended supply chains
contain three additional types of participants. First there is the supplier’s
supplier or the ultimate supplier at the beginning of an extended supply
chain. Then there is the customer’s customer or ultimate customer at
the end of an extended supply chain. Finally there is a whole category of
companies who are service providers to other companies in the supply
chain. These are companies who supply services in logistics, finance,
marketing, and information technology.
In any given supply chain there is some combination of companies
who perform different functions.There are companies that are producers,
distributors or wholesalers, retailers, and companies or individuals who
23
B a s i c C o n c e p t s o f S u p p l y C h a i n M a n a g e m e n t

are the customers, the final consumers of a product. Supporting these
companies there will be other companies that are service providers that
provide a range of needed services.
Producers
Producers or manufacturers are organizations that make a product.This
includes companies that are producers of raw materials and companies
that are producers of finished goods. Producers of raw materials are
organizations that mine for minerals, drill for oil and gas, and cut timber.
It also includes organizations that farm the land, raise animals, or catch
seafood. Producers of finished goods use the raw materials and sub-
assemblies made by other producers to create their products.
Producers can create products that are intangible items such as music,
entertainment, software, or designs.A product can also be a service such
as mowing a lawn, cleaning an office, performing surgery, or teaching a
skill. In many instances the producers of tangible, industrial products are
moving to areas of the world where labor is less costly. Producers in the
developed world of North America, Europe, and parts of Asia are
increasingly producers of intangible items and services.
Distributors
Distributors are companies that take inventory in bulk from producers
and deliver a bundle of related product lines to customers. Distributors
are also known as wholesalers. They typically sell to other businesses
and they sell products in larger quantities than an individual consumer
would usually buy. Distributors buffer the producers from fluctuations
in product demand by stocking inventory and doing much of the sales
work to find and service customers. For the customer, distributors ful-
fill the “Time and Place” function—they deliver products when and
where the customer wants them.
24
E S S E N T I A L S o f S u p p l y C h a i n M a n a g e m e n t

A distributor is typically an organization that takes ownership of
significant inventories of products that they buy from producers and sell
to consumers. In addition to product promotion and sales, other func-
tions the distributor performs are inventory management, warehouse
operations, and product transportation as well as customer support and
post-sales service. A distributor can also be an organization that only
brokers a product between the producer and the customer and never
takes ownership of that product. This kind of distributor performs
mainly the functions of product promotion and sales. In both these cases,
as the needs of customers evolve and the range of available products
changes, the distributor is the agent that continually tracks customer
needs and matches them with products available.
Retailers
Retailers stock inventory and sell in smaller quantities to the general
public.This organization also closely tracks the preferences and demands
of the customers that it sells to. It advertises to its customers and often
uses some combination of price, product selection, service, and con-
venience as the primary draw to attract customers for the products it
sells. Discount department stores attract customers using price and wide
product selection. Upscale specialty stores offer a unique line of prod-
ucts and high levels of service. Fast food restaurants use convenience
and low prices as their draw.
Customers
Customers or consumers are any organization that purchases and uses a
product. A customer organization may purchase a product in order to
incorporate it into another product that they in turn sell to other cus-
tomers. Or a customer may be the final end user of a product who buys
the product in order to consume it.
25
B a s i c C o n c e p t s o f S u p p l y C h a i n M a n a g e m e n t

Service Providers
These are organizations that provide services to producers, distributors,
retailers, and customers. Service providers have developed special expertise
and skills that focus on a particular activity needed by a supply chain.
Because of this, they are able to perform these services more effectively
and at a better price than producers, distributors, retailers, or consumers
could do on their own.
Some common service providers in any supply chain are providers
of transportation services and warehousing services. These are trucking
companies and public warehouse companies and they are known as
logistics providers. Financial service providers deliver services such as
making loans, doing credit analysis, and collecting on past due invoic-
es. These are banks, credit rating companies, and collection agencies.
Some service providers deliver market research and advertising, while
others provide product design, engineering services, legal services, and
management advice. Still other service providers offer information
technology and data collection services. All these service providers are
integrated to a greater or lesser degree into the ongoing operations of
the producers, distributors, retailers, and consumers in the supply chain.
Supply chains are composed of repeating sets of participants that
fall into one or more of these categories. Over time the needs of the
supply chain as a whole remain fairly stable.What changes is the mix of
participants in the supply chain and the roles that each participant plays.
In some supply chains, there are few service providers because the other
participants perform these services on their own. In other supply chains
very efficient providers of specialized services have evolved and the
other participants outsource work to these service providers instead of
doing it themselves. Examples of supply chain structure are shown in
Exhibit 1.2.
26
E S S E N T I A L S o f S u p p l y C h a i n M a n a g e m e n t

27
B a s i c C o n c e p t s o f S u p p l y C h a i n M a n a g e m e n t
Supply Chain Structure
EXHIBIT 1 .2
Supplier Company Customer
SupplierUltimateSupplier Company
ServiceProvider
ProductDesigner
LogisticsProvider
FinanceProvider
BusinessCustomer
RawMaterialProducer
Manufacturer Distributor Retailer RetailCustomer
MarketResearch
Customer UltimateCustomer

28
E S S E N T I A L S o f S u p p l y C h a i n M a n a g e m e n t
A new category of supply chain service providers
has arisen because of opportunities opened up by the
use of information technology. Functions that companies
each used to do on their own can now be outsourced to
companies who make that function a core competency.
SiteStuff (www.sitestuff.com) is a procurement solutions providerfocused on the real estate management market. The company servescustomers such as Trammell Crow, Jones Lang LaSalle, C.B. RichardEllis, and Insignia/ESG. Charlie Pace is SiteStuff’s chief operatingofficer and has been with the company since its founding in 1999.Charlie’s areas of responsibilities include creating SiteStuff’s prod-uct offering for maintenance, repair, and operations (MRO) Servicesand future lines of business, supply chain operations, and relation-ships with suppliers.
“Our founder, Michael Stuart, was a CIO for several REITS (realestate investment trusts). Back in the 1980s he saw the need inthe property management industry for better budgeting supportbased on more detailed understanding of spending patterns,” saidCharlie. “He put together a plan to offer this solution to propertymanagers before the Internet, but it was too expensive. Then theInternet came along and suddenly it became possible to cheaplynetwork into thousands of commercial properties.”
Traditionally, real estate procurement has been very decentralizedand real estate companies have shared similar issues when pur-chasing maintenance, repair, and operations (MRO) products andservices. This decentralized purchasing process results in:
• A lack of compliance on national purchasing contracts
• High transaction costs due to working with thousands ofvendors
• Lack of visibility into property operations
IN THE REAL WORLD

29
B a s i c C o n c e p t s o f S u p p l y C h a i n M a n a g e m e n t
IN THE REAL WORLD (CONTINUED)
“SiteStuff helps owners and managers of real estate save money,save time, and gain control over property operations by aggregatingtheir buying power, streamlining back-end accounting practices, andallowing them to more effectively track and manage data regardingprocurement activities,” Charlie explained. “I think most people cansee the benefits conceptually. The hard part is to do it in practice.In our daily operations we focus on three areas to get the job done.
“The first and most difficult is change management. We are funda-mentally changing the way distribution works with the properties andvice versa. We put together national solutions for what up until nowhave been regional markets. Distributors now have to deliver a veryspecific and predefined set of products.
“Technology infrastructure is the second area. Managing the order fulfillment process, which includes collecting end user data,order status, etc., is one of our core activities. This calls for us toroll out an e-purchasing system to our customers as well as link oursupplier’s systems with internal tools in order to provide seamlessintegration.
“Changing perceptions so that SiteStuff becomes an acceptedchannel to market—that’s the third. We have successfully demon-strated to property managers, manufacturers, and distributors thatour procurement solution delivers quantifiable benefits to all par-ties. Initially, this was a difficult proposition to prove, however, wegained traction as our volume quickly ramped up.”
SiteStuff did a strategic sourcing assessment for its customersbased on 1999 purchasing data provided by the customers. Thestudy identified the MRO products and services that customerswere buying, what the brand preferences were, whose products per-formed the best, and who had the best pricing. With this data,SiteStuff could zero in on the best-in-class providers of products andservices for its customers. They then began a process of negotiat-ing national contracts with these providers.

Aligning the Supply Chain with Business Strategy
A company’s supply chain is an integral part of its approach to the mar-
kets it serves. The supply chain needs to respond to market require-
ments and do so in a way that supports the company’s business strategy.
The business strategy a company employs starts with the needs of the
30
E S S E N T I A L S o f S u p p l y C h a i n M a n a g e m e n t
IN THE REAL WORLD (CONTINUED)
“For manufacturers we offer them the ability to drive standardizationwith our customers. Through distributor rationalization, we partnerwith a few best-in-class distributors per category, which in turn offersthem a significant increase in the business they get from our proper-ties. And our customers now have access to a single-source, paperlessprocess for purchasing all of their MRO products. They outsource theirpurchasing operations and benefit from better economies of scale.For each constituent in our model, we provide high levels of data onpurchasing activities, customer profiles, and seasonal patterns. Weare bringing transparency to the supply chain.”
In reflecting on the last couple of years, Charlie summarized themain lessons learned. “We have to stay very focused on our coreproposition. We do purchasing of MRO products and services forpeople who manage real estate. We continue to build our value inthat area. We have learned how best to roll out the technology andhow to integrate with our supplier partners. We also have learned a lotabout how to screen suppliers for their ability to implement our tech-nology and how to support and assist our client to grow with us.”
Looking at the next couple of years, Charlie sees the company con-tinuing to grow its client base. “We know we have an excellent pro-curement solution in place now. We will continue to grow andenhance our facility management service offerings. We will furtherintegrate our systems with those of suppliers. Where there is realestate and a need to manage it, we have a solution and real estateleaders are starting to realize that.”
TEAMFLY
Team-Fly®
TEAMFLY
Team-Fly®

customers that the company serves or will serve. Depending on the
needs of its customers, a company’s supply chain must deliver the
appropriate mix of responsiveness and efficiency. A company whose
supply chain allows it to more efficiently meet the needs of its cus-
tomers will gain market share at the expense of other companies in that
market and also will be more profitable.
For example, let’s consider two companies and the needs that their
supply chains must respond to. The two companies are 7-Eleven and
Sam’s Club, which is a part of Wal-Mart. The customers who shop at
convenience stores like 7-Eleven have a different set of needs and pref-
erences from those who shop at a discount warehouse like Sam’s Club.
The 7-Eleven customer is looking for convenience and not the lowest
price. That customer is often in a hurry and prefers that the store be
close by and have enough variety of products so that they can pick up
small amounts of common household or food items that they need
immediately. Sam’s Club customers are looking for the lowest price.
They are not in a hurry and are willing to drive some distance and buy
large quantities of limited numbers of items in order to get the lowest
price possible.
Clearly the supply chain for 7-Eleven needs to emphasize respon-
siveness.That group of customers expects convenience and will pay for
it. On the other hand, the Sam’s Club supply chain needs to focus tightly
on efficiency. The Sam’s Club customer is very price conscious and the
supply chain needs to find every opportunity to reduce costs so that these
savings can be passed on to the customers. Both of these companies’
supply chains are well aligned with their business strategies and because
of this they are each successful in their markets.
There are three steps to use in aligning your supply chain with
your business strategy. The first step is to understand the markets that
your company serves. The second step is to define the strengths or core
31
B a s i c C o n c e p t s o f S u p p l y C h a i n M a n a g e m e n t

competencies of your company and the role the company can or could
play in serving its markets. The last step is to develop the needed supply
chain capabilities to support the roles your company has chosen.
Understand the Markets Your Company Serves
Begin by asking questions about your customers. What kind of cus-
tomer does your company serve? What kind of customer does your
customer sell to? What kind of supply chain is your company a part of?
The answers to these questions will tell you what supply chains your
company serves and whether your supply chain needs to emphasize
responsiveness or efficiency. Chopra and Meindl have defined the fol-
lowing attributes that help to clarify requirements for the customers
you serve. These attributes are:
• The quantity of the product needed in each lot—Do your cus-tomers want small amounts of products or will they buy largequantities? A customer at a convenience store or a drug storebuys in small quantities. A customer of a discount warehouseclub, such as Sam’s Club, buys in large quantities.
• The response time that customers are willing to tolerate—Doyour customers buy on short notice and expect quick serviceor is a longer lead time acceptable? Customers of a fast foodrestaurant certainly buy on short notice and expect quickservice. Customers buying custom machinery would plan thepurchase in advance and expect some lead time before theproduct could be delivered.
• The variety of products needed—Are customers looking for anarrow and well-defined bundle of products or are they looking for a wide selection of different kinds of products?Customers of a fashion boutique expect a narrowly definedgroup of products. Customers of a “big box” discount storelike Wal-Mart expect a wide variety of products to be avail-able.
32
E S S E N T I A L S o f S u p p l y C h a i n M a n a g e m e n t

• The service level required—Do customers expect all products tobe available for immediate delivery or will they accept partialdeliveries of products and longer lead times? Customers of amusic store expect to get the CD they are looking for imme-diately or they will go elsewhere. Customers who order a custom-built new machine tool expect to wait a while beforedelivery.
• The price of the product—How much are customers willing topay? Some customers will pay more for convenience or highlevels of service and other customers look to buy based onthe lowest price they can get.
• The desired rate of innovation in the product—How fast are newproducts introduced and how long before existing productsbecome obsolete? In products such as electronics and com-puters, customers expect a high rate of innovation. In otherproducts, such as house paint, customers do not desire such ahigh rate of innovation.
Define Core Competencies of Your Company
The next step is to define the role that your company plays or wants to
play in these supply chains. What kind of supply chain participant is
your company? Is your company a producer, a distributor, a retailer, or
a service provider? What does your company do to enable the supply
chains that it is part of? What are the core competencies of your com-
pany? How does your company make money? The answers to these
questions tell you what roles in a supply chain will be the best fit for
your company.
Be aware that your company can serve multiple markets and par-
ticipate in multiple supply chains.A company like W.W. Grainger serves
several different markets. It sells maintenance, repair, and operating
(MRO) supplies to large national account customers such as Ford and
33
B a s i c C o n c e p t s o f S u p p l y C h a i n M a n a g e m e n t
Boeing and it also sells these supplies to small businesses and building
contractors. These two different markets have different requirements as
measured by the above customer attributes.
When you are serving multiple market segments, your company
will need to look for ways to leverage its core competencies. Parts of
these supply chains may be unique to the market segment they serve
while other parts can be combined to achieve economies of scale. For
example, if manufacturing is a core competency for a company, it can
build a range of different products in common production facilities.
Then different inventory and transportation options can be used to
deliver the products to customers in different market segments.
Develop Needed Supply Chain Capabil ities
Once you know what kind of markets your company serves and the role
your company does or will play in the supply chains of these markets,
then you can take this last step,which is to develop the supply chain capa-
bilities needed to support the roles your company plays. This develop-
ment is guided by the decisions made about the five supply chain drivers.
Each of these drivers can be developed and managed to emphasize
responsiveness or efficiency depending on the business requirements.
1. Production—This driver can be made very responsive by building
factories that have a lot of excess capacity and that use flexible
manufacturing techniques to produce a wide range of items. To
be even more responsive, a company could do their production
in many smaller plants that are close to major groups of customers
so that delivery times would be shorter. If efficiency is desirable,
then a company can build factories with very little excess capacity
and have the factories optimized for producing a limited range of
items. Further efficiency could be gained by centralizing produc-
tion in large central plants to get better economies of scale.
34
E S S E N T I A L S o f S u p p l y C h a i n M a n a g e m e n t

2. Inventory—Responsiveness here can be had by stocking high
levels of inventory for a wide range of products. Additional
responsiveness can be gained by stocking products at many loca-
tions so as to have the inventory close to customers and available
to them immediately. Efficiency in inventory management would
call for reducing inventory levels of all items and especially of
items that do not sell as frequently. Also, economies of scale and
cost savings could be gotten by stocking inventory in only a few
central locations.
3. Location—A location approach that emphasizes responsiveness
would be one where a company opens up many locations to be
physically close to its customer base. For example, McDonald’s
has used location to be very responsive to its customers by open-
ing up lots of stores in its high volume markets. Efficiency can
be achieved by operating from only a few locations and central-
izing activities in common locations. An example of this is the
way Dell serves large geographical markets from only a few cen-
tral locations that perform a wide range of activities.
4. Transportation—Responsiveness can be achieved by a transporta-
tion mode that is fast and flexible. Many companies that sell
products through catalogs or over the Internet are able to pro-
vide high levels of responsiveness by using transportation to
deliver their products, often within 24 hours. FedEx and UPS are
two companies who can provide very responsive transportation
services. Efficiency can be emphasized by transporting products
in larger batches and doing it less often. The use of transporta-
tion modes such as ship, rail, and pipelines can be very efficient.
Transportation can be made more efficient if it is originated out
of a central hub facility instead of from many branch locations.
35
B a s i c C o n c e p t s o f S u p p l y C h a i n M a n a g e m e n t

5. Information—The power of this driver grows stronger each year
as the technology for collecting and sharing information becomes
more widespread, easier to use, and less expensive. Information,
much like money, is a very useful commodity because it can be
applied directly to enhance the performance of the other four
supply chain drivers. High levels of responsiveness can be
achieved when companies collect and share accurate and timely
data generated by the operations of the other four drivers. The
supply chains that serve the electronics markets are some of the
most responsive in the world. Companies in these supply chains
from manufacturers, to distributors, to the big retail stores collect
and share data about customer demand, production schedules,
and inventory levels.
Where efficiency is more the focus, less information about
fewer activities can be collected. Companies may also elect to
share less information among themselves so as not to risk having
that information used against them. Please note, however, that
these information efficiencies are only efficiencies in the short
term and they become less efficient over time because the cost of
information continues to drop and the cost of the other four
drivers usually continues to rise. Over the longer term, those
companies and supply chains that learn how to maximize the use
of information to get optimal performance from the other drivers
will gain the most market share and be the most profitable.
36
E S S E N T I A L S o f S u p p l y C h a i n M a n a g e m e n t

37
B a s i c C o n c e p t s o f S u p p l y C h a i n M a n a g e m e n t
Three Steps to Align Supply Chain & Business Strategy
T IPS & TECHNIQUES

38
E S S E N T I A L S o f S u p p l y C h a i n M a n a g e m e n t
Sunil Chopra is the IBM Distinguished Professor
of Operations Management at Northwestern University’s
Kellogg School of Management and a director of the
Masters of Management in Manufacturing program. He is
also co-author of Supply Chain Management: Strategy,
Planning, and Operation, a definitive and widely recog-
nized source book in the field.
Wal-Mart and Dell Computers are two companies that have risen toprominence using a business strategy that offers low prices as a keyselling point to their customers. This strategy requires that their sup-ply chains be highly efficient in order to generate the cost savingsneeded to make a profit at the low prices they offer. Professor Choprahas followed these two companies and offers an analysis of how theyhave aligned their supply chains to support their business strategies.
To begin with, he points out that Wal-Mart’s competitors openedstores in ones and twos and used demographic data to select storesites. Wal-Mart took a supply chain approach and would not evenopen a store in an area unless they determined that the area couldsupport a distribution center (DC) and a sufficient number of storesto gain scale economies at the DC.
Then they targeted specific business operations from which to getefficiencies. “Wal-Mart said 15 years ago we are going to replenishour stores much more efficiently. They began to replenish storestwo times a week where their competition was replenishing twotimes a month. What this meant was that a Wal-Mart manager onlyhad to forecast for half a week and an equally capable store man-ager elsewhere had to forecast sales and inventory needs for half amonth—they couldn’t do as well.
EXECUTIVE INSIGHT

39
B a s i c C o n c e p t s o f S u p p l y C h a i n M a n a g e m e n t
EXECUTIVE INSIGHT (CONTINUED)
“Since they were replenishing more often, they pioneered the cross-docking technique in order to reduce the cost of small lot replen-ishment. They also said that they would own and control their owntrucks and their computer systems because these were the twoassets that they used to make their supply chain so efficient. Theyinvested heavily in information technology and trucks—they boughta fleet of trucks. They made these into core competencies of thecompany.
“When I look at Dell,” said Professor Chopra, “I see a company whowas able to live through and learn from a big mistake they madeearly on. Their roots were as a direct sales company but then in theearly 90s they tried to sell through retail stores and almost wentbroke. That drove them back to the direct model and they have notstrayed since.
“PCs are now much like cars, it is more of a replacement marketthan a growth market. Customers know what they want and theyalso want a good price. Dell’s message to the market is customiza-tion and great prices. They can support this strategy because theyenjoy economies of scale and postpone assembly. They use a fewlarge facilities to assemble PCs, they assemble to order and not tostock so inventory is kept very low. In a high change technology mar-ket they do not get stuck with obsolete inventory. Their shippingcosts are high but there is enough profit margin to cover that.
“This business model is finely tuned to the demands of the market,but what would happen if the PC market suddenly changed?”Professor Chopra painted a scenario that gives insight into how acompany must always adjust its strategy and its supply chain to thedemands of the market. “Low inventory is good in a technology mar-ket where there is a lot of churn and customers value customiza-tion. But what if the PC market is on the verge of standardization?The higher up we get in PC performance levels, the less the valueof the next incremental improvement in performance. Dell and its

Chapter Summary
A supply chain is composed of all the companies involved in the design,
production, and delivery of a product to market. Supply chain man-
agement is the coordination of production, inventory, location, and
transportation among the participants in a supply chain to achieve the
best mix of responsiveness and efficiency for the market being served.
The goal of supply chain management is to increase sales of goods and
services to the final, end use customer while at the same time reducing
both inventory and operating expenses.
The business model of vertical integration that came out of the
industrial economy has given way to “virtual integration” of companies
in a supply chain. Each company now focuses on its core competencies
and partners with other companies that have complementary capabilities
for the design and delivery of products to market. Companies must focus
on improvements in their core competencies in order to keep up with
the fast pace of market and technological change in today’s economy.
40
E S S E N T I A L S o f S u p p l y C h a i n M a n a g e m e n t
EXECUTIVE INSIGHT (CONTINUED)
competitors all use many of the same components to build theirmachines. If the market no longer values customization and simplywants the best price on a standard machine, then the Dell modeldoesn’t work as well. Build to stock and position inventory close tothe customers via retail stores becomes a better model.”
There is no one right model for a supply chain. Markets change andas they do, businesses need to reevaluate their business model andtheir strategy. “Since a company’s supply chain has a great impacton its ability to execute its business model successfully, that supplychain must always be adjusted as the business strategy changes.”
TEAMFLY
Team-Fly®
TEAMFLY
Team-Fly®

To succeed in the competitive markets that make up today’s econ-
omy, companies must learn to align their supply chains with the
demands of the markets they serve. Supply chain performance is now a
distinct competitive advantage for companies who excel in this area.
One of the largest companies in North America is a testament to the
power of effective supply chain management. Wal-Mart has grown
steadily over the last 20 years and much, if not most, of its success is
directly related to its evolving capabilities to continually improve its
supply chain.
41
B a s i c C o n c e p t s o f S u p p l y C h a i n M a n a g e m e n t


43
After read ing th is chapter you wi l l be ab le to
• Gain a conceptual appreciation of the business operations in any supply chain
• Exercise an executive level understanding of operationsinvolved in supply chain planning and sourcing
• Start to assess how well these operations are working withinyour own company
As the saying goes,“It’s not what you know,but what you can remem-
ber when you need it.” Since there is an infinite amount of detail
in any situation, the trick is to find useful models that capture the
salient facts and provide a framework to organize the rest of the relevant
details. The purpose of this chapter is to provide some useful models of
the business operations that make up the supply chain.
A Useful Model of Supply Chain Operations
In the first chapter we saw that there are five drivers of supply chain
performance. These drivers can be thought of as the design parameters
or policy decisions that define the shape and capabilities of any supply
chain. Within the context created by these policy decisions, a supply
CHAPTER 2
Supply Chain Operations:Planning and Sourcing
chain goes about doing its job by performing regular, ongoing opera-
tions. These are the “nuts and bolts” operations at the core of every
supply chain.
As a way to get a high level understanding of these operations and
how they relate to each other, we can use the supply chain operations
research or SCOR model developed by the Supply-Chain Council
(Supply Chain Council Inc., 1150 Freeport Road, Pittsburgh, PA 15238,
www.supply-chain.org). This model identifies four categories of opera-
tions.We will use these following four categories to organize and discuss
supply chain operations:
• Plan
• Source
• Make
• Deliver
Plan
This refers to all the operations needed to plan and organize the oper-
ations in the other three categories.We will investigate three operations
in this category in some detail: demand forecasting; product pricing; and
inventory management.
Source
Operations in this category include the activities necessary to acquire the
inputs to create products or services.We will look at two operations here.
The first, procurement, is the acquisition of materials and services. The
second operation,credit and collections, is not traditionally seen as a sourcing
activity but it can be thought of as, literally, the acquisition of cash. Both
these operations have a big impact on the efficiency of a supply chain.
44
E S S E N T I A L S o f S u p p l y C h a i n M a n a g e m e n t
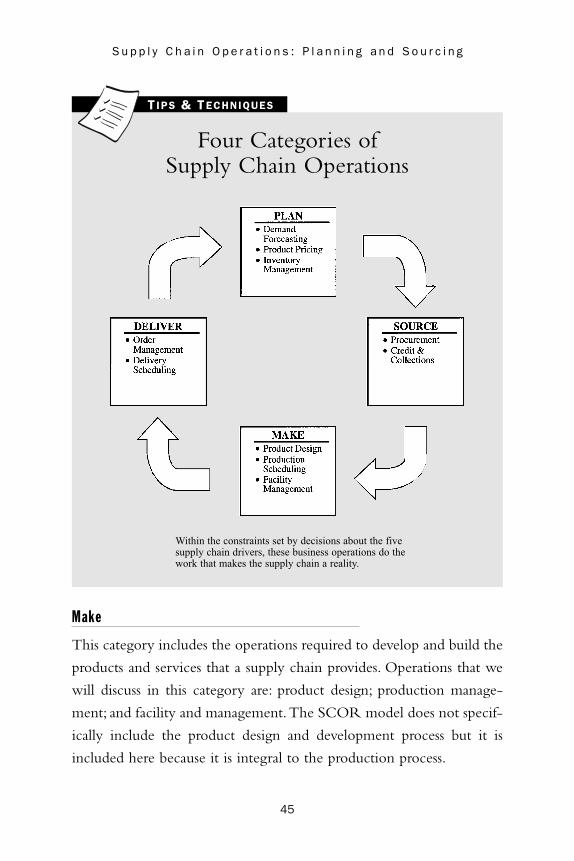
Make
This category includes the operations required to develop and build the
products and services that a supply chain provides. Operations that we
will discuss in this category are: product design; production manage-
ment; and facility and management.The SCOR model does not specif-
ically include the product design and development process but it is
included here because it is integral to the production process.
45
S u p p l y C h a i n O p e r a t i o n s : P l a n n i n g a n d S o u r c i n g
Four Categories ofSupply Chain Operations
T IPS & TECHNIQUES
Within the constraints set by decisions about the five supply chain drivers, these business operations do the work that makes the supply chain a reality.

Deliver
These operations encompass the activities that are part of receiving cus-
tomer orders and delivering products to customers.The two main oper-
ations we will review are order entry/order fulfillment and product
delivery. These two operations constitute the core connections between
companies in a supply chain.
The rest of this chapter presents further detail in the categories of
Plan and Source. There is an executive level overview of three main
operations that constitute the Planning process and two operations that
comprise the Sourcing process.Chapter 3 presents an executive overview
of the key operations in Making and Delivering.
46
E S S E N T I A L S o f S u p p l y C h a i n M a n a g e m e n t
There is also a supply operation called “adaptability.”
Business is an evolving set of challenges and adaptability
is what a company needs in order to succeed over the
long run.
Paper Enterprises (www.paperenterprises.com) is a distributor offood service and paper disposables and janitorial supplies. They arebased in the Bronx and serve the entire New York metropolitan area.Herb Sedler founded the company in 1961. His son Jordan hasbeen working in the business for over 23 years.
Success in a market like New York City calls for a company to beadept at maintaining high levels of customer service while also oper-ating as efficiently as possible. “You learn through trial and error butyou learn. This is what adaptability is all about,” said Jordan Sedler.“For instance, in a lot of Manhattan buildings you have to use afreight elevator manned by a guy who may not really care about yourdelivery schedule. You learn to bring him a doughnut and coffee.”
EXECUTIVE INSIGHT

47
S u p p l y C h a i n O p e r a t i o n s : P l a n n i n g a n d S o u r c i n g
EXECUTIVE INSIGHT (CONTINUED)
“In New York City there are about 300 competitors for every marketsegment,” said Herb Sedler. “There are three or four big, overheadladen corporations and then 297 little guys running around withtrucks who buy cheap and sell cheap. Paper Enterprises straddlesboth worlds. On the one hand, we compete with the big corpora-tions, and on the other hand, we didn’t want to compete with the lit-tle guys so we decided to make them our customers. We became are-distributor who could buy in bulk from manufacturers and resellto all the smaller operators.”
Paper Enterprises fosters a mindset of customer service in all of itsstaff and then they focus on the day-to-day demands of deliveringthat customer service. “I have set the tone that the customer isking,” said Herb. “You have to have a staff who loves the challengeof satisfying the customer. In today’s ABC (activity based costing)world this drive for customer satisfaction does not always look effi-cient. But it is the relentless dedication to satisfying the customerthat ultimately pays off.”
“Logistics. . . , ” said Jordan, “it comes down to being able to operateunder some pretty tough circumstances. There is always a problemwith delivery windows—70 percent of our customers have 2 1/2 hourdelivery windows that we have to meet. And the equipment you usehas to fit the terrain. In lower Manhattan you just can’t use trucks overa certain size. Imagine trying to back an 18 wheeler into a loading dockacross four lanes of traffic with pedestrians crossing back and forth.”
Jordan identified some other operating issues that require his atten-tion. “We have a difficult time finding warehouse space. In New Yorkit is often just not available and when it is available it costs way toomuch. Also in this city there is an interesting situation that you havewhen it comes to people. We hire people from many different eth-nic and cultural backgrounds and there is a cliquish tendency in theemployees from each of these cultures. It is a real trick to keepthese cliques from distracting people and undermining the companyenvironment.”

48
E S S E N T I A L S o f S u p p l y C h a i n M a n a g e m e n t
Demand Forecasting (Plan)
Supply chain management decisions are based on forecasts that define
which products will be required, what amount of these products will be
called for, and when they will be needed.The demand forecast becomes
the basis for companies to plan their internal operations and to cooper-
ate among each other to meet market demand.
EXECUTIVE INSIGHT (CONTINUED)
When they look at technology Herb and Jordan take a very pragmaticapproach. “We have two goals for using technology,” said Jordan.“The first goal is to lower our cost of doing business in a measurableway. How can we use technology to lower costs in inventory control,warehouse management, and order fulfillment? The second goal isto lower our error rate. We don’t want people to manually handle andre-handle data like purchase orders, invoices, etc., because it justincreases the error rate. Our motto is ‘Get it right the first time.’”
“We also want to bring technology to our customer base,” addedHerb. “The immigrants are the new entrepreneurs. They have no formaltraining in distribution and they are often one-man shows. I am a men-tor in the Baruch College entrepreneurship program. As they succeed,Paper Enterprises will succeed. As we show them technology andpractices that help them grow, we become a logistics organizationand not just a paper distributor.”
“I learn something every day. Running a business in New York is likeworking in a microcosm of the whole world. People from every countryare here,” said Jordan. “And it’s funny, where you may think thatthere would be intense and cutthroat competition—not so—there hasevolved a cooperative spirit. That is an important part of how we dobusiness.” “After 9/11,” said Herb, “we called a meeting of distrib-utors in the city and said we would make our trucks available to ourcompetitors who needed to get into lower Manhattan if they wouldhelp us in New Jersey.” Adaptability is an ever-changing blend ofcompetition and cooperation.

All forecasts deal with four major variables that combine to deter-
mine what market conditions will be like. Those variables are:
1. Demand
2. Supply
3. Product Characteristics
4. Competitive Environment
Demand refers to the overall market demand for a group of related
products or services. Is the market growing or declining? If so, what is
the yearly or quarterly rate of growth or decline? Or maybe the market
is relatively mature and demand is steady at a level that has been predictable
for some period of years. Also, many products have a seasonal demand
pattern. For example, snow skis and heating oil are more in demand in
the winter and tennis rackets and sun screen are more in demand in the
summer. Perhaps the market is a developing market—the products or
services are new and there is not much historical data on demand or the
demand varies widely because new customers are just being introduced
to the products. Markets where there is little historical data and lots of
variability are the most difficult when it comes to demand forecasting.
Supply is determined by the number of producers of a product and
by the lead times that are associated with a product.The more producers
there are of a product and the shorter the lead times, the more pre-
dictable this variable is.When there are only a few suppliers or when
lead times are longer, there is more potential uncertainty in a market.
Like variability in demand,uncertainty in supply makes forecasting more
difficult.Also, longer lead times associated with a product require a longer
time horizon over which forecasts must be done. Supply chain forecasts
must cover a time period that encompasses the combined lead times of
all the components that go into the creation of a final product.
49
S u p p l y C h a i n O p e r a t i o n s : P l a n n i n g a n d S o u r c i n g

Product characteristics include the features of a product that influ-
ence customer demand for the product. Is the product new and devel-
oping quickly like many electronic products or is the product mature
and changing slowly or not at all, as is the case with many commodity
products? Forecasts for mature products can cover longer timeframes
than forecasts for products that are developing quickly. It is also impor-
tant to know whether a product will steal demand away from another
product. Can it be substituted for another product? Or will the use of
a product drive the complementary use of a related product? Products
that either compete with or complement each other should be fore-
casted together.
Competitive environment refers to the actions of a company and
its competitors.What is the market share of a company? Regardless of
whether the total size of a market is growing or shrinking, what is the
trend in an individual company’s market share? Is it growing or declin-
ing? What is the market share trend of competitors? Market share trends
can be influenced by product promotions and price wars, so forecasts
should take into account such events that are planned for the upcoming
period. Forecasts should also account for anticipated promotions and
price wars that will be initiated by competitors.
Forecasting Methods
There are four basic methods to use when doing forecasts. Most fore-
casts are done using various combinations of these four methods. Chopra
and Meindl define these methods as:
1. Qualitative
2. Causal
3. Time Series
4. Simulation
50
E S S E N T I A L S o f S u p p l y C h a i n M a n a g e m e n t
TEAMFLY
Team-Fly®
TEAMFLY
Team-Fly®

Qualitative methods rely upon a person’s intuition or subjective
opinions about a market. These methods are most appropriate when
there is little historical data to work with.When a new line of products
is introduced, people can make forecasts based on comparisons with
other products or situations that they consider similar. People can fore-
cast using production adoption curves that they feel reflect what will
happen in the market.
Causal methods of forecasting assume that demand is strongly related
to particular environmental or market factors. For instance, demand for
commercial loans is often closely correlated to interest rates. So if interest
rate cuts are expected in the next period of time, then loan forecasts
can be derived using a causal relationship with interest rates. Another
strong causal relationship exists between price and demand. If prices are
lowered, demand can be expected to increase and if prices are raised,
demand can be expected to fall.
Time series methods are the most common form of forecasting.
They are based on the assumption that historical patterns of demand
are a good indicator of future demand. These methods are best when
there is a reliable body of historical data and the markets being fore-
cast are stable and have demand patterns that do not vary much from one
year to the next. Mathematical techniques such as moving averages
and exponential smoothing are used to create forecasts based on time
series data.These techniques are employed by most forecasting software
packages.
Simulation methods use combinations of causal and time series
methods to imitate the behavior of consumers under different circum-
stances. This method can be used to answer questions such as what will
happen to revenue if prices on a line of products are lowered or what
will happen to market share if a competitor introduces a competing
product or opens a store nearby.
51
S u p p l y C h a i n O p e r a t i o n s : P l a n n i n g a n d S o u r c i n g
52
E S S E N T I A L S o f S u p p l y C h a i n M a n a g e m e n t
Few companies use only one of these methods to do forecasts. Most
companies do several forecasts using several methods and then combine
the results of these different forecasts into the actual forecast that they
use to plan their business. Studies have shown that this process of creating
forecasts using different methods and then combining the results into a
final forecast usually produces better accuracy than the output of any
one method alone.
Regardless of the forecasting methods used, when doing forecasts
and evaluating their results it is important to keep several things in
mind. First of all, short-term forecasts are inherently more accurate than
long-term forecasts. The effect of business trends and conditions can be
much more accurately calculated over short periods than over longer
periods. When Wal-Mart began restocking its stores twice a week
instead of twice a month, the store managers were able to significantly
increase the accuracy of their forecasts because the time periods
involved dropped from two or three weeks to three or four days. Most
long range, multi-year forecasts are highly speculative.
Aggregate forecasts are more accurate than forecasts for individual
products or for small market segments. For example, annual forecasts for
soft drink sales in a given metropolitan area are fairly accurate but when
these forecasts are broken down to sales by districts within the metro-
politan area, they become less accurate. Aggregate forecasts are made
using a broad base of data that provides good forecasting accuracy. As a
rule, the more narrowly focused or specific a forecast is, the less data is
available and the more variability there is in the data, so the accuracy is
diminished.
Finally, forecasts are always wrong to a greater or lesser degree.
There are no perfect forecasts and businesses need to assign some
expected degree of error to every forecast. An accurate forecast may
have a degree of error that is plus or minus 5 percent. A more specula-

tive forecast may have a plus or minus 20 percent degree of error. It is
important to know the degree of error because a business must have
contingency plans to cover those outcomes.What would a company do
if raw material prices were 5 percent higher than expected? What
would it do if demand was 20 percent higher than expected?
53
S u p p l y C h a i n O p e r a t i o n s : P l a n n i n g a n d S o u r c i n g
The Four Forecasting Variables and the Four Forecasting Methods
T IPS & TECHNIQUES

Aggregate Planning
Once demand forecasts have been created, the next step is to create a
plan for the company to meet the expected demand. This is called
aggregate planning and its purpose is to satisfy demand in a way that
maximizes profit for the company. The planning is done at the aggre-
gate level and not at the level of individual stock keeping units (SKUs).
It sets the optimum levels of production and inventory that will be fol-
lowed over the next 3 to 18 months.
The aggregate plan becomes the framework within which short-term
decisions are made about production, inventory, and distribution.Produc-
tion decisions involve setting parameters such as the rate of production
and the amount of production capacity to use, the size of the workforce,
and how much overtime and subcontracting to use. Inventory decisions
include how much demand will be met immediately by inventory on
hand and how much demand can be satisfied later and turned into
backlogged orders. Distribution decisions define how and when product
will be moved from the place of production to the place where it will
be used or purchased by customers.
There are three basic approaches to take in creating the aggregate
plan.They involve trade-offs among three variables.Those variables are: 1)
amount of production capacity; 2) the level of utilization of the produc-
tion capacity; and 3) the amount of inventory to carry.We will look briefly
at each of these three approaches. In actual practice, most companies cre-
ate aggregate plans that are a combination of these three approaches.
1. Use production capacity to match demand. In this approach the total
amount of production capacity is matched to the level of demand.
The objective here is to use 100 percent of capacity at all times.
This is achieved by adding or eliminating plant capacity as needed
and hiring and laying off employees as needed. This approach
results in low levels of inventory but it can be very expensive to
54
E S S E N T I A L S o f S u p p l y C h a i n M a n a g e m e n t

implement if the cost of adding or reducing plant capacity is
high. It is also often disruptive and demoralizing to the work-
force if people are constantly being hired or fired as demand rises
and falls. This approach works best when the cost of carrying
inventory is high and the cost of changing capacity—plant and
workforce—is low.
2. Utilize varying levels of total capacity to match demand. This approach
can be used if there is excess production capacity available. If
existing plants are not used 24 hours a day and 7 days a week
then there is an opportunity to meet changing demand by
increasing or decreasing utilization of production capacity. The
size of the workforce can be maintained at a steady rate and
overtime and flexible work scheduling used to match production
rates. The result is low levels of inventory and also lower average
levels of capacity utilization. The approach makes sense when
the cost of carrying inventory is high and the cost of excess
capacity is relatively low.
3. Use inventory and backlogs to match demand. Using this approach
provides for stability in the plant capacity and workforce and
enables a constant rate of output. Production is not matched
with demand. Instead inventory is either built up during periods
of low demand in anticipation of future demand or inventory is
allowed to run low and backlogs are built up in one period to be
filled in a following period. This approach results in higher
capacity utilization and lower costs of changing capacity but it
does generate large inventories and backlogs over time as
demand fluctuates. It should be used when the cost of capacity
and changing capacity is high and the cost of carrying inventory
and backlogs is relatively low.
55
S u p p l y C h a i n O p e r a t i o n s : P l a n n i n g a n d S o u r c i n g

Product Pricing (Plan)
Companies and entire supply chains can influence demand over time by
using price. Depending on how price is used, it will tend to either max-
imize revenue or gross profit. Typically marketing and sales people want
to make pricing decisions that will stimulate demand during peak seasons.
The aim here is to maximize total revenue. Often financial or production
people want to make pricing decisions that stimulate demand during low
periods. Their aim is to maximize gross profit in peak demand periods
and generate revenue to cover costs during low demand periods.
Relationship of Cost Structure to Pricing
The question for each company to ask is,“Is it better to do price pro-
motion during peak periods to increase revenue or during low periods
to cover costs?” The answer depends on the company’s cost structure.
If a company has flexibility to vary the size of its workforce and pro-
ductive capacity and the cost of carrying inventory is high, then it is
best to create more demand in peak seasons. If there is less flexibility to
vary workforce and capacity and if cost to carry inventory is low, it is
best to create demand in low periods.
An example of a company that can quickly ramp up production
would be an electronics components manufacturer. Such companies have
invested in plant and equipment that can be quickly reconfigured to
produce different final products from an inventory of standard component
parts.The finished goods inventory is expensive to carry because it soon
becomes obsolete and must be written off.
These companies are generally motivated to run promotions in peak
periods to stimulate demand even further. Since they can quickly increase
production levels, a reduction in the profit margin can be made up for by
an increase in total sales if they are able to sell all the product that they
manufacture.
56
E S S E N T I A L S o f S u p p l y C h a i n M a n a g e m e n t

A company that cannot quickly ramp up production levels is a paper
mill.The plant and equipment involved in making paper is very expen-
sive and requires a long lead time to build. Once in place, a paper mill
operates most efficiently if it is able to run at a steady rate all year long.
The cost of carrying an inventory of paper products is less expensive
57
S u p p l y C h a i n O p e r a t i o n s : P l a n n i n g a n d S o u r c i n g
Product Promotion and Company Cost Structure
T IPS & TECHNIQUES

than carrying an inventory of electronic components because paper
products are commodity items that will not become obsolete. These
products also can be stored in less expensive warehouse facilities and are
less likely to be stolen.
A paper mill is motivated to do price promotions in periods of low
demand. In periods of high demand the focus is on maintaining a good
profit margin. Since production levels cannot be increased anyway, there
is no way to respond to or profit from an increase in demand. In periods
where demand is below the available production level, then there is
value in increased demand. The fixed cost of the plant and equipment
is constant so it is best to try to balance demand with available produc-
tion capacity. This way the plant can be run steadily at full capacity.
Inventory Management (Plan)
Inventory management is a set of techniques that are used to manage
the inventory levels within different companies in a supply chain. The
aim is to reduce the cost of inventory as much as possible while still
maintaining the service levels that customers require. Inventory man-
agement takes its major inputs from the demand forecasts for products
and the prices of products.With these two inputs, inventory manage-
ment is an ongoing process of balancing product inventory levels to
meet demand and exploiting economies of scale to get the best prod-
uct prices.
As we discussed in Chapter 1, there are three kinds of inventory: 1)
cycle inventory; 2) seasonal inventory; and 3) safety inventory. Cycle
inventory and seasonal inventory are both influenced by economy of
scale considerations. The cost structure of the companies in any supply
chain will suggest certain levels of inventory based on production costs
and inventory carrying cost. Safety inventory is influenced by the pre-
dictability of product demand. The less predictable product demand is,
58
E S S E N T I A L S o f S u p p l y C h a i n M a n a g e m e n t
the higher the level of safety inventory is required to cover unexpected
swings in demand.
The inventory management operation in a company or an entire
supply chain is composed of a blend of activities related to managing
the three different types of inventory. Each type of inventory has its
own specific challenges and the mix of these challenges will vary from
one company to another and from one supply chain to another.
Cycle Inventory
Cycle inventory is the inventory required to meet product demand
over the time period between placing orders for the product. Cycle
inventory exists because economies of scale make it desirable to make
fewer orders of large quantities of a product rather than continuous
orders of small product quantity. The end use customer of a product
may actually use a product in continuous small amounts throughout the
year. But the distributor and the manufacturer of that product may find
it more cost efficient to produce and stock the product in large batches
that do not match the usage pattern.
Cycle inventory is the buildup of inventory in the supply chain due
to the fact that production and stocking of inventory is done in lot sizes
that are larger than the ongoing demand for the product. For example, a
distributor may experience an ongoing demand for Item A that is 100 units
per week.The distributor finds, however, that it is most cost effective to
order in batches of 650 units.Every six weeks or so the distributor places
an order causing cycle inventory to build up in the distributor’s warehouse
at the beginning of the ordering period. The manufacturer of Item A
that all the distributors order from may find that it is most efficient for
them to manufacture in batches of 14,000 units at a time. This also
results in the buildup of cycle inventory at the manufacturer’s location.
59
S u p p l y C h a i n O p e r a t i o n s : P l a n n i n g a n d S o u r c i n g

Economic Order Quantity
Given the cost structure of a company, there is an order quantity that is
the most cost effective amount to purchase at a time. This is called the
economic order quantity (EOQ) and it is calculated as:
EOQ = 2UO (square root of 2UO / hC)hC
where:
U = annual usage rate
O = ordering cost
C = cost per unit
h = holding cost per year as a percentage of unit cost
For instance, let’s say that Item Z has an annual usage rate (U) of
240, a fixed cost per order (O) of $5.00, a unit cost (C) of $7.00, and
an annual holding cost (h) of 30 percent per unit. If we do the math, it
works out as:
EOQ = 2 x 240 x 5.00.30 x 7.00
EOQ = 24002.1
EOQ = 1142.86
EOQ = 33.81 and rounded to the nearest whole unit, it is 34
If the annual usage rate for Item Z is 240, then the monthly usage
rate is 20. An EOQ of 34 represents about 1 and 3/4 months supply.
This may not be a convenient order size. Small changes in the EOQ do
not have a big impact on total ordering and holding costs so it is best
to round off the EOQ quantity to the nearest standard ordering size. In
the case of Item Z, there may be 30 units in a case. So it would make
sense to adjust the EOQ for Item Z to 30.
60
E S S E N T I A L S o f S u p p l y C h a i n M a n a g e m e n t
TEAMFLY
Team-Fly®
TEAMFLY
Team-Fly®

The EOQ formula works to calculate an order quantity that results
in the most efficient investment of money in inventory. Efficiency here
is defined as the lowest total unit cost for each inventory item. If a cer-
tain inventory item has a high usage rate and it is expensive, the EOQ
formula recommends a low order quantity which results in more orders
per year but less money invested in each order. If another inventory
61
S u p p l y C h a i n O p e r a t i o n s : P l a n n i n g a n d S o u r c i n g
Understanding the Economic Ordering Quantity (EOQ)
Good inventory management requires a company to know the EOQfor all the products it buys. The EOQ for different products changesover time so a company needs an ongoing measurement process tokeep the numbers accurate and up to date.
T IPS & TECHNIQUES
item has a low usage rate and it is inexpensive, the EOQ formula rec-
ommends a high order quantity. This means fewer orders per year but
since the unit cost is low, it still results in the most efficient amount of
money to invest in that item.
Seasonal Inventory
Seasonal inventory happens when a company or a supply chain with a
fixed amount of productive capacity decides to produce and stockpile
products in anticipation of future demand. If future demand is going to
exceed productive capacity, then the answer is to produce products in
times of low demand that can be put into inventory to meet the high
demand in the future.
Decisions about seasonal inventory are driven by a desire to get the
best economies of scale given the capacity and cost structure of each com-
pany in the supply chain. If it is expensive for a manufacturer to increase
productive capacity, then capacity can be considered as fixed. Once the
annual demand for the manufacturer’s products is determined, the most
efficient schedule to utilize that fixed capacity can be calculated.
This schedule will call for seasonal inventory. Managing seasonal
inventory calls for demand forecasts to be accurate since large amounts
of inventory can be built up this way and it can become obsolete or
holding costs can mount if the inventory is not sold off as anticipated.
Managing seasonal inventory also calls for manufacturers to offer price
incentives to persuade distributors to purchase it and put it in their
warehouses well before demand for it occurs.
Safety Inventory
Safety inventory is necessary to compensate for the uncertainty that exists
in a supply chain. Retailers and distributors do not want to run out of
inventory in the face of unexpected customer demand or unexpected
62
E S S E N T I A L S o f S u p p l y C h a i n M a n a g e m e n t

63
S u p p l y C h a i n O p e r a t i o n s : P l a n n i n g a n d S o u r c i n g
Key Points to Remember about Inventory Management
T IPS & TECHNIQUES

delay in receiving replenishment orders so they keep safety stock on
hand. As a rule, the higher the level of uncertainty, the higher the level
of safety stock that is required.
Safety inventory for an item can be defined as the amount of inven-
tory on hand for an item when the next replenishment EOQ lot
arrives. This means that the safety stock is inventory that does not turn
over. In effect, it becomes a fixed asset and it drives up the cost of carry-
ing inventory. Companies need to find a balance between their desire
to carry a wide range of products and offer high availability on all of
them and their conflicting desire to keep the cost of inventory as low
as possible. That balance is reflected quite literally in the amount of
safety stock that a company carries.
Procurement (Source)
Traditionally, the main activities of a purchasing manager were to beat
up potential suppliers on price and then buy products from the lowest
cost supplier that could be found. That is still an important activity, but
there are other activities that are becoming equally important. Because
of this the purchasing activity is now seen as part of a broader function
called procurement. The procurement function can be broken into five
main activity categories:
1. Purchasing
2. Consumption Management
3. Vendor Selection
4. Contract Negotiation
5. Contract Management
Purchasing
These activities are the routine activities related to issuing purchase
orders for needed products. There are two types of products that a
64
E S S E N T I A L S o f S u p p l y C h a i n M a n a g e m e n t

65
S u p p l y C h a i n O p e r a t i o n s : P l a n n i n g a n d S o u r c i n g
Service means different things to different cus-
tomers. Customers have needs that vary depending on
their strengths and weaknesses and the business models
that they use. Effective supply chain companies learn to
tailor their service offerings to match the individual cus-
tomer’s needs.
Service Paper Company (www.servicepaper.com) distributes retailfood and foodservice products, industrial packaging, healthcare dis-posables, and janitorial supplies. They have been in business since1937 and have locations in Seattle, Portland, and Spokane. LeonardGreen is Service Paper’s president.
“We have customers in a number of different market segments andthese customers are in different stages of their business growth,”Leonard said. “We look at each customer and strive to provide a mixof products and services that will make us a valuable part of theiroperations. Let me illustrate this with an example of a customer thatwe have served for some time now and through several stages intheir growth. Back in the ‘80s we began doing business with a smallcompany that operated a handful of coffee shops in Seattle.
“This small company insisted on using specially made products featuring their logo. Their original supplier was not willing to stock“special print” inventory. At Service Paper we viewed the request asa customer requirement rather than an inconvenience. We begantaking large shipments of their logoed special print items from variousmanufacturers and distributed these products to their coffee shopsseveral times a week.
“They were growing rapidly and we were able to work with their staffto facilitate the procurement of their foodservice disposables. Weknew the products and the manufacturers in the foodservice indus-try so we were able to help in educating their purchasing people and
EXECUTIVE INSIGHT

66
E S S E N T I A L S o f S u p p l y C h a i n M a n a g e m e n t
EXECUTIVE INSIGHT (CONTINUED)
in suggesting the products they needed. We also helped them withsourcing and even in scheduling production runs with manufacturersfor products they needed.
“Early on the company CEO was very hands-on in all of these areas.He knew what he wanted the company to be and he was intent onfinding the products they needed. We steered him to the maker ofa new coffee cup lid called the traveler lid. It allowed a person to siphot coffee while they walked or drove without getting too much intheir mouth all at once. When he saw the lid he liked it so much thathe insisted the manufacturer give them an exclusive on the product.The manufacturer wasn’t willing to do that and was ready to walkaway from the business because of that demand. Since I knew bothparties, I was able to act as a referee. I encouraged the CEO to seethat he had a strong potential partner there and perhaps he couldreconsider his position. I helped them start a business relationshipthat has been very beneficial to both companies ever since.”
As the company expanded out of the Seattle area, Service Paperintroduced them to Network Services Company. Network Services isa national cooperative of distribution companies of which ServicePaper is both a member and an owner. “We got Network Servicesinvolved when the company told us they were going to expand intoChicago. I became their advocate within Network. We had lots ofbusiness in Seattle but, at first, there were only a few stores inChicago. The Network member in Chicago was reluctant to stock thespecially printed products and do the many small deliveries to thecoffee shops. Then they expanded into San Francisco and I had to workhard to explain to our member there why it was a good deal.
“We had to change our operating policies to meet the customer’sneeds. We had to carry a substantial inventory of proprietary itemsand we had to accept orders that were often much smaller than ourusual minimum orders. But, over time, they established credibility withus because they met their new store roll out plans and the promisedvolume did materialize. There are now some 25 Network memberswho support them nationwide.”
company buys; 1) direct or strategic materials that are needed to pro-
duce the products that the company sells to its customers; and 2) indi-
rect or MRO (maintenance, repair, and operations) products that a
company consumes as part of daily operations.
The mechanics of purchasing both types of products are largely the
same. Purchasing decisions are made, purchase orders are issued, vendors
are contacted, and orders are placed. There is a lot of data communicated
in this process between the buyer and the supplier—items and quantities
ordered, prices, delivery dates, delivery addresses, billing addresses, and
payment terms. One of the greatest challenges of the purchasing activity
is to see to it that this data communication happens in a timely manner
and without error. Much of this activity is very predictable and follows
well defined routines.
Consumption Management
Effective procurement begins with an understanding of how much of
what categories of products are being bought across the entire compa-
ny as well as by each operating unit. There must be an understanding
of how much of what kinds of products are bought from whom and
at what prices.
Expected levels of consumption for different products at the various
locations of a company should be set and then compared against actual
consumption on a regular basis. When consumption is significantly
above or below expectations, this should be brought to the attention of
the appropriate parties so possible causes can be investigated and appro-
priate actions taken.Consumption above expectations is either a problem
to be corrected or it reflects inaccurate expectations that need to be
reset. Consumption below expectations may point to an opportunity
that should be exploited or it also may simply reflect inaccurate expec-
tations to begin with.
67
S u p p l y C h a i n O p e r a t i o n s : P l a n n i n g a n d S o u r c i n g

Vendor Selection
There must be an ongoing process to define the procurement capabilities
needed to support the company’s business plan and its operating model.
This definition will provide insight into the relative importance of vendor
capabilities. The value of these capabilities have to be considered in
addition to simply the price of a vendor’s product. The value of product
quality, service levels, just in time delivery, and technical support can only
be estimated in light of what is called for by the business plan and the
company’s operating model.
Once there is an understanding of the current purchasing situation
and an appreciation of what a company needs to support its business plan
and operating model, a search can be made for suppliers who have both
the products and the service capabilities needed. As a general rule, a
company seeks to narrow down the number of suppliers it does business
with. This way it can leverage its purchasing power with a few suppliers
and get better prices in return for purchasing higher volumes of product.
Contract Negotiation
As particular business needs arise, contracts must be negotiated with
individual vendors on the preferred vendor list. This is where the specific
items, prices, and service levels are worked out. The simplest negotia-
tions are for contracts to purchase indirect products where suppliers are
selected on the basis of lowest price. The most complex negotiations
are for contracts to purchase direct materials that must meet exacting
quality requirements and where high service levels and technical support
are needed.
Increasingly, though, even negotiations for the purchase of indirect
items such as office supplies and janitorial products are becoming more
complicated because they fall within a company’s overall business plan
to gain greater efficiencies in purchasing and inventory management.
68
E S S E N T I A L S o f S u p p l y C h a i n M a n a g e m e n t
Suppliers of both direct and indirect products need a common set of
capabilities. Gaining greater purchasing efficiencies requires that suppli-
ers of these products have the capabilities to set up electronic connec-
tions for purposes of receiving orders, sending delivery notifications,
sending invoices, and receiving payments. Better inventory manage-
ment requires that inventory levels be reduced, which often means sup-
pliers need to make more frequent and smaller deliveries and orders
must be filled accurately and completely.
All these requirements need to be negotiated in addition to the
basic issues of products and prices. The negotiations must make trade-
offs between the unit price of a product and all the other value added
services that are required.These other services can either be paid for by
a higher margin in the unit price, or by separate payments, or by some
combination of the two. Performance targets must be specified and
penalties and other fees defined when performance targets are not met.
Contract Management
Once contracts are in place, vendor performance against these contracts
must be measured and managed. Because companies are narrowing
down their base of suppliers, the performance of each supplier that is
chosen becomes more important. A particular supplier may be the only
source of a whole category of products that a company needs and if it
is not meeting its contractual obligations, the activities that depend on
those products will suffer.
A company needs the ability to track the performance of its sup-
pliers and hold them accountable to meet the service levels they agreed
to in their contract. Just as with consumption management, people in a
company need to routinely collect data about the performance of sup-
pliers. Any supplier that consistently falls below requirements should be
made aware of their shortcomings and asked to correct them.
69
S u p p l y C h a i n O p e r a t i o n s : P l a n n i n g a n d S o u r c i n g
70
E S S E N T I A L S o f S u p p l y C h a i n M a n a g e m e n t
Often the supplier themselves should be given responsibility for
tracking their own performance.They should be able to proactively take
action to keep their performance up to contracted levels. An example
of this is the concept of vendor managed inventory (VMI).VMI calls
for the vendor to monitor the inventory levels of its product within a
customer’s business. The vendor is responsible for watching usage rates
and calculating EOQs. The vendor proactively ships products to the
customer locations that need them and invoices the customer for those
shipments under terms defined in the contract.
Credit and Collections (Source)
Procurement is the sourcing process a company uses to get the goods
and services it needs. Credit and collections is the sourcing process that
a company uses to get its money. The credit operation screens potential
customers to make sure the company only does business with customers
who will be able to pay their bills. The collections operation is what
actually brings in the money that the company has earned.
Approving a sale is like making a loan for the sale amount for a
length of time defined by the payment terms. Good credit management
tries to fulfill customer demand for products and also minimize the
amount of money tied up in receivables. This is analogous to the way
good inventory management strives to meet customer demand and also
minimize the amount of money tied up in inventory.
The supply chains that a company participates in are often selected
on the basis of credit decisions. Much of the trust and cooperation that
is possible between companies who do business together is based upon
good credit ratings and timely payments of invoices. Credit decisions
affect who a company will sell to and also the terms of the sale. The
credit and collections function can be broken into three main categories
of activity:
TEAMFLY
Team-Fly®
TEAMFLY
Team-Fly®

1. Set Credit Policy
2. Implement Credit and Collections Practices
3. Manage Credit Risk
Set Credit Policy
Credit policy is set by senior managers in a company such as the con-
troller, chief financial officer, treasurer, and chief executive officer.The first
step in this process is to review the performance of the company’s receiv-
ables. Every company has defined a set of measurements that they use to
analyze their receivables, such as: days sales outstanding (DSO); percent of
receivables past customer payment terms; and bad debt write-off amount
as percent of sales.What are the trends? Where are there problems?
Once management has an understanding of the company’s receiv-
ables situation and the trends affecting that situation, they can take the
next step which is to set or change risk acceptance criteria to respond
to the state of the company’s receivables. These criteria should change
over time as economic and market conditions evolve. These criteria
define the kinds of credit risks that the company will take with different
kinds of customers and the payment terms that will be offered.
Implement Credit and Collections Practices
These activities involve putting in place and operating the procedures
that will carry out and enforce the credit policies of the company. The
first major activity in this category is to work with the company sales-
people to approve sales to specific customers. As noted earlier, making
a sale is like making a loan for the amount of the sale. Customers often
buy from a company because that company extends them larger lines
of credit and longer payment terms than its competitors. Credit analysis
goes a long way to assure that this loan is only made to customers who
will pay it off promptly as called for by the terms of the sale.
71
S u p p l y C h a i n O p e r a t i o n s : P l a n n i n g a n d S o u r c i n g

After a sale is made, people in the credit area work with customers
to provide various kinds of service. They work with customers to
process product returns and issue credit memos for returned products.
They work with customers to resolve disputes and clear up questions
by providing copies of contracts, purchase orders, and invoices.
The third major activity that is performed is collections. This is a
process that starts with the ongoing maintenance of each customer’s
accounts payable status. Customers that have past due accounts are con-
tacted and payments are requested. Sometimes new payment terms and
schedules are negotiated.
The collections activity also includes the work necessary to receive
and process customer payments that can come in a variety of different
forms. Some customers will wish to pay by electronic funds transfer
(EFT). Others will use bank drafts and revolving lines of credit or pur-
chasing cards. If customers are in other countries there are still other
ways that payment can be made, such as international letters of credit.
Manage Credit Risk
The credit function works to help the company take intelligent risks
that support its business plan.What may be a bad credit decision from
one perspective may be a good business decision from another per-
spective. If a company wants to gain market share in a certain area it
may make credit decisions that help it to do so. Credit people work
with other people in the business to find innovative ways to lower the
risk of selling to new kinds of customers.
Managing risk can be accomplished by creating credit programs
that are tailored to the needs of customers in certain market segments
such as high technology companies, start-up companies, construction
contractors, or customers in foreign countries. Payment terms that are
attractive to customers in these market segments can be devised. Credit
72
E S S E N T I A L S o f S u p p l y C h a i n M a n a g e m e n t

risks can be lowered by the use of credit insurance, liens on customer
assets, and government loan guarantees for exports.
For important customers and particularly large individual sales,
people in the credit area work with others in the company to structure
special deals just for a single customer. This increases the value that the
company can provide to such a customer and can be a significant part
of securing important new business.
73
S u p p l y C h a i n O p e r a t i o n s : P l a n n i n g a n d S o u r c i n g
Building a recognized and valued brand name is a
goal that many companies try to accomplish. Doing this calls
for a company to be adaptable, to tailor its services to
customers’ needs, and to achieve high levels of efficiency
in the other supply chain operations that it performs.
Waxie Sanitary Supply (www.waxie.com) is a distributor with loca-tions throughout California, Nevada, Utah, Colorado, and Arizona.Over the last 20 years they have been very successful in develop-ing and promoting Waxie brand name products. Charles Wax is theCEO and Cliff Robbins is the company’s Director of InformationTechnology.
Charles Wax explained that, “The company was founded in 1945 bymy uncle Harry Wax and then my father Morris joined him soonafter. The company started under the name of San Diego JanitorialSupply. We grew and in 1962 bought another company in southernCalifornia named Kleenline. We kept both names because each hada loyal customer base. In the 1980s we expanded out of the south-ern California area and we felt the need for a new company namethat would convey who we were as we entered new markets.
“Uncle Harry was a Seabee in the navy during World War II. In thenavy he got the nickname “Waxie” and the logo he chose when he
EXECUTIVE INSIGHT

74
E S S E N T I A L S o f S u p p l y C h a i n M a n a g e m e n t
EXECUTIVE INSIGHT (CONTINUED)
first started the company was a bee operating a floor waxing machine.So it seemed natural for us to adopt the name Waxie and to use abee as our logo.
“We wanted to develop our own brand name because a lot of com-panies buy product and then forget where they bought it. If we putour name on the product they would remember where they got it.Also, if they like the product then they have to come to us to buy it.We redesigned and standardized our logo and the company sloganand put them on products, forms, trucks, brochures, everything.”
The first step is to create a brand name and the next step is to sellits benefits to customers. “We sell a lot of value added services,”said Charles. “We educate the customer to use the best product fortheir specific needs. We show them how to use dilution control tooptimize usage rates for chemicals. We show them how to use floormachines to cut labor costs. We train the customer’s people in howto use our products.
“It is easy for a competitor of ours to say, “We have the same itemand at a lower price.” We respond to this by educating customers tothe fact that 10 percent of their cost is product and the other 90percent is labor. We can show them how to use our products to cuttheir labor costs and that’s where they will see the big savings.
“We are always looking for ways to solve our customers’ problems.We work with each customer to customize our service offerings forthem. For instance, we did a lot of work at the Salt Lake City Olympics.To meet their delivery schedules, we got our drivers security clear-ance and worked closely with people running the event to bring ourtrucks in at night where and when they wanted them.”
“We use technology to help us deliver the services that build theWaxie brand,” Cliff Robbins said. “There is a system to help us doregular surveys of customers and people who aren’t our customers toidentify their needs and spot market trends. We equip our sales and

75
S u p p l y C h a i n O p e r a t i o n s : P l a n n i n g a n d S o u r c i n g
EXECUTIVE INSIGHT (CONTINUED)
service people in the field with laptops. They have the same accessto information as they would if they were in the office—completecustomer profiles, credit status, open issues, and sales history.”
“There is now a web-based order entry system that lets customersview their own customized product catalogs and prices,” Cliff con-tinued. “We are working with the sales people to train our cus-tomers to use this system.” Charles added that, “There is greatbenefit to the customers. They can order 24 by 7, they can make uptheir own order guides, they can see product pictures, and they cansee usage information. As customers start using the system, it cutsour cost to handle the orders and we are also seeing an increase inthe average order size from these customers.”
Delivering the value that makes up the Waxie brand requires a coor-dinated effort from everyone in the company. “To focus everyone onpulling together to build the value of the Waxie brand, we track a fewsimple performance measures,” explained Charles. “Gross marginpercent measures the productivity of the sales process and grossmargin growth measures the overall growth of the company. Wehave a program we call “All Sell All Grow.” It is the bonus programfor all non-sales people. We post branch and overall company grossmargin growth every month throughout the company. So all employ-ees know how we are doing and how they stand on their yearlybonus.”
“Having our own brand helps us manage our margins. It insulatesus somewhat from the actions of the national brand name manu-facturers,” observed Charles. “We wanted to create a brand thatstands for who we are. To remind us why we are here and to remindcustomers of our value.”

Chapter Summary
The business operations that drive the supply chain can be grouped into
four major categories: 1) Plan; 2) Source; 3) Make; and 4) Deliver. The
business operations that comprise these categories are the day-to-day
operations that determine how well the supply chain works. Companies
must continually make improvements in these areas.
Planning refers to all the operations needed to plan and organize
the operations in the other three categories. This includes operations
such as demand forecasting, product pricing, and inventory manage-
ment. Increasingly, it is these planning operations that determine the
potential efficiency of the supply chain.
Sourcing includes the activities necessary to acquire the inputs to
create products or services. This includes operations such as procure-
ment and credit and collections. Both these operations have a big impact
on the efficiency of a supply chain.
76
E S S E N T I A L S o f S u p p l y C h a i n M a n a g e m e n t

77
After read ing th is chapter you wi l l be ab le to
• Exercise an executive level understanding of operationsinvolved in the categories of making products and delivering products
• Assess supply operations in your company that may be candidates for outsourcing
Many companies and the supply chains they participate in serve
customers who are growing more sophisticated every year and
demanding higher levels of service. Continuous improvements to
the operations described in this chapter are needed to deliver the effi-
ciency and responsiveness that evolving supply chains require.
Product Design (Make)
Product designs and selections of the components needed to build these
products are based on the technology available and product perform-
ance requirements. Until recently, little thought was given to how the
design of a product and the selection of its components affect the supply
chain required to make the product.Yet these costs can become 50 per-
cent or more of the product’s cost.
When considering product design from a supply chain perspective the
aim is to design products with fewer parts, simple designs, and modular
CHAPTER 3
Supply Chain Operations:Making and Delivering

construction from generic sub-assemblies. This way the parts can be
obtained from a small group of preferred suppliers. Inventory can be
kept in the form of generic sub-assemblies at appropriate locations in
the supply chain.There will not be the need to hold large finished goods
inventories because customer demand can be met quickly by assembling
final products from generic sub-assemblies as customer orders arrive.
The supply chain required to support a product is molded by the
product’s design. The more flexible, responsive, and cost efficient the
supply chain, the more likely the product will succeed in its market. To
illustrate this point, consider the following scenario.
Fantastic Company designs a fantastic new home entertainment sys-
tem with wide screen TV and surround sound. It performs to demand-
ing specifications and delivers impressive results. But the electronics that
power the entertainment center are built with components from 12 dif-
ferent suppliers.
Demand takes off and the company ramps up production. Managing
quality control and delivery schedules for 12 suppliers is a challenge.
More procurement managers and staff are hired. Assembly of the com-
ponents is complex and delays in the delivery of components from any
of the suppliers can slow down production rates. So buffer stocks of fin-
ished goods are kept to compensate for this.
Several new suppliers were required to provide the specified product
components. One of them has quality control problems and has to be
replaced and another supplier decides after several months to cease pro-
duction of the component it supplies to Fantastic Company. They bring
out a new component with similar features but not an exact replacement.
Fantastic Company has to suspend production of the home entertain-
ment system while a team of engineers redesigns the part of the system
that used the discontinued component so that it can use the new compo-
nent. During this time, buffer stocks run out in some locations and sales
are lost when customers go elsewhere.
78
E S S E N T I A L S o f S u p p l y C h a i n M a n a g e m e n t

A competitor called Nimble Company is attracted by the success of
Fantastic Company and comes out with a competing product. Nimble
Company designed a product with fewer parts and uses components from
only four suppliers. The cost of procurement is much lower since they
only have to coordinate four suppliers instead of 12. There are no pro-
duction delays due to lack of component parts and product assembly is
easier.
While Fantastic Company, who pioneered the market, struggles with
a balky supply chain, Nimble Company provides the market with lower
cost and more reliable supply of the product. Nimble Company with its
responsive and less costly supply chain takes market share away from
Fantastic Company.
What can be learned here? Product design defines the shape of the
supply chain and this has a great impact on the cost and availability of
the product. If product design, procurement, and manufacturing people
can work together in the design of a product, there is a tremendous
opportunity to create products that will be successful and profitable.
There is a natural tendency for design, procurement, and manufactur-
ing people to have different agendas unless their actions are coordinated.
Design people are concerned with meeting the customer requirements.
Procurement people are interested in getting the best prices from a group
of pre-screened preferred suppliers. Folks in manufacturing are looking
for simple fabrication and assembly methods and long production runs.
Cross functional product design teams with representatives from
these three groups have the opportunity to blend the best insights from
each group. Cross functional teams can review the new product design
and discuss the relevant issues. Can existing preferred suppliers provide
the components needed? How many new suppliers are needed? What
opportunities are there to simplify the design and reduce the number of
suppliers? What happens if a supplier stops producing a certain compo-
nent? How can the assembly of the product be made easier?
79
S u p p l y C h a i n O p e r a t i o n s : M a k i n g a n d D e l i v e r i n g

At the same time they are reviewing product designs, a cross func-
tional team can evaluate existing preferred suppliers and manufacturing
facilities. What components can existing suppliers provide? What are
their service levels and technical support capabilities? How large a
workforce and what kind of skills are needed to make the product?
How much capacity is needed and which facilities should be used?
A product design that does a good job of coordinating the three
perspectives—design, procurement, and manufacturing—will result in a
product that can be supported by an efficient supply chain. This will
give the product a fast time to market and a competitive cost.
Production Scheduling (Make)
Production scheduling allocates available capacity (equipment, labor,
and facilities) to the work that needs to be done.The goal is to use avail-
able capacity in the most efficient and profitable manner. The produc-
tion scheduling operation is a process of finding the right balance
between several competing objectives:
• High utilization rates—This often means long production runsand centralized manufacturing and distribution centers. Theidea is to generate and benefit from economies of scale.
• Low inventory levels—This usually means short productionruns and just-in-time delivery of raw materials. The idea is tominimize the assets and cash tied up in inventory.
• High levels of customer service—Often requires high levels ofinventory or many short production runs. The aim is to pro-vide the customer with quick delivery of products and not torun out of stock in any product.
When a single product is to be made in a dedicated facility, sched-
uling means organizing operations as efficiently as possible and running
the facility at the level required to meet demand for the product.When
80
E S S E N T I A L S o f S u p p l y C h a i n M a n a g e m e n t
TEAMFLY
Team-Fly®
TEAMFLY
Team-Fly®

81
S u p p l y C h a i n O p e r a t i o n s : M a k i n g a n d D e l i v e r i n g
several different products are to be made in a single facility or on a single
assembly line, this is more complex. Each product will need to be pro-
duced for some period of time and then time will be needed to switch
over to production of the next product.
The first step in scheduling a multi-product production facility is to
determine the economic lot size for the production runs of each product.
This is a calculation much like the EOQ (economic order quantity)
calculation used in the inventory control process. The calculation of
economic lot size involves balancing the production set up costs for a
product with the cost of carrying that product in inventory. If set ups
are done frequently and production runs are done in small batches, the
result will be low levels of inventory but the production costs will be
higher due to increased set up activity. If production costs are minimized
by doing long production runs, then inventory levels will be higher and
product inventory carrying costs will be higher.
Once production quantities have been determined, the second step
is to set the right sequence of production runs for each product. The
basic rule is that if inventory for a certain product is low relative to its
expected demand, then production of this product should be scheduled
ahead of other products that have higher levels of inventory relative to
their expected demand.A common technique is to schedule production
runs based on the concept of a product’s “run out time.” The run out
time is the number of days or weeks it would take to deplete the prod-
uct inventory on hand given its expected demand. The run out time
calculation for a product is expressed as
R = P / D
where
R = run out time
P = number of units of product on hand
D = product demand in units for a day or week

82
E S S E N T I A L S o f S u p p l y C h a i n M a n a g e m e n t
The scheduling process is a repetitive process that begins with a cal-
culation of the run out times for all products—their R values. The first
production run is then scheduled for the product with the lowest R
value. Assume that the economic lot size for that product has been pro-
duced and then recalculate all product R values.Again, select the product
with the lowest R value, and schedule its production run next. Assume
the economic lot size is produced for this product and again recalculate
Production SchedulingProduction scheduling is a constant balancing act between utiliza-tion rates, inventory levels, and customer service levels.
T IPS & TECHNIQUES
all product R values. This scheduling process can be repeated as often
as necessary to create a production schedule going as far into the future
as needed.
After scheduling is done, the resulting inventory should be contin-
uously checked against actual demand. Is inventory building up too
fast? Should the demand number be changed in the calculation of run
out time? Reality rarely happens as planned so production schedules
need to be constantly adjusted.
Facility Management (Make)
All facility management decisions happen within the constraints set by
decisions about facility locations. Location is one of the five supply
chain drivers discussed in Chapter 1. It is usually quite expensive to shut
down a facility or to build a new one so companies live with the con-
sequences of decisions they make about where to locate their facilities.
Ongoing facility management takes location as a given and focuses on
how best to use the capacity available. This involves making decisions
in three areas:
1. The role each facility will play
2. How capacity is allocated in each facility
3. The allocation of suppliers and markets to each facility
The role each facility will play involves decisions that determine
what activities will be performed in which facilities. These decisions
have a big impact on the flexibility of the supply chain. They largely
define the ways that the supply chain can change its operations to meet
changing market demand. If a facility is designated to perform only a
single function or serve only a single market, it usually cannot easily be
shifted to perform a different function or serve a different market if
supply chain needs change.
83
S u p p l y C h a i n O p e r a t i o n s : M a k i n g a n d D e l i v e r i n g

How capacity is allocated in each facility is dictated by the role that
the facility plays. Capacity allocation decisions result in the equipment
and labor that is employed at the facility. It is easier to change capacity
allocation decisions than to change location decisions but still it is not
cost effective to make frequent changes in allocation. So, once decided,
capacity allocation strongly influences supply chain performance and
profitability.Allocating too little capacity to a facility creates inability to
meet demand and loss of sales.Too much capacity in a facility results in
low utilization rates and higher supply chain costs.
The allocation of suppliers and markets to each facility is influ-
enced by the first two decisions. Depending on the role that a facility
plays and the capacity allocated to it, the facility will require certain
kinds of suppliers and the products and volumes that it can handle
mean that it can support certain types of markets. Decisions about the
suppliers and markets to allocate to a facility will affect the costs for
transporting supplies to the facility and transporting finished products
from the facility to customers. These decisions also affect the overall
supply chain’s ability to meet market demands.
Order Management (Deliver)
Order management is the process of passing order information from
customers back through the supply chain from retailers to distributors
to service providers and producers. This process also includes passing
information about order delivery dates, product substitutions, and back
orders forward through the supply chain to customers. This process has
long relied on the use of the telephone and paper documents such as
purchase orders, sales orders, change orders, pick tickets, packing lists,
and invoices.
A company generates a purchase order and calls a supplier to fill the
order. The supplier who gets the call either fills the order from its own
84
E S S E N T I A L S o f S u p p l y C h a i n M a n a g e m e n t
85
S u p p l y C h a i n O p e r a t i o n s : M a k i n g a n d D e l i v e r i n g
Perkins (www.perkins1.com) is a distributor of food-
service paper products, specialty and bakery foods, restau-
rant equipment, and sanitary supplies serving New England
and the Mid-Atlantic states. The company has just completed
a 2 1/2 year process of planning, building, and moving into
their new headquarters and distribution center.
As the company grew and acquired other companies, it wound upoperating out of six different locations. Over time it became increas-ingly apparent that this collection of facilities was not able to effec-tively support the business. Gary Perkins is the President and CEOwhile Larry Perkins is the company’s Chief Operating Officer (COO).Larry offered, “We had duplicate inventory in these locations andwe had five trucks and five drivers whose sole activity was movinginventory around between these locations. We were becoming lessprofitable in terms of return on sales even though total revenuescontinued to go up.
“Growth of SKUs created bottlenecks in the warehouse at the stor-age and picking slots and at the loading docks. Introduction of newproduct categories was stymied. And when we acquired companiesthere was no opportunity to fold their operations into our existingfacilities. This caused us to squander efficiency realization.”
People from the company traveled and visited other best-in-classfacilities to see what other companies were doing. They also hireda consulting firm that specializes in facilities planning and design towork with them on the design of their new location. There were threemain steps in the process. The first step was to figure, based oninventory requirements, the size of the new facility they needed. Thesecond step was to choose the location for the facility and the laststep was to design the operating procedures and systems and thebuilding itself.
IN THE REAL WORLD

86
E S S E N T I A L S o f S u p p l y C h a i n M a n a g e m e n t
IN THE REAL WORLD (CONTINUED)
They analyzed the business and created projections for the growthof sales in each of their product categories. Design of the new build-ing was based on six-year projections. “This means one year to buildthe building and five years of growth after that,” said Larry. “We cango from a total of around 348,000 square feet now to 530,000square feet in the future. We looked for property that would accom-modate this size of a facility as well as provide us with space toexpand later. We found the perfect location logistically but could notfind the right land—so we kept looking in concentric circles out fromthere until we found a property that fit our needs, our personnel’sneeds, and our budget.
“Then we needed to decide what kind of warehouse operating pro-cedures and systems to use. Different kinds of inventory and dif-ferent product categories had different needs. In effect, what we didwas to wrap the new buiilding around the inventory. We designedfive kinds of aisles—conventional aisles, very narrow aisles, twokinds of high velocity storage aisles with a pick tunnel, andcarousels. Each aisle has its own types of pallet positions and pick-ing slots. The high velocity pick aisles accommodate our fastestturning items. The conventional aisles are for the items that arepicked over 10 times per week and the very narrow aisles are foritems we pick 10 or less times a week. The carousels handle smallbox items or broken cases.”
The new facility was also designed to accommodate other needs.There are very deep loading docks to allow fast loading and unload-ing of trucks. The loading docks also accommodate cross docking.There are parts of the warehouse with different temperatures—ambient room temperature, frozen temperature, and also a cooltermperature area to support new product lines.
A lot of thought went into the design of the administrative and train-ing areas of the facility and into an area to showcase equipment andsupplies that the company sells. “We actually built these areas to

87
S u p p l y C h a i n O p e r a t i o n s : M a k i n g a n d D e l i v e r i n g
IN THE REAL WORLD (CONTINUED)
accommodate 10-year projections,” said Larry. “We have a muchlarger auditorium for group meetings and presentations. And weadded a test kitchen to support in-house meals and “cuttings” offoods being considered for stocking. The test kitchen also show-cases our restaurant equipment offerings. The site layout, technicalcapabilities, size, and design features make this one of the bestfoodservice distribution facilities in the country.”
As they began to move into the new facility, timing and coordinationwere critical. “We moved our smaller locations into the building first.It gave us time to try out new procedures and debug them. We useRF (radio frequency) and bar coding for receiving, drops, picking, andinventory control. We use picking techniques like route picking andwave picking. We needed to train our people, try out the technology,and make adjustments without disrupting our ongoing business.”
The cost of building the new facility will be paid for by increasedoperating efficiencies in the next two to three years. Efficiencies willalso be gained in reduced rent and utilities costs, lower inventorycarrying costs, and reduced operating expenses. Larry pointed outsome other significant benefits, “All my competitors have the sameproducts that I do so I need to offer other capabilities to attract cus-tomers. Now we can provide increased customer service levels anda range of other offerings to customers. This facility is also verybeneficial in helping us to attract and retain good people. Peoplelike to be associated with success.”
As a company enters into a new phase of its growth, having the rightfacilities to support that growth are key to its continued success.Larry Perkins summed up the company’s move by saying, “Our man-agement team the last few years has been buried by the day-to-daydemands of just running the business because of the complexity ofit all. Now with this move we can get back to focusing on how tomake the business more efficient and looking into the more longterm growth and profit issues.”

inventory or sources required products from other suppliers. If the sup-
plier fills the order from its inventory, it turns the customer purchase
order into a pick ticket, a packing list, and an invoice. If products are
sourced from other suppliers, the original customer purchase order is
turned into a purchase order from the first supplier to the next supplier.
That supplier in turn will either fill the order from its inventory or source
products from other suppliers. The purchase order it receives is again
turned into documents such as pick tickets, packing lists, and invoices.
This process is repeated through the length of the supply chain.
In the last 20 years or so, supply chains have become noticeably
more complex than they previously were. Companies now deal with
multiple tiers of suppliers, outsourced service providers, and distribu-
tion channel partners. This complexity has evolved in response to
changes in the way products are sold, increased customer service expec-
tations, and the need to respond quickly to new market demands.
The traditional order management process has longer lead and lag
times built into it due to the slow movement of data back and forth in
the supply chain. This slow movement of data works well enough in
some simple supply chains, but in complex supply chains faster and
more accurate movement of data is necessary to achieve the respon-
siveness and efficiency that is needed. Modern order management
focuses on techniques to enable faster and more accurate movement of
order related data.
In addition, the order management process needs to do exception
handling and provide people with ways to quickly spot problems and
give them the information they need to take corrective action. This
means the processing of routine orders should be automated and orders
that require special handling because of issues such as insufficient
inventory, missed delivery dates, or customer change requests need to
be brought to the attention of people who can handle these issues.
88
E S S E N T I A L S o f S u p p l y C h a i n M a n a g e m e n t

Because of these requirements, order management is beginning to
overlap and merge with a function called customer relationship manage-
ment (CRM) that is often thought of as a marketing and sales function.
Because of supply chain complexity and changing market demands,
order management is a process that is evolving rapidly. However, a
handful of basic principles can be listed that guide this operation:
• Enter the order data once and only once—Capture the data electronically as close to its original source as possible and donot manually reenter the data as it moves through the supplychain. It is usually best if the customers themselves enter theirorders into an order entry system. This system should thentransfer the relevant order data to other systems and supplychain participants as needed for creation of purchase orders,pick tickets, invoices, and so on.
• Automate the order handling—Manual intervention should beminimized for the routing and filling of routine orders.Computer systems should send needed data to the appropriatelocations to fulfill routine orders. Exception handling shouldidentify orders with problems that require people to getinvolved to fix them.
• Make order status visible to customers and service agents—Letcustomers track their orders through all the stages from entryof the order to delivery of the products. Customers should beable to see order status on demand without having to enlistthe assistance of other people.When an order runs into prob-lems, bring the order to the attention of service agents whocan resolve the problems.
• Integrate order management systems with other related systems tomaintain data integrity—Order entry systems need productdescriptive data and product prices to guide the customer inmaking their choices. The systems that maintain this productdata should communicate with order management systems.
89
S u p p l y C h a i n O p e r a t i o n s : M a k i n g a n d D e l i v e r i n g
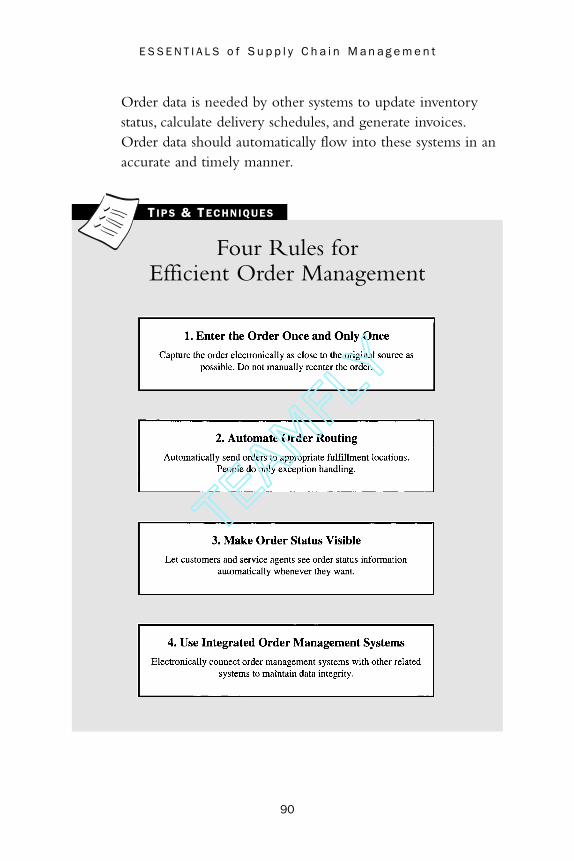
Order data is needed by other systems to update inventorystatus, calculate delivery schedules, and generate invoices.Order data should automatically flow into these systems in anaccurate and timely manner.
90
E S S E N T I A L S o f S u p p l y C h a i n M a n a g e m e n t
Four Rules for Efficient Order Management
T IPS & TECHNIQUES
TEAMFLY
Team-Fly®
TEAMFLY
Team-Fly®

Delivery Scheduling (Deliver)
The delivery scheduling operation is of course strongly affected by the
decisions made concerning the modes of transportation that will be
used. The delivery scheduling process works within the constraints set
by transportation decisions. For most modes of transportation there are
two types of delivery methods: direct deliveries and milk run deliveries.
Direct Deliveries
Direct deliveries are deliveries made from one originating location to
one receiving location.With this method of delivery the routing is sim-
ply a matter of selecting the shortest path between the two locations.
Scheduling this type of delivery involves decisions about the quantity
to deliver and the frequency of deliveries to each location. The advan-
tages of this delivery method are found in the simplicity of operations
and delivery coordination. Since this method moves products directly
from the location where they are made or stored in inventory to a loca-
tion where the products will be used, it eliminates any intermediate
operations that combine different smaller shipments into a single, com-
bined larger shipment.
Direct deliveries are efficient if the receiving location generates
economic order quantities (EOQs) that are the same size as the ship-
ment quantities needed to make best use of the transportation mode
being used. For instance, if a receiving location gets deliveries by truck
and its EOQ is the same size as a truck load (TL) then the direct delivery
method makes sense. If the EOQ does not equal TL quantities, then
this delivery method becomes less efficient.Receiving expenses incurred
at the receiving location are high because this location must handle sep-
arate deliveries from the different suppliers of all the products it needs.
91
S u p p l y C h a i n O p e r a t i o n s : M a k i n g a n d D e l i v e r i n g
Milk Run Deliveries
Milk run deliveries are deliveries that are routed to either bring prod-
ucts from a single originating location to multiple receiving locations
or deliveries that bring products from multiple originating locations to
a single receiving location. Scheduling milk run deliveries is a much
more complex task than scheduling direct deliveries. Decisions must be
made about delivery quantities of different products, about the fre-
quency of deliveries, and most importantly about the routing and
sequencing of pickups and deliveries.
The advantages of this method of delivery are in the fact that more
efficient use can be made of the mode of transportation used and the
cost of receiving deliveries is lower because receiving locations get
fewer and larger deliveries. If the EOQs of different products needed
by a receiving location are less than truck load (LTL) amounts, milk run
deliveries allow orders for different products to be combined until the
resulting quantity equals a truck load or TL amount. If there are many
receiving locations that each need smaller amounts of products, they can
all be served by a single truck that starts its delivery route with a TL
amount of products.
There are two main techniques for routing milk run deliveries.
Each routing technique has its strengths and weaknesses and each tech-
nique is more or less effective depending on the situation in which it is
used and the accuracy of the data that is available. Both of these tech-
niques are supported by software packages. The two techniques are:
• The savings matrix technique
• The generalized assignment technique
The savings matrix technique is the simpler of the two techniques and
can be used to assign customers to vehicles and to design routes where
there are delivery time windows at receiving locations and other con-
92
E S S E N T I A L S o f S u p p l y C h a i n M a n a g e m e n t
straints.The technique is robust and can be modified to take into account
many different constraints. It provides a reasonably good routing solution
that can be put to practical use. Its weakness lies in the fact that it is often
possible to find more cost effective solutions using the generalized assign-
ment technique.This technique is best used when there are many different
constraints that need to be satisfied by the delivery schedule.
The generalized assignment technique is more sophisticated and
usually gives a better solution than the savings matrix technique when
there are no constraints on the delivery schedule other than the carry-
ing capacity of the delivery vehicle. The disadvantage of this technique
is that it has a harder time generating good delivery schedules as more
and more constraints are included.This technique is best used when the
delivery constraints are limited to vehicle capacity or to total travel time.
Delivery Sources
Deliveries can be made to customers from two sources:
• Single product locations
• Distribution centers
Single product locations are facilities such as factories or warehouses
where a single product or a narrow range of related items are available
for shipment.These facilities are appropriate when there is a predictable
and high level of demand for the products they offer and where ship-
ments will be made only to customer locations that can receive the prod-
ucts in large, bulk amounts. They offer great economies of scale when
used effectively.
Distribution centers are facilities where bulk shipments of products
arrive from single product locations.When suppliers are located a long
distance away from customers, the use of a distribution center provides
for economies of scale in long-distance transportation to bring large
amounts of products to a location close to the final customers.
93
S u p p l y C h a i n O p e r a t i o n s : M a k i n g a n d D e l i v e r i n g

The distribution center may warehouse inventory for future ship-
ment or it may be used primarily for crossdocking. Crossdocking is a
technique pioneered by Wal-Mart where truckload shipments of single
products arrive and are unloaded. At the same time these trucks are
being unloaded, their bulk shipments are being broken down into
smaller lots and combined with small lots of other products and loaded
right back onto other trucks. These trucks then deliver the products to
their final locations.
Distribution centers that use crossdocking provide several benefits.
The first is that product flows faster in the supply chain since little
inventory is held in storage. The second is that there is less handling
expense since product does not have to be put away and then retrieved
later from storage. The benefits of crossdocking can be realized when
there are large predictable product volumes and when economies of
scale can be had on both the inbound and outbound transportation.
However, crossdocking is a demanding technique and it requires a con-
siderable degree of coordination between inbound and outbound ship-
ments.
Transporting and delivering goods is expensive so capabilities in
this area are closely aligned with the actual needs of the market that the
supply chain serves. Highly responsive supply chains usually have high
transport and delivery costs because their customers expect quick deliv-
ery. This results in many small shipments of product. Less responsive
supply chains can aggregate orders over a period of time and make
fewer and larger shipments.This results in more economies of scale and
lower transport costs.
94
E S S E N T I A L S o f S u p p l y C h a i n M a n a g e m e n t

95
S u p p l y C h a i n O p e r a t i o n s : M a k i n g a n d D e l i v e r i n g
Eastern Bag & Paper Company (www.eastern-
bag.com) is a distributor of paper products, industrial
packaging, foodservice, and janitorial and sanitary main-
tenance products. It operates out of two distribution cen-
ters, one in Connecticut and one in Massachusetts and has
a fleet of 44 straight trucks and 4 tractor trailers. More
than four million cases are shipped and 200,000 deliveries
are made each year.
Eastern Bag & Paper has developed a very efficient delivery sched-uling operation and it continues to innovate and refine the process-es that support this operation. Meredith Reuben is the company’sCEO and Don Burton is the Director of Operations. “Don has put aprocess in place,” said Meredith Reuben, “and he continuouslymeasures and refines the process so that it supports high levels ofcustomer service and is at the same time very cost efficient. Hehas saved the company a lot of money.”
The process begins at 4:00 p.m. every business day. All ordersreceived up to that time are downloaded from the ERP (enterpriseresource planning) system to an automatic delivery routing systemcalled RoadShow. “We have built in customized parameters,” Donexplained. “Things like tight delivery windows for certain customersand route preferences so the system creates routes and schedulesthat are very efficient.” It takes the RoadShow system and ourrouter about two hours to calculate the routes and schedules for allthe trucks.
At 6:00 p.m. the routes and schedules are uploaded back into theERP and the picking labels are printed in each of the distributioncenters. By 6:30 p.m. each location has a complete set of pick labels.The pick labels at each location are tailored to the way each ware-house is laid out. The pick labels tell the picker where to go for each
IN THE REAL WORLD

96
E S S E N T I A L S o f S u p p l y C h a i n M a n a g e m e n t
IN THE REAL WORLD (CONTINUED)
item and what quantity to retrieve. Along with the labels that areattached to each case, a pick list is generated to accommodate aquality control audit.
“We have a QA process that randomly selects orders to audit,” Donsaid. “We use the pick list and check it against the set of labels oneach case. We probably audit about 10 percent of orders. We trackerrors such as “right label on wrong case,” or “short, case not ontruck,” or “short, can’t find case.” Errors are traced back to theindividuals who caused them and we show these people what theydid wrong.”
Loading the trucks takes 8 to 10 hours. Loading starts by 7:00 p.m.and is usually finished by 4:00 a.m. The trucks are on the road soonafter. All trucks are equipped with a GPS (global positioning satel-lite) system. This system can pinpoint the location of each truck dur-ing the day and it creates an activity log that records the truck’smovements.
“RoadShow creates a delivery schedule and GPS allows us to com-pare the actual route versus the planned route,” Don explained.“The drivers are always saying RoadShow doesn’t accurately reflectconditions. We can now create very realistic RoadShow schedulesusing corrective information that we get from GPS. Drivers are ableto achieve 95 percent on-time performance against the schedulesthat we create.”
The company continuously measures their performance and makesadjustments as needed to maintain high levels of customer service.There is a zero defect program in place which follows a customerorder from entry to delivery. Meredith explained that, “We track ‘per-fect orders’ and rate ourselves on that. A perfect order is an orderthat results in a perfect delivery—the complete order delivered tothe right place at the right time, and a perfect invoice—all items cor-rectly priced and identified. Most companies only track order fillrates. We take a more inclusive view of order fulfillment by using the
Supply Chain Operations Can Be Outsourced
After reading about the 10 basic supply chain operations in this chapter
and the previous one, which of these operations are done by in-house
staff in your company? How many of these operations are core compe-
tencies? How many of these operations bring money into your company
and how many of them consume money?
The relentless pressure on profit margins that free markets create is a
driving force behind the growth of outsourcing.What may be considered
97
S u p p l y C h a i n O p e r a t i o n s : M a k i n g a n d D e l i v e r i n g
IN THE REAL WORLD (CONTINUED)
perfect order concept. When we first started tracking we were onlyaround 53 percent perfect. We are now in the low 80s and will soonhit 85 percent perfect.”
“Our performance measurements allow us to track individual pro-ductivity and error rates by worker,” said Don. “We have developedstandard productivity rates for different jobs that we can use to com-pare against the actual productivity of each person. Our errorreports allow us to identify the person and the department wherean error originated. This is the information we need to continuouslymake adjustments to our operations so as to keep up high servicelevels and also keep our costs as low as possible.”
It is the continuous measuring and adjusting that makes the activi-ties of delivery scheduling and order fulfillment into a core compe-tency. For the vast majority of distributors, regardless of the prod-ucts they distribute, these two activities must be core competenciesif the company is to be successful. “Bottom line, distribution is a 2percent to 4 percent net business and there is no room for errorsand low productivity,” Meredith observed. “Measuring people andprocesses to look for improvements is something that goes on allthe time. Process reengineering and investments in new technologyto decrease errors and increase productivity is something that wedo every year.”

as overhead for Company A may be a service that Company B can offer
and make a profit doing so. Company B may be able to offer this service
for a price lower than it costs Company A to do it in-house. Company
A is going to consider outsourcing.
The traditional participants in supply chains are producers, logistics
providers, distributors, and retailers. How many of the 10 supply chain
operations can be called core competencies of any of these organiza-
tions? There are some operations such as credit and collections, prod-
uct design, and order management that may not be a core competency
of any of the traditional participants.This creates opportunities for new
service providers to take on these operations and offer them to the
other supply chain participants. All 10 of these operations need to be
done for the supply chain as a whole, but they do not all need to be
done by any single company and indeed they cannot all be done well
by any single company.
The other force that drives outsourcing is the growing sophistica-
tion of the markets that supply chains serve. Gone are the days when
Ford Motor Company could run a vertically integrated company that
did everything from mine iron ore to produce steel to design and build
automobiles. That structure was only possible because the markets it
served were content to buy mass quantities of standard products. As
Henry Ford said when asked about what colors his customers could
choose from,“They can have any color they want as long as it’s black.”
Markets today demand and pay for all sorts of innovations, customized
features, and services. This creates complexity in the supply chain and
participants who specialize in certain areas bring the expertise and effi-
ciencies that are required to manage this complexity.
98
E S S E N T I A L S o f S u p p l y C h a i n M a n a g e m e n t

99
S u p p l y C h a i n O p e r a t i o n s : M a k i n g a n d D e l i v e r i n g
Many of the supply chain management concepts
originated in the manufacturing sector. Professor Wallace
Hopp is the Breed University Professor and a director of
the Master of Management and Manufacturing Program at
the McCormick School of Engineering and Kellogg
Graduate School of Management, Northwestern University.
He is co-author of Factory Physics.
Historically, many of the trends and techniques that now guide supplychain management originated in the manufacturing sector. ProfessorHopp points out one such technique that now gets a lot of attentionin supply chain management. It is a technique called variability pool-ing or postponement. “Using this technique manufacturers and nowwhole supply chains can make and stock inventory composed ofgeneric parts and then assemble these parts only at the last momentto create a specific final product.” Manufacturers such as HewlettPackard developed this technique because it allowed them to buildand keep on hand large inventories of parts from which to quicklyassemble finished goods. At the same time they were able to defermuch of the risk of holding that inventory.
A lot of the risk of holding inventory comes from the chance that itwill not match market demand and become obsolete. “If a companyor supply chain keeps its inventory as parts that can be assembledinto a number of different final products, then there is the opportunityto quickly build a final product only when the demand for that specificproduct exists. The risk of building any product beforehand basedon imperfect demand forecasts is avoided.”
In order for companies in a supply chain to employ this technique,it creates a need for these companies to collaborate in the designprocess. And collaborative design is a growing trend in many supplychains. This is especially apparent in the supply chains that feed the
EXECUTIVE INSIGHT
100
E S S E N T I A L S o f S u p p l y C h a i n M a n a g e m e n t
EXECUTIVE INSIGHT (CONTINUED)
automotive industry. “The big car companies are looking for ways toget their suppliers more involved in the design of new vehicles. Theyare driving the design function down not just to their tier one sup-pliers but even further down to the suppliers of those suppliers.”The idea is to design a car composed of many generic modules.“This can really shorten the time to market for a new product.Honda is getting very good at this so they get new cars to marketfaster than other car makers. They do this by breaking a new car intosub-sections that can be designed and built simultaneously by dif-ferent suppliers and then delivered to Honda for final assembly.”
When asked about the trend away from vertical integration towardoutsourcing, Professor Hopp feels that there are limits to how faroutsourcing can go and that some companies are now bumping upagainst those limits. For instance he said, “Ford has worked withsome of its suppliers to create the Ford suppliers industrial park,south of Chicago, next to its factory that is gearing up to produce itscrossover vehicle. Co-located suppliers have built their plants rightnext to the Ford plant. The advantages are that engineers can talkwith each other and the movement of parts from one plant to anoth-er is very quick. The disadvantages are that this arrangement is verymuch like having one vertically integrated operation. Since everyoneis in the same location, problems that affect one company will prob-ably also affect the others such as labor unrest, transportationdelays, or power outages.
“Some companies have swung back a bit on outsourcing and broughtoperations back in house. If you are a big enough company whywouldn’t you do as much of the common commodity manufacturingas you can? You get economies of scale when you do this. The moredifferent products that you make, the more products that you canmake a profit margin on. If all you are actually making is 5 percentof your final product then you don’t have much to defend or workwith. You are in danger of defining yourself so narrowly that you losethe ability to spot new trends and new applications for your products.
TEAMFLY
Team-Fly®
TEAMFLY
Team-Fly®

Chapter Summary
The Make category includes the operations required to develop and
build the products and services that a supply chain provides. Operations
that are in this category are: product design; production management;
and facility and management.The Deliver category of operations encom-
passes the activities that are part of receiving customer orders and deliv-
ering products to customers. The two main operations are order entry/
order fulfillment and product delivery. These two operations constitute
the core connections between companies in a supply chain.
The relentless pressure on profit margins that free markets create is
a driving force behind the growth of outsourcing.What may be con-
sidered as overhead for Company A may be a service that Company B
can offer and make a profit doing so. Company B may be able to offer
this service for a price lower than it costs Company A to do it in-house.
Company A is going to consider outsourcing.
101
S u p p l y C h a i n O p e r a t i o n s : M a k i n g a n d D e l i v e r i n g
EXECUTIVE INSIGHT (CONTINUED)
“A company has to be very careful, however, to select what it cancompete on. It has to know what its core competencies are. BreedTechnologies is a well-known maker of automotive safety systems.For a while they were very successful in making a lot of genericparts that were later assembled into finished products. In the endthough, the products they were making got outside of their corecompetencies and they ran into trouble.”


103
After read ing th is chapter you wi l l be ab le to
• Understand a common supply chain dynamic that is amajor contributor to the “boom to bust” business cycle
• Appreciate the factors that contribute to this supply chain dynamic
• Evaluate ways to combat this dynamic
• Assess the technology that is available to support and enable effective supply chain coordination
The spread of high speed data communications networks and com-
puter technology has made it possible to manage the supply chain
with a level of precision that was not feasible as recently as the mid-
1980s.Those organizations that learn to use the techniques and technolo-
gies that are now available can build supply chains that have a competitive
advantage in their markets.
Because the capability exists to react much more quickly to changes
in market demand, this capability is now a point of competition.Business
competition based on supply chain efficiency is becoming a central fact
in many markets. To develop this capability, individual companies and
entire supply chains need to learn new behaviors and they need to enable
these new behaviors with the use of appropriate technology.
CHAPTER 4
Supply Chain Coordinationand Use of Technology

The “Bullwhip” Ef fect
One of the most common dynamics in supply chains is a phenomena
that has been dubbed “the bullwhip effect.” What happens is that small
changes in product demand by the consumer at the front of the supply
chain translate into wider and wider swings in demand experienced by
companies further back in the supply chain. Companies at different
stages in the supply chain come to have very different pictures of mar-
ket demand and the result is a breakdown in supply chain coordination.
Companies behave in ways that at first create product shortages and
then lead to an excess supply of products.
This dynamic plays out on a larger scale in certain industries in what
is called a “boom to bust” business cycle. In particular this affects indus-
tries that serve developing and growth markets where demand can sud-
denly grow. Good examples of this can be found in the industries that
serve the telecommunications equipment or computer components mar-
kets. The cycle starts when strong market demand creates a shortage of
product. Distributors and manufacturers steadily increase their inventories
and production rates in response to the demand. At some point either
demand changes or the supply of product exceeds the demand level.
Distributors and manufacturers do not at first realize that supply exceeds
demand and they continue building the supply. Finally the glut of prod-
uct is so large that everyone realizes there is too much.Manufacturers shut
down plants and lay off workers. Distributors are stuck with inventories
that decrease in value and can take years to work down.
This dynamic can be modeled in a simple supply chain that contains
a retailer, a distributor, and a manufacturer. In the 1960s a simulation
game was developed by the Massachusetts Institute of Technology’s Sloan
School of Management that illustrates how the bullwhip effect develops.
The simulation game they developed is called the “beer game.” It shows
what happens in a hypothetical supply chain that supports a group of
104
E S S E N T I A L S o f S u p p l y C h a i n M a n a g e m e n t

retail stores that sell beer, snacks, and other convenience items. The
results of the beer game simulation teach a lot about how to coordinate
the actions of different companies in a supply chain.
Peter Senge in his book, The Fifth Discipline (Senge, Peter M., 1990,
The Fifth Discipline: The Art and Practice of the Learning Organization,
New York:Doubleday/Currency,Chapter 3),devotes a chapter to explor-
ing how the bullwhip effect gathers momentum and what can be done
to avoid it. The beer game starts with retailers experiencing a sudden but
small increase in customer demand for a certain brand of beer called
Lover’s Beer. Orders are batched up by retailers and passed on to the dis-
tributors who deliver the beer. Initially, these orders exceed the inventory
that distributors have on hand so they ration out their supplies of Lover’s
Beer to the retailers and place even larger orders for the beer with the
brewery that makes Lover’s Beer. The brewery cannot instantly increase
production of the beer so it rations out the beer it can produce to the dis-
tributors and begins building additional production capacity.
At first the scarcity of the beer prompts panic buying and hoarding
behavior. Then as the brewery ramps up its production rate and begins
shipping the product in large quantities, the orders that had been steadily
increasing due to panic buying suddenly decline. The glut of product
fills up the distributors’ warehouses, fills all the retailers’ unfilled back
orders, and exceeds the actual consumer demand.The brewery is left with
excess production capacity, the distributors are stuck with excess inven-
tory, and the retailers either cancel their beer orders or run discount
promotions to move the product. Everybody loses money. Exhibit 4.1
illustrates how each company sees product demand and the distortion
that causes such havoc.
The costs of the bullwhip effect are felt by all members of the supply
chain. Manufacturers add extra production capacity to satisfy an order
stream that is much more volatile than actual demand. Distributors carry
105
S u p p l y C h a i n C o o r d i n a t i o n a n d U s e o f Te c h n o l o g y

106
E S S E N T I A L S o f S u p p l y C h a i n M a n a g e m e n t
Product Demand Distortion Swings (The “Bullwhip” Effect)
Inventory levels in supply chain over time illustrating the wild swingsthat develop as product demand distortion moves from customer to retailer to distributor to manufacturer. Swings in product demandappear more pronounced to companies further up the supply chain.This distortion makes effective supply chain management very difficult.
EXHIBIT 4 .1

107
S u p p l y C h a i n C o o r d i n a t i o n a n d U s e o f Te c h n o l o g y
extra inventory to cover the variability in order levels. Transportation
costs increase because excess transportation capacity has to be added to
cover the periods of high demand.Along with transportation costs, labor
costs also go up in order to respond to the high demand periods.Retailers
experience problems with product availability and extended replenish-
ment lead times. During periods of high demand, there are times when
the available capacity and inventory in the supply chain cannot cover the
orders being placed.This results in product rationing, longer order replen-
ishment cycles, and lost sales due to lack of inventory.
Coordination in the Supply Chain
Research into the bullwhip effect has identified five major factors that
cause the effect. These factors interact with each other in different
combinations in different supply chains but the net effect is that they
generate the wild demand swings that make it so hard to run an effi-
cient supply chain. These factors must be understood and addressed in
order to coordinate the actions of any supply chain. They are:
1. Demand forecasting
2. Order batching
3. Product rationing
4. Product pricing
5. Performance incentives
Demand Forecasting
Demand forecasting based on orders received instead of end user demand
data will inherently become more and more inaccurate as it moves up
the supply chain. Companies that are removed from contact with the
end user can lose touch with actual market demand if they view their
role as simply filling the orders placed with them by their immediate
customers. Each company in a supply chain sees fluctuations in the

108
E S S E N T I A L S o f S u p p l y C h a i n M a n a g e m e n t
orders that come to them that are caused by the bullwhip effect.When
they use this order data to do their demand forecasts, they just add fur-
ther distortion to the demand picture and pass this distortion along in
the form of orders that they place with their suppliers.
Clearly, one way to counteract this distortion in demand forecasts is
for all companies in a supply chain to share a common set of demand
data from which to do their forecasting. The most accurate source of
this demand data is the supply chain member closest to the end use cus-
tomer (if not the end use customers themselves). Sharing point-of-sales
(POS) data among all the companies in a supply chain goes a long way
toward taming the bullwhip effect because it lets everyone respond to
actual market demand instead of supply chain distortions.
Order Batching
Order batching occurs because companies place orders periodically for
amounts of product that will minimize their order processing and trans-
portation costs. As discussed in the section on inventory control in
Chapter 2, companies tend to order in lot sizes determined by the EOQ
(economic order quantity). Because of order batching, these orders vary
from the level of actual demand and this variance is magnified as it moves
up the supply chain.
The way to address demand distortion caused by order batching is
to find ways to reduce the cost of order processing and transportation.This
will cause EOQ lot sizes to get smaller and orders to be placed more
frequently.The result will be a smoother flow of orders that distributors
and manufacturers will be able to handle more efficiently. Ordering costs
can be reduced by using electronic ordering technology. Transportation
costs can be reduced by using third party logistics suppliers (3PLs) to cost
effectively pick up many small shipments from suppliers and deliver
small orders to many customers.

Product Rationing
This is the response that manufacturers take when they are faced with
more demand than they can meet.One common rationing approach is for
a manufacturer to allocate the available supply of product based on the
number of orders received. Thus if the available supply equals 70 per-
cent of the orders received, the manufacturer will fill 70 percent of the
amount of each order and back order the rest. This leads distributors
and retailers in the supply chain to raise their order quantities artificially
in order to increase the amount of product that gets rationed to them.
This behavior greatly overstates product demand and it is called “short-
age gaming.”
There are several ways to respond to this. Manufacturers can base
their rationing decisions on the historical ordering patterns of a given
distributor or retailer and not on their present order sizes. This elimi-
nates much of the motivation for the shortage gaming that otherwise
occurs. Manufacturers and distributors can also alert their customers in
advance if they see demand outstripping supply. This way product
shortages will not take buyers by surprise and there will be less panic
buying.
Product Pricing
Product pricing causes product prices to fluctuate, resulting in distortions
of product demand. If special sales are offered and product prices are low-
ered, it will induce customers to buy more product or to buy product
sooner than they otherwise would (forward buying).Then prices return to
normal levels and demand falls off. Instead of a smooth flow of products
through the supply chain, price fluctuations can create waves of demand
and surges of product flow that are hard to handle efficiently.
Answers to this problem generally revolve around the concept of
“everyday low prices.” If the end customers for a product believe that
109
S u p p l y C h a i n C o o r d i n a t i o n a n d U s e o f Te c h n o l o g y

they will get a good price whenever they purchase the product, they
will make purchases based on real need and not other considerations.
This in turn makes demand easier to forecast and companies in the sup-
ply chain can respond more efficiently.
Performance Incentives
These are often different for different companies and individuals in a
supply chain. Each company can see its job as managing its position in
isolation from the rest of the supply chain.Within companies, individuals
can also see their job in isolation from the rest of the company. It is
common for companies to structure incentives that reward a company’s
sales force on sales made each month or each quarter. Therefore as the
end of a month or a quarter approaches, the sales force offers discounts
and takes other measures to move product in order to meet quotas.This
results in product for which there is no real demand being pushed into
the supply chain. It is also common for managers within a company to
be motivated by incentives that conflict with other company objectives.
For instance, a transportation manager may take actions that minimize
transportation costs at the expense of customer service or inventory
carrying costs.
Alignment of performance incentives with supply chain efficiencies
is a real challenge. It begins with the use of accurate activity based cost-
ing (ABC) data that can highlight the associated costs. Companies need
to quantify the expenses incurred by forward buying due to month-end
or end-of-quarter sales incentives. Companies also need to identify the
effect of conflicting internal performance incentives. The next step is
to experiment with new incentive plans that support efficient supply
chain operation. This is a process that each company needs to work
through in its own way.
110
E S S E N T I A L S o f S u p p l y C h a i n M a n a g e m e n t
TEAMFLY
Team-Fly®
TEAMFLY
Team-Fly®

111
S u p p l y C h a i n C o o r d i n a t i o n a n d U s e o f Te c h n o l o g y
Eliyahu Goldratt wrote a book titled, The Goal, about
a factory manager’s quest to save his factory from being
closed down for lack of profitability. It chronicles the process
that the manager and his staff go through as they learn
how to save their factory. What they learn is how to apply
the principles of what Mr. Goldratt calls the “Theory of
Constraints.”
Mr. Goldratt and others have realized that the theory of constraintsapplies equally well to the operation of a whole supply chain as tothe operation of a single factory within a supply chain. LawrenceFredendall and Ed Hill in their book, Basics of Supply Chain Manage-ment (Fredendall, Lawrence D., and Ed Hill, 2001, Basics of SupplyChain Management, Boca Raton, FL: St. Lucie Press), have put fortha clear explanation for how to apply the theory of constraints to syn-chronize the operations of a supply chain.
The theory of constraints provides a useful model to conceptualizeand manage the supply chain within a single company or across acollection of companies. The theory of constraints is based uponthe idea that all systems have at least one constraint and that it isbetter to manage constraints than to try to eliminate them. This isbecause when one part of a system ceases to be a constraint, a dif-ferent constraint will occur in another part of the system. This isinevitable because the capacities of each part of a system are notall the same. So instead of forever reacting to new constraints orbottlenecks as they appear, why not choose a small group of con-straints and manage them deliberately and efficiently?
To apply this model, the first step is to define the goal and decide whatmeasurements will be used to measure progress toward the goal.Mr. Goldratt’s definition of the goal for a manufacturing company also works for a supply chain. The goal is defined as “Increase
EXECUTIVE INSIGHT

112
E S S E N T I A L S o f S u p p l y C h a i n M a n a g e m e n t
EXECUTIVE INSIGHT (CONTINUED)
throughput while simultaneously reducing both inventory and oper-ating expense.” Throughput is the rate at which sales to end cus-tomers occur.
Once a goal has been defined and there is agreement on how tomeasure progress toward the goal, it is possible to apply the fivefocusing steps. These steps help clarify the situation being investi-gated and lead to the decisions necessary to reach the goal. The fivesteps are:
Identify the system’s bottlenecks or constraints—Trace outthe workflows and the paths that materials travel in a factory or asupply chain. Find out where slowdowns and backups occur.
Decide how to exploit these bottlenecks—Figure out how tomaximize the operation of those activities that are bottlenecks.The rate of throughput for the entire system is set by the rateof throughput achieved by the bottlenecks. Ensure the bottle-necks operate at maximum capacity by providing them withenough inventory so that they can continue to operate even ifthere are occasional slowdowns elsewhere in the system.
Subordinate everything else to the above decision—Do nottry to maximize the operation of a non-bottleneck operation.Additional productivity achieved by non-bottleneck operationsthat exceeds the capacity of the bottlenecks to process will beneutralized anyway by the slowdowns and backups caused atthe bottlenecks. Synchronize all system operations to the ratesthat can be efficiently processed by the bottleneck operations.
Elevate the system’s bottlenecks—Add additional processingcapacity to the bottleneck activities. Since the rate of throughputof the entire system is set by the throughput of the bottlenecks,improvements in the bottlenecks will increase the efficiency ofthe entire system and provide the best return on investment.
If, in a previous step, a bottleneck has been broken, go backto step 1—As the capacity of one system bottleneck is elevated,it may cease to be a bottleneck. The bottleneck may transfer to

113
S u p p l y C h a i n C o o r d i n a t i o n a n d U s e o f Te c h n o l o g y
EXECUTIVE INSIGHT (CONTINUED)
another operation that could keep up before but now cannotkeep up with the new increase in capacity. Watch the entiresystem to see where slowdowns and backups occur; they mayshift from one area to another. If this occurs, start again atstep 1.
The theory of constraints says that the throughput of the whole systemis set by the capacity of the bottlenecks. Exhibit 4.2 shows a samplediagram of workflows and bottlenecks in a factory. This model of work-flows in a factory can be applied to the workflows in a supply chain.One constraint or bottleneck in every supply chain is the demandthat is generated by the market that the supply chain serves. Inmany cases, market demand is the only constraint because supply ofproducts equals or exceeds demand. In cases where demand exceedssupply there will be some other constraints elsewhere in the supplychain. If we apply this model to a supply chain we get a powerfulmethod to organize and manage supply chain operations.
Flow of Work and Inventory through a Factory
The bottlenecks or constraints in the flow of work through this factoryare operations C and E. The productivity set by these two operationssets the pace for the ENTIRE factory. Productivity improvements inthe other operations will not result in any improvement in the pro-ductivity of the factory as a whole. Apply the five focusing steps tomanage this system and move it toward the goal defined for it.
EXHIBIT 4 .2
C
E

114
E S S E N T I A L S o f S u p p l y C h a i n M a n a g e m e n t
EXECUTIVE INSIGHT (CONTINUED)
A very effective response to the bullwhip effect is to manage theentire supply chain as a single entity and to synchronize it to the tim-ing of actual market demand. Exhibit 4.3 illustrates this idea. Thiscan happen if the supply chain participants closest to the end usecustomers share their sales numbers and their sales forecasts withthe other companies in the supply chain. Each company can thenmanage their actions based on the most accurate data about mar-ket demand.
Buffers in the supply chain are determined by the degree of uncer-tainty about future market demand and the service levels requiredby the market. The lower the uncertainty about demand, the smallerthe buffers can be and still maintain high service levels. Companies can manage their buffers by using either productive capacity orinventory, whichever is most cost effective for them.
Synchronized supply chains avoid the volatile waves of demand thatare generated by the bullwhip effect. And increased predictabilitymakes the productivity of each company easier to manage and thesupply chain as a whole becomes more efficient and profitable.
Flow of Inventory through a Synchronized Supply Chain
EXHIBIT 4 .3
MarketDemand

Collaborative Planning, Forecasting, and Replenishment
To facilitate the coordination that is needed in supply chains, an industry
group known as the Voluntary Interindustry Commerce Standards (VICS)
group has set up a committee to investigate collaborative planning, fore-
casting, and replenishment issues (CPFR). This committee documents
best practices for CPFR and creates guidelines to follow for CPFR.
The CPFR process is divided into the three activities of planning,
forecasting, and replenishment.Within each activity there are several steps:
Collaborative Planning
• Negotiate a front-end agreement that defines the responsibilitiesof the companies that will collaborate with each other
• Build a joint business plan that shows how the companies willwork together to meet demand
Collaborative Forecasting
• Create sales forecasts for all the collaborating companies
• Identify any exceptions or differences between companies
• Resolve the exceptions to provide a common sales forecast
115
S u p p l y C h a i n C o o r d i n a t i o n a n d U s e o f Te c h n o l o g y
EXECUTIVE INSIGHT (CONTINUED)
This model is called “drum-buffer-rope.” Market demand is the con-straint on the system and it sets the drum beat or pace of the sup-ply chain. Individual companies manage uncertainty in their stage ofthe supply chain by using a buffer of either inventory or productivecapacity. Buffers are kept low because uncertainty is minimized bysharing market demand data. This data is the rope that ties the par-ticipants together and allows them to synchronize their actions.

Collaborative Replenishment
• Create order forecasts for all the collaborating companies
• Identify exceptions between companies
• Resolve the exceptions to provide an efficient production anddelivery schedule
• Generate actual orders to meet customer demand
CPFR in Action
For an example of how CPFR can work let’s return to the example of
Nimble Company. In the section on product design in Chapter 2,we saw
how Nimble Company developed a home entertainment system that was
much simpler to manufacture than a competitor’s system. This simpler
design is in turn supported by a less complex supply chain that reduces
production costs and increases responsiveness to market demands. All of
this is central to the competitive success that Nimble Co. is enjoying.
Nimble Co. has collaboration agreements in place with its supply
chain partners and has an ongoing planning, forecasting, and replenish-
ment process in place with these partners. Nimble Co. receives POS
data that show the actual sales of its systems in retail stores. From these
same retailers, Nimble Co. receives regular updates of their sales forecasts
and their inventory levels of Nimble Co. home entertainment systems.
Nimble Co. uses this data to plan its production schedule and it also
shares this data with the component manufacturers who provide parts
for its home entertainment system. This way the component manufac-
turers can plan their own production schedules.
In looking at the sales data and forecasts,Nimble Co. sees that demand
for their product is growing faster than anticipated in their yearly plan
and they need to increase production. Nimble Co. revises its produc-
tion schedule for the year and takes the new plan to its key component
suppliers to negotiate additional purchases of their components. It turns
116
E S S E N T I A L S o f S u p p l y C h a i n M a n a g e m e n t

out that one component supplier cannot quickly ramp up their pro-
duction but a second supplier has a component that could fill the need
with just a slight modification to the design of one part of Nimble Co.’s
home entertainment system. Because all affected parties know what is
going on and have enough lead time, the design changes are made and
production schedules are increased to meet the rise in product demand
without any retailers running out of inventory.
The benefits illustrated in this scenario are numerous. To begin
with, the bullwhip effect is diminished because all companies in the
supply chain can see real time sales data and share sales forecasts. This
allows everyone to optimize their production schedules, inventory levels,
and delivery schedules. Next there are the benefits associated with
Nimble Co. being able to quickly see a real rise in customer demand
and coordinate with its suppliers to increase production schedules over
previously planned levels. Even though one component supplier was
not able to accommodate Nimble Co.’s increased production schedule,
another supplier had a workable substitute. Changes were made to the
product design, production was increased, and no retailer lost sales rev-
enue due to running out of inventory.
Those companies that can create collaborative supply chains will
have a significant competitive advantage. Collaboration is not easy to
implement and it will take time to become more common in business.
However, prominent companies are already beginning to lead the way.
Companies such as Wal-Mart, Dell, and Proctor & Gamble share point
of sales data with all the other companies in their respective supply
chains. The companies in these supply chains are also starting to share
inventory data with each other. Sharing this kind of information pro-
vides a basis for each company to make decisions about its own activities
that will yield better efficiencies and profits for itself and for the supply
chain as a whole.
117
S u p p l y C h a i n C o o r d i n a t i o n a n d U s e o f Te c h n o l o g y
How to Start Supply Chain Collaboration
The best place to start in any effort to promote collaboration is to meas-
ure the bullwhip effect within your company. Over a period of time
such as a quarter or a year, compare the volume and frequency of orders
you receive from your customers with the volume and frequency of
orders you place with your suppliers. Plot them out on a graph so every-
one can see the divergence between incoming customer orders and your
outgoing supplier orders.What is the extent of this divergence? Where
is your company located in the supply chain—is it toward the front of
the chain close to the end customer or is it further toward the back of the
chain? Remember, the distortion caused by divergence of incoming
orders with outgoing orders increases as it moves back through the sup-
ply chain.
Many companies are not aware of the cost of the bullwhip effect
on their supply chains. Traditionally, demand variability caused by the
bullwhip effect was taken as a given and companies worked on their
own to develop better capabilities to respond to fluctuations in demand.
It may instead be far more efficient for companies to work together to
actually reduce the fluctuations in demand. A company can either try
to optimize its individual response to fluctuating demand or it can col-
laborate with other companies to reduce the fluctuations themselves.
Once you have established the magnitude of the bullwhip effect
in your company, then get some estimates of the cost consequences in
different areas of the company.What is the effect of this demand vari-
ability on production costs and scheduling? What is the effect on trans-
portation costs and shipping and receiving costs? What inventory levels
are needed to maintain service levels in such a volatile situation and
what is the associated carrying cost? What is the effect on product avail-
ability and order lead times—are sales lost because of lack of inventory?
118
E S S E N T I A L S o f S u p p l y C h a i n M a n a g e m e n t

These estimates show the cost to the company of dealing with demand
fluctuations. This is the basis upon which to discuss what it might be
worth to fix the bullwhip effect.
119
S u p p l y C h a i n C o o r d i n a t i o n a n d U s e o f Te c h n o l o g y
Why do we need universal product code (UPC)
numbers? Because when each company uses only its own
part number for the same product as it moves through the
supply chain, what results is confusion and inefficiency.
Historically, companies have assigned their own part numbers tothe items that they buy and sell. This worked well enough in a slow-er time when supply chains were less complex and when productsthemselves were less complex. Those were times we now refer toas the “good old days.” Increasing competition and demands fromcustomers to deliver products faster and cheaper shapes the worldwe live in today. At the same time, the array and complexity of prod-ucts in our economy has increased dramatically and that trend willclearly continue and even accelerate.
In order to be competitive and also profitable, companies need tofind ways to reduce or eliminate costs associated with routine andrepetitive business transactions. Those transactions often fall in theareas of purchasing, billing, accounts receivable, and accountspayable. It is in these areas that the confusion caused by translat-ing part numbers is most noticeable. Time spent translating onepart number to another part number for the same item adds very lit-tle, if any, value to the transaction. The errors that result from errorsin translation are the cause of many problems in invoicing and mak-ing payments. These problems consume people’s time and slowdown cash flow. All these expenses simply eat away at profit mar-gins that are already thin enough.
EXECUTIVE INSIGHT

120
E S S E N T I A L S o f S u p p l y C h a i n M a n a g e m e n t
EXECUTIVE INSIGHT (CONTINUED)
In addition to the operating problems caused by using different partnumbers for the same item, another consequence is a lack of accu-racy and clarity in sales history data. Part number translation errorsresult in sales of some items being undercounted and sales of otheritems being overcounted. And sales of many items are simply not counted at all or they are lumped under a miscellaneous partnumber such as the famous “9999” part number. Sales historydata is usually the basis for forecasting future demand and thisfuzziness in the data hampers efforts to improve demand forecasts,production scheduling, and inventory management.
In order for companies to coordinate effectively, they need to havea single part number that stays with a part as it makes its waythrough the supply chain. That number is the Universal ProductCode (UPC) number. Standards for the use of UPC numbers are setby the Uniform Code Council (www.uc-council.org). Companies thatdo business together need to be able to tag every item that they buyand sell with a UPC number. They can still use their internal partnumbers for internal operations if they wish. But when they com-municate with each other they need to use UPC numbers so as toeliminate the need to do part number translations. There are manymore valuable and profitable things that can be done with the timeand money that now goes into translating part numbers and dealingwith translation-related problems.
The Integrated Business Communications Alliance or IBCA (www.ibcaweb.org) presents a short and useful white paper on this sub-ject. The paper is titled “A Starting Place for eCommerce” and it pres-ents a pragmatic and simple way for companies to get started. Thewhite paper can be found on the IBCA web site and downloaded.
TEAMFLY
Team-Fly®
TEAMFLY
Team-Fly®
Information Systems that Support the Supply Chain
Information technology can support internal operations and also col-
laboration between companies in a supply chain. Using high speed data
networks and databases, companies can share data to better manage the
supply chain as a whole and their own individual positions within the
supply chain. The effective use of this technology is a key aspect of a
company’s success.
All information systems are composed of technology that performs
three main functions: data capture and communication; data storage and
retrieval; and data manipulation and reporting. Different information
systems have different combinations of capabilities in these functional
areas. The specific combination of capabilities is dependent on the
demands of the job that a system is designed to perform. Information
systems that are employed to support various aspects of supply chain
management are created from technologies that perform some combi-
nation of these functions.
Data Capture and Data Communications
The first functional area is composed of systems and technology that
create high speed data capture and communications networks. It is this
technology that can overcome the lag times and lack of big picture
information that gives rise to the bullwhip effect.We will look at:
• The Internet
• Broadband
• EDI
• XML
121
S u p p l y C h a i n C o o r d i n a t i o n a n d U s e o f Te c h n o l o g y

The Internet
The Internet is the global data communications network that uses what
is known as Internet Protocol (IP) standards to move data from one
point to another. The Internet is the universal communications net-
work that can connect with all computers and communication devices.
Once a device is hooked into the Internet it can communicate with any
other device that is also connected to the Internet regardless of the dif-
ferent internal data formats that they may use.
Before the Internet, companies had to put in expensive dedicated
networks to connect themselves to other companies and move data
between their different computer systems. Now, with the Internet
already in place, different companies have a way to quickly and inex-
pensively connect their computer systems. If needed, extra data protec-
tion and privacy can be provided by using technology to create virtual
private networks (VPNs) that utilize the Internet to create very secure
communication networks.
Broadband
Basically, this means any communications technology that offers high
speed (faster than a 56Kb dial-up modem) access to the Internet with
a connection that is always on. This includes technologies such as coaxial
cable, digital subscriber line (DSL), metro Ethernet, fixed wireless, and
satellite. Broadband technology is spreading and as it does, it becomes
possible for companies in a supply chain to easily and inexpensively hook
up with each other and exchange large volumes of data in real-time.
Most companies have connected themselves internally using local
area network (LAN) technology such as Ethernet that gives them plenty
of internal communications capability. Many companies have connected
some or all of their different geographical locations using wide area
network (WAN) technology such as T1, T3, or frame relay.What now
122
E S S E N T I A L S o f S u p p l y C h a i n M a n a g e m e n t

needs to happen is high speed, relatively low cost connections between
separate companies and that is the role that broadband will play.
EDI
Electronic Data Interchange (EDI) is a technology that was developed
to transmit common types of data between companies that do business
with each other. It was first deployed in the 1980s by large companies
in the manufacturing, automobile, and transportation industries. It was
built to automate back office transactions such as the sending and
receiving of purchase orders (known as an “850” transaction), invoices
(an “810”), advance shipment notices (an “856”), and backorder status
(an “855”) to name just a few. It originally was built to run on big,
mainframe computers using value added networks (VANs) to connect
with other trading partners. That technology was expensive.
Many companies have large existing investments in EDI systems
and find that it is very cost effective to continue to use these systems to
communicate with other businesses. Standard EDI data sets have been
defined for a large number of business transactions.Companies can decide
which data sets they will use and which parts of each data set they will
use. EDI systems can now run on any type of computer from main-
frame to PC and it can use the Internet for data communications as well
as VANs. Costs for EDI technology have come down considerably.
XML
XML (eXtensible Markup Language) is a technology that is being
developed to transmit data in flexible formats between computers and
between computers and humans. Where EDI uses rigid, pre-defined
data sets to send data back and forth, XML is extensible and once certain
standards have been agreed upon, XML can also be used to communi-
cate a wide range of different kinds of data and related processing
123
S u p p l y C h a i n C o o r d i n a t i o n a n d U s e o f Te c h n o l o g y

instructions between different computer systems. XML can also be used
to communicate between computers and humans because it can drive
user interfaces such as web browsers and respond to human input.
Unlike EDI, the exact data transactions and processing sequences do
not have to be previously defined when using XML.
There are many evolving XML standards in different industries but
as yet none of these standards has been widely adopted. The industry
that has made the most progress in adopting XML standards is the elec-
tronics industry. They are beginning to implement the RosettaNet
XML standards (www.rosettanet.org).
In the near term, XML and EDI are merging into hybrid systems
that are evolving to meet the needs of companies in different supply
chains. It is not cost effective for companies with existing EDI systems that
are working well enough to replace them with newer XML systems all at
once. So XML extensions are being grafted onto EDI systems. Software
is available to quickly translate EDI data to XML and then back to EDI.
Service providers are now offering Internet-based EDI to smaller sup-
pliers who do business with large EDI-using customers.
In the longer term, EDI will be wholly consumed by XML as
XML standards are agreed upon and start to spread. As these standards
spread they will enable very flexible communications between companies
in a supply chain. XML will allow communications that are more spon-
taneous and free form, like any human language. This kind of commu-
nication will drive a network of computers and people interacting with
other computers and other people.The purpose of this network will be
to coordinate supply operations on a daily basis.
Data Storage and Retrieval
The second functional area of an information system is composed of
technology that stores and retrieves data. This activity is performed by
124
E S S E N T I A L S o f S u p p l y C h a i n M a n a g e m e n t

database technology. A database is an organized grouping of data that is
stored in an electronic format.The most common type of database uses
what is called “relational database” technology. Relational databases store
related groups of data in individual tables and provide for retrieval of data
with the use of a standard language called structured query language
(SQL).
A database is a model of the business processes for which it collects
and stores data. The model is defined by the level of detail in the data
it collects. The design of every database has to strike a balance between
highly aggregate data at one extreme and highly detailed data at the
other extreme. This balance is arrived at by weighing the needs and
budget of a business against the increasing cost associated with more
and more detailed data. The balance is reflected in what is called the
data model of the database.
As events occur in a business process, there are database transactions.
The data model of the database determines which transactions can be
recorded since the database cannot record transactions that are either more
detailed or more aggregated than provided for in the data model. These
transactions can be recorded as soon as they happen and that is called “real-
time”updating or they may be captured and recorded in batches that hap-
pen on a periodic basis and that is called “batch” updating.
A database also provides for the different data retrieval needs of the
people who use it. People doing different jobs will want different com-
binations of data from the same database. These different combinations
are called “views.” Views can be created and made available to people
who need them to do their jobs. For instance, consider a database that
contains sales history for a range of different products to a range of dif-
ferent customers. A customer view of this data might show a customer
the different products and quantities they purchased over a period of
time and show detail of the purchases at each customer location. A
125
S u p p l y C h a i n C o o r d i n a t i o n a n d U s e o f Te c h n o l o g y
manufacturer view might show all the customers who bought their
group of products over a period of time and show detail for the prod-
ucts that each customer bought.
Data Manipulation and Reporting
Different supply chain systems are created by combining processing
logic to manipulate and display data with the technology required to
capture, communicate, store, and retrieve data. The way that a system
manipulates and displays the data that flows through it is determined by
the specific business operations that the system is designed to support.
Information systems contain the processing logic needed by the busi-
ness operations they support. Chopra and Meindl define several kinds
of systems that support supply chain operations:
• Enterprise Resource Planning (ERP)
• Procurement Systems
• Advanced Planning and Scheduling
• Transportation Planning Systems
• Demand Planning
• Customer Relation Management (CRM) and Sales ForceAutomation (SFA)
• Supply Chain Management (SCM)
• Inventory Management Systems
• Manufacturing Execution Systems (MES)
• Transportation Scheduling Systems
• Warehouse Management Systems (WMS)
Enterprise Resource Planning
Enterprise Resource Planning (ERP) systems gather data from across
multiple functions in a company. ERP systems monitor orders, produc-
tion schedules, raw material purchases, and finished goods inventory.
126
E S S E N T I A L S o f S u p p l y C h a i n M a n a g e m e n t

They support a process-oriented view of business that cuts across dif-
ferent functional departments. For instance, an ERP system can view
the entire order fulfillment process and track an order from the procure-
ment of material to fill the order to delivery of the finished product to
the customer.
ERP systems come in modules that can be installed on their own
or in combination with other modules. There are usually modules for
finance, procurement, manufacturing, order fulfillment, human resources,
and logistics. The focus of these modules is primarily on carrying out
and monitoring daily transactions. ERP systems often lack the analytical
capabilities needed to optimize the efficiency of these transactions.
Procurement Systems
Procurement systems focus on the procurement activities that take
place between a company and its suppliers. The purpose of these sys-
tems is to streamline the procurement process and make it more effi-
cient. Such systems typically replace supplier catalogs with a product
database that contains all the needed information about products the
company buys. They also keep track of part numbers, prices, purchas-
ing histories, and supplier performance.
Procurement systems allow people to compare the price and per-
formance capabilities of different suppliers. This way the best suppliers
are identified so that relationships can be established with these suppliers
and prices negotiated. The routine transactions that occur in the pur-
chasing process can then be largely automated.
Advanced Planning and Scheduling
Advanced Planning and Scheduling, also known as APS systems, are highly
analytical applications whose purpose is to assess plant capacity, material
availability, and customer demand.These systems then produce schedules
for what to make in which plant and at what time. APS systems base
127
S u p p l y C h a i n C o o r d i n a t i o n a n d U s e o f Te c h n o l o g y

their calculations on the input of transaction level data that is extracted
from ERP or legacy transaction processing systems. They then use linear
programming techniques and other sophisticated algorithms to create
their recommended schedules.
Transportation Planning Systems
Transportation Planning Systems are systems that calculate what quan-
tity of materials should be brought to what locations at what times.The
systems enable people to compare different modes of transportation,
different routes, and different carriers. Transportation plans are then
created using these systems. The software for these systems is sold by
system vendors. Other providers known as content vendors provide the
data that is needed by these systems, such as mileage, fuel costs, and
shipping tariffs.
Demand Planning
These systems use special techniques and algorithms to help a company
forecast their demand.These systems take historical sales data and infor-
mation about planned promotions and other events that can affect cus-
tomer demand, such as seasonality and market trends.They use this data
to create models that help predict future sales.
Another feature that is often associated with demand planning sys-
tems is revenue management. This feature lets a company experiment
with different price mixes for its different products in light of the pre-
dicted demand. The idea is to find a mix of products and prices that
maximizes total revenue to the company. Companies in the travel
industry such as airlines, rental car agencies, and hotels are already using
revenue management techniques.These techniques will spread to other
industries.
128
E S S E N T I A L S o f S u p p l y C h a i n M a n a g e m e n t

Customer Relation Management
and Sales Force Automation
Systems of this type automate many of the tasks related to servicing
existing customers and finding new customers. Customer Relation
Management (CRM) systems track buying patterns and histories of
customers.They consolidate a company’s customer-related data in a place
where it is quickly accessible to customer service and sales people who
use the data to better respond to customer requests.
Sales Force Automation (SFA) systems allow a company to better
coordinate and monitor the activities of its sales force. These systems
automate many of the tasks related to scheduling sales calls and follow-up
visits and preparing quotes and proposals for customers and prospects.
Supply Chain Management
Supply Chain Management (SCM) systems are suites of different supply
chain applications, such as those described here that are tightly integrated
with each other.An SCM system could be an integrated suite that con-
tains advanced planning and scheduling, transportation planning, demand
planning, and inventory planning applications. SCM systems rely on
ERP or relevant legacy systems to provide them with the data to support
the analysis and planning that they do. These systems have the analytical
capabilities to support strategic level decision making.
Inventory Management Systems
These systems support the activities described in Chapter 2 that are part
of inventory management such as tracking historical demand patterns
for products, monitoring inventory levels for different products, and cal-
culating economic order quantities and the levels of safety inventory
that should be held for each product.These systems are used to find the
right balance for a company between the cost of carrying inventory
129
S u p p l y C h a i n C o o r d i n a t i o n a n d U s e o f Te c h n o l o g y
and the cost of running out of inventory and losing sales revenue
because of that.
Manufacturing Execution Systems
The focus is on carrying out the production activities in a factory. This
kind of system is less analytical than an APS. It produces short-term
production schedules and allocates raw materials and production resources
within a single manufacturing plant.A Manufacturing Execution System
(MES) is similar in its operational focus to an ERP system and frequently
MES software is produced by ERP software vendors.
Transportation Scheduling Systems
Systems in this category are similar to ERP and MES applications in
that they are less analytical and more focused on daily operational issues.
A transportation scheduling system produces short-term transportation
and delivery schedules that are used by a company.
Warehouse Management Systems
These systems support daily warehouse operations. They provide capa-
bilities to efficiently run the ongoing operations of a warehouse. These
systems keep track of inventory levels and stocking locations within a
warehouse and they support the actions needed to pick, pack, and ship
product to fill customer orders.
Assessing Technology and System Needs
When evaluating different systems that can be used to support your
supply chain it is important to keep in mind your goal—the reason for
using any of these systems. Customers desire good service and good
prices. That is what guides them when they select companies to do
business with. Technology is a means for a company to be of service to
its customers. Companies that keep this in mind do well.
130
E S S E N T I A L S o f S u p p l y C h a i n M a n a g e m e n t
TEAMFLY
Team-Fly®
TEAMFLY
Team-Fly®

In business, technology is only important insofar as it enables a
company or an entire supply chain to deliver valuable products and serv-
ices to its customers profitably. Do not let the complexity or the details
of any technology or system be a distraction from this basic truth.
Technology can be impressive but it is not an end in itself.
Success in supply chain management comes from delivering the high-
est levels of service at the lowest cost. Technology is expensive and can
quickly add a lot of cost to a business. It is a far better thing to use simple
technology well than to use sophisticated technology in a clumsy manner.
131
S u p p l y C h a i n C o o r d i n a t i o n a n d U s e o f Te c h n o l o g y
Starting in the late 1990s supply chain service
providers have sprung up to handle the needs of many
specific markets. There has been a high turnover in these
companies as the markets have evolved. Those companies
that have survived are now focused on providing specific
services to well-defined groups of customers.
Tibersoft (www.Tibersoft.com) provides order management servicesand supply chain monitoring and analysis systems to companies inthe food and the maintenance supplies industries. Christopher Martinis the Vice Chairman and founder of Tibersoft. “Order management issimple, but difficult to execute well. The supply chains we serve arevery high velocity and mistakes are costly. Order management sys-tems are the pinion gears used to keep everything moving smoothly.”
With the Internet, order management systems now span multiplecompanies in a supply chain. Their primary function is to presentcustomers with the information they need to place orders and thencommunicate the orders to the companies that will fulfil them. Thisextended supply chain requires tight integration between the ordermanagement system and various internal systems in companies
EXECUTIVE INSIGHT

132
E S S E N T I A L S o f S u p p l y C h a i n M a n a g e m e n t
EXECUTIVE INSIGHT (CONTINUED)
that are part of the supply chain. Chris explained, “You are alwaysupdating data about product, price, and promotion. Strong integra-tion with back office systems is crucial. Our systems are extensionsof the buyers’ and the sellers’ back office systems linked togetherover the Internet.
“Once you’ve taken the order there is a lot of tracking of that orderto let people know about things like order status, backorders andsubstitutions, advance ship notices. The velocity in supply chains isdefinitely increasing and people want increasing control over theirsupply chains because of this.”
The last few years have provided more understanding about the kindof control that people want. Chris continued, “There was a movementa couple of years ago where companies tried to create automatedresponses to supply chain events. That stopped because peopledidn’t want technology to run the supply chain, they want technologyto spot exceptions and bring them to their attention. This requiresthe order management system to get a continuous data feed fromother systems. The data needed cannot be provided by manual input.
“People who are successful with Internet technology have learnedthat improving business is a series of incremental steps. They aretotally focused on solving a specific problem. Supply chain serviceproviders that focus on specific processes within well-defined verti-cal markets are the ones who will succeed. You have to go deep intothe business processes of your customers to really advance thestate of the art. Companies that try to do many functions across arange of markets just skim the surface and cannot provide enoughvalue to deliver a compelling ROI.”
When discussing the growth strategy of the company, Chris referredto a lesson he learned from a mentor, Max Hopper, “Scope drivesscale and scale drives scope.” He continued, “What he means isthat we need to start with the scope of our existing products and gofor as much scale as possible. Get as much business as we can.Customers will then tell you what they want in the next version—and

E-Business and Supply Chain Integration
The widespread availability and use of the Internet offers companies
opportunities that did not exist before. These opportunities are made
possible because it is now so easy and relatively inexpensive for companies
to connect to the Internet. Once connected, companies can send data to
and receive data from other companies that they do business with regard-
less of the particular computers or software that individual companies
may be using to run their internal operations. Based on this data sharing,
opportunities exist to achieve tremendous supply chain efficiencies and
significant increases in customer service and responsiveness. These are
the results of better supply chain integration.
E-business encompasses the evolving set of principles and practices
that companies are employing to gain the benefits inherent in better
133
S u p p l y C h a i n C o o r d i n a t i o n a n d U s e o f Te c h n o l o g y
EXECUTIVE INSIGHT (CONTINUED)
we go again to build up the scale. We have come to believe that ifa customer feels strongly enough that they will pay for a new fea-ture, only then is it worth building that feature. Purely speculativedevelopment is a pernicious habit. Frankly, we don’t waste a lot oftime trying to revolutionize an industry. We work with individual cus-tomers to give them what they need to achieve their individual ROIs.The art is combining these solutions into the same code base.”
Chris summed up what the last several years have taught them, “Wedon’t want to rebuild systems that are already out there. We arehere to connect these different systems and provide the data acrossthe extended supply chain. Tibersoft does this by building private,point-to-point connections between companies using common dataprotocols. And those connections need to remain just that—private.Many dot com companies got themselves in trouble taking the datagenerated between their customers and using it to their economicbenefit. “Enable, don’t participate: that rule we don’t break.”

supply chain integration. In the words of Professors Hau Lee and
Seungjin Whang of Stanford University, e-business specifically refers to,
“the planning and execution of the front-end and back-end operations
in a supply chain using the Internet.”
In a white paper titled “E-Business and Supply Chain Integration”
published by the Stanford Global Supply Chain Management Forum
(www.stanford.edu/group/scforum/) professors Lee and Whang lay out
four key dimensions of the impact of e-business on supply chain inte-
gration.These four dimensions create a sequence of greater and greater
integration and coordination among supply chain participants. This
sequence culminates in the creation of whole new ways to conduct
business. The four dimensions are:
1. Information integration—Is the ability to share relevant informa-
tion among companies in a supply chain.This includes data such
as: sales history and demand forecasts; inventory status; production
schedules; production capacities; sales promotions; and trans-
portation schedules. This data should be available to the people
who need it in a real-time, on-line format via the Internet or
private network.
2. Planning synchronization—Refers to the joint participation of
companies in a supply chain in the demand forecasting and inven-
tory replenishment scheduling. It also includes the collaborative
design, development, and bringing to market of new products.
3. Workflow coordination—Is the next step after planning synchroniza-
tion. It is the streamlining and automation of ongoing business
activities across companies in a given supply chain. This includes
activities such as purchasing and product design.
4. New business models—Can emerge as a result of supply chain
integration made possible by the Internet. Roles and responsibilities
134
E S S E N T I A L S o f S u p p l y C h a i n M a n a g e m e n t

of companies in a supply chain can be redesigned so that each
company can truly concentrate on the activities that are its core
competencies.Non-core activities can be outsourced to other com-
panies. New capabilities and efficiencies will become possible.
Experience of the Last Several Years
Several waves of e-business development have occurred since the late
1990s.The first wave of developments by entrepreneurial start-up com-
panies typically focused on using Internet-based exchanges to improve
purchasing efficiencies and drive down the cost of products through
the use of online bid/auction techniques.Then industry news, statistics,
and reference material were added to many of these exchanges and they
were referred to as industry portals. Most of these developments have
not lived up to expectations.
The next wave of developments continued to focus on purchasing
efficiencies but this time the systems were developed by the purchasing
companies themselves instead of by third party entrepreneurs. Often
these developments have taken the form of a consortium of big com-
panies in an industry banding together to finance the start up of an
Internet-based purchasing platform that will support the whole range
of their purchasing functions. Examples of this are Covisint in the auto-
mobile industry, ForestExpress in the forest products industry, and Aero
Exchange International in the airline industry. These developments are
yielding efficiencies in procurement operations.
The most recent wave of developments are now looking at how to
achieve efficiencies in a broad range of supply chain operations such as
product design,demand forecasting, inventory management, and customer
service. The key to realizing these efficiencies is information sharing
between companies in a supply chain. Many current e-business develop-
ments are working on methods and standards to share information across
135
S u p p l y C h a i n C o o r d i n a t i o n a n d U s e o f Te c h n o l o g y

multiple companies. Information sharing is the foundation and then cross-
company coordination is what will deliver the desired efficiencies. Once
information integration is in place, the next three dimensions: planning
synchronization; workflow coordination; and new business models can
evolve much more rapidly. E-business development has only just begun.
Chapter Summary
One of the most common dynamics in supply chains is a phenomena
that has been dubbed “the bullwhip effect.” What happens is that small
changes in product demand by the consumer at the front of the supply
chain translate into wider and wider swings in demand as experienced
by companies further back in the supply chain. Companies at different
stages in the supply chain come to have very different pictures of market
demand and the result is a breakdown in supply chain coordination.
Companies behave in ways that at first create product shortages and then
lead to an excess supply of product.
Many companies are not aware of the cost of the bullwhip effect
on their supply chains. Traditionally, demand variability caused by the
bullwhip effect was taken as a given and companies worked on their
own to develop better capabilities to respond to fluctuations in demand.
It may instead be far more efficient for companies to work together to
actually reduce the fluctuations in demand.A company can either try to
optimize its individual response to fluctuating demand or it can collab-
orate with other companies to reduce the fluctuations themselves.
The use of supporting technology is necessary for effective supply
chain operations. All information systems are composed of technology
that performs three main functions: data capture and communication;
data storage and retrieval; and data manipulation and reporting. Different
supply chain information systems have different combinations of capa-
bilities in these functional areas.
136
E S S E N T I A L S o f S u p p l y C h a i n M a n a g e m e n t

137
After read ing th is chapter you wi l l be ab le to
• Employ a useful model for assessing markets and the supplychains that support them
• Define a concise set of metrics for measuring the perform-ance of a company’s supply chain operations
• Discuss ways to collect and display supply chain perform-ance data
• Use performance data to spotlight problems and opportunities
Supply chains are fluid and are continuously adjusting to changes in
supply and demand for the products they handle.To get the perform-
ance desired from supply chains requires a company to monitor and
control its operations on a daily basis. This chapter introduces four per-
formance categories that each supply chain participant should measure. It
then discusses the performance metrics that can be used in each of these
performance categories.The chapter also explores some of the technology
that can be used to collect, store, and present performance data.
A Useful Model of Markets and Their Supply Chains
A supply chain exists to support the market that it serves. To identify the
performance that a supply chain should deliver, we need to evaluate the
CHAPTER 5
Measuring Performance:Supply Chain Metrics

market being served. In support of this analysis we will employ a simple
model. The model allows us to categorize a market and identify the
requirements and opportunities that each kind of market presents to its
supply chains. Reality is, of course, more subtle and more complex than
any model can represent but this model can point you in the right
direction and guide you through an investigation of the markets your
company serves.
Let us start by defining a market using its two most basic components—
supply and demand.A market is characterized by its combination of sup-
ply and demand. This model defines four basic kinds of markets, or
market quadrants. In the first quadrant is a market where both supply
and demand for its products are low and unpredictable. Let’s call this a
developing market. In the second quadrant is a market where supply is
low and demand is high. This is a growth market. The third quadrant
contains a market where both supply and demand are high. There is a
lot of predictability in this market so call this a steady market. In the fourth
quadrant, this kind of market supply is higher than demand. This is a
mature market.
In a developing market, both supply and demand are low and also
uncertain. These are usually new markets that are just emerging. These
markets are created by new technology becoming available or by social
and economic trends that cause a group of customers to perceive some
new set of needs. Opportunities in a developing market are in the areas
of partnering with other players in the supply chain to gather intelli-
gence about what the market wants. Cost of sales is high in this market
and inventories are low.
Growth markets are markets where demand is higher than supply
and so supply is often uncertain. If a developing market solidifies and
builds up momentum, it can suddenly take off and for a time there is a
surge in demand that suppliers cannot keep up with. Opportunities in a
138
E S S E N T I A L S o f S u p p l y C h a i n M a n a g e m e n t

growth market are in providing a high level of customer service as meas-
ured by order fill rates and on-time deliveries.Customers in a market like
this value a reliable source of supply and will pay premium prices for
reliability. Cost of sales should be low since customers are easy to find
and inventories can be higher because they are increasing in value.
In a steady market both supply and demand are high and thus rela-
tively predictable. This is an established market where market forces
have been at work for a while and have pretty well balanced supply and
demand. Opportunities here lie in fine tuning and optimizing internal
company operations. Companies should focus on minimizing invento-
ry and cost of sales while maintaining high levels of customer service.
In a mature market, supply has overtaken demand and excess supply
capacity exists. Demand is reasonably stable or slowly falling but because
of the fierce competition due to oversupply,demand seems uncertain from
the point of view of any one supplier in this market. Opportunities in
this market are in the area of flexibility as measured by an ability to
respond quickly to changes in product demand while maintaining high
levels of customer service. Customers in a market like this value the
convenience of “one stop shopping” where they can purchase a wide
variety of related products at low prices. Inventories should be mini-
mized and the cost of sales are somewhat higher due to the expense of
attracting customers in a crowded market.
Market Per formance Categories
Markets in each quadrant have their own mix of opportunities for the
supply chains that support them. A different mix of performance char-
acteristics is required of companies in the supply chains of each kind of
market. In order to thrive, the companies in a supply chain must be able
to work together to exploit the opportunities available in their markets.
The highest profits go to the companies that can successfully respond to
139
M e a s u r i n g P e r f o r m a n c e : S u p p l y C h a i n M e t r i c s

the opportunities their markets offer. Companies that are unable to
respond to opportunities as effectively will fall behind.
In Chapter 1 we introduced two characteristics that describe supply
chain performance—responsiveness and efficiency. We all intuitively
know what these two characteristics imply, but now we need to define
140
E S S E N T I A L S o f S u p p l y C h a i n M a n a g e m e n t
Each Market Quadrant Presents Different Opportunities
What are the markets your company serves? What quadrants arethey in? How can your company respond to the opportunities inthese markets?
T IPS & TECHNIQUES
MATURESupply exceeds demand
Opportunities lie in coordinatingwith supply chain partners to pro-vide a wide range of products tothe market and accommodatewide fluctuations in productdemand while maintaining highlevels of customer service.
DEVELOPINGNew market and new products,
supply and demand are low
Opportunities lie in partneringwith other companies in thesupply chain to gather intelli-gence about what the marketwants and build and deliverproducts that will be attractiveto the market.
STEADYEstablished market, supply and
demand are balanced
Opportunities lie in each compa-ny fine tuning and optimizingtheir internal operations to getmaximum efficiency and bestoverall supply chain profitability.
GROWTHDemand exceeds supply
Opportunities lie in building mar-ket share and recognitionthrough working with supplychain partners to provide highlevels of customer service asmeasured by order fill rate andon-time delivery.
D E M A N D
SU
PP
LY
TEAMFLY
Team-Fly®
TEAMFLY
Team-Fly®
141
M e a s u r i n g P e r f o r m a n c e : S u p p l y C h a i n M e t r i c s
them in more precise terms so that they can be measured objectively.
We will use four measurement categories:
1. Customer Service
2. Internal Efficiency
3. Demand Flexibility
4. Product Development
Customer Service
Customer service measures the ability of the supply chain to meet the
expectations of its customers. Depending on the type of market being
served, the customers in that market will have different expectations for
customer service. Customers in some markets both expect and will pay
for high levels of product availability and quick delivery of small pur-
chase quantities. Customers in other markets will accept longer waits
for products and will purchase in large quantities.Whatever the market
being served, the supply chain must meet the customer service expec-
tations of the people in that market.
Internal Efficiency
Internal efficiency refers to the ability of a company or a supply chain
to operate in such a way as to generate an appropriate level of prof-
itability. As with customer service, market conditions vary and what is
an appropriate level of profit varies from one market to another. In a
risky developing market the profit margins need to be higher in order
to justify the investment of time and money. In a mature market where
there is little uncertainty or risk, profit margins can be somewhat lower.
These markets offer the opportunity to do large volumes of business
and to make up in gross profit what is given up in gross margin.

142
E S S E N T I A L S o f S u p p l y C h a i n M a n a g e m e n t
Demand Flexibil ity
This category measures the ability to respond to uncertainty in levels of
product demand. It shows how much of an increase over current levels
of demand can be handled by a company or a supply chain. It also
includes the ability to respond to uncertainty in the range of products
that may be demanded. This ability is often needed in mature markets.
Product Development
This encompasses a company and a supply chain’s ability to continue to
evolve along with the markets it serves. It measures the ability to develop
and deliver new products in a timely manner. This ability is necessary
when serving developing markets.
A Framework for Per formance Measurement
There are other demands that real-world markets place on their supply
chains, however, by using these four performance categories we can create
a useful framework. This framework describes the mix of performance
required from companies and supply chains that serve the four different
market quadrants.When a company identifies the markets it serves it can
then define the performance mix required by those markets in order to
best respond to the opportunities they provide.
Markets in the first quadrant, developing markets, require their supply
chains to excel in product development and customer service. Growth
markets require very high levels of customer service particularly as meas-
ured by order fill rates and on-time delivery. Steady markets require inter-
nal efficiency as well as an even broader scope of customer service.Mature
markets require all the internal efficiency and customer service called for
by steady markets.They also require the highest levels of demand flexibility.
The most profitable companies and supply chains are those that
deliver the performance called for by their markets.These organizations

are the most profitable because they are the ones most able to respond
effectively to the opportunities offered by their markets. Companies
should collect and track a handful of performance measures that cover
these four areas. This will give them valuable information about how
well they are responding to their markets.
The metrics that measure performance in the four areas are applicable
to individual companies and also to entire supply chains. It is harder to
gather these metrics for entire supply chains because companies are
reluctant to share data that may be used against them by their competitors
or by their customers or suppliers.There are issues of trust and incentive
143
M e a s u r i n g P e r f o r m a n c e : S u p p l y C h a i n M e t r i c s
Market Quadrants Require a Different Mix of Performance
Does your company excel in the performance categories that relateto the markets you serve? Profit opportunities lie in being a leaderin the mix of performance categories that your markets call for.
T IPS & TECHNIQUES
MATURE
• Customer Service
• Internal Efficiency
• Demand Flexibility
DEVELOPING
• Customer Service
• Product Development
STEADY
• Customer Service
• Internal Efficiency
GROWTH
• Customer Service
D E M A N D
SU
PP
LY
to work out before these metrics can readily be collected for an entire
supply chain. Nonetheless, when these issues are worked out, these
metrics will help to guide the behavior of the entire supply chain and
should benefit all the participants in that chain over the long term.
Customer Service Metrics
In the words of Warren Hausman, a professor at Stanford University,
“service relates to the ability to anticipate, capture and fulfill customer
demand with personalized products and on-time delivery” (Hausman,
Warren H., 2000, “Supply Chain Performance Metrics,” Management
Science & Engineering Department, Stanford University). The reason
that any company exists is to be of service to its customers. The reason
that any supply chain exists is to serve the market it is attached to.These
measures indicate how well a company serves its customers and how
well a supply chain supports its market.
There are two sets of customer service metrics depending on whether
the company or supply chain is in a build to stock (BTS) or build to
order (BTO) situation. Popular metrics for a build to stock situation are:
• Complete Order Fill Rate and Order Line Item Fill Rate
• On-Time Delivery Rate
• Value of Total Backorders and Number of Backorders
• Frequency and Duration of Backorders
• Line Item Return Rate
Popular metrics for a build to order situation are:
• Quoted Customer Response Time and On-TimeCompletion Rate
• On-Time Delivery Rate
• Value of Late Orders and Number of Late Orders
• Frequency and Duration of Late Orders
• Number of Warranty Returns and Repairs
144
E S S E N T I A L S o f S u p p l y C h a i n M a n a g e m e n t

Build to Stock
A build to stock or BTS situation is one where common commodity
products are supplied to a large market or customer base. These are
products such as office supplies, cleaning supplies, building supplies, and
so on. Customers expect to get these products right away any time they
need them. Supply chains for these products must meet this demand by
stocking them in inventory so they are always available.
In a BTS environment a customer wants their complete order to be
filled immediately.This may be expensive to provide if customer orders
contain a wide range and number of items. It is costly for companies to
carry all those items in stock so they may have backup plans to provide
expedited delivery of items not in stock or substitution of upgraded
items for those not in stock. The order fill rate measures the percentage
of total orders where all items on the order are filled immediately from
stock. The line item fill rate is the percentage of total line items on all
orders that are filled immediately from stock. Used together, these two
measures track customer service from two important perspectives.
Build to Order
A build to order or BTO situation is one where a customized product
is ordered by a customer. This is any situation where a product is built
based on a specific customer order and is configured to meet a unique
set of requirements defined by the customer. An example of this is the
way Boeing builds airplanes for specific customers and their require-
ments or the way Dell Computer assembles PCs to fit individual cus-
tomer orders and specifications.
In a BTO environment it is important to track both the quoted
customer response time and the on-time completion rate. It is easier for
a company to achieve a high on-time completion rate if it quotes
longer customer response times. The question is whether the customer
145
M e a s u r i n g P e r f o r m a n c e : S u p p l y C h a i n M e t r i c s
146
E S S E N T I A L S o f S u p p l y C h a i n M a n a g e m e n t
really wants a short response time or will accept a longer response time.
The quoted response time needs to be aligned with the company’s value
proposition and competitive strategy.
Internal Ef ficiency Metrics
Internal efficiency refers to the ability of a company or a supply chain
to use their assets as profitably as possible. Assets include anything of
tangible value such as plant, equipment, inventory, and cash. Some pop-
ular measures of internal efficiency are:
• Inventory value
• Inventory turns
• Return on sales
• Cash-to-cash cycle time
Inventory Value
This should be measured both at a point in time and also as an average
over time. The major asset involved in a supply chain is the inventory
contained throughout the length of the chain. Supply chains and the
companies that make them up are always looking for ways to reduce
inventory while still delivering high levels of customer service. This
means trying to match inventory availability (supply) with sales (demand)
and not have excess inventory left over. The only time a company
would want to let inventory exceed sales is in a growth market where
the value of the inventory will increase. However, markets change and
as a rule it is best to avoid excess inventory.
Inventory Turns
This is a way to measure the profitability of inventory by tracking the
speed with which it is sold or turned over during the course of a year.This
measure is often referred to as T& E or “turn and earn.” It is calculated
by the equation:
Turns = Annual Cost of Sales / Annual Average Inventory Value
Generally, the higher the turn rate the better, although some lower
turning inventory needs to be available in order to meet customer serv-
ice and demand flexibility.
Return on Sales
Return on sales is a broad measure of how well an operation is being
run. It measures how well fixed and variables costs are managed and also
the gross profit generated on sales:
Return on Sales = Earnings before Interest & Tax / Sales
Again, as a rule, the higher the return on sales the better. There are
times though when a company may deliberately reduce this number in
order to gain or defend market share or to incur expenses that are nec-
essary to achieve some other business objective.
Cash-to-Cash Cycle Time
This is the time it takes from when a company pays its suppliers for
materials to when it gets paid by its customers.This time can be estimated
with the following formula:
Cash-to-Cash Cycle Time = Inventory Days of Supply +
Days Sales Outstanding – Average Payment Period on Purchases
The shorter this cycle time the better.A company can often make more
improvements in their accounts payable and receivable areas than they
can in their inventory levels. Accounts receivable may be large due to
late payments caused by billing errors or selling to customers who are
bad credit risks. These are things a company can manage as well as
inventory.
147
M e a s u r i n g P e r f o r m a n c e : S u p p l y C h a i n M e t r i c s

Demand Flexibility Metrics
Demand flexibility describes a company’s ability to be responsive to
new demands in the quantity and range of products and to act quickly.
A company or supply chain needs capabilities in this area in order to
cope with uncertainty in the markets they serve. Some measures of
flexibility are:
• Activity Cycle Time
• Upside Flexibility
• Outside Flexibility
Activity Cycle Time
The cycle time measures the amount of time it takes to perform a supply
chain activity such as order fulfillment, product design, product assembly,
or any other activity that supports the supply chain.This cycle time can
be measured within an individual company or across an entire supply
chain. Order fulfillment within a single company may be fast but that
company may only be filling an order from another company in the
supply chain.What is important is the cycle time for order fulfillment
to the ultimate end use customer that the entire supply chain is there
to serve.
Upside Flexibil ity
It is the ability of a company or supply chain to respond quickly to
additional order volume for the products they carry. Normal order vol-
ume may be 100 units per week for a product. Can an order be accom-
modated that is 25 percent greater one week or will the extra product
demand wind up as a backorder? Upside flexibility can be measured as
the percentage increase over the expected demand for a product that
can be accommodated.
148
E S S E N T I A L S o f S u p p l y C h a i n M a n a g e m e n t
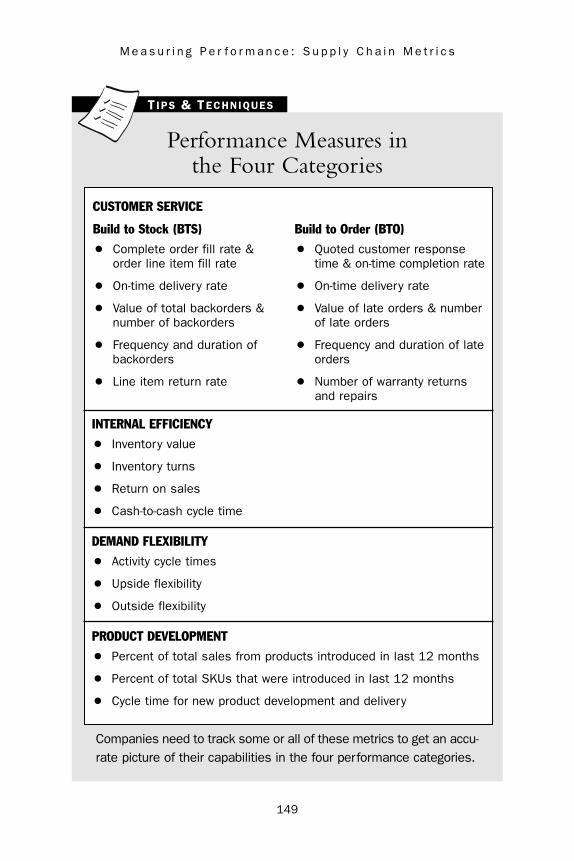
149
M e a s u r i n g P e r f o r m a n c e : S u p p l y C h a i n M e t r i c s
Performance Measures in the Four Categories
Companies need to track some or all of these metrics to get an accu-rate picture of their capabilities in the four performance categories.
T IPS & TECHNIQUES
CUSTOMER SERVICE
Build to Stock (BTS)
• Complete order fill rate &order line item fill rate
• On-time delivery rate
• Value of total backorders &number of backorders
• Frequency and duration ofbackorders
• Line item return rate
Build to Order (BTO)
• Quoted customer responsetime & on-time completion rate
• On-time delivery rate
• Value of late orders & numberof late orders
• Frequency and duration of lateorders
• Number of warranty returnsand repairs
INTERNAL EFFICIENCY
• Inventory value
• Inventory turns
• Return on sales
• Cash-to-cash cycle time
DEMAND FLEXIBILITY
• Activity cycle times
• Upside flexibility
• Outside flexibility
PRODUCT DEVELOPMENT
• Percent of total sales from products introduced in last 12 months
• Percent of total SKUs that were introduced in last 12 months
• Cycle time for new product development and delivery

Outside Flexibil ity
This is the ability to quickly provide the customer with additional
products outside the bundle of products normally provided. As markets
mature and technologies blend, products that were once considered out-
side of the range of a company’s offerings can become a logical extension
of its offerings. There is danger in trying to provide customers with a
new and unrelated set of products that has little in common with the
existing product bundle. However, there is opportunity to acquire new
customers and sell more to existing customers when outside flexibility
is managed skillfully.
Product Development Metrics
Product development measures a company or a supply chain’s ability to
design, build, and deliver new products to serve their markets as those
markets evolve over time.Technical innovations, social change, and eco-
nomic developments cause a market to change over time. Measurements
in this performance category are often overlooked, but companies do
so at their own peril. A supply chain must keep pace with the market
it serves or it will be replaced. The ability to keep pace with an evolving
market can be measured by metrics such as:
• Percentage of total products sold that were introduced in thelast year
• Percentage of total sales from products introduced in the last year
• Cycle time to develop and deliver a new product
Operations that Enable Supply Chain Per formance
In order for an organization to meet the performance requirements of
the markets it serves it must look to measure and improve its capabilities
in the four categories of supply chain operations:
150
E S S E N T I A L S o f S u p p l y C h a i n M a n a g e m e n t
TEAMFLY
Team-Fly®
TEAMFLY
Team-Fly®

1. Plan
2. Source
3. Make
4. Deliver
The efficiency with which these activities are carried out will ulti-
mately determine how well a company performs as measured by things
such as order and line item fill rate, on-time delivery, inventory turns,
151
M e a s u r i n g P e r f o r m a n c e : S u p p l y C h a i n M e t r i c s
Measuring performance is a process of selecting
a handful of meaningful indicators and using them to track
company performance. Often the indicators are financial
performance measurements.
Bob Mitchum is the CFO of a cooperative of distribution companies thatserves customers across North America. This organization is calledNetwork Services (www.nsconline.com). Bob is the one who keepstabs on the performance of the organization as a whole and also ofthe member companies individually. All member companies need tomeet several performance targets in order to remain members in goodstanding. This ensures that they are able to deliver the products andservices demanded by Network Services’ national account customers.
Bob watches four financial indicators of each member company’sinternal efficiency. Two of them measure the company’s operatingefficiency and two of them measure its resiliency—its ability to with-stand tough times and respond to opportunities. “Over a 2-to-3 yearperiod these ratios give a pretty clear picture of what’s going on witha company. Network requires its members to meet or exceed thebenchmark measures in these two areas as set by our industrytrade association [National Paper Trade Association].” These financialindicators are:
EXECUTIVE INSIGHT

152
E S S E N T I A L S o f S u p p l y C h a i n M a n a g e m e n t
EXECUTIVE INSIGHT (CONTINUED)
Operating Efficiency
• Return on Sales—Pretax earnings (EBIT) as a percentageof sales
• Return on Shareholder Equity—EBIT as a percentage ofshareholder equity
Resiliency
• Debt to Net Worth—Total debt divided by net worth
• Interest Coverage—EBIT divided by interest expense
Return on sales is an indicator of how well a business is being run.“It tells you if a company is operating within its means. If this num-ber is going up year to year that means the company is getting moreefficient. If the number is going down or becomes negative, thattells you the company is spending more than it is bringing in.”
Return on shareholder equity shows how efficiently the company’smoney is being spent, “the higher this number the better.” If a com-pany cannot produce a return on equity that is better than puttingthat same money into a CD then the investors in that company needto question how well their money is being spent.
Debt to net worth measures a company’s ability to borrow moneyand also how well the owners are leveraging their equity. “If the debtto equity ratio is high, then the company cannot borrow more moneyto either get through hard times or take advantage of an opportunity.At the same time, many owners of private companies like to haveas high a ratio as possible, especially during times of low interestrates, because this means the owner is leveraging his risk by usingthe bank’s money and not his own.”
Interest coverage indicates how much additional money a companycan borrow. “This shows how much additional interest on debt canbe covered by a company’s cash flow.”
and cash-to-cash cycle time. Certain activities are directly related to
certain performance categories. For instance, inventory management
will directly affect a company’s order and line item fill rate and its
inventory turns. Its procurement activity will directly affect its return
on sales and its upside ability. A company needs to collect data about its
activities in these four operational areas and monitor results.
The Supply-Chain Council’s SCOR model suggests the kind of
operational data that should be collected. This data is referred to as
“Level 2 Performance Metrics.” In the plan operation, useful measures
are the cost of planning activities, inventory financing costs, inventory
days of supply on hand, and forecast accuracy. In the sourcing opera-
tion, it is useful to have data on material acquisition costs, sourcing cycle
times, and raw material days of supply. Useful measures in the make
operation are the number of product defects/complaints, make cycle
times, build order attainment rates, and product quality. Suggested
delivery operation measures are fill rates, order management costs, order
lead times, and item return rates.
This data should be collected regularly and trends should be watched.
When performance targets start to be missed, the next step is to inves-
tigate the business operations that support that performance. Again the
SCOR model suggests more detailed data that can be collected and
analyzed in each of the four supply chain operating areas. This more
detailed data is referred to as “Level 3 Diagnostic Metrics.”
Diagnostic metrics can be used to analyze the complexity and con-
figuration of the supply chain and also to study specific practices. In the
plan operation, complexity measures are the number and percentage of
order changes, number of stock keeping units (SKUs) carried, produc-
tion volumes, and inventory carrying costs. Configuration measures track
things such as product volume by channel, number of channels, and
number of supply chain locations. Measures of management practices
153
M e a s u r i n g P e r f o r m a n c e : S u p p l y C h a i n M e t r i c s

in the plan operation are such things as planning cycle time, forecast accu-
racy, and obsolete inventory on hand.
In the source operation, measures of complexity and configuration
are number of suppliers, percentage of purchasing spending by distance,
and purchased material by geography. Some practice measurements are
supplier delivery performance, payment period, and percentage of items
purchased by their associated lead time.
154
E S S E N T I A L S o f S u p p l y C h a i n M a n a g e m e n t
Business Operations Support Company Performance
T IPS & TECHNIQUES

The make operation has measures of complexity and configuration
such as number of SKUs, upside production flexibility, manufacturing
process steps by geographical location, and capacity utilization. Manage-
ment practice measurements are value added percentage, build to order
percentage, build to stock percentage, percentage of manufacturing order
changes due to internal issues, and work in process inventory.
In the fourth supply chain operation, deliver, there are complexity
measures that include number of orders by channel, number of line items
and shipments by channel, and percentage of line items returned.Config-
uration measures are delivery locations by geography and number of
channels. Practice measures cover things like published delivery lead times,
percentage of invoices that contain billing errors, and order entry methods.
Collecting and Displaying Per formance Data
Historically, companies based their management decisions on periodic,
standard reports that showed what happened during some period in the
past. In stable and slow-moving business environments this worked well
enough. However, there are not many companies that work in stable and
slow-moving environments any more.Working from traditional, periodic,
accounting-oriented reports in a fast-paced world is somewhat like trying
to drive a car by looking into the rear-view mirror.
The business environments we live in are characterized by shorter
product life cycles, mass markets dissolving into smaller niche markets,
and new technology and distribution channels constantly opening up
new opportunities. The pace of change is both exhilarating and relent-
less. A company must keep up. To do this, a company needs to build a
reporting system that presents data at three levels of detail:
• Strategic—to help top management decide what to do
• Tactical—to help middle management decide how to do it
• Operational—to help people actually do it
155
M e a s u r i n g P e r f o r m a n c e : S u p p l y C h a i n M e t r i c s

156
E S S E N T I A L S o f S u p p l y C h a i n M a n a g e m e n t
Supply Chain Performance Metrics and Diagnostic Measures
(Supply-Chain Council SCOR Model)
T IPS & TECHNIQUES

Three Levels of Detail
In a supply chain management context, strategic data consists of current
actual, as well as plan and historical numbers that show the company’s
standing in the four performance categories: customer service; internal
efficiency; demand flexibility; and product development. In the Supply-
Chain Council SCOR model, data of this type is referred to as “Level
1” data. This data is summarized by major business units and for the
company as a whole. Strategic data also consists of data from outside the
company such as market sizes and growth rates, demographics, and eco-
nomic indicators such as GNP, inflation rates, and interest rates. There
should also be benchmark data from industry trade associations and
studies that show the operating standards and financial performance
levels that are standard for companies in the markets being served.
Tactical data consists of actual, plan, and historical numbers in the
four performance categories displayed at the branch office level of
detail.This data also includes the performance metrics labeled “Level 2”
in the SCOR model.These metrics monitor the plan, source, make, and
deliver operations that every company in a supply chain must perform.
Operational data consists of the measures labeled “Level 3” in the
SCOR model. These measurements help people who are charged with
getting a job done to understand what is happening and to find ways to
make improvements where needed to meet the performance targets that
have been set. The SCOR model refers to these measurements as diag-
nostic measures.
We are awash in data. It is important to present it in such a way that
it is useful. If people are overwhelmed with data they cannot use it. By
organizing data into these three levels, people can quickly access what
they need to do their jobs. Upper management uses strategic level data
to assess market conditions and set business performance objectives.
They can drill down to the tactical level or even the operational levels
157
M e a s u r i n g P e r f o r m a n c e : S u p p l y C h a i n M e t r i c s

when necessary. Middle managers use tactical data to do planning and
resource allocation to achieve the performance objectives set by upper
management. Line managers and their staffs use operational data to
solve problems and get things done.
The Data Warehouse
To collect this data requires the creation of a data warehouse. This data
warehouse is a central repository of data that is drawn from a variety of
operating systems and accounting systems in a company. It is important to
collect the needed data at its source. Tap into relevant systems within a
company and capture needed data automatically as a by-product of daily
operations.Avoid having people do manual entry to get data into the data
warehouse.
A data warehouse is composed of a database software package and the
automated connections to other systems needed to collect the relevant
data on a regular and timely schedule.Working in conjunction with the
database software is software that allows for the creation of standard
predefined reports and graphic displays which people can use to monitor
operations. In addition to predefined reports and displays, the software
must also allow people to do ad hoc queries of the data in the data
warehouse to do detailed investigations when necessary.
When designing and building a data warehouse it is best to start
quickly with something that is simple and on a smaller scale. This way
people can get experience in using data more actively to do their jobs.As
they gain experience and can clearly describe the additional features they
would like, larger and more complex data warehouses can be built.
Remember, the most important component in any data warehouse system
is not the technology, or even the data, but the people who use the system
and their ability to use the system effectively and learn from the data
158
E S S E N T I A L S o f S u p p l y C h a i n M a n a g e m e n t
and become more efficient at their jobs. Chapter 6 goes into further
detail about the design and building of these kinds of systems.
In addition to helping people inside of a company to become more
efficient in performing their supply chain management jobs, a data ware-
house can also be the foundation for collaboration with other companies
in the supply chain.Whatever information is shared between companies in
a supply chain should be made available to those other companies elec-
tronically. This often takes the form of reports that can be retrieved on
demand by other companies who access a company’s data warehouse over
the Internet using features of the same data reporting software that people
inside the company use. See Exhibit 5.1.
Spotlighting Problems and Finding Opportunities
Depending on the type of markets a company serves, senior manage-
ment needs to define a handful of key performance targets in the areas
of customer service, internal efficiency, demand flexibility, and product
development. The task then becomes one of figuring out how to man-
age operations to achieve the target numbers. The point of collecting
performance data is to help monitor and control daily, weekly, and
monthly operations.
People in a company need access to a one page display of the key
operating or financial measures that they are responsible for achieving.
These one page displays are known as “dashboards” because they show
a person at a glance the data that is most important to them. The data
that is displayed on a senior management dashboard is different from
that on an operating manager’s dashboard and the data on the dash-
board of a staff person in one department is different from a staff per-
son’s in another department.
Senior management sets company performance targets and they
need access to a dashboard report that shows them the company’s current
159
M e a s u r i n g P e r f o r m a n c e : S u p p l y C h a i n M e t r i c s
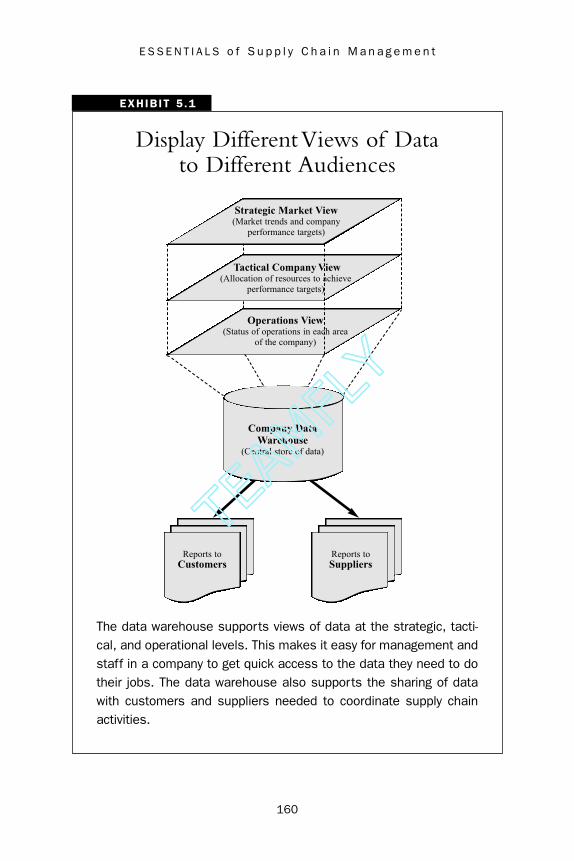
160
E S S E N T I A L S o f S u p p l y C h a i n M a n a g e m e n t
Display Different Views of Data to Different Audiences
The data warehouse supports views of data at the strategic, tacti-cal, and operational levels. This makes it easy for management andstaff in a company to get quick access to the data they need to dotheir jobs. The data warehouse also supports the sharing of datawith customers and suppliers needed to coordinate supply chainactivities.
EXHIBIT 5 .1
Reports toCustomers
Reports toSuppliers
Strategic Market View(Market trends and company
performance targets)
Tactical Company View(Allocation of resources to achieve
performance targets)
Operations View(Status of operations in each area
of the company)
Company Data Warehouse
(Central store of data)
TEAMFLY
Team-Fly®
TEAMFLY
Team-Fly®

performance against these targets. If things are going well and per-
formance is meeting expectations, then no further attention is called
for, but if performance is falling short against one or more of the per-
formance targets, then the senior manager knows right away where
more attention is needed.
Middle managers are responsible for managing their operations to
achieve one or more of the company’s performance targets.Their dash-
boards need to show them the plan and actual data on company per-
formance targets they are responsible for. They need to see quickly if
operations are on target or not and direct their attention accordingly.
Once alerted by their dashboard that there is a problem in a particular
area, the manager can then drill down into further detail in that area.
Staff people in various departments need dashboards that track and
illuminate the specific business operations that they are responsible for
such as purchasing, credit, inventory management, and so on.These dis-
plays should highlight issues needing their attention.
For the most part, people run their business or do their job by keep-
ing track of a handful of key indicators.These indicators tell them where
to direct their attention and help them steer through a complex and
changing world.When a data warehouse and software reporting tools are
in place in a company, people need to experiment with the design of
their dashboard displays or reports.As they get better at using their dash-
boards to guide their actions, the overall effect will be for the company
as a whole to become more efficient and more responsive to its markets.
Since very few companies work in stable and slow-moving markets
anymore, there is a great need to learn to use data effectively to make
decisions and act. Speed is a major competitive advantage. The faster a
company can spot problems and fix them or see opportunities and
respond to them, the more profitable the company will be. It will also
have a much better chance of survival over the long term. Companies
161
M e a s u r i n g P e r f o r m a n c e : S u p p l y C h a i n M e t r i c s

162
E S S E N T I A L S o f S u p p l y C h a i n M a n a g e m e n t
Dashboard Designs are Different at Each Level
People at different levels in an organization need to design theirdashboard displays so that they get quick and easy access to thedata they need to do their jobs and monitor their progress.
EXHIBIT 5 .2
STRATEGIC Dashboard
TACTICAL Dashboard
OPERATIONAL Dashboard

that can see their markets change and adjust and follow those markets
most efficiently are the ones that will stay in business. Companies that do
not notice problems soon enough or that do not see how their markets
change are the ones that will get into trouble. See Exhibit 5.2.
Markets Migrate from One Quadrant to Another
Markets migrate from one quadrant to another during the course of
their lifecycle. Over time, market forces are always pushing a market
toward an equilibrium where supply meets demand. At the same time,
other forces also influence a market so it fluctuates back and forth
around the equilibrium point. At times demand outstrips supply and at
other times there is more supply than there is demand.
Companies in the supply chains that supply a market must be able
to adjust their operations over time as their markets migrate from one
quadrant to another in order to remain competitive. For instance, in
growth markets, supply chains that do the best are the ones that have
the highest levels of customer service as measured by order fill rate and
on-time delivery. All the companies in the supply chain must focus on
delivering this performance in order to succeed.
As a growth market moves on to a steady market, the most profitable
companies will be those that are able to maintain high levels of existing
customer service and also broaden the scope of their customer services. In
addition, profitable companies will be the ones that achieve the best levels
of internal efficiency.They can no longer focus only on customer service.
As steady markets become mature markets, the supply chains that
serve them must again develop their performance in another category.
Mature markets require companies to develop the capabilities needed
to accommodate high levels of demand flexibility.Then in the midst of
mature markets, new developing markets can appear and the ability to
create new products and bring them to market becomes critical.
163
M e a s u r i n g P e r f o r m a n c e : S u p p l y C h a i n M e t r i c s

Adaptability itself is now as important to survival and success as the
four performance categories. Market evolution is now often measured
in years and sometimes in months. Gone are the days when markets
changed more slowly over decades. No company has the luxury of
being able to focus on optimizing any single mix of performance capa-
bilities over the long term.
A company may become very skilled at internal efficiency and cus-
tomer service as called for in a steady market. The company needs to
remember though that its markets will change. The company will have
to add skills in the area of demand flexibility as some of its markets
mature. The company may even need to de-emphasize some of its
internal efficiency policies in order to emphasize its performance in
product development so that it can participate in a promising develop-
ing market. The key here is that a company needs to know when to
shift its emphasis from one mix of performance categories to another.
A ship at sea needs to watch the wind and the waves and respond
appropriately when the weather changes. So too must a company watch
the supply and demand situation in its markets and respond appropri-
ately when one of its markets enters a new quadrant. If the collection
and display of market and company performance data alerts a compa-
ny to respond sooner to a market change than its competitors, then the
company has indeed developed an important tool for its success and
survival. See Exhibit 5.3.
Sharing Data Across the Supply Chain
As markets migrate from one quadrant to another, there are great demands
placed on the supply chains that support them. In fact, it is sometimes the
operation of the supply chain itself that can push a market from one quad-
rant to another. A case in point is illustrated by the beer game simulation
described in Chapter 3. This simulation shows how a slight change in
164
E S S E N T I A L S o f S u p p l y C h a i n M a n a g e m e n t

165
M e a s u r i n g P e r f o r m a n c e : S u p p l y C h a i n M e t r i c s
Market Conditions Shift Over Time
A market (call it Market ‘X’) follows a lifecycle. It develops and thenit goes on to become a growth market which leads to a steady mar-ket and then a mature market and so on. Over time the forces ofsupply and demand are always pushing the market toward a steadystate where supply and demand are equal yet at the same timeother forces disrupt this balance.
The supply chains that support Market ‘X’ need to be able to providefirst one kind of performance and then another as the marketmoves through its lifecycle. The companies that are most successfulin supplying this market are those that can adapt their performanceappropriately to follow the market as it changes.
EXHIBIT 5 .3

demand by the end customer or the market can cause wildly escalating
product demand forecasts to be sent to companies further down the supply
chain. This “bullwhip” effect results in the production of large quantities
of inventory which can then outstrip the real demand in the market.This
event becomes the event that pushes a market out of the steady quadrant
and into the mature quadrant.As excess inventory gets used up, it gradually
brings the market back into the steady quadrant.
The cure for the bullwhip effect is better sharing of data among all
the companies in a supply chain. Companies need to work through
their concerns about sharing data that many of them might consider
confidential. There are serious questions to be answered.What data is it
reasonable to share? How can privacy of critical data be maintained?
What are the benefits of sharing data and how can they be quantified?
Hau Lee is a professor at Stanford University’s business school and
director of the Stanford Global Supply Chain Management Forum. He
envisions the supply chain as an “intricate network of suppliers, dis-
tributors and customers who share carefully managed information
about demand, decisions and performance, and who recognize that suc-
cess for one part of the supply chain means success for all.”
If each company had demand information from the other companies
in its supply chain, it would help everyone to make the best decisions
about how much manufacturing capacity to build and how much
inventory to hold. Companies need to see demand information from
their immediate customers and also from the end customers that the
supply chain ultimately supports.
In addition to sharing demand data across the supply chain, compa-
nies need to share decisions they make that have supply chain implications.
A company could be unaware of decisions made by one of its customers
or one of its customer’s customers that will have a big impact on product
demand. For instance, a chain of retail stores may decide to run a special
166
E S S E N T I A L S o f S u p p l y C h a i n M a n a g e m e n t

promotion on a certain group of products.An analysis of past seasonal sales
data would not predict the spike in demand that will result from running
this promotion. So if the retail store chain does not share this decision
with its suppliers, there is a very good chance they will be caught short
and not be able to deliver enough product to support the promotion.
It is also important for companies to let each other know how well
they are doing in the performance of their supply chain activities.
These metrics can then be combined to provide a holistic picture of the
performance of the entire supply chain.When each company in a sup-
ply chain sees how the supply chain is working overall, then each com-
pany can make better individual decisions about where performance
improvements are needed.
At present, companies are most likely to share demand information
with each other.There is already a lot of precedent for doing this. How-
ever, companies are much less likely to share their decisions or perform-
ance metrics because they are afraid that if this information gets out, it
could wind up in the hands of their competitors and be used against
them.The need for sharing this information continues to grow though.
Customers continue to demand more and more from their supply
chains. In an interview with CIO Magazine for an article titled “The
Cost of Secrecy,” professor Hau Lee said,“If you are late because your
distributor is late, your customers will go to a competitor whose distrib-
utor isn’t late. That is more than a company-to-company competition.
We’re going to see more supply-chain-to-supply-chain competition.”
Companies that can work together to create efficient supply chains
are going to be the ones that do the best over the long term.Companies
that can figure out how to share data effectively will be the ones to create
the most competitive supply chains. Customers are attracted to efficient
supply chains and they gain market share at the expense of less efficient
supply chains. See Exhibit 5.4.
167
M e a s u r i n g P e r f o r m a n c e : S u p p l y C h a i n M e t r i c s

168
E S S E N T I A L S o f S u p p l y C h a i n M a n a g e m e n t
Benefits of Data Sharing Across the Entire Supply Chain
Company ‘A’ may be part of a supply chain (Supply Chain ‘Y’) that actuallymaintains higher levels of inventory across the entire supply chain to deliverthe required level of customer service. A competing supply chain that doesnot maintain as much inventory will be more profitable and can take moremarket share.
Whole supply chains can become more efficient if they are able to bettercoordinate their operations. As supply and demand conditions change, coor-dination of inventory levels is critical to business success.
EXHIBIT 5 .4
An individual company can achievehigh levels of customer service toits customer. However, this cus-tomer may not be the end usecustomer that the supply chainultimately serves, in which case,the company may find that its suc-cess is short lived.

169
M e a s u r i n g P e r f o r m a n c e : S u p p l y C h a i n M e t r i c s
Business realities do not always support the shar-
ing of data among supply chain partners. Concerns about
privacy and competitive advantage often lead companies
not to share data such as sales and demand forecasts.
Jim Alexy is the CEO of Network Services Company, a multi-billiondollar distribution organization. Prior to coming to Network Serviceshe held senior management positions at several of the manufactur-ers whose products Network Services sells. He can speak from theperspective of both the manufacturer and the distributor.
When asked about his experience in sharing data with other companies in a supply chain, he thought for a moment and thenresponded, “In a perfect world, yes it’s a great idea...but if you doshare the data, it’s only a matter of time before some companyturns it against you. Each company has its own quarterly manage-ment incentive plans and people will do what they need to do tomeet their numbers.”
Companies do share data about things such as product demandand inventory levels. The problem is that companies often modifythis data to their own advantage. Customers often inflate theirdemand numbers in order to ensure that they will get the amount ofproduct they think they will really need. Jim said, “Most manufac-turers have some sort of productivity targets they need to hit. Whenthey look at the demand data they get from customers it is so inac-curate that if they responded to all the fluctuations, their productioncosts would go up and they still wouldn’t be producing the rightitems anyway.”
So companies take the data that others share with them and runtheir own projections. “When I was CEO at Sweetheart Cups,” saidJim, “there was a guy who worked for me who built these greatdemand forecast models. He collected all the data and factored in
EXECUTIVE INSIGHT
170
E S S E N T I A L S o f S u p p l y C h a i n M a n a g e m e n t
EXECUTIVE INSIGHT (CONTINUED)
historical trends and ran the model. Then he looked at the resultsand tweaked them in places where he had a strong hunch or somespecial information. And then after all of that, his forecasts stillweren’t as accurate as they could be because one of our major cus-tomers like McDonald’s wouldn’t tell us about a big promotion theywere planning to run and we’d be caught short in 12 ounce cups orsomething. They didn’t always tell us because they didn’t want wordto get out and then have a competitor take action to counter theirpromotion.” Because of the “tweaking” that companies do, the datacan get pretty distorted at times. And since demand data needs tobe much more accurate and believable before a company is goingto accept it at face value, the tweaking will continue.
In spite of these issues, data sharing has enabled some major supplychain improvements. “I think there has been a lot of inventory takenout of the system,” said Jim. “Just-in-time inventory has resulted inmajor savings for everyone.” Just-in-time inventory is often imple-mented through a technique called vendor managed inventory orVMI. Using this technique, the suppliers of products monitor inven-tory levels of their products within the companies that they sell to.Their customers share inventory usage data and sales numbers andthe supplier keeps the inventory stocked at the right levels.
Companies are always weighing the costs and benefits of sharingdata and working together using techniques like VMI. “The wholeconcept of VMI is a very powerful concept. So why don’t I just picka small group of key suppliers and have them manage all my inven-tory for me? Well, the other side of that question is why do I want tobe in bed with just a few suppliers? They can arbitrarily change pricing,or have strikes or other production problems.”
It is very hard for companies to develop the level of credibility andtrust needed to establish tight working relationships. In the meantime,companies still benefit from developing the skill sets and tools thatallow them to analyze data and make decisions. “There is too much
TEAMFLY
Team-Fly®
TEAMFLY
Team-Fly®

Chapter Summary
A useful model of markets can be constructed using the basic compo-
nents of supply and demand. Using these two components results in a
model that defines four market quadrants:
1. DEVELOPING—New markets and new products where bothsupply and demand are low and uncertain
2. GROWTH—Markets where demand is higher than supply andsupply is uncertain
3. STEADY—Established markets where supply is high anddemand is high and both are stable and predictable
4. MATURE—Markets where supply exceeds demand and wheredemand can be unpredictable
The markets in each quadrant have a unique set of performance
requirements that they place on their supply chains. Developing markets
require performance in the areas of customer service and product devel-
opment. Growth markets demand customer service above all else. Steady
markets call for customer service and for internal efficiency, and mature
markets require customer service, internal efficiency, and demand flexi-
bility. In order to succeed, companies and supply chains must excel in
the performance areas that are required by the markets they serve.
Customer service performance is measured by metrics such as order
and line item fill rate, on-time delivery, and item return rates. Internal
171
M e a s u r i n g P e r f o r m a n c e : S u p p l y C h a i n M e t r i c s
EXECUTIVE INSIGHT (CONTINUED)
data. People need ways to sift through it and find what’s important.Computers will never be able to make all the decisions. There are apercentage of judgements that must always be made by people. Thebetter people are at making those judgements, the more productivethe company will be.”

efficiency refers to the ability of a company or supply chain to use its
assets as profitably as possible. Popular measures of internal efficiency
are metrics such as inventory value, inventory turns, and return on sales.
Demand flexibility describes the ability of a company or supply chain
to be responsive to sudden market demands for greatly increased quan-
tities of product or for additional products outside the normal bundle
of products provided. Product development measures an organization’s
ability to design, build, and deliver new products to serve their markets
as those markets evolve over time. Performance in this area is most
important in developing markets.
172
E S S E N T I A L S o f S u p p l y C h a i n M a n a g e m e n t

173
After read ing th is chapter you wi l l be ab le to
• Apply the market analysis framework to define the type ofmarkets your company serves and identify the performancecapabilities most valuable to those markets
• Define performance targets for your company to succeed in the markets you serve—the goal
• Create a strategy and define the objectives needed to reachthe goal
• Estimate the budget needed for this effort and calculate the return on investment (ROI)
• Create the high-level project plan that will guide the effort
Now that conscious design and real-time management of a company’s
supply chain is possible, how does a company use this ability to its
competitive advantage? A well designed and managed supply chain
will enable a company to offer high levels of customer service and at
the same time hold its inventories and cost of sales to levels lower than
its competitors. This chapter will lay out a process to use for defining
the supply chain management opportunities available to a company.
CHAPTER 6
Defining Supply ChainOpportunities

The Supply Chain as a Competitive Advantage
As companies such as Wal-Mart and Dell Computer have so clearly
shown, if a company can design and build a supply chain that is respon-
sive to market demands, it can grow from a small company to become
a major player. Efficient supply chain operations are central to being able
to satisfy market demands and to do so in a way that is profitable.Where
once markets were shaped by the availability of product, now they are
shaped by the evolving demands (some might say whims) of the end use
customers. Availability of most products is now taken for granted. So in
addition to the product itself, the market has a host of other require-
ments in the areas of customer service, demand flexibility, and product
development. A company needs to understand where it fits in the supply
chains of the markets it serves. Then it needs to decide which activities
it will focus on to deliver value.
Supply chains that deliver the best value to their end use customers
generate a strong demand for products and services. They are good
places for producers, logistics providers, distributors, and retailers to do
business. The efficiency of the entire supply chain greatly affects each
company’s ability to prosper, so standards of performance evolve in these
supply chains over time. New companies cannot enter unless they can
meet these standards.What this means is that companies who are good
at their core supply chain operations work together in self-selecting
supply chains to deliver the greatest value to the end use customer.
It also means that there is great profit potential to be had for compa-
nies in a supply chain who learn to cooperate to generate efficiencies and
cost savings for all. Skilled companies in specific markets that learn to work
together to achieve new levels of efficiency and cost savings will create
supply chains that grow faster than other supply chains in their markets.
We may even begin to look at a market in terms of the competing
supply chains that support it instead of just the competing supplier
174
E S S E N T I A L S o f S u p p l y C h a i n M a n a g e m e n t
175
D e f i n i n g S u p p l y C h a i n O p p o r t u n i t i e s
Companies that work together in supply chains
conduct an ongoing discussion about the value perceived
and paid for between supply chain partners. The balance
of power in the supply chain is always being explored.
Walt Dethlefsen is the executive vice president of Network ServicesCompany. Network Services is a distribution organization that handlesa bundle of products that includes printing paper and paper products,food service disposables, and janitorial supplies. Network Servicesparticipates in the supply chains of customers such as Starbucks,Baskin-Robbins, 24 Hour Fitness Clubs, and Premier Health Care.The company distributes the products of manufacturers such asGeorgia-Pacific, Kimberly Clark, Johnson Wax, 3M, and Rubbermaid.
One of Walt’s main activities is to manage the relationships thatNetwork Services has with its suppliers. His work gives him a first-hand view on a weekly basis of what it means to work in evolvingsupply chains with demanding customers and manufacturers. “Bigmanufacturers used to have the most power but that is shiftingtowards the big customer. Big customers now go directly to the man-ufacturers whose products they want to negotiate prices on and thenthey go to the distributor and negotiate the cost for product delivery.
“The distributor often has the least power now. For years the dis-tributor was in the middle and could negotiate with both sides—thecustomer on one hand and the manufacturer on the other. Therewere distributors who did a very good job negotiating with one or theother and sometimes both parties.” Customers these days have manychoices in what they buy and are very successful in driving downprices. Manufacturers are also able to use many different channelsto market so they demand greater and greater performance fromthe distributors they work with.
“The only distributors who are able to defy the price squeeze andmaintain reasonable margins are the ones who are able to create a
EXECUTIVE INSIGHT

176
E S S E N T I A L S o f S u p p l y C h a i n M a n a g e m e n t
EXECUTIVE INSIGHT (CONTINUED)
brand. Typically they recreate their whole company into a brand. Thebrand stands for all the products they sell plus everything else thatthey provide for the customer. When the customer buys from themthey know that trucks will show up at the right time with the rightstuff, that they will get quality products and top notch customerservice, all at a fair acquisition cost.”
The power of the distributor in a supply chain depends very much onthe type of manufacturers that they work with. “I would say we workwith three kinds of manufacturers,” says Walt. The first kind is thebrand name manufacturer who has a retail consumer side of theircompany as well as a business-to-business side. “What they mostlyexpect from the distributor is logistics and customer support in thefield.”
The second kind of manufacturer focuses mainly on the business-to-business market and views the distributor as their customer.“They are generally selective and will only sell to distribution thatgives them a lot of participation. They typically limit the number ofdistributors in a market if they are satisfied with the penetration theyprovide.”
In the third group of manufacturers are companies who are basicallyconverters or smaller manufacturers. Converters take a finishedproduct from another manufacturer and further customize it. Forinstance, they may buy bulk rolls of towel and tissue grade paper andcut it to customer specifications. Also in this group are small spe-cialty manufacturers of product lines that have little brand recogni-tion. “These companies are the ones who are most dependent onthe distributor to get their product to market. They have small salesforces and rely on distributors to develop the end use market fortheir products. They produce products with little known brand namesand typically they lead with price.”

177
D e f i n i n g S u p p l y C h a i n O p p o r t u n i t i e s
companies within the market. Just as we now rate individual companies
by their profitability and customer service levels, we may begin to measure
entire supply chains on their overall performance in these areas.
Identify the Business Opportunity and Define the Goal
Supply chain opportunities generally come in one of two categories.
The first category is to fix or improve something already in place. The
second category is to build something new. In both categories you have
to first define the goal and then set about to accomplish that goal.
Depending on which type of opportunity you are pursuing, the way to
accomplish the goal will be different.
If you are pursuing an opportunity that is in the “fix or improve
something already existing” category, then use Mr. Goldratt’s theory of
constraints as your guidelines for taking action. These guidelines are
summarized in an executive insight section in Chapter 3. If you are
going after an opportunity in the “build something new” category, then
use the process outlined in this chapter.
New markets emerge, existing markets evolve, and mature markets
fade away. A market creates a demand for a bundle of products and
services to support it. Over the life span of a market its supply chain
evolves in response to the forces of supply and demand. Companies that
supply a market must evolve along with the demands of that market.
What are the markets your company serves and who are the end use
customers in these markets? Who are the producers in these markets?
Who are the distributors, the logistics providers, and the retailers? What
are the products and services demanded by this market?
What is the supply and demand situation in the markets you serve?
The supply chain opportunities available to a company depend on which
quadrants the markets it serves are in. Use the market analysis framework
178
E S S E N T I A L S o f S u p p l y C h a i n M a n a g e m e n t
to determine which market quadrants your company deals with.Which
quadrants are your markets in today? Which quadrants do you think
they will be in two years from now? Compare your organization against
competing organizations in your markets. Identify whether you lead,
equal, or lag your competitors in the areas of:
• Customer Service
• Internal Efficiency
• Demand Flexibility
• Product Development
Each market is best served by some combination of performance in
these four areas. Define whether your company needs to lead, equal, or
even excel in each of these areas. Identify the position your company
needs to take in the four areas to best align itself with the demands of
the markets it serves.
As discussed in Chapter 4, a company must lead in flexibility if its
target markets are in quadrant three, and it must lead in internal effi-
ciency if its markets are in quadrant four.A company must excel in prod-
uct development if its markets are in quadrant one and companies must
meet high customer service standards in all market quadrants. Set the
performance targets needed to achieve this market alignment.These per-
formance targets define the goal. They become the measures of success.
Create the Strategy
Once a business goal is defined and the performance targets are set, the
next step is to create a strategy to accomplish this. Strategy can be defined
as simply,“the use of means to achieve ends.” In other words, a strategy
uses the business operations (means) of an organization to achieve its
goals (ends).

To define the strategy, begin by looking at the supply chain opera-
tions that are performed in your company. Achieving the performance
targets that have been set will require improvements in one or more of
the four categories of business operations that are used to manage the
supply chain:
• Plan
• Source
• Make
• Deliver
Use Brainstorming to Generate Ideas
Brainstorm a large list of improvement ideas for the operations under
each of the four categories. Ask the question,“ What seems impossible
to do, but if it could be done, would dramatically change the way we
do business?” Look for ways to change the business landscape—ways to
give your organization a significant competitive advantage by doing
something new and different.Where no new ideas are found, look for
ways to significantly improve existing operations to get greater perform-
ance and better cost savings. Better efficiencies in existing operations
will rarely provide huge business wins but they help ensure the com-
pany’s survival.
Take the time to work up a large list of ideas. These ideas are the
raw material from which the business strategy will emerge.When a suf-
ficiently large body of ideas has been generated, review the lists and
select three to six or so of the ideas that seem to have the most impact.
These are ideas that will deliver improvements in multiple operations
or performance categories. They are also ideas that promise the greatest
payback and have the highest likelihood of success. These are the ideas
that now need to get further attention. They will be the foundation
upon which the strategy is based. See Exhibit 6.1.
179
D e f i n i n g S u p p l y C h a i n O p p o r t u n i t i e s
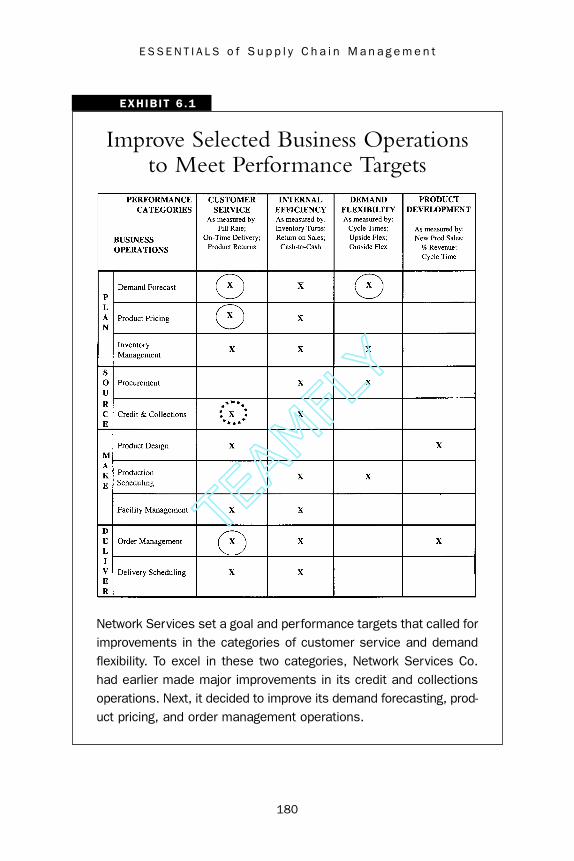
180
E S S E N T I A L S o f S u p p l y C h a i n M a n a g e m e n t
Improve Selected Business Operations to Meet Performance Targets
Network Services set a goal and performance targets that called forimprovements in the categories of customer service and demandflexibility. To excel in these two categories, Network Services Co.had earlier made major improvements in its credit and collectionsoperations. Next, it decided to improve its demand forecasting, prod-uct pricing, and order management operations.
EXHIBIT 6 .1
TEAMFLY
Team-Fly®
TEAMFLY
Team-Fly®

Examine this handful of most promising ideas that have been selected.
How will these ideas play out over the next few years? How do these ideas
work together to form a big picture sequence of events that will take
the organization from where it presently is to where it wants to go—the
accomplishment of its business goals? What things have to be done, what
new operating procedures and information systems need to be created
in order to carry out these ideas? What are the best guesses as to the time
it will take to create these new operating procedures and systems?
Look to see how these ideas relate to each other. Does the imple-
mentation of one idea build upon the implementation of a previous idea?
What sequence should be followed in the implementation of these ideas?
What kind of changes in operations, technology, and staffing are called
for to implement each idea and how can these changes be done in a man-
ageable way? How can the implementation of these ideas be broken up
into phases that can each be completed in three to nine months? A phase
needs to create deliverables that provide value in their own right and that
can be put to use as soon as the phase is completed. See Exhibit 6.2.
It is important to both see the big picture that stretches over a period
of several years and also to segment this big picture into smaller phases.
This way the company is able to begin receiving tangible benefits from
its work in a relatively short period of time. It can also respond to new
developments in the business environment in a timely manner by adjust-
ing its strategy as necessary as it completes each phase. There is a saying
that sums up this approach very nicely: “Think big, start small, and
deliver quickly.”
Create a Conceptual System Design
The strategy to achieve the business goals is expressed in the conceptual
design. The conceptual design is the high-level outline of a system or a
set of systems. Generate several different conceptual designs for systems
181
D e f i n i n g S u p p l y C h a i n O p p o r t u n i t i e s

182
E S S E N T I A L S o f S u p p l y C h a i n M a n a g e m e n t
Network Services’Development Strategy
EXHIBIT 6 .2
PHASE 1
Build version 1.0 of e-business systems
(9 Months)
PHASE 3
Build version 2.0 of e-business systems
(9 Months)
PHASE 2
Assist member companies
(3 Months)
PHASE 4
Integrate intosupply chains
(Quarterly)

that will meet the desired performance criteria. Approach the conceptual
design first from the perspective of the business processes that are sup-
ported. Sketch out the different operations that are performed and note
the kind of information that is required by and created by each operation.
Then add further definition to these process flows by specifying the
data flows into and out of each operation. For each operation, estimate
the volume and frequency of the data flows and also the source and des-
tination of each data flow. In addition, for each operation, define the
types of people (if any) who will perform this work. How many people
will there be? What are the skill levels of the different types of people?
This kind of business process diagram is illustrated in Exhibit 6.3.
Next, decide which operation will be automated, which will be
manual, and which will be part automated and part manual. As a rule,
people will like systems that automate the rote and repetitive tasks and
empower them to do the problem-solving and decision-making tasks
more effectively. People really are the most valuable resource of any
company, so design systems that make maximum use of their skills.
Technology’s role is to support the people who use it, not the other way
around.
Evaluate the existing computer system’s infrastructure in place in
your organization. Look for ways to build on that infrastructure. The
most cost effective systems are those that deliver valuable new capabil-
ities to an organization quickly and with a minimum of effort.
Select the simplest combinations of technology and business processes
that will meet the specified performance criteria. Balance the need for
simplicity with the ability to increase the capacity of the system to handle
greater volumes of data and to add new functionality as the business
operations grow in volume. And remember that markets move over
time from one quadrant to another so build a supply chain infrastructure
that is flexible enough to change with the needs of the markets your
183
D e f i n i n g S u p p l y C h a i n O p p o r t u n i t i e s

184
E S S E N T I A L S o f S u p p l y C h a i n M a n a g e m e n t
Diagram of the Business Process Flows
This diagram shows the business process flows that were includedin the design of the first version of the Network Services e-businesssystem.
EXHIBIT 6 .3

company serves. Do not design a system that locks the company into
one way of operating and that is not capable of evolving to support
new operations.
Create high level schematic diagrams to illustrate each conceptual
system design. In these diagrams use simple shapes like cubes and cylin-
ders and spheres to represent different components of the design.
Connect these shapes with lines and arrows to show the direction of
data flow and activity. Do not get too technical or detailed in these dia-
grams. Their purpose is to quickly communicate the basic structure of
the proposed designs.
These schematic diagrams are invaluable in communicating the fea-
tures of the different designs to a wide audience of people. Reviews and
comments should be sought from people who will use the new system,
people who will pay for it, and people who will build it.Thoughtful input
from a wide audience of people is very helpful in selecting the best
design and then in adjusting that design to increase the likelihood that
it will succeed.
Strategic Guidelines for Designing Systems
Designing supply chain systems or any other kind of system can quickly
become a very complex undertaking. The business manager can come
to feel overwhelmed by the possible choices and be tempted to leave
this activity to the technical experts. Do not give in to this temptation.
Business management must remain actively involved with the technical
people in creating the conceptual design for the system. It is in this
activity that the business manager can exercise very effective control
over the strategy that the company will take to accomplish its goal.This
activity cannot be left entirely to technical people because they usually
do not have the depth of business knowledge that is needed to make
the best decisions.
185
D e f i n i n g S u p p l y C h a i n O p p o r t u n i t i e s
The best approach is for business and technical people to work
together and generate a number of possible conceptual designs. Evaluate
the goodness of each conceptual design by applying the seven guidelines
for the design of new systems.These guidelines provide a basis to com-
pare different designs and to select the conceptual design that has the
best chance of success. A design that respects all seven of these guide-
lines is the best. It may still be a workable design if one or two of these
guidelines are violated (as long as it is not the first of the seven guide-
lines shown below). If guidelines are violated, there need to be very
good reasons for doing so and specific compensations made to cover
those violations. If three or more guidelines are broken, then the con-
ceptual design is seriously flawed and it is very unlikely that the design
can be successfully built.
The seven system design guidelines are:
1. Closely align system designs with the business goals and performance
targets they are intended to accomplish. For any systems develop-
ment project to be a success it must directly support the organ-
ization to achieve one or more of its goals. No new system can
be effective until you have first identified or created the business
opportunity that will make the system worth building and no
new system will bring any sustained benefit to your company
unless it supports the efficient exploitation of the business oppor-
tunity it was built to address.
2. Use systems to change the competitive landscape. Ask yourself what
seems impossible to do today, but if it could be done, would fun-
damentally change what your company does in a positive way.
Put yourself in your customers’ shoes. In the words of the
Nordstrom’s motto, think of what would “surprise and delight”
your customers. Look for opportunities to create a transforma-
186
E S S E N T I A L S o f S u p p l y C h a i n M a n a g e m e n t

tion or value shift in your market. Find ways to do things that
provide dramatic cost savings or productivity increases. Place
yourself in your competitor’s shoes and think of what course
you could take that would be the least likely to be foreseen or
quickly countered or copied.As long as you are able to do some-
thing of value that your competitors cannot, you have an advan-
tage. If you are going to take bigger risks and incur larger costs
to develop a system, then make sure it is a system that will change
the competitive landscape. This is the kind of system that can
deliver benefits that might justify bigger risks and costs.
3. Leverage the strengths of existing systems infrastructure.When exist-
ing systems have proven over time to be stable and responsive, find
ways to incorporate them into the design of new systems. The
purpose of strategy is to best use the means available to the organ-
ization to accomplish its goal. The design of a system is the
embodiment of the strategy being used.Build new systems on the
strengths of older systems. That is what nature does in the evolu-
tionary process. New systems provide value only insofar as they
provide new business capabilities. Time spent replacing old sys-
tems with new systems that do essentially the same things will
not, as a general rule, provide enough value to justify the cost.
4. Use the simplest possible combination of technology and business pro-
cedures to achieve the maximum number of performance targets. A
simple mix of technology and process that can achieve several
different performance targets increases the probability that at
least some performance targets can actually be achieved. This is
because simple combinations of technology and business process
reduce the complexity and the risk associated with the systems.
Using a different combination of technology and business process
187
D e f i n i n g S u p p l y C h a i n O p p o r t u n i t i e s

to achieve each different performance target multiplies the cost
and the complexity of the entire undertaking and reduces the over-
all probability of success.
5. Structure the design so as to provide flexibility in the development
sequence used to create the system. Break the system design into
separate components or objectives and as much as possible, run
the work on individual objectives in parallel.Try not to make the
achievement of one objective dependent on the prior achieve-
ment of another objective. In this way, delays in the work toward
one objective will not impact the progress toward other objec-
tives. Use people on the project who have skills that can be used
to achieve a variety of different objectives. If you use the same
technology to achieve several different objectives, it is much easier
to shift people from one objective to another as needed because
the skill sets used are the same. Your project plan should foresee
and provide for an alternative plan in case of failure or delays in
achieving objectives as scheduled. The design of the system you
are building should allow you to cut some system features if
needed and yet still be able to deliver solid value to the business.
6. Do not try to build a system whose complexity exceeds the organi-
zation’s capabilities. The beginning of wisdom is a sense of what
is possible so don’t bite off more than you can chew. When
defining business goals and the systems to reach those goals, aim
for things that are within your reach. Set challenging goals but
not hopeless goals.The people in your organization need to have
confidence in themselves in order to rise to a challenge. Avoid
exhausting their confidence in vain efforts to reach unrealistic
goals.
188
E S S E N T I A L S o f S u p p l y C h a i n M a n a g e m e n t

7. Do not renew a project using the same people or the same system
design after it has once failed. A mere reinforcement of effort or
just trying harder is not a sufficient enough change to ensure the
success of a project after it has once failed. People are probably
demoralized after the first failure and will not rise to the chal-
lenge of doing the work again unless there are meaningful
changes in the project approach. The new approach must clearly
reflect what was learned from the previous failure and offer a
better way to achieve the business goal and performance targets.
189
D e f i n i n g S u p p l y C h a i n O p p o r t u n i t i e s
Strategic System Design Guidelines
The seven system design guidelines are:
Closely align system designs with the business goals and per-formance targets they are intended to accomplish.
Use systems to change the competitive landscape.
Leverage the strengths of existing systems infrastructure.
Use the simplest possible combination of technology and busi-ness procedures to achieve the maximum number of perform-ance targets.
Structure the design so as to provide flexibility in the develop-ment sequence used to create the system.
Do not try to build a system whose complexity exceeds theorganization’s capabilities.
Do not renew a project using the same people or the samesystem design after it has once failed.
T IPS & TECHNIQUES

190
E S S E N T I A L S o f S u p p l y C h a i n M a n a g e m e n t
Network Services applied the strategic guidelines
for designing systems to create a conceptual design for
its e-business systems infrastructure.
Network Services selected a conceptual design for its e-businesssystems infrastructure that would best enable it to meet its per-formance targets. This design was presented to an audience thatranged from the board of directors to senior management to thepeople who would build the systems infrastructure and the peoplewho would use the systems. Feedback from all these people helpedto finalize the design. The schematic diagram for this conceptualdesign is shown in Exhibit 6.4.
The systems infrastructure is composed of four main componentsthat work together to provide a flexible and cost effective infra-structure that can change as business conditions evolve and canhandle greater and greater volumes of data as business operationsgrow. The four main components are:
The Extranet—A high-speed, Internet-based network to provideall member companies with a secure environment in which toexchange information and work together to serve nationalaccounts.
Web-Based E-Commerce Systems—A suite of systemsaccessed via the Network Services web site. A packaged sys-tem from an application service provider (ASP) namedTibersoft is used to provide order entry, inventory, and orderstatus. Network Services provides the sales history reportingsystem. This suite of e-commerce systems is also available tomember companies to serve their local customers.
NSC Data Warehouse—A collection of databases to supportthe web-based e-commerce operations and internal NSC oper-ations such as proposal development, price file maintenance,account book creation, and sales reporting.
IN THE REAL WORLD
TEAMFLY
Team-Fly®
TEAMFLY
Team-Fly®

191
D e f i n i n g S u p p l y C h a i n O p p o r t u n i t i e s
IN THE REAL WORLD (CONTINUED)
Data Delivery System (NetLink-NSC™)—A two-way, Internet-based data transfer system to allow each member company’sinternal systems to read and write data in a common formatto support delivery of seamless and consistent nationalaccount service. This component incorporated and reusedsoftware from an earlier system that provided for receipt anderror checking of invoice data from member companies.
Conceptual Design for E-Business Systems Infrastructure
The greatest value for the company lay in the construction of the data ware-house to house the databases and in building the data delivery systemcalled “NetLink-NSC™.” Those components working together would bestmeet the performance criteria defined by the company. In order to meet thefinancial performance criteria and reduce project risk, Network Servicesdecided to lease the use of an existing Web-based product catalog andorder entry system instead of building its own.
EXHIBIT 6 .4

Define Project Objectives
When you look at a schematic diagram that illustrates a conceptual
design, the system is shown as a set of high-level components. Defining
these high-level components is a somewhat subjective process since
there is a range of possible ways to design a system—some better than
others. The better designs will define high-level components that are
highly cohesive in the functions they perform. This means that each
component performs a set of tasks that are all closely related to a single
and well-defined activity. For instance, a highly cohesive component in
a conceptual design could be an order entry system. This component
does all the things that need to be done for a customer to enter an order
and that is all it does.
A component that is not cohesive would be a component that did
order entry and also managed a database of sales information and also
routed orders to different business locations. Showing all those activities
as one component in a schematic design does not provide enough def-
inition of the design to enable people to evaluate it effectively. This
component should be broken down into three separate components—
one for order entry, one for database management, and one for data
transmission.
The building of each of these high-level components defines a set
of specific, measurable activities or objectives that need to be achieved
in order to create the system.There will tend to be somewhere between
three to nine high-level components and all other components will
resolve into sub-components of these high-level components. Why
only three to nine high-level components? Because most of us are just
regular folks and we cannot comprehend at a glance or remember more
than seven (plus or minus two) things at a time. A clear and simple sys-
tem design goes a long way toward insuring the success of the project
because the people involved with it can understand it.
192
E S S E N T I A L S o f S u p p l y C h a i n M a n a g e m e n t

If a conceptual design is produced that is so complex only a genius
can understand it, then the conceptual design is useless. People will not
be able to use it to effectively guide their work in the detailed design
and building of the system.Without a clear conceptual design, the peo-
ple involved with building, using, and paying for the system will all have
different ideas about what the company is trying to accomplish. People
working on the different parts of the system will find it increasingly dif-
ficult to coordinate their actions with each other. The level of tension
and misunderstanding and arguing will rise higher and higher as the
work continues.
The development of each component in the conceptual system
design becomes an objective in the project to build the system. Similar
to the way that a long-term strategy is broken down into self-sufficient
phases that each provide value in their own right, the building of a new
system should be broken down into a set of objectives that each pro-
vide value in their own right. An objective should not be just an inter-
mediate step along the way that depends on the completion of some
future step to be of value. Objectives should each be achievable in three
to nine months (or less). Look for objectives that can be achieved
quickly. These will begin providing value and repaying the cost of the
project before it is even entirely finished. Once achieved, an objective
should become a base from which other objectives can be achieved.
Also be careful not to define objectives that lock the project into
some rigid sequence of development activities. The world rarely goes
according to plan, so the plan must be flexible in order to adapt as real-
ity unfolds. Begin work on as many objectives as possible at the same
time (in parallel).As much as possible, make the tasks needed to achieve
each objective independent of the tasks needed to achieve the other
objectives.This provides maximum flexibility, so that if one objective is
delayed, it will not also delay the completion of other objectives being
193
D e f i n i n g S u p p l y C h a i n O p p o r t u n i t i e s

done in parallel. Resources can then be shifted from one objective to
another as needed to respond to situations that arise.
Create an Initial Project Plan and Budget
It is always a challenge to create a project plan early in the project when
there are so many things that are not entirely known. There will be
much agonizing and grumbling about the plan. People will feel that
they are being asked to commit to something that they know very little
about and that whatever they say will come back to haunt them. In an
attempt to give themselves as much wiggle room as possible, some people
will create plans that are so high level and vague that they are little more
than smoke screens. Other people will plunge into the task with determi-
nation and produce a plan showing minute detail about things that can
hardly be defined yet. These plans are little more than wishful thinking
about a future that will probably be nothing like what is shown.
So what is to be done? Let’s start with a definition. Simply stated, a
plan is a sequence of non-repetitive tasks that lead to the achievement
of one or more predefined objectives that do not yet exist.A plan should
not be confused with an operating schedule,which is a repetitive sequence
of tasks that perpetuate an already existing state of affairs. This means
that the plan should focus on laying out the tasks that need to be per-
formed to achieve each objective that was identified in the conceptual
system design. Do not clutter up the project plan with repetitive tasks
that are related to ongoing administrative or business operations.
Create a section of the overall project plan for each objective. In the
section of the plan for each objective, list the major tasks needed to
achieve that objective. There will be tasks related to designing and then
building the deliverables necessary for each objective. Show the dependen-
cies between the tasks related to an objective and show the dependencies
between the objectives.
194
E S S E N T I A L S o f S u p p l y C h a i n M a n a g e m e n t
When estimating how long each task will take, remember the old
saying that “any job will expand to fill the time available.” Use a tech-
nique called “time boxing” to define the time limits for each task. This
technique calls for a trade-off between the work involved in carrying
out a task and the time that is available. Realistic and adequate time
periods must be assigned to each task but then it is up to the people
doing the work to tailor the job to fit the time that is allocated.When
setting these time boxes, get input from the people who will be asked
to do the work. In a good plan the time boxes for each task are aggres-
sive and they require people to work hard and stay focused, but they
should not be so aggressive as to make people feel they have no chance
of getting the work done.
A useful way to think about the work on a project and the corre-
sponding time boxes is to divide time spent on a project into three main
steps and assign an overall time box to each of the main steps. Then
within each step, subdivide the time available to accommodate the tasks
that are involved. The three steps and their durations are:
1. Define what is going to be done—the goal and the objectives.(2–6 weeks)
2. Design how that will be done—the detailed specifications. (1–3months)
3. Build what is specified. (2–6 months)
For each objective set a time box for the design step and the build
step. Don’t worry about the define step—that is what you are doing
right now and showing it on the plan is not necessary. Look at the tasks
that are required to achieve each objective. For example, let’s say that
Objective A has a one-month time box for design and a two-month
time box for build. Decide which tasks fall into the design step and
which tasks are in the build step. Allocate the time available in design
among the tasks involved and do the same for the tasks in the build step.
195
D e f i n i n g S u p p l y C h a i n O p p o r t u n i t i e s

196
E S S E N T I A L S o f S u p p l y C h a i n M a n a g e m e n t
How to Create an Initial Project Plan
The Network Services Co. e-business project objectives were defined by theconceptual system design. The conceptual design had four components:
The Extranet
Web-Based E-Commerce Systems
The Data Warehouse
The NetLink-NSC™ Data Delivery System
Thus, the creation of each of these four components became a projectobjective. There was also a fifth objective to address the strategy of providingtechnical skills and resources to member companies. This initial projectplan laid out the time boxes for the effort needed to achieve each objective.These time boxes defined the amount of time available for each activity.Work was then tailored to fit the times available.
EXHIBIT 6 .5
You have now subdivided the larger design and build time boxes for
Objective A into smaller time boxes for the tasks that are involved.
Assigning time boxes is an iterative process. It involves adjusting both
the time allocations and the scope of the work that will be done. It will
probably take several passes through the plan before you have some-
thing that seems reasonable—something that is both aggressive and yet
still doable. See Exhibit 6.5 for an example of an initial project plan.
Estimate the Project Budget and ROI
This is the step where you answer one of the most fundamental ques-
tions about the project—“Is this project worth doing?” Once a plan has
been constructed, the budget can be created. Project plans and budgets
are just two sides of the same coin. Plans show the time, people, and
material needed to get things done and budgets show the cost of the
people and material over the time frames involved. Although, in many
cases, the cost and benefits related to a project cannot be defined with
absolute certainty, it is still a valuable exercise to get as accurate an esti-
mate as possible.
The value comes in two areas. The first is that this is an opportunity
to create a consensus among the people who have to pay for the system.
Everyone whose budget will be affected by the project should have an
opportunity to review the costs and the benefits of the project. It is
often hard to assign specific values to the benefits but it must be done.
When in doubt, understate the benefits—just make sure that the bene-
fit numbers are ones that people can understand and support. The sum
of these benefit numbers is the value of the project and it is very
important to have agreement on the value of a project.
The value of the project is the main reference point to keep in
mind when evaluating the rest of the project. The value of the system
is what tells you how much can be spent to build the system. If the costs
197
D e f i n i n g S u p p l y C h a i n O p p o r t u n i t i e s

198
E S S E N T I A L S o f S u p p l y C h a i n M a n a g e m e n t
System Development Sequence
These three steps provide a useful way to think about the work that has tobe done to create a new system. Under each step is shown the deliverablesthat need to be produced and estimating guidelines for how long each stepshould take to complete and how much of the total project budget shouldbe spent on that step.
T IPS & TECHNIQUES

to develop a system add up to more than the benefits that will be pro-
duced, then there are two choices. Either find a less expensive way to
produce those benefits or simply do not do the project. Businesses exist to
make a profit and that is a discipline that all business people must live with.
Define the Specific Costs and Benefits
From a financial perspective, a system generates a stream of costs and
benefits over the length of time in which it is built and used. As a rule,
a system should pay for itself and return an appropriate profit within
one to three years because after that time the system will usually need
major enhancements or a complete reworking. Specific benefits need to
be identified and estimates made of their dollar value. Measure system
costs and benefits on a quarterly basis. Subtract costs from benefits to
arrive at the quarterly cash flow generated by the system. Calculate the
value of that cash flow using whatever method the financial decision-
makers would like (net present value, internal rate of return, etc.). The
higher the risk involved in building and operating the system, the higher
the profit that the system should generate.
System Costs
In a system development project there are three types of costs:
1. Hardware and software costs for the hardware, software, and com-
munication network components that need to be purchased from
vendors for the new system design.
2. Development costs as estimated by the time and cost needed to
achieve each project objective. Each task that is part of the work
plan for an objective will require some number of people with
certain skills for some period of time. Each task will also require
certain technology and perhaps other expenses, such as travel, hotel
rooms, and meals. Set a standard cost for each kind of person and
199
D e f i n i n g S u p p l y C h a i n O p p o r t u n i t i e s

200
E S S E N T I A L S o f S u p p l y C h a i n M a n a g e m e n t
Cost/benefit analysis calls for finance executives
to exercise judgment based on experience and industry
norms.
Network Services’ CFO, Bob Mitchum, uses some rules of thumbwhen he looks at a cost/benefit analysis. “First of all, I use a 12- to18-month time frame for the analysis and I need to see an attrac-tive payback in that time. If you accept a three- to five-year paybackperiod you are probably using the analysis to justify what is really anemotional decision. Beyond 18 months the world changes in waysyou cannot predict and I don’t think you can effectively estimatenumbers that far out.”
Costs are usually easier to estimate than benefits. A realistic esti-mate of benefits is very important. “Look at the tangible benefitsand try to assign some numbers over a period of time. Then look atother intangible benefits such as reputation and relationships withcustomers and suppliers. Look at employee productivity and lever-aging their talents. Who are the stakeholders? What are the alter-natives to doing the project and getting the same benefits?
“When I looked at the design and the cost benefit analysis for thee-business systems infrastructure for Network Services, I saw a coupleof things. We knew that many national accounts weren’t going touse our order entry system to key in orders. They would have their ownsystem. But unless we could check off a box on a checklist that, yes,we had a web-based ordering system, we wouldn’t make it past thefirst cut in the screening process. So the design proposed to use anapplication service provider to deliver that feature on a pay-as-you-gobasis. The real benefits came from electronic communications betweenus and the members and that was where the bulk of the proposedbudget was going to be spent. These communication links wouldmake us stronger as a core group. The investment would strengthenthe organization. The conceptual design met our basic needs and pro-vided the most cost efficient way to do so. The price tag was muchlower than the price of the other options that were presented.”
EXECUTIVE INSIGHT
TEAMFLY
Team-Fly®
TEAMFLY
Team-Fly®
estimate the labor expenses for each kind of person for each
step in the system development lifecycle: the DEFINE step; the
DESIGN step; and the BUILD step.
3. Operating costs have a number of components. Estimate labor
expenses for the kinds of people that will be needed for ongoing
operation and support of the new system. Estimate the line
charges and usage fees for the communications network and
technical architecture used by the system. Obtain yearly licensing
and technical support costs from vendors of the hardware and
software components used by the new system.
System Benefits
There are four types of benefits provided by a new system:
1. Direct benefits are productivity increases and cost savings due to
the capacity increases brought about by a new system. Define the
new functions the system provides that the company does not
now have. Estimate the productivity increases and labor savings
that these new features provide.
2. Incremental benefits are monetary benefits that may not be solely
a result of the new system but are measurable and due in some
significant degree to the capabilities of the new system.This may
be an increased ability to attract and retain new customers and the
extra revenue that generates. It may be the new system’s ability
to help the company avoid bad decisions or manage and plan for
certain business expenses and the reduced costs that result.
3. Cost avoidance benefits are savings related to the increased
capacity provided by the new system and the company’s ability
to grow the business without having to hire new staff or hire as
many new staff as would otherwise be the case.
201
D e f i n i n g S u p p l y C h a i n O p p o r t u n i t i e s

4. Intangible benefits are hard to quantify into a money amount but
should be identified and listed.These benefits include such things
as maintenance of a competitive advantage through better intelli-
gence and adaptability; superior service levels that solidify customer
relationships; and leveraging the abilities of talented employees
and increasing their job satisfaction.
202
E S S E N T I A L S o f S u p p l y C h a i n M a n a g e m e n t
Sample Cost/Benefit Analysis
ITEM PRICING SYSTEM—TOTAL ESTIMATED COSTS & BENEFITS
Project Description
Build system to assist staff of account development group to morequickly create contract proposals and explore impact of differentproduct cost and pricing structures. Monitor status of existing con-tracts and provide notice before cost supports expire.
Project Cost & Benefits (Dollars in Thousands)
Qtr 1 Qtr 2 Qtr 3 Qtr 4 Qtr 5 Totals
Hardware & Software (7.0) (7.0)
Development Costs (68.5) (68.5)
Operating Costs 0.0 (1.2) (1.2) (1.2) (1.2) (4.8)
Total Costs (75.5) (1.2) (1.2) (1.2) (1.2) (80.3)
Direct Benefits 0.0 8.4 8.4 8.4 8.4 33.6
Incremental Benefits 0.0 30.0 30.0 30.0 30.0 120.0
Cost Avoidance Benefits 0.0 18.2 18.2 18.2 18.2 72.8
Total Benefits 0.0 56.6 56.6 56.6 56.6 226.4
Net Benefits ($75.5) $55.4 $55.4 $55.4 $55.4 $146.1
Cumulative Benefits ($75.5) ($20.1) $35.3 $90.7 $146.1
Discount Rate 5% (5% per Qtr. = 20% Annual Discount Rate)
Net Present Value 60.6
T IPS & TECHNIQUES

203
D e f i n i n g S u p p l y C h a i n O p p o r t u n i t i e s
T IPS & TECHNIQUES (CONTINUED)
Detailed Schedule of Costs
Cost of Hardware & Software (Dollars in Thousands)
Item Description Cost
Application Server Server to run the system—allocate 1/3 of server cost 3.0
Personal Computers PCs for use by staff—allocate 1/3 of cost 3.0
Visual Basic language Allocated cost of VB programming language and tools 0.5
SQL Server database Allocated cost of SQL Server and tools 0.5
Total $7.0
Cost of Development (Dollars in Thousands)
Task Description Cost
Define Phase 5 days at average cost of $900 per day 4.5
Design Phase 15 days at average cost of $900 per day 13.5
Build Phase—Coding 30 days at average cost of $900 per day 27.0
Build Phase—Test & Train 30 days at average cost of $650 per day 19.5
Build Phase—Roll Out 5 days at average cost of $800 per day 4.0
Total $68.5
Cost of Operation (Dollars in Thousands)
Activity Description Cost
Qtr 1
Qtr 2 Incremental costs of operating the system 1.2
Qtr 3 Incremental costs of operating the system 1.2
Qtr 4 Incremental costs of operating the system 1.2
Qtr 5 Incremental costs of operating the system 1.2
Total $4.8

204
E S S E N T I A L S o f S u p p l y C h a i n M a n a g e m e n t
T IPS & TECHNIQUES (CONTINUED)
Detailed Schedule of Benefits
DIRECT BENEFITS (revenue and cost savings due to productivityimprovements)
Direct Benefit 1 Save staff time on proposal creation: 10 proposals per Qtr.; 20 Hrs. per proposal; $35/Hr.
Direct Benefit 2 Do 2 additional proposals per Qtr.; 20 Hrs./proposal; $35/Hr.
Value of Productivity Improvement (Dollars in Thousands)
Qtr 1 Qtr 2 Qtr 3 Qtr 4 Qtr 5
Save time on proposals 7.0 7.0 7.0 7.0
Do 2 additional proposals 1.4 1.4 1.4 1.4
Total Direct Benefit $0.0 $8.4 $8.4 $8.4 $8.4
INCREMENTAL BENEFITS (benefits due in part to new system, e.g.,attract new customers, make better decisions, etc.)
Incremental Benefit 1 Win more proposals due to better pricing decisions: $30,000 per Qtr. in additional profits
Incremental Benefit 2 —
Value of Incremental Benefit (Dollars in Thousands)
Qtr 1 Qtr 2 Qtr 3 Qtr 4 Qtr 5
Win more proposals 30.0 30.0 30.0 30.0
Incremental Benefit 2 — — — —
Total Incr Benefit $0.0 $30.0 $30.0 $30.0 $30.0

205
D e f i n i n g S u p p l y C h a i n O p p o r t u n i t i e s
T IPS & TECHNIQUES (CONTINUED)
COST AVOIDANCE BENEFITS (savings related to growing business with-out needing to add new staff or incurring other expenses)
Cost Avoidance 1 Avoid hiring more staff as business grows: half a person per year; $35/Hr.
Cost Avoidance 2 —
Value of Cost Avoidance (Dollars in Thousands)
Qtr 1 Qtr 2 Qtr 3 Qtr 4 Qtr 5
Avoid hiring more staff 18.2 18.2 18.2 18.2
Cost Avoidance 2 — — — —
Total CA Benefit $0.0 $18.2 $18.2 $18.2 $18.2
INTANGIBLE BENEFITS (benefits that are hard to quantify in dollaramounts but that should be identified and listed)
Maintain Competitive Advantages
• Item Pricing system should be a competitive benefit for next 2 yrs.
• After that, it will simply become a necessary tool to do business
Provide Superior Service Levels
• Provide customers and prospects with timely and accurate proposals
Increase Job Satisfaction
• Release staff from tedious and time consuming pricing calculations
• Allow staff to focus on more valuable and interesting work

Chapter Summary
The work of defining supply chain opportunities will be complete
when the following five deliverables are produced:
1. A clear statement of the business goal to be accomplished
2. The performance criteria required from the system.These criteria
fall into four measurement categories: 1) internal efficiency;
2) customer service; 3) demand flexibility; and 4) product devel-
opment.These are the conditions of success that the system must
meet.
3. A conceptual design for a system to accomplish the business goal
and meet the performance criteria. The system design is com-
posed of people, process, and technology. The conceptual design
is the embodiment of the strategy being used to attain the goal.
4. A definition of the project objectives that are needed to build the
system. The objectives are the things that must be built to create
the system outlined in the conceptual design.
5. A cost-benefit analysis that verifies that the project is worth carry-
ing out. The senior business executive or management group
who is responsible for accomplishing the business goal that the
system will address must confirm that this analysis is valid.
In formulating supply chain improvement projects, it is a far better
approach to successfully carry out a sequence of small steps than to
attempt to make a great leap forward and risk falling short. In an approach
that involves taking a sequence of smaller steps, the stakes at each step
are modest and the work is more manageable so success is easier to
achieve. In the approach of taking a great leap forward, the stakes are
high—the work is enormous, success is harder to achieve, and the cost
of failure is high.
206
E S S E N T I A L S o f S u p p l y C h a i n M a n a g e m e n t
207
After read ing th is chapter you wi l l be ab le to
• Understand the basics of how to organize and run a projectto design and build a new supply chain system
• Appreciate some useful techniques for investigating supplychain processes and documenting the findings
• See how to flesh out a conceptual system design and pro-duce detailed system specifications
• Understand how to create accurate project plans and budgets based on the detailed system specifications
• Evaluate progress on projects and recognize problems asthey emerge
After a company defines its supply chain strategy and sets the perform-
ance targets for the markets it serves, the next step is to develop the
systems needed to implement the strategy. Often existing systems
need to be enhanced and new systems need to be built. This chapter
presents a process to follow to create the detailed system designs and to
build those systems.
An organization will frequently employ the help of consultants and
software vendors to do this work. However, no company can delegate
the work entirely to outsiders and expect that their best interests will be
CHAPTER 7
Developing Supply ChainSystems

served. Companies that do not stay actively involved in this work put
themselves in a very vulnerable position where they “depend on the
kindness of strangers. . .” as the character Blanche DuBois said in the play
A Streetcar Named Desire (Williams, Tennessee, 1947, A Streetcar Named
Desire, New York, NY:Viking Penguin).
Organizing the Systems Development Project
In Chapter 5 a three-step process to create new systems was introduced.
The three steps in this process are: define; design; and build. The first
step (define) is also discussed in that chapter. This chapter presents the
last two steps in the process. Use this three-step process to organize the
project. Each step has a certain amount of time and budget that should
be allocated to it. Organize and run the project so that the work that
needs to be done in each step is done within the boundaries of these
time and budget limits.
There is a short list of six principles that should be used to run a
project. If these six principles are consistently applied, the probability of
success for the project is very high. If any one of these principles is ignored
then special precautions must be taken to compensate for that. If two or
more principles are violated, then the project is almost sure to fail.
1. Every project needs a full-time leader with overall responsibility and
the appropriate authority (the project leader).
There must be a single person who is responsible for the project’s
success and totally focused on getting the job done. This person
must also have the authority to make decisions and act. It is good
to have a steering committee or management oversight group in
place that the project leader reports to, but a committee cannot
make decisions in a timely manner. If there is no one person in this
role, then the project progress and cost will reflect that. Progress will
be slow or nonexistent and costs will be high.
208
E S S E N T I A L S o f S u p p l y C h a i n M a n a g e m e n t

2. Define a set of measurable and nonoverlapping objectives that are nec-
essary and sufficient to accomplish the project goal or mission.
It is crucial that you define clear project objectives so that the
people who are assigned the responsibility to achieve these objec-
tives know what is expected of them. It is very important that the
boundaries of these objectives do not overlap because if they do,
the overlap will cause confusion and conflict between the teams
assigned to achieve these overlapping objectives.
Make sure that each objective is absolutely necessary to the accom-
plishment of the project goal. Do not pursue an objective just
because it seems like a good idea. Finally, you must be able to say
that if each objective is achieved, then the mission or goal has
been accomplished. The objectives must cover everything that
needs to happen.
3. Assign project objectives to teams of two to seven people with hands-on
team leaders and the appropriate mix of business and technical skills.
Put together a project team of two to seven people who in your
judgment have among them the necessary business and technical
skills and experience to address the issues that will arise in achieving
the objectives you delegate to them. A team is a group of people
with complementary skills who organize themselves so that all
members can contribute their strengths and not be penalized for
their weaknesses.
Each member of the team concentrates on the aspects of design-
ing and building the system that they are good at and/or most
interested in.For the most part, no one is required to do things they
are not interested in or not good at.Within a team, the operative
word is “we,” not “me.” The whole team is rewarded for successes
209
D e v e l o p i n g S u p p l y C h a i n S y s t e m s

and takes responsibility for mistakes. Singling out superstars or
scapegoats undermines team morale and performance.
4. Tell the teams WHAT to do but not HOW to do it.
Point a project team in the right direction by giving them a well-
defined project goal and clearly identify the project objectives
that they are responsible for.The objectives define the things that
they must do to be successful.The project goal and the objectives
that are delegated to a team define the game that you want that
team to play.The team itself must then go through the process of
creating their plan to achieve the objectives that you have laid out
for them.
General Patton said, “Tell people what you want but don’t tell
them how to do it—you will be surprised by their resourceful-
ness in accomplishing their tasks.” The teams can make changes
or additions to the objectives they are given as long as the project
leader agrees that the modified objectives are still necessary and
sufficient to accomplish the project goal.
5. Break project work into tasks that are each a week or less in duration
and produce something of value to the business every 30 to 90 days.
Encourage project teams to structure their project plans so that
individual tasks are a week or less in duration. Each task must have
a well-defined deliverable. Track these tasks as either started,
delayed, or finished. Do not fall into the trap of tracking tasks by
their percentage of completion as it is unclear what “percent
complete” really means.What matters is whether the task deliv-
erable has been produced and if not, when it will be produced.
The project leader must be able to track progress at the task level
of detail in order to understand what is really going on and to
210
E S S E N T I A L S o f S u p p l y C h a i n M a n a g e m e n t
TEAMFLY
Team-Fly®
TEAMFLY
Team-Fly®

211
D e v e l o p i n g S u p p l y C h a i n S y s t e m s
keep accurate projections of the time to complete and the cost
to complete for each of the project’s objectives.
Multi-week tasks make progress hard to measure and they are the
ones that will cause cost overruns and confusion.Multi-week tasks
being reported by the percent complete method usually seem to
be making good progress and then in the last week they suddenly
turn out to be nowhere near completion and need several more
weeks to complete. To avoid this problem, break big tasks into a
set of sub-tasks that take a week or less to complete.
These tasks should combine to produce something that is of value
to the business every 30 to 90 days. This provides the opportunity
for the business to verify that the project is on the right track. It
also provides deliverables that the business can start to use even
before the entire project is complete and begin recouping the
cost of the project.
6. Every project needs project office staff to work with the project leader
and team leaders to update plans and budgets.
The project plan and budget are analogous to the profit and loss
statements for a business. They must be updated continuously
and accurately in order to provide the people running the project
with the information they need to make good decisions. There is
a common but misguided notion that the project leader and
team leaders should be the ones who keep the plans updated.
This is analogous to the idea that the president of a company and
its managers should spend their time keeping the company’s
books. The project leader and the team leaders are responsible
for creating the initial plan and budget, but after that, they must
devote their full energies to making the plan a reality.

212
E S S E N T I A L S o f S u p p l y C h a i n M a n a g e m e n t
Just as there is an accounting department to keep the company’s
books, there needs to be a project office group that keeps the
project’s plans and budgets. The project office staff reports to the
project leader and they work with the team leaders on a weekly
basis to review and update the plans and budgets associated with
each team’s objectives. In this way the project leader can accu-
rately monitor project progress and the team leaders are able to
focus on running their teams and not filling out reports.
Organizing and Running Projects
Principles for Running Projects
Every project needs a full-time leader with overall responsibilityand authority.
Define a set of measurable and nonoverlapping objectives thatare necessary and sufficient to accomplish the project goal ormission.
Assign project objectives to teams of two to seven people withhands-on team leaders and the appropriate mix of businessand technical skills.
Tell the teams WHAT to do but not HOW to do it.
Break project work into tasks that are each a week or less induration and produce something of value to the businessevery 30 to 90 days.
Provide project office staff to work with the project leader andteam leaders to update plans and budgets.
T IPS & TECHNIQUES

Designing Supply Chain Systems
The purpose of the design step is to flesh out the conceptual system
design and create the detailed system specifications.This step also creates
the detailed project plan and budget needed to build the system. This is
where the people who will work on the project get to take a look at
what senior management wants and figure out how they will do it.This
is where adjustments and refinements are made to the project objectives
as the people who have to build the system consider the realities of the
job before them.
By the end of the design step it is usually possible to predict the
success or failure of the project. If the people on the project finish this
phase with a clear set of system design specifications and confidence in
their ability to build a system to these specifications, then the project
will succeed. If the opposite occurs, if the design specifications are vague,
incomplete, or hard to understand and if people are ambivalent or uneasy
about their chances for success, then the project will fail.
The phase begins with the project leader reviewing the project goal,
the conceptual system design, and the objectives with the project work
group. The work group is composed of business and technical people
who have the necessary mix of business and technical skills and expe-
rience needed to do the detailed system design. It is important for the
people to understand senior management’s intentions and the project’s
goal. Specific issues relating to the project objectives and budget can be
investigated during this phase. If necessary, adjustments can be made in
light of the findings that come out of this phase.
Once the people on the project work group understand the goal
and the objectives, they participate with the project leader to lay out a
detailed plan for the work in this phase. There are two main things that
need to be done in the design phase:
213
D e v e l o p i n g S u p p l y C h a i n S y s t e m s

1. Create detailed process flow diagrams for the new system;
2. Build and test the system prototype (i.e., the user interface andthe technical architecture).
Use the technique called “time boxing” to lay out a work schedule and
get things done according to that schedule. Divvy up the time allotted
to the total design step among the two major design activities. Break
each activity into a set of tasks. Then give each task the time needed to
do a competent job. Avoid the temptation to spend extra time doing
excessive amounts of analysis and checking and re-checking the results
that come out of each activity.
The design step should take somewhere from one to three months
to complete. For the most part, work on each of these two activities can
proceed simultaneously or “in parallel.” In some cases the work can be
done in less than one month. In no case is it wise to let the work take
longer than three months. If the design work takes longer than three
months, that indicates a lack of clear focus or a lack of effective organ-
ization (or both) on the project.
Supply Chain Process Mapping
The project team should review the system performance criteria as
described in the define phase. The criteria will be some mix of per-
formance targets from the four categories:
1. Customer Service
2. Internal Efficiency
3. Demand Flexibility
4. Product Development
Before starting to sketch out the detailed process flows of the new sys-
tem, the project leader needs to lead people on the project teams in brain-
storming exercises on ways to meet these criteria. The project leader
214
E S S E N T I A L S o f S u p p l y C h a i n M a n a g e m e n t

needs to encourage a free flow of ideas and help the project group to
avoid falling into the trap of premature criticism and dwelling on why
things cannot be done. Focus instead on how things might be done.
Generate as many ideas as possible for how to meet these performance
criteria. These ideas are the raw material to be worked with and blended
together to create the designs for the new system process flows.
System Prototyping to Design New Systems
Once new process flows have been designed, system prototyping is a
technique to use to design a new system that will effectively support
these new processes. The process decomposition diagrams provide the
processing logic and sequences to be used and indicate the kinds and
volumes of data that the new system needs to handle.
There are two kinds of system prototypes: user interface prototypes
and technical architecture prototypes.An analogy is to think of designing
a building. If you were designing a building you would create two kinds
of designs.The first is the floor plan and façade of the building to show
what the building will look like. The second kind is the design of the
structural, electrical, and plumbing components needed to support the
specified floor plan and façade.This design shows how the building will
be built.
When designing systems, the user interface can be thought of as the
floor plan and façade because it shows what the system will look like
and how a person would move through the system. The equivalent of
the structural engineering for a building is the technical architecture of
a system—the hardware, operating system, and database software that
will be used to support the user interface.
Both the user interface and the technical architecture designs are
created in parallel. It is an iterative process that makes trade-offs
between the user interface, the system functionality, and the underlying
215
D e v e l o p i n g S u p p l y C h a i n S y s t e m s
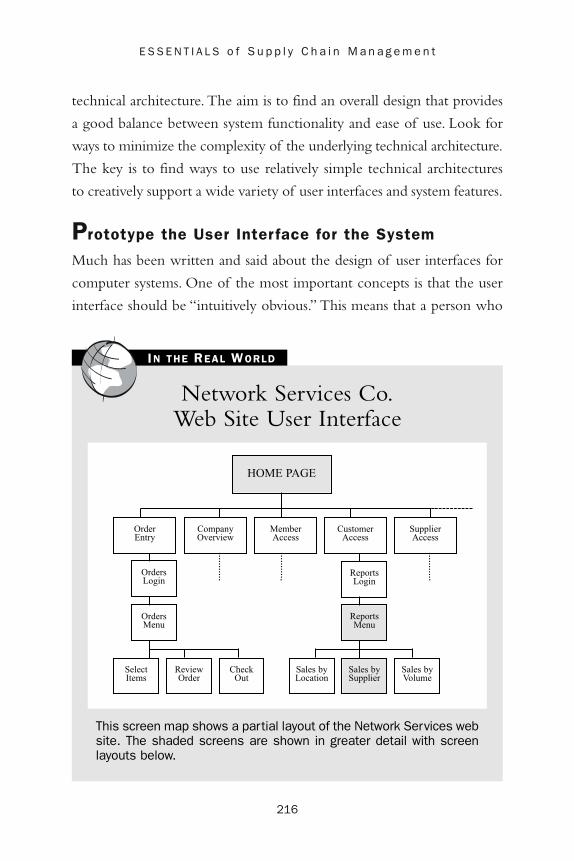
216
E S S E N T I A L S o f S u p p l y C h a i n M a n a g e m e n t
technical architecture. The aim is to find an overall design that provides
a good balance between system functionality and ease of use. Look for
ways to minimize the complexity of the underlying technical architecture.
The key is to find ways to use relatively simple technical architectures
to creatively support a wide variety of user interfaces and system features.
Prototype the User Inter face for the System
Much has been written and said about the design of user interfaces for
computer systems. One of the most important concepts is that the user
interface should be “intuitively obvious.” This means that a person who
Network Services Co.Web Site User Interface
This screen map shows a partial layout of the Network Services website. The shaded screens are shown in greater detail with screenlayouts below.
IN THE REAL WORLD
HOME PAGE
Order Entry
CompanyOverview
Member Access
CustomerAccess
SupplierAccess
Sales bySupplier
Sales byVolume
Sales byLocation
Check Out
ReviewOrder
SelectItems
OrdersMenu
OrdersLogin
ReportsMenu
ReportsLogin

217
D e v e l o p i n g S u p p l y C h a i n S y s t e m s
IN THE REAL WORLD (CONTINUED)
Network Services Home Page
This is the home page for the Network Services site (www.nscon-line.com). Different user options are selected by clicking on the but-tons shown along the left-hand side of the screen.
Reports Menu
Customers can select the report they want and set report parame-ters such as location, supplier, and time period.

already knows how to do the activity that the computer system is
designed to support should find that they can figure out the basics of
using the new computer system in about 20 minutes of playing around
with the system and trying things. The better a system interface design,
the less the amount of training that is needed to teach a person to use it.
Create a prototype of the user interface based on the work done to
define the process flows. The process decomposition diagrams will tell
you what activities are performed in what sequence and what data are
needed to support these activities. Design sequences of computer
screens that map closely to the process flows and that allow the user to
manipulate the data involved in these processes.
218
E S S E N T I A L S o f S u p p l y C h a i n M a n a g e m e n t
IN THE REAL WORLD (CONTINUED)
Data Display Screen
The resulting report can be displayed either on screen or down-loaded to a spreadsheet on the customer’s PC.

Prototype the Technical Architecture for the System
As the system user interface design is progressing, a parallel design effort
is underway to select and test the technical components that will be
used to build the system. Decisions should be made on the computer
hardware and software to be used.The database and other packages must
be specified and a programming language chosen if there is custom
coding to be done.All of these components must be assembled in a test
environment and tried out to see if they work as advertised. Connect
the pieces and make sure they actually do work the way the vendors said
they would.
Until a given technical component has been in use for at least two
years, it is not wise to take any published performance statistics at face
value. There will not be a wide enough base of experience with the
component to provide a well-balanced assessment and it will be unclear
just how the performance statistics were derived.Therefore the technical
people on a design team must do their own verification that all the
components will work together. This means that various performance
tests are devised and run to generate benchmarking data. The technical
design team needs to make changes in the component selection or even
the technical architecture design if certain components prove to be
incapable of performing as desired.
The database package must be installed on the hardware and oper-
ating system platform on which it is intended to run. Any packaged
application software that will be used must be installed. Then test data
needs to be loaded into the database and performance trials conducted
to test the operation of the whole architecture. Simple code should be
written to pass data from one component to the next to test out the
data interfaces and the speed of LAN, WAN, and Internet connections.
By the end of the prototyping activities, the technical architecture must
be shown to perform up to the requirements of the new system that it
219
D e v e l o p i n g S u p p l y C h a i n S y s t e m s

will support. If a prototype cannot be created that performs well, then
there is no sense in trying to build a production version of the system
using this same technical architecture.
The System Design Process
The first part of the design phase should be spent in sessions where the
business and technical people explore different process designs. Here is
where people should “think outside of the box” and generate as many
ideas as possible.The team then selects the most useful ideas and fits them
together to form a coherent and detailed map of how work will be organ-
ized and how things will be done in the new business process flow.
Once the process flows have been sketched out, then the design ses-
sions can begin to focus on how technology will be used to support this
process.The design team starts to define how people in the process will
interact with the technology supporting the process. Look for ways to
automate the rote and repetitive work and look for ways to empower
the problem solving and decision making tasks. People usually don’t like
to do the rote and repetitive work because it is boring but they do like
doing problem solving and decision making work because it is creative
and involves interaction with others.
Often the mistake is made of trying to have computers do the
problem solving and decision-making work. Remember that people are
the spark that animates a business process, not computers. Design sys-
tems that will be a rewarding experience for people. Design systems
where people are in control and not computers. Empower people with
access to information so that they can solve problems faster and make
better decisions. Have computers do the rote and repetitive work.That’s
what computers do well.
If the decision is made to use a packaged software application, then
that package should be brought in and installed in a test environment.
220
E S S E N T I A L S o f S u p p l y C h a i n M a n a g e m e n t
TEAMFLY
Team-Fly®
TEAMFLY
Team-Fly®

Realistic usage scenarios need to be scripted out.The databases used by
the package need to be loaded with a sampling of real data. People who
will both use and support the package then need to evaluate it by
working through the usage scenarios.
Create the Detailed Project Plan
Toward the end of the design phase, as the detailed design specifications
are produced, everyone involved will have a clear idea of the work they
need to do and how long this will take in the build phase. The project
leader is now able to oversee the creation of a detailed project plan and
budget for building the system. Project teams are assigned responsibility
for specific objectives and the people on these teams can then lay out
the sequence of tasks they will perform to achieve each objective
assigned to them.Working with project office staff, each team lays out
the plan for their work. Each task has time and resource requirements
assigned to it so a cost for each task can be calculated.
Respect the six principles for running projects. The project leader
should let each team define how they will do their work and how long
it will take. The project leader should challenge the teams to set ambi-
tious but achievable time frames. Teams should also be encouraged to
break their work into discrete tasks that take one week or less because
the week is the standard unit of time in business and teams must strive
to accomplish something of measurable value each week. If a certain
task takes longer than a week then it is probably composed of sub-tasks.
Apply the technique of process decomposition to identify these sub-
tasks. A project plan that clearly lays out for every person what they are
expected to accomplish every week is a valuable tool for coordinating
and monitoring the work of building the system. A plan at this level of
detail is also the best way to arrive at an accurate and realistic project
budget for the build phase.
221
D e v e l o p i n g S u p p l y C h a i n S y s t e m s

As the project teams are each creating their specific task plans to
achieve the objectives assigned to them, the project leader is combining
these plans into the overall project plan. In a process that is somewhat
analogous to the manner in which a general plans a campaign, the project
leader plans the sequence of activities that will lead to the successful
construction and roll out of the system that the design phase has specified.
Segment the project plan by objective. Devote one section of the
project plan to each objective. The project leader determines the nec-
essary sequence for achieving the project objectives and arranges the
project plan to reflect this. The project teams assigned to each objective
have already created detailed plans for their work. Insert the project teams’
plans into the section of the project plan related to their objectives.
Look for opportunities to run activities in parallel. The more work
that can be done simultaneously, the more flexible the project will be.
When activities are run in sequence, a delay in one activity causes a rip-
ple effect that delays all the other activities queued up behind it.When
activities are run in parallel, a delay in one does not delay the others.
Activities need to create deliverables that come together and combine
at the end to achieve the objective.
The key point here is that running in parallel allows you to finish
one activity and then shift resources over to help out on another activity
that is delayed. Delays are inevitable on a project. A plan that does not
account for delays and provide the flexibility needed to effectively
respond to them is a plan whose timetable and budget will quickly be
thrown into disarray and confusion, which bring with them the prob-
ability of failure.
Create the Detailed Project Budget
Project plans and budgets are just two sides of the same coin. Plans
show the time, people, and material needed to get things done and
222
E S S E N T I A L S o f S u p p l y C h a i n M a n a g e m e n t

budgets show the cost of the people and material over the time frames
shown in the plans. Once the project plan is in place, a detailed project
budget can be derived.
Estimate the labor cost for each task shown on the plan.Add in cost
of equipment such computers, software, and so on. Then add in other
costs as needed for items such as travel, lodging, and entertainment.
These costs all directly relate to the task sequence shown on the project
plan. If the project tasks are adjusted, then the budget should also be
adjusted. The total of these costs is the cost of the project.
The Decision to Proceed . . . or Not to Proceed
At the end of the design phase, the detailed system design and detailed
project plan and budget are presented to the senior management steering
committee or the executive sponsor of the project. If there are doubts
about the viability of the project or if the revised budget has gotten too
big, now is the time to reduce the scope of the project or cancel it alto-
gether. At this point only 20 percent to 40 percent of the total project
cost will have been incurred. The business has yet to commit the major
effort on the project.
A sober assessment of the system design and its prospects for success
is the order of the day.Once the project moves into the build phase, it will
be very hard to make significant design changes without negative impact
on the budget, the completion date, and the organization of the project.
Once into the build phase, all effort must be focused on building the system
as specified and responding to the day-to-day issues that arise in doing so.
There cannot be continuing questions and changes in the basic design of
the system without throwing the whole project into confusion.
It is all too common for companies to run the design phase as a poor-
ly defined research project. Much time is spent in detailed analysis of
what already exists but only sketchy design work is done on the specifics
223
D e v e l o p i n g S u p p l y C h a i n S y s t e m s

of what the new system will be. Debates break out on many aspects of
the design of the new system but no clear answers are agreed upon.
Crucial design questions are deferred to the build phase. Senior managers
who conceived of the project in the define phase may still be enthusias-
tic about the project but the people who will actually have to build the
system are starting to have doubts and disillusionment is setting in.
The design phase is the opportunity for a company to reduce the
risk on a project before committing large amounts of time and money
to it.The more detailed the design specifications, the better the chances
for building the system on time and on budget.The broader the under-
standing of and support for the system among both business and tech-
nical people, the greater the likelihood that the system will be used
effectively and produce the desired results.
At the end of the design phase the executive sponsor and the project
leader must pause and take stock of the project. Is there an air of under-
standing and confidence among the people on the project? Are we
good to go? Is the project ready for lift-off? The answers will be evident
for those who want to hear them.
If the design phase has not produced clear design specifications, if
the strategic design guidelines have been ignored, if people on the project
team are not confident of their abilities, then there will be no success.
The project leader can only fail in these situations no matter how heroic
the use of leadership skills. There is a 75 percent failure rate on IT sys-
tem development projects and this is not because we are incapable as
people. It is because we make fundamental mistakes in our system
designs and our plans for building them.
The Build Phase
This is the “Go For It!!!” phase. Stick to your aim and resist temptations
to change direction. Keep your focus and build the momentum you
224
E S S E N T I A L S o f S u p p l y C h a i n M a n a g e m e n t

need to achieve the project objectives within the time boxes called for
in the project plan. Activity must be tightly focused on the completion
of specific sequences of tasks. This is the step where good design and
planning pay off handsomely.
In this phase the project effort really ramps up.The full complement
of people is brought on to fill out the project teams. Because of this,
the weekly cost or “burn rate” on the project also rises significantly in
the build phase. So, unlike the previous two phases, the cost of false starts
and wrong turns now adds up very quickly.
The Project Office
Once the initial project plan is in place and the project enters the build
phase, the project leader and the team leaders will be fully engaged in
leading the project. Neither the project leader nor the team leaders will
have time to do this work on their own if they are doing a good job of
leading the project. However, if the project office work is not done, the
project plan and budget will quickly become out of date and will cease
to be the powerful coordinating and decision-making tools that they
would otherwise be. The project leader and the team leaders will then
be reduced to running the project “by the seat of their pants” and that
leads to trouble.
Maintaining project plans and budgets is a full-time job and needs to
be recognized as such in order to be successful.The project leader is anal-
ogous to the president of a company and the project office is like the
accounting department. The president does not have time to keep the
company’s books.There are far too many other things the president needs
to do to lead the company. The accounting people keep the company
books up to date so the president knows where the company stands.
Since the real world never happens exactly according to plan, the
project plan must be constantly updated and adjusted to reflect reality.
225
D e v e l o p i n g S u p p l y C h a i n S y s t e m s

The plan is the map of where the project is going and the progress
made to date. If this map does not accurately reflect reality then the
people on the project will lose track of where they are.
There is a pervasive tendency for people to hide bad news such as
delays and cost overruns. Unless the project leader takes active steps to
counter this tendency, the project will run into trouble.People need to see
that they will not be penalized for reporting bad news. On the contrary,
they must be shown that by reporting delays and potential cost overruns
as soon as they perceive them, they can improve their chances of success.
Early reporting gives everyone more time to respond effectively.
People need to understand that the project office staff are there to help
them keep track of what is really going on and make timely decisions.
Indeed, one of the best ways to get into trouble is to hide bad news
because when the truth finally does come out, there is usually very little
if any time to respond effectively to the situation.
System Test and Roll Out
The first step in rolling a system from development into production is to
do a system test with all the system components in place. If competent
load and volume testing was done on the system prototype during the
design phase, then there will be no surprises about whether or not the
system technically works and can handle the work load expected of it.
The purpose of system testing will be to work through a series of test
scripts that subject the system to the kind of uses it is designed for and
exercise various features and logic of the system. Some embarrassing
logic mistakes may well emerge during system test. This is OK. That is
what system test is for—to flush out and fix these kinds of errors before
the system goes into beta test.
The next step is the beta test of the system with a pilot group of
business users. This pilot group of users should have been involved in
226
E S S E N T I A L S o f S u p p l y C h a i n M a n a g e m e n t

some way in the design phase of the project. In this way they will
already have an understanding and acceptance of the need for and ben-
efits of the new system. Nonetheless, many minor adjustments will
need to be made to the system architecture and to the user interface
during the beta test. The people who operate the system architecture
will need to tweak different operating parameters to get the best
response time and stability from the system. The people who designed
the user interface will need to sit with the pilot group of business users
and listen to their ideas for improvements.
The business user who works with a system day in and day out will
have a different perspective on the system’s features than the people who
designed and built the system. Minor inconveniences in the system’s
operation can become major irritants to the people who have to use
the system day after day. These minor inconveniences should be fixed.
As business people in the pilot group test the system and make sug-
gestions for adjustments, the rough edges are smoothed off. In this process,
advocates for the system will emerge from among the pilot group.They
will feel a personal connection to the success of the system because the
system will take on a look and feel that is influenced by their suggestions.
These are the people who will sell the benefits of the system to the rest
of the company and who will often be the ones who train their co-
workers in the use of the system.
When the system first goes into production the roll out for a big
system (one that affects more than one area of the business or many
people in a single area) may last a while, from six months to a year.
There is not a lot of new development going on during this time, but
there is a steady stream of minor enhancements and bug fixes.The proj-
ect team can be slimmed down but the project leader needs to stay
involved during this time to facilitate the roll out and respond quickly
if some unexpected obstacle arises.
227
D e v e l o p i n g S u p p l y C h a i n S y s t e m s

228
E S S E N T I A L S o f S u p p l y C h a i n M a n a g e m e n t
In the fall of 1999 Network Services Company
reviewed and updated its strategic plan. The plan called for
the company to build the first version of its “web-enabled
supply chain” in 2000. These systems have been enhanced
and new features added since then as market needs have
evolved.
Through its strategic planning process, Network saw that the biggestbenefit to be gained was from using Internet technology to elec-tronically connect all of the different computer systems of its membercompanies. This would allow passing files such as purchase orders,invoices, and product masters quickly and accurately between cus-tomers, members, and manufacturers. With a system such as this,Network would be able to plug into whatever electronic trading net-works were evolving in the markets it served. The system to connectNetwork with its members, customers, and manufacturers was named“NetLink-NSC™.”
The second opportunity the company saw and acted on was tomake sales history data available via its web site. Since Network isthe hub of the NetLink-NSC™ system, a by-product is that Networkgathers a lot of valuable information that can be used by customers,members, and manufacturers. The company decided to build a datawarehouse that could be accessed through report generationscreens on its web site.
Many of Network’s customers already had or were building their ownorder entry systems and they wanted to send the company pur-chase orders directly from their systems using either EDI or theInternet. NetLink-NSC™ would allow Network to do that. For thosecustomers that wanted to enter orders over the web, Network decidedto lease the use of a web-based order entry package from a supplychain service provider named Tibersoft.
IN THE REAL WORLD

229
D e v e l o p i n g S u p p l y C h a i n S y s t e m s
IN THE REAL WORLD (CONTINUED)
As Network’s CIO, I was given the responsibility for building this e-business systems infrastructure. It was very important to develop theinfrastructure quickly and cost effectively so I used the time-boxingguidelines suggested in the define-design-build process. A team ofbusiness and technical people was assembled and they identified thecompany’s most pressing business issues and ideas for how tech-nology could help. These ideas were translated into a conceptualsystem design (see Exhibit 6.3 in Chapter 6). Within six weeks, thedefine phase was complete. The conceptual design and the proposedbudget to develop this infrastructure were presented to the board ofdirectors. They gave their approval to proceed with development.
Even before the define phase was finished, work began on a designand build sequence to produce a beta test version of the data ware-house that stored sales history data. This was completed quicklyand provided the business with a valuable tool as well as proof thatthe technical architecture was viable. It also gave everyone a clearindication that the system development effort was off to a goodstart and would live up to expectations.
A select group of consultants was brought in to work with companyIT staff. Four project teams were created—one team to design andbuild each of the four components of the e-business infrastructure.Two of the project team leaders were from the Network IT staff andtwo were consultants. There was also a two-person project officeteam headed by one of Network’s IT managers.
The hardware and software components chosen for the systemsarchitecture were assembled and tested out by the teams thatwould use them. Data was passed between the components tomake sure they could work together. Response times were testedunder different data volumes to verify that the system could handlethe expected amounts of data. When testing was finished, we hada solid design and there wasn’t any talk of, “we’ll figure this outafter we get into the build phase. . . ”

230
E S S E N T I A L S o f S u p p l y C h a i n M a n a g e m e n t
IN THE REAL WORLD (CONTINUED)
As each team finished the design phase of their work, they were wellpositioned to launch into their build phase. Each team had a clearset of design specifications and they had been able to test and verifythat the hardware and software they were going to use would meettheir expectations. Because of this it was possible for each teamleader to work with the project office manager to create very accu-rate project plans and budgets for their work in the build phase.
The first versions of all the system components were finished withinnine months and demonstrated to member companies and suppliersat the Network annual trade show. The systems were well receivedby Network members and some members asked if they could usethese systems to support their own local business as well as tohandle national account customers. So a set of enhancements toNetLink-NSC™ and the data warehouse were quickly designed andbuilt to let members use them for their local customers. In the lastthree months of 2000 the project team worked with Network mem-bers to roll out version 1.0 of these systems.
At the end of 2000 Network assessed its business situation and themarket conditions. It defined a set of major enhancements to addto the systems it had just rolled out. These enhancements wereagain designed and built within nine months and demonstrated inthe fall at the annual trade show. Exhibit 7.1 shows the time boxingsequence that was used on the project.
Every Friday afternoon the team leaders and I met to discuss theproject. We spent several hours and reviewed the progress and theissues that each team was encountering. The project office provid-ed accurate and updated plans and budgets for these meetings. Wecould all see the most current estimate of time and cost to finisheach objective. We could see if work on an objective threatened topush beyond its time box or if it was likely to overrun its budget.
TEAMFLY
Team-Fly®
TEAMFLY
Team-Fly®

231
D e v e l o p i n g S u p p l y C h a i n S y s t e m s
IN THE REAL WORLD (CONTINUED)
Network Services E-Business SystemDevelopment Sequence
The development sequence was focused and tightly time-boxed. Work ran inparallel during the design and build phases requiring good planning andcoordination. Version 1.0 of e-business systems infrastructure was createdin nine months. Based on positive reception and feedback from version 1.0,enhancements for version 1.1 were created. Further assessment of busi-ness needs led to definition of next round of major enhancements that cre-ated version 2.0 of the e-business infrastructure.
EXHIBIT 7 .1

Chapter Summary
Design Step Deliverables
1. A detailed design for the business process flow of the system.Also,
agreement among the people who will have to work with the sys-
tem that it will meet the performance criteria expected of it.
2. A system prototype that specifies both the technical architecture
and the user interface.This technical architecture must be shown
to be capable of handling the data volumes and user demands
that are expected. There must be a complete set of screen lay-
outs, report formats, and specifications for all aspects of the user
interface.
3. There must be a detailed project plan and budget that accurately
reflects the time, cost, and resources needed to build the system.
Build Step Deliverables
1. A working system that matches the design specifications and
meets performance criteria. The building of the system should
be scheduled so that there is something of value delivered to the
232
E S S E N T I A L S o f S u p p l y C h a i n M a n a g e m e n t
IN THE REAL WORLD (CONTINUED)
In the build phase especially, the project teams were at their high-est staffing levels so the project “burn rate” was also at its highestlevel. Small delays and little misunderstandings or scope changescould quickly balloon into big problems and cost overruns. Havingregular weekly review sessions backed up by current and accurateproject plans showed me early on where problems were developing.This way I knew when and where I needed to get personally involvedto keep things moving.

business every 30 to 90 days.This means that certain pieces of the
system must be finished and put into use before the entire system
is completed.
2. A complete and updated set of technical design documents. The
design documentation is analogous to the wiring diagrams and
structural plans of a building.
3. A complete set of operating instructions.The people who operate
and maintain a system are different from the people who build
systems.The people who operate a system need to know how to
bring the system up, bring it down, do performance tuning, and
do troubleshooting and operating maintenance.
233
D e v e l o p i n g S u p p l y C h a i n S y s t e m s


235
After read ing th is chapter you wi l l be ab le to
• Appreciate the “always-on” connection and what it means
• Assess the profit potential inherent in the self-adjustingfeedback loop
• Explore how the power of the self-adjusting feedback loopcan be harnessed to drive your supply chain
• Discuss the concept of emergent systems
The pace of business change and innovation is both exciting and
relentless. Over the next decade innovative companies in different
market segments will learn to design and deploy their supply
chains to improve their competitive position in the markets they serve.
They will create supply chains that enable them to develop and deliver
products and provide levels of service at price points that their com-
petitors cannot match.
We all sense that something profound has happened in the last ten
years or so. The Internet is a part of it, but it is not only about the
Internet.We learned that in the “dot com” bubble of the late 1990s and
early 2000s. There is something more than just the Internet going on
here.
CHAPTER 8
The Promise of the Real-Time Supply Chain

The Start of Something Big
As a historical analogy, consider what happened some 200 years ago at
the beginning of an age that came to be known as the Industrial Age.
The people of the time sensed that a powerful potential had been
released by the invention and spread of the steam engine.
The steam engine for the first time provided a movable source of
power that could be generated on demand and efficiently harnessed to
perform a wide variety of tasks. The Industrial Age was not so much
about the steam engine as it was about the things that could be done
and were done with the power that the steam engine made available.
Once it was born, the Industrial Age went on to outgrow the steam
engine as it evolved more advanced engine technologies such as inter-
nal combustion, the jet, the electric motor, and atomic power.
The rise and spread of the Internet has created for the first time a
global, multi-directional communications network that is “always-on.”
The cost of connecting to this network is so cheap that there is no need
for companies to save money by staying off line and only connecting
periodically. The normal state for companies is transitioning from being
off line and unconnected to one of being on line and connected.
As more and more companies use the Internet and other commu-
nications networks to create always-on connections with each other,
they will find ways to share data that enable them to better coordinate
their interactions.They will also learn faster and adapt to changing con-
ditions faster.These capabilities will clearly result in efficiencies that can
be turned into business profits.
The always-on connection is a new light that sheds steady illumina-
tion on a landscape that had before been seen only in periodic snapshots.
We are experiencing something similar to seeing a sequence of still
photos turn into a moving picture. As more pictures are taken at shorter
intervals, you cease to see a sequence of still photos and instead come
236
E S S E N T I A L S o f S u p p l y C h a i n M a n a g e m e n t

to see a continuous, moving image. This continuous, moving image is
what we see as we move from the snapshot or batch-time world into
the real-time world.
Supply chain management is a process of coordination between
companies. Those companies that learn to coordinate in real-time will
become incrementally more and more efficient.They will become more
profitable and quicker to see new opportunities than their competitors
who are still working in a batch-time world of snapshot pictures.
The Profit Potential of the Self-Adjusting Feedback Loop
The self-adjusting feedback loop is a very useful phenomena.An example
is the cruise control in an automobile. The cruise control constantly
reads the vehicle’s actual speed and compares that to the speed it was set
for. It responds to bring the actual speed in line with the desired speed.
It causes the engine to either accelerate or decelerate. The cruise con-
trol’s goal is to achieve and maintain the desired speed. As the vehicle
travels down the highway it continuously monitors speed and operates
the engine to achieve its goal.
Other examples of a self-adjusting feedback loop at work are a ther-
mostat that controls the temperature in a room, or a guided missile that
zeros in on a heat source or a radar emission source. Self-adjusting feed-
back loops use negative feedback to continuously correct their behavior.
Negative feedback occurs when a system compares its current state with
its desired state (or goal) and takes corrective action to move it in a
direction that will minimize the difference between the two states. A
continuous stream of negative feedback guides a system through a
changing environment toward its goal.
Companies can learn to work together to achieve supply chain per-
formance targets that are profitable to all of them. They can learn to
237
T h e P r o m i s e o f t h e R e a l - T i m e S u p p l y C h a i n

constantly adjust their behavior day after day, hour by hour to respond
to events and continue to steer toward their performance targets. The
bullwhip effect can be controlled by the introduction of negative feed-
back to dampen down the wild demand swings that otherwise result.
The opportunity now exists to leverage the power of the self-
adjusting feedback loop across entire supply chains. Real-time data shar-
ing and close coordination between companies can be employed to
deliver operating efficiencies that result in significant profits over time.
The result of these continuous incremental adjustments to supply chain
operations is analogous to the growth of capital over time due to the
miracle of compound interest.
Harnessing the Feedback Loop to the Supply Chain
How can the power of the self-adjusting feedback loop be brought to
bear in a supply chain? The answer is beginning to appear.As companies
link up using always-on communication networks to conduct business
with each other, they begin to automatically collect useful data as a by-
product of their interactions: electronic purchase orders, order status,
order receipts, invoices, and payment status. It is no longer a huge admin-
istrative chore to regularly track performance in the areas of customer
service, internal efficiency, demand flexibility, and product development.
Customers are starting to use supply chain “report cards” to grade
the performance of their suppliers. The report cards are more accurate
and more frequently produced than was previously possible. The next
step is for companies to move beyond the use of these report cards as
merely convenient tools for beating up their suppliers. The opportuni-
ty exists for customers and suppliers to use this data to work together to
meet mutually beneficial performance targets. Companies can select
performance targets that will generate quantifiable benefits and profits
to reward them for the effort needed to achieve the targets.
238
E S S E N T I A L S o f S u p p l y C h a i n M a n a g e m e n t

239
T h e P r o m i s e o f t h e R e a l - T i m e S u p p l y C h a i n
Either one dominant company can set the performance targets or
groups of companies can negotiate among themselves to set targets.
The important thing is that all participating companies in a supply
chain believe the targets are achievable and that when they are achieved
there will be rewards as a result. The desire to receive these rewards is
what brings the self-adjusting feedback loop into being.
The feedback loop happens when peoples’ interactions with each
other are cast in the form of a game whose object is to achieve the per-
formance targets. If companies and people in a supply chain have real-
time access to the data they need then they will steer toward their targets.
If they are rewarded when they achieve their targets then they will
learn to hit these targets more often than not. The profit potential of
negative feedback and the self-adjusting supply chain is now unleashed.
Playing the Game of Supply Chain Management
Human beings are social creatures who love to play games.This is a good
thing because through playing games we constantly learn and improve
our skills and our performance. Companies such as Wal-Mart and Dell
and their supply chain partners have in many ways begun to create an
evolving game out of managing their supply chains. They have steadily
learned and developed supply chains that are better than those of their
competitors and that are clearly business advantages for them.
There are only a few things required to start a game. In his book,
The Great Game of Business, Jack Stack lays out the four conditions that
are needed (Stack, Jack, 1992, The Great Game of Business, New York,
NY: Currency/Doubleday). They are:
1. People must understand the rules of the game and how it is played.
They must know what is fair and what is not fair and how to
score points.

240
E S S E N T I A L S o f S u p p l y C h a i n M a n a g e m e n t
2. People must be able to pick the roles or positions they want to
play in the game. They also need to get the training and experi-
ence necessary to keep developing the skills they need to succeed
in their positions.
3. All players must know what the score is at all times. They need
to know if they are winning or losing and they need to see the
results of their actions.
4. All players must have a personal stake in the outcome of the
game. There must be some important reward, either monetary or
psychological, that provides a reason for each player to strive to
succeed.
Basically, the game of supply chain management is a relatively sim-
ple game, as is soccer or basketball.Which is not to say that any of these
games can be mastered without years of practice and play. The main
techniques and operations of supply chain management are well
enough understood to be taught to a wide range of people in different
supply chain positions (see Chapters 2 and 3). The Internet is the way
for everyone to know the score at all times and see the results of their
actions. Profits generated by operating efficiencies provide people with
rewards and the reason to strive to succeed.
In supply chain management, everyone can acquire and install tech-
nology so technology alone cannot constitute a significant competitive
advantage. The advantage lies in the way the game is played. Let’s go
back to the example of Alexander the Great (see Chapter 1). His army
did not have any technology that was not also possessed by his oppo-
nents. In fact Alexander deliberately used less technology. He simplified
his army’s operations and equipment in order to make it more mobile
and more efficient. His army could travel faster and lighter than those
of his adversaries.
TEAMFLY
Team-Fly®
TEAMFLY
Team-Fly®

Advantage goes to those players who learn to use simple technolo-
gy and simple tactics extremely well. Alexander’s soldiers were well
trained in how to use their technology and because of the simplicity of
their tactics, they could remember and use them effectively in the heat
of the moment when it really counted. After all is said and done, suc-
cess is often just a matter of consistent performance and making fewer
errors than your competition.
241
T h e P r o m i s e o f t h e R e a l - T i m e S u p p l y C h a i n
Emergent behavior is what happens when an
interconnected system of relatively simple elements
begins to self-organize to form a more intelligent and
more adaptive higher-level system. Steven Johnson in his
book, Emergence—The Connected Lives of Ants, Brains,
Cities, and Software, explores the conditions that bring
about this phenomenon.
In an interview with Steven Johnson I posed six questions and askedhim to share his insights on a number of topics. These topics rangefrom what gives a system emergent characteristics to how companiescould organize their supply chains so as to encourage and benefitfrom emergent behavior.
What is an “emergent system?” How is an emergent system
different from an assembly line?
“The catchphrase that I sometimes use is that an emergent systemis ‘smarter’ than the sum of its parts. They tend to be systemsmade up of many interacting agents, each of which is following rel-atively simple rules governing its encounters with other agents.Somehow, out of all these local interactions, a higher-level, global
EXECUTIVE INSIGHT

242
E S S E N T I A L S o f S u p p l y C h a i n M a n a g e m e n t
EXECUTIVE INSIGHT (CONTINUED)
intelligence ‘emerges.’ The extraordinary thing about these systemsis that there’s no master planner or executive branch—the overallgroup creates the intelligence and adaptability; it’s not somethingpassed down from the leadership. An ant colony is a great exampleof this: colonies manage to pull off extraordinary feats of resourcemanagement and engineering and task allocation, all by followingremarkably simple rules of interaction, using a simple chemical lan-guage to communicate. There’s a queen ant in the colony, but she’sonly called that because she’s the chief reproductive engine for thecolony. She doesn’t have any actual command authority. The ordi-nary ants just do the thinking collectively, without a leader.
“A key difference between an emergent system and an assemblyline lies in the fluidity of the emergent system: randomness is a keycomponent of the way an ant colony will explore a given environment—take the random element out, and the colony gets much lessinteresting, much less capable of stumbling across new ideas.Assembly lines are all about setting fixed patterns and eliminatingrandomness; emergence is all about stumbling across new patternsthat work better than the old ones.”
You say that such systems are “bottom-up systems, not top-
down.” These systems solve problems by drawing on masses
of simple elements instead of relying on a single, intelligent
“executive branch.” What does this mean for people who are
trying to design and build emergent systems?
“One of the central lessons, I think, is that emergent systems arealways slightly out of control. Their unpredictability is part of theircharm, and their power, but it can be threatening to engineers andplanners who have been trained to eliminate unpredictability atevery turn. Some of the systems that I’ve looked at combine emer-gent properties and evolutionary ones: the emergent system gen-erates lots of new configurations and ideas, and then there’s a kind

243
T h e P r o m i s e o f t h e R e a l - T i m e S u p p l y C h a i n
EXECUTIVE INSIGHT (CONTINUED)
of natural selection that weeds out the bad ideas and encouragesthe good ones. That’s largely what a designer of emergent systemsshould think about doing: it’s closer to growing a garden than it isto building a factory.”
What does it mean when you say that emergent systems dis-
play complex adaptive behavior?
“The complexity refers to the number of interacting parts, like thethousands of ants in a colony, or the pedestrians on a street in abusy city. Adaptive behavior is what happens when all those com-ponent parts create useful higher-level structures or patterns ofbehavior with their group interactions, when they create something,usually unwittingly, that benefits the members of the group. Whenan ant colony determines the shortest route to a new source of foodand quickly assembles a line of ants to transport the food back tothe nest; when thousands of urbanites create a neighborhood witha distinct personality that helps organize and give shape to an other-wise overwhelming city, these are examples of adaptive behavior.”
What is negative feedback as opposed to positive feedback?
What role does negative feedback play in the ability of a sys-
tem to exhibit adaptive behavior?
“Negative feedback is crucial, and it’s not at all negative in a value-judgment sense. Positive feedback is what we generally mean whenwe talk about feedback, as in the guitar effect that we first startedto hear as music in the 60s: music is played through a speaker,which is picked up by a microphone, which then broadcasts it outthough the speaker, creating a sound that the microphone picks up,and so on until you get a howling noise that sounds nothing like theoriginal music. So positive feedback is a kind of self-perpetuating,additive effect: plug output A into input B which is plugged into inputA. Negative feedback is what you use when you need to dampendown a chain like this, when there’s a danger of a kind of runaway

244
E S S E N T I A L S o f S u p p l y C h a i n M a n a g e m e n t
EXECUTIVE INSIGHT (CONTINUED)
effect, or when you’re trying to home in on a specific target. Thinkof a thermostat trying to reach a preset temperature: it samples theair, and if the air’s too cold, it turns the heat on, then samples itagain. Without negative feedback, the room would just keep gettinghotter, but the thermostat has been designed to turn the heat offwhen the air reaches the target temperature. Ants use a compara-ble technique to achieve the right balance of task allocation through-out the colony: an individual ant who happens to be on foraging dutywill sample the number of ants also on foraging duty that she stum-bles across over the course of an hour. If she encounters a certainnumber, she’ll switch over to another task (nest building, say) inorder to keep the colony from becoming overrun with foragers.”
In your book you mention a designer who has proposed building
a learning network of traffic lights that will find an optimal
solution to continually changing traffic conditions. You observe
that, “You can conquer gridlock by making the grid itself
smart.” What is it that would make the grid smart? Is this
grid an example of an emergent system?
“The idea proposed in the traffic model is not to take the tradition-al engineering, top-down approach and say: ‘Let’s look at the entirecity and figure out where all the problems are, and try to design theroads and the light system to eliminate the problems.’ The smartgrid approach is to give each light a local perspective with a little bitof information, and give it the goal of minimizing delays at its ownlittle corner. So the light would be able to register the number ofcars stacked up at the intersection, and it would be able to experi-ment with different rhythms of red and green, with some feedbackfrom its near neighbors. When it stumbles across a pattern thatreduces delays, it sticks to that pattern; if the delays start piling upagain, it starts experimenting again. The problem with this sort ofapproach is that on Day One it’s a terrible, terrible system, becauseit doesn’t yet know anything about traffic flows. (You’d have to teach

245
T h e P r o m i s e o f t h e R e a l - T i m e S u p p l y C h a i n
EXECUTIVE INSIGHT (CONTINUED)
it quite a bit before you could actually implement it.) But it wouldlearn very quickly, and most importantly, it would be capable ofresponding to changing conditions in a way that the traditionallyengineered approach would not. That’s a hallmark of adaptability.”
Consider a system composed of many different companies
whose goal is to provide a market with the highest levels of
responsiveness at the lowest cost to themselves. High levels
of responsiveness require that these companies work together
to design, make, and deliver the right products at the right
price at the right time in the right amounts. What are some of
the things that these companies could do to organize them-
selves into an emergent system?
“There’s a telltale term in supply chain systems, which may well beunavoidable—the term ‘chain’ itself. Almost all emergent systemsare networks or grids; they tend to be flatter and more horizontal,with interaction possible between all the various agents. The prob-lem that supply chains have with positive feedback revolves aroundthe distance between the consumer and those suppliers furtherdown the chain; because the information has to pass through somany intermediaries, you get distortion in the message. Most emer-gent systems that I’ve looked at have a great diversity of potentialroutes that information can follow; the more chain-like they become,they less adaptive they are. The other key here is experimentation:letting the system evolve new patterns of interaction on its own,since these can often be more useful and efficient than the pre-planned ones. Of course, you don’t want to waste a few economicquarters experimenting with different supply chains, most of whichare a disaster. But that’s where some of the wonderful new model-ing systems for complex behavior can be very handy: you can do theexperimenting on the computer, and then pick the best solutions toimplement in real life.”

Emergent Behavior in Supply Chains
In the workings of a system such as a free market we witness emergent
behavior. This behavior is what the great British economist Adam
Smith referred to as the “invisible hand” of the market. This invisible
hand emerges to set product prices so as to best allocate available sup-
plies to meet market demands. Local interactions between large num-
bers of agents, governed by simple rules of mutual feedback, produce a
macro effect for the system as a whole that results in what we call emer-
gent behavior.
As we begin to practice supply chain management as a game
between companies and people who are motivated to achieve certain
performance targets, we will see emergent behavior in supply chains.
Good players in the supply chains of particular markets will seek each
other out because by playing together they can create more efficient
supply chains and generate better profits.
Supply chains will form up like sports teams and these teams will
compete with each other for market share. Just as the game of basket-
ball or soccer evolves over time, so too will the game of supply chain
management. New tactics, techniques, and technology will come about.
Market demands and the desire for competitive advantage will drive
companies to collaborate and innovate with each other to win at the
game of supply chain management.
Computers are best used to automate the rote, repetitious activities
that humans find to be dull and boring. These are all the ongoing and
routine activities of recording and monitoring supply chain operations.
Computers do these tasks very well.They do not fall asleep, they do not
miss details, and they can handle enormous volumes of data without
complaint.
People are best used to do the creative and problem solving activities.
These are the activities that do not have clear right or wrong answers.
246
E S S E N T I A L S o f S u p p l y C h a i n M a n a g e m e n t

These are the activities that call for people to collaborate with other
people and share information and try out different approaches to see
which ones work best. People are good at these activities and they like
doing them so they learn and keep getting better.
At a macro level, this will give rise to supply chains that, in effect,
learn and grow smarter. Computers will listen to the hum and crackle
of data flowing through the real-time, always-on supply chain. They
will employ pattern recognition algorithms to spot exceptions and
events that need to be brought to the attention of human beings. Like
good pilots and navigators, people will learn to respond effectively to
these developments as they happen. People will learn to keep steering
the supply chain on a course toward its desired performance targets.
Adaptive Networks and Economic Cycles
As we learn to recognize and effectively respond to developments in
our supply chains it will tend to lengthen the periods of market growth
and stability. Any industry or market where there is a boom to bust
cycle is an opportunity for us to apply the self-adjusting feedback loop
to smooth out the economic ups and downs. The boom to bust cycle
is caused by the same dynamic that results in the bullwhip effect in indi-
vidual supply chains.
In industries ranging from electronics manufacturing to real estate
development to telecommunications, the boom to bust cycle causes eco-
nomic waste and disruption. It also brings with it all the related human
hardships that are caused by the cycle. The ability to recognize and
smooth out excessive swings in demand, prices, and productive capacity
in different areas of the economy will create greater stability.And through
this stability more wealth will be both generated and preserved. Think
of the wealth that was destroyed by the excessive investments that created
more dot com companies and more telecommunications capacity than
247
T h e P r o m i s e o f t h e R e a l - T i m e S u p p l y C h a i n

were needed. Think of the wealth that disappeared in the company
closures and job losses that happened when these companies and their
suppliers finally had to face the consequences of too much supply and
not enough demand.
Adaptive supply chain networks using real-time information and
negative feedback can effectively dampen excessive market swings. This
ability alone will have a wealth creation effect that is even more power-
ful than what was created by the effect of the steam engine.
Chapter Summary
The “always-on” connection of the Internet and other communications
networks allows us to see ourselves in real-time. We can now see the
supply chain as a continuous moving picture whereas in the past we
could only see it as a collection of snapshots taken at periodic intervals.
This always-on, moving picture makes it possible to constantly adjust
supply chain operations week to week and day to day to get significant
new efficiencies.
This self-adjusting feedback loop is harnessed to the supply chain
through the daily actions of the people who carry out supply chain oper-
ations. First motivate people by providing them with monetary or psy-
chological rewards for achieving predefined performance targets. Then
provide people with real-time information that shows them whether
they are moving toward or away from their targets.People will steer toward
their targets and they will learn to hit these targets more often than not.
The effect of this dynamic will be to give rise to supply chains that
are both highly responsive and very efficient. Real-time operating adjust-
ments will result in supply chains that can better adapt to business changes
and deliver performance and profitability that is of a higher level than
anything that has been seen before.
248
E S S E N T I A L S o f S u p p l y C h a i n M a n a g e m e n t

249
1. Books
Chopra, Sunil, and Peter Meindl, 2001, Supply ChainManagement: Strategy, Planning, and Operations, Upper SaddleRiver, NJ: Prentice-Hall, Inc.
Fredendall, Lawrence D., and Ed Hill, 2001, Basics of SupplyChain Management, Boca Raton, FL: St. Lucie Press.
Goldratt, Eliyahu M., 1984, The Goal, Great Barrington, MA:The North River Press Publishing Corporation.
Graham, Gordon, 1987, Distribution Inventory Management,Richardson, TX: Inventory Management Press.
Johnson, Steven, 2001, Emergence:The Connected Lives of Ants,Brains, Cities, and Software, New York, NY: Scribner.
Roman, Eugene R., 1996, Reengineering the Distributor, SouthHolland, IL: Systems Design, Inc.
Senge, Peter M., 1990, The Fifth Discipline:The Art and Practice ofthe Learning Organization, New York, NY: Doubleday/Currency.
Stack, Jack, 1992, The Great Game of Business, New York, NY:Currency/Doubleday.
2. Magazines & Journals
EBN, Manhasset, NY: CMP Media, Inc.
Journal of Business Logistics, Oak Brook, IL: Council of LogisticsManagement.
Supply Chain Technology News, Cleveland, OH: Penton Media, Inc.
3. Internet
Council of Logistics Management, www.clm1.org
Integrated Business Communications Alliance, www.ibcaweb.org
Stanford Global Supply Chain Forum,www.stanford.edu/group/scforum
Additional Resources

Supply-Chain Council Home Page, supply-chain.nidhog.com
Supply Chain Management Research Center,www.cio.com/research/scm
Uniform Code Council, www.uc-council.org
4. Professional Organizations
The Council of Logistics Management
2805 Butterfield Road, Suite 200, Oak Brook, IL 60523,Ph: (630) 574-0985
The Supply-Chain Council
1150 Freeport Rd., Pittsburgh, PA 15238,Ph: (412) 781-4101
This list of additional resources just barely scratches the surface. The readershould also use Internet search engines such as Google (www.google.com)and do a further search. Another useful search resource are online book sellerssuch as Amazon (www.amazon.com) and Barnes & Noble (www.bn.com).
250
A d d i t i o n a l R e s o u r c e s
TEAMFLY
Team-Fly®
TEAMFLY
Team-Fly®

7-Eleven, 31
Aactivity cycle time, 148,149adaptive behavior, 243adaptive networks, 247–248advanced planning and scheduling systems,
127–128Aero Exchange International, 135aggregate planning, 54–55Alexander the Great, 7–9, 240–241Alexy, James, 169–171always-on connection, 236–238, 248
Bbeer game, 104–105big box store format, 18–19Breed Technologies, 101broadband, 122–123build to order (BTO), 144–146, 149build to stock (BTS), 144–145, 149bullwhip effect, 104–106, 114–115,
118–119, 238, 247demand forecasting, 107order batching, 108performance incentives, 110product pricing, 109product rationing, 109
burn rate, 225Burton, Donald, 95–97business cycle, 103–104business strategy, 30
aligning the supply chain, 31–37business opportunities, 177strategy creation, 178–182See also core competenciesSee also conceptual system design
Ccash-to-cash cycle time, 147Chopra, Sunil, 2, 9, 32, 38–40, 50, 126,
249collaborative planning, forecasting, and
replenishment (CPFR), 115–117how to start, 118–119
competitive advantage, see business strategycomplex adaptive behavior, 243conceptual system design, 181, 183–191core competencies, 20–23, 33–40, 99–101cost benefit analysis (CBA), 199–205Covisint, 135credit and collections, 70–73crossdocking, 11–12, 94customer relationship management
(CRM), 129customer service, 65–66,80, 130–131, 141,
180customer service metrics, 144–146, 149
cycle inventory, 12, 59, 63
Ddata sharing, 164–171data warehouse, 158–163days sales outstanding (DSO), 71DC. See distribution centerdebt to net worth, 152delivery scheduling, 91, 95–97
delivery sources, 93direct deliveries, 91generalized assignment, 92–93milk run deliveries, 92savings matrix technique, 92–93
Dell Computers, 38–40, 117, 239demand flexibility, 142, 148–150, 163, 178demand forecasting, 48–50
forecasting methods, 50–53forecasting variables, 49–50
251
Index

demand planning systems, 128Dethlefsen,Walter, 175–176digital subscriber line (DSL), 122distribution center (DC), 19, 38, 93–94distributors, 24, 27, 105–106
EEastern Bag & Paper, 95–97e-business, 133–136economic lot size (ELS), 81–82economic order quantity (EOQ), 60–62electronic data interchange (EDI), 19,
123–124Ellram, Lisa M., 2emergent behavior, 241–247Engels, Donald W., 7enterprise resource planning (ERP),
126–127everyday low prices, 19–20extensible markup language (XML),
123–124
Ffacility management, 83–84, 85–87feedback loop, 237–239, 243–244, 248Ford Motor Company, 20, 22, 100Ford, Henry, 22ForestExpress, 135functional focus, 11
GGaneshan, Ram, 3Goldratt, Eliyahu M., 9, 111, 249Green, Leonard, 65–66
HHarrison, Terry P., 3Hewlett Packard, 99Hill, Edward, 111, 249Honda Motor Co., Inc., 100Hopp,Wallace, 99–101
Iindirect items, 67information. See performance drivers
information systems, 121assessing needs, 130–131data capture and communication,
121–124data manipulation and reporting,
126–130data storage and retrieval, 124–126
Integrated Business CommunicationsAlliance (ICBA), 120
interest coverage, 152internal efficiency, 141, 143, 154, 156,
163–164, 238efficiency metrics, 146–147
Internet, 122, 123, 190–191, 235–237, 249inventory. See performance driversinventory management, 58–64inventory management systems, 129–130inventory turns, 146–147inventory value, 146
Jjob lot storage, 11Johnson, Steven, 241–245just-in-time inventory (JIT), 168, 170
KKeebler, James S., 3
LLambert, Douglas M., 2late orders, 144learning network, 244Lee, Hau, 134, 166–167line item fill rate, 144local area network (LAN), 122, 219location. See performance driverslogistics, 2, 4, 7, 26–27, 47, 249, 250
Mmaintenance, repair, and operating sup-
plies (MRO), 67manufacturing execution systems (MES),
130market migration, 163–164, 165markets, model of, 137–140Martin, Christopher, 131–133
252
I n d e x

Massachusetts Institute of Technology, 104Meindl, Peter, 2, 9, 32, 50, 126, 249Mitchum, Robert, 151–152, 200
Nnegative feedback, 243–244NetLink-NSC™, 190–191Network Services Co.
conceptual system design, 191data sharing concerns, 169–170performance measurement, 151–152power in supply chains, 175–176system development, 228–231
Nix, Nancy W., 3Northwestern University, 38, 99
Oon-time delivery rate, 144order fill rate, 144order management, 84, 88–90outside flexibility, 148–150outsourcing, 20, 97–101
PPace, Charlie, 28–30Paper Enterprises, 46–48Penn State University, 3performance categories, 141–142performance drivers, 10, 17, 34–36
information, 6, 15–18, 36, 121, 124, 126inventory, 5, 12–13, 58–59location, 5, 13–14production, 5, 10–12, 45, 80–84transportation, 6, 14–15, 91–94
performance measurement, 142–144collection of data, 155–156dashboard displays, 159–163key indicators, 161–162
performance targets, 178–180, 183, 207,238–239, 248
Perkins, 85–87Perkins, Gary, 85Perkins, Larry, 85–87process mapping, 214, 215Proctor & Gamble, 117
procurement, 64consumption management, 67contract management, 69–70contract negotiation, 68–69purchasing, 64, 67vendor selection, 68
procurement systems, 127producers, 24product design, 77–80product development, 142, 143, 150product focus, 10product pricing, 56production. See performance driversproduction scheduling, 80–83project budget, 197–199, 222–223project evaluation, 223–224project leader, 208, 211–212, 229–232project objectives, 194–197, 209–210,
221–222project office, 211–212, 225–226, 230project organization, principles, 208–212project plan, 194–197, 198, 222–223project team, 209–210, 212, 225, 229–230purchase order, 84, 88–90
Qquantity of product, 32quoted customer response time, 144
Rrate of innovation, 33response time, 32, 148retailers, 25, 105, 106return on investment (ROI), 197, 199–205return on sales, 146, 147, 152return on shareholder equity, 152return rate, 144Reuben, Meredith, 95–97Robbins, Clifford, 73–75RosettaNet, 124
Ssafety inventory, 58, 62–64sales force automation (SFA), 129SCOR model, 44–46, 157
253
I n d e x

level 2 performance metrics, 153, 156level 3 diagnostic metrics, 153, 156
seasonal inventory, 13, 62Sedler, Herbert, 46–48Sedler, Jordan, 46–48Senge, Peter, 105service level, 33,74, 80, 82, 96–97, 168Service Paper Company, 65–66service providers, 26–27SiteStuff, 28–30SQL. See structured query languageStack, Jack, 239Stanford University, 134, 144, 166Stock, James R., 2stock keeping unit (SKU) storage, 11structured query language (SQL), 125Stuart, Michael, 28supply chain capabilities, 31–32supply chain management systems (SCM),
129–131supply chain management, definition of,
2–3supply chain management, the game of,
239–241Supply-Chain Council, 44, 153, 250Sweetheart Cups, 169system development sequence, 195, 198system prototype, 215
user interface prototype, 216–218technical architecture prototype,
219–220system test and roll out, 226–227
Ttechnical architecture. See system proto-
typeTheory of Constraints, 111
focusing steps, 112–113Tibersoft, 131–133, 190, 195–196, 198time boxing, 195–196, 198transportation. See performance driverstransportation modes, 14–15transportation planning systems, 128transportation scheduling systems, 130
UUniform Code Council, Inc., 120universal product code (UPC), 120upside flexibility, 148user interface. See system prototype
Vvalue added network (VAN), 123value of total backorders, 144vendor managed inventory (VMI), 167vertical integration, 20–23virtual integration, 21, 23virtual private network (VPN), 122Voluntary Interindustry Commerce
Standards (VICS), 115
WW.W. Grainger, 33Wal-Mart, 18–20, 38–39, 41, 52, 94, 117,
239Walton, Samuel, 18warehouse management systems (WMS),
130warehousing, 11warranty returns, 144Wax, Charles, 73–75Waxie Sanitary Supply, 73–75wide area network (WAN), 122
WMS. See warehouse management systems
XXML. See extensible markup language
254
I n d e x