Embed Size (px)
Citation preview

H Y P E R I O N ® E S S B A S E ® – S Y S T E M 9E S S B A S E ® I N T E G R A T I O N S E R V I C E S
R E L E A S E 9 . 3 . 1
D A T A P R E P A R A T I O N G U I D E

Integration Services Data Preparation Guide, 9.3.1
Copyright © 1998, 2007, Oracle and/or its affiliates. All rights reserved.
Authors: David Lang
The Programs (which include both the software and documentation) contain proprietary information; they are providedunder a license agreement containing restrictions on use and disclosure and are also protected by copyright, patent, andother intellectual and industrial property laws. Reverse engineering, disassembly, or decompilation of the Programs, exceptto the extent required to obtain interoperability with other independently created software or as specified by law, isprohibited.
The information contained in this document is subject to change without notice. If you find any problems in thedocumentation, please report them to us in writing. This document is not warranted to be error-free. Except as may beexpressly permitted in your license agreement for these Programs, no part of these Programs may be reproduced ortransmitted in any form or by any means, electronic or mechanical, for any purpose.
If the Programs are delivered to the United States Government or anyone licensing or using the Programs on behalf of theUnited States Government, the following notice is applicable:
U.S. GOVERNMENT RIGHTS Programs, software, databases, and related documentation and technical data delivered toU.S. Government customers are "commercial computer software" or "commercial technical data" pursuant to theapplicable Federal Acquisition Regulation and agency-specific supplemental regulations. As such, use, duplication,disclosure, modification, and adaptation of the Programs, including documentation and technical data, shall be subjectto the licensing restrictions set forth in the applicable Oracle license agreement, and, to the extent applicable, the additionalrights set forth in FAR 52.227-19, Commercial Computer Software--Restricted Rights (June 1987). Oracle USA, Inc., 500Oracle Parkway, Redwood City, CA 94065.
The Programs are not intended for use in any nuclear, aviation, mass transit, medical, or other inherently dangerousapplications. It shall be the licensee's responsibility to take all appropriate fail-safe, backup, redundancy and other measuresto ensure the safe use of such applications if the Programs are used for such purposes, and we disclaim liability for anydamages caused by such use of the Programs.
Oracle is a registered trademark of Oracle Corporation and/or its affiliates. Other names may be trademarks of theirrespective owners.
The Programs may provide links to Web sites and access to content, products, and services from third parties. Oracle isnot responsible for the availability of, or any content provided on, third-party Web sites. You bear all risks associated withthe use of such content. If you choose to purchase any products or services from a third party, the relationship is directlybetween you and the third party. Oracle is not responsible for: (a) the quality of third-party products or services; or (b)fulfilling any of the terms of the agreement with the third party, including delivery of products or services and warrantyobligations related to purchased products or services. Oracle is not responsible for any loss or damage of any sort that youmay incur from dealing with any third party.

Contents
Chapter 1. OLAP and Integration Services . . . . . . . . . . . . . . . . . . . . . . . . . . . . . . . . . . . . . . . . . . . . . . . . . . 5
OLAP . . . . . . . . . . . . . . . . . . . . . . . . . . . . . . . . . . . . . . . . . . . . . . . . . . . . . . . . . . . . . . . 5
Multidimensional Databases . . . . . . . . . . . . . . . . . . . . . . . . . . . . . . . . . . . . . . . . . . . . . . 6
SAP BW Data Warehouses . . . . . . . . . . . . . . . . . . . . . . . . . . . . . . . . . . . . . . . . . . . . . . . 6
User Interactions with Data . . . . . . . . . . . . . . . . . . . . . . . . . . . . . . . . . . . . . . . . . . . . . . . 8
Sources of Data . . . . . . . . . . . . . . . . . . . . . . . . . . . . . . . . . . . . . . . . . . . . . . . . . . . . . . . . 8
Integration Services . . . . . . . . . . . . . . . . . . . . . . . . . . . . . . . . . . . . . . . . . . . . . . . . . . . . . 9
Components of Integration Services . . . . . . . . . . . . . . . . . . . . . . . . . . . . . . . . . . . . . . 9
Integration Services Console . . . . . . . . . . . . . . . . . . . . . . . . . . . . . . . . . . . . . . . . . . 10
Integration Server . . . . . . . . . . . . . . . . . . . . . . . . . . . . . . . . . . . . . . . . . . . . . . . . . . 10
Workflow of Integration Services . . . . . . . . . . . . . . . . . . . . . . . . . . . . . . . . . . . . . . . 11
OLAP Models . . . . . . . . . . . . . . . . . . . . . . . . . . . . . . . . . . . . . . . . . . . . . . . . . . . . . . . . 11
Using OLAP Models . . . . . . . . . . . . . . . . . . . . . . . . . . . . . . . . . . . . . . . . . . . . . . . . 11
Fact Table . . . . . . . . . . . . . . . . . . . . . . . . . . . . . . . . . . . . . . . . . . . . . . . . . . . . . . . 12
Dimension Tables . . . . . . . . . . . . . . . . . . . . . . . . . . . . . . . . . . . . . . . . . . . . . . . . . . 12
About Metaoutlines . . . . . . . . . . . . . . . . . . . . . . . . . . . . . . . . . . . . . . . . . . . . . . . . . . . 12
Metaoutline Components . . . . . . . . . . . . . . . . . . . . . . . . . . . . . . . . . . . . . . . . . . . . 13
Using Hierarchies . . . . . . . . . . . . . . . . . . . . . . . . . . . . . . . . . . . . . . . . . . . . . . . . . . . . . 14
Types of Hierarchies . . . . . . . . . . . . . . . . . . . . . . . . . . . . . . . . . . . . . . . . . . . . . . . . 14
Deploying Hierarchies . . . . . . . . . . . . . . . . . . . . . . . . . . . . . . . . . . . . . . . . . . . . . . . 16
Duplicate Members . . . . . . . . . . . . . . . . . . . . . . . . . . . . . . . . . . . . . . . . . . . . . . . . . . . . 17
Chapter 2. Preparing Data Sources . . . . . . . . . . . . . . . . . . . . . . . . . . . . . . . . . . . . . . . . . . . . . . . . . . . . . 19
Defining User Needs . . . . . . . . . . . . . . . . . . . . . . . . . . . . . . . . . . . . . . . . . . . . . . . . . . . 20
Defining Data Sources . . . . . . . . . . . . . . . . . . . . . . . . . . . . . . . . . . . . . . . . . . . . . . . . . . 20
Deciding to Create Staging Areas . . . . . . . . . . . . . . . . . . . . . . . . . . . . . . . . . . . . . . . . . . 21
Cleansing Data . . . . . . . . . . . . . . . . . . . . . . . . . . . . . . . . . . . . . . . . . . . . . . . . . . . . . . . 22
Creating Views, Tables, and User-Defined Tables . . . . . . . . . . . . . . . . . . . . . . . . . . . . . . 22
Deciding to Create a View or a Table . . . . . . . . . . . . . . . . . . . . . . . . . . . . . . . . . . . . 23
Deciding to Create a User-Defined Table . . . . . . . . . . . . . . . . . . . . . . . . . . . . . . . . . 23
Fact Tables in SAP BW . . . . . . . . . . . . . . . . . . . . . . . . . . . . . . . . . . . . . . . . . . . . . . 23
Building Essbase Hierarchies from Recursive Tables . . . . . . . . . . . . . . . . . . . . . . . . . 24
Contents iii

Removing Unions . . . . . . . . . . . . . . . . . . . . . . . . . . . . . . . . . . . . . . . . . . . . . . . . . . 25
Transposing Columns and Rows . . . . . . . . . . . . . . . . . . . . . . . . . . . . . . . . . . . . . . . 25
Denormalizing Source Data Tables . . . . . . . . . . . . . . . . . . . . . . . . . . . . . . . . . . . . . 27
Adding Columns to Tables . . . . . . . . . . . . . . . . . . . . . . . . . . . . . . . . . . . . . . . . . . . . . . 28
Setting Up Columns to Support Member and Measure Properties . . . . . . . . . . . . . . . 28
Joining Tables . . . . . . . . . . . . . . . . . . . . . . . . . . . . . . . . . . . . . . . . . . . . . . . . . . . . . . . . 28
Optimizing Tables for Use with SAP BW . . . . . . . . . . . . . . . . . . . . . . . . . . . . . . . . . . . . 28
Indexes for Small Tables . . . . . . . . . . . . . . . . . . . . . . . . . . . . . . . . . . . . . . . . . . . . . 29
Push Down Operations . . . . . . . . . . . . . . . . . . . . . . . . . . . . . . . . . . . . . . . . . . . . . . 29
Creating Indexes . . . . . . . . . . . . . . . . . . . . . . . . . . . . . . . . . . . . . . . . . . . . . . . . . . . . . . 29
Transforming Data . . . . . . . . . . . . . . . . . . . . . . . . . . . . . . . . . . . . . . . . . . . . . . . . . . . . 30
Deciding Which Tables Are Available to OLAP Model Creators . . . . . . . . . . . . . . . . . . . . 31
Selecting Tables for the Fact Table . . . . . . . . . . . . . . . . . . . . . . . . . . . . . . . . . . . . . . 32
Selecting Tables for Dimensions . . . . . . . . . . . . . . . . . . . . . . . . . . . . . . . . . . . . . . . . 33
Creating Aliases for Dimensions and Members . . . . . . . . . . . . . . . . . . . . . . . . . . . . . 33
Creating Time and Accounts Dimensions . . . . . . . . . . . . . . . . . . . . . . . . . . . . . . . . . . . . 34
Preparing Data for Time Analysis . . . . . . . . . . . . . . . . . . . . . . . . . . . . . . . . . . . . . . . 34
Associating Time Data with Measure Data . . . . . . . . . . . . . . . . . . . . . . . . . . . . . . . . 34
Working with Summary Data . . . . . . . . . . . . . . . . . . . . . . . . . . . . . . . . . . . . . . . . . 34
Accounts Dimensions and SAP BW . . . . . . . . . . . . . . . . . . . . . . . . . . . . . . . . . . . . . 36
Time Dimensions and SAP BW . . . . . . . . . . . . . . . . . . . . . . . . . . . . . . . . . . . . . . . . 37
Slowly Changing Dimensions in SAP BW . . . . . . . . . . . . . . . . . . . . . . . . . . . . . . . . . 37
Attribute-Enabled Columns in SAP BW . . . . . . . . . . . . . . . . . . . . . . . . . . . . . . . . . . 37
Accessing Tables in OLAP Metadata Catalog . . . . . . . . . . . . . . . . . . . . . . . . . . . . . . . . . . 40
Mapping to DB2 Cube Views . . . . . . . . . . . . . . . . . . . . . . . . . . . . . . . . . . . . . . . . . . . . . 40
Text Files as Data Sources . . . . . . . . . . . . . . . . . . . . . . . . . . . . . . . . . . . . . . . . . . . . . . . 41
Index . . . . . . . . . . . . . . . . . . . . . . . . . . . . . . . . . . . . . . . . . . . . . . . . . . . . . . . . . . . . . . 43
iv Contents

1OLAP and Integration Services
In This Chapter
OLAP ... . . . . . . . . . . . . . . . . . . . . . . . . . . . . . . . . . . . . . . . . . . . . . . . . . . . . . . . . . . . . . . . . . . . . . . . . . . . . . . . . . . . . . . . . . . . . . . . . . . . . . . . . . . . . . . . . . . . . . . . . . . . . . . 5
Multidimensional Databases... . . . . . . . . . . . . . . . . . . . . . . . . . . . . . . . . . . . . . . . . . . . . . . . . . . . . . . . . . . . . . . . . . . . . . . . . . . . . . . . . . . . . . . . . . . . . . . . . . . . . 6
SAP BW Data Warehouses ... . . . . . . . . . . . . . . . . . . . . . . . . . . . . . . . . . . . . . . . . . . . . . . . . . . . . . . . . . . . . . . . . . . . . . . . . . . . . . . . . . . . . . . . . . . . . . . . . . . . . . . 6
User Interactions with Data ... . . . . . . . . . . . . . . . . . . . . . . . . . . . . . . . . . . . . . . . . . . . . . . . . . . . . . . . . . . . . . . . . . . . . . . . . . . . . . . . . . . . . . . . . . . . . . . . . . . . . . 8
Sources of Data ... . . . . . . . . . . . . . . . . . . . . . . . . . . . . . . . . . . . . . . . . . . . . . . . . . . . . . . . . . . . . . . . . . . . . . . . . . . . . . . . . . . . . . . . . . . . . . . . . . . . . . . . . . . . . . . . . . . 8
Integration Services... . . . . . . . . . . . . . . . . . . . . . . . . . . . . . . . . . . . . . . . . . . . . . . . . . . . . . . . . . . . . . . . . . . . . . . . . . . . . . . . . . . . . . . . . . . . . . . . . . . . . . . . . . . . . . . 9
OLAP Models .. . . . . . . . . . . . . . . . . . . . . . . . . . . . . . . . . . . . . . . . . . . . . . . . . . . . . . . . . . . . . . . . . . . . . . . . . . . . . . . . . . . . . . . . . . . . . . . . . . . . . . . . . . . . . . . . . . . . . .11
About Metaoutlines ... . . . . . . . . . . . . . . . . . . . . . . . . . . . . . . . . . . . . . . . . . . . . . . . . . . . . . . . . . . . . . . . . . . . . . . . . . . . . . . . . . . . . . . . . . . . . . . . . . . . . . . . . . . . . .12
Using Hierarchies ... . . . . . . . . . . . . . . . . . . . . . . . . . . . . . . . . . . . . . . . . . . . . . . . . . . . . . . . . . . . . . . . . . . . . . . . . . . . . . . . . . . . . . . . . . . . . . . . . . . . . . . . . . . . . . . .14
Duplicate Members ... . . . . . . . . . . . . . . . . . . . . . . . . . . . . . . . . . . . . . . . . . . . . . . . . . . . . . . . . . . . . . . . . . . . . . . . . . . . . . . . . . . . . . . . . . . . . . . . . . . . . . . . . . . . . .17
Oracle's Essbase® Integration Services provides a suite of graphical tools to create OLAP modelsand metaoutlines and populate Oracle's Hyperion® Essbase® – System 9 databases. Use datasources to define logical models representing data in an online analytical processing (OLAP)context. Then use the OLAP models to create metaoutlines that serve as templates for Essbasedatabase outlines.
OLAPOLAP is designed for business managers to analyze consolidated enterprise data in real time.OLAP addresses complex “what if” questions, creating scenarios to test planning strategies.
Essbase supports OLAP, making possible a multidimensional, multiuser database that is accessedwith standard retrieval tools.
Essbase Server supports multiple views of data sets so users can analyze relationships betweendata categories such as:
● How did Product A sell last month? How does this compare to the same month over thelast five years? How will it sell next month?
● Did Product A sell better in particular regions?
● Did customers return Product A last year? Were returns due to defects? Did a specific plantmanufacture defective products?
● Did commissions and pricing affect how salespeople sold Product A?
OLAP 5

You can use Integration Services to create an Essbase database to answer these types of questionsquickly. You can use Integration Services Console to create logical data models that representssource databases.
Multidimensional DatabasesA multidimensional database (MDDB) stores consolidated data at the intersections of itsmembers and dimensions. For example, if a company sells 20 units of products in the East regionin the first quarter, Essbase stores 20 at the intersection of Product, East, Quarter1, and UnitSales.
In a multidimensional database, a dimension is a data category representing a core componentof a business plan, and it often relates to a business function. Product, Region, and Year aretypical dimensions. In most databases, dimensions rarely change over the life of the application.
In a multidimensional database, a member is an individual component of a dimension. Forexample, Product A and Product B are members of the Product dimension. Each member hasa unique name. A dimension can contain many members. In some dimensions, members changefrequently over the life of the application.
Members can be parents of some members and children of other members. The Essbase outlineindents members below one another to indicate a consolidation relationship.
SAP BW Data WarehousesSAP Business Information Warehouses (BW) store data in non relational, process-oriented datastructures.
Note:
Support for SAP BW is available through Hyperion® System™ 9 BI+™ Analytic IntegrationConnector for SAP BW™, a separately purchased and licensed option.
SAP BW data warehouses use different terminology for components that are analogous tomultidimensional components. In SAP BW:
● A dimension is a characteristic.
● A dimension denotes a group of related characteristics; for example, a time dimension refersto the characteristics Calendar Year and Fiscal Year.
● A member is a characteristic value.
● A measure is a key figure. It is a quantifiable value; for example, Gross Sales.
Table 1 maps SAP BW data source components to relational and XML targets.
6 OLAP and Integration Services

Table 1 SAP BW to Relational/XML Model Mapping
Source (BW/ODBO) Target (Relational Model) Target (XML Model)
Dimension Name ModelDim element, name attribute
Time dimensions Time table ModelDim element, modelDim attribute
Fact table ModelDim element, modelDim attribute
ModelLogicalJoin element, view1Nameattribute
Level Name ModelView element, name attribute
ModelLogicalJoin element, viewiNameattribute
Level Name Dimension table
Hierarchy Name Parent/child table (for alternatehierarchies)
ModelHierarchy element, name attribute
ModelPhysicalJoin element, table1Nameattribute, table2Name attribute
Member Unique Name ModelHierarchyMember element,viewMemberName attribute
Member Unique Name Column in fact, dimension,parent/child tables
ModelViewMember element, name attribute
ModelLogicalJoin element, memberiNameattributes
ModelPhysicalJoin element, column1Nameattribute
Member Name Column in dimension, parent/child tables (used to join parent/child table to dimension table)
ModelViewMember element, name attribute
ModelLogicalJoin element, memberiNameattributes
Member Caption Column in dimension, parent/child tables
ModelViewMember element, name attribute
Parent Unique Name Column in parent/child tables ModelViewMember element, name attribute
ModelPhysicalJoin element, column2Nameattribute
Property Name (dimensionproperties)
Columns in dimension, parent/child tables
ModelViewMember element, name attribute
Property Name (dimensionproperties)
Columns in dimension, parent/child tables
ModelViewMember element, drill-throughtype attribute
Measure Unique Name Column in fact table ModelViewMember element, name attribute
Measure Aggregator ModelViewMember element, aggregateTypeattribute
SAP BW Data Warehouses 7

User Interactions with DataEssbase Server consolidates and calculates data to provide different views of the data. Using amultidimensional database, users can perform several tasks:
Consolidate (aggregate or roll up) data
In block storage, consolidation computes the data relationships for all parent and childcombinations within a dimension. For example, the consolidation for the Year dimension is asfollows:
Year = Quarter1 + Quarter2 + Quarter3 + Quarter4
Create “what if” scenarios
Assume you set a sales goal of ten percent growth on all product lines. You can compare salesforecasts with actual sales data (retrieved from the online transaction processing [OLTP] database)to see how close you are to achieving your goals. If actual sales run lower than projected,salespeople can access the forecast data, input new sales scenarios, update the forecast data, andgenerate revised figures.
Input strategic planning assumptions
Assume your company is planning 50 percent growth over three years. You know how manynew products you need, but how many new people can you hire while still optimizing profitsand gross margin?
In block storage, you can input projected sales and expenses and calculate downward todetermine the projected cost of goods sold. If the results do not look practical, you can createdifferent scenarios with different mixes of products, people, and expenses until you produce theprofit picture that you require.
Conduct spreadsheet operations
To drill down or drill up on data retrieves progressively more detailed or progressively moregeneralized data relative to a selected dimension. Drilling down on a multidimensional databasedimension provides you with greater detail on the dimension. Drilling up provides you with amore summarized view of the dimension.
For example, you can drill down on the Year dimension to view each quarter. You can drill upfrom Chicago to view sales totals for the Central region.
Pivoting alters the data perspective. When Essbase Server retrieves a dimension, it displays aconfiguration of rows and columns. A user can pivot (rearrange) the data to obtain a differentviewpoint.
See the Essbase Spreadsheet Add-in or Oracle's Hyperion® Smart View for Officedocumentation.
Sources of DataThe data in a multidimensional database can originate from a variety of sources, such as OLTPdatabases, data warehouses, text , and spreadsheet files.
8 OLAP and Integration Services

In relational databases, data is stored in rows and columns; in a data warehouse such as an SAPBW, data is stored in QueryCubes and InfoCubes.
Integration ServicesIntegration Services transfers data from data sources to Essbase databases. After you determinewhich data to transfer, you consolidate it into a form useful for decision-support users. Thenyou identify the tables, rows, or columns that contain the data and determine how they map tothe structure of the multidimensional database.
Figure 1 illustrates the Integration Services workflow:
Figure 1 Workflow for Creating an Essbase Database from a Data Source
Use Integration Services Console for the following tasks:
● Use tables, views, and columns in one or more data source databases to create an OLAPmodel. An OLAP model is a logical star schema consisting of a fact table surrounded by relateddimension tables.
● Use the OLAP model to create a metaoutline, an template containing the structure and therules required to generate an Essbase outline.
● Use the metaoutline to create and populate an Essbase database.
Components of Integration ServicesIntegration Services, pictured in Figure 2, consists of two major components: IntegrationServices Console and Integration Server.
Integration Services 9

Figure 2 Integration Services
Integration Services ConsoleUse Integration Services Console to create OLAP models and metaoutlines and populate Essbasedatabases.
To create an OLAP model or metaoutline, connect to an OLAP Metadata Catalog and your datasources. See the Integration Services online help.
Integration ServerIntegration Server is the primary component of Integration Services. Integration Server issoftware that uses the information stored in the OLAP Metadata Catalog to extract from datasources the dimension and member names needed to build an associated Essbase outline. If yourdata source is an SAP BW data warehouse, Integration Services extracts characteristic namesand characteristic value names.
When the outline is complete, Integration Server extracts data from the data sources, performsthe operations specified in the associated metaoutline, and loads the data into the Essbasedatabase. See the Essbase Integration Services System Administrator's Guide.
Integration Server includes several subcomponents, as illustrated in Figure 2 on page 10:
● OLAP Metadata Catalog: A structured query language (SQL) relational database containing:
❍ Metadata describing the nature, source, location, and type of data to retrieve
❍ Metadata describing information required to generate Essbase outlines
10 OLAP and Integration Services

❍ OLAP models and metaoutlines
You can create multiple OLAP Metadata Catalogs to store OLAP models and metaoutlines.Using XML Import/Export, you can move OLAP models and metaoutlines to a different OLAPMetadata Catalog.
The OLAP Metadata Catalog is a data source that is configured for Open Database Connectivity(ODBC). See the Essbase Integration Services Installation Guide or the ODBC userdocumentation.
● Essbase Integration Services Shell: A command-line tool used to access Integration Serverto load members and data into an Essbase database. See the Essbase Integration ServicesSystem Administrator's Guide.
Workflow of Integration ServicesFigure 2 on page 10 shows the Integration Services components used to prepare data for OLAPreporting through Essbase Server.
➤ To create Essbase databases from data sources:
1 Build an OLAP model based on data sources.
Integration Server stores the OLAP model and information necessary to retrieve tables in OLAPMetadata Catalog.
2 Create a metaoutline from the OLAP model.
Integration Server stores the metaoutline in OLAP Metadata Catalog.
3 Use the metaoutline to load members and data into the Essbase database.
You can update the Essbase database with new members and data.
OLAP ModelsOLAP models are based on the idea that values in a data source can be categorized as either factsor dimensions of facts. Facts (or key figure data values in SAP BW) are the numeric, variablevalues in the database, such as numbers of units sold. Associated with facts are related data valuesthat provide additional information, such as store locations. An OLAP model contains a facttable, dimension tables, and dimension branches. An OLAP model may contain time andaccounts dimensions.
Integration Services creates an OLAP model that is a logical model, not a physical star schema,and is a logical representation of data values you select from data sources and report in Essbase.
Using OLAP ModelsUse an OLAP model to create metaoutlines. A metaoutline contains the basic structure requiredto build an Essbase outline and load data into EssbaseEssbase. You can use one OLAP model as
OLAP Models 11

the basis for another by saving the original under a different name and editing it. You can createany number of OLAP models to build metaoutlines. Each metaoutline, however, is based onone, specific OLAP model.
OLAP models have the following features:
● They can be the basis for multiple metaoutlines.
● They insulate the Essbase database outline from changes in the source database.
● They enable you to create hierarchies to structure and summarize data from a sourcedatabase. You can use the hierarchies in multiple metaoutlines.
Fact TableThe fact table is a container for all numeric facts (for the measures data values that vary overtime). In SAP BW data warehouses, facts are key figure values. In the sample applicationprovided, the fact table consists of the SALES relational table containing sales figures, cost ofgoods sold, opening and ending inventory quantities, and other columns of variable measures.
Dimension TablesA dimension table, such as a Product dimension, is a container for relational tables. Eachdimension table contains data related to facts in the fact table.
When a dimension table joins to the fact table, that dimension table and other dimension tablesjoined to it form a dimension. A dimension in an OLAP model represents a dimension (orcharacteristic from a data warehouse) you want to report in Essbase. See “MultidimensionalDatabases” on page 6.
When you create a dimension in an OLAP model, the dimension becomes available for use increating a dimension in an associated metaoutline. You can drag a predefined OLAP modeldimension directly into the metaoutline to create a dimension. The newly created metaoutlinedimension then becomes a dimension in the Essbase database that you create when you performa member or data load.
If your source is a relational database, when you build a metaoutline, you can create user-defineddimensions that do not exist in the associated OLAP model.
About MetaoutlinesA metaoutline is a template containing the structure and rules for creating an Essbase outline.A metaoutline is based on the structure of an OLAP model. Metaoutlines have several features:
● They can be the basis for multiple Essbase outlines.
● They can be defined at a central location and used to create multiple Essbase outlines inmultiple locations.
● They enable you to create Essbase databases on demand.
12 OLAP and Integration Services

● They enable you to view sample Essbase outlines before building them.
● They automatically generate SQL to retrieve data from an external source.
● They enable you to filter data before you build the associated Essbase outline.
● They enable you to transform data as you create an Essbase outline.
Metaoutline ComponentsA metaoutline has several components:
● One or more measures. Measures are data values and typically include items such as SALESand COGS (cost of goods sold). Every metaoutline used to build an Essbase outline requiresat least one measure.
In SAP BW data warehouses, measures are key figures. They are always numerical.
The Essbase database calculates the measures for each dimension intersection of theassociated metaoutline. Measures can be aggregated in a pre-defined order using an SQLexpression. The SQL expression uses an SQL template and a list of specified columns,attributes, and measures.
● Two or more dimensions. A dimension is a data category, containing members, used toorganize business data for retrieval and preservation of data values. In SAP BW datawarehouses, dimensions are characteristics which contain characteristic values (or members).In SAP BW data warehouses, dimension is used to denote a group of related characteristics;for example, a time dimension refers to the characteristics, Calendar Year and Fiscal Year.
A dimension in a metaoutline creates a dimension in the associated Essbase outline. Everymetaoutline used to create an Essbase outline must include at least two dimensions.
● One or more member levels. A member level is a hierarchical level of detail within adimension. A member level in a metaoutline creates members at the same level in theassociated Essbase outline.
For example, if the Product dimension of a metaoutline contains a PRODUCT_DESCmember level, the Product dimension in the Essbase outline contains members, such asBirch Beer and Caffeine Free Cola, that correspond to values in the PRODUCT_DESCmember level in the source database.
You can designate user-defined members as shared members. They can share storage spacewith other members of the same name.
● Filters. Filters determine which members of a member level that Integration Services addsto the associated Essbase outline. You can define transformation rules to determine whattransformations Integration Services performs on the members of a member level as it buildsthe Essbase outline.
● Optional attribute dimensions. Attribute dimensions are based on attribute-enabledcolumns in the OLAP model. After an attribute dimension and member are created, youcan define attribute properties, such as Boolean and numeric ranges, to view business datain finer detail than would otherwise be easily available.
About Metaoutlines 13

● Optional Hybrid Analysis low-level members. Hybrid Analysis integrates source databaseswith Essbase multidimensional databases so that applications and reporting tools candirectly retrieve data within both databases. When Hybrid Analysis is enabled, users ofspreadsheets and report writer interfaces can access data contained in the Essbase databaseand drill down to data accessed directly from the data source.
● Optional drill-through report members. A drill-through report is based on an intersectionlevel (member combination) that spreadsheet users double-click to start drill-throughoperations. Spreadsheet users can view or customize pre-defined drill-through reports thatretrieve detail columns from data sources. Integration Server returns the drill-throughreport in the context of the data that spreadsheet users are viewing.
❍ Drill-through report to a URL. Customize the drill-through SQL template, replacingthe data source with an HTML source. Integration Services passes the URL to EssbaseSpreadsheet Add-in or Hyperion Smart View for Office (or another drill-throughclient).
❍ Drill-through report to a secondary source.
❍ Drill-through report to attributes and members enabled for Hybrid Analysis. Selectfrom several options for attribute drill-through reporting:
❏ Attribute dimensions and attribute members as OLAP intersections.
❏ Hybrid Analysis dimensions as OLAP intersections.
❏ Hybrid Analysis member columns as intersections.
❏ Attributes associated with members that have been enabled for Hybrid Analysis.
Using HierarchiesDimensions are usually structured to contain a hierarchy of related members. For example, forrelational database users, the Time dimension includes members such as Year, Quarter, andMonth. This hierarchy creates an Essbase outline with members such as 2004, Quarter1, andJanuary.
Hierarchies also use attributes to classify members logically within a dimension; for example, aProduct dimension with attributes such as Size and Flavor.
You can create hierarchies for a metaoutline while creating OLAP models.
Types of HierarchiesThere are several types of hierarchies in data retrieval and analysis.
BalancedA balanced hierarchy has multiple branches in a hierarchical tree, and each member is consistentwith other members at the same level in each branch. For example, in a relational database, adimension has branches for 2005 and 2006. In each of these branches, Q1 is at the same level,
14 OLAP and Integration Services
as are the months Jan, Feb, and Mar. Time dimensions typically have balanced hierarchies. InSAP BW data warehouses, characteristics have analogous branches.
UnbalancedAn unbalanced hierarchy contains branches with unequal numbers of member levels althoughthe parent-child relationships are usually consistent from branch to branch. For example, a SalesPersonnel dimension has branches for Sales Manager East and West. Each of these branches hasStates. The Sales Manager East, however, has four states and the Sales Manager West has twostates. Human resource dimensions sometimes have unbalanced hierarchies.
RaggedA ragged hierarchy occurs when a dimension has branches with different numbers of levels. Forexample, a Sales Regions dimension has branches for North America and for Europe. Bothbranches have member level attributes for Country, State, and City.
The North America branch has United States, Massachusetts, and Boston. The Europe branchhas Greece, Athens because Greece does not have individual states like the United States. TheState level for Greece is empty, causing a ragged hierarchy.
Geographical dimensions and product dimensions often have ragged hierarchies.
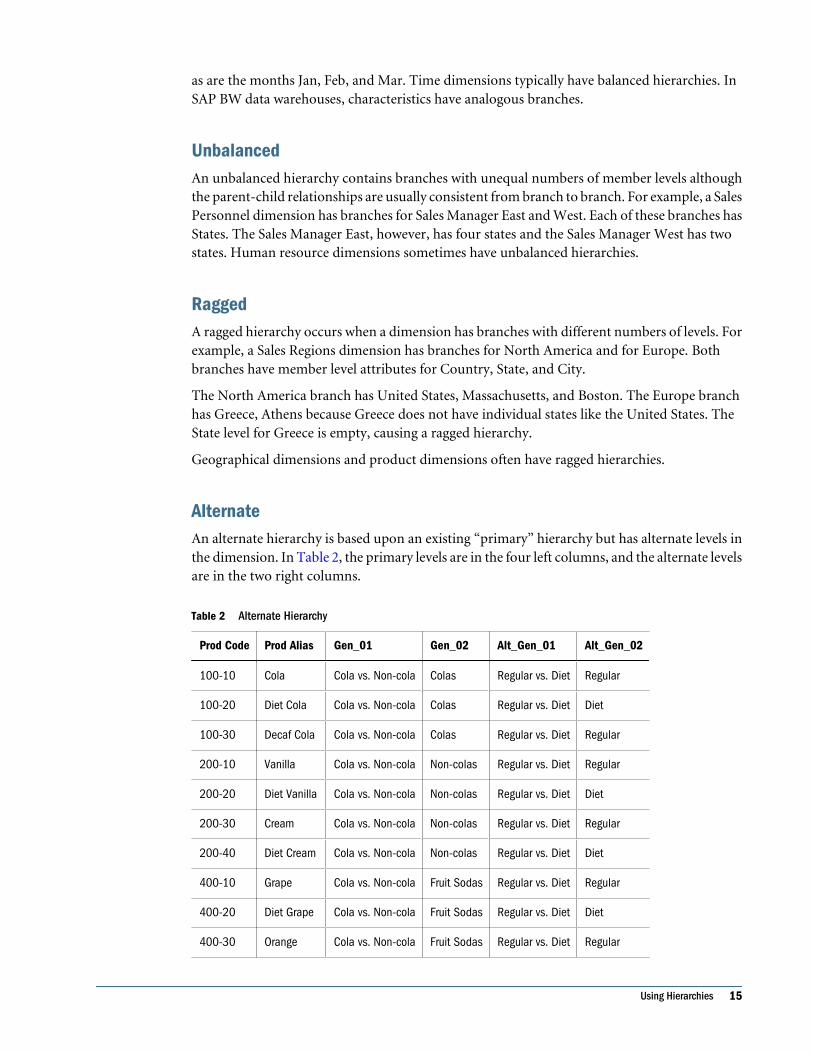
AlternateAn alternate hierarchy is based upon an existing “primary” hierarchy but has alternate levels inthe dimension. In Table 2, the primary levels are in the four left columns, and the alternate levelsare in the two right columns.
Table 2 Alternate Hierarchy
Prod Code Prod Alias Gen_01 Gen_02 Alt_Gen_01 Alt_Gen_02
100-10 Cola Cola vs. Non-cola Colas Regular vs. Diet Regular
100-20 Diet Cola Cola vs. Non-cola Colas Regular vs. Diet Diet
100-30 Decaf Cola Cola vs. Non-cola Colas Regular vs. Diet Regular
200-10 Vanilla Cola vs. Non-cola Non-colas Regular vs. Diet Regular
200-20 Diet Vanilla Cola vs. Non-cola Non-colas Regular vs. Diet Diet
200-30 Cream Cola vs. Non-cola Non-colas Regular vs. Diet Regular
200-40 Diet Cream Cola vs. Non-cola Non-colas Regular vs. Diet Diet
400-10 Grape Cola vs. Non-cola Fruit Sodas Regular vs. Diet Regular
400-20 Diet Grape Cola vs. Non-cola Fruit Sodas Regular vs. Diet Diet
400-30 Orange Cola vs. Non-cola Fruit Sodas Regular vs. Diet Regular
Using Hierarchies 15

Prod Code Prod Alias Gen_01 Gen_02 Alt_Gen_01 Alt_Gen_02
400-40 Diet Orange Cola vs. Non-cola Fruit Sodas Regular vs. Diet Diet
Deploying HierarchiesA hierarchy is deployed using a standard or recursive method:
StandardEach attribute in the hierarchy defines one level. For example, in a Time dimension, the hierarchyis organized so that the attributes Year, Quarter, and Month define different levels, as illustratedin Table 3.
Note:
Standard deployment may be used with all hierarchy types.
Table 3 Standard Hierarchy Deployment
Year Quarter Month
2003 1st Jan
2003 1st Feb
2003 1st Mar
2004 1st Jan
2004 1st Feb
2004 1st Mar
Recursive HierarchiesThe parent-child relationships of attributes are used to organize the hierarchy. For example, ina Sales Personnel dimension, the hierarchy is organized under the parent-child relationshipsshown in Table 4.
Table 4 Recursive Hierarchy Deployment
Parent Attribute Child Attribute
North America United States of America
United States of America California
California San Bernadino
16 OLAP and Integration Services

Parent Attribute Child Attribute
San Bernadino Los Angeles
Los Angeles Glendale
Recursive Hierarchies and SAP BW
In SAP BW data warehouses, base dimension tables contain only leaf level (level 0) members. Arecursive hierarchy dimension table contains parent-child hierarchical information which isused along with the leaf level members in the base dimensions to build a recursive hierarchy.
Note:
We strongly recommend you not edit recursive hierarchies imported from SAP BW datawarehouses into Integration Services unless you understand data warehousing and datamodeling.
Duplicate MembersA data source or metaoutline may contain duplicate member names. In Integration ServicesConsole, you can specify a metaoutline that, when loaded into an Essbase database, creates anEssbase outline that supports duplicate member names.
In order to support shared members in a duplicate member Essbase outline, the member columnin the metaoutline must be associated with a member key column from the data source.Integration Server makes use of the assigned key to uniquely identify the base member.Internally, Integration Servergenerates its own unique identifier to differentiate betweenduplicate members.
When Integration Services performs a member load, Integration Server applies the uniqueidentifier to duplicate names. From Integration Services clients, the member names can beretrieved using a qualified format, for example: [Product].[300].[300-30][Diet].[300-30]
You may choose to specify a metaoutline that, when loaded into Integration Services, does notcreate an outline that supports duplicate member names. In this case, when Integration Serverperforms a member load, it performs one of the following actions:
● It ignores the duplicate members. Integration Server does not load the members into theIntegration Services outline.
● It creates the members as shared members. The data associated with a shared member isstored in the real member.
For more information, see Essbase online help.
Duplicate Members 17

Note:
You should not create duplicate members as shared if the actual member or any shared memberat the first leaf level has a filter. Instead, individually tag such a member as shared. You canprevent the creation of duplicate member names by transforming data when you create an OLAPmodel.
18 OLAP and Integration Services

2Preparing Data Sources
In This Chapter
Defining User Needs ... . . . . . . . . . . . . . . . . . . . . . . . . . . . . . . . . . . . . . . . . . . . . . . . . . . . . . . . . . . . . . . . . . . . . . . . . . . . . . . . . . . . . . . . . . . . . . . . . . . . . . . . . . . . .20
Defining Data Sources... . . . . . . . . . . . . . . . . . . . . . . . . . . . . . . . . . . . . . . . . . . . . . . . . . . . . . . . . . . . . . . . . . . . . . . . . . . . . . . . . . . . . . . . . . . . . . . . . . . . . . . . . . .20
Deciding to Create Staging Areas ... . . . . . . . . . . . . . . . . . . . . . . . . . . . . . . . . . . . . . . . . . . . . . . . . . . . . . . . . . . . . . . . . . . . . . . . . . . . . . . . . . . . . . . . . . . . . .21
Cleansing Data ... . . . . . . . . . . . . . . . . . . . . . . . . . . . . . . . . . . . . . . . . . . . . . . . . . . . . . . . . . . . . . . . . . . . . . . . . . . . . . . . . . . . . . . . . . . . . . . . . . . . . . . . . . . . . . . . . . .22
Creating Views, Tables, and User-Defined Tables... . . . . . . . . . . . . . . . . . . . . . . . . . . . . . . . . . . . . . . . . . . . . . . . . . . . . . . . . . . . . . . . . . . . . . . . . . . . .22
Adding Columns to Tables ... . . . . . . . . . . . . . . . . . . . . . . . . . . . . . . . . . . . . . . . . . . . . . . . . . . . . . . . . . . . . . . . . . . . . . . . . . . . . . . . . . . . . . . . . . . . . . . . . . . . . .28
Joining Tables ... . . . . . . . . . . . . . . . . . . . . . . . . . . . . . . . . . . . . . . . . . . . . . . . . . . . . . . . . . . . . . . . . . . . . . . . . . . . . . . . . . . . . . . . . . . . . . . . . . . . . . . . . . . . . . . . . . . .28
Optimizing Tables for Use with SAP BW.... . . . . . . . . . . . . . . . . . . . . . . . . . . . . . . . . . . . . . . . . . . . . . . . . . . . . . . . . . . . . . . . . . . . . . . . . . . . . . . . . . . . . . .28
Creating Indexes ... . . . . . . . . . . . . . . . . . . . . . . . . . . . . . . . . . . . . . . . . . . . . . . . . . . . . . . . . . . . . . . . . . . . . . . . . . . . . . . . . . . . . . . . . . . . . . . . . . . . . . . . . . . . . . . . .29
Transforming Data ... . . . . . . . . . . . . . . . . . . . . . . . . . . . . . . . . . . . . . . . . . . . . . . . . . . . . . . . . . . . . . . . . . . . . . . . . . . . . . . . . . . . . . . . . . . . . . . . . . . . . . . . . . . . . . .30
Deciding Which Tables Are Available to OLAP Model Creators .. . . . . . . . . . . . . . . . . . . . . . . . . . . . . . . . . . . . . . . . . . . . . . . . . . . . . . . . . . . . . . .31
Creating Time and Accounts Dimensions ... . . . . . . . . . . . . . . . . . . . . . . . . . . . . . . . . . . . . . . . . . . . . . . . . . . . . . . . . . . . . . . . . . . . . . . . . . . . . . . . . . . . . .34
Accessing Tables in OLAP Metadata Catalog... . . . . . . . . . . . . . . . . . . . . . . . . . . . . . . . . . . . . . . . . . . . . . . . . . . . . . . . . . . . . . . . . . . . . . . . . . . . . . . . . .40
Mapping to DB2 Cube Views ... . . . . . . . . . . . . . . . . . . . . . . . . . . . . . . . . . . . . . . . . . . . . . . . . . . . . . . . . . . . . . . . . . . . . . . . . . . . . . . . . . . . . . . . . . . . . . . . . . .40
Text Files as Data Sources ... . . . . . . . . . . . . . . . . . . . . . . . . . . . . . . . . . . . . . . . . . . . . . . . . . . . . . . . . . . . . . . . . . . . . . . . . . . . . . . . . . . . . . . . . . . . . . . . . . . . . .41
An OLAP model is a dimensional model of relational data in the form of a star schema. OLAPmodels are based on the concept that values in an external data source can be categorized aseither facts (key figure data values in SAP BW) or dimensions of facts.
Before creating an OLAP model, understand and define your business needs and your datasources. You may need to modify some data sources to make the transition from relationaldatabases or data warehouses to multidimensional databases easier and more efficient.
For information about creating an OLAP model, see Integration Services Console Help.
Note:
Many tasks discussed here cannot be performed within Integration Services if you are using datafrom an SAP BW data warehouse. See the Hyperion System 9 BI+ Analytic IntegrationConnector for SAP BW documentation.
19

Defining User NeedsWhen you create an OLAP model, your goal is to create a multidimensional Essbase database.This topic assumes you understand design principles for multidimensional databases. See“OLAP” on page 5 and the Hyperion Essbase - System 9 Database Administrator's Guide.
Before designing OLAP models, answer these questions:
What data do users want to see in the Essbase database?
Consider your business environment and the available data. Decide whether to create one ormultiple Essbase databases.
What is the level of detail users need in the Essbase database?
Consider your business environment and the performance requirements of the Essbase database.(In general, the less detail stored in the Essbase database, the faster the performance.)
You can use drill-through reports or Hybrid Analysis to offer users at the spreadsheet levelalternative views of data and direct access to the source data.
Which dimensions apply to each fact table row?
A dimension is a data category. Typical dimensions are Product, Market, and Time. Considerhow users want to view data. In SAP BW data warehouses, multidimensional dimensions arecharacteristics.
Each dimension has a number of members (characteristic values in data warehouses). Forexample, the Market dimension can include members representing cities. Each row in the facttable represents a combination of members, one from each dimension. For example, a row inthe fact table stores the sales for Product A in New York in February.
Which measures do you want to represent in the fact table?
Measures are numeric quantities that vary over time. In SAP BW data warehouses, measures arekey figures. Examples of measures are quantity sold, cost of goods sold, and profit. Not all numericvalues are measures, but all measures are numeric values..
Defining Data SourcesAfter defining the data users need in the Essbase database, define the data sources. Considerthese questions:
● Is the data clean?
Consider the quality and integrity of the source data. See “Cleansing Data” on page 22.
● Is the data calculated by a procedure and not stored; for example, a discount calculated fora specific product at a specific time?
Create this information as tables in the source database. Consider using a staging area. See“Deciding to Create Staging Areas” on page 21.
● Is the data in a single structured query language (SQL) database or in multiple SQL datasources?
20 Preparing Data Sources
Essbase Integration Server can access multiple SQL sources; however, you can consolidateSQL tables into a single SQL data source for each chosen source database.
● Is the data in text (flat) files)?
Integration Services supports text files (flat files). If your data is in text files, you need tocreate text files as tables in the chosen source databases. Consider creating a staging area.See “Deciding to Create Staging Areas” on page 21. Alternatively, after building the Essbasedatabase outline, use Oracle's Essbase® Administration Services to load data. See Oracle'sEssbase® Administration Services Online Help and “Text Files as Data Sources” on page41.
● Is the data In SAP BW data warehouses?
Note differences between the terminology used in relational databases and SAP BW datawarehouses. See “SAP BW Data Warehouses” on page 6.
Deciding to Create Staging AreasA staging area is an RDBMS database you create to meet the needs of specific applications.Typically, a staging area is small compared to a data warehouse or an online transactionprocessing (OLTP) application. As a snapshot of data, it is not constantly updated with new databut is refreshed periodically.
Note:
For information on creating a staging area for an SAP BW data warehouse, see your SAP BWdocumentation.
Use a staging area for these tasks:
● Combine data from disparate or heterogeneous platforms without changing source data
● Fine-tune data for an application
For example, you can calculate a subset of the data source data and then run faster querieson the precalculated data in the staging area.
● Create tables or views to denormalize the data so that it maps more easily to an OLAP model(see “Creating Views, Tables, and User-Defined Tables” on page 22)
● Transform data not consistently described (see “Transforming Data” on page 30)
Figure 3 shows a staging area as part of a data warehouse. Data is copied into the staging areafrom the source data and then converted.
Deciding to Create Staging Areas 21

Figure 3 Data Warehouse with Staging Area
Cleansing DataIntegration Server does not cleanse invalid or inconsistent data. Inconsistent data may includeincorrect values, incorrect data types, or non-matching integrity constraints (rows that do nothave entries for required key columns). Also, data is inconsistent if the same value is entered indifferent forms. Inconsistency often occurs when data is drawn from multiple sources or whenusers enter data incorrectly.
If source data is inconsistent, you cleanse, the data. Cleansing data can be a simple process, suchas making suspect data into nulls, or a more complex process requiring a data-cleansing tool.
Creating Views, Tables, and User-Defined TablesIntegration Server does not distinguish between tables and views in data sources. You can usethem (and user-defined tables) when building OLAP models.
Creating views, tables, user-defined tables, or synonyms can provide security and make thetransition from data sources to multidimensional databases easier. By creating views, tables, oruser-defined tables, the structure in the data source remain unchanged.
Create views, new tables, or user-defined tables for these takss:
● Build an Essbase hierarchy down to a specific level in a recursive table (see “Building EssbaseHierarchies from Recursive Tables” on page 24).
● Create aliases in Essbase databases from data stored in multiple columns in source data tables(see “Creating Aliases for Dimensions and Members” on page 33).
Consider creating views, tables, or user-defined tables if source tables meet any of these criteria:
● The source tables contain unions. Integration Server does not generate SQL for unions. See“Removing Unions” on page 25.
22 Preparing Data Sources
● The source tables have columns you want to transpose to rows. See “Transposing Columnsand Rows” on page 25.
● The source tables are in a packaged application. You may not know which tables containthe data that you need because the table names provided by the application may not bemeaningful in your environment. You may need to ask an application specialist to createthe required tables and views (with meaningful names) in a staging area in the target datasource. See “Deciding to Create Staging Areas” on page 21.
● The source tables are highly normalized. Normalized data is appropriately grouped and doesnot include redundant data. Consider denormalizing data. See “Denormalizing Source DataTables” on page 27.
Deciding to Create a View or a TableTypically, you create views of the source data (instead of tables) because views ensure that datais current and efficiently stored. Also, you do not need to maintain two sets of the same data.
When deciding to create a view or a new table, consider these questions:
● Does the data already exist?
If the data does not exist, create a table.
● Do you want to index columns that are not indexed in the source table?
Create a table because you cannot index columns in a view. See “Creating Indexes” on page29.
● Do you want to index columns that contain data you need to transform?
Many data sources ignore indexes on columns with transformations. You probably need tocreate a new table. See “Transforming Data” on page 30.
Create tables and views in the staging area. See “Deciding to Create Staging Areas” on page21.
Deciding to Create a User-Defined TableCreate user-defined tables for the reasons described in “Deciding to Create a View or a Table”on page 23. User-defined tables are created in the Integration Services Console, not in therelational database or data warehouse.
Fact Tables in SAP BWWhen creating an OLAP model from a relational data source, select one or more relational sourcetables to use as a fact table, time dimension, accounts dimension, and other dimensions. Whenworking with an SAP BW data source, you do not have the option of individually selecting viewsto use as components of the OLAP model.
When you import an SAP BW model, Analytic Integration Connector for SAP BW examinesthe metadata of the selected InfoObject and extracts information to create the fact table. It also
Creating Views, Tables, and User-Defined Tables 23

extracts information to create other OLAP model elements such as dimensions, hierarchies, andattributes. Integration Services Console then displays the resulting OLAP model.
Editing the fact table is neither advised nor recommended. Contact Hyperion Technical Support.
You may want to aggregate data before using it in Integration Server. When you aggregate datain views, the DBMS does the aggregation dynamically. When you aggregate data in tables, theaggregation is done ahead of time which may improve performance.
Building Essbase Hierarchies from Recursive TablesA recursive table contains information in one column that is a parent or child of informationin a second column. Essbase Integration Server can build Essbase outline hierarchies from arecursive source table.
When creating a hierarchy from a recursive table, follow these guidelines:
● To associate aliases or user-defined attributes (UDA) with members created from a recursivetable, ensure the column with which you associate the alias or UDA is fully defined.
● When creating an OLAP model, join the recursive table to itself.
● When creating a metaoutline, select the parent or child column you want to filter on as amember level in the metaoutline.
Building a Hierarchy Down to a Specific LevelTo build the Essbase outline down to a specific level, create a view containing data for only thedesired levels.
Creating Aliases or UDAs for Members in a Recursive TableIf you want to associate aliases or UDAs with members created from a recursive source table,you must prepare the data:
If the alias or UDA data is in a separate table, you must complete specific steps when creatingan OLAP model. These steps vary, depending on whether the column, with which you areassociating the alias or UDA, is fully defined (see Table 5 and Table 3).
If the alias or UDA data is in the recursive source table, the column with which you associatethe alias or UDA must be fully defined, and all alias or UDA information must relate to the fullydefined column.
If you want to associate an alias or UDA with the parent column of a recursive table, the parentcolumn must be fully defined. A recursive table parent column is fully defined when the parentcolumn contains every value (every member proposed for the Essbase hierarchy). Thus theparent column contains the lowest-level value in the hierarchy with a NULL value in the childcolumn. In Table 5, the GEO_PARENT column is fully defined because the GEO_PARENTcolumn contains the lowest-level value, 01010, with a NULL child in the GEO_CHILD column.
24 Preparing Data Sources

Table 5 Fully Defined Parent Column
GEO_PARENT GEO_CHILD
USA East
East Maine
Maine Bangor
Bangor 01010
01010 <NULL>
If you want to associate an alias or UDA with the child column in a recursive table, the childcolumn must be fully defined. A recursive table child column is fully defined when the childcolumn contains every value (every member proposed for the Essbase hierarchy). Thus the childcolumn contains the highest-level value in the hierarchy, with a NULL value in the parentcolumn.
In Table 6, the GEO_CHILD column is fully defined because the GEO_CHILD column containsthe highest-level value, USA, with a NULL parent in the GEO_PARENT column.
Table 6 Fully Defined Child Column
GEO_PARENT GEO_CHILD
<NULL> USA
USA East
East Maine
Maine Bangor
Bangor 01010
Removing UnionsIntegration Server does not generate SQL for unions. A union is join that combines the resultsof two SELECT statements. It is often used to merge lists of values contained in two tables. Ifthe source tables use unions, you must create views of the data that do not use the unions beforeyou can start to work with the data in Integration Services. See your RDBMS or data warehousedocumentation.
Transposing Columns and RowsTranspose columns and rows to transition data from various sources to an Essbase database.Transpose the columns before you start to work with the data in Integration Server.
Consider the following example in which you create multiple Essbase measures (Init_Sales,Subsequent_Sales, and Return_Sales) from a single database column (SALESTYPE).
Creating Views, Tables, and User-Defined Tables 25
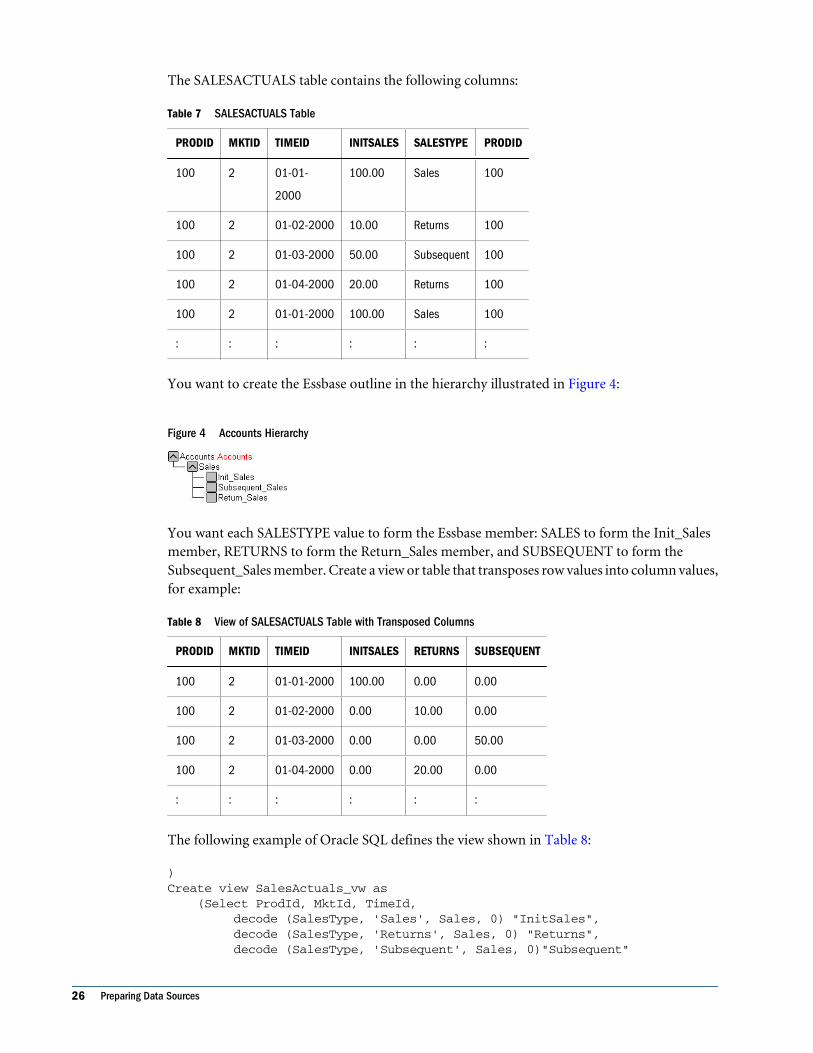
The SALESACTUALS table contains the following columns:
Table 7 SALESACTUALS Table
PRODID MKTID TIMEID INITSALES SALESTYPE PRODID
100 2 01-01-
2000
100.00 Sales 100
100 2 01-02-2000 10.00 Returns 100
100 2 01-03-2000 50.00 Subsequent 100
100 2 01-04-2000 20.00 Returns 100
100 2 01-01-2000 100.00 Sales 100
: : : : : :
You want to create the Essbase outline in the hierarchy illustrated in Figure 4:
Figure 4 Accounts Hierarchy
You want each SALESTYPE value to form the Essbase member: SALES to form the Init_Salesmember, RETURNS to form the Return_Sales member, and SUBSEQUENT to form theSubsequent_Sales member. Create a view or table that transposes row values into column values,for example:
Table 8 View of SALESACTUALS Table with Transposed Columns
PRODID MKTID TIMEID INITSALES RETURNS SUBSEQUENT
100 2 01-01-2000 100.00 0.00 0.00
100 2 01-02-2000 0.00 10.00 0.00
100 2 01-03-2000 0.00 0.00 50.00
100 2 01-04-2000 0.00 20.00 0.00
: : : : : :
The following example of Oracle SQL defines the view shown in Table 8:
)Create view SalesActuals_vw as (Select ProdId, MktId, TimeId, decode (SalesType, 'Sales', Sales, 0) "InitSales", decode (SalesType, 'Returns', Sales, 0) "Returns", decode (SalesType, 'Subsequent', Sales, 0)"Subsequent"
26 Preparing Data Sources

from SalesActuals)
After defining a new table or view, use it to create an OLAP model.
Denormalizing Source Data TablesIf data is highly normalized, it may not map clearly to OLAP models. Normalized data is groupedand has no redundant data. You can use normalized source tables to create an OLAP model byspecifying joins, but it may be more efficient to create a new table of denormalized data in theRDBMS.
If you use the denormalized data source, Integration Server does not need to compute thejoins when building OLAP models.
In this example, in the first three tables, data is highly normalized, minimizing redundant data:
Table 9 Normalized Product Family Data
FAMILYID FAMILYDESC
100 Colas
200 Root Beer
Table 10 Normalized Product Data
PRODID FAMILYID
100-10 100
100-20 100
100-30 100
Table 11 Normalized Product Description Data
PRODID PRODDESC
100-10 Cola
100-20 Diet Cola
100-30 Caffeine Free Cola
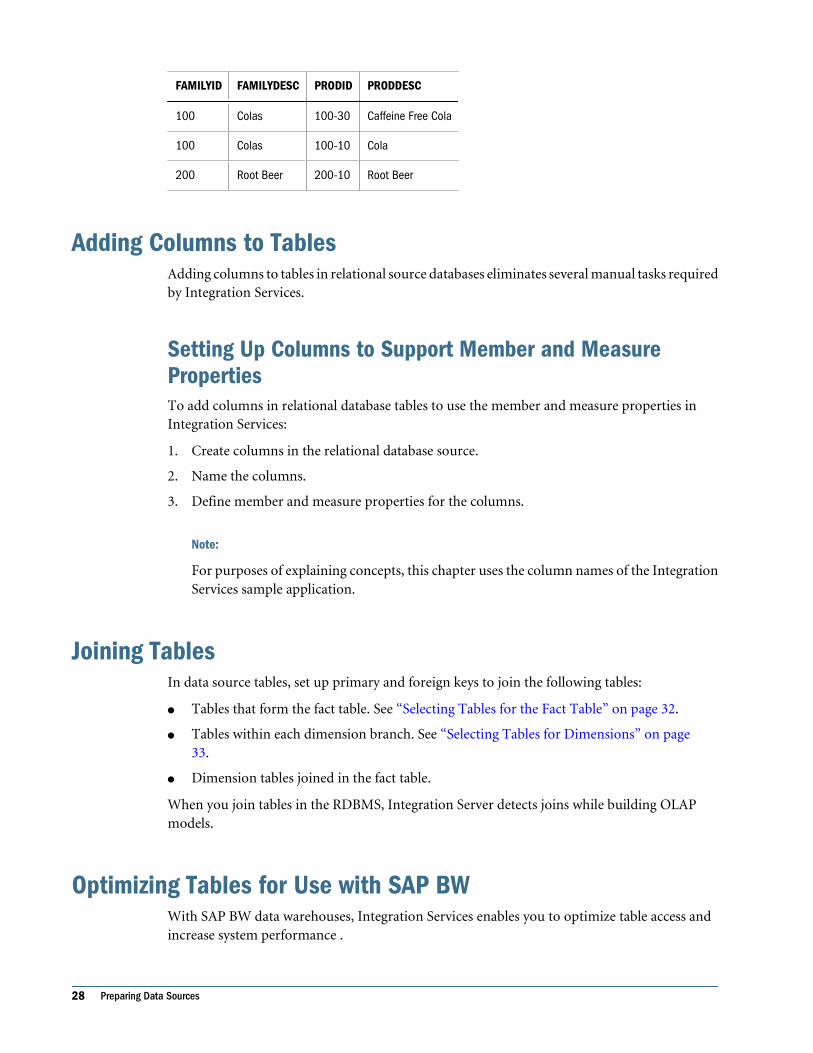
The following shows denormalized data in one table:
Table 12 Denormalized Product Data
FAMILYID FAMILYDESC PRODID PRODDESC
100 Colas 100-10 Cola
100 Colas 100-20 Diet Cola
Creating Views, Tables, and User-Defined Tables 27
FAMILYID FAMILYDESC PRODID PRODDESC
100 Colas 100-30 Caffeine Free Cola
100 Colas 100-10 Cola
200 Root Beer 200-10 Root Beer
Adding Columns to TablesAdding columns to tables in relational source databases eliminates several manual tasks requiredby Integration Services.
Setting Up Columns to Support Member and MeasurePropertiesTo add columns in relational database tables to use the member and measure properties inIntegration Services:
1. Create columns in the relational database source.
2. Name the columns.
3. Define member and measure properties for the columns.
Note:
For purposes of explaining concepts, this chapter uses the column names of the IntegrationServices sample application.
Joining TablesIn data source tables, set up primary and foreign keys to join the following tables:
● Tables that form the fact table. See “Selecting Tables for the Fact Table” on page 32.
● Tables within each dimension branch. See “Selecting Tables for Dimensions” on page33.
● Dimension tables joined in the fact table.
When you join tables in the RDBMS, Integration Server detects joins while building OLAPmodels.
Optimizing Tables for Use with SAP BWWith SAP BW data warehouses, Integration Services enables you to optimize table access andincrease system performance .
28 Preparing Data Sources

Indexes for Small TablesIf you have multiple joins across tables, system performance may degrade because each joinrequires a full scan through each table for data. Integration Services uses indexes to search onspecific rows rather than on entire tables. This works well with small tables.
Push Down OperationsIntegration Services uses several “push down” operations to speed access to tables:
Push Down ProjectionsIntegration Services “pushes down” to desired columns in a fact table rather than pulling in allfields in the table.
Push Down FiltersIntegration Services uses the WHERE clause rather than SELECT in MDX statements to findthe table field.
Push Down JobsIntegration Services places multi-table SQL statements in a single MDX statement with eachtable having its own MDX statement, giving more efficient joins.
Push Down Group ByIntegration Services provides push down aggregation in SAP BW cube logic so that the GROUPBY count always equals one.
Creating IndexesIntegration Server detects indexes (including bitmapped indexes) you have defined on sourcetables and uses them to create an Essbase outline and to load data. Indexes are pointers logicallyarranged by the values of a key. Indexes optimize access to relational data. Bitmapped indexesare specialized indexes that may improve performance during analysis of numeric data.
Note:
In SAP BW data warehouses, aggregates can be created but not indexes which can be used byIntegration Services.
To improve performance:
Creating Indexes 29

● Define indexes on columns you use to filter data in the source database or in the OLAPmodel. For example, if the source database contains columns for city and state, and you filteron city or state (SELECT * FROM Region WHERE State = Ca%), then index the columnswhich you are filtering (here, State).
● If you are creating and filtering on alias names, index the column containing alias names.See “Creating Aliases for Dimensions and Members” on page 33.
● Define bitmapped indexes on numeric data you use to filter the database. For example, ifyou filter on sales values SELECT Product FROM ProdSales GROUPBY ProductORDERBY ProdId HAVING SUM(Sales)>15000, then consider defining a bitmapped indexon sales values. Most source databases support bitmapped indexes. See the documentationfor the RDBMS or data warehouse that you are using.
Transforming DataYou may need to transform data, for example, to change date formats.
Note:
For information on transforming data In SAP BW data warehouses, see your SAP BWdocumentation.
Assume you want to create an OLAP model, combining data from sales and financial databases.If the sales database specifies New York as New_York and the financial database specifies NewYork as NY, you can transform NY to New_York in the staging area (see “Deciding to CreateStaging Areas” on page 21) without changing source data.
You can do some data transformations in OLAP models and metatoutlines. (For a list of availabletransformations, see Integration Services online help.) If you must do significanttransformations on the data, consider using a data transformation tool before you use the datain Integration Server.
Transformations you must perform in source databases, and not in Integration Services, includethese:
● Most frequently accessed transformations
For example, you want the Essbase database outline to include members for Year, Qtr, andMonth, and the data source table contains a column called TRANSDATE. TRANSDATEholds the transaction date for each row.
Transform the data ahead of time, creating a source table that contains the columns YEAR,QTR, and MONTH. The columns contain data transformed from the TRANSDATEcolumn. You can index the YEAR, QTR, and MONTH columns to improve performance.
Note:
Many data source databases ignore indexes on columns with transformations. Transformthe data and create a physical table with new columns that can be indexed.
30 Preparing Data Sources
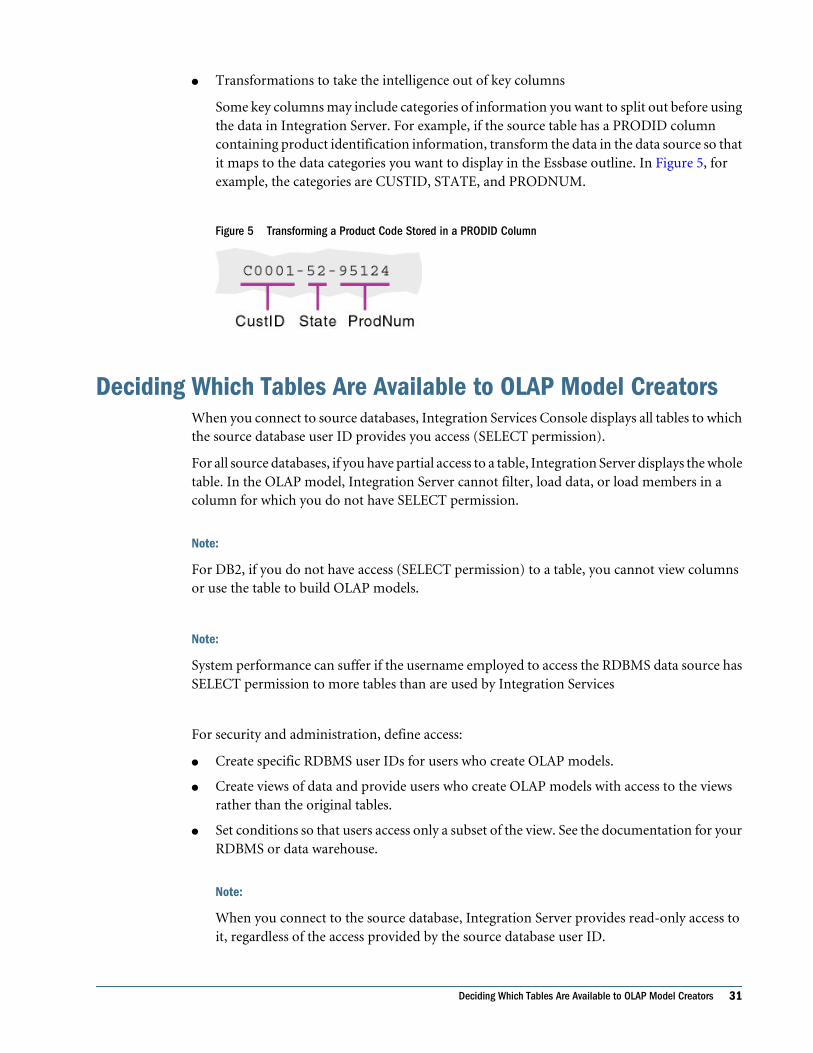
● Transformations to take the intelligence out of key columns
Some key columns may include categories of information you want to split out before usingthe data in Integration Server. For example, if the source table has a PRODID columncontaining product identification information, transform the data in the data source so thatit maps to the data categories you want to display in the Essbase outline. In Figure 5, forexample, the categories are CUSTID, STATE, and PRODNUM.
Figure 5 Transforming a Product Code Stored in a PRODID Column
Deciding Which Tables Are Available to OLAP Model CreatorsWhen you connect to source databases, Integration Services Console displays all tables to whichthe source database user ID provides you access (SELECT permission).
For all source databases, if you have partial access to a table, Integration Server displays the wholetable. In the OLAP model, Integration Server cannot filter, load data, or load members in acolumn for which you do not have SELECT permission.
Note:
For DB2, if you do not have access (SELECT permission) to a table, you cannot view columnsor use the table to build OLAP models.
Note:
System performance can suffer if the username employed to access the RDBMS data source hasSELECT permission to more tables than are used by Integration Services
For security and administration, define access:
● Create specific RDBMS user IDs for users who create OLAP models.
● Create views of data and provide users who create OLAP models with access to the viewsrather than the original tables.
● Set conditions so that users access only a subset of the view. See the documentation for yourRDBMS or data warehouse.
Note:
When you connect to the source database, Integration Server provides read-only access toit, regardless of the access provided by the source database user ID.
Deciding Which Tables Are Available to OLAP Model Creators 31

Note:
When configuring ODBC data for Teradata, always use the UseXViews option.
Selecting Tables for the Fact TableA fact table is a logical container for the relational tables defining the data values (measures) foreach dimension intersection in an OLAP model. In SAP BW data warehouses, measures are keyfigures and facts are key figure values; dimensions are characteristics. (See “SAP BW DataWarehouses” on page 6.)
The type of Essbase database you create determines which source tables to include in the facttable. See “Defining User Needs” on page 20.
Note:
If you configure ODBC data sources for Teradata, invoke the UserXViews option.
When selecting source tables for the fact table, consider data distribution in tables and how thedata relates to dimensions in the Essbase database.
Select tables containing measure data that Essbase users want to see. For example, if the sourcedatabase contains ORDERS and ORDERDETAILS tables, include both tables.
Table 13 ORDERS and ORDERDETAILS Tables for the Fact Table
Orders ORDERID TRANSDATE SHIPID EMPTYID
Order Details ORDERID PRODID NUMUNITS UTPRICE
Select tables that represent dimensions (data categories) on which users want to analyze data.For example, if users need to analyze product sales by time and sales channel, select tablescontaining key columns for these dimensions.
You may improve performance by creating aggregate data in tables instead of in views. See“Creating Views, Tables, and User-Defined Tables” on page 22. See “Deciding to Create StagingAreas” on page 21.
If the Essbase users need to only aggregate data, then include tables or views of aggregated data.You can add more detail as you build the OLAP model.
Note:
If your data source is a relational database, you can improve performance by setting up primaryand foreign keys, and joining the tables that form the fact table. See “Adding Columns to Tables”on page 28.
32 Preparing Data Sources

Selecting Tables for DimensionsA dimension is a data category. Typical dimensions are Product, Geography, and Time. In SAPBW data warehouses, the components analogous to multidimensional dimensions arecharacteristics, and dimension denotes a group of related characteristics. See “SAP BW DataWarehouses” on page 6.
A dimension table is a logical container within an OLAP model. A dimension table includes oneor more relational tables defining a potential Essbase dimension. A dimension table can join toother dimension tables, forming a dimension branch.
The data needed for analysis in Essbase applications determines which source tables used tocreate dimensions. See “Defining User Needs” on page 20. When selecting source tables fordimensions, select tables that include the maximum amount of information about the datacategory (dimension).
Creating Aliases for Dimensions and MembersAn alias often provides an easily identifiable label, such as a product name or product description,for columns in relational data sources. For example, the 200-20 member could have the aliasRoot Beer.
Note:
In SAP BW data warehouses, an alias is the text for a characteristic.
You can create nine alias tables (including the Default alias table) for a given metaoutline tostore nine aliases for dimensions, members, attribute dimensions, attribute members, and user-defined members.
If the source data contains information you need to create aliases in an Essbase outline, includethe relevant data as columns in the associated OLAP model. Then, when you create ametaoutline, you can retrieve alias information from columns of the OLAP model.
One column of source data can be used to create multiple aliases. Multiple columns of sourcedata can be used to create a single alias.
If alias information for a single alias is in multiple columns, complete one of these procedures:
● In the source database, create a view or table to concatenate (and, if necessary, transform)alias information into a single column. Creating a view or table is preferred if aliasinformation is stored in three or more columns.
● In the OLAP model, concatenate (and, if necessary, transform) columns containing aliasinformation. See the Integration Services Console online help.
● In the OLAP model, use the pass-through feature to run a procedure that uses relationallogic to retrieve alias information from the columns you specify. If a field in one column isempty, the procedure tells the source database to retrieve alias information for that fieldfrom a different column.
Deciding Which Tables Are Available to OLAP Model Creators 33

For information on pass-through transformations, see Integration Services Console online help.
Creating Time and Accounts DimensionsIn an OLAP model, you can create time and accounts dimensions that relate directly to theEssbase outline. The time dimension table contains date-related columns from the relational datasource. The accounts dimension table contains measures columns that duplicate columns in thefact table.
Note:
In SAP BW data warehouses, multidimensional dimensions are characteristics, and dimensiondenotes a group of related characteristics. See “SAP BW Data Warehouses” on page 6.
Preparing Data for Time AnalysisIf your business requires time-related analysis, include a time dimension in the Essbase outline.A time dimension includes members for the time periods that you report on; for example,months.
To support a time dimension, the data source should include:
● One or more time-related columns associated with measure data.
● One or more tables containing user-defined calendars. A user-defined calendar maps thetime-related column in the fact table to a specific business calendar.
Associating Time Data with Measure DataFor Integration Server to map data that you are measuring to specific time periods, the sourcedata for the fact table must contain one or more time-related columns.
Working with Summary DataIf the measures columns in the source data contain summary data, the time-related column mustindicate the time period for which the data is summarized. For example, assume that theSALESINVACT table contains measures columns SALES and COGS; a date-related column,TRANSDATE; and STATE and PRODCODE columns that categorize by sales date, state, andproduct code.
Table 14 TBC_MD Data in the SALESINVACT Table
STATE PRODCODE TRANSDATE SALES COGS ...
IL 100-10-C001-S0002-P001 Jan 4
2000
12:00AM
672.00 217.00
34 Preparing Data Sources

STATE PRODCODE TRANSDATE SALES COGS ...
IL 100-10-C001-S0002-P001 Feb 4
2000
12:00AM
241.00 70.00
IL 100-10-C001-S0002-P001 Mar 3
2000
12:00AM
287.00 84.00
IL 100-10-C001-S0002-P001 Apr 7
2000
12:00AM
295.00 85.00
IL 100-10-C001-S0002-P001 May 3
2000
12:00AM
702.00 207.00
Each row in the SALESINVACT table summarizes product sales and costs for a particular datefor customers from a particular state. A row can also summarize data by other periods; forexample, by week.
Formatting DatesIntegration Server supports three data types: string, numeric, and datetime. The data type of thesource data column containing time-related data does not matter. For example, the date can bea timestamp in a column with a datetime data type, or it can be keyed data in a numeric column(for example, 09232000 or 20000923). A string column can contain dates with or withoutseparating characters such as slashes or periods (for example, 09/23/2000 or 23.09.2000 or09232000). Portions of the date can be included in the source data as separate string or numericcolumns.
The values in time-related columns must map to the time periods you want in the timedimension. If dates are stored as datetime data types and you want quarterly totals, IntegrationServer can determine the quarter. If dates are stored in numeric or string columns and you wantquarterly totals, you must have an explicit column containing the associated quarter for the datathat you want to consolidate.
Working with Data in Similar Time PeriodsIn certain applications, such as general ledger and legacy systems, tables may be organized sothat columns identify similar time periods. For example, a single row may include all monthsof a year. In this case, each subsequent row includes a measure category as a data value; forexample, a specific account number.
Creating Time and Accounts Dimensions 35

Table 15 Columns Defining Time Periods
PRODCODE STATE ACCOUNT JAN FEB MAR ...
100-10-C001-S002-P001 AZ Sales 672.00 241.00 287.00
100-10-C001-S002-P001 AZ COGS 403.00 132.00 177.00
100-10-C001-S002-P001 CA Sales 401.00 143.00 378.00
100-10-C001-S002-P001 CA COGS 260.00 101.00 226.00
To create a dimension of the type time, Integration Server requires that all time identifiers be inone column and that accounts identifiers be in separate columns, as shown in Table 16. If datais stored with each month as an individual column, as shown in Table 15, restructure the data.Individual months should be data values in a MONTH column, and the measures categories,such as SALES, should be separate columns.
Table 16 Time Periods Stored as Data Values
PRODCODE STATE MONTH SALES COGS
100-10-C001-S002-P001 AZ 1 672.00 403.00
100-10-C001-S002-P001 AZ 2 241.00 132.00
100-10-C001-S002-P001 AZ 3 287.00 177.00
100-10-C001-S002-P001 CA 1 401.00 260.00
100-10-C001-S002-P001 CA 2 143.00 101.00
100-10-C001-S002-P001 CA 3 378.00 226.00
100-10-C001-S002-P001 AZ 1 672.00 403.00
You can write a program to convert the data to a table that uses the appropriate format or usethe source database to transpose the columns (see “Transposing Columns and Rows” on page25).
Accounts Dimensions and SAP BWWhen you import an SAP BW model to create an OLAP model, Analytic Integration Connectorfor SAP BW examines the InfoObject you selected for accounts information. The accountsinformation is collected and presented in the OLAP model as one coherent accounts dimensioncontaining entities reflecting the structure of the SAP BW database.
If the SAP BW data source does not contain accounts elements, Analytic Integration Connectorfor SAP BW cannot create an accounts dimension.
36 Preparing Data Sources

It is neither advised nor recommended to edit an accounts dimension. Contact HyperionTechnical Support.
Note:
You cannot enable the accounts dimension or its members for Hybrid Analysis.
Time Dimensions and SAP BWIn SAP BW data sources, time entities are generally stored as separate dimensions. When youimport an SAP BW model to create an OLAP model, Analytic Integration Connector for SAPBW examines the InfoObject for time information. Various SAP BW time dimensions arecollected and presented in the OLAP model as one coherent time dimension.
If the SAP BW data source does not contain time elements, Analytic Integration Connector forSAP BW cannot create an accounts dimension.
It is neither advised nor recommended to create or edit a time dimension. Contact HyperionTechnical Support.
Slowly Changing Dimensions in SAP BWSome metadata and data can be very stable over long periods then experience a change instructure; for example, Seattle is in the Northwest Region for several years before being movedto the Pacific Coast Region. In SAP BW data warehouses, this is a slowly changing dimension.
SAP BW contains a key date, sometimes referred to as the active date range, but this key date isnot supported in Integration Services. Therefore, when you access data from a slowly changingdimension in SAP BW, you always see the latest value.
Attribute-Enabled Columns in SAP BWWhen you import an SAP BW model to create an OLAP model, Hyperion® System™ 9 BI+™Analytic Integration Connector for SAP BW™ examines the InfoObject for attributeinformation and marks appropriate columns as attributes.
To view the columns in the OLAP model, right-click a dimension table name in the OLAP modeland select Properties and then select the Columns tab. Columns marked as attribute-enabledcontain a “Y” in the Attribute column.
Consolidation PropertiesThe following table defines the values for consolidation properties Integration Servicesrecognizes when loading these properties from database columns.
Creating Time and Accounts Dimensions 37
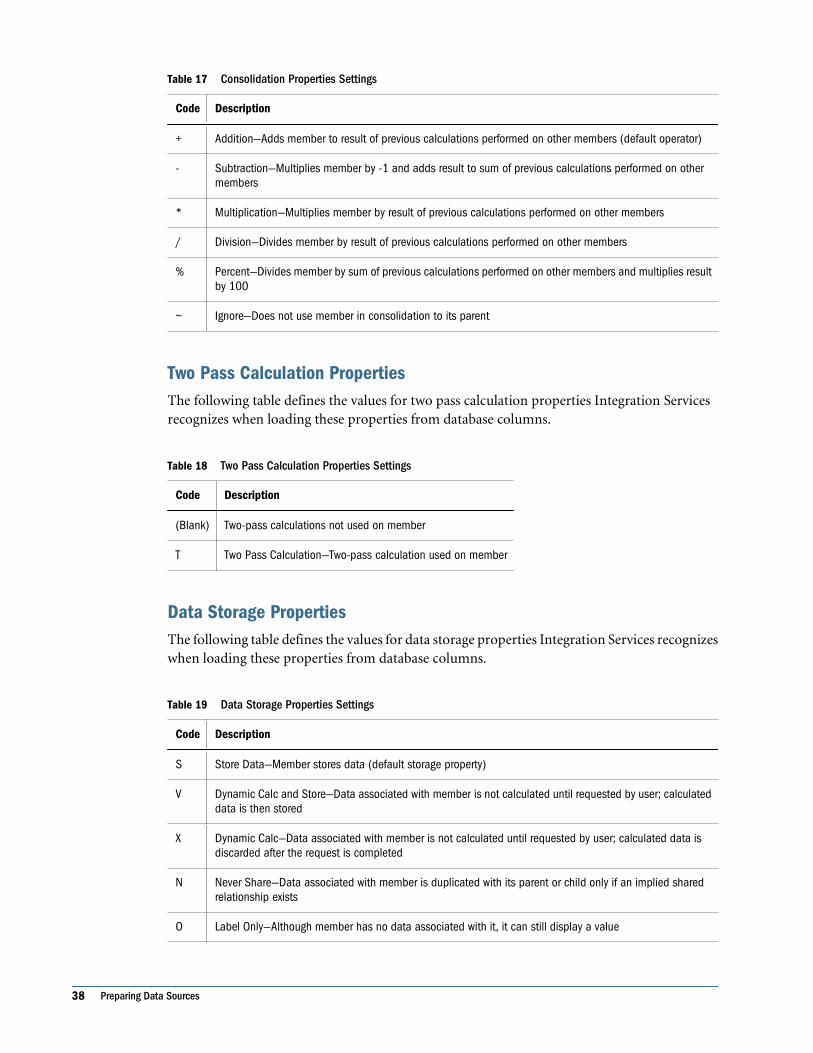
Table 17 Consolidation Properties Settings
Code Description
+ Addition—Adds member to result of previous calculations performed on other members (default operator)
- Subtraction—Multiplies member by -1 and adds result to sum of previous calculations performed on othermembers
* Multiplication—Multiplies member by result of previous calculations performed on other members
/ Division—Divides member by result of previous calculations performed on other members
% Percent—Divides member by sum of previous calculations performed on other members and multiplies resultby 100
~ Ignore—Does not use member in consolidation to its parent
Two Pass Calculation PropertiesThe following table defines the values for two pass calculation properties Integration Servicesrecognizes when loading these properties from database columns.
Table 18 Two Pass Calculation Properties Settings
Code Description
(Blank) Two-pass calculations not used on member
T Two Pass Calculation—Two-pass calculation used on member
Data Storage PropertiesThe following table defines the values for data storage properties Integration Services recognizeswhen loading these properties from database columns.
Table 19 Data Storage Properties Settings
Code Description
S Store Data—Member stores data (default storage property)
V Dynamic Calc and Store—Data associated with member is not calculated until requested by user; calculateddata is then stored
X Dynamic Calc—Data associated with member is not calculated until requested by user; calculated data isdiscarded after the request is completed
N Never Share—Data associated with member is duplicated with its parent or child only if an implied sharedrelationship exists
O Label Only—Although member has no data associated with it, it can still display a value
38 Preparing Data Sources

Time Balance PropertiesThe following table defines the values for time balance properties Integration Services recognizeswhen loading these properties from database columns.
Table 20 Time Balance Properties Settings
Code Description
(Blank) None—If time balance is set as none, Essbase rolls up parents in time dimension in standard method: valueof parent is based on formulas and consolidation properties of children (default setting)
F First—Set time balance as first to have parent value represent value of first member in branch (often atbeginning of time period)
L Last—Set time balance as last to have parent value represent value of last member in branch (often at endof time period)
A Average—Set time balance as average to have parent value represent average of children values
Skip PropertiesThe following table defines the values for skip properties Integration Services recognizes whenloading these properties from database columns.
Table 21 Skip Properties Settings
Code Description
(Blank) None—Does not skip data when calculating parent value (default setting). If Oracle's Hyperion® Essbase®– System 9 encounters #MISSING data when calculating an average, it does not divide by total number ofmembers; it divides by number of members with actual values. Therefore, setting the skip property to noneor #MISSING does not affect average but does affect first and last.
M Missing—Skips #MISSING data when calculating parent value
Z Zeros—Skips data equaling zero when calculating parent value
B Both Missing and Zeros—Skips both #MISSING data and data equaling zero when calculating the parentvalue
Variance Reporting PropertiesThe following table defines the values for variance reporting properties Integration Servicesrecognizes when loading these properties from database columns.
Table 22 Variance Reporting Properties Settings
Code Description
Non Expense—For non-expense items, such as sales, actual expenses should be higher than budgetedexpenses. When actual expenses are less than budget, variance is negative. The @VAR function calculatesACTUAL - BUDGET. For example, if budgeted sales are $100 and actual sales are $110, the variance is 10.By default, members are non-expense.
Creating Time and Accounts Dimensions 39
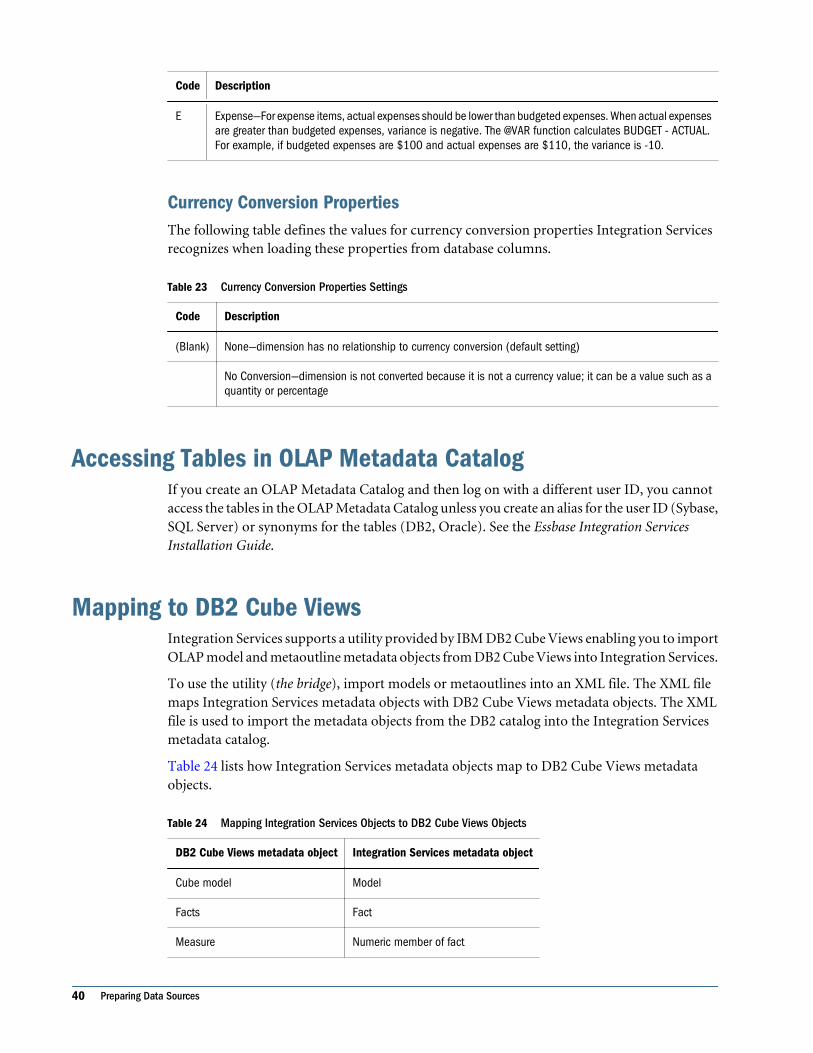
Code Description
E Expense—For expense items, actual expenses should be lower than budgeted expenses. When actual expensesare greater than budgeted expenses, variance is negative. The @VAR function calculates BUDGET - ACTUAL.For example, if budgeted expenses are $100 and actual expenses are $110, the variance is -10.
Currency Conversion PropertiesThe following table defines the values for currency conversion properties Integration Servicesrecognizes when loading these properties from database columns.
Table 23 Currency Conversion Properties Settings
Code Description
(Blank) None—dimension has no relationship to currency conversion (default setting)
No Conversion—dimension is not converted because it is not a currency value; it can be a value such as aquantity or percentage
Accessing Tables in OLAP Metadata CatalogIf you create an OLAP Metadata Catalog and then log on with a different user ID, you cannotaccess the tables in the OLAP Metadata Catalog unless you create an alias for the user ID (Sybase,SQL Server) or synonyms for the tables (DB2, Oracle). See the Essbase Integration ServicesInstallation Guide.
Mapping to DB2 Cube ViewsIntegration Services supports a utility provided by IBM DB2 Cube Views enabling you to importOLAP model and metaoutline metadata objects from DB2 Cube Views into Integration Services.
To use the utility (the bridge), import models or metaoutlines into an XML file. The XML filemaps Integration Services metadata objects with DB2 Cube Views metadata objects. The XMLfile is used to import the metadata objects from the DB2 catalog into the Integration Servicesmetadata catalog.
Table 24 lists how Integration Services metadata objects map to DB2 Cube Views metadataobjects.
Table 24 Mapping Integration Services Objects to DB2 Cube Views Objects
DB2 Cube Views metadata object Integration Services metadata object
Cube model Model
Facts Fact
Measure Numeric member of fact
40 Preparing Data Sources

DB2 Cube Views metadata object Integration Services metadata object
Dimension Dimension
Attribute Dimension view member
Hierarchy Hierarchy
Join Join (logical and physical)
Cube Metaoutline
Cube dimension Non-accounts dimension
Cube facts Accounts dimension
Cube hierarchy Metaoutline dimension hierarchy
Text Files as Data SourcesIn Oracle's Essbase® Integration Services, you can use text files (flat files) as data sources, butnote these conditions:
● Open Database Connectivity (ODBC) drivers cannot extract month names from date fieldsin text files, for example, “January” cannot be extracted from “01/30/04.” During a memberload, you can apply a transformation so that the numerical value is converted into the nameof the month.
● If the data source consists of several text files that resemble or consist of tables, the importingof data will be much like that of importing relational data. If the data source is one large,contiguous text file with several different columns, it is likely that you will need to “cleanse”your data beforehand (see “Cleansing Data” on page 22). Or you may drop some tablesmultiple times to represent dimensions. You may also need to define your joins explicitlyfor optimal performance (see “Joining Tables” on page 28.
Text Files as Data Sources 41

42 Preparing Data Sources

Index
Aaccessing tables in OLAP Metadata Catalog, 40accounts dimension
sample hierarchy, 26use in Essbase outline, 34
adding columns to tables, 28aggregation
choosing level of, 20defined, 8
aliasesconcatenating, 33creating for dimension or member names, 33multiple aliases, using, 33pass-through transformations and, 33recursive tables and, 24
Bbalanced hierarchies, 14, 15batch processing, Integration Services Shell, 11bitmapped indexes, defined, 29
Ccharacteristic values, 6characteristics, 6cleansing data, 22columns
adding to tables, 28availability, aliases, 33fully-defined in recursive tables, 24indexes, 30supporting member and measure properties, 28time-related, defining in source data, 34transposing with rows, 25
concatenation and aliases, 33Console. See Integration Services Consoleconsolidation
defined, 8
drill down and, 8example, 8members, 6
consolidation properties, 37creating
Essbase databases, workflow, 11hierarchies, 24indexes, 29
currency conversion properties, 40customer comparisons, 5
Ddata
cleansing, 22combining multiple sources, 21denormalizing, 27drill down, 8ensuring consistency, 22pivoting to change view, 8preparing for time analysis, 34source preparation, 19transforming in data source, 30types of, 20
data sourcesbuild levels, 24defining, 20parent-child, 24spreadsheet files, 8SQL, 8text files, 8workflow for transferring, 11
data storage properties, 38data types and cleansing, 22data values. See measuresdata warehouse, diagram, 22data warehouses
source of data, 8
A B C D E F G H I J K L M N O P R S T U V W
Index 43

terminology, 6databases. See data sourcesdates, formatting in source data, 35DB2, tables displayed in, 31denormalizing data, 27deploying hierachies, 16deploying hierarchies, 16detail data
choosing level of, 20retrieving, 8
dimension branches, defined, 33dimension names, creating aliases for, 33dimension tables
defined, 12, 33OLAP models, 12
dimensionschoosing, 20choosing tables for, 33compared with characteristics, 6creating in a metaoutline, 12defined, 6, 11, 13, 19, 33examples, 6frequency of change, 6members, 6SAP BW, 20Scenario, 12use in consolidation, 6using in metaoutlines, 12
drill down, 8drill up, 8drill-through report members, 14drill-through reports, 14duplicate members, 17
EEssbase
accounts dimension, 34databases, workflow, 11designing a database for user needs, 20Essbase Server, defined, 5hierarchies, creating, 24members, compared to metaoutline member levels,
13users, 8
Essbase Integration Server. See Integration ServerEssbase Integration Services. See Integration Services
Essbase Integration Services Shell. See IntegrationServices Shell
Essbase Server, defined, 5Essbase Server, overview of, 8
Ffact table
choosing tables for, 32compared with dimensions, 20defined, 12, 32measures and, 32role in OLAP model, 12SAP BW, 12
facts, defined, 11, 19filters, 30flat files
as a data source, 20, 41combining with SQL data sources, 21
forecasting, 8fully defined columns, defined, 24
Ggeneral ledger data, 35
Hhierarchies
balanced, 14, 15building from recursive tables, 24consolidation and, 6creating, 24data sources for building to a specific level, 24deploying, 16ragged, 15recursive, 16standard, 16types, 14unbalanced, 15using, 14
Hyperion Connect, 6Hyperion Essbase. See EssbaseHyperion Integration Server. See Integration ServerHyperion Integration Server Desktop. See Integration
Services Console
A B C D E F G H I J K L M N O P R S T U V W
44 Index

Iindenting, 6indexes
SAP BW, 29working with, 29, 30
indexes, working with, 29, 30Integration Server, defined, 10Integration Services
about, 9data warehouse, 21defined, 5Integration Services Console, defined, 10Integration Services Shell, defined, 11OLAP Metadata Catalog, defined, 11product family, 10, 11workflow, 9, 11
Integration Services Console, defined, 10Integration Services Shell
batch processing, 11defined, 11
integrity constraints, cleansing data, 22intersections, defined, 6
Jjoins
joining tables in your RDBMS, 28reducing through denormalization, 27unions, removing, 25
Kkey figures, 6keys, columns, transformations and, 31
Llegacy data, preparing, 35levels, data sources for building, 24logical model, description, 11
Mmeasure filters. See filtersmeasures
bitmapped indexes and, 30compared with key figures, 6data, associating with time periods, 34defined, 13, 20
fact table and, 32SAP BW, 13, 20using with columns, 28
member filters. See filtersmember levels, defined, 13member names, creating aliases, 33members
compared with characteristic values, 6consolidation, 6defined, 6dimensions, 6examples, 6OLAP models, 6using with columns, 28
metadataaccessing OLAP Metadata Catalog, 40defined, 10
metadata repository. See OLAP Metadata Catalogmetadata, OLAP Metadata Catalog storage, 10metaoutlines
advantages of, 12components, 13creating dimensions, 12
models. See OLAP modelsmultidimensional databases
defined, 6uses, 8workflow, 9, 11
multiple alias tables, using, 33
Nnormalized data, denormalizing, 27numeric data, indexes and, 30
OOLAP Builder. See metaoutlinesOLAP Catalog. See OLAP Metadata CatalogOLAP Command Interface. See Integration Services
ShellOLAP Integration Server. See Integration ServerOLAP Metadata Catalog
accessing tables, 40configuring for ODBC, 11defined, 10, 11
OLAP metaoutline. See metaoutlinesOLAP models
A B C D E F G H I J K L M N O P R S T U V W
Index 45

choosing which tables are displayed, 31components, 11creating, 10defined, 12dimension tables, 12dimensions, 6fact table, 12graphic illustration, 12members, 6uses, 5
OLAP Server. See Essbase ServerOnline Analytical Processing (OLAP), defined, 5
Pparent-child data source, 24pass-through transformations, aliases and, 33performance
bitmapped indexes and, 29increasing through denormalization, 27
permissions, required in the SQL data source, 31perspective, changing data on a spreadsheet, 8pivoting, using to change data view, 8privileges. See permissionsproduct code, example, 31product comparisons, 5properties
consolidation, 37currency conversion, 40data storage, 38skip, 39time balance, 39two pass calculation, 38variance reporting, 39
push down operations with SAP BW, 29
Rragged hierarchies, 15read-only access, SQL data sources and, 31recursive hierarchies, 16recursive tables
aliases and, 24creating Essbase hierarchies from recursive tables,
24defined, 24defining for alias or UDAs, 24fully-defined columns for, 24
rules for, 24redundant data, denormalizing, 27relational databases. See data sourcesrepository. See OLAP Metadata Catalogroll-ups, defined, 8rows, transposing with columns, 25
Ssample, hierarchy, accounts dimension, 26SAP BW
aliases, 33data source, 21dimensions, 20fact table, 12, 32indexes, 29Integration Server, 10measures, 13, 20performing tasks, restrictions, 19push down operations, 29staging area, 21star schema, 19support of Integration Services, 6tables, 28, 33terminology, 6transforming data, 30
scenarios, 8security
SQL data sources, 31views and, 22
SELECTpermission, 31statements, combining, 25
skip properties, 39snapshot, staging area, 21source data
denormalizing, 27transforming, 30
sources. See data sourcesspreadsheet files, data sources, 8SQL data sources
combining, 21combining flat files, 21consolidating multiple, 21read-only access to, 31required permission for, 31security, 31staging area, 21
A B C D E F G H I J K L M N O P R S T U V W
46 Index

SQL Drill-Through. See drill-through reportsstaging area
advantages of, 21deciding whether to create, 21defined, 21diagram, 22
standard hierarchies, 16star schemas. See OLAP modelsstrategic planning, 8summary source data, associating with time periods,
34
Ttables
accessing tables in OLAP Metadata Catalog, 40choosing which tables are displayed in OLAP
models, 31creating to denormalize data, 27deciding whether to create new tables, 22denormalizing, 27joining, 28reasons to create, 23recursive
aliases and, 24defined, 24fully-defined columns for, 24rules for, 24UDAs or aliases, 24
SAP BW optimizing, 28text file as a data source, 8, 41time
analysis, preparing data for, 34associating with measures data, 34time-related columns, defining in source data, 34
time balance properties, 39time dimension
defined, 34use in Essbase outline, 34
transformationsdefining in SQL data sources, 30example in data source, 31indexes and, 30key columns and, 31
transposing columns and rows, 25trends, 5two pass calculation properties, 38
UUDAs, creating in recursive tables, 24unbalanced hierarchies, 15unions, removing, 25user needs, defining, 20user privileges. See permissionsuser-defined dimensions, defined, 12user-defined tables, 22users, Essbase, 8
Vvalues. See measuresvariables, defined, 20variance reporting properties, 39views
deciding whether to create new views, 22reasons to create, 23
Wwhat if scenarios, example, 8WHERE clause. See filtersworkflow
Integration Services, 9Integration Services product family, 11
A B C D E F G H I J K L M N O P R S T U V W
Index 47

A B C D E F G H I J K L M N O P R S T U V W
48 Index