Embed Size (px)
Citation preview

University of South CarolinaScholar Commons
Theses and Dissertations
1-1-2013
Essays On Food Banks: Operational Issues and theRole of Supply Chain IntegrationCigdem AtasevenUniversity of South Carolina - Columbia
Follow this and additional works at: https://scholarcommons.sc.edu/etd
This Open Access Dissertation is brought to you by Scholar Commons. It has been accepted for inclusion in Theses and Dissertations by an authorizedadministrator of Scholar Commons. For more information, please contact [email protected].
Recommended CitationAtaseven, C.(2013). Essays On Food Banks: Operational Issues and the Role of Supply Chain Integration. (Doctoral dissertation).Retrieved from https://scholarcommons.sc.edu/etd/2420

i
ESSAYS ON FOOD BANKS: OPERATIONAL ISSUES AND THE ROLE OF
SUPPLY CHAIN INTEGRATION
by
Çiğdem Ataseven
Bachelor of Science
Bilkent University, 2003
Master of Science
Bilkent University, 2006
Submitted in Partial Fulfillment of the Requirements
For the Degree of Doctor of Philosophy in
Business Administration
Darla Moore School of Business
University of South Carolina
2013
Accepted by:
Anand Nair, Dissertation Co-chair
Mark Ferguson, Dissertation Co-chair
Kathleen Whitcomb, Committee Member
Yasemin Kor, Committee Member
Lacy Ford, Vice Provost and Dean of Graduate Studies

ii
© Copyright by Çiğdem Ataseven, 2013
All Rights Reserved

iii
DEDICATION
To my parents, Havva and Ismet, for their unconditional love and support,
and to my sister, Esin, whose memory will live with us forever...

iv
ACKNOWLEDGEMENTS
This dissertation would not have been possible without the help and guidance of
my advisors, Anand Nair and Mark Ferguson. I would like to express my sincerest
gratitude to Anand for having confidence in me, and guiding me in every step along the
way. I know how he values mentoring a PhD student, and he sure did justice to it in my
case. Mark was there whenever I needed his help throughout the dissertation process. He
has always been kind, understanding and supportive. I would like to thank Kathy
Whitcomb and Yasemin Kor for accepting to be my dissertation committee members.
Their valuable comments and criticisms improved the manuscript.
The donation and the trips made to food banks for this research were supported by
Darla Moore School Research Grant. I would like to take this opportunity to thank the
Dean's Office and the Department of Management Science for being sensitive to
sustainability and non-profit business research. Julia Witherspoon and Scott Ranges
deserve to be acknowledged here as well. They have been excellent resources who know
all the answers to my never-ending administrative questions. I also would like to thank
Harvest Hope Food Bank, especially Chris Daly, for helping me understand how the
operations are run in a food bank environment and develop the research model.
I owe more than words can say to my dear friends and extended family members
who genuinely cared about me throughout this process, and cheered for me to cross the
finish line of this race called the PhD program. They know who they are. I always keep
them near and dear to my heart. Distances do not matter.

v
ABSTRACT
Food banks are humanitarian aid organizations that collect, organize, and deliver
food to the communities in need. In pursuit of achieving their social goal of alleviating
hunger, food banks work with other non-profit member agencies such as soup kitchens,
food pantries and shelters. Matching supply of funds and donated food with demand in
this context is subject to unique challenges, which remain unaddressed in operations and
supply chain literature. This dissertation presents three essays to gain deeper insights into
critical operational and supply chain issues influencing the performance of food banks,
and the impact of supply chain integration on food bank performance. To conduct an in-
depth examination of supply chain integration in food banks, the first essay undertakes an
extensive review and a meta-analytic investigation of the literature focusing on supply
chain integration. The essay aids in discerning the association of integration practices
with performance and in identifying potential moderating variables. The second essay
utilizes secondary data merged with primary data to test a model covering key activities
of food banks. Specifically, the model focuses on how food distributed is influenced by
an integrated effort encompassing fundraising activities, public support, basic programs
run, and supply chain integration. The results of the model illuminate the importance of
supply chain integration for enhancing food bank performance. Utilizing the insights
gained from the meta-analytic study and the second essay, the third essay employs survey
data collected from food banks, and examines the antecedents of food bank supply chain
integration and its performance implications.

vi
TABLE OF CONTENTS
DEDICATION ................................................................................................................... iii
ACKNOWLEDGEMENTS .............................................................................................. iv
ABSTRACT ........................................................................................................................v
LIST OF TABLES .......................................................................................................... viii
LIST OF FIGURES ............................................................................................................x
CHAPTER 1 INTRODUCTION ........................................................................................1
CHAPTER 2 A META-ANALYTIC INVESTIGATION OF THE RELATIONSHIP
BETWEEN SUPPLY CHAIN INTEGRATION AND PERFORMANCE ...........6
2.1 INTRODUCTION .............................................................................................6
2.2 LITERATURE REVIEW AND HYPOTHESIS DEVELOPMENT .................9
2.3 META ANALYSIS OF CORRELATIONS ....................................................16
2.4 RESULTS ........................................................................................................29
2.5 DISCUSSION AND IMPLICATIONS ...........................................................37
2.6 CONCLUSIONS AND FUTURE RESEARCH DIRECTIONS .....................42
CHAPTER 3 AN EMPIRICAL EXAMINATION OF THE IMPACT OF
ORGANIZATIONAL AND SUPPLY CHAIN PRACTICES OF FOOD BANKS
ON FOOD DELIVERY PERFORMANCE ..........................................................46
3.1 INTRODUCTION AND MOTIVATION .......................................................46
3.2 MODEL, HYPOTHESES AND THEORETICAL FRAMEWORK ..............49
3.3 RESEARCH DESIGN .....................................................................................57
3.4 RESULTS AND IMPLICATIONS .................................................................65

vii
3.5 DISCUSSION AND LIMITATIONS..............................................................68
CHAPTER 4 ANTECEDENTS AND PERFORMANCE IMPLICATIONS OF SUPPLY
CHAIN INTEGRATION IN FOOD BANKS: A SURVEY-BASED
INVESTIGATION OF THE ROLE OF INTELLECTUAL CAPITAL................71
4.1 INTRODUCTION ...........................................................................................71
4.2 MODEL, HYPOTHESES AND THEORETICAL FRAMEWORK...............74
4.3 DATA AND METHODOLOGY .....................................................................84
4.4 RESULTS AND IMPLICATIONS .................................................................93
4.5 DISCUSSION AND LIMITATIONS..............................................................97
CHAPTER 5 CONTRIBUTIONS, CONCLUSIONS AND LIMITATIONS .................100
REFERENCES ................................................................................................................107
APPENDIX A - SUMMARY OF THE ARTICLES USED FOR META-ANALYSIS 118
APPENDIX B - MEASUREMENT ITEMS ..................................................................126
APPENDIX C - SURVEY COVER LETTER ...............................................................129

viii
LIST OF TABLES
Table 2.1 Complete data sample ........................................................................................22
Table 2.2 Relationship between supply chain integration and financial performance ......23
Table 2.3 Relationship between supply chain integration and operational performance ..24
Table 2.4 Relationship between supply chain integration and cost performance .............25
Table 2.5 Relationship between supply chain integration and quality performance .........26
Table 2.6 Relationship between supply chain integration and delivery performance .......27
Table 2.7 Relationship between supply chain integration and flexibility performance ...28
Table 2.8 Stage I meta-analysis results ..............................................................................31
Table 2.9 Overall results of the meta-analysis of correlations...........................................33
Table 2.10 Summary of hypotheses testing results ...........................................................36
Table 2.11 Impact analysis of individual supply chain integration dimensions on
performance outcomes .......................................................................................................39
Table 3.1 VIF values of the variables ................................................................................62
Table 3.2 Descriptive statistics ..........................................................................................63
Table 3.3 Variable definitions ............................................................................................64
Table 3.4 Seemingly unrelated regression results..............................................................67
Table 4.1 Standardized CFA path loadings for Intellectual Capital constructs .................89
Table 4.2 Standardized CFA path loadings for Supply Chain Integration constructs .......90
Table 4.3 Reliability results for the constructs ..................................................................92
Table 4.4 Seemingly unrelated regression results..............................................................94
ix
Table A.1 Summary of the articles used for meta-analysis .............................................118
Table B.1 Measurement items .........................................................................................126

x
LIST OF FIGURES
Figure 3.1 Conceptual Model for Essay 2 .........................................................................57
Figure 3.2 Seemingly Unrelated Regression Model - Results ...........................................66
Figure 4.1 Conceptual Model for Essay 3 .........................................................................84
Figure 4.2 Seemingly Unrelated Regression Model - Results ...........................................93

1
CHAPTER 1
INTRODUCTION
Food banks are not-for-profit organizations that collect, organize, and deliver food
to non-profit member agencies – such as soup kitchens, food pantries and shelters - and
also to individuals to help remedy the society's hunger problem. The network of food
banks is quite complex considering private sector food industries, individual donors and
governmental offices provide support in the form of money and food on the supply side;
while member agencies including food pantries, soup kitchens, shelters and individuals
deliver support on the demand side. Moreover, performance of food banks is measured
on the basis of the amount of food distributed to the communities in need, which is quite
different than the performance measures of a commercial organization.
Food banks act as centers for the redistribution of donated and surplus food that
would otherwise be wasted. Over the past few decades, the food banking industry has
become a remedy factor for the growing poverty, hunger and wasted food problems, by
being the link that matches the supply with the demand of food. Therefore, these
organizations are also important entities in decreasing waste, and they hold a place in the
reverse logistics and sustainability realm of operations. This issue requires attention,
since improving operations in this area has many stakeholders, such as companies that are

2
willing to donate food, the communities in need, and the policy makers that are searching
for better ways to increase the welfare of people.
While food banking is relatively new in some parts of the world, it has grown and
progressed more in the United States, Canada and Europe (Riches, 2002). The first food
bank in the US was established in 1967 in Phoenix, Arizona, with the aim of matching
the food industry’s dilemma on how to handle surplus food, and the charity organizations
whose goal was to provide resources to communities in need (Riches, 2002). The idea
then grew over time to the other states, as well as countries such as Canada and UK. Over
time, umbrella organizations (e.g. Feeding America, Global Foodbanking Network) have
been established and food banks have become institutionalized. The food banks started to
engage in partnerships with corporations that donate large amounts of food. Governments
also support food bank organizations, not only in terms of grants, but also with policies
such as the 1976 Tax Reform Act, which permitted corporate tax deductions of cost plus
50% of any appreciated value of the donated food (Daponte and Bade, 2006). This policy
in particular, and similar policies to follow provided incentives to donors and supported
the industry. The agencies that the food banks work with are in the downstream of food
banking supply chains, and they do a considerable amount of distribution to hungry, in
addition to the direct distribution that the food banks handle themselves.
The foodbanking context is interesting due to the complex structure it is
embedded in. It has its own challenges and idiosyncrasies. While there are similarities
with the for-profit supply chains, the way food banks operate and the resource constraints
they have make it worthwhile to study their operations, understand the unique
environment and provide solutions to the issues they encounter. The benefits are

3
obviously major and useful for the people that do not have access to enough food as well
as the businesses that emphasize the triple bottom line (people, planet and profits), since
the surplus resources are distributed accordingly to protect the people and the planet, over
and above the profit goals of companies.
Seamless integration of the processes along the supply chain, from the suppliers
to the customers, is considered to be a competitive edge for companies (Frohlich and
Westbrook, 2001). The degree to which the organizations are integrated either upstream
with the suppliers, or downstream with the customers varies across the companies. The
level of integration was named "arc of integration" by Frohlich and Westbrook (2001)
and has become an important issue to be considered in the operations management
literature. In general, the broader the arc of integration an organization has, the more
successful it will become. However, there are certain contingencies that call for
integration more than others (Wong et al., 2011). The value of exchanging information
and collaborating on activities has proven useful in various for-profit industries.
However, supply chain integration has not been studied in non-profits extensively. In
particular, the food banking industry, where the uncertainty of incoming food and
demand complicate the processes, requires a timely and accurate flow of information in
order to run seamlessly. This dissertation mainly aims to shed light on the dynamics of
collaboration in this environment. Moreover, this study focuses on the antecedents of
supply chain integration in this not-for-profit context.
First, an exploratory case study was conducted in order to understand the
important processes that take place in food banks. The discussions with the Chief
Operating Officer (COO) of a local food bank revealed the importance of management

4
style, human resources and strategic direction, as well as the food distribution structure
for delivering aid to communities in need for a food bank. The COO emphasized human
resources and upper management vision as the most critical factors in determining the
way the food banks operate.
The interviews also indicated that the supply side of the operations consisted of
food, friends and funds. The amount of food varies greatly from food bank to food bank,
and is collected through local donations, donations through Feeding America
relationships, and federal and state partnerships, and is purchased out of need by using
the funds available. Friends are basically the volunteer workforce and the champions of
the cause. Funds, which are essential for purchasing food as well as equipment, fuel, and
utilities, are generated via fundraising activities. The amount of return on fundraising
expenses varies to a great extent. Internally, the funds collected go into the programs run
by the food banks, facilities, and vehicles. The supply of money determines the number
and size of the programs that a food bank runs as well as the size and capacity of
buildings, the amount and quality of vehicles and industrial handling equipment. On the
demand side, there are clients that are served either directly or through agency partners.
This dissertation will present three essays to gain deeper insights into critical
operational and supply chain issues that influence the performance of food banks. To
conduct an in-depth examination of supply chain integration in food banks, the first essay
undertakes an extensive review and a meta-analytic investigation of the literature
focusing on supply chain integration. The essay aids in discerning the association of
integration practices with performance and in identifying potential moderating variables.
The second essay utilizes secondary data merged with survey data to test a model

5
covering key activities of food banks. Specifically, the model focuses on how food
distributed per food insecure individual in the service area of the food bank is influenced
by an integrated effort encompassing fundraising activities, public support, supply chain
integration and basic programs. The results of the model illuminate the importance of
supply chain integration for enhancing food bank performance. Utilizing the insights
gained from the meta-analytic study and the second essay, the third essay employs
primary data collected from food bank executives, and examines the link between key
organizational variables as antecedents of integration, food bank supply chain integration
practices, and performance.
A distinguishing characteristic of this dissertation lies in the use of multiple
methodologies to examine the supply chain integration concept in food banks, in order to
have a deeper understanding of the phenomenon from different angles. The dissertation
contains five chapters. In Chapter 2, we present Essay 1, which is the meta-analytic
investigation to gain insights about the supply chain integration literature and detail the
main tenets and contingency factors in this area. Chapter 3 contains Essay 2, which is a
general look at the food bank operations spanning from the generation of support to the
delivery of the food. In Chapter 4, we discuss the survey essay, which aims to test a
model regarding the antecedents of supply chain integration in food banks. Finally, we
conclude and state the contributions of the dissertation in Chapter 5.

6
CHAPTER 2
A META-ANALYTIC INVESTIGATION OF THE RELATIONSHIP BETWEEN
SUPPLY CHAIN INTEGRATION PRACTICES AND PERFORMANCE
2.1 INTRODUCTION
The topic of supply chain integration has received a lot of attention in operations
and supply chain management literature for more than a decade. To advance theory
development, it is important to critically examine the empirical findings in various
studies published on a stream in the literature. In particular, this paper undertakes a meta-
analytic investigation of the relationships between supply chain integration practices and
various performance dimensions. The study contributes to literature in two important
ways. First, it provides an in-depth review of the literature that examines the association
between supply chain integration and performance. Second, meta-analytic methodology
is used to formally analyze the correlations found in the empirical papers published in
this area to disentangle the practice-performance relationships after accounting for
various attenuation factors. The findings of the meta-analytic investigation provide
further insights into the relationship between supply chain integration practices and
performance. The essay discusses theoretical and managerial implications of the meta-
analytic findings and offers several directions for extending supply chain integration

7
research, particularly for investigating this issue in the non-profit business context in this
dissertation.
Supply chain integration is one of the prominent research streams in operations
and supply chain management literature. Since mid-1990s, several research studies have
examined the strategic aspect of supply chain management and empirically investigated
the relationships between different supply chain integration practices and various
performance measures (Ragatz et al., 1997; Frohlich and Westbrook, 2001; Stank et al.,
2001; Dröge et al., 2004; Lee, 2004; Swink et al., 2005; Cousins and Menguc, 2006;
Vereecke and Muylle, 2006; Devraj et al., 2007; Schoenherr and Swink, 2012). Supply
chain integration practices manifest in terms of integration of internal operations within a
firm, as well as external integration with customers and suppliers. In general, internal and
external integration of operations have been emphasized to be a key competitive
differentiator by several studies (Ragatz et al., 1997; Frohlich and Westbrook, 2001; Lee,
2004). The practices that are required to foster integration among supply chain partners
mainly concentrate on information sharing and collaboration in the design of processes
and products, joint decision-making, and coordination. These practices help align the
interests of all firms within the value chain and aid in improving overall supply chain
performance instead of maximizing only internal efficiencies of individual firms (Lee,
2004).
Notwithstanding the importance of supply chain integration practices, in previous
studies the underlying constructs have been conceptualized and analyzed from different
perspectives. Further, internal integration practices within a firm as well as external
integration initiatives across firms along the supply chain have been shown to exert

8
different and varying levels of impact on various performance dimensions. For instance,
Schoenherr and Swink (2012) find distinct associations of supply chain integration
practices with operational and financial performance. Cousins and Menguc (2006) show
that supply chain integration positively impacts the supplier’s communication
performance, however, it does not influence the supplier’s operational performance.
Devaraj et al. (2007) report that supplier integration has a positive impact on
performance, but customer integration does not have a significant impact on
performance.
In this paper, we focus on the relationship between key dimensions of integration
(internal and external) and multiple aspects of performance (operational and financial) to
synthesize the existing findings and contribute to theory development in the area of
supply chain integration. Meta-analysis of correlations technique is employed to gain
deeper insights into the observed relationships. The meta-analytic procedure helps answer
the following questions:
1) Which supply chain integration practices are positively correlated with the firm’s
financial performance?
2) Which supply chain integration practices are positively correlated with various
dimensions of the firm’s operational performance?
3) Are the relationships between supply chain integration practices and various
performance measures influenced by potential moderators?
The existence of numerous studies in this area, especially due to the increasing
level of interest among scholars since early 2000, enables an in-depth examination of the
relationships through formal statistical tests that are part of the meta-analysis technique

9
(Damanpour, 1991; Nair, 2006; Mackelprang and Nair, 2010). Meta-analytic
investigation facilitates closer examination of research findings and presents further
insights regarding those relationships that are generalizable after accounting for
attenuation factors. These insights provide opportunities for future research
investigations.
The rest of the essay is organized as follows. The next section provides a review
of the supply chain integration literature. Section 3 explains the meta-analysis technique
and describes the procedures employed in this study. The results of the analyses are
presented in Section 4, which is followed by Section 5, which discusses the findings and
presents research implications. In Section 6 we conclude and offer directions for future
research.
2.2 LITERATURE REVIEW AND HYPOTHESIS DEVELOPMENT
Supply chain management literature includes several different but interrelated
definitions of supply chain integration (Pagell, 2004). Fabbe-Costes and Jahre (2008)
claim that the lack of a clear and single formal definition of supply chain integration
makes it difficult to prescribe practical solutions regarding what to integrate and the costs
and benefits of integration practices. Likewise, a collective understanding of supply
chain integration will help in theory building and consensus in supply chain management
literature. While there are discussions that emphasize the importance of bringing the
supply chain integration literature together (Fabbe-Costes and Jahre, 2008), a systematic
meta-analytic study to unravel the key insights gained thus far is missing.

10
Several research articles have undertaken an empirical investigation of supply
chain integration in the extant literature (Frohlich and Westbrook, 2001; Koufteros et al.,
2005; Swink et al., 2007; Schoenherr and Swink, 2012). The integration dimensions
examined include internal integration within an organization, external integration with
customers, and external integration with suppliers. Internal integration is defined as “the
cross-functional intra-firm collaboration and information sharing activities that occur via
interconnected and synchronized processes and systems” (Schoenherr and Swink, 2012;
p.100). Accordingly, internal integration measures relate to collaboration between various
functions of an organization, such as operations, logistics, marketing and sales, to
accomplish supply chain objectives. Customer integration represents “… close
collaboration and information sharing activities with key customers that provide the firm
with strategic insights into market expectations and opportunities, ultimately enabling a
more efficient and effective response to customer needs” (Schoenherr and Swink, 2012;
p.100). It addresses the demand side collaboration / coordination endeavors of a firm.
Supplier integration refers to “coordination and information sharing activities with key
suppliers that provide the firm with insights into suppliers’ processes, capabilities and
constraints, ultimately enabling more effective planning and forecasting, product and
process design, and transaction management” (Schoenherr and Swink, 2012; p.100). In
essence, it helps a firm to tightly integrate the supply base with internal operations and
external demand.
Chen et al. (2009) posits that integration is a broad term that spans different
tangible and intangible elements of organizations’ operations, both internally and
externally, to develop efficiencies in their supply chains. Integration enables firms to

11
attain a competitive edge by streamlining business processes and by coordinating
activities with business partners. Since there are materials, goods and information flows
in a typical supply chain, integration requires the coordination of the downstream and
upstream flow of materials and information within the supply chain (Frohlich and
Westbrook, 2001). The degree of integration, either upstream with suppliers and/or
downstream with customers, differs considerably among firms resulting in differential
extended capabilities and performance. The importance of having a broad arc of
integration that spans both upstream and downstream along the supply chain has been
proposed in literature (Frochlich and Westbrook, 2001). In the absence of such broad-
based integration, firms witness inefficiencies and glitches, such as the bullwhip effect
(Lee et al., 1997; Metters, 1997), which adversely impacts performance.
On a general level, internal integration focuses on intra-organizational aspects,
whereas external integration measures gauge the breadth and depth of relationships that
firms maintain with their upstream and downstream business partners. While there are
nuances in the conceptualizations of the supply chain integration and performance
measures in the literature, the scales used to gauge these concepts typically include items
focusing on the extent to which firms’ operations are seamlessly coordinated internally
and are synchronized with their partners. Supplier integration and customer integration
are the main elements of external integration (e.g. Frohlich and Westbrook, 2001;
Devaraj et al., 2007; Flynn et al., 2010). A review of literature indicates that terms such
as supply chain coordination (Jayaram et al., 2011) and supply chain collaboration
(Sanders and Premus, 2005; Vereecke and Muylle, 2006) have also been used to

12
represent the set of practices that are commonly considered in the operationalization of
the supply chain integration construct.
The association between supply chain integration practices and performance has
been an area of active research investigation. Firm level financial performance
dimensions that have been considered in supply chain integration studies include such
measures as growth of sales, return on investment, profit margin on sales, and overall
business performance (Cao and Zhang, 2011; Frohlich and Westbrook, 2002; Flynn et al.
2010; Swink et al. 2007). Several studies in the area employ operational performance as a
single scale (Flynn et al., 2010; Cousins and Menguc, 2006; Stank et al., 2001; Gimenez
and Ventura, 2005), while others include various operational performance dimensions
separately, such as cost, quality, flexibility, delivery, productivity, time to market and
efficiency (Wong et al., 2011; Schoenherr and Swink, 2012; Vereecke and Muylle, 2006;
Swink et al. 2007; Tracey, 2004; Saeed et al., 2005). Both financial performance and
operational performance measures are hypothesized to be positively associated with
supply chain integration practices. There is empirical evidence that supports these
hypothesized relationships in the literature (Koufteros et al., 2010; Flynn et al., 2010;
Wong et al., 2011). However, there are also papers that have mixed findings regarding
the relationships between various dimensions of supply chain integration and
performance (Devaraj et al., 2007; Vereecke and Muylle, 2006).
Along with the studies that focus on the direct effect of supply chain integration
practices on performance, various studies have also investigated the moderation and
mediation effects of certain variables on the relationships between supply chain
integration practices and performance. For instance, Wong et al. (2011) have found that

13
environmental uncertainty has a significant moderation effect on the relationships
between supply chain integration and operational performance. Interim outcomes such as
collaborative advantage (Cao and Zhang, 2011), knowledge sharing, and process
coupling with channel partners (Saraf et al., 2007) have also been emphasized in the
literature, investigating the relationship between supply chain integration practices and
performance. Some studies have also examined whether internal integration acts as a
moderator for the relationships between external integration and performance rather than
modeling a direct link between internal integration and various operational measures
(Schoenherr and Swink, 2012). Furthermore, studies that model a correlational link
between internal and external integration constructs also exist in the previous works in
the area (Stank et al., 2001; Gimenez and Ventura, 2005).
The role played by various factors that act as key antecedents to supply chain
integration have also been considered in the extant literature. For instance, information
sharing and information systems related practices have been a part of broader
investigation of supply chain integration (Saraf et al., 2007; Sanders and Premus, 2005).
Product modularity has also been considered as an antecedent for integration (Dröge et
al., 2004; Danese and Filippini, 2010; Howard and Squire, 2007; Jacobs et al. 2007)
given that modular designs require sharing of information and specific assets between
supply chain partners as a result of exchangeability of parts and standardization
requirements in production (Howard and Squire, 2007). Similarly, relationship
characteristics with the supply chain partners (such as trust, commitment,
interdependency, length of relationship and guanxi relationship), and organizational
characteristics (such as top management support, cultural similarity and goal

14
compatibility) have been also considered as precursors of supply chain integration (Lee et
al., 2010; Vijayasarathy, 2010; Chen et al., 2010).
Overall, an examination of literature reveals various integration-performance
configurations that are tested in the supply chain integration literature. In this meta-
analytic study, we focus on the generally accepted relationships between supply chain
integration practices (internal integration, supplier integration and customer integration)
and performance dimensions (firm business performance and operational performance).
We test the following hypotheses that investigate the presence of direct associations as
well as moderating effects in the supply chain integration – performance relationship at
an aggregate level.
H1. Supply chain integration practices at an aggregate level encompassing supplier,
customer and internal integration practices are positively correlated with aggregate
performance.
H2. The correlation between aggregate supply chain integration practices and
aggregate performance is influenced by moderating factors.
In addition, we also examine the association of individual supply chain integration
practices on aggregate performance as well as business and operational dimensions of
performance. Specifically, we test the following hypotheses:
H3. Customer integration practices are positively correlated with (a) aggregate
performance, (b) business performance, and (c) operational performance.
H4. Supplier integration practices are positively correlated with (a) aggregate
performance, (b) business performance, and (c) operational performance.
H5. Internal integration practices are positively correlated with (a) aggregate
performance, (b) business performance, and (c) operational performance.

15
H6. The correlations of customer integration practices with (a) aggregate performance,
(b) business performance, and (c) operational performance dimensions are influenced by
moderating factors.
H7. The correlations of supplier integration practices with (a) aggregate performance,
(b) business performance, and (c) operational performance dimensions are influenced by
moderating factors.
H8. The correlations of supplier integration practices with (a) aggregate performance,
(b) business performance, and (c) operational performance dimensions are influenced by
moderating factors.
Finally, the study examines the association of individual supply chain integration
practices on cost, quality, delivery, and flexibility dimensions of operational
performance. Organizations engage in supply chain integration practices to gain
advantages in terms of efficient and effective processes. Supply chain integration enables
cost reduction, improved quality, reliable delivery and flexibility in production (Vargas et
al., 2000; Swink et al., 2007; Wong et al., 2011; Prajogo et al., 2012; Schoenherr and
Swink, 2012). Accordingly,
H9. Customer integration practices are positively correlated with (a) cost performance,
(b) quality performance, (c) delivery performance and (c) flexibility performance.
H10. Supplier integration practices are positively correlated with (a) cost performance,
(b) quality performance, (c) delivery performance and (c) flexibility performance.
H11. Internal integration practices are positively correlated with (a) cost performance,
(b) quality performance, (c) delivery performance and (c) flexibility performance.
H12. The correlations of customer integration practices with (a) cost performance, (b)
quality performance, (c) delivery performance and (c) flexibility performance dimensions
are influenced by moderating factors.
H13. The correlations of supplier integration practices with (a) cost performance, (b)
quality performance, (c) delivery performance and (c) flexibility performance dimensions
are influenced by moderating factors.
H14. The correlations of internal integration practices with (a) cost performance, (b)
quality performance, (c) delivery performance and (c) flexibility performance dimensions
are influenced by moderating factors.

16
Overall, the examination of these hypotheses will allow us to systematically
accumulate the findings of studies that examine supply chain integration and performance
relationships, weigh them based on the reliabilities of constructs and sample sizes, and to
reach empirical generalizations. Specifically, the meta-analytic technique allows the
examination of the overall association of supply chain integration practices and
performance as well as the identification of the significance between sub-dimensions of
supply chain integration practices and various performance measures. Moreover, the
existence of moderating factors on the supply chain integration practices and
performance, on both aggregate and individual level associations, can be tested using this
methodology. The following section describes the meta-analytic technique used in this
study to examine these relationships.
2.3 META ANALYSIS OF CORRELATIONS
Meta-analysis of correlations is a technique that is used to analyze the existing
body of literature and develop theory (Hunter and Schmidt, 1990; 2004). This
methodology considers the distribution of correlations of independent and dependent
variable pairs within a specific domain. There is a certain amount of variation caused by
sampling errors and transcriptional errors, as well as by the particular research methods
used for research investigation. These types of variations, alternatively referred to as
‘artifacts,’ need to be accounted for so that the actual relationships between the variables
of interest can be correctly identified. Meta-analytic methodology controls for the
artifacts that could be a function of sample size, mean and spread of the variables, as well
as the reliability of the scales (Hunter and Schmidt, 2004). By means of meta-analytic

17
procedures, we can analyze the data on replicated correlations from multiple studies that
investigate the same fundamental relationships. The sampling error can then be reduced,
as the relationships are based on a larger sample by bringing multiple studies together to
analyze the relationships between the same independent-dependent variable pairs (Hunter
and Schmidt, 2004). In a typical published empirical study, only significant results of
correlational analyses are interpreted and discussed, and the non-significant correlations
are considered to be statistically not different than zero. In contrast, since meta-analytic
technique aims to discern the basic correlation between variables of interest, it considers
inclusion of all correlations reported in the extant literature, irrespective of their
significance levels (Hunter and Schmidt, 2004).
Construct operationalization and inter-construct correlations
There are various scales used in the supply chain integration literature. These
measures mostly include multi-item, multi-dimensional manifests, and there are certain
variations between their conceptualizations across studies. Despite these differences, as
long as the main hypothesized relationships between independent and dependent
variables are the same, meta-analysis methodology allows these distinct
conceptualizations to be used for analyzing the broad concept (Hunter and Schmidt,
2004). This idea referred to as multiple operationalism (Webb et al., 1981) suggests that
the same concept can be gauged by multiple measures that have some imperfections and
irrelevancies to them. Nevertheless, at a higher level of abstraction, the core idea remains
the same. If the latent construct can be measured with these multiple realizations and can
still reveal associational patterns between variables, the uncertainties regarding the

18
relationships are greatly reduced. Therefore, it is actually desirable to aggregate various
measurement efforts to develop theory by using meta-analysis.
In this study we focus on three main dimensions of supply chain integration that
can be found in the literature. These three dimensions - supplier integration, customer
integration, and internal integration - are generally operationalized as multi-item
measures (Frohlich and Westbrook, 2001; Koufteros et al., 2005; Swink et al., 2007). The
vertical (external) connections that aim at coordinating forward and backward flow of
materials, services, information and money across the supply chain are called supplier
and customer integration. The integration efforts with the external parties have strategic
long-term orientation, which distinguishes them from arm’s length relationships that
include limited levels of coordination and information exchange with shorter time focus
(Swink et al., 2007). Sharing of operational plans, mutually providing access to
information systems, customization for partners’ operations (such as packaging and
containers) and joint planning of task forces are examples of external integration
initiatives (Frohlich and Westbrook, 2001; Chen and Paulraj, 2004). On the other hand,
the horizontal (internal) coordination emphasizes the inter-functional linkages that are
strategically strengthened within the organization to fulfill customer requirements and to
efficiently interact with suppliers (Flynn et al., 2010). In order to achieve seamless
operational activities, internal integration emphasizes cross-functional teams, openness,
teamwork, routine meetings of various departments, and use of enterprise resource
planning (ERP) systems (Pagell, 2004; Braunscheidel and Suresh, 2009). In all types of
integration, the main goal is to create operational processes that cannot be easily imitated
by competitors (Frohlich and Westbrook, 2001).

19
Various measures of performance are used in empirical studies on supply chain
integration. While some of the studies focus only on financial performance (Cao and
Zhang, 2011; Narasimhan and Kim, 2002), others examine the impact of integration on
operational performance by explicitly considering various facets such as cost, quality,
delivery and flexibility separately (Vargas et al., 2000; Swink et al., 2007; Wong et al.,
2011; Prajogo et al., 2012; Schoenherr and Swink, 2012), or as a composite single scale
(Cousins and Menguc, 2006; Devaraj et al. 2007). Given the state of literature on supply
chain integration, we focus on aggregate performance, business performance, and
operational performance. We also examine the association of supply chain integration
practices with individual operational measures of cost, quality, delivery and flexibility.
Sample
An academic literature database search was conducted to obtain the sample for
this study. Search terms “supply chain integration” and “integration” were used to
identify published articles to be included in the study. Specifically, the empirical papers
on supply chain integration that appeared in the following journals were included in the
current meta-analytic investigation: Journal of Operations Management, Production and
Operations Management, Decision Sciences Journal, Management Science,
Manufacturing and Service Operations Management, International Journal of
Production Research, International Journal of Operations and Production Management,
International Journal of Production Economics, Journal of Business Logistics, Journal of
Supply Chain Management, International Journal of Logistics Management,
International Journal of Physical Distribution and Logistics Management, Management

20
Information Sciences Quarterly, Information Systems Research and Journal of
Management Information Systems.
In the initial search, 103 papers were identified. However, since some of these
papers have a different conceptualization of integration as compared to external and
internal integration, they were left out from further consideration. For instance, Koufteros
et al. (2007) conceptualize integration as black-box and grey-box integration, where the
level and form of supplier involvement in product development change is considered.
Also, there are some other types of integration that appear in the literature such as
purchasing integration (Narasimhan and Das, 2001) or logistics integration (Stock et al.,
2000), that mainly investigate the coordination idea within specific functions of the
organization. In addition, some papers that employed the same dataset for different
research questions and models were not included in the final sample in order to avoid
duplication. Hence, after a careful examination of the articles, the ones that use survey
methodology and specifically include supply chain integration – performance
relationships were identified for meta-analytical investigation. We obtained information
from twenty articles by following the described process. Next, we sent e-mail requests to
authors of fourteen survey-based research studies that have consistent conceptualization
of the supply chain integration construct, but in which some of the required information
needed for meta-analysis was not reported in the published article. Relevant information
for four additional studies was collected following this step. When construct level
correlations were not available in the papers, the correlations at the item level were
averaged to substitute for the unavailable information. Overall, 24 articles were employed
in the subsequent analyses. The sample size is consistent with the sample sizes of other

21
meta-analytic studies in operations management (Gerwin and Barrowman, 2002; Nair,
2006; Mackelprang and Nair, 2010). A detailed description of the studies used in this
research is provided in Appendix A.
Meta-analytic method
The meta-analytic procedures used in this study follow the step prescribed in
Hunter and Schmidt (1990; 2004), which has been adopted by other meta-analytic
examinations in the operations management area (Gerwin and Barrowman, 2002; Nair,
2006; Mackelprang and Nair, 2010). The details of the two stages of meta-analytic
procedures and the heuristics for interpretation of the results are presented in the
following subsections.
As an initial step, the correlations between supply chain integration and
performance were examined at an aggregate level to formally test for the positive effects
that have received extensive support in the literature. Aggregate supply chain integration
is a cumulative set of all supply chain integration dimensions, and aggregate performance
captures composite performance outcomes. The data used in this first stage is presented
in Table 2.1.
In the second stage, the correlations and moderating effects of individual supply
chain integration practices and various performance dimensions were examined. Meta-
analyses were conducted for the relevant subsets of studies to examine how much of the
residual variance consists of sampling error as against capturing the actual variance. The
details of the data associated with the second stage of the analysis are presented in Tables
2.2 - 2.7.

22
Table 2.1 Complete data sample
Study
Sample
Size SCI Reliability
Performance
Reliability
SCI-Performance Sample
Correlation
Wong et al. (2011) 151 0.803 0.823 0.376
Schoenherr and Swink (2012) 403 0.840 0.793 0.262
Vereecke and Muylle (2006) 374 0.570 0.685 0.146
Swink et al. (2005) 57 0.850 0.730 0.410
Swink et al. (2007) 224 0.827 0.763 0.198
Jayaram et al. (2011) 197 0.690 0.805 0.167
Dröge et al. (2004) 57 0.633 0.875 0.166
Danese and Filippini (2010) 186 0.763 0.777 0.192
Stank et al. (2001) 306 0.810 0.820 0.380
Tracey (2004) 180 0.780 0.880 0.173
Devaraj et al. (2007) 120 0.790 0.890 0.174
Flynn et al. (2010) 617 0.920 0.900 0.332
Frohlich and Westbrook (2002) 485 0.845 0.830 0.445
Cousins and Menguc (2006) 142 0.810 0.850 0.430
Lawson et al. (2009) 111 0.820 0.920 0.540
Lee et al. (2010) 271 0.913 0.879 0.224
Handfield et al. (2009) 151 0.760 0.840 0.465
Sanders and Premus (2005) 245 0.790 0.762 0.307
Saeed et al. (2005) 38 0.720 0.880 0.310
Saraf et al. (2007) 63 0.847 0.910 0.251
Villena et al. (2009) 133 0.700 0.720 0.220
Gimenez and Ventura (2005) 64 0.951 0.912 0.373
Chiang et al. (2012) 144 0.538 0.670 0.195
Cao and Zhang (2011) 211 0.910 0.920 0.670
22

23
Table 2.2 Relationship between supply chain integration and financial performance
Study
Corrected correlation
(r')
Sample size
(N)
Attenuation factor
(A)
SCI-Performance
correlation (r)
Study weight
(W)
Supplier
Integration
Flynn et al. (2010) 0.234 617 0.940 0.22 545.181
Swink et al. (2007) 0.373 224 0.785 0.293 137.894
Dröge et al. (2004) 0.195 57 0.771 0.15 33.880
Saraf et al. (2007) 0.315 63 0.903 0.285 51.425
Customer
Integration
Flynn et al. (2010) 0.272 617 0.920 0.250 521.982
Swink et al. (2007) -0.022 224 0.785 -0.017 137.894
Saraf et al. (2007) 0.255 63 0.852 0.217 45.692
Internal
Integration
Flynn et al. (2010) 0.376 617 0.930 0.35 533.582
Swink et al. (2007) 0.400 224 0.785 0.314 137.894
Swink et al. (2005) 0.677 57 0.782 0.53 34.884
Tracey (2004) 0.250 180 0.819 0.205 120.744
23

24
Table 2.3 Relationship between supply chain integration and operational performance
Study
Corrected
correlation (r')
Sample size
(N)
Attenuation factor
(A)
SCI-Performance
correlation (r)
Study weight
(W)
Supplier Integration
Cousins and Menguc
(2006) 0.518 142 0.830 0.430 97.767
Devaraj et al. (2007) 0.469 120 0.844 0.396 85.440
Flynn et al. (2010) 0.345 617 0.899 0.310 498.783
Frohlich and
Westbrook (2002) 0.518 485 0.869 0.450 366.321
Villena et al. (2009) 0.310 133 0.710 0.220 67.032
Lawson et al. (2009) 0.622 111 0.869 0.540 83.738
Lee et al. (2010) 0.250 271 0.896 0.224 217.485
Handfield et al. (2009) 0.638 151 0.799 0.510 96.398
Sanders and Premus
(2005) 0.464 245 0.801 0.372 157.193
Gimenez and Ventura
(2005) 0.451 64 0.938 0.423 56.325
Customer Integration
Devaraj et al. (2007) -0.059 120 0.833 -0.049 83.304
Flynn et al. (2010) 0.523 617 0.880 0.460 477.558
Frohlich and
Westbrook (2002) 0.547 485 0.805 0.440 313.989
Internal Integration
Flynn et al. (2010) 0.450 617 0.889 0.400 488.170
Saeed et al. (2005) 0.389 38 0.796 0.310 24.077
Handfield et al. (2009) 0.526 151 0.799 0.420 96.398
Sanders and Premus
(2005) 0.321 245 0.750 0.241 137.777
Gimenez and Ventura
(2005) 0.348 64 0.924 0.322 54.691
Chiang et al. (2011) 0.325 144 0.600 0.195 51.906
24

25
Table 2.4 Relationship between supply chain integration and cost performance
Study
Corrected correlation
(r')
Sample size
(N)
Attenuation factor
(A)
SCI-Performance correlation
(r)
Study weight
(W)
Supplier
Integration
Wong et al. (2011) 0.479 151 0.815 0.390 100.204
Schoenherr and
Swink (2012) 0.367 403 0.788 0.289 250.062
Vereecke and
Muylle (2006) 0.111 374 0.558 0.062 116.351
Customer
Integration
Wong et al. (2011) 0.424 151 0.815 0.345 100.204
Schoenherr and
Swink (2012) 0.453 403 0.769 0.348 238.294
Vereecke and
Muylle (2006) 0.284 374 0.620 0.176 143.728
Internal
Integration
Wong et al. (2011) 0.408 151 0.835 0.341 105.277
Schoenherr and
Swink (2012) 0.413 403 0.792 0.327 253.003
Swink et al. (2005) 0.498 57 0.804 0.400 36.822
25

26
Table 2.5 Relationship between supply chain integration and quality performance
Study
Corrected correlation
(r')
Sample size
(N)
Attenuation factor
(A)
SCI-Performance correlation
(r)
Study weight
(W)
Supplier
Integration
Swink et al. (2007) 0.169 224 0.830 0.140 154.291
Wong et al. (2011) 0.604 151 0.770 0.465 89.468
Schoenherr and
Swink (2012) 0.221 403 0.855 0.189 294.593
Jayaram et al.
(2011) 0.222 197 0.824 0.183 133.874
Vereecke and
Muylle (2006) 0.162 374 0.597 0.097 133.518
Customer
Integration
Swink et al. (2007) 0.129 224 0.799 0.103 143.002
Wong et al. (2011) 0.600 151 0.770 0.462 89.468
Schoenherr and
Swink (2012) 0.167 403 0.835 0.139 280.730
Jayaram et al.
(2011) 0.331 197 0.744 0.246 108.914
Vereecke and
Muylle (2006) 0.462 374 0.664 0.307 164.934
Internal
Integration
Swink et al. (2007) 0.232 224 0.869 0.202 169.344
Wong et al. (2011) 0.567 151 0.789 0.447 93.998
Schoenherr and
Swink (2012) 0.160 403 0.860 0.138 298.059
26

27
Table 2.6 Relationship between supply chain integration and delivery performance
Study
Corrected correlation
(r')
Sample size
(N)
Attenuation factor
(A)
SCI-Performance correlation
(r)
Study weight
(W)
Supplier
Integration
Swink et al. (2007) 0.344 224 0.825 0.284 152.454
Wong et al. (2011) 0.496 151 0.843 0.418 107.361
Schoenherr and
Swink (2012) 0.283 403 0.835 0.236 280.891
Dröge et al. (2004) 0.253 57 0.716 0.181 29.262
Vereecke and
Muylle (2006) 0.170 374 0.618 0.105 143.055
Customer
Integration
Swink et al. (2007) 0.243 224 0.794 0.193 141.299
Wong et al. (2011) 0.419 151 0.843 0.353 107.361
Schoenherr and
Swink (2012) 0.351 403 0.815 0.286 267.673
Vereecke and
Muylle (2006) 0.084 374 0.687 0.058 176.715
Internal
Integration
Swink et al. (2007) 0.308 224 0.864 0.266 167.328
Wong et al. (2011) 0.514 151 0.864 0.444 112.797
Schoenherr and
Swink (2012) 0.314 403 0.840 0.264 284.196
Danese and
Filippini (2010) 0.249 186 0.770 0.192 110.270
Stank et al. (2001) 0.466 306 0.815 0.380 203.245
Tracey (2004) 0.168 180 0.838 0.141 126.360
27

28
Table 2.7 Relationship between supply chain integration and flexibility performance
Study
Corrected correlation
(r')
Sample size
(N)
Attenuation factor
(A)
SCI-Performance correlation
(r)
Study weight
(W)
Supplier Integration
Swink et al. (2007) 0.300 224 0.684 0.205 104.698
Wong et al. (2011) 0.351 151 0.795 0.279 95.432
Schoenherr and
Swink (2012) 0.393 403 0.804 0.316 260.338
Jayaram et al. (2011) 0.187 197 0.745 0.139 109.396
Vereecke and Muylle
(2006) 0.311 374 0.589 0.183 129.703
Customer Integration
Swink et al. (2007) 0.219 224 0.658 0.144 97.037
Wong et al. (2011) 0.418 151 0.795 0.332 95.432
Schoenherr and
Swink (2012) 0.379 403 0.785 0.297 248.087
Jayaram et al. (2011) 0.149 197 0.672 0.100 89.000
Vereecke and Muylle
(2006) 0.280 374 0.655 0.183 160.222
Internal Integration
Swink et al. (2007) 0.355 224 0.716 0.254 114.912
Wong et al. (2011) 0.287 151 0.815 0.234 100.264
Schoenherr and
Swink (2012) 0.383 403 0.808 0.310 263.401
Swink et al. (2005) 0.386 57 0.777 0.300 34.400
28

29
Heuristics for interpretation of results
Two heuristics developed by Hunter and Schmidt (1990) were used to guide the
interpretation of results in this paper. The ratio of the average corrected correlations and
estimated population standard deviation, which is known as RATIO1 (RATIO1= r ' / Sρ),
is analogous to a confidence interval with the exception that it uses standard deviation of
correlations instead of using the standard error. For RATIO1, the estimates of population
variance S2
ρ are obtained by using the values of the variance of corrected sample
correlation S 2
r' and the corrected estimate of the sampling error variability S2
e:
S2
ρ =
S 2
r' -
S2
e. If RATIO1 is greater than or equal to 2, it can be concluded that the population’s
correlation is greater than zero (Hunter and Schmidt, 1990; 2004). The second heuristic,
RATIO2, presents the amount of observed variance caused by the artifacts. It is
calculated by dividing the weighted mean sampling error variance by the variance of the
corrected correlations (RATIO2 = S2
e /S 2
r';). If RATIO2 is greater than or equal to 0.75, it
means that there is only one population correlation and moderators that impact the
strength of the relationships do not exist. On the other hand, if this ratio is less than 0.75,
then it indicates the existence of moderators on the relationship between the constructs of
interest (Hunter and Schmidt, 1990; 2004).
2.4 RESULTS
In light of the heuristics presented in the previous section, initially RATIO1 was
calculated to test the relationship between aggregate supply chain integration and
aggregate performance. The information in Table 2.1 was used to calculate the necessary
statistics. The results indicate a significant positive correlation between the independent

30
and dependent constructs (RATIO1 = 3.076). Since this value is greater than the cutoff
value of 2, it can be concluded that supply chain integration and aggregate performance
are positively correlated. The nominal value for mean corrected correlation between
supply chain integration and aggregate performance is 0.38 and the credibility interval is
[0.128 , 0.632]. This result implies that, assuming that the effect size correlations have a
normal distribution, 95% of the values in the population correlation distribution are
within the credibility interval (Hunter and Schmidt, 1990; 2004). The results provide
further evidence for a positive correlation between supply chain integration and
performance, since 0 is not included in the credibility interval, thereby lending support
for H1. RATIO2 was calculated to test the existence of moderating factors on the
aggregate relationships of interest. The value of this ratio is 0.272, which indicates that
moderators do influence the strength of the relationship between aggregate supply chain
integration and performance. The result lends support for H2.
After obtaining the Stage I results, in Stage II the relationships among individual
supply chain integration dimensions and performance were examined. In particular, we
test hypotheses H3 to H8 and investigate the association of individual supply chain
integration practices on aggregate, business, and operational performance dimensions.
We also test H9 – H14 to investigate the correlations among each individual supply chain
integration practice (supplier integration, customer integration, and internal integration)
and specific operational performance dimensions (cost, quality, delivery and flexibility).
The same procedure as in the tests for the aggregate level relationships was used and the
heuristics described before were employed for interpretation. Stage I results are presented
in Table 2.8. Also, Stage II results can be found in Table 2.9.

31
Table 2.8 Stage I meta-analysis results
Sample size SCI-performance correlation Corrected correlation Error variance Study weight
Study
(N) (r) (r') (e) (W)
Wong et al. (2011) 151 0.376 0.462 0.0081 99.772
Schoenherr and Swink (2012) 403 0.262 0.321 0.0030 268.277
Vereecke and Muylle (2006) 374 0.146 0.234 0.0055 146.028
Swink et al. (2005) 50 0.410 0.520 0.0264 31.025
Swink et al. (2007) 224 0.198 0.250 0.0057 141.195
Jayaram et al. (2011) 197 0.167 0.223 0.0073 110.296
Dröge et al. (2004) 57 0.166 0.222 0.0258 31.571
Danese and Filippini (2010) 186 0.192 0.249 0.0073 110.270
Stank et al. (2001) 306 0.380 0.466 0.0040 203.245
Tracey (2004) 180 0.173 0.209 0.0065 123.552
Devaraj et al. (2007) 120 0.174 0.207 0.0096 84.372
Flynn et al. (2010) 617 0.332 0.364 0.0016 510.876
Frohlich and Westbrook (2002) 485 0.445 0.531 0.0024 340.155
Cousins and Menguc (2006) 142 0.430 0.518 0.0083 97.767
Lawson et al. (2009) 111 0.540 0.622 0.0097 83.738
Lee et al. (2010) 271 0.224 0.250 0.0037 217.485
Handfield et al. (2009) 151 0.465 0.582 0.0084 96.398
Sanders and Premus (2005) 245 0.307 0.395 0.0055 147.485
Saeed et al. (2005) 38 0.310 0.389 0.0342 24.077
Saraf et al. (2007) 63 0.251 0.286 0.0168 48.559
Villena et al. (2009) 133 0.220 0.310 0.0120 67.032
Gimenez and Ventura (2005) 64 0.373 0.400 0.0147 55.508
Chiang et al. (2012) 144 0.195 0.325 0.0155 51.906
Cao and Zhang (2011) 211 0.670 0.732 0.0046 176.649
RATIO1 = sample means/standard deviation of population correlations = 3.076; RATIO2 = error variance/variance of corrected sample correlation =
0.272
31

32
Customer integration
The value of RATIO1 for the association between customer integration and
aggregate performance is 7.671. As the value is greater than 2, we find support for H3a
and conclude that the population correlation between this integration dimension and
aggregate performance is greater than zero. However, the value of RATIO1 for the
correlation of customer integration with business performance (1.112) and operational
performance (1.393) do not lend support for H3b and H3c. The values of RATIO2 for the
association of customer integration with aggregate performance (0.445), business
performance (0.037) and operational performance (0.007) are less than the cutoff value of
0.75. This indicates that moderators influence these relationships, thereby lending support
for H6a, H6b, and H6c.
Next, the correlations between individual operational performance measures with
customer integration were evaluated. The RATIO1 values for customer integration’s
relationship with cost performance (4.928) and flexibility performance (2.945) are greater
than the cutoff value of 2, indicating positive population correlations between customer
integration and these performance dimensions. On the other hand, there is lack of
statistical evidence regarding the population correlations of customer integration with
quality (1.503) and delivery (1.921) performance. Hence, we find support for H9a and
H9d but fail to find support for H9b and H9c.
The values of RATIO2 for the customer integration’s relationships with cost
(0.205), quality (0.029), delivery (0.060), and flexibility (0.107) are below the cutoff
value of 0.75. Hence, it can be concluded that there are moderators that influence the
strength of the relationships, thereby lending support for H12.

33
Table 2.9 Overall results of the meta-analysis of correlations
SCI factors
# of
studies
Overall
sample
size
SCI-
performance
correlation
(r)
Corrected
correlation
(r')
Mean error
variance
(ē)
SD corrected
correlations
(σr') RATIO1 RATIO2
Customer Integration 7.671 0.445
Cost performance 3 928 0.296 0.396 0.002 0.090 4.928 0.205
Quality performance 5 1349 0.219 0.294 0.001 0.198 1.503 0.029
Delivery performance 4 1152 0.219 0.271 0.001 0.146 1.921 0.060
Flexibility performance 5 1349 0.228 0.309 0.001 0.111 2.945 0.107
Operational performance 3 1222 0.404 0.476 0.001 0.343 1.393 0.007
Business performance 3 904 0.196 0.213 0.001 0.195 1.112 0.037
Supplier Integration 21.603 0.875
Cost performance 3 928 0.254 0.327 0.002 0.188 1.782 0.051
Quality performance 5 1349 0.194 0.244 0.001 0.186 1.336 0.033
Delivery performance 5 1209 0.245 0.304 0.001 0.122 2.607 0.084
Flexibility performance 5 1349 0.242 0.326 0.001 0.104 3.332 0.116
Operational performance 10 2339 0.368 0.428 0.000 0.127 3.428 0.029
Business performance 4 961 0.234 0.263 0.001 0.080 3.652 0.199
Internal Integration 5.714 0.283
Cost performance 3 611 0.338 0.419 0.002 0.050 17.257 0.767
Quality performance 3 778 0.209 0.250 0.002 0.217 1.175 0.036
Delivery performance 6 1450 0.285 0.341 0.001 0.131 2.674 0.049
Flexibility performance 4 835 0.282 0.358 0.002 0.046 16.938 0.789
Operational performance 6 1259 0.357 0.422 0.001 0.081 5.639 0.142
Business performance 4 1078 0.330 0.375 0.001 0.180 2.114 0.031
33

34
Supplier integration
The values of RATIO1 for the relationship of supplier integration with aggregate
performance, business performance, and operational performance are 21.603, 3.652, and
3.428, respectively. Since the values of RATIO1 are greater than 2, the results lend
support for H4a, H4b, and H4c. The value of RATIO2 for the correlation of supplier
integration with aggregate performance is 0.875, which is greater than the cutoff value of
0.75. This result suggests that the association between supplier integration and aggregate
performance holds irrespective of the presence of moderating variables. Hence, we fail to
find support for H7a. The corresponding values for RATIO2 for the association of
supplier integration with business performance and operational performance are 0.199
and 0.029, respectively. This lends support for H7b and H7c.
The results for the association of supplier integration with individual operational
performance dimensions indicate that supplier integration is positively correlated with
delivery (RATIO1 = 2.607) and flexibility (RATIO1 = 3.332), but not with cost
(RATIO1 = 1.782) and quality performance (RATIO1 = 1.336). Hence, we fail to find
support for H10a and H10b, but hypotheses H10c and H10d are supported. The values for
RATIO2 indicate that there are moderators influencing the relationship strength between
all operational performance dimensions and supplier integration (RATIO2Cost = 0.051;
RATIO2Quality = 0.033; RATIO2Delivery = 0.084; RATIO2Flexibility = 0.116;
RATIO2Operational = 0.029; RATIO2Business = 0.199). Hence, hypotheses H13a, H13b,
H13c, and H13d are supported.

35
Internal integration
The results for the third and the final integration dimension indicated that internal
integration has a positive correlation with aggregate performance (RATIO1 = 5.714),
business performance (RATIO1 = 2.114) and operational performance (RATIO1 =
5.639), lending support for H5a, H5b, and H5c. RATIO2 values for aggregate
performance (RATIO2 = 0.283), business performance (RATIO2 = 0.031), and
operational performance (RATIO2 = 0.142) are all below 0.75. These results provide
support for hypotheses H8a, H8b, and H8c. The individual analyses of the relationships
of internal integration with various operational performance dimensions indicate that this
integration dimension has a significant positive correlation with all the individual level
operational performance dimensions except quality performance (RATIO1Cost = 17.257;
RATIO1Quality = 1.175; RATIO1Delivery = 2.674; RATIO1Flexibility = 16.938). Hence we find
support for H11a, H11c, and H11d but fail to find support for H11b.
The values obtained for RATIO2 suggest that the relationship of internal
integration with cost (RATIO2 = 0.767) and flexibility performance (RATIO2 = 0.789)
does not involve moderation effects. Hence, H14a and H14d are not supported. However,
the association of internal integration with quality (RATIO2 = 0.036) and delivery
(RATIO2 = 0.049) affirm the presence of moderators, thereby lending support for H14b
and H14c. The summary of the hypotheses testing results are presented in Table 2.10.

36
Table 2.10 Summary of hypotheses testing results
A. P. A. P.
(mod.
effects)
B. P. B. P.
(mod.
effects)
O. P. O. P.
(mod.
effects)
Cost Cost
(mod.
effects)
Qual. Qual.
(mod.
effects)
Del. Del.
(mod.
effects)
Flex. Flex.
(mod.
effects)
Aggregate
Supply Chain
Integration
H1: S H2: S
Customer
Integration
H3a:
S
H6a: S H3b: NS H6b: S H3c:
NS
H6c: S H9a: S H12a: S H9b:
NS
H12b: S H9c:
NS
H12c: S H9d: S H12d:
S
Supplier
Integration
H4a:
S
H7a:
NS
H4b: S H7b: S H4c: S H7c: S H10a:
NS
H13a: S H10b:
NS
H13b: S H10c: S H13c: S H10d:
S
H13d:
S
Internal
Integration
H5a:
S
H8a: S H5b: S H8b: S H5c: S H8c: S H11a: S H14a:
NS
H11b:
NS
H14b: S H11c: S H14c: S H11d:
S
H14d:
NS
S: Hypothesis supported
NS: Hypothesis not supported
A. P.: Aggregate Performance
B. P.: Business Performance
O. P.: Operational Performance
Cost: Cost Performance
Qual.: Quality Performance
Del.: Delivery Performance
Flex.: Flexibility Performance
Mod. Effects: Moderating Effects
36

37
2.5 DISCUSSION AND IMPLICATIONS
Overall, the results of this study provide evidence for a significant positive
association between aggregate supply chain integration and aggregate performance. This
result is consistent with the large set of studies that present similar findings (Flynn et al.,
2010; Schoenherr and Swink, 2012). Moreover, the results lend support for significant
positive correlations of aggregate performance with individual dimensions of supplier
integration, customer integration, and internal integration practices. The results indicate
that more than half of the relationships of the individual level integration dimensions and
individual performance measures have significant positive correlations. The results also
point to the importance of focusing on appropriate performance dimension(s) that is (are)
consistent with the competitive priority of an organization. It is important to improve the
identified performance dimension(s) by focusing on supply chain integration practice(s)
with which they are significantly associated. The results provide strong support for the
presence of moderating factors that influence various supply chain integration practice-
performance dimension links. In the subsequent sub-sections, we discuss the
implications of the study’s findings in further detail.
Theoretical implications
Table 2.11 presents the summary of the specific integration – performance
relationships to discern the level of impact of individual integration practices. The pattern
observed in Table 2.11 indicates that as compared to supplier integration, customer
integration does not have an impact on a large breadth of performance dimensions. In
light of the combined findings from the current set of empirical studies, this implies that

38
supplier integration would be a priority if an organization intends to integrate externally,
as it is more likely to provide the focal firm performance benefits in a broad range of
performance dimensions.
Internal integration is related to most performance dimensions. We propose that it
might be wise for the firms to integrate internally before they even make external
integration attempts. There are studies that conceptualize internal integration as a
precursor of external integration in the literature (Tracey, 2004; Braunscheidel and
Suresh, 2009). Internal attitudes and procedures need to be aligned before the inclusion of
partners in the integration efforts (Tracey, 2004). Internal integration enables the
knowledge sharing between the functions, and ultimately facilitates the coordination of
production capacity and flexibility in the system (Sawhney et al., 2006; Wong et al.,
2011). Moreover, internal integration is instrumental in improving product and process
designs with the use of cross functional teams, which help reduce costs for the
organization and provide efficiencies (Wong et al., 2011). This integration dimension
also has positive associations with logistics service performance (Germain and Iyer,
2006; Stank et al., 2001) and delivery performance (Swink et al., 2007). The lack of
support for the association of internal integration with quality performance is intriguing,
even though some studies in the extant literature have emphasized this particular
relationship with positive and significant results (Swink et al., 2007; Wong et al., 2011).
Perhaps, the time (Iyer et al., 2004; Prajogo et al., 2012) and agility (Braunscheidel and
Suresh, 2009) orientation of supply chain integration practices might be resulting in more
emphasis on performance measures such as cost, delivery and flexibility. Incidentally,
literature has even found evidence of negative association of supplier integration with

39
quality (Swink et al., 2007). It is plausible that more complex relationships, such as an
inverted U-shaped relationship, might be at work between certain integration practices
and performance measures. It would be important to examine optimal configurations for
supply chain integration to achieve superior performance (Das et al., 2006).
Table 2.11 Impact analysis of individual supply chain integration dimensions on
performance outcomes
SCI
dimension Cost Quality Delivery Flexibility Operational Business
Breadth of
impact (%
of
possible
significant
outcomes)
Depth of
impact
(average
significant
corrected
correlations)
Customer
integration X
X
33.33% 0.327
Supplier
integration X X X X 66.67% 0.315
Internal
integration X*
X X* X X 83.33% 0.361
X significant positive correlation
* not subject to moderating factors
In addition to the direct association of supply chain integration practices with
performance, the existence of moderators on several relationships is supported by the
findings of this study. These moderators can manifest as control variables or statistical
interaction effects. Control variables that are analyzed in supply chain integration
literature include firm size, production process characteristics, product seasonality,
product perishability (Chiang et al., 2012), industry sector, firm age (Villena et al., 2009),

40
and product customization level (Saeed et al., 2005). Furthermore, various
conceptualizations of moderating effects can be observed in supply chain integration
literature. For instance, internal integration has been considered as a moderator for the
relationships between external integration and performance (Schoenherr and Swink,
2012). An organization’s information system capability is shown to be a moderator
between inter-functional integration and market and supply-chain intelligence, which are
the interim outcomes that ultimately impact performance in new product development
context. Information system includes control mechanisms for data updates and access,
which enables quality assurance for shared information and enhanced supply chain
integration (Bendoly et al., 2012). The dynamism level in the environment that the firms
operate in is critical with respect to the integration and performance relationship. For
instance, product clock speed has been employed as a moderator between integration and
performance (Jayaram et al., 2011). Likewise, uncertainty is considered to be an
important moderator in the relationship between supply chain integration, and operational
and business performance dimensions (Wong et al., 2011; Boon-itt and Wong, 2011).
The findings of this study highlight the importance of more focused examination of
moderators that impact the association of supply chain integration practices and
performance.
Managerial implications
This study provides some insights for practitioners that are engaged in managing
operations within their organizations as well as in the extended supply chain. Firms
typically have limited resources, and managers need to allocate these resources prudently

41
to obtain maximum possible benefits. Supply chain integration practices require
monetary investments to set up the necessary infrastructure. This study provides some
guidance for managers to make decisions regarding integration investments with respect
to the chosen competitive priorities. The investments allocated for integration could be
targeted towards, and prioritized upon, the relevant dimensions of supply chain
integration depending on the desired performance outcomes. Internal integration should
generally precede external integration, as the processes within an organization need to be
aligned before engaging in information sharing and collaboration activities with external
supply chain partners. Managers should consider this sequence when they are making
supply chain integration decisions. As shown in Table 2.11, internal integration has the
maximum breadth of impact (83.33%) followed by supplier integration (66.67%) and
customer integration (33.33%).
Moreover, managers should be aware of the contextual differences in the
relationship between supply chain integration practices and performance. The findings of
this study lend support to certain moderating effects that might be strengthening or
weakening the relationships between supply chain integration practices and performance.
The context should be carefully analyzed and studied before making potentially
expensive and hard-to-reverse investments in integration. For instance, environmental
uncertainty stands out as a critical issue to be considered when it comes to supply chain
integration. Information processing becomes more crucial in highly uncertain
environments relative to others, and managers should be cognizant of the requirements of
the business environment they operate in when they are making supply chain integration
decisions to align the degree of coordination internally as well as externally. In essence,
42
managers should supplement their bandwagon-driven or benchmarking-driven supply
chain integration initiatives with prudent consideration of their own contextual
environments.
2.6 CONCLUSIONS AND FUTURE RESEARCH DIRECTIONS
This study provides insights into the relationships between supply chain
integration and several performance dimensions. Internal integration as well as external
integration play critical roles for organizations. Internal integration makes sure that the
functions of an organization act as parts of a coordinated whole, whereas, external
integration emphasizes the importance of implementing practices jointly with suppliers as
well as customers to build relationships that help achieve a seamless flow of goods,
materials and information in the supply chain.
The meta-analytic approach used in this study helps in gaining deeper insights
beyond the findings of individual studies, and provides a foundation for building theory
in this important research stream in the operations and supply chain management area.
While there is an overall understanding of the impact of supply chain integration on
performance, a systematic and statistical approach for analyzing these relationships was
lacking in the literature. This study was motivated by that need and we carried out the
necessary steps to provide deeper insights. The findings of this study present actionable
recommendations for managers as well as contributions to theory development in the
area.
There are few limitations of this study that are important to keep in consideration.
While an extensive analysis of the literature was conducted and a significant amount of
43
effort was put in to gather data to obtain valid and reliable findings, several inescapable
and undetectable artifacts such as deviation from perfect construct validity in the
dependent and independent variables, or reporting and transcriptional errors (Hunter and
Schmidt, 2004, p. 35) were not considered in this study. However, sampling error and
error of measurement in the dependent and independent variables were taken into account
by using construct reliabilities and assigning weights to the studies depending on sample
sizes. There are obviously many more studies that investigate supply chain integration
and performance relationships. However, some studies needed to be left out due to lack
of access to relevant information to conduct meta-analysis. Nevertheless, the sample size
used to conduct a meta-analysis of correlations in this study is representative of the
domain, and is in line with the data used in other meta-analytic investigations
(Damanpour, 1991; Gerwin and Barrowman, 2002; Nair, 2006; Mackelprang and Nair,
2010).
Our study offers several important directions for extending supply chain
integration research. Given that a large set of supply chain integration practices –
performance relationships were influenced by moderating variables, a focused
investigation of potential set of moderators would provide richness to the literature base.
Contingency and configuration approaches to integration have recently started receiving
some attention by scholars in the area (Flynn et al., 2010). Contingency approach mainly
focuses on the importance of the environment that an organization operates in, and the
alignment of the structure and processes within the organization that the firms should
attain in order to achieve high performance. This brings up the relevance of various
contexts when we consider implementation of supply chain integration practices.

44
Furthermore, configuration approach takes a broader perspective on the fit idea by
emphasizing the need to have a holistic alignment between various elements of an
organization rather than fragmented focus of contingency approach (Flynn et al., 2010).
In the supply chain integration area, there are some studies that have looked at the
moderating effects (Germain and Iyer, 2006; Devaraj et al., 2007) and the taxonomic
groups of different integration dimensions (Frohlich and Westbrook, 2001). Further
research would be useful to identify various contextual factors influencing the impact of
supply chain integration practices. Moreover, recognition of configuration typologies of
supply chain integration in fast changing environment of contemporary global supply
chains would present additional insights. Since supply chain integration practices include
information exchange, joint decision-making, and emphasis on teamwork; the
interactions mostly take place among the human actors of the organizations, and the
integration practices are closely linked with knowledge based processes. Therefore, the
level of collective skills and abilities in the form of human resources might influence the
strength of the relationships between internal and external integration with organization's
performance. This remains as an open avenue for future research in the supply chain
management area. In particular, we consider human resources related associations with
respect to supply chain integration in this dissertation.
Temporal and cumulative aspect of building capabilities using different types of
supply chain integration brings an interesting twist to the interaction and accumulated
effects of the dimensions of integration on performance. For instance, the precursor role
of internal integration as well as the moderating role of it on the relationship between
external integration and performance is discussed in the literature (Schoenherr and

45
Swink, 2012). These alternative conceptualizations need to be reconciled in future theory
building efforts in supply chain integration area. Finally, the mixed findings of this meta-
analytic study open avenues for further understanding and examination of the
relationships between integration and different operational performance measures.
Specifically, a broader conceptualization of quality performance that considers time-
sensitive nature of this performance dimension should offer insights that extend the
current findings. A more holistic conceptualization of performance measures would aid in
tightly linking practices with performance more.

46
CHAPTER 3
AN EMPIRICAL EXAMINATION OF THE IMPACT OF ORGANIZATIONAL
AND SUPPLY CHAIN PRACTICES OF FOOD BANKS ON FOOD DELIVERY
PERFORMANCE
3.1 INTRODUCTION AND MOTIVATION
Poverty is considered to be a natural slow-onset disaster (van Wassenhove, 2006)
and management of food distribution for hunger relief is an associated issue to be
managed on a continuous basis within disaster relief and humanitarian logistics area. The
natural slow-onset disaster category includes disasters that take a long time to produce
emergency conditions, such as drought or socio-economic decline, which are normally
accompanied by early warning signs. There are studies in the humanitarian logistics
literature stream that examine issues related to disaster relief operations such as vehicle
fleet management (van Wassenhove and Martinez, 2012) or stochastic optimization of
natural disaster asset prepositioning (Salmeron and Apte, 2010). These studies mainly
consider natural sudden-onset disasters (e.g hurricanes, floods, earthquakes) whereas
operational issues regarding slow-onset disasters have not been researched extensively
from the operations management point of view.
Food banks are not-for-profit organizations that collect, organize, and deliver food
to non-profit member agencies – such as soup kitchens, food pantries and shelters - and

47
individuals to remedy the hunger problem in the society. Food bank networks are
important, and are one of the most influential emergency food service delivery systems in
the United States (Warsgwsky, 2010). Food banks were originally developed as
temporary relief mechanisms to meet emergency food demand during economic
downturns of 1970s and 1980s. Several tax incentives that were put into action starting
around the 1970s, along with the consolidation of grocery industry and agricultural
business growth, enhanced the food donations and development of food banking
(Warsgwsky, 2010). Since the 1990s, food banks have grown to be permanent institutions
in food delivery systems for underserved communities (Warsgwsky, 2010).
Feeding America, formerly known as America’s Second Harvest, serves about 37
million people annually in 50 states via its large network of food banks and more than
40,000 member agencies (Feeding America, 2010) and became the largest food banking
model in US. Feeding America relies on monetary and food donations from government
agencies, food industries, institutions, and individuals. The funds are used for food bank
operations and resources. The food donated to and procured by Feeding America is
delivered to regional food banks to be stored in the warehouses until they are delivered to
the member agencies and individuals. Food banks also get donations from corporations,
individuals, and federal and state partnerships. Fundraising activities are important for
food banks, and vary from one food bank to another due to the level of donated food
supply. In turn, the level of food supply forces the food banks to generally purchase a
large percentage of their food. On the demand and distribution side, member agencies
pay a certain amount of money to their respective food banks to purchase food to be
distributed to people in need. For many working and non-working Americans, the support

48
coming from food banks has become a major mode of sustenance (Feeding America,
2012).
The network of food banks is quite complex considering private sector food
industries, individual donors as well as governmental offices that provide support in the
form of money and food on the supply side; and member agencies including food
pantries, soup kitchens and shelters, and individuals on the demand side. Food banks can
also be considered as a waste management system for the overall food industry since
much of the grown, processed and manufactured food is not consumed because of
expiration, overproduction, damage, marketing and other decisions. Billions of pounds of
food go to waste each year, while almost one billion people worldwide do not have
enough food to eat. Food banks gather surplus food that would be otherwise wasted and
deliver it to the people who need it the most (The Global FoodBanking Network, 2012).
Management of operations in the humanitarian context is quite valuable as the resources
managed by the humanitarian organizations are constrained, and they have to be well
allocated. Therefore, understanding the factors that drive high performance will help
improve the operations within this context.
Van Wassenhove (2006) emphasizes cross-learning possibilities despite the
fundamental differences between private and humanitarian sectors. There are several
practices to be learned from the private sector by humanitarian organizations – such as
the tools of SCM in private businesses – which would help humanitarian supply chains,
provided that they are carefully translated, and the complexities of humanitarian logistics
are taken into account. Moreover, private sector also could gain some insights from the

49
humanitarian aid organizations since non-profits are in a position to be agile and
adaptable, and to operate under more resource constrained environments.
In this essay, the basic operations of a food bank are analyzed by using secondary
data combined with primary data. The supply side, internal operations and demand side
are examined by means of recent operational and financial data of 71 food banks in the
U.S. The data from primary and secondary sources were merged to capture important
aspects of food bank operations as well as contextual conditions within which these food
banks operate. The aim of this essay is to gain insights as to how the basic programs of
the food banks are created in relation to the public support and revenue as a result of
fundraising efforts as well as supply chain integration, and how these dynamics impact
the amount of food distributed per food insecure individual in the service area of the food
bank organization. In the next section, we present the model and the theoretical
framework.
3.2 MODEL, HYPOTHESES AND THEORETICAL FRAMEWORK
The financial resources that are collected via fundraising efforts, along with the
supply chain management practices and capabilities of the organization, result in basic
programs, which ultimately determine the delivery performance of a food bank. The
strategic side of the operations consists of the decisions regarding the money raising
efforts and supply chain management style. The monetary resources, and the internal as
well as external integration, produce the basic programs run by the food bank. These
programs are the services that the food bank develops using the resources within the

50
organization, in addition to the customization and integration with the suppliers and the
clients that the food bank works with.
The support from corporations and individuals in the form of in-kind donations
constitute the largest portion of the income of food banks. Stakeholder theory posits that
stakeholders are people or groups that have interests in a corporation’s past, present or
future activities (Clarkson, 1995). Aside from primary stakeholders, whose continued
participation is required for the survival of an organization, such as employees, customers
and suppliers; there are secondary stakeholders that influence or affect, and likewise are
influenced or affected by the corporations’ activities even though their relation to the
corporation does not involve transactions that are essential for the survival of the
organization (Clarkson, 1995). Ethical responsibilities and philanthropic acts are
generally considered to fall into the activities that are exercised by the corporation to give
back to the communities in which they do business. The types of behavior coming from
corporations generally serve as indicators of social responsiveness. On the other hand,
food banks are in need of support to run their operations by generating funds. They
engage in certain activities to raise awareness of a social problem and increase their
visibility in the form of fundraising activities. The more a food bank is proactive in
attracting those funds by doing fundraising, the more share of support it will get from
potential donations. It is expected that the extent of support collected will be positively
associated with the efforts spent on fundraising activities. It is hypothesized that,
H1: The extent of fundraising of a food bank is positively associated with the amount of
total public support and revenue gained.

51
The support collected is allocated to develop programs to provide basic services
such as fresh produce, kids cafes, production kitchens, school pantries, senior meal
delivery and such. If a food bank operates with more resources, it can increase the scope
of operations and have more variety in the basic programs run, as the support will enable
the organization to do so. The resource-based view emphasizes that organizations are
bundles of heterogeneous resources and capabilities, which cannot be easily transferred to
other organizations. If the resources maintained in the organizations are valuable, rare,
inimitable and non-substitutable, they become a source of competitive advantage
(Barney, 1991; McWilliams et al., 2006). Therefore, non-profit organizations, just like
their for-profit counterparts, need to find sources of advantage that would attract support
and elevate their performance. Today, non-profit organizations are operating in a highly
competitive environment. There is an increasing demand for community services,
escalating competition for contracts with the public and for-profit sector, a decline in
volunteer support, and generally tighter government funding (Kong, 2007). This requires
a need for increased resources and competent strategic management in non-profit
environments (Stone et al., 1999). This starts with offering various services that are
catered towards customer needs. Homburg et al. (2000) states that service organizations
commonly introduce "product managers" into their organizational structures to make
decisions about customer segmentation, product line development, service offerings, and
standardization versus customization of the services. Moreover, this new organizational
form that is customer-focused emphasizes a better assessment of the value chain
including all downstream customers, and differentiation of the offerings on the basis of

52
this knowledge. Service ranges that the food banks have are analogous to this idea, and
increased service lines are possible with the incoming support. Hence,
H2: The amount of total public support and revenue is positively associated with the
number of basic programs run in a food bank.
The initial step to integrate the supply chain activities is the effective coordination
of each partner organization’s internal processes (Tracey, 2004). There is empirical
evidence in the literature that the reduction of internal barriers precedes the removal of
barriers to external integration (Frohlich and Westbrook, 2002). Initially, external supply
chain members need to see the information sharing, trust and integration among the
functions of the potential partner organizations to engage in collaboration with them.
When we look at the supply chain integration literature, we can see several studies that
conceptualize internal integration as an antecedent of external integration (Tracey, 2004;
Braunscheidel and Suresh, 2009). Internal attitudes and procedures need to be aligned
before the inclusion of partners in the integration process (Tracey, 2004). Internal
cohesion of the processes will encourage the external parties to join the integrated
processes. Food banks get the food from donors such as farms, manufacturers,
distributors, retail stores, consumers, and other sources, and make it available to those in
need through a community agency network. Matching the supply of food that would
otherwise be wasted to the demand of people that are in need requires internal integration
that precedes the integration activities that span the whole supply chain both upstream

53
and downstream. Internal integration of processes provides the basis for enabling the
requisite supply and demand integration. Thus, we hypothesize that:
H3: The level of internal integration in the food bank is positively associated with the
level of supply integration in the food bank.
H4: The level of internal integration in the food bank is positively associated with the
level of demand integration in the food bank.
The importance of supply chain integration has been emphasized in the literature
(Frohlich andWestbrook, 2001; Ragatz et al., 1997). The nature of collaboration with
supply chain partners enables exchange of information and ideas between the parties
engaged in integration. Therefore, the products and services can be better catered to the
needs of the clients, and the supply integration can enhance the understanding about the
abilities of the supply base. The supplier's existing knowledge of the partner
organization's internal processes and goals make the service and product development, as
well as appropriate planning of the supplier possible (Ragatz et al., 1997). Littler et al.
(1995) argues that frequent inter-organizational communication, building trust, and
ensuring that all parties act as expected are some of the key success factors for new
product/service development. Furthermore, it is established in the literature that
improvements in flexibility are positively associated with considering suppliers and
customers as the sources of information and collaboration (Wong et al., 2011). Product
variety is a dimension of flexibility performance (Schoenherr and Swink, 2012), which is
the capability of producing numerous product/service lines and their variations (Berry

54
and Cooper, 1999). The type of flexibility that enables the firm to increase the mix of
products/services is considered to be one of the most external facing ones among all
flexibility types (Braunscheidel and Suresh, 2009), and is affected by a broad integration
arc that faces outward to suppliers and customers (Frohlich and Westbrook, 2001).
Also, integrating the operations with downstream partners is critical to get
information on demand patterns and customer requirements. The lack of demand side
integration leads to important inefficiencies in the system such as poor customer service
and waste. Especially in service operations, the characteristics of products/services such
as customer participation, heterogeneity, and perishability adds to the complexity of
activities, and increases the need to have demand integration in place to come up with the
right scope of services for the clients (Frohlich and Westbrook, 2002). In this respect,
coordination with the external partners of a food bank makes it possible to deal with the
complexity in the system and to broaden the service range. Therefore, we hypothesize
that:
H5: The level of supply integration in the food bank is positively associated with the
number of basic programs run in the food bank.
H6: The level of demand integration in the food bank is positively associated with the
number of basic programs run in the food bank.
The basic programs run in a food bank are customized services for different
groups of clients. Some examples include programs targeted for seniors and kids. As
indicated before, basic programs run are, in a sense, similar to variety of

55
products/services that a commercial firm offers to its customers. Broader product lines
enable firms to meet customer demand more closely and increase the reach to customers,
and higher “market shares” ensue (Kekre and Srinivasan, 1990). Product variety is often
considered to lead to a competitive edge in for-profits through offering products or
services tailored to specific market segments, and it helps in producing higher sales
volumes (Berry and Cooper, 1999). Broadening the service offerings for a food bank
would mean attracting attention of the people in need. For instance, introducing kids
cafes programs would serve the elementary school children that would not be aware of
the programs otherwise, and increase the target share of the population in need. Similarly,
senior brown bag programs would help meet the needs of senior community members
and increase the reach to this segment. Moreover, various programs would attract media
and donor attention, thereby increase the incoming support. In this respect, the amount of
food distributed will be dependent on the number of basic programs run, as the programs
will be structured to meet different client needs and lead to higher amount of food
distributed per food insecure individual in the service area. Accordingly, we hypothesize
that:
H7: The number of basic programs run in the food bank is positively associated with the
amount of food distributed per food insecure individual in the service area of the food
bank.

56
Control Variables
The history of an organization basically reflects a unique bundle of critical
resource as well as organizational skills and capabilities that have been accumulated over
time. These resources influence an organization’s strategies of growth and organizational
structure (Nelson and Winter, 1982; Penrose, 1959). We expect that the longer the
history of the organization, the greater the organization's embeddedness in its
environment. (Yiu et al., 2005). Moreover, older organizations are more experienced in
their areas of operations, and they emphasize efficiency (Lukas et al., 1996).
Accordingly, we control for the "age of the food bank". Organizational size can also
affect the performance, since large organizations have more resources through which the
performance could be strengthened (Tsai, 2001). The total assets are indicative of the
"size" of the organization, which we incorporate in our model and control for (Waddock
and Graves, 1997).
In a commercial setting, there is a tradeoff between increasing the number of
channels and increasing the market coverage at the expense of reduction in intermediary
incentive to invest and add value (Frazier, 1999). However, in a non-profit setting the
incentives of all channel members are already aligned. Specifically, food banks and
member agencies have the same goal of reaching more people in need and distributing as
much food as possible. Multiple channels are also found to be supporting each other on
several occasions via providing more identification with, and exposure to, the services to
diffuse into the client base (Frazier, 1999). In distribution channels, relational exchange is
considered to be ongoing transfers of value between independent channel members. The
interactions and associations of personnel influence the channel governance (Frazier,

57
1999). There are benefits to relational exchange as a result of the transactions that occur
repeatedly, such as learning and social rewards (Frazier, 1999). If a food bank has
experience with multiple types of agencies, the delivery of basic programs to the clients
will benefit from the knowledge accumulation gained from experience and the basic
programs will result in higher performance. A food bank may or may not have a non-zero
number of agencies for each category (Soup Kitchen, Shelter, Day Care etc.). We control
for this difference that is described in terms of "service agency breadth", which is the
number of type of agencies in various categories. Putting all the relationships together,
the illustration of the proposed model can be found in Figure 3.1.
Figure 3.1 Conceptual Model
3.3 RESEARCH DESIGN
Data Collection
To undertake this research investigation, data on the population served and
amount of food distributed annually were gathered from Feeding America’s website

58
(http://feedingamerica.org/foodbank-results.aspx). There are 202 food banks throughout
the United States, and operational information for all of them is available on this website.
This data set is then merged with the financial information collected from IRS 990 forms
of the food banks. Food banks report their financial standing for transparency of
operations requirement and to show how they manage their funds to their stakeholders.
The relevant financial information (IRS 990 forms) is available on the websites of many
of the food banks. The form for year 2010 was used, which was the most recent financial
information that was available on the food bank websites during the time of data
collection. Since there were food banks that did not provide the IRS 990 form in the year
2010, the number of observations was reduced to 120 food banks. Then, this dataset was
matched and merged with the survey data, which we will be talking about in the next
chapter in more detail. There were 72 food banks that had both the secondary and
primary information, and this final dataset was used to test the research model. There was
one observation with a missing value for the variables in this model, and that data point
was dropped from the analysis.
The amount of food distributed per food insecure individual in the service area of
the food bank (in lbs) was operationalized and used as the performance variable. As
mentioned before, the size of the food bank is controlled by using the total assets of the
food bank. We also control for age of the organization, since older and larger
organizations are more experienced in their areas of operations, and they emphasize
efficiency (Lukas et al., 1996). Service agency breadth is also controlled for as mentioned
before. A non-zero number for this variable indicates that a food bank has activity in a
particular category. For instance, if a food bank has activity only in "emergency",

59
"senior" and "shelter" categories, it will have a score of 3, indicating the types of service
agencies the food bank works with. We control for this impact on performance, (the
amount of food distributed per food insecure individual in the service area of the food
bank), since Service Agency measure stands for the distribution channels in this study.
After accounting for the factors that would cause variability in the performance, the links
that are significant for food bank operations were identified.
Fundraising expenses were used as a precursor to the total support and revenue
collected by the organization, as food banks need to spend some effort and money to
attract donors, which will provide the necessary support and supplies in the form of food
and money. Total support and revenue is allocated toward running basic programs,
(operationalized as the number of basic programs run). This way the food bank builds the
financial resources to put in the services, which are the main products of a food bank. The
financial measures are reported in the IRS 990 forms, which are filed by non-profits,
charities, and other tax-exempt organizations. The revenues and support, as well as how
the expenses are allocated, are reported in these forms.
Over and above the financial resources collected, the basic programs of a food
bank are formed as a result of the collaboration of the organization with the supply chain
partners. The information regarding the resources and capabilities of the suppliers
determine the way the programs are structured. Moreover, client needs are incorporated
into the formation of basic programs to better meet the requirements of the beneficiaries.
Inter-functional (internal) integration also plays a role indirectly through supply and
demand integration, since a common understanding of the functional teams regarding the
goals and capabilities is necessary to be able to come up with the programs that best

60
allocate the resources in the organization to the right services. We use perceptual
measures regarding the level of internal and external (supply and demand) integration
present in the food bank. The scale is a 7-point Likert scale, where 1 indicates "Strong
Disagreement" and 7 indicates "Strong Agreement" with the manifest items. The details
of the psychometric properties of the survey scales will be discussed in the next essay. In
summary, the variables taken from the survey have appropriate validity and reliability.
Research Methodology
Seemingly unrelated regression (SUR) is an econometric analysis method that
allows for simultaneously running a system of regression equations and accounts for
correlated error terms across the variables (Autry and Golicic, 2010). Zellner (1962)
introduced this method as an efficient estimation of generalized least-squares model,
where the variables that are independent in one equation can be a dependent variable in
another equation in the system (Autry and Golicic, 2010). As SUR has the power to
account for contemporaneous cross-equation error correlations, it has advantages over
other approaches such as path modeling. Therefore, if multiple equations are
simultaneously tested and there is a chance that variables in the models can be related,
SUR is the appropriate methodology (Devaraj et al., 2004; Autry and Golicic, 2010;
Griffis et al., 2012). This method has become very popular recently in applied
econometric research.
In operations management literature, we can see some examples that employ this
technique. For instance, Autry et al. (2010) reports that SUR is an effective method for
estimating models depicting mediating and/or moderating conditions using cross-

61
sectional data. This technique is also known for alleviating endogeneity concerns (Autry
and Golicic, 2010), since possible correlation between error terms are accounted for and
the focal variables are modeled to be both independent and dependent in the model
(Greene, 1993; p.486). Moreover, Griffis et al. (2012) employs SUR in a recent empirical
study, where the associations between the independent variable, controls, and multiple
dependent variables are simultaneously tested, where several of the independent variables
have the potential to be related to each other, leading to correlated error terms. We also
deem that this is the appropriate method for the purposes of the model in this essay.
In general, non-normality of the error terms and heteroscedasticity occur together
in the data (Kutner et al., 2005; p132). We checked for normality of the variables in the
model by using the Shapiro-Wilk test, and did the necessary logarithmic and square root
transformations on the variables that do not have normality to remedy the problem
(Kutner et al., 2005; p132). SUR models assume that the error terms are homoscedastic.
We tested for the assumption of errors with constant variance (homoscedasticity) via
Breusch-Pagan test (Kutner et al., 2005; p118). The result of this test indicated that the
error variances are not constant.
Since the reported errors in SUR output in STATA 12 imposes constant variance,
and taking the natural logarithm of the variables did not reduce the heteroscedasticity in
the data, Cameron and Trivedi (2009; p.160) propose that bootstrapping can be used in a
SUR setting, where the error terms are heteroscedastic. This method allows us to get
robust standard errors, and in the case that the error terms are homoscedastic, the results
converge to the default standard errors (Cameron and Trivedi, 2009). We used this

62
methodology in order to estimate the data with heteroscedasticity using the default
bootstrap option in STATA 12.
We also checked whether multicollinearity was a problem in the data. The
multiple regression equations that take place in the system include Demand Integration,
Supply Integration, and Total Public Support and Revenue as predictors of Basic
Programs as the first equation. The second multiple regression equation has Food per
Food Insecure Individual as the dependent variable; and Basic Programs, Total Assets,
Age, and Service Agency as the independent variables. We looked at variance inflation
factors (VIF) of these variables when entered into the regression equation simultaneously
for multicollinearity diagnostics. A VIF value in excess of 10 is generally considered as
an indication of multicollinearity being an issue influencing the least squares estimates
(Kutner et al., 2005; p.409). In this particular model, the VIF values are below 1.5, which
shows that there is no multicollinearity issue present in the model. The VIF values are
reported in Table 3.1.
Table 3.1 VIF values of the variables
Variable VIF 1/VIF
Equation 1 Supply Integration 1.37 0.727844
Demand Integration 1.37 0.728394 Total Public Support and Revenue 1 0.996548
Mean VIF 1.25 Variable VIF 1/VIF
Equation 2 Basic Programs 1.18 0.848224
Total Assets 1.1 0.905502
Service Agencies 1.07 0.937447
Age 1.01 0.993083
Mean VIF 1.09

63
We also present the descriptive statistics of the variables employed in the model
in Table 3.2.
Table 3.2 Descriptive statistics
Variable N Mean Std. Dev. Min Max
Internal
Integration 72 5.523 0.936 2 7
Demand
Integration 72 5.714 1.002 1 7
Supply
Integration 72 5.338 0.938 3 7
FOOD
(performance) 72 68.447 35.705 2.718 181.575
Fundraising
Expenses 71 740,669 628,061 72,363 2,783,378
Total Public
Support &
Revenue 72 30,700,000 20,900,000 1,982,299 88,000,000
Service
Agency
Category 72 8.917 1.441 1 10
Basic
Programs 72 12.514 3.272 4 18
Age 72 29.556 5.886 5 42
Total Assets 72 12,100,000 9,460,891 1,080,599 46,400,000
The system of equations that are simultaneously estimated using SUR
methodology is specified below:
Total Public Support and Revenue = β10 + β11 (Fundraising Expenses)+ ε1
Supply Integration = β20 + β21 (Internal Integration)+ ε2
Demand Integration = β30 + β31 (Internal Integration)+ ε3
Basic Programs = β40 + β41 (Supply Integration) + β42 (Demand Integration) + β43 (Total
Public Support and Revenue)+ ε4

64
Food per Food Insecure Individual in the Service Area of the Food Bank = β50 + β51
(Basic Programs) + β52 (Total Assets) + β53 (Age) + β54 (Service Agency)+ ε5
Also, for reference, the variable names and the descriptions can be found in Table 3.3.
Table 3.3 Variable Definitions
Variable Name Definition
Internal
Integration: The cross-functional intra-organizational collaboration and information sharing
activities that occur via interconnected and synchronized processes and
systems.
Demand
Integration: Close collaboration and information sharing activities with clients that provide
the firm with strategic insights into market expectations and opportunities,
ultimately enabling a more efficient and effective response to client needs.
Supply
Integration: Coordination and information sharing activities with key suppliers that provide
the organization with insights into suppliers’ processes, capabilities and
constraints, ultimately enabling more effective planning and forecasting,
product and process design, and transaction management.
FOOD
(performance): Amount of food distributed per food insecure individual in the service area of
the food bank (in pounds).
Fundraising
Expenses: The amount of money spent for publicizing and conducting fund-raising
campaigns; maintaining donor mailing lists; conducting special fund-raising
events; preparing and distributing fundraising manuals, instructions, and other
materials; and conducting other activities involved with soliciting contributions
from individuals, foundations, government agencies, and others.
Total Public
Support and
Revenue:
Public support generated by contributions and grants, contributed food
received, and revenues in the form of fees and grants from government
agencies, handling fees from member agencies, investment and other income
Service
Agency: Type of service agency categories distributing food (e.g. Emergency, Soup
Kitchen, Shelter, Day Care, Senior etc.)
Basic
Programs: Programs that are being run by the food bank to achieve the goal of food
distribution to the communities in need (e.g. Fresh Produce, Back Pack,
Salvage, Senior Meal Delivery, Kids Cafes, After School Snacks etc.)
Age: Time in years that the food bank has been in operation
Total Assets: Sum of all current and non-current assets of the food bank
65
3.4 RESULTS AND IMPLICATIONS
The results of the analysis indicate that the general framework regarding the basic
flow of operations forming the basic programs is supported. The amount of fundraising
expenses is found to be associated with higher amount of total public support and
revenue, lending support to H1. This finding is intuitive and expected. Nonetheless, we
wanted to keep the whole picture in the framework and included this link in the model
and found empirical evidence.
When we look at the precursors of basic programs run, it is evident from the
significant finding that total public support and revenue provides the monetary resources
necessary to build the basic programs in the food bank. Thus, we have support for H2.
These resources are vital to run the operations of the organization. However, over and
above the monetary resources that are collected, there are other factors that are essential
to structure the programs in order to meet the food distribution goals of the food bank.
We theoretically hypothesized that these factors are the elements of supply chain
integration. The results of this part of the framework show that internal integration is
strongly associated with supply and demand integration, whereas only demand
integration has a significant association with basic programs when external integration
measures and their relations to basic programs run are considered. This lends support to
H3, H4, and H6, however, there is lack of support for H5 in this analysis.
Finally, the ultimate performance measure for the food bank organization is the
amount of food distributed. The basic programs are the means to achieve this goal. The
findings regarding the predictors of performance in this model show that the basic
programs are positively and significantly associated with the amount of food distributed

66
per food insecure individual in the service area of the food bank. This lends support to
H7. None of the control variables turned out significant in this setting. We combine and
present all the findings regarding all the links tested in this model in Figure 3.2. Also, the
detailed results can be found in Table 3.4.
Figure 3.2 Seemingly Unrelated Regression Model - Results
The results indicate that food banks should strategically combine their fundraising
efforts and supply chain integration in order to achieve their social goal of food
distribution to the communities in need. However, they need to allocate more of their
already constrained resources towards demand integration, rather than supply integration,
since the results show that demand integration has a more significant impact on the basic
programs run. This insight would be helpful for the food bank executives to see how they

67
should be balancing out their resources. Moreover, the findings prove the fact that
internal integration precedes the external integration significantly in a non-profit context.
Table 3.4 Seemingly Unrelated Regression Results
Observed Bootstrap
Coefficient Std. Err. z P>z
[95% Conf.
Interval]
Dependent Variable: Total Public Support and
Revenue
Fundraising Expenses 0.730 0.094 7.730 0.000 0.545 0.915 intercept 0.000 0.067 0.000 1.000 -0.131 0.131
Dependent Variable: Demand
Integration
Internal Integration 0.638 0.236 2.700 0.007 0.175 1.101 intercept 0.000 0.078 0.000 1.000 -0.153 0.153
Dependent Variable: Supply
Integration
Internal Integration 0.516 0.128 4.030 0.000 0.265 0.768 intercept 0.000 0.096 0.000 1.000 -0.189 0.189
Dependent Variable: Basic Programs
Total Public Support and
Revenue 0.286 0.094 3.040 0.002 0.102 0.470 Demand Integration 0.394 0.214 1.840 0.066 -0.027 0.814 Supply Integration 0.017 0.166 0.100 0.917 -0.308 0.343 intercept 0.000 0.116 0.000 1.000 -0.228 0.228
Dependent Variable: Food per Food Insecure Individual in the
Service Area
Total Assets -0.078 0.126 -0.620 0.535 -0.325 0.169 Age 0.207 0.156 1.330 0.185 -0.099 0.513 Service Agency -0.088 0.351 -0.250 0.801 -0.777 0.600 Basic Programs 0.347 0.116 3.000 0.003 0.121 0.574
intercept 0.000 0.128 0.000 1.000 -0.251 0.251

68
3.5 DISCUSSION AND LIMITATIONS
In general, in this essay we investigated the precursors of basic programs run in a
food bank and the consequent performance implications by using a dataset that is
comprised of information from secondary data and survey resources. This study gives us
important insights into the general flow of operations and the importance of supply chain
integration in a non-profit setting. So far, the majority of work in the empirical operations
management field has dealt with for-profit enterprises. The literature on supply chain
integration is no exception to this common theme. In this study, we have looked at the
foodbanking sector as a non-profit setting, and found that supply chain integration has
proven useful in food banking organizations. The mechanism through which internal and
external integration affects the food bank performance is the basic programs structured in
the organization.
Foodbanking organizations are dependent on total public support and revenue,
which results from the fundraising efforts to gain the necessary resources to operate.
Moreover, we observed that several tools of supply chain management that are found to
be useful in other settings are commonly used in food banks with some adjustment to the
non-profit environment in which they take place. There are several reasons for these
adjustments, even though the idea of supply chain integration remains the same. For
instance, there are different applications of the integration idea in food banking because
of the nature of the non-profit service setting rather than a typical commercial exchange
environment. The materials that are passed through the supply chain are food products
that have a relatively short shelf life. Furthermore, these products are delivered on the
basis of goodwill, which is quite distinct from a monetary transaction between a customer

69
and a service provider. These are some of the tenets of non-profits that make it necessary
to adjust the supply chain integration idea that was originated in for-profit organizations.
While the two sectors have their differences, the notion of collaboration, information
exchange, and joint decision-making are pivotal, irrespective of the setting. This study
provides insights in this manner.
We also shed light on the dynamics between the internal and external (demand
and supply) integration in non-profit organizations. The literature that mainly focuses on
for-profit organizations suggests that internal integration precedes external integration,
and we have found that it actually is the case in food banks as well, as a result of our
empirical investigation in this essay. Aside from the hard data, the observations in the
food banks also provided an opportunity to see the inter-functional work that is taking
place in these organizations. The interviews with the COO of a local food bank also
support the awareness of the food banks regarding external integration, which was not
immediately observable. The antecedents of supply chain integration in food banks
remain as an open question to be explored in the next essay.
While there are important insights gained from this analysis, we need to
acknowledge some limitations. For instance, the sample used to make the necessary
analysis for this study is 71. First of all, the population of food banks in the nation is
slightly higher than 200. Also, the overlapping and matched data between secondary and
primary sources reduced the sample size. This prevented us from running analysis with
structural equation modeling. We also wanted to keep the model simple rather than
introducing complex moderating relationships into the framework at this stage, since the
main aim here is to see to basic flow of operations in a food bank. Nonetheless, this is a

70
unique dataset that provides valuable information regarding food bank operations. The
study answers several questions about how supply chain integration plays a role in
forming basic programs, and opens the avenue for further inquiries about the antecedents
of supply chain integration, which we investigate in the next chapter.

71
CHAPTER 4
ANTECEDENTS AND PERFORMANCE IMPLICATIONS OF SUPPLY CHAIN
INTEGRATION IN FOOD BANKS: A SURVEY-BASED INVESTIGATION OF
THE ROLE OF INTELLECTUAL CAPITAL
4.1 INTRODUCTION
Supply chain management practices and strategic supply management are very
crucial for food banks as much as for commercial companies. Operating under
constrained resources, food banks can and do greatly benefit from supply chain
integration given the potential operational and financial benefits. Supply chain integration
(SCI) has been one of the main areas of investigation in supply chain management
research (Frohlich and Westbrook, 2001; Das et al., 2006). The SCI concept has
generally been classified on two dimensions - internal integration and external
integration. For a firm, external integration relates to the level of collaboration with its
upstream suppliers and its downstream customers. Information exchange with supply
chain partners on various stages of operations to make demand and supply management
more efficient is the main tenet of external integration (Frohlich and Westbrook, 2001).
On the other hand, internal integration involves information synchronization and
integrative initiatives between the functions within an organization. Flynn et al. (2010)
define SCI as the degree of an organization’s strategic collaboration with its customers

72
and suppliers, and management of intra and inter organizational processes. The benefits
of collaboration between supply chain partners as well as the integration between the
functions within an organization have been shown to impact operational and financial
performance in several research studies (Cao and Zhang, 2011; Germain and Iyer, 2006;
Braunscheidel and Suresh, 2009; Devaraj et al., 2007; Swink et al., 2007).
An examination of the literature on SCI indicates that it has been primarily
examined from the context of private sector enterprises spanning various industries from
automotive (e.g. Wong et al., 2011; Droge et al, 2004) to consumer products (e.g.
Rosenzweig et al., 2003), as well as multiple industries in a single study (e.g. Frohlich
and Westbrook, 2001; Das et al., 2006). Notwithstanding the advances in research
examining supply chain integration in the private sector, a sound understanding of the
nature and potential of SCI for organizations engaged in serving social causes is a
relatively under-researched domain. Organizations addressing issues such as hunger,
health, and poverty are required to manage the steady flow of materials, services and
information to achieve their social goals (Akingbola, 2006). Yet, they have unique
budgetary and infrastructural constraints that require innovative business practices. This
calls for transferring and extending the lessons learnt from the private sector, so that
organizations focusing on performance measures that transcend beyond economic
measures can attain their multi-dimensional goals effectively and efficiently (Akingbola,
2006).
An exploratory interview with the Chief Operating Officer (COO) of a local food
bank highlighted the importance of SCI and indicated that the level of integration varies
greatly from one food bank to another. This essay aims to investigate the key antecedents

73
and implications of supply chain integration (SCI) for food banks. The discussion with
the COO revealed the importance of organizational and human assets for ensuring
efficient and effective operations of food banks. The importance of human assets was
also emphasized in the keynote speech by the CEO of Global Foodbanking Network, Jeff
Klein, at the Humanitarian Logistics College Mini Conference, (23rd
Annual POMS
Annual Meeting, 2012). Drawing upon the opinions and observations of practicing
professionals in the food banking sector, it is apparent that a highly skilled workforce is
as crucial, if not more so, for the operations of these non-profit sector organizations as it
is for a commercial organization, since food banks are already resource constrained.
This essay aims to disentangle the key organizational factors that lead into supply
chain integration in the context of food banks. There are certain idiosyncrasies that come
into play in this particular context. This study examines the role of intellectual capital
(Subramaniam and Youndt, 2005) as a key organizational factor that leads to the
development of supply chain integration. Information exchange and interactions between
parties that engage in supply chain activities to end up with a common understanding of
the overall supply chain are emphasized in internal and external integration. As a human
resources related capability, intellectual capital's driving force for achieving supply chain
integration is the main question in this essay.
Additionally, the strength of impact of supply chain integration on delivery
performance may be influenced by environmental uncertainty, as the level of incoming
support as well as the demand for food is not very steady and it creates a mismatch in the
delivery of the service to the clients. In this respect, the precursor role of intellectual
capital on supply chain integration, as well as the performance implications that ensue,

74
incorporating the contextual setting, are studied in food banks. The model was analyzed
using responses to a questionnaire that was collected from food bank executives. Overall,
the study targets a comprehensive understanding of the operational issues that span the
building of supply chain integration capabilities and resulting performance in the
foodbanking sector. In the next section, the model, hypotheses, framework and research
design are elaborated.
4.2 MODEL, HYPOTHESES AND THEORETICAL FRAMEWORK
Drucker (1989) argues that motivation and productivity of knowledge workers in
non-profit organizations are extremely crucial. Moreover, these organizations are not
fixated on financial returns, rather, the performance of their mission is much more
important to have a disciplined organization in place. Therefore, a sound understanding
and dedication to the social goals are pivotal for the success of non-profit organizations.
Thus, what makes information exchange and communication possible are the people of
the organization and their approach towards the mission of the non-profit organization.
In this study, we theorize that the intellectual capital leads to supply chain integration to
achieve the social performance of alleviating hunger in food banks.
Organizations have different ways of accumulating and using knowledge.
Intellectual capital is all the knowledge firms utilize to gain a competitive advantage
(Subramaniam and Youndt, 2005). Subramaniam and Youndt (2005) conceptualize
intellectual capital on three dimensions. “Human capital is the knowledge, skills, and
abilities residing with and utilized by individuals, whereas organizational capital is the
75
institutionalized knowledge and codified experience residing within and utilized through
databases, patents, manuals, structures, systems and processes” (Subramaniam and
Youndt, 2005; p.451). The third aspect of intellectual capital is the social capital, which is
the knowledge that emerges through interactions between individuals and their
interrelationships.
The building blocks of human capital are creative, bright, skilled employees, with
expertise in their roles and functions, who constitute the major source for new ideas and
knowledge in an organization (Subramaniam and Youndt, 2005). As such, human capital
requires the hiring, training, and retaining of employees. However, since human capital is
embedded in individual expertise, it may not necessarily stay within the organization due
to the mobility of employees. As a result, human capital can come into and go from the
organization. On the other hand, the main tenets of organizational capital include reliance
on manuals, databases, patents, and licenses to codify and preserve knowledge, along
with the establishment of structures, processes, and routines that encourage repeated use
of this knowledge (Hansen et al., 1999). As such, organizational capital, which takes
form in institutionalized knowledge, stays within the organization and does not change
very easily. This is because organizational capital is related to the codification and
preservation of knowledge through structured and repetitive activities. The codification is
manifested in the form of manuals, databases, and patents that organizations use to
accumulate and retain knowledge. At the same time, organizational capital is also
concerned with formal procedures and rules for retrieving, sharing, and utilizing
knowledge. In essence, organizational capital aims to institutionalize knowledge within
an organization by means of preserving knowledge and by incorporating mechanisms to

76
use it recurrently. Social capital emerges from norms of collaboration, interaction, and
sharing of ideas. This form of intellectual capital does not follow predetermined rules for
knowledge transmission; instead, it requires structures that facilitate the interactions in
networks. Although the dimensions of intellectual capital may sound different, they
transform into and transferred via each other, and ultimately unfold the organizational
knowledge (Subramaniam and Youndt, 2005).
Knowledge management is not a foreign concept in the context of supply chain
management. Research in the knowledge management area emphasizes that organizations
that possess higher levels of intellectual capital are more successful at responding to
demand unpredictability (Chakravarthy et al., 2003). Knowledge sharing is one of the
main characteristics of supply chain integration since information exchange and
interactions between parties that engage in supply chain activities to end up with a
common understanding of the overall supply chain are emphasized in internal and
external integration. Knowledge based view argues that knowledge is the most important
strategic resource of an organization (Chakravarthy et al. 2003; Eisenhardt and Santos
2002). The factor that gives knowledge this critical position is that it is not imitable,
which is one of the tenets that RBV argues (Dierickx and Cool, 1989). RBV basically
states that organizations seek valuable, rare, inimitable and non-substitutable resources to
achieve competitive success. Human and knowledge based resources are strategic in the
sense that they bring in the skills, practices, knowledge and capabilities that add positive
value to the organization, and are either unique or rare among the organizations in the
industry (Wright and McMahan, 1992). In the supply chain literature there are several
studies that use KBV and RBV as the theoretical lens since the relationships and

77
information exchange with suppliers and customers as well as cross-functional
streamlining of operations, trust and involvement in partners’ activities are key
characteristics of successful supply management (Cao and Zhang, 2011; Cousins and
Menguc, 2006). As indicated before, supply chain integration mainly focuses on
information exchange, building relationships and close connections that go beyond day-
to-day transactions. This directly influences the development of valuable and unique
resources that cannot be replicated.
As previously mentioned, human capital represents tacit and explicit knowledge
that resides in the workforce as well as their learning capabilities, and social capital is the
knowledge that emerges through interactions between individuals and their
interrelationships. Social capital is an asset reflecting the characteristics of social
interactions achieved through individual level collective understandings regarding the
tasks and goals. The employees' abilities to solve problems and their skills are the reasons
that lead to the selection of recruitment of that particular individual (Leana and Van
Buren, 1999). The accumulation of the right human actors with their abilities and
resources foster the necessary social capital in the organization, as social aspect of
intellectual capital represents embedded knowledge available though the
interrelationships and interactions of the individuals (Subramaniam and Youndt, 2005).
Moreover, emergence in the form of collective knowledge of human actors of the
organization emphasizes that the accumulation of the human capital in the organization is
a function that does not need to be linear (Wright and McMahan, 2011). Hence, this
statement implies that while human capital forms the basis as the parts of a whole, the
resulting setting that the interactions occur and knowledge is shared is emergent, which

78
social capital stands for. It is stated that the non-profit employees select to work for the
non-profit organizations to be knowledge workers in this environment, where they can
contribute to society to achieve certain meaningful results (Drucker, 1989). Also, the
aspirations, personalities and motivations of the individual human actors that target a
common social goal present a context, where the knowledge, experiences, and know-how
are exchanged willingly, and collaboration and teamwork happens naturally. We posit
that the prerequisite to building the social aspect of intellectual capital is expected to be
the skilled, creative and bright workforce, which is the human capital. Training,
education, and sophistication of individuals of the organization accumulate to form the
level and quality of interactions and interrelationships between the employees in food
banks. Therefore, we hypothesize
H1: Human capital is positively associated with the level of social capital in food banks.
Moreover, organizational capital represents structured recurrent processes that are
codified and preserved in an organization, and it leads to cross-functional information
exchange as well as a common understanding of the operations and metrics about the
supply chain management of the organization. Moreover, an organization’s existing
knowledge base is used in structured and recurrent activities as a reliable and robust
response. It influences the problem solving patterns that take place in the organization
(Subramaniam and Youndt, 2005). In general, recurrent processes and routines leveraged
on the organization's preserved knowledge are expected to enhance the level of
interactions, relationships, and collaborations among the individuals that deploy the

79
organizational knowledge. Especially, the projects that require collective work of the
individuals provide context, where the organization's codified knowledge (e.g. in
databases, patents, and licenses) is put to use, updated and reinforced (Subramaniam and
Youndt, 2005). Organizational capital, the way it is conceptualized by Subramaniam and
Youndt (2005), comprises of structures, standardized processes, routines, formalization
of rules and procedures; is mostly mechanistic (Kang and Snell, 2008). These structures
create a resource for the employees to refer to as an institutionalized, reliable, and
legitimate codebook, and help in organizational learning processes. The organizational
capital that is available minimizes the time it takes to understand and interpret issues to
be solved in the organization (Kang and Snell, 2008). In addition, these sources define
the protocols and implementation of processes, assuming the starting point role, and lead
the interactions that take place within and across the organization. Food banks provide
manuals, general rules and guidelines to their workforce as well as to their supply chain
partners to describe the process and transfer the knowledge. Thus,
H2: Organizational capital is positively associated with the level of social capital in food
banks.
Social capital has a cooperative role that expands the collection of knowledge that
is embodied in various sources, including the human actors, structures and systems, and
channels the emergent interactions towards collaboration and teamwork that make up the
internal integration. Both human and organizational capital are utilized and transferred
via interactions that occur in networks (Subramaniam and Youndt, 2005). Mainly, the

80
links that enable sharing of information and know-how among the members of an
organization (social capital) facilitate the precursor role of human capital by encouraging
collaboration, which leads to integration of intra-organizational processes. Social capital
encourages exchange of ideas and interactions of the human capital. Networking aspect
of social capital sets out the connections required for sharing of ideas. Likewise, social
capital works through the enhancement of group work and information exchange among
team members of an organization, and facilitates the organizational capital’s knowledge
reinforcement role. The amount of information exchange in groups of people and their
interactions helps aid in achieving higher levels of internal integration in an organization.
In other words, internal integration emphasizes a deliberate effort towards teamwork and
information exchange between the functions of an organization (Schoenherr and Swink,
2012), and the team members will turn to the expertise sharing, internal resources and the
existing norms of collaboration in place to find process solutions. Since food banks are
non-profits that have an advantage regarding the commitment and relationships of the
employees due to the common social good to be achieved, the environment that has
emerged via the interactions of the members gives rise to the inter-functional teamwork,
consensus on common metrics and understanding of the ultimate social goal. Therefore,
H3: Social capital is positively associated with the level of internal integration in food
banks.
The prerequisite for successful supply chain integration is the effective
coordination of each partner organization’s internal processes initially (Tracey, 2004).

81
First of all, supply chain members need to see the information sharing, trust and
integration among the functions of potential partner organizations to engage in
collaboration with them. There are studies that conceptualize internal integration as a
precursor of external integration in the literature (Tracey, 2004; Braunscheidel and
Suresh, 2009). Internal attitudes and procedures need to be aligned before the inclusion of
partners in the integration efforts (Tracey, 2004). Internal cohesion of the processes will
encourage the external parties to join the integrated processes. Food banks get the food
from donors such as farms, manufacturers, distributors, retail stores, consumers, and
other sources, and make it available to those in need through a community agency
network. Matching the supply of food that would otherwise be wasted to the demand of
people that are in need requires internal integration, which precedes the integration
activities that span the whole supply chain both upstream and downstream. Internal
integration of processes provides the basis for enabling the requisite supply and demand
integration. Moreover, the interview with the COO of a local food bank supports this
theoretical argument. The following is an excerpt from the discussion about food bank
operations:
"Interviewer: We discussed internal integration as well as supplier and demand
integration during our meeting before. Do you think one integration type precedes
another? Does one lead into another one? As you may remember, internal integration is
more about cross-functional information exchange within the food banks, and supplier
and demand integration are coordination of activities of the food bank with external
parties, involvement and synchronization of processes with those of suppliers and clients.

82
COO: I think our internal integration precedes external. Message about our brand must
be consistent and have internal buy in to be successful."
Accordingly, we hypothesize that:
H4: Food banks that have a high level of internal integration will have high levels of
supply integration.
H5: Food banks that have a high level of internal integration will have high levels of
demand integration.
Delivery is one operational dimension that is critical in the context of food
banking, as the essence of work is all about delivery of the aid to communities in need.
Delivery has been employed as the single performance outcome of supply chain
integration efforts in previous studies (Ahmad and Schroeder, 2001; Da Silveira and
Arkader, 2007), aside from the studies that examine all operational performance
dimensions simultaneously (Flynn et al., 2010; Wong et al., 2011). Exchanging the
information with the supply side to synchronize the activities with upstream partners, and
being aware of the demand side of the supply chain to better address the client
requirements, give food banks a competitive advantage in improving the delivery
performance. Therefore,
H6: The higher the supply integration in food banks, the better they will deliver service.
H7: The higher the demand integration in food banks, the better they will deliver service.

83
The dominant forces for non-profit enterprises include mission, values, funders,
government, political system, clients, social needs, stakeholders, advocacy groups,
governance, and regulations (Akingbola, 2013). These collectively create a social
complexity to be handled by the non-profit organizations. In this complex structure,
environmental uncertainty, including the difficulty of predicting demand and supply, is
an influential factor that determines the effectiveness of supply chain integration on
delivery performance (Boon-itt and Wong, 2011). The interviews with the COO also
indicated that one of the most prominent issues in a food bank is the sorting process. This
is a bottleneck for the organization because of the uncertainty about incoming food, and
the lack of standardization and accurate information regarding the support. Uncertainty
distorts the accurate information that is achieved though the integration of the processes
along with the supply chain and causes issues regarding matching of supply with demand
by introducing variability to the system. Environmental uncertainty basically hinders the
potential operational supply chain integration benefits that would be realized in case of its
absence. Thus,
H8a: The effectiveness of supply integration on delivery performance will be diminished
by the extent of environmental uncertainty.
H8b: The effectiveness of demand integration on delivery performance will be diminished
by the extent of environmental uncertainty.
Putting all the hypotheses together, the conceptual framework is presented in
Figure 4.1. In the next section, we describe the data and the methodology.

84
Figure 4.1 Conceptual Model
4. 3 DATA AND METHODOLOGY
Data Collection
In order to test the proposed model, we use an online survey instrument that was
sent to US based food banks that are members of Feeding America network to collect
information about the SCI practices and several key organizational variables of these
organizations. There are 202 food banks that are connected to this network spanning the
50 states of the US as of the timeline of this study. First of all, we referred to the meta
analysis study (Essay 1) to determine the important concepts in the supply chain
integration literature. The scales for the supply chain integration constructs are adapted
from the previous studies in supply chain management (Schoenherr and Swink , 2012;
Koufteros et al., 2005; Swink et al., 2007), and intellectual capital scales are adapted

85
from the management literature (Subramaniam and Youndt, 2005). Environmental
uncertainty contains items that relate to both supply and demand uncertainty (Paulraj and
Chen, 2007). There is not a universally accepted organizational performance measure for
non-profit sector in the literature (Akingbola, 2006). The performance measurement of
non-profit organizations cannot be simply boiled down to profitability, since the aims of
non-profit organizations vary. Their effectiveness can be gauged as the extent to which
they achieve their mission (Akingbola, 2006). In this study, delivery performance
(Schoenherr and Swink, 2012) is used as the social performance measure in the model,
since the raison d'être of food banks is the delivery of food to the communities in need.
The validity of this performance measure has been verified by the interviews with the
COO of a local food bank. The measurement items for the survey can be found in
Appendix B.
The survey was sent to the COO that was interviewed for face validity. He was
asked to go through the survey, indicate if there was any ambiguity, and record the time it
takes to estimate the time to complete the questionnaire. Some changes were made
according to his inputs to ensure readability and clarity. Then, the first wave of the survey
was distributed through Qualtrics - a web based survey application - in September 2012.
The procedure carried out to communicate was an initial e-mail to the food bank
executives to introduce the study, followed by the link to access the survey if the
executive agreed to cooperate. If there was no response in about a week, several reminder
e-mails were sent to improve the response rate. The cover letters that were sent to recruit
respondents is presented in Appendix C.

86
Some food bank executives declined the invitation to participate in this study
indicating reasons such as "Very busy", "Not interested" or "Length of the survey". The
potential respondents were asked to complete the survey by October 31, 2012, to be
eligible to enter a drawing to win a gift donation. Moreover, the food bank executives
were also told that they would be provided with an executive report once the project was
completed. These incentives were provided to increase the response rate, which is known
to be problematic in organizational survey research (Baruch and Holtom, 2008). There
were 36 food bank executives who completed the survey in the first wave. The Darla
Moore School of Business research grant was used to make a donation of $180 to the
Virginia Peninsula Foodbank as a result of the first wave. Since the sample size in the
first phase was not as high as it was desired, a second wave of communication was held
in December 2012. The researcher of the project travelled to the New York City area,
using the support of Darla Moore School of Business research grant, to visit four food
banks, and also to observe the environment and to increase the sample size by meeting
the food bank executives in person. We should mention in passing that it has been
observed that face-to-face interaction was useful, since the respondents could ask their
questions and learn about the project instantly. Unfortunately, the visits do not guarantee
a response, as the food banks are resource constrained organizations, and some of them
turn down research requests such as this one. For the second wave, the data collection
ended at the end of May, 2013, resulting in 74 responses collected. Both waves
combined, the sample size became 110 with a response rate of 54.5%. This response rate
is appropriate for survey research in operations management surpassing the 20% response

87
rate level recommended in the literature (Malhotra and Grover, 1998), and is also much
higher than the average observed response rates in the field.
In order to check for non-response bias, we conducted several t-tests (Lambert
and Harrington, 1990), assuming that the responses of the late respondents were
representative of the non-respondents (Armstrong and Overton, 1977). The early wave
and the late wave respondents were compared using "Age" and "Warehouse Size" as well
as a randomly selected construct measurement item to test whether non-response bias was
a problem in the sample (Chen et al., 2004). The t-test results indicated no statistically
significant differences between the first wave and second wave responses at 0.05 level
(Difference in "Age": 95% CI -- [-2.60, 2.47], difference in "Warehouse Size": 95% CI --
[-26,061.98, 22,154.95], and difference in measurement item for "Organizational
Capital": 95% CI -- [-0.51, 0.67]). Thus, the results support that non-response bias is not
present in the data.
Common method bias is tested using Harman's single factor test (Podsakoff et al.,
2003). If there is a substantial common method variance caused by using a single method
of data collection (survey), a single factor is expected to emerge when all the
measurement items of variables are entered into an exploratory factor analysis (Podsakoff
and Organ, 1986). All the items could not be included in the factor analysis because of
the sample size and the number of variables in this study. Instead, two factor analyses
were done to satisfy the subjects to variables ratio of 5 (Arrindell and van der Ende,
1985), one with intellectual capital items and the second one with supply chain
integration items. The first factor analysis conducted on 14 items with no rotation
resulted in two factors with eigenvalues greater than 1 and a third factor that has an
88
eigenvalue of 0.82. Scree plot indicated a three-factor solution to the analysis. The second
factor analysis with 17 items and no rotation yielded three factors that have an eigenvalue
that is greater than 1. This solution was supported by Scree plot as well. These results
provide evidence that common method variance is not a problem in the dataset.
We conducted a missing value analysis to see if missing values follow a pattern.
Missing values in a dataset can be MCAR (missing completely at random), MAR
(missing at random, called ignorable nonresponse) and MNAR (missing not at random or
nonignorable) (Tabachnick and Fidell, 2007; p.62). The missing values are desired not to
follow a certain pattern. Therefore, we tested if the missing observations were
predictable. Although this procedure is not required for the variables with less than 5% of
data missing and none of the variables we used for this analysis has more than a 5%
missing value percentage, the Little's MCAR test conducted on SPSS indicates a
statistically non-significant result (p = 0.463), which lends support for MCAR.
Measurement, Validity and Reliability
As indicated before, the sample size was not large enough to estimate a factor
analysis on the entire model all at once. Therefore, we ran two confirmatory factor
analyses (CFA). The first one included the items representing intellectual capital, and the
second one was done on supply chain integration variables. In the literature, an index of
0.90 is generally accepted as a good fit (Bollen, 1989). Also, RMSEA (root mean square
of approximation) of 0.1 or less indicate an acceptable fit (Sharma et al., 2005). The
CFA model for intellectual capital yielded fit indices of CFI = 0.91, TLI = 0.89. The χ2/df
ratio is 2.07 (153.062/74), and RMSEA = 0.096. Although TLI is slightly below the

89
recommended cutoff value, we move on with the structural analysis since the fit index
issue may be due to the sample size (Sharma et al., 2005). The CFA for supply chain
integration constructs yielded CFI = 0.89, TLI = 0.87, χ2/df ratio of less than 2
(216.813/116), and RMSEA = 0.09. Some of the fit indices are slightly below the cutoff
values for this model as well. In general, it is known that fit indices increase with sample
size (Hu and Bentler, 1998). The standardized factor loadings are presented in Table 4.1
and Table 4.2.
Table 4.1 Standardized CFA path loadings for Intellectual Capital Constructs
Item Human Capital Organizational Capital Social Capital
HUM1 0.777
HUM2 0.678
HUM3 0.868
HUM4 0.665
HUM5 0.818
ORG1 0.794
ORG2 0.646
ORG3 0.831
ORG4 0.841
SOC1 0.880
SOC2 0.792
SOC3 0.768
SOC4 0.737
SOC5 0.760

90
Table 4.2 Standardized CFA path loadings for Supply Chain Integration Constructs
Item Internal Integration Demand Integration Supply Integration
INT1 0.660
INT2 0.714
INT3 0.754
INT4 0.772
INT5 0.799
INT6 0.651
DEM1 0.662
DEM2 0.723
DEM3 0.810
DEM4 0.792
DEM5 0.701
SUP1 0.577
SUP2 0.780
SUP3 0.796
SUP4 0.779
SUP5 0.545
SUP6 0.612
Construct validity is the assessment of the degree to which a particular measure
actually measures the latent construct of interest. The most efficient measures are
manifestations of constructs that take place in articulated theory and are supported by
empirical data (Netemeyer et al., 2003; p.8). The measures used in this study resulted
from an extensive literature search, and supply chain integration constructs are
determined on the basis of the thorough meta-analysis conducted for this research.
Moreover, since the measures were adopted from the previous studies, they have been

91
evaluated by academics over the years as the literature has developed and the scales have
been refined (Netemeyer et al., 2003; p.8). As mentioned before, the particular measures
in this study were assessed in by a practitioner terms of face validity in the context of
foodbanking. We believe that all these steps collectively strengthen the validity of the
scales used in this project.
We also assessed the discriminant validity of the constructs. Discriminant validity
checks are done to evaluate the degree to which the constructs of interest are distinct
from each other. In order to examine the discriminant validity, we compare the two CFA
models, one of which the correlation between the latent variables are set equal to 1, and
another where the correlations are free. When the two models are compared, a
significantly lower χ2 value for the unconstrained model with respect to the constrained
model indicates discriminant validity (O'Leary-Kelly and Vokurka, 1998). For the
intellectual capital block, the χ2 value is 407.55 with 77 degrees of freedom for the
constrained model. The χ2 difference test indicated that the unconstrained model explains
the data better, thus, we established discriminant validity for intellectual capital.
Likewise, for the integration block, the χ2 value is 460.23 with 119 degrees of freedom
for the constrained model. The χ2 difference is significant indicating better fit for the
unconstrained model. Therefore, we establish discriminant validity for both sets of latent
constructs.
Convergent validity is assessed by examining the factor loadings on the latent
constructs (Hair et al., 1998). All of the item loadings on their respective latent constructs
that are in excess of 0.5 indicate that convergent validity is achieved. Moreover, each

92
indicator's estimated path coefficient on the respective underlying factor is greater than
twice its standard error, indicating significance (Anderson and Gerbing, 1988).
Reliability has also been assessed to establish construct validity. This measure of
validity is concerned with the consistency of a scale in measuring a given construct, and
the degree to which the items hold together (Netemeyer et al., 2003; p.10). There are
various measures to gauge reliability. We use Cronbach's coefficient alpha in this
research. Cronbach's alpha is a coefficient of internal consistency and is a function of
inter-item correlations of the items that measure a construct. The cutoff value for
Cronbach's alpha is reported to be 0.70 (Nunnally, 1978). Some researchers accept 0.60
and greater values as satisfactory levels of alpha reliability (Hair et al., 1998; p. 118). The
reliabilities of the scales used in this study are presented in Table 4.3. The scale
reliabilities of all constructs except the environmental uncertainty scale are above the
cutoff value.
Table 4.3 Reliability results for the constructs
Construct Number of
Measurement Items
Cronbach's
alpha
Average Variance
Extracted
Human Capital 5 0.870 0.586
Organizational Capital 4 0.852 0.611
Social Capital 5 0.890 0.622
Internal Integration 6 0.860 0.529
Demand Integration 5 0.847 0.547
Supply Integration 6 0.838 0.476
Delivery 3 0.801 0.561
Environmental Uncertainty 4 0.375 0.333

93
Since the sample size is not sufficient to run the whole structural model, the data
is analyzed using SUR. In general, SUR technique enables the simultaneous analysis of
the complete model including the moderating relationships. We present the results in the
next section.
4.4 RESULTS AND IMPLICATIONS
As explained in the previous essay, SUR allows for simultaneously running a
system of regression equations and accounts for correlated error terms across the
variables (Autry and Golicic, 2010). Also, a dependent variable in one equation can be an
independent variable in another equation, and the relationships between the equations
stemming from the use of same variables in different parts of the system are controlled
for. We have averaged the scale items and treated the constructs as observed variables to
run the model as a SUR. The results are presented in Figure 4.2. Also, the detailed results
can be found in Table 4.4.
Figure 4.2 Seemingly Unrelated Regression Model - Results

94
Table 4.4 Seemingly Unrelated Regression Results
Observed Bootstrap
[95% Conf.
Interval]
Coefficient Std. Err. z P>|z|
Dependent Variable: Social Capital Human Capital 0.635 0.097 6.530 0.000 0.445 0.826
Organizational Cap. 0.146 0.074 1.960 0.050 0.000 0.292
intercept
1.237 0.520 2.380 0.017 0.218 2.256
Dependent Variable: Internal Integration Social Capital 0.627 0.113 5.560 0.000 0.406 0.848
intercept
2.078 0.642 3.240 0.001 0.820 3.337
Dependent Variable: Demand Integration Internal Integration 0.616 0.132 4.670 0.000 0.357 0.874
intercept
2.282 0.760 3.000 0.003 0.791 3.772
Dependent Variable: Supply Integration Internal Integration 0.637 0.099 6.420 0.000 0.443 0.832
intercept
1.789 0.572 3.130 0.002 0.669 2.909
Dependent Variable: Delivery Supply Integration 0.158 0.100 1.590 0.112 -0.037 0.354
Demand Integration 0.314 0.131 2.400 0.016 0.058 0.570
Environmental
Uncert. -0.003 0.110 -0.030 0.980 -0.219 0.213
Sup. Int. X Env.
Uncer. 0.058 0.105 0.560 0.579 -0.147 0.264
Dem. Int. X Env.
Uncer. -0.115 0.116 -0.980 0.325 -0.343 0.114
intercept 3.235 0.897 3.610 0.000 1.478 4.993

95
Based on the results of SUR, Human Capital turns out to be a significant
predictor of Social Capital in food banks, lending support for H1. Also, when we
examine the Organizational Capital - Social Capital link, we find support for H2 (at
p<0.05). Nonetheless, it is obvious that Human Capital is more crucial in building Social
Capital than Organizational Capital is in the food banking environment.
Social Capital is a significant precedent of Internal Integration as hypothesized.
The results support H3, emphasizing the importance of having the social interactions and
the network between the employees of the organization to build the teamwork, functional
team decision consensus and common understanding of the processes and performance
outcomes. Also, external integration (both Demand Integration and Supply Integration) is
influenced by internal integration as evidenced by the data as well as the literature.
Therefore, we find support for H4 and H5.
Finally, Delivery performance is significantly influenced by Demand Integration
compared to Supply Integration. Supply Integration is not a significant predictor, while
Demand Integration has a significant impact at 0.05 (not supporting H6 and supporting
H7). The moderation effect of Environmental Uncertainty is not supported by the data on
food banks in this study (lack of support for H8a and H8b). It is an interesting result
given the amount of uncertainty the food banks have to deal with. However, the
adaptation of the organizations to the high levels of demand and supply uncertainty may
be explanatory for this result. Since these organizations emerge, develop and mature over
time in highly uncertain environments, their operating mechanisms could be at a stage
that has already adapted to the uncertainty inherent in the system. In this respect, perhaps,

96
we might consider food banks as complex adaptive systems, where the entities and the
environments co-evolve in the philanthropy scene (Choi et al., 2001).
Overall, the results of this essay provide support for the interplay between the
Intellectual Capital aspects we hypothesized in a non-profit environment. Moreover, we
have found support for the antecedent role of Intellectual Capital to Supply Chain
Integration in this study. Also, the precedence of Internal Integration to External
Integration, which take places in the supply chain integration literature that mainly
examines for-profit organizations, is supported for non-profits as well. Interestingly,
Delivery performance of the food banks is not influenced by Supply Integration, which
emphasizes strong relationships and information exchange with the suppliers. On the
other hand, Demand Integration is significantly influential on Delivery performance. This
finding indicates that client relationships and inputs in the food distribution process are
important for increasing the amount of food distributed in the service area.
This study presents valuable insights for the management of food banks. First of
all, knowing that Intellectual Capital precedes and determines the level of Supply Chain
Integration, foodbanking organizations should be proactive in how to manage the
Human, Organizational and Social Capital. Internal Integration is positively and
significantly associated with Social Capital, which should be enhanced by the food banks
to have a high level of Supply Chain Integration as the structure of the organization. The
results indicate that what is invested in Demand Integration should be higher than the
investments for Supply Integration in order to improve Delivery performance. The lack of
the significant relationship between Supply Integration and Delivery is worth
investigating as a future research opportunity. Also, within the Intellectual Capital

97
dynamics in this non-profit environment, the lower degree of Organizational Capital's
influence on Social Capital with respect to Human Capital could be examined further.
4.5 DISCUSSION AND LIMITATIONS
In this study, we have examined how supply chain integration develops and
affects delivery performance. Building upon the first two essays in the dissertation,
intellectual capital has been conceptualized as the antecedent of integration in food
banks. We have shown the interplay between the intellectual capital aspects, along with
the sequence of internal and external integration that take place in food banks, with the
help of survey responses collected from food bank executives. The results of the study
lend support for most of the hypothesized relationships.
This study sheds light on the mechanism through which the social capital is built
in a non-profit setting. Human capital and organizational capital precede the social
capital, which in turn helps in building internal integration in food banks. Supply chain
integration literature, along with the interviews with the COO of a local food bank, has
been used to conceptualize the internal and external integration relationships. As
expected, internal integration is found to be the precursor of demand integration and
supply integration.
Since the reason of existence of food banking organizations is the delivery of food
to the communities in need, we have looked at the impact of supply chain integration on
delivery as the social performance measure of food banks. We have found support for
the significant impact of demand integration on delivery, whereas the findings indicate
that there is lack of support for the supply integration and delivery relationship. This is

98
quite an interesting result and requires further investigation as a future research
opportunity. The unique nature of food banks as opposed to for-profit enterprises sets out
a context that is worthwhile to investigate, and the idiosyncrasies that come with this
setting may be altering some of the expectations regarding how the mechanisms generally
work in for-profit enterprises.
There are some implications of the current study for food bank management. First
of all, the value of intellectual capital has been verified in food banking as a result of this
study. Moreover, the interplay between the intellectual capital dimensions has been
investigated in a non-profit environment. The findings have indicated the importance of
skilled, bright and creative individuals as well as the systems, structures and institutional
knowledge in building the emergent social structure that consists of the interactions of the
food bank employees who are committed to the achievement of the social goal that is
delivery. Attracting and retaining the skilled workforce, and creating a robust structure
that facilitates knowledge sharing, are pivotal in establishing collaboration and teamwork
in food banks. Secondly, the results also indicate that internal integration precedes the
external integration, which is in line with the expectations depending on the literature and
the interviews with the COO. We have found evidence supporting the precedence of the
message as to the consistency of the food bank's brand and reputation with respect to the
functional integration and collaborative operations, before establishing supply and
demand integration to be successful.
This study is, unfortunately, not free from limitations. First of all, like any other
survey study, we rely on perceptual measures to gauge the constructs of interest to
answer our research questions. We have tried to overcome this limitation by combining

99
perceptual measures with objective measures in the previous essay to see the impact of
supply chain integration on delivery performance. Also, given the total number of food
banks under Feeding America umbrella is already limited (202), even though the
response rate is successful (~55%), we use a sample size of 110 to conduct the statistical
analysis in this study. This constrained us from running a full-fledged structural equation
model for the entire conceptual framework. However, SUR enabled us to run the entire
model including the moderating relationships, by treating the constructs as observed
variables via averaging the scales for each construct. Nonetheless, we have incorporated
the CFA in order to see the structure of the data, and have an item-level analysis in the
study.
In general, this study sheds light on an important topic, yet in a relatively new
context for business research. Non-profit organizations have been using some of the tools
developed in for-profit contexts, however, they also present to be the incubators for new
ideas and approaches to process management and improvement, as non-profits are in a
place to be agile and efficient in their operations due to lack of abundant resources. We
have found evidence to the use of supply chain management tools as we know them in
non-profit settings. Moreover, we also could not observe some of the expected
relationships such as the supply integration - delivery link, or the moderation effect of
environmental uncertainty, in this study. We have presented some possible explanations
for these findings. However, further investigation of the same issues from different angles
(e.g. case studies, modeling approaches) would give a better understanding of the
mechanics of the operations in food banks.

100
CHAPTER 5
CONTRIBUTIONS, CONCLUSIONS AND LIMITATIONS
In this dissertation, we have investigated the supply chain integration concept and
its antecedents in food bank organizations. We have studied the main dimensions of
supply chain through an in-depth literature review and systematic examination of the
articles published in this area in the first essay. The meta-analytic investigation has
provided the background to identify the concepts and main constructs that take place in
this major subject area in operations management. Moreover, some potential moderators
of supply chain integration and performance relationships were determined using meta-
analysis.
In the second essay, we have looked at the basic operations of a food bank with
the help of data from secondary and primary sources to understand how fundraising,
basic programs and supply chain integration play various roles to deliver food to the
communities in need. The findings of the second essay indicated the key role played by
supply chain integration (especially internal integration and demand integration) on the
delivery performance measured as the amount of food distributed per food insecure
individual in the service area of the food bank.
Building upon the first and second essays, we have examined the antecedents of
supply chain integration in food banks in the third essay. We have used survey responses

101
collected from the US food banks with a good coverage and response rate (~55%) to
conduct the analysis for this study. Also, the interviews done with the COO of a local
food bank were helpful in conceptualizing the precedent role of intellectual capital for
building supply chain integration in this non-profit setting. The general framework of
"Intellectual Capital" - "Supply Chain Integration" - "Performance" relationships were
tested using the appropriate statistical techniques. The natural performance measure for a
food bank organization has been determined to be the delivery of food throughout the
dissertation. The second essay includes an objective performance measure, while the
third essay uses a perceptual measure of delivery performance. The use of multiple
techniques to collect and analyze data adds to the robustness of this dissertation.
Theoretical Contributions
This dissertation presents empirical evidence of supply chain integration practices
and their impact on delivery performance in a non-profit environment. Although supply
chain integration has been studied extensively in for-profit enterprises, there has been
lack of empirical studies conducted regarding non-profit operations, especially
concerning the supply chain management of these organizations. As previously
mentioned, the use of multiple methodologies in order to examine various operations
management related questions on this topic was a deliberate effort to strengthen the
contribution of this work as a whole.
The meta-analysis study is a response to the call regarding the importance of
bringing the supply chain integration literature together, and this study has been
conducted to arrive at a collective understanding of supply chain integration -

102
performance relationships to help in theory building and consensus in supply chain
management literature. The operations management literature is rich in supply chain
integration studies that examine this concept from various angles. The meta-analysis of
the articles in this area enables us to systematically collect the findings of studies that
take place in the literature, weigh them based on the reliabilities of constructs and sample
sizes, and eventually reach certain generalizations. In particular, the meta-analytic
methodology in this dissertation has examined the overall association of supply chain
integration practices and performance, as well as identified the significance between sub-
dimensions of supply chain integration practices and various performance measures.
Furthermore, the existence of moderating factors on the supply chain integration practices
and performance, on both aggregate and individual level associations, have been tested
using this methodology in this subject. Specifically, the importance of internal integration
has been emphasized in the meta-analysis and helped in understanding the dynamics
between internal and external integration. Environmental uncertainty has also emerged to
be an important moderator, which was used in the third essay particularly in this
dissertation.
The second essay was useful in investigating the basic flow of operations in food
banks. We have found empirical evidence for the use and benefit of a supply chain
management concept that originated in for-profit enterprises. Supply chain integration
and the precedence of relationships between internal and external integration in relation
to how basic programs are conceived in a non-profit setting have been tested. As a result,
the general framework has been supported, and set the stage for the third essay that
examined the antecedents of supply chain integration and the moderation effect of

103
environmental uncertainty, which has been found to be an important moderator in the
first essay.
Finally, to our knowledge, the antecedent role of intellectual capital has not been
studied in literature before. Triangulating between the comments and highlights by the
operations executive of a local food bank and the literature, we have conceptualized the
framework in the third essay. The model has been tested using survey data, and the
findings indicate that the interplay between the dimensions of intellectual capital as well
as the precursor role of it for supply chain integration has been supported. The lack of
support for the moderation effect of environmental uncertainty raises other research
opportunities such as the impact of this construct in an inherently uncertain context,
which is the foodbanking environment.
Contributions to Practice
In this dissertation, we have shown that supply chain integration practices have
been known and used in food banks. Supply chain management tools that originate in
other industries apparently take place in non-profit sector as well. Especially, internal
integration has been an essential part of the operations in food banks in the sense that it
drives the external integration and ultimately performance. This finding is helpful for
food banking practice, since strategy setting, planning and formalization of operations
should take this effect into account and emphasize the importance of this dimension of
supply chain integration. As entities that are resource constrained, food bank
organizations should allocate their resources toward building internal integration before
external integration.

104
Second, demand integration should be the priority while making decisions about
external integration, since empirical evidence supports the positive and significant impact
of client side integration on performance. There is lack of support for the influence of
supply integration on delivery performance, both for objective and perceptual measures.
Perhaps, supply integration is not where it needs to be yet in non-profits, or the suppliers
do not have enough incentives to share operational information and for further
involvement with the organizations that they work with, compared to the agencies and
clients that are in the downstream of the supply chain. This result creates some awareness
about the potential benefits and the current situation.
Moreover, human capital (i.e. skilled, educated, creative and bright workforce)
relative to organizational capital (i.e. manuals, databases, structures, systems and
processes) has been found to be essential in forming the social capital (i.e. networks and
interactions), which is the backbone of internal integration in the organization. Social
capital is the driving force for inter-functional teamwork, and common understanding of
goals and metrics. Therefore, food bank managers should be cognizant of this dynamic
happening throughout the organization, and value the intellectual capital properly. The
findings show that the leverage of organizational capital is not very strong in this setting.
However, this may be due to the lack of resources to invest in formalized structures
compared to skilled workforce, but it could be strengthened considering the potential it
may bring into the intellectual structure of the food bank.

105
Limitations and Future Research
This dissertation provides empirical evidence for the supply chain integration -
performance relationships in food banks. Moreover, the driving forces of integration have
also been examined and their existence has been empirically supported. We have made
every effort to get data from as many food banks as possible by using incentives and
multiple follow-ups with the respondents. While the response rate was quite successful
for a survey study, the sample size turned out to be 110. This sample allowed us to make
certain statistical analysis to answer the research questions we had, however, a structural
equation model to test the entire model required a much larger sample size. Therefore,
another non-profit setting that has a larger population of organizations that could yield a
higher sample size can be investigated as a future research opportunity to test a similar
model, this time as an SEM.
Moreover, the findings we presented show that there is much more to investigate
in food bank organizations, since we could not find support for some of the expected
relationships in the overall framework. For instance, the lack of significant impact of
supplier integration on delivery performance leads to new questions as to why this is the
case, or how supply side integration could be achieved given that there may be several
efficiencies gained through information exchange, streamlining of operations with those
of the suppliers, and new forms of involvement that go beyond daily transactions. Finally,
environmental uncertainty did not turn out to be a significant moderator for supply chain
integration - performance relationship in this study. Further research could look into the
alternative role that uncertainty may be playing, or the contextual idiosyncrasies due to

106
the non-profit setting studied here, which cancels out the significance of environmental
uncertainty more in depth.

107
REFERENCES
Ahmad, S., Schroeder, R.G., 2009. The impact of EDI on delivery performance,
Production and Operations Management, 10 (1), 16-30.
Akingbola, K., 2006., Strategic choice and change in non-profit organizations, Strategic
Change, 15, 265-281.
Akingbola, K., 2013. A model of strategic nonprofit human resource management,
Voluntas: International Journal of Voluntary and Nonprofit Organizations, 24 (1),
214-240.
Anderson, J. C., Gerbing, D. W., 1988. Structural equation modeling in practice: A
review and recommended two-step approach, Psychological Bulletin, 103 (3),
411-423.
Arrindell, W. A., van der Ende. J., 1985. An empirical test of the utility of the
observations-to-variables ratio in factor and components analysis, Applied
Psychological Measurement, 9, 165 - 178.
Armstrong, J.S., Overton, T.S., 1977. Estimating non-response bias in mail surveys,
Journal of Marketing Research, 16 (August), 396-402.
Autry, C.W., Golicic, S.L., 2010. Evaluating buyer–supplier relationship–performance
spirals: A longitudinal study. Journal of Operations Management, 28, 87-100.
Autry, C.W., Grawe, S.J., Daugherty, P.J., Richey, R.G., 2010. The effects of
technological turbulence and breadth on supply chain technology acceptance and
adoption. Journal of Operations Management, 28, 522-536.
Barney, J., 1991. Firm resources and sustained competitive advantage. Journal of
Management, 17, 99–120.
Baruch, Y., Holtom, B.C. 2008. Survey response rate levels and trends in organizational
research, Human Relations, 61 (8), 1139-1160.

108
Bendoly, E., Bharadwaj, A., Bharadwaj, S., 2012. Complementary drivers of new product
development performance: Cross-functional coordination, information system
capability, and intelligence quality, Production and Operations Management, 21
(4), 653-667.
Berry, W.L., Cooper, M.C., 1999. Manufacturing flexibility: methods for measuring the
impact of product variety on performance in process industries, Journal of
Operations Management, 17, 163-178.
Braunscheidel, M.J., Suresh, N.C., 2009. The organizational antecedents of a firm’s
supply chain agility for risk mitigation and response, Journal of Operations
Management, 27, 119-140.
Bollen, K., 1989. Structural Equations with Latent Variables. Wiley, New York.
Boon-itt, S., Wong, C.Y., 2011. The moderating effects of technological and demand
uncertainties on the relationship between SCI and customer delivery performance,
International Journal of Physical Distribution and Logistics Management, 41 (3),
253-276.
Cameron, A.C., Trivedi, P.K., 2009.Microeconometrics using Stata. Stata Press, TX.
Cao, M., Zhang, Q., 2011. Supply chain collaboration: Impact on collaborative advantage
and firm performance, Journal of Operations Management, 29, 163-180.
Chakravarthy, B., McEvily, S., Doz, Y., Rau, D., 2003. Knowledge management and
competitive advantage. M. Easterby-Smith, M. A. Lyles, eds. The Blackwell
Handbook of Organizational Learning and Knowledge Management. Blackwell
Publishing, Malden, MA, 305–323.
Chen, H., Daugherty, P.J., Roath, A.S., 2009. Defining and operationalizing supply chain
process integration, Journal of Business Logistics, 30 (1), 63-84.
Chen, I., Paulraj, A., 2004. Towards a theory of supply chain management: the
constructs and measurements. Journal of Operations Management, 22 (2), 119-
150.
Chen, I.J., Paulraj, A., Lado, A.A., 2004. Strategic purchasing, supply management, and
firm performance, Journal of Operations Management, 22 (5), 505-523.
Chen, H., Tian, Y., Ellinger, A.E., Daugherty, P.J., 2010. Managing logistics outsourcing
relationships: An empirical investigation in China, Journal of Business Logistics,
Vol. 31 (2), 279-299.

109
Chiang, C-Y, Kocabasoglu-Hillmer, C., Suresh, N., 2012. An empirical investigation of
the impact of strategic sourcing and flexibility on firm’s supply chain agility,
International Journal of Operations and Production Management, 32 (1), 49-78.
Choi, T.Y., Dooley, K.J., Rungtusanatham, M., 2001. Supply networks and complex
adaptive systems: control versus emergence, Journal of Operations Management,
19, 351-366.
Clarkson, M.B.E., 1995., A stakeholder framework for analyzing and evaluating
corporate social performance, Academy of Management Review, 20 (1), 92-117.
Cousins, P.D., Menguc, B., 2006. The implications of socialization and integration in
supply chain management, Journal of Operations Management, 24, 604-620.
Da Silviera, G.J.C., Arkader, R., 2007. The direct and mediated relationships between
supply chain coordination investments and delivery performance, International
Journal of Operations and Production Management, 27 (2), 140-158.
Damanpour, F., 1991. Organizational innovation: A meta-analysis of effects of
determinants and moderators, Academy of Management Journal, 34 (3), 555-590.
Danese, P., Filippini, R., 2010. Modularity and the impact on new product development
time performance, International Journal of Operations and Production
Management, 30 (11), 1191-1209.
Daponte, B.O., Bade, S., 2006. How the private food assistance network evolved:
Interactions between public and private responses to hunger, Nonprofit and
Voluntary Sector Quarterly, 35 (4), 668-690.
Das, A.J., Narasimhan, R., Talluri, S. 2006. Supplier integration - finding an optimal
configuration, Journal of Operations Management, 24 (5), 563-582.
Devaraj, S., Hollingwood, D., Schroeder, G.R., 2004. Generic manufacturing strategies
and plant performance. Journal of Operations Management 22 (3), 313–333.
Devaraj, S., Krajewski, L., Wei, J.C. 2007. Impact of eBusiness technologies on
operational performance: The role of production information integration in the
supply chain, Journal of Operations Management, 25, 1199-1216.
Dierickx, I., Cool, K., 1989. Asset stock accumulation and sustainability of competitive
advantage, Management Science, 35 (12), 1504-1511.
Dröge, C., Jayaram, J., Vickery, S.K., 2004. The effects of internal versus external
integration practices on time-based performance and overall firm performance,
Journal of Operations Management, 22, 557-573.

110
Drucker, P.E., 1989. What businesses can learn from nonprofits? Harvard Business
Review, (July-August), 88-93.
Eisenhardt, K.M., Santos, F.M., 2002. Knowledge-based view: A new theory of strategy?
A. Pettigrew, H. Thomas, R. Whittington, eds. Handbook of Strategy and
Management. Sage Publications, London, UK 139–164.
Fabbe-Costes, N, Jahre, M., 2008. Supply chain integration and performance: A review
of the evidence, The International Journal of Logistics Management, 19 (2), 130-
154.
Feeding America, 2010. Hunger Study 2010. Feeding America Chicago, IL
<http://feedingamerica.org/hunger-in-america/hunger-studies/hunger-study-
2010.aspx>
Feeding America, 2012. Hunger Facts. Feeding America Chicago, IL <
http://feedingamerica.org/hunger-in-america/hunger-facts.aspx>
Flynn, B.B., Huo, B., Zhao, X., 2010. The impact of supply chain integration on
performance: A contingency and configuration approach, Journal of Operations
Management, 28, 58-71.
Frazier, G.L., 1999. Organizing and managing channels of distribution, Journal of
Academy of Marketing Science, 27 (2), 226-240.
Frohlich, M.T., and Westbrook, R., 2001. Arcs of integration: an international study of
supply chain strategies, Journal of Operations Management, 19, 185-200.
Frohlich, M.T., Westbrook, R., 2002. Demand chain management in manufacturing and
services: web-based integration, drivers and performance, Journal of Operations
Management, 20, 729-745.
Germain, R., Iyer, K.N.S., 2006. The integration of internal and downstream integration
and its association with performance, Journal of Business Logistics, 27 (2), 29-52.
Gerwin, D., Barrowman, N.J., 2002. An evaluation of research on integrated product
development. Management Science, 48 (7), 938–953.
Gimenez, C., Ventura, E., 2003. Supply chain management as a competitive advantage in
the Spanish grocery sector, International Journal of Logistics Management, 14
(1), 77-88.
Gimenez, C., Ventura, E., 2005. Logistics-production, logistics-marketing, and external
integration: Their impact on performance, International Journal of Operations
and Production Management, 25(1), 20-38.

111
Greene, W., 1997. Econometric Analysis. Prentice Hall, NJ.
Griffis, S.E., Rao, S., Goldsby, T.J., Niranjan, T.T., 2012. The customer consequences of
returns in online retailing: An empirical analysis, Journal of Operations
Management, 30, 282-294.
Hair, J.F., Anderson , R.E., Tatham, R.L., Black, W.C., 1998. Multivariate Data Analysis,
5th ed. Prentice Hall, Upper Saddle River, NJ.
Handfield, R., Petersen, K., Cousins, P., Lawson, B., 2009. An organizational
entrepreneurship model of supply management integration and performance
outcomes, International Journal of Operations and Production Management,
Vol.29 (2), 100-126.
Hansen, M.T., Nohria, N., Tierney, T., 1999. What’s your strategy for managing
knowledge?, Harvard Business Review, March-April, 106-116
Homburg, C., Workman, J. P., Jensen, O., 2000. Fundamental changes in marketing
organization: The movement toward a customer-focused organizational structure,
Journal of the Academy of Marketing Science, 28 (4), 459-478.
Howard, M., Squire, B., 2007. Modularization and the impact on supply relationships,
International Journal of Operations and Production Management, 27 (11), 1192-
1212.
Hu, L., Bentler, P.M., 1998. Fit indices in covariance structure modeling: Sensitivity to
underparameterized model misspecification, Psychological Methods, 3 (4), 424-
453.
Hunter, J.E., Schmidt, F.L., 1990. Methods of Meta-Analysis - Correcting Bias in
Research Findings, first ed. Sage Publications, Thousand Oaks, California.
Hunter, J.E., Schmidt, F.L., 2004. Methods of Meta-Analysis - Correcting Bias in
Research Findings, second ed. Sage Publications, Thousand Oaks, California.
Iyer, K.N.S., Germain, R., Frankwick, G.L., 2004. Supply chain B2B e-commerce and
time-based delivery performance, International Journal of Physical Distribution
and Logistics Management, 34 (8), 645-661.
Jacobs, M., Vickery, S.K., Dröge, C., 2007. The effects of product modularity on
competitive performance, International Journal of Operations and Production
Management, 27 (10), 1046-1068.
Jayaram, J., Xu, K., Nicolae, M., 2011. The direct and contingency effects of supplier
coordination and customer coordination on quality and flexibility performance,
International Journal of Production Research, 49 (1), 59-85.

112
Kang, S.C., Snell, S.A., 2009. Intellectual capital architectures and ambidextrous
learning: A framework for human resource management, 46 (1), 65-92.
Kekre, S., Srinivasan, K., 1990. Broader product line: A necessity to achieve success?,
Management Science, 36 (10), 1216-1231.
Kong, E., 2007. The strategic importance of intellectual capital in the non-profit sector,
Journal of Intellectual Capital, 8 (4), 721-731.
Koufteros, X., Vonderembse, M., Jayaram, J., 2005. Internal and external integration for
product development: The contingency effects of uncertainty, equivocality, and
platform strategy, Decision Sciences Journal, 36 (1), 97 – 133.
Koufteros, X.A., Lai, K.H., Cheng, T.C.E., 2007. ‘Black-Box' and 'Gray Box' Supplier
Integration in Product Development: Antecedents, Consequences and the
Moderating Role of Firm Size, Journal of Operations Management, 25 (4), 847-
870.
Koufteros, X., Rawski, G.E., Rupak, R., 2010., Organizational integration for product
development: The effects of glitches, on-time execution of engineering change
orders, and market success, Decision Sciences Journal, 41 (1), 49 – 80.
Kutner, M.H., Nachtsheim, C.J., Neter, J., Li, W., 2005. Applied Linear Statistical
Models. McGraw-Hill, NY.
Lambert, D.M., Harrington, T.C., 1990. Measuring non-response bias in customer service
mail surveys, Journal of Business Logistics, 11 (2), 5–25
Lawson, B., Cousins, P.D., Handfield, R.B., Petersen, K.J., 2009. Strategic purchasing,
supply management practices and buyer performance improvement: an empirical
study of UK manufacturing organizations, International Journal of Production
Research, 47 (10), 2649-2667.
Leana, C. R., Van Buren, H. J., 1999. Organizational social capital and employment
practices, Academy of Management Review, 24, 538-555.
Lee, H.L., Padmanabhan, V., Whang, S., 1997. Information distortion in a supply chain:
The bullwhip effect, Management Science, 43 (4), 546-558.
Lee, H.L., 2004. The triple-A supply chain, Harvard Business Review, October, 1-12.
Lee, B-C, Kim, P-S., Hong, K-S., Lee, I., 2010. Evaluating antecedents and consequences
of supply chain activities: an integrative perspective, International Journal of
Production Research, 48 (3), 657-682.

113
Littler, D., Leverick, F., Bruce, M., 1995. Factors affecting the process of collaborative
product development: A study of U.K. manufacturers of information and
communications technology products, Journal of Product Innovation
Management, 12 (1), 16-23.
Lukas, B.A., Hult, G.T.M., Ferrell, O.C., 1996. A theoretical perspective of the
antecedents and consequences of organizational learning in marketing channels,
Journal of Business Research, 36, 233-244.
Mackelprang, A.W., Nair, A., 2010. Relationship between just-in-time manufacturing
practices and performance: A meta-analytic investigation, Journal of Operations
Management, 28 (4), 283-302.
Malhotra, M., Grover, V., 1998. An Assessment of Survey Research in POM: from
Constructs to Theory, Journal of Operations Management, 16 (4), 407-425.
McWilliams, A., Siegel, D.S., Wright, P.M., 2006. Corporate social responsibility:
Strategic implications, Journal of Management Studies, 43 (1), 1-18.
Metters, R., 1997. Quantifying the bullwhip effect in supply chains, Journal of
Operations Management, 15 (2), 89-100.
Nair, A., 2006. Meta-analysis of the relationship between quality management practices
and firm performance – implications for quality management theory development,
Journal of Operations Management, 24 (6), 948-975.
Narasimhan, R., Das, A., 2001. The impact of purchasing integration and practices on
manufacturing performance, Journal of Operations Management, 19, 593-609.
Narasimhan, R., Kim, S.W., 2002. Effect of SCI on the relationship between
diversification and performance: evidence from Japanese and Korean firms,
Journal of Operations Management, 20, 303-323.
Nelson, R.R., Winter, S.G., 1982. An Evolutionary Theory of Economic Change.
Belknap Press/Harvard University Press, Cambridge.
Netemeyer, R.G., Bearden, W.O., Sharma, S., 2003. Scaling Procedures: Issues and
Applications, Sage Publications, CA.
Nunnally, J.C., 1978. Psychometric Theory. McGraw-Hill, NY.
O'Leary-Kelly, S.W., Vokurka, R.J., 1998. The empirical assessment of construct
validity, Journal of Operations Management, 16 (4), 387-405.

114
Paulraj, A., Chen, I.J., 2007. Environmental uncertainty and strategic supply
management: A resource dependence perspective and performance implications,
Journal of Supply Chain Management, Summer, 29-42.
Pagell, M., 2004. Understanding the factors that enable and inhibit the integration of
operations, purchasing, and logistics, Journal of Operations Management, 22 (5),
459-487.
Penrose, E. T., 1959. The Theory of the Growth of the Firm. Wiley, NY.
Podsakoff, P. M., Organ, D. W., 1986. Self-reports in organizational research: Problems
and prospects, Journal of Management, 12 (4), 531-544.
Prajogo, D., Chowdhury, M., Yeung, A.C.L., Cheng, T.C.E., 2012. The relationship
between supplier management and firm’s operational performance: A multi-
dimensional perspective, International Journal of Production Economics, 136,
123-130.
Ragatz, G.L., Handfield, R.B., Scannell, T.V., 1997. Success factors for integrating
suppliers into new product development, Journal of Product Innovation
Management, 14, 190-202.
Riches, G., 2002. Food banks and food security: Welfare reform, human rights and social
policy: Lessons from Canada, Social Policy and Administration, 36 (6), 648-663.
Rosenzweig, E.D., Roth, A.V., Dean Jr., J.W., 2003. The influence of an integration
strategy on competitive capabilities and business performance: An exploratory
study of consumer products manufacturers, Journal of Operations Management,
Vol 21, 437-456.
Saeed, K.A., Malhotra, M.K., Grover, V., 2005. Examining the impact of inter-
organizational systems on process efficiency and sourcing leverage in buyer-
supplier dyads, Decision Sciences Journal, 36 (3), 365 – 396.
Salmeron, J., Apte, A., 2010. Stochastic Optimization for Natural Disaster Asset
Prepositioning, Production and Operations Management, 19(5), 561-575.
Sanders, N.R., Premus, R., 2005. Modeling the relationship between firm IT capability,
collaboration, and performance, Journal of Business Logistics, 26 (1), 1-23.
Saraf, N., Langdon, C.S., Gosain, S., 2007. IS application capabilities and relational
value in interfirm partnerships, Information Systems Research, 18(3), 320-339.
Sawhney, M., Wolcott, R.C., Arroniz, I., 2006. The 12 different ways for companies to
innovate, Sloan Management Review, 47 (3), 128-143.

115
Schoenherr, T., Swink, M., 2012. Revisiting the arcs of integration: Cross-validations and
extensions, Journal of Operations Management, Vol 30, 99-115.
Sharma, S., Mukherjee, S., Kumar, A., Dillon, W.R., 2005. A simulation study to
investigate the use of cutoff values for assessing model fit in covariance structure
models, Journal of Business Research, 58 (7), 935-943.
Stank, T.P., Keller, S.B, Daugherty, P.J., 2001. Supply chain collaboration and logistical
service performance, Journal of Business Logistics, 22 (1), 29-48.
Stock, G.N., Greis, N.P., Kasarda, J.D., 2000. Enterprise logistics and supply chain
structure: The role of fit, Journal of Operations Management, 18, 531-547.
Stone, M.M., Bigelow, B. Crittenden, W.E., 1999. Research on strategic management in
non-profit organizations: synthesis, analysis, and future directions, Administration
and Society, 31 (3), 378-423.
Subramaniam, M., Youndt, M.A., 2005. The influence of intellectual capital on the types
of innovative capabilities, Academy Management Journal, 48(3) 450–463.
Swink, M., Narasimhan, R., Kim, S. W., 2005. Manufacturing practices and strategy
integration: Effects on cost efficiency, flexibility, and market-based performance,
Decision Sciences Journal, 36 (3), 427 – 457.
Swink, M., Narasimhan, R., Wang, C., 2007. Managing beyond the factory walls: Effects
of four types of strategic integration on manufacturing plant performance, Journal
of Operations Management, Vol 25, 148-164.
Tabachnick, B.G., Fidell, L.S., 2007. Using multivariate statistics. Pearson, MA.
The Global Foodbanking Network. 2012. What is foodbanking?
<http://www.foodbanking.org/site/PageServer?pagename=foodbanking_main >
Tracey, M., 2004. A holistic approach to NPD: New insights, Journal of Supply Chain
Management, Fall, 37-55.
Tsai, W., 2001. Knowledge transfer in intraorganizational networks: Effects of network
position and absorptive capacity on business unit innovation and performance,
Academy of Management Journal, 44 (5), 996-1004.
Van Wassenhove, L.N., 2006. Humanitarian aid logistics: supply chain management in
high gear, Journal of Operational Research Society, 57, 475-489.

116
Van Wassenhove, L.N., Martinez, A.J.P., 2012. Using OR to adapt supply chain
management best practices to humanitarian logistics, International Transactions in
Operational Research, 19, 307-322.
Vargas, G., Cardenas, L., Matarranz, J.L., 2000. Internal and external integration of
assembly manufacturing activities, International Journal of Operations and
Production Management, 20 (7), 809-822.
Vereecke, A., Muylle, S., 2006.Perofmance improvement through supply chain
collaboration in Europe, International Journal of Operations and Production
Management, 26 (11), 1176-1198.
Villena, V.H., Gomez-Mejia L.R., Revilla, E., 2009. The decision of the supply chain
executive to support or impede supply chain integration: A multidisciplinary
agency perspective, Decision Sciences Journal, 40 (4), 635 – 665.
Vijayasarathy, L.R., 2010. Supply integration: An investigation of its multi-
dimensionality and relational antecedents, International Journal of Production
Economics, Vol.124, 489-505.
Waddock, S.A., Graves, S.B., 1997. The corporate social performance - financial
performance link, Strategic Management Journal, 18 (4), 303-319.
Warshawsky, D.N., 2010. New power relations served here: The growth of food banking
in Chicago, Geoforum, 41, 763-775.
Webb, E., Campbell, D., Schwartz, R., Sechrest, L., Belew Grove, J., 1981. Non-Reactive
Measures in the Social Sciences, second ed. Houghton Mifflin Company, Boston.
Wong, C.Y., Boon-itt S., Wong, C.W.Y., 2011. The contingency effects of environmental
uncertainty on the relationship between supply chain integration and operational
performance, Journal of Operations Management, Vol 29, 604-615.
Wright, P.M., McMahan, G.C., 1992. Alternative theoretical perspectives for strategic
human resource management, Journal of Management, 18, 295-320.
Wright, P.M., McMahan, G.C., 2011. Exploring human capital: Putting human back into
strategic human resource management. Human Resource Management Journal, 21
(2), 93-104.
Yiu, D., Bruton, G.D., Lu, Y., 2005. Understanding Business Group Performance in an
Emerging Economy: Acquiring Resources and Capabilities in Order to Prosper,
Journal of Management Studies, 42 (1), 183-206.

117
Zellner, A., 1962. An efficient method of estimating seemingly unrelated regressions and
tests for aggregation bias. Journal of the American Statistical Association 57
(298), 348–368.

118
APPENDIX A
Table A.1 Summary of the articles used for meta-analysis
Paper Sample Method Operationalization SCI
practices
Operationalization of
performance
Key Findings
Wong et al.
(2011)
151 plants from
Thailand
automotive
industry
Structural Equation
Modeling
1. Internal Integration
2. Supplier Integration
3. Customer Integration
1. Delivery
2. Production Cost
3. Product Quality
4. Production Flexibility
Environmental uncertainty
has significant moderation
effect on the relationships
between various
integration-performance
pairs.
Schoenherr and
Swink (2012)
403 supply chain
professionals
1. Discriminant
Analysis
2. ANCOVA
1. Internal Integration
2. Supplier Integration
3. Customer Integration
1. Quality
2. Delivery
3. Flexibility
4. Cost
Frohlich and Westbrook's
framework is revisited. The
moderating role of internal
integration on the
relationship between arcs
of integration and
performance is
investigated. Results
indicate that internal
integration strengthens
some of the relationships
between external
integration measures and
performance.
118

119
Vereecke and
Muylle (2006)
374 firms from
European
countries
1. Factor Analysis
2. ANOVA
3. Correlations
1. Collaboration with
Supplier
2. Collaboration with
Customer
1. Cost
2. Flexibility
3. Quality
4. Delivery
5. Procurement
6. Time to Market
Empirical support was
found for the hypothesized
higher levels of
collaboration among
companies showing higher
performance improvement.
There was partial support
for the hypothesized
relationships.
Swink et al.
(2005)
57 North
American
manufacturing
plants
Structural Equation
Modeling
Strategic Integration 1. Process Flexibility
2. New Product
Flexibility
3. Cost Efficiency
4. Market-based
Performance
Strategy integration
impacts manufacturing cost
efficiency and new product
flexibility capabilities.
Strategy integration
moderates the relationship
between product-process
development, supplier
relationship management,
workforce development,
JIT flow, and process
quality management
practices and certain
manufacturing capabilities.
Manufacturing capabilities
mediate strategy
integration and market
based performance
relationship.
Swink et al.
(2007)
224 responses
from
manufacturing
plant managers
Path Analysis 1. Corporate Strategy
Integration
2. Product-process
Integration
3. Strategic Customer
Integration
4. Strategic Supplier
Integration
1. Cost
2. Quality
3. Delivery
4. Process Flexibility
5. New Product
Flexibility
6. Market Performance
7. Customer Satisfaction
Each type of integration
has varying levels of
impact on manufacturing
competitive capabilities.
119

120
Jayaram et al.
(2011)
197 responses
from Chinese
manufacturing
firms
Regression 1. Supplier
Coordination
2. Customer
Coordination
1. Quality Performance
2. Flexibility
Performance
Results support four direct
and positive relationships.
Some of the interaction
effects were significant.
Dröge et al.
(2004)
57 US
automotive
manufacturers
1. Canonical
Correlation
2. Regression
1. Supplier Integration
2. Customer Integration
1. Delivery Performance
2. Support Performance
Product/process strategy
(product modularity and
process modularity)
precede external
integration (supplier and
customer), which
ultimately impacts service
performance (support and
delivery). Customer
integration mediates the
linkages from modularity
variables to delivery, and
process modularity to
support performance.
Supplier integration only
mediates process
modularity and delivery
performance.
Danese and
Filippini (2010)
186
manufacturing
firms from
multiple
countries
Regression Inter-functional
Integration
NPD Time Performance Supplier involvement and
inter-functional integration
are moderators of the
relationship between
product modularity and
NPD time performance.
Modularity has a direct
impact on NPD time perf.
Inter-functional integration
moderates the relationship
whereas modularity
moderation hypothesis is
not supported.
120

121
Stank et al.
(2001)
306 firms from
US
Structural Equation
Modeling
1. Internal Integration
2. External Integration
Logistical Service
Performance
Internal collaboration
positively impacts firm
performance but external
collaboration doesn’t have
a direct effect. Internal and
external collaboration are
significantly correlated.
Tracey (2004) 180
manufacturing
firms
Path Analysis 1. Integrated Product
Development – Internal
2. Integrated Product
Development –
Supplier Involvement
3. Integrated Product
Development -
Customer Involvement
1. Manufacturing
Efficiency
2. Manufacturing Agility
3. Delivery Service
4. Organizational
Performance
Integration on each aspect
leads to higher
manufacturing efficiency
and manufacturing agility,
hence, delivery service and
ultimately organizational
performance.
Devaraj et al.
(2007)
120 responses Structural Equation
Modeling
Production Information
Integration
1. Supplier Integration
2. Customer Integration
1. Cost
2. Quality
3. Flexibility
4. Delivery
Supplier integration
impacts performance.
Customer integration effect
is non-significant.
Flynn et al.
(2010)
617 responses
from Chinese
firms
1. Regression
2. Cluster Analysis
1. Supplier Integration
2. Customer Integration
3. Internal Integration
1. Operational
Performance
2. Business Performance
Supply chain integration
influences both operational
and business performance.
Frohlich and
Westbrook
(2002)
485 responses
from UK based
firms
1. Discriminant
Analysis
2. ANOVA
1. Demand Integration
2. Supply Integration
Performance
1. Faster Delivery Time
2. Reduced Transaction
Costs
3. Greater Profitability
4. Enhanced Inventory
Turnover
Demand chain
management impacts
performance in
manufacturing
environment compared to
in service environment.
Cousins and
Menguc (2006)
142 responses
from UK based
firms
Regression Supply Chain
Integration
1. Supplier's Operational
Performance
2. Supplier's
Communication
Performance
Supply chain integration
impacts supplier’s
communication
performance but not its
operational performance.
121
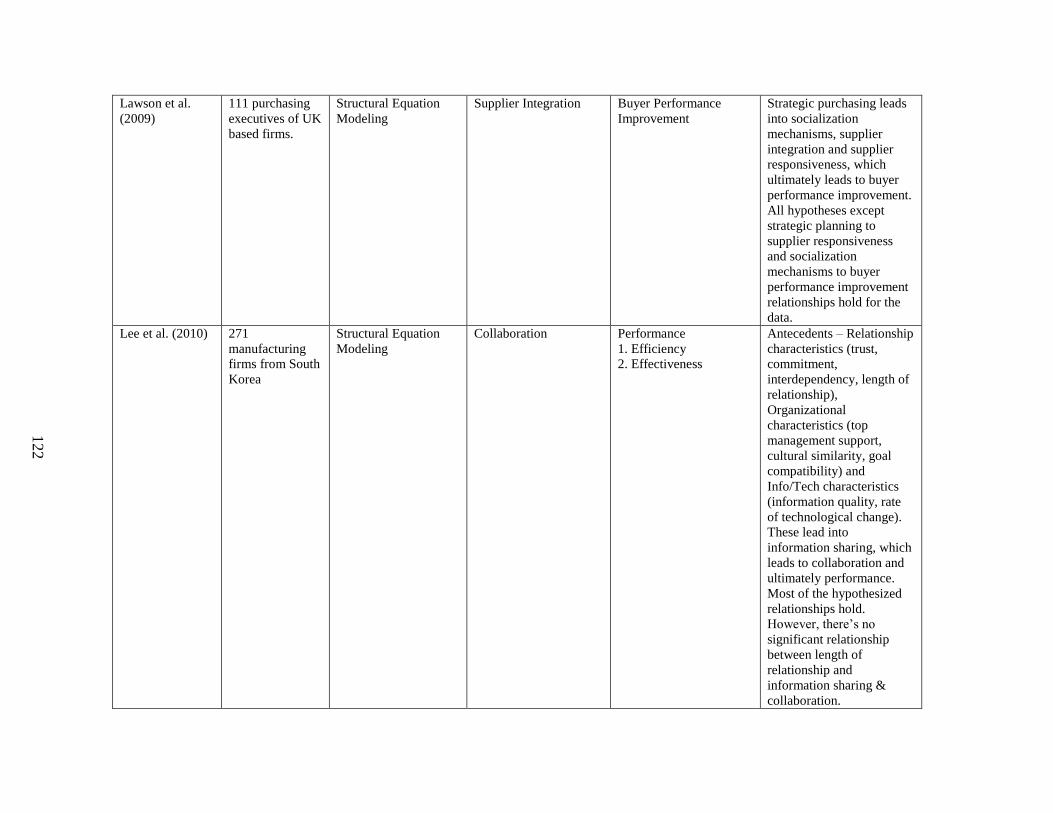
122
Lawson et al.
(2009)
111 purchasing
executives of UK
based firms.
Structural Equation
Modeling
Supplier Integration Buyer Performance
Improvement
Strategic purchasing leads
into socialization
mechanisms, supplier
integration and supplier
responsiveness, which
ultimately leads to buyer
performance improvement.
All hypotheses except
strategic planning to
supplier responsiveness
and socialization
mechanisms to buyer
performance improvement
relationships hold for the
data.
Lee et al. (2010) 271
manufacturing
firms from South
Korea
Structural Equation
Modeling
Collaboration Performance
1. Efficiency
2. Effectiveness
Antecedents – Relationship
characteristics (trust,
commitment,
interdependency, length of
relationship),
Organizational
characteristics (top
management support,
cultural similarity, goal
compatibility) and
Info/Tech characteristics
(information quality, rate
of technological change).
These lead into
information sharing, which
leads to collaboration and
ultimately performance.
Most of the hypothesized
relationships hold.
However, there’s no
significant relationship
between length of
relationship and
information sharing &
collaboration.
122

123
Handfield et al.
(2009)
151 UK based
firms
Structural Equation
Modeling
1. Cross-enterprise
Integration
2. Supplier Integration
1. Sourcing Enterprise
Performance
2. Buyer Financial
Performance
Supply market intelligence
and supply management
influence are antecedents
of the integration types.
The theoretical model is
supported. SM Intel. and
SM Influ. impact cross-
enterprise integration and
supplier integration, which
in turn impact sourcing
enterprise performance,
which ultimately impacts
buyer financial
performance.
Sanders and
Premus (2005)
245 US
manufacturing
firms
Structural Equation
Modeling
1. Internal
Collaboration 2.
External Collaboration
1. Cost
2. Quality
3. New Product
Introduction Time
4. Delivery Speed
Firm IT capability impacts
internal collaboration, and
external collaboration. It
also has a direct effect on
firm performance. External
collaboration impacts
internal collaboration and
internal collaboration
impacts firm performance.
Saeed et al.
(2005)
38 responses 1. Cluster Analysis
2. Regression
1. External Integration
2. Internal Integration
1. Process Efficiency
2. Sourcing Leverage
External integration, along
with inter-organizational
systems breadth and inter-
organizational systems
initiation, impacts the
performance variables.
123

124
Saraf et al.
(2007)
63 responses Partial Least Squares 1. IS integration with
customers
2. IS integration with
channel partners
Business Unit
Performance
Knowledge sharing with
customers, knowledge
sharing with partners,
process coupling with
customers, process
coupling with channel
partners mediate the
relationships between IS
integration and
performance. IS integration
with channel partners and
customers contributes to
both knowledge sharing
and process coupling with
both types of enterprise
partners. Process coupling
with customers and
knowledge sharing with
channel partners have sig
relationship with
performance.
Villena et al.
(2009)
133 Spanish
firms
Regression Supply Chain
Integration
Operational Performance
1. Productivity
2. Quality
3. Leadtime
4. Service Levels
Compensation risk and
employment risk precede
supply chain integration –
this relationship is
moderated by
environmental risk. Supply
chain integration impacts
operational performance.
Gimenez and
Ventura (2005)
64 Spanish
FMCG firms
Structural Equation
Modeling
1. Internal Integration -
Logistics / Production
2. Internal Integration -
Logistics / Marketing
3. External Integration
Logistics Performance Integration types influence
each other. Structural
model includes direct links
to performance and
correlations between the
integration types.
124

125
Chiang et al.
(2012)
144
manufacturing
firms
Structural Equation
Modeling
Internal Integration Firm’s supply chain
agility
1. Customer
responsiveness
2. Demand response
3. Joint planning
Internal integration takes
place in strategic sourcing
construct along with
strategic purchasing,
information sharing and
supplier development.
Both strategic sourcing and
strategic flexibility are
related to the firm’s supply
chain agility.
Cao and Zhang
(2011)
211 responses Structural Equation
Modeling
Supply Chain
Collaboration
1. Information Sharing
2. Goal Congruence
3. Decision
Synchronization
4. Incentive Alignment
5. Resource Sharing
6. Collaborative
Communication
7. Joint Knowledge
Creation
Firm Performance
1. Growth of Sales
2. Return on Investment
3. Growth in ROI
4. Profit Margin on Sales
Collaborative advantage is
a mediator. Firm size is a
moderator. Hypothesized
relationships hold at
varying levels in different
sized companies.
125

126
APPENDIX B
Table B.1 Measurement Items
Construct
Measurement Items Reference
Internal
Integration
1. Functional teams are aware of each other’s
responsibilities.
2. Functional teams have a common prioritization of clients
in case of supply shortages and how allocations will be
made.
3. Supply decisions are based on plans agreed upon by all
functional teams.
4. All functional teams use common metrics of performance
while coming up with supply chain operations plans.
5. Operational and tactical information is regularly
exchanged between functional teams.
6. Performance metrics promote rational trade-offs among
customer service and operational costs.
Schoenherr and
Swink (2012),
Koufteros et al.
(2005), Swink et
al. (2007)
Demand
Integration
1. We pursue client relationships and involvement that go
beyond service transactions.
2. Our plans address individual client requirements.
3. We have clearly defined roles and responsibilities for
managing client relationships.
4. We are constantly exploring new ways of utilizing client
input in our operations.
5. We synchronize our internal activities so that we can
serve to clients in need in a timely fashion.
Schoenherr and
Swink (2012),
Koufteros et al.
(2005), Swink et
al. (2007)

127
Supplier
Integration
1. We pursue supplier relationships and involvement that
go beyond daily operational transactions.
2. Our plans address individual suppliers’ capabilities.
3. We synchronize our activities with those of key
suppliers.
4. We exchange operational information with suppliers
on a regular basis.
5. We occasionally exchange operational information
with suppliers.
6. We are constantly exploring new working
relationships with suppliers.
Schoenherr and
Swink (2012),
Koufteros et al.
(2005), Swink et
al. (2007)
Human
Capital
1. Our employees are highly skilled.
2. Our employees are widely considered among the best
trained and educated in their particular fields.
3. Our employees are creative and bright.
4. Our employees are experts in their particular jobs and
functions.
5. Our employees develop new ideas and knowledge.
(Subramaniam
and Youndt,
2005)
Social Capital 1. Our employees are skilled at collaborating with each
other to diagnose and solve problems.
2. Our employees share information and learn from one
another.
3. Our employees interact and exchange ideas with
people from different areas of the food bank.
4. Our employees partner with clients, suppliers,
agencies etc., to develop solutions.
5. Our employees apply knowledge
from one area of the food bank to problems and
opportunities that arise in another.
(Subramaniam
and Youndt,
2005)

128
Organizational
Capital
1. Much of our food bank’s knowledge is contained in
manuals, databases, etc.
2. Our food bank’s culture (stories, rituals) contains
valuable ideas, ways of doing business, etc.
3. Our food bank embeds much of its knowledge and
information in structures, systems, and processes.
4. Our food bank strictly keeps detailed documentation of
the operations to preserve the knowledge.
(Subramaniam
and Youndt,
2005)
Environmental
Uncertainty
1. The suppliers consistently meet our requirements.
2. We have a high disposal rate of products that we
receive from our suppliers.
3. The volume and/or composition of demand is difficult
to predict.
4. We keep weeks of inventory of the critical/basic
products to meet the changing demand.
(Paulraj and
Chen, 2007)
Delivery 1. Our food bank is successful at achieving a high fill
rate for the communities in need. (Fill rate is the
proportion of orders immediately met by available
inventory)
2. Our food bank is successful at achieving timely
delivery of aid for the communities in need.
3. Our food bank is successful at reducing the lead time
of delivery of aid for the communities in need.
(Schoenherr and
Swink, 2012)

129
APPENDIX C
Survey Cover Letter
WAVE 1
You are invited to participate in a research study concerning supply chain practices in
food banks. The relationships of intellectual resources with supply chain operations in non-profit
organizations, and their resulting impact on performance are investigated in this project.
This survey, which contains questions on your perceptions and experiences regarding
your organization's operational practices, should take about 20 minutes to complete. By
receiving this email, you are eligible to enter your email address into a drawing for a chance to
receive a donation for your food bank. The amount to be donated will be dependent on the total
number of participating food banks. For each response, $5 will be added to the donation pool. If
all of the US based food banks currently listed in Feeding America's website participate in the
survey, the total maximum amount will be $1,010. If the number of participating food banks is
less than 202, the donation amount will be determined by multiplying the number of participants
by $5. The greater the number of the participating food banks, the bigger the donation will be.
Below, you will be asked to enter your email address so that I may enter your food bank
into the drawing for the donation. One email address, which is affiliated with one food bank will
be drawn, receiving the food bank donation that may be up to $1,010. Only one food bank will
receive the donation. The result of this drawing will be announced to all the participants who
include an email address. Email addresses will be destroyed once the drawing is complete. No
identifying information will be stored with your survey responses. You should also indicate if
you would like to receive an executive summary of the results after the study is completed.
To be eligible for the drawing, you must access the survey by 10/31/2012.
*No individual participants will be identified in the results of this study; only group statistics will
be published.
*Participation presents no risk to you whatsoever.
*Your personal scores will not be published separately.
*The author will never disclose any personal information regarding you or any other participants.
Your participation is completely voluntary, and only I will have access to your responses.
For more information concerning this research, you can contact me:
Cigdem Ataseven

130
PhD Candidate
Department of Management Science
Darla Moore School of Business
University of South Carolina
Columbia, SC
Thank you for your interest in this research study!
WAVE 2
You are invited to participate in a research study concerning supply chain practices in
food banks. The relationships of intellectual resources with supply chain operations in non-profit
organizations, and their resulting impact on performance are investigated in the project.
This survey, which contains questions on your perceptions and experiences regarding
your organization's operational practices, should take about 20 minutes to complete.
You should indicate if you would like to receive an executive summary of the results
after the study is completed.
*No individual participants will be identified in the results of this study; only group statistics will
be published.
*Participation presents no risk to you whatsoever.
*Your personal scores will not be published separately.
*The author will never disclose any personal information regarding you or any other
participants.
Your participation is completely voluntary, and only I will have access to your responses.
For more information concerning this research, you can contact me:
Cigdem Ataseven
PhD Candidate
Department of Management Science
Darla Moore School of Business
University of South Carolina
Columbia, SC
Thank you for your interest in this research study!


![QUANTIFICATION OF OPERATIONAL RISKS IN BANKS … · QUANTIFICATION OF OPERATIONAL RISKS IN BANKS: ... provisions, pricing, margin income and budgeting [13], ... Many tests can be](https://img.dokumen.tips/doc/110x75/5b3224f87f8b9ae1108c3162/quantification-of-operational-risks-in-banks-quantification-of-operational-risks.jpg)


