Embed Size (px)
Citation preview
NEBOJSA DIMIC
Essays on Emerging Market Finance
ACTA WASAENSIA 384
BUSINESS ADMINISTRATION

ACADEMIC DISSERTATION
To be presented, with the permission of the Board of the Faculty of Business Studies of the University of Vaasa, for public dissertation
in Auditorium Nissi (K218) on the 3rd of November, 2017, at noon.
Reviewers Professor Laurens Swinkels Erasmus University Rotterdam, Erasmus School of Economics, Finance Department and Erasmus Research Institute of Management P.O. Box 1738 3000 DR ROTTERDAM NETHERLANDS
Professor Piotr Korczak University of Bristol, School of Economics, Finance and Management, Department of Accounting and Finance Priory Road Complex, Priory Road BRISTOL BS8 1TU UNITED KINGDOM

III
Julkaisija Julkaisupäivämäärä Vaasan yliopisto Marraskuu 2017 Tekijä(t) Julkaisun tyyppi Nebojsa Dimic Artikkeliväitöskirja
Julkaisusarjan nimi, osan numero Acta Wasaensia, 384
Yhteystiedot ISBN Vaasan yliopisto Kauppatieteellinen tiedekunta Laskentatoimi ja rahoitus PL 700 FI-65101 VAASA
978-952-476-766-8 (painettu) 978-952-476-767-5 (verkkoaineisto) ISSN 0355-2667 (Acta Wasaensia 384, painettu) 2323-9123 (Acta Wasaensia 384, verkkoaineisto) Sivumäärä Kieli 106 englanti
Julkaisun nimike Esseitä kehittyvien talouksien pääomamarkkinoista Tiivistelmä Väitöskirjan tavoitteena on tutkia kehittyvien markkinoiden tärkeimpien omaisuusluokkien ominaisuuksia. Neljässä erillisessä esseessä tarkastellaan kehittyvien markkinoiden osake- ja joukkovelkakirjamarkkinoiden ominaispiirteitä. Ensimmäisessä esseessä tutkitaan kehit-tyvien markkinoiden osakkeiden ja joukkovelkakirjalainojen välistä korrelaatiota. Tulokset osoittavat, että osakkeiden ja joukkovelkakirjalainojen väliseen korrelaatioon vaikuttaa merkittävästi valittu aikaperiodi. Lyhyen aikavälin korrelaatio voi muuttua nopeasti, ollen negatiivinen suurimman osan ajasta, kun taas pitkän aikavälin korrelaatio pysyy positiivise-na suurimman osan ajasta. Tärkeimmät selittävät tekijät osakkeiden ja joukkovelkakirja-lainojen väliselle korrelaatiolle ovat keskuspankkien rahapolitiikka, inflaatio ja osake-markkinoiden epävarmuus. Toisessa esseessä tutkitaan sijoituspäätösten ajoittamista kehittyvien markkinoiden osakkeiden ja joukkovelkakirjalainojen hintasuhteita hyödyn-tämällä. Tulokset osoittavat, että kehittyvien markkinoiden joukkovelkakirjalainoilla on osakkeille tyypillisiä piirteitä, eikä niitä siitä syystä tulisi pitää turvallisina sijoituksina suhteessa kehittyvien markkinoiden osakkeisiin.
Väitöskirjan kolmas essee keskittyy erityisesti analysoimaan poliittisen riskitekijän vaikutusta osaketuottoihin kehittyneissä, kehittyvissä sekä reunamarkkinoihin kuuluvissa maissa. Tulokset osoittavat, että poliittinen riskitekijä on hinnoiteltu osakkeisiin kaikilla tutkituilla osakemarkkinoilla, mutta myös eroavaisuuksia löytyy markkinoiden välillä. Neljäs essee laajentaa väitöskirjan ulottuvuutta ja tarkastelee yritysten kansainvälistä velka-rahoitusta. Tulokset osoittavat, että yhdysvaltalaisten yritysten kansainvälistymisestä saamat hyödyt eroavat merkitsevästi riippuen siitä, mihin maahan ne kansainvälistyvät. Joukkovelkakirjojen liikkeellelasku kehittyvissä maissa vaikuttaa haitallisesti yritysten markkina-arvoon, kun taas kehittyneistä maista haettu velkarahoitus nostaa markkina-arvoa. Asiasanat Kehittyvien markkinoiden osakkeet, kehittyvien markkinoiden velkakirjat, poliittinen riski, kansainvälistyminen


V
Publisher Date of publication Vaasan yliopisto November 2017 Author(s) Type of publication Nebojsa Dimic Doctoral thesis by publication
Name and number of series Acta Wasaensia, 384
Contact information ISBN University of Vaasa Faculty of Business Studies Accounting and Finance P.O. Box 700 FI-65101 Vaasa Finland
978-952-476-766-8 (print) 978-952-476-767-5 (online) ISSN 0355-2667 (Acta Wasaensia 384, print) 2323-9123 (Acta Wasaensia 384, online) Number of pages Language 106 English
Title of publication Essays on Emerging Market Finance Abstract This thesis studies various aspects of major financial asset classes in emerging markets. Four interrelated essays explore the attributes and investigate the risk characteristics of equity and debt markets in emerging countries. The first essay examines the relationship between the emerging market stocks and bonds. The results show that time-varying stock-bond correlation patterns vary significantly between time horizons. In the short horizon, the correlation changes the sign rapidly showing sustainable negative episodes, while in the long horizon the correlation stays positive most of the time. Important factors influencing stock-bond correlation are monetary policy stance, inflation and stock market uncertainty. The second essay studies the characteristics of emerging market stocks and bonds by using their relative yields as a foundation for various market timing investment strategies. The findings demonstrate that emerging market bonds have equity-like characteristics and should not be assigned the properties of a safe investment relative to emerging market stocks.
The third essay focuses specifically on risk characteristics of emerging equity markets by investigating how determinants of political risk factor affect stock returns of developed, emerging and frontier markets. The results show that composite political risk is priced in all three stock market categories, but the effect of individual components varies across different markets. The fourth essay extends the scope of the dissertation and examines the issues surrounding the cross-border raising of debt capital in developed and emerging market environments. The results reveal that the benefits of internationalization for US firms differ sharply depending on the specific market into which they internationalize. Firms that issue debt to emerging markets experience a negative valuation effect while internationalization improves valuation for firms issuing debt in developed markets. Keywords Emerging Market Stocks, Emerging Market Bonds, Political Risk, Internationalization


DEDICATION
This work is dedicated to my parents,
Mirko and Gordana Dimic.


IX
ACKNOWLEDGEMENTS
The completion of the dissertation is truly a special moment in my life and an important cornerstone for my future. Writing this dissertation has been an intense learning period for me, not just academically but also on a personal level. In the following paragraphs I would like to reflect on numerus people that helped me throughout this process.
First of all, I would like to express my gratitude to my friend and supervisor Professor Janne Äijö, who noticed my potential, always guided me to the right direction, believed in me and provided support from the day one. Special acknowledgement is owed to Professor Sami Vähämaa who showed me, by his example, what a good teacher and researcher should be.
Also, I am very thankful to pre-examiners of the dissertation, Professor Laurens Swinkels from the Erasmus University Rotterdam, and Professor Piotr Korczak from the University of Bristol. Their insights and valuable comments improved the overall quality of the dissertation.
I will always be grateful to my dearest friend, Professor Vitaly Orlov who helped me throughout this process more than I could ever give him credit for here. We went through a lot together during these past few years, good and bad times, accomplishments and downturns on both personal and professional level. I am very excited about our future professional cooperation and more importantly, friendship. I am very thankful to Professor Vanja Piljak, for being a great friend, coauthoring papers with me, giving professional advices, sharing her experiences and encouraging me in any possible way. Special thanks go to all of my colleagues from the Department of Accounting and Finance at the University of Vaasa and especially Professor Timo Rothovious as the head of the department. I also wish to thank Professor Klaus Grobys and Antti Klemola for the support and friendship during all these years.
During my studies I was fortunate to make a research visit at the Alliance Business School, University of Manchester, UK. I wish to thank Professor Mike Bowe for inviting me as a visiting scholar and being the best possible host during the entire duration of research visit in Manchester. I would also like to acknowledge the Graduate School of Finance (GSF) and its director Dr. Mikko Leppämäki for organizing high-quality doctoral courses and research seminars that extended significantly my knowledge in Finance and enhanced my understanding of scientific research.

X
I wish to thank the University of Vaasa for employing me and providing an excellent working environment during my PhD studies. Furthermore, I gratefully acknowledge the financial support for my dissertation from Säästöpankki Group Research Foundation, OP-Pohjola Group Research Founadation and Marcus Wallenberg Foundation.
Over the last few years, the essays included in this dissertation have been presented at many conferences and workshops. Thus, I wish to thank all of the discussants and participants at the Southern Finance Association Annual Meeting (Key West, 2017), the INFINITI Conference on International Finance (Dublin, 2016 and Valencia, 2017), the Australasian Finance and Banking Conference (Sydney, 2016), the Financial Management Association (FMA) Annual European Conference (Helsinki, 2016), the Graduate School of Finance (GSF) and the Finnish Doctoral Programme in Economics (FDPE) Workshop in Finance (Helsinki, 2016), the Midwest Finance Association Annual Meeting (Chicago, 2015), and the Paris Financial Management Conference (Paris, 2014).
Finally, I wish to express my deepest gratitude to my family. My parents, Mirko and Gordana have sacrificed a lot for me, always believed in me and provided constant support, encouraged me to move forward during hard times and gave me unconditional love. They are the perfect parents to me, my heroes and role models and this work is dedicated to them. Last but certainly not least, I am grateful to my brothers, Nikola and Aleksa for their love, understanding and motivation. I could not be able to complete this work without their support.
Vaasa, August 2017
Nebojsa Dimic
XI
Contents
ACKNOWLEDGEMENTS ........................................................................... IX
1 INTRODUCTION ................................................................................. 1
2 CONTRIBUTION OF THE DISSERTATION .............................................. 3
3 THEORETHICAL BACKGROUND ........................................................... 5 3.1 International diversification ..................................................... 5 3.2 Financial integration ................................................................ 6
4 EMERGING MARKET FINANCE ............................................................. 8 4.1 Relationship between stocks and bonds ................................... 9
4.1.1 Emerging markets’ stock-bond relationship .................. 10 4.2 Uncertainty in emerging markets ........................................... 11 4.3 Firm internationalization in emerging markets ....................... 12
5 SUMMARY OF THE ESSAYS ............................................................... 15 5.1 Impact of Financial Market Uncertainty and Macroeconomic
Factors on Stock-Bond Correlation in Emerging Markets ......... 15 5.2 Bond–Equity Yield Ratio Market Timing in Emerging Markets . 16 5.3 Political Risk Factor in Emerging, Frontier, and Developed
Stock Markets ........................................................................ 17 5.4 Internationalization and firm valuation: New evidence from
foreign debt issuances of US firms ......................................... 18
REFERENCES .......................................................................................... 20

XIII
This thesis consists of an introductory chapter and the following four essays:
1. Dimic, N., Kiviaho, J., Piljak, V. and Äijö, J. (2016). Impact of Financial MarketUncertainty and Macroeconomic Factors on Stock-Bond Correlation in Emerging Markets. Research in International Business and Finance 36, 41-51.1
2. Dimic, N., Orlov, V. and Äijö, J. (2016). Bond -Equity Yield Ratio Investing inEmerging Markets. Journal of Emerging Market Finance, Forthcoming.2
3. Dimic, N., Orlov, V. and Piljak, V. (2015). The Political Risk Factor in Emerging,Frontier, and Developed Stock Markets. Finance Research Letters 15, 239-245.3
4. Dimic, N. (2017). Internationalization and firm valuation: New evidence fromforeign debt issuances of US firms. Proceedings of the Graduate School ofFinance (GSF) and the Finnish Doctoral Programme in Economics (FDPE)Workshop in Finance; Proceedings of the 15th INFINITI Conference onInternational Finance; and Proceedings of the 2017 Southern FinanceAssociation Annual Meeting.
1 Printed with kind permission of Elsevier. 2 Printed with kind permission of SAGE Publications. 3 Printed with kind permission of Elsevier.

1 INTRODUCTION
This doctoral dissertation investigates various aspects of major financial asset classes in emerging markets through its four constituent essays. Specifically, the first and second essays examine the relationship between the equity and debt markets in emerging countries. The third essay focuses specifically on the risk characteristics of emerging equity markets. The fourth essay extends the scope of the dissertation and examines the issues surrounding the cross-border raising of debt capital in developed and emerging market environments.
The impact of emerging markets on the global economy has increased drastically in recent decades. Emerging countries containing the majority of the world’s land and population represent the major force in the global economy, and have superior rates of economic growth relative to the developed countries. Assets from emerging markets, characterized by high returns accompanied by high levels of volatility, offer unique opportunities for both investors seeking diversification benefits and researchers utilizing the aforementioned characteristics to test existing financial theories. Further, finance in emerging markets has evolved into an important but challenging area of research. Although much has been learned about emerging economies, our knowledge is still far from complete on many issues. Further academic research progress is essential in order to fully understand these markets. This dissertation proceeds on the basis of the above-mentioned facts and focuses on various contemporary topics in the realm of emerging market finance.
The purpose of this dissertation is to explore the attributes and investigate the risk characteristics of major asset classes in emerging markets. Understanding the features of emerging markets stocks and bonds is important for academics, investors, and policy makers. Academics are interested in understanding the mechanisms linking the major asset classes, investors seek returns and the diversification properties of stock and bond markets, while policy makers utilize the characteristics of stocks and bonds to improve capital allocation functions and strengthen the financial system (Baker and Wurgler, 2012). Additionally, this dissertation acknowledges that one distinguished feature of an emerging market is its vulnerability to political uncertainty, and pays particular attention to the political risks arising from emerging countries. Finally, as most of the previous literature on emerging market finance has focused on country level aggregate indices, it is of great interest to examine the behavior of individual firms operating in the unique environments of emerging economies. Therefore, this dissertation

2 Acta Wasaensia
expands the existing literature on emerging market finance and reveals novel evidence consolidating its firm level analysis. In this manner, building on classic evidence and recent contributions in the literature, this dissertation provides evidence on different aspects of emerging markets.
The reminder of this introductory chapter is organized as follows. Section 2 outlines the contribution of the dissertation as a whole and of each individual essay. Section 3 outlines the theoretical foundations of the dissertation, including portfolio diversification theory and the issues associated with financial integration of the markets. Section 4 provides the theoretical background of the essays included in the dissertation. Finally, Section 5 summarizes the four essays that comprise the dissertation.
Acta Wasaensia 3
2 CONTRIBUTION OF THE DISSERTATION
This dissertation contributes to the international finance literature by providing new evidence on various aspects of emerging markets in four related essays. The first essay examines the relationship between emerging market stocks and bonds at different time horizons. In addition, this essay investigates both the global and domestic fundamental forces driving this relationship. The second essay approaches the topic of the stock-bond relationship from the practical perspective, and investigates the market timing ability of emerging market stock and bond yields. The third essay examines the risk-based characteristics of emerging market stocks while focusing on the political uncertainty originating in emerging countries. The fourth essay shifts the focus on to individual firms, and examines the effects of cross-border debt issuance in emerging and developed markets.
This dissertation makes a contribution to the international finance literature, as each of the constituent essays adds to specific streams of emerging markets literature related to the relationship and attributes of stock and bond markets, international portfolio diversification, market timing, risk-based explanations of stock returns, financial market uncertainty, political risk sign paradox and bonding and segmentation theories of internationalizations. Moreover, the dissertation unites these several strands of literature and provides new evidence that illuminates each of them. The remainder of this chapter reports the detailed contribution of each essay in the dissertation.
The first essay of the dissertation contributes to the literature in three important ways. First, this essay adds to the literature on stock-bond correlation by providing new evidence on the impact of macroeconomic factors and global financial market uncertainty from the perspective of emerging markets. Second, by using the advantageous methodological framework of the wavelet analysis, this essay examines the differences in importance of macroeconomic and financial market uncertainty factors for the stock-bond correlations in long- and short-horizons. Third, this essay extends the literature on financial market uncertainty by examining connections between global bond market uncertainty and stock-bond correlations.
The second essay of the dissertation contributes to the literature in three important ways. First, the essay adds to the strand of literature investigating the market timing ability of bond–equity yields by providing new international evidence from emerging markets. The literature has traditionally focused on developed markets, and this is the first study to consider emerging markets as a separate category in the context of bond–equity yield ratio market timing. Second, by utilizing US

4 Acta Wasaensia
bonds as a safe asset and emerging markets’ stocks or bonds as risky assets in its analysis, this essay constructs new augmented bond–equity yield indicators that serve as a valuable relative pricing tool that can be used to dynamically allocate capital between safe and risky assets in the international setting. A third feature of this study is its providing evidence that emerging market bonds should not be assigned the properties of a safe investment relative to emerging market stocks. By comparing the performance of traditional and augmented BEYR-based strategies, this essay confirms the equity-like properties of emerging market bonds.
The third essay contributes to the strand of literature searching for specific risk-based explanations for equity market fluctuations. This essay makes two main contributions: First, it explores the role of the determinants of political risk in explaining stock returns across developed, emerging, and frontier markets and shows how the importance of individual components of political risk varies across the three categories. Second, this essay is the first study to consider frontier markets a separate category in the context of political risk.1 The frontier markets offer a unique setting in which to investigate the political risk–stock return relationship, given that they are characterized by a greater degree of political instability and considered an increasingly important source of alternative investments.
The fourth essay makes a contribution to the literature in the following ways. First, this essay adds to the debate on bonding and segmentation theories of firm internationalization by adopting a different angle. Previous studies focus on internationalization among emerging or other developed-market firms in the US equity markets marked by the issuing of depositary receipts, cross-listing, and raising equity capital through private or public placements. This essay extends the common ground covered in previous literature by examining US firms internationalizing in emerging and other developed markets by issuing debt, and provides broad evidence in support of segmentation theory. Further, the final essay of the dissertation provides evidence of the reverse bonding hypothesis where firms internationalizing into emerging market environments experience a negative impact on their valuation due to their detachment from good governance practices.
1 Frontier markets are regarded among investors as “small” or “new” emerging markets. The International Finance Corporation (IFC) introduced frontier markets as a special subset of emerging markets, characterized by relatively small trading, a short history, and high risk levels.
Acta Wasaensia 5
3 THEORETHICAL BACKGROUND
3.1 International diversification
Diversification by definition, means that a large volume of assets are included in a portfolio thus limiting the risk exposure of any particular asset (Bodie et al. 2009). The main benefit of diversification is the reduction of risk. A portfolio of only one stock is exposed to two types of risk: the risk from the general economy (e.g., business cycle movements, inflation, interest rates etc.) and the risk specific to that particular company or the industry the company is in. However, including other stocks from different companies and different industries in the portfolio reduces the risk considerably as the firm-specific risk is spread to many stocks and its influence on the whole portfolio is significantly reduced. Therefore, by adding more and different stocks to the portfolio, eventually, the firm-specific risk (also called unique risk, nonsystematic risk, or diversifiable risk) influence can almost completely disappear. The portfolio will be affected only by the macroeconomic risk of the whole economy (also called market risk, systematic risk, or non-diversifiable risk). Accordingly, investors benefit by investing in broader ranges of securities.
“If wider range of investment choices can benefit investors, why should we limit ourselves to purely domestic assets?” (Bodie et al. 2009). Recent trends in globalization (e.g., efficient communication technology and increasing regulations) lead to progress in international diversification as the risk reduction tool . In addition to its ability to reduce risk, international diversification is justified even if expected returns are lower internationally than domestically; for although taxes and currency restrictions represent potential threats, international diversification is generally profitable (Elton and Gruber 1997).
Taking the standpoint of a US investor, Elton et al. (1995) calculate international diversification portfolio benefits with the aid of the following formula. Investors should hold non-US securities as long as:
> , (1)
where: = the expected return on the non-US securities in dollars

6 Acta Wasaensia
= the risk-free rate of interest
= the expected return on US securities = the standard deviation of non-US securities in dollars
, = the correlation between US securities and non-US securities
and = the standard deviation of US securities
According to Elton et al. (1995), as long as the expression in the last set of parentheses of the equation is less than one, the international diversification will be profitable, even if the expected returns are lower than those on the domestic market. Pioneering studies on international diversification like Levy and Sarnat (1970), Solnik (1974), Errunza (1977) and Lessard (1990) demonstrated that diversification reduces risk and can be beneficial specifically in case of allocating capital into emerging and less-developed countries.
Nevertheless, others disagree. Hanna at al. (1999) question the international diversification benefits due to the progress of globalization and the increased integration of financial markets. Bhargava et al. (2004) argue that the international diversification benefits are still present, but are decreasing, owing to the world markets becoming highly correlated with that of the USA. Further, the potential threat to diversification into emerging markets can be exchange rate risk and the political risk. The instability of foreign governments and inappropriate monetary and fiscal policies can result in serious damage to the portfolio profits.
3.2 Financial integration
Financial market integration is the process of unification of the markets. Integrated markets have unified risk-adjusted returns for similar maturity assets. Financial markets around the world have experienced increased integration in recent decades influenced by globalization and advances in informational technology. The global financial crisis in the 1990s, and especially that in the 2000s, accelerated the process of integration among the markets. The integration process started among the developed countries. After the world’s major economies became integrated to a large extent, emerging economies started the removal of restrictions on pricing on many financial assets and therefore started their process of financial integration with the developed countries. The result was more mobile

Acta Wasaensia 7
capital across the countries additionally aided by technological developments (Central Bank of India 2006).
Different segments of financial markets do not integrate in the same way since they trade various types of financial instruments. Some market segments are domestic in nature while others are international. For instance, foreign exchange and stock markets are international in nature because they deal with cross-border transactions and the listing of foreign securities, and because of the involvement of foreign investors. On the other side, money and credit financial market segments are domestic in nature, since they mostly involve banks and other financial institutions operating domestically.
There are three dimensions of financial integration: the global, national, and regional dimensions (Reddy 2002). Global financial integration involves opening up the markets and financial institutions to free cross-border financial services and the flow of capital. Additionally, the barriers such as capital controls, withholding taxes, and obstacles to the movement of technology and people are removed. One of the goals of global integration is to balance the national standards and laws across countries (Reddy 2002). The second dimension of integration is regional financial integration. Regional integration arises due to ties between the countries in a certain geographic region. It is far more achievable than global financial integration due to the tendency of markets to concentrate in a certain geographical center. Regional integration is important for national economies because it also promotes the development of domestic financial markets. The most easily attainable dimension of integration happens at the domestic level. Domestic financial integration involves the linkage of different domestic financial segments. Some financial institutions, such as intermediaries, help to accelerate this integration due to their business operating concurrently in two or more market segments. For example, commercial banks work with savings and loan markets simultaneously (Central Bank of India 2006).
Financial market integration brings many benefits to countries but also some risks. The major risk of financial integration is the possibility of contagion: a subject widely studied during the 1990s and 2000s global financial crises. Contagion problems during the recent financial crisis caused many researchers to question the claimed benefits of global financial integration, and to decide that it ultimately brings global financial instability (Stiglitz 2002; Bhagwati 1998). The threat of systematic instability is present in the case of both domestic and global integration as complications from one market are easily transferred to another.
8 Acta Wasaensia
4 EMERGING MARKET FINANCE
The term emerging market is commonly used in the literature; however, there is no generally agreed definition of what constitutes an emerging market . Bekaert and Harvey (2002) refer to an emerging market as one that gradually “emerges” from less-developed status to join the group of developed countries. Further, The World Bank classifies these markets based on a GDP that falls below a certain barrier and grows over time. Emerging markets have been a major driver of the world’s economic growth in recent decades. These markets are characterized by high returns accompanied by high levels of volatility. Accordingly, emerging markets provide a very interesting environment both for investors seeking diversification benefits for their portfolios and for academic researchers using the specific circumstances arising in these markets to test standard theories and models.
Emerging markets are positioned between developed markets (such as those of the USA, Japan, and the core European countries) and frontier markets (characterized by thin trading activity, a short history, and excessive risk levels). In particular, four giants of the emerging markets worldwide are the so-called BRIC countries: Brazil, Russia, India, and China. Further, this nucleus of emerging markets extends to CIVETS countries, smaller in size but with a diverse and dynamic economy and a youthful growing population: these are Colombia, Indonesia, Vietnam, Egypt, Turkey, and South Africa. In 2001, Goldman Sachs named the “Next 11” emerging markets: Bangladesh, Egypt, Indonesia, Iran, Korea, Mexico, Nigeria, Pakistan, the Philippines, Turkey, and Vietnam. Next 11 emerging countries are growth markets widely regarded as the most likely to rise quickly in economic prominence over the coming decades. It is important to note that some of the emerging markets are relatively wealthy countries; however, their economies are still considered underdeveloped especially when viewed from the regulatory point of view.
Most of the academic research in finance has been focused on developed countries because these markets offer conditions that are in most cases consistent with the assumptions in existing theoretical models. However, emerging markets can challenge the applicability of our existing models and prompt the creation of new ones (Bekaert and Harvey 2002). Therefore, despite the issue of data availability, academic researchers have devoted considerable attention to emerging markets in recent decades.2 Emerging markets have attracted a great deal of interdisciplinary
2 Data on emerging markets have fairly short histories on major databases. The first reliable time series of data from one of the biggest data providers on emerging markets, the Morgan Stanley Capital International (MSCI) database, starts in the 1990s.

Acta Wasaensia 9
interest that spans investments, corporate finance, international economics, political science, and developmental economics.
The main avenues of research in the field of emerging market finance are: (i) understanding the specific risk-return relationship in emerging countries, and identifying global and local risk factors affecting this relationship (Bailey and Chang, 1995; Erb et al., 1996a; Bekaert and Harvey, 1997; Pajuste et al., 2000; Bilson et al., 2002; Mateus 2004; De Jong and De Roon, 2005), (ii) identifying portfolio diversification opportunities in emerging markets (Bekaert and Urias, 1996; Driessen and Laeven, 2007; Li and Majerowska, 2008), and (iii) the applicability of classic asset pricing models and theories of finance to the emerging market setting (Harvey, 1995; Cheng et al., 2010; Iqbal et al., 2010).
4.1 Relationship between stocks and bonds
Bonds and stocks have different risk-return characteristics. Generally, stocks are more volatile but offer higher returns than bonds, especially in the longer term. Practitioners, academics, and policy makers are interested in understanding the relationship between two major asset classes. The relationship between stocks and bonds is shaped by two effects. First, the “discount rate effect” suggests a negative relationship between bond and equity yields driven by the rationale that the cost of equity depends on prevailing interest rates, and accordingly that rising (falling) bond yields lead to lower (higher) stock prices (Giot & Petitjean, 2009). An alternative view called the “cash flow effect” proposes a positive correlation between stock prices and bond yields motivated by the argument that rising inflation drives bond yields as well as the growth of future nominal cash flow from equities up, which in turn raises equity prices as well. Nevertheless, the general agreement in stock-bond literature is that the discount rate effect should prevail during expansion periods, while the cash flow effect is more important during contractions (Boyd et al., 2005; Anderson et al., 2008).
The fluctuations of the economy between periods of expansion (growth) and contraction (recession) have an impact on market participants’ risk aversion, thereby also affecting the prices of stocks and bonds simultaneously (Gulko, 2002; Connolly et al., 2005; Andersson et al., 2008; Baur & Lucey, 2009). Government bonds, by definition, are deemed to be safe haven assets relative to stocks in developed markets. During times of financial turmoil, investors engage in a “flight-to-safety” as they substitute risky assets (stocks) for safer assets (bonds). Between 2004 and 2012 the Financial Times referred 1338 times to “flight-to-safety” or “flight-to-quality” phenomenon. Moreover, an active theoretical academic
10 Acta Wasaensia
literature study such phenomena (Barsky, 1989; Vayanos, 2004; Caballero and Krishnamurthy, 2008; Bekaert et al, 2009; Brunnermeier and Pedersen, 2009;). Beale et al. (2013) define a “flight-to-safety” event as a day characterized by positive bond returns, negative equity returns, negative stock-bond return correlation, and a market stress reflected in large equity return volatility. Major “flight-to-safety” episodes identified in Beale et al. (2013) are October 1987, the Russia crisis in 1998 and the Lehman bankruptcy 2008. Moreover, the “flight-to-safety” episodes coincide with increases in VIX and decrease in consumer sentiment indicators in USA, Germany and rest of OECD countries. Finally, Beale et al. (2013) note that stock and bond returns are likely to be positively correlated outside the “flight-to-safety” periods in their developed markets setup since both assets represent high duration assets.
However, the relationship between stock and bond prices is altered in emerging markets. Specifically, prices of both assets tend not to move in opposite directions during crisis periods. Subsequently, due to the specific country risk in emerging economies, domestic bond returns resemble “equity-like” securities and, in turn, the “flight-to-quality” phenomenon does not appear (Kelly et al., 1998).
4.1.1 Emerging markets’ stock-bond relationship
The literature on the relationship between stocks and bonds has traditionally focused on developed markets (Andersson et al., 2008; Campbell and Ammer, 1993; Cappiello et al., 2006; Ilmanen, 2003). The most prominent issue within this stream of literature is that examining the various factors driving stock-bond correlations. The debate on this issue remains open, as there is mixed evidence in the literature on the role of macroeconomic factors in driving stock-bond correlations. In particular, one segment of the literature documents the importance of the macroeconomic fundamentals, specifically inflation, the business cycle environment, and the monetary policy stance in explaining stock-bond correlations (Ilmanen, 2003; Li, 2004; Yang et al., 2009). Yang et al. (2009) provide convincing evidence of time-varying stock-bond correlations over macroeconomic conditions (the business cycle, the inflation environment, and monetary policy stance) by using data for the USA and the UK covering the past 150 years. Ilmanen (2003) points out how inflation is a key driver of stock-bond correlation. High inflation periods lead to changes in common discount rates that dominate cashflow expectations and lead to a positive correlation between the two asset classes. Further findings demonstrate that stocks tend to outperform bonds during the business cycle expansions, while bonds outperform stocks during the business cycle contraction periods. Finally, easing the monetary policy has a
Acta Wasaensia 11
positive effect on both stocks and bonds exhibiting the positive relation with the correlation of those two asset classes.
A more recent study by Aslanidis and Christiansen (2014) provides new insights into the role of macroeconomic fundamentals in explaining stock-bond correlations. They find that macroeconomic factors have only a slight explanatory power when the stock-bond correlation is largely positive; however, when the stock-bond correlation is largely negative, macroeconomic fundamentals are the most useful explanatory variables. The rationale behind this finding is that macroeconomic factors are important for bonds in all periods, while for stocks they are important only in very volatile periods.
One additional segment of the related literature provides evidence that stock market uncertainty plays an important role in explaining stock-bond correlations (Andersson et al., 2008; Connolly et al., 2005, 2007; Kim et al., 2006). The aforementioned studies use implied volatility from equity index options as a proxy for stock market uncertainty, and suggest that implied volatility changes have an impact on market participants’ risk aversion therefore affecting the stock-bond correlation. Those studies pay considerable attention to the flight-to-safety phenomenon, in which the correlation between stocks and bonds becomes significantly negative during periods of high market uncertainty (Gulko, 2002; Connolly et al., 2005; Andersson at al., 2008; Baur and Lucey, 2009). In particular, financial equity market crashes make investors more risk averse, as they shift the funds from stock to bond markets.
Among the literature on stock-bond correlation, studies examining emerging markets are relatively scarce. However, Panchenko and Wu (2009) use a sample comprising 18 emerging markets to investigate how the stock-bond co-movement is affected by emerging stock market integration. In addition, Boyer et al. (2006) examine correlations between stock and bonds in emerging markets within the context of financial crisis contagion. More recently, Christopher et al. (2012) address the issue of the effects of sovereign credit ratings on time-varying stock-bond correlations in emerging countries worldwide.
4.2 Uncertainty in emerging markets
Political uncertainty is one of the major factors influencing emerging economies. Recent events like the Arab Spring in the MENA region, civil war in Libya, and riots in Egypt and Tunisia during 2011, the political and military crisis in Thailand during 2006, and the turmoil in Ukraine starting in 2014 are important for

12 Acta Wasaensia
international investors owing to their huge impact on stock market performance in emerging countries. However, there is only very limited empirical research testing the impact of political risk on stock markets (Lehkonen and Heimonen, 2015).
Current literature documents that political risk is an important factor in explaining stock returns. A standard risk-return relationship suggests that investors demand a higher return for taking higher risks. Following that rationale, the political risk should be priced together with the other risks and therefore should negatively impact the excess stock returns, which is confirmed in studies from Erb et al. (1996b) and Bilson et al. (2002). However, political risk is often found to violate the classic risk-return relationship, leading to the so-called political risk sign paradox, exemplified in situations like a reduction in political risk being associated with higher stock returns (Diamonte et al., 1996; Perotti and van Oijen, 2001; Lehkonen and Heimonen, 2015).
Diamonte et al., (1996) further argue that political stability and upgrades to a political risk profile lead to higher returns in an emerging market setting. Erb et al. (1996) and Bilson et al. (2002) find that political risk has a greater impact on returns in emerging markets than in developed markets. However, Diamonte et al. (1996) emphasize the concept of global political risk convergence, indicating that the differential impact of political risk on returns in emerging and developed markets narrows over time.
4.3 Firm internationalization in emerging markets
Financial globalization has spurred a rapid increase in firms raising international capital in recent decades. Two prominent theories explain the causes and effects of firms’ internationalization: bonding and segmentation theory.3 According to bonding theory, firms internationalize to bond themselves to better corporate governance practices. Internationalization improves investor protection by limiting the extent to which insiders can extract private benefit. According to bonding theory, firms that internationalize signal their quality owing to their improved investor protection and by alleviating agency problems (Stulz, 1999; Coffee, 2002; Reese and Weisbach 2002, Doidge et al. 2004; Gozzi et al. 2008; Gozzi et al. 2010). On the other hand, segmentation theory argues that firms internationalize to avoid regulations and complicated accounting systems that
3 Other views include market timing theory, which predicts that firms raise capital abroad to exploit “hot markets” and temporary high prices for their securities (Errunza and Miller, 2000; Henderson et al., 2006).
Acta Wasaensia 13
deter foreign investors from purchasing their securities. Segmentation theory further claims that internationalization overcomes barriers to international capital flows and potentially provides firms with cheaper capital, which consequently improves their valuation (Black, 1974; Solnik, 1974; Errunza and Losq, 1985; Stapleton and Subrahmanyam, 1977; Alexander et al. 1987; Domowitz et al., 1998; Pagano et al., 2002; Gozzi et al., 2010).
Bonding and segmentation theories conflict regarding the permanent effect of internationalization. While bonding theory anticipates a long-term positive effect (the overall long-term valuation will be higher than that before internationalization), segmentation theory predicts only a short-term positive impact, typified by valuations rising in the period before internationalization and then falling back to their original levels over time (Tobin and Brainard, 1977; La Porta et al., 2002; Lan and Wang, 2004; Durnev and Kim, 2005; Caprio et al., 2007; Albuquerque and Wang, 2008; Gozzi et al., 2008).
In addition to conflicting long-term theoretical predictions, the empirical evidence further complicates the relationship between the internationalization and valuation. Gozzi et al. (2010) suggest that wide gaps exist in current theories regarding causes and effects behind international capital raising, while a growing body of literature criticizes the predictions of both bonding and segmentation theories. Some studies question the very existence of the relationship between internationalization and the improved governance system of a firm, thus neglecting the motivation behind the bonding theory (Licht, 2003; Pinegar and Ravichandran, 2003; Siegel 2004). Stulz (1999), Coffee (2002), Benos and Weisbach (2004) and Doidge et al.(2004) found a positive long-term relationship between a firm’s internationalization and its valuation, while Gozzi et al. (2008) argue that the positive relationship holds only for the short term.
The common ground for the current literature on internationalizations is the American Depositary Receipts (ADR) Market, where firms from emerging or other developed markets issue equities in the USA. Moreover, the discussion on the bonding and segmentation hypotheses in the literature overlooks the reverse situation: US firms internationalizing into other markets. Internationalizations by US firms are an important addition to the discussion, for as La porta et al. (2002) establish, US firms have the most advanced corporate governance systems in the world. Given that the rationale behind the bonding hypothesis is that firms from countries with poor governance raise capital in markets with better corporate governance standards, the internationalization arrangements of US firms should not support this view. Therefore, the last essay of the dissertation pays special

14 Acta Wasaensia
attention to the location where US firms choose to internationalize into. Those US firms that exhaust their home capital markets and choose to market their bonds to unsuspecting foreign investors in emerging markets can potentially experience negative effects on a valuation. These expected negative effects on the valuation can be explained through the so-called reverse bonding hypothesis, where US firms de-bond from good governance practices by entering emerging markets.

Acta Wasaensia 15
5 SUMMARY OF THE ESSAYS
This dissertation includes the four related essays described in the reminder of this section. The contribution of each co-author of the individual essays is outlined below:
Essay 1: The main author of the essay is Nebojsa Dimic, who is responsible for the research idea, data collection, research design, empirical analysis, and writing the essay. Dr. Äijö, Dr. Piljak, and Mr. Kiviaho contributed by providing the support, guidance, and valuable suggestions throughout the essay development, and supervised the process of publishing the paper.
Essay 2: The main author of the essay is Nebojsa Dimic, who is responsible for the research idea, data collection, research design, empirical analysis, and writing the essay. Dr. Äijö and Dr. Orlov contributed valuable comments and suggestions.
Essay 3: The main author of the essay is Nebojsa Dimic, who is responsible for the research idea, data collection, research design, empirical analysis, and writing the essay. The role of Dr. Piljak and Dr. Orlov lies in making suggestions to improve the paper and on the publication process.
Essay 4: The essay is single-authored by Nebojsa Dimic.
5.1 Impact of Financial Market Uncertainty and Macroeconomic Factors on Stock-Bond Correlation in Emerging Markets
The first essay of the dissertation focuses on the impact of global financial market uncertainty and domestic macroeconomic factors on stock-bond correlation in emerging markets on different time horizons. The empirical analysis is performed using monthly data for stock and bond returns on 10 emerging markets and the United States. The selection of the emerging markets in the sample is based on the country composition of the J.P. Morgan Emerging Market Bond Index Plus (EMBI+). 4 Stock market indices for each emerging market in the study are provided by Morgan Stanley Capital International (MSCI). The inclusion of the US
4 The EMBI+ is J.P. Morgan’s most liquid US-dollar emerging markets debt benchmark. It tracks returns for actively traded debt instruments in emerging markets including Brady bonds, Eurobonds, and traded loans issued by sovereign entities. The EMBI+ index includes only issues with a current face amount outstanding of $500 million or more and a remaining life of greater than 2.5 years. The J.P. Morgan indices are the most widely used and comprehensive emerging market sovereign debt benchmarks.
16 Acta Wasaensia
market in the study was due to its role as a global factor in the international financial markets. The stock and bond markets of the USA are represented by the S&P 500 index and 10-year US government bonds, respectively.
The empirical findings reported in this essay show that global financial market uncertainty and domestic macroeconomic factors play an important role in explaining the stock-bond correlation in emerging markets. In addition, time-varying stock-bond correlation patterns vary significantly between the time horizons. The short horizon correlation changes the sign rapidly showing sustainable negative episodes during crisis periods, which is consistent with the flight-to-quality phenomenon. The long horizon correlation stays positive most of the time, indicating that emerging market stock and bond prices move in the same direction signifying the equity-like properties of emerging market bonds in the longer term.
The findings of this essay also suggest that the most important factor influencing stock-bond correlation on a short horizon is the monetary policy stance, while the factors with the highest impact on the stock-bond correlation in the long term are inflation and stock market uncertainty. Furthermore, the empirical findings of this study demonstrate a positive long-term relationship between inflation and stock-bond correlation suggesting that both stock and bond prices in emerging markets tend to move in the same direction during periods of high inflation. Moreover, the essay’s analysis shows that high equity market uncertainty, as measured by implied volatility, leads to a greater co-movement of stock and bond prices in emerging markets. Finally, the reported results reveal that global stock market uncertainty plays a more significant role than global bond market uncertainty in explaining stock-bond correlations in emerging markets.
5.2 Bond–Equity Yield Ratio Market Timing in Emerging Markets
The second essay of the dissertation examines the market timing ability of the bond–equity yield ratio (BEYR) from an international investor perspective in the emerging market setting. The underlying motivation for using the bond–equity yield ratio as a relative pricing tool for allocating the capital between stocks and bonds can be described as follows: Yields on bonds and dividend yields associated with stocks should be approximately equal or at least strongly correlated in the long term, and therefore the BEYR should vary around its long-term equilibrium (Maio, 2013). If equity yields fall, bonds become more attractive to investors and their prices rise, which will in turn cause bond yields to fall, making equity yields

Acta Wasaensia 17
look attractive again (Giot & Petitjean, 2009). A decline in bond yields pushes the BEYR down from its long-term equilibrium while a fall in equity yields drives it back up. If the BEYR were too low compared to the long-term level, bonds would be viewed as expensive relative to stocks and the traditional investing rule would suggest “sell bonds and buy stocks.” Inversely, if the BEYR were too high related to its long-run equilibrium, equities would be viewed as too expensive relative to bonds and the investing rule would suggest “sell stocks and buy bonds.”
The empirical element of the essay focuses on 13 emerging markets, namely Argentina, Brazil, Bulgaria, China, Colombia, Ecuador, India, Mexico, Peru, the Philippines, Russia, Turkey, and Venezuela, as well as the United States. The sample data cover the period January 1994 until September 2014. The study incorporates the longest available data set for each country in the study. The selection of the emerging markets in the sample is based on the country composition of both the Morgan Stanley Capital International (MSCI) BRIC Index and the J.P. Morgan Emerging Market Bond Index Plus (EMBI+).
The empirical findings reported in this essay show that the traditional BEYR investing strategies (constructed from the emerging market bond and stock yields) do not deliver significantly higher risk-adjusted returns relative to buy-and-hold benchmark strategies. The results therefore cast doubt on the market timing ability of the traditional BEYR, providing further international support for the findings of Brooks and Persand (2001) and Giot and Petitjean (2009). Furthermore, all of the augmented BEYR-based trading strategies (using US bonds as a safe asset and emerging market stocks and bonds as risky assets) deliver higher risk-adjusted returns compared to the benchmark buy-and-hold bonds or stocks strategies.
5.3 Political Risk Factor in Emerging, Frontier, and Developed Stock Markets
The third essay continues with the emerging markets asset classes theme and investigates how determinants of the political risk factor affect stock returns. The total sample includes 64 countries divided into three categories (emerging, frontier, and developed) based on their classification by the Morgan Stanley Capital International (MSCI). The emerging markets sample comprises 22 countries (Brazil, Chile, China, Colombia, the Czech Republic, Egypt, Greece, Hungary, India, Indonesia, Malaysia, Mexico, Peru, Philippines, Poland, Russia, South Africa, South Korea, Taiwan, Thailand, Turkey, and the UAE), while the frontier markets sample consists of 21 countries (Argentina, Bahrain, Bangladesh, Bulgaria, Croatia, Estonia, Jordan, Kenya, Kuwait, Kazakhstan, Lithuania,

18 Acta Wasaensia
Morocco, Nigeria, Oman, Pakistan, Romania, Slovenia, Sri Lanka, Tunisia, Ukraine, and Vietnam). The developed markets are represented by 21 countries (Australia, Austria, Belgium, Canada, Denmark, Finland, France, Germany, Ireland, Italy, Japan, Netherlands, New Zealand, Norway, Portugal, Singapore, Spain, Sweden, Switzerland, the United Kingdom, and the USA). We use the MSCI Standard Total Return Index for each country in the sample
The findings of this essay show that the composite political risk is priced regardless of the type of market, but the effect of individual components varies across the market categories. Specifically, government actions as a source of political risk uniformly have a negative effect on the stock returns in all three market categories. Further, political risk related to rising ethnic tensions has a negative impact on the stock returns in emerging and frontier markets, but not in developed markets. This implies that racial, nationality, or language divisions are associated with lower stock returns. Furthermore, stock returns of frontier markets are affected by a component of political risk associated with government stability, while the emerging markets category is the only one affected by the risk of corruption, democratic regime change, and investment profile.
5.4 Internationalization and firm valuation: New evidence from foreign debt issuances of US firms
The fourth essay extends the scope of the dissertation to the individual firm setting, and studies the effect of internationalization on a firm’s valuation. The general literature mainly relies on firms from around the world internationalizing by issuing equity in the USA, while this essay uses data on US firms that internationalize by issuing debt in emerging and other developed markets.
The results of the study can be summarized as follows. First, internationalization has a positive short-term effect on a firm’s valuation. We observe significant positive anticipatory and impact effects around the internationalization dates that subsequently diminish in the long-term. The dynamics of Tobin’s q around the dates of off-shore bond issuance found in this study (a strong positive effect one year prior to and during the first year following the internationalization followed by a sharp decline in subsequent years) is the result that supports segmentation theory. Second, the location of the market where US firms issue debt dramatically affects the results. The positive short-term effect on Tobin’s q is conditional given that US firms raise debt in other developed markets. Specifically, those firms that raise capital in emerging markets experience a significant negative long-term effect on their Tobin’s q. US firms coming from an environment marked by the best

Acta Wasaensia 19
governance standards and high investor protection de-bond from good practices by issuing debt in emerging markets with poor governance standards and low investor protection. This “reverse bonding” has a long-term negative impact on valuation. Therefore, the benefits of internationalization for US firms differ sharply depending on the specifics of the market where they internationalize.

20 Acta Wasaensia
References
Alexander, G., Eun, C. and Janakiramanan, S. (1987). Asset pricing and dual listing on foreign capital markets: A note. Journal of Finance 42, 151-158.
Albuquerque, R. and Wang, N. (2008). Agency conflicts, investment, and asset pricing. Journal of Finance 63, 1-40.
Aslanidis, N. and Christiansen, C. (2014). Quantiles of the realized stock-bond correlation and links to the macroeconomy. Journal of Empirical Finance 28, 321-331.
Andersson, M., Krylova, E. and Vähämaa, S. (2008). Why does the correlation between stock and bond returns vary over time? Applied Financial Economics 18, 139-151.
Baele, L., Bekaert, G., Inghelbrecht, K. and Wei, M. (2013). Flights to safety. NBER Working Paper No. 19095.
Bailey, W. and Chung, P. (1995). Exchange rate fluctuations, political risk, and stock returns: some evidence from an emerging market. Journal of Financial and Quantitative Analysis 30, 541-561.
Baur, G., Lucey, B. (2009). Flights and contagion - An empirical analysis of stock-bond correlations. Journal of Financial Stability 5, 339–352.
Bakaert, G. and Urias, S. (1996). Diversification, integration and emerging market closed-end funds. Journal of Finance 51, 835-869.
Bekaert, G. and Harvey, C. (1997). Emerging equity market volatility. Journal of Financial Economics 43, 29-77.
Bekaert, G., Engstrom, E. and Xing, Y. (2009). Risk, uncertainty, and asset prices. Journal of Financial Economics 91, 59-82.
Bekaert, G. and Harvey, C. (2002). Research in emerging markets finance: looking to the future. Emerging Markets Review 3, 429-448.
Barsky, R. (1989). Why don't the prices of stocks and bonds move together. American Economic Review 79, 1132-1145
Benos, E. and Weisbach, M. (2004). Private benefits and cross-listings in the United States. Emerging Markets Review 5, 217–240.
Bhagwati, J. (1998). The Capital Myth: The Difference between Trade in Widgets and Trade in Dollars. Foreign Affairs,77, 7-12.

Acta Wasaensia 21
Bhargava, V., D. K. Konku & D. K. Mihotra. (2004) Does International Diversification Pay? Association for Financial Counseling and Planning Education,53-62.
Bilson, M., Brailsford, J., and Hooper, C. (2002). The explanatory power of political risk in emerging markets. International Review of Financial Analysis 11, 1-27.
Black, F. (1974). International capital market equilibrium with investment barriers. Journal of Financial Economics 1, 337-352.
Bodie, Z., Kane, A., and Marcus, A. (2009). Investments. 8th ed. New York:McGraw-Hill Inc.
Boyer, B., Kumagai, T. and Yuan, K. (2006). How do crises spread? Evidence from accessible and inaccessible stock indices. Journal of Finance 61, 957–1003.
Brooks, C. and Persand, G. (2001). The trading profitability of forecasts of the gilt-equity-yield ratio. International Journal of Forecasting 17, 11-29
Brunnermeier, M. and Pedersen, L. (2009). Market liquidity and funding liquidity. Review of Financial Studies 22, 2201-2238.
Caballero, R. and Krishnamurthy, A. (2008). Collective risk management in a flight to quality episode. Journal of Finance 63, 2195-2230.
Campbell, J. and Ammer, J. (1993). What moves the stock and bond markets? A variance decomposition for long-term asset returns. Journal of Finance 48, 3-37.
Cappiello, L., Engle, R. and Sheppard, K. (2006). Asymmetric dynamics in the correlations of global equity and bond returns. Journal of Financial Econometrics 4, 537-572.
Caprio, G., Laeven, L. and Levine, R. (2008). Governance and bank valuation. Journal of Financial Intermediation 16, 584-617.
Central Bank of India (2006). Report on Currency and Finance 2005-06: Development of Financial Markets and Role of the Central Bank. Mumbai Reserve Bank of India.
Cheng, A-R., Jahan-Parvar, R., and Rothman, P. (2010). An empirical investigation of stock market behavior in the Middle East and North Africa. Journal of Empirical Finance 17, 413-427.
Christopher, R., Kim, S-J. and Wu, E. (2012). Do sovereign credit ratings influence regional stock and bond market interdependencies in emerging

22 Acta Wasaensia
countries? Journal of International Financial Markets, Institutions and Money 22, 1070-1089.
Chuhan, P., G. Perez-Quiros, & H. Popper. (1996). International capital flows: Do short-term investment and direct investment differ? World Bank Policy Research Working Paper No. 1669.
Coffee, J. (2002). Racing towards the top: The impact of cross-listings and stock market competition on international corporate governance. Columbia Law Review 102, 1757–1831.
Connolly, R., Stivers, C., Sun, L. (2005). Stock market uncertainty and the stock-bond return relation. Journal of Financial and Quantitative Analysis 40, 161-194
De Jong, F. and De Roon, A. (2005). Time-varying market integration and expected returns in emerging markets. Journal of Financial Economics 78, 583-613.
Diamonte, R., Liew, J. and Stevens, R. (1996). Political risk in emerging and developed markets. Financial Analysts Journal 52, 71–76.
Doidge, C., Karolyi, A. and Stulz, R. (2004). Why are firms that list in the U.S. worth more? Journal of Financial Economics 71, 205–238.
Domowitz, I., Glen, J. and Madhavan, A. (1998). International Cross-Listing and Order Flow Migration: Evidence from an Emerging Market. Journal of Finance 53, 2001-2027.
Driessen, J. and Leaven, L. (2007). International portfolio diversification benefits; Cross-country evidence from a local perspective. Journal of Banking and Finance 31, 1693-1712.
Durnev, A. and Kim, E. (2005). To steal or not to steal: Firm attributes, legal environment, and valuation. Journal of Finance 60, 1461–1493.
Elton, E. & Gruber, M. (1995). Modern Portfolio Theory and Investment Analysis. 5th ed. Wiley, New York.
Elton, E. & Gruber, M. (1997). Modern portfolio theory, 1950 to date. Journal of Banking and Finance 21, 1734-1759.
Erb, C, Harvey, C. & Viskanta, E. (1996a). Expected returns and volatility in 135 countries. Journal of Portfolio Management 22, 64-58.
Erb, C., Harvey, C. and Viskanta, T. (1996b). Political risk, economic risk, and financial risk. Financial Analysts Journal 52, 29-46.

Acta Wasaensia 23
Errunza, V. (1977). Gains from portfolio diversification into less developed countries’ securities. Journal of International Business Studies 8, 83-99.
Errunza, V., Losq, E. (1985). International asset pricing under mild segmentation: Theory and tests. Journal of Finance 40, 105-124.
Errunza, V., Miller, D. (2000). Market segmentation and the cost of capital in international equity markets. Journal of Financial and Quantitative Analysis 35, 577–600.
Giot, P. and Petitjean, M. (2009). Short-term market timing using the bond-equity yield ratio. The European Journal of Finance 15, 365-384.
Gozzi, J., Levine, R. and Schmukler, S. (2008). Internationalization and the evolution of corporate valuation. Journal of Financial Economics 88, 607–632.
Gozzi, J.C., Levine, R., Schmukler, S., 2010. Patterns of international capital raisings. Journal of International Economics 80, 45-57.
Gulko, L. (2002). Decoupling. Journal of Portfolio Management 28, 59-67.
Harvey, R. (1995). Predictable risk and returns in emerging markets. Review of Financial Studies 8, 773-816.
Hanna, E., McCarmack P. and G. Perdue (1999). A nineties perspective on international diversification. Financial Services Review 8, 37-54.
Henderson, B., Jegadeesh, N., Weisbach, M. (2006). World markets for raising new capital. Journal of Financial Economics 82, 63–101.
Ilmanen, A. (2003). Stock-bond correlations. Journal of Fixed Income 13, 55-66.
Iqbal, J., Brooks, R. and Galagedera, A. (2010). Testing conditional asset pricing models: An emerging market perspective. Journal of International Money and Finance 29, 897-918.
Kelly, J., Martins, L., and Carlson, J. (1998). The relationship between bonds and stocks in emerging countries. Journal of Portfolio Management 24, 110-122.
Kim, S. and In, F. (2006). The relationship between stock returns and inflation: new evidence from wavelet analysis. Journal of Empirical Finance 12, 435-444.

24 Acta Wasaensia
La Porta, R., Lopez-de-Silanes, F., Shleifer, A. and Vishny, R. (2002). Investor protection and corporate valuation. Journal of Finance 57, 1147–1170.
Lan, Y. and Wang, N. (2004). Investor protection and investment. Working Paper Columbia University.
Lehkonen, H. & Heimonen, K. (2015). Democracy, political risk and stock market performance. Journal of International Money and Finance 59, 77-99.
Li, L. (2004). Macroeconomic factors and the correlation of stock and bond returns. In Proceeding of the 2004 American Finance Association Meeting.
Li, H. and Majerowska, E. (2008). Testing stock market linkages for Poland and Hungary: a multivariate GARCH approach. Research in International Business and Finance 22, 247-266.
Licht, A. (2003). Cross-listing and corporate governance: Bonding or avoiding? Chicago Journal of International Law 4, 141–163.
Lessard, D. (1990). Beyond the debt crisis: Alternate forms of financing growth. Working Paper, Alfred P. Sloan School of Management Research Paper No. 1921-1989.
Levine, R. (1997). Financial development and economic growth: Views and agenda. Journal of Economic Literature 35, 688-726.
Levy, H. & Sarnat, M. (1970). International diversification of investment portfolios. American Economic Review 60, 668-675.
Maio, P. (2013). The “Fed model” and the predictability of stock returns. Review of Finance 17, 1489-1533.
Mateus, T. (2004). The risk and predictability of equity markets of the EU accession countries. Emerging Markets Review 5, 241-266.
Pagano, M., Roell, A. and Zechner, J. (2002). The geography of equity listing: why do companies list abroad? Journal of Finance 57, 2651-2694.
Panchenko, V. and Wu, E. (2009). Time-varying market integration and stock and bond return concordance in emerging markets. Journal of Banking and Finance 33, 1014–1021.
Pajuste, A., Kepitis, G., and Högfeldt, P. (2000). Risk factors and predictability of stock returns in Central and Eastern Europe. Emerging Markets Quarterly 4, 7-25.

Acta Wasaensia 25
Perotti, E. and van Oijen, P. (2001). Privatization, political risk and stock market development in emerging markets. Journal of International Money and Finance 20, 43-69.
Pinegar, J. and Ravichandran, R. (2003). U.S. investors’ perceptions of corporate control in Mexico: Evidence from sibling ADRs. Journal of Financial and Quantitative Analysis 38, 213–230.
Prasad, E., K. Rogoff, S.J. Wei & A. Kose (2006). Financial Globalisation: A Reappraisal. Working Paper. National Bureau of Economic Research Paper No 12484.
Reddy, Y. (2002). Dimensions of Financial Development, Market Reforms and Integration: The Indian Experience. Macroeconomics and Monetary Policy: Issues for a Reforming Economy. New Delhi: Oxford University Press.
Reese Jr., W. and Weisbach, M. (2002). Protection of minority shareholder interests, cross-listings in the United States, and subsequent equity offerings. Journal of Financial Economics 66, 65-104.
Siegel, J. (2004). Can foreign firms bond themselves effectively by renting U.S. securities laws? Journal of Financial Economics 75, 319–359
Solnik, B. (1974). Why not diversify internationally rather than domestically? Financial Analysts Journal 30, 48-54.
Stapleton, R. and Subrahmanyam, M. (1977). Market imperfections, capital market equilibrium, and corporate finance. Journal of Finance 32, 307-319.
Stiglitz, J.E. (2002). Globalisation and its Discontents. New York: Norton.
Stulz, R. (1999). Globalization of equity markets and the cost of capital. Journal of Applied Corporate Finance 12, 1–12.
Tobin, J. and Brainard, W. (1977). Asset markets and the cost of capital. In: Balassa, B., Nelson, R. (Eds.), Economic Progress, Private Values, and Public Policy. North Holland, Amsterdam, pp. 235–262.
Vayanos, D. (2004). Flight to quality, flight to liquidity, and the pricing of risk. NBER Working Paper No. 10327.
Yang, Y., Zhou, Y. and Wang, Z. (2009). The stock-bond correlation and macroeconomic conditions: One and a half centuries of evidence. Journal of Banking and Finance 33, 670-680.

26 Acta Wasaensia
Research in International Business and Finance 36 (2016) 41–51
Contents lists available at ScienceDirect
Research in International Businessand Finance
journal homepage: www.elsevier.com/locate/r ibaf
Impact of financial market uncertainty and macroeconomic
factors on stock–bond correlation in emerging markets�
Nebojsa Dimic, Jarno Kiviaho, Vanja Piljak ∗, Janne Äijö
Department of Accounting and Finance, University of Vaasa, Finland
a r t i c l e i n f o
Article history:
Received 31 August 2015
Accepted 8 September 2015
Available online 14 September 2015
JEL classification:
E44
F30
G15
Keywords:
Stock–bond correlation
Emerging markets
Macroeconomic factors
Financial market uncertainty
Wavelet analysis
a b s t r a c t
This paper examines the impact of global financial market uncertainty and domestic macro-
economic factors on stock–bond correlation in emerging markets. In particular, by applying
the wavelet analysis approach, we are able to examine stock–bond correlations over differ-
ent time horizons in ten emerging markets. We find that stock–bond correlation patterns
vary significantly between the time horizons. In particular, the correlation in short hori-
zon changes the sign rapidly showing sustainable negative episodes while the correlation
in long horizon stays positive most of the time. The most important factor influencing
stock–bond correlation in short horizon is the monetary policy stance, while the factors
with the greatest long-term impact are inflation and stock market uncertainty. Finally,
global stock market uncertainty plays a more significant role than global bond market
uncertainty in explaining stock–bond correlations in emerging markets.
© 2015 Elsevier B.V. All rights reserved.
1. Introduction
This article focuses on the impact of global financial market uncertainty and domestic macroeconomic factors on
stock–bond correlation in emerging markets on short and long time horizons. Examining the dynamics of the time-varying
co-movements between stocks and bonds is important for several reasons. The stock–bond correlation is one of the most
influential inputs to investors’ asset allocation decisions. Moreover, investors’ portfolio optimization, risk management, and
hedging choices may be vastly improved by taking into consideration the relationship between two main asset classes.
Finally, policymakers are increasingly using the information about the joint behavior of stocks and bonds in determining
the market views on the inflation and the economic activity of a country. The issue of stock–bond correlation in emerging
markets has recently been gaining considerable attention due to increasing demand for the emerging market assets by
international investors seeking the benefits of portfolio diversification. In particular, government bonds of emerging mar-
kets have become an attractive investment target in recent decades due to the following reasons: (i) emerging markets are
among the world’s fastest growing economies in which government bonds represent the second largest source of financing
� We would like to thank the discussants and participants of the 2nd Paris Financial Management Conference, the 61st Annual Meeting of the Midwest
Finance Association in Chicago, the 51st Annual Meeting of the Eastern Finance Association in New Orleans, and the International Conference on Macro-
economic Analysis and International Finance in Crete for valuable comments and suggestions. Jarno Kiviaho would like to thank Jenny and Antti Wihuri
Foundation for financial support.∗ Corresponding author at: P.O. Box 700, FI-65101 Vaasa, Finland.
E-mail addresses: [email protected] (N. Dimic), [email protected] (J. Kiviaho), [email protected] (V. Piljak), [email protected] (J. Äijö).
http://dx.doi.org/10.1016/j.ribaf.2015.09.001
0275-5319/© 2015 Elsevier B.V. All rights reserved.

Acta Wasaensia 27
42 N. Dimic et al. / Research in International Business and Finance 36 (2016) 41–51
since the 1990s; and (ii) increasing market liquidity and transparency in emerging bond markets (see e.g., Bunda et al., 2009;
Piljak, 2013).
The purpose of this study is two-fold. By applying the wavelet analysis approach, we are able to examine stock–bond cor-
relations over different time horizons in ten emerging markets during the period 2001–2013.1 Assessment of stock–bond
correlation dynamics at different time horizons is important for international investors in the context of portfolio rebal-
ancing decisions.2 In addition, the advantage of applying wavelet analysis to examining co-movement dynamics between
asset classes is related to simultaneous consideration of time and frequency domains in one integrated framework. Second,
we investigate the impact of global financial market uncertainty (both stock and bond market uncertainty) and domestic
macroeconomic factors on the stock–bond correlations on short- and long-term horizons. In line with earlier studies on the
relationship between the stock–bond correlation and macroeconomic factors (Ilmanen, 2003; Yang et al., 2009), we include
inflation, business cycle patterns, and the monetary policy stance in our analysis.
The literature on stock–bond correlations has traditionally focused on developed markets (Andersson et al., 2008;
Campbell and Ammer, 1993; Cappiello et al., 2006; Ilmanen, 2003). The most prominent issue within this stream of literature
is related to examining various factors driving the stock–bond correlations. The debate on this issue remains open, given the
mixed evidence in the literature on the role of macroeconomic factors in driving stock–bond correlations. In particular, one
segment of the literature documents the importance of macroeconomic fundamentals, specifically inflation, business cycle
environment, and monetary policy stance, in explaining stock–bond correlations (Ilmanen, 2003; Li, 2004; Yang et al., 2009).
Yang et al. (2009) provide convincing evidence of time-varying stock–bond correlations over macroeconomic conditions (the
business cycle, the inflation environment, and monetary policy stance) by using data from the US and the UK covering the
past 150 years. Ilmanen (2003) proposes inflation as a key driver of the stock–bond correlation. High inflation periods lead
to changes in common discount rates that dominate the cash-flow expectations and lead to a positive correlation between
the two asset classes. Further findings demonstrate that stocks tend to outperform bonds during business cycle expansions,
while bonds outperform stocks during business cycle contraction periods. Finally, easing the monetary policy has a positive
effect on both stocks and bonds exhibiting a positive relation with the correlation of those two asset classes.
Andersson et al. (2008) use data from the US, the UK, and German markets and find that inflation expectation is an impor-
tant determinant of the stock–bond correlation, while economic growth expectation is not a relevant factor. Specifically,
their result shows that stock and bond prices move in the same direction when inflation expectations are high. In contrast,
Baele et al. (2010) argue that macroeconomic factors play only a minor role in explaining stock–bond correlations in the US
market. A more recent study by Aslanidis and Christiansen (2014) provides new insights into the role of macroeconomic fun-
damentals in explaining stock–bond correlations. They find that macroeconomic factors have only little explanatory power
when the stock–bond correlation is largely positive; but when the stock–bond correlation is largely negative, then macro-
economic fundamentals are most useful explanatory variables. The rationale behind this finding is that macroeconomic
factors are important for bonds in all periods, while for stocks they are important only in extremely volatile periods.
One additional segment of the related literature provides evidence that stock market uncertainty plays an important role
in explaining stock–bond correlations (Andersson et al., 2008; Connolly et al., 2005, 2007; Kim et al., 2006). These studies
use implied volatility from equity index options as a proxy for stock market uncertainty, and suggest that implied volatility
changes have an impact on market participants’ risk aversion, therefore affecting the stock–bond correlation. Considerable
attention in these studies has been paid to the “flight-to-safety” phenomenon, in which the correlation between stocks
and bonds becomes significantly negative during periods of high market uncertainty (Gulko, 2002; Connolly et al., 2005;
Andersson et al., 2008; Baur and Lucey, 2009). In particular, the financial equity markets crashes make investors more risk
averse, as they shift their funds from stock to bond markets.
In the literature on stock–bond correlation, studies examining emerging markets are relatively scarce. Panchenko and
Wu (2009) use a sample of 18 emerging markets to investigate how stock–bond co-movement is affected by emerging
stock market integration, while. Boyer et al. (2006) examine correlations between stocks and bonds in emerging markets
within the context of financial crisis contagion. More recently, Christopher et al. (2012) address the issue of the effects of
sovereign credit ratings on time-varying stock–bond correlations in emerging countries worldwide. Finally, Bianconi et al.
(2013) examine the behavior of stock and bond return volatility and the correlation for the BRIC countries conditional on a
measure of US financial stress.
Our study contributes to the literature in three ways. First, we add to the literature on the stock–bond correlation by pro-
viding new evidence of the impact of macroeconomic factors and global financial market uncertainty from the perspective
of emerging markets. Second, by using the advantageous methodological framework of the wavelet analysis, we are able
to examine differences in the importance of macroeconomic and financial market uncertainty factors for the stock–bond
correlations in long and short horizons. Third, we extend the literature on financial market uncertainty by examining
1 A wavelet analysis approach has been applied in several studies to analyze financial time-series. For example, Rua and Nunes (2009), Kiviaho et al.
(2014), and el Alaoui et al. (2015) apply wavelet squared coherency to analyze international co-movement of stock market returns. Kim and In (2007) apply
wavelet analysis to examine the relationship between changes in stock prices and bond yields in G7 countries, while Aloui et al. (2015) utilize wavelet
approach to examine co-movement between Islamic stocks and bonds in the Gulf Cooperation Council (GCC) countries.2 The true long-term relationship between stock and bond returns can be altered in a short horizon due to short-term noise: investors’ immediate
consumption needs and portfolio optimization (see Harrison and Zhang, 1999).

28 Acta Wasaensia
N. Dimic et al. / Research in International Business and Finance 36 (2016) 41–51 43
connections between global bond market uncertainty and stock–bond correlations. Related studies on stock–bond cor-
relation have focused on the impact of uncertainty coming from stock markets (Andersson et al., 2008; Connolly et al., 2005,
2007; Kim et al., 2006), while our study differs from these in that it also examines the impact of uncertainty originating from
the bond market.
The empirical findings reported in this article show that global financial market uncertainty and domestic macroecono-
mic factors play an important role in explaining the stock–bond correlation in emerging markets. In addition, time-varying
stock–bond correlation patterns vary significantly between time horizons. The short horizon correlation changes the sign
rapidly, showing sustainable negative episodes during crisis periods, which is consistent with the “flight-to-quality” phe-
nomenon. The long horizon correlation stays positive most of the time, indicating that emerging market stock and bond
prices move in the same direction signifying “equity like”3 properties of emerging market bonds in the long run.
Our findings also suggest that the most important factor influencing the stock–bond correlation on a short horizon is the
monetary policy stance, while the factors with the greatest impact on the stock–bond correlation in the long run are inflation
and stock market uncertainty. Our empirical findings further demonstrate a positive long run relationship between inflation
and stock–bond correlation suggesting that both stock and bond prices in emerging markets tend to move in the same
direction during periods of high inflation. Moreover, our analysis shows that high equity market uncertainty, as measured
by implied volatility, leads to a higher co-movement of stock and bond prices in emerging markets. Finally, global stock
market uncertainty plays a more significant role than global bond market uncertainty in explaining stock–bond correlations
in emerging markets.
The remainder of this paper is organized as follows. Section 2 presents data and the descriptive statistics. In Section 3, we
present a brief description of the wavelet analysis approach. The empirical results are presented in Section 4, while Section
5 provides conclusions.
2. Data
2.1. Stock and bond market returns
The empirical analysis is performed using monthly data for stock and bond returns on ten emerging markets and the
United States. The selection of the emerging markets in our sample is based on the country composition of the J.P. Morgan
Emerging Market Bond Index Plus (EMBI+).4 Stock market indices for each emerging market in the study are provided by
Morgan Stanley Capital International (MSCI). The inclusion of the US market in the study was due to its role as a global
factor in the international financial markets as well as for purposes of comparison with the emerging markets. Stock and
bond markets of US are represented respectively by the S&P 500 index and 10-year US government bonds. Similarly to Rua
(2010), stock and bond price indices are converted to the monthly returns by taking the first difference of the natural log for
each stock and bond price index. The use of monthly frequencies is commonly used in the literature (see e.g., Kim and In,
2007; Aslanidis and Christiansen, 2014) and is due to the fact that data on macroeconomic factors used in further analysis
are available only on a monthly level. The source of the data is Thomson Reuters Datastream. The sample period spans from
January 2001 until December 2013, leading to the sample size of 156 observations for all markets included in the study. The
starting point for the sample period is dictated by the availability of data.
Table 1 presents the summary statistics for stock and bond market returns for ten emerging markets and the US. As shown
in Panel A, all the emerging markets in the sample have positive and higher average stock returns than the US during the
period under study. The highest stock returns are recorded for Colombia, Venezuela, and Peru. The volatility levels of each of
the emerging stock markets from the sample are higher than the volatility of the US market. The least volatile emerging stock
markets are those of Mexico and the Philippines with standard deviations of 0.071 and 0.073 respectively, while the most
volatile emerging stock markets are those of Turkey, Venezuela, and Argentina. Panel B presents the statistical properties of
the bond returns for emerging markets and the US. Similarly to the pattern observed for stock markets, average returns of
emerging market bonds are higher than the US (except for Argentina). Standard deviations of emerging market bonds are
greater than for the US with the exceptions of Bulgaria and Mexico, suggesting that emerging countries have generally riskier
bond markets. The emerging market with the most volatile bond returns is Argentina. The distribution of both stocks and
bonds return series is non-normal, with kurtosis exceeding 3 in all cases (leptokurtic series) and showing negative skewness
(except for the US bonds).
The unconditional stock–bond correlations for each country included in the study are reported in Table 2. All emerging
markets exhibit a positive and statistically significant correlation between stocks and bonds. The level of unconditional
stock–bond correlation differs substantially within the emerging market sample group, ranging from 0.130 (Venezuela) to
3 Emerging markets bonds are often considered to be “equity like” assets because of higher country risk in emerging economies (see Kelly et al., 1998;
Panchenko and Wu, 2009; Piljak, 2013).4 EMBI+ includes 18 countries. Our sample is limited to those countries with data available on stocks, bonds and macroeconomic factors for the entire
sample period The EMBI+ is J.P. Morgan’s most liquid US dollar emerging markets debt benchmark. It tracks returns for actively traded debt instruments in
emerging markets including Brady bonds, Eurobonds, and traded loans issued by sovereign entities. The EMBI+ index includes only issues with a current face
amount outstanding of $500 million or more and remaining life of more than 2.5 years. The J.P. Morgan indices are the most widely used and comprehensive
emerging market sovereign debt benchmarks.
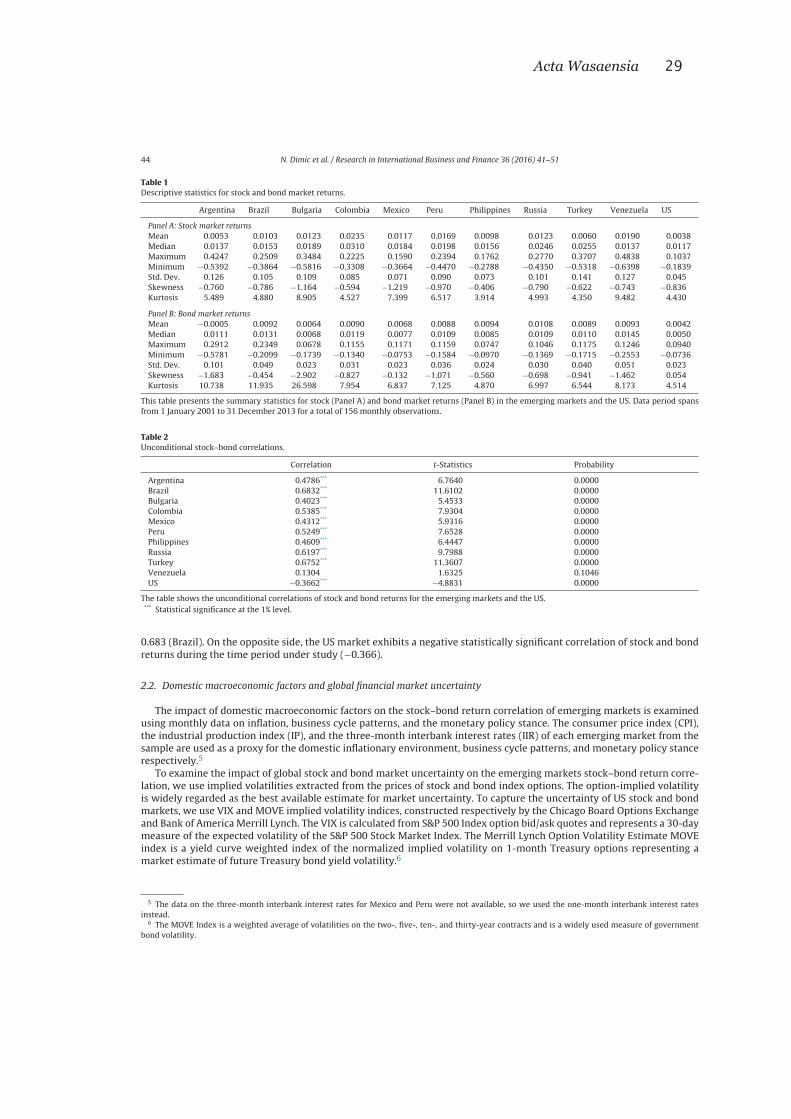
Acta Wasaensia 29
44 N. Dimic et al. / Research in International Business and Finance 36 (2016) 41–51
Table 1Descriptive statistics for stock and bond market returns.
Argentina Brazil Bulgaria Colombia Mexico Peru Philippines Russia Turkey Venezuela US
Panel A: Stock market returns
Mean 0.0053 0.0103 0.0123 0.0235 0.0117 0.0169 0.0098 0.0123 0.0060 0.0190 0.0038
Median 0.0137 0.0153 0.0189 0.0310 0.0184 0.0198 0.0156 0.0246 0.0255 0.0137 0.0117
Maximum 0.4247 0.2509 0.3484 0.2225 0.1590 0.2394 0.1762 0.2770 0.3707 0.4838 0.1037
Minimum −0.5392 −0.3864 −0.5816 −0.3308 −0.3664 −0.4470 −0.2788 −0.4350 −0.5318 −0.6398 −0.1839
Std. Dev. 0.126 0.105 0.109 0.085 0.071 0.090 0.073 0.101 0.141 0.127 0.045
Skewness −0.760 −0.786 −1.164 −0.594 −1.219 −0.970 −0.406 −0.790 −0.622 −0.743 −0.836
Kurtosis 5.489 4.880 8.905 4.527 7.399 6.517 3.914 4.993 4.350 9.482 4.430
Panel B: Bond market returns
Mean −0.0005 0.0092 0.0064 0.0090 0.0068 0.0088 0.0094 0.0108 0.0089 0.0093 0.0042
Median 0.0111 0.0131 0.0068 0.0119 0.0077 0.0109 0.0085 0.0109 0.0110 0.0145 0.0050
Maximum 0.2912 0.2349 0.0678 0.1155 0.1171 0.1159 0.0747 0.1046 0.1175 0.1246 0.0940
Minimum −0.5781 −0.2099 −0.1739 −0.1340 −0.0753 −0.1584 −0.0970 −0.1369 −0.1715 −0.2553 −0.0736
Std. Dev. 0.101 0.049 0.023 0.031 0.023 0.036 0.024 0.030 0.040 0.051 0.023
Skewness −1.683 −0.454 −2.902 −0.827 −0.132 −1.071 −0.560 −0.698 −0.941 −1.462 0.054
Kurtosis 10.738 11.935 26.598 7.954 6.837 7.125 4.870 6.997 6.544 8.173 4.514
This table presents the summary statistics for stock (Panel A) and bond market returns (Panel B) in the emerging markets and the US. Data period spans
from 1 January 2001 to 31 December 2013 for a total of 156 monthly observations.
Table 2Unconditional stock–bond correlations.
Correlation t-Statistics Probability
Argentina 0.4786*** 6.7640 0.0000
Brazil 0.6832*** 11.6102 0.0000
Bulgaria 0.4023*** 5.4533 0.0000
Colombia 0.5385*** 7.9304 0.0000
Mexico 0.4312*** 5.9316 0.0000
Peru 0.5249*** 7.6528 0.0000
Philippines 0.4609*** 6.4447 0.0000
Russia 0.6197*** 9.7988 0.0000
Turkey 0.6752*** 11.3607 0.0000
Venezuela 0.1304 1.6325 0.1046
US −0.3662*** −4.8831 0.0000
The table shows the unconditional correlations of stock and bond returns for the emerging markets and the US.*** Statistical significance at the 1% level.
0.683 (Brazil). On the opposite side, the US market exhibits a negative statistically significant correlation of stock and bond
returns during the time period under study (−0.366).
2.2. Domestic macroeconomic factors and global financial market uncertainty
The impact of domestic macroeconomic factors on the stock–bond return correlation of emerging markets is examined
using monthly data on inflation, business cycle patterns, and the monetary policy stance. The consumer price index (CPI),
the industrial production index (IP), and the three-month interbank interest rates (IIR) of each emerging market from the
sample are used as a proxy for the domestic inflationary environment, business cycle patterns, and monetary policy stance
respectively.5
To examine the impact of global stock and bond market uncertainty on the emerging markets stock–bond return corre-
lation, we use implied volatilities extracted from the prices of stock and bond index options. The option-implied volatility
is widely regarded as the best available estimate for market uncertainty. To capture the uncertainty of US stock and bond
markets, we use VIX and MOVE implied volatility indices, constructed respectively by the Chicago Board Options Exchange
and Bank of America Merrill Lynch. The VIX is calculated from S&P 500 Index option bid/ask quotes and represents a 30-day
measure of the expected volatility of the S&P 500 Stock Market Index. The Merrill Lynch Option Volatility Estimate MOVE
index is a yield curve weighted index of the normalized implied volatility on 1-month Treasury options representing a
market estimate of future Treasury bond yield volatility.6
5 The data on the three-month interbank interest rates for Mexico and Peru were not available, so we used the one-month interbank interest rates
instead.6 The MOVE Index is a weighted average of volatilities on the two-, five-, ten-, and thirty-year contracts and is a widely used measure of government
bond volatility.
30 Acta Wasaensia
N. Dimic et al. / Research in International Business and Finance 36 (2016) 41–51 45
3. The wavelets analysis approach
Wavelet transforms provide an extremely useful and practical set of methods for analyzing economic time-series.7
Wavelets can unravel both the time varying and frequency specific behavior of the variables. The classical frequency analysis
method, the Fourier transform, can only reveal static frequency properties. The wavelet transform, in turn, can reveal the
dynamic behavior of the variable on different frequencies. For our purpose of studying the correlation structure between
bond and stock markets, wavelet correlation analysis provides an appropriate framework for unraveling the dynamic and
frequency specific properties of the correlation. Our analysis closely follows the approach of Rua (2010) and Croux et al.
(2001).
In wavelet analysis, the time and frequency localized properties of a time-series are extracted with the help of a wavelet
function �,s(t) by dilating and translating it with
�,s(t) = 1√s
(t − �s
)(1)
where s is the frequency parameter and � expresses the position in time. By convoluting the function �,s(t) with a time-series
x(t), we obtain the wavelet transform Wx(�, s) :
Wx(�, s) = 1√s
∫ ∞
−∞x(t) ∗
(t − �s
)dt (2)
where * is the complex conjugate. Now from the wavelet transformations Wx and Wy of two time-series x(t) and y(t) it is
possible to obtain a wavelet correlation measure between these two variables:
�xy(�, s) = R(Wxy(�, s))√|Wx(�, s)|2|Wy(�, s)|2
(3)
where Wxy(�, s) is the cross-wavelet spectrum. The wavelet correlation measure �xy(�, s) takes values in [−1,1] and so is
similar to the classical correlation coefficient. As the wavelet function, we use the Morlet wavelet �,s(t) = �−1/4eiω0te−t2/2,
with ω0 = 6.
4. Results
4.1. The stock–bond correlation at short-term and long-term horizons
In this section we report the stock–bond correlations obtained by applying the wavelet approach. Stock–bond correlation
output is illustrated by contour plots involving three dimensions: frequency, time, and the wavelet correlation value (height).
The frequency dimension is shown on the vertical axis and ranges from the highest frequency of two months (top of the
plot) to the lowest frequency of four years (bottom of the plot). The time dimension is presented on the horizontal axis.
Finally, the height dimension (wavelet correlation) is illustrated with different shades of gray in the figures. The correlation
scale ranges from −1 to 1 and is interpreted in terms of the darkness of the gray color.
Three-dimensional setting of wavelet based correlation enables us to detect the areas of varying correlation between
stock and bond series both over time and frequency bands. In this integrated framework, a dark gray area at the bottom
(top) of the figures corresponds to a positive stock–bond correlation at low (high) frequencies, whereas a dark gray area at
the left-hand (right-hand) side signifies a positive stock–bond correlation at the start (end) of the sample period (see Rua,
2010). Analogously, a negative stock–bond correlation is matched with the light gray color. The frequency scale enables us
to separate the stock–bond return correlation between short term and long term. Due to our relatively small sample period
of thirteen years, the short term is considered to be the fluctuations ranging between two to four months, while the long
term can be thought of as fluctuations between one and three years.
Fig. 1 presents the stock–bond correlations obtained by applying the wavelet approach to emerging markets and the US.
By visually assessing the stock–bond correlation graphs, it can be seen that the stock–bond correlation of both the emerging
countries and the US varies considerably across frequencies and over time. These are discussed in more detail in the following
sections.
On short-term horizons (high frequency) stock–bond correlations tend to change the sign and magnitude rapidly, going
from extremely positive to negative episodes for most of the emerging markets in the sample. During the period from
the beginning of 2001 until the end of 2002 (the period corresponding to the “Dotcom market crash”), Argentina,8 Bulgaria,
Colombia, Russia, and Venezuela show sustainable episodes of negative stock–bond correlation. The emerging countries with
the biggest drop in the correlation of stock and bond returns during this time period are Venezuela (from +0.85 to −0.70)
and Argentina (from +0.45 to −0.50). Other emerging markets in the sample, specifically Mexico, Peru, the Philippines, and
7 For more information on Wavelet analysis see Torrence and Compo (1998) and Grinsted et al. (2004).8 This time period also coincides with Argentina’s debt default crisis.
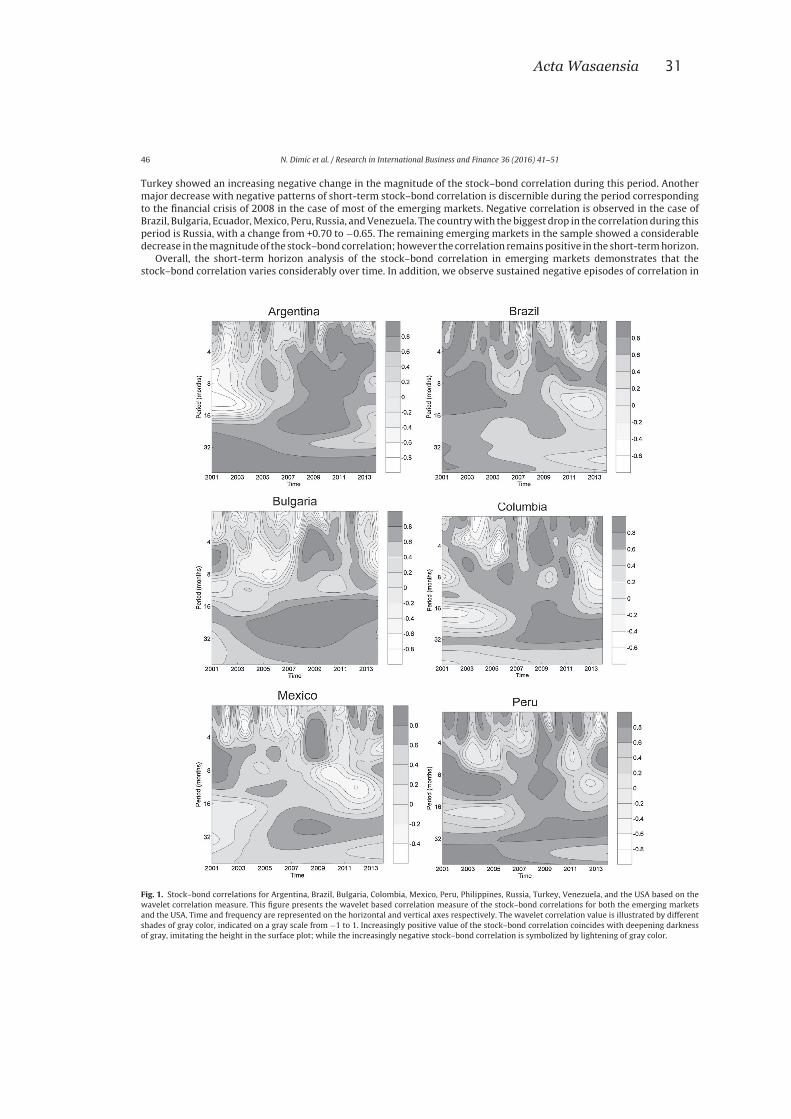
Acta Wasaensia 31
46 N. Dimic et al. / Research in International Business and Finance 36 (2016) 41–51
Turkey showed an increasing negative change in the magnitude of the stock–bond correlation during this period. Another
major decrease with negative patterns of short-term stock–bond correlation is discernible during the period corresponding
to the financial crisis of 2008 in the case of most of the emerging markets. Negative correlation is observed in the case of
Brazil, Bulgaria, Ecuador, Mexico, Peru, Russia, and Venezuela. The country with the biggest drop in the correlation during this
period is Russia, with a change from +0.70 to −0.65. The remaining emerging markets in the sample showed a considerable
decrease in the magnitude of the stock–bond correlation; however the correlation remains positive in the short-term horizon.
Overall, the short-term horizon analysis of the stock–bond correlation in emerging markets demonstrates that the
stock–bond correlation varies considerably over time. In addition, we observe sustained negative episodes of correlation in
Fig. 1. Stock–bond correlations for Argentina, Brazil, Bulgaria, Colombia, Mexico, Peru, Philippines, Russia, Turkey, Venezuela, and the USA based on the
wavelet correlation measure. This figure presents the wavelet based correlation measure of the stock–bond correlations for both the emerging markets
and the USA. Time and frequency are represented on the horizontal and vertical axes respectively. The wavelet correlation value is illustrated by different
shades of gray color, indicated on a gray scale from −1 to 1. Increasingly positive value of the stock–bond correlation coincides with deepening darkness
of gray, imitating the height in the surface plot; while the increasingly negative stock–bond correlation is symbolized by lightening of gray color.

32 Acta Wasaensia
N. Dimic et al. / Research in International Business and Finance 36 (2016) 41–51 47
Fig. 1. (Continued ).
the short term that seem to coincide with the crisis periods. This result is consistent with the “flight-to-safety” phenomenon
observed in the developed markets (Gulko, 2002; Andersson et al., 2008; Baur and Lucey, 2009). Thus our empirical findings
further suggest that short-term investors tend to switch their positions from stocks to bonds during crisis periods and that
emerging market bonds provide a hedging opportunity for the emerging market stocks in the short run.
The patterns of the long-term horizon (low frequency) correlation between emerging markets stock and bond returns,
in turn, are quite different; the sign of the correlation remains positive and less volatile for all the emerging countries (with
the exception of Venezuela, which shows a short period of negative correlation). The highest levels of positive correlations
between stock and bond returns are found in Bulgaria, Russia, and Turkey (+0.95 for all) during the period following the
financial markets crash of 2008. The highly positive stock–bond correlation on the long-term horizon throughout the entire
sample lends no support to the “flight-to-safety” phenomenon. This result suggests that long-term investors do not see the
emerging markets bonds as a safe asset compared to emerging market stocks. Therefore the emerging market bonds exhibit
Acta Wasaensia 33
48 N. Dimic et al. / Research in International Business and Finance 36 (2016) 41–51
properties of “equity like” assets due to the high country risk in emerging economies (Kelly et al., 1998; Panchenko and Wu,
2009; Piljak, 2013).
The next step in our analysis entails assessing the stock–bond correlation pattern for the US market at the short and
long horizons, and comparison with patterns observed in the emerging markets. Similarly to emerging markets, the US
stock–bond correlation on the short-term horizon changes rapidly from positive to negative. The lowest levels of negative
correlation are found during the Dotcom crash (−0.80), and during the financial crisis of 2008 (−0.85). The stock–bond
correlation for the US demonstrates a completely different pattern from the emerging markets on the long-term horizon.
Unlike the emerging countries, the US market correlation between stock and bond returns remains negative on the long
horizon, demonstrating the lowest values during periods coinciding with the “Dotcom crisis” and the financial crisis of 2008.
The negative episodes in the US stock–bond correlation are consistent with the literature, suggesting that bonds tend to
outperform stocks during crisis periods leading to a negative relationship of stock–bond returns (Ilmanen, 2003).
4.2. Impact of global financial market uncertainty and domestic macroeconomic factors on the stock–bond correlation
In the next stage of our analysis, we examine factors that may cause the time variation in the correlation between the
stock and bond returns of emerging markets on different time horizons. Evidence in the literature on developed markets
suggests that inflation and economic growth unconditionally determine the government bond yields (Andersson et al., 2008).
In particular, there is a negative relationship of inflation and economic growth with bond prices. The impact of growth and
inflation on stock prices is somewhat uncertain.9 Nevertheless, some studies suggest that high inflation has a negative impact
on stock prices (Ilmanen, 2003). Monetary policy easing has a positive effect on both stocks and bonds, hence the positive
relation with the stock–bond correlation. Finally, financial market turbulence periods may cause risk-averse investors in
developed countries to shift to safer assets, such as government bonds, causing “flight-to-safety” episodes.
To determine the impact of relevant factors affecting the stock–bond correlation in emerging markets we account for both
global financial market uncertainty and domestic macroeconomic factors. The global uncertainty factors used are the VIX
and MOVE indices that serve respectively as proxies for US stock and bond market uncertainty. The domestic factors used to
proxy the business cycle fluctuations, the inflation environment, and the monetary policy stance are industrial production
(IP), consumer price index (CPI) and three-month interbank interest rates (IIR) respectively. Both the global uncertainty and
domestic macroeconomic factors used are at a monthly level with the sample period corresponding to the period used for
the wavelet correlation analysis.
We conduct the regression analysis of the wavelet stock–bond correlation at different time frequencies on the aforemen-
tioned proxy variables for financial market uncertainty, domestic economic growth, inflation, and monetary policy stance.10
A separate OLS regression is conducted for each emerging market in the sample as well as for the US.11 Consequently, the
following regression model is estimated:
WCORi,f = ˛+ ˇ1VIX + ˇ2MOVE + ˇ3CPIi + ˇ4IPi + ˇ5IIRi + εi,f (4)
where WCORi,f denotes the wavelet correlation between stock and bond returns for country i; f is the frequency domain
given at two different levels, expressed in time units of 3 months (short-term horizon) and 2 years (long-term horizon).12
The regression results for the impact of global financial market uncertainty and domestic macroeconomic factors on the
stock–bond return correlation in emerging markets and the US are reported in Table 3. As in most multi-country studies,
slight differences in terms of significance levels and the coefficient signs of explanatory factors occur in the regression
models. Nevertheless, several interesting findings can be drawn from the empirical results of the regressions. Generally, the
results suggest considerable variations in factors impacting on the correlation at the short-term horizon (high frequency) as
opposed to the long-term horizon (low frequency).
The short term horizon analysis (given in panel A) reveals that there is at least one highly statistically significant factor
of interest for each individual country. The results show that the domestic monetary policy stance is the most influential
factor in the short term, being highly statistically significant in seven out of ten emerging markets. The coefficient sign of
three-month interbank interest rate changes across the countries, suggesting that the way in which monetary policy affects
the stock–bond correlation is not consistent in all emerging markets. For instance, in certain countries (Brazil, Colombia, and
Mexico) the sign of the IIR coefficient is positive, while for other countries (Argentina, Peru, Russia, and Venezuela) the sign
is negative. A factor with moderate impact on the short-term stock–bond correlation in the emerging markets is US equity
market uncertainty. The VIX index is statistically significant in five markets in the short horizon analysis. Furthermore, the
MOVE index has only a minor effect on the correlation in the short run, being significant in only three emerging markets. The
9 For more discussion on this issue please see Andersson et al. (2008).10 To check for the stationarity of the explanatory variables used in the regression analysis two unit root tests were performed, specifically Augmented
Dickey-Fuller (ADF) and Phillips-Perron (PP). The lag length criterion for the unit root tests is based on the Schwarz information criterion. The results
suggest that the explanatory variables are stationary. Therefore the null hypothesis of a unit root can be rejected for the time series used in the regression
analysis. Not all unit root tests results for explanatory variables are shown here due to space considerations, but they are available upon request.11 To check for multicollinearity between the explanatory variables we rely on Variance Inflation Factor (VIF) test. The results suggest no multicollinearity
problem among the variables. The VIF test results are available upon request. Readers interested in the VIF measure should refer to O’Brien (2007).12 A similar approach to determining short and long horizons is applied in Kiviaho et al. (2014).

34 Acta Wasaensia
N. Dimic et al. / Research in International Business and Finance 36 (2016) 41–51 49
Table 3Relationship of the stock–bond correlations with the domestic macroeconomic factors and the global financial market uncertainty in emerging markets
and the USA.
˛ VIX MOVE CPIdomestic IPdomestic IIRdomestic R2
Panel A: Short-term horizon (f = 0.25 year)
Argentina −0.7843** 0.0130*** −0.0008 0.0029 0.0061 −0.0095*** 0.652
(0.3841) (0.0043) (0.0015) (0.0025) (0.0040) (0.0021)
Brazil 1.2880 −0.0023 −0.0019 0.0003 −0.0196 0.0304** 0.233
(0.8743) (0.0067) (0.0020) (0.0003) (0.0136) (0.0144)
Bulgaria −0.5015 −0.0154*** 0.0009 0.0000 0.0032 −0.0515 0.260
(0.3509) (0.0052) (0.0016) (0.0001) (0.0040) (0.0320)
Colombia −2.2137*** 0.0096* −0.0016 0.0178*** 0.0037 0.0772*** 0.495
(0.4879) (0.0054) (0.0020) (0.0056) (0.0043) (0.0264)
Mexico −2.1035** −0.0040 0.0036** 0.0306*** −0.0122 0.0746*** 0.584
(1.0204) (0.0055) (0.0016) (0.0056) (0.0111) (0.0192)
Peru 0.8891 0.0178*** 0.0012 −0.0072 0.0007 −0.0968*** 0.460
(0.7675) (0.0043) (0.0014) (0.0139) (0.0032) (0.0247)
Philippines −0.5863 −0.0167** 0.0058*** 0.0035 0.0048 −0.0517 0.386
(0.8768) (0.0082) (0.0019) (0.0064) (0.0031) (0.0475)
Russia 2.5270*** 0.0093 −0.0007 0.0023* −0.0238** −0.0510*** 0.240
(0.7120) (0.0064) (0.0023) (0.0013) (0.0102) (0.0117)
Turkey 1.3502** −0.0097 0.0044*** −0.0016 −0.0070* −0.0091 0.284
(0.5489) (0.0062) (0.0017) (0.0034) (0.0043) (0.0167)
Venezuela 1.0331*** 0.0051 −0.0016 0.0006 0.0000 −0.0198*** 0.228
(0.3275) (0.0057) (0.0015) (0.0005) (0.0000) (0.0044)
US −3.0742 −0.0173* 0.0083*** 0.0096** 0.0037 0.0121 0.190
(2.0761) (0.0099) (0.0027) (0.0045) (0.0256) (0.0545)
Panel B: Long-term horizon (f = 2 years)
Argentina 0.5106*** 0.0039*** 0.0004 0.0077*** 0.0056*** 0.0004 0.920
(0.0604) (0.0013) (0.0003) (0.0005) (0.0006) (0.0004)
Brazil 0.9146*** 0.0030*** 0.0006** −0.0001*** −0.0010 −0.0055** 0.789
(0.1195) (0.0009) (0.0002) (0.0000) (0.0012) (0.0027)
Bulgaria −0.0817 0.0029** −0.0015*** 0.0001*** 0.0014* 0.0313*** 0.858
(0.0768) (0.0014) (0.0005) (0.0000) (0.0008) (0.0067)
Colombia −1.6784*** 0.0031* −0.0002 0.0166*** 0.0044*** 0.0201** 0.930
(0.1404) (0.0019) (0.0006) (0.0015) (0.0009) (0.0083)
Mexico 1.0286* −0.0115** 0.0034*** 0.0216*** 0.0107 0.0067 0.740
(0.5320) (0.0049) (0.0008) (0.0052) (0.0092) (0.0163)
Peru −0.6752*** 0.0036** 0.0000 0.0074** 0.0030*** 0.0096 0.902
(0.1873) (0.0016) (0.0005) (0.0032) (0.0008) (0.0107)
Philippines 0.7578*** −0.0007 0.0007*** 0.0016** 0.0000 0.0160** 0.808
(0.1070) (0.0007) (0.0002) (0.0008) (0.0003) (0.0072)
Russia −0.7763*** 0.0063* 0.0002 0.0019*** 0.0081*** −0.0041 0.844
(0.1896) (0.0033) (0.0009) (0.0004) (0.0026) (0.0060)
Turkey 2.0277*** 0.0008 −0.0002 0.0076*** −0.0011* −0.0180*** 0.948
(0.1030) (0.0011) (0.0003) (0.0005) (0.0006) (0.0023)
Venezuela −0.0156 0.0023** 0.0000 −0.0023*** 0.0002*** 0.0009 0.958
(0.0491) (0.0009) (0.0003) (0.0001) (0.0000) (0.0007)
US −2.0932*** −0.0018** −0.0005* 0.0044*** 0.0073*** −0.0106** 0.909
(0.1910) (0.0009) (0.0003) (0.0004) (0.0022) (0.0042)
This table presents the regression model results linking the short- and long-term horizons of the wavelet correlation with domestic macroeconomic factors
and global financial uncertainty (Eq. (4)). The explanatory variables include two global factors originating in the US market: VIX (Chicago Board Options
Exchange Implied Volatility Index as a proxy for global stock market uncertainty) and MOVE (Merrill Lynch Option Volatility Estimate Index as a proxy for
global bond market uncertainty). Domestic macroeconomic factors include: CPI (the Consumer Price Index as a proxy for inflation environment), IP (the
Industrial Production Index as a proxy for domestic business cycle fluctuations), and IIR (the three-month interbank interest rate as a proxy for monetary
policy stance). Figures in parenthesis are the Newey-West robust standard errors.* Statistical significance at 10%.
** Statistical significance at 5%.*** Statistical significance at 1%.
business cycle pattern is the least influential macroeconomic factor in the short run as it is significant in only two markets,
suggesting that the emerging market stock–bond return correlation is virtually unaffected by the domestic business cycle
patterns at the short horizon.
Panel B of Table 3 reports the impact of global financial market uncertainty and domestic macroeconomic factors on the
correlation between stock and bonds at the long-term horizon (low frequency). Generally, in comparison to the short-term
horizon analysis, a significantly higher impact of factors used on the stock–bond correlation is found at the long-term horizon.
For each emerging market there were at least three statistically significant variables of interest affecting the stock–bond
correlation in the long run, while for certain countries there are four or even five significant factors. The explanatory power

Acta Wasaensia 35
50 N. Dimic et al. / Research in International Business and Finance 36 (2016) 41–51
of the model (R-squared) differs considerably between short- and long-term analyses, ranging from 22% to 65% in the short
term, and from 74% to 96% in the long-term period.
The most influential macroeconomic factor for the long-term period stock–bond correlation is inflation, as the consumer
price index variable is highly significant in all ten emerging markets in the sample. This result is consistent with the general
literature, suggesting that inflation can be seen as one of the key driving factors for the correlation between stock and bond
returns. In particular, our results demonstrate that the inflation and stock–bond return correlation at the long-term horizon
are positively related, given that the sign of the estimated coefficient for inflation is positive in almost all emerging countries
(except Brazil and Venezuela). Since bond prices are negatively related to inflation, our finding indicates that high inflation
also has a negative impact on stock prices, which is in line with Ilmanen (2003) and Andersson et al. (2008). Hence, negative
relation of inflation with both stocks and bonds consequently leads to movement of stocks and bonds in the same direction,
resulting in a positive relation between inflation and the stock–bond correlation.
The second most important factor in explaining the long-term horizon correlation of emerging stocks and bonds is global
stock market uncertainty. US stock market implied volatility is found to be significant in nine out of ten emerging markets. A
significant and positive sign for the VIX coefficient is found in seven countries, namely Argentina, Brazil, Bulgaria, Colombia,
Peru, Russia, and Venezuela, suggesting that high stock market uncertainty has a negative effect on both stocks and bonds
in those emerging markets in the long run. This finding further implies that the stock and bond prices on emerging markets
tend to co-move more during periods of high uncertainty on the US equity market.
The third influential macroeconomic factor for the stock–bond correlation in the long run is the business cycle, appearing
significant in eight emerging markets. The estimated coefficients of the industrial production index are positive and statis-
tically significant in seven countries, specifically Argentina, Bulgaria, Colombia, Peru, Russia, Turkey, and Venezuela. This
result indicates that the domestic trend in growth may have a similar effect on stock and bond returns in the long run,
causing a positive correlation. The effect of monetary policy stance is similar on the short- and long-term horizons. Similarly
to the short-term horizon, the sign of the IIR coefficient is not consistent on the long-term horizon. The empirical analysis
also shows that the MOVE index is the least influential factor for the emerging market stock–bond correlation analysis in
the long term. Generally the stock–bond correlation in emerging markets is virtually unaffected by the implied volatility of
the US bond market. Therefore US stock market uncertainty plays a much bigger role than US bond market uncertainty as
regards the impact of the correlation on stock and bond returns in emerging markets.
We continue our analysis by examining factors affecting the stock–bond correlation in the US market on the short and
long horizons, and by providing a brief comparison with the case of the emerging markets. The regression results for the US
market demonstrate that the implied volatility of both stocks and bonds impacts the correlation of stock–bond returns at the
short and long horizons. The negative significant coefficient for VIX is consistent with the general literature on the stock–bond
correlation in developed markets and the “flight-to-safety” phenomenon. Differently from the emerging markets, the US
stock–bond correlation is affected by the uncertainty also originating from bond market. Finally, similarly to the emerging
markets, the estimated coefficients on CPI and IP are positive and highly statistically significant at the long horizon, implying
that growth in inflation and production has a positive impact on the stock–bond correlation.
5. Conclusions
This article examines the short- and long-term horizon patterns of the stock–bond correlation in emerging markets and
the factors driving the time-varying correlations. In particular, we study the impact of global financial market uncertainty
and domestic macroeconomic factors on the stock–bond correlation. We utilize the powerful tool of wavelet correlations,
which enables us to simultaneously consider the time and frequency domains in the co-movement between stock and
bond returns. Our study contributes to the literature by providing new evidence on the impact of macroeconomic factors
and global financial market uncertainty on both short- and long-term stock–bond correlations in emerging markets. While
earlier research has focused on the impact of uncertainty coming only from stock markets, we examine connections between
global bond market uncertainty and stock–bond correlations.
Our empirical findings indicate that the stock–bond correlation in emerging markets differs considerably over time and
between short and long horizons. Using data from 10 emerging markets, namely Argentina, Brazil, Bulgaria, Colombia,
Mexico, Peru, the Philippines, Russia, Turkey, and Venezuela, we find that the short-term correlations between stocks and
bonds change the sign rapidly, showing sustained episodes of negative correlation corresponding to the crisis periods. Hence
the short-term analysis suggests that rapid changes in the correlation of emerging markets stocks and bonds during crisis
periods are consistent with the “flight-to-quality” phenomenon. The long-term horizon analysis demonstrates that the
stock–bond correlation in emerging markets remains positive throughout the entire sample period, suggesting “equity like”
properties of emerging market bonds in the long run due to the country-specific risks.
Further results indicate that macroeconomic factors can explain the time variations in the correlation of stock and bond
returns in emerging markets on both the short- and long-term horizons. Generally, macroeconomic factors have greater
explanatory power in explaining the correlation in the long run (low-frequency) compared to the short run (high frequency).
The most prominent macroeconomic factor in the short-term analysis is domestic monetary policy stance. Our analysis also
suggests that monetary policy easing boosts the performance of both stocks and bonds, producing a positive relationship
with the stock–bond correlation for Argentina, Peru, Russia, and Venezuela, while easing monetary policy in Brazil, Colombia,
and Mexico leads to decoupling the performance of stocks and bonds in the short run.

36 Acta Wasaensia
N. Dimic et al. / Research in International Business and Finance 36 (2016) 41–51 51
The long-term horizon analysis shows that inflation and US stock market implied volatility are the most important
macroeconomic factors responsible for time varying of the stock–bond return correlation. Furthermore, the long run analysis
demonstrates a positive relationship between inflation and the stock–bond correlation in emerging markets. Since bond
prices are negatively related to inflation, our finding indicates that high inflation also has a negative impact on stock prices.
The empirical findings further indicate a positive relationship between US stock market uncertainty and the stock–bond
correlation in emerging markets. In addition, global stock market uncertainty plays a more significant role than global bond
market uncertainty in explaining stock–bond correlations in emerging markets.
The results of this study offer interesting insights for both short- and long-term investors, as they can benefit from taking
account of the time and frequency domains analysis of the stock–bond correlation in making asset allocation decisions.
Moreover, our findings are also helpful in shedding further light on the influence of macroeconomic factors and financial
market uncertainty on the stock–bond correlation in emerging markets at the short and long horizons.
References
el Alaoui, A.O., Dewandaru, G., Rosly, S.A., Masih, M., 2015. Linkages and co-movement between international stock market returns: case of Dow JonesIslamic Dubai Financial Market index. J. Int. Financ. Mark. Inst. Money 36, 53–70.
Aloui, C., Hammoudeh, S., Hamida, H.B., 2015. Co-movement between sharia stocks and sukuk in the GCC markets: a time-frequency analysis. J. Int.Financ. Mark. Inst. Money 34, 69–79.
Andersson, M., Krylova, E., Vähämaa, S., 2008. Why does the correlation between stock and bond returns vary over time? Appl. Financ. Econ. 18, 139–151.Aslanidis, N., Christiansen, C., 2014. Quantiles of the realized stock–bond correlation and links to the macroeconomy. J. Empir. Financ. 28, 321–331.Baele, L., Bekaert, G., Inghelbrecht, K., 2010. The determinants of stock and bond return comovements. Rev. Financ. Stud. 23, 2374–2428.Baur, D.G., Lucey, B.M., 2009. Flights and contagion – an empirical analysis of stock–bond correlations. J. Financ. Stabil. 5, 339–352.Bianconi, M., Yoshino, J.A., Machado de Sousa, M.O., 2013. BRIC and the U.S. financial crisis: an empirical investigation of stock and bond markets. Emerg.
Mark. Rev. 14, 76–109.Bunda, I., Hamann, A.J., Lall, S., 2009. Correlations in emerging market bonds: the role of local and global factors. Emerg. Mark. Rev. 10, 67–96.Boyer, B.H., Kumagai, T., Yuan, K., 2006. How do crises spread? Evidence from accessible and inaccessible stock indices. J. Financ. 61, 957–1003.Campbell, J., Ammer, J., 1993. What moves the stock and bond markets? A variance decomposition for long-term asset returns. J. Financ. 48, 3–37.Cappiello, L., Engle, R., Sheppard, K., 2006. Asymmetric dynamics in the correlations of global equity and bond returns. J. Financ. Econom. 4, 537–572.Christopher, R., Kim, S.-J., Wu, E., 2012. Do sovereign credit ratings influence regional stock and bond market interdependencies in emerging countries? J.
Int. Financ. Mark. Inst. Money 22, 1070–1089.Connolly, R., Stivers, C., Sun, L., 2005. Stock market uncertainty and the stock–bond return relation. J. Financ. Quant. Anal. 40, 161–194.Connolly, R., Stivers, C., Sun, L., 2007. Commonality in the time-variation of stock–stock and stock–bond return comovements. J. Financ. Mark. 10, 192–218.Croux, C., Forni, M., Reichlin, L., 2001. A measure of comovement for economic variables: theory and empirics. Rev. Econ. Stat. 83, 232–241.Grinsted, A., Moore, J.C., Jevrejeva, S., 2004. Application of cross wavelet transform and wavelet coherence to geophysical time series. Nonlinear Process.
Geophys. 11, 561–566.Gulko, L., 2002. Decoupling. J. Portfolio Manage. 28, 59–67.Harrison, P., Zhang, H.H., 1999. An investigation of the risk and return relation at long horizons. Rev. Econ. Stat. 81, 399–408.Ilmanen, A., 2003. Stock–bond correlations. J. Fixed Income 13, 55–66.Kelly, J.M., Martins, L.F., Carlson, J.H., 1998. The relationship between bonds and stocks in emerging countries. J. Portfolio Manage. 24, 110–122.Kim, S., In, F., 2007. On the relationship between changes in stock prices and bond yields in the G7 countries: wavelet analysis. J. Int. Financ. Mark. Inst.
Money 17, 167–179.Kim, S.-J., Moshirian, F., Wu, E., 2006. Evolution of international stock and bond market integration: influence of the European Monetary Union. J. Bank.
Financ. 30, 1507–1534.Kiviaho, J., Nikkinen, J., Piljak, V., Rothovius, T., 2014. The co-movement dynamics of European frontier stock markets. Eur. Financ. Manage. 20, 574–595.Li, L., 2004. Macroeconomic factors and the correlation of stock and bond returns. In: Proceedings of the 2004 American Finance Association Meeting.O’Brien, R.M., 2007. A caution regarding rules of thumb for variance inflation factors. Qual. Quant. 41, 673–690.Panchenko, V., Wu, E., 2009. Time-varying market integration and stock and bond return concordance in emerging markets. J. Bank. Financ. 33, 1014–1021.Piljak, V., 2013. Bond markets co-movement dynamics and macroeconomic factors: evidence from emerging and frontier markets. Emerg. Mark. Rev. 17,
29–43.Rua, A., 2010. Measuring comovement in the time-frequency space. J. Macroecon. 32, 685–691.Rua, A., Nunes, L.C., 2009. International comovement of stock market returns: a wavelet analysis. J. Empir. Financ. 16, 632–639.Torrence, C., Compo, G.P., 1998. A practical guide to wavelet analysis. Bull. Am. Metrol. Soc. 79, 61–78.Yang, Y., Zhou, Y., Wang, Z., 2009. The stock–bond correlation and macroeconomic conditions: one and a half centuries of evidence. J. Bank. Financ. 33,
670–680.
Acta Wasaensia 37
Bond–Equity Yield Ratio Market Timing in Emerging Markets1
Nebojsa Dimic2 , Vitaly Orlov3 , Janne Äijö4
University of Vaasa, Department of Accounting and Finance, P.O. Box 700, FI-65101 Vaasa, Finland
Abstract
This paper investigates the market timing ability of the bond–equity yield ratio (BEYR) from an international investor perspective. Consolidating data on emerging markets, we document no major international evidence that BEYR-based investing strategies, namely extreme values, thresholds, and moving averages, provide higher risk-adjusted returns than benchmark buy-and-hold portfolios. However, we develop new augmented BEYR indicators by introducing the notion of U.S. bonds as a safe investment relative to emerging market stocks and bonds. Dynamic strategies based on our augmented BEYR indicators produce significant gains in risk-adjusted returns compared to traditional BEYR and buy-and-hold benchmark strategies.
JEL classifications:
Keywords: BEYR, emerging markets, market timing
1 The paper was partially written while Vitaly Orlov was a visiting scholar at Columbia Business School. We thank the participants of the 2016 FMA European Conference, INFINITI Conference on International Finance and Australasian Finance & Banking Conference for helpful suggestions. Vitaly Orlov gratefully acknowledges financial support from the OP-Pohjola Group Research Foundation (grant 201500087) and the Marcus Wallenberg foundation. 2 Corresponding author. Tel.: +358 45 104 7707. E-mail address: [email protected] (N. Dimic). 3 Tel.: +358 41 700 8227. E-mail address: [email protected] (V. Orlov). 4 Tel: +358 6 324 8276. E-mail address: [email protected] (J. Äijö).

38 Acta Wasaensia
1. Introduction
The empirical relationship between stock and bond markets is of great importance to investors (Baker & Wurgler, 2012). In particular, market participants are interested in the returns and diversification properties of the two major asset classes. The extant literature documents a number of financial and accounting variables associated with stocks and bonds that have been evaluated and tested as a foundation for various trading rules.5 In this study, we examine the market timing ability of the bond–equity yield ratio (BEYR) from an international investor perspective in the emerging market setting.
The underlying motivation behind using the bond–equity yield ratio as a relative pricing tool for allocating the capital between stocks and bonds can be described as follows: Yields on bonds and dividend yields associated with stocks should be approximately equal or at least strongly correlated in the long run, and therefore BEYR should vary around its long-run equilibrium (Maio, 2013). If equity yields fall, bonds become more attractive to investors and their prices rise, which, in turn, will cause bond yields to fall, making equity yields look attractive again (Giot & Petitjean, 2009). A decline in bond yields pushes the BEYR down from its long-term equilibrium while a fall in equity yields drives it back up. If the BEYR were too low compared to the long-run level, bonds would be viewed as expensive relative to stocks and the traditional investing rule would suggest “sell bonds and buy stocks.” Inversely, if the BEYR were too high related to its long-run equilibrium, equities would be viewed as too expensive relative to bonds and the investing rule would suggest “sell stocks and buy bonds.”
The purpose of this article is twofold. First, by comparing the performance of BEYR-based strategies to traditional buy-and-hold bonds and stocks benchmark strategies we explore the market timing ability of the BEYR using emerging market data. This is conducted by employing three BEYR-based active investment strategies, namely extreme values, the thresholds BEYR rule, and moving averages. Second, we develop two new augmented BEYR indicators, in which we introduce the U.S. bonds as a safe haven investment relative to the emerging market stocks and bonds. Establishing new augmented BEYR indicators is motivated by the literature suggesting that emerging market bonds exhibit properties of “equity-like” risky assets due to the high country risk and uncertainty in emerging economies (Kelly et al., 1998; Panchenko & Wu, 2009; Piljak, 2013). Thus, the underlying concept is that risk-averse investors, when substituting safer assets for their risky ones, prefer allocating their capital to bonds from developed countries (proxied by the U.S. government bonds), rather
5 These variables include the lagged equity return (see Fama & French, 1988; Lo & MacKinlay, 1988; among others), dividend-to-price ratio (see Fama & French, 1988, 1989; Campbell & Shiller, 1988; Robertson & Wright, 2006; Goyal & Welch, 2003; Lettau & Van Nieuwerburgh, 2008; Chen, 2009; among others), earnings-to-price ratio (see Fama & French, 1988; Campbell & Shiller, 1988, 1998; Campbell & Vuolteenaho, 2004; Campbell & Yogo, 2006; et al., 2008; among others), the ratio of forecast equity earnings to the current bond yield (Lander et al., 1997), and the change in the short yield (Campbell & Hamao, 1989).
Acta Wasaensia 39
than bonds in emerging markets. The performance of the augmented BEYR investing strategies is compared with the benchmark buy-and-hold and traditional BEYR-based strategies.
Our study contributes to the literature in three important ways. First, we add to the strand of literature investigating BEYR market timing (Levin & Wright, 1998; Brooks & Persand, 2001; Harris & Sanchez-Valle, 2000) by providing new international evidence from emerging markets. The literature has traditionally focused on developed markets, and this is the first study that considers emerging markets a separate category in the context of BEYR market timing. Second, by employing the U.S. bonds as a safe asset and emerging markets’ stocks or bonds as risky assets, we construct new augmented BEYR indicators serving as a valuable relative pricing tool that can be used to dynamically allocate capital between safe and risky assets in the international setting. Third, in line with Kelly et al. (1998), Panchenko & Wu (2009), and Piljak (2013), we provide supplementary evidence that emerging market bonds should not be assigned the properties of a safe investment relative to emerging market stocks. By comparing the performance of traditional and augmented BEYR-based strategies we confirm the equity-like properties of emerging market bonds. Empirical findings from this paper can benefit international investors seeking profitable trading opportunities between stock and bond markets.
The empirical findings reported in this study show that the traditional BEYR investing strategies (constructed from the emerging market bond and stock yields) do not deliver significantly higher risk-adjusted returns relative to buy-and-hold benchmark strategies. Our results are therefore casting doubt on the market timing ability of the traditional BEYR, providing further international support to the findings in Brooks & Persand (2001) and Giot & Petitjean (2009). Furthermore, all of the augmented BEYR-based trading strategies (using U.S. bonds as a safe asset and emerging market stocks and bonds as risky assets) deliver higher risk-adjusted returns compared to the benchmark buy-and-hold bonds or stocks strategies.
The remainder of the paper is organized as follows. In Section 2, we describe the theoretical rationale for using the BEYR as an investing tool. Section 3 presents the dataset, provides descriptive statistics, and describes various methods of BEYR investing. In Section 4, we present the results. Finally, Section 5 concludes the paper.
2. Essential Theory Underlying BEYR
The cornerstone of bond–equity yield ratio market timing is the relationship between risky assets (stocks) and safe assets (bonds). BEYR is defined as the ratio of the income yield on long-term government bonds to the dividend yield on equities.6 It has been identified by the practitioners as a useful tool for detecting relative mispricing between bonds and equities. The
6 In the United Kingdom, the BEYR is known as gilt–equity yield ratio (GEYR).

40 Acta Wasaensia
theoretical rationale for using the BEYR as a tool for detecting profitable trading opportunities between stocks and bonds can be seen from its basic definition:
BEYR = (1)
where represents the income stream from bonds (coupon), is the income stream from the equity (dividend), and and are the observed prices of bonds and equity, respectively. Consequently, the expression for underlying determinants of the observable BEYR follows:7
BEYR = ( )[ ( )( )/ ]( )[ ( )( )/ ] (2)
where is the risk-free discount rate, is the equity risk premium, and and are the
corresponding growth in the income stream from bonds and equity, respectively. Equation (2) accordingly suggests that BEYR will diverge if is not equal to , which means that the equity prices are being mispriced relative to bond prices . In other words, other things remaining equal, if equities are priced too high relative to bonds, this will increase the value of BEYR, and if equity is priced too low compared to bonds, the result will be a lower BEYR value.
Because BEYR represents a ratio of bond yield, which is a nominal variable in nature and equity yield, which is a real variable, it is evident that the BEYR is exceptionally sensitive to expected inflation. Specifically, while firms can raise their prices in response to inflation, bond coupons stay fixed in nominal terms. The positive effect of inflation on equity yields (also known as the “money illusion error”) can be attributed to distorted corporate earnings and capital gain taxes (Asness, 2003). Thus, investors demand higher risk premiums and expected returns with high inflation, causing equity yield to rise (Giot & Petitjean, 2009). The growth rate is also affected by anticipated inflation caused by the restrictive monetary regime that results from rising inflation expectations (Levin & Wright, 1998). To consolidate the impact of expected inflation on the real value of bond coupons (which is a constant in nominal terms), the following BEYR equation is derived:
BEYR = ( )[ ( )( )/ ]( )[ ( )( )/ ] (3)
7 For more details on the BEYR formula derivation please see Levin & Wright (1998).

Acta Wasaensia 41
where (1 + R)(1 + ) = 1+ r; (1+ G)(1 + ) = 1+ g; and (1 + )(1 + ) = 1 + represent Fisher equations for the relationship between the nominal and real variables. R represents the real interest rate, G is the real growth rate in the income stream, and depicts the real equity risk premium.
The relationship between bonds and stocks is shaped by two effects. First, the “discount rate effect” suggests a negative relationship between bond and equity yields driven by the rationale that cost of equity depends on prevailing interest rates and accordingly rising (falling) bond yields lead to the lower (higher) stock prices (Giot & Petitjean, 2009). An alternative view called the “cash flow effect” proposes a positive correlation between stock prices and bond yields motivated by the argument that rising inflation drives bond yields as well as the growth of future nominal cash flow from equities up, which in turn raises equity prices as well. Nevertheless, the general agreement in stock–bond literature is that the “discount rate effect” should prevail during expansion periods while the “cash flow effect” is more important during contractions (Boyd et al., 2005; Anderson et al., 2008).
The fluctuations of the economy between periods of expansions (growth) and contractions (recession) have an impact on market participants’ risk aversion, thereby also affecting the prices of stocks and bonds simultaneously (Gulko, 2002; Connolly et al., 2005; Andersson et al., 2008; Baur & Lucey, 2009). Government bonds, by definition, are deemed to be safe haven assets relative to stocks in developed markets. During times of financial turmoil, investors engage in “flight-to-safety” as they substitute risky assets (stocks) for safer assets (bonds). However, the relationship between stock and bond prices is altered in emerging markets. Specifically, prices of both assets tend not to move in opposite directions during crisis periods. Subsequently, due to the specific country risk in emerging economies, domestic bond returns show patterns of “equity-like” securities and, in turn, the “flight-to-quality” phenomenon does not exist (Kelly et al., 1998).
In a nutshell, the relationship between the stock and bond yields is fairly sophisticated, and the overall picture is further complicated in the emerging market setting. Moreover, the ability of BEYR to work as a trading rule foundation in emerging economies is challenged by the country-dependent comovements in stock and bond prices and the risk premium. Thus, no definite proof in support of the BEYR approach exists (Giot & Petitjean, 2009).

42 Acta Wasaensia
Tab
le 1
: Sum
mar
y of
the
Prio
r L
itera
ture
Th
is ta
ble
repo
rts th
e su
mm
ary
of th
e pr
ior l
itera
ture
incl
udin
g th
e co
untri
es in
vest
igat
ed p
revi
ousl
y. A
dditi
onal
ly, t
he ta
ble
repo
rts re
sults
on
whe
ther
or n
ot a
mod
el
asso
ciat
ed w
ith st
ocks
and
bon
ds c
an b
e us
ed a
s val
uabl
e m
arke
t tim
ing
tool
. Typ
ical
ly, m
arke
t tim
ing
prop
ertie
s of t
hree
mod
els a
re u
sed:
the
Fed
mod
el, t
he b
ond–
equi
ty
yiel
d ra
tio (B
EYR
), an
d th
e bo
nd–s
tock
ear
ning
s yie
ld d
iffer
entia
l (B
SEY
D).
Aut
hors
M
odel
Use
d C
ount
ries I
nves
tigat
ed
Per
iod
Res
ults
B
elgi
um
Can
ada
Fran
ce
Ger
man
y Ja
pan
Net
herla
nds
Switz
erla
nd
UK
U
S C
lare
et a
l. (1
994)
G
EYR
x
19
68-1
992
Posi
tive
Levi
ng &
Wrig
ht (1
998)
G
EYR
x
1982
-199
6 M
ixed
H
arris
& S
anch
ez-V
alle
(200
0)
GEY
R
x x
1968
-199
7 Po
sitiv
e B
rook
s & P
ersa
nd (2
001)
G
EYR
x
x x
1975
-199
7 N
egat
ive
Asn
ess (
2003
) Fe
d M
odel
x
1881
-200
1 M
ixed
B
erge
& Z
iem
ba (2
003)
B
SEY
D
x x
x x
x 19
70-2
000
Posi
tive
Gw
ilym
et a
l (20
04)
Fed
Mod
el
x x
x x
x x
1973
-200
3 M
ixed
G
iot &
Pet
itjea
n (2
009)
B
EYR
x
x x
x 19
73-2
004
Neg
ativ
e Ll
eo &
Zie
mba
(201
3)
BSE
YD
x
1962
-201
2 Po
sitiv
e M
aio
(201
3)
Fed
Mod
el
x 19
53-2
008
Posi
tive

Acta Wasaensia 43
2.1 Related Literature on BEYR
Several studies discuss the market timing properties of three models associated with bonds and stocks: the Fed model, the bond–equity yield ratio (BEYR), and the bond–stock earnings yield differential (BSEYD). Studies like Asness (2003), Gwilym et al. (2004), and Maio (2013) address the Fed model, which uses the yield gap, the difference between equity yields on stock market indexes and long-term yields on treasury bonds. Other studies such as Levin & Wright (1998), Brooks & Persand (2001), Giot & Petitjean (2009), and Harris & Sanchez-Valle (2000) focus on BEYR, which is defined as the ratio of bond yields over the equity yields (dividend or earnings yields). Finally, Berge & Ziemba (2003) and Lleo & Ziemba (2013) focus on bond–stock earnings yield differential (BSEYD), defined as the ratio between long-term government bonds yields and earnings yields on stocks. All of the models are essentially based on the same underlying theory that stocks and bonds are interchangeable investment assets with their yields being highly correlated in the long run.
The literature on market timing of the BEYR offers miscellaneous explanations and inconclusive results on whether the BEYR can be used as a profitable trading rule. A summary of the literature including the countries investigated and the results on whether a model associated with stocks and bonds can be used as valuable market timing tool is reported in Table 1. Clare et al. (1994) and Harris & Sanchez-Valle (2000) investigate a number of BEYR-based trading rules that in turn deliver higher average returns and lower standard deviations than buy-and-hold strategies. Additionally, Levin & Wright (1998) introduce the threshold values for BEYR market timing strategy in determining whether the equities and bonds are cheap or expensive and conclude that the BEYR model is superior to all other benchmark portfolios. Conversely, Brooks & Persand (2001) and Giot & Petitjean (2009) find no international evidence that BEYR-based trading strategies deliver significantly higher risk-adjusted returns than buy-and-hold stocks or bonds portfolios. Owing to the general disagreement in the literature, Giot & Petitjean (2009) argue that future research is warranted to investigate how BEYR might be best modeled and implemented.
3. Data and Trading Rules
Monthly data on stock index dividend yields and income yields on government bonds were obtained from the Thomson Reuters Datastream.8 The empirical part focuses on 13 emerging markets, namely Argentina, Brazil, Bulgaria, China, Colombia, Ecuador, India, Mexico, Peru, the Philippines, Russia, Turkey, and Venezuela as well as the United States. The sample data cover the period January 1994 until September 2014. We incorporate the longest available data set for each country in the study.9 The selection of the emerging markets in our sample
8 Related studies like Harris & Sanchez-Valle (2000), Brooks & Persand (2001), and Giot & Petitjean (2009) utilize monthly data for the empirical analysis. 9 Number of observations for all of the countries included in the sample is totaling 249, except for Bulgaria, Colombia, Philippines and Turkey with total of 182 monthly observations.
44 Acta Wasaensia
is based on the country composition of both the Morgan Stanley Capital International (MSCI) BRIC Index 10 and the J.P. Morgan Emerging Market Bond Index Plus (EMBI+). 11 Stock market indexes for each emerging market are provided by MSCI. The inclusion of the U.S. market in the study was due to its role as a global factor in the international financial markets. The U.S. bond market is represented by 10-year government bonds. All of the stock and bond indexes are denominated in U.S. dollars.
Further, we carry out a set of empirical experiments aimed at evaluating traditional and augmented BEYR performance as a relative pricing tool for allocating funds between risky and safe assets. In the traditional BEYR evaluation we compare two basic benchmark rules, namely buy-and-hold equity and buy-and-hold bonds with a number of BEYR-based active trading strategies. Specifically, we employ the extreme value strategy, the thresholds BEYR rule, and the moving averages investing strategies. In addition to the traditional BEYR, we create two new augmented BEYR variables, integrating the U.S. bonds in the calculation as a proxy for safe investment relative to risky emerging market stocks and bonds. Inclusion of U.S. bonds as a safe asset relative to emerging market stocks and bonds is motivated by the literature treating the emerging market bonds as risky “equity-like” assets due to high country risk and uncertainty in emerging economies.
Trading rules for the traditional BEYR are based on the basic principle of shifting the capital between the competing assets: stocks (risky assets) and long-term government bonds (safe assets). Deviations from the long-term equilibrium are used as a signal in the trading rules. In situations where bond yields are exceptionally low relative to equity yields, and therefore the BEYR is too low compared to its long-term equilibrium, we shift our position from bonds to stocks. Correspondingly, we shift from stocks to bonds if the BEYR is too high or stock yields are much higher than bond yields.
10 MSCI BRIC Index is a free float-adjusted market capitalization weighted index. It measures the equity market performance for Brazil, Russia, India, and China. The index covers approximately 85% of the free float-adjusted market capitalization in each country. 11 The EMBI+ is J.P. Morgan’s most liquid U.S. dollar emerging markets debt benchmark. It tracks returns for actively traded debt instruments in emerging markets including Brady bonds, Eurobonds, and traded loans issued by sovereign entities. The EMBI+ index includes only issues with a current face amount outstanding of $500 million or more and remaining life of greater than 2.5 years. The J.P. Morgan indexes are the most widely used and comprehensive emerging market sovereign debt benchmarks. EMBI+ includes 18 countries. Our sample is limited to those countries with data available for both stock and bond markets (prices and yields) during the entire sample period.

Acta Wasaensia 45
Tab
le 2
: Des
crip
tive
stat
istic
s
Pane
l A: D
escr
iptiv
e sta
tistic
s on
tradi
tiona
l BEY
R c
alcu
late
d fro
m e
mer
ging
mar
ket b
ond
and
stoc
k yi
elds
)
AR
G
BR
A
BU
L C
HI
CO
L EC
U
IND
M
EX
PER
PHI
RU
S TU
R
VEN
M
ean
4.73
3.
14
6.52
1.
97
2.48
4.
79
6.38
4.
47
3.02
3.
96
4.94
4.
79
3.67
M
edia
n 3.
38
2.28
4.
63
1.60
2.
12
4.47
6.
15
4.07
2.
17
3.12
3.
47
3.43
2.
18
Max
imum
11
.10
8.33
41
.46
6.78
6.
73
15.7
6 12
.31
10.8
2 8.
71
10.5
4 16
.94
14.8
4 15
.53
Min
imum
1.
34
0.89
0.
15
0.72
0.
61
0.86
2.
22
1.51
0.
57
1.54
0.
67
1.75
0.
69
Std
. Dev
. 2.
78
2.11
6.
97
1.18
1.
40
3.10
2.
35
1.88
2.
15
2.17
4.
10
3.20
3.
70
Ske
wne
ss
0.67
1.
14
2.14
1.
64
0.88
0.
91
0.24
0.
60
0.92
0.
73
1.24
1.
22
1.70
K
urto
sis
2.07
2.
96
9.05
5.
73
2.82
3.
67
2.27
2.
53
2.56
2.
37
3.50
3.
40
4.83
Ja
rque
-Ber
a 27
.75
52.3
9 35
4.87
18
7.11
24
.03
33.6
2 7.
85
17.1
9 31
.33
19.4
5 53
.69
46.6
0 15
4.46
P
roba
bilit
y 0.
00
0.00
0.
00
0.00
0.
00
0.00
0.
02
0.00
0.
00
0.00
0.
00
0.00
0.
00
Pane
l B: D
escr
iptiv
e sta
tistic
s on
augm
ente
d B
EYR
calc
ulat
ed fr
om U
S bo
nd y
ield
s and
em
ergi
ng m
arke
t equ
ity (d
ivid
end)
yie
lds
US-
AR
G
US-
BR
A
US-
BU
L U
S-C
HI
US-
CO
L U
S-EC
U
US-
IND
U
S-M
EX
US-
PER
U
S-PH
I U
S-R
US
US-
TUR
U
S-V
EN
Mea
n 1.
69
1.59
4.
89
1.70
1.
92
1.45
3.
10
2.92
4.
53
4.14
2.
36
2.13
1.
51
Med
ian
1.62
1.
11
3.02
1.
40
1.60
1.
22
3.04
2.
83
1.53
2.
52
1.92
1.
74
0.75
M
axim
um
5.04
5.
15
25.0
5 6.
12
6.38
4.
08
6.94
7.
79
52.0
0 18
.11
5.75
8.
40
5.92
M
inim
um
0.20
0.
36
0.34
0.
34
0.29
0.
21
0.91
0.
71
0.26
0.
49
0.34
0.
59
0.11
S
td. D
ev.
1.02
1.
21
5.22
1.
10
1.28
0.
83
1.33
1.
38
8.29
4.
33
1.45
1.
31
1.65
S
kew
ness
0.
93
1.41
1.
93
1.53
0.
96
0.68
0.
45
0.55
3.
49
1.78
0.
37
1.66
1.
39
Kur
tosi
s 4.
02
3.74
6.
68
5.42
3.
12
2.76
2.
69
2.92
16
.99
5.00
1.
88
6.16
3.
46
Jarq
ue-B
era
46.6
6 85
.65
184.
11
157.
18
38.2
8 16
.83
9.36
12
.49
534.
99
172.
54
15.0
4 21
8.36
82
.31
Pro
babi
lity
0.00
0.
00
0.00
0.
00
0.00
0.
00
0.01
0.
00
0.00
0.
00
0.00
0.
00
0.00

46 Acta Wasaensia
Pane
l C: D
escr
iptiv
e sta
tistic
s on
augm
ente
d B
EYR
calc
ulat
ed fr
om U
S bo
nd y
ield
s and
em
ergi
ng m
arke
t bon
d yi
elds
US-
AR
G
US-
BR
A
US-
BU
L U
S-C
HI
US-
CO
L U
S-EC
U
US-
IND
U
S-M
EX
US-
PER
U
S-PH
I U
S-R
US
US-
TUR
U
S-V
EN
Mea
n 0.
38
0.50
0.
82
0.84
0.
55
0.34
0.
50
0.64
0.
55
0.55
0.
54
0.51
0.
39
Med
ian
0.37
0.
51
0.61
0.
85
0.54
0.
34
0.50
0.
65
0.55
0.
54
0.54
0.
52
0.40
M
axim
um
0.76
0.
79
6.88
1.
47
0.83
0.
75
0.88
0.
88
0.84
0.
79
0.87
0.
76
0.75
M
inim
um
0.11
0.
17
0.25
0.
39
0.26
0.
10
0.18
0.
30
0.27
0.
27
0.22
0.
25
0.12
S
td. D
ev.
0.18
0.
12
0.75
0.
17
0.11
0.
12
0.14
0.
11
0.12
0.
10
0.16
0.
12
0.16
S
kew
ness
0.
20
-0.2
5 3.
94
0.23
0.
11
0.46
-0
.06
-0.3
4 0.
22
0.07
0.
21
-0.1
5 0.
29
Kur
tosi
s 1.
68
2.91
23
.28
4.98
2.
65
2.98
2.
94
2.73
2.
60
2.47
2.
04
2.14
2.
22
Jarq
ue-B
era
19.7
5 2.
60
752.
91
42.4
3 1.
27
8.46
0.
18
5.42
3.
15
2.32
9.
34
6.25
9.
66
Pro
babi
lity
0.00
0.
27
0.00
0.
00
0.53
0.
01
0.92
0.
07
0.21
0.
31
0.01
0.
04
0.01
Acta Wasaensia 47
Further, for our augmented BEYR-based trading strategies we shift between the U.S. bonds (safe assets) and the emerging market stocks or bonds (risky assets). If the augmented BEYR is too high, we shift the funds out of emerging market stocks or bonds into U.S. government bonds. Correspondingly, if the augmented BEYR is too low, we shift the capital from U.S. government bonds to emerging market stocks or bonds. Following the prior literature, we initially place our capital into equity for all of the strategies used.
Table 2 presents the summary statistics for the three versions of the BEYR used in the study. We construct three different versions of the BEYR to use in further analysis: (1) Panel A represents the summary statistics for the traditional BEYR calculated by taking the ratio of bond and equity yields from the same country, that is, the bond yield divided by the equity dividend yield; (2) Panel B shows the descriptive statistics for the first augmented BEYR calculated as a ratio of U.S. bond yield (safe) over the equity dividend yield from the emerging markets (risky); and (3) Panel C presents the second augmented BEYR, calculated as a ratio of U.S. bond yield (safe) over the emerging market bond yield (risky). Based on Jarque–Bera normality and kurtosis test statistics we reject the hypothesis for the normality for all of the BEYR and augmented BEYR series which gives further motivation for using the active strategy switching models for our trading rules.
3.1 Buy-and-Hold Bonds and Stocks
The passive buy-and-hold (stocks and bonds) strategy is the most appropriate benchmark for comparison purposes to active traditional and augmented BEYR-based strategies. It represents the highest possible return for the given level of risk with no active management (Levin & Wright 1998). In this basic investing strategy, we buy bonds or stocks and hold them for the entire sample period, regardless of the fluctuations in the market. Conventional investing experience from developed markets suggests that stocks render a higher return than bonds over longer time horizons.
3.2 The Extreme Value Strategy
The extreme value strategy compares the current levels of traditional and augmented BEYR to the extreme values extracted from its historical distribution. Specifically, this strategy identifies those months when investors should switch their positions between risky and safe assets based on the thresholds that are set to the 10th and 90th percentiles of the unconditional distribution of the BEYR. To spot the deviation from the long-term equilibrium, the percentiles are set according to the first 60 months of observations and then rolled forward one month at a time. Thus, we employ the following trading rule: when the current value of the traditional BEYR is lower than the 10th percentile of its unconditional distribution, we would shift the funds from bonds to equity, and inversely, if the current value of the traditional BEYR is above the 90th percentile of its unconditional distribution, we would shift the funds

48 Acta Wasaensia
out of stocks and into bonds. In this fashion we could identify the months when investors should be out of equities (or bonds) as the stock market (bond market) is too expensively priced.
Accordingly, when the current value of the augmented BEYR is lower than the 10th percentile of its distribution, we would shift the funds from U.S. bonds to emerging market stocks or bonds. Inversely, if the current value of the augmented BEYR is above the 90th percentile of its distribution, we would shift the funds out of risky emerging market stocks or bonds into safe U.S. bonds.
3.3 Thresholds BEYR Rule
The thresholds BEYR rule is based on the Hoare Govett thresholds strategy. This active trading strategy typically used by investment managers employs fixed thresholds for incrementing the portfolio toward either the total equity return index or the return on government bonds (Levin & Wright, 1998). The selected fixed thresholds of 2.0 and 2.4 are commonly used by practitioners arbitraging between stock and bond markets in the United Kingdom.
The thresholds BEYR uses the following trading rules: A traditional BEYR value lower than 2.0 results in the decision to switch the position to equity, while a traditional BEYR value over 2.4 results in the decision to shift the funds back to bonds. Correspondingly, if the current value of the augmented BEYR is lower than 2.0, we would switch the position to risky assets (emerging market stocks or bonds), while the value of BEYR over 2.4 would result in the decision to shift the funds back to safe assets (U.S. bonds).
3.4 Moving Averages Strategy
The moving averages investing strategy uses a crossover type of signal for switching the capital between bonds and stocks. Specifically, when a short-term average crosses the long-term average of BEYR, the signal is given for switching the positions. For executing the moving averages strategy in our empirical analysis, we consider six months as the short-term period and 24 months as the long-term period.
A “buy bonds and sell stocks” signal arises when the short-term average crosses above the long-term average of traditional BEYR indicator, and correspondingly, the “buy stocks and sell bonds” signal is triggered by a short-term average crossing below the long-term average. Subsequently, when a short-term average crosses above the long-term average of augmented BEYR indicator, the “buy US bonds and sell emerging market stocks or bonds” (move the capital into safe assets) signal is given. Finally, the “buy emerging market stocks or bonds and sell U.S. bonds” (move the capital into risky assets) signal is triggered by a short-term average crossing below the long-term average of the augmented BEYR indicator.
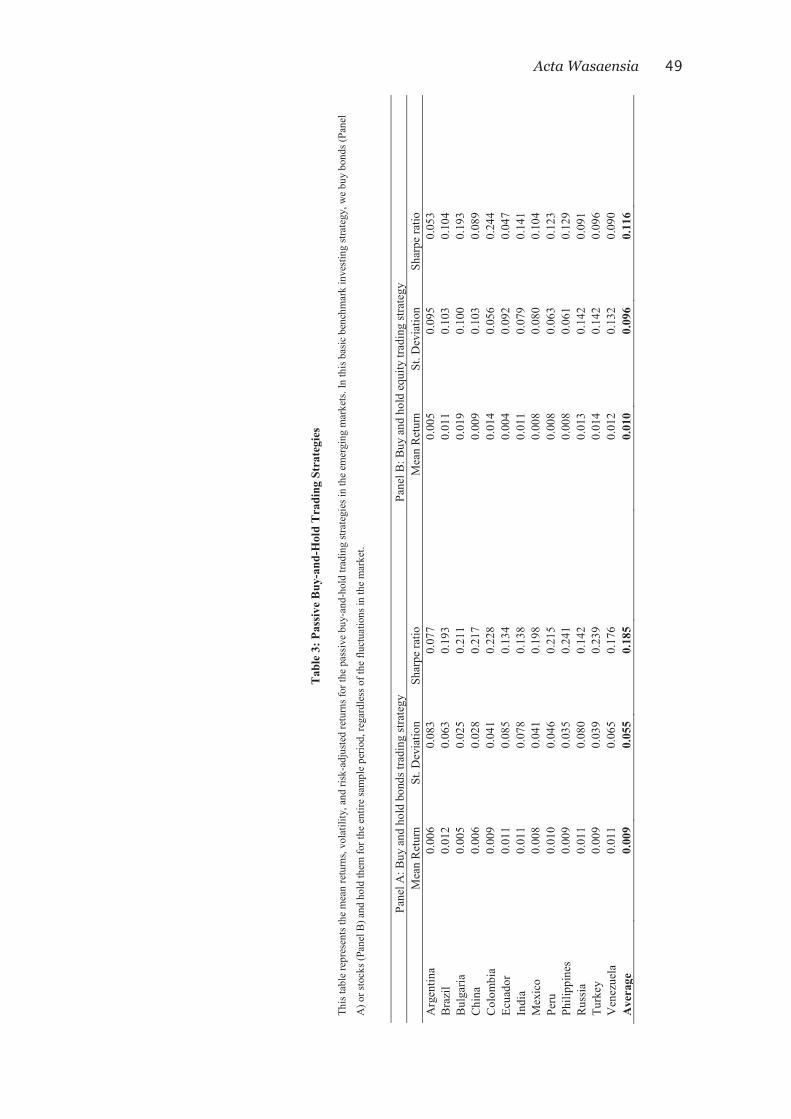
Acta Wasaensia 49
Tab
le 3
: Pas
sive
Buy
-and
-Hol
d T
radi
ng S
trat
egie
s
This
tabl
e re
pres
ents
the
mea
n re
turn
s, vo
latil
ity, a
nd ri
sk-a
djus
ted
retu
rns f
or th
e pa
ssiv
e bu
y-an
d-ho
ld tr
adin
g str
ateg
ies i
n th
e em
ergi
ng m
arke
ts. I
n th
is ba
sic b
ench
mar
k in
vest
ing
stra
tegy
, we
buy
bond
s (Pa
nel
A)o
r sto
cks (
Pane
l B) a
nd h
old
them
for t
he e
ntire
sam
ple
perio
d, re
gard
less
of t
he fl
uctu
atio
ns in
the
mar
ket.
Pane
l A: B
uy a
nd h
old
bond
s tra
ding
stra
tegy
Pa
nel B
: Buy
and
hol
d eq
uity
trad
ing
stra
tegy
M
ean
Ret
urn
St. D
evia
tion
Shar
pe ra
tio
Mea
n R
etur
n St
. Dev
iatio
n Sh
arpe
ratio
A
rgen
tina
0.00
6 0.
083
0.07
7 0.
005
0.09
5 0.
053
Bra
zil
0.01
2 0.
063
0.19
3 0.
011
0.10
3 0.
104
Bul
garia
0.
005
0.02
5 0.
211
0.01
9 0.
100
0.19
3 C
hina
0.
006
0.02
8 0.
217
0.00
9 0.
103
0.08
9 C
olom
bia
0.00
9 0.
041
0.22
8 0.
014
0.05
6 0.
244
Ecua
dor
0.01
1 0.
085
0.13
4 0.
004
0.09
2 0.
047
Indi
a 0.
011
0.07
8 0.
138
0.01
1 0.
079
0.14
1 M
exic
o 0.
008
0.04
1 0.
198
0.00
8 0.
080
0.10
4 Pe
ru
0.01
0 0.
046
0.21
5 0.
008
0.06
3 0.
123
Phili
ppin
es
0.00
9 0.
035
0.24
1 0.
008
0.06
1 0.
129
Rus
sia
0.01
1 0.
080
0.14
2 0.
013
0.14
2 0.
091
Turk
ey
0.00
9 0.
039
0.23
9 0.
014
0.14
2 0.
096
Ven
ezue
la
0.01
1 0.
065
0.17
6 0.
012
0.13
2 0.
090
Ave
rage
0.
009
0.05
5 0.
185
0.01
0 0.
096
0.11
6

50 Acta Wasaensia
4. Empirical Results
First, we turn to the question of whether or not the traditionally calculated BEYR variable can be used as a successful trading rule in emerging markets. In particular, we investigate the performance of traditional BEYR-based active strategies (extreme values, fixed thresholds rule, and moving averages) relative to passive buy-and-hold bonds and equities strategies. To do so, we examined the mean returns, standard deviations, and Sharpe ratios for each strategy. Additionally, we report the number of switches in placing the capital between stocks and bonds for each active trading strategy. Further, we expanded our empirical tests to the augmented BEYR-based strategies, compared their risk-adjusted returns to the benchmark buy-and-hold strategies, and examined whether or not they generate significantly higher average returns in comparison to the traditional BEYR-based strategies.
Table 3 presents the performance results for the benchmark buy-and-hold bonds and buy-and-hold equity strategies. On average, the emerging markets deliver a mean return of 0.9% and 1.0% per month for passively investing in bonds and stocks, respectively. Importantly, the risk-adjusted returns for the corresponding buy-and-hold bonds and stocks portfolios provide monthly Sharpe ratios of 0.185 and 0.116, respectively, across the emerging markets included in the sample. More specifically, emerging countries with the highest risk-adjusted returns from the buy-and-hold bonds strategy are Columbia and Turkey, while the highest Sharpe ratios among the emerging countries for the buy-and-hold equity strategy are delivered by Bulgaria and Colombia. After setting the benchmark strategies results, we proceed by comparing their performance with active BEYR-based investing strategies.

Acta Wasaensia 51
Tab
le 4
: Tra
ditio
nal B
EY
R A
ctiv
e T
radi
ng S
trat
egie
s
This
tabl
e re
pres
ents
mea
n re
turn
s, vo
latil
ity, a
nd tr
adin
g pr
ofita
bilit
y fo
r act
ive
tradi
ng st
rate
gies
bas
ed o
n th
e tra
ditio
nal B
EYR
. Tra
ditio
nal B
EYR
inve
stin
g st
rate
gies
are
exe
cute
d us
ing
emer
ging
mar
ket b
onds
as
a pr
oxy
for s
afe
asse
ts a
nd e
mer
ging
mar
ket s
tock
s as r
isky
asse
ts. E
xtre
me
valu
es st
rate
gy (P
anel
A) i
s bas
ed o
n th
e 90
th p
erce
ntile
of t
he u
ncon
ditio
nal d
istri
butio
n in
calc
ulat
ing
the
thre
shol
d va
lue
of th
e au
gmen
ted
BEY
R. I
f cur
rent
val
ue o
f the
BEY
R is
low
er th
an th
e 10
th p
erce
ntile
of i
ts di
strib
utio
n, w
e sh
ift th
e fu
nds
from
bon
ds to
sto
cks,
and
inve
rsel
y, if
the
curre
nt v
alue
of t
he B
EYR
is a
bove
the
90th
per
cent
ile o
f its
distr
ibut
ion,
we
shift
the
fund
s out
of s
tock
s int
o bo
nds.
Thre
shol
d BE
YR
stra
tegy
(Pan
el B
) is b
ased
on
fixed
thre
shol
ds fo
r the
low
er a
nd u
pper
regi
me
switc
hing
sign
als b
etw
een
U.S
. bon
ds a
nd e
mer
ging
mar
ket
(EM
) sto
cks
for B
EYR
val
ues.
If th
e cu
rrent
val
ue o
f BEY
R is
low
er th
an 2
.0, w
e sw
itch
the
posit
ions
to ri
sky
asse
ts (s
tock
s), w
hile
a v
alue
of B
EYR
ove
r 2.4
resu
lts in
the
deci
sion
to sh
ift th
e fu
nds b
ack
to s
afe
asse
ts (b
onds
). M
ovin
g av
erag
es st
rate
gy (P
anel
C) i
s bas
ed o
n a
cros
sove
r typ
e si
gnal
for s
witc
hing
the
capi
tal b
etw
een
bond
s and
stoc
ks. I
f a sh
ort-t
erm
ave
rage
cro
sses
the
long
-term
ave
rage
of B
EYR
, the
sign
al
is g
iven
for s
witc
hing
the
posit
ions
. A “
buy
bond
s an
d se
ll st
ocks
” (m
ove
the
capi
tal i
nto
safe
ass
ets)
sig
nal i
s gi
ven
whe
n a
shor
t-ter
m a
vera
ge c
ross
es a
bove
the
long
-term
ave
rage
of t
he B
EYR
indi
cato
r, an
d
corre
spon
ding
ly, t
he “
buy
stoc
ks a
nd se
ll bo
nds”
(mov
e th
e ca
pita
l int
o ris
ky a
sset
s) si
gnal
is tr
igge
red
by a
shor
t-ter
m a
vera
ge c
ross
ing
belo
w th
e lo
ng-te
rm a
vera
ge. I
nitia
l ly, t
he c
apita
l is p
lace
d in
to e
quity
for a
ll
of th
e st
rate
gies
. Fin
ally
, we
repo
rt th
e nu
mbe
r of s
witc
hed
posit
ions
bet
wee
n U
.S. b
onds
and
EM
bon
ds fo
r eac
h st
rate
gy.
Pane
l A: E
xtre
me
valu
es
Pane
l B: T
hres
hold
s BEY
R ru
le
Pane
l C: M
ovin
g av
erag
es st
rate
gy
Mea
n R
etur
n St
. D
evia
tion
Shar
pe
ratio
N
o of
sw
itche
s M
ean
Ret
urn
St.
Dev
iatio
n Sh
arpe
ra
tio
No
of
switc
hes
Mea
n R
etur
n St
. D
evia
tion
Shar
pe
ratio
N
o of
sw
itche
s A
rgen
tina
0.00
2 0.
082
0.02
4 3
0.00
3 0.
077
0.03
2 8
0.01
0 0.
101
0.10
1 8
Bra
zil
0.01
0 0.
106
0.09
5 0
0.01
2 0.
079
0.15
5 11
0.
008
0.06
8 0.
113
13
Bul
garia
0.
011
0.08
5 0.
130
2 0.
004
0.03
4 0.
128
3 0.
013
0.07
8 0.
163
9 C
hina
0.
013
0.07
9 0.
170
4 0.
015
0.08
3 0.
179
12
0.00
6 0.
069
0.08
3 9
Col
ombi
a 0.
014
0.05
6 0.
244
0 0.
013
0.04
8 0.
269
5 0.
008
0.03
5 0.
220
5 Ec
uado
r 0.
012
0.08
7 0.
141
4 0.
018
0.08
7 0.
207
11
0.01
3 0.
087
0.14
5 9
Indi
a 0.
014
0.07
9 0.
177
2 0.
011
0.08
0 0.
141
0 0.
014
0.08
0 0.
171
11
Mex
ico
0.01
2 0.
072
0.16
0 1
0.00
9 0.
030
0.31
1 4
0.00
7 0.
049
0.14
8 11
Pe
ru
0.00
9 0.
060
0.15
2 2
0.01
3 0.
057
0.22
3 5
0.00
7 0.
041
0.16
4 8
Phili
ppin
es
0.01
4 0.
056
0.24
6 2
0.01
3 0.
040
0.31
8 4
0.00
9 0.
026
0.33
8 4
Rus
sia
0.01
3 0.
142
0.09
1 0
0.01
0 0.
057
0.17
3 5
0.01
1 0.
051
0.21
8 7
Turk
ey
0.01
4 0.
142
0.09
6 0
0.01
1 0.
056
0.19
7 4
0.00
7 0.
053
0.12
3 6
Ven
ezue
la
0.02
1 0.
117
0.18
1 5
0.02
2 0.
111
0.20
0 10
0.
009
0.08
6 0.
109
8 A
vera
ge
0.01
2 0.
089
0.14
6 1.
923
0.01
2 0.
064
0.19
4 6.
308
0.00
9 0.
063
0.16
1 8.
308
52 Acta Wasaensia
Next, we explore whether or not a traditional BEYR can be used as a profitable market timing tool for investing in emerging markets. Table 4 provides summary results of traditional BEYR-based investing returns, standard deviations, Sharpe ratios, and number of switched positions between bonds and stocks. Specifically, we employ three active BEYR-based trading strategies, namely extreme values (Panel A), fixed thresholds rule (Panel B) and moving averages (Panel C) to guide us on investing decisions about whether to place the funds in bonds or equity inemerging markets. The results indicate that the fixed thresholds rule is the only traditional BEYR trading strategy that delivers both the mean returns and Sharpe ratios compared to benchmark strategies. Specifically, countries with the highest risk-adjusted performance are Mexico and the Philippines with the respective Sharpe ratios of 0.311 and 0.318. Moreover, the extreme values and moving averages strategies exhibit higher average returns than the equity benchmark portfolio but not the bond benchmark portfolio. On average, the buy-and-hold bond portfolio demonstrates a superior performance measured in a higher Sharpe ratio (0.185) than both the extreme values (0.146) and the moving averages strategies (0.161). The emerging market countries with the highest risk-adjusted returns based on extreme values and moving averages BEYR-based strategies are Colombia and the Philippines. Although some active trading strategies do provide higher risk-adjusted returns than buy-and-hold strategies for certain emerging market countries, the overall result of whether or not the traditional BEYR is a useful market timing tool in emerging markets is negative. The passive buy-and-hold bonds strategy delivers higher risk-adjusted returns than many of the BEYR dynamic strategies.
The results thus far cast a doubt on traditional BEYR-based strategies’ performance as trading rules in emerging markets. We observe that basic passive strategies outperform traditional BEYR active strategies in many cases. We offer the following explanation for this finding. Emerging market bonds are not safe assets relative to emerging market stocks and therefore do not offer a hedging opportunity for investors in times of falling stock markets.12 Therefore, investors with positions in emerging market stocks might prefer shifting their funds to developed market bonds instead (proxied by U.S. bonds in our sample). Consequently, we create two new augmented BEYR measures in which we combine the U.S. bond yields with emerging market stock and bond yields and investigate whether or not these new augmented BEYR strategies deliver higher risk-adjusted returns than buy-and-hold strategies as well as the traditional BEYR.
12 Emerging market bonds exhibit “equity-like” properties due to the specific country risk that emerging economies encounter.

Acta Wasaensia 53
Tab
le 5
: Aug
men
ted
BE
YR
Act
ive
Tra
ding
Str
ateg
ies:
US
bond
s - E
M S
tock
s
This
tabl
e re
pres
ents
mea
n re
turn
s, vo
latil
ity, a
nd tr
adin
g pr
ofita
bilit
y fo
r act
ive
tradi
ng st
rate
gies
bas
ed o
n au
gmen
ted
BEY
R. A
ugm
ente
d B
EYR
inve
stin
g st
rate
gies
are
exe
cute
d us
ing
U.S
. bon
ds a
s a p
roxy
for s
afe
asse
ts a
nd e
mer
ging
mar
ket (
EM) s
tock
s as r
isky
asse
ts. E
xtre
me
valu
es st
rate
gy (P
anel
A) i
s bas
ed o
n th
e 90
th p
erce
ntile
of t
he u
ncon
ditio
nal d
istri
butio
n in
cal
cula
ting
the
thre
shol
d va
lue
of a
ugm
ente
d B
EYR
. If
the
curre
nt v
alue
of t
he B
EYR
is lo
wer
than
the
10th
per
cent
ile o
f its
dist
ribut
ion,
we
shift
the
fund
s fro
m U
.S. b
onds
to E
M st
ocks
, and
inve
rsel
y, if
the
curre
nt v
alue
of t
he B
EYR
is a
bove
the
90th
per
cent
ile o
f its
dist
ribut
ion,
we
shift
the
fund
s out
of E
M st
ocks
into
U.S
. bon
ds. T
he th
resh
old
BEY
R st
rate
gy (P
anel
B) i
s bas
ed o
n fix
ed th
resh
olds
for t
he lo
wer
and
upp
er re
gim
e sw
i tchi
ng si
gnal
s be
twee
n U
.S. b
onds
and
EM
stoc
ks fo
r aug
men
ted
BEY
R va
lues
. If t
he c
urre
nt v
alue
of t
he a
ugm
ente
d B
EYR
is lo
wer
than
2.0
, we
switc
h th
e po
sitio
ns to
risk
y as
sets
(EM
stoc
ks),
whi
le a
BEY
R v
alue
ove
r 2.4
resu
lts in
the
deci
sion
to sh
ift th
e
fund
s ba
ck to
saf
e as
sets
(U.S
. bon
ds).
The
mov
ing
aver
ages
stra
tegy
(Pan
el C
) is
base
d on
a c
ross
over
type
sig
nal f
or s
witc
hing
the
capi
tal b
etw
een
U.S
. bon
ds a
nd E
M b
onds
. If a
sho
rt-te
rm a
vera
ge c
ross
es th
e
long
-term
ave
rage
of a
ugm
ente
d B
EYR
, the
sig
nal i
s gi
ven
for s
witc
hing
the
posit
ions
. A “
buy
U.S
. bon
ds a
nd se
ll EM
sto
cks”
(mov
e th
e ca
pita
l int
o sa
fe a
sset
s) s
igna
l is
give
n w
hen
a sh
ort-t
erm
ave
rage
cro
sses
abov
e th
e lo
ng-te
rm a
vera
ge o
f the
BEY
R in
dica
tor,
and
corre
spon
ding
ly, t
he “
buy
EM st
ocks
and
sell
U.S
. bon
ds”
(mov
e th
e ca
pita
l int
o ris
ky a
sset
s) si
gnal
is tr
igge
red
by a
shor
t-ter
m a
vera
ge c
ross
ing
belo
w th
e
long
-term
ave
rage
. Ini
tially
, the
cap
ital i
s pla
ced
into
equ
ity fo
r all
of th
e st
rate
gies
. Fin
ally
, we
repo
rt th
e nu
mbe
r of s
witc
hed
posit
ions
bet
wee
n U
.S. b
onds
and
EM
bon
ds fo
r eac
h st
rate
gy.
Pane
l A: E
xtre
me
valu
es (U
S bo
nds -
EM
equ
ity)
Pane
l B: T
hres
hold
s rul
e (U
S bo
nds -
EM
equ
ity)
Pane
l C: M
ovin
g av
erag
es (U
S bo
nds -
EM
equ
ity)
Mea
n R
etur
n St
. D
evia
tion
Shar
pe
ratio
N
o of
sw
itche
s M
ean
Ret
urn
St.
Dev
iatio
n Sh
arpe
ra
tio
No
of
switc
hes
Mea
n R
etur
n St
. D
evia
tion
Shar
pe
ratio
N
o of
sw
itche
s A
rgen
tina
0,00
9 0.
047
0.19
3 3
0,01
2 0.
092
0.13
0 4
0,01
4 0.
063
0.21
9 8
Bra
zil
0,01
5 0.
106
0.14
1 1
0,01
6 0.
103
0.15
3 3
0,01
5 0.
052
0.29
6 9
Bul
garia
0,
011
0.08
4 0.
134
2 0,
010
0.04
5 0.
218
3 0,
014
0.07
4 0.
185
5 C
hina
0,
015
0.08
5 0.
175
4 0,
010
0.09
5 0.
102
4 0,
009
0.07
1 0.
127
9 C
olom
bia
0,01
4 0.
056
0.25
0
0,01
7 0.
054
0.31
4 3
0,00
6 0.
040
0.14
7 7
Ecua
dor
0,01
3 0.
064
0.20
4 2
0,01
5 0.
082
0.18
2 16
0,
007
0.07
9 0.
083
11
Indi
a 0,
011
0.00
8 0.
142
2 0,
015
0.04
4 0.
336
13
0,01
0 0.
057
0.18
4 13
M
exic
o 0,
012
0.07
2 0.
160
1 0,
015
0.04
6 0.
327
5 0,
009
0.04
9 0.
190
13
Peru
0,
009
0.06
0 0.
152
3 0,
016
0.05
8 0.
275
3 0,
008
0.03
6 0.
230
10
Phili
ppin
es
0,01
4 0.
056
0.24
6 2
0,01
5 0.
047
0.31
0 5
0,01
4 0.
033
0.42
9 6
Rus
sia
0,00
9 0.
015
0.56
8 2
0,01
4 0.
081
0.16
6 9
0,00
8 0.
049
0.16
9 11
Tu
rkey
0,
018
0.11
7 0.
150
1 0,
016
0.08
4 0.
186
11
0,01
5 0.
046
0.31
3 6
Ven
ezue
la
0,01
6 0.
117
0.13
8 3
0,01
5 0.
121
0.12
6 3
0,00
7 0.
067
0.09
9 6
Ave
rage
0,
013
0.06
8 0.
186
2.00
0 0,
014
0.07
3 0.
193
6.30
8 0,
010
0.05
5 0.
190
8.76
9
54 Acta Wasaensia
Table 5 shows the performance for the first augmented BEYR strategies incremented each period based on extreme values, the fixed thresholds rule, and moving averages trading rules (accordingly displayed in Panels A, B, and C). The augmented BEYR is composed from the U.S. bond yields representing a safe asset and the emerging market equity yields as a risky asset. The results in Table 5 demonstrate that all of the investing strategies based on the augmented BEYR deliver both higher mean and higher risk-adjusted returns compared to all of the benchmark strategies. On average, Sharpe ratios for the augmented BEYR trading rules for extreme values (0.186), fixed thresholds rule (0.193), and moving averages (0.190) exceed the risk-adjusted returns of buy-and-hold strategies. Additionally, these strategies deliver higher risk-adjusted returns relative to traditional BEYR strategies with the exception of the fixed thresholds strategy. The number of switches for placing the capital between the U.S. bonds and emerging market equities increases compared to the traditional BEYR strategies. More specifically, the augmented BEYR calculated from combining the U.S. bonds with stocks from Russia gives the highest risk-adjusted returns for the extreme value strategy, stocks from India provide the highest returns for fixed thresholds rule, and finally stocks from the Philippines deliver the highest returns for the moving averages strategy.
Next, we combined the U.S. bonds (safe) with the emerging market bonds (risky) to create a second augmented BEYR indicator and tested it against the benchmarks and the traditional BEYR strategies. In so doing we used the emerging market bonds as a risky “equity-like” asset for timing the market. The results from Table 6 yield similar conclusions about the profitability of the augmented BEYR-based strategies. The risk-adjusted returns reported in Panels A, B, and C on extreme values, fixed thresholds, and moving averages strategies are significantly outperforming the benchmark buy-and-hold as well as the traditional BEYR strategies. On average, dynamic strategies utilizing U.S. bond yields (as a safe asset) and emerging market bond yields (as a risky asset) deliver Sharpe ratios of 0.235 for the extreme values, 0.244 for the fixed thresholds rule, and 0.207 for the moving averages strategy. On the individual country level, the augmented BEYR trading strategies provide the highest risk-adjusted returns when combining U.S. bonds with bonds from the following emerging market countries: The Philippines and Russia (for the extreme values and fixed thresholds strategies), and the Philippines and China (for the moving averages strategy).
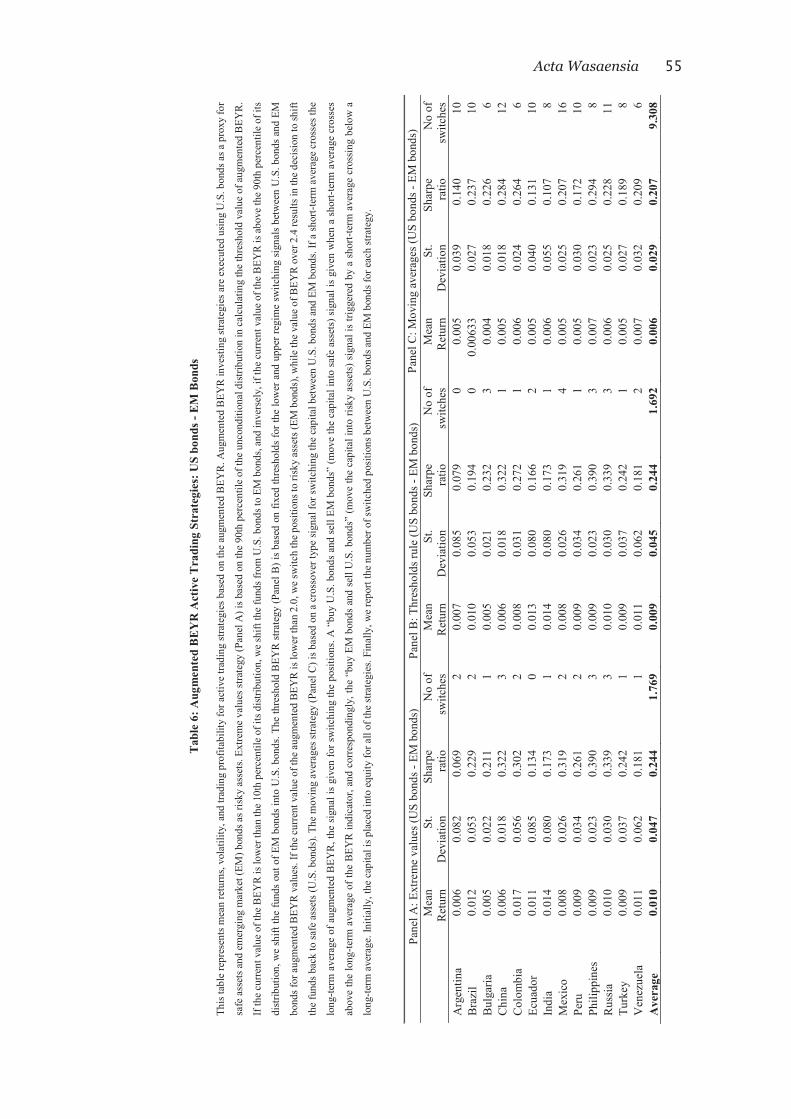
Acta Wasaensia 55
Tab
le 6
: Aug
men
ted
BE
YR
Act
ive
Tra
ding
Str
ateg
ies:
US
bond
s - E
M B
onds
This
tabl
e re
pres
ents
mea
n re
turn
s, vo
latil
ity, a
nd tr
adin
g pr
ofita
bilit
y fo
r act
ive
tradi
ng st
rate
gies
bas
ed o
n th
e au
gmen
ted
BEY
R. A
ugm
ente
d B
EYR
inve
stin
g st
rate
gies
are
exe
cute
d us
ing
U.S
. bon
ds a
s a p
roxy
for
safe
ass
ets a
nd e
mer
ging
mar
ket (
EM) b
onds
as r
isky
ass
ets.
Extre
me
valu
es st
rate
gy (P
anel
A) i
s bas
ed o
n th
e 90
th p
erce
ntile
of t
he u
ncon
ditio
nal d
istrib
utio
n in
cal
cula
ting
the
thre
shol
d va
lue
of a
ugm
ente
d B
EYR
.
If th
e cu
rrent
val
ue o
f the
BEY
R is
low
er th
an th
e 10
th p
erce
ntile
of i
ts d
istri
butio
n, w
e sh
ift th
e fu
nds f
rom
U.S
. bon
ds to
EM
bon
ds, a
nd in
vers
ely,
if th
e cu
rrent
val
ue o
f the
BEY
R is
abo
ve th
e 90
th p
erce
ntile
of i
ts
distr
ibut
ion,
we
shift
the
fund
s ou
t of E
M b
onds
into
U.S
. bon
ds. T
he th
resh
old
BEY
R str
ateg
y (P
anel
B) i
s bas
ed o
n fix
ed th
resh
olds
for t
he lo
wer
and
upp
er re
gim
e sw
itchi
ng si
gnal
s bet
wee
n U
.S. b
onds
and
EM
bond
s for
aug
men
ted
BEY
R v
alue
s. If
the
curre
nt v
alue
of t
he a
ugm
ente
d BE
YR
is lo
wer
than
2.0
, we
switc
h th
e pos
ition
s to
risky
ass
ets (
EM b
o nds
), w
hile
the
valu
e of
BEY
R o
ver 2
.4 re
sults
in th
e de
cisi
on to
shift
the
fund
s bac
k to
safe
ass
ets (
U.S
. bon
ds).
The
mov
ing
aver
ages
stra
tegy
(Pan
el C
) is b
ased
on
a cr
osso
ver t
ype
sign
al fo
r sw
itchi
ng th
e ca
pita
l bet
wee
n U
.S. b
onds
and
EM
bon
ds. I
f a sh
ort-t
erm
ave
rage
cro
sses
the
long
-term
ave
rage
of a
ugm
ente
d B
EYR
, the
sig
nal i
s gi
ven
for s
witc
hing
the
posit
ions
. A “
buy
U.S
. bon
ds a
nd s
ell E
M b
onds
” (m
ove
the
capi
tal i
nto
safe
ass
ets)
sig
nal i
s gi
ven
whe
n a
shor
t-ter
m a
vera
ge c
ross
es
abov
e th
e lo
ng-te
rm a
vera
ge o
f the
BEY
R in
dica
tor,
and
corre
spon
ding
ly, t
he “
buy
EM b
onds
and
sel
l U.S
. bon
ds”
(mov
e th
e ca
pita
l int
o ris
ky a
sset
s) s
igna
l is
trigg
ered
by
a sh
ort-t
erm
ave
rage
cro
ssin
g be
low
a
long
-term
ave
rage
. Ini
tially
, the
cap
ital i
s pla
ced
into
equ
ity fo
r all
of th
e st
rate
gies
. Fin
ally
, we
repo
rt th
e nu
mbe
r of s
witc
hed
posit
ions
bet
wee
n U
.S. b
onds
and
EM
bon
ds fo
r eac
h st
rate
gy.
Pane
l A: E
xtre
me
valu
es (U
S bo
nds -
EM
bon
ds)
Pane
l B: T
hres
hold
s rul
e (U
S bo
nds -
EM
bon
ds)
Pane
l C: M
ovin
g av
erag
es (U
S bo
nds -
EM
bon
ds)
Mea
n R
etur
n St
. D
evia
tion
Shar
pe
ratio
N
o of
sw
itche
s M
ean
Ret
urn
St.
Dev
iatio
n Sh
arpe
ra
tio
No
of
switc
hes
Mea
n R
etur
n St
. D
evia
tion
Shar
pe
ratio
N
o of
sw
itche
s A
rgen
tina
0.00
6 0.
082
0.06
9 2
0.00
7 0.
085
0.07
9 0
0.00
5 0.
039
0.14
0 10
B
razi
l 0.
012
0.05
3 0.
229
2 0.
010
0.05
3 0.
194
0 0.
0063
3 0.
027
0.23
7 10
B
ulga
ria
0.00
5 0.
022
0.21
1 1
0.00
5 0.
021
0.23
2 3
0.00
4 0.
018
0.22
6 6
Chi
na
0.00
6 0.
018
0.32
2 3
0.00
6 0.
018
0.32
2 1
0.00
5 0.
018
0.28
4 12
C
olom
bia
0.01
7 0.
056
0.30
2 2
0.00
8 0.
031
0.27
2 1
0.00
6 0.
024
0.26
4 6
Ecua
dor
0.01
1 0.
085
0.13
4 0
0.01
3 0.
080
0.16
6 2
0.00
5 0.
040
0.13
1 10
In
dia
0.01
4 0.
080
0.17
3 1
0.01
4 0.
080
0.17
3 1
0.00
6 0.
055
0.10
7 8
Mex
ico
0.00
8 0.
026
0.31
9 2
0.00
8 0.
026
0.31
9 4
0.00
5 0.
025
0.20
7 16
Pe
ru
0.00
9 0.
034
0.26
1 2
0.00
9 0.
034
0.26
1 1
0.00
5 0.
030
0.17
2 10
Ph
ilipp
ines
0.
009
0.02
3 0.
390
3 0.
009
0.02
3 0.
390
3 0.
007
0.02
3 0.
294
8 R
ussi
a 0.
010
0.03
0 0.
339
3 0.
010
0.03
0 0.
339
3 0.
006
0.02
5 0.
228
11
Turk
ey
0.00
9 0.
037
0.24
2 1
0.00
9 0.
037
0.24
2 1
0.00
5 0.
027
0.18
9 8
Ven
ezue
la
0.01
1 0.
062
0.18
1 1
0.01
1 0.
062
0.18
1 2
0.00
7 0.
032
0.20
9 6
Ave
rage
0.
010
0.04
7 0.
244
1.76
9 0.
009
0.04
5 0.
244
1.69
2 0.
006
0.02
9 0.
207
9.30
8
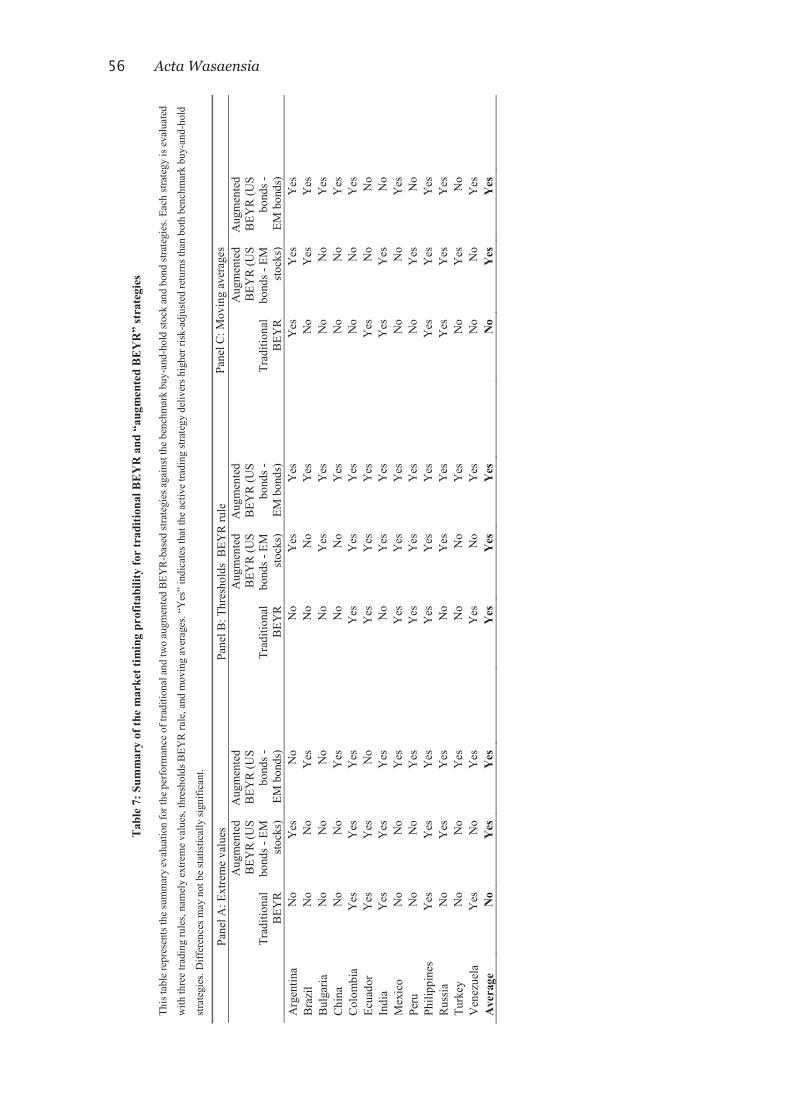
56 Acta Wasaensia
Tab
le 7
: Sum
mar
y of
the
mar
ket t
imin
g pr
ofita
bilit
y fo
r tr
aditi
onal
BE
YR
and
“au
gmen
ted
BE
YR
” st
rate
gies
This
tabl
e re
pres
ents
the
sum
mar
y ev
alua
tion
for t
he p
erfo
rman
ce o
f tra
ditio
nal a
nd tw
o au
gmen
ted
BEY
R-b
ased
stra
tegi
es a
gain
st th
e be
nchm
ark
buy-
and-
hold
stoc
k an
d bo
nd st
rate
gies
. Eac
h st
rate
gy is
eva
luat
ed
with
thre
e tra
ding
rule
s, na
mel
y ex
trem
e va
lues
, thr
esho
lds B
EYR
rule
, and
mov
ing
aver
ages
. “Y
es”
indi
cate
s tha
t the
act
ive
tradi
ng st
rate
gy d
eliv
ers h
ighe
r ris
k-ad
just
ed re
turn
s tha
n bo
th b
ench
mar
k bu
y-an
d-ho
ld
stra
tegi
es. D
iffer
ence
s may
not
be
stat
istic
ally
sign
ifica
nt.
Pane
l A: E
xtre
me
valu
es
Pane
l B: T
hres
hold
s B
EYR
rule
Pa
nel C
: Mov
ing
aver
ages
Trad
ition
al
BEY
R
Aug
men
ted
BEY
R (U
S bo
nds -
EM
st
ocks
)
Aug
men
ted
BEY
R (U
S bo
nds -
EM
bon
ds)
Trad
ition
al
BEY
R
Aug
men
ted
BEY
R (U
S bo
nds -
EM
st
ocks
)
Aug
men
ted
BEY
R (U
S bo
nds -
EM
bon
ds)
Trad
ition
al
BEY
R
Aug
men
ted
BEY
R (U
S bo
nds -
EM
st
ocks
)
Aug
men
ted
BEY
R (U
S bo
nds -
EM
bon
ds)
Arg
entin
a N
o Y
es
No
No
Yes
Y
es
Yes
Y
es
Yes
B
razi
l N
o N
o Y
es
No
No
Yes
N
o Y
es
Yes
B
ulga
ria
No
No
No
No
Yes
Y
es
No
No
Yes
C
hina
N
o N
o Y
es
No
No
Yes
N
o N
o Y
es
Col
ombi
a Y
es
Yes
Y
es
Yes
Y
es
Yes
N
o N
o Y
es
Ecua
dor
Yes
Y
es
No
Yes
Y
es
Yes
Y
es
No
No
Indi
a Y
es
Yes
Y
es
No
Yes
Y
es
Yes
Y
es
No
Mex
ico
No
No
Yes
Y
es
Yes
Y
es
No
No
Yes
Pe
ru
No
No
Yes
Y
es
Yes
Y
es
No
Yes
N
o Ph
ilipp
ines
Y
es
Yes
Y
es
Yes
Y
es
Yes
Y
es
Yes
Y
es
Rus
sia
No
Yes
Y
es
No
Yes
Y
es
Yes
Y
es
Yes
Tu
rkey
N
o N
o Y
es
No
No
Yes
N
o Y
es
No
Ven
ezue
la
Yes
N
o Y
es
Yes
N
o Y
es
No
No
Yes
A
vera
ge
No
Yes
Y
es
Yes
Y
es
Yes
N
o Y
es
Yes

Acta Wasaensia 57
For ease of exposition, Table 7 summarizes the results of the empirical tests and evaluates the performance of the traditional BEYR and the two augmented BEYR-based strategies relative the benchmark buy-and-hold stock and bonds strategies. Each emerging country from the sample is evaluated individually and compared with the benchmark strategies. Additionally, the averages across the emerging markets are calculated and compared as well. On the basis of risk-adjusted returns, we provide the answers to whether or not a particular active trading strategy outperforms both buy-and-hold bonds and buy-and-hold stocks benchmarks.
The summary of results reported in Table 7 suggests that, on average, the traditional BEYR strategies do not outperform benchmark strategies. On the other hand, all of the augmented BEYR-based trading rules deliver higher risk-adjusted returns than benchmark portfolios across emerging markets. This finding is far more evident in the case of the second augmented BEYR indicator that combines the U.S. bonds with the emerging market bonds, giving further confirmation that emerging market bonds can be treated as “equity-like” assets. Finally, for the further comparison purposes between the traditional and augmented BEYR trading strategies relative to buy-and-hold bonds and stocks strategies, we create hypothetical portfolios with the initial value of 1. We increment each portfolio every month according to the outcome determined by the trading rule. The mean return results for the each portfolio are summarized in the Appendix A.
5. Conclusion
Motivated by the inconclusive empirical evidence about the market timing ability of the bond–equity yield ratio (BEYR), this study investigates the profitability of BEYR trading strategies in an international framework. By utilizing the data from the emerging markets, we empirically examine the performance of various BEYR-based active trading strategies relative to the performance of benchmark buy-and-hold portfolios. Additionally, given the previous evidence that emerging market bonds have equity-like properties due to the specific country risk in emerging economies, we create new augmented BEYR variables combining the U.S. bonds (proxy for safe assets) and emerging markets stocks and bonds (proxies for risky assets). Our results contribute to the literature in three important ways: First, our paper provides new international evidence on market timing of the BEYR from the emerging markets. Specifically, traditional BEYR trading strategies do not deliver higher risk-adjusted returns relative to the benchmark buy-and-hold bonds and stocks strategies. Second, by employing the U.S. bonds as a safe asset and emerging markets’ stocks or bonds as risky assets we construct the augmented BEYR indicator serving as a valuable practical tool that generates risk-adjusted returns persistently exceeding the returns of both buy-and-hold and traditional BEYR-based strategies. Third, we extend the literature on emerging market bonds by providing supplementary evidence that these assets possess “equity-like” properties due to the specific country risk in emerging markets.

58 Acta Wasaensia
The empirical findings reported in this study show that the traditional BEYR investing strategies do not deliver significantly higher risk-adjusted returns relative to benchmark strategies. However, all of the augmented BEYR-based trading strategies (constructed from the U.S. bonds as a proxy for safe assets and emerging market stocks and bonds as risky assets proxies) deliver higher risk-adjusted returns compared to the benchmark buy-and-hold bonds or stocks strategies. Empirical findings from this paper can benefit those international investors seeking profitable trading opportunities between stock and bond markets.

Acta Wasaensia 59
References
Andersson, M., Krylova, E., Vähämaa, S. (2008). Why does the correlation between stock and bond returns vary over time? Applied Financial Economics, 18, 139-151.
Asness, C. (2003). Fight the Fed model. The Journal of Portfolio Management 11-24.
Baker, M., Wurgler, J. (2012). Comovement and predictability relationships between bonds and the cross-section of stocks. Review of Asset Pricing Studies, 2, 57-87.
Baur, D. G., Lucey, B. M. (2009). Flights and contagion - An empirical analysis of stock-bond correlations. Journal of Financial Stability, 5, 339–352.
Berge, K., Ziemba, T. (2003). The predictive ability of the bond stock earnings yield differential in world-wide equity markets. Manuscript. University of British Columbia.
Brooks, C., Persand, G. (2001). The trading profitability of forecasts of the gilt-equity-yield ratio. International Journal of Forecasting, 17, 11-29.
Boyd, J., Hu, J., Jagannathan, R. (2005). The stock market’s reaction to unemployment news: Why bad news is usually good for stocks. Journal of Finance, 60, 649-672.
Campbell, J., Hamao, Y. (1989). Predictable stock returns in the United States and Japan: A study of long term capital market integration. LSE Financial Markets Groups Discussion Paper 69.
Campbell, J., Shiller, R. (1988). The dividend price ratio and expectations of future dividends and discount factors. Review of Financial Studies, 1, 195-228.
Campbell, J., Shiller, R. (1998). Valuation ratios and the long-run stock market outlook. Journal of Portfolio Management, 24, 11–26.
Campbell, J., Vuolteenaho, T. (2004). Bad beta, good beta. American Economic Review, 94, 1249–1275.
Campbell, J., Yogo, M. (2006). Efficient tests of stock return predictability. Journal of Financial Economics, 81, 27–60.
Chen, L. (2009). On the reversal of return and dividend growth predictability: a tale of two periods. Journal of Financial Economics, 92, 128–151.
Clare, A., Thomas, S., Wickens, M. (1994). International evidence for the predictability of bond and stock returns. Economic Letters, 40, 105-112.
Connolly, R., Stivers, C., Sun, L. (2005). Stock market uncertainty and the stock-bond return relation. Journal of Financial and Quantitative Analysis, 40, 161-194.
Fama, E., French, K. (1988). Dividend yields and expected stock returns. Journal of Financial Economics, 22, 3-25.
60 Acta Wasaensia
Fama, E., French, K. (1989). Business conditions and expected returns on stocks and bonds. Journal of Financial Economics, 25, 23-49.
Giot, P., Petitjean, M. (2009). Short-term market timing using the bond-equity yield ratio. The European Journal of Finance, 15, 365-384.
Goyal, A., Welch, I. (2008). A comprehensive look at the empirical performance of equity premium prediction. Review of Financial Studies, 21, 1455–1508.
Gulko, L. (2002). Decoupling. Journal of Portfolio Management, 28, 59-67.
Gwilym, O., Seaton, J., Suddason, K., Thomas, S. (2004). Does the Fed model travel well? The Journal of Portfolio Management, 33, 68-75.
Harris, F., Sanchez-Valle, R. (2000). The Gilt-equity yield ratio and the predictability of UK and US equity returns. Journal of Business Finance & Accounting, 27, 333-357.
Kelly, J. M., Martins, L. F., Carlson, J. H. (1998). The relationship between bonds and stocks in emerging countries. Journal of Portfolio Management, 24, 110-122.
Lander, J., Orphanides, A., Douvogiannis, M. (1997). Earnings forecasts and the predictability of stock returns: Evidence from trading the S&P. Journal of Portfolio Management, 23, 24-35.
Levin, J., Wright, T. (1998). The information content of the guilt-equity yield ratio. Manchester School, 66, 89-101.
Lettau, M., Van Nieuwerburgh, S. (2008). Reconciling the return predictability evidence. Review of Financial Studies, 21, 1607–1652.
Lo, A., MacKinlay, A. (1988). Stock market prices do not follow random walks: Evidence from a simple specification test. Review of Financial Studies, 1, 41-66.
Lleo, S., Ziemba, W. (2015). Does the bond-stock earnings yield differential model predict equity market corrections better than high P/E models? Working Paper.
Maio, P. (2013). The “Fed model” and the predictability of stock returns. Review of Finance, 17, 1489-1533.
Panchenko, V., Wu, E. (2009). Time-varying market integration and stock and bond return concordance in emerging markets. Journal of Banking and Finance, 33, 1014–1021.
Piljak, V. (2013). Bond markets co-movement dynamics and macroeconomic factors: Evidence from emerging and frontier markets. Emerging Markets Review 17, 29-43.
Robertson, D., Wright, S. (2006). Dividends, total cash flow to shareholders, and predictive return regressions. Review of Economics and Statistics 88, 91–99.
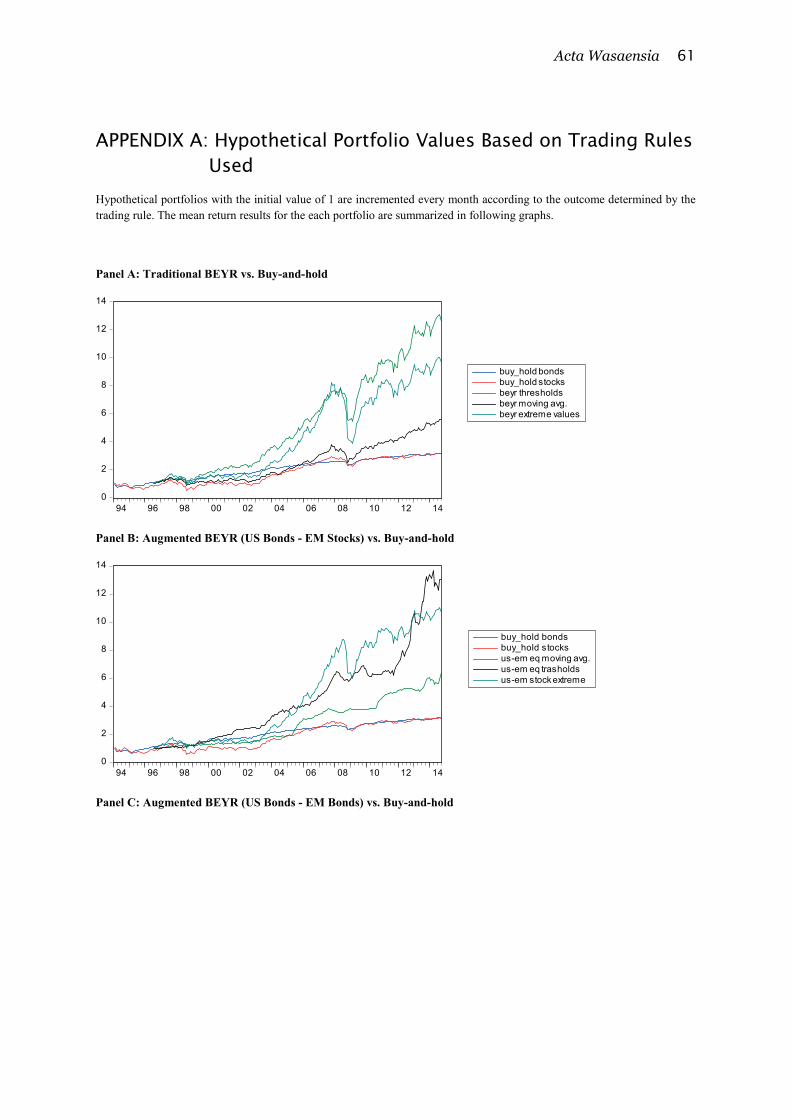
Acta Wasaensia 61
APPENDIX A: Hypothetical Portfolio Values Based on Trading Rules Used
Hypothetical portfolios with the initial value of 1 are incremented every month according to the outcome determined by the trading rule. The mean return results for the each portfolio are summarized in following graphs.
Panel A: Traditional BEYR vs. Buy-and-hold
Panel B: Augmented BEYR (US Bonds - EM Stocks) vs. Buy-and-hold
Panel C: Augmented BEYR (US Bonds - EM Bonds) vs. Buy-and-hold
0
2
4
6
8
10
12
14
94 96 98 00 02 04 06 08 10 12 14
buy_hold bondsbuy_hold stocksbeyr thresholdsbeyr moving avg.beyr extreme values
0
2
4
6
8
10
12
14
94 96 98 00 02 04 06 08 10 12 14
buy_hold bondsbuy_hold stocksus-em eq moving avg.us-em eq trasholdsus-em stock extreme

62 Acta Wasaensia
0
2
4
6
8
10
12
14
94 96 98 00 02 04 06 08 10 12 14
buy_hold bondsbuy_hold stocksus-em bond extremeus-em bond moving avg.us-em bond trashholds

Acta Wasaensia 63
APPENDIX B
Table B1: Robustness tests: Aggregate Strategies
Panel A: Passive Buy-and-Hold Trading Strategies Buy and hold stocks Mean Return St. Deviation Sharpe ratio 0.009 0.039 0.239
Buy and hold bonds Mean Return St. Deviation Sharpe ratio 0.014 0.056 0.244
Panel B: Traditional BEYR Active Trading Strategies Extreme values BEYR Mean Return St. Deviation Sharpe ratio No. of switches 0.015 0.056 0.293 5
Thresholds rule BEYR Mean Return St. Deviation Sharpe ratio No. of switches 0.019 0.061 0.312 4
Moving averages BEYR Mean Return St. Deviation Sharpe ratio No. of switches 0.024 0.075 0.324 9
Panel C Augmented BEYR Active Trading Strategies: US bonds - EM Stocks Extreme values BEYR (US stocks - EM bonds) Mean Return St. Deviation Sharpe ratio No. of switches 0.019 0.075 0.248 3
Thresholds rule BEYR (US stocks - EM bonds) Mean Return St. Deviation Sharpe ratio No. of switches 0.014 0.041 0.346 3
Moving averages BEYR (US stocks - EM bonds) Mean Return St. Deviation Sharpe ratio No. of switches 0.014 0.033 0.429† 6
Panel D: Augmented BEYR Active Trading Strategies: US bonds - EM Bonds Extreme values Augmented BEYR Mean Return St. Deviation Sharpe ratio No. of switches 0.013 0.032 0.399† 4
Thresholds rule Augmented BEYR Mean Return St. Deviation Sharpe ratio No. of switches 0.019 0.049 0.390† 3
Moving averages Augmented BEYR Mean Return St. Deviation Sharpe ratio No. of switches 0.010 0.026 0.373† 3
† Paired t-test shows a significantly positive difference at 5% level between the Sharpe ratio of the current strategy and the Sharpe Ratios of both buy-and-hold equity and bonds strategies

64 Acta Wasaensia
In the Appendix B, we present the additional results of BEYR based trading strategies. Due to the fact that the stock returns (as well as bond returns) of emerging markets are highly correlated, we build an aggregate investments strategy as an additional test. Thus, in addition to previous analysis and comparison of averages from different emerging markets, we combine all of the emerging markets together in one aggregate strategy. In particular, trading rules for the aggregate strategies are still based on the basic principle of shifting the capital between the stocks and bonds, however now we pull all of the emerging markets assets together and perform the extreme values, thresholds rule, and moving averages investing strategies following the same rules stated in Sections 3.1, 3.2, 3.3 and 3.4.
The results are summarized in Table B1. Essentially, the results of the analysis based on the alternatively specified aggregate strategies are very similar to those reported in Tables 3-7. Traditional BEYR strategies (Panel B) do not provide significantly higher risk adjusted returns relative to benchmark buy-and-hold stocks and bonds strategies (Panel A). Furthermore, incorporating US bonds as a safe asset relative to the emerging market stocks and bonds (Panels C and D) provides significantly higher Sharpe ratios relative to benchmark strategies (Panel A). Thus we confirm the previous findings giving further confirmation that emerging market bonds can be treated as “equity-like” assets.
Note: The empirical analyses throughout this study are focused on the dollar-denominated emerging market securities. It is important to stress that a dollar-denominated securities are highly financially integrated with US markets and therefore the risk of unpredictable fluctuation in the foreign currencies is completely eliminated as a factor that could impact the results. Thus, a further research is warranted on the BEYR style investing by using financially less integrated local-currency assets as the role of currency risks, capital constrains in the form of taxes and the investment quotas might play an important role in impacting the results.
Acta Wasaensia 65
Finance Research Letters 15 (2015) 239–245
Contents lists available at ScienceDirect
Finance Research Letters
journal homepage: www.elsevier.com/locate/frl
The political risk factor in emerging, frontier,
and developed stock markets�
Nebojsa Dimic∗, Vitaly Orlov1, Vanja Piljak
University of Vaasa, Department of Accounting and Finance, P.O. Box 700, FI-65101 Vaasa, Finland
a r t i c l e i n f o
Article history:
Received 3 September 2015
Accepted 16 October 2015
Available online 24 October 2015
JEL classifications:
F30
F50
G15
Keywords:
Political risk
Stock returns
Frontier and emerging markets
a b s t r a c t
This paper investigates how determinants of the political risk factor
affect the stock returns of developed, emerging and frontier markets.
We find that composite political risk is priced in all three stock mar-
ket categories, but the effect of individual components varies across
different markets.
© 2015 Elsevier Inc. All rights reserved.
1. Introduction
The extant literature documents how political risk is an important factor in explaining stock returns,
however it is often found to violate the classic risk-return relationship, leading to the so-called polit-
ical risk sign paradox, under which a decrease in political risk is associated with higher stock returns
(Diamonte et al., 1996; Perotti and van Oijen, 2001; Lehkonen and Heimonen, 2015).2 However, previous
� The paper was partially written while V. Orlov was a visiting scholar at Columbia Business School. Vitaly Orlov gratefully ac-
knowledges financial support from the OP-Pohjola Group Research Foundation (grant 201500087) and Marcus Wallenberg founda-
tion.∗ Corresponding author. Tel.: +358 45 104 7707.
E-mail addresses: [email protected], [email protected] (N. Dimic), [email protected] (V. Orlov), [email protected] (V. Piljak).1
Tel.: +358 41 700 8227.2 The political risk has also been examined in the context of the relationship with foreign direct investments (Busse and Hefeker,
2007), sovereign bond spreads (Bekaert et al., 2014), and interest rates (Caporale and Caporale, 2008).
http://dx.doi.org/10.1016/j.frl.2015.10.007
1544-6123/© 2015 Elsevier Inc. All rights reserved.
66 Acta Wasaensia
240 N. Dimic et al. / Finance Research Letters 15 (2015) 239–245
studies focus on composite political risk measures and analyze stock returns from different countries con-
currently. While such an approach reveals the basic risk-return relationship, the determinants of political
risk may vary across different markets. This paper investigates how individual components of the political
risk factor affect stock returns, and whether the nature of political risk differs across emerging, frontier,
and developed markets.
This study makes two main contributions: first, we explore the role of determinants of political risk
in explaining stock returns across developed, emerging, and frontier markets and show how the impor-
tance of individual components of political risk varies across the three categories. Second, this is the first
study that considers frontier markets as a separate category in the context of political risk. The political
instability of frontier markets and the fact that they are considered an increasingly important source of
alternative investments make them a unique setting in which to investigate the political risk–stock return
relationship.3
The findings of this paper show that composite political risk is priced regardless of the type of mar-
ket, but the effect of individual components varies across the market categories. Specifically, government
actions as a source of political risk have a uniformly negative effect on the stock returns in all three mar-
ket categories. Further, political risk related to rising ethnic tensions has a negative impact on the stock
returns in emerging and frontier markets, but not in developed markets. This implies that racial, nation-
ality, and language divisions are all associated with lower stock returns. Furthermore, the stock returns of
frontier markets are affected by components of political risk associated with government stability, while
emerging markets is the only category affected by the risk of corruption, democratic regime change, and
an investment profile.
This study adds to the strand of literature documenting how aggregate political risk has a larger im-
pact on returns in emerging markets than in developed ones (see Erb et al., 1996; Bilson et al., 2002). In
addition, our findings support the proposition of Diamonte et al. (1996) relating to global political risk
convergence, indicating that the differential impact of political risk on returns in emerging and developed
markets narrows over time. Finally, our results support the political risk sign paradox (Perotti and van
Oijen, 2001; Lehkonen and Heimonen, 2015) that holds that for all market categories greater political risk
leads to lower stock returns.
Our study is also related to literature on financial development and property rights. In these segments
of the literature, the political risk factor and its individual components have been examined extensively
(see Knack and Keefer, 1995; Keefer, 2008).4 In particular, Knack and Keefer (1995) focus on institutional
indicators and find that property rights have significant impact on investment and economic growth. Fur-
thermore, Morck et al. (2000) document that property rights protection affects stock price movements,
and that measures of property rights explain difference between emerging and developed markets in
terms of stock price synchronicity. The findings of our study might provide an interesting setting to fur-
ther investigate importance of individual factors in affecting property rights in three different market
categories.
The remainder of the study is organized as follows. Section 2 presents our data, Section 3 describes
methodological approach, and Section 4 reports the results. Section 5 concludes.
2. Data
Our total sample comprises 64 countries divided into three categories (emerging, frontier, and devel-
oped) based on their classification by the MSCI.5 We use the MSCI Standard Total Return Index for each
country in the sample. All the stock return data are expressed in US dollars and obtained from Thomson
3 See Kiviaho et al. (2014) for more comprehensive overview of frontier stock markets.4 See Morck et al. (2000) for more comprehensive discussion on the relationship between property rights and stock markets.5 Emerging markets sample comprises of 22 countries (Brazil, Chile, China, Colombia, the Czech Republic, Egypt, Greece, Hungary,
India, Indonesia, Malaysia, Mexico, Peru, Philippines, Poland, Russia, South Africa, South Korea, Taiwan, Thailand, Turkey, and the
UAE), while the frontier markets sample consists of 21 countries (Argentina, Bahrain, Bangladesh, Bulgaria, Croatia, Estonia, Jor-
dan, Kenya, Kuwait, Kazakhstan, Lithuania, Morocco, Nigeria, Oman, Pakistan, Romania, Slovenia, Sri Lanka, Tunisia, Ukraine, and
Vietnam). The developed markets are represented by 21 countries (Australia, Austria, Belgium, Canada, Denmark, Finland, France,
Germany, Ireland, Italy, Japan, the Netherlands, New Zealand, Norway, Portugal, Singapore, Spain, Sweden, Switzerland, the United
Kingdom, and the USA).

Acta Wasaensia 67
N. Dimic et al. / Finance Research Letters 15 (2015) 239–245 241
Table 1
Description of individual components of the composite ICRG risk rating.
Political indicators Description
Quality of institutions
Law and order Assessment of the strength/impartiality of the legal system and popular observance of the law
Bureaucratic quality The institutional strength and quality of bureaucracy
Corruption Measures corruption within the political system
Conflict
Internal conflict An assessment of the political violence in the country and its actual or potential political
impact measured with three subcomponents: Civil War/Coup threat, Terrorism/Political
violence, and Civil disorder
External conflict Risk to the government from foreign actions. The risk rating assignment is the sum of three
subcomponents: war, cross-border conflict, and foreign pressures
Religious tensions Measures whether a single religious group can affect the country’s politics
Ethnic tensions Degree of tension assessment attributable to racial, nationality, and language divisions
Democratic tendencies
Military in politics A measure of the degree to which the military is involved in the politics of a country
Democratic accountability Measurement of how responsive the government is to the people
Government actions
Government stability The ability of the government to carry out its declared program and its ability to stay in office.
It is the sum of three subcomponents: government unity, legislative strength, and popular
support
Socioeconomic conditions The assessment of socioeconomic pressures at work in society that could affect government
actions. Its subgroups are unemployment, consumer confidence, and poverty
Investment profile Factors affecting the risk to investment not covered by other political, economic, and financial
components (contract viability/expropriation, profits, repatriation, payment delays)
This table provides the description of 12 individual components and subgroups of the ICRG composite political risk measure. The
components are organized into four subgroups by Bekaert et al. (2014).
Reuters Datastream. The issue of data availability means we used an unbalanced panel dataset with yearly
observations from 1990 to 2013. For the measurement of the political risk variable we used data from the
International Country Risk Guide (ICRG) obtained from the Political Risk Services Group. The ICRG pro-
vides data on the composite political risk rating score for individual countries, as well as the scores for 12
individual components of political risk (Table 1). The composite political risk ismeasured on a scale from 0
to 100 points; where the highest score of 100 points corresponds to the least risk, while the lowest score
(0 points) reflects the most risk. Additionally, we followed Bekaert et al. (2014) and organized individ-
ual components into subgroups: Quality of Institutions, Conflicts, Democratic Tendencies, and Government
Actions.
The econometric framework used in the current research accounts for the global market risk factor and
global stock market uncertainty proxied by the MSCI World Index and VIX Index variables, respectively.6
Since our regression analysis uses stock return data with a yearly frequency, we control for changes in the
macroeconomic environment by including the variables of GDP growth and inflation for each individual
country in the sample.
3. Methodology
The following fixed-effect panel regression model is estimated as:
ri,t = α0 + β1Worldt + β2VIXt + β3PRi,t + β4GDPi,t + β5INFi,t + εi,t (1)
where ri, t is the stock market return for country i at time t, World is the return on the world stock index,
VIX is the return on the VIX index, PRi is the composite political risk rating of country i, GDPi is the annual
growth rate of GDP, and INFi denotes the inflation rates of country i, and ε i, t is the residuals.
6 As a robustness check, we perform all of the analysis also by using S&P 500 index as a proxy for global market risk. The results
remained unchanged.

68 Acta Wasaensia
242 N. Dimic et al. / Finance Research Letters 15 (2015) 239–245
Table
2
Stock
return
sandpoliticalrisk
.
PanelA.A
ggregate
politicalrisk
andsu
bgroupanalysis
Developedmarkets
Emergingmarkets
Frontiermarkets
Model1
Model2
Model3
Model4
Model5
Model6
Constant
–0,224
–0,203
–0,462
∗–0,480
∗∗∗
–0,744
∗∗∗
–0,819
∗∗
(–1,234)
(–1,069)
(–1,680)
(–4,634)
(–4,082)
(–2,364)
Aggregate
politicalrisk
0,627
∗∗1,566
∗∗∗
1,021
∗∗∗
(2,462)
(3,492)
(2,862)
Quality
ofinstitutions
0,022
0,278
0,335
(0,086)
(1,249)
(0,925)
Conflict
0,364
0,717
∗∗0,811
∗∗
(1,354)
(2,081)
(1,96)
Democratictendencies
–0,098
0,099
–0,187
(–0,270)
(0,499)
(–1.356)
Govern
mentactions
0,239
∗∗0,666
∗∗∗
0,471
∗
(2,342)
(3,134)
(1,757)
VIX
–0,046
–0,054
∗–0,130
–0,128
∗∗–0,366
∗∗∗
–0,368
∗∗∗
(–1,603)
(–1,810)
(–1,050)
(–2,011
)(–4,909)
(–4.799)
Worldindex
1,110
∗∗∗
1,104
∗∗∗
1,103
∗∗∗
1,106
∗∗∗
0,326
∗∗∗
0,279
∗∗
(21,932)
(21,546)
(4,695)
(10,161)
(2,645)
(2.191)
GDPGrowth
0,018
∗∗∗
0,018
∗∗∗
0,069
∗∗∗
0,069
∗∗∗
0,0758
∗∗∗
0,080
∗∗∗
(3,293)
(3,214)
(3,363)
(6,463)
(5,805)
(6,044)
Inflation
0,010
0,008
–0,006
–0,004
0,021
0,027
(0,538)
(0,417
)(–0,299)
(–0,279)
(1,027)
(1.285)
R-squared
0,681
0,682
0,437
0,437
0,282
0,275
PanelB.A
nalysisofco
mponents
ofpoliticalrisk
Developedmarkets
Emergingmarkets
Frontiermarkets
Model7
Model8
Model9
Model10
Model11
Model12
Model13
Model14
Model15
Model16
Model17
Model18
Constant
–0,175
–0,254
–0,197
–0,129
–0,423
∗∗∗
–0,475
∗∗∗
–0,436
∗∗∗
–0,474
∗∗∗
–0,771
∗∗∗
–0,833
∗∗∗
–0,816
∗∗∗
–0,767
∗∗∗
(–0,945)
(–1,347)
(–1,072)
(–0,701)
(–3,994)
(–4,473)
(–4,129)
(–4,447)
(–4,162)
(–4,428)
(–4,326)
(–3,986)
Law
andorder
0,0132
0,420
∗∗∗
0,434
∗∗
(0,072)
(2,642)
(2,068)
Bureaucraticquality
–0,635
–0,274
–0,471
(–1,559)
(–1,296)
(–1,396)
Corruption
0,118
0,303
∗∗∗
0,242
(1,291)
(2,817
)(1,578)
(continued
onnextpage)

Acta Wasaensia 69
N. Dimic et al. / Finance Research Letters 15 (2015) 239–245 243
Table
2(continued
)
PanelB.A
nalysisofco
mponents
ofpoliticalrisk
Developedmarkets
Emergingmarkets
Frontiermarkets
Model7
Model8
Model9
Model10
Model11
Model12
Model13
Model14
Model15
Model16
Model17
Model18
Intern
alco
nflict
0,231
0,299
0,036
(1,241)
(1,602)
(0,300)
Extern
alco
nflict
0,058
0,196
0,195
(0,398)
(0,695)
(0,564)
Religioustensions
0,056
0,106
0,059
(0,367)
(0,578)
(0,301)
Ethnic
tensions
0,003
0,417
∗∗0,393
∗∗
(0,029)
(2,153)
(2,099)
Military
inpolitics
0,265
0,376
∗∗–0,021
(0,822)
(2,307)
(–0,125)
Democraticaccountability
–0,147
0,226
∗0,122
(–0,807)
(1,658)
(0,782)
Govern
mentstability
0,058
0,181
0,510
∗∗∗
(0,937)
(1,61)
(2,798)
Socioeco
nomic
conditions
0,081
0,106
0,131
(0,759)
(0,739)
(0,842)
Investmentprofile
0,109
0,452
∗∗∗
0,028
(1,196)
(3,131)
(0,162)
VIX
–0,025
–0,032
–0,034
–0,053
–0,126
∗–0,115
∗–0,133
∗∗–0,168
∗∗–0,369
∗∗∗
–0,359
∗∗∗
–0,384
∗∗∗
–0,386
∗∗∗
(–0,891)
(–1,127)
(–1,222)
(–1,750)
(–1,965)
(–1,794)
(–2,090)
(–2,553)
(–4,806)
(–4,649)
(–4,938)
(–4,930)
Worldindex
1,140
∗∗∗
1,131
∗∗∗
1,126
∗∗∗
1,106
∗∗∗
1,070
∗∗∗
1,104
∗∗∗
1,069
∗∗∗
1,065
∗∗∗
0,259
∗∗0,305
∗∗0,271
∗∗0,272
∗∗
(22,306)
(22,339)
(22,304)
(21,304)
(9,893)
(9,976)
(9,788)
(9,349)
(2,049)
(2,417
)(2,126)
(2,145)
GDPGrowth
0,018
∗∗∗
0,019
∗∗∗
0,019
∗∗∗
0,017
∗∗∗
0,073
∗∗∗
0,077
∗∗∗
0,076
∗∗∗
0,065
∗∗∗
0,078
∗∗∗
0,084
∗∗∗
0,083
∗∗∗
0,078
∗∗∗
(3,203)
(3,363)
(3,375)
(2,930)
(6,999)
(7,190)
(7,190)
(5,840)
(5,932)
(6,233)
(6,221)
(5,746)
Inflation
0,006
0,013
0,007
0,001
–0,014
–0,012
–0,016
–0,001
0,023
0,025
0,022
0,022
(0,281)
(0,660)
(0,366)
(0,061)
(–1,000)
(–0,821)
(–1,134)
(–0,078)
(1,102)
(1,160)
(1,019)
(1,038)
R-squared
0,68
0,678
0,677
0,681
0,428
0,417
0,415
0,424
0,263
0,257
0,253
0,266
This
table
containsregressionresu
ltsfor18differentmodelsp
ecifications.
PanelAreportsmodels
1,3,and5thatco
nce
rntheco
mposite
politicalrisk
,whilemodels
2,4,and6referto
subgroupsofpoliticalrisk
.PanelBsh
owsmodels
7–18thatmeasu
retheeffect
ofindividualco
mponents
ofpoliticalrisk
onstock
return
s.Allmodels
are
estim
atedwithfixedeffectsfor
unbalance
dpaneldata.A
sterisk
sdenote
statisticalsignificance
atthe1%(∗
∗∗),5%(∗
∗ )and10%(∗).T-values(inparentheses)
are
basedonW
hiteestim
atorforvariance
.

70 Acta Wasaensia
244 N. Dimic et al. / Finance Research Letters 15 (2015) 239–245
In order to test how different sources of political risk ratings affect stock returns, we replaced the com-
posite political risk rating with its four subgroups. Hence, we augment Eq. (1) in the following manner:
ri,t = α0 + β1Worldt + β2VIXt + β3QIi,t + β4Coni,t + β5Demi,t + β6Govi,t + β7GDPi,t
+ β8INFi,t + εi,t (2)
where QIi, Coni, Demi, and Govi refer to the four subgroups (Quality of Institutions, Conflict, Democratic
Tendencies, and Government Actions) of the composite political risk rating of country i. Finally, we exam-
ine the role of the individual components of each subgroup independently. All regressions are estimated
separately for each category of markets (emerging, frontier, and developed).
4. Results
Table 2 presents the results of the analysis of the relationship between stock returns and aggregate
political risk factor, the four subgroups, and individual components.
Panel A shows that composite political risk is positive and highly statistically significant suggesting
that lower political risk leads to higher stock market returns regardless of the type of market. Given that
the composite political risk is significant in all three market categories, we continued on to explore the
role of different subgroups and individual components of political risk. The common source of political
risk that negatively affects stock returns in all three market categories is Government actions. However, the
Conflict subgroup of political risk has a consistent negative effect on stock returns, but only in emerging
and frontier markets.
Next, we drilled down into the individual component analysis. Panel B demonstrates that the effect of
individual components varies across market categories. In particular, emerging and frontier stock markets
are more exposed to political risk than developed markets are. Among all the individual components, we
found only two variables (Ethnic tensions and Law and order) that have a significant negative effect in both
emerging and frontier markets. This implies that a higher degree of tension within a country attributable
to racial, nationality, or language divisions is associated with lower stock returns. Moreover, weaknesses
in the legal system and weak observance of the law negatively affect stock returns.
Although emerging and frontier markets share some common sources of political risk, there are still
certain individual components unique to each category. Specifically, frontier markets are characterized
by the significant influence of Government stability, suggesting the importance of government unity and
legislative strength to stock returns in this market category. On the other hand, stock returns in emerging
markets are more sensitive to sources of political risk related toMilitary in politics, Democratic accountabil-
ity, Corruption, and Investment profile. This finding indicates that factors related to democratic proclivity,
corruption within the political system, and risk of expropriation and contract viability play an important
role in explaining return variation in emerging stock markets.
5. Conclusion
This paper provides evidence that the aggregate political risk factor affects stock returns of developed,
emerging and frontier markets, but the effect of individual components differs according to the market
category. The common source of political risk that is significant in all three market categories is govern-
ment action, while the main difference relates to the risk of conflict reflected in ethnic tensions (relevant
only in the frontier and emerging markets categories). Finally, the source of political risk that is unique to
frontier stock markets is government stability.
Our work on political risk factors and stock markets can be further extended by examining the role of
property rights in explaining differences in stock returns across different market categories.
References
Bekaert, G., Harvey, C.R., Lundblad, C.T., Siegel, S., 2014. Political risk spreads. J Int Bus Stud 45, 471–493.Bilson, C.M., Brailsford, T.J., Hooper, V.C., 2002. The explanatory power of political risk in emerging markets. Int. Rev. Finan. Anal. 11,
1–27.
Busse, M., Hefeker, C., 2007. Political risk, institutions and foreign direct investment. Eur. J. Polit Econ 23, 397–415.Caporale, B., Caporale, T., 2008. Political risk and the expectations hypothesis. Econ Lett 100, 178–180.

Acta Wasaensia 71
N. Dimic et al. / Finance Research Letters 15 (2015) 239–245 245
Diamonte, R.L., Liew, J.M., Stevens, RC., 1996. Political risk in emerging and developed markets. Finan Anal J 52, 71–76.
Erb, C.B., Harvey, C.R., Viskanta, T.E., 1996. Political risk, economic risk, and financial risk. Finan Anal. J. 52, 29–46.
Keefer, P., 2008. Beyond legal origin and checks and balances: political credibility, citizen information, and financial sector develop-ment. In: Haber, S., North, D.C., Weingast, B.R. (Eds.). Political Institutions and Financial Development. Stanford University Press,
Palo Alto, California.Kiviaho, J., Nikkinen, J., Piljak, V., Rothovius, T., 2014. The co-movement dynamics of European frontier stock markets. Eur Finan
Manag 20, 574–595.Knack, S., Keefer, P., 1995. Institutions and economic performance: cross-country tests using alternative institutional measures. Econ
Polit 7, 207–228.
Lehkonen, H., Heimonen, K., 2015. Democracy, political risk and stock market performance. J Int Money Finan doi:10.1016/j.jimonfin.2015.06.002.
Morck, R., Yeung, B., Yu, W., 2000. The information content of stock markets: why do emerging markets have synchronous stockprice movements? J Finan Econ 58, 215–260.
Perotti, E.C., van Oijen, P., 2001. Privatization, political risk and stock market development in emerging markets. J Int Money Finan20, 43–69.

72 Acta Wasaensia
Internationalization and firm valuation: New evidence from foreign debt issuances of US firms1
Nebojsa Dimic2
University of Vaasa, Department of Accounting and Finance, P.O. Box 700, FI-65101 Vaasa, Finland
Abstract
Does internationalization affect firm valuation? To answer this question, literature mainly studies firms from around the world internationalizing by issuing equity in the USA, whereas the current study focuses on US firms that internationalize by issuing debt in overseas markets. Providing support for segmentation theory, this study finds that internationalization improves valuation in the short-term. Tobin’s q tends to increase before and during the first year of internationalization, but then declines in the following years. Moreover, the positive effect on valuation is conditional given that US firms internationalize into other developed markets. This study provides evidence of the “reverse bonding hypothesis”, which holds that firms that issue debt to emerging markets experience a long-term negative valuation effect.
JEL classifications:
Keywords: International financial markets; Bonding; Segmentation; Tobin’s q;
1 The paper was partially written while Nebojsa Dimic was a visiting scholar at Alliance Manchester Business School. The author is grateful to the participants of the 2016 Graduate School of Finance (GSF) and the Finnish Doctoral Programme in Economics (FDPE) Workshop in Finance and the 15th INFINITI Conference on International Finance for valuable comments. Nebojsa Dimic gratefully acknowledges financial support from the OP-Pohjola Group Research Foundation (grant 201600054) and the Marcus Wallenberg Foundation. 2 Corresponding author. Tel.: +358 45 104 7707. E-mail address: [email protected] (N. Dimic)

Acta Wasaensia 73
1. Introduction
Financial globalization in recent decades has caused a rapid increase in the raising of international capital by firms. The extant literature on international corporate finance directs attention to the effects of raising foreign capital and mainly focuses on firms from markets around the world internationalizing in the USA by issuing equity. Further, the literature offers contrasting reasons for the causes and effects of firms’ internationalization initiatives (Gozzi et al. 2008). This paper attempts to fill the gap in the literature by examining the effects of US firms’ financial internationalization by issuing debt in overseas markets. The main finding of the study is a positive short-term internationalization effect on a firm’s valuation. Further, this positive relationship is conditional on US firms internationalizing in other developed markets, as those firms that issue debt in emerging markets experience long-term negative valuation effects.
The results of this study relate to two prominent theories explaining the causes and effects of firms’ internationalization: bonding and segmentation theory.3 Bonding theory argues that firms internationalize to “bond” themselves to a better corporate governance practices. Internationalization improves investor protection by limiting the opportunity of insiders to extract private benefits. According to bonding theory, firms that internationalize signal their quality due to improved investor protection and reduced agency problems (Stulz, 1999; Coffee, 2002; Reese and Weisbach 2002, Doidge et al. 2004; Gozzi et al. 2008; Gozzi et al. 2010). However, segmentation theory suggests that firms internationalize to avoid regulations and complicated accounting systems that deter foreign investors from purchasing their securities. Segmentation theory further claims that internationalization overcomes barriers to international capital flows and potentially provides firms with cheaper capital, which consequently improves their valuation (Black, 1974; Solnik, 1974; Errunza and Losq, 1985; Stapleton and Subrahmanyam, 1977; Alexander et al. 1987; Domowitz et al., 1998; Pagano et al., 2002; Gozzi et al., 2010).
Bonding and segmentation theories conflict regarding the permanent effect of internationalization. In particular, while bonding theory anticipates a long-term positive effect, segmentation theory predicts only a short-term positive impact where valuation rises in the period before the internationalization and then falls back to original levels (Tobin and Brainard, 1977; La Porta et al., 2002; Lan and Wang, 2004; Durnev and Kim, 2005; Caprio et al., 2007; Albuquerque and Wang, 2008; Gozzi et al., 2008).
In addition to conflicting long-term theoretical predictions, the empirical evidence further complicates the relationship between the internationalization and valuation. Gozzi et al. (2010) suggest that there is a wide gap in current theories on the causes and effects of the
3 Another view includes market timing theory. Market timing theory predicts that firms raise capital abroad to exploit “hot markets” and temporary high prices for their securities (Errunza and Miller, 2000; Henderson et al., 2006).
74 Acta Wasaensia
raising of international capital, while a growing body of literature criticizes the predictions of both the bonding and segmentation theories. Some studies question the very existence of the relationship between internationalization and the improved governance system of a firm, thus disregarding the motivation behind bonding theory (Licht, 2003; Pinegar and Ravichandran, 2003; Siegel 2004). Stulz (1999), Coffee (2002), Benos and Weisbach (2004) and Doidge et al. (2004) find a positive long-term relationship between internationalization and a firm’s valuation, while Gozzi et al. (2008) argue that the positive relationship exists only in the short-term.
The common ground for most previous studies on internationalizations is the American Depositary Receipts (ADR) Market, where firms from emerging or other developed markets issue equities in the US. Moreover, the discussion on the bonding and segmentation hypotheses in the literature overlooks the reverse situation: US firms internationalizing into other markets. Internationalizations by US firms are an important addition to the discussion because La Porta et al. (2002) establish that US firms have the most advanced corporate governance systems in the world.4 Since the rationale behind the bonding hypothesis is that firms from countries with poor governance raise capital in markets with better corporate governance standards, the internationalization setup of US firms should not support this view. Therefore, this article pays particular attention to the locations US firms internationalize into. Those US firms that exhaust home capital markets and choose to market their bonds to unsuspecting foreign investors in emerging markets can potentially experience negative effects on valuation. These expected negative effects on valuation can be explained through the reverse bonding hypothesis where US firms de-bond from good governance practices by entering into emerging markets.
Various classic capital structure models relying on information asymmetries imply that firm’s valuation could change in response to bond issuances. The “positive impact hypothesis” argues that by issuing bonds and increasing the leverage, firms signal positive management expectations concerning the future earnings prospects (Eckbo, 1986). Thus, investors distinguish between low-value and high-value firms and a positive impact on firm’s valuation follows (Ross, 1977; Heinkel, 1982). The opposite prediction called “negative impact hypothesis” suggests that large external debt financing reveals lower-than-expected operating cash flows by a firm. As follows, investors react negatively which leads to possible decrease in firm’s valuation (Miller and Rock, 1985).5
Furthermore, the market value of a firm is positively correlated with the number of investors who “know about” the firm (Chaplinsky and Ramchand 2000). Global issuances of securities thus reduce the information costs by promoting a greater familiarity with a US firm. In this context an international bond issuance can potentially increase the market
4 For more details see Tables 2 and 6 in La porta et al. (2002) 5 For more details on potential valuation effects of a debt offering (positive and negative impact hypothesis) see Section 2 in Eckbo (1986)
Acta Wasaensia 75
value of a firm and thus its overall valuation. Moreover, raising debt in international markets is a far more important source of capital for firms than raising equity, as debt markets tend to be internationalized to a larger extent than equity markets (Gozzi et al, 2010). Accordingly, unlike previous studies, this paper focuses on those firms that raise debt capital as their first international activity in major overseas markets.6
The results of the study can be summarized as follows. First, internationalization initiatives have a positive short-term effect on US firms’ valuation. We observe significant positive anticipatory and impact effects around the internationalization dates, which subsequently diminish in the longer term. The dynamics of Tobin’s q around the dates when offshore bonds were issued found in this study (a strong positive effect one year prior to and during the first year after the internationalization, followed by a sharp decline in subsequent years) supports segmentation theory. Second, the location of the market where US firms issue debt dramatically affects the results. The positive short-term effect on Tobin’s q is conditional upon the US firms raising debt in other developed markets. Those firms that raise capital in emerging markets experience a significant negative long-term effect on their Tobin’s q.7 US firms acknowledged to have the best governance standards and high investor protection de-bond from good practices by issuing debt in emerging markets with poor governance standards and low investor protection environment. This “reverse bonding” has a long-term negative impact on their valuation. Therefore, the benefits of internationalization for US firms differ sharply depending on the specific market into which they internationalize.
This study contributes to the literature in the following ways. First, it adds to the debate on the bonding and segmentation theories of firm internationalization. Previous studies like Foerster and Karolyi (1998), Domowitz et al. (1998), Karoloyi (2004), Levine and Schmukler (2006) and Gozzi et al. (2008) focus on the internationalization of emerging market or other developed market firms into the US equity markets by issuing depositary receipts, cross-listing, and raising equity capital through private or public placements. This paper extends the ground covered in previous literature by examining US firms internationalizing in foreign markets by issuing debt, and the findings provide broad evidence in support of segmentation theory. Further, the current study provides evidence of the reverse bonding hypothesis where firms internationalizing into low investor protection environments de-bond themselves from good governance practices and experience negative long-term valuation effects.
6 This study considers only those US firms that issue debt overseas in US dollars. Those firms issuing non-USD debt abroad may have tax or hedging motives and therefore it would not be appropriate to include them for testing bonding and segmentation theories. 7 We consider only large emerging markets with their own investors that face capital constraints. Thus, smaller emerging markets (Cayman Islands, Bermuda and Channel Island) that are considered tax havens are excluded from the analysis.

76 Acta Wasaensia
The reminder of the paper proceeds as follows: Section 2 describes the dataset, the data collection process, and provides basic statistics. In Section 3, we describe the methods used for the empirical analysis. Section 4 turns to the relation at the center of the study and examines the effect internationalization on firm valuation. Section 4 also presents the supplementary analysis where we examine the alternative measure for firms’ internationalization. Section 5 concludes the paper.
2. Data
To evaluate the impact of internationalization on a firm’s valuation, data are collected on (i) dates of offshore bond issuance by firms, (ii) firm-level data on valuation, and (iii) firm-specific characteristics. We rely on two sources to identify our sample and to obtain the data for the empirical analysis.
First, we identify the US firms’ international activities by utilizing the data from the Thomson Reuters SDC Platinum database. SDC Platinum is regarded as the most comprehensive database on global security issuance (Gozzi et al. 2008). Specifically, we collect (i) the dates of first internationalization activity: the initial offshore bond offerings from publicly traded US firms, (ii) the principal amount of the issuances, and (iii) country and the exchange where the issuances are listed. The firm is considered as international if it at least once raises capital in international markets. In a time-series dimension, the US firm is classified as international from the moment it raises debt capital abroad for the first time. The study pays special attention to whether the impact on valuation and liquidity differs by whether the US firms internationalize in emerging or in developed markets.
The sample of US firms is then screened against the Thomson Reuters Worldscope database for the data availability on valuation, trading activity, and other firm-level traits. Our sample is limited to those firms with available data on all of the required variables for the entire sample period. After the matching procedure, our final dataset consists of 205 US firms that internationalized by raising debt capital abroad for the first time during the period from January 1984 until December 2015. The dataset provides 7,380 annual observations.
We employ Tobin’s q as the measure of firm valuation. Tobin’s q is computed as the market value of assets plus the book value of debt divided by the book value of assets. Specifically, the book value of debt is calculated as the book value of assets minus the book value of equity. Similar definitions to Tobin’s q are used in La Porta et al. (2002), Doidge et al. (2004) and Gozzi et al. (2008). Following the same literature, we use the firm-specific characteristic that might affect the valuation of firms. To control for the firms’ size and growth prospects, we collect the data on total assets and sales growth. We use sales instead of earnings because earnings are often volatile and easily manipulated. Further, we use the leverage ratio, commonly used in studies of Tobin’s q. The leverage ratio assesses the firm’s

Acta Wasaensia 77
ability to meet its financial obligations and is calculated as the firm’s total outstanding debt divided by the amount of shareholder equity. Finally, we control for firms specifically operating in financial and high-tech industries.
Table 1 reports the statistics for the US firms that internationalize by raising debt capital abroad for the first time during the period 1984–2015. More specifically, it displays the total number of internationalization operations of US firms raising debt overseas for the first time, the average amount in dollars of offshore bond issuance per year, the total number of all offshore bond offerings, and the average amount in dollars of all offshore bond issuances. The study uses only debt issued in US dollars. Firms issuing non-US-dollar debt may have other motivations (e.g., tax management or hedging), but issuing US-dollar debt abroad is far more appropriate a test for the bonding and segmentation hypotheses, as it is free from any hedging motives. During the sample period, a total of 205 US publicly traded firms issued bonds abroad for the first time, averaging $ 404 million of capital raised per year.
Based on the location of the exchange where the US firm raises debt capital, the sample is divided into internationalizations into emerging and developed markets. Historically, a majority of US firms internationalized by raising debt in other developed markets. The number of first time offshore bond issuances accelerated particularly during 1984–1986 and 2000–2001 periods as well as in 2014. The first US firm internationalizations through raising debt capital in emerging markets occurred in 2001, while most offshore bond offerings took place in the period preceding the financial crisis (2006–2008).
The patterns of US firms’ internationalizations by issuing debt abroad during the period of 1984 to 2015 can be seen in Figure 1 of the Appendix. Figure 1 reports the total number of debt issuances by US firms in addition to the initial debt offerings. Figure 2 of Appendix graphically shows the average dollar amounts of first offshore bond issuances and all additional bond issuances by all of the US firms included in the study during the period 1984–2015.
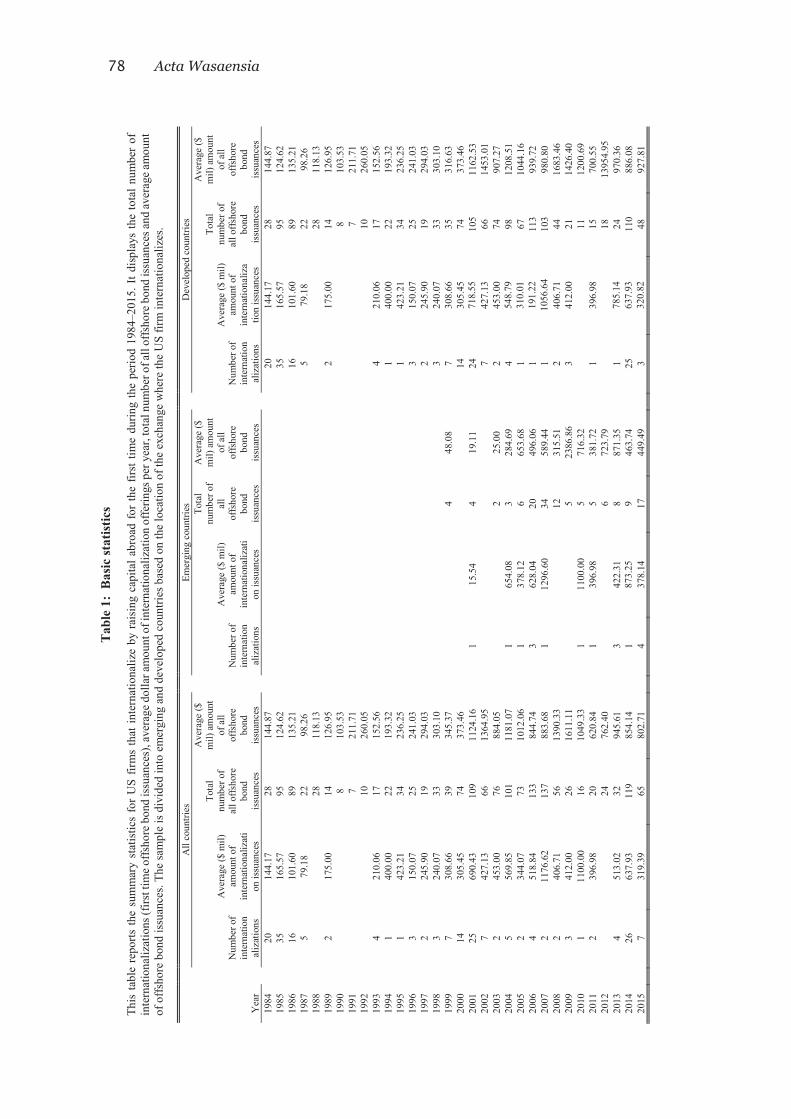
78 Acta Wasaensia
Tab
le 1
: B
asic
stat
istic
s
This
tabl
e re
ports
the
sum
mar
y st
atis
tics
for
US
firm
s th
at in
tern
atio
naliz
e by
rai
sing
cap
ital a
broa
d fo
r th
e fir
st ti
me
durin
g th
e pe
riod
1984
–201
5. I
t disp
lays
the
tota
l num
ber
of
inte
rnat
iona
lizat
ions
(firs
t tim
e offs
hore
bon
d is
suan
ces)
, ave
rage
dol
lar a
mou
nt o
f int
erna
tiona
lizat
ion
offe
rings
per
yea
r, to
tal n
umbe
r of a
ll of
fsho
re b
ond
issu
ance
s and
aver
age a
mou
nt
of o
ffsho
re b
ond
issu
ance
s. Th
e sa
mpl
e is
div
ided
into
em
ergi
ng a
nd d
evel
oped
cou
ntrie
s bas
ed o
n th
e lo
catio
n of
the
exch
ange
whe
re th
e U
S fir
m in
tern
atio
naliz
es.
Yea
r
All
coun
tries
Em
ergi
ng c
ount
ries
Dev
elop
ed c
ount
ries
Num
ber o
f in
tern
atio
nal
izat
ions
Ave
rage
($ m
il)
amou
nt o
f in
tern
atio
naliz
ati
on is
suan
ces
Tota
l nu
mbe
r of
all o
ffsho
re
bond
is
suan
ces
Ave
rage
($
mil)
am
ount
of
all
offs
hore
bo
nd
issu
ance
s
Num
ber o
f in
tern
atio
nal
izat
ions
Ave
rage
($ m
il)
amou
nt o
f in
tern
atio
naliz
ati
on is
suan
ces
Tota
l nu
mbe
r of
all
offs
hore
bo
nd
issu
ance
s
Ave
rage
($
mil)
am
ount
of
all
offs
hore
bo
nd
issu
ance
s
Num
ber o
f in
tern
atio
nal
izat
ions
Ave
rage
($ m
il)
amou
nt o
f in
tern
atio
naliz
atio
n is
suan
ces
Tota
l nu
mbe
r of
all o
ffsho
re
bond
is
suan
ces
Ave
rage
($
mil)
am
ount
of
all
offs
hore
bo
nd
issu
ance
s 19
84
20
144.
17
28
144.
87
20
144.
17
28
144.
87
1985
35
16
5.57
95
12
4.62
35
16
5.57
95
12
4.62
19
86
16
101.
60
89
135.
21
16
101.
60
89
135.
21
1987
5
79.1
8 22
98
.26
5 79
.18
22
98.2
6 19
88
28
118.
13
28
118.
13
1989
2
175.
00
14
126.
95
2 17
5.00
14
12
6.95
19
90
8 10
3.53
8
103.
53
1991
7
211.
71
7 21
1.71
19
92
10
260.
05
10
260.
05
1993
4
210.
06
17
152.
56
4 21
0.06
17
15
2.56
19
94
1 40
0.00
22
19
3.32
1
400.
00
22
193.
32
1995
1
423.
21
34
236.
25
1 42
3.21
34
23
6.25
19
96
3 15
0.07
25
24
1.03
3
150.
07
25
241.
03
1997
2
245.
90
19
294.
03
2 24
5.90
19
29
4.03
19
98
3 24
0.07
33
30
3.10
3
240.
07
33
303.
10
1999
7
308.
66
39
345.
37
4 48
.08
7 30
8.66
35
31
6.63
20
00
14
305.
45
74
373.
46
14
305.
45
74
373.
46
2001
25
69
0.43
10
9 11
24.1
6 1
15.5
4 4
19.1
1 24
71
8.55
10
5 11
62.5
3 20
02
7 42
7.13
66
13
64.9
5 7
427.
13
66
1453
.01
2003
2
453.
00
76
884.
05
2 25
.00
2 45
3.00
74
90
7.27
20
04
5 56
9.85
10
1 11
81.0
7 1
654.
08
3 28
4.69
4
548.
79
98
1208
.51
2005
2
344.
07
73
1012
.06
1 37
8.12
6
653.
68
1 31
0.01
67
10
44.1
6 20
06
4 51
8.84
13
3 84
4.74
3
628.
04
20
496.
06
1 19
1.22
11
3 93
9.72
20
07
2 11
76.6
2 13
7 88
3.68
1
1296
.60
34
589.
44
1 10
56.6
4 10
3 98
0.80
20
08
2 40
6.71
56
13
90.3
3 12
31
5.51
2
406.
71
44
1683
.46
2009
3
412.
00
26
1611
.11
5 23
86.8
6 3
412.
00
21
1426
.40
2010
1
1100
.00
16
1049
.33
1 11
00.0
0 5
716.
32
11
1200
.69
2011
2
396.
98
20
620.
84
1 39
6.98
5
381.
72
1 39
6.98
15
70
0.55
20
12
24
762.
40
6 72
3.79
18
13
954.
95
2013
4
513.
02
32
945.
61
3 42
2.31
8
871.
35
1 78
5.14
24
97
0.36
20
14
26
637.
93
119
854.
14
1 87
3.25
9
463.
74
25
637.
93
110
886.
08
2015
7
319.
39
65
802.
71
4 37
8.14
17
44
9.49
3
320.
82
48
927.
81

Acta Wasaensia 79
3. Methodology
To examine the impact on the valuation of US firms of their internationalization by raising debt capital abroad, we estimate the following specification. Regressions are estimated using standard errors clustered at the firm level. All of the models and specifications include firm ( ) and year effects ( ). Finally, all regressions throughout the study use
unbalanced panels.
, = + , + , + , + , + + + , (1)
, represents Tobin’s q, which is the firm’s i valuation measure in time t. For the
numerator of Tobin’s q, we use the market value of equity plus the book value of debt (calculated as the book value of assets minus the book value of equity). For the denominator, we take the book value of assets. The superscript I labels the firm as an international, which is a firm that raises capital abroad at some point in the sample.
, represents the internationalization dummy that equals zero if a firm i during the time t did not internationalize. Correspondingly, it equals one after the first internationalization activity of the firms and remains one for the rest of the sample period. A positive coefficient on the , variable can be interpreted as signaling that internationalization has a positive impact on the firms domestic trading activity. The internationalization dummy with the aforementioned characteristics has been widely used in the literature (Levine and Schmukler, 2006; Gozzi et al., 2008). However, due to recent criticism that the current internationalization dummy is not equally applicable to all firms (firms that internationalize late in the sample period have a shorter duration for the internationalization dummy), we use an alternative measure for internationalization as well. The alternative internationalization dummy equals a value of one after the first internationalization activity and remains so during the five following years. After the period of five years it takes the value zero again and retains it for the rest of the sample period.8
, is the logarithm of total assets of a firm i in time t. Previous research designated large and liquid firms as the main source of international firms, and thus we control for firm size. Further, we control for the sample firms’ growth prospects as , represents the growth rates of total sales. Finally, we control for the firms’ ability to meet their financial obligations by introducing the leverage ratio: , .
8 Please see Table 4 for the detailed analysis using the alternative dummy variable for firm’s internationalization.

80 Acta Wasaensia
Next, we drill down into the dynamics of the impact of internationalization activity on firm valuation. Specifically, we check for the anticipatory, impact, and permanent effects of US firms’ internationalization activity. To do so, we augment Equation 1 in the following manner:
, = + , + , + , + , + , + , + + + , (2)
, is a dummy variable capturing the anticipatory effect of internationalization on the firm’s liquidity or valuation. , equals one in the period of 12 months prior to first internationalization activity and zero otherwise. , captures the impact effect of the internationalization equaling one during the period of 12 months following the first offshore bond issuance by the US firm and zero otherwise. Thus, the anticipatory and impact dummies capture the impact of internationalization in the short term. Lastly, , c checks for the permanent effect. It equals one in the period from 12 months after the internationalization event and throughout all subsequent years in the sample, and tends to capture the long-term effect of internationalization.
For the additional analysis, we control for firms operating in specific industries. Accordingly, the additional models incorporate dummy variables for financial and high-tech firms. Financial firms are unique relative to firms operating in other industries due to their different regulatory overlay and differences in accounting rules. High-tech firms are specific as they are small in terms of total assets, growth oriented, and dedicate large financial resources to research and development. Therefore, our models include High-Tech Firms and Financial Firms dummy variables to control for these specific industries.
4. Results
First, we turn to the question of how a first internationalization operation through issuing debt affects a US firm’s valuation. The dependent variable is Tobin’s q for the panel of US firms internationalizing by raising debt capital in overseas markets during the period 1984–2015.

Acta Wasaensia 81
Tab
le 2
: Int
erna
tiona
lizat
ion
and
firm
val
uatio
n
The
depe
nden
t var
iabl
e is
Tob
in’s
q. T
he in
tern
atio
naliz
atio
n du
mm
y eq
uals
one
in a
nd a
fter t
he y
ear o
f firs
t int
erna
tiona
lizat
ion
activ
ity o
f the
firm
s and
zer
o ot
herw
ise.
The
ant
icip
ator
y du
mm
y eq
uals
one
dur
ing
the
perio
d of
12
mon
ths
prio
r to
firs
t int
erna
tiona
lizat
ion
activ
ity a
nd z
ero
othe
rwis
e. T
he i
mpa
ct d
umm
y eq
uals
one
dur
ing
the
perio
d of
12
mon
ths
follo
win
g th
e fir
st
inte
rnat
iona
lizat
ion
activ
ity b
y U
S fir
m an
d ze
ro o
ther
wis
e. T
he p
erm
anen
t dum
my
equa
ls o
ne in
the p
erio
d st
artin
g fro
m 1
2 m
onth
s afte
r the
inte
rnat
iona
lizat
ion
even
t and
rem
ains
one
thro
ugho
ut
all o
f the
sub
sequ
ent y
ears
in th
e sa
mpl
e. M
odel
s 1–
6 in
clud
e fir
m a
nd y
ear d
umm
ies,
albe
it no
t rep
orte
d in
the
tabl
e. M
odel
s 7
and
8 in
clud
e du
mm
y va
riabl
es fo
r firm
s op
erat
ing
in h
igh-
tech
an
d fin
anci
al in
dust
ries.
A fi
rm is
con
side
red
as in
tern
atio
nal i
f it r
aise
s ca
pita
l in
inte
rnat
iona
l mar
kets
at l
east
onc
e. T
he re
gres
sion
s ar
e es
timat
ed w
ith s
tand
ard
erro
rs c
lust
ered
by
firm
. The
co
nsta
nt is
est
imat
ed, a
lbei
t not
repo
rted
in th
e ta
ble.
T-s
tatis
tics a
re re
porte
d in
bra
cket
s. *,
**,
***
den
ote
stat
istic
al si
gnifi
canc
e at
the
10%
, 5%
and
1%
leve
ls re
spec
tivel
y.
Dep
ende
nt V
aria
ble:
Tob
in's
q (1
) (2
) (3
) (4
) (5
) (6
) (7
) (8
) In
tern
atio
naliz
atio
n
0.02
5**
0.02
1**
0.02
3**
(2.0
62)
(2.4
63)
(2.1
27)
Ant
icip
ator
y
0.02
0**
0.02
7***
0.
029*
* (2
.434
) (3
.245
) (2
.553
) Im
pact
0.
026*
**
0.03
3***
0.
036*
**
(2.9
00)
(3.3
25)
(2.8
24)
Perm
anen
t 0.
002
0.01
1 0.
021
(0.1
88)
(0.8
56)
(1.3
51)
Size
(Log
of T
otal
Ass
ets)
-0
.005
-0
.005
-0
.005
-0
.004
-0
.005
0.
012
0.00
9 (-
0.55
5)
(-0.
546)
(-
0.57
5)
(-0.
496)
(-
0.61
6)
(1.3
72)
(1.1
10)
Log
of (S
ales
Gro
wth
) -0
.022
**
-0.0
22*
-0.0
22*
-0.0
22*
-0.0
22*
-0.0
07
-0.0
06
(-1.
838)
(-
1.82
4)
(-1.
809)
(-
1.83
3)
(-1.
845)
(-
0.62
0)
(-0.
571)
Le
vera
ge
0.00
1***
0.
001*
**
0.00
1***
0.
001*
**
0.00
1***
0.
001*
**
0.00
1***
(1
3.08
6)
(13.
079)
(1
3.08
1)
(13.
215)
(1
3.40
1)
(10.
160)
(1
0.23
4)
Hig
h-Te
ch F
irms
0.10
5 0.
108
(0.9
04)
(0.9
27)
Fina
ncia
l Firm
s -0
.057
* -0
.052
* (-
1.93
3)
(-1.
768)
Firm
Dum
mie
s Y
es
Yes
Y
es
Yes
Y
es
Yes
N
o N
o Y
ear D
umm
ies
Yes
Y
es
Yes
Y
es
Yes
Y
es
Yes
Y
es
R-s
quar
ed
0.57
2 0.
600
0.59
8 0.
599
0.59
9 0.
601
0.06
0 0.
063

82 Acta Wasaensia
Table 2 demonstrates that the Internationalization dummy , appears positive and significant in Model 1. This result holds when conditioning on firm characteristics as well as firm and year dummies (Model 2), thus suggesting that US firms’ internationalization improves their valuation. Next, in Models 3–6, we drill down into the dynamics of valuation around the internationalization dates and check for anticipatory, impact, and permanent effects. Accordingly, we provide a more direct test of Tobin’s q evolution before, during, and after the first internationalization activity of the firms. Regardless of the model specification, the Anticipatory and Impact dummies show positive and significant coefficients, implying a strong positive effect on firm valuation one year before and after the internationalization event. Further, Model 6 simultaneously includes all three dummies to check for the timing of the impact of the internationalization event on firm valuation. In order to claim that Tobin’s q rises after internationalization and remains significant in the long-run as suggested by the bonding hypothesis, the coefficient of the Permanent dummy variable in these models would have to be statistically significant and significantly higher than the coefficients of the Anticipatory and Impact dummy variables. However, Model 6 offers no support for any long-term effects on firm valuation as the Permanent dummy variable does not exhibit any significance.
Analyzing the coefficients of the dummy variables, we find a strong anticipatory effect where Tobin’s q rises significantly in the period before the actual internationalization. Model 6 suggests that the market anticipates the internationalization, which accounts for the strong positive effect on valuation in the year before the first internationalization activity of the firms. Further, we capture a strong impact effect as Tobin’s q continues to increase in the first year following the internationalization event. However, in the following years, US firms experience a sharp decrease in Tobin’s q, which is consistent with the segmentation theory prediction that the initial increase in a firm’s valuation is followed by a reduction in the longer term. This finding also challenges the bonding theory view predicting that a sharp increase in Tobin’s q resulting from internationalization will persist in the long-term.
Further, in Models 7 and 8, we control for firms operating in high-tech and financial industries. These models confirm the previous findings on the generally positive impact of internationalization on firm valuation as the Internationalization dummy remains positive and significant alongside additional control variables (Model 7). Model 8 further supports the short-term valuation impact as the Anticipatory and Impact dummy variables enter with positive and significant coefficients, while the Permanent dummy remains insignificant.

Acta Wasaensia 83
Tab
le 3
: Int
erna
tiona
lizat
ion
and
firm
val
uatio
n by
loca
tion
of th
e in
tern
atio
nal m
arke
t
The
sam
ple
is d
ivid
ed in
to e
mer
ging
and
dev
elop
ed c
ount
ries b
ased
on
the
loca
tion
of th
e ex
chan
ge w
here
the
US
firm
rais
es c
apita
l. Th
e de
pend
ent v
aria
ble
is th
e lo
garit
hm o
f one
plu
s the
tu
rnov
er ra
tio fo
r the
firm
. The
inte
rnat
iona
lizat
ion
dum
my
equa
ls o
ne in
and
afte
r the
yea
r of f
irst i
nter
natio
naliz
atio
n ac
tivity
of t
he fi
rm a
nd z
ero
othe
rwis
e. T
he a
ntic
ipat
ory
dum
my
equa
ls
one
durin
g th
e pe
riod
of 1
2 m
onth
s prio
r to
first
inte
rnat
iona
lizat
ion
activ
ity a
nd z
ero
othe
rwis
e. T
he im
pact
dum
my
equa
ls o
ne d
urin
g th
e pe
riod
of 1
2 m
onth
s fol
low
ing
the
first
in
tern
atio
naliz
atio
n ac
tivity
by
the
US
firm
and
zer
o ot
herw
ise.
The
per
man
ent d
umm
y eq
uals
one
in th
e pe
riod
star
ting
from
12
mon
ths a
fter t
he in
tern
atio
naliz
atio
n ev
ent a
nd re
mai
ns o
ne
thro
ugho
ut th
e su
bseq
uent
yea
rs in
the
sam
ple.
Mod
els 1
–4 a
nd 6
–9 in
clud
e fir
m a
nd y
ear d
umm
ies,
albe
it th
ey a
re n
ot re
porte
d in
the
tabl
e. M
odel
s 5 a
nd 1
0 in
clud
e a
dum
my
varia
ble
for
the
finan
cial
indu
stry
. A fi
rm is
con
side
red
inte
rnat
iona
l if i
t rai
ses c
apita
l in
inte
rnat
iona
l mar
kets
at l
east
onc
e. T
he re
gres
sion
s are
est
imat
ed w
ith st
anda
rd e
rror
s clu
ster
ed b
y fir
m. T
he
cons
tant
is e
stim
ated
, alb
eit n
ot re
porte
d in
the
tabl
e. T
-sta
tistic
s are
repo
rted
in b
rack
ets.
*, *
*, *
** d
enot
e st
atis
tical
sign
ifica
nce
at th
e 10
%, 5
% a
nd 1
% le
vels
resp
ectiv
ely.
Dep
ende
nt V
aria
ble:
Tob
in's
q
Emer
ging
Mar
kets
D
evel
oped
Mar
kets
(1
) (2
) (3
) (4
) (5
) (6
) (7
) (8
) (9
) (1
0)
Inte
rnat
iona
lizat
ion
-0
.078
**
-0.0
79**
0.
033*
* 0.
027*
* (-
2.01
0)
(-2.
149)
(2
.551
) (2
.182
) A
ntic
ipat
ory
0.
037
0.03
5 0.
049
0.02
3***
0.
024*
**
0.02
1*
(1.2
71)
(1.2
13)
(0.9
59)
(2.6
71)
(2.7
91)
(1.8
82)
Impa
ct
0.01
2 0.
008
0.02
1 0.
038*
**
0.03
2***
0.
032*
* (0
.367
) (0
.250
) (0
.389
) (3
.276
) (3
.103
) (2
.464
) Pe
rman
ent
-0.1
35**
* -0
.137
***
-0.0
82**
0.
026*
0.
022
0.02
2 (-
2.96
3)
(-3.
235)
(-
2.16
9)
(1.9
23)
(1.6
05)
(1.3
72)
Size
(Log
of T
otal
Ass
ets)
0.
008
0.00
1 -0
.041
***
-0.0
07
-0.0
08
0.01
4 (0
.303
) (0
.034
) (-
4.76
0)
(-0.
798)
(-
0.87
4)
(1.5
44)
Log
of (S
ales
Gro
wth
) 0.
012
0.00
8 0.
021*
-0
.026
**
-0.0
27**
-0
.005
(0
.387
) (0
.296
) (1
.996
) (-
2.16
0)
(-2.
216)
(-
0.48
3)
Leve
rage
0.
001*
**
0.00
1***
0.
001*
**
0.00
1 0.
001
0.00
3 (1
5.09
2)
(15.
237)
(3
.886
) (0
.918
) (0
.910
) (1
.333
) Fi
nanc
ial F
irms
-0.0
06
-0.0
51*
(-0.
160)
(-
1.76
0)
Firm
Dum
mie
s Y
es
Yes
Y
es
Yes
N
o Y
es
Yes
Y
es
Yes
N
o Y
ear D
umm
ies
Yes
Y
es
Yes
Y
es
Yes
Y
es
Yes
Y
es
Yes
Y
es
R-s
quar
ed
0.59
2 0.
613
0.60
8 0.
628
0.28
5 0.
579
0.61
0 0.
581
0.61
2 0.
067

84 Acta Wasaensia
The previous section provides evidence supporting segmentation theory, because our sample of US firms experiences a short-term strong positive impact on Tobin’s q. However, pooling all internationalization types together might not give us the clear picture of the relationship between the firms’ first internationalization activity and its valuation. To provide more detailed evidence of the internationalization impact on Tobin’s q, we split our sample based on the firms’ choice of location for their first internationalization activity. Consequently, the sample is divided into US firms issuing debt in emerging and developed markets. We expect that internationalizing in developed markets with tight regulations and strong governance mechanisms has a different impact on US firms’ valuation than internationalizing into less integrated emerging markets that generally have weaker investor protection laws. Furthermore, as our sample of US firms internationalizes by issuing debt, we expect that different signals will be sent to investors about a firm’s ability to repay its debt obligations when a US firm decides to issue debt in developed market with strict systems and high investor protection rather than issuing debt in an emerging market with potentially weak structure systems and loose listing requirements.
Comparing the results of Models 1 and 2 (emerging markets) with those of Models 6 and 7 (developed markets) in Table 3 reveals some intriguing conclusions. The Internationalization dummy enters as significant and negative in Models 1 and 2 while it becomes significant and positive in Models 5 and 6. This result points to a different impact on US firms’ valuations based on the location of their internationalization activity. Specifically, US firms internationalizing into emerging markets generally experience a negative effect on their valuation, while the effect is positive for those firms internationalizing into other developed markets.
Furthermore, in Models 3 and 4 (emerging markets) and 8 and 9 (developed markets) we check for the impact on Tobin’s q before, during, and after the internationalization dates. Strikingly, Models 3 and 4 reveal that the coefficient of the Permanent dummy variable is negative and significantly different from those of the Anticipatory and Impact dummies, which suggests a long-term negative effect on Tobin’s q. Both Anticipatory and Impact dummies remain insignificant while the Permanent variable enters Models 3 and 4 as highly significant at the 1% level. Those US firms exhausting the home capital market and offering their bonds to unsuspecting foreign investors in emerging markets experience negative long-term effect on their Tobin’s q.
Nevertheless, markets anticipate the internationalization and view it positively, which is reflected in the rise of Tobin’s q before the actual internationalization for those US firms issuing bonds in other developed markets. Models 7 and 8 (re. developed markets) show positive and significant coefficients of the Anticipatory and Impact dummy variables. The valuation of those US firms that internationalize into developed markets raises during the anticipatory, and especially during the impact, phase (one year before and one year after the internationalization dates). However, the Permanent dummy variable remains trivial
Acta Wasaensia 85
in Models 7 and 8. The insignificant nature of the Permanent variable thus further confirms no longer-term valuation effect for firms internationalizing in developed markets.
Finally, Models 5 and 10 introduce the dummy variable for financial firms while checking for the dynamics of the valuation impact around the internationalization dates. Model 5 confirms the long-term negative valuation effect for those US firms issuing debt in emerging markets. The coefficient of the Permanent dummy variable remains significant, negative, and significantly different from the coefficients of Anticipatory and Impact variables. Further, Model 10 validates the short-term positive valuation impact for those US firms issuing debt in developed markets. The Anticipatory and Impact variables enter Model 10 with positive and significant coefficients while the Permanent variable remains insignificant. The valuation rises one year before, and especially during the first year of, overseas debt issuance and then decreases in the following years.
Table 4 takes into account an alternative Internationalization dummy variable that equals one during the year of the US firm’s first offshore bond issuance and remains one during the following five years. Five years after the initial offshore debt issuance the Internationalization dummy variable takes the value of zero again and remains zero until the end of the sample period. The different valuation impact for US firms internationalizing into developed and emerging markets is confirmed with the application of the alternative internationalization dummy. Firms from the USA internationalizing into emerging markets (models 4–6) suffer a negative valuation effect as the Internationalization variable shows negative and significant coefficients. In contrast, the alternative internationalization variable enters positive and significant in models 7–9 resulting in a positive valuation effect for those US firms choosing developed markets as the location in which to issue debt.
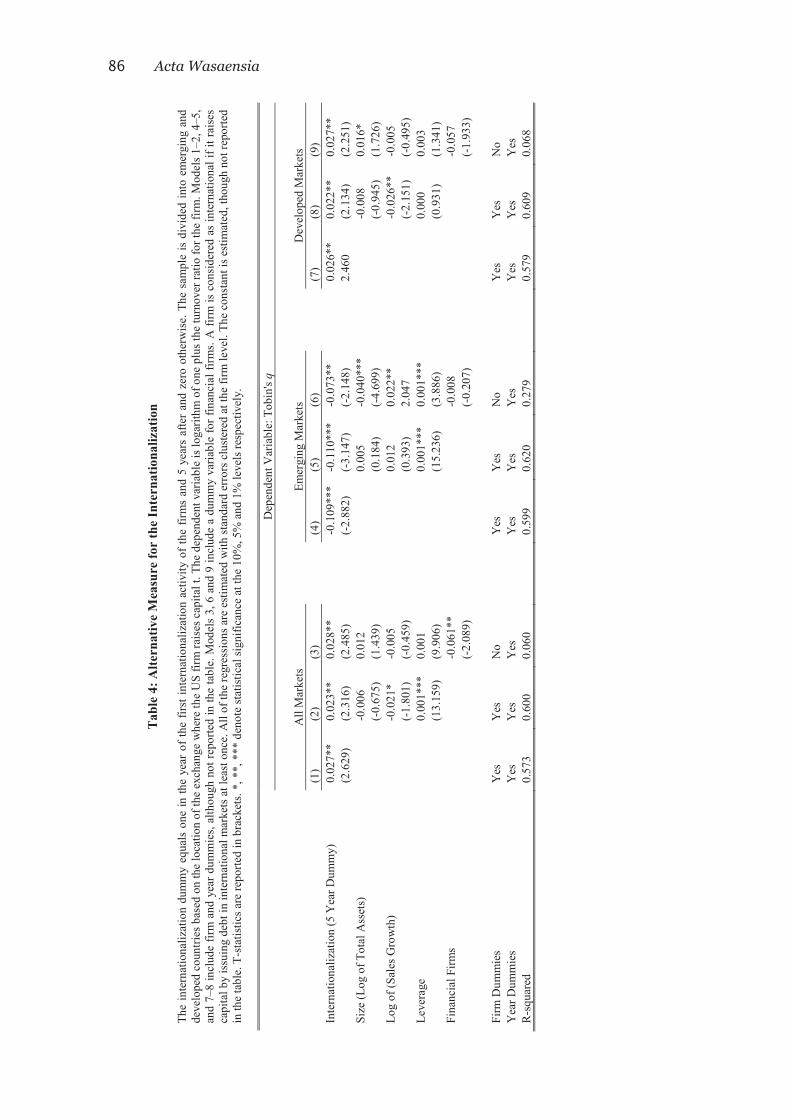
86 Acta Wasaensia
Tab
le 4
: Alte
rnat
ive
Mea
sure
for
the
Inte
rnat
iona
lizat
ion
The
inte
rnat
iona
lizat
ion
dum
my
equa
ls o
ne in
the
year
of t
he fi
rst i
nter
natio
naliz
atio
n ac
tivity
of t
he fi
rms
and
5 ye
ars
afte
r and
zer
o ot
herw
ise.
The
sam
ple
is d
ivid
ed in
to e
mer
ging
and
de
velo
ped
coun
tries
bas
ed o
n th
e lo
catio
n of
the
exch
ange
whe
re th
e U
S fir
m ra
ises
cap
ital t
. The
dep
ende
nt v
aria
ble
is lo
garit
hm o
f one
plu
s the
turn
over
ratio
for t
he fi
rm. M
odel
s 1–2
, 4–5
, an
d 7–
8 in
clud
e fir
m a
nd y
ear d
umm
ies,
alth
ough
not
repo
rted
in th
e ta
ble.
Mod
els
3, 6
and
9 in
clud
e a
dum
my
varia
ble
for f
inan
cial
firm
s. A
firm
is c
onsi
dere
d as
inte
rnat
iona
l if i
t rai
ses
capi
tal b
y is
suin
g de
bt in
inte
rnat
iona
l mar
kets
at l
east
onc
e. A
ll of
the
regr
essi
ons a
re e
stim
ated
with
stan
dard
err
ors c
lust
ered
at t
he fi
rm le
vel.
The
cons
tant
is e
stim
ated
, tho
ugh
not r
epor
ted
in th
e ta
ble.
T-s
tatis
tics a
re re
porte
d in
bra
cket
s. *,
**,
***
den
ote
stat
istic
al si
gnifi
canc
e at
the
10%
, 5%
and
1%
leve
ls re
spec
tivel
y.
Dep
ende
nt V
aria
ble:
Tob
in's
q
All
Mar
kets
Em
ergi
ng M
arke
ts
Dev
elop
ed M
arke
ts
(1)
(2)
(3)
(4)
(5)
(6)
(7)
(8)
(9)
Inte
rnat
iona
lizat
ion
(5 Y
ear D
umm
y)
0.02
7**
0.02
3**
0.02
8**
-0.1
09**
* -0
.110
***
-0.0
73**
0.
026*
* 0.
022*
* 0.
027*
* (2
.629
) (2
.316
) (2
.485
) (-
2.88
2)
(-3.
147)
(-
2.14
8)
2.46
0 (2
.134
) (2
.251
) Si
ze (L
og o
f Tot
al A
sset
s)
-0.0
06
0.01
2 0.
005
-0.0
40**
* -0
.008
0.
016*
(-
0.67
5)
(1.4
39)
(0.1
84)
(-4.
699)
(-
0.94
5)
(1.7
26)
Log
of (S
ales
Gro
wth
) -0
.021
* -0
.005
0.
012
0.02
2**
-0.0
26**
-0
.005
(-
1.80
1)
(-0.
459)
(0
.393
) 2.
047
(-2.
151)
(-
0.49
5)
Leve
rage
0.
001*
**
0.00
1 0.
001*
**
0.00
1***
0.
000
0.00
3 (1
3.15
9)
(9.9
06)
(15.
236)
(3
.886
) (0
.931
) (1
.341
) Fi
nanc
ial F
irms
-0.0
61**
-0
.008
-0
.057
(-
2.08
9)
(-0.
207)
(-
1.93
3)
Firm
Dum
mie
s Y
es
Yes
N
o Y
es
Yes
N
o Y
es
Yes
N
o Y
ear D
umm
ies
Yes
Y
es
Yes
Y
es
Yes
Y
es
Yes
Y
es
Yes
R
-squ
ared
0.
573
0.60
0 0.
060
0.59
9 0.
620
0.27
9 0.
579
0.60
9 0.
068
Acta Wasaensia 87
Our results suggest a dramatically different valuation impact depending on the location where US firms internationalize. Those firms that issue their debt in other developed markets experience a short-term increase in their valuation while others that choose emerging markets for their internationalization encounter a long-term negative valuation effect. Investors react negatively if US firms internationalize into emerging markets, which are generally marked by weak investor protection, loose listing requirements, and poor governance systems. In choosing an emerging market in which to issue their bonds, US firms send a negative signal to investors about their quality and the ability to repay the debt. The bonding hypothesis predicts that firms in countries with poor corporate governance raise capital in developed markets with better corporate governance standards to signal quality and improve investor protection, which in turn improves the firms’ valuation in the longer term. However, as our analyses focus on US firms originating in the most advanced corporate governance system in the world and internationalizing in poor governance system environments (emerging markets), the opposite outcome prevails. The rationale here is that weak US firms internationalizing into emerging markets de-bond themselves from good governance practices and send a negative signal to investors, which leads to a longer-term reduction in their valuation, suggesting a case of reverse bonding hypothesis. Furthermore, this finding is broadly consistent with the observation of La Porta et al. (2002) that firms in countries with weaker investor protection have a lower valuation than firms in operating in environments with stronger protection and governance systems.
In contrast, those US firms that internationalize by issuing debt capital into other developed markets certify their quality. Internationalizing into other developed markets with strict listing requirements, strong investor protection, and tight regulations improves a firm’s valuation significantly in the short term, as it signals that they are good-quality firms capable of meeting their debt obligations. However, this positive impact does not persist in the long term. This finding supports the segmentation theory prediction that internationalization increases a firm’s valuation temporarily. Accordingly, strong US firms seek capital abroad to increase demand for their securities (if only for a short time) and lower the cost of capital without changing their good governance system practices.
5. Conclusions
By examining the dynamics of Tobin’s q before, during, and after the dates of initial offshore bond issuance by US firms, this paper examines the impact of internationalization on firm valuation. The empirical study employs a sample of 205 US firms that have internationalized by issuing debt in foreign markets during the period 1984–2015. Tobin’s q is used as the measure for the firm valuation.
We find that internationalization improves a firm’s valuation in the short term. Specifically, we observe a strong positive effect on that valuation prior to and during the

88 Acta Wasaensia
first year of internationalization, followed by a decline in the following years. This result provides support for the segmentation hypothesis. Further, a positive short-term effect on Tobin’s q is conditional on US firms internationalizing into other developed markets. Specifically, those US firms that internationalize by issuing debt to emerging markets experience a significant negative long-term valuation effect. US firms issuing debt in emerging markets associated with low investor protection and loose listing requirements send a negative signal to investors and suffer a long-term negative valuation effect. This long-term negative impact on valuation confirms the assertions of the reverse bonding hypothesis when firms from countries with strong corporate governance practices issue capital in poor governance environments. Therefore, the benefits of internationalization for US firms differ sharply depending on the specific market into which they internationalize.
The findings of this study contribute to the debate on bonding and segmentation theories. Whereas previous literature largely focuses on internationalization initiatives by firms from all over the world issuing equity in the USA, this paper examines US firms’ internationalization through issuing debt abroad. The current study provides evidence of a short-term positive valuation effect that supports segmentation theory. Further, this study finds evidence of the reverse bonding hypothesis being applicable to those US firms that come from a commercial environment marked by good governance standards and robust investor protection which then internationalize into markets with poor governance standards and weak investor protection. Reverse bonding leads to a long-term negative effect on the firm’s valuation.
Acta Wasaensia 89
References
Albuquerque, R., Wang, N., 2008. Agency conflicts, investment, and asset pricing. Journal of Finance 63, 1-40.
Alexander, G., Eun, C., Janakiramanan, S., 1987. Asset pricing and dual listing on foreign capital markets: A note. Journal of Finance 42, 151-158.
Benos, E., Weisbach, M., 2004. Private benefits and cross-listings in the United States. Emerging Markets Review 5, 217–240.
Black, F., 1974. International capital market equilibrium with investment barriers. Journal of Financial Economics 1, 337-352.
Caprio, G., Laeven, L., Levine, R., 2008. Governance and bank valuation. Journal of Financial Intermediation 16, 584-617.
Chaplinsky, S., Ramchand, L., 2000. The impact of global equity offerings. Journal of Finance 55, 2767-2789.
Coffee, J., 2002. Racing towards the top: The impact of cross-listings and stock market competition on international corporate governance. Columbia Law Review 102, 1757–1831.
Doidge, C., Karolyi, A., Stulz, R., 2004. Why are firms that list in the U.S. worth more? Journal of Financial Economics 71, 205–238.
Domowitz, I., Glen, J., Madhavan, A., 1998. International Cross-Listing and Order Flow Migration: Evidence from an Emerging Market. Journal of Finance 53, 2001-2027.
Durnev, A., Kim, E., 2005. To steal or not to steal: Firm attributes, legal environment, and valuation. Journal of Finance 60, 1461–1493.
Errunza, V., Losq, E., 1985. International asset pricing under mild segmentation: Theory and tests. Journal of Finance 40, 105-124.
Errunza, V., Miller, D., 2000. Market segmentation and the cost of capital in international equity markets. Journal of Financial and Quantitative Analysis 35, 577–600.
Foerster, S., Karolyi, A., 1998. Multimarket trading and liquidity: a transaction data analysis of Canada–US interlistings. Journal of International Financial Markets, Institutions and Money 8, 393-412.
Foerster, S., Karolyi, A., 1999. The effects of market segmentation and investor recognition on asset prices: Evidence from foreign stocks listing in the United States. Journal of Finance 54, 981-1013.
Fuerst, O. (1998) A theoretical analysis of the investor protection regulations argument for global listing of stocks, unpublished working paper, Yale University

90 Acta Wasaensia
Gozzi, J.C., Levine, R., Schmukler, S., 2008. Internationalization and the evolution of corporate valuation. Journal of Financial Economics 88, 607–632.
Gozzi, J.C., Levine, R., Schmukler, S., 2010. Patterns of international capital raisings. Journal of Itnternational Economics 80, 45-57.
Heinkel, R., 1982. A theory of capital structure relevance under imperfect information. Journal of Finance 37, 1141-1150.
Henderson, B., Jegadeesh, N., Weisbach, M., 2006. World markets for raising new capital. Journal of Financial Economics 82, 63–101.
Karolyi, A., 2004. The role of American depository receipts in the development of emerging equity markets. Review of Economics and Statistics 86, 670-690.
La Porta, R., Lopez-de-Silanes, F., Shleifer, A., Vishny, R., 2002. Investor protection and corporate valuation. Journal of Finance 57, 1147–1170.
Lan, Y., Wang, N., 2004. Investor protection and investment. Working Paper Columbia University.
Levine, R., Schmukler, S., 2006. Internationalization and stock market liquidity. Review of Finance 10, 153–187.
Licht, A.N., 2003. Cross-listing and corporate governance: Bonding or avoiding? Chicago Journal of International Law 4, 141–163.
Miller, M., Rock, K., 1985. Dividend policy under asymmetric information. Journal of Finance 40, 1031-1051.
Pagano, M., Roell, A., Zechner, J., 2002. The geography of equity listing: why do companies list abroad? Journal of Finance 57, 2651-2694.
Pinegar, J., Ravichandran, R., 2003. U.S. investors’ perceptions of corporate control in Mexico: Evidence from sibling ADRs. Journal of Financial and Quantitative Analysis 38, 213–230.
Ross, S., 1977. The determination of financial structure: The incentive-signaling approach. Bell Journal of Economics 5, 273-307.
Reese Jr., W., Weisbach, M., 2002. Protection of minority shareholder interests, cross-listings in the United States, and subsequent equity offerings. Journal of Financial Economics 66, 65-104.
Siegel, J., 2004. Can foreign firms bond themselves effectively by renting U.S. securities laws? Journal of Financial Economics 75, 319–359.
Solnik, B., 1974. Why not diversify internationally rather than domestically? Financial Analysts Journal 30, 48-54.

Acta Wasaensia 91
Stapleton, R., Subrahmanyam, M., 1977. Market imperfections, capital market equilibrium, and corporate finance. Journal of Finance 32, 307-319.
Stulz, R., 1999. Globalization of equity markets and the cost of capital. Journal of Applied Corporate Finance 12, 1–12.
Tobin, J., Brainard, W., 1977. Asset markets and the cost of capital. In: Balassa, B., Nelson, R. (Eds.), Economic Progress, Private Values, and Public Policy. North Holland, Amsterdam, pp. 235–262.

92 Acta Wasaensia
APPENDIX
Figure 1
Figure 2
0
20
40
60
80
100
120
140
1984
1986
1988
1990
1992
1994
1996
1998
2000
2002
2004
2006
2008
2010
2012
2014
Total offshore bond issuances
Internationalizations
0
200
400
600
800
1000
1200
1400
1600
1800
1984
1986
1988
1990
1992
1994
1996
1998
2000
2002
2004
2006
2008
2010
2012
2014
Average ($ mil) amount of alloffshore bond issuances
Average ($ mil) amount ofinternationalization issuances


![[2005] Three Essays in International Finance](https://img.dokumen.tips/doc/110x75/577d34e81a28ab3a6b8f2476/2005-three-essays-in-international-finance.jpg)