Embed Size (px)
Citation preview

ESQUEMA DE LA PRESENTACIÓN
1. Breve descripción del plan de doctorado y del proye cto que lo financia (FPI)
-Objetivo.
-Marco de Trabajo: Modelos Dinámicos de cambios de usos de suelo en regionesurbanas.
- Metodología: Construyendo un modelo dinámico basado en autómatascelulares sobre una plataforma SIG .
2. Explorando las limitaciones de CORINE Land Cover para el modelado de usos de suelo.
3. Conclusiones.
-Objetivo.
- Metodología: Comparación de las geodatabases CLC-MLU a diferentesescalas.
Jaime Díaz Pacheco
Dir. Dr. Javier Gutiérrez Puebla
Dpto. de Geografía Humana
Universidad Complutense
II Jornadas de Geografía Humana
24 – 25 noviembre 2011

Planning
1 2 4
2008-2009PhD Course
2009-2010DEA
2010 - 2013THESIS WORK
AÑOS (FPI)
SIMULACIÓN DE USOS DE SUELO
URBANO (ANN)
TEORÍA DE SISTEMAS COMPLEJOSAPLICADOS A LA GEOGRAFÍA
MODELOS DINÁMICOS DE CAMBIO DE USOS DE SUELO BASADOS EN AC URBANO
MODELIZACIÓN USOS DE SUELO Y MOVILIDAD
Un sistema en el cual un granred de componentes sin sin uncontrol central y una serie dereglas simples operanincrementando la complejidadde su comportamiento colectivo,procesando informaciónsofisticada en un proceso deaprendizaje y adaptación.

PROJECT : RELATIONSHIP AMONG LAND USE AND URBAN MO BILITY.
MARS CA
Cellular AutomataMetropolitan Activity Relocation Simulator
1. Brief description of the whole project where this work is included. - Objective:
Human Geography Department UCM
TRANSyT - Transport Research Centre -UPM
Regional Transport and Land Use Dynamic ModelMunicipality (Scale)
Regional Land Use Dynamic Model25x25 m. cell (Scale)
Jaime Díaz Pacheco
Dpto. de Geografía Humana
Universidad Complutense
Acknowledgements: Financial support from Ministerio de Ciencia e Innovación (project TRA2008-06682) is gratefully acknowledged.
Jaime Díaz Pacheco
Dir. Dr. Javier Gutiérrez Puebla
Dpto. de Geografía Humana
Universidad Complutense
II Jornadas de Geografía Humana
24 – 25 noviembre 2011
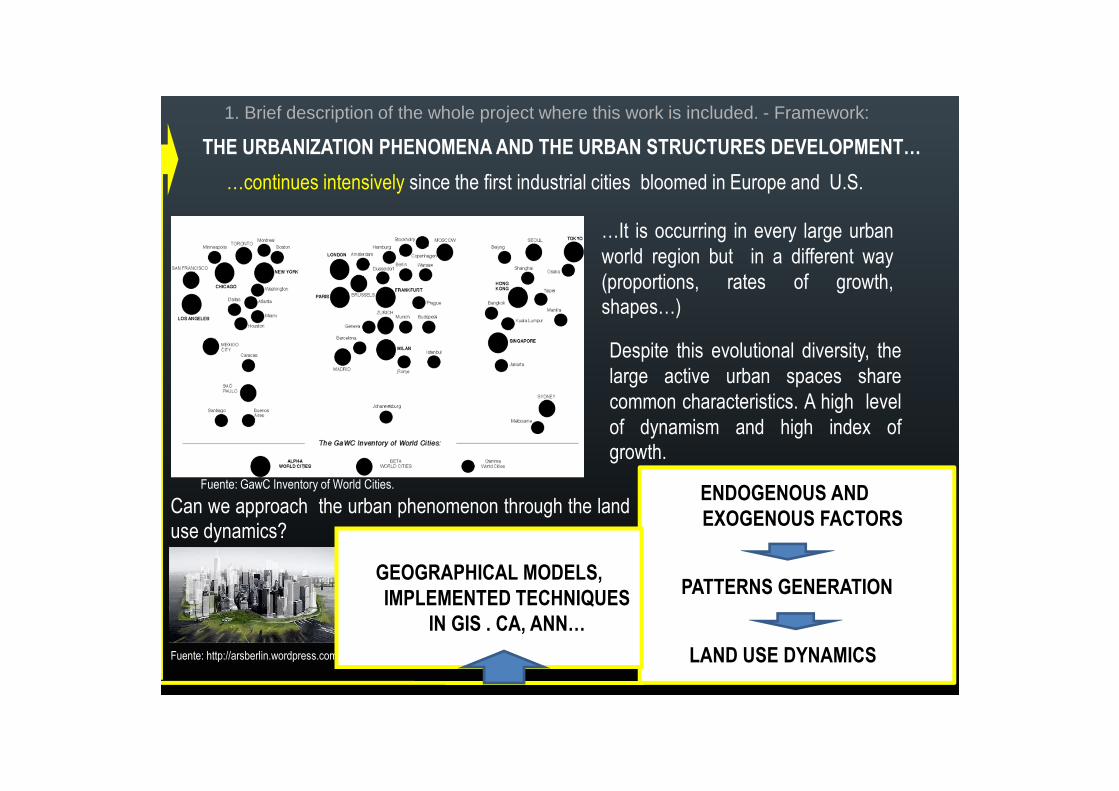
1. Brief description of the whole project where this work is included. - Framework:
COMPLEXITY OF THE HUMAN SOCIO-SPATIAL PHENOMENA.
CITIES ARE A DYNAMIC SELF ORGANIZING SYSTEM
…continues intensively since the first industrial cities bloomed in Europe and U.S.
…It is occurring in every large urbanworld region but in a different way(proportions, rates of growth,shapes…)
THE URBANIZATION PHENOMENAAND THE URBAN STRUCTURES DEVELOPMENT…
Despite this evolutional diversity, thelarge active urban spaces sharecommon characteristics. A high levelof dynamism and high index ofgrowth.
Fuente: GawC Inventory of World Cities. ENDOGENOUS AND EXOGENOUS FACTORS
PATTERNS GENERATION
LAND USE DYNAMICS
Can we approach the urban phenomenon through the landuse dynamics?
Are there factors which are inrelationship with urbantransformations? How are thesefactors contributing on the landuse dynamic in the cities?Fuente: http://arsberlin.wordpress.com/
GEOGRAPHICAL MODELS, IMPLEMENTED TECHNIQUES
IN GIS . CA, ANN…
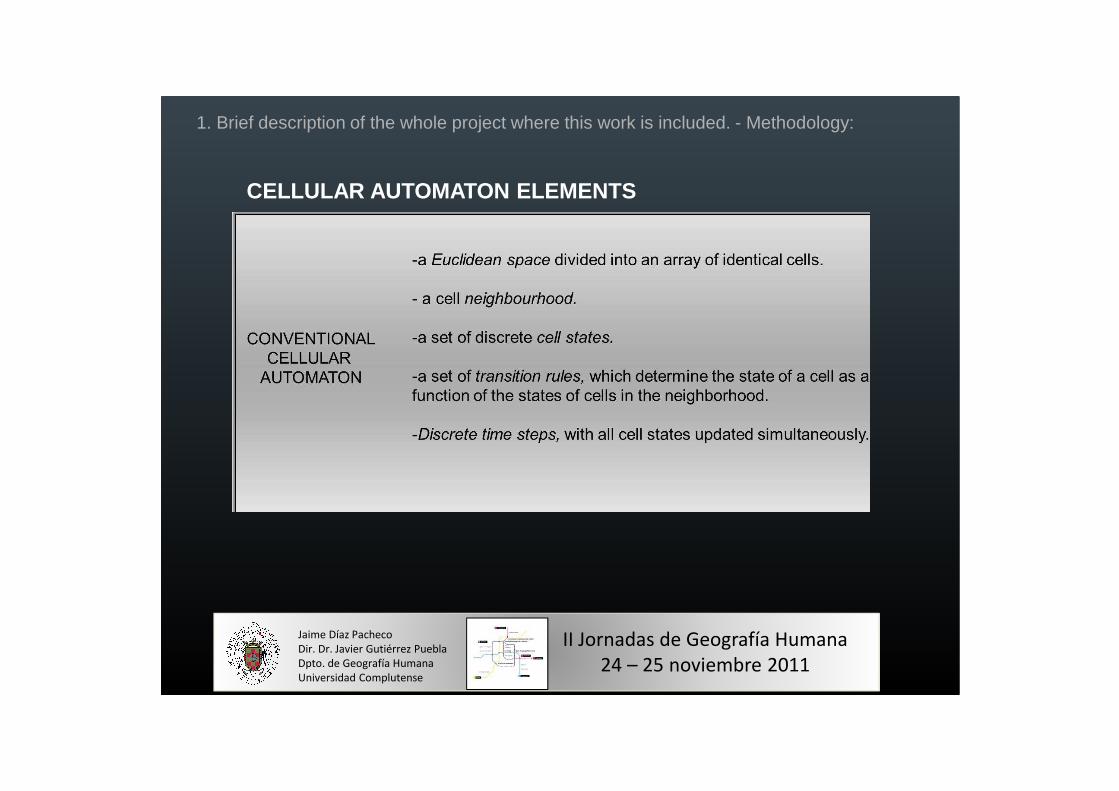
CELLULAR AUTOMATON ELEMENTS
1. Brief description of the whole project where this work is included. - Methodology:
Jaime Díaz Pacheco
Dpto. de Geografía Humana
Universidad Complutense
Jaime Díaz Pacheco
Dir. Dr. Javier Gutiérrez Puebla
Dpto. de Geografía Humana
Universidad Complutense
II Jornadas de Geografía Humana
24 – 25 noviembre 2011

LAND USECHANGE
BEHAVIOUR
LAND USE CHANGE DYNAMIC MODEL
POTENTIALTRANSITION
(RULES)
FUTURESCENARIOS
LAND USEDEMANDMODEL
MAP COMPARISON
CALIBRATION
Changing rules
Changing demand
LAND USE
Period t0 (2000)
LAND USE
Period t6 (2006)
Simulation
LAND USE
Period t6 (2006)
True
LAND USE
Period t6 (2006)
True
LAND USE
Period t9
(2009)
Simulation
LAND USE
Period t9
(2009)
VALIDATION
Where? How much?
Jaime Díaz Pacheco
Dir. Dr. Javier Gutiérrez Puebla
Dpto. de Geografía Humana
Universidad Complutense
II Jornadas de Geografía Humana
24 – 25 noviembre 2011
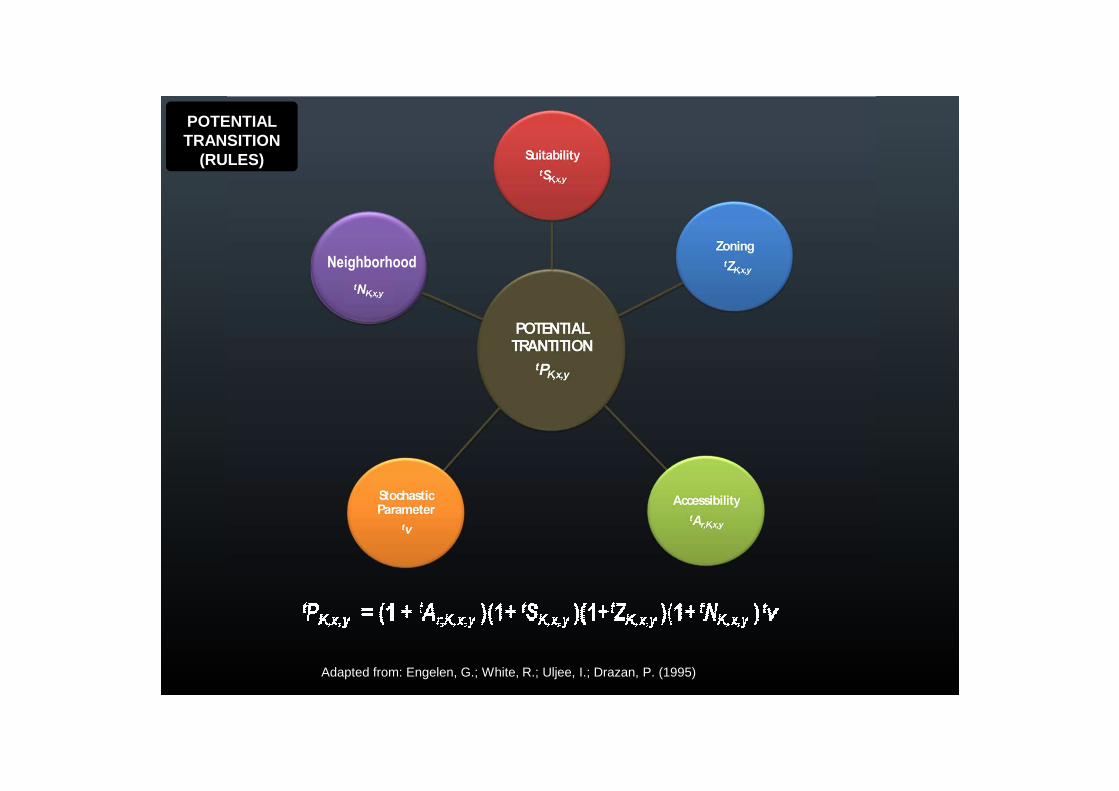
POTENTIAL TRANSITION
(RULES)
Adapted from: Engelen, G.; White, R.; Uljee, I.; Drazan, P. (1995)
Neighborhood

Years
Exploring the limitations of CORINE Land Cover for modeling urban land use change.
Jaime Díaz [email protected]
Dir. Dr. Javier Gutiérrez PueblaUniversidad Complutense. Departamento de Geografía Humana.
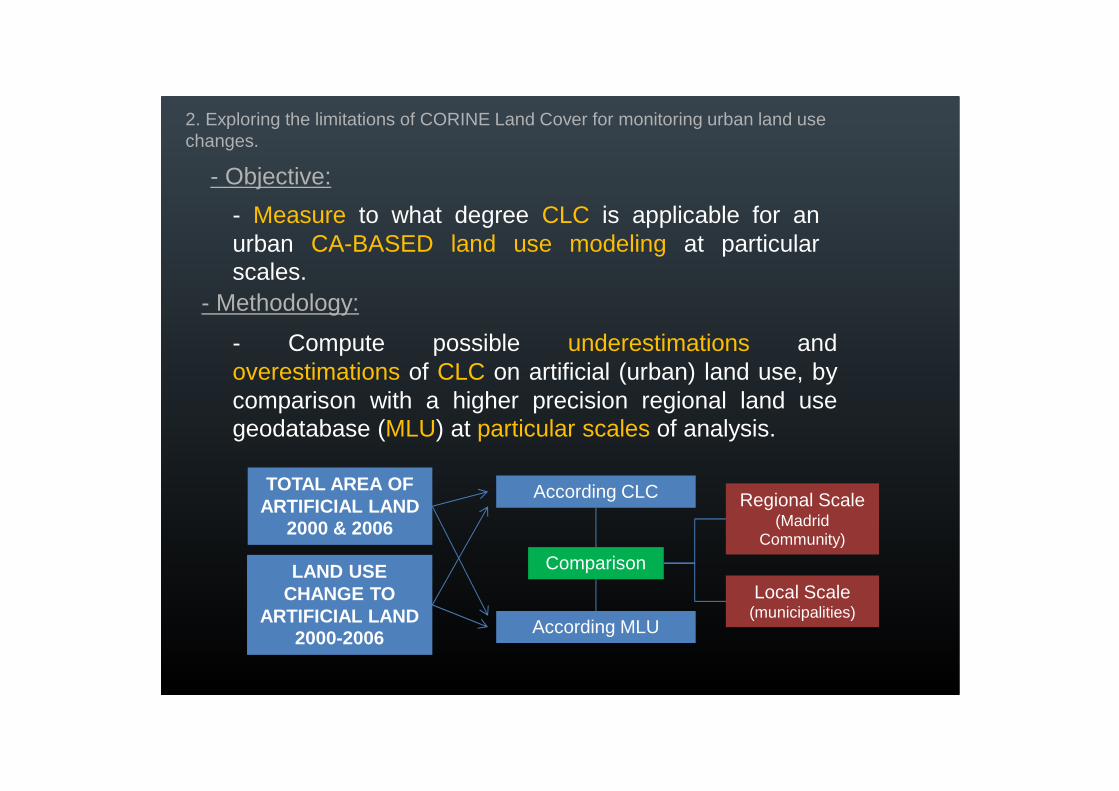
2. Exploring the limitations of CORINE Land Cover for monitoring urban land use changes.
- Measure to what degree CLC is applicable for anurban CA-BASED land use modeling at particularscales.
- Compute possible underestimations andoverestimations of CLC on artificial (urban) land use, bycomparison with a higher precision regional land usegeodatabase (MLU) at particular scales of analysis.
- Methodology:
LAND USE CHANGE TO
ARTIFICIAL LAND2000-2006
According CLC
According MLU
TOTAL AREA OF ARTIFICIAL LAND
2000 & 2006
Comparison
Regional Scale(Madrid
Community)
Local Scale(municipalities)
- Objective:
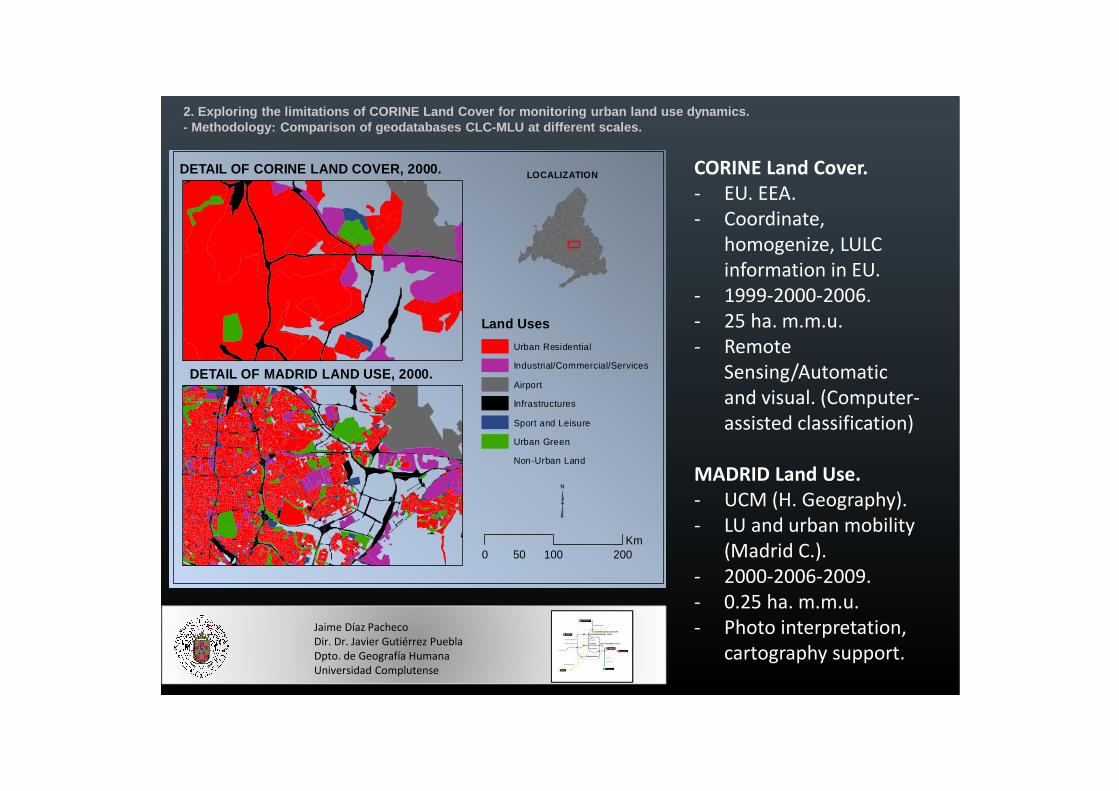
2. Exploring the limitations of CORINE Land Cover f or monitoring urban land use dynamics. - Methodology: Comparison of geodatabases CLC-MLU at different scales.
Land Uses
Urban Residential
Industrial/Commercial/Services
Airport
Infrastructures
Sport and Leisure
Urban Green
Non-Urban Land
0 100 20050Km
³
DETAIL OF CORINE LAND COVER, 2000.
DETAIL OF MADRID LAND USE, 2000.
LOCALIZATION CORINE Land Cover.
- EU. EEA.
- Coordinate,
homogenize, LULC
information in EU.
- 1999-2000-2006.
- 25 ha. m.m.u.
- Remote
Sensing/Automatic
and visual. (Computer-
assisted classification)
MADRID Land Use.
- UCM (H. Geography).
- LU and urban mobility
(Madrid C.).
- 2000-2006-2009.
- 0.25 ha. m.m.u.
- Photo interpretation,
cartography support.
Jaime Díaz Pacheco
Dir. Dr. Javier Gutiérrez Puebla
Dpto. de Geografía Humana
Universidad Complutense

0 20 4010Km
³
MADRID Land Use (2006) CORINE Land Cover (2006)
Airports
Sport and Leisure
Industrial/Commercial/Service
Road Network
Urban Residential
Urban Green
2. Exploring the limitations of CORINE Land Cover f or monitoring urban land use dynamics. - Methodology: Comparison of geodatabases CLC-MLU at different scales.
A NEW SET OF CATEGORIES TO ASSIMILATE CLC and MLU CLASSES.

COMPARISON OF ARTIFICIAL LAND USE COMPUTED BY CLC AND MLU AT REGIONAL SCALE.
Jaime Díaz Pacheco
Dpto. de Geografía Humana
Universidad Complutense
Jaime Díaz Pacheco
Dir. Dr. Javier Gutiérrez Puebla
Dpto. de Geografía Humana
Universidad Complutense
II Jornadas de Geografía Humana
24 – 25 noviembre 2011

2. Exploring the limitations of CORINE Land Cover f or monitoring urban land use dynamics. - Methodology: Comparison of geodatabases CLC-MLU at different scales.
ARTIFICIAL LAND USE EVOLUTION, 2000-2006. OVERESTIM ATIONS AND UNDERSTIMATIONS, CLC.
Jaime Díaz Pacheco
Dir. Dr. Javier Gutiérrez Puebla
Dpto. de Geografía Humana
Universidad Complutense
II Jornadas de Geografía Humana
24 – 25 noviembre 2011
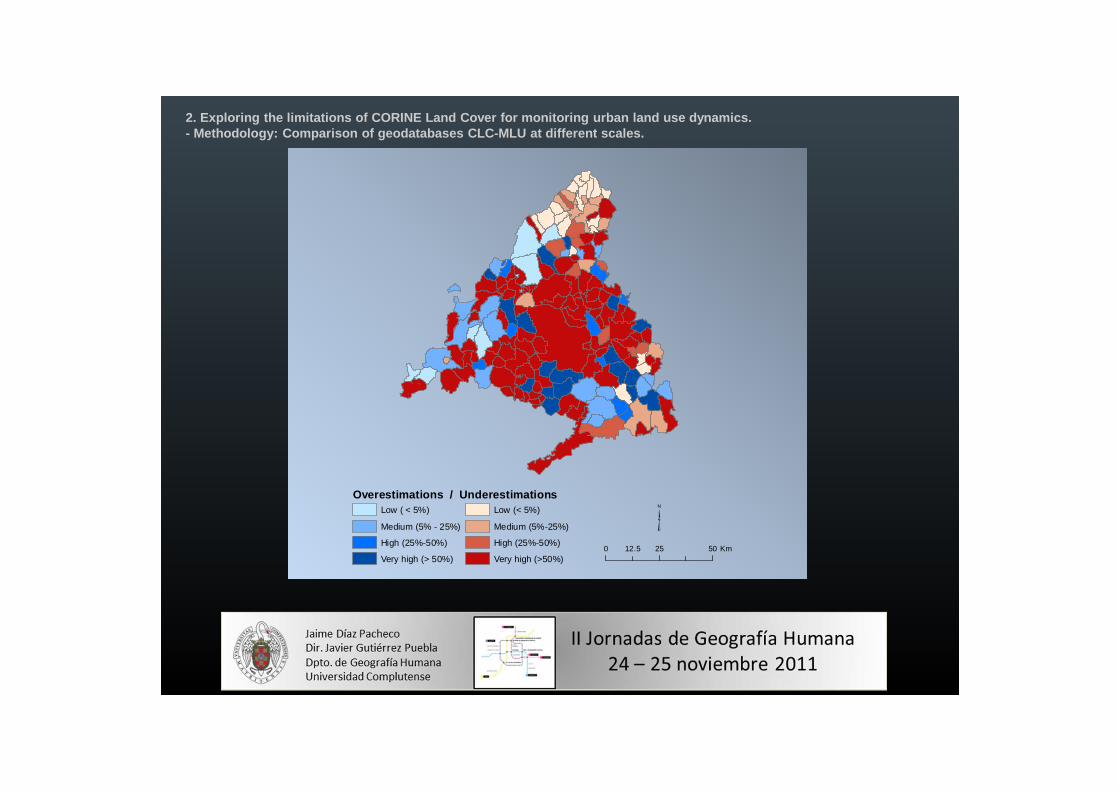
2. Exploring the limitations of CORINE Land Cover f or monitoring urban land use dynamics. - Methodology: Comparison of geodatabases CLC-MLU at different scales.
Overestimations / UnderestimationsLow ( < 5%)
Medium (5% - 25%)
High (25%-50%)
Very high (> 50%)
Low (< 5%)
Medium (5%-25%)
High (25%-50%)
Very high (>50%)
³0 25 5012.5 Km

2. Exploring the limitations of CORINE Land Cover f or monitoring urban land use dynamics. - Methodology: Comparison of geodatabases CLC-MLU at different scales.
Underestimations Overestimations
Underestimations
n: 128
X: 55.25
s : 83.46
Max: 495.84
Min: 0.18
Overestimations
n: 51
X: 36.42
s : 35.79
Max: 168.33
Min: 2.02
Jaime Díaz Pacheco
Dir. Dr. Javier Gutiérrez Puebla
Dpto. de Geografía Humana
Universidad Complutense
II Jornadas de Geografía Humana
24 – 25 noviembre 2011

2. Exploring the limitations of CORINE Land Cover f or monitoring urban land use dynamics. - Methodology: Comparison of geodatabases CLC-MLU at different scales
EXAMPLES: AREAS CLASSIFIED AS SPORT AND LEISURE CAT HEGORY, WHICH HAVE OTHER USE
Jaime Díaz Pacheco
Dir. Dr. Javier Gutiérrez Puebla
Dpto. de Geografía Humana
Universidad Complutense
II Jornadas de Geografía Humana
24 – 25 noviembre 2011
0 100 20050Km ³
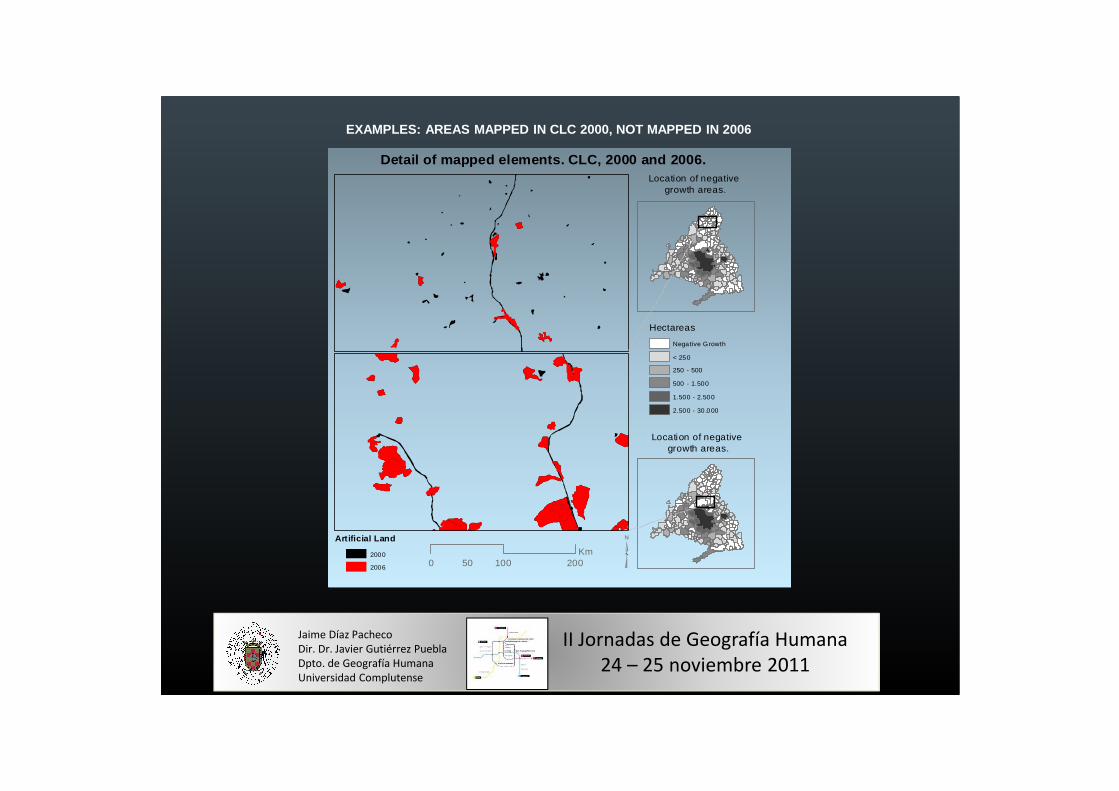
Detail of mapped elements. CLC, 2000 and 2006.
Artificial Land
2000
2006
Hectareas
Negative Growth
< 250
250 - 500
500 - 1.500
1.500 - 2.500
2.500 - 30.000
Location of negative growth areas.
Location of negative growth areas.
EXAMPLES: AREAS MAPPED IN CLC 2000, NOT MAPPED IN 2 006
Jaime Díaz Pacheco
Dir. Dr. Javier Gutiérrez Puebla
Dpto. de Geografía Humana
Universidad Complutense
II Jornadas de Geografía Humana
24 – 25 noviembre 2011

3. CONCLUSIONS.
- This work has tried to explore the coherence of CORINE land co ver and its capacity toserve as input land use geodatabase for modeling urban land u se change.
- CORINE land cover may be useful to work at small scales (coars e resolution) forassessing urban land use change, but it is not so suitable to w ork at scales greater (finerresolution) than 1:100,000. It is necessary to be aware of th is limitation of CLC for urbanmodeling.
- Recently in the EU a new LULC geodatabase a a larger scale (0.2 5 ha. m.m.u.) isavailable for large cities (urban regions), nonetheless th ere is still only one time periodgeotabase (2010 for Madrid).
- The measurements of artificial land use do not show a high dif ference in quantity of landuse computed between CLC and MLU for 2000 and 2006 (static met hod), nonetheless ifthe evolution of artificial land uses between 2000-2006 is c omputed, there is a markedincrease in the difference between CLC and MLU.
- The overestimations and underestimations of CLC over MLU in crease as we increase thescale of analysis (regional-municipal). In other words the error degree tends to increasewith the scale.
- Certainly the land use classes behavior is not the same for ev ery category. There areextreme cases as the evolution of road network according CLC . In fact if we analyze thedata we find decrease rather than increase for these categor ies between 2000-2006. Thiskind of problem makes results from CLC incoherent.
Jaime Díaz Pacheco
Dir. Dr. Javier Gutiérrez Puebla
Dpto. de Geografía Humana
Universidad Complutense
II Jornadas de Geografía Humana
24 – 25 noviembre 2011

Thank you!Gracias!