Embed Size (px)
Citation preview

NASE Publications Solar Spectrum and Sunspots
Solar Spectrum and Sunspots
Alexandre Costa, Beatriz García, Ricardo MorenoInternational Astronomical Union, Escola Secundária de Loulé (Portugal), National Technological University (Mendoza, Argentina), Retamar School (Madrid, Spain)
Summary
This workshop includes a theoretical approach to the spectrum of sunlight that can be used in high school. The activities are appropriate for primary and secondary levels.
The Sun is the main source of almost all wavelengths of radiation. However, our atmosphere has high absorption of several non-visible wavelengths so we will only consider experiments related to the visible spectrum, which is the part of the spectrum that is present in the daily lives of students. For the activities in non-visible wavelengths, see the corresponding workshop.
First we will present the theoretical background followed by experimental demonstrations of all the concepts developed. These activities are simple experiments that teachers can reproduce in the classroom, introducing topics such as polarization, extinction, blackbody radiation, the continuous spectrum, the emission spectrum, the absorption spectrum (eg sunlight) and Fraunhofer lines.
We also discuss differences between the areas of regular solar output and the emission of sunspots. Additionally, we mention the evidence of solar rotation and how this concept can be used for school projects.
Goals- To understand what the Sun's spectrum is.- Understand the spectrum of sunlight.- Understand what sunspots are.- Understand the historical significance of sunspots and of Galileo's work on the rotation of the Sun.- Understand some characterstics of the light such as polarization, dispersion, etc
Solar Radiation
Solar energy is created inside the Sun in a region called the core where the temperature reaches 15 million degrees and the pressure is very high. The conditions of pressure and temperature in the core usually allow nuclear reactions to occur. In the main nuclear reaction that occurs in the core of the Sun, four protons (hydrogen nuclei) are transformed into alpha particles (helium nuclei) and generate two positrons, two neutrinos and two gamma photons according to the equation:

NASE Publications Solar Spectrum and Sunspots
1 41 24 H He 2 2 2e
The resulting mass is less than that of the four protons added together. The mass that is lost, according to the following equation discovered by Einstein, is transformed into energy:
NASE Publications Solar Spectrum and Sunspots
2E mc
Every second 600 million tons of hydrogen are transformed into helium, but there is a loss of 4 to 5 million tons which is converted into energy. While this may seem a very large loss, the Sun's mass is such that it can work like this for billions of years. The energy produced in the core will follow a long journey to reach the surface of the Sun.
The energy produced in the interior of the Sun will follow a long route to reach the Sun's surface.
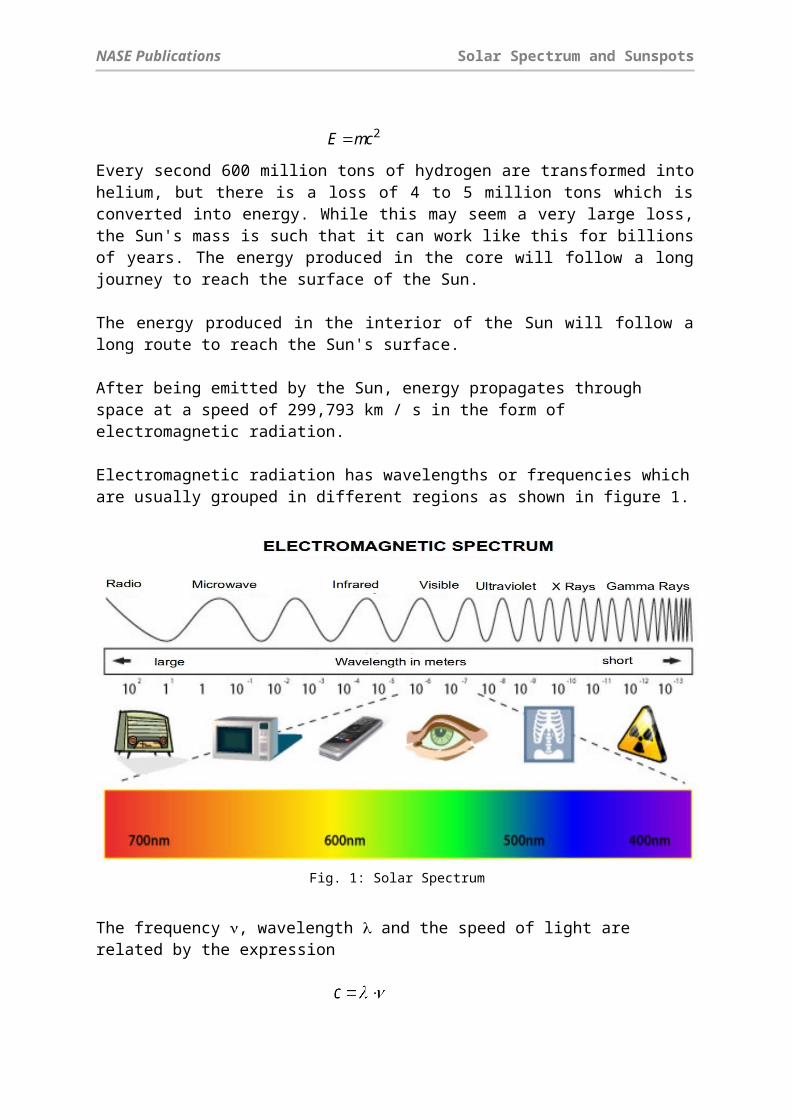
After being emitted by the Sun, energy propagates through space at a speed of 299,793 km / s in the form of electromagnetic radiation. Electromagnetic radiation has wavelengths or frequencies which are usually grouped in different regions as shown in figure 1.
Fig. 1: Solar Spectrum
The frequency , wavelength and the speed of light are related by the expression
Although the Sun is a major source of many wavelengths of light, we'll make most of our approach to solar radiation using the visible spectrum. Except for radio frequencies and small bands in the infrared or ultraviolet, wavelengths of visible light are those to which our atmosphere is transparent (figure 3) and we do not need sophisticated equipment to view them. Therefore, they are the best for experimentation in the classroom.
Polarization of Light

NASE Publications Solar Spectrum and Sunspots
Perfect electromagnetic radiation, linearly polarized, has a profile like that shown in figure 2.
Fig. 2: Polarized light.
Sunlight has no privileged direction of vibration, but can be polarized when reflected under a determined angle, or if it passes through certain filters called polarizers.
The light passing through one of these filters (figure 3), vibrates only in one plane. If you add a second filter, two things can happen: when the two filters have parallel polarization orientation, light passes through both of them (figure 4a), but if they have perpendicular polarization, light passing through the first filter is blocked by second one (figure 3) and the filters become opaque (figure 4b).
Fig. 3: When two filters have a perpendicular transmition orientation, the light which passes through the first is blocked by the second.

NASE Publications Solar Spectrum and Sunspots
Fig. 4a: If the filters have the same orientation, light passes through.
Fig. 4b: If one of the filters is turned 90º, light is blocked.
Many sunglasses are polarized to filter reflected light, abundant in the snow or on the sea, which is usually polarized (figures 5a and 5b). Polarizing filters are also used in photography, and with them reflections are eliminated and the sky appears darker.
Fig. 5a and 5b: Reflected light, photographed with and without a polarizing filter.
Most 3D cinema systems record the film with two cameras, separated by the distance between human eyes. Then, in cinemas, they are shown with two projectors using polarized light in perpendicular directions. Viewers wear special glasses that have various polarizing filters with perpendicular directions. This means that each eye sees only one of the two images, and the viewer sees the images in 3D.
Activity 1: Polarization of LightIn order to make polarizing filters, cut the bridge of the nose of colorless 3D glasses to create two pieces (green / red glasses cannot be used in this activity) so you can do the activity in figures 4a and 4b. You can also take two pairs of sunglasses or 3D glasses and orient them to show the polarization so that you don't have to break them into two pieces.
Many sunglasses have polarization to filter the light and LCD computer screens and televisions (not plasma) emit light that is polarized. You can check both by looking at the screen of a laptop with sunglasses on and turning your head: if they are polarized, viewing at a specific angle will make the screen black.

NASE Publications Solar Spectrum and Sunspots
There are some plastics and glasses that will affect polarized light passed through it, according to their thickness and composition. If you look at them with polarized sunglasses, you will see different colored light.
Fig. 6: The light from the TFT screen of a computer is polarized, and the tape rotates the polarization angle. Colors are seen when viewed with polarized sunglasses.
Stick several strips of tape on a piece of glass (such as from a photo frame) so that in some areas three layers of tape overlap each other, in other areas two pieces overlap and in other areas there is only one piece (figure 6). On a television or computer with LCD screen, display an image that has white as the main color, for example, a blank document in a word processor. Place the glass in front of the screen and look with polarized sunglasses. If you turn the glass, you will see the tape appear different colors. Instead of glass you can use a clear plastic CD case. You will see the points where more tension concentrated in the plastic. If you bend the plastic, you will see color changes in the plastic when viewed with the polarized light and filters.
The Structure of the Sun at a Glance
The Sun has a structure that can be divided into five main parts:
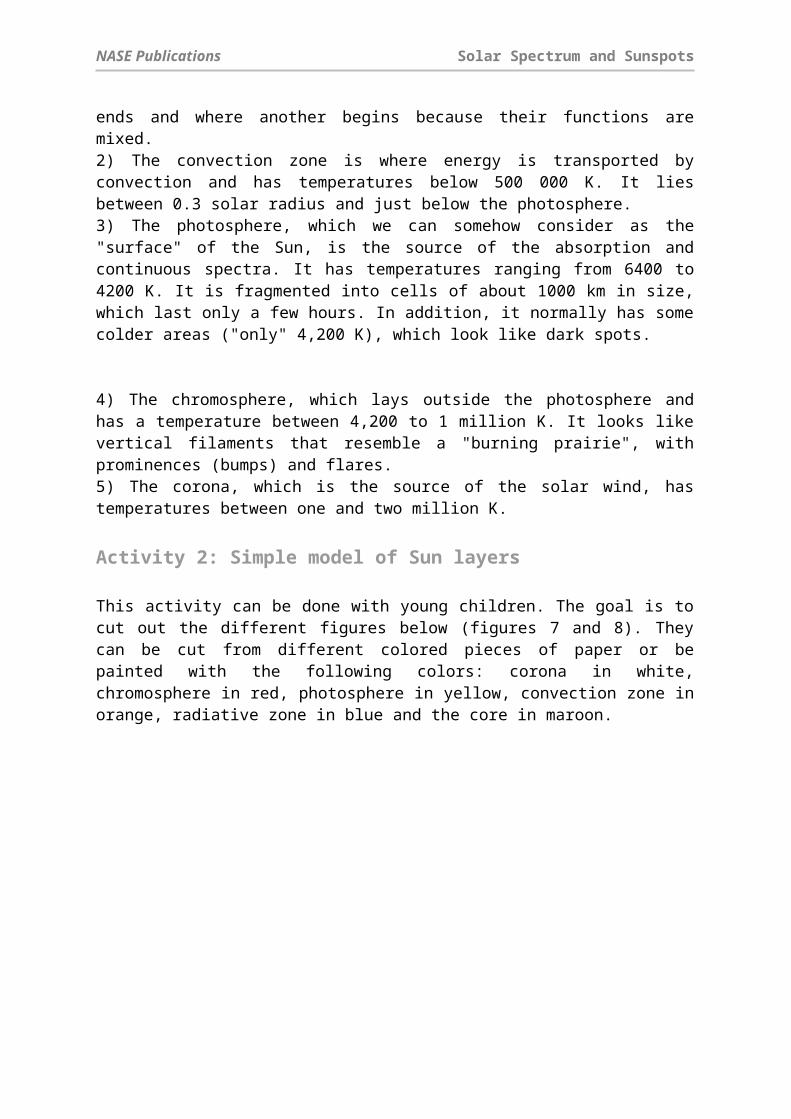
1) The core and the radiative zone are the areas where the thermonuclear fusion reactions are produced. Temperatures inside the core are 15 million Kelvin (K) and a bit lower in the radiative zone, which are about 8,000,000 K. Energy is transferred by radiation through the region closest to the core. They could be considered two distinct regions (the core and radiative zone) but it is very difficult to tell where one ends and where another begins because their functions are mixed.2) The convection zone is where energy is transported by convection and has temperatures below 500 000 K. It lies between 0.3 solar radius and just below the photosphere.3) The photosphere, which we can somehow consider as the "surface" of the Sun, is the source of the absorption and continuous spectra. It has temperatures ranging from 6400 to 4200 K. It is fragmented into cells of about 1000 km in size, which last only a few hours. In addition, it normally has some colder areas ("only" 4,200 K), which look like dark spots.

NASE Publications Solar Spectrum and Sunspots
4) The chromosphere, which lays outside the photosphere and has a temperature between 4,200 to 1 million K. It looks like vertical filaments that resemble a "burning prairie", with prominences (bumps) and flares.5) The corona, which is the source of the solar wind, has temperatures between one and two million K.
Activity 2: Simple model of Sun layers
This activity can be done with young children. The goal is to cut out the different figures below (figures 7 and 8). They can be cut from different colored pieces of paper or be painted with the following colors: corona in white, chromosphere in red, photosphere in yellow, convection zone in orange, radiative zone in blue and the core in maroon.
Fig. 7: Sun's parts to cut out.
NASE Publications Solar Spectrum and Sunspots
Fig. 8: Corona to cut out.
Finally you can paste one above each other, in the right order (the size of each piece also indicates the order).
Sunspots
Frequently, dark spots, called sunspots, are observed in the photosphere. A sunspot typically consists of a dark central region called the umbra, surrounded by an area of bright and dark filaments which radiate out from the umbra.
The filaments of sunspots are surrounded by the typical granules of the photosphere (figure 9).

NASE Publications Solar Spectrum and Sunspots
Fig. 9: Close-up of a sunspot. (Photo: Vacuum Tower Telescope, NSO, NOAO)
The spots appear black with a small telescope, but that is only a contrast effect. If you could observe the spot in isolation, it would actually be brighter than the full moon. The difference in intensity of the spots is because the spot’s temperature is 500 to 2,000° C lower than the surrounding photosphere. Sunspots are the result of the interaction of strong vertical magnetic fields with the photosphere.
Sunspots have a great historical importance as they allowed Galileo Galilei to determine the Sun's rotation period and verify that its rotation was differential, i.e., spinning faster at the equator (rotation period 25.05 days) than at the poles (34.3 days rotational period).
Activity 3: Determination of the rotation period of the Sun
A simple experiment you can perform in the classroom is to measure the period of solar rotation using sunspots. In this experiment, you must keep track of sunspots for several days in order to measure the Sun’s rotation. The solar observations should always be done by projection through a telescope (figure 10a), or binoculars (figure 10b). We can never stress enough that one should never look at the Sun directly and even less so with binoculars or telescopes, since it can cause permanent damage to the eyes.
Fig. 10a: Solar observation by projection with a telescope (never look directly at the Sun).
Fig. 10b: Observation by projection with binoculars (never look directly at the Sun).
Remember you should never look directly at the sun with the unaided eye, binoculars or telescopes because it can cause irreparable damage to the eyes.

NASE Publications Solar Spectrum and Sunspots
If you observe sunspots for several days, the movement of a spot will look like the example in figure 11.
Day 1 Day 4 Day 6 Day 8
Fig. 11: Change of position of a sunspot over several days.
Superimpose the observations on a transparency as shown in figure 12. The period may then be calculated simply through a simple proportion:
Where t indicates the time interval between two observations of the same sunspot, is the central angle between the displacement of the two spots considered (figure 12) and P is the solar rotation period we want calculate. This calculation gives a good level of accuracy.
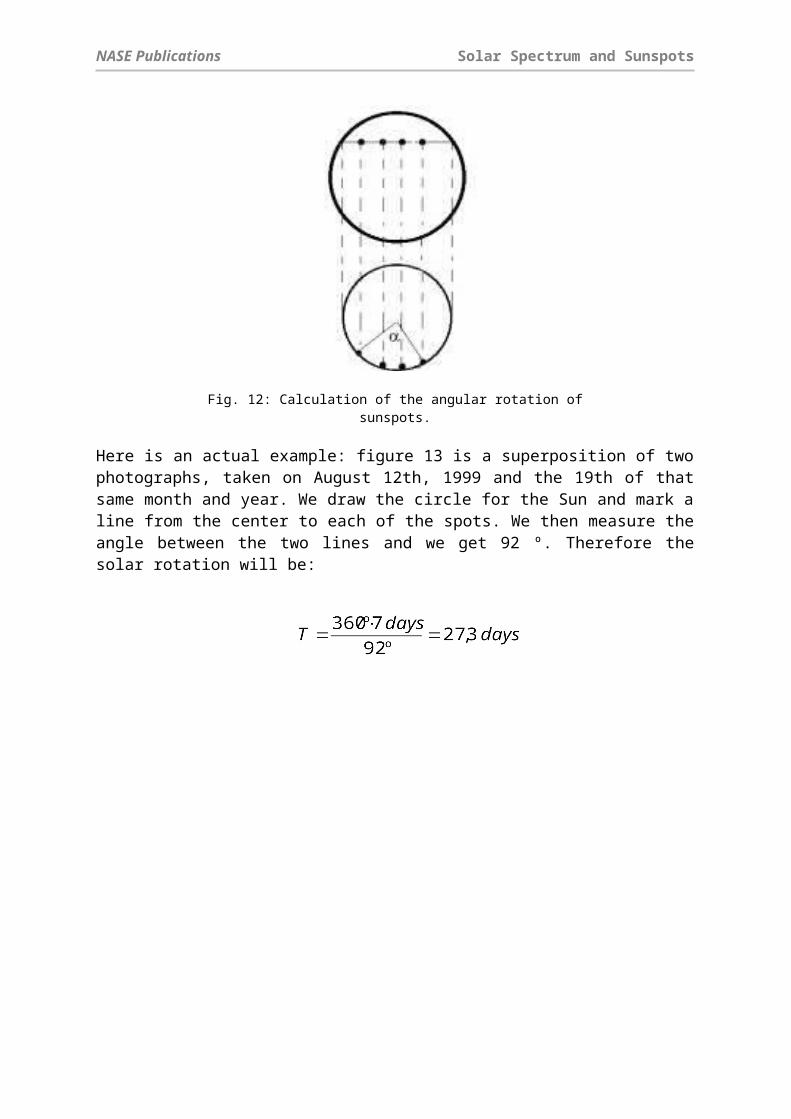
Fig. 12: Calculation of the angular rotation of sunspots.
Here is an actual example: figure 13 is a superposition of two photographs, taken on August 12th, 1999 and the 19th of that same month and year. We draw the circle for the Sun and mark a line from the center to each of the spots. We then measure the angle between the two lines and we get 92 º. Therefore the solar rotation will be:

NASE Publications Solar Spectrum and Sunspots
Fig. 13: Determination of solar rotation period.
The radiation coming from the Sun
The Sun is a large nuclear reactor where huge amounts of energy are continuously produced and transported to the surface in the form of photons. Photons are the particles responsible for electromagnetic radiation and the amount of energy they carried can be calculated by the expression
where E is the photon energy, h is Planck's constant ( ) and the frequency of electromagnetic radiation associated with the photon. The photons generated by the Sun are responsible for its spectrum.
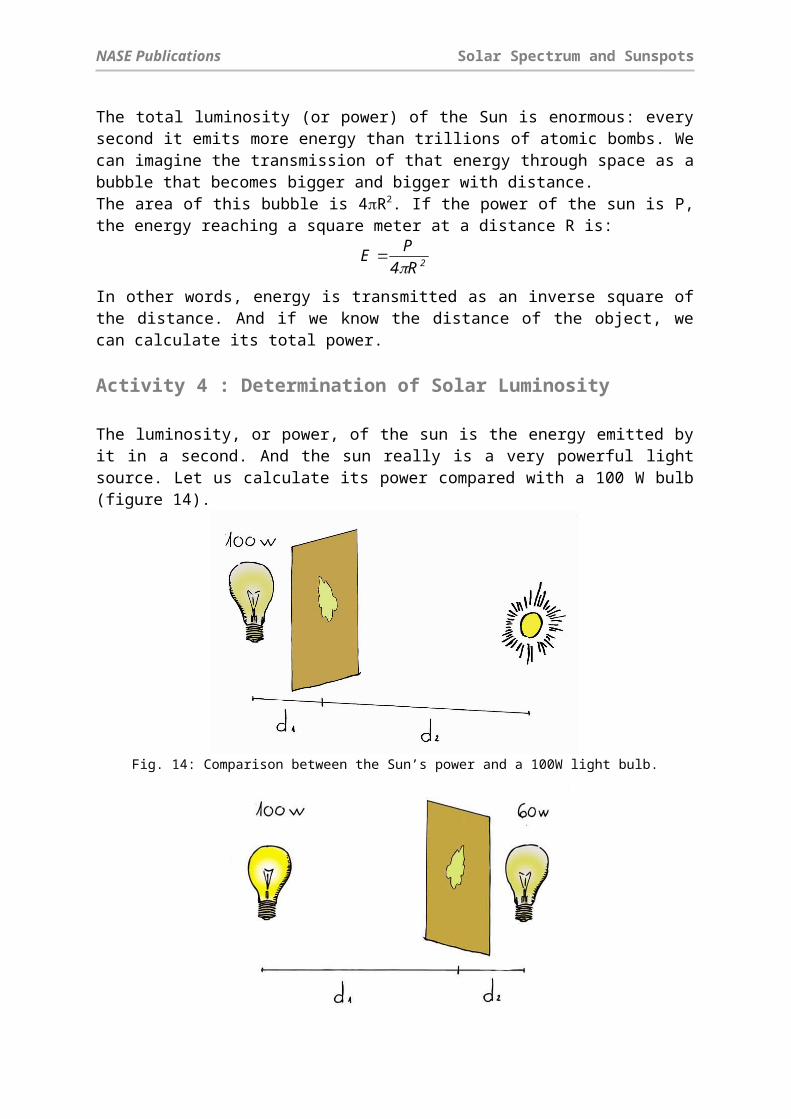
The total luminosity (or power) of the Sun is enormous: every second it emits more energy than trillions of atomic bombs. We can imagine the transmission of that energy through space as a bubble that becomes bigger and bigger with distance.The area of this bubble is 4R2. If the power of the sun is P, the energy reaching a square meter at a distance R is:
2R4PE

NASE Publications Solar Spectrum and Sunspots
In other words, energy is transmitted as an inverse square of the distance. And if we know the distance of the object, we can calculate its total power.
Activity 4 : Determination of Solar Luminosity
The luminosity, or power, of the sun is the energy emitted by it in a second. And the sun really is a very powerful light source. Let us calculate its power compared with a 100 W bulb (figure 14).
Fig. 14: Comparison between the Sun’s power and a 100W light bulb.
Fig. 15: If the light that reaches each side is the same, the oil slick is not seen.
We can build a photometer that will allow us to compare the brightness of two light sources. To do this, put a couple of drops of oil in the middle of a sheet of wrapping paper (plain white paper will work too). The stain that forms makes the paper a bit transparent and this will be our photometer. By putting it between two light sources (figures 14 to 16), the distance can be adjusted until we cannot see the stain. Aligned this way, the lighting on either side of the paper and the energy arriving at each side is equal.
In this case:
NASE Publications Solar Spectrum and Sunspots
Fig. 16: Oil slick photometer, between two light bulbs.
On a sunny day, take the photometer outdoors with a light bulb of at least 100 W (brighter is better). Put the photomemeter between the sun and the light bulb at a distance such that the two sides of the photometer appear equally bright. Measured the distance d1, in meters, from the photometer to the filament of the light bulb.
Knowing that the distance from the Sun to Earth is approximately d2 = 150,000,000 km, we can calculate the power of the Sun P with the inverse square law (the term 4 is cancelled out because it is on both sides of the equation):
The result should be close to the actual luminosity of the Sun, which is 3.83·1026 W.
Opacity
The energy associated with a high energy photon produced in the Sun's core will take up to 1 million years to reach the photosphere, since it is produced in the innermost parts of the Sun where photons interact with very dense matter. The interactions between the photons and the matter occur in great numbers in the core but decrease as they approach the photosphere. The photons take a zig-zag (figure 17) path from the core to the outer parts of the Sun, which can take thousands of years.

NASE Publications Solar Spectrum and Sunspots
Fig. 17: Photons take 1 million years to leave the photosphere.
When radiation reaches the photosphere, and therefore the sun's atmosphere, it is radiated outward with almost no interactions and in most wavelengths, creating the continuous spectrum we see from the photosphere. That's because the core and the sun's interior is opaque to all wavelengths of radiation and its atmosphere is transparent. In astronomy, the concepts of opaque and transparent are somewhat different from everyday use.
A gas can be transparent or opaque depending on how it absorbs or scatters the photons that pass through it. For example, our atmosphere is transparent to visible wavelengths. However, on a foggy day we cannot see much, so it is opaque.
It should be pointed out that transparent does not mean invisible. A flame of a burner or candle is transparent to the wavelengths of an overhead projector.
Activity 5: Transparency and opacity
You can show these concepts using a burner or a candle (the burner is better than the candle because the candle will sometimes produce opaque black smoke due to incomplete combustion, which will be seen coming out of the candle flame).
The demonstration is very simple. Put transparent and opaque objects in the light projected onto a wall or screen by an overhead projector and ask if it is transparent or opaque. For common objects, most people will know the answer for the objects.
The flame of a candle, a Bunsen burner or a lighter is also transparent and it is surprising for students to see that the flame produces no shadow on the wall (figure 11). You can explain that this is like the Sun’s photosphere, which is nearly transparent to any radiation.
NASE Publications Solar Spectrum and Sunspots
Fig. 18a y 18b: Alcohol lamp or candle flames do not produce a shadow on the wall. Observe that the glass is not completely transparent.
Spectra
In 1701, Newton used a prism for the first time to break sunlight into its component colors. Any light can be dispersed with a prism or a diffraction grating, and what you get is its spectrum. Spectra can be explained by the three laws that Gustav Kirchhoff and Robert Bunsen discovered in the nineteenth century. The three laws are represented in figure 19.
Fig. 19: Laws of Kirchhoff and Bunsen.
1st Law - An incandescent solid object produces light in a continuous spectrum. 2nd Law - A hot tenuous gas produces light with spectral lines at discrete
wavelengths depending on the chemical composition of the gas (emission spectrum). 3rd Law - An incandescent solid object surrounded by a low pressure gas produces a
continuous spectrum with gaps at discrete wavelengths whose positions depend on the chemical composition of the gas, and coincide with those of the 2nd Law (absorption spectrum).

NASE Publications Solar Spectrum and Sunspots
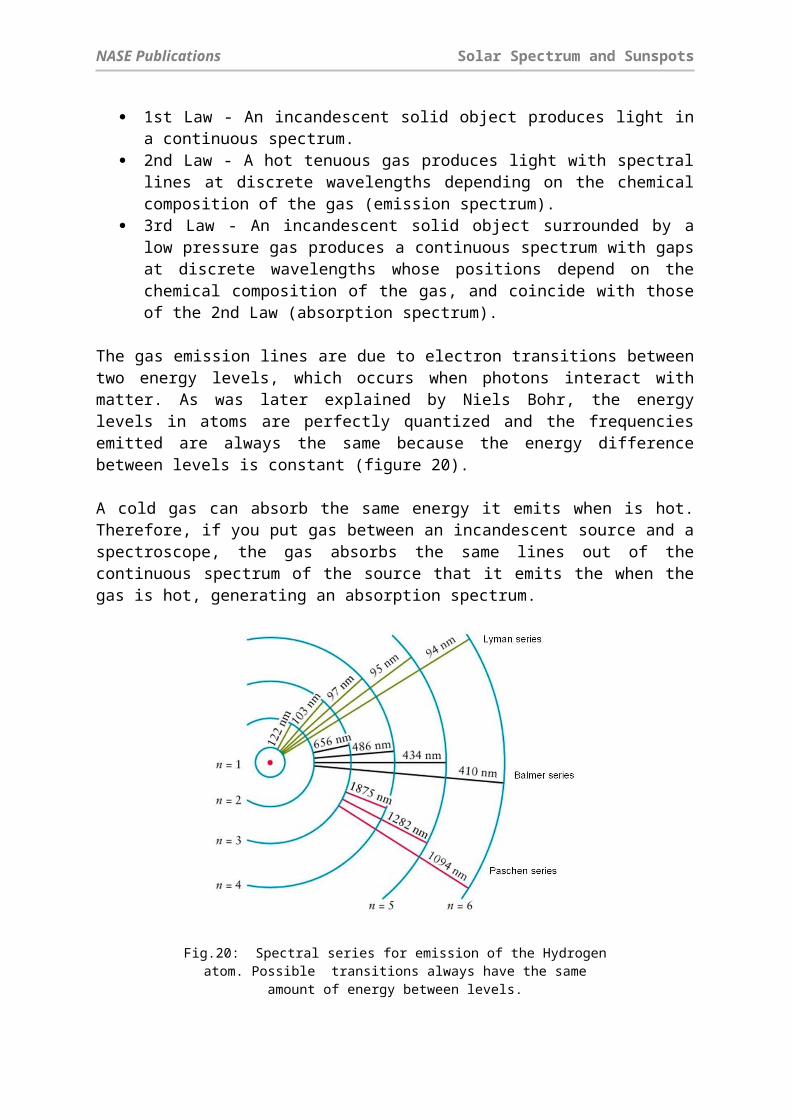
The gas emission lines are due to electron transitions between two energy levels, which occurs when photons interact with matter. As was later explained by Niels Bohr, the energy levels in atoms are perfectly quantized and the frequencies emitted are always the same because the energy difference between levels is constant (figure 20).
A cold gas can absorb the same energy it emits when is hot. Therefore, if you put gas between an incandescent source and a spectroscope, the gas absorbs the same lines out of the continuous spectrum of the source that it emits the when the gas is hot, generating an absorption spectrum.
Fig.20: Spectral series for emission of the Hydrogen atom. Possible transitions always have the same amount of energy between levels.
This is what happens in the atmosphere of the Sun. The chemical elements contained in the gas of the solar atmosphere absorb the frequencies associated with the spectral lines of these elements. This fact was verified by Joseph Fraunhofer in 1814, thus the sun's spectral lines are called Fraunhofer lines and are listed in the table below, according to the original designations by Fraunhofer (1817) of letters to the absorption lines in the solar spectrum.
Letter Wavelength (nm) Chemical Origin Color rangeA 7593,7 O2 atmospheric dark redB 6867,2 O2 atmospherico redC 6562,8 Hidrogen alpha redD1 5895,9 Neutral Sodiumo oranged-redD2 5890,0 Neutral Sodium yellowE 5269,6 Neutra Iron greenF 4861,3 H beta cyianG 4314,2 CH molecular blueH 3968,5 Ionized Calcium dark violetK 3933,7 Ionized Calcium dark violet
Table 1: Fraunhofer’ s lines for the Sun.

NASE Publications Solar Spectrum and Sunspots
It is important to realize that by analyzing the light coming from the sun or a star, we know what it is made of without having to go there. Today spectra are taken with high resolution instruments to detect many lines .
Blackbody Radiation
When a metal is heated sufficiently, it becomes red. In a dark place, the metal becomes visible at a temperature of 400 °C. If the temperature continues rising, the color of the metal turns orange, yellow and even becomes blue after passing through the emission of white light at about 10,000 ° C. An opaque body metal or not, will radiate with these characteristics.
When a blackbody (an idealized object which does not reflect light) is heated, it emits radiation in many wavelengths. If we measure the intensity of that radiation at each wavelength, it can be represented by a curve called Planck curve. In figure 21, the curves are shown for for a variety of blackbody temperatures. The curve has a peak at a certain wavelength, which gives us the object's the dominant color. That max is related to the body's temperature according to Wien's Law:
where T is the temperature of the body. Note that because of this law, by studying the radiation that comes to us from a distant object, we can know its temperature with no need to go there and measure it directly.
Fig. 21: Planck curves for black bodies at different temperatures.
Examples of astronomical objects that can be called opaque blackbodies are the stars (except for its atmosphere and corona), planets, asteroids or radiation from the cosmic microwave background.
Wien's Law is a general law for the thermal emission of opaque bodies. For example, the human body radiates in the infrared region with a maximum emission at a wavelength of 9.4 m, as Wien’s law says (usign a temperature of 37 º C (= 310 K)). So the military uses devices for night observation in these wavelengths.
Returning to the Sun, since the atmosphere is transparent, blackbody radiation is determined by the temperature at the photosphere, where the sun becomes transparent (about 5800 K) so

NASE Publications Solar Spectrum and Sunspots
its blackbody radiation should not exceed a wavelength around 500 nm, as shown in figure 22.
Fig. 22: Emission curve for the “continuous spectrum” of the Sun.
Our atmosphere absorbs infrared and ultraviolet radiation. Interestingly, the human eye has evolved to see just the visible portion of sunlight that reaches the Earth's surface.
Scattering of sunlightWhen a beam of white light passes through a gas containing particles larger than the light's wavelength, the light does not spread and all wavelengths are scattered. This occurs when sunlight passes through a cloud containing small droplets of water: it looks white. The same thing happens when light passes through grains of salt or sugar.
But if the light is scattered by particles of similar size to the wavelength (color) of the photons, those photons are dispersed but not the rest. This is called Rayleigh scattering.
In our atmosphere, blue light scatters more than red light, and photons reach us from all directions. This causes us to see the sky blue (figure 23) instead of black, as seen in space. At dusk, the light passes through much more of the atmosphere and contains less blue light so it appears more yellow. Sunsets also disperse red photons.
This is also the reason that when light passes through large thicknesses of gas (e.g. nebulae) it is red (because blue is going to scatter in all directions and only red is going to come in full intensity to the observer). This is the Rayleigh dispersion.
DayDay

NASE Publications Solar Spectrum and Sunspots
Fig. 23: The color of the sky depends on the Rayleigh scattering.
Activity 6: Extinction and scattering
This experiment is done with an overhead projector (or any other intese light source), a dilute solution of milk, a piece of black cardboard and a tall glass. Prepare a solution of milk of about 1 drop of milk in 50 ml of water (that's the most important thing, you need to test the concentration of the solution before class).
Cut a circle in the black cardboard with the shape and size of the glass bottom. Put the empty glass on the open circle and turn on the projector (figure 24a). The light reaching the wall will be white.
Fig. 24a: At the begining, the light
reaching the wall is white.Fig. 24b: With a bit of solution, the
light will be yellow.Fig. 24c: When the glass is full, the
light reaching the wall is red
NASE Publications Solar Spectrum and Sunspots
Fill the glass with the dilute milk solution. The light reaching the wall is increasingly red (figures 24b and 24c). The sides of the glass show bluish-white light.
Bibliography Broman, L, Estalella, R, Ros, R.M. Experimentos en Astronomía.Editorial
Alhambra Longman S.A., Madrid, 1993. Costa, A, Sunlight Spectra, 3rd EAAE Summer School Proceedings, Ed. Rosa Ros,
Briey, 1999. Costa, A, Simple Experiments with the Sun, 6th International Conference on
Teaching Astronomy Proceedings, Ed. Rosa Ros, Vilanova i la Geltrú, Barcelona, 1999.
Dale,A.O., Carrol,B.W, Modern Stellar Astrophysics, Addison-Wesley Publ. Comp., E.U.A, 1996.
Ferreira,M., Almeida,G, Introdução à Astronomia e às Observações Astronómicas, Plátano Ed. Téc., Lisboa, 1996.
Johnson,P.E., Canterna,R, Laboratory Experiments For Astronomy, Saunders College Publishing, Nova Iorque, 1987.
Lang,K.R, Sun, Earth & Sky, Springer-Verlag, Heidelberga, 1995. Levy,D, Skywatching-The Ultimate Guide to the Universe, Harper Collins
Publishers, London, 1995. Moreno, R. Experimentos para todas las edades, Editorial Rialp, Madrid, 2008 Rybicki,G.B., Lightman, A.P, Radiative Processes in Astrophysics,John Wiley &
Sons, E.U.A, 1979. Sousa, A.S, Propriedades Físicas do Sol, Ed. ASTRO, Porto, 2000. Zeilik, M., Gregory, S.A., Smith, E.V.P, Introductory Astronomy and Astrophysics,
3rd Ed., Saunders College Publishing, Orlando, E.U.A, 1992.
Internet sources NASA Polar Wind and Geotail Projects, http://www-istp.gsfc.nasa.gov. Space & astronomy experiments, http://www.csiro.au/csiro/channel/pchdr.html The Sun, http://www.astromia.com/solar/sol.htm Nine planets, http://www.astrored.net/nueveplanetas/solarsystem/sol.html