Embed Size (px)
Citation preview
Index Insights
Sustainable Investment | Product Engineering
ESG scores and beyond Part 2: Contribution of themes to ESG Ratings: a statistical assessment
ftserussell.com 1
Introduction A FTSE Russell ESG rating is the culmination of a rigorous process that
combines various aspects of an issuer's total Environmental, Social or
Governance exposure and performance, into a single score. Whereas the
process synthetizes ESG information objectively, a company’s exposure to the
Environmental, Social or Governance themes is ultimately driven by its activity.
However, while some themes are important to all issuers, and will participate in
most of the FTSE Russell’s ESG rating, others will contribute less.
With the attention of investors being increasingly focused on sustainability
issues, awareness of these ESG ratings characteristics is essential, as it
allows the user to have a better overview of their meaning.
This paper answers the question “What themes matter most in ESG
ratings?”, by explaining the information underpinning FTSE Russell’s ESG
rating and identifying the themes which provide the highest contribution to an
overall score. It
• Provides an overview of the FTSE Russell’s ESG dataset and rating
methodology
• Measures the ESG themes’ individual contributions to the overall ESG
performance
• Distinguishes the most contributing themes by industry group
• Proposes approaches on how best to use the various themes’
identified contributions
Apri l 2021
AUTHORS
Kevin Ratsimiveh
Data Scientist
+33 (0)1 8744 8901
Ruben Haalebos
Data Scientist
+33 (0)1 8744 8905

ftserussell.com 2
Contents Executive summary 3
ESG performance assessment methodology summarized 4
An overview of the FTSE Russell ESG dataset 7
General distribution of the ratings 7
Distribution of thematic scores 8
Discussion 9
Measuring the ESG theme contribution to the overall ESG performance 10
Completeness and breadth of thematic scores 10
Addressing incomplete data 11
Correlation analysis 11
Methodology to control the contribution of themes to final ESG Ratings 13
Results 14
Do themes contribute equally to the ESG performance at industry level? 18
Discussion 22
Appendix 24
1: An optimized Partial Least Squares (PLS) method 24
2: A historical study of the ESG theme contribution to ESG performance 25
3: Effect of incomplete data attribution regarding the results 27

ftserussell.com 3
Executive summary In our previous paper, ESG Scores and Beyond: Factor control: Isolating
specific biases in ESG ratings, we explored how some external factors—or
biases—can significantly explain and partly predict the FTSE Russell’s
ESG rating. In this second part, we provide a deeper analysis of those
ratings by estimating the influence of the various constituting themes on
the overall score.
We believe that a) investors should focus on the materiality of the detailed
ESG information aggregated in the final ESG scores and ratings; and b)
rating providers should deliver cutting-edge assessments based on
credible and controlled information for what contributes to them.
This scoring framework is built using over 300 indicators, grouped into 14
themes. Not all themes are relevant for each company, so the score is
combined with an exposure measure to make it relevant for the
organizations assessed.
We find that six themes contribute overwhelmingly toward determining the
overall ESG rating, namely:
• Climate Change
• Environment Supply Chain
• Anti-Corruption
• Labour Standards
• Human Rights and Community
• Social Supply Chain
These results were obtained via a Partial Least Square regression, with a cross-validation step to
confirm the outcomes of the model. Furthermore, our analysis on the importance of independent
variables and their estimated link with the response variable, and the stability of each regression’s
outputs over time, showed that the quality of the regressions is satisfactory.
Nevertheless, this does not mean that the other themes do not provide information to the overall
ESG ratings.
Indeed, we performed the same analysis and differentiated the results by using the Industry
Classification Benchmark (ICB) Level 1 industries classification filter. Because of the exposures
considered in the ESG ratings, some themes proved relevant for specific industries. As
highlighted by the results, nuances between specific sectors are important.
However, the Climate Change, Anti-Corruption, Labour Standards, and Human Rights and
Community themes are relevant to all industries. When we reconstruct the final ESG rating with
these four themes, we get a result strongly related to the original ESG rating.
Overall, this study proposes a statistically robust and objective framework to control the relevance
of themes and data input included into any ESG ratings or scores, paving the way for a new
generation of scores and tools, while offering greater transparency to investors on what an ESG
rating can provide.
In this second report, we provide a
deeper analysis of the ratings by
estimating the influence of their
constituting themes on the overall
score to reveal the substance of our
ESG rating.

ftserussell.com 4
ESG performance assessment methodology summarized A FTSE Russell ESG rating strives to synthetize ESG information (both qualitative and
quantitative) objectively into a single score; it combines an issuer's total Environmental, Social or
Governance exposure and performance in multiple dimensions. The final score attributed to any
organization rests on assessments conducted for the three E, S and G pillars, covering 14
themes, themselves spread over 300 indicators1.
Figure 1. Overview of the ESG rating process
Table 1. List of FTSE Russell 14 ESG themes within the 3 pillars
3 ESG Pillars
Environmental Social Governance
14 ESG Themes
Biodiversity Customer Responsibility Anti-Corruption
Climate Change Health & Safety Corporate Governance
Environmental Supply Chain Human Rights & Community Risk Management
Pollution & Resources Labor Standards Tax Transparency
Water Security Social Supply Chain
Sources: FTSE Russell.
1 Please refer to the methodological report available at:
https://qsd.ftserussell.com/Docs/ESG/FTSE%20Russell%20ESG%20Data%20Model%20Methodology%20-%20April-2019-March-2020-Rev2.pdf (Accessed: 02/03/2021).
ESG Rating
3 ESG Pillars
Score & Exposure
14 ESG Themes
Score & Exposure
>300 Indicators

ftserussell.com 5
For each of the ESG pillars, a five-step calculation process identifies the applicable indicators for
each theme and assesses the organization’s performance with regards to those indicators,
resulting in two measures
• Exposure, which measures the relevance of the pillar topics for a company
(from 0 = none, to 3 = high)
• Score, which measures the quality of a company’s management of the pillar issues
(from 0 = no disclosure, to 5 = best practice)
Each pillar score results from the aggregation of pertinent ESG themes, grouped into the 14
categories listed in Table 1 above.
Prior to calculating the exposure and score for the ESG pillars, the five-step process is also
applied to each theme, in the same way as the calculation for the pillars. An exposure and a
score measure are collated, which can use over 300 data points (the indicators), based on each
company’s unique circumstances. Each theme includes six to 58 indicators (Table 2), with an
overall average of 125 indicators being applied for each company.
Table 2. Number of data points (or indicators) per FTSE Russell ESG theme
ESG themes Pillar (E, S or G) Number of data points
Customer Responsibility S 58
Climate Change E 49
Social Supply Chain S 45
Corporate Governance G 40
Health & Safety S 37
Water Security E 33
Environmental Supply Chain E 24
Pollution & Resources E 23
Labor Standards S 23
Human Rights & Community S 19
Risk Management G 16
Biodiversity E 13
Anti-Corruption G 13
Tax Transparency G 6
Total ESG 330
Sources: FTSE Russell.
In the assessment process, the exposure of a company to a specific theme is identified as high,
medium, low, or negligible/not applicable (N/A), based on the following criteria:
• The Industry Classification Benchmark (ICB) subsector is used to determine if a company has
activities in a subsector relevant to a specific theme;

ftserussell.com 6
• Geography is used to determine if a company has activities in a country relevant for a specific
theme.
Then for a company, the score for a relevant theme results from the combination of its exposure
to that theme and the percentage of indicator points2 scored (Figure 2).
Figure 2. FTSE Russell ESG Themes scoring matrix
Theme Exposure
Low Medium High
Th
em
e S
co
re
0 N/A 0% 0%
1 0-5% 1-5% 1-10%
2 6-10% 6-20% 11-30%
3 11-30% 21-40% 31-50%
4 31-50% 41-60% 51-70%
5 51-100% 61-100% 71-100%
Sources: FTSE Russell. See FTSE Russell ESG Data Model 6th Research Cycle (2019/20)3 and update4 for a more detailed overview of the methodology.
However, it is worth noting that although the 14 themes are included in the analysis framework,
they do not necessarily contribute equally to the final assessment score. Even though the
information gathering has been carried out consistently for all companies, and according to the
predefined weighting scheme, it is still unclear what share of information each theme brings to the
final ESG rating, and whether some themes weigh more than others.
Answering this question would help rating providers and users to: (1) understand which themes
contribute most to the underlying ESG rating; (2) select the essential themes needed to
implement a more focused ESG rating or lead to a change of ESG rating constituents towards
new emerging themes; and (3) assess to what extent the real influence of a theme on an ESG
rating is different from its theoretical weighting.
2 For each theme, the number of indicators ‘points’ a company meets is calculated as a percentage of total applicable points and a theme
score is given based on threshold bands. The threshold bands are higher for companies with a high exposure than the bands for a company with low exposure.
3 https://qsd.ftserussell.com/Docs/ESG/FTSE%20Russell%20ESG%20Data%20Model%20Methodology%20-%20April-2019-March-2020-Rev2.pdf (Accessed: 02/03/2021).
4 https://qsd.ftserussell.com/Docs/ESG/FTSE%20Russell%20ESG%20Ratings_Methodology%20changes%20summary%202019-2020.pdf (Accessed: 02/03/2021).
Percentage of
Indicator Points
scored

ftserussell.com 7
An overview of the FTSE Russell ESG dataset The Organization for Economic Co-operation and Development (OECD) recently published a
report on the environmental pillar in ESG scores5 emphasizing the importance of understanding
the underlying explicative factors of an ESG score. As methodologies for ESG score building can
vary between data providers, users should have knowledge of what story an ESG score is telling.
To investigate this area of research, we use detailed ESG theme data from the FTSE Russell
ESG database, which comprises over 7,200 securities in 47 developed and emerging markets
and is represented by constituents from the FTSE All-World, FTSE All-Share and Russell 1000®
Indexes. The database covers detailed ESG information since 2014 and is updated every three
months.
General distribution of the ratings
The current final ESG rating is a continuous variable, normally distributed between 0 and 5, as
shown on Chart 1. The mean score is 2.26 with a standard deviation of 1.00.
Chart 1. Distribution of ESG ratings as of June 24, 2019
Sources: FTSE Russell, Beyond Ratings.
Here, we show the result for the fifth research cycle (the mid-2019 review)6. The distribution has
remained stable since the start of said cycles. However, the number of companies has increased
with the different updates. The stability of ESG data throughout the years is discussed in more
length in Appendix 2.
5 Boffo, R., C. Marshall and R. Patalano (2020), “ESG Investing: Environmental Pillar Scoring and Reporting,” OECD Paris,
www.oecd.org/finance/esg-investing-environmental-pillar-scoring-and-reporting.pdf (Accessed: 20/01/2021). 6 This review corresponds to the one selected for a previous paper on the same subject: Ratsimiveh, K. & al. (2020). ESG scores and beyond – Factor control: Isolating specific biases in ESG ratings. FTSE Russell.
ftserussell.com 8
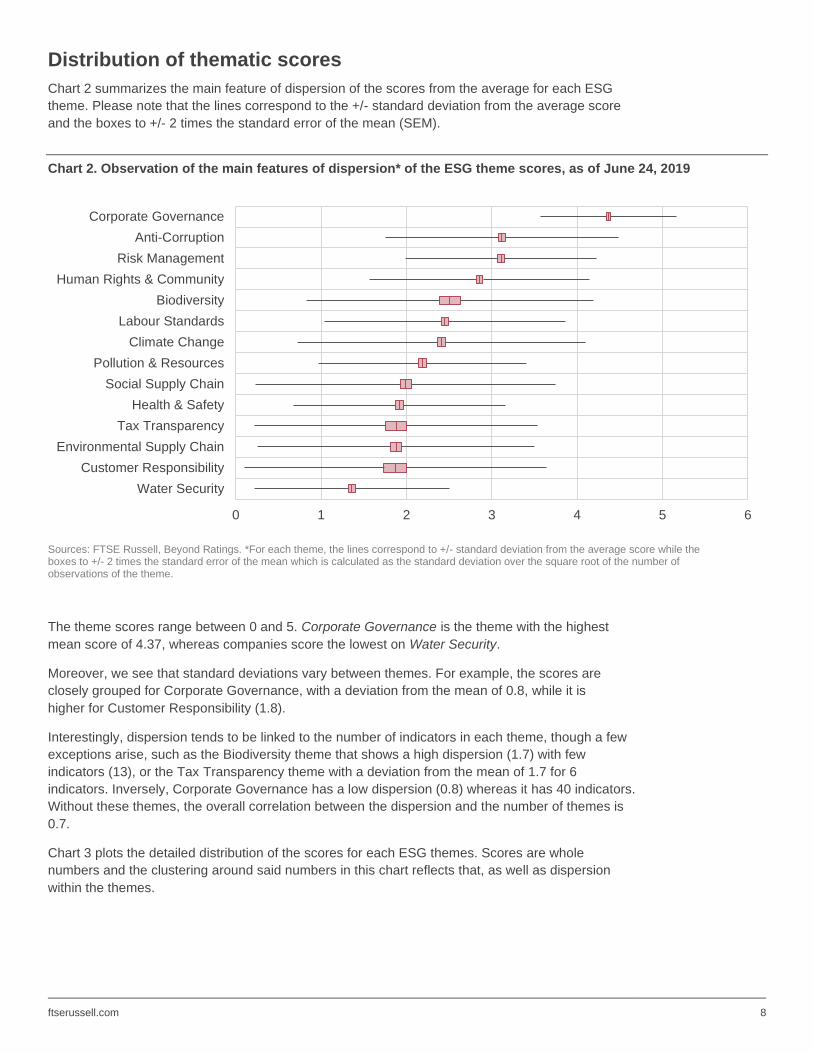
Distribution of thematic scores
Chart 2 summarizes the main feature of dispersion of the scores from the average for each ESG
theme. Please note that the lines correspond to the +/- standard deviation from the average score
and the boxes to +/- 2 times the standard error of the mean (SEM).
Chart 2. Observation of the main features of dispersion* of the ESG theme scores, as of June 24, 2019
Sources: FTSE Russell, Beyond Ratings. *For each theme, the lines correspond to +/- standard deviation from the average score while the boxes to +/- 2 times the standard error of the mean which is calculated as the standard deviation over the square root of the number of observations of the theme.
The theme scores range between 0 and 5. Corporate Governance is the theme with the highest
mean score of 4.37, whereas companies score the lowest on Water Security.
Moreover, we see that standard deviations vary between themes. For example, the scores are
closely grouped for Corporate Governance, with a deviation from the mean of 0.8, while it is
higher for Customer Responsibility (1.8).
Interestingly, dispersion tends to be linked to the number of indicators in each theme, though a few
exceptions arise, such as the Biodiversity theme that shows a high dispersion (1.7) with few
indicators (13), or the Tax Transparency theme with a deviation from the mean of 1.7 for 6
indicators. Inversely, Corporate Governance has a low dispersion (0.8) whereas it has 40 indicators.
Without these themes, the overall correlation between the dispersion and the number of themes is
0.7.
Chart 3 plots the detailed distribution of the scores for each ESG themes. Scores are whole
numbers and the clustering around said numbers in this chart reflects that, as well as dispersion
within the themes.
0 1 2 3 4 5 6
Water Security
Customer Responsibility
Environmental Supply Chain
Tax Transparency
Health & Safety
Social Supply Chain
Pollution & Resources
Climate Change
Labour Standards
Biodiversity
Human Rights & Community
Risk Management
Anti-Corruption
Corporate Governance

ftserussell.com 9
Chart 3. Distribution of the different ESG themes, as of June 24, 2019
Sources: FTSE Russell, Beyond Ratings.
Discussion
It confirms previous observations that companies tend to score higher in Corporate Governance
than in other themes. By contrast, companies seem to perform poorly on environmental-related
themes, such as Water Security or Environmental Supply Chain.
While it can be argued that the distribution of thematic scores can be driven by the “performance”
of listed companies (e.g., a wide distribution for corporate governance score), we might also
believe that the main driver is linked to the level of transparency required, the type of data point
collected, the selectivity of the data point, and the type of answer expected. (“Comply or explain”:
for instance, corporate governance standards are now widespread and recognized internationally,
and sometimes mandatory, facilitating implementation, disclosure and formal compliance.)
Alternatively, companies exposed to the Water Security theme run businesses in sectors
(Chemicals, Forestry, Mining and Utilities), where water pollution and consumption are a systemic
risk that cannot be fully mitigated: water management issues7 count and weigh down on the
thematic score. Their low score here is inherent to their business, and it is hard to obtain the best
score for these companies.
For Customer Responsibility, the premise is similar. Companies exposed to this theme have
activities related to alcohol or tobacco as examples. This theme is focused on sectors where
products have explicit negative externalities (the sale of the product benefits the company but on
balance damages society), leaving little room for a positive outcome. Therefore, mitigating risk is
the overall objective to improve a structurally impaired score.
While this is a sample bias, it is consistent with the objective of the overall ESG score, where we
would expect companies dealing in activities creating negative externalities to have a low score.
7 This includes water wasting, water pollution and issues in water recycling.

ftserussell.com 10
Measuring the ESG theme contribution to the overall ESG performance As discussed in the previous section, not all themes are relevant for all companies. For example,
the Biodiversity theme only applies to companies with exposure towards this theme. Hence,
companies involved in forestry activities will have a score on this theme, unlike most companies
in the technology sector8. Therefore, this results in incomplete data for a few themes.
Completeness and breadth of thematic scores
In Chart 4, we show the level of completeness for each theme, defined as the ratio between the
number of companies where a theme is relevant versus the total number of companies
considered.
Chart 4. Completeness* of data within each ESG theme, as of June 24, 2019
Sources: FTSE Russell, Beyond Ratings. *Share of companies with a score within each ESG theme.
Three themes stand out: Tax Transparency, Customer Responsibility and Biodiversity. Their level
of completeness is around 15%, which means that only 15% of companies in the FTSE Russell
ESG database are scored on these themes as of the date of the study9.
However, for a statistically more robust analysis, we need to input values where no score is
reported10.
8 This is an example; the real exposure is measured in a more nuanced way. 9 We consider 4686 companies in total. 10 Another strategy would be to consider only the companies for which all themes are relevant. However, this would limit our sample to 15% of
the complete database and hinder the robustness of our study. Thus, we prefer to input missing data.
0% 20% 40% 60% 80% 100%
Tax Transparency
Customer Responsibility
Biodiversity
Environmental Supply Chain
Health & Safety
Risk Management
Water Security
Pollution & Resources
Social Supply Chain
Anti-Corruption
Labour Standards
Human Rights & Community
Corporate Governance
Climate Change

ftserussell.com 11
Addressing incomplete data
We tested two different strategies to address the lack of data for some themes:
• A first method, where incomplete data is replaced by zero;
• A second, where incomplete data is replaced by the mean value of the theme.
Neither method is conceptually satisfactory: the first one implies that companies where the theme
is not relevant get the lowest score. While this is justifiable in some cases—for example when
companies choose not to report on a specific indicator because they perform badly—in our case,
some indicators are simply not relevant for certain companies.
The second method is slightly better because it does not modify the statistical properties of the
scores of each ESG theme and thus, does not impact their potential influence on the outcome.
We can see this because both average and distribution figures remain the same.
Moreover, we find that the latter method is better suited for our models as it provides higher
quality metrics and a better basis for explanation. The results obtained with both methods are
presented in Appendix 3.
Correlation analysis
The analysis of the correlation between each individual ESG theme and rating constitutes a
necessary step in the study of the contribution of ESG themes on the overall level of ESG rating.

ftserussell.com 12
Chart 5. Correlation plot between ESG rating and each ESG theme, and between them, as of June 24, 2019
Sources: FTSE Russell, Beyond Ratings.
Chart 5 plots the Pearson correlation coefficients11 between ESG ratings and themes and shows
clear differences in the respective links.
• Climate Change, Environmental Supply Chain, Labour Standards, Anti-corruption, Social
Supply Chain have the highest correlation with the final ESG score.
• Biodiversity and Tax Transparency have the lowest correlation with the final ESG score. The
former is relevant only for a few companies, which could explain this apparent absence of
correlation—the latter, as we have already discussed, tends to have a relatively high number
of low scores.
However, a correlation study only gives the strength of a relationship in a bivariate case (only two
variables examined), but it is not sufficient to estimate the influence of one variable when several
are involved, as is the case here.
11 In statistics, the Pearson’s correlation coefficient measures the linear relationship between two variables. It has a value between +1 to -1,
where 1 is a total positive linear correlation, -1 a total negative linear correlation and 0 no linear correlation. The larger the absolute value of the coefficient, the stronger the relationship.

ftserussell.com 13
Methodology to control the contribution of themes to final ESG Ratings
A more efficient way to analyze the influence of each individual ESG theme versus the overall
ESG performance is to execute a regression analysis with the level of ESG ratings as response
variable and the 14 themes scores as regressors. The aim of a regression analysis is to isolate
the relationship between each independent variable (regressor) and the dependant one.
Also, it is important that the regressors be uncorrelated, otherwise a multicollinearity12 issue could
occur.
As the above chart highlights, several ESG themes are highly correlated between each other
such as Environmental Supply Chain and Social Supply Chain.
To deal with this apparent multicollinearity, we propose an optimized Partial Least Squares
(PLS) method.
PLS regression is an alternative statistical method to Ordinary Least Squares, which fits a
multiple linear regression model on a set of relevant independent regressors.
It could be viewed as a two-step process that:
• Forces the set of initial regressors to be independent by aggregating them into relevant latent
variables; and then
• Models the relationship between the response variable and the set of “new” regressors.
Using machine learning techniques, we propose to optimize the calibration of the PLS regression.
Furthermore, to prevent an overfitting issue of our model, we discard initial regressors that do not
give more information and could be considered statistically irrelevant to some extent.
More precisely, the aim of the algorithm is to minimize the cross-validation Mean Squared Error13
(MSE) by varying simultaneously the number of latent variables and the set of initial regressors.
For each combination, we add a cross-validation step by testing the predictive ability of the
calibration on random sub-samples and keeping the one with the minimum cross-validation MSE.
This allows us to be more parsimonious14 (in terms of variables and axes considered) in our
regression.
See Appendix 1 for a more detailed overview of the methodology.
12 Multicollinearity is evidence of a model dealing with multiple factors that are correlated not just to the dependant variable but also to each
other: it results when (one or more) factors are redundant to some extent. 13 The mean squared error (MSE) of a model is the average deviation between the response variable and the fitted values. A model with low
MSE has a better quality than a model with high MSE.
14 A parsimonious model/theory is one with the least assumptions and variables but with greatest explanatory power. The principle of parsimony is also known as Occam’s razor: Numquam ponenda est pluralitas sine necessitate–(William of Ockham “Plurality must never be posited without necessity").

ftserussell.com 14
Results
For the research cycle studied, all themes were selected in our algorithm.
To measure the quality of our model, we compute the coefficient of determination (R-squared)
and the mean squared error (MSE) between the response variable and the estimated values by
the PLS regression, using the optimal number of latent variables and the remaining theme scores
as regressors.
While the R-squared measures the fraction of variance of the response variable captured by the
model, the MSE, which is defined as the average of the square of the errors, is a precision
measure that captures more broadly the residual errors of the model.
The R-squared sets at 0.93 can be interpreted as 93% of the cross-variance in companies’ ESG
ratings explained by the 14 ESG themes. This is relatively high, but not surprising as the
response variable is by construction a combination of the exogenous variables15.
The MSE is especially low with regards to the scale of the ESG ratings.
Table 3. Quality metrics from the PLS regression
Type Value
R-Squared 0.93
MSE 0.07
Sources: FTSE Russell, Beyond Ratings.
In a PLS framework, two main measures are relevant to study the influence of each individual
regressor and the response variable:
• The estimated coefficient associated with each independent variable. The higher its
absolute value, the more a given variable is related to the response variable, while the sign
displays the nature of the estimated relationship; and
• The Variable Importance in Projection16 (VIP) scores summarize the contribution of each
variable to the model and constitute the main measure of a variable’s importance.
Chart 6 and Chart 7 below plot respectively the estimated coefficients and the VIP scores from
our PLS regression for each ESG themes.
15 Because not all companies are exposed to the 14 themes, R-squared cannot be equal to 1.
16 The VIP score of a variable is calculated as a weighted sum of the squared correlations between the PLS latent variables and the original
variable. The weights correspond to the percentage variation explained by the PLS latent variable in the model. The number of terms in the sum depends on the number of PLS latent variables found to be significant in distinguishing the classes. A variable with a VIP Score close to or greater than 1 can be considered important in a given model.

ftserussell.com 15
Chart 6. Coefficients estimated by the PLS regression
Sources: FTSE Russell, Beyond Ratings.
Chart 7. Independent variables from the PLS regression sorted by their importance in the model (measured by their VIP scores)
Sources: FTSE Russell, Beyond Ratings.
0.00 0.05 0.10 0.15 0.20 0.25 0.30
Biodiversity
Customer Responsibility
Health & Safety
Water Security
Pollution & Resources
Environmental Supply Chain
Tax Transparency
Risk Management
Corporate Governance
Social Supply Chain
Anti-Corruption
Human Rights & Community
Labour Standards
Climate Change
Estimated coefficients
0.0 0.5 1.0 1.5
Tax Transparency
Biodiversity
Customer Responsibility
Corporate Governance
Risk Management
Water Security
Pollution & Resources
Health & Safety
Environmental Supply Chain
Human Rights & Community
Social Supply Chain
Anti-Corruption
Climate Change
Labour Standards
VIP scores

ftserussell.com 16
Coefficients from our PLS regression are related to the completeness of data on each theme but
not solely explained by it. Themes covering more companies will show a higher variance but do
not necessarily provide further insights of the final score.
As shown by Chart 7, only six themes (Labour Standards, Climate Change, Anti-Corruption,
Human Rights & Community, Social Supply Chain and Environmental Supply Chain) out of 14 are
given a VIP score of at least 1 by the model and significantly contribute to the overall ESG
assessment of companies17.
Surprisingly at first, Corporate Governance has a high coefficient, but is not significant, according
to the VIP score. This is consistent with its low correlation with the overall ESG score: it has a
high value, so generally contributes positively to the ESG score, but it has a low variance, so
tends not to be explained by this response variable. Since Corporate Governance has a low
variance and is regrouped around a few values, it has a low explanatory power on the overall
levels of the ESG score.
To further investigate the influence of each theme, we select only the relevant variables according
to the VIP score and run successive OLS regressions18. At each step, we include one more
variable, and we start with the Labour Standards theme, that shows the highest VIP score19. In
Chart 8 we plot the successive adjusted R-squared obtained.
Chart 8. R-Squared improvements* from the successive OLS regression
Sources: FTSE Russell, Beyond Ratings. * The model with Social Supply Chain and Labour Standards has an adjusted R-squared that is 0.10 points higher than that of the model with only Labour Standards as an explanatory variable.
17 Note that the VIP score is an absolute score in the sense that the suppression of relevant variables has no influence on the relevance of
others. In other words, if all variables in a model are relevant, they all have a VIP score higher than 1. 18 Because we perform the regression on only five variables, we use a simple OLS regression and not a PLS regression. Multicollinearity is
diminished compared to the regression on all variable with a Variance Inflation Factor less than 10. Moreover, here we do not look at coefficients but only R-squares.
19 This is the same idea as a step-wise regression, though here it is not used to select variable but rather to uncover the information each variable adds to the model.
0.89
0
0.1
0.2
0.3
0.4
0.5
0.6
0.7
0.8
0.9
1
Labour Standards Social SupplyChain
EnvironmentalSupply Chain
Climate Change Anti-Corruption Human Rights &Community

ftserussell.com 17
In Chart 8, we can observe that we are able to capture most of the overall ESG rating outcome
with relatively few themes. This does not mean that the other themes are not valid, from either a
rating or an ESG standpoint. From a statistical perspective, our findings suggest that it is possible
to replicate or build up ratings with fewer information (principle of parsimony). Obviously, the
information found in other themes does contribute (even though it is significantly less) to final
ESG ratings, which can help discriminate between similar companies. However, it does raise
interesting questions such as:
• Are the themes found to be less statistically pertinent, well-defined and complete enough to
offer substantial, or even material, information to investors?
• Are the themes underpinned by robust standards and therefore capture adequate
information?
• Is the information collected for those themes specific enough?
• Should this part of the thematic framework be reinforced (in terms of relevance, depth of
cover, or data completeness), so as to identify potentially more explanatory power for some
themes?
At this stage, some conclusions can be drawn:
• Variables with low variance (Corporate Governance) are less significant: variables need to
discriminate between companies;
• Themes with high completeness provide the most explanation of the final score. While not
surprising, we obtain a high final R-squared using only six themes, meaning that the bulk of
variance is explained by just a few.
Nevertheless, this first analysis needs to be refined to better capture the influence of the different
themes. While most of the information is captured into just a few themes, those remaining do
seem to be relevant at the sector level. We explore this point further in the next section.

ftserussell.com 18
Do themes contribute equally to the ESG performance at industry level? In this section, we apply the previous methodology to ESG ratings by industry (ICB 1) to identify
whether the themes contribute to industry’s ESG performance in the same magnitude. Indeed, it
is possible to infer for instance that a theme of Water Supply would weigh less for services than
for industrial companies.
As with the whole sample, we first study the Pearson correlation between ESG ratings and each
theme score by ICB 1 industries. Correlations are all positive because each theme contributes
positively to the overall score.
Chart 9. Correlation between ESG rating and each ESG theme by ICB 1 industries, as of June 24, 2019
Sources: FTSE Russell, Beyond Ratings.
We see in Chart 9 that the relationship between the ESG rating and each ESG theme is
heterogenous by industry
• On the whole sample, Anti-Corruption, Climate Change and Labour Standards themes scores
are highly correlated with the ESG ratings for each industry;
• For a few industries, theme scores are highly correlated with the ESG ratings, while this
correlation was very low on the whole sample.

ftserussell.com 19
These initial results seem to confirm that the contribution of each theme to ESG performance will
not be the same for each industry.
To study these contributions, we apply the PLS regression analysis on each industry (ICB 1) sub-
sample.
First, as shown in Table 4, which summarizes the main quality metrics for each industry-specific
PLS regression, our methodology is efficient with all industries as the average R-Squared set of
0.95 and MSE are low given the scale of the data.
Table 4. Quality metrics from each industry-specific PLS regressions
Industry (ICB 1) R-Squared MSE
Utilities 0.99 0.01
Oil & Gas 0.98 0.01
Basic Materials 0.98 0.02
Consumer Goods 0.98 0.02
Telecommunications 0.98 0.02
Financials 0.96 0.04
Industrials 0.94 0.05
Health Care 0.94 0.05
Technology 0.90 0.10
Sources: FTSE Russell, Beyond Ratings.
We then focus on the VIP scores associated to each ESG theme. As already explained, a VIP
score gives an estimate of the contribution of each independent variable on the response one
which, in our case, is the ESG ratings.
As shown in Chart 10, only four themes have a VIP score above 1 and thus contribute
significantly to the ESG ratings of all industries: Labour Standards, Climate Change, Anti-
Corruption and Human Rights & Community. These themes also contributed significantly to the
ESG ratings on the whole sample.
Of greater interest, a few themes are relevant for specific industries. For example, Pollution &
Resources is relevant only for Basic Materials, Consumer Goods, Industrials, Oil & Gas and
Utilities companies, while Social Supply Chain for only Consumer Services, Financials,
Technology and Telecommunications.
By contrast, the Biodiversity and Tax Transparency themes remain statistically not clearly
relevant for all sectors. A more specific sectoral analysis, for example at ICB 4 level, could
uncover more influence.

ftserussell.com 20
Chart 10. Independent variables from each industry-specific PLS regression sorted by their importance in the model (measured by their VIP scores)
Sources: FTSE Russell, Beyond Ratings.

ftserussell.com 21
Furthermore, our algorithm has removed different theme scores to optimize the performance of
each industry-specific PLS regression, but not evenly across all industries20.
However, the four themes highlighted above—which are consistently significant—are never
removed for any PLS regression, suggesting that they are consistently the most relevant themes.
To confirm our findings, we investigate further the influence of each relevant theme detected by
the PLS regression for each industry by running successive industry-specific OLS regressions.
For each industry, we start with the most significant theme and, at each iteration, include an
additional variable-based theme.
As shown in Chart 11, the adjusted R-squared sets at 0.86 on average for each industry, which
means that we can capture most of the overall ESG scoring with only four themes, even by
industries.
Chart 11. R-Squared improvements* from the successive OLS regression by industry
Sources: FTSE Russell, Beyond Ratings. *For Basic Materials industry, the model with Human Rights & Community and Labour Standards has an adjusted R-squared that is 0.08 points higher than that of the model with only Labour Standards as an explanatory variable.
20 As an example, for the Technology industry, Pollution & Resources, Biodiversity and Customer Responsibility themes were removed by the
algorithm.
0.90 0.90
0.76
0.85 0.850.88 0.90
0.870.84
0.91
0
0.1
0.2
0.3
0.4
0.5
0.6
0.7
0.8
0.9
1
Labour Standards Climate Change Human Rights & Community Anti-Corruption

ftserussell.com 22
Discussion This paper helps to explain information underpinning our ESG ratings and identify the most
contributing themes.
Through an innovative statistical modelling, we have highlighted that four ESG themes—Labour
Standards, Climate Change, Anti-Corruption and Human Rights & Community—contribute
significantly to ESG performance, even at the industry level. These themes happen to be the
most scrutinized by investors, authorities and other stakeholders. This focus might also help
explain the reason they capture most of the information included in the overall ESG ratings.
These findings do not debase the value of the other themes included in the ESG rating
framework. Some are found to be relevant for specific industries and will therefore be useful to
discriminate between companies with the same industry profile.
However, a valid question could be whether a company’s ranking, based on the overall ESG
ratings, would be the same, if not all, but only the four most contributing themes were considered
in the rating process.
To answer this question, we have applied the rating methodology on the risk exposures and the
scores of the four relevant themes. We studied the Spearman correlation21 between the initial and
these “reduced” ESG ratings and found correlation sets at 0.91 based on the whole panel (Chart
12) and at 0.86 on average by industries (Chart 13).
Chart 12. Rank of Initial and Reduced* ESG ratings, as of June 24, 2019
Sources: FTSE Russell, Beyond Ratings. * The Reduced ESG ratings is based on the same methodology as for the Initial ones and result from the aggregation of risk exposures and scores of Labour Standards, Climate Change, Anti-Corruption and Human Rights & Community themes.
21 In statistics, the Spearman’s correlation coefficient measures the linear relationship between the rank of two underlying variables. It has a
value between +1 to -1, where 1 is a total positive linear correlation, -1 a total negative linear correlation and 0 no linear correlation. The larger the absolute value of the coefficient, the stronger the relationship.
R² = 0.8356
0
500
1000
1500
2000
2500
3000
3500
4000
4500
5000
0 1000 2000 3000 4000 5000
Reduced*
ES
G r
atings (
Rank)
Initial ESG ratings (Rank)

ftserussell.com 23
Chart 13. Spearman’s correlation between Initial and Reduced ESG ratings, as of June 24, 2019
Sources: FTSE Russell, Beyond Ratings. * The Reduced ESG ratings is based on the same methodology as for the Initial ones and result from the aggregation of risk exposures and scores of Labour Standards, Climate Change, Anti-Corruption and Human Rights & Community themes.
These figures are high and suggest that if we focus on the rank instead of the level of ESG
ratings—for example in an index framework—highlighted companies would be nearly the same
with both the initial or the “reduced” version of ESG ratings. More broadly, these conclusions
raise the question of the ultimate use of ESG ratings by an investor.
Indeed, some investors would prefer to use original ESG ratings to capture the full range of ESG
issues or the ones inherent to specific sectors. Any stakeholder in that case should be wary of the
underlying weighting approach and the impact it has on the level of significance for each theme.
Alternatively, a more generalist investor could use reduced ESG ratings, as presented above, to
cover the main ESG challenges that a company can cope with. As this reduced version focuses
on the four most material ESG themes, it significantly decreases the impact of the weighting
scheme and of the underlying indicators structure, while retaining most of the information
underpinning the final ESG ratings, and keeping the bulk of companies comparable from an ESG
point of view.
However, this alternative focused approach does not fully answer the question of the use of an
ESG rating. Maybe the time has come for more advanced methods, where the interactions
between ESG pillars are accounted for, rather than the pillars simply being aggregated. Trends
on the various ESG themes should also be considered, as they indicate if a company is an
innovator of a laggard in a specific theme. Either position bears its own risks: the former could
self-penalize by too early adoption, while the latter may face compliance issues.
This means that the methodology for building ESG ratings may need to be modified to include
forward-looking data or to be explicitly linked to economic performance. Meanwhile, ESG ratings
providers should endeavour to communicate broadly their coverage and the significance of each
indicator.
0.83
0.89
0.90
0.91
0.92
0.94
0.94
0.95
0.95
0.95
0.91
0 0.1 0.2 0.3 0.4 0.5 0.6 0.7 0.8 0.9 1
Consumer Services
Health Care
Telecommunications
Technology
Financials
Consumer Goods
Industrials
Basic Materials
Oil & Gas
Utilities
Overall
Spearman correlation

ftserussell.com 24
Appendix
1: An optimized Partial Least Squares (PLS) method
Multiple linear regression methods aim at building a linear model: 𝒀 = 𝑿𝜷 + 𝜺.
Using matrix representation, 𝑿 is a matrix gathering all predictors vectors, 𝒀 the response vector,
𝜷 the vector of estimated parameters and 𝜺 the noise vector.
The quality of a calibration model is then measured using the coefficient of determination (𝑅2) and
the mean squared error (MSE), which is the average deviation between the response variable
and the fitted values, estimated by the model: 𝑴𝑺𝑬 = 𝟏
𝒏∑ (𝒀𝒊 − �̂�𝒊)
𝟐𝒏𝒊=𝟏 where �̂�𝒊 = 𝜷𝑿𝒊 and 𝒏 the
sample size.
In this study, the set of predictors vectors contained in the matrix 𝑿 are highly correlated and may
obscure the relation we want to highlight (multicollinearity issue).
To handle this multicollinearity issue, PLS regression transforms the initial set of predictors 𝑿 into
an equivalent set 𝑿′ = 𝑿𝑾 through a linear transformation 𝑾, such that the ultimate set of
predictors 𝑿′ (which are the latent variables) are linearly independent. The linear transformation
𝑾 is found by maximizing the covariance between the response variable 𝒀 and the latent
variables 𝑿′.
However, the main risk that could skew results from a PLS model is overfitting. In machine
learning, an overfitting issue occurs when the model describes too well the response variable in
that the model contains more parameters than can be justified by the data. In such a case, the
model has extracted some of the noise by considering it as an underlying structure.
A common procedure to prevent an overfitting issue is to discard initial predictors that do not give
more information and thus are redundant to some extent.
To manage both multicollinearity and overfitting issues, we build an algorithm that optimizes the
calibration of the PLS regression. It aims to find the optimal number of latent variables given an
optimal set of initial regressors that minimizes the cross-validation MSE.
More precisely, the cross-validation procedure consists of splitting the initial sample of data into
few random sub-samples, leaving one of the sub-samples out and fitting a model on the
remaining sub-samples. The model is then used to predict the values of the left-out sub-sample.
The process is repeated22 so that all samples have been predicted once. Finally, the cross-
validation MSE is the average MSE across all tested sub-samples.
22 We perform the cross-validation procedure on 10 random sub-samples for each combination.
ftserussell.com 25
2: A historical study of the ESG theme contribution to ESG performance
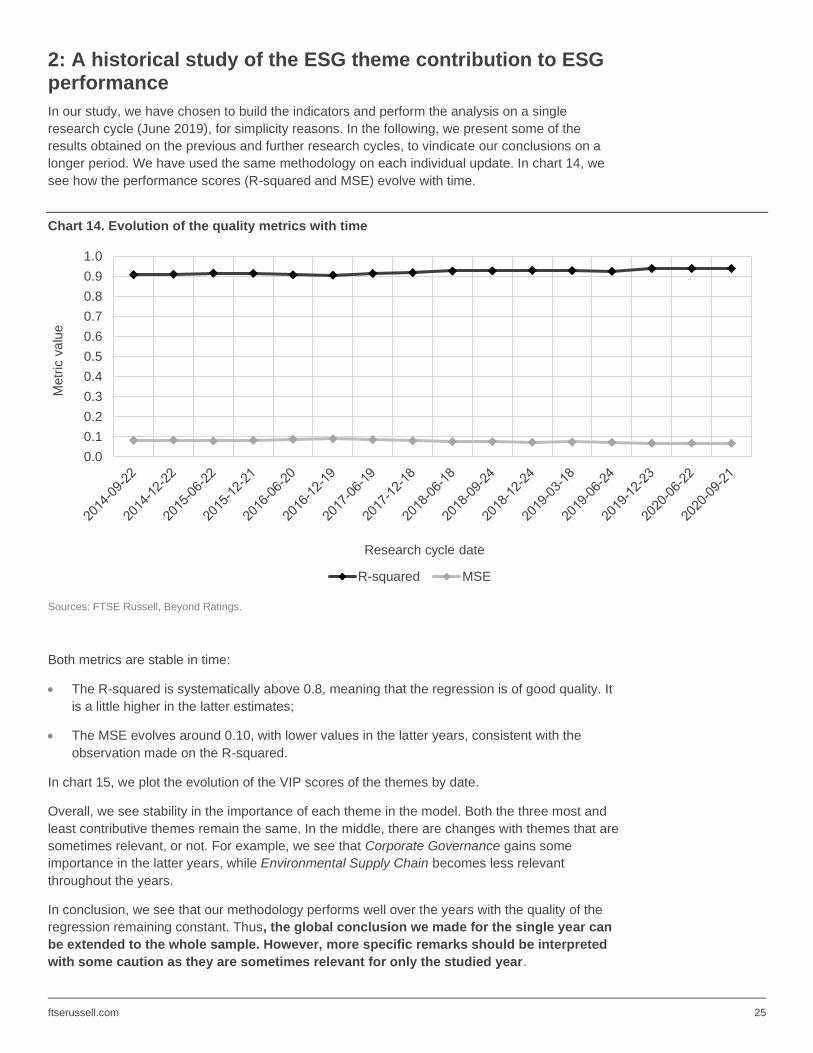
In our study, we have chosen to build the indicators and perform the analysis on a single
research cycle (June 2019), for simplicity reasons. In the following, we present some of the
results obtained on the previous and further research cycles, to vindicate our conclusions on a
longer period. We have used the same methodology on each individual update. In chart 14, we
see how the performance scores (R-squared and MSE) evolve with time.
Chart 14. Evolution of the quality metrics with time
Sources: FTSE Russell, Beyond Ratings.
Both metrics are stable in time:
• The R-squared is systematically above 0.8, meaning that the regression is of good quality. It
is a little higher in the latter estimates;
• The MSE evolves around 0.10, with lower values in the latter years, consistent with the
observation made on the R-squared.
In chart 15, we plot the evolution of the VIP scores of the themes by date.
Overall, we see stability in the importance of each theme in the model. Both the three most and
least contributive themes remain the same. In the middle, there are changes with themes that are
sometimes relevant, or not. For example, we see that Corporate Governance gains some
importance in the latter years, while Environmental Supply Chain becomes less relevant
throughout the years.
In conclusion, we see that our methodology performs well over the years with the quality of the
regression remaining constant. Thus, the global conclusion we made for the single year can
be extended to the whole sample. However, more specific remarks should be interpreted
with some caution as they are sometimes relevant for only the studied year.
0.0
0.1
0.2
0.3
0.4
0.5
0.6
0.7
0.8
0.9
1.0
Metr
ic v
alu
e
Research cycle date
R-squared MSE

ftserussell.com 26
Chart 15. Evolution of the VIP scores of the themes by date
Sources: FTSE Russell, Beyond Ratings.

ftserussell.com 27
3: Effect of incomplete data attribution regarding the results
As described in the first section of this report, we have applied a substitution method for
incomplete data. To study the effects of this imputation strategy, we apply a PLS regression on
the sample of ESG theme scores and replace incomplete data with 0.
In Table 5, we compare the performance metrics obtained with both methods: with Method 2, our
regression performs slightly better, both in terms of R-squared and MSE.
Table 5. Quality metrics from the PLS regression for each incomplete data imputation method*
Type Value
(Method 2*)
Value
(Method 1*)
R-Squared 0.93 0.86
MSE 0.07 0.13
Sources: FTSE Russell, Beyond Ratings. * Method 2 corresponds to the method where incomplete data is replaced by average theme scores, whereas Method 1 is when incomplete data is replaced by 0.
In Charts 16 and 17, we show the differences in terms of PLS regression value and VIP score.
Chart 16. Coefficients estimated by the PLS regression for each incomplete data imputation method*
Sources: FTSE Russell, Beyond Ratings. * Method 2 corresponds to the method where incomplete data is replaced by average theme scores, whereas Method 1 is when incomplete data is replaced by 0.
-0.1 0 0.1 0.2 0.3 0.4
Biodiversity
Customer Responsibility
Health & Safety
Water Security
Pollution & Resources
Environmental Supply Chain
Tax Transparency
Risk Management
Corporate Governance
Social Supply Chain
Anti-Corruption
Human Rights & Community
Labour Standards
Climate Change
Estimated coefficients
Method 2* Method 1*

ftserussell.com 28
Chart 17. VIP scores from the PLS regression for each incomplete data imputation method*
Sources: FTSE Russell, Beyond Ratings. *The Method 2 corresponds to the method where incomplete data is replaced by average theme score, whereas the Method 1 is when incomplete data is replaced by 0.
Here, we see some discrepancies between both methods.
First, the rank of the coefficients associated to each theme is not the same. A few estimated
coefficients are negative with Method 1 (Risk Management, Environmental Supply Chain,
Pollution & Resources and Water Security), which means that these themes would negatively
influence the overall ESG performance, while all coefficients are positive with Method 2.
Furthermore, Environmental Supply Chain is found relevant (regarding the VIP score) using
Method 2. It already had a quite high VIP score with Method 1, but it is larger than 1 with the
second one.
Finally, Anti-Corruption has a lower coefficient with Method 1 (0.09 versus 0.17). It is the theme
where the difference is the most significant.
Overall, results are consistent between methods, but the metric qualities show that Method 2
used to recover incomplete data yields better results.
0 0.5 1 1.5 2
Tax Transparency
Biodiversity
Customer Responsibility
Corporate Governance
Risk Management
Water Security
Pollution & Resources
Health & Safety
Environmental Supply Chain
Human Rights & Community
Social Supply Chain
Anti-Corruption
Climate Change
Labour Standards
VIP scores
Method 2* Method 1*

ftserussell.com 29
About FTSE Russell
FTSE Russell is a leading global provider of benchmarks, analytics and data solutions with multi-asset capabilities,
offering a precise view of the markets relevant to any investment process. For over 30 years, leading asset owners,
asset managers, ETF providers and investment banks have chosen FTSE Russell indexes to benchmark their
investment performance and create investment funds, ETFs, structured products and index-based derivatives. FTSE
Russell indexes also provide clients with tools for performance benchmarking, asset allocation, investment strategy
analysis and risk management.
To learn more, visit ftserussell.com; email [email protected]; or call your regional Client Service Team office
EMEA
+44 (0) 20 7866 1810
North America
+1 877 503 6437
Asia-Pacific
Hong Kong +852 2164 3333
Tokyo +81 3 4563 6346
Sydney +61 (0) 2 8823 3521
© 2021 London Stock Exchange Group plc and its applicable group undertakings (the “LSE Group”). The LSE Group includes (1) FTSE International Limited (“FTSE”), (2) Frank Russell Company (“Russell”), (3) FTSE Global Debt Capital Markets Inc. and FTSE Global Debt Capital Markets Limited (together, “FTSE Canada”), (4) MTSNext Limited (“MTSNext”), (5) Mergent, Inc. (“Mergent”), (6) FTSE Fixed Income LLC (“FTSE FI”), (7) The Yield Book Inc (“YB”) and (8) Beyond Ratings S.A.S. (“BR”). All rights reserved.
FTSE Russell® is a trading name of FTSE, Russell, FTSE Canada, MTSNext, Mergent, FTSE FI, YB and BR. “FTSE®”, “Russell®”, “FTSE Russell®”, “MTS®”, “FTSE4Good®”, “ICB®”, “Mergent®”, “The Yield Book®”, “Beyond Ratings®“ and all other trademarks and service marks used herein (whether registered or unregistered) are trademarks and/or service marks owned or licensed by the applicable member of the LSE Group or their respective licensors and are owned, or used under licence, by FTSE, Russell, MTSNext, FTSE Canada, Mergent, FTSE FI, YB or BR. FTSE International Limited is authorised and regulated by the Financial Conduct Authority as a benchmark administrator.
All information is provided for information purposes only. All information and data contained in this publication is obtained by the LSE Group, from sources believed by it to be accurate and reliable. Because of the possibility of human and mechanical error as well as other factors, however, such information and data is provided “as is” without warranty of any kind. No member of the LSE Group nor their respective directors, officers, employees, partners or licensors make any claim, prediction, warranty or representation whatsoever, expressly or impliedly, either as to the accuracy, timeliness, completeness, merchantability of any information or of results to be obtained from the use of the FTSE Russell products, including but not limited to indexes, data and analytics or the fitness or suitability of the FTSE Russell products for any particular purpose to which they might be put. Any representation of historical data accessible through FTSE Russell products is provided for information purposes only and is not a reliable indicator of future performance.
No responsibility or liability can be accepted by any member of the LSE Group nor their respective directors, officers, employees, partners or licensors for (a) any loss or damage in whole or in part caused by, resulting from, or relating to any error (negligent or otherwise) or other circumstance involved in procuring, collecting, compiling, interpreting, analysing, editing, transcribing, transmitting, communicating or delivering any such information or data or from use of this document or links to this document or (b) any direct, indirect, special, consequential or incidental damages whatsoever, even if any member of the LSE Group is advised in advance of the possibility of such damages, resulting from the use of, or inability to use, such information.
No member of the LSE Group nor their respective directors, officers, employees, partners or licensors provide investment advice and nothing contained herein or accessible through FTSE Russell products, including statistical data and industry reports, should be taken as constituting financial or investment advice or a financial promotion.
The information contained in this report should not be considered “research” as defined in recital 28 of the Commission Delegated Directive (EU) 2017/593 of 7 April 2016 supplementing Directive 2014/65/EU of the European Parliament and of the Council (“MiFID II”) and is provided for no fee.
Past performance is no guarantee of future results. Charts and graphs are provided for illustrative purposes only. Index returns shown may not represent the results of the actual trading of investable assets. Certain returns shown may reflect back-tested performance. All performance presented prior to the index inception date is back-tested performance. Back-tested performance is not actual performance, but is hypothetical. The back-test calculations are based on the same methodology that was in effect when the index was officially launched. However, back- tested data may reflect the application of the index methodology with the benefit of hindsight, and the historic calculations of an index may change from month to month based on revisions to the underlying economic data used in the calculation of the index.
This document may contain forward-looking assessments. These are based upon a number of assumptions concerning future conditions that ultimately may prove to be inaccurate. Such forward-looking assessments are subject to risks and uncertainties and may be affected by various factors that may cause actual results to differ materially. No member of the LSE Group nor their licensors assume any duty to and do not undertake to update forward-looking assessments.
No part of this information may be reproduced, stored in a retrieval system or transmitted in any form or by any means, electronic, mechanical, photocopying, recording or otherwise, without prior written permission of the applicable member of the LSE Group. Use and distribution of the LSE Group data requires a licence from FTSE, Russell, FTSE Canada, MTSNext, Mergent, FTSE FI, YB, BR and/or their respective licensors.