Embed Size (px)
Citation preview

ERSTFLoads and Resources Balance
Clyde Loutan, Senior Advisor – Renewable Energy Integration, CAISO
Vancouver, B.C.September 17 & 18

RELIABILITY | ACCOUNTABILITY2
Loads and Resources Team
Subgroup Lead Company EmailClyde Loutan CAISO [email protected]
Subgroup MembersAmir Najafzadeh NERC [email protected]
Brendan Kirby Kirby Consulting [email protected]
Dave Devereaux IESO [email protected]
Ed Scott Duke Energy [email protected]
Jay Ruberto First Energy [email protected]
Layne Brown WECC [email protected]
Michael McMullen MISO [email protected]
Michael Milligan NREL [email protected]
Noha Abdel-Karim NERC [email protected]
Pooja Shah NERC [email protected]
Ron Carlsen Southern Company [email protected]
Todd Lucas Southern company [email protected]
Tom SiegristBrickfield, Burchette, Ritts & Stone, P.C.

RELIABILITY | ACCOUNTABILITY3
Agenda
• Adequacy of existing BAL-Standards Example of monitoring CPS1 on an hourly basis Root cause analysis of sub par performance
• Characteristics of Flexible Capacity Example of flexible capacity needs
• Emerging Technologies Do we need to develop new standards?
• Example of the CAISO’s process of determining monthly ramping needs for future years Intra-hour flexibility needs 3-Hour flexibility needs Potential over-generation Need for higher ramp rate

RELIABILITY | ACCOUNTABILITY4
StandardsControl
Performance Measures
Current Matrices
Is Standard adequate for
higher penetration of
VERs?
Suggestions/Comments/ Recommendations for BAs with high
levels of VERs
BAL-001-2: Real Power Balancing
Control Performance
R1: CPS1
Evaluates a BA’s 12-month rolling average CPS1 performance
Pass: CPS1 > 100%
YesBAs with high levels of VERs should consider evaluating their CPS1 scores on a more granular level (daily or hourly) to identify root cause of CPS1 excursions less than 100%.
R2: BAAL
Address both over and under-frequency events. BAAL cannot exceed operating limits for more than 30 consecutive minutes
YesBAs can evaluate hours when BAAL is exceeded and track the duration of consecutive minutes exceeded. This data could be correlated with VERs production at the corresponding times.
Focus on hours when CPS1 hourly averages are less than 100%.
Is BAL-001-2 adequate at high levels of VERs penetration?

RELIABILITY | ACCOUNTABILITY5
Is BAL-002 & BAL-003-1 adequate at high levels of VERs penetration?
StandardsControl
Performance Measures
Current Matrices
Is Standard adequate for
higher penetration of VERs?
Suggestions/Comments/Recommendations for BAs with high levels of
VERs
BAL-002: Disturbance
Control Performance
DCS
Address under-frequency events but only measures ACE.
The contingent BA must return ACE to zero if pre-disturbance ACE was greater than zero or pre-disturbance level if ACE was less than zero.
Maybeconflicts with
EOP-002
Standard does not look at frequency and could have a BA drop load unnecessarily following a disturbance i.e. if system frequency is greater than 60 HZ, should a contingent BA drop load post-contingency.
Sudden changes in wind/solar output i.e. within 1-minute can be treated as a “credible contingencies.”
BAs need to monitor their MSSC periodically. May need to procure additional reserves during some hours.
BAL-003-1: Frequency
Response and Frequency Bias
Frequency Response Measure (FRM)
BAs need to meet a frequency response obligation (FRO) based on its size to the interconnection
Yes BAs need to monitor available/expected frequency response. Inadequate FR can result in a BA depleting its regulating reserve and inability to meet its FRO.
RELIABILITY | ACCOUNTABILITY6
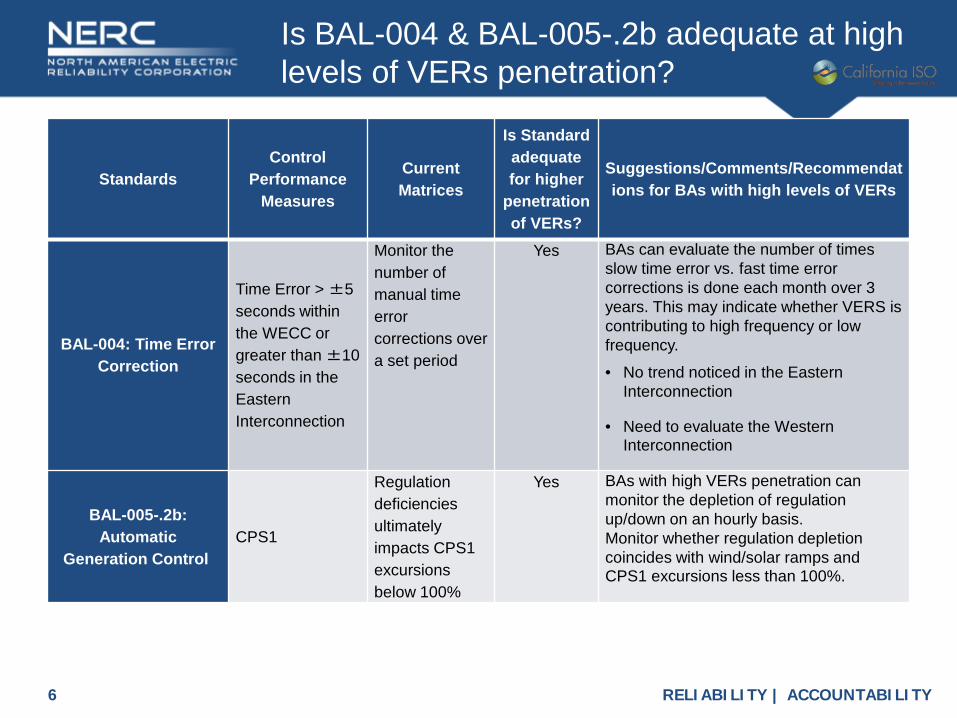
Is BAL-004 & BAL-005-.2b adequate at high levels of VERs penetration?
StandardsControl
Performance Measures
Current Matrices
Is Standard adequate for higher
penetration of VERs?
Suggestions/Comments/Recommendations for BAs with high levels of VERs
BAL-004: Time Error Correction
Time Error > ±5 seconds within the WECC or greater than ±10 seconds in the Eastern Interconnection
Monitor the number of manual time error corrections over a set period
Yes BAs can evaluate the number of times slow time error vs. fast time error corrections is done each month over 3 years. This may indicate whether VERS is contributing to high frequency or low frequency.
• No trend noticed in the Eastern Interconnection
• Need to evaluate the Western Interconnection
BAL-005-.2b: Automatic
Generation ControlCPS1
Regulation deficiencies ultimately impacts CPS1 excursions below 100%
Yes BAs with high VERs penetration can monitor the depletion of regulation up/down on an hourly basis.Monitor whether regulation depletion coincides with wind/solar ramps and CPS1 excursions less than 100%.
RELIABILITY | ACCOUNTABILITY7
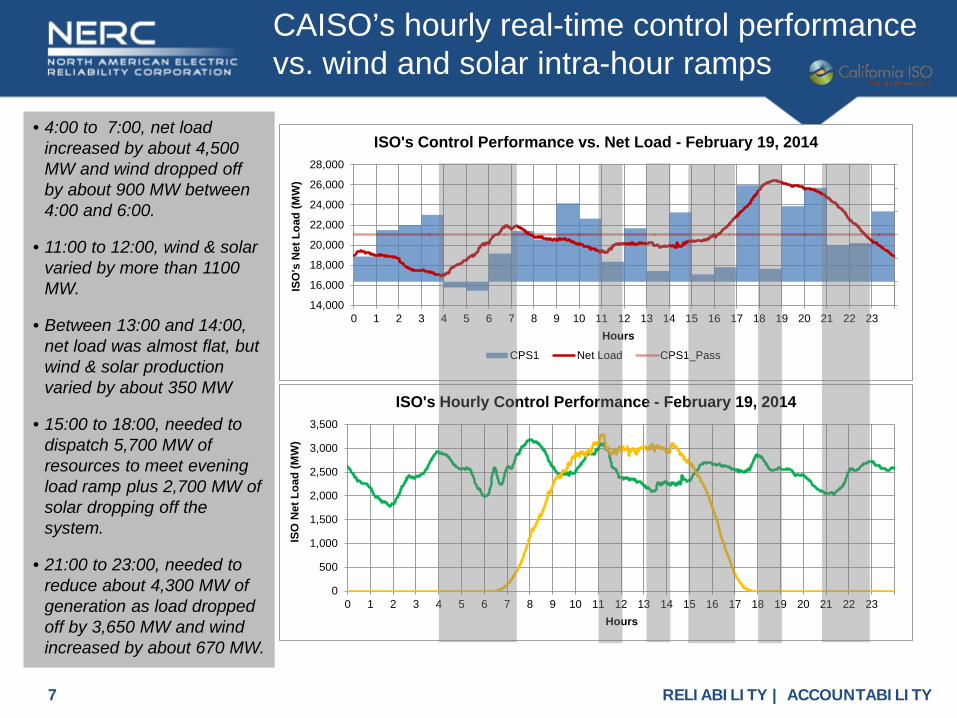
CAISO’s hourly real-time control performance vs. wind and solar intra-hour ramps
• 4:00 to 7:00, net load increased by about 4,500 MW and wind dropped off by about 900 MW between 4:00 and 6:00.
• 11:00 to 12:00, wind & solar varied by more than 1100 MW.
• Between 13:00 and 14:00, net load was almost flat, but wind & solar production varied by about 350 MW
• 15:00 to 18:00, needed to dispatch 5,700 MW of resources to meet evening load ramp plus 2,700 MW of solar dropping off the system.
• 21:00 to 23:00, needed to reduce about 4,300 MW of generation as load dropped off by 3,650 MW and wind increased by about 670 MW.
0
500
1,000
1,500
2,000
2,500
3,000
3,500
0 1 2 3 4 5 6 7 8 9 10 11 12 13 14 15 16 17 18 19 20 21 22 23
ISO
Net
Loa
d (M
W)
Hours
ISO's Hourly Control Performance - February 19, 2014
14,000
16,000
18,000
20,000
22,000
24,000
26,000
28,000
0 1 2 3 4 5 6 7 8 9 10 11 12 13 14 15 16 17 18 19 20 21 22 23
ISO
's N
et L
oad
(MW
)
Hours
ISO's Control Performance vs. Net Load - February 19, 2014
CPS1 Net Load CPS1_Pass
Slide 7
RELIABILITY | ACCOUNTABILITY8
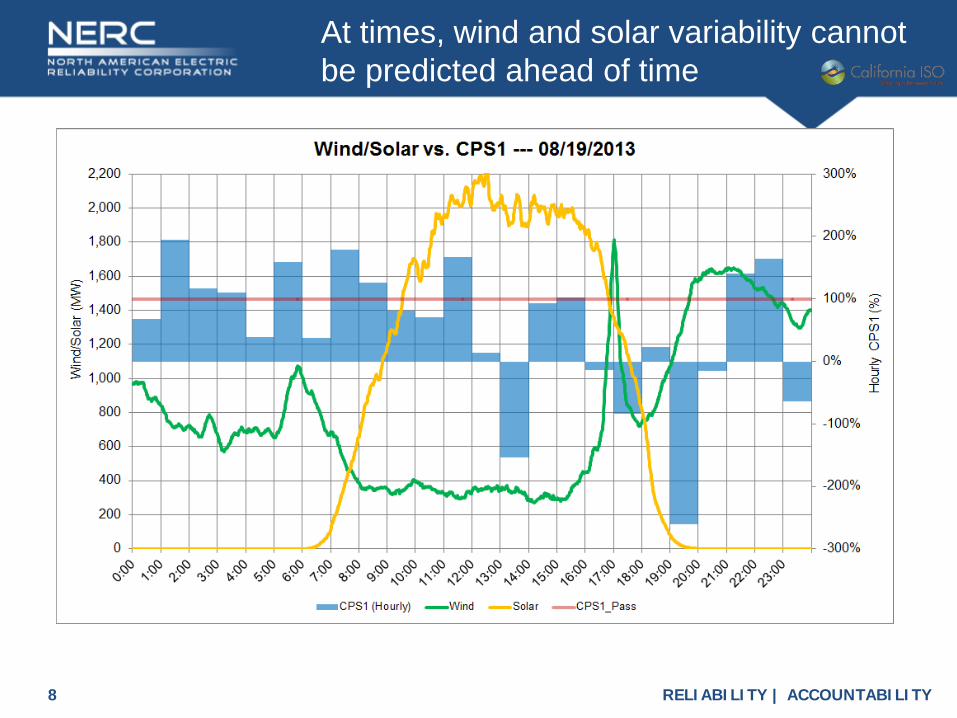
At times, wind and solar variability cannot be predicted ahead of time

RELIABILITY | ACCOUNTABILITY9
Flexible capacity is comprised of several characteristics
NERC Standard Characteristics Description
Metrics as VERs
increases
Comments/Recommendation
Non
e
• Low Pmin High Pmin can result in over-generation conditions and cannot back down a resources
CPS1/BAAL
• Fleet make-up needs to change in the long-term but what happens in the meantime?
• Monitor trend of over-generation conditions
• Monitor periods of negative prices
Non
e
• Multiple start/stop capability
Some BAs are starting to see two daily peaks
CPS1/BAAL
Many resources are restricted to one start per day. Maybe physical constraints or environmental constraints. Some BA’s have this issue
Non
e
• Start-up time
• Down Time
Units with start-up times greater than 6Resources with down-time greater than 6hours
CPS1/BAAL
Physical characteristic of the resource … maybe difficult and costly to change
Non
e
• High Ramp Rate Insufficient upward ramping capability (eg. loss of solar resources during sunset) CPS1/BAAL
• Monitor high energy prices• Monitor the frequency of regulation-up
depletion• Monitor CPS1 excursions during the
same hours• Based on minute by minute, load,
wind and solar data (CAISO)

RELIABILITY | ACCOUNTABILITY10
Flexible capacity is comprised of several characteristics (cont.)
NERC Standard Characteristics Description
Metrics as VERs
increases
Comments/Recommendation
Non
e
Sustain upward/downward ramps
Could be restricted by use limited resources (e.g. hydro with limited storage or environmental constraints)
CPS1/BAAL
Track CO2 and other environmental constraints. Water availability may be limited for a few hours due to storage and environmental constraints.
Non
e
Ability to quickly change ramp direction
Ramp up/down deficiencies
CPS1/BAAL
Some BAs are expected to experience two daily peaks. Environmental restrictions on some resources.
Non
e DispatchableVERs
Should VERs be part of the solution as opposed to the cause?
CPS1/BAALActive power control capability would be required for dispatchability
Non
e
Intra-Hour Load Following Capability
Intra-hour MW capacity needed for dispatch.
CPS1/BAAL
BAs need to monitor BAAL exceedance to ensure adequate Load Following capability is available for intra-hour dispatch.
Calculate hourly load following requirement based on expected variability and uncertainty associated with load, wind and solar.
Non
e Multiple Hour Flexible Capacity Requirements
3-hour continuous ramping needs
CPS1/BAAL Calculate 3-hour ramping capability based on expected renewable build-out.

RELIABILITY | ACCOUNTABILITY11
Do we need to develop standards for emerging technologies?
NERC Standard Technology Concerns
Metrics as VERs
increases
Comments/Recommendation
Non
e
Distributed Energy Resources* (DER)
• Transmission operators have no visibility of DER
• DER not included in a BA’s load calculation
CPS1/BAAL
• Environmental policies would require changes to integrate DER
• DER not included in forecast• Need to monitor over-generation
during sunrise and under-generation during sunset.
Non
e
Demand Response including dispatchableloads
• Lack of real-time visibility
• Not sure what is available for dispatch
• Limited dispatchabilityper hour/day
CPS1/BAAL
• Loads can reshape the load curve• Develop framework for loads to
participate in system control
Non
e
Energy Storage
&
Electric Vehicles
• No standardize study methodology
CPS1/BAAL
• Inverter capability• Ramp rate• How do we standardize study
assumptions• Batteries capability/chemistry• Cycle depth/cycle frequency• Behind the meter storage
• Bill Gates: We always overestimate the change that will occur in the next two years and under estimate the change that will occur in the next ten

RELIABILITY | ACCOUNTABILITY12
What role does forecast errors play in loads and resources balance?
NERC Standards
Timeframe Metrics as VERs
increases
Recommendation
Non
e
• Day Ahead load/wind/solar forecast errors
CPS1/BAAL Forecast errors will improve over the coming years but in the interim bettermodels need to be developed to forecast net-load in the day-ahead timeframe
Non
e
• Real-time load/wind/solar forecast errors
CPS1/BAAL At times, short-term forecast cannot predict short term wind/solar variability fast enough for real-time economic dispatch.Persistence model may not work at times because of the high 5-minute variability in wind/solar production
RELIABILITY | ACCOUNTABILITY13
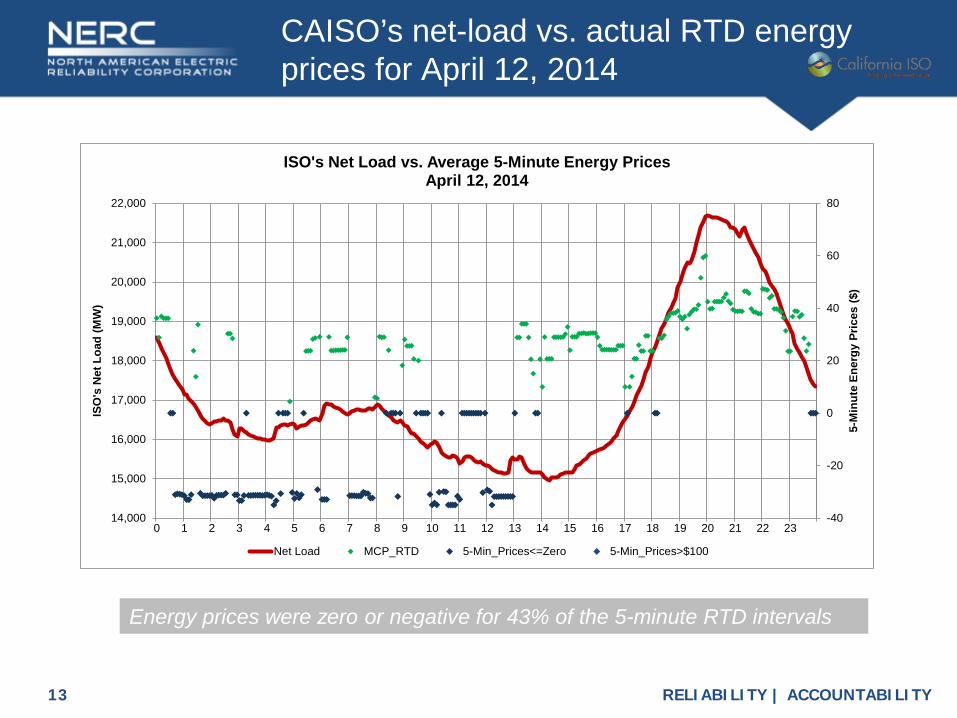
CAISO’s net-load vs. actual RTD energy prices for April 12, 2014
Energy prices were zero or negative for 43% of the 5-minute RTD intervals
Slide 13
-40
-20
0
20
40
60
80
14,000
15,000
16,000
17,000
18,000
19,000
20,000
21,000
22,000
0 1 2 3 4 5 6 7 8 9 10 11 12 13 14 15 16 17 18 19 20 21 22 23
5-M
inut
e En
ergy
Pric
es ($
)
ISO
's N
et L
oad
(MW
)
ISO's Net Load vs. Average 5-Minute Energy PricesApril 12, 2014
Net Load MCP_RTD 5-Min_Prices<=Zero 5-Min_Prices>$100
RELIABILITY | ACCOUNTABILITY14
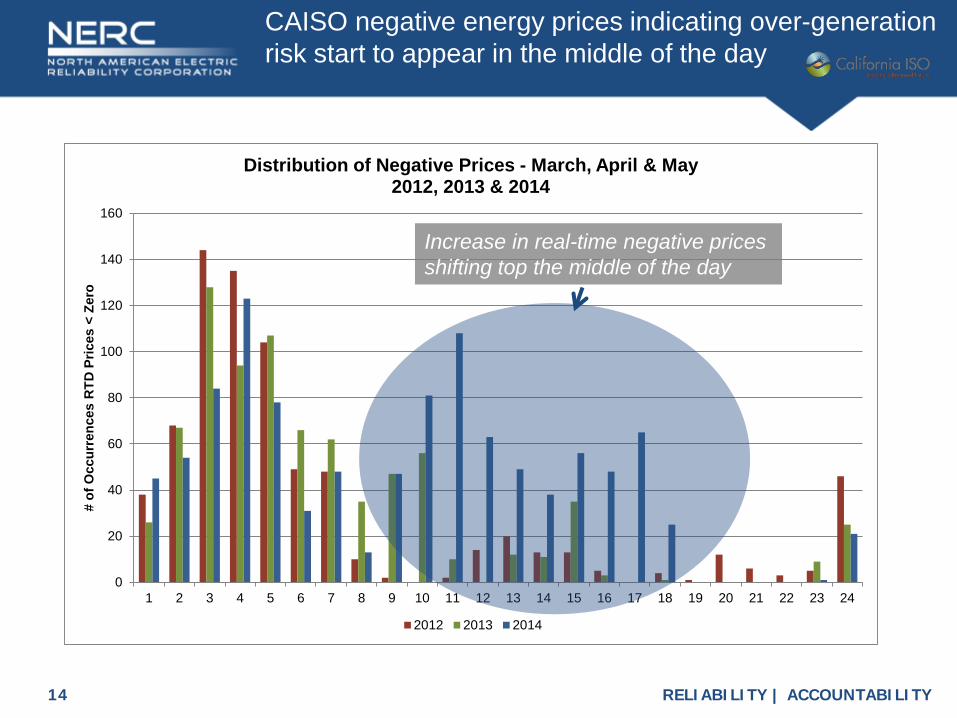
CAISO negative energy prices indicating over-generation risk start to appear in the middle of the day
Slide 14
0
20
40
60
80
100
120
140
160
1 2 3 4 5 6 7 8 9 10 11 12 13 14 15 16 17 18 19 20 21 22 23 24
# of
Occ
urre
nces
RTD
Pric
es <
Zer
o
Distribution of Negative Prices - March, April & May2012, 2013 & 2014
2012 2013 2014
Increase in real-time negative prices shifting top the middle of the day

RELIABILITY | ACCOUNTABILITY15
CAISO determination of flexible capacity for future years
• NREL’s 2005 VERs profiles were used in order to maintain the correlation between load demand and wind/solar production
• Obtain the latest PTOs assumption of VERs build-out and CPUCs RPS calculator• Calculate 1-minute net-load
Load
• Use 2005 1-minute actual load data
Wind
• Develop 1-minute wind production profiles for CREZs based on their geographic location using NREL’s 2005 wind profiles
Solar installation
• Develop 1-minute solar production profiles for CREZs based on their geographic location and technology using NREL’s 2005 solar profiles (i.e. solar thermal, solar PV tracking & solar PV fixed)
• Aggregate all new solar 1-minute production data by technology
• New CREZs does not have the load/solar correlation but the maximum 3-hour ramps during the non-summer months are highly influenced by sunset which is consistent with existing solar data Slide 15

RELIABILITY | ACCOUNTABILITY16
The need for flexibility capacity
Slide 16
Load
& N
et L
oad
(MW
)
0
1,000
2,000
3,000
4,000
5,000
6,000
7,000
8,000
9,000
14,000
16,000
18,000
20,000
22,000
24,000
26,000
28,000
30,000
32,000
34,000
Load, Wind & Solar Profiles --- Base ScenarioJanuary 2020
Net_Load Load Wind Total Solar
Win
d &
Sol
ar (M
W)
6,700 MW in 3-hours
7,000 MW in 3-hours
12,700 MW in 3-hours
Net Load = Load - Wind - Solar

RELIABILITY | ACCOUNTABILITY17
Expected 3-Hour ramping needs as more VERS are integrated into the system
Jan Feb Mar Apr May Jun Jul Aug Sep Oct Nov Dec2014_Act. 7,288 7,078 6,843 6,613 5,574 5,150 5,750 5,5772018 11,896 13,216 12,354 9,905 9,495 9,345 9,089 10,646 12,385 10,744 13,466 15,4832021 12,344 13,857 13,029 10,510 10,139 9,963 9,691 11,252 13,110 11,290 14,049 16,1162024 13,915 15,978 15,206 12,881 12,239 11,982 11,629 13,072 15,494 13,578 15,887 18,079
0
2,000
4,000
6,000
8,000
10,000
12,000
14,000
16,000
18,000
20,000
Max
imum
3-H
our f
Ram
p (M
W)
Maximum 3-Hour Ramps2014, 2018, 2021 & 2024

RELIABILITY | ACCOUNTABILITY18
Essential Reliability ServicesFlexibility Requirements –Preliminary Assessment Noha Abdel-Karim, Senior Engineer, Reliability AssessmentERSTF Meeting, Vancouver September 17-18, 2014

RELIABILITY | ACCOUNTABILITY2
• Study Objective The need to consider system flexibility to
accommodate VG characteristics and changing resource mix as part of BPS design. Study the Impact of VG on Imbalance and Net Load
Ramping Characteristics Describe the characteristics of the net load to be
served by conventional generation and the need for flexibility. Identify data requirements to support resource
adequacy assessment.
ERS - Load and Resource Balance

RELIABILITY | ACCOUNTABILITY3
• Load and Resource Balance: Operating Reserves Active Power Controlo Frequency Controlo Ramping Capability
• System Interconnections: Western ERCOT Eastern Quebec
• Data Used in Base-Case Scenario: Historical minute and hourly load profiles Simulated and historical Wind and Solar Profiles
Ramping Capabilities Modeling and Analysis

RELIABILITY | ACCOUNTABILITY4
ERCOT Interconnection - Base case Assessment
• NERC staff report provides a foundation for task force
• Framework to address ERS expected in Q4 2014:– Measures for planning and operations timeframes
– Identify parameters and performance needs
– Develop reference and guidance documents
– Coordinate initiatives, guidelines, and standards
• Final Assessment completed in Q4 20150 1,000 2,000 3,000 4,000 5,000 6,000 7,000 8,000 9,000
0
500
1000
1500
2000
2500
3000
3500
4000
MW
Freq
uenc
y of
Occ
uren
ce
Weibull Parameters:
α = 0.0036β = 1.16
Wind Statistics:
Nameplate = 18,000 MWCapacity Factor = 45%µ = 1,000 MWσ = 862 MW
0 1,000 2,000 3,000 4,000 5,000 6,000 7,000 8,000 9,0000
0.1
0.2
0.3
0.4
0.5
0.6
0.7
0.8
0.9
1
MW
Empi
rical
DCF
, F(x
)

RELIABILITY | ACCOUNTABILITY5
ERCOT – Load and Wind Characteristics
12/29/2012 12/30/2012 12/31/201225,000
30,000
35,000
40,000
45,000
MW
12/29/2012 12/30/2012 12/31/20120
1,000
2,000
3,000
4,000
MW
LoadNet Load
Wind
RELIABILITY | ACCOUNTABILITY6
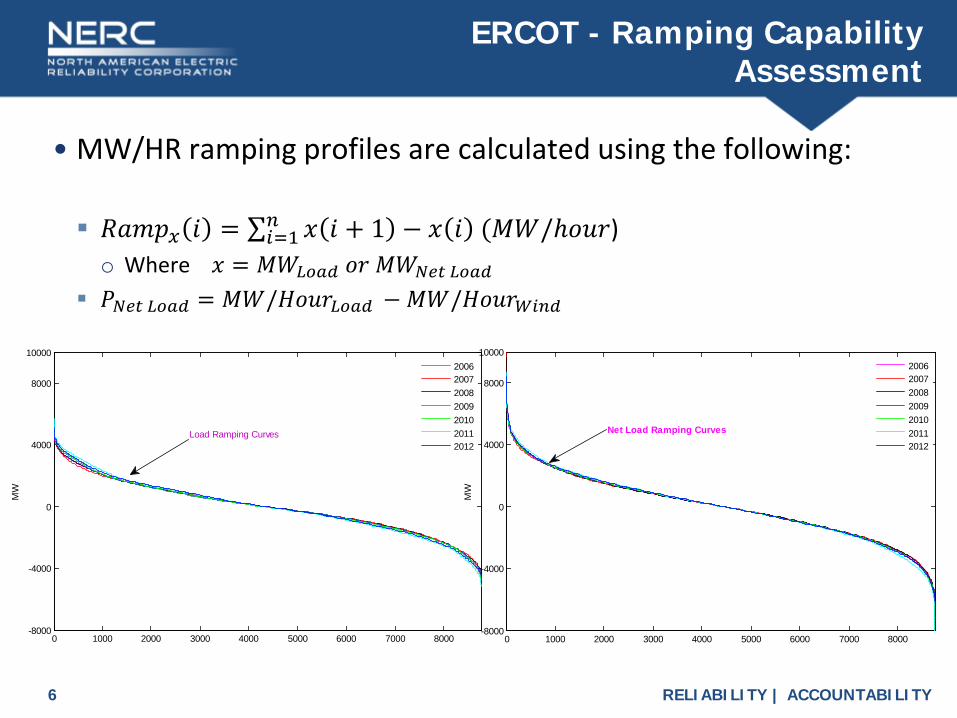
• MW/HR ramping profiles are calculated using the following:
𝑅𝑅𝑅𝑅𝑅𝑅𝑅𝑅𝑥𝑥 𝑖𝑖 = ∑𝑖𝑖=1𝑛𝑛 𝑥𝑥 𝑖𝑖 + 1 − 𝑥𝑥 𝑖𝑖 (𝑀𝑀𝑀𝑀/ℎ𝑜𝑜𝑜𝑜𝑜𝑜)o Where 𝑥𝑥 = 𝑀𝑀𝑀𝑀𝐿𝐿𝐿𝐿𝐿𝐿𝐿𝐿 𝑜𝑜𝑜𝑜 𝑀𝑀𝑀𝑀𝑁𝑁𝑁𝑁𝑁𝑁 𝐿𝐿𝐿𝐿𝐿𝐿𝐿𝐿
𝑃𝑃𝑁𝑁𝑁𝑁𝑁𝑁 𝐿𝐿𝐿𝐿𝐿𝐿𝐿𝐿 = 𝑀𝑀𝑀𝑀/𝐻𝐻𝑜𝑜𝑜𝑜𝑜𝑜𝐿𝐿𝐿𝐿𝐿𝐿𝐿𝐿 − 𝑀𝑀𝑀𝑀/𝐻𝐻𝑜𝑜𝑜𝑜𝑜𝑜𝑊𝑊𝑖𝑖𝑛𝑛𝐿𝐿
ERCOT - Ramping Capability Assessment
0 1000 2000 3000 4000 5000 6000 7000 8000-8000
-4000
0
4000
8000
10000
MW
2006200720082009201020112012
Load Ramping Curves
0 1000 2000 3000 4000 5000 6000 7000 8000-8000
-4000
0
4000
8000
10000
MW
2006200720082009201020112012
Net Load Ramping Curves
RELIABILITY | ACCOUNTABILITY70 1,000 2,000 3,000 4,000 5,000 6,000 7,000 8,000
-8000
-6000
-4000
-2000
0
2000
4000
6000
8000
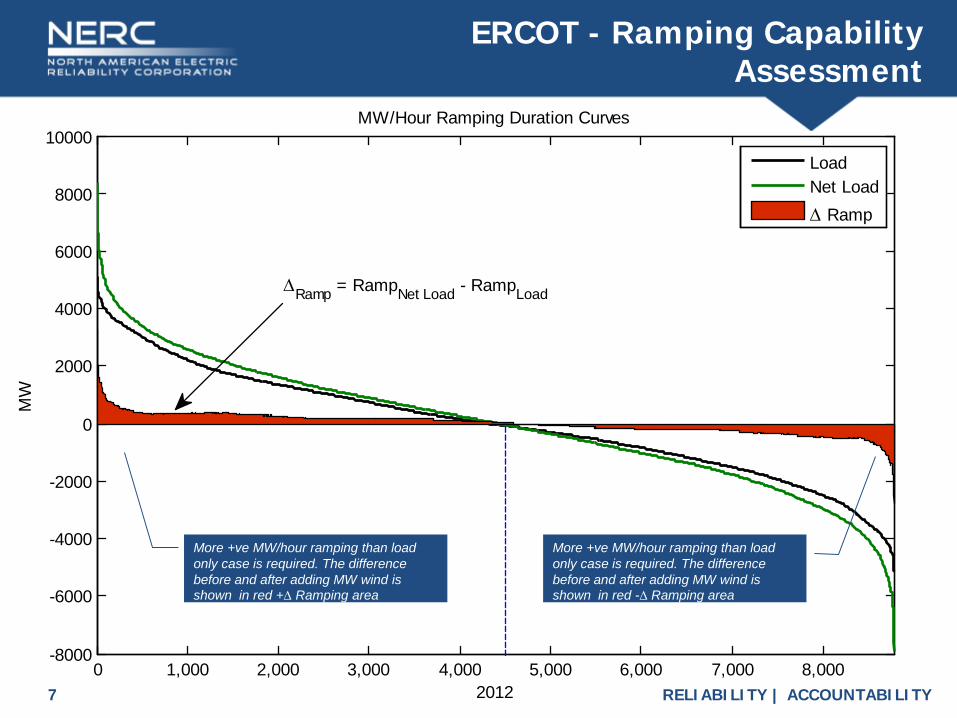
10000MW/Hour Ramping Duration Curves
2012
MW
LoadNet Load∆ Ramp
∆Ramp = RampNet Load - RampLoad
More +ve MW/hour ramping than load only case is required. The difference before and after adding MW wind is shown in red +∆ Ramping area
More +ve MW/hour ramping than load only case is required. The difference before and after adding MW wind is shown in red -∆ Ramping area
ERCOT - Ramping Capability Assessment
RELIABILITY | ACCOUNTABILITY8
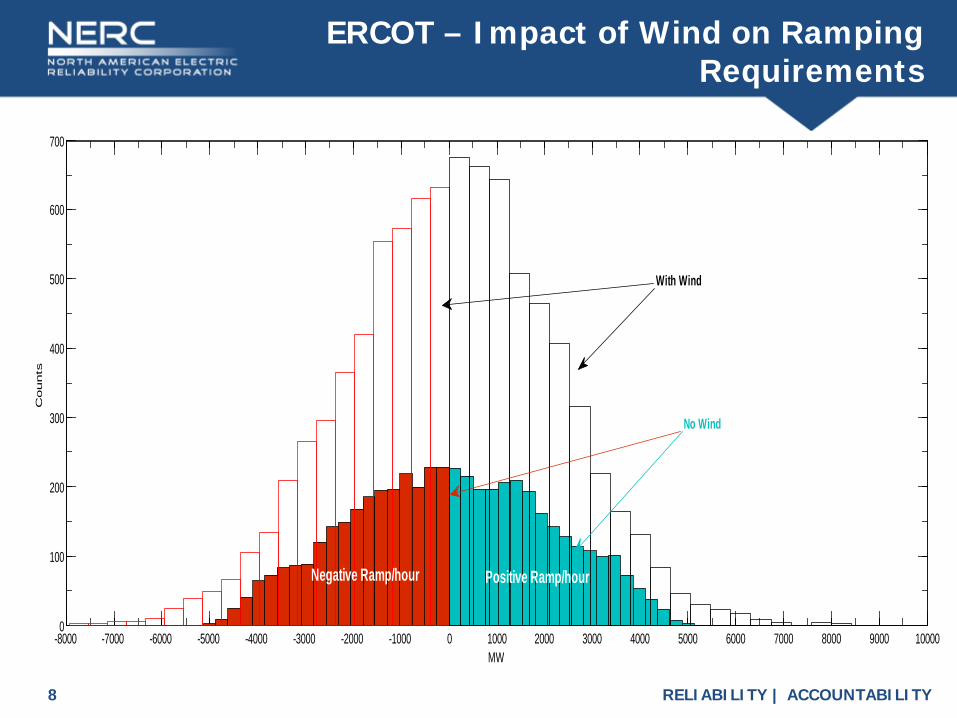
ERCOT – Impact of Wind on Ramping Requirements
-8000 -7000 -6000 -5000 -4000 -3000 -2000 -1000 0 1000 2000 3000 4000 5000 6000 7000 8000 9000 100000
100
200
300
400
500
600
700
MW
Counts
No Wind
With Wind
Positive Ramp/hourNegative Ramp/hour
RELIABILITY | ACCOUNTABILITY9
0 200 400 6000
500
1,000
1,500
2,000
2,500M
W
0 200 400 6000
100
200
300
400
500
600
MW
0 100 200 300 400 500 600 70015,000
20,000
25,000
30,000
35,000
January 2012 - Hourly Data
MW
Load Net Load
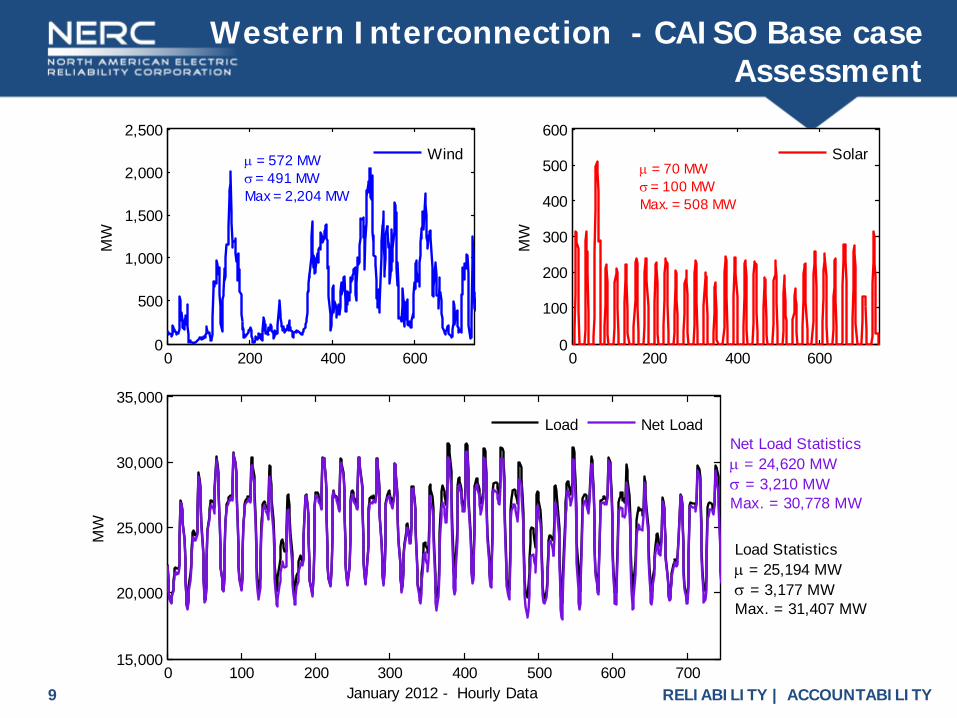
Wind Solarµ = 572 MWσ = 491 MWMax = 2,204 MW
µ = 70 MWσ = 100 MWMax. = 508 MW
Net Load Statisticsµ = 24,620 MWσ = 3,210 MWMax. = 30,778 MW
Load Statisticsµ = 25,194 MWσ = 3,177 MWMax. = 31,407 MW
Western Interconnection - CAISO Base case Assessment
RELIABILITY | ACCOUNTABILITY10
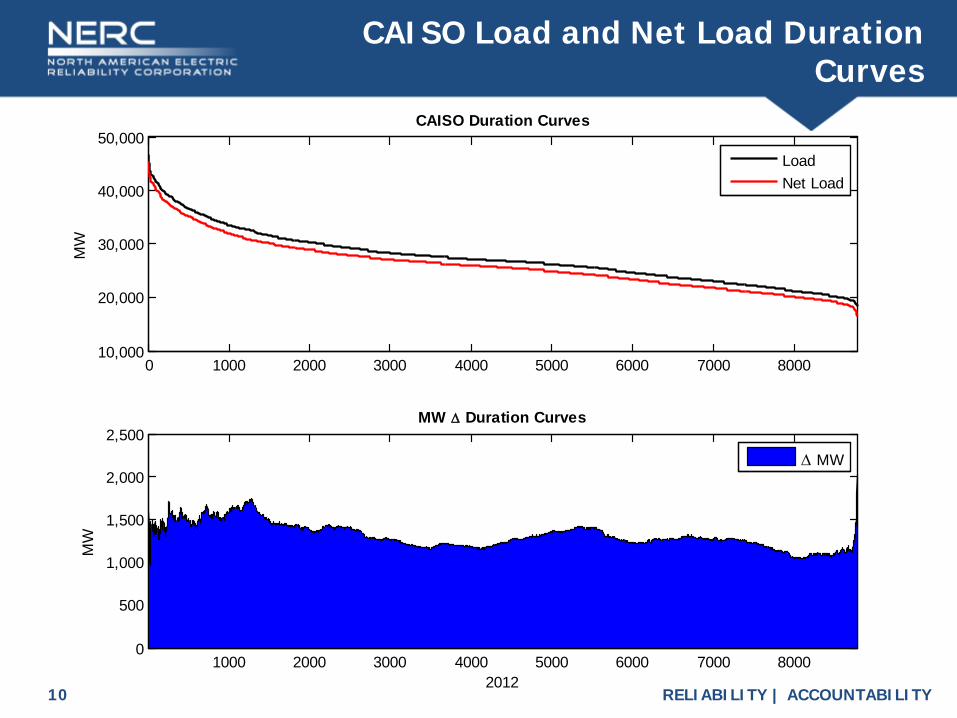
CAISO Load and Net Load Duration Curves
0 1000 2000 3000 4000 5000 6000 7000 800010,000
20,000
30,000
40,000
50,000CAISO Duration Curves
MW
1000 2000 3000 4000 5000 6000 7000 80000
500
1,000
1,500
2,000
2,500MW ∆ Duration Curves
2012
MW
LoadNet Load
∆ MW
RELIABILITY | ACCOUNTABILITY11
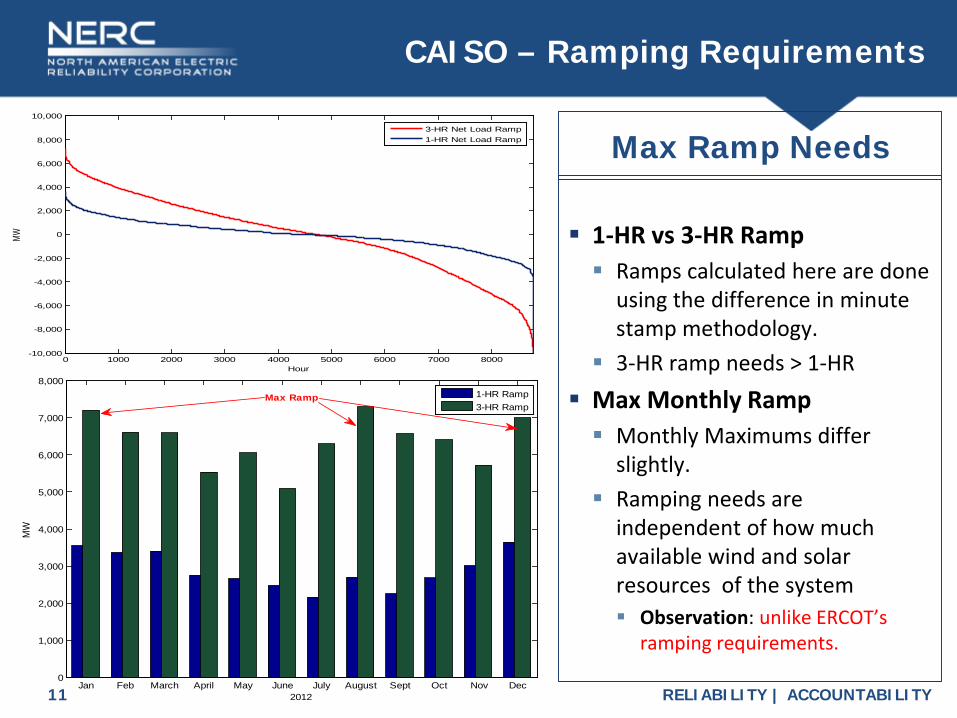
CAISO – Ramping Requirements
0 1000 2000 3000 4000 5000 6000 7000 8000-10,000
-8,000
-6,000
-4,000
-2,000
0
2,000
4,000
6,000
8,000
10,000
Hour
MW
3-HR Net Load Ramp1-HR Net Load Ramp
Jan Feb March April May June July August Sept Oct Nov Dec0
1,000
2,000
3,000
4,000
5,000
6,000
7,000
8,000
2012
MW
1-HR Ramp3-HR Ramp
Max Ramp
Max Ramp Needs
1-HR vs 3-HR Ramp Ramps calculated here are done
using the difference in minute stamp methodology.
3-HR ramp needs > 1-HR Max Monthly Ramp Monthly Maximums differ
slightly. Ramping needs are
independent of how much available wind and solar resources of the system Observation: unlike ERCOT’s
ramping requirements.
RELIABILITY | ACCOUNTABILITY12
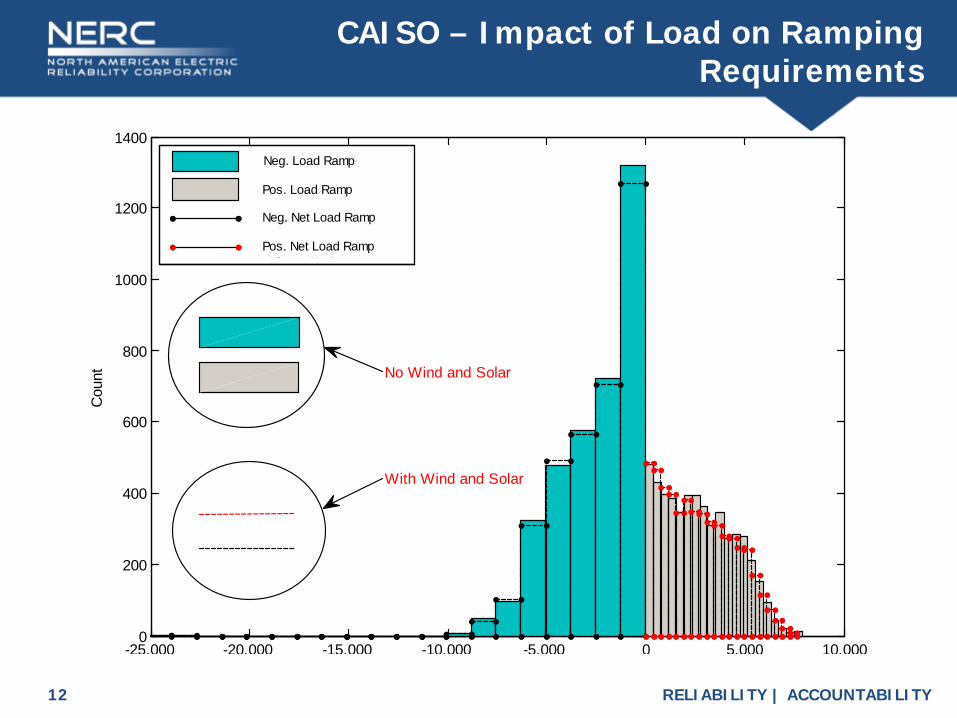
-25,000 -20,000 -15,000 -10,000 -5,000 0 5,000 10,0000
200
400
600
800
1000
1200
1400
Cou
nt
negrcountload
posrcountload
negrcountnetload
posrcountnetload
Neg. Load Ramp
Pos. Load Ramp
Neg. Net Load Ramp
Pos. Net Load Ramp
With Wind and Solar
No Wind and Solar
CAISO – Impact of Load on Ramping Requirements

RELIABILITY | ACCOUNTABILITY13
• Data Collection: identify data required to assess ramping capabilities, source, time and historical records
• VG and Base Load Generation Retirements: Study the combined impact of VG and retirements on Ramping requirements
• Forecasting Methodologies: For resource adequacy assessment, study forecasted load and VG duration curves on ramp requirements.
• Assumptions and Scenarios: Load growth System topology VG -Future planned Retirements Environmental regulations
Next Steps

RELIABILITY | ACCOUNTABILITY14
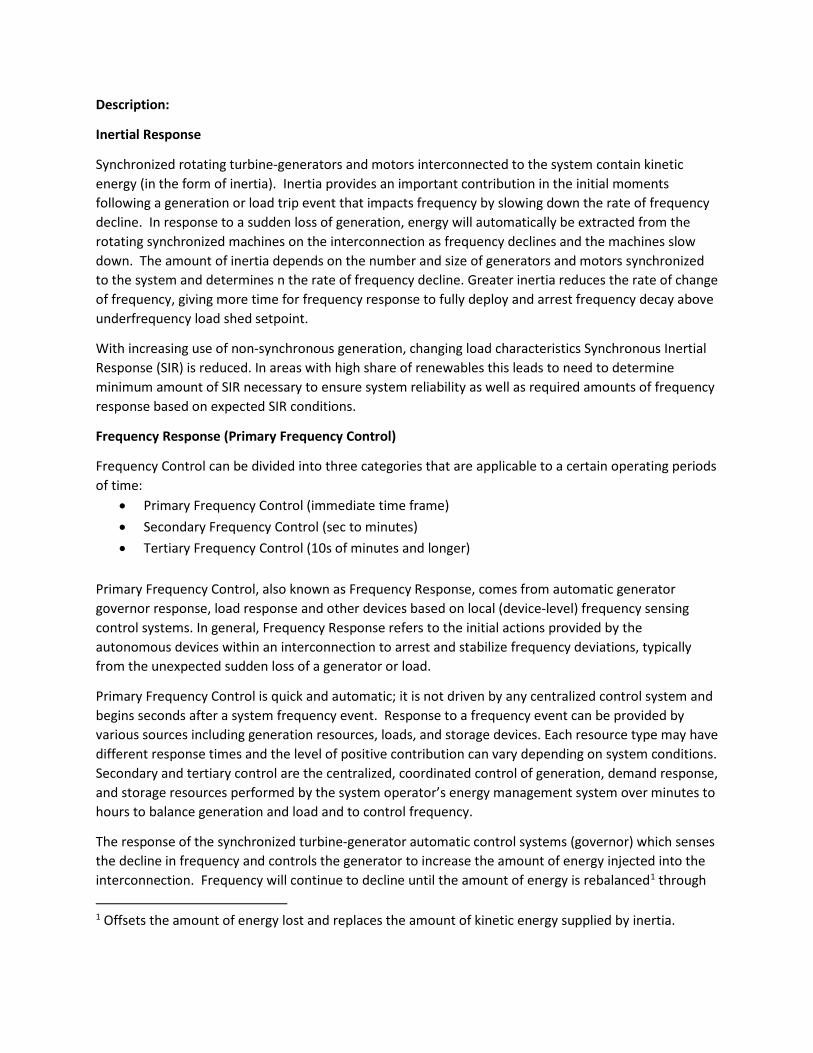
Description:
Inertial Response
Synchronized rotating turbine-generators and motors interconnected to the system contain kinetic energy (in the form of inertia). Inertia provides an important contribution in the initial moments following a generation or load trip event that impacts frequency by slowing down the rate of frequency decline. In response to a sudden loss of generation, energy will automatically be extracted from the rotating synchronized machines on the interconnection as frequency declines and the machines slow down. The amount of inertia depends on the number and size of generators and motors synchronized to the system and determines n the rate of frequency decline. Greater inertia reduces the rate of change of frequency, giving more time for frequency response to fully deploy and arrest frequency decay above underfrequency load shed setpoint.
With increasing use of non-synchronous generation, changing load characteristics Synchronous Inertial Response (SIR) is reduced. In areas with high share of renewables this leads to need to determine minimum amount of SIR necessary to ensure system reliability as well as required amounts of frequency response based on expected SIR conditions.
Frequency Response (Primary Frequency Control)
Frequency Control can be divided into three categories that are applicable to a certain operating periods of time:
• Primary Frequency Control (immediate time frame) • Secondary Frequency Control (sec to minutes) • Tertiary Frequency Control (10s of minutes and longer)
Primary Frequency Control, also known as Frequency Response, comes from automatic generator governor response, load response and other devices based on local (device-level) frequency sensing control systems. In general, Frequency Response refers to the initial actions provided by the autonomous devices within an interconnection to arrest and stabilize frequency deviations, typically from the unexpected sudden loss of a generator or load.
Primary Frequency Control is quick and automatic; it is not driven by any centralized control system and begins seconds after a system frequency event. Response to a frequency event can be provided by various sources including generation resources, loads, and storage devices. Each resource type may have different response times and the level of positive contribution can vary depending on system conditions. Secondary and tertiary control are the centralized, coordinated control of generation, demand response, and storage resources performed by the system operator’s energy management system over minutes to hours to balance generation and load and to control frequency.
The response of the synchronized turbine-generator automatic control systems (governor) which senses the decline in frequency and controls the generator to increase the amount of energy injected into the interconnection. Frequency will continue to decline until the amount of energy is rebalanced1 through
1 Offsets the amount of energy lost and replaces the amount of kinetic energy supplied by inertia.
the automatic control actions of Primary Frequency Response resources. Greater inertia reduces the rate of change of frequency, giving more time for governors to respond.
Recommendation:
In order to measure Frequency Response performance a metric is needed at the interconnection level to show how the individual interconnections are performing and a second metric is needed at the Balancing Authority (BA) level to measure BA Frequency Response performance. The BAs will need to measure performance of individual resources in order to identify issues that are affecting their Balancing Authority Area.
Interconnection Level
ALR1-12 is a metric used to track and monitor Interconnection Frequency Response. Frequency Response is a measure of an Interconnection’s ability to stabilize frequency immediately following the sudden loss of generation or load. It is defined as the sum of the change in demand and the change in generation, divided by the change in frequency, expressed in megawatts per 0.1 Hertz (MW/0.1 Hz).
ALR1-12 frequency event detection methodologies are being refined to make them more meaningful and aligned with the implementation of NERC Reliability Standard BAL-003-1.
There is no need for additional metrics at the interconnection level at this time.
BA Level
BAL-003-1 has been approved by FERC and awaiting implementation in April 2015. BAs will begin collecting data in December 2014 and the first reporting period to NERC will be January 2016 where BAs will begin filling out the appropriate forms in support of bias calculations for 2016.
BAs will need to determine the minimum Synchronous Inertial Response (SIR) in order to meet BAL -003-1 while integrating non-synchronous variable generation in resource mix. It is proposed that SIR is monitored in real time at the interconnection or BA level to ensure that SIR is above pre-determined minimum requirement for the interconnection. Criteria outlined in BAL-003-1, i.e. for largest category C event to prevent first step of underfrequency load shed will drive minimum SIR needs.
The BAs will need to collect data (inertia constant, MVA rating) from individual resources in order to make SIR calculation possible. Additionally in order to determine minimum SIR requirements system load damping needs to be estimated (in % per Hertz).
It is also recommended that in the interconnections with high share of non-synchronous generation project future SIR trends based on historical SIR information and planned new non-synchronous generation projects in the interconnection queue (e.g. with signed interconnection agreements and financial commitments). These projections will help a BA to anticipate decreasing SIR conditions and to develop appropriate measures for support of minimum SIR requirement.
The first metric report will potentially be available in January 2018.
Resource Level
The individual resource level is too granular to measure at the interconnection level. However, resource performance may be measured at the BA level as needed by the individual BA to manage their
Frequency Response performance under BAL-003-1. The first recommendation of the NERC Frequency Response Initiative Report (FRI Report) states “NERC should embark immediately on the development of a NERC Frequency Response Resource Guideline to define the performance characteristics expected of those resources for supporting reliability.” The recommendation goes on to describe the parameters of the recommended guideline. The NERC staff has been developing a Reliability Guideline to identify the characteristics of Frequency Response and resource performance. They will be seeking input and concurrence of the NERC Resources Subcommittee (RS) and approval by the NERC Operating Committee (OC).
Conclusion
There is a need to add a metric to measure Synchronous Inertial Response (SIR) to assess the state of the various interconnections. This will require the collection of data from the BAs tied to BAL-003-1. The FR Team is working to develop a strawman for a metric.
Inertial Response in ERCOT
Julia Matevosyan, PhDSr. Planning EngineerResource AdequacyERCOT

• SIR is stored kinetic energy that is extracted from the rotating mass of synchronous machines following a disturbance in a power system
• SIR can be provided by synchronous machines, whenever in operation.
• Quantity of inertia contribution is determined as 2 x Kinetic Energy that can be provided by a synchronous machine during system imbalance:
2·H·MVA
• where H is machine inertia constant in seconds, MVA is machine’s rated power
• SIR is based on actual physical characteristics of a machine • SIR is independent of machine’s operating point.
Synchronous Inertial Response
2
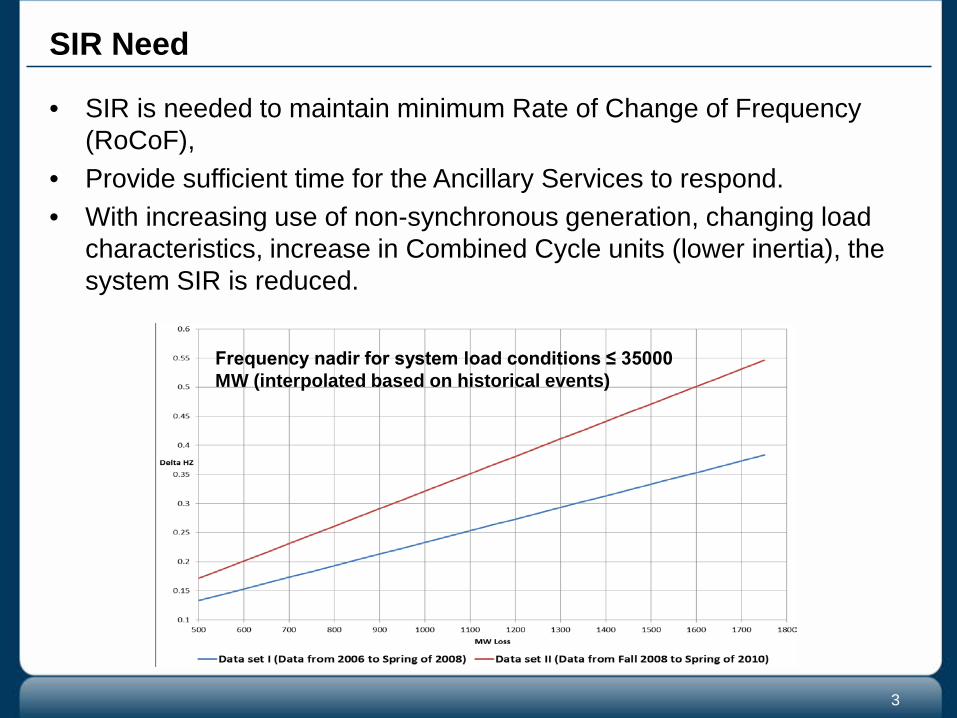
• SIR is needed to maintain minimum Rate of Change of Frequency (RoCoF),
• Provide sufficient time for the Ancillary Services to respond.• With increasing use of non-synchronous generation, changing load
characteristics, increase in Combined Cycle units (lower inertia), the system SIR is reduced.
SIR Need
Frequency nadir for system load conditions ≤ 35000 MW (interpolated based on historical events)
3
4
y = 4.5286x + 60964R² = 0.8924
100000
150000
200000
250000
300000
350000
10000 15000 20000 25000 30000 35000 40000 45000 50000 55000 60000
Kin
etic
Ene
rgy
(MW
∙s)
Net Load (MW)
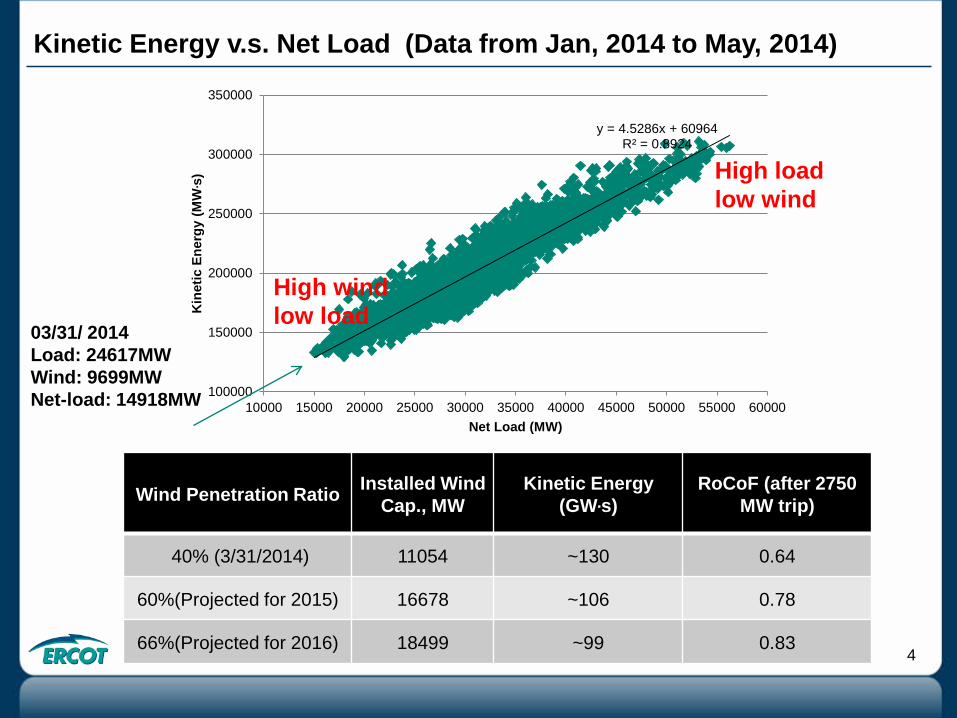
03/31/ 2014 Load: 24617MWWind: 9699MWNet-load: 14918MW
Wind Penetration Ratio Installed Wind Cap., MW
Kinetic Energy (GW∙s)
RoCoF (after 2750 MW trip)
40% (3/31/2014) 11054 ~130 0.64
60%(Projected for 2015) 16678 ~106 0.78
66%(Projected for 2016) 18499 ~99 0.83
Kinetic Energy v.s. Net Load (Data from Jan, 2014 to May, 2014)
High wind low load
High load low wind
5
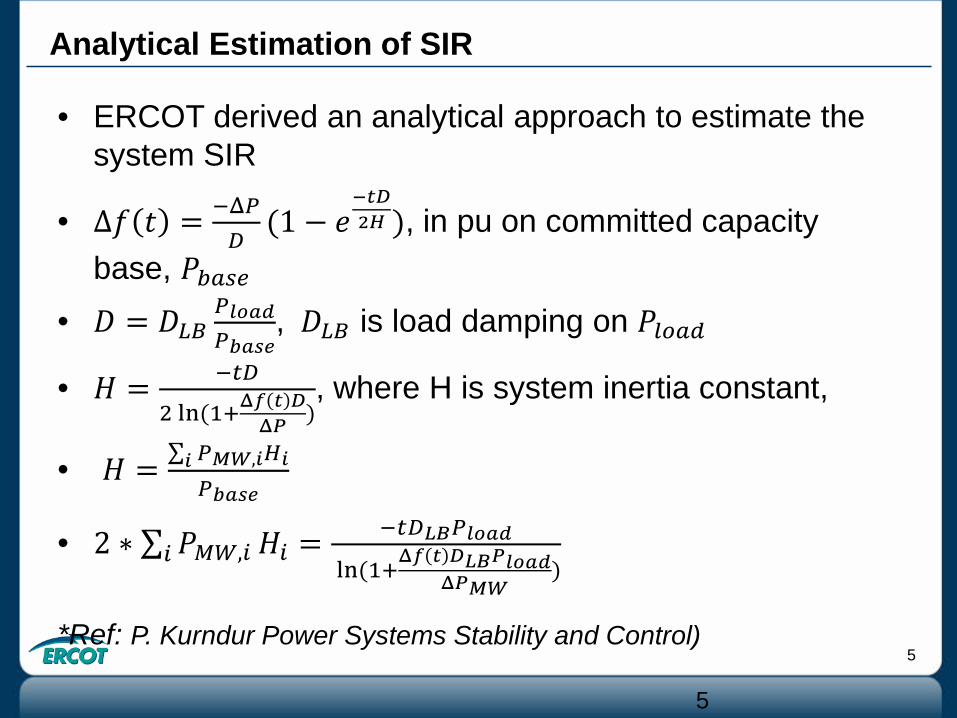
• ERCOT derived an analytical approach to estimate the system SIR
• Δ𝑓𝑓 𝑡𝑡 = −Δ𝑃𝑃𝐷𝐷
(1 − 𝑒𝑒−𝑡𝑡𝑡𝑡2𝐻𝐻 ), in pu on committed capacity
base, 𝑃𝑃𝑏𝑏𝑏𝑏𝑏𝑏𝑏𝑏• 𝐷𝐷 = 𝐷𝐷𝐿𝐿𝐿𝐿
𝑃𝑃𝑙𝑙𝑙𝑙𝑙𝑙𝑙𝑙𝑃𝑃𝑏𝑏𝑙𝑙𝑏𝑏𝑏𝑏
, 𝐷𝐷𝐿𝐿𝐿𝐿 is load damping on 𝑃𝑃𝑙𝑙𝑙𝑙𝑏𝑏𝑙𝑙
• 𝐻𝐻 = −𝑡𝑡𝐷𝐷
2 ln(1+Δ𝑓𝑓 𝑡𝑡 𝑡𝑡Δ𝑃𝑃 )
, where H is system inertia constant,
• 𝐻𝐻 = ∑𝑖𝑖 𝑃𝑃𝑀𝑀𝑀𝑀,𝑖𝑖𝐻𝐻𝑖𝑖𝑃𝑃𝑏𝑏𝑙𝑙𝑏𝑏𝑏𝑏
• 2 ∗ ∑𝑖𝑖 𝑃𝑃𝑀𝑀𝑀𝑀,𝑖𝑖 𝐻𝐻𝑖𝑖 = −𝑡𝑡𝐷𝐷𝐿𝐿𝐿𝐿𝑃𝑃𝑙𝑙𝑙𝑙𝑙𝑙𝑙𝑙ln(1+Δ𝑓𝑓 𝑡𝑡 𝑡𝑡𝐿𝐿𝐿𝐿𝑃𝑃𝑙𝑙𝑙𝑙𝑙𝑙𝑙𝑙
Δ𝑃𝑃𝑀𝑀𝑀𝑀)
*Ref: P. Kurndur Power Systems Stability and Control)
Analytical Estimation of SIR
5
6
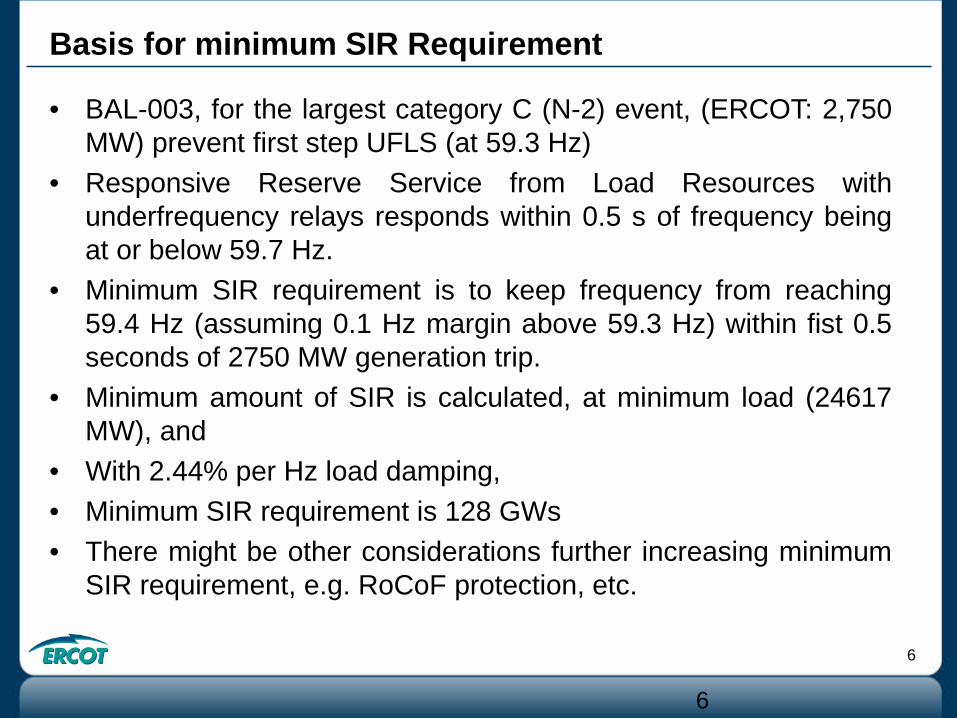
• BAL-003, for the largest category C (N-2) event, (ERCOT: 2,750MW) prevent first step UFLS (at 59.3 Hz)
• Responsive Reserve Service from Load Resources withunderfrequency relays responds within 0.5 s of frequency beingat or below 59.7 Hz.
• Minimum SIR requirement is to keep frequency from reaching59.4 Hz (assuming 0.1 Hz margin above 59.3 Hz) within fist 0.5seconds of 2750 MW generation trip.
• Minimum amount of SIR is calculated, at minimum load (24617MW), and
• With 2.44% per Hz load damping,• Minimum SIR requirement is 128 GWs• There might be other considerations further increasing minimum
SIR requirement, e.g. RoCoF protection, etc.
Basis for minimum SIR Requirement
6
7
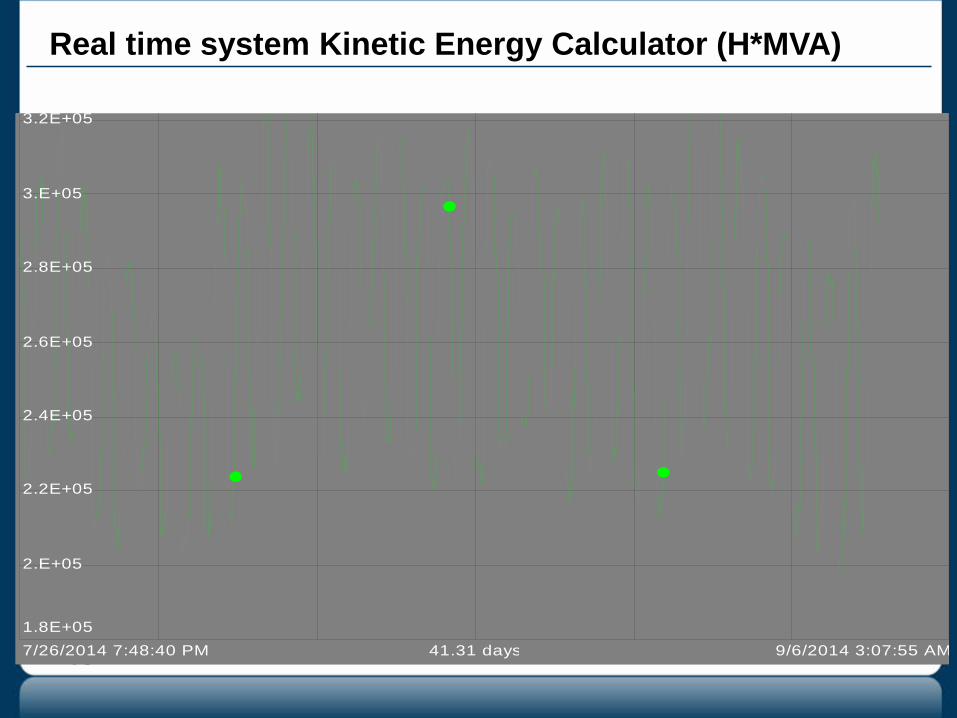
Real time system Kinetic Energy Calculator (H*MVA)
9/6/2014 3:07:55 AM7/26/2014 7:48:40 PM 41.31 days
1.8E+05
2.E+05
2.2E+05
2.4E+05
2.6E+05
2.8E+05
3.E+05
3.2E+05

8
• Determine minimum SIR for the system
• Monitor SIR in real time to make sure it stays above minimum SIR requirement
• Project future SIR based on planned non-synchronous generation projects with SIAs and financial commitments.
• Determine spinning and contingency reserve requirements based on expected SIR conditions (examples on the next slides)
Proposed Measures
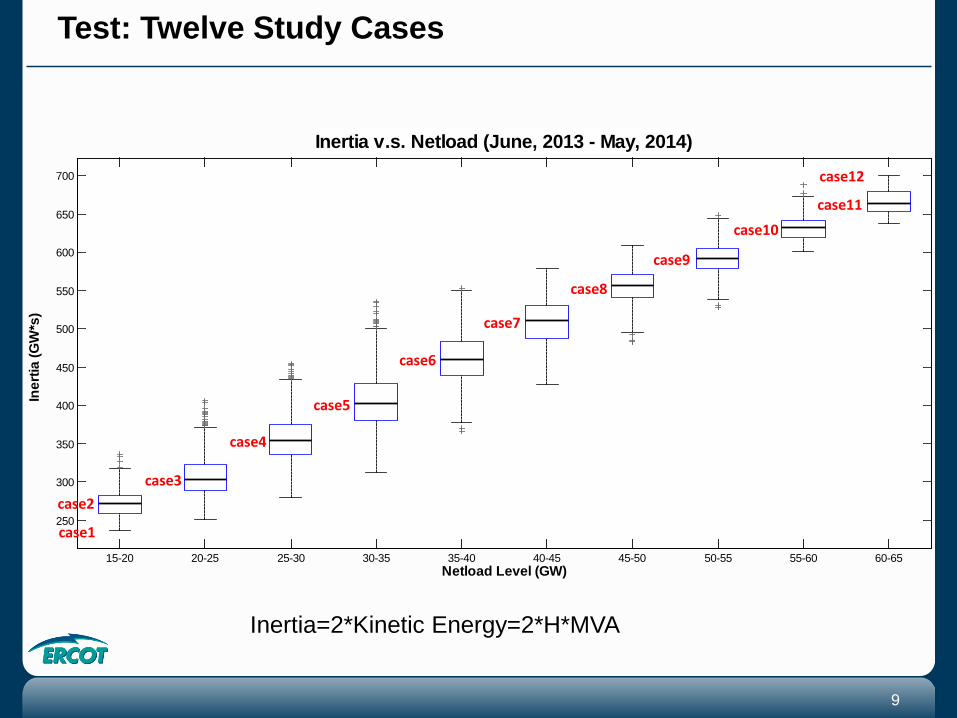
Test: Twelve Study Cases
15-20 20-25 25-30 30-35 35-40 40-45 45-50 50-55 55-60 60-65
250
300
350
400
450
500
550
600
650
700
Netload Level (GW)
Iner
tia (G
W*s
)
Inertia v.s. Netload (June, 2013 - May, 2014)
case1
case2case3
case4
case5
case6
case7
case8
case9
case10case11
case12
Inertia=2*Kinetic Energy=2*H*MVA
9

10
In ERCOT’s Future Ancillary Framework Spinning Reserve is split in two Ancillary Services Primary Frequency Response Service (PFR, governor response) and Fast Frequency Response (FFR, mainly load resources with underfrequency relays).
Criteria : Frequency nadir shall be equal to or above 59.4 Hz for loss of two largest units. (0.1 Hz margin for the first stage of UFLS at 59.3 Hz)
No angular and voltage instability
Study will determine the following parameters for different SIR conditions Minimum amount of PFRS Needed amount of FFR Equivalency ratio between PFRS and FFRS
No high frequency over-shoot
Spinning Reserve Requirements for different SIR levels
10

Minimum Amount of PFR:• BAL-003-1: The ERCOT Interconnection Frequency
Response Obligation (IFRO) is currently 413MW/0.1 Hz• No FFR Response is expected for 0.3 Hz band
between 60 Hz and 59.70 Hz• PFR(min) = 413 MW/0.1 Hz * 3 (since FFR does not
respond up to 0.3 Hz deviation) = 1,239 MW
Minimum PFR can be changed based on annual review ofIFRO by NERC
Minimum PFR Requirement
11
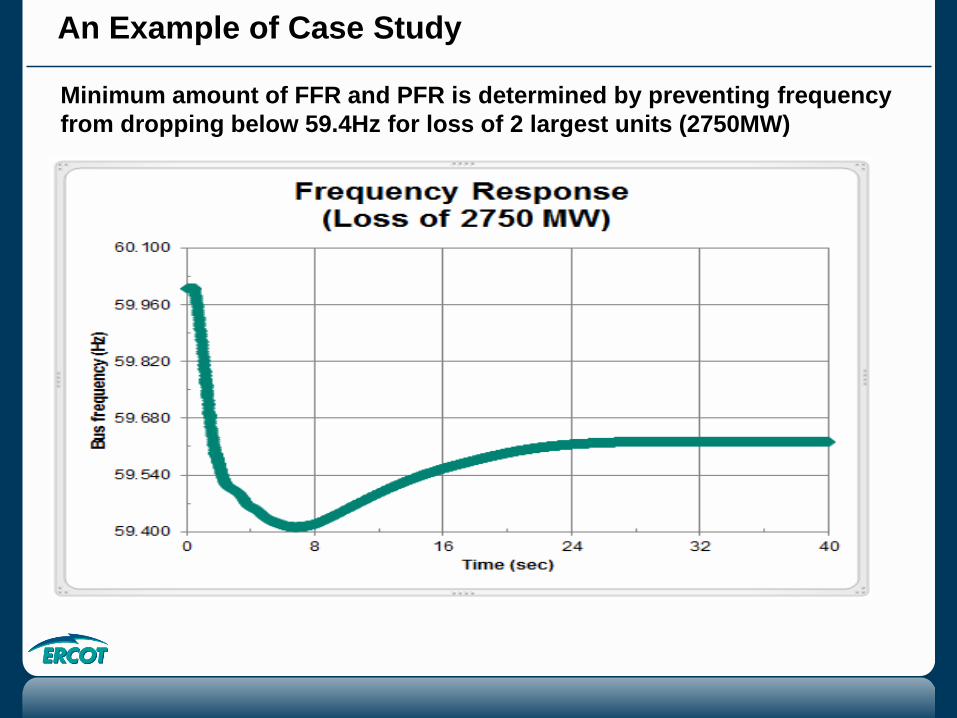
An Example of Case Study
Minimum amount of FFR and PFR is determined by preventing frequency from dropping below 59.4Hz for loss of 2 largest units (2750MW)
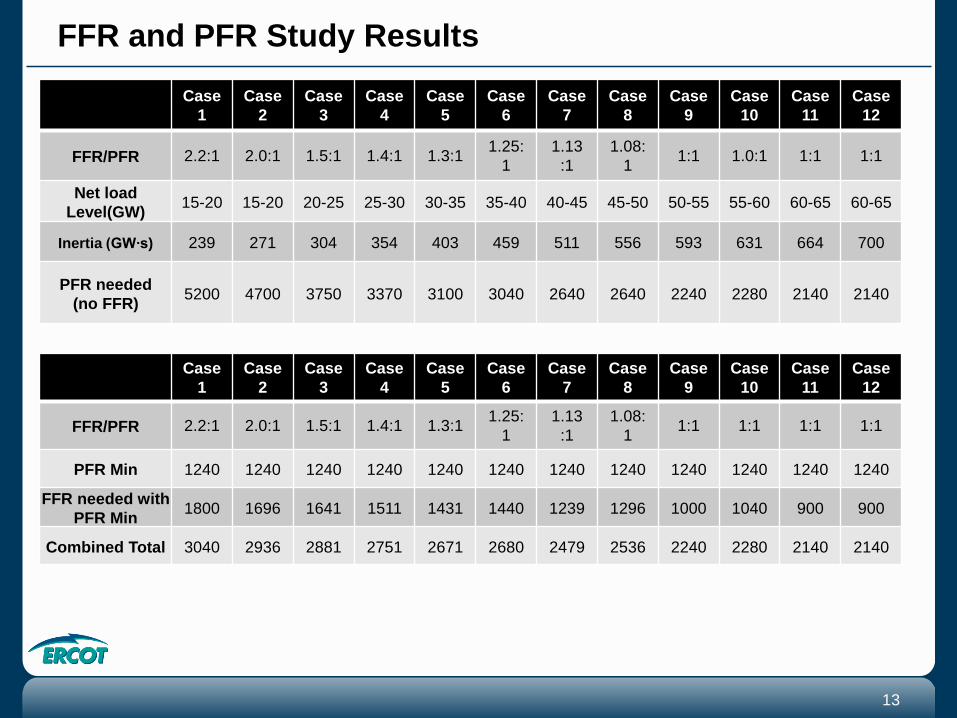
FFR and PFR Study ResultsCase
1Case
2Case
3Case
4Case
5Case
6Case
7Case
8Case
9Case
10Case
11Case
12
FFR/PFR 2.2:1 2.0:1 1.5:1 1.4:1 1.3:1 1.25:1
1.13 :1
1.08:1 1:1 1.0:1 1:1 1:1
Net load Level(GW) 15-20 15-20 20-25 25-30 30-35 35-40 40-45 45-50 50-55 55-60 60-65 60-65
Inertia (GW∙s) 239 271 304 354 403 459 511 556 593 631 664 700
PFR needed(no FFR) 5200 4700 3750 3370 3100 3040 2640 2640 2240 2280 2140 2140
Case1
Case2
Case3
Case4
Case5
Case6
Case7
Case8
Case9
Case10
Case11
Case12
FFR/PFR 2.2:1 2.0:1 1.5:1 1.4:1 1.3:1 1.25:1
1.13 :1
1.08:1 1:1 1:1 1:1 1:1
PFR Min 1240 1240 1240 1240 1240 1240 1240 1240 1240 1240 1240 1240
FFR needed with PFR Min 1800 1696 1641 1511 1431 1440 1239 1296 1000 1040 900 900
Combined Total 3040 2936 2881 2751 2671 2680 2479 2536 2240 2280 2140 2140
13
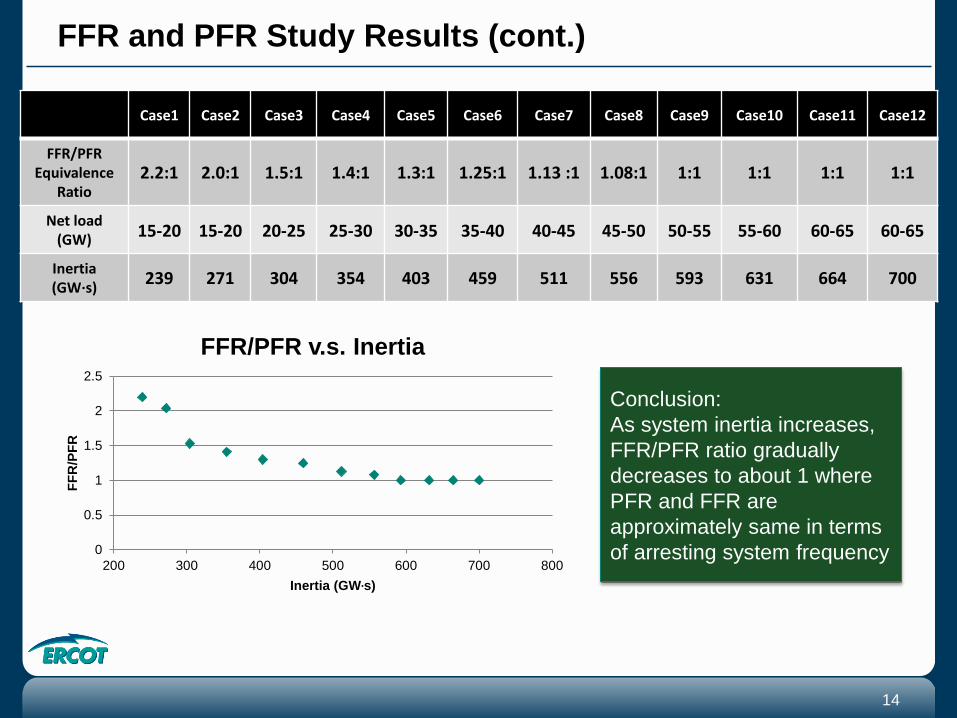
FFR and PFR Study Results (cont.)
Case1 Case2 Case3 Case4 Case5 Case6 Case7 Case8 Case9 Case10 Case11 Case12
FFR/PFREquivalence
Ratio2.2:1 2.0:1 1.5:1 1.4:1 1.3:1 1.25:1 1.13 :1 1.08:1 1:1 1:1 1:1 1:1
Net load (GW) 15-20 15-20 20-25 25-30 30-35 35-40 40-45 45-50 50-55 55-60 60-65 60-65
Inertia(GW∙s) 239 271 304 354 403 459 511 556 593 631 664 700
Conclusion:As system inertia increases, FFR/PFR ratio gradually decreases to about 1 where PFR and FFR are approximately same in terms of arresting system frequency0
0.5
1
1.5
2
2.5
200 300 400 500 600 700 800
FFR
/PFR
Inertia (GW∙s)
FFR/PFR v.s. Inertia
14
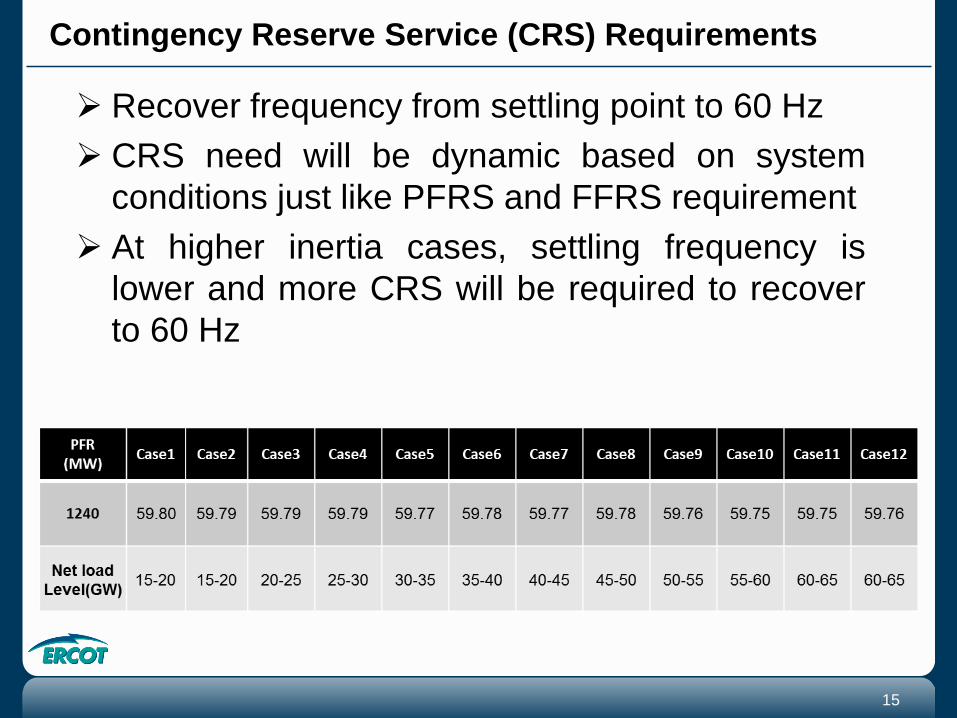
Recover frequency from settling point to 60 Hz CRS need will be dynamic based on system
conditions just like PFRS and FFRS requirement At higher inertia cases, settling frequency is
lower and more CRS will be required to recoverto 60 Hz
Contingency Reserve Service (CRS) Requirements
15

Available Capacity Reliability A reliable grid must have generation providing these services not just the MW capability Anticipated generation retirements by 2015 = ZZZZ MW Additional retirements due to 111(d) (EPA estimate) = YYYY MW Replacement Resources are not currently providing or designed to provide these essential reliability services
Grid Reliability Concerns due to the Changing Resource Mix The Bulk Electric System (BES) in North America is currently undergoing a significant change in the mix of generation resources due to unit retirements as a result of new environmental regulations. The rate of change is unlike anything experienced by the industry to date. The primary impact of the new regulations is seen in the significant retirement of conventional coal-fired generation which will only increase in the next few years. These retirements will be replaced by gas fired generation coupled with Variable Energy Resources (VER), such as wind, solar and distributed generation. This change in generation resource mix will change the operational characteristics of the grid and raises concerns about the ability of operators to maintain the reliability of the BES. The key characteristics of a reliable grid can be categorized into 3 main groupings: 1) Load & Resource Balancing; 2) Voltage and Reactive Load Support and 3) Frequency Response. Impact of Retirements: Generating units scheduled for retirement inherently provide these necessary ingredients as a function of their design and operation which allow the electric grid to operate reliably under standards established by NERC. Replacement Resources: Certain types of VERs can be equipped to provide some form of these characteristics; however, the functionality is not typically installed due to cost. Newer gas-fired units generally have the capability of providing these services, but are not always set up operationally to provide these characteristics. As the generation resource mix evolves, the reliability of the electric grid depends on the operating characteristics of the replacement resources to ensure grid reliability. Capacity (Steel in the Ground): Merely having available capacity does not equate to having the necessary reliability services. It is essential for the electric grid to have generation resources with the capability to provide these services. There are no standards mandating any replacement units to have essential reliability services capability built into their designs. The absence of such
standards could have widespread negative implications during this transition period and threaten the integrity of the bulk electric system. Load & Resource Balancing: The ability to
raise and lower generation or load under normal or contingency conditions to ensure a balance. Retiring steam turbine units tend to have a large load range so that they are able to respond to minute-by-minute load demands. Voltage and Reactive Load Support: The transmission system alone cannot provide the reactive support to keep voltage and
reactive load at required levels. Retiring generating units often provide this support. Frequency Response: The U.S. bulk electricity system – from the largest generating units to small home appliances – is designed to operate at a frequency of 60 hertz. Significant deviation from 60 hertz can have destructive effects on motors and equipment of all sizes and types. Steam turbines typically respond well to maintain frequency within the appropriate bounds.
So what should we do?

NERC Proactively Establishes Task Force to Review
- NERC establishes the Essential Reliability Services Task Force (ERSTF) March 2014. - Charged with assessing the reliability impacts of the changes in the generation resource
mix. - Focused on developing new, or incorporating existing, methods to assess the current and
potential future states of grid reliability - Goal is to enable the various regions of North America to consistently assess the impacts
and develop plans to address any shortfalls – not define specific solutions Points to Consider
- Varying topology and operational needs within the multiple regions of North America - Potential for multiple ways to address any identified shortfalls in the key reliability
characteristics What Was the Result? Load & Resource Balancing
- Additional points to be made here More detailed definition of the essential reliability characteristics necessary for reliable operation of the grid. Appropriate methods and metrics to assess the current and potential future states as well as defining the data necessary for assessment. Voltage and Reactive Load Support
- Additional points to be made here Frequency Response
- Additional points to be made here
How can you help?
Policy Decisions are Critical
- Points to make to policy makers……
- Federal, state, and local policy decisions can impact changes in the resource mix and thus, also impact the reliability of the BES.
- Careful consideration needs to be given to unintended consequences of certain policy decisions.
- The assessment methods developed and recommended by the NERC ERSTF will assist in informing policy makers of the impacts.

Essential Reliability Services – Will they be sufficient?
Transmission Grid ReliabilityOperators need generation resources to supply ERS to
maintain reliability
Load & Resource Balancing
- Continuous balancing of load and generation
- Additional points…
Voltage Control & Reactive Support
- Maintain voltage within tolerable range
- Additional points…
Frequency Support
- Maintain frequency at 60 Hz
- Additional points…
Coal generation traditionally provided these essential reliability services. Retiring coal units being replaced by new gas and variable (solar/wind) generation which are not providing these services either due to cost concerns or not properly valuing these
services.