Embed Size (px)
Citation preview
Errors in Survey Measurements
Random v. Systematic
Presentation by Tom Arneson for the 2011 MSPS Conference
1
Classifications of Survey Errors
Mistakes or Blunders
Systematic errors
Random errors
2
Mistakes or Blunders
These are not really errors, under error theory, but they
are the one of the main reasons why surveyors purchase
errors and omissions insurance.
Some examples are:
Transposing digits i.e. writing 144.03 instead of 114.03
Recording the wrong point number for a traverse point.
Not recording a change in prism pole height.
Blunders that cause large errors in the final survey are
usually detected by normal survey checks, however small
blunders may remain undetected.
3
Systematic Errors
Systematic errors, or biases errors, result from the
physical properties of the measuring system.
Systematic errors are constant under constant measuring
conditions and change as conditions change. A classical
example is the change in length of a tape as the
temperature changes.
4

Correcting Systematic Errors
5
Because systematic errors are caused by the physics of the
measurement system, they can be mathematically
modeled and corrections computed to offset these
errors. For example temperature correction for a steel
tape:
Where k is a constant:, (6.45x10⁻⁶ for degrees Fahrenheit) ;
Tm is the temperature of the tape; Ts is the standard
temperature; and L is the uncorrected length measured. If the
temperature is above standard, then the tape is too long, and
a measured distance will be too short.

Total Station EDM Corrections for
Systematic Errors
6
The EDM (Electronic Distance Measurement) part of a total station measures distances using light waves. The velocity of light in air varies according to the air density. If the operator enters air temperature and pressure, the systematic error caused by this variation is corrected by most total stations.
The atmospheric pressure reported by The National Weather Service and used in weather reports is not an actual pressure. It is corrected to sea level pressure, so that a stated pressure means the same thing, as far as weather trends go, in areas of different elevations. For example an pressure of 30.10 inches of mercury (inHg) at Boston, near sea level, corresponds to an actual pressure of 24.79 inHg at Denver, which is about 5000 feet elevation.
If the survey not at sea level, using sea level pressure introduces a systematic error. This error, of course, increases with elevation. Ignoring the correction at an elevation of 900 feet causes a distance error of about 10 ppm (parts per million).
Correcting Sea Level Pressure
7
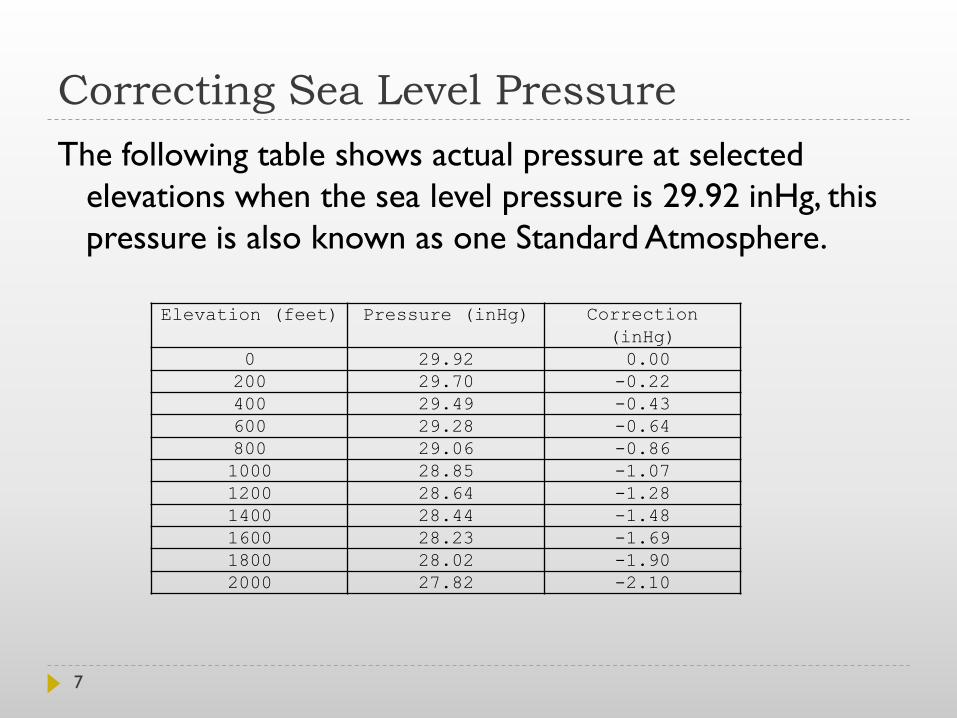
The following table shows actual pressure at selected
elevations when the sea level pressure is 29.92 inHg, this
pressure is also known as one Standard Atmosphere.
Elevation (feet) Pressure (inHg) Correction
(inHg)
0 29.92 0.00
200 29.70 -0.22
400 29.49 -0.43
600 29.28 -0.64
800 29.06 -0.86
1000 28.85 -1.07
1200 28.64 -1.28
1400 28.44 -1.48
1600 28.23 -1.69
1800 28.02 -1.90
2000 27.82 -2.10
8
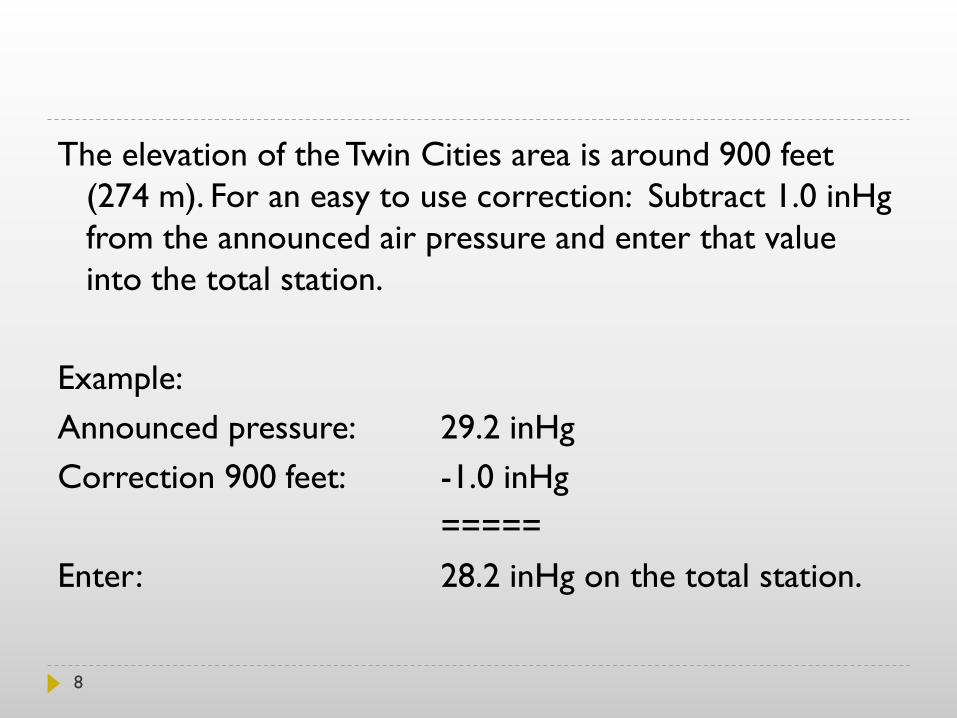
The elevation of the Twin Cities area is around 900 feet
(274 m). For an easy to use correction: Subtract 1.0 inHg
from the announced air pressure and enter that value
into the total station.
Example:
Announced pressure: 29.2 inHg
Correction 900 feet: -1.0 inHg
=====
Enter: 28.2 inHg on the total station.
Random Errors
Remain after mistakes are prevented or eliminated and
measurements corrected for systematic errors
Random errors are as likely to be positive as negative
Small random errors are much more likely than large
ones.
Study of random errors began in the 18th Century
9
Carl Friedrich Gauss
Gauss was a German mathematician and scientist who
contributed significantly to many fields, including number
theory, statistics, analysis, differential geometry, geodesy,
geophysics, electrostatics, astronomy, and optics.
Although others also worked on random error theory,
Carl Gauss got much of the credit, to the extent that
Germany honored him on the Ten-Mark note. (This note
is obsolete since the advent of the common European
currency, the Euro.)
10

Ten Mark Bill honoring Carl Gauss
11

Reverse of 10-Mark bill showing a
triangulation diagram and a sextant
12
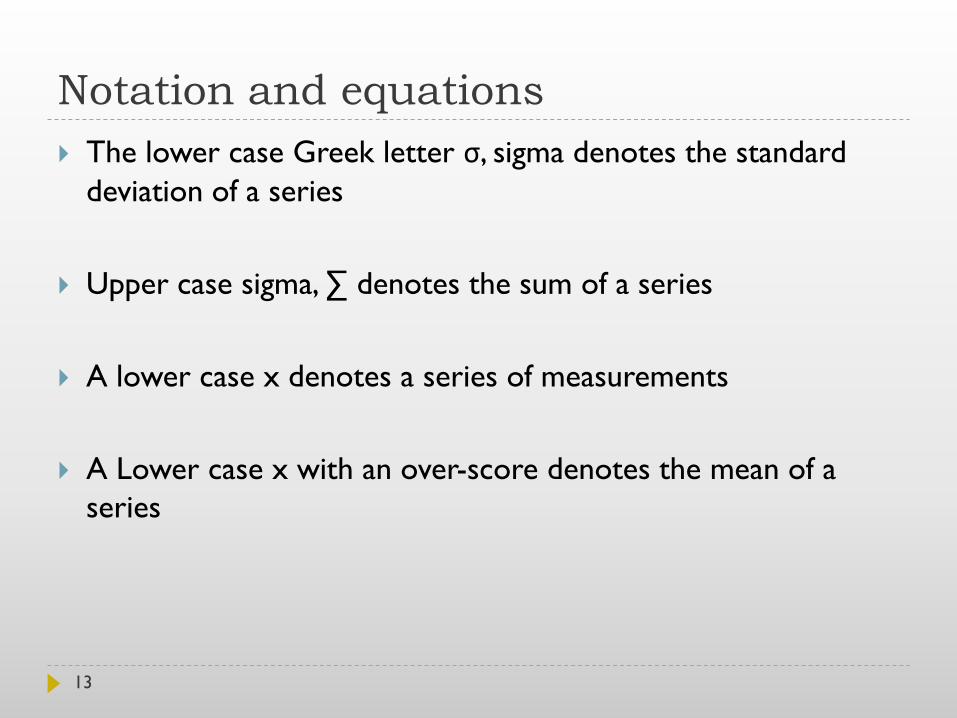
Notation and equations
The lower case Greek letter σ, sigma denotes the standard
deviation of a series
Upper case sigma, ∑ denotes the sum of a series
A lower case x denotes a series of measurements
A Lower case x with an over-score denotes the mean of a
series
13
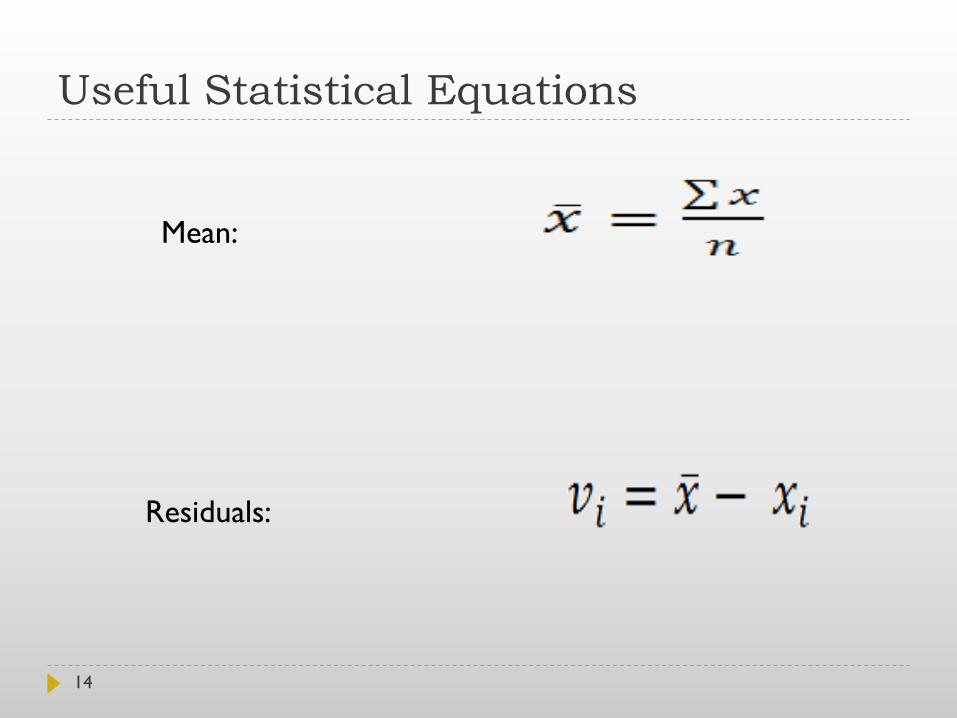
Useful Statistical Equations
Mean:
Residuals:
14
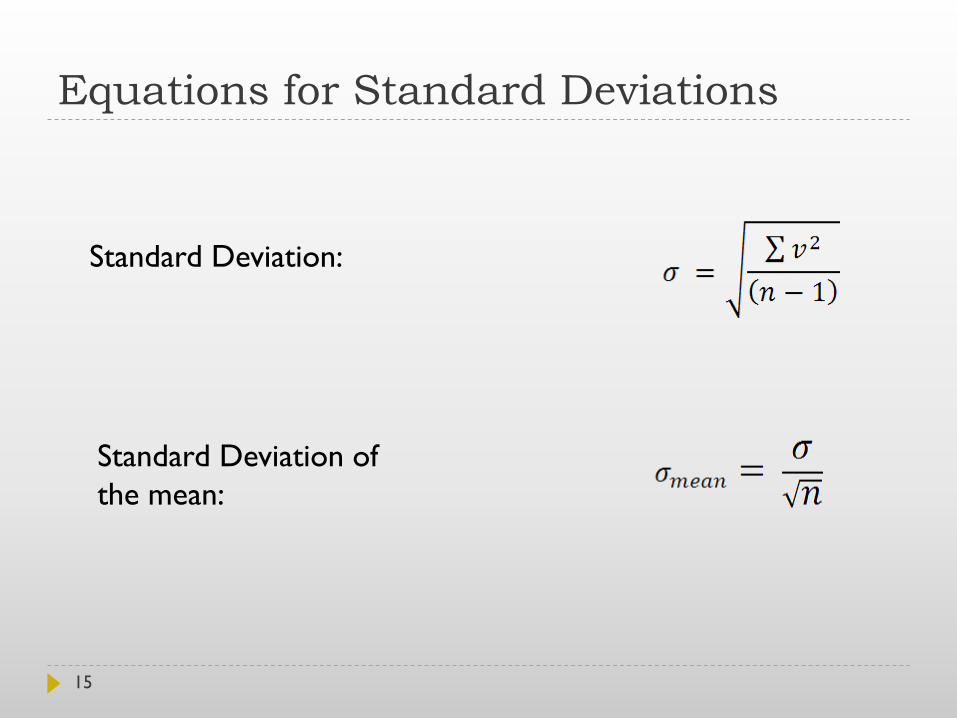
Equations for Standard Deviations
Standard Deviation:
Standard Deviation of
the mean:
15
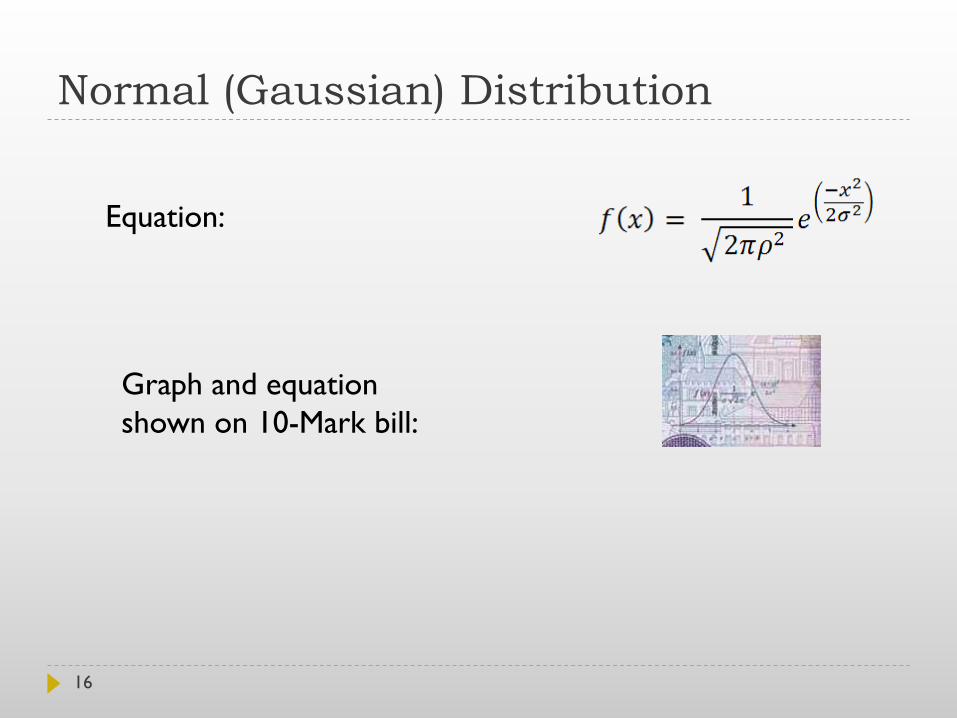
Normal (Gaussian) Distribution
Equation:
Graph and equation
shown on 10-Mark bill:
16
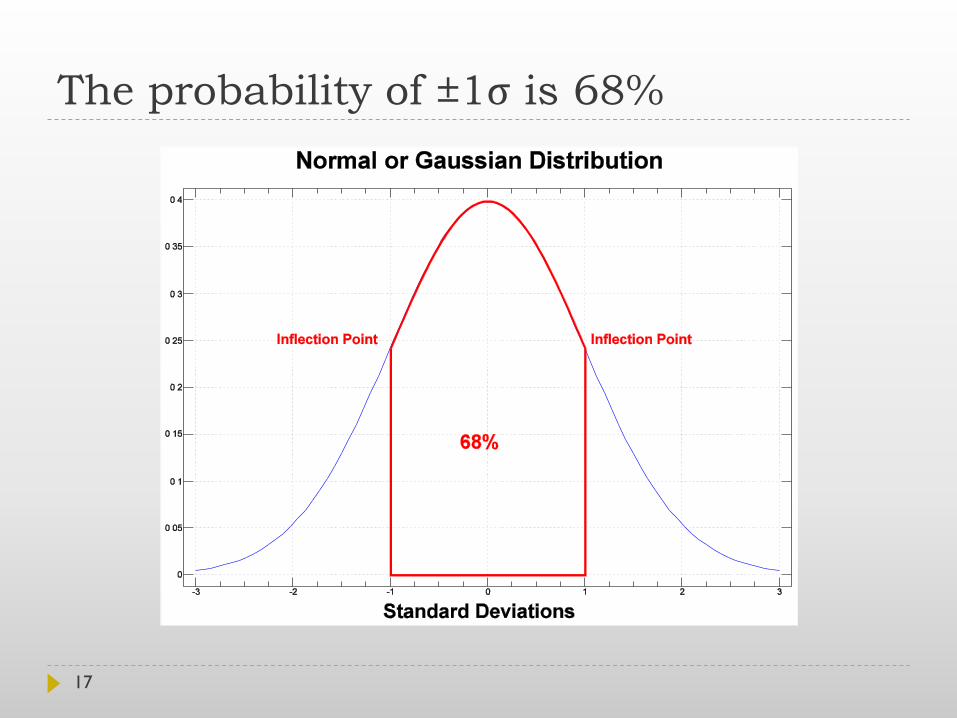
The probability of ±1σ is 68%
17

The probability of ±2σ is 95%
18

The probability of ±3σ is 99.7%
19
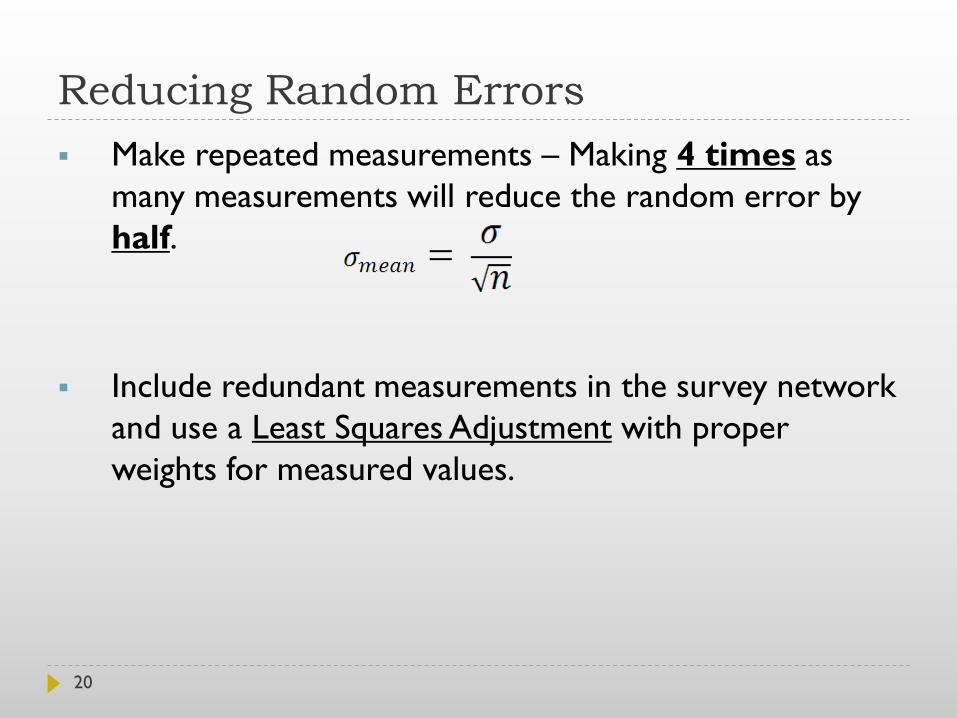
Reducing Random Errors
Make repeated measurements – Making 4 times as
many measurements will reduce the random error by
half.
Include redundant measurements in the survey network
and use a Least Squares Adjustment with proper
weights for measured values.
20
References
Elementary Surveying, An Introduction to Geomatics, Charles D.
Ghilani and Paul R Wolf
Adjustment Computations: Spatial Data Analysis, Charles D.
Ghilani and Paul R Wolf
21
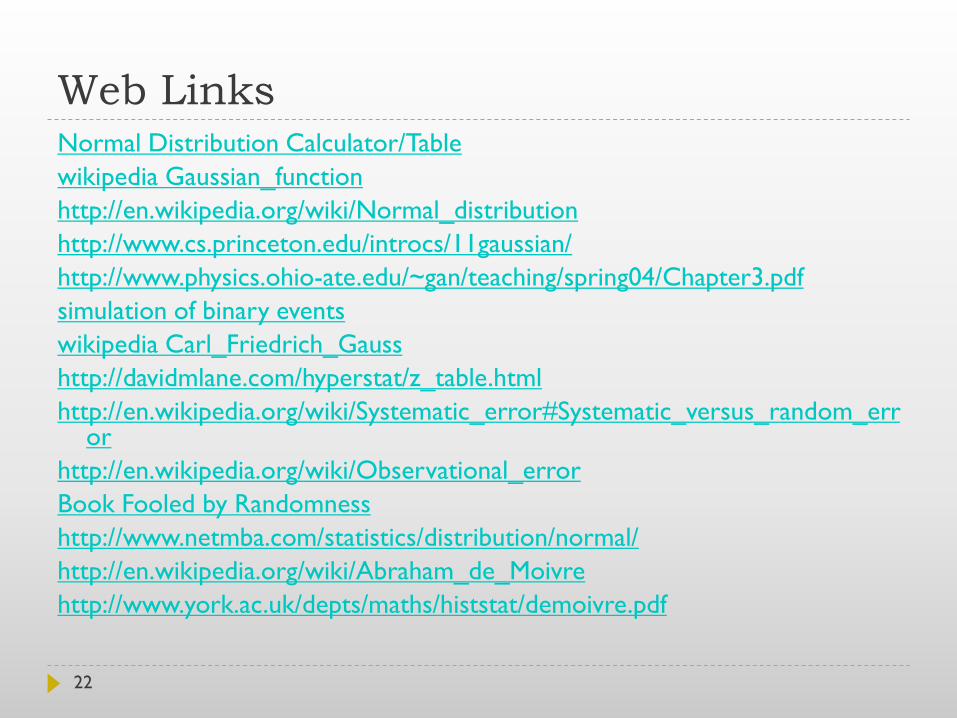
Web Links
22
Normal Distribution Calculator/Table
wikipedia Gaussian_function
http://en.wikipedia.org/wiki/Normal_distribution
http://www.cs.princeton.edu/introcs/11gaussian/
http://www.physics.ohio-ate.edu/~gan/teaching/spring04/Chapter3.pdf
simulation of binary events
wikipedia Carl_Friedrich_Gauss
http://davidmlane.com/hyperstat/z_table.html
http://en.wikipedia.org/wiki/Systematic_error#Systematic_versus_random_error
http://en.wikipedia.org/wiki/Observational_error
Book Fooled by Randomness
http://www.netmba.com/statistics/distribution/normal/
http://en.wikipedia.org/wiki/Abraham_de_Moivre
http://www.york.ac.uk/depts/maths/histstat/demoivre.pdf