Embed Size (px)
Citation preview
1
"This project has been funded with the support of the Prevention, Prepar-edness and Consequence Management of Terrorism and other Security-related Risks Programme European Commission - Directorate-General Home Affairs". This publication [communication] reflects the views only of the author, and the Commission cannot be held responsible for any use which may be made of the information contained therein"
Authors: Duncan Shaw Pavel Albores Susan Anson Paul Kailiponi Magesh Nagarajan Patrick Tissington Tom Hart
Title: Evacuation Responsiveness by Government Organisations (ERGO): Final Report
Publisher: Aston Centre for Research into Safety and Security (CRISIS), Aston University Business School, UK.
Date of Publication: 2011
Aston CRISIS CentreAston UniversityAston TriangleBirminghamB4 7ET
www.AstonCRISIS.com
For any information about this report please contact Prof. Duncan Shaw ([email protected])
Copyright © Aston University, 2011Aston University owns the copyright for this Evacuation Preparedness Assessment Workbook and no part (including text, images and design) may be reproduced or copied without the written permission of the copyright owner.
ISBN 978 1 85449 486 3

ERGOThe challenges of mass evacuation
2 3
AcknowledgementsWe are extremely grateful for the tremendous support from Jill Forrest, without whom we would have been indefinitely stranded.
We thank Jane Crier for her wise counsel, Kevin Arbuthnot for sharing his vast experience of operational matters, Micren who designed and redesigned our designs, and Adam Hewitt who lent us his keen eye for detail.
We greatly appreciate the advice, commitment and support of each of our Advisory Board Members (Mats Ardbreck, Birgitte Buch, Koen De Budt, Dimitar Cherkov, Haruo Hayashi, Guórún Jóhannesdóttir, Pawel Karnas, Alvaro Pemartin, Peer Rechenbach, Simon Lewis). Finally, our thanks to each interviewee who helped us to understand about evacuation in their country.
"This project has been funded with the support of the Prevention, Preparedness and Consequence Management of Terrorism and other Security-related Risks Programme European Commission - Directorate-General Home Affairs". This publication [communication] reflects the views only of the author, and the Commission cannot be held responsible for any use which may be made of the information contained therein"

ERGOThe challenges of mass evacuation
4 5
Table of Contents
Extended abstract . . . . . . . . . . . . . . . . . . . . . . . . . . . . . . . . . . . 8
Chapter 1 Introduction
1.1 . . . . . Introduction to the ERGO project . . . . . . . . . . . . . . . . . . . . . . . . . . . . . . . . . . 11
1.2 . . . . . Defining the scope of the project . . . . . . . . . . . . . . . . . . . . . . . . . . . . . . . . . . 12
1.3 . . . . . Observations in setting the context for mass evacuation . . . . . . . . . . . 19
1.4 . . . . . Explaining the ERGO project . . . . . . . . . . . . . . . . . . . . . . . . . . . . . . . . . . . . . . 21
1.5 . . . . . Structure of this report . . . . . . . . . . . . . . . . . . . . . . . . . . . . . . . . . . . . . . . . . . . . 25
Chapter 2 Literature Review
2.1 Introduction . . . . . . . . . . . . . . . . . . . . . . . . . . . . . . . . . . . . . . . . . . . . . . . . . . . . . . . . . . . 27
2.2 Part 1: Preparing the public to evacuate . . . . . . . . . . . . . . . . . . . . . . . . . . . . . . . . 29
2.3 Part 2: Understanding the evacuation zone . . . . . . . . . . . . . . . . . . . . . . . . . . . . . 44
2.4 Part 3: Making the evacuation decision . . . . . . . . . . . . . . . . . . . . . . . . . . . . . . . . . 49
2.5 Parts 4-6: Modelling the evacuation . . . . . . . . . . . . . . . . . . . . . . . . . . . . . . . . . . . . 63
2.6 Part 4: Disseminating the message . . . . . . . . . . . . . . . . . . . . . . . . . . . . . . . . . . . . . 69
2.7 Part 5: Evacuee transportation . . . . . . . . . . . . . . . . . . . . . . . . . . . . . . . . . . . . . . . . . 76
2.8 Part 6: Emergency accommodation planning and operation . . . . . . . . . . . . 86
2.9 Conclusion . . . . . . . . . . . . . . . . . . . . . . . . . . . . . . . . . . . . . . . . . . . . . . . . . . . . . . . . . . . . 98

ERGOThe challenges of mass evacuation
6 7
Chapter 3 Research Methodology
3.1 Introduction . . . . . . . . . . . . . . . . . . . . . . . . . . . . . . . . . . . . . . . . . . . . . . . . . . . . . . . . . . . 99
3.2 The ERGO data . . . . . . . . . . . . . . . . . . . . . . . . . . . . . . . . . . . . . . . . . . . . . . . . . . . . . . . 100
3.3 Part 1: Preparing the public for evacuation . . . . . . . . . . . . . . . . . . . . . . . . . . . . 104
3.4 Part 2: Understanding the evacuation zone . . . . . . . . . . . . . . . . . . . . . . . . . . . . 110
3.5 Part 3: Making the evacuation decision . . . . . . . . . . . . . . . . . . . . . . . . . . . . . . . 111
3.6 Parts 4, 5 and 6: Disseminating the warning message, traffic management and shelter management . . . . . . . . . . . . . . . . . . . . . . . . . . . . . . . . . . . . . . . . . . . . . . . 116
3.7 Conclusion . . . . . . . . . . . . . . . . . . . . . . . . . . . . . . . . . . . . . . . . . . . . . . . . . . . . . . . . . . . 122
Chapter 4 ERGO Countries and ERGO City
4.1 Introduction . . . . . . . . . . . . . . . . . . . . . . . . . . . . . . . . . . . . . . . . . . . . . . . . . . . . . . . . . . 123
4.2 Describing each ERGO country . . . . . . . . . . . . . . . . . . . . . . . . . . . . . . . . . . . . . . . . 124
4.3 Describing ERGO City . . . . . . . . . . . . . . . . . . . . . . . . . . . . . . . . . . . . . . . . . . . . . . . . . 130
4.4 Conclusion . . . . . . . . . . . . . . . . . . . . . . . . . . . . . . . . . . . . . . . . . . . . . . . . . . . . . . . . . . . 134
Chapter 5 Findings: Part 1 Preparing the public
5.1 Introduction . . . . . . . . . . . . . . . . . . . . . . . . . . . . . . . . . . . . . . . . . . . . . . . . . . . . . . . . . . 137
5.2 How ERGO countries prepare their public for evacuation . . . . . . . . . . . . . . . 139
5.3 Preparing the public in ERGO City . . . . . . . . . . . . . . . . . . . . . . . . . . . . . . . . . . . . . 155
5.4 Implications for the public preparedness strategy . . . . . . . . . . . . . . . . . . . . . 175
Chapter 6 Findings: Part 2 Evaluating the evacuation zone
6.1 Introduction . . . . . . . . . . . . . . . . . . . . . . . . . . . . . . . . . . . . . . . . . . . . . . . . . . . . . . . . . . 184
6.2 How ERGO countries analyse their evacuation zone . . . . . . . . . . . . . . . . . . . 185
6.3 Evaluating the evacuation zone in ERGO City . . . . . . . . . . . . . . . . . . . . . . . . . . 190
6.4 Implications of evaluating the evacuation zone . . . . . . . . . . . . . . . . . . . . . . . 196
Chapter 7 Findings: Part 3 Making the evacuation decision
7.1 Introduction . . . . . . . . . . . . . . . . . . . . . . . . . . . . . . . . . . . . . . . . . . . . . . . . . . . . . . . . . . 197
7.2 How ERGO countries make the evacuation decision . . . . . . . . . . . . . . . . . . . 199
7.3 Making the evacuation decision in ERGO City . . . . . . . . . . . . . . . . . . . . . . . . . 207
7.4 Implications of making the evacuation decision . . . . . . . . . . . . . . . . . . . . . . . 224
Chapter 8 Findings: Parts 4-6 Modelling the evacuation
8.1 Introduction . . . . . . . . . . . . . . . . . . . . . . . . . . . . . . . . . . . . . . . . . . . . . . . . . . . . . . . . . . 228
8.2 Warning message dissemination . . . . . . . . . . . . . . . . . . . . . . . . . . . . . . . . . . . . . . 229
8.3 Evacuee transportation management . . . . . . . . . . . . . . . . . . . . . . . . . . . . . . . . . 243
8.4 Emergency shelter allocation . . . . . . . . . . . . . . . . . . . . . . . . . . . . . . . . . . . . . . . . . 258
8.5 Overview of ERGO findings on the usage of analytical models used in evacuation preparedness . . . . . . . . . . . . . . . . . . . . . . . . . . . . . . . . . . . . . . . . . . . . . . . . 272
8.6 Chapter Summary . . . . . . . . . . . . . . . . . . . . . . . . . . . . . . . . . . . . . . . . . . . . . . . . . . . . 276
Chapter 9 Evacuation Preparedness Assessment Workbook
9.1 Introduction . . . . . . . . . . . . . . . . . . . . . . . . . . . . . . . . . . . . . . . . . . . . . . . . . . . . . . . . . . 278
9.2 Evaluating preparedness . . . . . . . . . . . . . . . . . . . . . . . . . . . . . . . . . . . . . . . . . . . . . . 279
9.3 Workbook development . . . . . . . . . . . . . . . . . . . . . . . . . . . . . . . . . . . . . . . . . . . . . . 281
9.4 Example of the EPAW . . . . . . . . . . . . . . . . . . . . . . . . . . . . . . . . . . . . . . . . . . . . . . . . . 283
9.5 Conclusion . . . . . . . . . . . . . . . . . . . . . . . . . . . . . . . . . . . . . . . . . . . . . . . . . . . . . . . . . . 286
Chapter 10 Conclusion
10.1 Overview . . . . . . . . . . . . . . . . . . . . . . . . . . . . . . . . . . . . . . . . . . . . . . . . . . . . . . . . . . . 287
10.2 Aims and objectives . . . . . . . . . . . . . . . . . . . . . . . . . . . . . . . . . . . . . . . . . . . . . . . . . 289
10.3 Findings 1: Preparing the public to evacuate . . . . . . . . . . . . . . . . . . . . . . . . . 296
10.4 Findings 2: Understanding your evacuation zone . . . . . . . . . . . . . . . . . . . . . 298
10.5 Findings 3: Making the evacuation decision . . . . . . . . . . . . . . . . . . . . . . . . . . 299
10.6 Findings 4-6: Operational Research Models . . . . . . . . . . . . . . . . . . . . . . . . . . . 301
10.7 Future research . . . . . . . . . . . . . . . . . . . . . . . . . . . . . . . . . . . . . . . . . . . . . . . . . . . . . 303
10.8 Close . . . . . . . . . . . . . . . . . . . . . . . . . . . . . . . . . . . . . . . . . . . . . . . . . . . . . . . . . . . . . . . 304
References . . . . . . . . . . . . . . . . . . . . . . . . . . . . . . . . . . . . . . . . . . . . . . . . . . 306

ERGOThe challenges of mass evacuation
8
Extended Abstract9
Extended Abstract
Extended abstractThis report details the final project findings from the Evacuation Responsiveness by Government Organisations (ERGO) project which was co-funded with the support of the Prevention, Preparedness and Consequence Management of Terrorism and other Security-related Risks Programme, European Commission - Directorate-General Home Affairs (JLS/2007/HOME/025) and by Aston University Business School, Birmingham, UK.
The ERGO project was designed to identify and transfer good practice on the planning, coordination and execution of mass evacuations. It has examined the methods used by government organisations to prepare both themselves and their public for mass evacuation. The project took place over three years (January 2008-December 2010), with the participation of evacuation experts from 10 countries - Belgium, Bulgaria, Denmark, Germany, Iceland, Poland, Spain, Sweden, the United Kingdom and Japan.
The approach taken by the project was to divide mass evacuation planning into six parts:
Preparing the public to evacuate.1.
Understanding the evacuation zone.2.
Making the evacuation decision.3.
Disseminating the warning message.4.
Evacuating people.5.
Shelter management. 6.
These six parts are where the project makes original contributions to the practice and theory of evacuation planning. Taken together, these six parts form the ERGO Framework for Evacuation - a conceptual model that was designed to help government organisations to think about mass evacuation strategies. The detail that underpins the ERGO Framework for Evacuation constitutes the project’s main contribution to creating, testing and evaluating evidence-based policy making and empirically underpinned research for mass evacuation.
The report is designed to assist government organisations with understanding the framework, and so enable them to use its underpinnings in day-to-day planning activities. The report presents a comprehensive review of the academic literature for each part of the framework. This review resulted in the identification of three approaches that may support mass evacuation planning: Social Marketing, Decision Theory, and analytical modelling from Operational Research.
Research was conducted with government organisations to understand, develop and refine the framework as well as to develop specific recommendations for addressing the six parts. Each of the 10 ERGO
countries was typically visited at least three times to gather information on how they plan for and execute a mass evacuation. The team interviewed over 142 evacuation experts resulting in approximately 114 hours of interview recordings which were rigourously analysed using good-practice research methodology from an academic tradition.
The report provides the key findings on how the ERGO countries are preparing both their organisations and their public for mass evacuation. Key findings for each part of the ERGO Framework for Evacuation include:
Preparing the public: • We found that countries are challenged to adopt a truly integrated, strategic approach to the preparation of their public for mass evacuation. The report presents a solution – a strategic approach which involves a number of integrated steps: from setting preparedness behaviour goals to agreeing knowledge objectives right through to the final step of evaluating behavioural change in the public.
Understanding the evacuation zone:• The physical space to be evacuated is typically well known by experienced officials, but modelling and spatial data support can further strengthen their knowledge base. ERGO explored the important aspects of accumulating data about evacuation zones and how this data should be collected and maintained in geographical information systems.
Making the evacuation decision:• Emergency officials balance uncertainty about an event with the urgent need to make a decision on whether to evacuate an area. To support these officials, ERGO has developed a model that explores the decision objectives, uncertainties and pay-offs. This can be used for: exercises; reviewing investment decisions and the impact of policies; post-event review.
Disseminating the warning message:• The warning and informing of potential evacuees is well researched, but how long does it take for an official warning message to notify a city? This ERGO simulation model examined the effectiveness of different policies on the time it takes to notify the public of the need to evacuate using official and unofficial warning channels.
Evacuating people:• The mass movement of evacuees may cause traffic jams which slow the evacuation. This problem is addressed by an ERGO computer model that examines the effect of different transportation policies on the evacuation time. The model allows different policies to be trialled to see the effect on policy measures/target.
Shelter management: • A challenge to effective shelter provision is ensuring adequate space and provisions within shelters. ERGO offers an analytical model to address this need. The model evaluates the allocation of evacuees across shelters and analyses the best shelter destinations for evacuee transportation.

ERGOThe challenges of mass evacuation
10
Extended Abstract
The findings from each part of the framework are developed into the Evacuation Preparedness Assessment Workbook (EPAW) (Chapter 9). The EPAW is a tool for government organisations to evaluate the six parts of their planning for mass evacuation. This tool systematically analyses each part by offering a range of evaluative statements that allow for a broad and in-depth assessment of preparedness.
The report concludes by taking a comprehensive and integrated approach to the six parts of the ERGO Framework for Evacuation, specifically aiming for joined-up planning. It will illustrate, for example, how Parts 2-6 of the Framework can be used to predict the optimal public response during a mass evacuation and how Part 1 can be used to influence the public to prepare for mass evacuation so that they respond in the desired way when there is a need to evacuate.
The report aims to support government organisations as they plan for mass evacuation and the EPAW aims to be a practical contribution to the measurement and enhancement of preparedness.
The project website can be found at www.ergo-aston.eu and the project repository is available through that site as well as through http://crisis.aston.ac.uk/.

1.1 Introduction to the ERGO projectIn April 2010, the Icelandic emergency services were faced with a major catastrophic event when the Eyjafjallajökul volcano, which had lain dormant for almost two-hundred years, erupted. The eruption meant economic disruption and inconvenience for thousands of people across the world as flights across Europe were grounded to avoid volcanic dust, which had the potential to destroy aircraft engines.
For Iceland, the volcano represented more than an inconvenience; more than another blow to the national economy, it was a direct threat to life and property. This was a catastrophic event, an event that would require the authorities to notify and evacuate over eight-hundred people from floods, lava and mudslides created by the volcano. In all, evacuations of the same area were called three times as a result of eruptions and the threat to residents’ safety.
The decisions involved, and the methods required to implement this evacuation without loss of life were complex. People had to be informed when they needed to evacuate, and what to take with them to safety;
Chapter 1 Introduction
Key Points:Introduces the scope and objectives of the project.•
Presents the ERGO Framework for Evacuation and the six models that we have been •developing during the project.
Scopes the context of the project.•
Discusses the research methodology, the participating countries and the deliverables.•
Outlines the structure of the report and what each chapter will cover.•

ERGOThe challenges of mass evacuation
12
Chapter 113
Introduction
Less frequent, but much more dramatic, are the false alarms caused by system malfunctions, or disobedient children playing with the system. Here the system is put to a real test, and the situation is not as controlled as in the well-rehearsed practice sessions. Things go wrong. Children go missing; teachers are not where they are meant to be; doors that are meant to be operational are blocked; nobody knows if there really is a fire or not. The fire brigade must be called to check the building. A whole morning’s work is lost.
The school fire alarm drill makes an important impression on an individual, one which is embedded into our minds with such force that, throughout our entire life, our reactions to a fire alarm in any situation will tend to revert to the instruction provided to us in school. Whether we are in our offices, watching a film at the cinema or eating at a restaurant we will react in the same way, and so will the people around us.
Each member of the public is, therefore, familiar with the principles of evacuation, albeit at the most elementary and small-scale level. Everybody knows that there are certain strategies and tactics required to ensure people can leave a building in a safe way when an alarm is activated. These actions are so embedded within us that we no longer devote conscious effort to planning our actions during an alarm. However, the process itself is quite complex. What seems like common sense to us was not always so for our ancestors, and even the procedures during a fire alarm had to be developed, and refined.
Consider the following factors that are required to evacuate a building like your first school:
A clear plan that will take into account the best routes for people to •follow when leaving the building.
This plan will look for the quickest routes, and those that avoid •obvious hazards. This is simple enough for an experienced head teacher to determine. They know their building. They know the steps pupils tend to trip on, and where bikes are dumped by careless students.
The plan will also include actions to be taken after the school has •been evacuated. A register will be taken; parents will be informed, and so on.
Ways must be found to communicate the plan to pupils from •different age ranges. The eldest pupils can be told what to do when they hear the alarm; but the youngest might require several lessons, perhaps their teachers will encourage them with artistic activities about the fire brigade or relevant stories.
The whole plan must be tested on a regular basis to inform new •pupils and teachers about what to do and to exercise to make sure the plan works.
shelters had to be prepared at safe locations; secure road networks were marked out; information was distributed. These were a small number of the activities required to conduct the evacuation.
Major events, like the Eyjafjallajökul volcano, are infrequent occurrences for most countries, but are events where poor preparation can have an enormous impact on those involved in the disaster. Other catastrophic events may involve more people, putting emphasis on the need for advanced planning to help authorities and the public to respond effectively e.g. 10,000 people evacuated following tsunami warning in Japan (28th February 2010), 4 million people affected by flooding in Pakistan (August 2010), 100,000 displaced following eruptions in Indonesia (November 2010). In these disasters the priority is to save life, often by getting people away from the danger area and to somewhere they will be safe. However, this requires coordination of government agencies and members of the public to ensure clear instructions are given and followed to enable the evacuation to be effected as safely and quickly as possible.
The Evacuation Responsiveness by Government Organisations (ERGO) project is an investigation into the planning, coordination and execution of mass evacuations by government organisations. It has used academic rigour to build insights into how decisions are (and can be) made before/during mass evacuations; how people behave, and the best ways to communicate information to people before and after a disaster has occurred. ERGO has built models and frameworks which can underpin evidence-based policy and decision making – so that rigorous analysis complements expert judgment and experience to help key decision makers to prepare themselves, their organisations and the public they serve. ERGO aims to provide support to those whose responsibility it is to prepare for the mass evacuation of hundreds, thousands, millions of people from catastrophic events.
1.2 Defining the scope of the projectThe need for mass evacuation from major catastrophic events is self-evident. An evacuation decision taken at the correct time will save lives. Mass evacuations are complicated events but people are conditioned to respond to them from an early age (albeit through being trained to respond to small scale evacuations e.g. building fire alarms). This section will examine how evacuation is understood within the ERGO project and the particular parts of an evacuation that have been examined.
From an early age, most people are made familiar with what to do when a fire alarm goes off. The process starts at their very first school. Teachers provide basic instructions to their pupils on how to leave the classroom. Personal possessions must be left behind; everybody must be silent and calm. There must be no panic and no pushing. Once outside, a registration will be taken by the teachers. Each academic semester there is a practice fire alarm and the classes follow the instructions given by their teachers.

ERGOThe challenges of mass evacuation
14
Chapter 115
Introduction
Each threat posed particular resource management problems for the emergency managers involved, but all have a common theme: managing the evacuation of large numbers of people in a context where a city’s infrastructure has been compromised. It is at this scale that the ERGO project was conceived and executed.
The following headings have been revised to place due emphasis on the scope of the ERGO project:
Preparing the public for mass evacuation: • Populations are even more fragmented than school classes. In cities or countries there will be issues connected to age, social class, mobility health, ethnicity, gender, language, education, vulnerability, and more. Each factor will influence how to communicate with a diverse population. Furthermore, the expected disaster type in an area will also influence the information required by the population. Different materials and methods for communication as well as culture and recent major catastrophes will influence how receptive people are to receiving information about evacuating from a disaster. ERGO has examined materials and strategies from the ten countries that participated in the project, and combined this information with comprehensive research into existing literature and theoretical models on how to communicate with the public before and during a disaster.
Understanding the evacuation zone:• Large distances are covered when mass population evacuation occurs. There is a need to understand car usage, number of people in a population, building structures and so on. This information can be plotted on Geographical Information Systems (GIS) to help government organisations make decisions about how an evacuation is carried out. ERGO has built a framework that links GIS to the decision to call an evacuation. Using this framework, government organisations can understand the uncertainties in the geographical area and how these may influence their decision to evacuate an area.
Making the evacuation decision: • When an individual sees a fire, smells burning, or notices smoke in a building then making the decision to pull a lever or smash the glass to activate a fire alarm is not difficult, and there will usually be little cost if the decision is wrong. The situation with large city/national populations is much more difficult. Natural disasters are often difficult to predict, the time taken to evacuate can be measured in days and the economic cost can be huge, and (on many occasions) the human cost can be significant in terms of injuries sustained and even death. The situation is further complicated by the complex, unpredictable and often illogical human responses to perceived risk. The consequences for an official who makes the wrong decision, either by evacuating too early or too late are severe.
ERGO project deals with evacuation on a much larger scale – cities, regions, countries. Preparing to evacuate thousands of people from a part of a city is undoubtedly infinitely more complex in practice, but there are commonalities in the stages of planning that must be undertaken. Both the school and the city/regional/national government must work through similar stages of planning which we divide into six simple headings:
Preparing the public to evacuate.1.
Understanding the evacuation zone.2.
Making the evacuation decision.3.
Disseminating the warning message.4.
Evacuating people.5.
Shelter management.6.
These six points are the essential areas examined by this project, ERGO. We reiterate that the difference comes with the larger scale of a mass evacuation on which ERGO focuses, but the fundamentals are shared with the most basic ideas behind moving people away from small, contained threats for which they are more likely to be conditioned.
This report will discuss responses to dramatic disasters ranging from volcanic eruptions in Iceland to earthquakes in Japan and flooding in Poland. These catastrophes affect thousands, if not millions of people, and in accordance with the complexity of evacuating millions of the members of public, the ERGO project has employed tools that stretch beyond the sophistication required for evacuating a building, but the underlying concerns remain the same.
Hazards occur on many different scales. The small-scale threat posed by a school fire is not within the remit of the ERGO project. Instead ERGO is focused on very large scale incidents such as the city-wide threat from coastal flooding, the regional threat produced by an earthquake, or the international threat created by a large tsunami. The ERGO project sought to examine city, regional and national-level responses to threats and our country partners helped by providing access to how they plan for a range of common hazards facing Europe. Thus, the project covers several hazards and threats, including:
Earthquakes.•
Volcanoes.•
Floods.•
Terrorism.•
Nuclear incidents.•
Mass gatherings.•
Extreme weather.•

ERGOThe challenges of mass evacuation
16
Chapter 117
Introduction
it is important to know how long it will take people to leave their homes, travel to shelters, and overcome congestion. It is also useful to know who will arrive at the shelter first. The ERGO project has developed computer models to indicate the evacuation pattern of the public after they receive the warning message. We aim to help the authorities to understand adjustments in how they think about evacuating people through testing different scenarios in a computer model.
Shelter management:• When large numbers of people arrive at a shelter, often without appropriate provisions and with individual medical and social support requirements, the authorities are presented with a hugely complex task under time pressure, limited resource and at potential risk to life. To further understand the logistical challenges presented by shelter management, we developed a simulation model to determine the best way to allocate people to shelters dynamically. By understanding these basic factors, responses to complex threats can be improved. From the school to the city to the country are enormous steps in scale and complexity which require careful planning and analysis.
We do not suggest that computer models can replace the decision makers – far from it. Decision makers with their experience, intuition and knowledge of the context may be able to consider other aspects of the evacuation challenge by thinking about the models and frameworks that we have been developing during the ERGO project. These models and frameworks can highlight to government organisations what sorts of analysis they might like to have. We regard well-built models to be one tool in the toolbox for government organisations.
1.2.1 Structured versus unstructured evacuations
In small scale events, such as when we attend a football match or concert, our environment is subject to close control. The event will have been planned months in advance and our security may be subject to enforced legislation. For example: the staff will be familiar with the venues; escape routes will be well-marked; coverage by CCTV may be comprehensive and additional support will have been drafted based on the event’s popularity. Large venues should have well defined procedures for planning events with checklists for who to involve, the level of resources needed and so on. For example, more than two years before it was due to take place, the 2012 Glastonbury Festival (UK) was cancelled because the planning process identified a critical problem with resources due to a clash with the London Olympics (there would not be enough portable toilets available in the UK).
On this small-scale, football stadia and concert halls are venues where structured evacuations take place. Imagine that a concert given by the winner from a television talent contest. The crowd is thick and excited.
ERGO has sought to provide decision models as an additional tool to help government organisations to be more aware of some of the tough, but informed, choices that they have to make on when to order an evacuation. This tool can be used to understand the decision to be made, the beliefs that informed the decision, the uncertainties that were considered, as well as to support post-event debriefs that record why certain decisions were taken.
Disseminating the warning message:• Someone sitting at home at night with the curtains closed is not aware of their outside environment, anything could be going on outside and they might not know. Hundreds of people could be quickly moving along the street but the noise of their television and the usual late-rush hour traffic overwhelms any noticeable difference. How would the individual be warned if there was an impending incident that requires evacuation? How quickly would this warning take to reach them? ERGO has built a computer model to understand how long it might take for a warning message to spread across a population in an area. This model can look at the effect on time to receive the message from different policies for encouraging the spread of the message (e.g. tell you neighbour). It aims to help governments to think about the issues in spreading the message so that emergency managers can estimate and influence the time to disseminate.
Evacuating people: • When a fire alarm is sounded, there is always a move towards an exit and, if there are enough people in the building, the exit can be blocked. When a city evacuation occurs the same event can happen, but in a much more dramatic way e.g. roads can become blocked, cars and buses can form traffic jams, pedestrians can spill from overcrowded pavements onto the roads. In order to plan for an effective evacuation
Figure 1.1 The ERGO Framework for Evacuation

ERGOThe challenges of mass evacuation
18
Chapter 119
Introduction
preparedness and resilience on evacuation specific activities, for example:
Individuals can acquire important transferable skills that are »relevant to evacuation (e.g. first aid).
Individuals might take training to have a role during an »evacuation (e.g. evacuation warden).
Individuals can give blood which might be useful during a »major incident.
Community preparedness needs to be balanced with government preparedness i.e. government organisations having the capability (skills, knowledge) and capacity (enough resources) to suitably conduct an evacuation. Therefore the government needs to have plans, processes, structures, resources, understanding and ability in place for when disaster strikes. These preparations can be eased by understanding more about the decision making framework which supports an evacuation decision. For example, we can analyse: who are the public and how well prepared they are; the physical area to be evacuated as well as the people in it; the influences on how the evacuation decision is made; how long the warning message will take to disseminate; how long the people will take to evacuate or how many shelters will be needed. This is the approach that we have taken to try to help government organisations to further enhance their preparedness for the challenge of mass evacuation.
The ERGO project examines the interaction between community and government levels of preparedness, and how the relationship can be made to work in a beneficial way for both groups.
1.3 Observations in setting the context for mass evacuation1.3.1 How government and the public perceive incidents
Events that require mass evacuation are rare, and so the public will perceive the risk from an incident in a very different way to a government official whose job is to plan, prepare and coordinate responder agencies for when such disasters strike. The public has limited access to information, and the information they do have is usually mediated by the different sources through which it is received. The public may have their views formed by gossip, half-remembered newspaper articles, snatched television documentaries, films, family folklore, what happened at school, and so on. As such, it is important for emergency management officials to understand how people perceive a threat in order to determine the best way to provide information about how they should respond.
Governments perceive disastrous incidents in a very different way. Officials have more access to information, and experience, but this also has dangers. They may have too much information on a threat for it to
They cluster towards the stage when the star appears, but in doing so start to crush the people at the front. A few people collapse. As the crowd surges forward more people are in danger. A security supervisor notices what is happening via CCTV. They pull the power on the performance, raise the lights, and communicate with the security team. Staff members move to pre-designated points and usher people from the venue. An ambulance is already on scene for the injured at the stage. The environment itself is controlled at each step, and there is little or no ambiguity in the evacuation and emergency procedures.
This situation contrasts with large-scale evacuations that take place when thousands of people in a city or region need to be evacuated. The basic concerns remain the same; people must be evacuated from danger; the injured must be treated, and the situation secured. However, the city’s size means that there cannot be one plan or procedure to deal with every eventuality. Different sectors will be evacuated at different times, if at all, depending upon the threat facing the city. A junior policeman cannot be provided with a plan that deals with all eventualities, instead they must be prepared to adapt to orders determined by their superiors.
This does not mean that when parts or all of a city is evacuated there is no plan, or chaos. Rather the evacuation takes place in a context where individual actors will have to be pragmatic, and adapt their plans according to multiple developments and uncertainties during the emergency.
It is these unstructured evacuations that are considered by the ERGO project.
1.2.2 The dual focus – government & community preparedness
Communities make preparations for disasters without any conscious effort. If you visit any town or city you will find multiple clubs and societies that reach out to groups from all ages, ethnicities, social classes, and from almost any demographic category which can be conceived. There are volunteer groups that can help to provide facilities and skills, for example:
Some provide meals for the elderly (and may be able to do so if •there was a major catastrophe).
Some social groups have home phone numbers for members (and •so could check on their members in case they need help during an evacuation).
Some clubs provide basic skills and experience in a vast range of •subjects (such as carpentry, which could protect windows before a storm to avoid flying glass).
Taken together, these everyday activities constitute one aspect of •building community preparedness. Furthermore, when encouraged by publicity and resources, a community can increase its inherent

ERGOThe challenges of mass evacuation
20
Chapter 121
Introduction
Some people might expect the fire brigade to rescue their cat from a tree as a priority, and others will want fireman to take risks to save possessions from their houses during a fire.
In order to help people in the most effective way, the government must understand these diverse needs and expectations; furthermore, it must communicate the agreed procedures/decisions that relate to how the emergency services will respond during a disaster to the public. This is a complex task, and it is an area covered by the ERGO project’s analysis of Social Marketing in the participating countries. Once a government understands what people expect, and the measures they have taken to prepare, the emergency services will be in a stronger position to realign their expectations and help them during a disaster.
1.3.3 Government expectations – the public’s ability to cope themselves
A government will not always have a firm grasp upon their population’s characteristics. Often it is only possible to understand the population in broad statistical terms and without much insight into how individuals perceive reality. As such, a government may overestimate a population’s ability to cope with a disaster. The ERGO project has developed a strategy for governments to find out more about their populations.
1.4 Explaining the ERGO project1.4.1 Objectives of the ERGO project, countries, data, findings
European governments have long planned for mass evacuation to address the challenges associated with catastrophic events e.g. the nature of the threat, the number of people to be evacuated, the time available for response, and the long-term effects of the incident. Government organisations have the option of making preparedness plans for specific risks (e.g. floods) or take an “all hazards” approach, which provides generic guidelines when dealing with emergencies. Either way, they need to test the robustness of those plans and the ERGO project provides a measurement framework to help them to assess their own planning for mass evacuation.
The ERGO project aimed to, in part, support governments and emergency management agencies (EMAs) as they plan for mass evacuation of their public. This included discovering good practice on evacuation preparedness and sharing this through workshops, reports, feedback sessions, Masterclasses and an international conference. The project focused not only in helping governments to prepare, plan and execute a mass evacuation, but also in helping them to prepare and educate their public.
Ten countries participated in the project: nine from the European Economic Area (EEA), (Belgium, Bulgaria, Denmark, Germany, Iceland,
be useful (as conflicting information clouds judgment), or experience may harden into prejudice and prevent them from reacting in a timely manner to new threats. They are also confined by laws, and bureaucratic procedures that, while may exist for good reasons, may also limit how they can respond to a disaster.
This is why it is useful for more academic projects such as ERGO to examine responses to disasters. The academic perspective, whilst far from infallible, can provide a new perspective on public and government perceptions by working from outside established habits and experience.
1.3.2 Community expectations – who has the responsibility to prepare?
There was a time when protection from natural disasters fell to individuals and not to the government. Private companies provided small plaques, known as firemarks, which displayed the company’s emblem. When a fire broke out, fire brigades (maintained by the insurers) would be deployed to the scene, but they would only act if they insured that building; even then, the fire brigade’s priority was to protect possessions, and not lives. Individuals had to rely on charitable fire-fighting organisations.
The private fire brigade system was replaced following several enormous fires that placed a heavy financial burden on the insurance companies. This was the beginning of the government-funded fire brigade system still in place today in the UK. This was a significant transition. Before, it was up to each individual to prepare for a fire, but this changed and now there is an expectation that the government will protect each citizen from fire. What was once a private business transaction became a matter of law, duties, and rights.
In most industrialised countries, the government now plays a much larger role than it did in the nineteenth-century. Attitudes to disaster preparation have shifted in accordance with these changes in societal organisation. There are still some areas where the government does not intervene in rescue efforts; Germany’s Deutsche Gesellschaft zur Rettung Schiffbrüchiger (German Society for the Rescue of the Shipwrecked) provides a comprehensive rescue lifeboat system funded through charitable donations, but for most purposes the commercial model for helping people in emergencies has been replaced by government provision.
One problem that emerges from the decline in the commercial model of emergency response is how to gauge expectations within the community. When an emergency service is provided on a commercial basis the expectations are clear; either an individual can pay to protect themselves, or they cannot, and are left to take what measures they can afford. The government’s position is more complex. Some people will buy fire alarms, sort out escape routes, and buy fire blankets – others will not.
ERGOThe challenges of mass evacuation
22
Chapter 123
Introduction
ERGO’s main objective was to understand how countries can prepare to mass evacuate their public. The project’s aims included:
A survey of global literature on, and models for, strengthening a. preparedness.
Identifying good practices and sharing these across participating b. countries.
Find opportunities to strengthen practices in ERGO countries.c.
Assist government agencies to further strengthen their d. evacuation preparedness and the preparedness of the public.
Establish a central repository of information and resources.e.
Establish a framework through which countries can measure the f. preparedness of their government and their public.
Contribute to the existing literature on preparedness for mass g. evacuation.
Country Board Member Organisation Example scenario
Belgium Koen De Budt Federal Public Service of the Interior, Directorate-General Crisis Centre, Brussels
Nuclear incident
Bulgaria Dimitar Cherkov Head of Programming Department, International Projects Directorate, Ministry of Interior, Sofia
Flooding
Nuclear incident
Denmark Birgitte Buch Danish National Police, Copenhagen Terrorism/flooding
Germany Dr Peer Rechenbach Head of Civil Protection and Disaster Management, Ministry of Interior, Hamburg
Tidal flooding
Iceland Guórún Jóhannesdóttir National Commissioner Of The Icelandic Police, Department of Civil Protection and Emergency Management, Reykjavik
Volcanic flooding
Japan Professor Haruo Hayashi Director of the Disaster Prevention Research Institute, Kyoto University
Tsunami/earthquake
Poland Major Pawel Karnas Voivodeship Headquarters of Police in Krakow Flooding
Spain Dr. Alvaro Pemartin Medical Coordinator and Mass Casualties and NBCR Response Team Leader, Cadiz
Mass gatherings
Sweden Mats Ardbreck Strategist for Nuclear Emergency Preparedness, Swedish Civil Contingency Agency, Stockholm
Nuclear incident
(Uppsala)
United Kingdom
Simon Lewis The British Red Cross (ex-Chief Superintendent, The Metropolitan Police, London)
Terrorist incidents
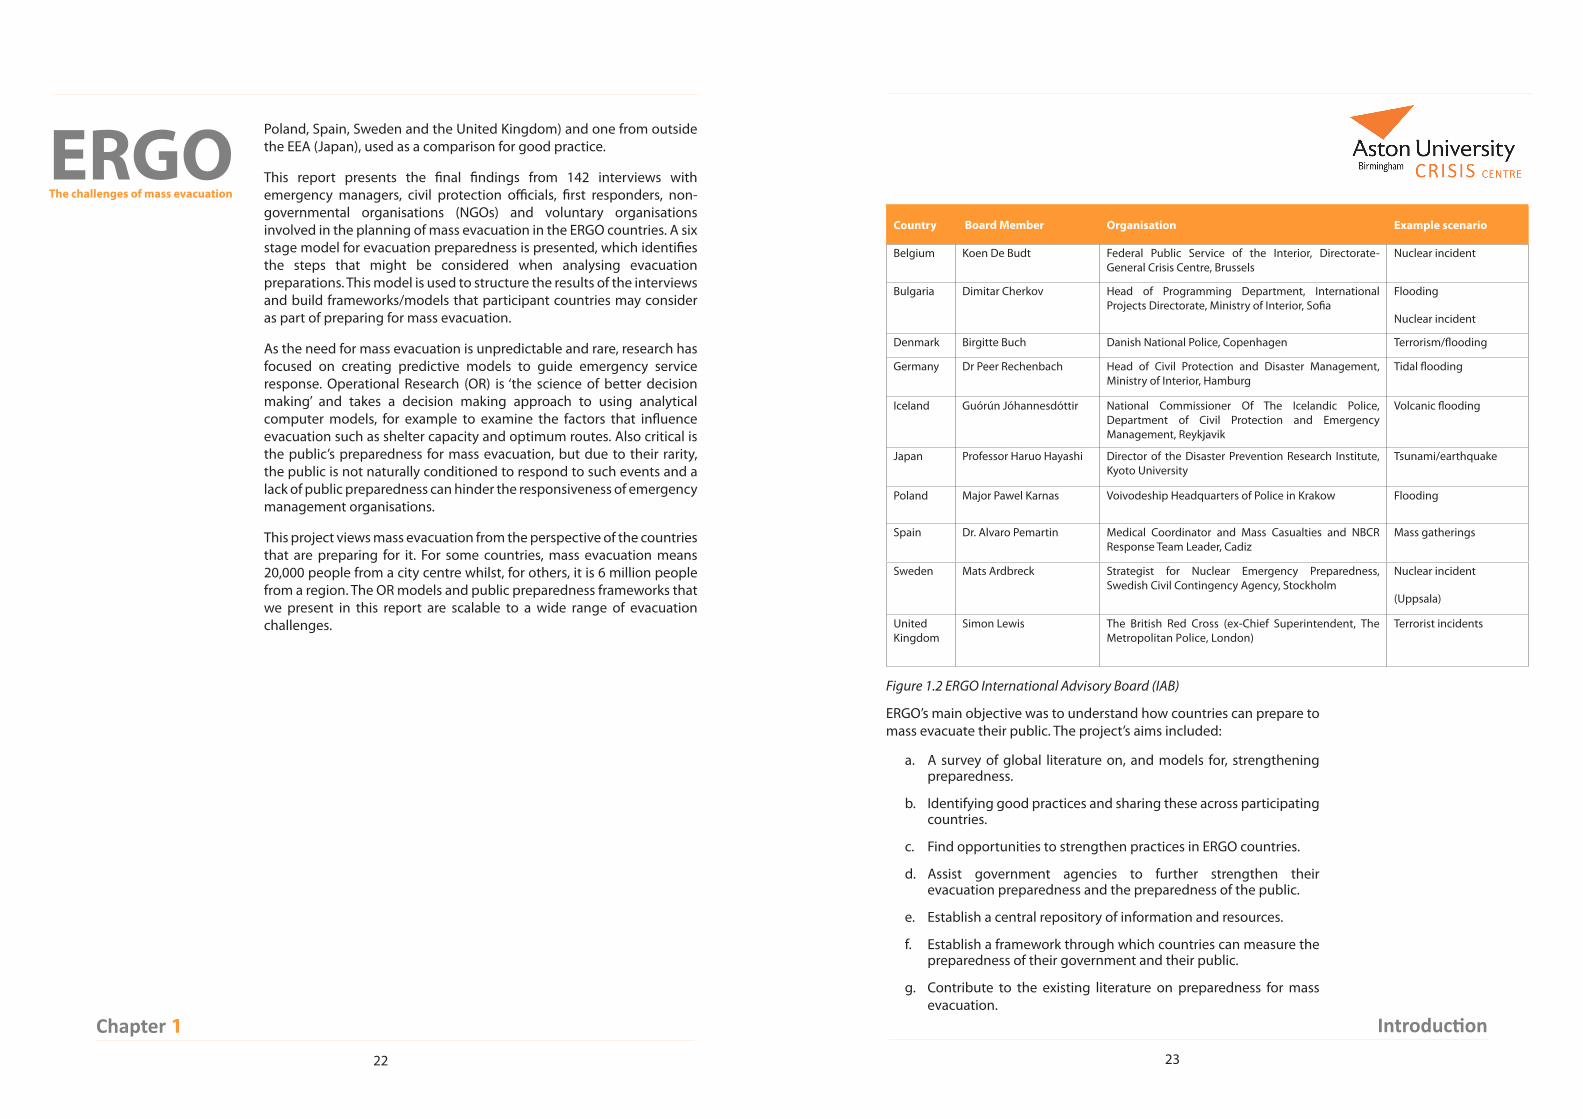
Figure 1.2 ERGO International Advisory Board (IAB)
Poland, Spain, Sweden and the United Kingdom) and one from outside the EEA (Japan), used as a comparison for good practice.
This report presents the final findings from 142 interviews with emergency managers, civil protection officials, first responders, non-governmental organisations (NGOs) and voluntary organisations involved in the planning of mass evacuation in the ERGO countries. A six stage model for evacuation preparedness is presented, which identifies the steps that might be considered when analysing evacuation preparations. This model is used to structure the results of the interviews and build frameworks/models that participant countries may consider as part of preparing for mass evacuation.
As the need for mass evacuation is unpredictable and rare, research has focused on creating predictive models to guide emergency service response. Operational Research (OR) is ‘the science of better decision making’ and takes a decision making approach to using analytical computer models, for example to examine the factors that influence evacuation such as shelter capacity and optimum routes. Also critical is the public’s preparedness for mass evacuation, but due to their rarity, the public is not naturally conditioned to respond to such events and a lack of public preparedness can hinder the responsiveness of emergency management organisations.
This project views mass evacuation from the perspective of the countries that are preparing for it. For some countries, mass evacuation means 20,000 people from a city centre whilst, for others, it is 6 million people from a region. The OR models and public preparedness frameworks that we present in this report are scalable to a wide range of evacuation challenges.
ERGOThe challenges of mass evacuation
24
Chapter 125
Introduction
1.5 Structure of this reportThis report is written for practitioners of emergency management as the technical report is to be disseminated. Academic readers will find interest in this report, but also are offered journal publications, book chapters and conference papers that have been (and will continue to be) written from the project.
To achieve its aims, this report is divided into ten chapters which aim to explain the results, their underpinning and their potential impact on the theory and practice of emergency planning and management.
Chapter 2 comprises of a literature review detailing the latest existing research on evacuation. The chapter is structured around the ERGO Framework for Evacuation (Figure 1.1) and, consequently, reviews the six topics and how the existing academic and practitioner literatures address these. This literature review is written for practitioners, and aims to make the theory and results from academic literature more accessible to those whose priority is practical emergency planning.
Chapter 3 explains the project’s methodology in terms of how data was collected and analysed. We aim to highlight the approaches used so that readers know what data underpins the results and how that data has been analysed to provide generalisable findings in which we can have confidence. We will also introduce the methodological underpinnings of the models and frameworks that are presented in later chapters.
Chapter 4 provides brief country overviews with the aim of helping the reader to understand (at a very high level) more about emergency planning in the ten countries that are involved in the ERGO project. We also introduce a hypothetical city in which we use as a case study city in later chapters.
Chapter 5 discusses the potential impact of Social Marketing to raise awareness and change behaviour for evacuation preparedness. We describe and show the application of a model for how governments might take a strategic approach to strengthen the preparedness of their public.
Chapter 6 outlines the project’s findings regarding the evacuation zone and how government organisations can build a greater understanding of the zone using various tools. The most important of these, the Geographic Information System (GIS), is reviewed. The chapter also discusses the types of spatial data that can be used to understand an evacuation zone, and the limitations for each type. Finally, the chapter highlights best practice in evacuation zone management throughout the ERGO countries, and suggests methods to improve spatial data quality.
Chapter 7 details our work on supporting government organisations in thinking about the uncertainties they face when making the decision to call an evacuation and how personal beliefs influence their professional
1.4.2 Research methodology
ERGO’s methodology is divided into five phases:
Phase 1: The exploratory stage included a review of: the literature, OR models, and approaches to public preparedness. Phase 2: Visits to ten countries where interviews were conducted to establish how governments work and what plans they have to prepare the public.Phase 3: An analysis phase mapped current capabilities, identified good practice and generated measures of preparedness.Phase 4: An impact phase followed with workshops held in each participating country and an interactive web portal established.Phase 5: Dissemination to publicise findings through a conference, journal articles and trade magazines.
1.4.3 Participating countries
Researchers from the ERGO project visited ten partner countries (see Figure 1.2). The countries, their representatives on the project’s International Advisory Board (which is a group of experts who steer the project), and one example of the hazards they face, is given in Figure 1.2.
In some countries we worked at the national level because this is where most evacuation planning was conducted. In other countries we worked at the regional or even local/city level – always positioning our work at the right level for that country (as advised by evacuation specialists in that country). Frequently we held interviews at national, regional and local levels in order to capture a complete picture of planning and analysis in that country. Throughout this report we talk about ‘countries’, for brevity, for consistency, and for anonymity.
Many ERGO countries were preparing for a key hazard which was high on their risk register. We mention these high risk hazards in Table 1, but note that these are one hazard among a number of threats for which these countries were simultaneously preparing.
1.4.4 Deliverables from ERGO
Accompanying this final report there is also an extensive online repository of evacuation-related resources. This repository includes materials that have been prepared by the project team, materials from ERGO partner countries, materials from an international search of evacuation and emergency related materials. This repository is available from www.AstonCRISIS.com or http://crisis.aston.ac.uk .

ERGOThe challenges of mass evacuation
26
Chapter 1
judgement. We comment on the use of models, including decision making models, to uncover more about the challenges of analysing when to call an evacuation decision.
Chapter 8 discusses the computer models that we have developed to support the analyses of government preparedness. These quantitative models analyse and predict: the dissemination of the warning message across a population; the movement of the population when an evacuation is called; and the shelter management of evacuees.
Chapter 9 describes a workbook that we have developed for countries to evaluate their preparedness for analysing evacuation. This workbook can be used by government organisations to assess the preparedness of their country on each of the six topics in the ERGO Framework of Evacuation (Figure 1.1). This chapter will outline that workbook and explain how it can be applied by government organisations to assess their own practice against international good practice.
Chapter 10 concludes the report and summarises the key recommendations for the ERGO project on analysing mass evacuation.
The aim for this report is to help government organisations to become aware of the potential for rigorous research to inform evidence-based planning. Whether this is on preparing the public through Social Marketing, evaluating the evacuation decision, or quantitatively analysing the actual evacuation of the public from an area, government organisations might enjoy the potential for powerful analytical capabilities to further support their efforts. These models will not replace decision makers, but they may prepare them for the evacuation challenge by making them a little more aware of the variables to consider and how these variables may interact.

27
Chapter 2 Literature Review
Key Points:There is a substantial body of literature on each of the six parts of the ERGO •Framework for Evacuation.
ERGO addresses key areas where there is limited literature, for example:•
A comprehensive strategy for creating evacuation behaviour change. »
The evaluation of public preparedness. »
Formalising the process of making the objective-led decisions to evacuate. »
Combining modelling of the warning message with evacuation of people with shelter »planning.
This literature review underpins ERGO’s development of innovative models for •evidence-based evacuation policy making and planning.
2.1 IntroductionIn the early stages of the ERGO project, the research team needed to understand the most recent developments relating to mass evacuation, some of which could be found from a search of international literature. The insights collected at this stage provided an intellectual compass for the project by:
Determining the areas within mass evacuation that the team •needed to focus on.
Informing the methodology that would be employed to complete •the investigation.
Assessing the project’s contribution to the field. •
There is a vast body of literature available on each of the six parts in the ERGO Framework for Evacuation (Figure 1.1). This literature review presents articles that informed the development of these six parts as well as those which the team judged relevant for government

ERGOThe challenges of mass evacuation
28
Chapter 229
Literature Review
2.2 Part 1: Preparing the public to evacuateEven the best evacuation plan will be rendered ineffective if the public does not know what they should do during a disaster. Communication with the public well in advance of any incident (months/years) is vital to raise awareness and change behaviour, but competition for the public’s attention is fierce. Information about preparation for an evacuation (an event which may seem improbable to the public) must draw attention without causing alarm, but remain compelling enough to ensure action is taken.
This section will examine the existing literature on communicating with the public in preparation for an evacuation. It considers the different methods that can be used to communicate information to the public from GOs, and argues that Social Marketing could make a novel contribution to disaster preparedness. This section will demonstrate how Social Marketing encompasses the key lessons from the existing literature on public preparedness; for example, the relationship between the use of audience research (a Social Marketing characteristic) and two areas of public preparedness literature, influences on public preparedness and how public preparedness can be measured.
Chapter 5 will outline the approaches that the ERGO countries are using to prepare their public for mass evacuation and present a case study of these approaches in action.
2.2.1 The need for public preparedness for mass evacuation
Public preparation for mass evacuation provides benefits for individuals and for the GOs that need to coordinate an efficient response to a disaster. Mileti (1991) describes how preparing the public for an evacuation can mitigate the impact of a disaster “(it can) help save lives, reduce injuries…and minimise all sorts of disruptions that disasters cause” (p239). Public preparation for evacuation also removes the sole responsibility for evacuation from GOs, “…in today’s complex world it is hard to see how the public can be protected adequately unless it takes some responsibility for its own security, as the task is simply too great for civil administrators to accomplish alone” (Alexander, 2005, p172).
There is evidence that even in areas where major disasters have occurred, the public fails to prepare for the next event. After experiencing hurricanes Katrina & Rita (USA), a substantial proportion of the affected public did not prepare for evacuation from a future hurricane (Blendon et al. 2007). This indicates that public preparedness for disastrous events is not spontaneous; the threat is evident, but people do not take steps to prepare themselves. Public preparation for an evacuation depends on effective communication from GOs, and this process must be continuous if it is to complement an actual evacuation.
organisations (GOs) that deal with evacuations. The chapter will also outline the conclusions drawn from these literatures by the research team, and provide the context for the ERGO project and its development of analytical models.
Throughout this review several concepts are used: hazard, risk, vulnerability, resilience, preparedness, disaster, evacuation, and many others. It is important to understand what is meant by each key term. Some definitions are given below, but also see Thywissen (2006) for other definitions:
“A hazard, in the broadest term, is a threat to people and the things •they value. Hazards have a potentiality to them (they could happen), but they also include the actual impact of an event on people or places.” (Cutter, 2001, p2) .
“Risk is the probability of an event occurring, or the likelihood •of a hazard happening … Risk emphasizes the estimation and quantification of probability in order to determine appropriate levels of safety or the acceptability of a technology or course of action. Risk is a component of hazard.” (Cutter 2001, p3). Risk = Likelihood x Consequence (Ansell & Wharton 1992, p100).
Vulnerability is “The insecurity of the well-being of individuals, •households or communities in the face of a changing environment”. (Moser & Holland, 1989; quoted in Alwang et al., 2001, p42).
Resilience involves “Qualities of people, communities, agencies, •infrastructure that reduce vulnerability. Not just the absence of vulnerability rather the capacity to 1) prevent, mitigate losses and then if damage occurs 2) to maintain normal living conditions and to 3) manage recovery from the impact.” (Buckle et al., 2000).
Preparedness• is “A state of readiness to respond to a disaster, crisis, or any other type of emergency situation. It includes activities, programs, and systems that exist before an emergency that are used to support and enhance response to an emergency.” (Bullock et al 2005, p181).
A disaster is “A serious disruption of the functioning of society, •causing widespread human, material or environmental losses, which exceed the ability of affected society to cope using only its own resources. Disasters are often classified according to their cause (natural or man-made).” (EEA, 2005).
Evacuation is “the mass physical movement of people in a •community” (Riad et al., 1999, p918)”.
It is also useful to remember that Evacuation Management can be classified into four stages: Mitigation, Preparedness, Response and Recovery (Altay & Green, 2006), and that the ERGO project is focused on studying the government preparedness before an actual emergency.
We will now introduce the literature reviews to understand the state-of-the-art research for the six parts of the ERGO Framework for Evacuation.

ERGOThe challenges of mass evacuation
30
Chapter 231
Literature Review
particular preparations are reviewed. From the literature, messages can have different characteristics that influence how the public may respond to them. One variation in message characteristic is known as the negative threat appeal (McGuire, 1985); these are concerned with how a person is directed to believe that they are at risk from an incident with the potential to cause harm (Mulilis & Duval, 1995). The person-relative-to-event (PrE) model (Mulilis & Duval, 1995; Duval & Mulilis, 1999) proposes that a negative threat appeal which results in a person evaluating their resources as sufficient in relation to the severity of the threat will develop more problem-focused coping than if they evaluate their resources as insufficient (Mulilis & Duval, 1995). Research conducted with 135 students (Mulilis & Duval, 1995) and 178 members of the public (Duval & Mulilis, 1999) using earthquakes as the incident provides support that communications are more likely to be effective in influencing the public to prepare for an earthquake when messages incorporate both a person’s resources to deal with the incident and the severity of the threat. If a member of the public evaluates their resources as sufficient relative to the severity of the threat, increasing the level of threat will result in increased problem focused coping (Duval & Mulilis, 1999).
After the preparedness message is determined, consideration must be given to the delivery method. One communication channel that can be used to send preparedness messages is the internet. Tanner et al. (2009) consider literature on the internet as a communication method in providing the public with preparedness information. Their research examined 119 news websites in the USA for public health emergency content. Only 44% of websites provided mobilising information, information that can cue an individual to action regarding specific behaviour (Damond et al., 2003; Friedman & Hoffman-Goetz, 2003; Hoffman-Goetz, et al., 2003). Mobilising information for emergency preparedness includes “evacuation information, help-line telephone numbers, checklists for preparedness supplies, websites with more information concerning the disaster, and instructions on what to do in case of an emergency” (Tanner et al., 2009, p743).
Another area that needs to be considered is who will receive the preparedness information. The existing literature outlines how different groups of the public may require different public preparedness strategies. Ballantyne et al. (2000) identified that “the social context in which information is received is characterized by considerable demographic (e.g. age, ethnicity, family characteristics, socio-economic status) diversity. This diversity means that different groups have different needs and expectations. By presenting the public education program in a format (e.g. pamphlets, TV advertising) that did not cater for all needs, the perceived credibility of the information was compromised and trust in its source reduced” (Paton et al., 2008, p183).
Members of the public may receive preparedness information at many locations. They may still be at school, at their place of work or in their community during the day. The locations that the public frequently
The need for the public to take an active role in emergency management is reflected by the introduction of laws in countries such as the UK. The Civil Contingencies Act, introduced in the UK in 2004, requires by law that Category One Responders such as Local Authorities inform the public about the risks in their area.
The existing literature outlines various ways in which the public can be encouraged to prepare for a disaster. An overview of this literature will be provided in the next section.
2.2.2 Research on public preparation for disaster
The existing literature on public preparedness can be divided into the following areas:
The effect of different sources of preparedness information.•
The use of different types of messages to influence the public to •prepare.
The use of communications channels such as the internet to prepare •the public.
Preparing different groups of the public.•
The Protective Action Decision Model (PADM). •
The different factors influencing why the public do not prepare for •emergencies.
Measurements of public preparedness.•
The influences on the public’s decision to evacuate.•
When developing a public preparedness strategy, theory tells us that an issue to consider is who delivers the preparedness messages (Paton et al 2008). Different sources of preparedness information may be considered more or less trustworthy by the public. For example, consider how the public may respond to information provided to them from a scientific source compared to a government official involved in a scandal. The emergency management literature outlines how public trust in the source of preparedness information may affect their response to communications. Research with the public in Oregon and Alaska found that the public who were at risk from tsunamis, having reduced trust in civic agencies, resulted in a belief that they would not be warned in time (Paton et al., 2009). Studies have also identified that if information from “civic and scientific sources” did not address public concerns, the public will lose trust in these sources (Paton et al., 2008, p183).
Once it has been decided which source (who) is going to deliver the preparedness information, decisions need to be made on the actual information (messages) that will be sent to the public. As the required content of the message may be disaster and location specific, more information on the precise message content will be discussed later and in Chapter 5 where the findings from the ERGO countries and their
ERGOThe challenges of mass evacuation
32
Chapter 233
Literature Review
Perry (2000) acknowledge that there is a need for further research into the model, and a need to modify theory based on the “discrepancies between PADM and the findings of research on seismic adjustment” (p488). For example, while PADM was originally developed to explain how members of the public living in risk areas responded to evacuation warnings, it has been extended to account for long term volcano preparedness (Lindell & Perry, 2000).
In addition to the above areas covering the different components of a preparedness strategy, the literature covers the measurement of how prepared the public are for emergencies in general or for a specific hazard such as volcanoes, earthquakes and hurricanes. Public preparedness was measured in studies by identifying which “preparedness” activities had been undertaken by the public (Paton et al. 2008; Larsson & Enander, 1997; Ballantyne et al., 2000). In addition to measuring preparedness, these studies also identified the different reasons for why the public were not performing preparedness behaviours (further information on which is outlined later in this section). In another study, organisations were surveyed to measure public complacency under repeated emergency threats from hurricanes (Wang & Kapucu, 2007). The findings of the study illustrated that repeated threat warnings during a hurricane season led to increased public complacency. Recommendations to GOs were made on how to use communications to reduce complacency, such as introducing pre-disaster education to enhance the image of government as a reliable source of information (Wang & Kapucu, 2007). When a GO knows the existing preparedness level for different behaviours, it can allocate resources to strengthen weaker behaviours.
If GOs measure public preparedness for emergencies and identify low levels of preparedness, it is important to identify the reasons why this exists. Once the reasons for lower preparedness are understood, communication material can be designed to address the gaps in the public’s knowledge. Reasons suggested in the academic literature for poor public preparedness include:
Lack of awareness (Auf Der Heide, 1989; Larsson & Enander, 1997).•
Underestimating the risk of disaster (Auf Der Heide, 1989; Paton et •al., 2000).
Fatalism (Auf Der Heide, 1989; Paton et al., • 2000).
Denial (Auf Der Heide, 1989; Larsson & Enander, 1997).•
Not believing one is capable of doing anything to prepare (Paton et •al., 2000; Larsson & Enander, 1997).
Transferring responsibility to others (Paton et al., • 2000).
However, the reasons outlined above are not supported with empirical evidence. A survey of 925 people in Sweden found that the most popular reason for not preparing for emergencies or disasters relates to uncertainty (Larsson & Endander, 1997). People did not know what
attend can be used to disseminate preparedness information. Schools and community groups are two locations that literature suggests to use to influence public preparedness for mass evacuation. Children who have participated in two or more education programmes involving learning about hazards are significantly more aware of protective behaviours than both non-educated children and those who have only participated in one programme (Ronan et al., 2001). The use of community groups to achieve public preparedness is proposed by Mileti & Fitzpatrick (1993), Paton et al. (2008) & Perry & Nigg (1985). Findings from a survey of 405 people (Ballantyne et al., 2000) provides support for the use of the community in preparing the public: “preparation is linked to prevailing sense of community…data support the use of community empowerment and development programmes for hazard mitigation and preparation initiatives” (p38).
So far the source of preparedness information, the preparedness message itself, the communications channel used to deliver the message, the public who receive the message and the locations where preparedness information is disseminated to the public have been identified as areas that are covered in the existing literature. Although GOs may use the literature outlined above to inform their preparedness strategy, most academic studies focus on only one element of a preparedness strategy.
In practice, it is likely that GOs will consider several elements for a preparedness strategy (an integrated approach), and in doing so will consider what messages to send through which communications channels to whom. Suggestions on different elements of a preparedness strategy, focused on earthquakes, are outlined by Nathe et al. (1999) covering:
The message:• Use simple language, ensure information is consistent, include information on potential losses, the chances of losses taking place in a specific time period, how the public can reduce these losses and who is at risk if an earthquake occurs.
The process of communicating with the public:• Use various sources of information that the public trust, tailor information to different groups of the public, use different types of media to provide information and include an evaluation component in the campaign.
One model that incorporates different elements from a public preparedness strategy is the Protective Action Decision Model (PADM) (Lindell & Perry, 1992, 2000, 2004). The model recommends environmental cues, social context, information sources, information channels, message content and receiver characteristics that lead to “protective action decision making” by members of the public (Terpstra, 2009; Lindell & Perry, 2004). Information sources, information channels, message content and receiver characteristics are already considered in the above literature, however PADM brings these different areas of a preparedness strategy together. Although PADM does incorporate a number of the different elements of a preparedness strategy, Lindell &

ERGOThe challenges of mass evacuation
34
Chapter 235
Literature Review
do this, currently GOs would have to integrate the different areas of research themselves. Although the PADM does incorporate different elements of a preparedness strategy, there is a need for further research into a number of different areas of the model.
The above literature considers one main area of a preparedness strategy: communications with the public. In addition to developing a communications strategy, GOs will be responsible for the planning, implementation and evaluation of the preparedness strategy. The existing literature can assist in making decisions on which source to use, the preparedness message and communications channels; it does not assist in preparing for other stages within the preparedness strategy, such as evaluation.
The existing approaches in the literature can also be considered “top-down” in that the researchers develop the intervention and then measure how effective it is in influencing the public to prepare. In many cases, the researchers do not engage with the public to develop the intervention before testing it. The academic literature has acknowledged that “emergency management should be about strengthening the links between responders and the public to enhance emergency planning…effective emergency planning should be more encompassing and should include the wider public” (O’Brien, 2008, p240). The next section will outline an approach for GOs to design, implement and evaluate their preparedness strategy.
2.2.4 Social Marketing for public preparedness
This section outlines how Social Marketing may be used by GOs to influence the public to prepare for mass evacuation. Examples of how Social Marketing has been used in practice to influence preparedness behaviours will illustrate the application of Social Marketing in emergency management contexts.
What is Social Marketing?: Social Marketing is “the adaptation of commercial marketing technologies to programs designed to influence voluntary behaviour of target audiences to improve their personal welfare and that of the society of which they are part” (Andreasen, 1994, p110). In contrast to commercial marketing, Social Marketing is concerned with influencing behaviour change in order to benefit individuals and society (Andreasen, 1994). In the context of preparing the public for emergencies, observers have noted that, “…through culturally sensitive market research, careful market segmentation and targeting, and scrupulous pretesting of marketing programs, Social Marketing has the potential to address the individual differences…that affect people’s perceptions of disaster risks and their responses to risk” (Guion et al., 2007, p26). Research has demonstrated that an effective Social Marketing approach can be used to change the public’s behaviour. For example, Social Marketing has been used to change smoking, alcohol and drug-related behaviours (Stead et al., 2006), changing gambling habits (Gordon & Moodie, 2009), sustainable
to prepare for and therefore thought that there was no use in carrying out preparedness activities. Not wanting to think about preparing for emergencies and not wanting to spend time or money on preparing for emergencies were also reasons provided by the people surveyed. In a study on community resilience and preparedness for pandemic flu, Paton et al. (2008) found that people were not preparing due to a belief that it would not make any difference.
In addition to understanding why the public do not prepare for emergencies, it is also important to understand why the public decide not to evacuate. The reasons why the public do not evacuate can then be targeted with preparedness communications. Research carried out with the public has shown that reasons for deciding not to evacuate include:
Perception of the risk (Blendon et al., • 2007; Eisenmann et al., 2007; Riad et al.,1999).
Concerns about financial resources and property (Blendon et al., •2007; Eisenmann et al., 2007, Riad et al., 1999).
Characteristics of the evacuation message (Eisenman et al., • 2007, Fischer et al., 1995).
Social support/networks (Eisenman et al., • 2007; Riad et al., 1999; Cutter & Barnes, 1982).
Previous experience (Perry et al., • 1980).
Pets (Eisenman et al., • 2007; Leonard & Scammon, 2007).
2.2.3 Limitations of the existing literature
The literature outlined above is based on research with the public to identify how different approaches may influence their preparedness behaviours. There is an absence of literature and theory grounded in GOs’ perspective of preparedness. It has been acknowledged by Dyer (1999) that “the disaster literature has been dominated by a focus on community and individual perspectives, but it has failed to take institutional perspectives and responses into account” (Baker, 2009, p120). Therefore, GOs may or may not currently use the above research to develop their preparedness strategies; however, there is no research outlining whether and how they do this. GOs’ perspective on public preparedness for mass evacuation is important as they are the designers and implementers of the preparedness strategy and are the ones working to influence the public to prepare for mass evacuation. Organisations responsible for influencing the public to prepare will be able to identify the activities the public should be undertaking to best prepare for mass evacuation and any barriers restricting the extent to which they can prepare the public.
As outlined above, the existing literature, with the exception of the PADM model, mostly considers only how one element of a preparedness strategy can influence public preparedness. In reality, GOs will have to consider all the different areas outlined in the literature. To

ERGOThe challenges of mass evacuation
36
Chapter 237
Literature Review
The following six sections expand on the titles found in Figure 2.1 to explain the characteristics of a Social Marketing approach in the context of preparing the public for mass evacuation:
Behaviour change as the primary goal:1. This is concerned with identifying the desired behaviours, knowledge and beliefs the public should adopt, for example to stop smoking or reduce litter dropping. Once the behaviours and knowledge have been identified, measurable objectives may be set so that the approach can be evaluated. In the context of preparing for mass evacuation, GOs may want the public to prepare by adopting behaviours such as storing resources and/or creating family evacuation plans. There is also an opportunity for GOs to change what the public currently knows and believes about preparing for mass evacuation.
The use of audience research: 2. Research can be conducted at various stages of an approach to change behaviour. It can be undertaken to identify the existing levels of public performing the desired behaviour, to identify what information the public needs to perform the behaviour and also to evaluate whether the campaign was effective in changing behaviour. GOs can use research to identify the public’s emergency preparedness information needs and to evaluate the approach.
Segmentation of the target audience: 3. Not all members of the public will respond to communications in the same way and may need
Figure 2.1 Social Marketing characteristics (Andreasen, 2002)
behaviours (McKenzie-Mohr, 2000) and reducing electricity use (Marcell et al., 2004).
In the context of the public’s emergency preparedness behaviours, two research studies describe the potential of Social Marketing in Rhode Island (US) (Marshall et al., 2007) and Central Vietnam (Ramaprasad, 2005). In Rhode Island, 10% of the adult population adopted one or more preparedness behaviours because of the Social Marketing approach taken.
One campaign developed using a Social Marketing approach to change the public’s emergency preparedness behaviours is Public Safety Canada’s “Is Your Family Prepared?” campaign (www.getprepared.ca) (Kotler & Lee, 2008). Public Safety Canada used the different characteristics of Social Marketing to achieve their aims, which were to: raise awareness of hazards and threats; increase the number of Canadians who have created a family emergency plan; increase the number of Canadians who have a 72 hour emergency kit (Kotler & Lee, 2008). Preliminary evaluations indicate that the Social Marketing campaign had a positive impact on the Canadian public’s emergency preparedness behaviours. Public Safety Canada’s campaign is used as a case study by Kotler & Lee (2008) to illustrate how Social Marketing can be used to improve the readiness of the public to prepare for and respond to an emergency. The next section will use the public preparedness campaigns in Public Safety Canada (Kotler & Lee, 2008) and Rhode Island (Marshall et al., 2007) as case studies to illustrate how the characteristics of Social Marketing have been used effectively to change the public’s emergency preparedness behaviours.
Characteristics of Social Marketing: This section will use Figure 2.1 to outline the characteristics associated with Social Marketing.

ERGOThe challenges of mass evacuation
38
Chapter 239
Literature Review
The three emergency preparedness behaviours that the Rhode Island Department of Health wanted their public to adopt to prepare for emergencies were to:
Make an emergency kit.1.
Make a plan to stay in contact with family and neighbours.2.
Identify how to stay informed about emergency instructions 3. (Marshall et al. 2007).
In order to concentrate on changing these three specific behaviours, the Department of Health sent a booklet entitled “Make a Kit, Make a Plan, Stay Informed” to all Rhode Island residents. For further information on this Social Marketing initiative designed to prepare the public for emergencies visit http://www.health.ri.gov/
GOs may set measurable objectives for the behaviours they want the public to undertake. Setting measurable objectives for behaviour change enables organisations to monitor and evaluate their efforts to prepare the public. An example of a measurable objective is: To increase the percentage of the public who have created an emergency kit by 10% in the next 18 months. In addition to changing behaviour, there is also the opportunity for GOs to change what the public knows about preparing (knowledge objectives) and what they believe or feel about preparing. There are various different types of knowledge that GOs may want the public to gain in order to prepare for mass evacuation, such as how they should respond to a warning, where they should go and what they should take when evacuating. There is also the opportunity to change the public’s beliefs about preparing for mass evacuation, for example GOs may want the public to believe that the benefits of preparing outweigh the costs. Although GOs may identify the beliefs they want the public to hold regarding preparing for mass evacuation, measurable objectives do not need to be set due to the difficulties associated with measuring a person’s beliefs.
Audience research: The second characteristic of a Social Marketing approach is the use of audience research at the beginning, during and after the implementation of an intervention. Public Safety Canada carried out research with the public before their campaign to measure the level of personal emergency preparedness (Kotler & Lee, 2008). The research identified low to moderate levels of personal preparedness with 33% of Canadians having prepared a family emergency plan and 32% an emergency kit. As outlined above, studies in the existing public preparedness literature have also measured public preparedness for emergencies in general or for particular hazards. One study measuring public preparedness for emergencies, in general provided the public with a “behavioural report list” of 15 different actions including knowledge of sources of preparedness information and preparations that had been made at work, school or at home and asked the public to indicate yes or no for each action they undertook (Larsson & Enander, 1997, p13). Similar approaches were used in studies designed to
information tailored to their needs. Different preparedness strategies may be required by GOs to target different groups of the public.
Consideration of the costs to change behaviour versus the benefits 4. received in exchange: In order to receive the benefits of a new behaviour the public often have to pay a ‘cost’. For example there is a long-term health benefit from stopping smoking but there is also a short term ‘cost’ in terms of withdrawal symptoms such as cravings. To prepare for mass evacuation the public may have to spend time and/or money in exchange for receiving the benefits of being better prepared for mass evacuation. GOs have the opportunity to reduce the effort the public makes to prepare.
The marketing strategy:5. This characteristic considers: products and services that support the behaviour change; reducing the effort the public needs to exert to perform the behaviour; convenient and easy access to behaviour change information and the behaviour change messages being sent to the public through appropriate channels. When developing a public preparedness strategy using a Social Marketing approach, GOs will need to consider ways to support the public’s preparation efforts, locations, and the communication channels used to disseminate preparedness messages and information to the public.
Consideration of the competition to the desired behaviour change:6. There are many organisations competing to change the public’s behaviour, for example the public are sent messages to stop smoking, increase their physical activity and eat five portions of fruit and vegetables a day. This characteristic is concerned with acknowledging that in addition to GOs wanting to increase the public’s mass evacuation preparedness behaviours, there are other organisations trying to change a wide variety of public behaviour. All organisations are competing with each other to be successful in changing the public’s behaviour.
The next section will discuss how these Social Marketing characteristics are relevant to preparing the public for mass evacuation.
2.2.5 The relevance of the 6 Social Marketing characteristics to evacuation
This section extends the discussion above around Figure 2.1 and clarifies its relevance to evacuation planning.
Behaviour, knowledge and beliefs: Social Marketing aims to effect voluntary change in the public’s behaviour (Andreasen, 1994). GOs may want the public to change from being under-prepared for mass evacuation to adopt new behaviours to prepare for mass evacuation such as storing resources, creating evacuation plans and identifying local and regional evacuation plans (Redlener & Berman, 2006).
ERGOThe challenges of mass evacuation
40
Chapter 241
Literature Review
evacuation are outlined below (Kotler & Armstrong, 2001; Kotler & Lee, 2008, p119):
Demographic segmentation: • Age, gender, family size, income, occupation, education, religion, race, generation, nationality, health – Developing an emergency preparedness colouring book for young children exemplifies preparation by age; a different approach, such as an emergency preparedness computer game to target teenagers also falls in this category.
Geographic segmentation: • World, region or country, city or metro size, density, climate, proximity to the source of the hazard – geographic segmentation would involve creating different hazard maps for different geographic areas.
Behavioural segmentation:• Readiness stage, attitude toward the product – GOs may choose to target members of the public differently depending on their existing level of preparedness for mass evacuation.
Psychographic segmentation:• Social class, lifestyle, personality, transport usage – an example of psychographic segmentation would include targeting specific groups of the public such as those who are highly innovative and are the first to adopt new technologies.
Both Public Safety Canada and Rhode Island Department of Health used demographic segmentation in preparedness campaigns. Public Safety Canada wanted to focus more on targeting women than men with their “Is Your Family Prepared?” campaign. In order to target women the promotional element of their strategy included adverts in 16 national magazines targeted at women. Rhode Island Department of Health translated their “Make a Kit, Make a Plan, Stay Informed” booklets from English into an additional seven languages (Spanish, Portuguese, Chinese, French, Cambodian, Hmong and Laotian) (Marshall et al. 2007).
Preparedness costs versus benefits: When using a Social Marketing approach to motivate the public, GOs create an exchange with the public. In exchange for the benefits of being prepared for mass evacuation, the public must pay the associated price (costs) (Guion et al., 2007). Preparing for evacuation may cost the public:
Time:• Searching for information and making plans.
Psychologically:• There may be psychological costs of engaging in the behaviour (e.g. fear arousal).
Financially:• Paying for resources in case of evacuation.
The research outlined above identified that the public do not prepare for emergencies due to the time and financial costs of preparing (Larsson & Enander, 1997). Many attempt to reduce the time costs that the public pay to prepare by providing a checklist covering the creation of an evacuation plan and what to do once an evacuation begins (e.g. South Gloucestershire Council, UK http://www.southglos.gov.uk). Public
measure preparedness for volcanic and earthquake hazards (Ballantyne et al, 2000) and pandemic flu (Paton et al., 2009) where the public were provided with a list of preparedness behaviours and knowledge and were asked to indicate which they have. Audience research can also be used to identify the different factors that influence whether the public prepare for mass evacuation. The literature outlined above included many suggestions as to why the public do or do not prepare for emergencies. Those factors based on research evidence include uncertainty and not wanting to spend time or money on preparing (Larsson & Enander, 1997). An understanding of the factors influencing whether the public prepare for emergencies is important when developing preparedness communications and information to the public (Larsson & Enander, 1997). Rhode Island Department of Health undertook the following research when using a Social Marketing approach to prepare the public:
Focus groups:• Held with 112 members of the public from Rhode Island to understand their information needs before, during and after a health emergency.
In-depth interviews: • Held with 19 members of staff from 17 different organisations serving the community to understand their perceptions of past health emergencies and the information needs of ‘special populations’.
Pre/post-test telephone survey: • Held with 501 members of the public to measure changes in behaviour before and after the Social Marketing approach taken (Marshall et al., 2007).
Audience research may be used to measure existing levels of public preparedness, identify the information the public needs to prepare, develop communications material and evaluate the preparedness strategy. Conducting research may also identify different levels of preparedness and information needs for different groups of the public. The next section outlines how different groups of the public may need to be targeted in different ways.
Segmentation: When GOs decide on a target audience it is important for them to recognise that not all members of the public should be targeted in the same way. The public may perceive the costs and benefits of preparing for evacuation differently and need to be targeted in a different way (Guion et al., 2007). Tailoring communications to different target audiences may also increase their effectiveness in changing behaviour (Kotler & Lee, 2008).
Different countries may have specific characteristics that requires a tailored approach. Research by Tanaka (2005) found, “…that different approaches and information of disaster education are necessary for people to be motivated to take preparatory activities in different cultures” (p218).
Methods of segmenting the public relevant to emergency management contexts and examples of how the method works in practice for

ERGOThe challenges of mass evacuation
42
Chapter 243
Literature Review
have participated in the campaign that includes the distribution of promotional materials such as a calendar explaining different risks and how children can prepare. For more information on the “What If?’” campaign please visit the emergency preparedness webpage on Essex County Council’s website (www.essexcc.gov.uk).
Promotion of the preparedness strategy:• GOs will need to make decisions on the promotional strategy used to prepare the public. In order to make these decisions the existing disaster management literature may be of use as it outlines how to design effective communications. The following areas of the existing literature are considered important when designing communications to the public:
Source (Who is responsible for the communications): » It is important for GOs to understand which sources of preparedness information the public trusts most and use these sources to deliver information where possible (e.g. the Mayor, a government scientist, a police chief ).
Message (What is said to the public): » Audience research may identify the messages the public need and want to know in order to prepare for mass evacuation. Rhode Island Department of Health conducted 12 focus groups with 112 residents and found the public wanted to receive “basic information about where to go and what to do” (Marshall et al., 2007, p51). The existing literature on the PrE model (Mulilis & Duval, 1995; Duval & Mulilis, 1999) may also be used to design preparedness messages.
Channel (How messages are sent to the public): » Channels currently used to send preparedness messages to the public include printed materials such as leaflets, brochures, hazard maps and newspapers, outdoor signage and the internet. The focus groups conducted by Rhode Island Department of Health identified that members of the public wanted to have something to “refer to” in the event of an emergency – such as print materials provided directly to each household or through newspaper inserts, supermarkets, pharmacies, and on the government website” (Marshall et al., 2007, p53).
Receiver (The person who receives the message): » This area is related to segmentation and acknowledging that different target groups may respond differently to different messages and may use different communications. The existing literature (Ballantyne, 2000; Paton et al., 2008) outlines how different target groups have different needs and expectations.
Feedback (The effect of the communication): » When sending preparedness messages to the public it is important that the sender (GOs) knows that the public has received and understands the message. Receiving feedback from the public may inform the sender whether the message has been understood and provides the sender with an opportunity to modify the communication to be more in line with the information needs of the public.
Safety Canada also attempted to reduce the time costs to the public by selling ready-made emergency kits for approximately $57 USD and by including templates to create family plans on the website (Kotler & Lee, 2008).
The marketing strategy: When developing a public preparedness strategy using a Social Marketing approach, GOs will need to consider the following areas:
Ways to support the public’s preparation efforts.•
The locations where preparedness information should be •disseminated.
The messages to be communicated to the public through •communications channels relevant and preferred by the target audience – the promotional strategy (Andreasen, 2002).
These areas are outlined in more detail below.
Supporting public preparation efforts:• GOs want to increase the members of the public undertaking preparedness behaviours. In order to support the public in undertaking in these behaviours different types of products and services may be needed. Tangible products introduced by Public Safety Canada to prepare their public include a website, free telephone number, family preparedness guide and the ready-made emergency kits (Kotler & Lee, 2008). In the UK, an internet based game covering different emergencies is available for children (http://www.crucial-crew.org/what-if/).
Locations to disseminate preparedness information:• In order to perform the behaviour of preparing for mass evacuation, it must be convenient and easy for the public to access information on how to prepare and to receive the products and services introduced to support their preparation efforts. GOs have the opportunity to make preparedness information, products and services conveniently and easily accessible to the public by disseminating them through locations such as places of work, schools and directly in the community. The literature above outlined how community groups are one way in which the public can receive preparedness information (Mileti & Fitzpatrick, 1993; Paton et al., 2008; Perry & Nigg, 1985). An example of a community initiative in the UK is the Flood Warden scheme in Lincolnshire. Through the scheme, members of the public who are interested in protecting their own and other members of the public’s homes can register to be a warden, and then be trained in how to prepare and notify neighbours if a flood is predicted. (http://www.lincolnshire.gov.uk). Schools were identified as another place to disseminate preparedness information (Ronan & Johnston, 2003; Ronan et al., 2001). An example of a programme targeting children is the “What If?” campaign run by Essex County Council, UK. Schools in Essex

ERGOThe challenges of mass evacuation
44
Chapter 245
Literature Review
wide range of applications, and systems have been used in projects as diverse as asset management and archaeology (Berry, 1993; Joerin & Musy, 2000). The system is so flexible because it is much more than a conventional map, instead a GIS combines three main elements:
Maps:• Diagrams showing an area’s geographic features.
Databases: • The information that can be displayed on the maps. For example, a database could contain information about the preferred escape routes from an area susceptible to flood.
Statistics:• Information from the database that has been analysed to display particular trends.
The information displayed in a GIS is known as spatial data, and is defined as information that has a geographic element. In many cases this type of information is vital to public decision making (Burrough & Mcdonnel, 1998; Cornelis & Brunet, 2002). Van Oort (2005) estimates that 80% of data used by managers and decision makers (DM) is spatial.
When integrated into a GIS the three elements listed above become a powerful tool, especially for emergency management. This can be illustrated by one of the earliest GIS, which was deployed by Dr. John Snow during the 1854 cholera outbreak in Soho, London. Cholera is a disease spread through contaminated water sources, and in the 1800’s many people in London depended on public pumps for their water. However, the link between water contamination and the disease was not established at the time. During the outbreak Dr. Snow, a local physician who suspected that cholera was waterborne, visited the area to determine where the cholera victims were located. He plotted this information, amongst other data, on a map. This map indicated that disease victims were clustered around a particular drinking pump. Dr. Snow had the authorities remove the pump’s handle; the outbreak subsided, a development that vindicated his theory and demonstrated the value of mapping techniques.
Compared to the computerised systems used today Snow’s GIS seems very primitive, but it contained (if only at a very simple level) a map, a database and statistics about the outbreak. Faced with a similar epidemic today authorities can call upon much more sophisticated computer systems that integrate vast amounts of information at great speed, and this allows for more complex relationships to be uncovered. For example, the recent cholera outbreak in Haiti has been mapped in real-time for use by public health officials.
The information used by Snow, and today’s health workers in Haiti, are examples of spatial data. The ERGO project’s concern is evacuation, and the spatial data involved in our analysis can be summarised as follows:
Traffic patterns (Hobeika et al., • 1994).
Demographic data (Wright, 1936; Martin et al., • 2000).
Shelter information (Simmons & Sutter, 2006; Dombroski et al., •2006).
Competing for the public’s attention: The final suggested characteristic of a Social Marketing approach (Figure 2.1) is that emergency planners should recognise they are not alone in trying to get the public to do something different (Andreason, 2002). Just as marketing in the commercial arena has to compete with other messages and products, Social Marketing is a competitive arena with the request for the public to spend time preparing for an evacuation means the public are being asked to spend time engaging in activities that may never have a payoff (i.e. the evacuation may never happen) as compared to everyday activities that do have a payoff. Also, the Social Marketing messages about preparing for an evacuation are in competition with other Social Marketing messages about, for example, eating healthily, quitting smoking and taking up exercise. GOs responsible for public preparedness are competing with these other messages and have to try to make their message seem more attractive to the public.
2.2.6 Conclusion
This section has suggested that Social Marketing potentially offers a useful framework for GOs seeking to prepare the public for mass evacuation from a disaster. The Social Marketing approach still requires refinement for a mass evacuation environment, but it offers novel contributions for GOs seeking more effective communication with the public.
Outlining the Social Marketing characteristics illustrated in Figure 2.1 has demonstrated how the characteristics such as behaviour change objectives, audience research, segmentation and the marketing strategy are relevant to GOs responsible for the design and development of a public preparedness strategy. It is important to note that both public and government preparedness is required for an effective mass evacuation. The public being well prepared for mass evacuation reduces demand on GOs needing to respond during an incident.
The next section will discuss the existing academic literature on methods for understanding the evacuation zone itself, and explain the potential systems for doing so.
2.3 Part 2: Understanding the evacuation zoneWe now move on to Part 2 in the ERGO Framework for Evacuation (Figure 1.1), the analysis of the evacuation zone. Humans like to be familiar with their surroundings; we all know the important landmarks in our hometowns for navigation; and everybody knows what it’s like to be lost, or curious about an unknown area.
The solution to this problem is to be found in mapping our environment. This section is about a type of map, usually computerised, called a Geographic Information System (GIS). A GIS can be used for a

ERGOThe challenges of mass evacuation
46
Chapter 247
Literature Review
management requires the correct configuration of transport networks, and the routing of individuals either away from established high-risk zones or toward evacuation shelters.
The Configurable Emergency Management and Planning System (CEMPS) is an example of a GIS used to facilitate emergency evacuation. The primary goal of this system is to use traffic and road networks to facilitate routing, queuing, and destination decisions by a GO (Pidd et al., 1996; de Silva & Eglese, 2000; de Silva, 2001). The CEMPS system integrates a simulation model into a GIS framework to analyse policy actions that will affect roadway congestion during full-scale evacuation of the population. This evacuation model illustrates how the use of spatial data is simply used as the input to the evacuation analysis. The platform in which the data can then be visualized is also done through the GIS. In this case, the primary spatial data used is the transportation network of the study area and some specification of the hazard that can affect this network. The use of the GIS is also for visualisation purposes and provides a platform through which policy outputs may be presented to emergency managers (Andrienko & Andrienko, 2007).
Cova (1997) takes a different approach to modelling evacuation through the creation of Emergency Planning Zones. Cova creates a map that predicts areas of high road congestion during evacuation scenarios. This also utilises GIS as a platform through which data is analysed and presented. In this case the GIS is used for the manipulation of population and road data. The inclusion of population data is very important when using spatial data. The concept of population distributions in evacuation zones is a necessary component to spatial analysis for evacuation. Specifically, a process is used that attaches population information from the data warehouse that is organised by zones within the road networks, which are also represented within the GIS.
There have also been attempts to model more uncertain hazards, like forest fires, through GIS by using a model that analyses how a fire might spread from information gathered by satellites or aircraft passes over fire-prone areas. This data is then integrated into the population-based network map to predict fire spread and provide the basis for evacuation of at-risk neighbourhoods (Cova & Johnsone, 1997). In this case, the GIS platform is used to simulate fire spread as well as a visual representation, such as a map, for policy assessment.
Kar & Hodgson (2008) use population and building information within a GIS to evaluate the supply and demand of evacuation shelters in Florida. The potential need for evacuation shelters in Florida combined with the uncertainty of shelter demand leads to this analysis of potential sheltering sites within the area. The process includes the identification and spatial analysis of possible shelter locations in 17 Florida counties. Their focus is on the elderly and disabled people and the spatial location of both these populations and the locations of the shelters it is possible to find if there is a need for additional sheltering
Topographic information (Butler et al., • 2007).
Routing information for individuals (ReVelle et al., • 1991).
High-risk zones (Thayer et al., • 2003).
This section will deal with the ways in which spatial data is used to understand the evacuation zone and support evacuation planning and operations. The next section will deal with issues of spatial data, including spatial data quality.
2.3.1 Spatial data manipulation
In order to explain how GIS can be used to support evacuation and planning it is important to understand spatial data in a little more depth, and also how GIS have been used to create tools for evacuation planning. The academic research discussed here represents a sample of research that uses spatial data for evacuation analysis. While other research exists, the focus here will be on how spatial data can be manipulated to inform evacuation policies and decisions. Manipulation, in this context, refers to the ability to define the spatial data used in the system and how those data are accessed.
The information behind a GIS, the spatial data, is stored in a database warehouse; this is a database that stores information from many different databases. For example, an emergency manager might be interested in census data, traffic information, shelter resources, and flood tides on a river. This information would be drawn from different sources, but the database warehouse manages the data in a way that makes it useful for the GIS. This information is then displayed on a map, and the map can be changed to display different parts of information from that warehouse.
The main difference between the use of GIS and other simulation techniques is the way this information can be changed within the GIS. Many other traffic and risk-based models use spatial information, but these do not need to use a GIS as they either do not use maps to visualise the data or require fewer data to be manipulated (Chiu & Zheng, 2007).
While GIS capability represents a more advanced level of spatial analysis, it is important to note that the academic literature tells us that simpler spatial data analysis tools can also be used for emergency management. Some of these alternatives can be as basic as paper maps, map boards, or even a table-top graphic of the local area.
Evacuation-specific models that use spatial data have, for the most part, focused on answering operational questions because a large portion of literature on evacuation has been done by engineering and transportation researchers seeking to improve their day-to-day activities. These models attempt to use established traffic-flow models to understand the maximum capacities of transportation networks. Their work is relevant to the ERGO project because successful disaster

ERGOThe challenges of mass evacuation
48
Chapter 249
Literature Review
spatial data without considering the implication of the quality of that information, either because they are compelled to use the data or because it is the only information available to them. The findings suggested that, in many cases, the problem lay in a lack of underlying information that was not readily available or understandable by the relevant policy-makers. The result of using inaccurate spatial data is also hidden from policy-makers. This is also complicated when various organisations must rely on information from outside sources. The implication of this for evacuation policy-making is substantial. It means that decisions must be taken based on information that may be unreliable, unintelligible or unavailable.
In conclusion, this section has outlined the capacity and potential for GIS during an evacuation. Contemporary GIS allow for complex relationships to be understood at speed. Above all a GIS allows many different data sources to be collected into a single system. These can come from very diverse sources, often quite different to each other in format. The GIS is invaluable as a central repository, but it also allows much flexibility in how the data is displayed. Applications have been varied, but few have considered using GIS as part of a comprehensive evacuation package. A useful GIS requires accurate data, and there is an important role for GOs in determining what data can be gathered for a system.
We now move on to Part 3 in the ERGO Framework for Evacuation (Figure 1.1) as the next section will discuss how Decision Theory can inform the actual evacuation orders.
2.4 Part 3: Making the evacuation decisionThe evacuation decision is vital for GOs. Upon examining the literature, it was found that emergency managers were concerned about when they should make an evacuation decision. The following key aspects of emergency management emerged as being important to making the evacuation decision:
Hazards and risks are rarely predicted with certainty within the 1. necessary timeframe of an effective evacuation.
Evacuation orders bear with them considerable costs to the 2. public and GOs.
GOs must base the decision on multiple conflicting objectives.3.
These factors indicate that in many cases it is necessary for emergency managers to call an evacuation when the hazard is becoming more concerning, but the risk is still uncertain. This is often the case with floods. Officials will be aware that water levels have risen, but do not want to risk the economic damage caused by an evacuation. The penalties for making the wrong decision could be severe as many lives could be lost, the economic penalties could be serious, and public faith in the GO could be damaged which may compromise responses to future emergencies.
options. These different types of spatial information are combined through a map system within the GIS. This research found that over half of the identified sheltering locations were either unsuitable due to their distance from at-risk populations or because their proximity to hazardous coastal areas.
As the above GIS examples show, there are many different ways to manipulate spatial data in order to make it useful for emergency planning. However, even a well-designed system can fail if it is fed poor quality data. This problem is addressed in the following section.
2.3.2 Spatial data quality
When a judge hears a case in court, he is always aware that the information being provided to him may well be inaccurate, subject to manipulation and memory. He will seek to make his decision using the best information presented to him. The same is true for GIS, a system has enormous possibilities to process information, but this is useless unless the data is reliable. Good quality data can lead to the best evacuation response based on a GIS.
Spatial data quality (SDQ) refers to the degree to which any single dataset, which is a collection of related data, accurately represents the location and information that must be analysed. European Union policy identifies a set of data characteristics that define data quality for spatial information (Jakobsson & Vauglin 2001). Specifically, the requirements include:
Provide an unambiguous location for user information. • This means that a GO official would only need to use one program to access data on evacuation.
Enable the merging of data from various sources e.g. • information on traffic patterns and shelter capacity.
Provide a context to allow others to better understand the •information that is being presented (Rase et al., 2003).
The above requirements illustrate a way to evaluate the quality of spatial data used by GOs for evacuation analysis. The source of the information is vital to the quality of spatial information. Spatial data should adhere to high standards of data gathering from organisations that have the resources and responsibility to provide that information. Due to the wide variety of spatial information that is used in evacuation analysis it is important that the data can be effectively merged between the various sources. Finally, the information must be presented in a context that is easily interpretable by users. This can take various forms ranging from the use of metadata (information concerning the sources, context and extent of the spatial data) to information concerning the completeness and accuracy of the data.
Van Oort (2005) surveyed practitioners of spatial databases to assess their use of information and its adherence to the principles of SDQ. It was generally found that policy-makers make use of existing

ERGOThe challenges of mass evacuation
50
Chapter 251
Literature Review
evacuation decisions would have to:
Explicitly include the manipulation and evaluation of 1. uncertainty.
Use inputs that are clearly defined and interpreted.2.
Procedures used to arrive at recommendations are logically 3. sound.
The next section will address the disadvantages found in other types of MCDA, and explain why Decision Theory is an appropriate tool to use for assisting a GO in planning an evacuation.
2.4.2 Manipulation and evaluation of uncertainty
There will always be unknown elements to any hazardous event, and these uncertain aspects will impact on a how a decision is made and the amount of confidence the Decision Maker (DM) has in making a decision. These uncertainties can surround the event itself (i.e. the magnitude, location, etc) or involve other factors that can affect outcomes, such as the number of individuals that need to evacuate or the condition of the road network along which people will evacuate. Even following the onset of a disaster, such as in the case of earthquake or terrorist attack, many uncertainties lead to difficulty in making evacuation decisions. However, some MCDA methodologies deal primarily with decisions where there is certainty. Below we provide details of MCDA methods which can be used when there is certainty and then we review those which are more relevant to the ERGO approach of coping with uncertainty in evacuation decision making.
Decisions given certainty: A decision given certainty assumes that the DM is able to know the possible outcomes at the beginning of the analysis. For example, an emergency manager must choose an evacuation shelter for a known flood area. The DM in this case is able to know with certainty the proximity of the shelter to the flood area. A decision with uncertainty would assume that the exact location of the flood is not known explicitly by the DM and must therefore be included in the decision analysis.
The ELECTRE and PROMETHEE decision-making models (Brito et al., 2010; Almeida-Dias et al., 2010) are examples of MCDA models which assume there is certainty in our understanding of the decision variables. These MCDA models use an interview process with DMs that provides a sorting of available strategies and the creation of a rank ordering for both the options themselves as well as multiple criteria used to assess those options, Behzadian (2010) also provides an overview of the PROMETHEE techniques. In most cases the purpose of the analysis is to sort and rank different possible strategies by DMs to optimise actions according to criteria set by the relevant officials. These methods seek to rank a set of options, and so are known collectively as outranking methods (Roy & Vanderpooten, 1997). The underlying assumption with both MCDA methods is that a DM is able to describe in detail their
In order to determine the best evacuation decision (and support training and after-action reviews) a framework is needed that takes into account:
The different associated costs to both the public and emergency 1. organisations of all outcomes possible in an evacuation situation.
The probabilities associated with each possible outcome. 2.
Evaluation based on multiple, conflicting objectives. 3.
Decision Theory provides a framework that analyses the probability of possible outcomes for catastrophic events along with the costs/benefits of each of these outcomes. A decision rule is then used to choose the optimal (best) strategy by the DM. One example of a decision rule is to simply choose the option that has the highest total benefit to the organisation e.g. emergency managers might choose the option that maximises the number of lives saved. Alternative rules can be used depending on the type of uncertainty that the organisation faces and their own preferences.
2.4.1 Multi-Criteria Decision Analysis
Decision Theory is just one of a larger class of methodologies known as Multi-Criteria Decision Analysis (MCDA). These methodologies are used to make decisions where there are conflicting or complex factors involved (Belton & Stewart, 2002). For example, an MCDA might be used by a government to determine how various options for allocating scarce resources will help them to meet key performance indicators e.g. how to allocate money across healthcare (Firestone et al., 2007; Gelman et al., 2004; Lester et al., 2007; Torrance & Boyle, 1982), future technologies (Cooke & Goossens, 2004), security (Bier 2007; Bier et al., 2007; Keeney, 2007; Parnell et al., 2010; Willis, 2007), business (Zopunidis & Doumpos, 2002), and education (Visschers et al., 2007) in order to deliver a ‘better’ place to live. However, an MCDA depends upon subjective factors; so the outcome from an MCDA into this resource allocation problem would depend upon the assumptions made by the politicians who are doing the analysis, as they may prefer to invest more heavily in different areas than their colleagues. For a GO considering an evacuation, MCDA would be useful to decide between two important factors: preserving life, and minimising economic damage. MCDA could be used to determine the point at which actions should switch from defending property to defending life, and vice-versa.
While it is not possible to evaluate all the types of MCDA in this document, it is important to provide the reasons for the use of Decision Theory as an appropriate tool for evacuation planning from the wide range of MCDA tools that exist. Howard (1992) provided basic reasons that make Decision Theory an effective MCDA method. Adapted from his work any decision making process that is used to evaluate

ERGOThe challenges of mass evacuation
52
Chapter 253
Literature Review
include uncertainty. Decision Theory is suited to the dynamic nature of emergency management and uncertainty concerning many different aspects of any given hazard/threat.
The next section will consider the inputs chosen by DMs, and how these inputs can influence the outcome from a Decision Theory analysis.
2.4.3 Inputs clearly defined and interpretable
Inputs feed data into the decision model (e.g. options for the outcome, preferences which DMs hold, importance of criteria to distinguish between different options). Inputs must be clearly defined at the start so that the analysis is based on a correct understanding of the issues. For example, a DM must know what is meant by emergency personnel when beginning the analysis. This might be a limited concept (only including the police, fire and ambulance) or it might encompass a broader field, and include voluntary organisations like the Red Cross. It is also necessary when the DM must provide the methodology for their decision process or when their decisions are open to external scrutiny.
A clearly defined input to a decision model is one that is precise and objective. A precise input is one that accurately describes an aspect of the decision. An example of a precise input is the number of emergency personnel that are available to support evacuation practices. The exact number of available resources leads to a precise input. If there is uncertainty surrounding the input then it can limit the quality of outputs because it brings confusion on exactly how many personnel will be available. An objective input is one that leaves little ambiguity as to its meaning. The DM must know exactly the meaning/interpretation of any assessment that goes into the model.
The precision of inputs can be difficult with MCDA techniques that are based on the quantification of descriptive assessments. To explain, the descriptive statement that one factor is ‘strongly’ preferred to another factor does have some meaning; however, the exact meaning of the descriptor ‘strongly’ is subjective. This is important as a fully transparent decision-making system allows for easier review and analysis of the findings. For example, an emergency manager has a need to provide the reason for a decision made during an evacuation. The manager in this example states that the choice was made because she felt that the protection of the public was ‘strongly’ preferred to possible business disruption. The descriptive term ‘strongly’ is not easily interpreted among a group of individuals and can have different meanings. The AHP, ELECTRE and PROMETHEE all use a descriptive assessment process that is then quantified to order possible decision alternatives. The use of a quantification process does attempt to create objective inputs, but ambiguity will remain because this process was based on a descriptive assessment (Howard, 1992). While it is possible ad hoc to re-verify the descriptive assessments with the DM, it is important that the Decision Theory process is precise and objective from the start.
preferences between options. The DM must also be able to assess the benefit or cost of the option against one or more criteria with certainty. This means that there is an assumption that there will be no changes to the desirability of an option before, during or after the decision has been made.
Another decision making methodology that is used to assess ranking of options given certainty is the Analytical Hierarchy Process (AHP). AHP uses pairwise comparisons, which offer a DM the chance to express a preference between mutually exclusive options (Forman & Gass, 2001). For example, an emergency manager might be invited to express a preference between putting their resources into saving life or protecting property. Saaty (1977) created the AHP as a process that uses pairwise comparisons to identify optimal options for DMs. One advantage of the AHP is that DMs need not assign explicit numerically-based preference between options/criteria. DMs simply state ‘how much more important’ one factor is against another (i.e. weak, very weak, strong, very strong, etc.). Once the set of pairwise comparisons have been completed the analyst then creates a numerical ranking that is used to order the options available to the DM. Like the above outranking methods, AHP was originally created as a way to make decisions given certainty.
The AHP has found substantial use by organisations due to its relative ease of use and accessible supporting software to aid analyses. Vaidya & Kumar (2006) provide a literature review that includes 150 examples of the AHP in action. The AHP has also been used in combination with other research methodologies to support existing systems. Ho (2008) provides an overview of these integrated AHP systems. These varied uses of the AHP illustrate the flexibility that the method provides to experts.
Decisions given uncertainty: Both outranking methods and AHP were originally designed as MCDA tools given certainty. In the case of evacuation decision making there is enormous uncertainty concerning many different factors. One example of this is that the nature of catastrophic events makes the exact magnitude of hazards/threats difficult to know before the event actually occurs. While there has been extensive use of these models in aiding DMs the ranking process itself does not explicitly include the possibility of uncertainty within the criteria or external environmental factors. In order to use these MCDA techniques with uncertainty, alternative theoretical frameworks must be used such as Fuzzy Set Theory (Tiglioglu 2001; Kangas & Kangas, 2004), a mathematical technique that allows for more than two sets to be compared. Additional discussion of these inclusions will be in later sections.
Decision Theory uses probability mathematics as a method to include uncertainty in the decision analysis. This means that traditional outranking methods and the AHP are less appropriate for an analysis of evacuation decision making unless they use alternative methods to

ERGOThe challenges of mass evacuation
54
Chapter 255
Literature Review
decisions will also allow for different precautionary actions, such as improvements to road networks or better communication systems, to be compared.
In Decision Theory, the inputs to an analysis must be clear, precise and reached using a transparent methodology. The following section examines how the underlying assumptions used in an analysis can be generated through collaboration between the DM and the analyst.
2.4.4 Developing justified recommendations
The Decision Theory method of analysis is based on the combination of probability mathematics and economic utility theory. By combining probability mathematics and economic utility theory an analyst is able to create a decision model that encompasses the preferences of a DM as well as the uncertainties that they face in any context. The assessment of DM preferences can depend on many different factors and can change depending on the experiences of the individual. The assumptions of this assessment process and the corresponding mathematical implications are explicitly detailed in what are called axioms. These axiomatic assumptions provide a set of underlying rules that allow for objective analysis of DM preferences and uncertainties that they face when making a decision. The axiomatic process of Decision Theory also makes explicit exactly what the analyst considers to be “logical.” Von Neumann & Morgenstern (1944) first established the basis of generating preference and the transformation of these preferences into a unit of measure known as utility. This transformation into utility is important as it allows the DM to compare dissimilar criteria during the analysis. An example of this for evacuation policies is where a DM needs to evaluate both the number of potential deaths due to an upcoming event but also compare those possible deaths with the loss to the economy if an evacuation were called. It can be very difficult for a DM in these circumstances to identify the exact trade-off of lives for economy loss. The utility transformation process for each identified criteria of the analysis allows for this type of comparison.
Decision Theory includes uncertainty by allowing for both normal statistical manipulation as well as the use of subjective probabilities. A subjective probability is uncertainty that is dependent on beliefs of an expert or of the DM themselves. The use of subjective probabilities established by Savage (1954) then provides the basis of Bayesian statistics within the Decision Theory framework. Bayesian statistics allows for the use of subjective probabilities within Decision Theory as well as the ability to update a DM’s understanding of the decision as new information is received (French & Rios Insua 2000). von Neumann & Morgenstern (1944) & Savage (1954) provide the axiomatic bases of Decision Theory. These axioms include:
Ordering and transitivity:1. DMs are able to establish preferential ordering from a set of strategies and that the order is transitive. The order is transitive if a relationship between two elements holds true
The inclusion of uncertainty is vital for the creation of decision models for evacuation and the creation of these variables must also adhere to the specifications mentioned above. The AHP, ELECTRE and PROMETHEE have all used Fuzzy Set Theory, hereafter ‘Fuzzy’, as a way to include uncertainty both across the preferences of DMs and uncertain factors that affect final outcomes. Fuzzy treats uncertainty in DM preferences and external factors by creating a set of membership functions. These membership functions allow for the descriptive preference ranking to be members of multiple sets. For example, an emergency manager is not able to state whether one factor is ‘strongly’ preferred or ‘very strongly’ preferred to another factor. Fuzzy allows an analyst to allow that factor to reside in both sets (strongly and very strongly). In this way Fuzzy is able to introduce uncertainty into preferences of the DM as well as external factors that influence outcomes. This can be useful when DMs are unable to establish precise numerical values for their preferences or their beliefs concerning other external factors. A second advantage to the use of Fuzzy in decision making methods is that it more closely mirrors descriptive decision processes. This literature finds that the way that DMs really make their decisions is by using ‘rules of thumb’ as opposed to strictly objective preference analysis (Klein, 2008; Lipshitz et al., 2001). Fuzzy has been used extensively as a tool to model uncertainty for decision problems where DMs are uneasy providing explicit numerical information concerning their preferences. Yi-Kai (2010) provides one such example to find appropriate urban renewal programs for policy-makers. Fuzzy is used in combination with PROMETHEE to understand DM preferences. This combination allows for uncertainty to be introduced in the ordering of preferences for competing goals that the DM may have surrounding urban renewal.
Given these issues, the creation of fuzzy sets for decision making has advantages where DMs are unable to give precise, objective values for the decision model. Both Howard (1992) & Clemen (2001) state that the level of precision is the necessary component when using any MCDA technique for policy debate and analysis. Precision in the decision-model will allow for a clear understanding of why choices were made and allow for replication of methods that go beyond a single context. Howard (1992) also argues that the use of Decision Theory need not adhere to ‘real’ human decision making processes as some decision contexts are more interested in a transparent process to facilitate policy analysis. This is especially true when the outputs of the decision model will NOT be used for actual event decision making but rather as a support tool during planning and evaluation of evacuation events (Clemen, 2001; French & Rios Insua, 2000). Within Decision Theory this focus on a clear and precise decision making processes (as opposed to more descriptive model of decision making) is known as prescriptive decision analysis.
Evacuation decision making can benefit from a completely transparent, precise and objective methodology due to the immense consequences of catastrophic disasters. The objective analysis of evacuation

ERGOThe challenges of mass evacuation
56
Chapter 257
Literature Review
(Triantaphyllou, 2001). This violates the transitivity axiom under Decision Theory and has resulted in some debate as to the appropriate use of the AHP for policy analysis (Saaty, 1990, 1994; Millet, 2000; Harker & Vargas, 1990). Given the importance of the evacuation decision and the high level of uncertainty involved in outcomes surrounding evacuation, Decision Theory will be used as an MCDA method within the ERGO project. This is due to its:
Ability to analyse uncertainty using probability statistics. 1.
Clear and interpretable inputs to decision models.2.
Results that are logically sound due to axiomatic assumption.3.
The basis of this theoretical framework is to provide a systematic analysis of a decision. The logical framework of Decision Theory along with its explicit use of probability mathematics is vital to making important policy decisions such as evacuation. A more complete history of Decision Theory as well as its applications is now provided to illustrate its ability to provide insight into evacuation planning.
2.4.5 Decision Theory
Decision Theory provides a framework through which the evacuation decision can be structured across a wide range of scenarios, while also allowing for a computational method to identify optimal decisions given the uncertainties and preferences for multiple, conflicting criteria expressed by DMs. The original work of von Neumann, Morgenstern and Savage led to the development of decision making tools that outlined the way that a DM should make a decision. While von Neumann & Morgenstern (1994) developed the basic method of assessing outcomes by DMs, the use of conflicting criteria was developed in the work of Keeney & Raiffa (1976). This text explicitly describes both utility and uncertainty assessment from a DM perspective as well as the ways to verify the axioms of Decision Theory through both a qualitative and quantitative process called multi-attribute utility theory (MAUT). The MAUT process builds on the quantitative work of von Neumann and Morgenstern by providing a decision making process that leads toward the goal of prescriptive decision making. The analyst is able to take a very direct approach to structuring the decision process of the DM and is able to provide guidance and suggestions in order to provide a feasible, transparent decision model.
This process straddles normative decision making (how an individual should make a decision) and purely descriptive decision making (how an individual really makes a decision). A prescriptive model allows the DMs themselves to decide if the axioms of normative decision statistics are valid for their specific circumstances. Where discrepancies are encountered, it is the job of the analyst and DM to arrive at a compromise that fits the function of the decision analysis. Whether this means adhering to axioms or weakening some of the assumptions, is consciously decided upon by all participating DMs. Due to this
for the first and second, the second and third, and the first and third. An example of this is: if A is preferred to B, and B is preferred to C then A is preferred to C.
Reduction of compound events:2. DMs are able to describe their preferences through a series of degenerate choices between uncertain events described in a lottery. This allows a decision analyst to quantitatively model DM preferences through a series of choices between two options which are called lotteries. This provides the mechanism through which alternatives can be ranked.
Continuity:3. A DM can verify indifference between a certain quantity and choice between two uncertain outcomes. This axiom essentially means that a DM is able to make choices between options. An example of this would be a decision analyst who asks a DM to choose between an action that has a 100% chance of 1 fatality in an emergency situation or an action that would leave a 50% chance of no fatalities and a 50% chance of 3 fatalities.
Substitutability:4. A DM is indifferent between an outcome and an equivalent uncertain event. An equivalent uncertain event is calculated by multiplying the outcome of the event by the probability of it occurring. This axiom states that this expected outcome of an uncertain event would be indistinguishable to a DM from a certain outcome of an equal amount.
Monotonicity:5. Given equal outcomes a DM will prefer the one with a higher probability of winning.
Invariance:6. A DM is able to determine preference among uncertain events with the consequences of an event and the associated probabilities.
Finiteness:7. All consequences are comparable between one another. There are no infinitely good or bad consequences (Clemen, 2001).
The importance of these axioms is to provide a mathematical model through which outcomes and probabilities may be combined in a logical way. Some of the above axioms are needed to provide a logical, complete ordering of strategy sets. Later axioms provide the underlying assumption for DMs that allow for differentiation of strategies based on the uncertainty that can affect possible outcomes. The axiomatic basis is ideally suited for policy analysis as the decision making process is explicit and replicable.
The axioms discussed above provide the analyst and DM with an objective framework for the problem that is mathematically consistent. The logical consistency that is guaranteed in Decision Theory is not true for all MCDA methods. In particular the AHP has been criticised for the possibility of illogical results known as rank reversal. Dyer (1990) outlined the critique of rank reversal to the AHP as a situation where an established ordering of options is reversed when an alternative that is a copy of an already existing option is added to the analysis

ERGOThe challenges of mass evacuation
58
Chapter 259
Literature Review
modelling the actual decision process, they do not make use of the quantitative power of Decision Theory. Also, time constraints when making the decision limits the analytical power of the DM and results in a model that is more interested in finding a satisfactory option as opposed to the optimal one (Klein, 2008).
The primary goal in using Decision Theory for evacuation policies is to analyse the existing processes that are adopted by emergency organisations. While it is possible to use the results from the analysis to actually make operational evacuation decisions, expert practitioners may feel that the responsibility of these types of emergency decisions should be retained by local officials. This leads us to a more prescriptive use of Decision Theory as opposed to the descriptive approach. In an evacuation context, this would mean that the use of the decision model would be to provide an emergency manager with a systematic analysis of the important decisions that they must make. It also allows the DM to transparently articulate the reasoning for their choices based on the criteria they feel are important and the uncertainty surrounding outcomes. It is important to include the advances in descriptive Decision Theory (such as Prospect Theory) to avoid various cognitive biases during the assessment process, yet the primary purpose of the prescriptive analysis will be to provide strategic insights into the evacuation process.
A second set of developments that stems from Decision Theory is in the modelling of decisions for both qualitative and quantitative purposes. One such tool developed through Decision Theory for structuring a decision making process is the influence diagram (ID) (Pearl, 2005). Developed by Howard & Matheson (1983) an ID is a graphical representation of a single decision context. A decision context is simply the issues that surround a given decision situation. Figure 2.2 is an ID of the basic evacuation decision.
Figure 2.2 A simple influence diagram of an evacuation decision (for illustration)
prescriptive approach, MAUT methods sacrifice generalizability to wider emergency situations for contextual acceptance by DMs.
The alternatives to prescriptive approaches to decision making are numerous descriptive models. These models focus on the way that DMs make their decisions and reject either in part or entirely the axioms developed by von Neumann, Morgenstern and Savage. As the axiomatic basis of Decision Theory is weakened, modelling difficulties emerge as well as the complexity of quantitative descriptive models. The basis of this alternative to normative Decision Theory was primarily from psychologists who found that individuals fail to adhere to even the most basic normative axioms. Kahneman & Tversky (1979) outlined Prospect Theory as a purely descriptive decision making model that illustrates many ways in which individuals violate axioms of normative utility theory and quantitative methods to overcome these violations while preserving the computational advantages of Decision Theory.
One key development of Prospect Theory has been the identification of cognitive limitations to individuals when they make decisions. An example of one of these cognitive limitations is called the framing effect (Hammond et al., 2006; Tversky & Kahneman, 1986). Framing refers to a DM that changes his preference between choices depending on the way in which the choice is presented to the DM. This effect is important as it represents a way in which the logical axiomatic basis of Decision Theory fails to describe the way in which people really make decisions. These developments, while complex, do influence prescriptive Decision Theory during the elicitation period between the analyst and DM. Cognitive limitations that have been explained through Prospect Theory can be limited during this elicitation period. Other descriptive models that attempt to correct for violations of normative axioms while attempting to adhere to its quantitative advantages include weighted utility theory (Chew, 1983) and subjectively weighted utility (Karmarkar, 1979). Both of these models attempt to retain the quantitative rigor of Decision Theory while providing adjustments that account for observations made by studying the way in which people really make decisions.
A second class of descriptive models of decision making include Naturalistic Decision Making (NDM). NDM models also attempt to create descriptive decision making models but outside of more systematic MCDA techniques. As these models have no axiomatic basis they explain the way in which a DM thinks about a decision and how they process information to decide what is their best outcome. NDM has its roots in analyses of emergency professionals, military commanders, health practitioners and other individuals who must make critical decisions given limited information and strict time constraints. Examples of NDM models include cognitive continuum theory (Hammond et al., 1987), cognitive control (Rasmussen, 1983), and Recognition Primed Decisions (RPD) (Klein, 1998). These models have been used to improve decision making given time and stress consideration. While these models are effective and appropriate in

ERGOThe challenges of mass evacuation
60
Chapter 261
Literature Review
use throughout this period came only through the close interaction between researchers and emergency officials. A second important issue is how the studied questions should come from the emergency services sector as opposed to the researchers. Simple models were also found to be more readily accepted by the emergency services.
Nuclear emergency management has also made extensive use of Decision Theory. The proliferation of Decision Theory for nuclear disaster began following the events of Three Mile Island in the United States and Chernobyl in Russia. This application of Decision Theory typifies the difficulty in optimising DMs’ actions due to the issue of multiple criteria. A common thread throughout these projects is the use of expert knowledge in creating decision models. The International Chernobyl Project, which began in 1990, was commissioned through the European Community to analyse and create decision making models to inform DMs in cases of nuclear emergency (French et al., 2007; Geldermann et al., 2009). The Chernobyl Project conferences identified social, political and economic objectives that can be affected by the decisions made in the nuclear industry. The purpose of this analysis was to identify a set of preventative actions to limit damage caused by nuclear events as well as optimize actions taken following such an event. French (2005) also uses Decision Theory to analyse mitigation options to minimize damage from nuclear disaster.
A limited portion of the evacuation literature deals with the actual evacuation decision made by emergency officials. Regnier (2008) discusses the use of meteorological forecasting to inform evacuation decisions for hurricane events in the United States. This research also analyses the use of decision rules to avoid costly false evacuations. Regnier advocates simple decision tools that use forecasting probability models and weather information to identify accurate timeframes in which the evacuation decision should be made. Once this threshold for the decision is identified DMs are able to make informed decisions based on the vulnerability of the population and likelihood of the hurricane event (Regnier 2008). A complete understanding of the variation in hurricane forecasting that is conditional on a geographic region was found to have a significant effect on the timing of the evacuation decision. Regnier’s conclusion was that evacuation decisions could be improved and false evacuations minimized by taking into account the variation in hurricane forecasting.
The use of forecasting data as the probability model in a decision system is combined with a criteria analysis in the form of an objective function. The objective function in this instance is an approximation of aggregate cost of evacuation for each mile of coastline compared to the cost of a failure to evacuate in case of catastrophic disaster (Whitehead, 2003; Guofang & Ikeda, 2006). The use of Decision Theory in these instances can greatly increase the precision of objective functions for emergency personnel. The inclusion of a multi-objective utility function can better represent the complex trade-offs that DMs must make when weighing the mitigating effect of evacuation in advance of a hazard
The ID uses shapes (called nodes) and arcs (connecting lines) to repre-sent relationships between factors in the analysis. The evacuation deci-sion is represented by the rectangle and leads to the outcome which is shown as a diamond. Outcomes, however, are not solely influenced by the decision taken by emergency managers. The outcome is also influ-enced by an uncertain factor, which in this case is the possibility of a hazardous event occurring. The uncertainty, in this case the hypotheti-cal risk is represented by the oval. The arrows indicate that the outcome is influenced both by the decision of the emergency manager as well as the uncertain risk. Influence diagrams have a number of uses in understanding decision problems. First, they provide a simple graphical representation that can be used to foster understanding of the problem and verify the factors that influence outcomes of the decision. Second, it allows for the creation of computational models that represent mathematically the relationships between nodes that are shown graphically in the ID. Rios (2009) provides an alternative use for influence diagrams to facilitate negotiations between various stakeholders. Matzkevich & Abramson (1995) provide an overview of how various statistical methods can be used to create the appropriate relationships between uncertainties mathematically through the use of probability distribution functions (PDF). The ability to transform a conceptual decision model into a computational one has been a development used extensively in both operational research as well as computer science (Smith 1989). By using influence diagrams with DMs it is possible to create a graphical representation of the important components of an evacuation decision that can then be transformed into a computational form for policy analysis (Schacter, 1986; Shacter, 1988). The creation of an ID for evacuation encompasses many of the more qualitative benefits of the DT methodology. These benefits include an explicit understanding of evacuation criteria, identification of uncertainty that effect those criteria and a framework around which an understanding of the evacuation decision can be reviewed by participating organisations or individuals. The next section will examine DT as it is used in emergency management.
2.4.6 Decision Theory in emergency management
Decision Theory and resultant decision models have featured prominently in emergency management. Green (2004) provides a review of the use of operational research on emergency organisations. The prominent use of MCDA within fire services is of particular interest for ERGO. Many operational research projects attempt to optimise resources and maximize the protection of the public through the correct placement of fire stations and related resources (Rider, 1976; Swersey 1982). This is done by identifying criteria that lead to the need for fire stations and analysing potential locations against these criteria. One of the more prominent findings within the review is the importance of constant re-evaluation of the model by domain experts. Many important breakthroughs for fire services that had continued

ERGOThe challenges of mass evacuation
62
Chapter 263
Literature Review
with making the decision. This will provide the basis for formulating alternative policies, and provide a structure for future activities.
2.5 Parts 4-6: Modelling the evacuationThe sections above discussed how to prepare the public for evacuation, and the ways in which GOs can provide a rational basis for prioritising their decisions. The next three sections examine: how the message to evacuate is disseminated (Part 4 in the ERGO Framework for Evacuation, Figure 1.1), how transport to the shelters is organised (Part 5), and how shelters can be managed (Part 6). These are prefaced with a general introduction to Operational Research (OR), and its application to evacuation planning.
2.5.1 Operational research and evacuation planning
This section looks at how OR and analytical modelling techniques can help emergency planners to support evacuation analysis. There are many OR techniques which are used in the planning for evacuation management, for example:
Optimisation• is the use of mathematical modelling to find an ‘optimum solution’. It is used when the problem can be formulated in a quantitative manner with predefined structures. Optimisation techniques are widely used in traffic management for obtaining optimum evacuation routes for the evacuees (Chiu et al., 2007). Here the roads are represented as networks and the evacuation route is obtained for minimum travel time.
Simulation modelling• is the use of a computer-based representation of reality to study the changing behaviour of a system under different conditions. Simulation modelling allows the user to explore what-if scenarios, test the robustness of systems, experiment with different configurations and policies, and understand complex interdependencies between critical incidents.
Agent-based modelling• (ABM) is a type of simulation technique used mainly in social science, where the evacuees are represented as agents and defined using behavioural properties (for example response time) to measure the interaction among the other evacuees (agents) in order to obtain the overall behaviour. ABM has been used to study pedestrian evacuations from underground stations (Castle, 2006) as well as for planning evacuation of the city (Chen et al, 2006). In both the cases the evacuee behaviour is represented using ‘agents’ for developing the model.
Models are developed by combining various techniques described in these approaches. As discussed in Part 2, a GIS (Geographical Information System) is often used to represent the demographic details of the evacuation area and support in visualising the evacuation zone. An example of combining models is: in order to distribute evacuees from different regions to safe areas a ‘spatial multi objective optimization problem’ (Saadatseresht et al, 2009) was created
against the cost of a false evacuation. This could lead to a decrease in the number of false evacuations while increasing the government’s ability to save lives in uncertain situations.
While this research focuses specifically on the operational uses of Decision Theory within an emergency context, Decision Theory has also been applied as a way of understanding precautionary actions given uncertainty. Precautionary action refers to any action taken by a DM to prevent losses from risks. DeKay (2002) provides an example of the use of Decision Theory when analysing appropriate preventative measures. He describes a fruit trade where a hypothetical DM must decide on the level of trade to maximize the benefits of fruit while limiting the possibility of environmental damages caused by the invasive pests. This example is similar to evacuation actions where the choice of an evacuation is a preventative measure to limit the possibility of death and injury to the public (Lempert & Collins, 2007; Ricci, 2008; Basili, 2006).
Lave (2006) also uses Decision Theory to analyse the appropriate size of dam and spillways to prevent catastrophic flood damage. This research is effective in showing how mathematical decision models can be useful in evaluating policy options to prevent future disasters. The analysis takes into account various costs associated with building dams and spillways and illustrates how the appropriate action by the DM would be to protect against small and moderate flood events due to the exorbitant cost of protecting against catastrophic flood events.
A decision theoretic model for evacuation finds the criteria under which an evacuation would be made by asking emergency managers as well as other participating organisations for the factors that are important to them when they are considering evacuation actions (Cooke & Goossens, 2004; Aloysius et al., 2006; Loomes & Mehta, 2007). The uncertainty that can also affect these criteria such as the probability of the hazard/threat, infrastructure, public behaviour and many other factors should also be included. Once these two components have been combined it is possible to:
Identify the multiple, conflicting objectives that emergency 1. managers have when contemplating the evacuation decision.
Identify the key uncertainties that lead to optimal evacuation 2. decision making.
Determine alternative policies that can be adopted to optimise 3. multiple objectives.
Provide structure to the evacuation decision process for training 4. and planning in advance of catastrophic events.
In conclusion, an emergency manager using DT to plan for a future evacuation would expect to be provided with an indication as to the conflicting objectives they will face when making an evacuation decision. They will also be more aware of the uncertain areas associated
ERGOThe challenges of mass evacuation
64
Chapter 265
Literature Review
assumptions and ignoring the context specific aspect on interpretation of the output results, are some issues highlighted as reasons for failures of models in emergency management (Starbuck, 1983; French, 2004). A carefully designed modelling approach needs to factor in these issues to make the model reliable for the intended purpose. This highlights the need for validation of the evacuation models in order to increase their reliability in evacuation planning.
2.5.3 Validation of the model
Emergency managers using software models in evacuation planning need to know about two broad classifications of software products namely: ‘Off-the-shelf models’ and ‘Custom-built Models‘. An off-the-shelf (OTS) product is ready to roll the minute you slide the installation CD in the drive: low priced, generic, and equipped with revisions for updates (Morris, 2010; Voas, 2002). An example of an OTS product used in evacuation planning is NAME – Nuclear Accident Model, developed by UK Meteorological Office (Maryon et al., 1991) and used to predict the dispersion of nuclear plume given the atmospheric conditions like temperature, wind speed, etc. On the other hand, Custom-built Models are developed in-house with tailor-made specification, generally expensive and includes organisation specific features. For example, Crowd Dynamics Inc. (Crowd-Dynamics, 2010) developed an agent-based simulation model to understand the external crowd movements of a stadium in Solna, Sweden in order to plan for entrance and exit routes.
Some OTS products have generic features that can be customized to the evacuation planning area. For example, GIS software like ArcGIS can be used for a wide range of purposes, including evacuation modelling. Irrespective of the type of model used in evacuation planning, the end-users need to know about the underlying principles of the model, limitation, scope and various assumptions. This understanding of the distinction will help in the validation of the model and increasing the end-user confidence.
There are four stages of modelling process namely: Conceptual Modelling, Model Coding, Experimentation and Implementation (Robinson, 2003, p52). The conceptual model is defined, ‘…as a non-software specific description of the simulation model that is to be developed, describing the objectives, inputs, outputs, content, assumptions and simplifications of the model’. From the conceptual model stage the description is converted into software codes or components that comply with the intended objective. Once the model has been coded and tested, the model requires experimentation to study the variation of input and output along with stability of the results. Quality or reliability of the model ‘…must be built in every portion of the software development process’ (Pressman, 2001). End-users, when they are involved in the model development, will have a better idea of scope, assumptions and principles in comparison to off -the-shelf models.
by combining the GIS model into multi-objective algorithms for evacuation planning. Critical Infrastructure Modelling System (CIMS) is a ‘Discrete Event Simulation’ (DES) model to study the interdependencies of various infrastructures and identify evacuation response strategies (Santella et al, 2009). A combined simulation and optimisation model has been developed for evacuation planning of Ocean City, Maryland, USA (Zou, 2005). This model has been developed to test evacuation planning in advance and also as a system to support real-time operational decisions. A survey of OR models and its application to evacuation management can be found in Simpson & Hancock (2009), Wright et al (2006), Altay & Green (2006), Pidd et al (1996).
2.5.2 Need for models in evacuation planning
Emergency Managers from various organisations are involved in developing evacuation plans for their local hazard scenario. These plans are aligned with other factors such as legal restriction, availability of resources (personnel and equipment), demographic details of the population, type of hazard and its potential impact. GOs, as a part of a preparedness initiative, should identify evacuation response strategies. Evacuation models are purpose-built, simplified representations of a city or regions of a city. The models can serve as a platform for testing and experimentation (Simpson & Hancock, 2009; Green & Kolesar 2004; Pidd et al, 1996) of the evacuation plans, various response policies, simulating worst-case scenarios, and identify potential for further capacity development.
Computer models are, ‘…well able to represent dynamic aspects of change’ (Gilbert & Trotizsch, 2008, p13). In evacuation modelling, the dynamics of the disaster event (for example flooding) and its impact on the evacuation (for example road network disruption) can be represented conveniently as a computer model to support the DMs. The robustness of the evacuation plan can be tested by harnessing the dynamic capability of the computer models. The modelling approach would serve as low-risk approach of testing compared to experimenting in real-life.
Evacuation plans have assumptions about the evacuee behaviour (e.g. choice of evacuation transport) that forms the basis for evacuation response plans (Drabek, 2007). The uncertainty in the assumed evacuee behaviour and the implication of these assumptions will impact the successfulness of evacuation. OR models will serve as a platform for the GOs to understand the implication of evacuee behaviour assumptions on the overall evacuation. The uncertainty of evacuee behaviour is generally studied in the model using the sensitivity analysis of the evacuation performance.
Using models: a health warning: Evacuation models are abstract representations of reality. The complexity of the disaster event, along with the abstraction in the model, could lead to less reliable model results. An over-reliance on a model’s results, understatement of

ERGOThe challenges of mass evacuation
66
Chapter 267
Literature Review
These behaviour analysis data form the basis for evacuation plans, specifically on ‘sheltering analysis, transportation analysis, guidance in emergency decision making and public awareness efforts’ (FEMA, 2010). Thus GOs, as a part of a preparedness initiative, could collect data about the evacuee behaviour from the available sources for their planning area. The uncertainty of the evacuee behaviour can be tested using the OR models.
2.5.4 Levels of modelling
Evacuation models can be developed at different levels depending on the smallest unit of analyses and purpose of modelling (see Figure 2.4). There are three levels: micro-level models, macro-level models and meso-level models (Pidd, 1996).
‘Micro-level models’ are used to study individual entities (any •component in a simulation model, e.g. cars or pedestrians in an evacuation model) in the road network using simulation from the evacuation zones to a safer destination (Pidd, 1996). In micro simulation the individual entities are treated independently and the interaction effects are generally discarded (Gilbert & Troitzsch, 2008).
‘Macro-level models’ do not track the individual entities in a detailed •level. Instead, they aggregate the individual entities from the same evacuation zone as a group and study the overall evacuation behaviours.
‘Meso-level models’ are a middle line approach between the other •two categories and track individuals as groups but at a more detailed level compared to macro simulations.
When EMAs need to manage people leaving facilities such as an underground station, shopping malls, and stadia there are many types of micro-level crowd modelling software such as VISSIM, EXODUS, MYRAID. For example, the Jamarat bridge pilgrimage facility in Hajj (Makka) has been modelled using mathematical models (Algadhi & Mahmassani, 1990) as well using ABM software (Crowd-Dynamics, 2010)
The validity of a simulation model can be evaluated in three ways (Garson, 2009, p274):
Outcome validity• is obtained by comparing the results from the simulation model with real world results to ascertain the accuracy of the model results. In evacuation modelling obtaining real world data is limited hence conducting outcome validation is considered difficult.
Process validity• is used to demonstrate “that the process that leads to outcomes in a simulation corresponds to processes in the real world” (Garson, 2009, p275). Evacuation models are required to be aligned with various stages of the evacuation process and the internal sequence of events need validation.
Internal validity• demonstrates that simulation software validly represents the process being modelled along with the explicit statement of assumptions. For ascertaining the internal validity of the models, the evacuee behaviour, organisational response plans and assumptions need to be accurately represented.
Even when the empirical data of evacuee behaviour is limited, the benefits of quantification and simulation using models could outweigh the potential problems regarding external validity of the models (Grobler, 2004). These validity tests help in measuring the reliability of the models to ensure the validity and acceptance of model usage for the intended purpose.
In evacuation modelling, quantifying the behaviour of evacuees is important and can affect the acceptability of the model by the end-users. Collecting data of evacuee behaviour can be done through different techniques, namely: post-evacuation survey, pre-evacuation stated preference survey, social sciences literature, practitioner experience, post-disaster reports, etc. Figure 2.3 summarises these techniques and their key features.
As a part of preparedness initiative for hurricane evacuation in the USA, FEMA has conducted research with the public at the local county level.
Data collection technique
Key feature Example
Evacuation preference surveys conducted pre-evacuation
Evacuees respond to the questions based on a stated scenario for evacuation. Evacuees may not act the way they say they will.
Bird et al., 2009;Jóhannesdóttir & Gísladóttir, 2010
Post-evacuation survey Based on recollection of the evacuees. Brodie et al., 2006Social science literature Based on generalisable evacuee behaviour theories
and findings.Drabek, 1996
Practitioner Experience Held by key individuals. Need to be documented and disseminated across agencies.
Experiential
Post-disaster report Disaster event specific and its effect on the generalisable lessons.
Pitt, 2007
Figure 2.3 Evacuee behaviour models (techniques and key features)
Model details Level of model
Reference
NETSIM – Traffic simulation model Micro Rathi & Santiago, 1990
A behaviour based simulation model Micro Stern & Sinuany-Stern, 1989
Network simulation model for dam failure Macro Southworth & Chin, 1987
MASSVAC – Evacuation time estimation Macro Hobieka & Jamie, 1985
PACKSIM – real time traffic management Meso Barcello & Grau, 1993
CEMPS – Configurable Emergency Management and Planning System
Meso Pidd, 1996
Figure 2.4 Different levels of modelling

ERGOThe challenges of mass evacuation
68
Chapter 269
Literature Review
The outputs from these disaster-specific models are used for identifying the evacuation zones, impact level of the disaster, and to determine when the zones will be affected. For example, the SLOSH model (Sea, Lake and Overland Surges from Hurricanes) provides levels of storm surge for various combinations of hurricane strength, forward speed of storm, and direction of storm. The SLOSH model is used for real-time forecasting of surges from approaching hurricanes in coastal basins in the US. Wright et al (2006) provide more information about disaster-specific OR models.
Evacuation support models: Apart from the disaster-specific models, there are OR models used in the preparedness stage to develop and test the evacuation plans as well as identifying the best strategies among the available options. The integrated framework proposed by the ERGO Framework for Evacuation shows six tasks in large-scale emergency planning for which the GOs prepare themselves and the public. This framework has been used as a basis for classifying the OR models used for EMA preparedness. The disaster-specific models summarised above can help in understanding the evacuation zone (Part 2 of the ERGO Framework for Evacuation) as well as making the evacuation decision (Part 3). There are also OR models that can help in planning the warning dissemination (Part 4), evacuee transport planning (Part 5) and emergency accommodation management (Part 6). The next three sections will discuss literature associated with these three phases.
2.6 Part 4: Disseminating the message Effective warning during a large-scale emergency situation is essential for saving lives, by ensuring that the maximum proportion of population are well-informed about the threat. Miscommunication of the severity of the emerging flood warning message has been cited as one of the main reasons for estimated deaths of about 10,000 people in river flooding in West Bengal, India (Schware, 1982, p210). The warning
Disaster Type ReferenceEarthquake Viswanthan and Peeta, 2003Flood Wei et al, 2002Storm Surge – SLOSH model (Sea, Land and Overland Surges from Hurricanes)
Zhang, 2008; SLOSH, 2010
Nuclear incidents Barbarosogulu; Arda, 2004; Ozdamar et al., 2004; Ishigami et al., 2004
Tsunami Charnkol & Tanaboriboon, 2006
Wild fire Simard & Eenigenburg, 1990Glacial flooding model O’Connor & Baker, 1992Snow avalanches Schweizer et al., 2003Oil and Chemical spill Wilhelm & Srinivasa, 1996
Figure 2.5 Disaster-specific OR models (adopted from Altay and Green, 2006, p482)
for better management and to avoid overcrowding. This model was used to identify a bottleneck within the system that slows down the overall exit time, and to streamline it when there is a multidirectional flow of crowd. Kerridge et al. (2001) provide more information on a detailed review of pedestrian modelling.
ABM is a social simulation technique that specifically looks at how an individual’s behaviour and their interactions will affect the overall behaviour of the system. ABM has been widely used in evacuation modelling of building facilities (Castle, 2006) and regions of a city (Rogers & Sorensen, 1991). For evacuation models in ABM, the behaviour of agents (e.g. a household) can be specified as ‘rules’ based on the process observed in the real life evacuation situation. For example, each household can have attributes set to reflect its characteristics (e.g. access to warning channels like TV/radio) and behaviours (e.g. the need for public shelters), and these can be programmed as the properties of the agents.
A detailed comparison of different levels of simulation techniques and their features is available in Gilbert & Trotzisch (2008, p13). The readers are cautioned about a different usage of terminology in evacuee transport modelling, where micro-level refers to tracking individual vehicles, meso-level refers to stream of vehicles and less detailed individual vehicle tracking and macro-level refers to the traffic flow (vehicles/hours) from different sub-regions of the city. Thus depending on the level of detail and the purpose of the model, EMAs could choose appropriate modelling level for developing the model.
2.5.5 Purpose of the models
OR models have been used in all the four phases of emergencies namely Mitigation, Preparedness, Response and Recovery (Altay & Green, 2006). Models 4-6 of the ERGO project looks at how analytical tools are helpful for ensuring emergency preparedness and hence this review will focus on the OR applications in the preparedness stage only. Application of OR in large-scale evacuation modelling can be broadly divided between disaster-specific models and evacuation support models.
Disaster-Specific Models: Disaster-specific models are focused on a specific disaster (e.g. floods, avalanches) and are used as a forecasting tool to predict the potential areas to be evacuated and the timeline of when the disaster will strike. These models help in supporting the evacuation decision during the event. These models are developed by the respective scientific discipline and generally maintained by the lead organisations. For example, flood models are used by environmental agencies (or their equivalent) to predict the flood level during a disaster event. Figure 2.5 highlights some references for various ‘disaster specific’ OR models.
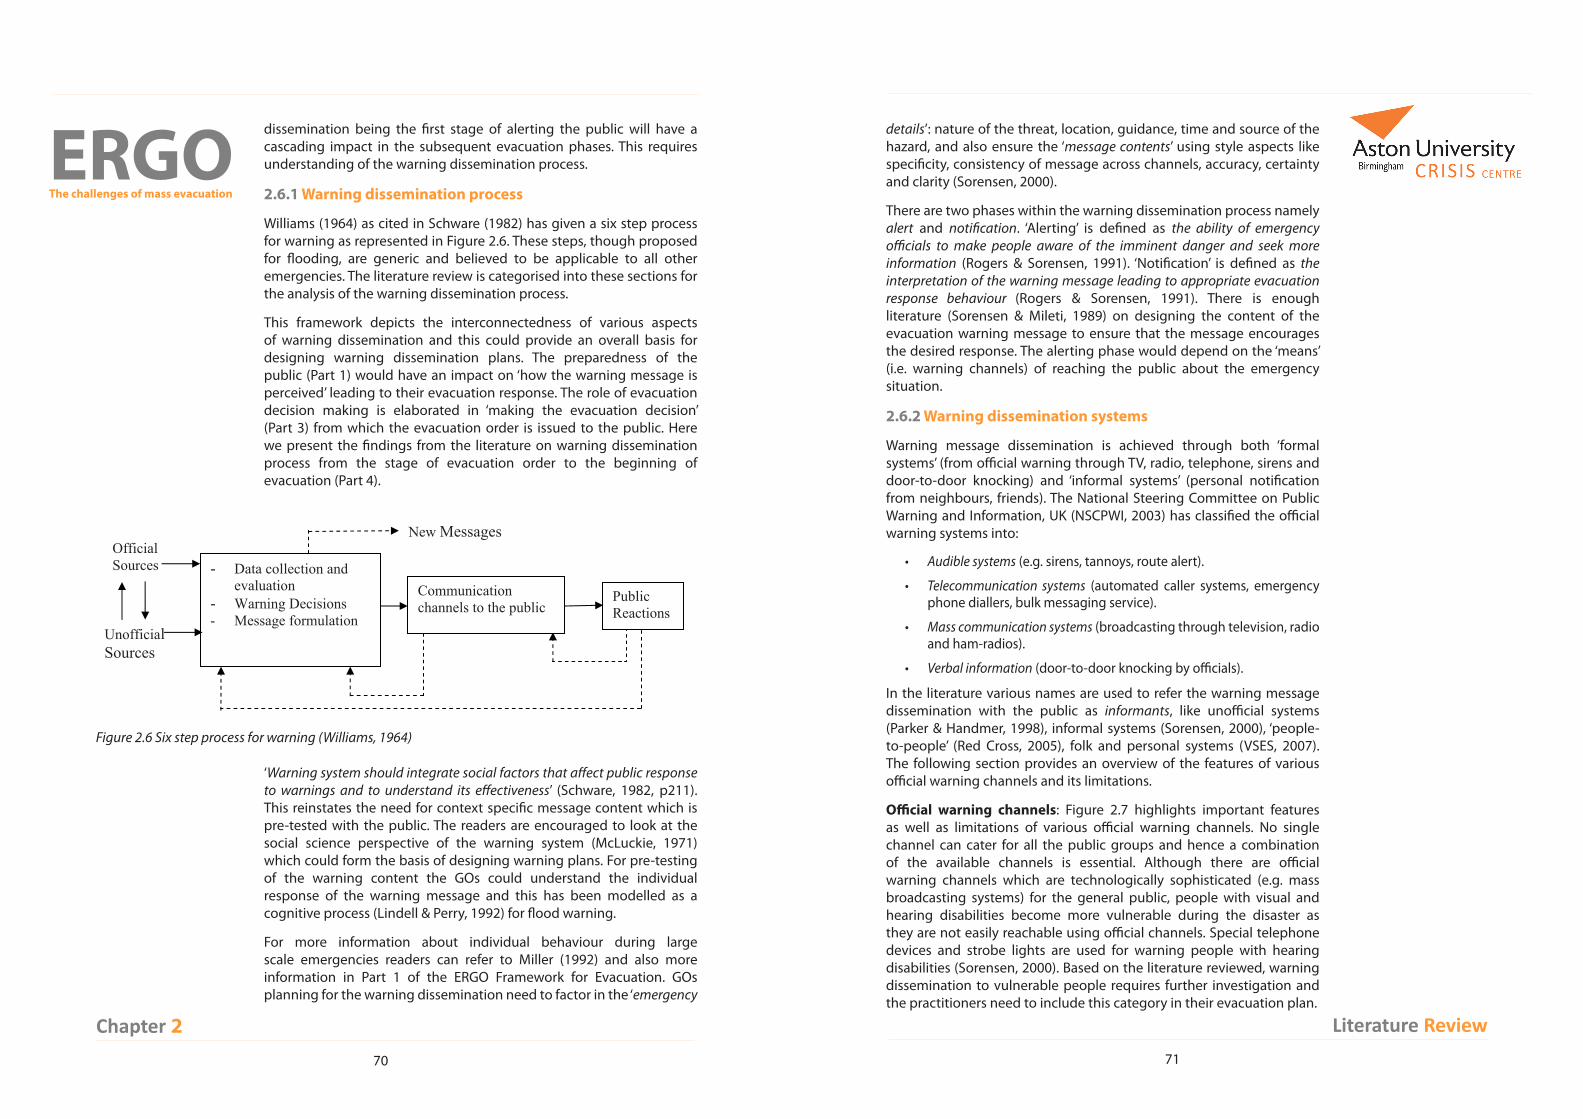
ERGOThe challenges of mass evacuation
70
Chapter 271
Literature Review
details’: nature of the threat, location, guidance, time and source of the hazard, and also ensure the ‘message contents’ using style aspects like specificity, consistency of message across channels, accuracy, certainty and clarity (Sorensen, 2000).
There are two phases within the warning dissemination process namely alert and notification. ‘Alerting’ is defined as the ability of emergency officials to make people aware of the imminent danger and seek more information (Rogers & Sorensen, 1991). ‘Notification’ is defined as the interpretation of the warning message leading to appropriate evacuation response behaviour (Rogers & Sorensen, 1991). There is enough literature (Sorensen & Mileti, 1989) on designing the content of the evacuation warning message to ensure that the message encourages the desired response. The alerting phase would depend on the ‘means’ (i.e. warning channels) of reaching the public about the emergency situation.
2.6.2 Warning dissemination systems
Warning message dissemination is achieved through both ‘formal systems’ (from official warning through TV, radio, telephone, sirens and door-to-door knocking) and ‘informal systems’ (personal notification from neighbours, friends). The National Steering Committee on Public Warning and Information, UK (NSCPWI, 2003) has classified the official warning systems into:
Audible systems• (e.g. sirens, tannoys, route alert).
Telecommunication systems• (automated caller systems, emergency phone diallers, bulk messaging service).
Mass communication systems• (broadcasting through television, radio and ham-radios).
Verbal information• (door-to-door knocking by officials).
In the literature various names are used to refer the warning message dissemination with the public as informants, like unofficial systems (Parker & Handmer, 1998), informal systems (Sorensen, 2000), ‘people-to-people’ (Red Cross, 2005), folk and personal systems (VSES, 2007). The following section provides an overview of the features of various official warning channels and its limitations.
Official warning channels: Figure 2.7 highlights important features as well as limitations of various official warning channels. No single channel can cater for all the public groups and hence a combination of the available channels is essential. Although there are official warning channels which are technologically sophisticated (e.g. mass broadcasting systems) for the general public, people with visual and hearing disabilities become more vulnerable during the disaster as they are not easily reachable using official channels. Special telephone devices and strobe lights are used for warning people with hearing disabilities (Sorensen, 2000). Based on the literature reviewed, warning dissemination to vulnerable people requires further investigation and the practitioners need to include this category in their evacuation plan.
dissemination being the first stage of alerting the public will have a cascading impact in the subsequent evacuation phases. This requires understanding of the warning dissemination process.
2.6.1 Warning dissemination process
Williams (1964) as cited in Schware (1982) has given a six step process for warning as represented in Figure 2.6. These steps, though proposed for flooding, are generic and believed to be applicable to all other emergencies. The literature review is categorised into these sections for the analysis of the warning dissemination process.
This framework depicts the interconnectedness of various aspects of warning dissemination and this could provide an overall basis for designing warning dissemination plans. The preparedness of the public (Part 1) would have an impact on ‘how the warning message is perceived’ leading to their evacuation response. The role of evacuation decision making is elaborated in ‘making the evacuation decision’ (Part 3) from which the evacuation order is issued to the public. Here we present the findings from the literature on warning dissemination process from the stage of evacuation order to the beginning of evacuation (Part 4).
‘Warning system should integrate social factors that affect public response to warnings and to understand its effectiveness’ (Schware, 1982, p211). This reinstates the need for context specific message content which is pre-tested with the public. The readers are encouraged to look at the social science perspective of the warning system (McLuckie, 1971) which could form the basis of designing warning plans. For pre-testing of the warning content the GOs could understand the individual response of the warning message and this has been modelled as a cognitive process (Lindell & Perry, 1992) for flood warning.
For more information about individual behaviour during large scale emergencies readers can refer to Miller (1992) and also more information in Part 1 of the ERGO Framework for Evacuation. GOs planning for the warning dissemination need to factor in the ‘emergency
OfficialSources
UnofficialSources
- Data collection and evaluation
- Warning Decisions- Message formulation
Communication channels to the public
New Messages
PublicReactions
Figure 2.6 Six step process for warning (Williams, 1964)

ERGOThe challenges of mass evacuation
72
Chapter 273
Literature Review
Unofficial warning channels: Even though the official channels form the major portion of the formal warning dissemination process, the unofficial warning channel cannot be ignored. Parker & Handmer (1998) addressed the importance of unofficial communication (including personal network and direct observation) during floods. Personal networks (friends, neighbours and relatives) are used to share and interpret the message, increasing the understanding of the contents, aiding in the informed decision making. A survey conducted by the US Centre for Disease Control, found that about 40% of the respondents to the survey received an emergency message from informal channels – friend or relative, either in person, or by telephone (Sorensen 1992). Another study conducted by Sorensen (2000) specified that informal notification among the public plays an important role in warning dissemination in most emergencies. A tsunami warning study in Mauritius showed that about 15% of the public received a face-to-face warning (Perry, 2007). In this study, the significance of face-to-face communication was third behind TV and radio. Another study (Werrity, 2007) reported the results of a survey among the residents of a Scottish flood plain region to understand the social impact of flooding. The study found that among the surveyed households, 32% received the warning message from neighbours and about 51% of the flooded households actually received the message from official channels. The empirical evidence shows the significance of informal communication channels, and also the possibility (about 49% in this case) of some residents not receiving timely information from official sources.
The role of youths and children as potential informants within the emergency communication network is highly underestimated (Mitchell et al., 2008) and not directly accounted for in the theoretical models of risk communication. This study (Mitchell et al., 2008) investigated the community initiatives in El Salvador and New Orleans, and demonstrated the possibility of using youths and children as trusted informants. The children and youths received training in school clubs, and were found to possess a high understanding of local risks, communication of warning messages and even the actions for reducing risks.
In order to use the public as informants of the warning message, it is essential to understand their behaviour during emergencies. There are widespread misconceptions that: the public panic on receiving the warning message (Fritz & Williams, 1957; Quarantelli, 1990), behave as victims, are highly dependent on official resources and are helpless (Fritz & Williams, 1957; Dynes, 1990). There are various studies refuting such views, which also caution against developing emergency plans with these assumptions (Fritz & Williams, 1957; Dynes, 1990; Quarantelli, 1990; Sorensen, 2000; Maxwell, 2003).
The survey conducted by Werrity et al. (2007) also investigated local authorities for their warning and informing plans to various groups (p133) namely: householders, landowners, and businesses (‘Do you have systems in place to warn householders, landowners, businesses,
Warning channel
Feature Limitation
Sirens Includes many sophisticated designs like electronic sirens, sirens with voice capability and remote activation capabilities.
People don’t pay attention to it and people don’t understand the meaning of different sounding signals (Sorensen, 2000).
Electronic Sirens with voice capability can fill this gap (Sorensen, 2000) an example for this is Telegraf (2010).
Tone alert radio Personalised warning mechanism and remote operation (ASC, 2010).
Needs electric power through battery and needs dedicated system installation and support.
Media channel – Radios
One of the important media channels, especially suitable to alert people who are driving.
The percentage of radio listeners depends on the time of the day and also the activity of the evacuee during dissemination.
Media channel – Television
Video and voice to give elaborate warning message. Easier to give constant updates.
Depends on the TV viewing patterns (Sorensen, 2000). There are models studying the diurnal variation (Tavakoli & Cave, 1996).
Mass dissemination Systems
‘Auto dial’ feature for reaching large number of telephones in minutes.
Requires dedicated system installation and support, which are expensive.
Mobile Phones SMS text alert as well as voice based alert to the subscribed users.
Requires collaboration with the telecommunication service providers.
Landline Telephones
Auto dialling systems predominantly use landline based alerting.
Only the evacuees who are in their house are likely to be reached through this channel.
Media channel – Internet
Social media and news feeds are increasingly popular source of warning dissemination (Sutton, 2008). For example, AlertSU is an emergency alert system integrated mass-communication systems with Facebook and Twitter feed in the Stanford University area (San Francisco Bay) for Earthquakes (Julian, 2010).
The public need to be connected to the service and also depends on the internet network availability. With increasing use of smartphones this channel has potential for including formal warning plans to reach the internet users.
Door-to-Door Knocking
Personalised warning dissemination to each household by first responders (generally police). It is considered to be effective due to reliability of the warning source.
During the emergencies, the availability of resources for door-to-door knocking is limited by the availability of personnel (Sorensen, 2000).
Figure 2.7 Characteristics of warning channels
During the rapid onset of flooding, “the most commonly affected groups are those who are mobile at the time of flood” (Werrity et al, 2007, p3) and this mobile group cannot be reached by some of the official channels (e.g. TV, landline numbers) and rely on certain channels such as radios and text alert. ‘A subscriber based alert’ system like that used by the UK’s Environment Agency can help only the registered users and the permanent population. Nevertheless providing timely warning to the transent population continues to be a challenge for GOs. Thus the official warning channel forms a critical portion of the warning dissemination plan.

ERGOThe challenges of mass evacuation
74
Chapter 275
Literature Review
contains useful information for practitioners along with checklists for designing warning systems (UNISDR, 2006a) and a comprehensive global review of early warning systems (UNISDR, 2006b). An online forum called ‘AWARE – Alert, Warnings And Response to Emergencies’ (Botterell, 2010) has provided a detailed summary on a standard for practice of public warning as various policy level questions and this requires validation from real life events. In order to measure the overall performance of warning systems, various studies (Stern & Sinuany-Stern, 1989; Southworth, 1991; Rogers & Sorensen, 1991; Hiu et al, 2008) have used ‘overall warning level’ (% people warned) and notification time (in minutes) as effectiveness measures. EMAs could use these performance metrics to compare various alternatives, set operational targets and plan for various scenarios to test the warning plan.
2.6.3 Modelling the evacuation warning dissemination process
The effectiveness of warning channels and its impact on overall warning dissemination has been modelled using two different approaches in the past two decades. A macro simulation looks at the aggregate level by dividing the city into different localities (not individual households) to model the overall warning dissemination. The activities of the household (e.g. travelling, at home and sleeping) and its impact on overall warning dissemination, was studied (Stern & Sinuany-Stern, 1989) using a behavioural simulation model. Another study has validated the simulation model results with the empirical data of warning system effectiveness (Rogers & Sorensen, 1991). Here the diffusion of the warning message was depicted as a logistic equation, but the parameters in the differential equation need to be validated prior to the generalisation of these results.
Secondly, ‘micro-simulation approach’ is where the individual entity (house) behaviour and its interaction with other entities (houses) are considered as the basic principle of modelling (see above and Gilbert (2004) for more details). As the interactions among the evacuees are the key feature of this approach, ABM is a suitable technique for this purpose. Hiu et al, (2008) used an ABM approach to model the diffusion of the warning message among two hypothetical communities as a function of trust. This study used axioms to model the behaviour of the individual households and study the overall warning effectiveness.
The outputs of these models are depicted as a warning response curve which is a plot showing the percentage of warned evacuees for various time duration. The micro approach is data intensive as it requires information about the individual household details as well as warning channels. The warning channel and its effectiveness being a function of: time of the day, availability of the channel as well the connectedness to the evacuees, can be modelled to obtain policy level questions like: how long does it take to warn the public (Stern & Sinuany Stern, 1991; Hiu et al , 2008)? On the other hand a macro-level simulation uses aggregate data (e.g. for example zone level TV viewership details) for ascertaining
directly? If so, how do they work?’). Apart from these groups, tourists, commuters, people living in temporary sites (e.g. caravans) and the socially isolated are vulnerable (referred to as ‘residual risk’ groups in Werrity et al, (2007) & Handmer (2001)), as they are less likely to be reached by the official warning channels and need to be included in the evacuation warning dissemination plan.
Apart from relatives and friends, the role of neighbours is significant owing to their physical proximity (Parker & Handmer, 1998). A post-flooding survey indicated that about 30% of respondents in the Maidenhead flood catchment received their first warning from neighbours (Tunstall, 1992). Another survey indicated that 22% of respondents warned their neighbours (Parker et al, 2009). However, not all the evacuees may warn the same number of neighbours and the pattern of ‘selection set’ (choosing which neighbours to warn e.g. adjacent and/or opposite houses) could vary due to, for example, prior contacts/hostilities with neighbours.
Not all the families or individuals respond in the same way during emergencies (Kreps, 1984), which leads to uncertainty in the behaviour of the public as potential informants. Moreover, as each individual takes a different time period to assimilate (receive, understand and react) the warning message, it may take a longer time to disseminate the message when only informal communication channels are used (McLuckie, 1970). The ‘evacuation preparation time’ is the time between the evacuation decision and its enactment (Hiu et al., 2008). Warning response will depend on these different timelines and the understanding of the uncertainties of these times is required for the GOs to know the onset of warning dissemination as well as overall warning dissemination time. The reliability of a warning system is likely to be increased when there are multiple channels of communication, rather than relying on a single channel. These studies support the observation of rational and active community behaviour, and also that the public could be potential informants for disseminating the emergency message. The behaviour of the public as an informal channel needs to be modelled along with the official channels.
A report titled ‘Developing an early warning system – A checklist’
Study area Proportion of people warned through informal channel
Malaysian flooded catchment 29%Georges river area (Australia) 13 to 24%Macon ( France) 75%
Lagny-Sur-Marne (France) 60%
Saintes (France) 63%
Figure 2.8 Proportion of people who received a flood warning from an unofficial source (Parker and Handmer, 1998, p52 & 55)

ERGOThe challenges of mass evacuation
76
Chapter 277
Literature Review
2.7.1 Timeline from receiving warning message to leaving the house
The previous section highlighted various aspects that will affect when the evacuees receive the evacuation order. It is important to understand the sequence of events for managing the evacuation. Figure 2.9 represents the four separate components of events during the evacuation based on the definitions provided by Urbanik et al (1980) and further elaboration in Southworth (1991, p19).
Southworth (1991, p19) defines terms that underpin Figure 2.9:
Decision time is defined as the time between incidence detection •and an official decision to order an evacuation.
Notification time is defined as the time required to notify all the •individuals in the area at risk of such an evacuation order.
Preparation time is defined as the time required for individuals to •prepare to evacuate the specified area.
Response time (or clearance time) defined as the time required for •individuals to physically travel to safety.
Evacuation time is defined as “the time it takes for a person to start evacuating and get to a safe destination”. (Margulis et al , 2006) and ‘evacuation time estimates’ (ETE) have been widely used as a means of measuring the effectiveness of evacuation used (Southworth, 1991; Rathi & Solanki, 1993; Han et al., 2007, Lindell, 2008). Elaborate discussion on the decision making process as well the theories behind the same have been presented in the earlier section (Part 3). There are various factors that affect when the evacuees receive the warning message and this has been presented above. By preparing the public in advance (Part 1), having a household evacuation plan and providing them with supporting information during the evacuation, the preparation time can be reduced to facilitate the onset of relocating to the place of safety.
During Hurricane Floyd, about 65% of the residents in the mandatory evacuation zone evacuated to a safe location (Dow & Cutter, 2002, p13). A post-evacuation survey indicated that among the 73% of people
Decision time Notification time Response time Preparation time
Incident detection
Issue evacuation order
Receive notification
Begin evacuation
Reach place of safety
Figure 2.9 Components of evacuation process from ‘evacuation decision making’ to ‘evacuation to safety’
the same policy-level question. The output of these approaches would depend on the accuracy of the input parameters and validity of the model.
As there has been empirical evidence (Figure 2.8) of the role of unofficial warning channels, there is a need for the EMAs to know how these unofficial channels will influence the overall dissemination. Though there was a simulation model developed for two hypothetical communities (Hiu et.al, 2008), there remains a research gap in exploring the use of agent-based-modelling for large scale evacuations combining official warning channels and unofficial warning channels. Apart from this evacuation model, the suitability of agent-based modelling as a technique for evacuation modelling has been increasingly recognised (Cabinet Office, 2003) and has also been applied in various social-simulation problems, namely epidemiological studies, pandemic flu spread modelling, and rumour propagation problems (North & Macal, 2007). This requires further investigation in studying how an integrated warning plan is prepared and the scope of using models to support EMA warning preparedness.
2.6.4 Summary
The literature that informs Part 4 includes the warning dissemination process, warning channel system and the scope of modelling the warning dissemination. The content of the warning message was found to be well established, underpinning the social science literature (Sorensen & Mileti, 1989) and the GOs could use this knowledge to design and test the sufficiency of content as one of its preparedness initiatives. The review has highlighted the uncertainty of individual official warning channels in the alerting the public. The evidence demonstrates the importance of unofficial warning channels, and the EMAs need to formally exploit these during emergencies. The delay in warning dissemination may have a cascading effect on evacuating to a safer place – and so it intimately linked to the analysis of ‘how do they evacuate’ (Transportation, Part 5) and ‘where do they evacuate to?’ (Shelter, Part 6) .
2.7 Part 5: Evacuee transportationOur evacuee transportation model (Part 5 in the ERGO Framework for Evacuation) looks at the physical relocation of people from the hazard zone to the place of safety. This review of literature has been classified based in logical order of evacuee response i.e. warning, evacuation, shelter. This section will present the review of literature about GOs response strategies as well as modelling of evacuee transportation. As there are various factors namely, “time available before (or after) the hazard impact, the expected travel demand, and the consequence of not clearing the area in a timely manner” (Cova and Johnson, 2003, p580) that would affect safe evacuation, the authorities need an understanding about these to manage the traffic within the existing road infrastructure.

ERGOThe challenges of mass evacuation
78
Chapter 279
Literature Review
2.7.2 Choice of the evacuee destination
Evacuating to safety would involve relocation of the household members from the hazard zone to a place of safety. This information of ‘destination choice’ is essential for the GOs to understand the flow of traffic during evacuation as well as providing sheltering support (elaborated further in the next section). The authorities in South Carolina, which is prone to hurricanes, conducted a stated-preference survey to know the destination choice of the evacuees. Figure 2.11 indicates the choice of destination among the evacuating households (South-Carolina, 2010).
Figure 2.12 demonstrates the planning assumption about the destination of the evacuating public during hurricane evacuation. As the evacuees leave the house towards safety, there will be a need for them to change their destination for various reasons. During Hurricane Opal (1995) a post-evacuation survey was conducted to understand the reasons for changing the destination, and it was found that over half of the evacuated public changed due to traffic congestions.
2.7.3 Means of transportation and estimation of traffic volume
From the hazard zone to the evacuation destination (place of safety), the evacuees will move to safety through various means. When there are safe places within the neighbourhood of the evacuated zone, the evacuees could leave as ‘pedestrians’ and in other cases evacuees use vehicles (cars and public transport) for evacuation. For Hurricane Opal (1995), a post-evacuation survey indicated that about 62-68%
Destination choice Percentage of evacueesPercent to Local Public Shelter 3-5 of high risk areas (beachfront, barrier islands)
10-15% of moderate risk areas (category 2-3 zones)
15-25% of low risk area depending upon income Percent to Out-of-County 40-70% in strong storm depending upon risk area and income
30-50% in a weak storm depending upon risk area and incomeRemainder to In-County Friends and Relatives Homes and Hotel/Motels
Figure 2.11 Survey from South Carolina (2010) on evacuation destination choice
Reasons Beach area Mainland surge area
Non-surge area
Traffic congestion 53% 42% 33%Storm getting too close 16% 25% 22%Storm getting too strong 17% 17% 0%Motels were full 23% 14% 11%
Figure 2.12 Reasons for changing destination during hurricane Opal (North West Florida, 2010, table 4.28)
who heard the warning order, about 38% evacuated during Hurricane Katrina (Brodie et al, 2006, Figure 2.19 below). During Hurricane Katrina the same study found that, among the non-evacuees who heard the message, 34% indicated that the reason for not evacuating was due to the ‘lack of cars’, 28% underestimated the storm, and 12% could not leave the house as they were “physically unable to leave or having to care for someone who was physically unable to leave” as the main reason they stayed behind (Brodie et al, 2006, p5). This illustrates the various reasons for ‘non-compliance’ to the evacuation order apart from not hearing the warning message.
Given that the warning ‘notification time’ will vary across households (represented as dotted arrows in Figure 2.9), not every evacuee will be able to leave at the same time. During evacuation, the household members could be in different locations and this could have an impact on the evacuation. A two stage linear programming approach was proposed by Murray-Twite & Mahmassani (2002) and considers the ‘household travel pattern’ in order to obtain a prediction for total evacuation time. Transport planners in South Carolina have assumed three categories of evacuee response as a planning basis. Figure 2.10 indicates the response curves for rapid, medium and long response (South-Carolina, 2010). The behaviour at the household level would impact on ‘when they will begin to evacuate’ as well as their choices about their place of safety and means of evacuation.
Figure 2.10 Behaviour response curve reproduced from South-Carolina (2010)

ERGOThe challenges of mass evacuation
80
Chapter 281
Literature Review
identifying a means of re-routing during evacuation to make more road capacity available for evacuees. Southworth (1991, p7) provides detailed calculations of traffic loading values.
Zone within the state Percentage of tourists
Illinois, Indiana, Ohio, Kentucky 13%
Georgia, Tennessee 7%
North Carolina 25%
South Carolina Inland 14%
Virginia, West Virginia 13%
Maryland, New York, Pennsylvania, & New England 17%
Canada 2%
Other 9%
Figure 2.13 Average % of tourists in different state zones (FEMA,1999)
2.7.4 Supporting evacuation through transport management
There are various means of supporting the evacuation by transport officials to reduce the evacuation time. They are providing public transport support, regulating traffic flow through contra-flow plans, traffic signal management and providing routing plans to the evacuees. A technical report’s recommendation prepared by the GOs in New York City indicated that ‘if officials aggressively urge evacuees to use public transportation rather than their own vehicles, approximately half the evacuees will comply, further reducing the number of vehicles used in the evacuation.’ (NYC, 2005) As the number of evacuees per vehicle in a public transport (say bus or metro) is high, leading to lower number of vehicles on roads, this demonstrates a means of reducing traffic volume during evacuation. Apart from the resident population, tourists are vulnerable with respect to transportation and would rely on the public transport. For this, the GOs need an understanding of the transport resource capacity (number of buses), trip scheduling and capacity of the road networks.
A bus dispatch system was proposed to schedule the bus services for facilitating the evacuation (Margulis et al., 2006). The following were the operational and behavioural assumptions made while developing the system:
The time it takes to go from a pick-up point to a shelter is fixed. 1.
There is a maximum amount of trips that a bus can make. 2.
of the vehicles registered in that area were used for evacuation, with 1.16 to 1.36 vehicles per household (North West Florida, 2010). In another study, a stated-preference survey found that about 20% of the evacuees would require assistance for evacuation (NYC, 2005) and ‘need transportation or the person had a disability or medical problem’.
In order to establish the traffic volume on major roads, the authorities have used the O-D (Origin and Destination) studies as well as the ‘annual daily traffic data’. Apart from the vehicle traffic, the census data has been used to estimate the proportion of people at different zones (work zones, school and university and residential) in the city. For example during the daytime, USA census indicated (Southworth, 1991) that 46.2% of the population will be at work, 18.2% in school or day care and 35.6% of the population will be at home. Though these values are geography specific, such an estimate could be collected by the GOs in their respective countries to support the transport plans.
In order to obtain a planning estimate for the ‘number of vehicles’, the authorities have used state-preference surveys (FEMA, 1999), and in another study (Southworth, 1991) the number of registered vehicles in the area and number of licensed car drivers was used to obtain a planning estimate for number of cars. This estimate is essential to understand the expected vehicle loading at different zones during the evacuation. Finally to obtain the number of evacuees safely evacuated, it is also essential to know the average number of evacuees per car.
As receiving the warning message on official channels (TV, radio, etc) would depend on the time of the day (Roger & Sorensen, 1991, p125), there will be a difference in receiving the message for a daytime scenario versus night time scenario. Apart from this difference the potential evacuees will be involved in different activities during different times of the day, namely at work, sleeping, in transit and awake at home (Roger & Sorensen, 1991). Based on the time of the day, the number of evacuees per vehicle used was 1.85 daytime evacuees per vehicle (Southworth, 1991, p13) and another study used 2.5 evacuees per car as an average value (Wolshon 2006, p6).
Apart from the traffic volume of the ‘resident population’, commuters and tourists form a major portion of additional evacuees. The proportion of commuter traffic could be obtained from ‘travel survey data’ (Glickman, 1986; Southworth, 1991). The percentage of tourists is specific to geography and GOs have used secondary sources (tourist department) to obtain an estimate of tourists in the city for a given season (FEMA, 1999).
Drabek (1996) discusses tourists and transient evacuee behaviour. Figure 2.13 shows the percentage of tourists in the city that helped EMAs to support their evacuation plans. Finally, there will be additional transient vehicular traffic along the evacuation route due to regular motorway users. This transient traffic could be estimated by analysing the historic volume of traffic along the evacuating routes and
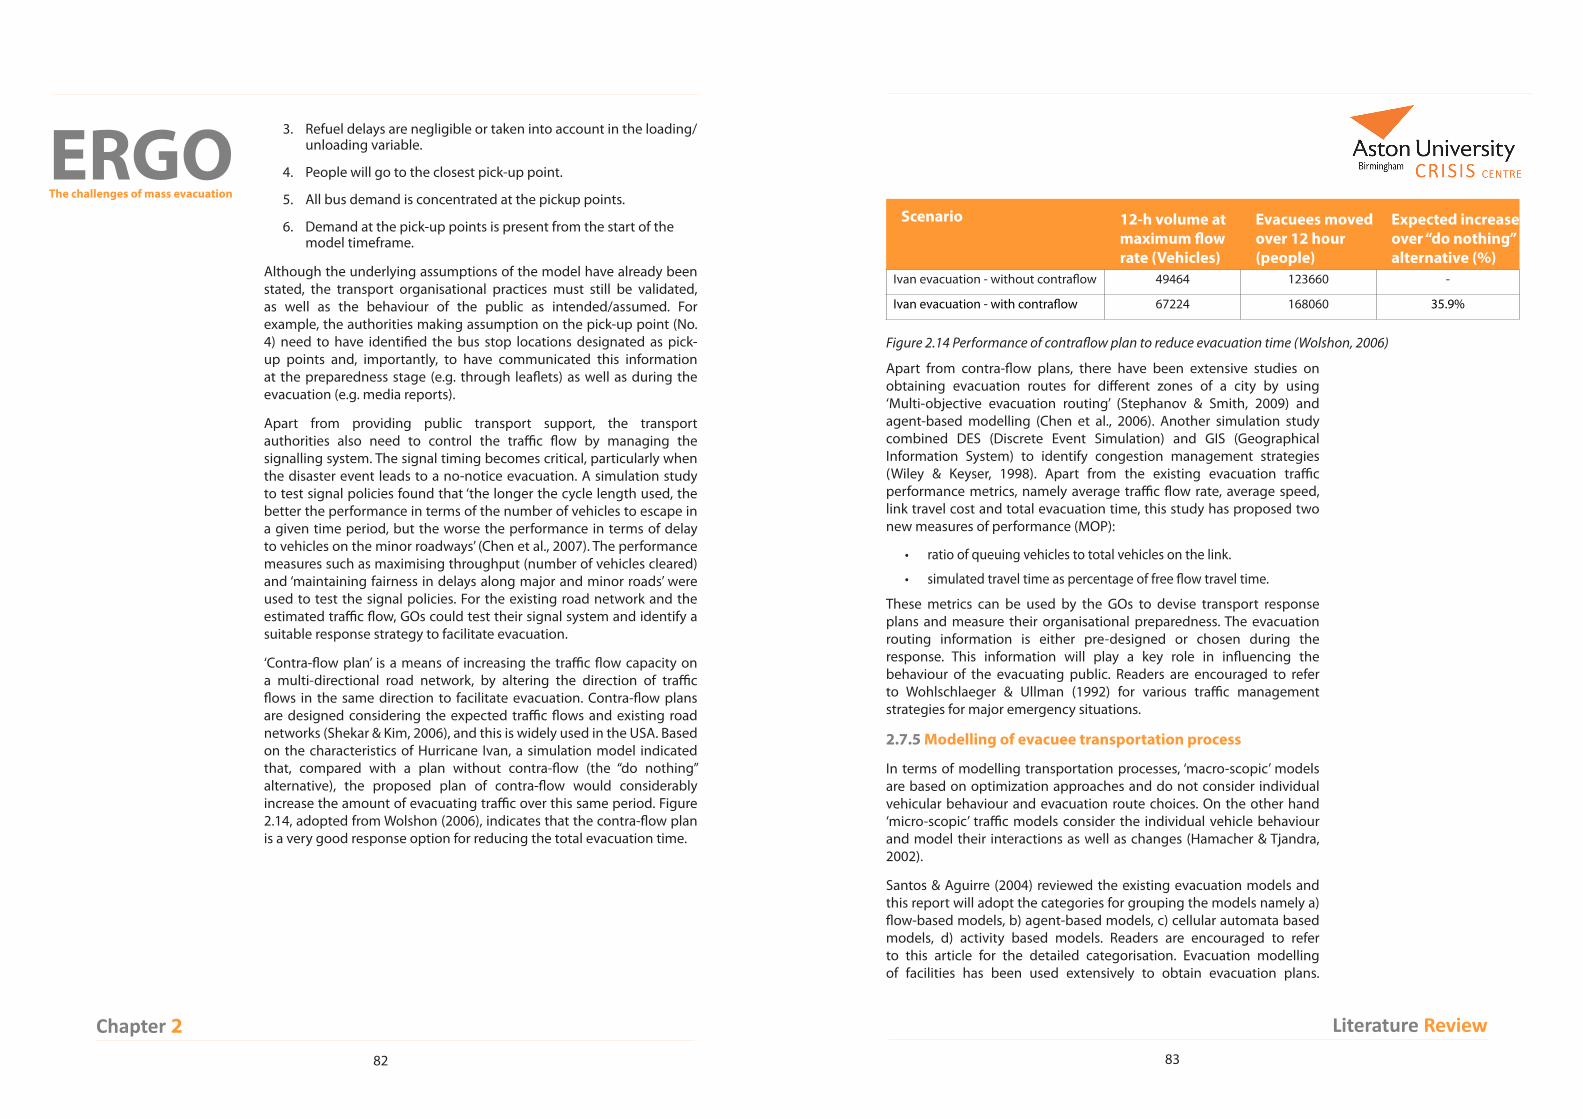
ERGOThe challenges of mass evacuation
82
Chapter 283
Literature Review
Apart from contra-flow plans, there have been extensive studies on obtaining evacuation routes for different zones of a city by using ‘Multi-objective evacuation routing’ (Stephanov & Smith, 2009) and agent-based modelling (Chen et al., 2006). Another simulation study combined DES (Discrete Event Simulation) and GIS (Geographical Information System) to identify congestion management strategies (Wiley & Keyser, 1998). Apart from the existing evacuation traffic performance metrics, namely average traffic flow rate, average speed, link travel cost and total evacuation time, this study has proposed two new measures of performance (MOP):
ratio of queuing vehicles to total vehicles on the link. •
simulated travel time as percentage of free flow travel time. •
These metrics can be used by the GOs to devise transport response plans and measure their organisational preparedness. The evacuation routing information is either pre-designed or chosen during the response. This information will play a key role in influencing the behaviour of the evacuating public. Readers are encouraged to refer to Wohlschlaeger & Ullman (1992) for various traffic management strategies for major emergency situations.
2.7.5 Modelling of evacuee transportation process
In terms of modelling transportation processes, ‘macro-scopic’ models are based on optimization approaches and do not consider individual vehicular behaviour and evacuation route choices. On the other hand ‘micro-scopic’ traffic models consider the individual vehicle behaviour and model their interactions as well as changes (Hamacher & Tjandra, 2002).
Santos & Aguirre (2004) reviewed the existing evacuation models and this report will adopt the categories for grouping the models namely a) flow-based models, b) agent-based models, c) cellular automata based models, d) activity based models. Readers are encouraged to refer to this article for the detailed categorisation. Evacuation modelling of facilities has been used extensively to obtain evacuation plans.
Scenario 12-h volume at maximum flow rate (Vehicles)
Evacuees moved over 12 hour (people)
Expected increase over “do nothing” alternative (%)
Ivan evacuation - without contraflow 49464 123660 -
Ivan evacuation - with contraflow 67224 168060 35.9%
Figure 2.14 Performance of contraflow plan to reduce evacuation time (Wolshon, 2006)
Refuel delays are negligible or taken into account in the loading/3. unloading variable.
People will go to the closest pick-up point.4.
All bus demand is concentrated at the pickup points.5.
Demand at the pick-up points is present from the start of the 6. model timeframe.
Although the underlying assumptions of the model have already been stated, the transport organisational practices must still be validated, as well as the behaviour of the public as intended/assumed. For example, the authorities making assumption on the pick-up point (No. 4) need to have identified the bus stop locations designated as pick-up points and, importantly, to have communicated this information at the preparedness stage (e.g. through leaflets) as well as during the evacuation (e.g. media reports).
Apart from providing public transport support, the transport authorities also need to control the traffic flow by managing the signalling system. The signal timing becomes critical, particularly when the disaster event leads to a no-notice evacuation. A simulation study to test signal policies found that ‘the longer the cycle length used, the better the performance in terms of the number of vehicles to escape in a given time period, but the worse the performance in terms of delay to vehicles on the minor roadways’ (Chen et al., 2007). The performance measures such as maximising throughput (number of vehicles cleared) and ‘maintaining fairness in delays along major and minor roads’ were used to test the signal policies. For the existing road network and the estimated traffic flow, GOs could test their signal system and identify a suitable response strategy to facilitate evacuation.
‘Contra-flow plan’ is a means of increasing the traffic flow capacity on a multi-directional road network, by altering the direction of traffic flows in the same direction to facilitate evacuation. Contra-flow plans are designed considering the expected traffic flows and existing road networks (Shekar & Kim, 2006), and this is widely used in the USA. Based on the characteristics of Hurricane Ivan, a simulation model indicated that, compared with a plan without contra-flow (the “do nothing” alternative), the proposed plan of contra-flow would considerably increase the amount of evacuating traffic over this same period. Figure 2.14, adopted from Wolshon (2006), indicates that the contra-flow plan is a very good response option for reducing the total evacuation time.
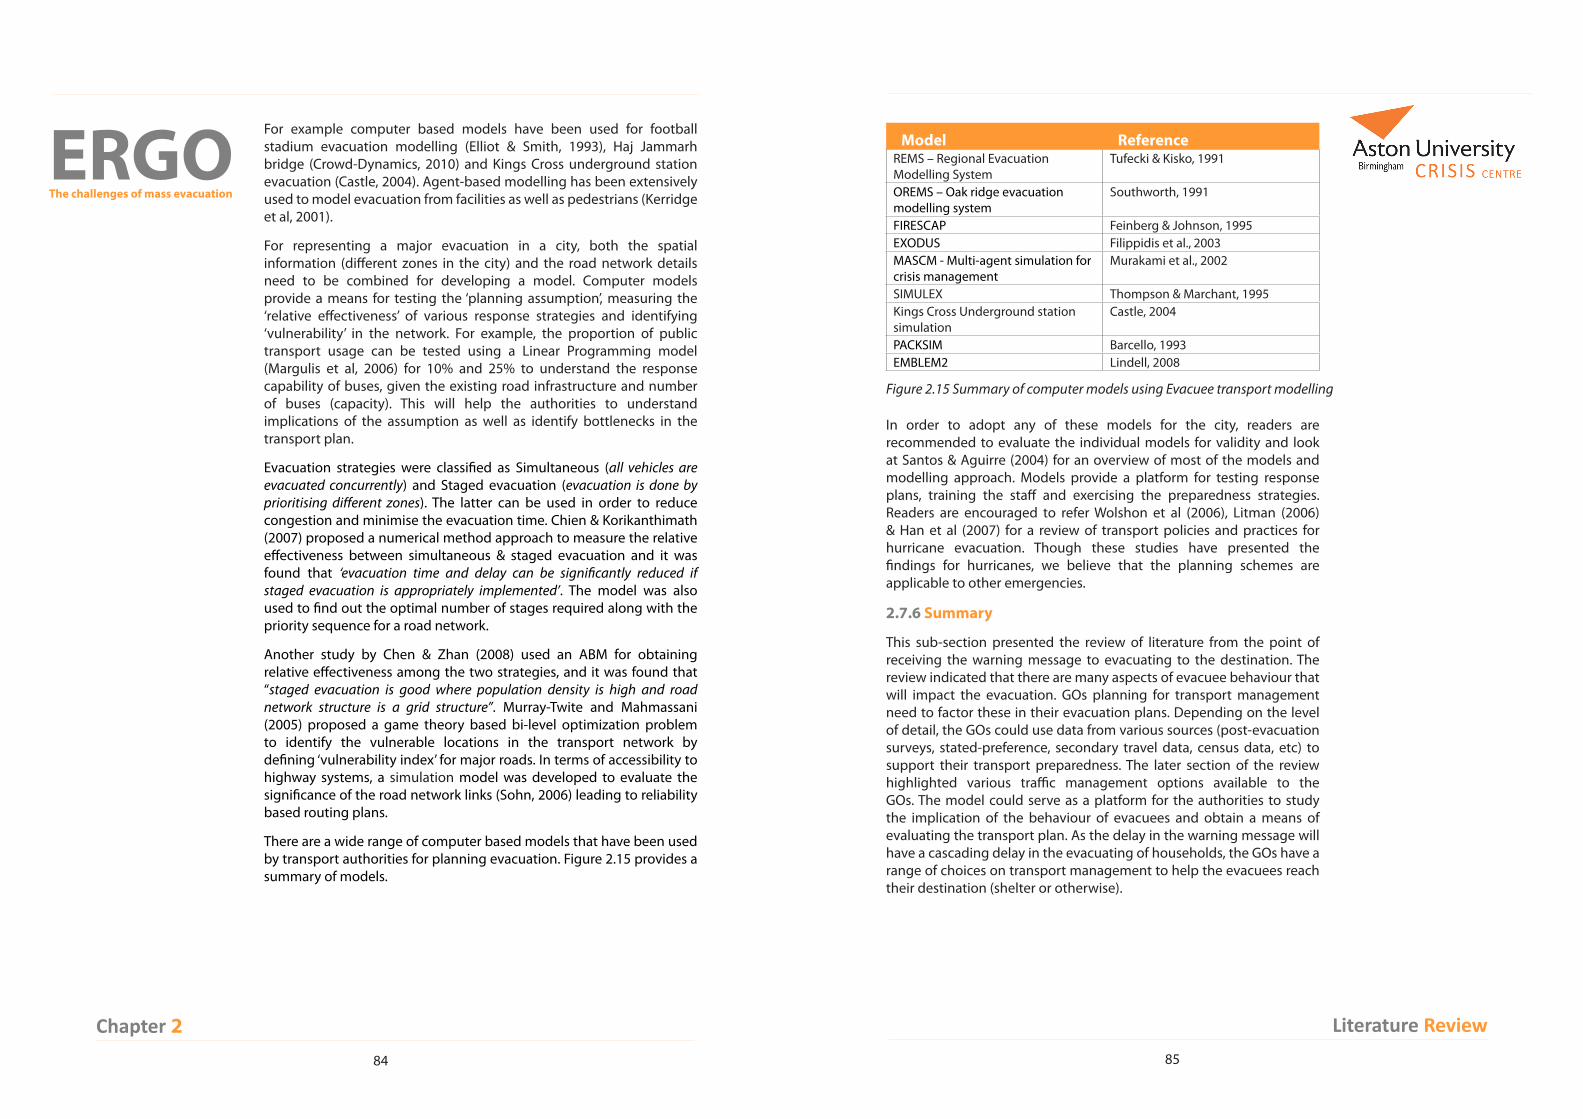
ERGOThe challenges of mass evacuation
84
Chapter 285
Literature Review
In order to adopt any of these models for the city, readers are recommended to evaluate the individual models for validity and look at Santos & Aguirre (2004) for an overview of most of the models and modelling approach. Models provide a platform for testing response plans, training the staff and exercising the preparedness strategies. Readers are encouraged to refer Wolshon et al (2006), Litman (2006) & Han et al (2007) for a review of transport policies and practices for hurricane evacuation. Though these studies have presented the findings for hurricanes, we believe that the planning schemes are applicable to other emergencies.
2.7.6 Summary
This sub-section presented the review of literature from the point of receiving the warning message to evacuating to the destination. The review indicated that there are many aspects of evacuee behaviour that will impact the evacuation. GOs planning for transport management need to factor these in their evacuation plans. Depending on the level of detail, the GOs could use data from various sources (post-evacuation surveys, stated-preference, secondary travel data, census data, etc) to support their transport preparedness. The later section of the review highlighted various traffic management options available to the GOs. The model could serve as a platform for the authorities to study the implication of the behaviour of evacuees and obtain a means of evaluating the transport plan. As the delay in the warning message will have a cascading delay in the evacuating of households, the GOs have a range of choices on transport management to help the evacuees reach their destination (shelter or otherwise).
For example computer based models have been used for football stadium evacuation modelling (Elliot & Smith, 1993), Haj Jammarh bridge (Crowd-Dynamics, 2010) and Kings Cross underground station evacuation (Castle, 2004). Agent-based modelling has been extensively used to model evacuation from facilities as well as pedestrians (Kerridge et al, 2001).
For representing a major evacuation in a city, both the spatial information (different zones in the city) and the road network details need to be combined for developing a model. Computer models provide a means for testing the ‘planning assumption’, measuring the ‘relative effectiveness’ of various response strategies and identifying ‘vulnerability’ in the network. For example, the proportion of public transport usage can be tested using a Linear Programming model (Margulis et al, 2006) for 10% and 25% to understand the response capability of buses, given the existing road infrastructure and number of buses (capacity). This will help the authorities to understand implications of the assumption as well as identify bottlenecks in the transport plan.
Evacuation strategies were classified as Simultaneous (all vehicles are evacuated concurrently) and Staged evacuation (evacuation is done by prioritising different zones). The latter can be used in order to reduce congestion and minimise the evacuation time. Chien & Korikanthimath (2007) proposed a numerical method approach to measure the relative effectiveness between simultaneous & staged evacuation and it was found that ‘evacuation time and delay can be significantly reduced if staged evacuation is appropriately implemented’. The model was also used to find out the optimal number of stages required along with the priority sequence for a road network.
Another study by Chen & Zhan (2008) used an ABM for obtaining relative effectiveness among the two strategies, and it was found that “staged evacuation is good where population density is high and road network structure is a grid structure”. Murray-Twite and Mahmassani (2005) proposed a game theory based bi-level optimization problem to identify the vulnerable locations in the transport network by defining ‘vulnerability index’ for major roads. In terms of accessibility to highway systems, a simulation model was developed to evaluate the significance of the road network links (Sohn, 2006) leading to reliability based routing plans.
There are a wide range of computer based models that have been used by transport authorities for planning evacuation. Figure 2.15 provides a summary of models.
Figure 2.15 Summary of computer models using Evacuee transport modelling
Model ReferenceREMS – Regional Evacuation Modelling System
Tufecki & Kisko, 1991
OREMS – Oak ridge evacuation modelling system
Southworth, 1991
FIRESCAP Feinberg & Johnson, 1995EXODUS Filippidis et al., 2003MASCM - Multi-agent simulation for crisis management
Murakami et al., 2002
SIMULEX Thompson & Marchant, 1995Kings Cross Underground station simulation
Castle, 2004
PACKSIM Barcello, 1993EMBLEM2 Lindell, 2008

ERGOThe challenges of mass evacuation
86
Chapter 287
Literature Review
Sheltering level FeatureHousehold level Safe room within the house – for flooding, earthquake
and some nuclear disasters – in-shelteringNeighbourhood level
Building in a higher elevation and safe – for fire and earthquakes - Refugee Point
Community level A shelter location identified in advance within the community (e.g. neighbourhood leisure centre)
Regional level When there is wide spread damage to the houses within the region, the evacuees are sheltered in the neighbouring region
Figure 2.16 Spatial classification of different shelters and their key features
The choice of sheltering level would also impact the transportation aspects, namely the means of transportation, vehicles per household, time of evacuee departures and role of information in evacuation routes (Dow & Cutter, 2002, p13). This highlights the interrelatedness of the three evacuation support functions (warning dissemination, transportation and shelter management). As the shelters are located in different parts of the city, the spatial distribution will have an impact on ‘total evacuation time’.
2.8.2 Shelter demand estimation
A city’s population can be classified as having a ‘resident population’ and a ‘transient population’ (Johnston et al, 2007). The transient population includes commuters, visitors and tourists. Not all the population will comply with the evacuation order. For example, during Hurricane Floyd only about 65% evacuated from the danger zone (Dow & Cutter, 2002). Among the evacuated people, the proportion of people who will require sheltering will vary. The demand (defined as number of evacuees needing shelter) for public shelters was explained in Mileti et al, (1992) by various factors and grouped into three categories:
Characteristics of the disaster event.a.
Characteristics of the emergency preparedness.b.
Characteristics of the evacuees. c.
Figure 2.17 summarises the findings from various published sources as presented in Mileti et al (1992). Such a study could help GOs to understand the factors affecting the shelter demand.
2.8 Part 6: Emergency accommodation planning and operationEmergency accommodation, though the last phase in evacuation, is one of the important phases in the mass evacuation of a city, bridging the gap between evacuation and safe recovery/return. There are various terms used in the literature to denote emergency accommodation: sheltering, public shelters, mass care shelters, refugee centres and Humanitarian Assistance Centres, and this report will refer to these as shelters. Hurricane Katrina and Rita displaced about 2 million people and more than 250,000 were sheltered for more than two weeks (Burkle, 2009). The duration of sheltering could be as short as a few hours (for example evacuation whilst an unexploded bomb from World War II is defused) or it could be as high as five weeks (for example evacuation during Hurricane Andrews) (Sattler et al., 1995) depending on the nature of the emergency, immediate effect on their houses and proactive measures taken by the public. Thus the GOs responsible for shelter management need an understanding of sheltering as well as identifying, allocating and managing the shelter for a city.
This section reviews emergency accommodation planning, and is grouped into the following sub-sections: classification of shelters, estimation of demand, sheltering availability and allocation, relief supplies planning and support services.
2.8.1 Classification of shelters
Sheltering involves relocating evacuees from a hazard zone to a place of safety. There are many alternatives to be evaluated prior to issuing an evacuation order. The alternatives are (Xu, 2006):
In-sheltering (staying in a safe place within the premises).•
Vertical evacuation (moving to the floor above - especially used in •flash flooding - or to the cellar in the case of tornado).
Horizontal evacuation (leaving the threatened location to a place of •safety).
The detailed analysis of ‘evacuation decision making’ has been presented in Part 3. Once the evacuation decision is made, the warning message will provide information about evacuating to shelters. Shelters are broadly classified (Kar & Hodgson, 2008) into ‘special facilities’ (specifically built for emergency accommodation) and dual-use public buildings (schools, colleges, churches and community centres).
Depending on the relative location of the shelter to the evacuated zone, the shelters are classified into four categories based on ‘spatial scales’ (Xu, 2006, p183). Figure 2.16 lists these categories along with their features. Each category of sheltering level will have different needs depending on the duration of sheltering. For example, when the evacuees are relocated to a regional level shelter for long duration (say one week), there will be a need for lifeline support (e.g. food, bedding, medication, etc.) until it is safe to return home.

ERGOThe challenges of mass evacuation
88
Chapter 289
Literature Review
The authorities responsible for shelters have used policy-level questions like, “What are the destinations of the evacuees and what type of shelter will they be heading for?” (Alabama, 2010). In order to obtain data supporting their plans, the authorities have also used stated-preference surveys from the residents living in the community. The evacuee behaviour data helps in estimating the demand for shelters during an evacuation.
For the evacuees complying with the evacuation order there are various alternative destinations. They are:
Evacuate to public shelters.a.
Stay with friends or relatives. b.
Go to a hotel or motel.c.
Go to church or workplace. d.
The following Figure 2.18 shows the variation of stated-preference of evacuation destination for four counties within Northwest Florida prone to hurricanes (FEMA, 1999).
The average demand for mass care shelters in USA was reported to be 15% (Sorensen, 2000). Depending on the socio-economic profile of the evacuated zone, the demand will vary considerably in different zones (FEMA, 1999). In order to understand the expected variation, the authorities have used post-evacuation surveys to create a planning estimate. Based on a post-evacuation survey conducted (Brodie et al, 2006) after the Hurricane Katrina evacuation, it was found that about 30% (8000 people) were sheltered out of the 27100 resident population. This study also highlights the sheltering usage is influenced by ‘ethnicity’ (African Americans were about 93% of Houston shelter residents), ‘low income level’, ‘low rate of home ownership’, health insurance, education level and marriage status. Figure 2.19 summarises the findings reported in Brodie et al (2006) on the demographic details of the evacuees.
These findings, although specific to geography (Houston area, USA) and a disaster type (Hurricanes), highlight the factors that would possibly affect the evacuees needing shelters (Shelter demand). The emergency planner as part of a preparedness initiative could arrive at a planning estimate of ‘shelter demand’ by considering these factors in their area and identifying the lack of sheltering capacity (how many people who
Mobile Baldwin
Escambia Santa Rosa
Okaloosa Walton
Bay
Evacuate to Public Shelter 2 5 7 6Stay with Friend or Relatives 64 61 57 51Go to a Hotel or Motel 21 22 21 27Other (such as churches or work place) 13 12 15 16
Figure 2.18 Type of refuge in Opal, by County (%) (FEMA, 1999)
The ‘Nanticoke metal fire evacuation’ (1987) resulted in 15000 residents being evacuated including 250 hospital and nursing home patients (Stambaugh, 1987), and shelter usage during this evacuation was about 43.2% (Ducos et al, 1989). The demand for shelters can be estimated based on the number of people exposed to the threat (Mileti et al, 1992). GOs can estimate these ‘expected evacuation zones’ using disaster-specific OR models (for example, the flood model). Thus GOs could combine the demographic data of the area with the threat information (Ng, 2010) to determine the evacuation zone, which would in turn provide the number of evacuees. The synthesis of historical records (Mileti et al, 1992) detailing the ‘demand for shelters’ for different hazards is summarised in the above figure, but caution should be exercised in relation to the effect of other factors (e.g. severity of the disaster, socio-economic profile, etc.) on the generalisability of these observations.
Category Factor ObservationsCharacteristics of the disaster event
Emergency Type Shelter demand (%) for different disastersHurricanes – 19%Flooding – 13.9%Industrial disasters – 16.3%Geological hazards – 3.4 %
Characteristics of the disaster event
Anticipated length of stay
Short term evacuations (hours to days) have more public shelter demand compared to long term evacuation (days to weeks). For evacuation involving overnight stay, the public shelter usage was found to be higher.
Characteristics of the evacuees
Ethnicity of evacuees Immigrant communities, as well as ethnic minorities, have higher shelter demand. The cultural affinity within the community would influence their choice of using public shelters or going to their extended families.
Characteristics of emergency preparedness
Publicity Average shelter demand was 19.2% where the shelter details were publicized using awareness campaigns, brochures and assigning a particular neighbourhood to them.
Characteristics of the disaster event
Urban versus rural Public shelter demand was higher in evacuations involving the city compared to rural areas.
Characteristics of the evacuees
Age Elderly people are more likely to use shelters and the average shelter use rate was 25.8% for areas with substantial portion of evacuees over 60 years.
Characteristics of the evacuees
Socio-Economic status The average use of shelters in evacuations involving low socio-economic status was 27.5%.
Figure 2.17 Classification of factors that affect shelter demand (Mileti et al, 1992)

90 91
Literature Review
can be sheltered). Readers are encouraged to refer to Xu et al (2006) for classification of shelters as well as alternatives and Mileti et al (1992) for theoretical basis for understanding shelter demand.
2.8.3. Shelter availability, estimation and allocation
Shelters are often pre-identified and documented as a part of preparedness initiative. The names and addresses of existing shelters can be geo-coded to produce an existing shelter geographic database (Kar & Hodgson, 2008). The responsibility of identifying the potential sheltering locations and documenting these is an important task (Cabinet Office, 2006). For a large scale evacuation, the database of shelters will have to be used to identify the available shelters, depending on the damage due to the disaster, evacuation distance and facilities available.
Figure 2.20 highlights the variety of dual-use buildings identified for potential use as shelters (Kar & Hodgson, 2008). The capacity of these shelters (number of people who can be accommodated) will be varied comparably in the list given below. As the identified shelters will be dispersed across different regions in the city, the available shelters need to be allocated for different evacuation zones.
Kar & Hodgson (2008, p227) presented a GIS-based selection from the available location on the following policy level questions of suitability:
How many candidate shelters are located in physically suitable areas 1. (e.g. not in a flood prone area, not near hazardous facilities, etc)?
How many existing shelters are located in physically unsuitable areas, 2. but in socially suitable areas (situated in areas with demand)?
How many alternative existing and/or candidate shelters with high/3. very high physical suitability are located near physically unsuitable existing shelters and thus, may be better choices for a shelter?
How many existing shelters located in physically unsuitable areas are 4. not near alternative existing and/or candidate shelters?
These suitability questions were used to obtain a ranking of candidate shelter locations and select the higher ranking ones for sheltering. Given
Facility Types of facilitiesHealthcare Ambulatory Surgical Centre, Clinic, Crisis Stabilization Unit, Family/General Practice,
Hospital, Medical Centre
Community Centre Community CentreSocial Services Centre
Child Day Care Service, Government Offices, Health and Welfare Agencies
Cultural Centre Institutional Library, Library, Special Interest LibraryCivic Centre Auditorium, Conference Centre, Convention Centre, Civic CentreReligion Centre Church
Figure 2.20 Facility type considered for sheltering as adopted from Kar and Hodgson (2008, p235)
Sl. No. Factors
Houston Shelter Residents %
New Orleans Residents %
Louisiana Residents %
1 Residents at the time of hurricaneNew Orleans or Outskirts 98Elsewhere in Louisiana or Mississippi 1
2 GenderMale 50Female 50
3 RaceWhite 5 28 64Black 93 67 33
4 Age (years)18-34 32 28 6435-49 37 30 28>=50 30 42 40
5 Marital StatusMarried/Living as Married 30Single, Never Married 47Separated/Divorced 15Widowed 8
6 Has children younger than 18 years 45 30Has children in shelter 33
7 Employment status before stormEmployed full time 54 40 37Employed part time 15 5 6Unemployed 12 1 3Other (e.g. retired, homemaker) 18 54 54
8 Household Income, US$, 2004< 10000 32 10 1010000 – 19999 27 13 1320000 – 29999 15 10 1330000 – 39999 9 13 1440000 – 49999 2 9 10>= 50000 1 44 40
9 EducationHigh school graduate 70 75 75Bachelor’s degree 6 26 19
10 Owns home 33 47 6811 Insurance status among non-elderly
Uninsured 54 26Private insurance 18 63Medicare 5 3Medicaid or other government program 15 8
12 Main source of health care before hurricaneHospital 46Clinic or health care 20Physician’s office 20No source of care 9
13 Primary care hospital or clinicCharity Hospital 54University Hospital 8Tulane University Medical Centre 4Touro Infirmary 4Veterans Administration or US Veterans Medical Centre 4
14 Has chronic health condition 41
Figure 2.19 Demographic details of the Hurricane Katrina sheltered evacuees reproduced from Brodie et al (2006)

ERGOThe challenges of mass evacuation
92
Chapter 293
Literature Review
evacuees was used as a performance metric which was minimised by balancing various constraints:
Available shelters•
Shelter demands •
Evacuee behaviour•
Travel time from the hazard zone to the allocated shelters•
This section has explained how OR models have provided a means of understanding various aspects of shelter allocation, but the shelters also require supplies and staff to deal with evacuees. The next section will examine how shelters can be organised to provide for evacuees in an effective way.
2.8.4 Relief supplies planning and support services
About 32% of those people evacuated to the Houston shelter indicated that their close relatives and friends were ‘still missing’ based on a post-evacuation survey (Brodie et al, 2006) conducted two weeks after the evacuation. In order to provide an information hotline service for missing persons, evacuee registration data would be essential. Chelmsford Borough (CBC, 2010) in the UK have developed “Evacuees – Registration and Logistics Management” software in Visual Basic (VB) which facilitates registration, tracking and generating reports based on the evacuee details at each shelter location. Another web-based tool was developed to facilitate evacuee registration (Chatham, 2009). Screenshots of these systems are provided in Figures 2.21 to 2.24. Web-based systems can provide centralised access to the information with real-time updates. Such systems have the potential for development where the shelter availability details and the evacuee registration are integrated. It will also support the information hotline services more effectively.
that the shelters are identified in safer zones with different capacities, the evacuees from different zones need to reach different shelters. The GOs here could allocate the shelters based on a response priority.
In order to understand the distributiveness and coverage of the shelters, OR models have been used to choose optimal shelter location. Sherali et al (1991) used a mathematical modelling approach to formulate a location-allocation problem to select best shelter locations among available shelters by minimising congestion and total evacuation time. The sufficiency of the number of shelters and its coverage to various zones (Chiyoshi, et al., 2002) of a city can be studied as a ‘location search problem’ (Brandeau & Chiu, 1989) to help in identifying new shelters. These OR models will help GOs to understand the coverage of shelters for different evacuated zones.
As the demand locations (evacuated zones) and supply points (shelter locations) are geographically spread out, the evacuation time must be balanced such that the evacuees reach safety quickly. This would entail understanding the behaviour of evacuees in evacuation route choice and considering the same while allocating the shelters. New Hannover County, which is prone to various disasters like flooding, wild fires, tornadoes and earthquakes, has publicised various evacuation shelters on their website using a map (NHC, 2010). The website also provides information about carrying pets and sheltering location (NHC-S, 2010) as well as directions to each shelter. In the absence of any prior information about their allocated shelters, the evacuees might go to the nearest shelters or a convenient shelter. In some instances the evacuees were “assigned particular neighbourhoods to them” (Mileti et al, 1992, p33) and this will influence their choice during the evacuation.
The GOs responsible for allocating the shelter would aim at minimising the total evacuation time (sum of the evacuation time of all the evacuees) and this approach is referred to as system-level optimisation (cooperative behaviour). The GO’s decision could be divided into a ‘location problem’ (Sherali et al, 1991), and a requirement identifying the shelters for different zones. The evacuees depend on the information available prior to the event (e.g. from leaflets), instructions given in the warning message stating shelter location, as well as evacuation routes and personal preferences (e.g. evacuating to nearest shelters) to choose their best shelter. Failure to undertake these actions could result in non-optimal behaviour, which “could potentially lead to overcrowded shelters and/or severe traffic disruptions” (Ng, 2010).
Kongsomsaksakul (2005) proposed a model of the GO’s perspective as well as evacuee behaviour choice. This problem was solved using a Genetic Algorithm, which is a heuristic technique for solving optimization problems. A more recent approach for allocating shelters was using hybrid bi-level (Ng, 2010), which involves solving the optimal shelter allocation in two stages. First the problem was solved at the ‘authorities’ perspective’ and then the next level was solved at each evacuation zone. In all these models the total evacuation time of all the
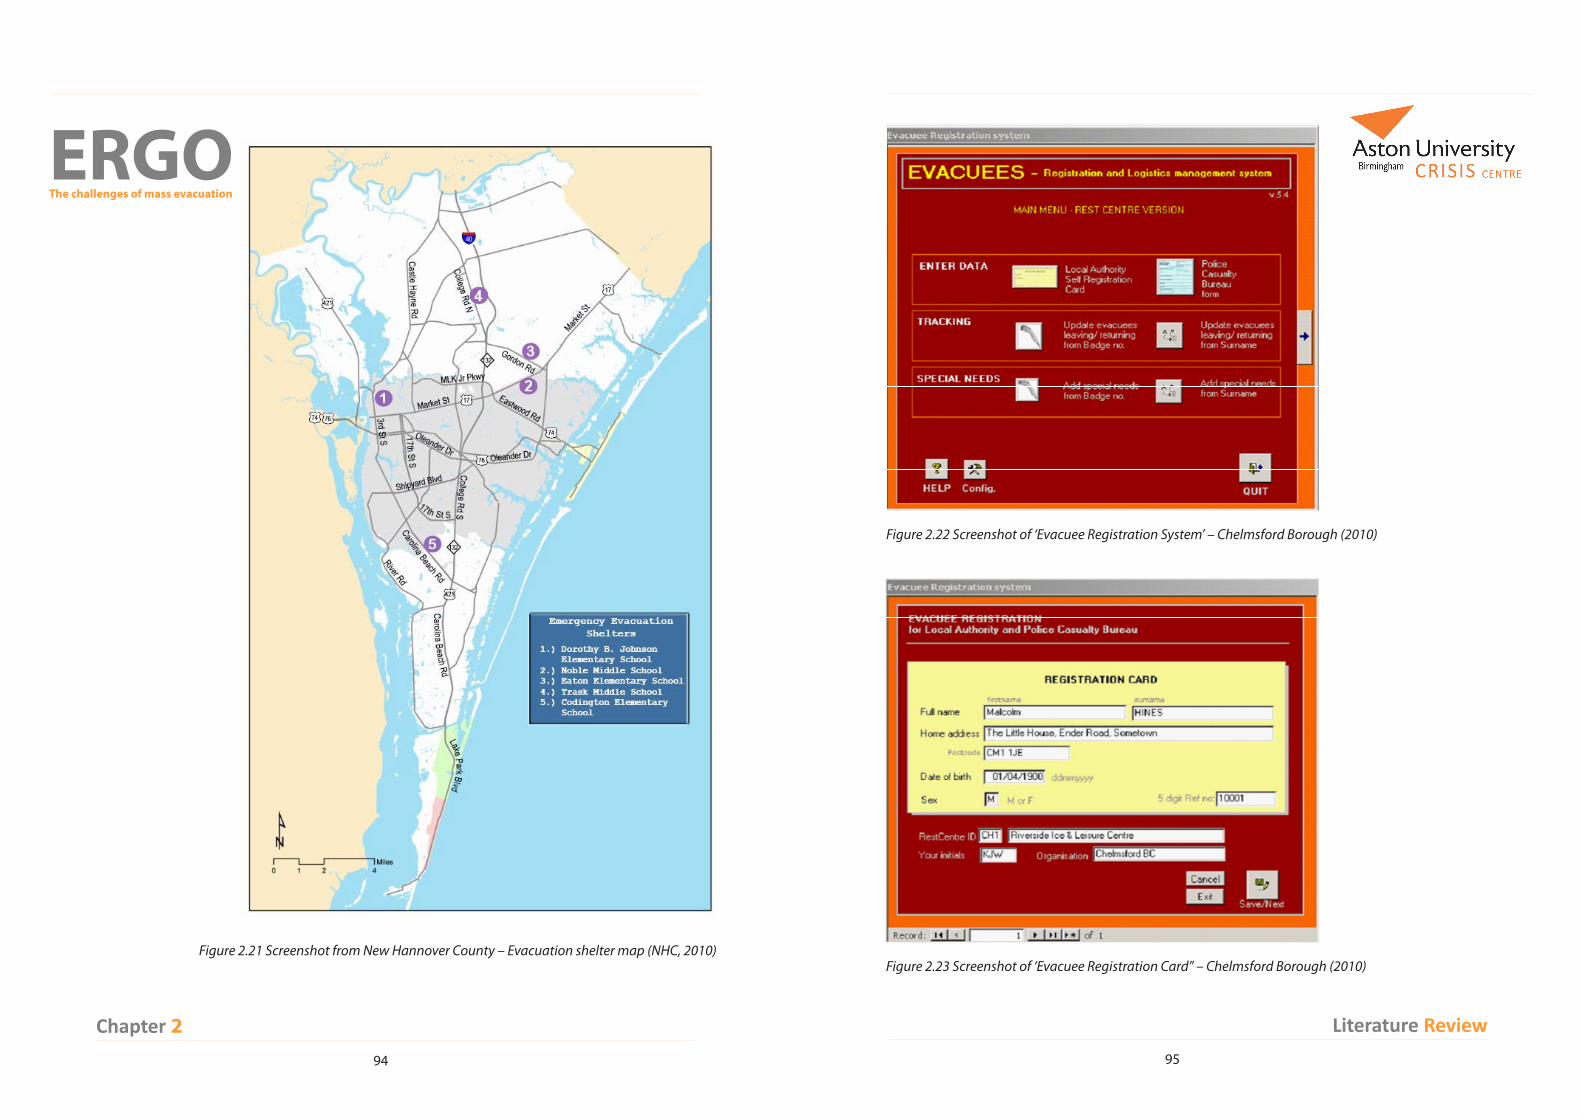
ERGOThe challenges of mass evacuation
94
Chapter 295
Literature Review
Figure 2.22 Screenshot of ‘Evacuee Registration System’ – Chelmsford Borough (2010)
Figure 2.23 Screenshot of ‘Evacuee Registration Card” – Chelmsford Borough (2010)Figure 2.21 Screenshot from New Hannover County – Evacuation shelter map (NHC, 2010)
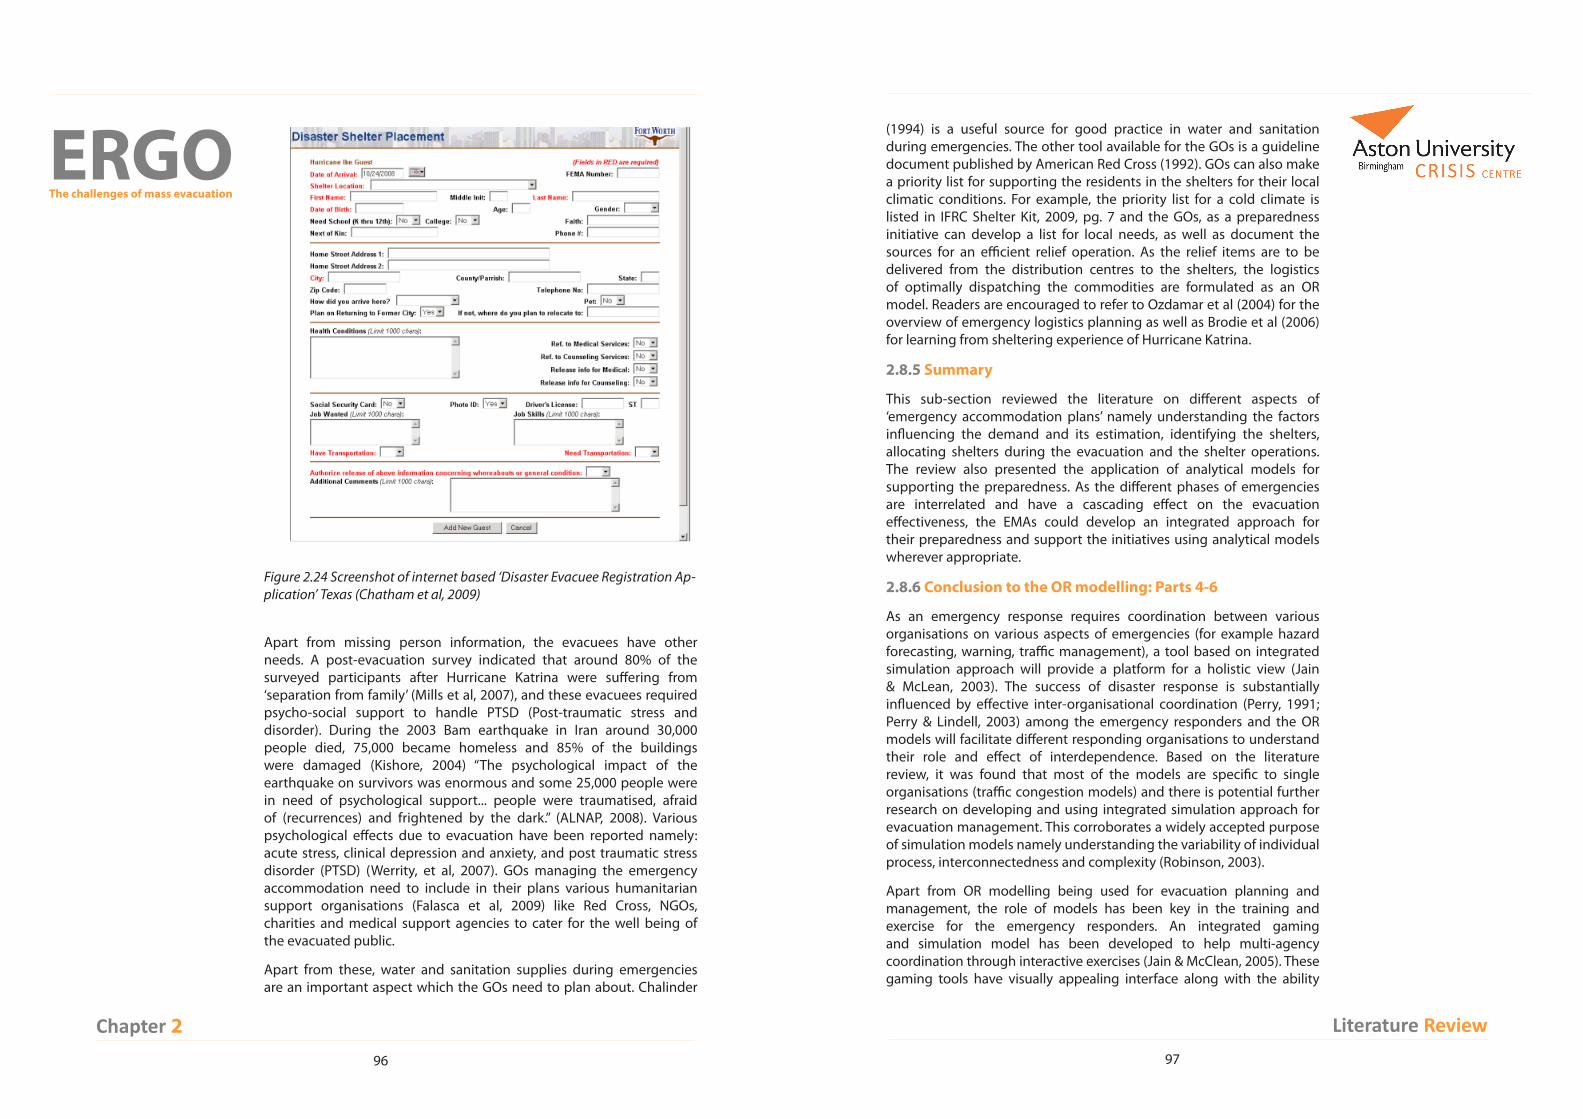
ERGOThe challenges of mass evacuation
96
Chapter 297
Literature Review
(1994) is a useful source for good practice in water and sanitation during emergencies. The other tool available for the GOs is a guideline document published by American Red Cross (1992). GOs can also make a priority list for supporting the residents in the shelters for their local climatic conditions. For example, the priority list for a cold climate is listed in IFRC Shelter Kit, 2009, pg. 7 and the GOs, as a preparedness initiative can develop a list for local needs, as well as document the sources for an efficient relief operation. As the relief items are to be delivered from the distribution centres to the shelters, the logistics of optimally dispatching the commodities are formulated as an OR model. Readers are encouraged to refer to Ozdamar et al (2004) for the overview of emergency logistics planning as well as Brodie et al (2006) for learning from sheltering experience of Hurricane Katrina.
2.8.5 Summary
This sub-section reviewed the literature on different aspects of ‘emergency accommodation plans’ namely understanding the factors influencing the demand and its estimation, identifying the shelters, allocating shelters during the evacuation and the shelter operations. The review also presented the application of analytical models for supporting the preparedness. As the different phases of emergencies are interrelated and have a cascading effect on the evacuation effectiveness, the EMAs could develop an integrated approach for their preparedness and support the initiatives using analytical models wherever appropriate.
2.8.6 Conclusion to the OR modelling: Parts 4-6
As an emergency response requires coordination between various organisations on various aspects of emergencies (for example hazard forecasting, warning, traffic management), a tool based on integrated simulation approach will provide a platform for a holistic view (Jain & McLean, 2003). The success of disaster response is substantially influenced by effective inter-organisational coordination (Perry, 1991; Perry & Lindell, 2003) among the emergency responders and the OR models will facilitate different responding organisations to understand their role and effect of interdependence. Based on the literature review, it was found that most of the models are specific to single organisations (traffic congestion models) and there is potential further research on developing and using integrated simulation approach for evacuation management. This corroborates a widely accepted purpose of simulation models namely understanding the variability of individual process, interconnectedness and complexity (Robinson, 2003).
Apart from OR modelling being used for evacuation planning and management, the role of models has been key in the training and exercise for the emergency responders. An integrated gaming and simulation model has been developed to help multi-agency coordination through interactive exercises (Jain & McClean, 2005). These gaming tools have visually appealing interface along with the ability
Apart from missing person information, the evacuees have other needs. A post-evacuation survey indicated that around 80% of the surveyed participants after Hurricane Katrina were suffering from ‘separation from family’ (Mills et al, 2007), and these evacuees required psycho-social support to handle PTSD (Post-traumatic stress and disorder). During the 2003 Bam earthquake in Iran around 30,000 people died, 75,000 became homeless and 85% of the buildings were damaged (Kishore, 2004) “The psychological impact of the earthquake on survivors was enormous and some 25,000 people were in need of psychological support... people were traumatised, afraid of (recurrences) and frightened by the dark.” (ALNAP, 2008). Various psychological effects due to evacuation have been reported namely: acute stress, clinical depression and anxiety, and post traumatic stress disorder (PTSD) (Werrity, et al, 2007). GOs managing the emergency accommodation need to include in their plans various humanitarian support organisations (Falasca et al, 2009) like Red Cross, NGOs, charities and medical support agencies to cater for the well being of the evacuated public.
Apart from these, water and sanitation supplies during emergencies are an important aspect which the GOs need to plan about. Chalinder
Figure 2.24 Screenshot of internet based ‘Disaster Evacuee Registration Ap-plication’ Texas (Chatham et al, 2009)

ERGOThe challenges of mass evacuation
98
Chapter 2
for multiple users to simultaneously interact with the system. Models require formal training in usage, customization to the evacuation area and enhancement with change in circumstance and policies. The models are not intended to replace the role of practitioners and their diverse experience in responding to emergencies, instead the models support their evacuation plans by acting as an experimentation platform. By involving experienced practitioners in various stages of model development could possibly reveal the knowledge held by individuals to be accessible to others.
2.9 ConclusionThis chapter has outlined the rationale behind the three main approaches used by the ERGO project: Social Marketing, Decision Theory, and computer modelling grounded in OR. Each section has surveyed existing literatures and techniques for these areas, and presented justification for using these particular approaches to address the challenges of mass evacuation.
The following chapter will examine how these approaches informed the methodology that was used to collect and interpret the information gathered during the project.

99
Key Points:Explains the methodology used to conduct the ERGO project•
Describes the qualitative and quantitative methods used to collect data•
Justifies the methodologies used for each section•
Considers the possible drawbacks to each method, and the techniques used to •overcome these problems
3.1 IntroductionAfter the literature review, the team collected data from the 10 ERGO countries to understand their approaches to mass evacuation planning. This chapter outlines the research methods used to collect data on evacuation and how the data were analysed. We used a mixed research methodology. Qualitative research methods developed an understanding of the “social world” (Snape and Spencer, 2003) through interviews, focus groups, and observations; while the quantitative research methods included questionnaires, surveys, and data analysis using statistical techniques (Kaplan and Duchon, 1988). The quantitative data and analysis provided techniques for systematically investigating a social phenomenon in terms of ‘measurements’ and their relationships in order to ‘describe, explain, predict, and/or control the phenomenon of interest’(NCREL, 2010). Our mixed method approach achieved “complementary extension” by using more than one form of evidence to understand an area (Snape and Spencer, 2003, p21-22).
Chapter 3 Research Methodology
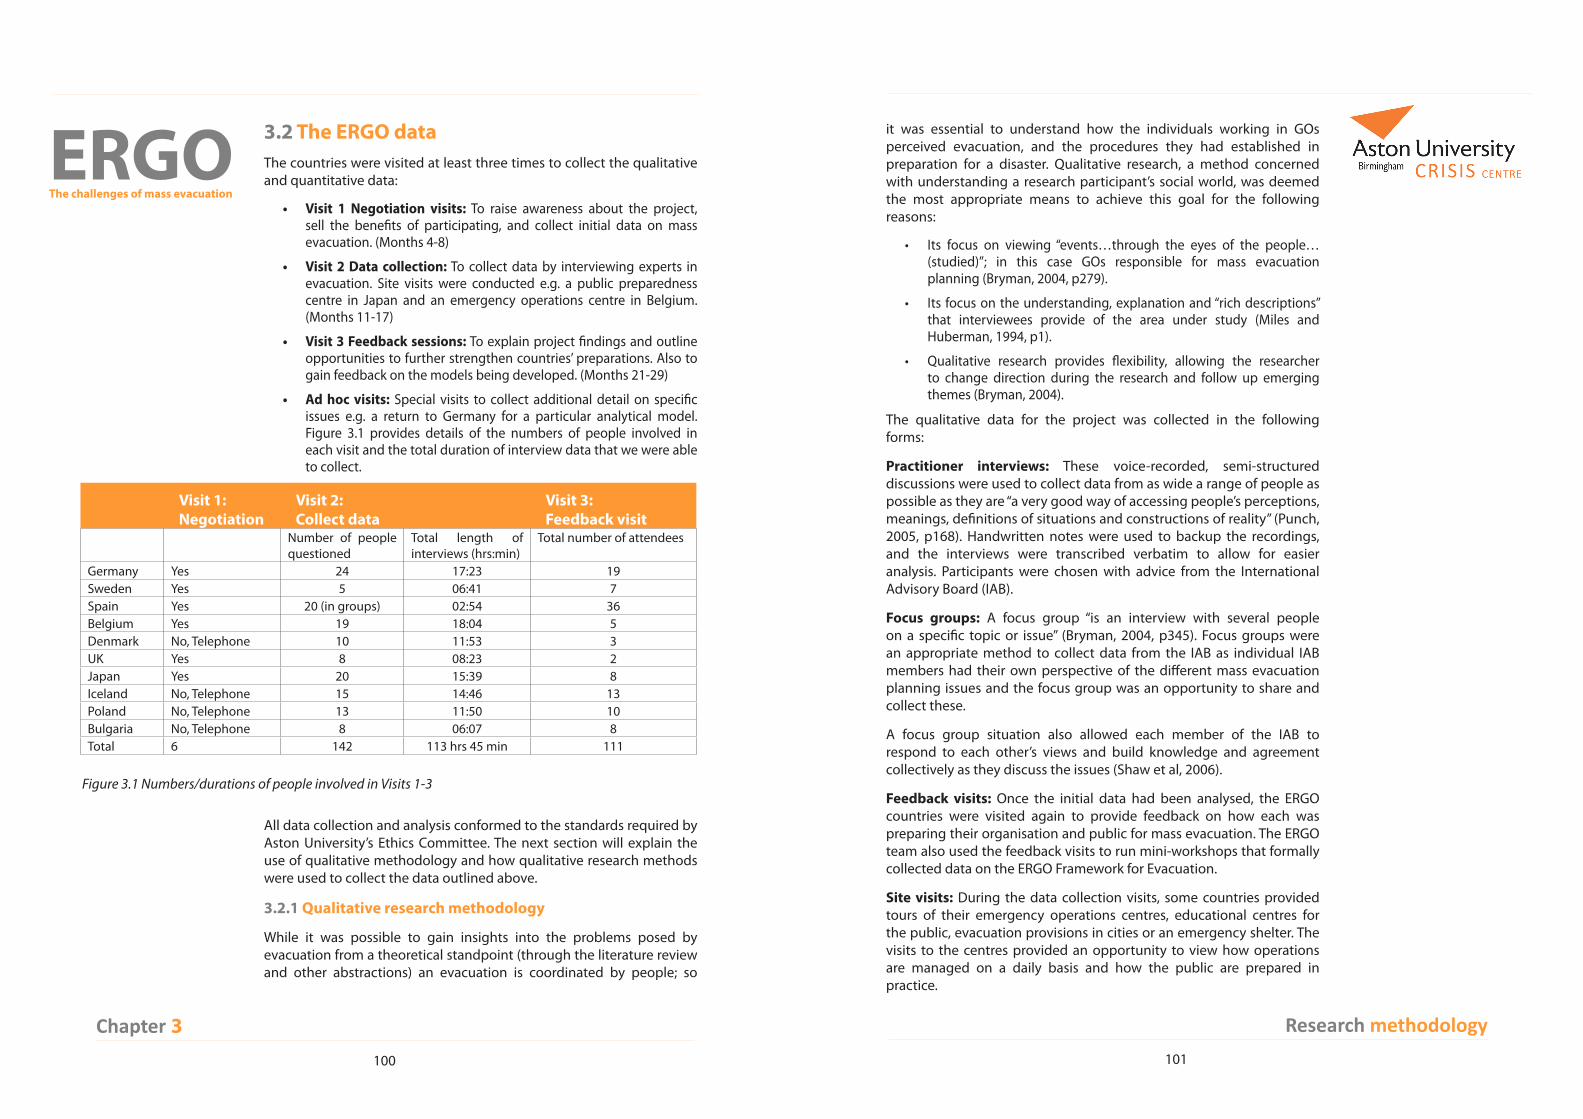
ERGOThe challenges of mass evacuation
100
Chapter 3101
Research methodology
it was essential to understand how the individuals working in GOs perceived evacuation, and the procedures they had established in preparation for a disaster. Qualitative research, a method concerned with understanding a research participant’s social world, was deemed the most appropriate means to achieve this goal for the following reasons:
Its focus on viewing “events…through the eyes of the people… •(studied)”; in this case GOs responsible for mass evacuation planning (Bryman, 2004, p279).
Its focus on the understanding, explanation and “rich descriptions” •that interviewees provide of the area under study (Miles and Huberman, 1994, p1).
Qualitative research provides flexibility, allowing the researcher •to change direction during the research and follow up emerging themes (Bryman, 2004).
The qualitative data for the project was collected in the following forms:
Practitioner interviews: These voice-recorded, semi-structured discussions were used to collect data from as wide a range of people as possible as they are “a very good way of accessing people’s perceptions, meanings, definitions of situations and constructions of reality” (Punch, 2005, p168). Handwritten notes were used to backup the recordings, and the interviews were transcribed verbatim to allow for easier analysis. Participants were chosen with advice from the International Advisory Board (IAB).
Focus groups: A focus group “is an interview with several people on a specific topic or issue” (Bryman, 2004, p345). Focus groups were an appropriate method to collect data from the IAB as individual IAB members had their own perspective of the different mass evacuation planning issues and the focus group was an opportunity to share and collect these.
A focus group situation also allowed each member of the IAB to respond to each other’s views and build knowledge and agreement collectively as they discuss the issues (Shaw et al, 2006).
Feedback visits: Once the initial data had been analysed, the ERGO countries were visited again to provide feedback on how each was preparing their organisation and public for mass evacuation. The ERGO team also used the feedback visits to run mini-workshops that formally collected data on the ERGO Framework for Evacuation.
Site visits: During the data collection visits, some countries provided tours of their emergency operations centres, educational centres for the public, evacuation provisions in cities or an emergency shelter. The visits to the centres provided an opportunity to view how operations are managed on a daily basis and how the public are prepared in practice.
3.2 The ERGO data The countries were visited at least three times to collect the qualitative and quantitative data:
Visit 1 Negotiation visits:• To raise awareness about the project, sell the benefits of participating, and collect initial data on mass evacuation. (Months 4-8)
Visit 2 Data collection:• To collect data by interviewing experts in evacuation. Site visits were conducted e.g. a public preparedness centre in Japan and an emergency operations centre in Belgium. (Months 11-17)
Visit 3 Feedback sessions:• To explain project findings and outline opportunities to further strengthen countries’ preparations. Also to gain feedback on the models being developed. (Months 21-29)
Ad hoc visits:• Special visits to collect additional detail on specific issues e.g. a return to Germany for a particular analytical model. Figure 3.1 provides details of the numbers of people involved in each visit and the total duration of interview data that we were able to collect.
All data collection and analysis conformed to the standards required by Aston University’s Ethics Committee. The next section will explain the use of qualitative methodology and how qualitative research methods were used to collect the data outlined above.
3.2.1 Qualitative research methodology
While it was possible to gain insights into the problems posed by evacuation from a theoretical standpoint (through the literature review and other abstractions) an evacuation is coordinated by people; so
Visit 1: Negotiation
Visit 2: Collect data
Visit 3: Feedback visit
Number of people questioned
Total length of interviews (hrs:min)
Total number of attendees
Germany Yes 24 17:23 19Sweden Yes 5 06:41 7Spain Yes 20 (in groups) 02:54 36Belgium Yes 19 18:04 5Denmark No, Telephone 10 11:53 3UK Yes 8 08:23 2Japan Yes 20 15:39 8Iceland No, Telephone 15 14:46 13Poland No, Telephone 13 11:50 10Bulgaria No, Telephone 8 06:07 8Total 6 142 113 hrs 45 min 111
Figure 3.1 Numbers/durations of people involved in Visits 1-3

ERGOThe challenges of mass evacuation
102
Chapter 3103
Research methodology
identify quantitative variables for modelling evacuation preparedness. For example, during the interviews it was found that the GOs in one country believed that ~40% of evacuees will use public transport and others will self-evacuate in cars. This quantitative data helped to identify the concept of a ‘transport usage (%)’ variable as well as a representative value for it. The variables and their interrelationships were identified for each phase of the evacuation and will be elaborated on in Chapters 7 and 8.
Quantitative data were collected from a wide range of different sources. Often estimates for values varied widely and so descriptive statistics (e.g. mean and standard deviation) were used to reflect the variation. Additional quantitative data for specific models in Parts 3-6 were gathered in follow-up visits to specific countries.
The main sources of quantitative data included:
The individual interviews:• In addition to the interviews being used to capture qualitative data, they were also used to capture quantitative data that represented the subjective belief of individuals. For each part of the ERGO Framework for Evacuation, the interview transcripts were analysed to identify the breadth of quantitative assessments that were made e.g. on issues such as the evacuee behaviour, EMA response factors, hazard/risk-based information.
Evacuation plans:• The sequence of events in the evacuation plan (e.g. warning dissemination phases) is another important data source. This data can form a ‘process map’ for individual parts of the evacuation. A process map is a ‘diagrammatic representation of a process in order to provide better understanding’ (Greasley, 2004, p.52) of the system under study. Our process map was built with the quantitative data from various sources and was used in developing models of the evacuation process.
Advisory Board:• Demonstration of the model prototypes with IAB members provided additional insights and an opportunity to gain quantitative values.
One-to-one review with practitioners:• Senior practitioners were consulted to review the models in depth and this provided more data to develop the model.
Academic peer reviews:• Academics seminars, conferences and presentations at international events were opportunities to present the models and ensure academic feedback built added rigour to the research.
Literature:• Published literature (academic and practitioner), post-disaster reports, pre-disaster studies and evacuation manuals form an important data source for identifying the variables as well as representative values to support the evacuation modelling.
Feedback visits and Masterclasses:• Models were demonstrated to the ERGO countries during the feedback visits and presented to
Documents: Documents such as newspapers, magazines and letters can be used as qualitative data (Robson, 2002). During country visits, the ERGO team were provided with a range of documents including emergency plans, hazard maps, communications materials that are distributed to the public and interviewees’ presentation slides.
Training sessions and exercises: The ERGO team participated in training sessions, such as Evacuation Warden training. These provided insights into preparation for mass evacuation. The team were also invited to witness exercises demonstrating how the British Army would plan for and respond to different scenarios.
3.2.2 Quantitative Methodology
Quantitative research methods investigate a social phenomenon through measurement, and in this case measurement of the evacuation process (e.g. how long it takes evacuees to receive a warning message, the travel time required to evacuate, the impact of weather conditions on the resource allocation). The measures involve ‘variables’ and ‘relationships’ between those variables which describe the evacuation process.
These variables fed into mathematical models for Parts 3-6:
Part 3 analyses the evacuation decision. •
Part 4 simulates disseminating the warning message. •
Part 5 simulates evacuee transportation. •
Part 6 models shelter management. •
These quantitative models analyse the evacuation challenge and the operational targets that GOs set. As an example of targets, the Shearon Harris Nuclear Plant Board aimed to notify 100% of the population (‘notification target’) within 5 miles (‘warning priority zone’) surrounding the plant within 15 minutes (‘warning time target’) (Sorensen, 1992).
Quantitative models can provide results that support emergency planning e.g. analysts can investigate the flood risk by analysing historical weather data, topography, infrastructure, etc. However, the models simplify the complexity in order to understand it.
The ‘variables’ discussed above can be further classified as ‘independent variables’ and ‘dependent variables’. For example, the choice of evacuee transportation in transport management represents an independent variable (e.g. using cars) that will influence the total evacuation time, a dependent variable. These variables form the basic unit of building quantitative models based on the relationship between dependent variables (e.g. evacuation time) being influenced by independent variables (e.g. choice of transport). Models are used to understand the variation of the independent variable and its effect on the dependent variable. The ERGO interviews as well as the literature were used to

ERGOThe challenges of mass evacuation
104
Chapter 3105
Research methodology
public preparedness for mass evacuation, as advocated by Miles and Huberman (1994, p58). How the provisional codes were developed is outlined below:
Developing the initial “start list” of public preparedness codes 1.
The “start list” of codes was developed by reviewing the ERGO project proposal, the areas of literature identified in Chapter 2, any notes/documents that had been collected during the research (e.g. from negotiation visits and the IAB). Details of how each of these sources of information was used to develop the public preparedness codes include:
Project proposal:• Research Question two of the ERGO project proposal is concerned with the preparedness of the public which led to the creation of a “master code” entitled ‘Public Preparedness’ (Miles and Huberman, 1994, p58). Under this master code a series of subcodes all covering public preparedness were developed using information from the project proposal. For example, a subcode entitled PP-MEA (Public Preparedness – MEAsure) was created due to a question in the proposal being “How can we measure public preparedness?” For each subcode created, the team developed a brief definition and an expanded definition. The following are examples of a public preparedness master code, subcode and definitions that were included in the coding framework.
The academic literature:• Two areas of literature were used to develop public preparedness codes: the existing public preparedness literature and Social Marketing literature (see Chapter 2). The public preparedness literature covers how different areas of communications can be used to influence the public to prepare for mass evacuation. A master code of “Public Communications” was created to identify how countries use communications to prepare their public for mass evacuation. Six further subcodes were created that relate to the existing public preparedness literature outlined in the literature review.
Initial research:• Handwritten interview notes and informal discussions identified additional relevant areas that had not been included in the coding framework. Thus, further codes were included e.g. during negotiation
Master code: Public Preparedness (PP).
Subcode: PP-CAM.
Subcode Definition: Public Preparedness Campaigns.
Subcode Expanded Definition: Any activities by government or organisations to prepare/inform the public about mass evacuation.
emergency management practitioners in Masterclass sessions, with feedback received from both audiences. These helped in collecting more quantitative values, validating the model and validating its applicability with the GOs present in the meetings.
Survey data: • Data from surveys form an important source of insight for evacuation preparedness. ERGO countries were asked to provide survey results that they had used for evacuation planning and the research team used this to identify the generalisable planning aspects and findings.
These events were used to collect data and validate the prototype mathematical models that were being developed to ensure methodological rigour, and also as an opportunity to input data.
Quantitative data has been used predominantly in Models 3-6. Qualitative and quantitative methods each have roles to play in informing models that can support emergency planners in GOs. In ERGO, they have been combined in different phases of the ERGO Framework for Evacuation to better understand the evacuation process, identify quantitative values to measure variables, and allow the development of models that can analyse the process of evacuation. We will now examine the methodology used to create the Framework for Evacuation step-by-step.
3.3 Part 1: Preparing the public for evacuation3.3.1 Introduction
This section outlines the techniques used to generate the findings on how the 10 ERGO countries prepare their public for mass evacuation (Part 1). The actual results of the analysis will be presented in Chapter 5; this chapter presents the techniques used to ensure that those findings were of high quality.
To understand how ERGO countries prepare their public for mass evacuation, the interview transcripts were analysed through three activities: “data reduction, data display, and conclusion drawing/verification” (Miles and Huberman, 1994, p10). Information on how this data was analysed is presented below, starting with how the data was reduced.
3.3.2 Analysing the qualitative data
Data reduction is the process of analysing raw data and understanding the general messages it contains – attempting to reduce it to a more manageable set. Data can be reduced through “the process of selecting, focusing, simplifying, abstracting, and transforming the data that appears in written-up field notes or transcriptions” (Miles and Huberman, 1994, p10). Thus, both the handwritten notes and interview transcripts were analysed in this way.
The first step was to develop a “provisional ‘start list’ of codes” covering

ERGOThe challenges of mass evacuation
106
Chapter 3107
Research methodology
Revising and applying the codes2.
The “start list” of codes was revised during the process of applying them to the transcripts. The team used a process of “check-coding” to ensure there was a consensus on the meaning of codes (Miles and Huberman, 1994). Check-coding is where two or more coders code the same transcript and then meet to discuss how they had each coded the transcript and any difficulties or differences in their coding. This process led to the addition of new codes and the redefinition of some existing codes. Check-coding was carried out for approximately 20% of transcripts to ensure that there was high reliability in how different coders coded the same piece of data.
Once a satisfactory reliability of the check coding had been achieved (78%), the coders used the framework to code all transcripts. Coding all transcripts helped to reduce the data and gain understanding on how countries are preparing their public. The next stage of data analysis involved creating “data displays” (Miles and Huberman, 1994).
Data Displays 3.
The development of “data displays” is an analytical technique to help to draw “descriptive conclusions” on how countries prepare their public (Miles and Huberman, 1994, p90). A display is “a visual format that presents information systematically, so the user can draw valid conclusions and take needed actions” (Miles and Huberman, 1994, p91). Creating a display for coded data enabled the team to: (1) identify how each country is preparing their public; (2) make comparisons on public preparedness strategies between countries.
Two data displays were produced to analyse the coded data. Both were “conceptually ordered displays” whereby the data was ordered by the themes that had been generated through the coding process (Miles and Huberman, 1994, p127). The first was produced for each country. Each row of information on the display provided the name of the theme (e.g. risk perception), the reference to a source (e.g. an interviewee), and the data covering what had been said (e.g. a quotation). Figure 3.3 provides an example of one row taken from the first display to be created.
Theme Interviewee DataRisk perception Interviewee 21, Country 9 “And, they are newcomers so they don’t
know the risk of this community, and they never respond at the time of the event...”
Figure 3.3 An example taken from the data displays
visits the public’s risk perception was discussed. A subcode of R:PUB (Risk: PUBlic) was created to account for this category.
Figure 3.2 outlines the “start list” of public preparedness codes that were developed to analyse the transcripts to identify how the ERGO countries are preparing their public for mass evacuation. After developing this initial “start list”, the next stage was to revise the codes; this is outlined below.
Master code and Subcodes DefinitionPUBLIC PREPAREDNESS PPPP-CAM Public Preparedness CampaignsPP-EXA Public Preparedness ExamplesPP-MEA Measurements of Public PreparednessPP-SUG Suggestions for futurePUBLIC COMMUNICATIONS PCPC-SOU SourcePC-MES MessagesPC-SIG SignalPC-TAR Target audiencePC-FED FeedbackPC-NOI NoiseEVIDENCE OF SOCIAL MARKETING SMSM-BEH Behavioural change goalsSM-AUD Audience researchSM-SEG Audience segmentationSM-EXC ExchangeSM-PRO ProductSM-PRI PriceSM-PLA Place SM-PRO PromotionSM-COM CompetitionRISK R R:PUB Public perception
Figure 3.2 The “start list” of master codes, subcodes and their brief definitions for public preparedness.

ERGOThe challenges of mass evacuation
108
Chapter 3109
Research methodology
Making contrasts and comparisons:• The coding of the data and the different data displays were used to compare and contrast the countries’ approaches to preparing the public for mass evacuation. This highlighted the differences in approaches the countries are taking to prepare their public.
Subsuming particulars into the general:• This data analysis activity is concerned with asking “What is this specific thing an instance of? Does it belong to a more general class?” (Miles and Huberman, 1994, p255).
Once the team had drawn conclusions from the data analysis, they had to test and verify the findings.
Verifying the conclusions of the data analysis is concerned with the reliability and validity of the research. The ways in which the conclusions of the data analysis were verified, as proposed by Miles and Huberman (1994), include:
Representativeness:• No limits were placed on the type/number of representatives of GOs who were interviewed in each country. Any individual who had information about the preparations for evacuation was eligible to be interviewed.
Researcher effects: • The ERGO team have had prolonged contact with each ERGO country over a period of up to 3 years and have collected a vast amount of information to supplement the interviews. As outlined above, discussions amongst the ERGO team were used to reduce individual researcher bias (Robson, 2002).
Triangulation:• Triangulation is where different methods and sources are used to validate the findings of a study (Ritchie, 2003). In this study, a range of different methods of data collection (i.e. qualitative and quantitative methods) and sources of data (i.e. interviewees working in different roles , documents, plans and models) were used to collect data.
Collecting feedback:• Feedback was received from the IAB throughout the ERGO project and from emergency management representatives during the feedback visits.
This section has demonstrated how the data collected from the ERGO countries has been analysed to generate the findings outlined in Chapter 5. The next section will outline the data analysis techniques that were used to develop the findings on Part 2 of the ERGO Framework for Evacuation (understanding the evacuation zone).
Displaying the data as above for each country allowed the team to understand the interview data relating to each of the different themes.
To compare the data across countries more easily, a second data display was created (see Figure 3.4). This display included the 10 countries across the top row and the different themes and sub-themes in the left hand column. If the country’s first data display (Figure 3.3) indicated that they considered a specific theme to prepare their public, it was marked with an X in the second data display (Figure 3.4). For example, Figure 3.4 illustrates that countries 1-7 are considering 3 different types of audience segmentation whereas country 10 is considering no types of audience segmentation. Developing the second data display enabled the team to quickly identify the themes that each country is and is not considering. For more detailed information on a particular theme, a member of the team could then refer back to each of the countries individual data displays.
These stages of analysis resulted in reduced data and a deeper understanding of how countries are preparing their public for mass evacuation.
Drawing and verifying conclusions4.
To draw conclusions from the coding and data displays, further analysis involved:
Noting patterns and themes:• By coding the data and developing the data displays, the team identified “recurring patterns, themes … which pull together many separate pieces of data” (Miles and Huberman, 1994, p246).
Grouping themes:• The existing theory and data analysis were used to group themes that have similar characteristics with the aim of understanding particular themes better (Miles and Huberman, 1994).
Partitioning codes:• This is where codes are reconsidered and split up if they contain two issues that should be coded separately. For example, the code “Social Marketing – Promotion” (SM-PRO) was split into two further codes as it covered both the messages and the communications channels that are used to prepare the public. After the coding of the first few transcripts, it became apparent that there was a need to code these two areas separately.
Country: 1 2 3 4 5 6 7 8 9 10
Theme: Audience Segmentation based on
Language x x x x x x x Geographic Area x x x x x x x x Community Groups x x x x x x x x x
Figure 3.4 An example taken from the data display produced for comparison purposes

ERGOThe challenges of mass evacuation
110
Chapter 3111
Research methodology
and the additional visits to ERGO countries. The findings from this analysis are outlined in Chapter 6.
3.5 Part 3: Making the evacuation decision Decision Theory uses both qualitative and quantitative information to build decision models. The first section below discusses the way in which the interview and focus group data were used within a Decision Theory model. The second section discusses the use of quantitative data that was mostly gathered during follow-up meetings with expert practitioners in ERGO countries as well as from historical data.
3.5.1 Qualitative Decision Theory methodology
How Decision Theory used the interview and focus group data is explained in terms of:
Developing our understanding of the evacuation objective.•
Developing our understanding of the evacuation uncertainty. •
Developing the qualitative influence diagram to represent the •objective and the uncertainty.
Verifying the objective and the uncertainty surrounding the •situation.
Evacuation objective development: The first analysis of interview codes developed broad categories which, whilst useful, are not as specific as those needed for Decision Theory. Thus, the analysis continued to identify measurable factors to represent objectives. These measurable factors built a quantitative understanding of how uncertain factors affect evacuation objectives.
The elicitation of objectives and uncertainties in Decision Theory has been outlined by many authors (Clemen, 2001; Keeney & Robin, 1994). Bond (2008) found that it is difficult for individuals to identify all objectives that underlie the problems they face. They may, for example, concentrate on evacuation in a very broad way without considering the particular difficulties facing different sections within the population. To overcome the challenge of an incomplete objective list, our interviews included qualitative aids for developing objectives (Baron, 1997). These included questions that probed individuals about their objectives and worksheets that identified particular priorities. A master list of objectives was then developed by combining the individual objective lists from a range of interviewees into a single list that was distributed to all for verification (Kerr & Tindale, 2004). This ensured that a complete list of evacuation objectives had been captured.
The initial master list of objectives was built on regional information, physical models, decisions and risk categories in the coding scheme. This information provided the context for the evacuation decision and the objectives. These parts of the master list were then verified during feedback sessions, IAB meetings and additional interviews on specific case-study scenarios.
3.4 Part 2: Understanding the evacuation zoneERGO’s approach to the analysis of spatial data was to create an inventory of the uses of spatial data and the quality of that data. The zone information collected from ERGO countries was analysed to identify ways in which spatial data is used and manipulated to support evacuation planning. A secondary goal of the analysis was to verify the quality of the spatial data that is being used by the countries.
3.4.1 Spatial data uses
The development of the coding scheme for qualitative data for Part 2 followed the same process as for its development for Part 1 (see Figure 3.2). The finalised coding scheme for Part 2 was applied to the interview transcripts to identify how spatial data is used for evacuation planning.
Beyond interview transcripts, information on spatial data uses was collected during site visits; for example, demonstrations of the information technologies and computer models were received during these visits which gave insight to the use of spatial data. Also, informal discussions with GIS practitioners provided insight into the ways in which spatial data is used to support evacuation decisions.
The final source of information for spatial data use is the additional workshops that were performed in Germany, Belgium and Iceland. Within Germany, additional interviews were held with GIS and environmental experts to further gather and determine the specific uses of spatial data (similarly for Belgium and Iceland). These interviews differed from the initial data-gathering visits due to the specificity of the visit.
The information gathered gave insight into practical methods of using spatial data to support evacuation planning and response. The wide range of emergency scenarios that have been analysed allows a multi-hazard assessment of spatial data that can be used by any country to help support their own planning.
3.4.2 Spatial Data Quality
Van Oort (2005) provides a framework that is useful to assess the quality of spatial data for emergency practitioners. This framework includes the following four criteria to assess spatial data quality (SDQ):
A single location for the spatial data1.
Ability to effectively merge spatial data from various sources2.
Processes to facilitate understanding of spatial data3.
The quality of geographic placement for desired elements.4.
Each of these elements was examined through the interview coding scheme, the specific interviews with GIS and environmental officials,

ERGOThe challenges of mass evacuation
112
Chapter 3113
Research methodology
The four outcomes represent possible future states following the resolution of the uncertainty (hit/miss) and the action taken by the emergency manager (evacuate or not). The emergency manager also has a set of preferences for each possible outcome – perhaps as simple as ordering the possible outcomes – or as sophisticated as a utility model (utility is similar to desirability but represents a hypothetical unit of preference measurement which will be explained below). Decision Theory uses probability mathematics to analyse which action is most desirable for the DM. Figure 3.6 indicates the variables that we have thus far identified along with a mathematical notation for each utility.
Given the above notation, the desirability (utility) of each action taken by the DM is shown in Equations 3.1 & 3.2 (adapted from Dekay et al. 2002).
Evacuate=U(TP)* p(Hit)+ U(FN)* p(Miss) (3.1)
Do not Evacuate=U(FP)* p(Hit)+ U(TN)* p(Miss) (3.2)
Equations 3.1 & 3.2 represent the total utility for an evacuation action as the sum of the possible outcomes multiplied by its probability of occurring. The mathematical model of DM preferences is based on the assumptions, or axioms of decision theory presented in Chapter 2. This mathematical model does not represent the way that a DM makes an evacuation decision – it is only a framework that results in logical recommendations. In this case, Decision Theory advises that the optimal action to be taken by the emergency manager is the option that maximizes utility. The maximization of utility for a decision problem such as this only represents one rule that could be used to choose between alternatives.
In practical terms it may be possible to use a common unit to represent the desirability of any outcome. Money, for example, often represents a substitute variable when analysing both uncertain outcomes and multiple objectives. Depending on the exact objective identified by a decision maker it can be impossible to evaluate a common measure to compare one criterion with another. This is true for evacuation decision-making where a DM may not feel comfortable saying that they are willing to have a loss of life if they can avoid 2 million Euros worth
Figure 3.6 Variables to include in the mathematical model of utility
Mathematical Notation Definitionp(Hit) Probability of the hazard/risk occurringp(Miss) Probability of the hazard/risk not occurringU(TP) Utility of a true positive outcomeU(FP) Utility of a false positive outcomeU(FN) Utility of a false negative outcomeU(TN) Utility of a true negative outcome
Evacuation uncertainty development: Once a master list of objectives was identified, these were connected with the uncertain elements that influence evacuation decisions. The identification of uncertainty includes factors that cannot be directly controlled by the DM (e.g. the weather) or represent factors that are dynamic and can be influenced indirectly by the DM (e.g. population in at-risk zone, engineering defences for hazards). This information was gathered by asking interviewees about specific pieces of information that they needed in order to make the evacuation decision. Once again, uncertainties arose from the regional information, physical model, decision, and risk sections of the codes.
Influence diagram development: The objectives and uncertainties can be represented in an influence diagram (ID) (see Chapter 2). The ID adds detail on how these uncertainties affect objectives and verifies the DMs’ understanding of the evacuation decision making process - making explicit how each piece of information affects their decision.
Objective/uncertainty verification: Throughout all data gathering activities, constant verification of the decision model with experts was important. This was done through additional visits to ERGO countries as well as consultation with the IAB and its Chairman. This verification aimed to understand/resolve differences between interviewees’ views on objectives, uncertainties and their relationship.
3.5.2 Quantitative Decision Theory methodology
How Decision Theory used the quantitative data is explained in terms of:
Quantitative evacuation decisions and representing this through •mathematical equations.
Developing the quantitative influence diagram to represent the •objective and the uncertainty.
The outputs from quantitative Decision Theory.•
Basic quantitative evacuation decision: To illustrate the method that quantitative Decision Theory takes to answer the evacuation decision, a basic example will be used. In this example an emergency manager has a known probability that a hazardous event will occur in an area (Hit/Miss). The DM’s options are to call an evacuation or not. Thus, four outcomes are possible (Figure 3.5).
Figure 3.5 Possible outcomes from a simple evacuation decision
Action
Outcome Evacuate Don’t EvacuateHit True Positive False PositiveMiss False Negative True Negative
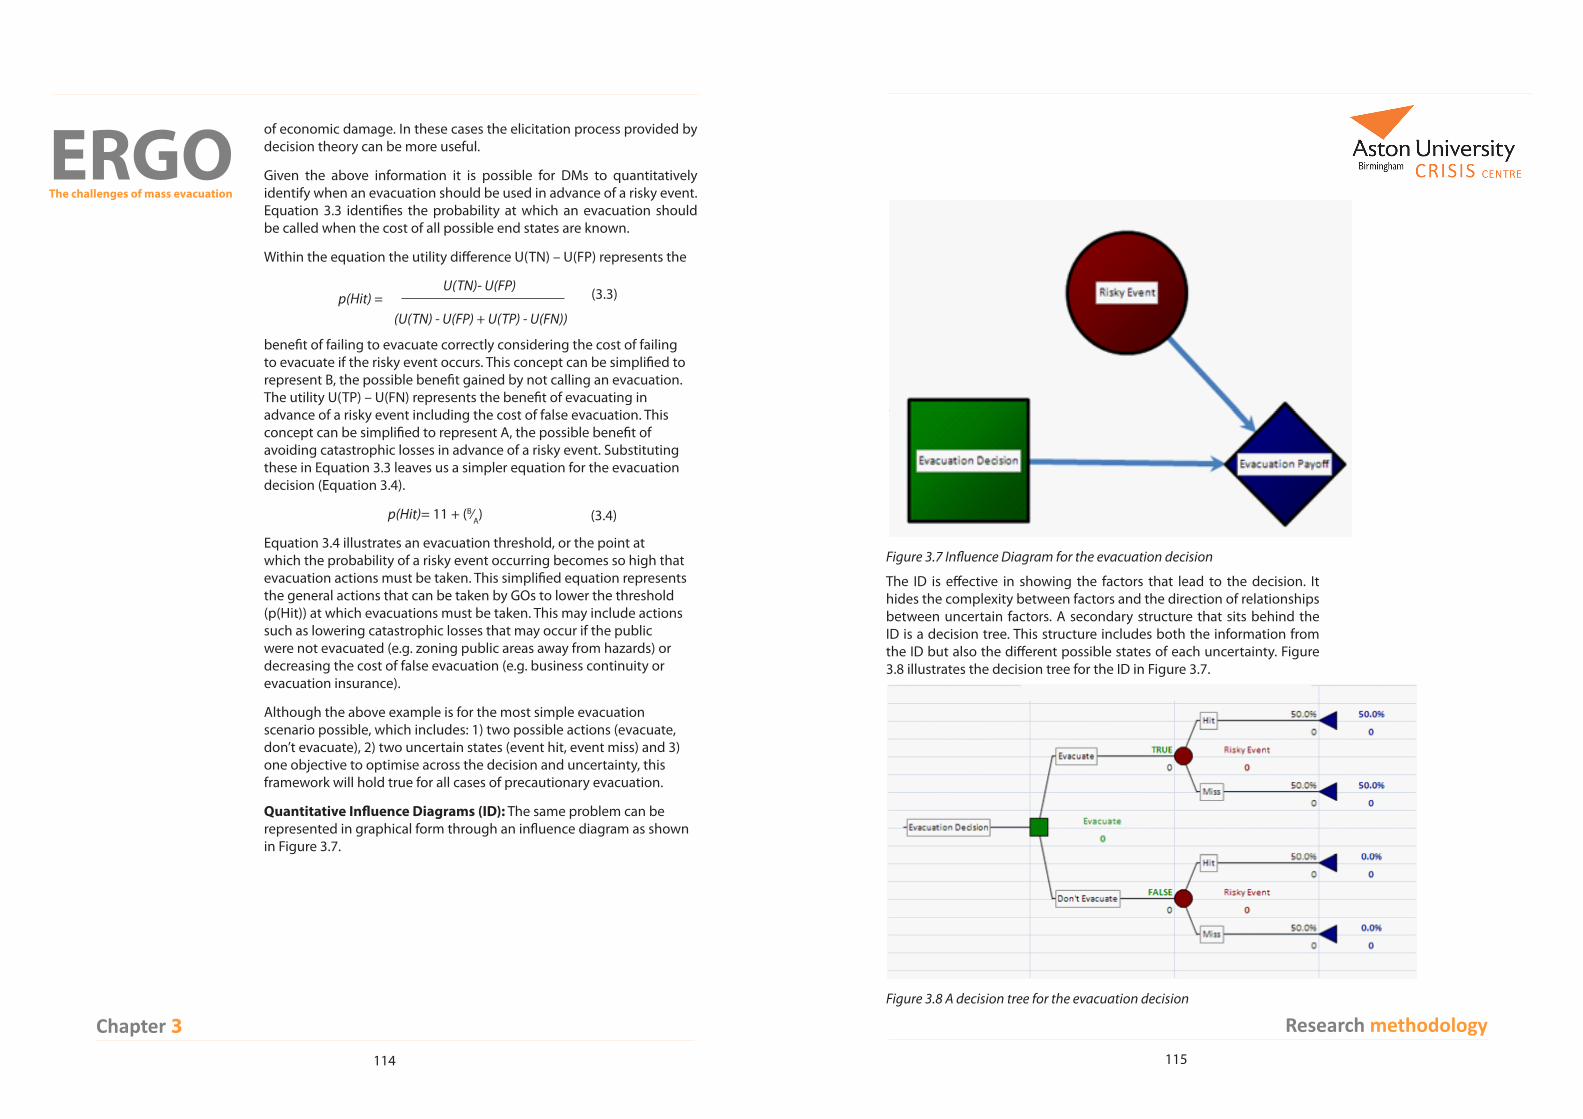
ERGOThe challenges of mass evacuation
114
Chapter 3115
Research methodology
The ID is effective in showing the factors that lead to the decision. It hides the complexity between factors and the direction of relationships between uncertain factors. A secondary structure that sits behind the ID is a decision tree. This structure includes both the information from the ID but also the different possible states of each uncertainty. Figure 3.8 illustrates the decision tree for the ID in Figure 3.7.
Figure 3.7 Influence Diagram for the evacuation decision
Figure 3.8 A decision tree for the evacuation decision
of economic damage. In these cases the elicitation process provided by decision theory can be more useful.
Given the above information it is possible for DMs to quantitatively identify when an evacuation should be used in advance of a risky event. Equation 3.3 identifies the probability at which an evacuation should be called when the cost of all possible end states are known.
Within the equation the utility difference U(TN) – U(FP) represents the
benefit of failing to evacuate correctly considering the cost of failing to evacuate if the risky event occurs. This concept can be simplified to represent B, the possible benefit gained by not calling an evacuation. The utility U(TP) – U(FN) represents the benefit of evacuating in advance of a risky event including the cost of false evacuation. This concept can be simplified to represent A, the possible benefit of avoiding catastrophic losses in advance of a risky event. Substituting these in Equation 3.3 leaves us a simpler equation for the evacuation decision (Equation 3.4).
p(Hit)= 11 + (B⁄A)
Equation 3.4 illustrates an evacuation threshold, or the point at which the probability of a risky event occurring becomes so high that evacuation actions must be taken. This simplified equation represents the general actions that can be taken by GOs to lower the threshold (p(Hit)) at which evacuations must be taken. This may include actions such as lowering catastrophic losses that may occur if the public were not evacuated (e.g. zoning public areas away from hazards) or decreasing the cost of false evacuation (e.g. business continuity or evacuation insurance).
Although the above example is for the most simple evacuation scenario possible, which includes: 1) two possible actions (evacuate, don’t evacuate), 2) two uncertain states (event hit, event miss) and 3) one objective to optimise across the decision and uncertainty, this framework will hold true for all cases of precautionary evacuation.
Quantitative Influence Diagrams (ID): The same problem can be represented in graphical form through an influence diagram as shown in Figure 3.7.
p(Hit) = U(TN)- U(FP)
(U(TN) - U(FP) + U(TP) - U(FN))
(3.3)
(3.4)
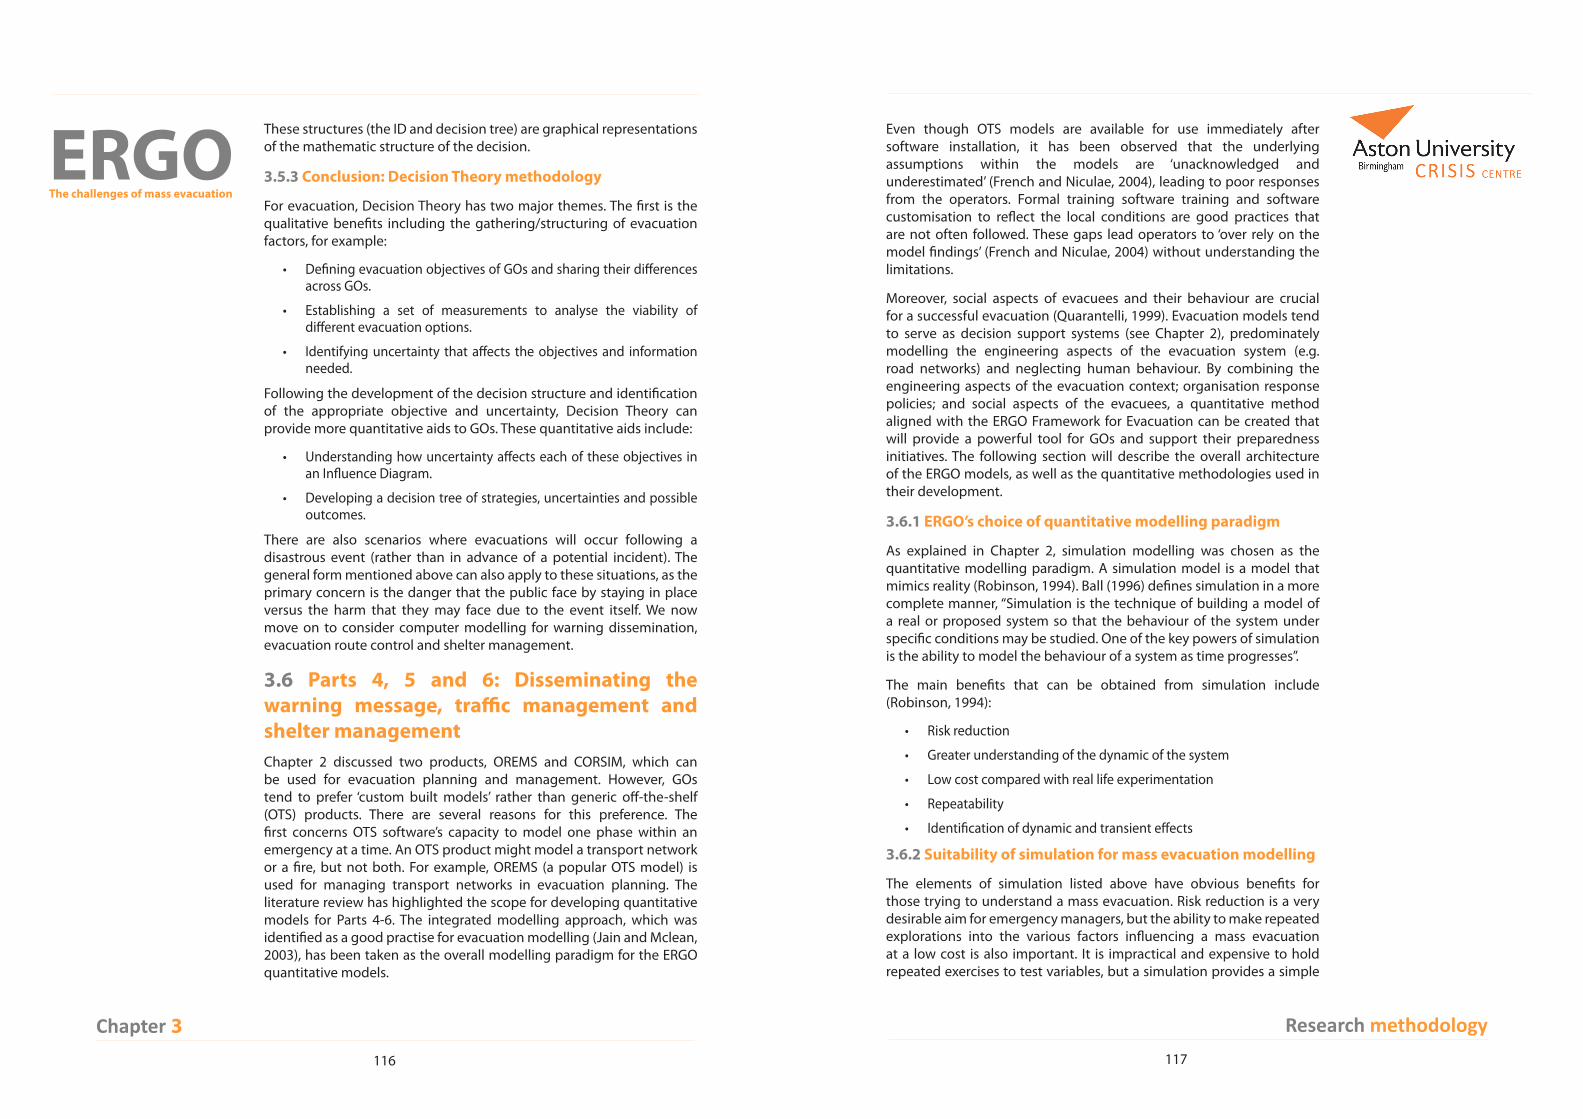
ERGOThe challenges of mass evacuation
116
Chapter 3117
Research methodology
Even though OTS models are available for use immediately after software installation, it has been observed that the underlying assumptions within the models are ‘unacknowledged and underestimated’ (French and Niculae, 2004), leading to poor responses from the operators. Formal training software training and software customisation to reflect the local conditions are good practices that are not often followed. These gaps lead operators to ‘over rely on the model findings’ (French and Niculae, 2004) without understanding the limitations.
Moreover, social aspects of evacuees and their behaviour are crucial for a successful evacuation (Quarantelli, 1999). Evacuation models tend to serve as decision support systems (see Chapter 2), predominately modelling the engineering aspects of the evacuation system (e.g. road networks) and neglecting human behaviour. By combining the engineering aspects of the evacuation context; organisation response policies; and social aspects of the evacuees, a quantitative method aligned with the ERGO Framework for Evacuation can be created that will provide a powerful tool for GOs and support their preparedness initiatives. The following section will describe the overall architecture of the ERGO models, as well as the quantitative methodologies used in their development.
3.6.1 ERGO’s choice of quantitative modelling paradigm
As explained in Chapter 2, simulation modelling was chosen as the quantitative modelling paradigm. A simulation model is a model that mimics reality (Robinson, 1994). Ball (1996) defines simulation in a more complete manner, “Simulation is the technique of building a model of a real or proposed system so that the behaviour of the system under specific conditions may be studied. One of the key powers of simulation is the ability to model the behaviour of a system as time progresses”.
The main benefits that can be obtained from simulation include (Robinson, 1994):
Risk reduction•
Greater understanding of the dynamic of the system•
Low cost compared with real life experimentation•
Repeatability•
Identification of dynamic and transient effects•
3.6.2 Suitability of simulation for mass evacuation modelling
The elements of simulation listed above have obvious benefits for those trying to understand a mass evacuation. Risk reduction is a very desirable aim for emergency managers, but the ability to make repeated explorations into the various factors influencing a mass evacuation at a low cost is also important. It is impractical and expensive to hold repeated exercises to test variables, but a simulation provides a simple
These structures (the ID and decision tree) are graphical representations of the mathematic structure of the decision.
3.5.3 Conclusion: Decision Theory methodology
For evacuation, Decision Theory has two major themes. The first is the qualitative benefits including the gathering/structuring of evacuation factors, for example:
Defining evacuation objectives of GOs and sharing their differences •across GOs.
Establishing a set of measurements to analyse the viability of •different evacuation options.
Identifying uncertainty that affects the objectives and information •needed.
Following the development of the decision structure and identification of the appropriate objective and uncertainty, Decision Theory can provide more quantitative aids to GOs. These quantitative aids include:
Understanding how uncertainty affects each of these objectives in •an Influence Diagram.
Developing a decision tree of strategies, uncertainties and possible •outcomes.
There are also scenarios where evacuations will occur following a disastrous event (rather than in advance of a potential incident). The general form mentioned above can also apply to these situations, as the primary concern is the danger that the public face by staying in place versus the harm that they may face due to the event itself. We now move on to consider computer modelling for warning dissemination, evacuation route control and shelter management.
3.6 Parts 4, 5 and 6: Disseminating the warning message, traffic management and shelter management Chapter 2 discussed two products, OREMS and CORSIM, which can be used for evacuation planning and management. However, GOs tend to prefer ‘custom built models’ rather than generic off-the-shelf (OTS) products. There are several reasons for this preference. The first concerns OTS software’s capacity to model one phase within an emergency at a time. An OTS product might model a transport network or a fire, but not both. For example, OREMS (a popular OTS model) is used for managing transport networks in evacuation planning. The literature review has highlighted the scope for developing quantitative models for Parts 4-6. The integrated modelling approach, which was identified as a good practise for evacuation modelling (Jain and Mclean, 2003), has been taken as the overall modelling paradigm for the ERGO quantitative models.

ERGOThe challenges of mass evacuation
118
Chapter 3119
Research methodology
Robinson (2004) describes three types of data when building simulation models:
Category A data:• Data that were already available. In particular, the literature from previous studies on warning dissemination. Examples of these data included the effectiveness of different channels at different times of the day.
Category B data:• Data collected during the interviews with emergency managers and with people who have been affected by evacuations. Examples of data collected in this way include the percentage of people who will use shelter, use of different channels for warning dissemination, availability of public transport, etc.
Category C data:• Data that is not available and cannot be collected. One example is the different policies across the ERGO countries for informal warning dissemination. Members of the International Advisory Board and other experts were used to estimate parameters that were closest to reality. In some cases, Category C data was used as an experimental factor, to see what the effect of using different values for that parameter would be on the response of the system.
There are three main inputs to the model:
Population and environmental information. •
Road network information was coded in the model as a separate •input layer using ‘points and arcs’, as used in network models
Category Examples
1. Evacuee information Details about population characteristics, disabilities, socio-economic status, additional languages and so on.
2. Environmental information Information about the type of hazard facing a community; the nature and extent of these hazards; and the areas affected (if known).
3. Warning channel details Details about the various warning channels available during evacuation; the preferred warning channel for an agency; and the effectiveness of each channel. These included sirens, and more advanced systems like mobile telephone alerts.
4. Transportation details Details about the existing road networks, evacuation routes, transport policies and evacuee behavioural choice of the means of transportation (e.g. Cars, buses etc.).
5. Emergency accommodation
details
Details about the estimated public sheltering demands as well as pre-identified shelters available for emergency accommodation, and information about shelter capacities and additional support.
6. Evacuation response plans Details about the evacuation response plans specific to parts 4-6 of the ERGO Framework for Evacuation and any ‘worst case scenarios’ (for example, major evacuation route will be flooded and closed) for testing the preparedness.
Figure 3.9 Information categories for the ERGO model
solution. These factors make simulation a suitable technique to study the tactical and operational aspects of mass evacuation.
Simulations provide the following useful characteristics for evacuation modelling:
Quantitative information for decision making.•
Analyses of the dynamic interdependency of activities and entities •within the process.
Models of technical and human resources.•
The ability to conduct “What if?” • experiments.
Enhanced capabilities that achieve an in-depth understanding of •internal process performance and correct allocation of resources (Fathee et al, 1998).
The scope to analyse process change or to design completely new •processes and test the future behaviour of the real system.
Incorporate the stochastic nature of evacuation approaches and the •random behaviour of the resources and affected population.
Allow participation from non-technical staff, since simulations •provide a highly visual display of the process and its operation.
Detailed analysis before incurring the risk of making major changes •to existing processes or implementing new processes (Jones 1995).
A greater understanding of the key drivers in resource management •and increased dependability in terms of the decisions made (Dennis et al. 2000).
In order to model the evacuation process, we have followed a standard simulation project management approach, as suggested by Robinson (2004) as discussed below.
3.6.3 Scope and level
The scope and level of the models were set by identifying the different stages in the evacuation process and selecting the boundaries of the model e.g. the areas affected by the disaster, supports to response or recovery effort (e.g. shelter locations). The modelling was defined using the Evacuee Information Categories 1 to 3 (Figure 3.9) which were aggregated at the ‘household level’. This helped to define the evacuee behaviours in the household unit. This meant that the units moving through the simulation were ‘households’ or ‘families’, rather than individual members of the public. Evacuee Information Categories 4 and 5 were aggregated at the ‘zone level’ to indicate the important transport networks, as well as the shelters available in each zone.
3.6.4 Model Inputs: Data collection and analysis
The model inputs are presented in Figure 3.9. The generic information needed to model mass evacuations includes population, transport networks, and natural or manmade threats. In general, this information is available to emergency planners and city development authorities.

ERGOThe challenges of mass evacuation
120
Chapter 3121
Research methodology
Evacuees, on receiving the warning message, will move from their current location to a place of safety. The evacuees will make varied choices, namely ‘when to leave’ (onset of evacuation), ‘how to evacuate’ (mode of transport), and ‘where to go’ (e.g. go to public shelters or go to friends and family outside the city). These behaviours can be represented at the household level for each zone using ‘Agents’ within the ABM technique. These evacuees will have transportation needs, including evacuation routes and transport response plans, which are represented in the model using ‘points and arcs’. Thus for Part 5 of the ERGO Framework for Evacuation to model the evacuee transportation, a combination of Agent-based modelling and Network modelling was appropriate.
The authorities need to optimise the overall evacuation time, by allocating the shelters keeping in mind the demand for public shelters for various zones, the capacity of the shelters and travel time from the evacuating location to the shelters. Optimisation techniques are helpful in formulating such problems as well as arriving at an allocation plan. Thus for Part 6 of the ERGO Framework for Evacuation, an integer optimisation technique was used to develop the model.
3.6.6 Experimentation
An important part of using simulation models is to be able to experiment with different parameters to examine “what-if?” scenarios and conduct sensitivity analysis.
Successful evacuation planning and management will involve identifying `the best among available options’ as well as choosing a relatively better option, both by the authorities and the evacuating public. For example, in order to minimise the total evacuation time of all the evacuees, the authorities need to identify the best available evacuation routes and ‘optimisation methods’ are more appropriate in modelling the problem. On the other hand if the authorities would want to compare the response strategies namely `staged evacuation’
Feature of the model Choices More detailsLevel of modelling Micro, Macro and Meso scale Chapter 2Modelling techniques Optimisation, Simulation, Equation based
modelsChapter 2
Choice of the model Off-the-shelf and custom-built evacuation models
Chapter 2
Quantitative methods and the model development process
Suitable choice of technique as well as rigorous model development from conception to implementation
Chapter 2, 3 and 8
Figure 3.10 Evacuation modelling features and choices
(Kongsomsaksakul, 2005; Ng and Park, 2010). Emergency planners will have this information in their emergency plans for their city, specifically with the transport authorities and this can be contextualised to use the ERGO Framework for Evacuation planning.
The third input concerns the evacuation response plan for the •‘city level’. GOs identify in their evacuation planning scenarios the intensity of threat (e.g. flood level); zones to be evacuated; and their response plans of various GOs (e.g. will evacuees use cars for evacuation?). This information is imported in the ‘setup stage’ prior to running the model and forms another important input in the quantitative model.
These three sets of inputs, namely household level, zone level and city level form an important component in the quantitative model. The methodology choices of the evacuation model are presented in the following sub-sections.
3.6.5 Model building
Models were built for each step of the mass evacuation process to provide a proof of concept. The models illustrated the approach and methodology, but were not specific to any ERGO country. The models were built in such a way for the models to be customised to a particular city or region by exchanging the data sets.
An evacuation modelling project requires the following choices about the features of an evacuation model as presented in Figure 3.10. Once these three choices are made by the GO, the evacuation model development will ensure a more suitable and reliable model.
The uncertainty regarding when the evacuees receive the warning message and their role as informal warning channels are key aspects of Part 4 of the ERGO Framework for Evacuation. These evacuee behavioural aspects are well represented in the Agent-Based Modelling (ABM) technique which is widely used in social simulation (Gilbert, 2005). Each household within the simulation can be set with evacuee behaviour properties and represented with ease as ‘Agents’ of ABM. For this reason ABM has been identified as a quantitative modelling approach for Part 4 of the ERGO Framework for Evacuation.

ERGOThe challenges of mass evacuation
122
Chapter 3
(evacuating in prioritised zones) and `simultaneous evacuation’ (evacuating in the order of receiving the warning message), simulation methods are more suitable for such problems. As evacuation involves both aspects of decision making a combined simulation and optimisation approach is more suitable to model the system (Carson, 1997: Pichitlamken and Nelson, 2003).
3.6.7 Evacuation Model Output
GOs identify various performance metrics to evaluate their evacuation response plans and ascertain the successfulness of an evacuation. The ERGO interviews, as well as published literature, inform the selection of performance metrics. Apart from these, emergency planners have various policy level questions to support their evacuation preparedness:
How long does it take for the people to receive the warning i. message? (Sorensen, 2000)
How will the effectiveness of warning in various channels ii. impact on the timely reception of a warning message and what channels will be crucial? (Stern and Sinuany-Stern, 1993)
How will the choice of transportation affect the successfulness iii. of evacuation? (Murray and Mahmassani, 2002)
What will be the relative impact of ‘congestion management iv. strategies’ adopted during the evacuation? (Han et al, 2007)
How should planners ensure an optimal shelter allocation from v. various evacuation zones? (Kongsomsaksakul, 2005; Ng, 2010)
The ERGO model provides answers to these questions. Apart from these, there are additional analyses conducted using the model output to measure the relative effectiveness of evacuation and also to obtain useful insights from the model results.
3.7 ConclusionThis chapter has outlined and defended the ERGO project’s methodologies, both qualitative and quantitative, and described the particular advantages offered by specific methods. The ERGO project’s methodologies were selected to ensure a high degree of validity, repeatability, and generalisability while combining insights from participants in emergency planning and more abstract data. The research itself was conducted in accordance with the ethical standards approved for research in Aston University Ethics Guidelines. The next chapter will examine the existing procedures and preparations for disasters in the ERGO Countries.