Embed Size (px)
Citation preview

European Energy Regulators for Electricity and Gas 28 rue le Titien, 1000 Bruxelles
Arrondissement judiciaire de Bruxelles RPM 0861.035.445
ERGEG 2008 Status Review of the Liberalisation and Implementation of
the Energy Regulatory Framework
C08-URB-15-04 10 December 2008

2008 Status Review Ref. C08-URB-15-04
2/83
CONTENT
INTRODUCTION.........................................................................................................4
1 KEY FINDINGS ....................................................................................................5
1.1 Full market opening for all customers and regional market integration ............................................ 5
1.2 Empowering consumers........................................................................................................................... 5
1.3 Retail markets........................................................................................................................................... 6
1.4 Wholesale markets ................................................................................................................................... 9
1.5 Security of supply and infrastructure .................................................................................................. 11
1.6 Regulation and enforcement.................................................................................................................. 12
2 GAS WHOLESALE ............................................................................................13
2.1 Background............................................................................................................................................. 13
2.2 Highly concentrated upstream markets ............................................................................................... 15
2.3 Developments in market integration .................................................................................................... 16
2.4 Liquidity on European Hubs................................................................................................................. 18
2.5 Integration of international markets .................................................................................................... 21
2.6 Conclusions ............................................................................................................................................. 22
3 GAS RETAIL ......................................................................................................23
3.1 Introduction ............................................................................................................................................ 23
3.2 Prices ....................................................................................................................................................... 23
3.3 Switching................................................................................................................................................. 27
3.4 Market shares ......................................................................................................................................... 30
3.5 Underground storage ............................................................................................................................. 31
3.6 Conclusions ............................................................................................................................................. 31
4 ELECTRICITY WHOLESALE ............................................................................33
4.1 Generation and capacity ........................................................................................................................ 33

2008 Status Review Ref. C08-URB-15-04
3/83
4.2 Market dominance ................................................................................................................................. 35
4.3 Market liquidity and transparency....................................................................................................... 36
4.4 Physical integration and market coupling ........................................................................................... 41
4.5 Conclusions ............................................................................................................................................. 42
5 ELECTRICITY RETAIL ......................................................................................43
5.1 Prices ....................................................................................................................................................... 43
5.2 Switching................................................................................................................................................. 48
5.3 Regulated electricity prices.................................................................................................................... 51
5.4 Market shares ......................................................................................................................................... 52
5.5 Conclusions ............................................................................................................................................. 54
6 SECURITY OF SUPPLY AND INFRASTRUCTURE..........................................56
6.1 Introduction ............................................................................................................................................ 56
6.2 External aspects...................................................................................................................................... 58
6.3 Internal aspects....................................................................................................................................... 62
6.4 Conclusions ............................................................................................................................................. 68
7 REGULATION AND UNBUNDLING ..................................................................70
7.1 Background............................................................................................................................................. 70
7.2 Competences of National Regulatory Authorities ............................................................................... 70
7.3 Roles of TSOs in markets ...................................................................................................................... 72
7.4 Unbundling of TSOs and DSOs ............................................................................................................ 73
7.5 Conclusions ............................................................................................................................................. 80
8 ANNEX ...............................................................................................................81
8.1 References ............................................................................................................................................... 81
8.2 Tables and Figures ................................................................................................................................. 82

2008 Status Review Introduction and Key Findings
Ref. C08-URB-15-04
4/83
Introduction The Electricity Directive 2003/54/EC (Article 23) and the Gas Directive 2003/55/EC (Article 25) require that national energy regulatory authorities publish an annual report on the outcome of their monitoring activities related to the functioning of the electricity and gas markets in their country. Through ERGEG, the content of these 27 National Reports is coordinated with the European Commission. The National Reports of each EU country and the overall ERGEG assessment reports, for each year since 2005, can be found on the ERGEG website1. In addition the national energy regulators also provide the European Commission with raw data for its annual benchmarking report on the opening of the electricity and gas markets. Although committed to providing harmonised and comprehensive information, the national energy regulatory authorities have diverse data collection powers. Therefore not all data could be collected for all Member States2. This 2008 ERGEG Status Review on the Liberalisation and Implementation of the Regulatory Framework (formerly called ERGEG Assessment Report) draws some conclusions from the National Reports of the national energy regulators and from several additional sources in order to build an assessment of the development of the European energy market. The ERGEG Status Review draws primarily from ERGEG data, but where necessary, external resources are used. The report identifies general developments and tendencies, without prejudice to possible exceptions in individual cases. This report refers to the situation in 2007. In this context, it is worth noting that on 10th January 2007 the European Commission published the finding of its (DG Competition’s) energy sector inquiry. The European Competition found severe deficiencies, both for gas and electricity markets, in market integration, transparency, price information, balancing markets, LNG markets, competition in downstream markets as well as severe problems of vertical foreclosure and market concentration/market power. This ERGEG Status Review looks into some of the deficiencies identified and tracks the development of national gas and electricity markets and the progress towards an EU energy market. In terms of remedies, the European Commission’s third energy liberalisation legislative package proposals, (September 2007), which are currently subject to negotiations in European Parliament and Council, go some way to redressing the problems identified in this Status Review. ERGEG’s main focus in the 2008 Status Review is on energy consumers and the necessary prerequisites for effective competition to their benefit.
1 http://www.energy-regulators.eu/portal/page/portal/EER_HOME/EER_PUBLICATIONS/NATIONAL_REPORTS
2 Unless otherwise stated, data reported is obtained from the CEER database, using, in some cases, Eurostat categories. Data subsets are used in the cases where all data were not available for all 27 EU Member States.
2008 Status Review Introduction and Key Findings
Ref. C08-URB-15-04
5/83
1 Key findings
1.1 Full market opening for all customers and regional market integration The first priority of EU energy regulators is to ensure that energy consumers get the best possible deal in terms of price, choice and quality. The best way to do this is through a single, competitive, EU energy market. This requires two fundamental elements, firstly the opening up of national energy markets and secondly, the integration of those national markets into a single European market for electricity and gas for the benefit of consumers. In July 2007 full retail market opening became effective meaning that all electricity and gas customers (including households) are now (at least in theory) free to choose their supplier in every Member State 3 (and in Norway). The full market opening of national energy markets in itself, however, cannot guarantee a sufficient degree of supplier choice and competition. Market liberalisation and market integration needs to go hand in hand. This is why ERGEG established, in 2006, the Regional Initiatives4 to move from the 27 fragmented national energy markets to regional energy markets. In 2007, the regulators in the 7 electricity and 3 regional gas markets continue to work hard to remove obstacles to trade between neighbouring countries. The ultimate objective of the Regional Initiatives is the completion of a single EU market, which would bring fair and dynamic competition to Europe’s energy consumers.
1.2 Empowering consumers The proper functioning of competitive energy markets and the rights of energy consumers are linked. A well-functioning market needs well-informed and active customers, and strong independent regulators who monitor retail and wholesale markets. Consumers can force a supplier to deliver a quality service at the best price by the credible threat of moving their business to another supplier. This means that customers must be well informed of their rights and have a strong position. ERGEG encouraged the European Commission to provide for the establishment of the Citizens’ Energy Forum (or London Forum) in its third energy liberalisation legislative package proposals (3rd Package). This London Forum (which had its first meeting in October 2008) is akin to the Florence Forum in energy or Madrid Forum in gas, instead focuses on retail market and consumers issues. It provides a formal platform at EU level for dialogue with consumers’ representative bodies on real issues that matter to energy consumers. The regulators also sought to empower consumers through improving supplier switching. In 2008 ERGEG also monitored whether Member States have actually transposed the consumer rights provisions of the current energy laws.
3 The exceptions being Portugal, Finland, Greece, Cyprus, Latvia, Estonia and Malta who have been granted
derogations for domestic customers on either electricity/gas legislation. 4 http://www.energy-regulators.eu/portal/page/portal/EER_HOME/EER_INITIATIVES

2008 Status Review Introduction and Key Findings
Ref. C08-URB-15-04
6/83
National regulatory authorities also need effective powers to monitor market participants and full independence (of both industry and Ministries) so as to safeguard the public interest. Well-functioning, competitive and integrated markets which provide efficient and secure supply of final customers are the ultimate objectives of the independent regulators. Proper regulatory oversight of the wholesale and retail markets is necessary. Such regulatory oversight of wholesale and retail markets is partly included in the European Commission’s proposals of 19 September 2007 for the 3rd Package.
1.3 Retail markets The reports of the national regulatory authorities show a very heterogeneous picture of the different retail markets for gas and electricity across the EU, indicating lack of market integration but also supporting the conclusion that liberalisation has not fully delivered to date. National implementation of the existing Directives5 is so diverse that markets are covering a broad range of market structures, i.e., from competitive to monopolistic. The current legislative framework seems to allow this kind of diversity. The newly established Citizens’ Energy Forum may play an important role in sharing best practice as well as establishing minimum standards for retail markets. In 2007 retail markets for electricity were characterised by price increases for households in almost every country and for large industrial customers in more than half of the analysed European countries. Gas prices also increased in 2007, both for households as well as small industrial customers, although to a smaller extent. For instance, compared with 2006, the average price paid by households consumers in 2007 increased by 1.8%. In 2007, market structure on a national scale remains highly concentrated, both for gas and electricity. For instance, in most of the 16 European countries analysed, the market shares of the three largest gas suppliers in the retail market reflect a very high market concentration; 14 of which have shares of more than 70%, reaching 98% or more for 8 suppliers. Such highly concentrated markets impede the development of effective competition. Switching rates for households and small commercial customers remain low, both for gas and electricity. While increases in the level of switching of electricity suppliers has been reported in several countries, the switching rates of smaller customers remains low. Overall, the rate of switching is low in many countries; even those countries that had fully liberalised their markets well before 1 July 2007. For instance, the annual switching rate observed for electricity household consumption in terms of eligible meter points is in many countries between zero and some 2%. For gas, the switching rate is extremely low. Only 4 countries reported a switching rate for household and small commercial customers of at least 1% per year. The low switching rates (especially for households and small industrial customers) in many countries are a sign of narrow geographic retail markets and competition not being
5 The Electricity Directive 2003/54/EC and the Gas Directive 2003/55/EC.

2008 Status Review Introduction and Key Findings
Ref. C08-URB-15-04
7/83
well-developed at the national level. This shows a lack of market integration. Low switching rates also underpin the market power of incumbents. Although switching is not the only indicator to gauge the extent of competition in a market, the figures are useful to show that in the energy market, the introduction of competition is not sufficient to effectively restrict market power. In contrast, switching rates for larger industrial customers are higher in a number of countries; the markets for larger industrial customers are more likely national, as electricity and gas suppliers actively compete for large industrial customers on a national scale. Geographically narrow markets imply high market power for incumbents. The market power of incumbents, which has not been sufficiently restricted by alternative supply and choice for customers, requires the implementation of additional measures to prevent abusive behaviour. In the current highly concentrated and geographically-narrow retail markets more and stringent market monitoring and surveillance is necessary. This is needed to build consumer confidence in competition and to protect customers from abusive behaviour of dominant companies. To this end national regulators need effective monitoring powers to protect customers and safeguard the public interest. In cases where dynamic gas and electricity markets with high switching rates and a high level of competition are observed they very often exist in the same countries, such as in Great Britain, the Netherlands and Denmark. In some countries they are restricted to one energy source, such as the Nordic market for electricity. Furthermore, in many Member States6 competitive (or market-based) prices still coexist with regulated end-user prices, which remain a major concern. In such dual markets suppliers without low-cost generation capacity or equivalent long-term contracts will not be able to make competitive offers which cover their supply costs if regulated end-user prices are not in line with wholesale market conditions. Furthermore, there will be no incentive to switch supplier if customers benefit from artificially low regulated prices. In this respect, a switch-back from the liberalised to the regulated market was observed in some Member States, such as in the electricity household sector in Spain. In some countries, it is even irreversible to leave the regulated prices, thereby locking the customer to the incumbent. In countries with a dual market, a significant decrease in switching rates was observed, e.g., the switching rates of non-residential electricity customers in France. These findings show that artificially low regulated end-user prices which are not market based are an obstacle to supplier switching. Therefore, as far as non market-based regulated end-user prices are distorting competition, they should be abolished or, where appropriate, brought into line with market conditions.
6 16 Member States have regulated electricity prices for end-users who do not opt to procure from the liberalised market.

2008 Status Review Introduction and Key Findings
Ref. C08-URB-15-04
8/83
In the transition to a fully liberalised market, regulated end-user prices are often put in place to protect customers. Their persistence can be seen as a symptom of a poorly functioning market. While, regulated end-user prices should serve to protect customers less informed and less advantaged, from potential abuses of dominant position, the use of this tool should be seen as a short-term measure to be used while pursuing the goal of an effective, competitive, transparent energy market. The National Reports show that in markets with regulated prices, retail markets are being driven by the regulated prices and that there is a lack of competition in the retail market in these countries. As identified above, the reports of the national regulators show that in most Member States, competition in the retail gas and electricity markets for small customers is almost non-existent. Increased competition would contribute to the development of national electricity and gas retail markets to the benefit of smaller customers, in advance of a further European market integration at a retail level. Typically markets for large industrial customers are better integrated so that market power in the countries where competitors exist is somewhat restricted as a result of the market integration. For Distribution System Operators (DSOs) the official deadline for legal unbundling was 1 July 2007. During 2007, most Member States implemented the “formal” legal unbundling for DSOs7. Despite progress made, the National Reports indicate that the integrated companies did not establish fully functioning independent system operators capable of carrying out their business autonomously (e.g., lack of internal staff, own dedicated assets, etc.)8. One of the reasons for this failure is the transposition of unbundling obligations into national law, which is often too vague. Once again ERGEG reiterates for the third year that the present legal framework for legal unbundling is insufficient; the strengthening of unbundling provisions is necessary. This is of significant importance as the risk of insufficient unbundling of commercial and network activities can seriously hamper competition and liberalisation. To assist in the strengthening of these provisions, ERGEG published Guidelines of Good Practice on Functional and Informational Unbundling for Distribution System Operators9. Importantly unbundling is not an objective in itself, but rather a means to an end. The importance of effective unbundling at DSO (as distinct from TSO) level should not be underestimated. DSO unbundling is essential for effective competition in retail markets. This requirement was highlighted at the Citizens’ Energy Forum. DSOs must become “market facilitators”, i.e., their role must not be restricted to providing non-discriminatory access to
7 In line with the exemptions in the 2003 Electricity and Gas Directives, implementation of “legal” unbundling was
only realised in July 2007 in many Member States. Whilst Member States could delay the obligation to legally unbundle (i.e., create a separate company) for larger DSOs until 1 July 2007, such a possibility did not exist with regard to the obligation to unbundle in “functional” terms.
8 Austria and Poland.
9 C06-CUB-12-04b

2008 Status Review Introduction and Key Findings
Ref. C08-URB-15-04
9/83
their grid; they should also provide services to market participants, energy suppliers and consumers, including providing information and facilitating consumer switching. In order to facilitate competition, market participants and potential market players need access to timely market information, which is typically available to DSOs. Furthermore, consumer awareness needs to be increased through the spread of information. Information to consumers (e.g., on prices, billing information, and supplier contracts) and the transparency of this information must be improved; this has been identified as a key to reinforcing consumer confidence in energy markets. In this respect, the new measures for consumer information provided for in the 3rd Package are welcomed. It is obvious from the National Reports that DSOs have not yet assumed the role of “market facilitators” for retail markets. In ERGEG’s view, unbundling must be more ambitious, ensuring a more active role for independent TSOs and DSOs to facilitate the development of competition in respective markets. ERGEG considers that DSOs should be offered incentives to take on this enhanced role in the future.
1.4 Wholesale markets Well-functioning wholesale markets are a prerequisite for well-functioning retail markets. Wholesale markets serve to allow market participants to equalise demand and supply. Transparent price information is necessary to allow economically efficient decision-making. The market structure has not changed remarkably in 2007. Gas and electricity wholesale markets remain national, even though some improvements have been achieved within the Gas and Electricity Regional Initiatives, which were launched by ERGEG in 2006. In gas and electricity there remain highly concentrated national wholesale markets. Market dominance continues to be a significant issue. In the electricity sector, wholesale concentration on a national scale is quite stable. Weighted in terms of each country’s capacity, the market share of the 3 biggest generators has increased from 67.8% in 2006 to 69% in 2007. The Herfindahl Hirschman Index (HHI)10 shows a decrease from 2006 to 2007; the total HHI has decreased slightly 3685 in 2006 to 3625 in 2007 (using a weighted index in terms of percentage share of the total net generation volume).
For gas wholesale, the level of concentration has not significantly changed during the last years. This underlines the importance of competitive down-stream markets, which can only be ensured if there is a level playing field in access to gas volumes. Otherwise, the concentration in upstream will automatically feed through to the retail markets.
In some Member States changes in market design has promoted liquidity within the electricity wholesale markets. Increased market coupling and market integration should
10
An index used to express the level of concentration in the market using the sum of squared market shares for each firm in the market.

2008 Status Review Introduction and Key Findings
Ref. C08-URB-15-04
10/83
result in greater convergence of prices in electricity wholesale markets. However, there remain considerable price differences between power exchanges, showing that markets are not fully integrated. As for gas wholesale, the majority of European gas customers have no access to liquid trading. Regional gas markets are unequally developed and market integration between the regions is not visible. The existence of different pricing regimes is a sign of compartmentalisation. The lack of transparent and liquid (secondary) markets for transportation rights hampers further integration within and moreover between regions. These findings show that there is no sufficient progress in market integration. An appropriate level of harmonisation is necessary to integrate markets. Progress cannot be achieved unless appropriate rules are established for the use of infrastructure, interoperability and transparency. The ERGEG Gas Regional Initiatives (which create 3 regional gas markets in Europe) play a key role in providing solutions on a voluntary, cooperative basis with stakeholders, which can complement the use of binding rules and facilitate the creation of regional markets as an interim step towards the creation of a single European gas market. The 3rd Package provides a mechanism for binding network rules, which are to be applied in the whole European market. It envisages the development of cross-border gas and electricity network codes, drafted by the ENTSOs on the basis of framework guidelines. The framework guidelines and the codes will be a major tool which, over time, will enable the diverse national and regional markets in the European Union to evolve towards an efficient single European energy market. Hence, the importance of the role of TSOs will increase in the future. TSOs must be “market facilitators” for wholesale markets. In this respect, effective collaboration between TSOs and national regulatory authorities (NRAs) is essential to build a competitive market. In 2007, there are no major changes reported with respect to the obligations on unbundling of electricity TSOs in Europe. CEER and ERGEG have repeatedly stated that ownership unbundling is the preferred market structure for TSOs, in both the electricity and gas sectors so as to bring fair and dynamic competition to Europe's energy consumers. At present insufficient unbundling still remains an obstacle for market integration. For 2007, regulators report some progress on the transparency of TSOs, in both the electricity and gas sectors. However, ERGEG’s monitoring of compliance with the Electricity11 and Gas Regulations12 shows that most network operators in the electricity and gas sectors do not satisfactorily meet their statutory transparency requirements and duties of disclosure.
11
See “Compliance with the Electricity Regulation 1228/2003 –An ERGEG Monitoring Report” (E07-EFG-23-06), 18 July 2007.
12 See Compliance with Transparency Requirements of the Gas Regulation 1775/2005 – An ERGEG Monitoring Report” (E07-TRA-02-03), 18 July 2007 and “ERGEG’s Gas Transparency Requirements –An ERGEG Additional Monitoring Report” (E07-TRA-02-03b), 9 October 2007. The latter is additional monitoring by ERGEG, requested by the European Commission, which explains why compliance by TSOs with the legally binding requirements of the Gas Regulation is unsatisfactory.

2008 Status Review Introduction and Key Findings
Ref. C08-URB-15-04
11/83
As market concentration is not diminishing (and even slightly increasing in electricity wholesale markets) the importance of market integration increases. The 3rd Package is expected to promote market integration. Where the 3rd Package bases this market integration on TSO cooperation, the effective separation (unbundling) of TSOs from the competitive elements of the market (supply and production) is of crucial importance.
1.5 Security of supply and infrastructure A fully functioning, competitive internal market is the best guarantee for efficient and secure supply to final customers.
While the National Reports show no imminent threat to energy security at EU-level, there are a number of major challenges facing Member States in this area, especially for gas supplies: (i) a number of countries still depend on one single supplier for pipeline gas (Bulgaria, Finland, Greece, Latvia, Lithuania, and Slovakia), (ii) the EU’s own gas reserves and production continue to decrease, (iii) competition between storage operators and access to storage across the EU remains restricted. Gas imports, where dependence is greatest, cause the most concern. Diversification of the gas supply sources open to the European market is crucial to long-term security of supply, as gas production and the remaining reserves will increasingly be concentrated in regions outside the EU over the next few decades. Opening up new sources in the Caspian, the Middle East and North Africa by developing transportation infrastructure, like he Nabucco pipeline, will make a major contribution to Europe’s long-term security of supply. In general, diversification of energy sources and routes is required, especially in cases where Member States are wholly dependent on one provider. Crucial elements for security of supply are the availability of secure, reliable networks with sufficient capacity to transport energy supplies and a sufficient level of interconnection between Member States for the development of the internal market. Investment in infrastructure and non-discriminatory access to energy infrastructure are keys to the development of the internal market. A fully functioning internal market also contributes to a better ability to predict demand by increasing transparency and creating forward markets. Effective unbundling (or separation) is also an important factor in ensuring secure supply. The effective separation of networks from the competitive parts of the electricity and gas business result in real incentives for companies to invest in new infrastructure (including storage), interconnection capacity and new generation capacity, thereby avoiding black-outs and unnecessary price surges. Thus the successful implementation of the proposals in the European Commission’s 3rd Package would strengthen security of supply. As for electricity infrastructure, the European electricity transmission grid is highly meshed, with some important bottlenecks. Cross-border transmission capacity is not only an asset that provides for improved dispatch efficiency and improved system security, but it is also an essential element in enabling competition. Investment in energy efficiency measures will also help to ensure security of supply, by conserving resources and reducing peak demand.

2008 Status Review Introduction and Key Findings
Ref. C08-URB-15-04
12/83
Proposals in the 3rd Package to provide a predictable, transparent and stable regulatory framework and to coordinated planning of grid investments by gas and electricity TSOs (including inter alia the 10-year investment plan) will also promote security of supply. A stable and predictable investment climate will help to ensure sufficient transmission capacity will be available to meet demand and to integrate national markets. Finally, the Commission’s 3rd Package proposals to enhance the powers of regulators at national level and to establish an Agency for the Co-operation of EU Energy Regulators (Agency) is an important step towards a transparent and consistent EU regulatory framework. Such a more coherent, transparent and stable regulatory framework is key to providing the right climate for investment.
1.6 Regulation and enforcement
Regulators must be independent not just from industry but also from political interference. Despite the progress reported by some regulators in the enhancement of their powers, political interference remains a concern. In 2007 political interference in energy regulation was reported as a significant concern for regulators as last year’s rising energy prices have tempted some countries to use political control over prices as a remedy for presumed insufficient competition or to reach diverse societal goals. This, however, undermines the credibility of competitive markets. Political influence has not been exerted in a transparent way but through increased influence by ministries or parliaments on some national regulatory authorities, in terms of appointment or even on the adoption of individual decisions. It was, for instance, reported that some ministries have powers to approve, reject or amend regulatory decisions. This impacts not just the independence of regulators but moreover it is harmful to the market development and market players (e.g., regulatory risk resulting from political interference undermines investors’ confidence). In general the findings of the regulators’ reports show that independence of national regulators needs to be improved and their competences enhanced in several areas, as set out throughout this Status Review. The reported lack of NRAs competences in competition issues and the lack of powers for regulators to impose effective sanctions weaken the effectiveness of their decisions and affect the well functioning of the market. Furthermore, regulators are not currently entrusted with the necessary powers to enforce effective unbundling. Regulators reported a lack of legal powers to change the companies’ behaviour or to impose effective sanctions. The reports’ findings make clear that, in the case of vertically integrated network companies, extensive monitoring of company behaviour is required and national regulators need to be given the necessary powers to monitor market participants and impose effective sanctions.

2008 Status Review Gas Wholesale
Ref. C08-URB-15-04
13/83
2 Gas Wholesale
2.1 Background Europe procures most of its gas demand via long-term take-or-pay contracts. As long as such contracts are maintained by the supplier, these contracts are economically equivalent to production within the EU if volumes are freely transferable on the internal market. As an example, the following Figure shows the duration of import contracts in Italy in 2007. Less than 6.5% are procured on a short-term basis. Figure 1: Term of new import contracts in Italy 2007
10 to 15 years
5.2%
1 to 5 years
2.7%5 to 10 years
0.6%
Up to 1 year
6.5%
15 to 20 years
14.0%
20 to 25 years
20.7%25 to 30 years
4.2%
Over 30 years
46.1%
While there are benefits to the long-term import contracts, there is a possibility that they may severely hamper further development of liquid wholesale markets if they are concluded between importers and suppliers or final customers within the EU. In this case, they impede free transferability of gas and thereby reduce liquidity. This issue has been raised by the EC in its Sector Inquiry and taken up by German Cartel Office in its decisions to reduce long-term contracts further down in the supply chain, i.e., between importers and municipalities. Liquid markets mainly exist where local production and local oversupply is important (local production for the Netherlands, GB and highly diversified imports for Belgium) or where LNG plays an important role, such as in Spain. Free short-term volumes
Key points:
• Regional markets are unequally developed
• Majority of European gas customers have no access to liquid trading
• Market integration is not making sufficient progress

2008 Status Review Gas Wholesale
Ref. C08-URB-15-04
14/83
are therefore most likely present in these regions whereas in other regions, gas is typically imported via long-term “dedicated” contracts. Short term gas trading takes place as OTC13, or bilateral trading as well as on organised trading exchanges. Liquid trading needs free gas volumes, i.e., volumes which, at least at the moment of production or import, are not dedicated to a specific customer. But even if gas is dedicated (on a long-term basis), fluctuations in demand may cause shippers to engage in trading activities to balance their positions. 2007 is a good example of the latter case. In 2007 the EU14 consumed approximately 5495 TWh of natural gas, a reduction of 1.4% from the previous year. The reduction was mainly due to the warm weather in continental Europe, which was only partly outweighed by consumption increases in the rest of the EU (Northern Europe, Iberian Peninsula and Greece). Figure 2: Consumption of natural gas in the EU and Norway in 2007
Consumption of Natural Gas in 2007
TWh/yr
UNITED KINGDOM; 1057; 20%
GERMANY; 991.2; 19%
ITALY; 898.4; 17%
FRANCE; 498.5; 9%
SPAIN; 408; 8%
THE NETHERLANDS; 400; 8%
BELGIUM; 189.3; 4%
POLAND; 152.3; 3%HUNGARY; 124; 2%
CZECH REPUBLIC; 91.29; 2%
AUSTRIA; 88; 2%
SLOVAK REPUBLIC; 59.83; 1%
PORTUGAL; 48.9; 1%
IRELAND; 48.58; 1%
FINLAND; 45; 1%
GREECE; 42.63; 1%
DENMARK; 40; 1%
LITHUANIA; 33.1; 1%
BULGARIA; 32; 1%
LATVIA; 16.7; 0%
LUXEMBOURG; 15; 0%
SLOVENIA; 12; 0%
SWEDEN; 11.7; 0%
ESTONIA; 9; 0%
Rest; 718; 14%
Source: CEER Database
13
Over the counter (OTC) trades are trades that do not take place on an established exchange. 14
EU here comprises all 27 Member States and Norway.

2008 Status Review Gas Wholesale
Ref. C08-URB-15-04
15/83
Figure 3: Production of natural gas in the EU and Norway in 2007
Production of Natural Gas in 2007
in TWh/yr
THE NETHERLANDS; 709; 25%
GERMANY; 166.5; 6%
ITALY; 102.6; 4%DENMARK; 90; 3%
POLAND; 47.53; 2%
HUNGARY; 24; 1%
AUSTRIA; 20.3; 1%
FRANCE; 10.94; 0%
BULGARIA; 3; 0%
SLOVAK REPUBLIC; 1.26; 0%
SPAIN; 1.04; 0%
CZECH REPUBLIC; 1; 0%
NORWAY; 910; 32%
UNITED KINGDOM; 774; 27% Rest; 199; 7%
Source: CEER Database
The European Union and Norway produced 2,861 TWh of natural gas in 2007, which amounts to some 54% of demand of EU27 plus Norway. This is approximately the same percentage as in 200615. Due to reduced demand, production was decreased (for instance, almost 100 TWh less in the UK). However, this did not lead to a lower rate of indigenous supply; 506 TWh were imported via LNG.
2.2 Highly concentrated upstream markets The share of the biggest 3 companies in available gas supports the conclusion that markets are highly concentrated. In most cases, this indicator is above 80%, with only a few exceptions (Spain, Romania, and Germany). The level of concentration has not significantly changed during the last years. This underlines the importance of competitive down-stream markets, which are only possible if there is a level playing field in access to gas volumes. Otherwise, the upstream concentration will automatically feed through to the retail markets.
15
Other sources, such as the BP Statistical Review of World Energy, may show slightly different figures due to the status of statistical figures.

2008 Status Review Gas Wholesale
Ref. C08-URB-15-04
16/83
Figure 4: Concentration: Market share of biggest 3 shippers in available gas (import plus production)
0%
20%
40%
60%
80%
100%
120%
SLO SLOV POL LUX LIT HEL FIN BEL EST HUN FR IT AU ESP ROM GER
CR
3
2.3 Developments in market integration ERGEG’s Regional Initiatives, which were launched in 2006, delivered their initial achievements in 2007. The three regions, North-West (NW), South (S) and South-South-East (SSE), defined their respective priorities in the areas of
o Interconnection, o transparency, o interoperability and o development of gas hubs.
In the NW Region, the main priorities were to improve transparency and the use of interconnection capacity and to develop a sound regional investment climate. The region
certainly is the most developed market in the EU. In 2006 and 2007 the NTZ (NBP-TTF-Zeebrugge) market16 exhibits highly correlated prices for spot and forward delivery. Correlation has even increased compared to the years before. Physically, the NBP is connected for import only to TTF and for import as well as export to
16
The NTZ market includes the National Balancing Point (NBP), the virtual trading point in Great Britain; the Title Transfer Facility (TTF), the trading platform for the Dutch TSO system and Zeebrugge, the Belgian Hub, which is comprised of a system of entry-exit points around Zeebrugge.
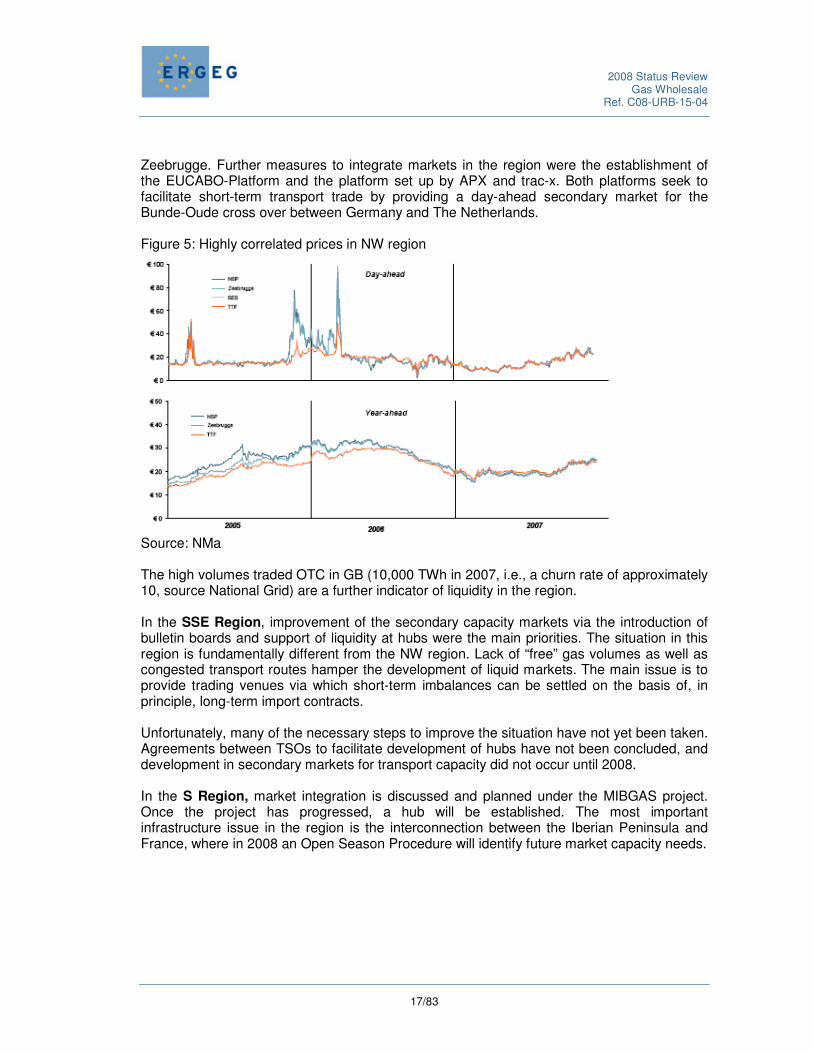
2008 Status Review Gas Wholesale
Ref. C08-URB-15-04
17/83
Zeebrugge. Further measures to integrate markets in the region were the establishment of the EUCABO-Platform and the platform set up by APX and trac-x. Both platforms seek to facilitate short-term transport trade by providing a day-ahead secondary market for the Bunde-Oude cross over between Germany and The Netherlands. Figure 5: Highly correlated prices in NW region
Source: NMa The high volumes traded OTC in GB (10,000 TWh in 2007, i.e., a churn rate of approximately 10, source National Grid) are a further indicator of liquidity in the region. In the SSE Region, improvement of the secondary capacity markets via the introduction of bulletin boards and support of liquidity at hubs were the main priorities. The situation in this region is fundamentally different from the NW region. Lack of “free” gas volumes as well as congested transport routes hamper the development of liquid markets. The main issue is to provide trading venues via which short-term imbalances can be settled on the basis of, in principle, long-term import contracts. Unfortunately, many of the necessary steps to improve the situation have not yet been taken. Agreements between TSOs to facilitate development of hubs have not been concluded, and development in secondary markets for transport capacity did not occur until 2008. In the S Region, market integration is discussed and planned under the MIBGAS project. Once the project has progressed, a hub will be established. The most important infrastructure issue in the region is the interconnection between the Iberian Peninsula and France, where in 2008 an Open Season Procedure will identify future market capacity needs.

2008 Status Review Gas Wholesale
Ref. C08-URB-15-04
18/83
2.4 Liquidity on European Hubs Figure 6 shows the volumes traded on European Gas Hubs in 2007. At first sight it becomes clear that the triangle NBP-TTF-Zeebrugge (NTZ) encompasses the most liquid trading spots in Europe as the UK, the Netherlands (and Norway) are the most important gas producing countries. Figure 6: Trade volumes on European Hubs 2007
73.2 672.4
197.2
446.9
283
123.4 102.64
444
0
200
400
600
800
1000
1200
1400
EGT V
P (D)
BEB V
P (D)
GDFD
T (D
)
CEG
H (A
)
Zeebr
ügge
(B)
TTF (N
L)
PEG
(F)
NBP
(GB) -
estim
ated
-
PSV (I
)
CDG (E
S)
TW
h
appr 10,000 TWh
Source: National Reports, Energie&Management The warm weather triggered an increase in trading activity in many parts of the EU as surplus volumes were marketed via hubs and exchanges. OTC trade at hubs, therefore, witnessed noticeable improvements of liquidity and some trade commenced at exchanges, except in the UK where exchange-based spot trade was 129 TWh (at OCM17). The UK saw a reduction in liquidity in this market. As an example the figures of the French hub PEG18 show the increase in trading in 2007, starting in the warm winter 2006/07.
17
On the day commodity markets (OCM). 18
Point d’Exchange de Gaz.

2008 Status Review Gas Wholesale
Ref. C08-URB-15-04
19/83
Figure 7: Trade at French Hub PEG in 2007 Source: CRE Further, the entry-exit system which was introduced in Germany 2007 facilitated trading on virtual hubs and exchanges. Still, trading volumes on exchanges remain quite low. Table 1: Traded gas volumes at exchanges in 2007 Exchange Volume (TWh in 2007) EEX19 4.1 ICE 150 Mio therms/day equivalent to 1600
TWh/yr APX-NBP UK Na OCM 129 TWh APX-NL < 1 Endex 17.8
An easing of the gas supply and demand balance in 2007 can also be concluded by the sharp decrease in gas prices in the first quarter. Day Ahead Prices at Zeebrugge Hub fell by some 50%.
19
Trade began on 1 July 2007.
0
1
2
3
4
5
6
7
8
9
10
11
12
13
14
APR-05
JUN-05
AUG-05
OCT-05
DEC-05
FEB-06
APR-06
JUN-06
AUG-06
OCT-06
DEC-06
FEB-07
APR-07
JUN-07
AUG-07
OCT-07
DEC-07
TWh
0
1
2
3
4
5
6
7
8
9
10
11
12
13
14
APR-05
JUN-05
AUG-05
OCT-05
DEC-05
FEB-06
APR-06
JUN-06
AUG-06
OCT-06
DEC-06
FEB-07
APR-07
JUN-07
AUG-07
OCT-07
DEC-07
TWh

2008 Status Review Gas Wholesale
Ref. C08-URB-15-04
20/83
Figure 8: Development of Hub Day Ahead Prices in Zeebrugge
Zeebrugge Gas Prices DA
0
5
10
15
20
25
30
02.0
1.20
07
16.0
1.20
07
30.0
1.20
07
13.0
2.20
07
27.0
2.20
07
13.0
3.20
07
27.0
3.20
07
10.0
4.20
07
24.0
4.20
07
08.0
5.20
07
22.0
5.20
07
05.0
6.20
07
19.0
6.20
07
03.0
7.20
07
17.0
7.20
07
31.0
7.20
07
14.0
8.20
07
28.0
8.20
07
11.0
9.20
07
25.0
9.20
07
09.1
0.20
07
23.1
0.20
07
06.1
1.20
07
20.1
1.20
07
04.1
2.20
07
18.1
2.20
07
€/M
Wh
All in all, 2007 provided support for further development of liquid wholesale markets. However, the support may not have lasting effects. Infant hubs, such as the Austrian CEGH20, profited from free volumes in the market but could not fully stabilise higher trading volumes. At the very moment when general price increases in Europe revealed tightening markets, hubs lost volumes.
20
Central European Gas Hub (CEGH).

2008 Status Review Gas Wholesale
Ref. C08-URB-15-04
21/83
Figure 9: Development of traded volumes at Austrian Hub 2005 - 2008
0
2,000
4,000
6,000
8,000
10,000
12,000
14,000
16,000
18,000
20,000
Okt
.05
Nov.
05
Dez
.05
Jän.0
6
Feb.0
6
Mär
.06
Apr.0
6
Mai
.06
Jun.0
6
Jul.0
6
Aug.0
6
Sep.0
6
Okt
.06
Nov.
06
Dez
.06
Jän.0
7
Feb.0
7
Mär
.07
Apr.0
7
Mai
.07
Jun.0
7
Jul.0
7
Aug.0
7
Sep.0
7
Okt
.07
Nov.
07
Dez
.07
Jän.0
8
Feb.0
8
Mär
.08
Apr.0
8
Mai
.08
Jun.0
8
Jul.0
8
Aug.0
8
Sep.0
8
0
10
20
30
40
50
60
Titel Tracking Volume
physical throughput
Number of Traders (right)
Source: CEGH
GWh Number
If liquid hub trading is not taking off, oil price indexed import contracts for pipeline as well as LNG gas will prevail in the future. This may seriously undermine the balance between supply and demand.
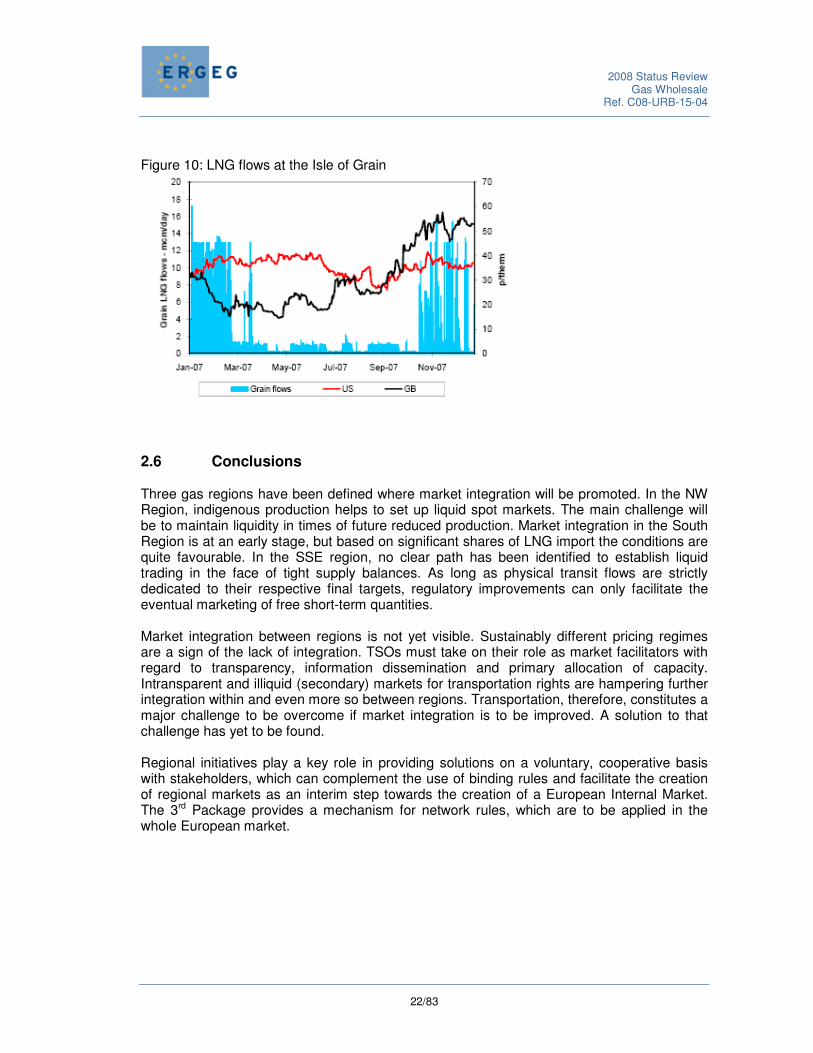
2.5 Integration of international markets The European market is already being influenced by international gas markets. The following figure shows the amount of LNG flows at the Isle of Grain in comparison to the price spread between US and GB prices. The graph shows that in spite of a British price premium on the Atlantic market, LNG may not be flowing towards Europe and flows instead to even higher priced markets elsewhere on the globe (e.g., Asia).
2008 Status Review Gas Wholesale
Ref. C08-URB-15-04
22/83
Figure 10: LNG flows at the Isle of Grain
2.6 Conclusions Three gas regions have been defined where market integration will be promoted. In the NW Region, indigenous production helps to set up liquid spot markets. The main challenge will be to maintain liquidity in times of future reduced production. Market integration in the South Region is at an early stage, but based on significant shares of LNG import the conditions are quite favourable. In the SSE region, no clear path has been identified to establish liquid trading in the face of tight supply balances. As long as physical transit flows are strictly dedicated to their respective final targets, regulatory improvements can only facilitate the eventual marketing of free short-term quantities. Market integration between regions is not yet visible. Sustainably different pricing regimes are a sign of the lack of integration. TSOs must take on their role as market facilitators with regard to transparency, information dissemination and primary allocation of capacity. Intransparent and illiquid (secondary) markets for transportation rights are hampering further integration within and even more so between regions. Transportation, therefore, constitutes a major challenge to be overcome if market integration is to be improved. A solution to that challenge has yet to be found. Regional initiatives play a key role in providing solutions on a voluntary, cooperative basis with stakeholders, which can complement the use of binding rules and facilitate the creation of regional markets as an interim step towards the creation of a European Internal Market. The 3rd Package provides a mechanism for network rules, which are to be applied in the whole European market.
2008 Status Review Gas Retail
Ref. C08-URB-15-04
23/83
3 Gas Retail
3.1 Introduction
2007 was a landmark year for the gas sector, like in electricity, with almost all EU 27 countries fully opening the retail gas market to all customers by the beginning of the second semester. (Countries like Finland, Portugal, Latvia and Greece are exceptions due to their derogation status (Latvia and Portugal until 2010). Malta and Cyprus do not currently have a gas market. In 2007 gas prices increased for both domestic and small industrial customers. In terms of competition, despite some steps forward, indicators do not show significant steps towards the achievement of effective competition in national gas markets in the short-term.
3.2 Prices
Regarding domestic customers (Eurostat category D3), a wide range of prices were reported, with Sweden (11.13 ct/kWh) showing the highest prices, more than three times the price offered in Lithuania21 .
21
When comparing household prices in Member States, differences in purchasing power should be taken into account.
Key points:
• High concentration of gas markets impedes development of effective competition
• Gas retail competition is almost non-existent in most Member Sates
• More stringent market monitoring is necessary to support customer confidence in competition
• Coexistence of competitive and regulated prices is difficult to balance. Regulated prices that are not market-based further reduce the potential for competition

2008 Status Review Gas Retail
Ref. C08-URB-15-04
24/83
Figure 11: Composition of total gas prices for standard domestic customers (Eurostat category D3) in 2007
1.50
2.10
1.95
2.04
2.51
2.78
2.44
2.63
3.45
2.40
2.64
2.41
2.11
2.66
3.49
3.07
3.60
3.94
8.95
0.66
0.54
0.72
1.08
0.79
0.74
0.88
1.51
1.30
1.42
1.41
2.31
1.29
1.19
1.05
0.85
1.39
2.18
0.39
0.47
0.51
0.69
0.54
0.38
0.00
1.01
0.78
0.82
0.71
1.55
1.49
2.31
2.73
4.82
0.76
0.78
0.22
0.0 2.0 4.0 6.0 8.0 10.0
LT
EE
RO
PL
HU
LU
SK
EL
UK
BE
FR
SI
ES
AT
DE
IT
NL
DK
SE
ct\kWh
Energy price Network Charges Levies Taxes
Levies:BE: 0,09 EL: 0,002
SI: 0,282 AT: 0,251
DE: 0,07 DK: 0,04
ES: 0,018
In comparison to 2006, the average price in 2007 increased by about 4.8%, with the Slovakia showing the largest increase.
Figure 12: Development of total gas prices for standard customers D3 from 2006 to 2007
2.7
2 3.1
1
3.8
4
3.4
3
4.1
2
3.8
0
1.8
6
3.9
3
4.5
5
5.6
3 6.1
1
6.3
1
9.5
6
2.5
5 3.1
1
3.1
7
3.8
0
3.8
3
3.9
0
4.1
0 4.4
3 4.8
0
4.9
2
5.7
5 6.2
4
6.4
3
10
.19
4.8
6
4.9
44.8
34.59
4.80
0
2
4
6
8
10
LT
EE
RO PL
HU
LU
SK
UK
BE
FR SI
AT
DE IT
DK
ct\kWh
2006 2007 Average 2006 Average 2007

2008 Status Review Gas Retail
Ref. C08-URB-15-04
25/83
In 2007, with respect to prices related to large industrial costumers (Eurostat category I4), Sweden and Germany had the highest average prices of the available sample and were the only two countries with a price level over 4 ct/kWh. Estonia reported the lowest average price of 2.31 ct/kWh, almost half the price paid by industrial customers in Sweden. Figure 13: Composition of total gas prices for large industrial customers (Eurostat
category I4) in 2007
1,81
1,86
1,49
1,88
2,10
2,35
1,89
2,23
2,46
1,65
2,03
2,19
2,42
2,91
3,90
0,15
0,13
0,38
0,38
0,26
0,41
0,38
0,10
0,17
0,68
0,60
0,20
0,35
0,17
0,36
0,35
0,47
0,73
0,41
0,38
0,50
0,47
0,34
0,74
0,50
0,59
0,53
1,15
0,0 0,5 1,0 1,5 2,0 2,5 3,0 3,5 4,0 4,5
EE
BE
DK
LT
ES
EL
PL
FR
IT
FI
RO
SI
HU
DE
SE
ct/kWh
Energy price Network Charges Levies Taxes
Levies:BE: 0,01 EL: 0,002
SI: 0,282 DK: 0,04
Despite the fact that the European average price remained stable from 2006 to 2007, prices for large industrial customers in Lithuania and Poland increased by 19% and 12% respectively, while, in Romania and Slovenia prices decreases by approximately 10%.

2008 Status Review Gas Retail
Ref. C08-URB-15-04
26/83
Figure 14: Development of total gas prices for large industrial customers (Eurostat category I4)
2,3
0
2,4
0
2,2
4
2,4
8
2,8
2
3,0
6
3,0
7
3,5
1
3,6
1
3,5
8
4,2
8
2,3
1 2,4
7 2,6
7
2,7
8
2,8
0
2,9
7
3,0
7
3,1
3
3,2
6
3,3
0
4,2
3
3,00
3,03
0
1
2
3
4
5
EE BE LT PL FR IT FI RO SI HU DE
ct/kWh
2006 2007 Average 2007 Average 2006
Prices for small industrial customers in Sweden and Denmark are the two highest in the chart, Estonia and Lithuania are the lowest. The difference between the highest and lowest prices is 4.63 ct/kWh. Figure 15: Composition of total gas prices for small industrial customers (Eurostat
category I1)
1.58
2.10
2.88
1.95
1.97
2.10
2.51
3.06
2.63
2.62
0.81
2.45
2.61
2.89
3.34
3.94
5.61
0.66
0.15
0.70
1.09
0.73
0.46
1.44
0.94
0.68
0.95
0.87
0.79
0.93
1.39
1.66
0.40
0.41
0.50
0.67
0.53
0.37
0.72
0.13
0.93
1.45
1.40
1.16
0.59
1.94
1.72
0.0 1.0 2.0 3.0 4.0 5.0 6.0 7.0 8.0
LT
EE
IE
RO
PL
ES
HU
LU
EL
FR
SK
BE
AT
IT
DE
DK
SE
ct\kWh
Energy price Network Charges Levies Taxes
Levies:DK: 0,04 DE: 0,06
AT: 0,223 BE: 0,09
EL: 0,002 ES: 0,009

2008 Status Review Gas Retail
Ref. C08-URB-15-04
27/83
Small industrial customers saw an increase in the average price of 1.8%, with Slovakia registering the highest percentage increase, while Romania reported the most significant decrease. Figure 16: Development of total gas prices for small industrial customers (Eurostat
category I1)
2.7
2
1.3
5
5.6
0
6.6
5
2.6
5
3.1
5
5.1
6
5.6
2
5.7
3
7.0
9
2.6
5
3.3
5 3.7
7
3.7
3
4.1
3
4.2
9
4.1
4
5.0
0
5.4
8
2.6
4
3.7
4
3.8
9
3.8
2
4.2
8
1.6
2
4.4
2
4.07
4.14
0
1
2
3
4
5
6
7
8
LT
EE
PL
RO
LU
HU
FR
SK
BE
AT IT
DE
DK
ct/kWh
2006 2007 Average 2006 Average 2007
3.3 Switching
3.3.1 Switching rates In many countries, regulated and competitive market prices coexist. This often distorts comparisons of switching data, as churn between regulated and competitive markets within the countries may dominate switching rates. Gas retails markets have not developed as expected; major improvements have yet to be achieved. The low switching rates observed in the retail market support that conclusion. Only few countries (3 by eligible meter points and 4 by volume) have reported a switching rate of at least 1% per year. Relevant switching rates can only be found in Member States where the wholesale market provides competitors with at least a minimum access to gas volumes. On the other hand, 8 countries by meter points, and 7 by volume reported 0% switching rates. This indicates that full market opening in 2007 was not effective in all countries. Despite that, available data shows that retail markets are developing in some countries, like Denmark and Spain, with switching rates of 29% and 20% in terms of volume of gas consumed, respectively. This may spark competition when/if the incumbent tries to sell (spare) volumes to new customers.

2008 Status Review Gas Retail
Ref. C08-URB-15-04
28/83
Figure 17: Annual switching rates by eligible meter points and by volume for the total market
0,00%
5,00%
10,00%
15,00%
20,00%
25,00%
30,00%
35,00%
DK ES HU DE
(by eligible volume) 2006 2007
0,00%
2,00%
4,00%
6,00%
8,00%
10,00%
12,00%
BE ES DE DK IT AT
(by number of eligible meter points) 2006 2007
Looking at smaller customers (small industry and households), the switching rates are very low. Except for Spain with a 15% switching rate (volume), the remaining 5 countries reported switching rates of less than 5%, while 6 countries reported a rate of 0%. In terms of the number of customers that have changed supplier (meter points), most Member States have reported a switching rate of less than 5%. However, the United Kingdom reported a switching rate of 18.4%, or approximately 4 million customers changing suppliers. 7 countries reported a switching rate of 0%. These low switching rates may reflect a number of factors, including low levels of information available to the customers. Regulators should pay particular attention to the provision of information to customers, e.g., by implementing guidelines on the provision of information to be implemented by suppliers. Figure 18: Annual switching rates by eligible meter points and by volume for households and
small industrial customers
0,00%
2,00%
4,00%
6,00%
8,00%
10,00%
12,00%
14,00%
16,00%
ES HU DK DE IT AT
(by volume)2006 2007
0,00%
2,00%
4,00%
6,00%
8,00%
10,00%
12,00%
14,00%
16,00%
18,00%
20,00%
UK NL ES DE DK IT AT FR BE
(by number of eligible meter points) 2006 2007
For medium size industrial customers, the figures available seem to show their awareness of different offers available from gas suppliers. The annual switching rates for these customers are higher than those for smaller customers. Hungary and Denmark with, respectively, 46% and 35% present the highest switching rates in terms of consumption moved between suppliers in 2007. In terms of the number of consumers switching suppliers the results vary between 0% and 20% in Spain. 9 countries reported switching rates of 0%.

2008 Status Review Gas Retail
Ref. C08-URB-15-04
29/83
Figure 19: Annual switching rates by eligible meter points and by volume for medium size industrial customers
Switching rate in medium size industry
(by volume)
0.00%
5.00%
10.00%
15.00%
20.00%
25.00%
30.00%
35.00%
40.00%
45.00%
50.00%
HU DK ES IT DE AT
2006 2007Switching rate in medium size industry
(number of eligible meter points)
0.00%
5.00%
10.00%
15.00%
20.00%
25.00%
30.00%
ES DK IT AT DE CZ BE
2006 2007
For large industry, available data shows that this customer category is making use of market opportunities. However switching rates still are quite modest in terms of volume as well as metering points for most countries. In each indicator, 9 countries had reported 0% for switching rates. Figure 20: Annual switching rates by eligible meter points and by volume for large industrial
customers
0%
10%
20%
30%
40%
50%
60%
70%
80%
90%
HU ES DE AT
(by volume) 2006 2007
0%
5%
10%
15%
20%
25%
30%
ES IT CZ DE AT
(number of eligible meter points) 2006 2007
In some countries switching seems more likely to be triggered by changing relations between regulated and free market prices than by competition between competitors. The transition to a liberalised market may require the co-existence of regulated and market prices. During the transitional period, the regulated prices should serve to protect customers that are less informed and less advantaged from potential abuses by market participants with dominant positions. It is important to stress that the goal, which should be reached as quickly as possible, is to have facilitated the development of an effective, competitive and transparent market. However, the evidence shows that some retail markets are more driven by regulated prices than by the interaction of competitors. For a sustainable market, it is necessary to assure that there are a sufficient number of market players and that the market is transparent and non-discriminatory. Market prices must

2008 Status Review Gas Retail
Ref. C08-URB-15-04
30/83
be accurate, transparent and cost-reflective. To ensure transparency and non-discrimination, market monitoring is a key factor, particularly when competition is not well established.
3.4 Market shares The market share of the three largest suppliers in the EU retail markets reflects a very high market concentration in most of the 16 European countries (out the 26 that provided data). 14 of the 16 countries showed the three largest suppliers with shares of more than 70%, reaching 98% or more in 8 countries. Germany is the only country reporting a share of the three largest suppliers below 60%. In comparison with 2006, the 2007 market shares of the three largest suppliers in the retail market remains almost the same, with three significant difference: in France, the index of the three largest suppliers has increased as the relevant market has changed due to full market opening; Romania and Germany have seen the market shares of their three largest suppliers decrease, respectively, from 90.6% to 83% and from 30.9% to 26.3%; Belgium and Luxemburg with no data in 2006, are now included in the group of countries with a highly concentrated retail gas market. Figure 21: Market shares of the three largest suppliers in national retail markets
100.0
%
100.0
%
100.0
%
100.0
%
100.0
%
100.0
%
99.0
%
90.0
%
86.0
%
90.6
%
73.0
%
75.0
%
66.5
%
30.9
%
100.0
%
100.0
%
100.0
%
100.0
%
100.0
%
100.0
%
99.0
%
98.5
%
92.3
%
88.5
%
86.0
%
83.0
%
75.0
%
74.0
%
66.5
%
26.3
%
0.0%
10.0%
20.0%
30.0%
40.0%
50.0%
60.0%
70.0%
80.0%
90.0%
100.0%
EL IE LV LT PL SK EE FR BE LU SI RO HU ES IT DE
2006 2007
In the following Figure, the number of companies with at least 5% market share is compared with the market share of the three largest suppliers in the retail market in 2007 for each of the represented countries. The markets with highest concentration are characterised by very high market shares of the three largest suppliers combined with a relatively low number of companies that have at least 5% market share.

2008 Status Review Gas Retail
Ref. C08-URB-15-04
31/83
Figure 22: Number of companies with at least 5% market share in comparison to market shares of the three largest suppliers in the national retail market in 2007
BE
SK FR
DE
PL
HU
ES
SI
LU
EL
RO
EE
LT
IT
0
0.1
0.2
0.3
0.4
0.5
0.6
0.7
0.8
0.9
1
0 1 2 3 4 5 6 7 8
Number of companies >= 5% market share
Mark
et share
of th
e 3
larg
est suppliers
3.5 Underground storage The flexibility associated with the use of a scarce resource, such as underground storage facilities, is a factor with a major role in the composition of the end-user price of natural gas. Access to these storage facilities may be regulated or negotiated. The flexibility regarding underground storage is generally seen as a wholesale market or security of supply issue. Nevertheless, access to gas storage, as well as the price paid for the use of such infrastructure, may have a significant role for competitive gas retail markets. Lack of access may be a barrier to entry for new entrants trying to develop a competitive offer.
3.6 Conclusions The data provided within the 2007 National Reports shows significant diversity in the level of liberalisation within the gas retail markets. One of the main points that can be drawn from this is the fact that full retail market opening is not sufficient to develop a competitive European gas market. Measures must be taken to achieve market integration, at least on a national level, which would facilitate the development of competition and increase customer choice. This would also reduce the market power of incumbents and might serve as the basis for future dynamic competition. The fact that markets for small customers are very narrow, in effect mostly the area of the local distribution grid, underlines the importance of independence of distribution companies in order to achieve competition in retail markets.

2008 Status Review Gas Retail
Ref. C08-URB-15-04
32/83
The low level of switching rates for households and small industrial customers reflects that competitive markets do not yet exist on a national level. Significant efforts will need to be made in this area by competent national authorities. On the contrary, the data shows that the competitive retail markets for larger industrial customers have at least partly been developed. Competition is easier to implement for this segment as they act in a wider scale. Therefore, regulators and competition authorities or other competent entities must reinforce the need to monitor the retail market, ensuring transparency and non-discrimination, to allow effective competition to develop within the national retail markets. In conclusion, markets on a national level remain highly concentrated. In spite of the steps taken towards liberalisation in retail gas markets of the EU in 2007, the 2007 data reflects that there is still a long way to go to the implementation of a single internal gas market in the EU. To facilitate this goal, further improvements within each Member State are required, particularly in respect of market monitoring and enforcement as well as increasing consumer engagement in markets by making them aware of the choices available to them and how to make the most of them.

2008 Status Review Electricity Wholesale
Ref. C08-URB-15-04
33/83
4 Electricity Wholesale
4.1 Generation and capacity Generation capacity in 2007 increased by approximately 2.0% in the countries that reported for both 2006 and 2007, as shown in Figure 23. The biggest increase was in Lithuania, with about 12.5%. The total peak load showed a minor increase of approximately 1.5% (based upon data provided by the countries that have reported for both years). Lithuania reported the largest increase in total peak load, with an increase of 19.6 %. Figure 23: Generation capacity in 2007
Generation capacity 2007
0
100
200
300
400
500
600
700
800
900
Ger
man
y
Franc
e
Spa
inIta
lia UK
Rest A
ll
Country
GW
Figure 24 shows the electricity generation in 2007. There was a minor increase from 2006 and 2007 (based upon data provided by the countries that have reported for both years). The largest increase was in Estonia with 25.5%.
Key points:
• Concentration on a national scale is slightly increasing
• Changes in Market Design promote liquidity in some Member States

2008 Status Review Electricity Wholesale
Ref. C08-URB-15-04
34/83
Electricity imports show a minor increase from 2006 to 2007 (based upon data provided by the countries that have reported for both years). The largest increase in imports was in UK with a 69.4% increase. Italy showed the largest volume of imports in 2007, 48.5 TWh. Other countries have reported increased exports from 2006 to 2007. Overall, total exports increased by 4.8% (based upon data provided by the countries that have reported for both years). The largest increase was in Latvia with 550.3%, while Germany exported the greatest volume of electricity in 2007 - 56 TWh. Figure 24: Generation of electricity in 2007
Total net generation volume 2007
0
500
1000
1500
2000
2500
3000
3500
Germany France UK Italy Spain Rest All
Country
TW
h
Figure 25 shows the consumption of electricity in 2007. Compared to 2006 it shows a minor increase. The increase was highest in Latvia with 14.8%.

2008 Status Review Electricity Wholesale
Ref. C08-URB-15-04
35/83
Figure 25: Electricity consumption in 2007
Electricity Consumption 2007
0
500
1000
1500
2000
2500
3000
3500
Ger
man
y
Franc
eUK
Italy
Spa
inRest A
ll
Countries
TW
h
4.2 Market dominance In 2007, there is a slight increase in the market share of the 3 biggest generators by capacity. For the 26 countries that have reported for both 2006 and 2007, weighted in terms of each country’s capacity, there is an increase from 67.8% to 69%. If looking at the average percentage for the 25 countries, the market share has increased from about 73.1% to 73.5%. Even though this is not a considerable change, it shows increased market concentration, which can act as a barrier to competition. Percentages range from Cyprus, which has reported 100% to Norway and UK, with respectively 40% and 41%.

2008 Status Review Electricity Wholesale
Ref. C08-URB-15-04
36/83
Figure 26: Concentration in generation capacity (CR3)
Percentage 3 biggest companies by
capacity 2007
0
1
2
3
4
5
6
7
40-49 % 50-59 % 60-69 % 70-79 % 80-89 % 90-99 % 100-100
p%
Percent age 3 b igg est companies
The Herfindahl Hirschman Index (HHI, showing market concentration as the sum of squared shares of individual companies) for the average of the countries which have reported for both years shows an increase from 4100 in 2006 to 4424 in 2007. However, a more relevant picture is given by using a weighted index in terms of percentage share of the total net generation volume. This shows a slight decrease from 2006 to 2007, with a HHI in 2006 of 3685 and in 2007 of 3625. The index has risen in 6 countries and decreased in 7 countries.
In Belgium, Hungary, Luxembourg, Slovenia, Spain and the United Kingdom the HHI has increased. Even in countries like Italy, in which at national level the HHI has slightly decreased between 2006 and 2007, the HHI zone concentration, calculated on the effective sale and offers of energy in the three geographical zones in which the wholesale market is organised, evidences a strong presence of structural problems linked to the scarce development of competition on the supply side.
4.3 Market liquidity and transparency Increased trading on the power exchange, by spot and futures trading contributes to a more liquid and transparent wholesale market. Between 2006 and 2007, increased trading is evident in the EU markets. The volume of electricity traded at power exchange spot markets (day ahead) has increased by 25.3% or approximately 203 TWh for the 22 countries that have reported for both years (Figure 27: Trading volumes at PXs in 2006 vs 2007). Almost 30.7% of the total net generation volume was traded on spot in 2007. The differences in traded volumes can partially be attributed to different wholesale market designs. In some countries, market design supports trade taking place at power exchanges (e.g., Italy and the Nordic countries).

2008 Status Review Electricity Wholesale
Ref. C08-URB-15-04
37/83
Figure 27: Trading volumes at PXs in 2006 vs 2007
Volume of electricity traded at power exchange spot
market (day ahead) 2006 and 2007
-
200.0
400.0
600.0
800.0
1,000.0
1,200.0
Italy
Spa
in
Swed
en
Ger
man
y
Norway
Rest
Total
Country
TW
h 2006
2007
However approximately 33% of the increase in traded volumes can be explained by changes in the legal framework in Spain from 2005 to 2006 (which reverted back to the initial 2005 position in 2007). The decrease in 2006 was a result of a Royal Law Decree concerning one type of contract that was no longer traded on the spot market. Even though only about 30.7% of the total net generation volume in 2007 was traded on the power exchange spot markets, the development is taken as a positive sign, as it increases market transparency and liquidity. For instance, in the Nordic market, the electricity traded on spot (Nord Pool Spot AS) has increased by 13.2%; in 2007, approximately 69% of the electricity consumption was traded on the power exchange spot market (the rest were traded bilaterally). This is a considerable increase from 2006, where spot market trade was approximately 61.4%. The same tendency is seen in countries like Italy (58.2% to 65.2%), Germany (15.6% to 21.6%) and France (6.2% to 9.2%)22. Following is a brief summary of the regulation of Nord Pool Spot AS (handling the electricity traded on spot in the Nordic market):
22
Percentages are traditionally given as ratios to the national consumption; however as exchanges provide
trading facilities for more and more locations (Nordpool for Germany, EEX for Austria and Switzerland, EXAA for Germany, etc) careful interpretation is required. Rising percentages (if all trades are added) do not necessarily mean more liquidity.

2008 Status Review Electricity Wholesale
Ref. C08-URB-15-04
38/83
The Nordic Power exchange - Regulation of Nord Pool Spot AS
Nord Pool Spot holds a licence (“Markedsplasskonsesjon”) under the Energy Act (2003) of Norway. The licence is granted by the Norwegian Water Resources and
Energy Directorate (NVE) to operate an organised marketplace for trade in physically delivered power contracts. Nord Pool spot is under the supervision of NVE. The licence requires that a market surveillance function is established, and Nord Pool ASA and Nord Pool Spot have agreed that the Market surveillance for
Nord Pool ASA shall act for both companies. The rulebook for Nord Pool Spot regulates the obligations and right of the market participants in trading and settlement, and constitutes the rules that the spot market participants must
comply with. This example shows that power exchanges may impose specific transparency requirements on traders if they are given an important role in market design (such as Nordpool for cross-border trades in market splitting). The electricity traded in the futures market, basically on the Nordic Power Pool by the Nordic countries (but also among others by Germany, France and Spain), has increased by about 15.5% for the 16 countries that have reported for both years (OTC clearing at power exchanges is not included). In terms of a well functioning market, it is not only volumes that are important measurements of the activity on the power exchanges; a significant number of actors/traders are important as well. The number of active traders has increased by about 19% for the 14 countries that have reported for both 2006 and 2007. In total, there were 1,054 active traders participating in the 14 countries in 2007. Germany has the highest number of active traders with 192. For the Nordic countries, the combined total was approximately 30023.
23
This does not imply that there are over 1.000 traders in the EU; it is on the one hand a sign of liquidity, but also a sign of lack of integration as traders must be active on many trading venues.

2008 Status Review Electricity Wholesale
Ref. C08-URB-15-04
39/83
Figure 28: Number of active traders in 2007
Number of traders active at power exchange 2007
0
200
400
600
800
1000
1200
Germany Sweden Norway Romania Bulgaria Italy Rest Total
Country
Nu
mb
er
of
trad
ers
Another aspect of a well-functioning power exchange is how stakeholders view the power exchange. The figures below show an analysis of stakeholder views from two selected countries, Germany and Norway (from a Review and analysis of EU wholesale energy markets (The Moffat Associates Partnership – July 2008. Client European Commission – DG TREN)):

2008 Status Review Electricity Wholesale
Ref. C08-URB-15-04
40/83
A comparison shows, for instance, that in Germany, stakeholders are more sceptical of demand and supply transparency then in Norway. Furthermore, in Norway there is an absolute confidence in how representative the spot market price is. In Germany, the confidence is considerably lower. Regarding market integration, Austria reports that the high level of integration with the German pricing area is important, as it allows free trades between the two markets. At the same time, it influences liquidity on the Austrian Energy Exchange, EXAA, as in the integrated market EXAA provides similar products as EEX, the German exchange. Market integration therefore also allows more competition between trading venues.
Developments at power exchanges: In the UK, the total traded volume on the power exchange UKPX for 2007/8 was 17.1 TWh for all packages, where the total traded volume comprises half hour and four hour (EFA) block trades, this is around 2 TWh higher than 2006/7. France reports that vertical integration of trading, production/imports and supply activities within EDF and Gaz de France does not encourage historical operators to be active on wholesale markets, which leads to little market liquidity in futures. The fact that the majority of supply sources are under the control of former public monopolies, the scarcity of import capacity and the limitations of Energy release programmes (Virtual Power Plants (VPPs) and Gas Release) further reduces opportunities for competitive supply offers on wholesale markets, as new suppliers may not have their own resources. Poland reports that nearly all traded electricity is sold via bilateral contracts, which limits wholesale market liquidity. Transactions on the Day-Ahead Market of the Polish Power Exchange amounted to 2.2% of the total electricity sales to final customers, showing a low level of liquidity of the exchange market in Poland.

2008 Status Review Electricity Wholesale
Ref. C08-URB-15-04
41/83
4.4 Physical integration and market coupling Differences in trading regimes, in the calculation, allocation and management of available capacity are the primary obstacle to efficient use of existing capacity. The goal within the EU is to have fully integrated markets with harmonised rules on capacity. Implicit auctions and coordinated capacity allocation procedures may be used as a first step towards market integration, allowing for more efficient use of existing infrastructure. Full market integration Ireland and Northern Ireland are linked via a 600 MW AC ‘North-South’ interconnector. In the past, congestion was a significant issue on the North-South line. This issue has been resolved by the 2007 introduction of the Single Electricity Market (SEM), a joint electricity market between Ireland and Northern Ireland. The interconnector is now considered a transmission line within the SEM and is governed by common rules, facilitating the TSOs’ efforts to maximise use of the available capacity. Implicit Auctions Implicit auctions are a general term used to describe the merging of energy trade and capacity allocation activities into a single operation, thereby integrating the participating markets. Implicit auctions can take the form of market coupling or market splitting. Market coupling is a decentralised approach for markets with more than one PX, requiring a minimum degree of market harmonisation. Market splitting is a centralised approach, requiring a single PX operating in several countries, which divides markets into different regional zones by introducing a price differential to modify the flow of power. By reducing or increasing area prices, the power flow is altered until it matches the allocated grid capacity. Market splitting is, for instance, used in the Nordic Power Market to manage congestion. On the KONTEX interconnector, linking Germany and Eastern Denmark, it has been agreed that market splitting will be replaced by day-ahead market coupling, which will be implemented on the interconnectors between Germany and Denmark (both eastern and western) in the first quarter of 2009. In 2007, the Iberian Electricity Market (MIBEL) went live. MIBEL utilises market splitting to manage congestion between Spain and Portugal. As a next step, MIBEL is looking to implement market coupling with CWE. Increased market coupling and market integration should result in greater convergence of prices, but still there are considerable price differences. Due to its 15,500 MW of thermal transmission capacity into neighbouring countries, Austria reports that it is expects there to be strong integration of the wholesale markets among the neighbouring countries. In fact, the Austrian wholesale prices are in line with those in Germany, as a result of market integration.
France reports that CRE has asked RTE to raise its investment level to increase interconnection capacity, as they are currently considered to be insufficient to support the

2008 Status Review Electricity Wholesale
Ref. C08-URB-15-04
42/83
internal energy market. CRE has called upon RTE to make proposals in order to boost investment in new interconnectors. Poland reports that no significant changes took place in the electricity sector in reference to capacity interconnectors. Still the National Electricity System (NES) is rather isolated.
4.5 Conclusions Market dominance continues to be a significant issue in some countries. The market share of the 3 biggest generators has increased. Weighted in terms of each country’s capacity, their market share has increased from 67.8% in 2006 to 69% in 2007. If we only look at the unweighted average percentage for the 25 countries, the market share has increased from about 73.1% to 73.5%. Regarding market concentration in terms of the HHI, using a weighted index of the percentage share of the total net generation volume a slight decrease from 2006 to 2007 is observed. The HHI is 3685 in 2006 and 3625 in 2007. The index has risen in 6 countries and decreased in 7 countries. But if we only look at the unweighted average for the countries which have reported for both years, it shows an increase from 4100 in 2006 to 4424 in 2007. The volume of electricity traded at power exchange spot markets (day ahead) has increased by 25.3% or approximately by 203 TWh for the 22 countries that have reported for both years (Figure 27). Almost 30.7% of the total net generation volume was traded on spot in 2007. The futures market shows similar improvement, with an increased volume of electricity traded on the PX future markets of 15.5% from 2006 to 2007. Differences between Member States can partially be attributed to different wholesale market designs. In some countries, trading at power exchanges is “supported” by the operation of specific market activities on the PX. Increased market coupling and market integration should result in greater convergence of prices. However, considerable price differences remain between power exchanges, showing that markets are not yet fully integrated.

2008 Status Review Electricity Retail
Ref. C08-URB-15-04
43/83
5 Electricity Retail Directive 2003/54/EC set a deadline of 1 July 2007 for the complete liberalisation of electricity retail markets. In addition to the countries that already had opened their retail electricity markets for all customers before 1 July 2007 a number of countries opened the market fully from this date. As a result in the EU 27 and Norway (except Cyprus, Estonia and Malta) all electricity customers are now free to choose their supplier. In 2007 retail electricity markets are characterised by price increases for households customers in almost every country and for large industrial customers in more than half of the analysed European countries. While switching rates for households and small industrial customers are increasing in several countries, they remain low in many cases. As full market opening occurred only on 1 July 2007 in a number of countries, one could not possibly expect effective competition in these countries immediately. In contrast, switching rates for larger industrial customers are higher in a number of countries. The market shares of the largest suppliers in the retail market are often at a high level and have changed only slightly in 2007.
5.1 Prices As regards household customers, Denmark, Italy and Germany ranked highest in price level. The lowest prices for this type of customer can be observed in Estonia, Latvia and Greece however varying purchasing power is not taken into account.
Key points:
• In many Member States competition is more likely to occur between the regulated and competitive prices than between different suppliers.
• Most markets for small customers are geographically very narrow, which implies a high level of market power for incumbents.
• Effective monitoring powers for NRAs are necessary to protect customers.

2008 Status Review Electricity Retail
Ref. C08-URB-15-04
44/83
Figure 29: Composition of total electricity prices for households (Eurostat category Dc) in
2007
5.20
8.33
5.79
6.70
6.83
8.51
6.80
5.74
6.26
5.72
4.75
4.75
4.34
3.36
4.06
8.55
2.12
2.90
4.72
8.45
6.28
5.85
7.38
4.94
4.90
3.16
3.95
3.89
4.19
3.92
4.40
5.91
0.42
4.00
3.92
1.78
2.66
0.75
13.97
4.80
5.22
4.09
2.05
3.40
2.41
2.17
2.99
2.82
1.98
1.82
2.38
2,15
1,54
1.25
1.30
0.84
1.96
1.00
0.72
0.00 5.00 10.00 15.00 20.00 25.00 30.00
Denmark
Italy
Germany
Austria
Luxembourg
Cyprus
Belgium
Spain
Portugal
Hungary
France
Finland
Slovenia
Romania
Poland
Greece
Latvia
Estonia
cent/kWh
energy price network charges levies taxes
The total electricity price for household customers shows a large spread. This could be due to different levels of levies and taxes. Moreover, the level of energy prices tend to be higher in countries with higher end-user prices however there are some exemptions to this trend. The influence of the network charges on the price level for households is rather inconsistent.

2008 Status Review Electricity Retail
Ref. C08-URB-15-04
45/83
Figure 30: Composition of total electricity prices for large industrial customers (Eurostat category Ig) in 2007
7,47
8,76
5,47
7,10
4,16
5,24
4,49
5,50
3,71
4,92
2,70
4,63
5,42
3,30
2,91
2,70
2,38
3,49
1,40
1,51
0,90
4,24
1,01
0,92
0,90
1,77
1,26
1,30
1,77
0,99
1,24
1,68
0,91
2,97
2,40
1,66
3,06
1,42
1,40
1,20
0,98
1,121,37
1,21
0,78
1,54
1,15
1,45
0,00 2,00 4,00 6,00 8,00 10,00 12,00 14,00
Cyprus
Italy
Germany
Belgium
Slovakia
Austria
Hungary
Slovenia
Poland
Portugal
Denmark
Spain
Greece
France
Norway
Latvia
Estonia
cent/kWh
energy price network charges levies taxes
The spread of total electricity prices for large industrial customers is also remarkable. Countries with a higher price level show a tendency towards higher values for energy as well as for taxes and levies with some exceptions. The level of network charges, on the other hand, is rather comparable, except for two countries (Slovakia and Cyprus) with relatively higher network charges. The percentage share of the energy price in relation to the total electricity price is normally higher for large industrial customers than for households. For large industrial customers this share lies between 40% and 85% (59% on average) whereas the range for households is between 20% and 87% (41% on average) in the countries analysed.

2008 Status Review Electricity Retail
Ref. C08-URB-15-04
46/83
Figure 31: Development of total electricity prices for households (Eurostat category Dc)
8.0
5
6.4
1
9.8
6
9.7
9
10
.60
11
.61
12
.13
10
.20
12
.47 15
.41
14
.70
13
.72
16
.04
14
.44 17
.44
18
.89 2
2.4
4
24
.76
8.0
7
8.2
0 9.8
4
10
.86
11
.08
11
.30
11
.49
12
.19
13
.02
13
.31
13
.46
15
.70
15
.72
15
.91
17
.39
18
.01
19
.95 2
3.3
4
25
.43
0.00
5.00
10.00
15.00
20.00
25.00
30.00
EE LV EL PL RO SI FI FR HU PT ES BE CY LU AT UK DE IT DK
cen
t/kW
h
2006 2007
The development of total electricity prices for household customers shows price increases in 2007 compared with 2006 in almost every country analysed. For industrial customers, the total electricity prices increased in more than half of the countries analysed in 2007. Figure 32: Development of total electricity prices for large industrial customers (Eurostat
category Ig)
4,3
8
3,5
1
8,2
4
5,9
8
8,8
4
7,5
2
7,4
0
6,4
1
6,5
5
8,8
8
8,5
1
10
,30
11
,12 12
,46
11
,52
4,3
7
4,3
8 5,5
8
6,0
8
6,4
0
6,4
2
6,4
3
6,5
3
6,6
8 8,0
4
8,0
7
9,9
4
10
,44
10
,94 1
2,8
3
12
,86
10
,70
0,00
2,00
4,00
6,00
8,00
10,00
12,00
14,00
EE LV NO FR EL ES DK PT PL SI HU AT SK BE DE IT CY
ce
nt/
kW
h
2006 2007

2008 Status Review Electricity Retail
Ref. C08-URB-15-04
47/83
The development of the electricity price components reveal that the total electricity prices for household customers increased due to rising energy prices. Moreover, higher levies and taxes contributed to this price increase. In a number of countries the percentage variations of the network charges are lower compared to the other price components (energy price, levies and taxes). As a result, the influence of changes in network charges on the total price variations is rather secondary. Furthermore in some countries the total prices for household customers increased despite reduced network charges. Table 2: Change of electricity price components (2007 vs 2006) for households (Eurostat
category Dc)
Dc total price
Country
Energy price
in %
Network charges
in %
Levies
in %
Taxes
in % in % in cent/kWh
Latvia (LV) 6.00 33.33 91.18 30.00 27.97 1.79
Hungary (HU) 38.56 15.50 23.26 27.59 27.61 2.82
Cyprus (CY) 26.00 -0.90 -1.79 16.53 14.56 2.00
Romania (RO) 98.46 -9.67 0.00 16.47 13.19 1.29
Poland (PL) 8.62 11.46 0.00 10.19 10.16 1.00
Belgium (BE) 13.33 2.08 0.00 3.03 6.80 1.00
Portugal (PT) -5.91 9.03 48.94 19.67 6.70 0.83
Slovenia (SI) 24.77 -7.92 -0.35 12.22 6.57 0.70
Germany (DE) 28.95 -13.97 7.26 12.99 5.61 1.06
Italy (IT) -4.09 5.96 25.00 9.75 4.02 0.90
Austria (AT) 61.01 5.03 0.00 3.28 20.43 2.95
Denmark (DK) -5.45 0.43 129.85 0.58 2.71 0.67
France (FR) 4.34 0.00 0.00 0.91 0.49 0.06
Estonia (EE) 0.00 0.00 0.00 2.04 0.31 0.03
Finland (FI) -0.6 -1.75 0.00 -0.7 -1.03 -0.12
Luxembourg (LU) 6.27 -1.34 -37.50 -0.79 -0.78 -0.13
Spain (ES) -21.48 -8.41 14.36 -13.00 -12.65 -1.95
Total electricity prices developed quite differently in 2007 among the European countries analysed. The variations of total electricity prices for household customers and large industrial customers in % as well as in ct/kWh are heterogeneous and spread widely. Table 3: Change of electricity price components (2007 vs 2006) for large industrial customers
(Eurostat category Ig)

2008 Status Review Electricity Retail
Ref. C08-URB-15-04
48/83
5.2 Switching
5.2.1 Switching rates Supplier switching among smaller customers is increasing, but remains at a low rate in a number of countries. This is even true for those countries that had fully liberalised their markets before 1 July 2007. As indicated in a few National Reports this can be explained by poor switching awareness among household customers and passivity on the suppliers’ side due to a lack of competition in the market. The highest level of switching rates in small industry and household customers can be observed in the UK, where a steady increase in supplier changes culminated in five million account switches in 2007. This corresponds to a switching rate by eligible meter points of 19.1%. Retail markets for household customers in Netherlands, Norway and Sweden have also been quite competitive resulting in switching rates by eligible meter points between 8.5% and 9.5% in 2007. In many countries, however, the annual switching rate for households in terms of eligible meter points is between 0% and some 2%. The annual switching rates for larger industrial customers are noticeably higher in several countries compared to smaller customers as far as data are available. Comparable to the household sector, the switching rates for industrial customers reveal a large spread in the countries analysed with low switching rates on the one hand and a higher switching intensity on the other hand.
Ig total price
Country
Energy price
in %
Network charges
in %
Levies
in %
Taxes
in % in % in cent/kWh
Latvia (LV) 22.73 0.00 91.18 0.00 24.86 0.87
Slovenia (SI) 27.68 3.10 -10.14 27.98 22.87 1.50
Slovakia (SK) 41.98 9.84 5.56 22.06 22.68 1.93
Austria (AT) 22.43 0.00 3.28 2.68 11.94 1.06
Cyprus (CY) 18.62 -0.91 -1.79 13.93 11.64 1.34
Poland (PL) 13.79 -11.46 0.00 4.15 4.18 0.27
Belgium (BE) 4.41 0.00 0.00 4.35 3.88 0.40
Italy (IT) 5.82 1.82 11.77 -25.96 3.01 0.38
France (FR) 2.48 0.00 0.00 1.40 1.67 0.10
Estonia (EE) 0.00 -2.48 0.00 2.84 -0.32 -0.01
Germany (DE) -7.76 -8.48 16.47 10.41 -1.62 -0.18
Portugal (PT) -18.07 33.67 1.82 12.86 -11.70 -0.87
Denmark (DK) -40.79 0.00 90.12 4.26 -14.49 -1.09
Spain (ES) -24.35 -47.95 -35.00 -27.67 -27.38 -2.42
Norway (NO) -43.50 8.73 0.00 -32.12 -32.28 -2.66

2008 Status Review Electricity Retail
Ref. C08-URB-15-04
49/83
Table 4: 2007 Switching rates in different countries (%)
Country
In large industry
[meter points/ volume]
In medium-sized industry
[meter points/ volume]
In small industry and households
[meter points/ volume]
In the whole retail market
[meter points / volume]
Austria (AT) 9.5 / 7.3 2.1 / 2.1 1.5 / 1.5 - / -
Belgium (BE) 1.0 / - - / - - / - 10.1 / -
Bulgaria (BG) 35.0 / 48.6 0.0 / 1.1 0.0 / 0.0 0.0 / 12.7
Cyprus (CY) 0.0 / 0.0 0.0 / 0.0 0.0 / 0.0 0.0 / 0.0
Czech Republic (CZ) 6.0 / 6.0 3.0 / 3.0 0.8 / 0.1 0.8 / 0.8
Denmark (DK) - / - 20.7 / 20.8 2.8 / 6.4 3.0 / 13.7
Estonia (EE) 0.0 / 0.0 0.0 / 0.0 0.0 / 0.0 0.0 / 0.0
Finland (FI) - / - - / - - / - 4.0 / -
France (FR) 1.2 / - 0.0 / - 2.2 / - 0.4 / -
Germany (DE) 5.5 / 13.2 4.7 / 9.7 3.2 / 4.2 3.4 / 10.0
Greece (EL) - / 0.0 - / 0.0 - / 0.0 0.0 / 0.0
Ireland (IE) - / - - / - 0.4 / - - / -
Italy (IT) 28.2 / 1.2 22.6 / 7.0 1.9 / 4.0 1.9 / 4.6
Latvia (LV) 0.0 / 0.0 3.0 / 2.0 0.0 / 0.0 1.0 / 1.0
Lithuania (LT) 0.0 / 0.0 0.0 / 0.0 0.0 / 0.0 0.0 / 0.0
Luxembourg (LU) 11.4 / 29.1 0.2 / 0.4 0.2 / 0.2 0.2 / 15.0
Netherlands (NL) - / - - / - 8.5 / - - / -
Norway (NO) - / - 7.6 / - 8.6 / - 8.5 / -
Poland (PL) - / 17.0 - / 0.1 - / 0.0 - / 7.8
Portugal (PT) - / - 3.9 / 14.1 2.2 / 5.2 2.2 / 7.2
Romania (RO) 4.4 / 6.2 3.2 / 7.1 0.1 / 0.9 - / -
Slovakia (SK) 2.0 / - 0.0 / 0.0 0.0 / 0.0 2.0 / 2.0
Slovenia (SI) 0.0 / 0.0 10.4 / 6.5 0.4 / 4.5 0.4 / 3.6
Spain (ES) 18.0 / 10.0 7.0 / 22.0 2.0 / 3.0 2.0 / 10.0
Sweden (SE) 10.3 / 8.7 9.5 / 10.4 10.0 / 9.1
United Kingdom (UK) - / - - / - 19.1 / - - / -

2008 Status Review Electricity Retail
Ref. C08-URB-15-04
50/83
Figure 33: Development of annual switching rates by eligible volume for household and small industrial customers
0,0
0
0,0
0
0,0
0
0,0
0
0,0
0
0,0
0
0,0
0
0,1
0
0,0
0 1,0
0
5,0
0
2,5
5
4,1
0
2,7
0
9,8
0
0,0
0
0,0
0
0,0
0
0,0
0
0,0
0
0,0
0
0,0
0
0,1
8 0,9
3 1,5
0
3,0
0 4,0
0
4,2
3 5,2
0
6,4
0
10
,40
1,4
6
0,1
0
0,0
0
4,5
0
0
2
4
6
8
10
BG CY EE EL LV LT SK PL CZ LU RO AT ES IT DE SI PT DK SE
%
2006 2007
Figure 34: Development of annual switching rates by eligible meter points for
households and small industrial customers
0,0
0
0,0
0
0,0
0
0,0
0
0,0
0
0,0
0
0,0
0
0,2
0
0,2
0
1,0
0
3,0
0
0,4
0
1,2
0
5,6
0
11
,90
7,8
0
18
,00
0,0
0
0,0
0
0,0
0
0,0
0
0,0
0
0,0
0
0,0
7
0,1
9
0,4
0
0,4
0
0,8
0
1,5
0
1,9
0
2,0
0
2,2
0 3,1
8
8,5
0
8,6
3 9,5
0
19
,10
2,8
0
2,2
0
0,00
2,00
4,00
6,00
8,00
10,00
12,00
14,00
16,00
18,00
20,00
PL BG CY EE LV LT SK RO LU SI IE CZ AT IT ES FR PT DK DE NL NO SE UK
%
2006 2007

2008 Status Review Electricity Retail
Ref. C08-URB-15-04
51/83
In 2007 the annual switching rates for household customers and small industrial customers increased in several countries, sometimes even by a multiple, but nonetheless remained often at a low level. In a number of countries the household switching rates are zero; however these markets either were not fully open in 2007 (Cyprus and Estonia) or did not open the market fully until 1 July 2007 (Bulgaria, Greece, Latvia, Lithuania, Poland, and Slovakia). Figure 35: Development of annual switching rates by eligible volume for large industrial
customers
0,0
0
0,0
0
0,0
0
0,0
0
0,0
0 4,0
0
5,6
0 9,6
0
9,0
0
14
,15
15
,84
10
,90
0,0
0
0,0
0
0,0
0
0,0
0
0,0
0
0,0
0
1,2
0
6,0
0
6,2
2
7,3
0
8,7
0
10
,00
16
,95
29
,10
48
,60
13
,19
0,00
5,00
10,00
15,00
20,00
25,00
30,00
35,00
40,00
45,00
50,00
CY EE EL LV LT SI IT CZ RO AT SE ES DE PL LU BG
%
2006 2007
The annual switching rates by volume for large industrial customers have changed slightly in several countries, as far as data are available. An exception is Luxembourg with a considerable increase from 10.9% (2006) to 29.1% (2007). The most competitive market for large industrial customers in 2007 was Bulgaria with a switching rate of 48.6%.
5.3 Regulated electricity prices By definition, a regulated end-user price is a price subject to regulation by a public authority, as opposed to an end-user price exclusively set by supply and demand. The regulation can take different forms such as setting or approval of price, price caps or various elements of these24.
24
ERGEG Status Review on End-User Prices (E07-CPR-08-04), page 4.

2008 Status Review Electricity Retail
Ref. C08-URB-15-04
52/83
Regulated electricity prices for end-users who do not opt to procure electricity from the liberalised market still exist in 16 Member States25. These markets are therefore dual markets, having both a regulated market and a liberalised one with market-based pricing. In most of these countries, all customer segments can be supplied at regulated prices. According to a recent ERGEG monitoring report on the Transposition of Consumer Rights26 more than 85% of household customers (by number) in these countries are supplied under regulated electricity end-user prices. In some Member States that figure is as high as 100%. As stated in the ERGEG Position Paper on End-user Price Regulation27, suppliers without low cost generation capacity or equivalent long-term contracts will not be able to make competitive offers which cover their supply costs if regulated end-user prices are not in line with wholesale market conditions. Furthermore there will be no incentive to switch supplier if customers benefit from artificially low regulated prices. Concerning regulated electricity prices the following developments could be observed according to some National Reports:
• In France, the switching rates of non-residential customers in the electricity sector have gone down significantly, with an average of 1,000 new supply contracts at market price each month during the first quarter of 2008 versus 9,000 in the first quarter of 2007. This is in addition to a change in the commercial policy of EDF, a result of increased wholesale prices which have attained a level well above regulated tariffs. It is thus difficult for alternative suppliers to make attractive offers.
• Furthermore, a switch-back from the liberalised to the regulated market could be observed. This happened, for instance, in the household sector in Spain where the number of household customers in the liberalised market fell by approximately 10% (182,216 customers) in 2007. This development has also been seen in Portugal, where the share of power supplied via the liberalised market in the overall national market decreased in comparison with 2006. This decline occurred particularly from the beginning of the second half of 2007 onwards.
5.4 Market shares The market shares of the three largest suppliers differ widely in the European countries analysed. On the one hand, a number of countries show very high market shares (more than 90%) of the three largest suppliers in the retail market. On the other hand, in several countries this share is below 50 percent. Norway and Slovakia have the lowest market
25
Cyprus, Denmark, Estonia, France, Greece, Hungary, Ireland, Italy, Latvia, Lithuania, Netherlands, Poland, Portugal, Romania, Slovak Republic and Spain.
26 E08-CPR-20-03, page 11
27 E07-CPR-10-03

2008 Status Review Electricity Retail
Ref. C08-URB-15-04
53/83
shares pooled by the three largest suppliers in the retail market in 2007 with only 31% and 35% respectively. In 2007, the market shares of the three largest suppliers in the national retail market only show slight changes compared to 2006, as far as data is available. Figure 36: Development of market shares of the three largest suppliers in the retail market
35
,70
40
,00
45
,70
49
,80
64
,00
71
,00
67
,50
85
,00
85
,57 1
00
,00
97
,50
99
,00
98
,50
10
0,0
0
10
0,0
0
10
0,0
0
31
,20
35
,00
40
,00
44
,00
44
,90
46
,10
60
,00
68
,00
85
,00
87
,18
93
,00
94
,00
97
,00
97
,50
99
,00
99
,60
10
0,0
0
10
0,0
0
10
0,0
0
43
,00
83
,90
64
,00
99
,00
0,00
20,00
40,00
60,00
80,00
100,00
NO SK FI RO PL DE SE IT AT SI ES IE HU LU FR LV BG CZ EE PT CY EL LT
%
2006 2007
The number of companies with at least 5% market share in the retail market varies from one to seven suppliers. In 2007, the number of companies with at least 5% market share in the retail market remained unchanged in the great majority of countries (20). A decrease of one player could be observed in a few countries (5), whereas an increase of one player only occurred in two countries. In the following figure, the number of companies with at least 5% market share is compared with the market share of the three largest suppliers in the national retail market in 2007 (for each of the represented countries). The markets with highest concentration are characterised by very high market shares of the three largest suppliers combined with a relatively low number of companies that have at least 5% market share. While this is true in a number of countries, there are also several countries that reveal greater market diversity.

2008 Status Review Electricity Retail
Ref. C08-URB-15-04
54/83
Figure 37: Number of companies with at least 5% market share in comparison to market shares of the three largest suppliers in the national retail market in 2007
FR
PT CZ
DE
IT
LU
SKFI
NO
RO PL
ATSI
CY,EL,LTEE
HUIEES
LV BG
0
10
20
30
40
50
60
70
80
90
100
0 1 2 3 4 5 6 7 8
Number of companies >= 5 % market share
Ma
rke
t s
ha
re o
f th
ree
la
rge
st
su
pp
lie
rs i
n %
5.5 Conclusions The observed indicators in the fields of prices, switching rates and market shares are very heterogeneous in the European countries analysed. In addition to the observed differences at the European level, the low switching rates, especially for household and small industrial customers in many countries, could be interpreted as a sign of narrow geographic retail markets and competition not being well- developed at the national level for this customer segment. In contrast, the markets for larger industrial customers are more likely to be developed nationwide. Markets where incumbents exhibit a high-level of market power, such as sub-national or even separate local markets for smaller customers, require close monitoring of company behaviour by the relevant institutions (regulators and/or competition authorities). Customers and suppliers should use the liberalised retail markets for electricity to intensify competition. Artificially low regulated end-user prices are an obstacle to supplier switching. Regulated end-user prices set below market prices are distortionary and should be abolished or brought in line with market conditions. Increasing competition would contribute to the development of national electricity retail markets for smaller customers in advance of a further European market integration at a retail level. The low switching rates observed for households and small industrial customers in many countries could also be an indicator of a lack of information. Customers need to be better informed about their opportunities in a liberalised electricity market. Facilitating customer

2008 Status Review Electricity Retail
Ref. C08-URB-15-04
55/83
access to a greater level of information about the market participants would contribute to a more competitive market. DSOs in their future role as “market facilitators” should provide more valuable information to customers and to market participants (suppliers) to increase market transparency and facilitate market entry.
2008 Status Review Security of Supply and Infrastructure
Ref. C08-URB-15-04
56/83
6 Security of supply and Infrastructure
6.1 Introduction
6.1.1 Background Security of energy supply is, with competitiveness and sustainability, one of the three pillars of the EU Energy policy. Since 2005, some major events have pushed it forward on the EU agenda, making it a major issue in European energy policy. These events include the rapid rise of fossil fuel prices since 2004; the interruption of gas supplies from Russia in January 2006, with resulting gas shortages in a number of EU member states, and the continuing threat of disputes; a major electricity blackout in November 2006, affecting large parts of north-western Europe; and the development of the internal energy market. Security of supply is being addressed on a range of levels, from pursuing closer relations with external suppliers, to increasing international and internal interconnections, from reducing demand to increasing domestic supplies within the Union. As a consequence, energy security policy has been recognised as a major challenge for the EU27 requiring action at both European and at Member State level. This chapter examines both the external and internal elements of the EU’s energy security situation. In terms of the former, it examines the EU’s dependence on imports from third countries. The focus is on gas imports - where dependence is greatest and the cause for most concern - but it also touches briefly on coal. With respect to the internal aspects, once the primary sources reach the internal market there is a need to distribute them in either their primary form or as electricity between member states. A crucial element, therefore, is the availability of secure, reliable networks with sufficient capacity to transport energy supplies to the load centres as well as transparency in these flows. Before examining the above elements, it is useful to highlight some of the policies the EU has put in place to achieve the goal of security of supply.
Key points:
• A fully functioning internal market is the best guarantee of security of supply and facilitates more accurate demand estimates by increasing transparency and creating forward markets
• Diversification of energy sources and routes is needed, particularly in cases where member states are wholly dependent on one provider
• Investment in energy efficiency is crucial to reduce peak demand
• A transparent and stable regulatory framework is key to promoting investment

2008 Status Review Security of Supply and Infrastructure
Ref. C08-URB-15-04
57/83
6.1.2 Policy framework
On the back of the Commission’s first Strategic Energy Review published in January 2007, the European Council agreed the EU’s new energy and environmental policy at its Spring Summit in March that year. This established a political agenda to achieve the three pillars of the Community’s energy objectives, namely sustainability, competitiveness and security of supply. To put this into effect, the EU committed to the 20-20-20 targets: reducing GHG emissions by 20%; increasing the share of renewables in consumption to 20% and improving energy efficiency by 20%. The Commission also tabled the 3rd Package in September 2007 aimed at making competition more effective as well as fostering a more predictable investment climate. In January 2008, it brought forward its Green Package proposals, which included an Emission Trading Scheme and a Renewables Directive. These developments are key steps on the path to reducing both imports and energy consumption. In November 2008, the Commission published its second Strategic Energy Review with a strong focus on energy security. As part of the Review, it proposed an EU Energy Security and Solidarity Action Plan, concentrating on the following five areas:
• Infrastructure needs and the diversification of energy supplies
o A new Green Paper on energy networks identifies six strategic initiatives as essential for the EU's energy security: a Baltic Interconnection Plan, a Mediterranean Energy Ring, adequate North-South gas and electricity interconnections with Central and South-East Europe, a North Sea Offshore Grid, a Southern Gas Corridor and effective liquefied natural gas (LNG) supplies for Europe;
• External energy relations
o This focuses on the establishment of relationships with supplier, transit and consumer countries as well as closer coordination among Member States and the Commission in external energy relations;
• Oil and gas stocks and crisis response mechanisms
o Proposal to revise the EU's strategic oil stocks legislation, improving coherence with the International Energy Agency regime, reliability and transparency on available stocks and clarifying emergency procedures. After its evaluation of the Directive on Security of Gas Supply, the Commission concluded that greater harmonisation of security of supply standards and predefined emergency measures at regional and EU levels are needed. A revision of the Directive may be tabled in 2010;
• Energy efficiency
o The 2006 Energy Efficiency Action Plan will be evaluated in 2009. In the meantime, a 2008 Energy Efficiency Package is being tabled, focused on improvements in the legislation on the energy performance of buildings and on energy labelling as well as intensification of the implementation of eco-design and cogeneration Directives; and

2008 Status Review Security of Supply and Infrastructure
Ref. C08-URB-15-04
58/83
• Making the best use of the EU’s indigenous energy resources.
o As a next step in the Strategic Energy Technology Plan, the Commission will be issuing a Communication on Financing Low Carbon Technologies. This will propose ways to support large scale demonstrations at EU level, including up to twelve Carbon Capture and Storage (CCS) demonstration plants.
6.2 External aspects
Despite the above policy efforts, the EU remains heavily dependent on imported energy, particularly in light of the decline of Europe’s indigenous production of fossil fuels. Annual gas production in the UK is already declining. In the Netherlands, the other major EU gas producer, offshore gas producers are facing difficulties in maintaining production levels, while the largest field (Groningen) is estimated to have a remaining production horizon of less than 20 years. This, alongside the increase in demand, has meant that the EU has had to source an increasing proportion of its natural gas through imports. The EU and Norway produced 282 bcm of natural gas in 2007, which amounts to some 58% of consumption28. This is approximately the same percentage as in 2006.
28
See Footnote 15.

2008 Status Review Security of Supply and Infrastructure
Ref. C08-URB-15-04
59/83
Figure 38: Development of consumption vs production of natural gas
In terms of gas imports, Russia, Norway and Algeria supply over three quarters of gas imports into the EU-27, with Russia being the most important supplier. As can be seen below, gas reserves are becoming increasingly concentrated in limited hands.

2008 Status Review Security of Supply and Infrastructure
Ref. C08-URB-15-04
60/83
Figure 39: Proved reserves of natural gas in 2007
This increasing import dependence will make the gas supply more vulnerable to geopolitical factors and less determined by purely market-based considerations. Both the above production and supply trends are a particular concern with respect to gas for those Member States who are wholly dependent on a single provider. Coal remains an important alternative to gas and is available in vast quantities around the world. However, production in Europe has declined sharply since the 1980s for a number of reasons: competition from countries with lower production costs; reduction of state subsidies; exhaustion of the best reserves; and structural moves to activities with higher added value.

2008 Status Review Security of Supply and Infrastructure
Ref. C08-URB-15-04
61/83
Figure 40: Development of coal production vs consumption
The EU27 does not import lignite, but is a net importer of hard coal. Hard coal imports from outside the EU originate mainly from South Africa and Russia. Continued significant use of coal and lignite in electricity generation will remain, however its CO2 emissions remain the most significant disincentive for investment in light of the growing environmental agenda. The EU27 was also a net importer of comparatively small volumes of electricity in 2005, primarily from Norway, Ukraine, and Russia (directly or through Belarus). Some EU members, in particular the Baltic States which acceded in 2004, are very heavily dependent on energy imports from outside the EU. The EU is also exporting electricity, for example, to Morocco.

2008 Status Review Security of Supply and Infrastructure
Ref. C08-URB-15-04
62/83
6.3 Internal aspects
6.3.1 Gas
As a net importer of gas, investment in gas import infrastructure is vital. The Commission has estimated that significant investment is required to meet expected energy demand and to replace ageing infrastructure over the next 20 years. Pipeline entry points to the EU are mainly from Russia directly and via Ukraine and Belarus, from Norway (8 points), from Algeria via Morocco and Tunisia (2 pipelines), from Libya (1 pipeline), and from Iran/Azerbaijan via Turkey (1 pipeline). A number of countries (Bulgaria, Finland, Greece, Latvia, Lithuania and Slovakia) still depend on one single supplier for pipeline gas. For these and others, the diversification of sources is a primary concern. Although pipeline flows between countries still largely dominate gas trade, their construction often entails crossing a number of countries and borders, requiring lengthy and difficult right-of-way negotiations. With its flexibility, LNG can help overcome these types of constraints and help to meet energy security objectives. However, the construction of on shore infrastructure for LNG terminals may face considerable challenges of authorisation procedures. Therefore, the potential exists for LNG trade to expand rapidly compared with pipeline gas flows.
Figure 41: LNG volumes vs pipeline volumes for specific countries in 2007
The EU has 14 LNG terminals in operation or under construction. In 2007, according to available National Report Data, 506 TWh were imported via LNG, accounting for about 9% of total gas consumption, with the major suppliers being Egypt, Algeria, Qatar, Nigeria and Trinidad and Tobago.

2008 Status Review Security of Supply and Infrastructure
Ref. C08-URB-15-04
63/83
Box 1.2: Case Study – France In the recent years, 4 new LNG terminals have been announced by 4Gas, EDF, Gaz de Normandie and Shell. In accordance with the Directive 2003/55/CE, these LNG projects, as major new gas infrastructures, may, upon request, be granted an Article 22 exemption. The new LNG terminal of Fos Cavaou will be completed in the first semester 2009 and 10 % of its capacity has been allocated for 3 years to newcomers on the French gas market (Distrigaz, EDF, ENI and Essent).
Flexibility is a key aspect of security of supply. Gas storage is a key tool for providing flexibility in Europe. Storage provides seasonal flexibility, but it often also provides the quickest and safest form of flexible gas supply for short-term requirements such as peak shaving and parking. In addition, as most European countries are strongly dependent on imports, storage may also be used to maintain gas reserves to protect customers from interruptions. Figure 42: Gas storage as percentage of consumption in 2007
As shown above, storage across the EU exhibits a high degree of heterogeneity. It is important to be aware that the Member States with the highest levels of storage (e.g., Austria, Slovakia and Hungary) are transit countries and therefore it does not provide a completely accurate picture of what is actually available for own use. The level of storage requirements for each Member State will, of course, vary depending on the characteristics of that country, e.g., the degree of dependency on less secure exporters, the presence of LNG in the energy mix and the liquidity of the gas market, etc.

2008 Status Review Security of Supply and Infrastructure
Ref. C08-URB-15-04
64/83
Storage investment in many EU countries has, however, been slow in forthcoming. This is due to a combination of local environmental problems, planning issues or lack of market signals. The latter is connected to the linking of gas prices to oil prices, which disconnects them from market fundamentals. The declining ability of domestic gas production to respond to demand swings as production declines is improving the economic case for some Member States to build more facilities (e.g., as is the case in the UK).
6.3.2 Electricity
Another key objective for the successful operation of the internal market is the guarantee of a high level of security of electricity supply. The following important elements must be ensured:
(a) an adequate level of generation capacity;
(b) an adequate balance between supply and demand;
(c) an appropriate level of interconnection between Member States for the development of the internal market.
With respect to the first two elements, an adequate level of generation capacity is required for meeting the demand of predictable consumers. Within that scope, all timeframes have to be considered, from a few years ahead (investments in new generation capacity) to close to real time (e.g., sufficient margin over peak load). The UCTE System Adequacy Retrospect 2007 report, published in June 2008, concludes that there was sufficient generation capacity available in 2007 to meet the demand with the usual level of security. The actual pace of development in generation facilities balances the continuing growth of load and peak demand. The analysis of the commercial or contractual congestions on cross-border lines shows that the eastern part of UCTE in Central Europe remains the main area of congestion. ETSO29 has compiled adequacy assessments on a voluntary basis since 2005. These are based on adequacy assessments from UCTE, Nordel, UKTSOA (Great Britain), ATSOI (Ireland) and BALTSO (Baltic states). The 2007 assessment includes information about known commissioning and decommissioning of plants in the period 2008-2015 and expected growth in demand. Each assessment includes a “conservative” scenario including only commissioning of new plants that are regarded as firm as well as the “best estimate” scenario, which also includes commissioning of new projects that are not firm but can be regarded as realistically viable. Across the ETSO region, the adequacy assessment shows decreasing reserve margins, but adequacy criteria are generally met until 2012. After this point, new investments corresponding to 3% of installed capacity must be committed in addition to those that are firm
29
EU transmission system operators (TSOs) co-operate in ETSO, in which the western Balkan states are associate members.

2008 Status Review Security of Supply and Infrastructure
Ref. C08-URB-15-04
65/83
today to ensure adequacy. In the “best estimate” scenario, global adequacy criteria are met until 2015. In terms of the adequacy assessment of the main UCTE bloc, western continental Europe excluding the Iberian peninsula and Italy, is today a net exporter and it will remain so, but export volumes will decrease. Adequacy criteria are met up to 2015. In UCTECentrel, central and eastern continental Europe, the situation is comfortable today, but worsens quickly in the conservative scenario from 2010 to 2015 because of the required decommissioning of old fossil fuel plants to comply with the Large Combustion Plant Directive. New investments are required, as indicated in the best estimate scenario, to fill the gap. In the Nordic bloc, adequacy criteria are fulfilled towards 2015. The most interesting developments are, however, negative, including the further delay of the Finnish nuclear plant at Olkiluoto. On the positive side, wind power is now expected to contribute up to 6% of installed capacity during peak load. In the 2006 assessment, the British bloc was expected neither to fulfil adequacy criteria in the conservative scenario nor from 2009 in the best estimate scenario. Some significant changes occurred and have been reflected in the 2007 update. First of all, peak demand did not increase as expected and was in fact 3 GW lower than projected in 2007. This was mainly due to demand responding to peak prices. Another significant change is that a significant increase in new wind power is expected in the “best estimate” scenario.
Box 1.3: Case Study – UK Transmission Access Review Grid access is currently a major barrier to the deployment of new renewable (and other low carbon) generation. A review was therefore undertaken by Ofgem with the objective of removing, or significantly reducing, grid-related access barriers. The Review includes actions that will allow faster connection of some renewable generation to the Grid in the short-term (e.g., a form of “connect and manage” to allow an early connection date to projects that currently have planning consent), steps to introduce new, enduring grid access arrangements that allow faster connection and expansion of Grid capacity and measures to identify the new transmission infrastructure necessary to meet the UK share of the 2020 EU renewable energy targets and new financial incentives on the transmission companies to deliver that capacity.
6.3.3 Interconnection between Member States Another element of security of electricity supply is interconnection between Member States. Diversifying energy sources and developing well-interconnected European networks requires significant capital investment. However, investors are faced with an uncertain investment climate, particularly in relation to cross-border investments, where the investment may be subject to different regulatory regimes on either side of the border. National regulatory authorities must work to stimulate investment by providing a transparent regulatory framework and, where required, offering incentives for the construction of the necessary infrastructure. As mentioned earlier, the TEN-E guidelines are an important policy instrument for reinforcing security of supply by better linking national markets.

2008 Status Review Security of Supply and Infrastructure
Ref. C08-URB-15-04
66/83
In March 2002 at the Barcelona European Council, the Heads of State and government agreed to set a target for Member States, according to which the level of electricity interconnections should be equivalent to at least 10% of their installed production capacity by 2005. However, the need for interconnection varies with market fundamentals. High price differences between markets make more interconnection valuable and vice-versa. As a consequence there is no static, optimal degree of interconnection. In terms of security of supply, a minimum degree of interconnection reduces the need for spare capacity in national production facilities, which would have to be installed in case of a low level of interconnection capacity. The 2007 National Reports show that National Regulatory Authorities have sought to stimulate efficient investment in the trans-European Energy Networks. The Gas and Electricity Directives include an obligation for TSOs to invest in the networks to ensure the long-term ability of the system and to meet demand. As such, investments should be made by the TSOs. However, it is recognised that in some instances, additional incentives may be required, particularly in relation to cross-border investments where the investment may be subject to widely different regulatory regimes on either side of the border. Recognising this need, the Gas (2003/55/EC) and Electricity (2003/54/EC) Directives have included a provision allowing Member States to exempt interconnectors from third party access rules and certain tariff provisions. These exemptions may be granted by the national regulatory authority when deemed necessary to ensure the investment will occur. In the event that an exemption is granted, these investments are deemed to be merchant investments and are not considered as part of the regulatory asset base. The following are some of the significant infrastructure investments undertaken 2007 (the examples have been chosen for illustrating the primary requirements for new build – increasing interconnections between remote areas (NorNed, East-West Interconnector / BritNed cable), and diversifying gas supply sources (Nabucco and Poseidon projects and gas storage facilities): Regulated investment
In 2007, construction on the NorNed Cable, a 700MW undersea cable between Norway and the Netherlands, was completed. Testing of the cable will begin in 2008, with full commercial operation expected in mid-2008. The route for the East-West Interconnector, a 500MW undersea cable between Ireland and Wales has been approved and construction is expected to begin in 2009. The cable is expected to come online in 2012. The Haidach Gas Storage project (Austria) will make use of the depleted Haidach gas field as a storage facility. The project is being executed in two stages, each with a working gas volume of 1.2bn cu m, and maximum injection and withdrawal capacities of 500,000 cu m/hour. The first phase entered into service in July 2007. The second phase is expected to be operational in mid-2011.

2008 Status Review Security of Supply and Infrastructure
Ref. C08-URB-15-04
67/83
Merchant Investment
BritNed, a 1000 MW undersea cable between Great Britain and the Netherlands is due to be commissioned in 2010. BritNed has been granted an exemption order under the Electricity Directive, such that third party access and use of revenue requirements will not apply for a period of 25 years. The exemption order was communicated to the European Commission, and later amended in line with the Commission’s comments. BritNed will be required to present the national regulators with further information within 10 years after the start date, setting out the details of total costs and revenues of the project and the rate of return on the investment. If the estimated internal rate of return for the entire project is more than one percentage point above the internal rate of return estimated when filing the exemption request, BritNed shall either increase the interconnector capacity such that the initially estimated rate of return is met or the additional profits are used to finance the regulated asset base in the UK and in the Netherlands. BritNed agreed with these exemption modifications and has begun construction on the new line, which is expected to be commissioned in late 2010. The Nabucco pipeline, originating in Turkey, going through Bulgaria, Hungary, Romania and Austria, will import gas from the Caspian region, with much of its supplies expected to come from Azerbaijan. Exemptions were granted by all EU Member States. However, when notified to the Commission, additional information was requested in relation to these exemptions; the exemption process is still underway. The Austrian Exemption (pending agreement by the Commission) guarantees the regulatory framework for the pipeline for a 25-year period. E-Control has included a number of requirements in the exemption order, including enabling shippers to carry gas across the five Nabucco countries under single contracts; holding an open-season tender for the capacity in order to ascertain actual capacity needs, and an undertaking to develop sufficient capacity to meet the notified requirements; arrangements for the reallocation of unused capacity, and the creation of a trading platform for the secondary market; revision of the approved tariff setting methods, 20 years after commissioning of the pipeline, if the rates are 10% higher than those of comparable systems. (details on the Nabucco exemptions in other Member States are not available.) The Poseidon project, which includes the IGI underwater interconnector between Italy and Greece (Poseidon natural gas pipeline) and Zeus pipeline, connecting Greece to the Turkish grid, is targeted for commissioning in 2012. In January 2007, a memorandum of understanding was signed between the Italian and Greek governments and exemptions to the third party access rules were granted for the entire capacity of the pipelines for a period of 25 years. Construction will begin in 2008 and commercial operation is planned to commence in the first quarter of 2012. The Medgaz line, between Algeria and Spain is expected to begin in 2008 and completed in 2009. This pipeline will provide an additional yearly capacity of 8 Bcm to the Spanish gas market, approximately 20% of the projected 2009 gas consumption in Spain. The Grain LNG terminal in the UK, which has been in operation since July 2005, has received its latest approval to expand the capacity of the terminal. Grain Phase II will triple the LNG throughput to 9.8 million tonnes per annum (12% of UK gas demand). Construction

2008 Status Review Security of Supply and Infrastructure
Ref. C08-URB-15-04
68/83
is expected to be completed in 2008. Grain Phase III, which is expected to be completed by winter 2010, will provide an additional five million tonnes of LNG throughput. Construction will commence in 2008. Ofgem has granted UK National Grid’s exemption request for all phases of the terminal. The 2007 National Reports show significant progress on the development of diverse energy sources and improved interconnection among Member States. These projects will expand access to natural gas in the Caspian Sea and Algeria and will promote development of the regional markets, strengthening Europe’s security of supply. In 2007, ERGEG conducted an internal survey on the interpretation and application of exemptions, as per Article 22 of the Gas Directive. The results of this study found that there were significant differences in interpretation and application. ERGEG consulted on draft Guidelines of Good Practice to provide a framework for NRAs when considering exemption requests. The results of this consultation have been published and shared with the European Commission. The Commission has published a draft staff working document on Article 22 of Directive (EC) No 2003/55 and Article 7 Regulation (EC) No 1228/2003 with guidance for national authorities when deciding on new infrastructure exemptions. It is expected to publish the final staff working document in early 2009.
6.4 Conclusions
While there is no imminent threat to energy security at EU-level, there are still a number of challenges facing Member States in this area:
• A number of countries (Bulgaria, Finland, Greece, Latvia, Lithuania, Slovakia) still depend on one single supplier for pipeline gas;
• The EU’s own gas reserves and production continue to decrease;
• Competition between storage operators and access to storage across the EU is still restricted.
As a result, some clear messages have presented themselves:
• In line with the Action Plan on an Energy Policy for Europe 2007-2009, adopted in March 2007, a fully functioning internal market is the best guarantee of supply security and contributes to a better ability to predict demand by increasing transparency and creating forward markets. The effective separation of networks from the competitive parts of the electricity and gas business results in real incentives for companies to invest in new infrastructure (including storage), inter-connection capacity and new generation capacity, thereby avoiding black-outs and unnecessary price surges. The successful conclusion of the 3rd Package would strengthen security of supply;
• Diversification of the gas supply sources open to the European market is crucial to long-term security of supply, as gas production and the remaining reserves will increasingly be concentrated in regions outside the EU over the next few decades. Opening up new sources in the Caspian, the Middle East and North Africa by developing transportation infrastructure, for example, the Nabucco pipeline, would make a major contribution to Europe’s long-term security of supply;

2008 Status Review Security of Supply and Infrastructure
Ref. C08-URB-15-04
69/83
• Investment in energy efficiency is crucial to reduce peak demand;
• The European electricity transmission grid is highly meshed, with some important bottlenecks. Cross-border transmission capacity is now not only an asset that provides for improved dispatch efficiency and improved system security but it is also seen by the European Commission as an essential element in enabling competition;
• The Commission’s proposal to enhance the powers of regulators at national level and to establish an Agency for the Co-operation of EU Energy Regulators (Agency) is an excellent step towards a transparent and consistent EU regulatory framework, which is key to promoting infrastructure investments.

2008 Status Review Regulation and Unbundling
Ref. C08-URB-15-04
70/83
7 Regulation and Unbundling
Key points
• National Regulatory Authorities competences and independence need to be improved
• Insufficient unbundling remains an obstacle for the market integration
• Unbundling has to be more ambitious in terms of a more active roles for TSOs and DSOs to develop competition in respective markets
• Legislative unbundling framework for DSOs needs to be improved
• Collaboration between TSOs must increase
7.1 Background Regulation and effective unbundling are key elements for an integrated European market. In 2007, National Reports showed that there always are obstacles to achieve this aim and further action will be needed to ensure sustainable competition. Well-functioning competition and thereby efficient and secure supply to final customers are the ultimate objectives of independent regulation. The fact that the regulator’s independence is sometimes limited and subject to political circumstance is a critical issue. Moreover, improvements regarding unbundling provisions seem necessary.
7.2 Competences of National Regulatory Authorities
Compared with the last annual reports, improvements could be seen, mainly in market monitoring and customer protection. Despite progress, political interference remains the main issue. Since 1 July 2007, several NRAs have taken actions to inform consumers. Many of them have carried out internal reorganisation linked with market opening (new website, increased staff number to answer consumer’s demands, etc.) Some of them have seen their powers confirmed and reinforced. Several regulators play a role in guaranteeing the availability and the accessibility of consumption data of final clients to suppliers. For instance, in Finland, the regulator has elaborated binding rules for information exchange between market participants in connection with supplier switching (clarification of the roles and responsibilities of DSOs and suppliers in connection with the supplier switching).

2008 Status Review Regulation and Unbundling
Ref. C08-URB-15-04
71/83
Regarding competition, in 2007, some regulators have seen their powers strengthened. They are now responsible for supervision of transparency in the electricity and gas markets, and for price monitoring. These regulatory advances are fully in line with the proposals included in the 3rd Package. However, in the absence of violations of competition rules, regulators generally do not have powers to impose measures to promote effective competition. The right to propose new VPPs or gas releases remains an exception.
Apart from that, many regulators reported to be proactive in fostering competition and highlight successful cooperation with the National Competition Authority (where they do not function as the NCA themselves) as well as "voluntary agreements" to promote effective competition. As mentioned in the chapter on the wholesale gas market and in the 2005 sector inquiry30, there is a lack of liquidity which acts as a barrier to new market entrants. A harmonisation of the national regulatory authorities’ (NRAs) competition powers may improve the situation. Cooperation between the national regulatory authorities and other relevant authorities is also of importance. For instance, during 2007, the cooperation between national financial services authorities and the Committee of European Securities Regulators (CESR) led to a better understanding of the functioning of energy trading on the wholesale market31. This type of cooperation should be followed up to identify possible regulatory gaps. Another important regulatory competence is the power of the NRAs to approve congestion management procedures proposed by TSOs. Currently, national regulatory authorities do not have the same competences on capacity allocation and congestion management mechanisms. These differences impede efficient coordination between NRAs in the capacity allocation mechanisms and more generally, in congestion management. In the aim of improving market liquidity, a clarification on a formal approval of the congestion management procedures by regulators seems relevant. Many regulators reported having powers to impose effective sanctions. However some, can only recommend to another authority that sanctions should be imposed or such powers do not include effective sanctions. Regulators generally have powers to issue binding decisions on electricity/gas undertakings. Even if regulators have several competences to impose sanctions, in many cases NRAs cannot exercise these powers. The absence of a legal framework weakens the effectiveness of their decisions and negatively affects the functioning of the market.
30
See Chapter 2: Gas Wholesale. 31
CEER/CESR have launched a public consultation on market abuse issues related to energy trading (E08-PC-30) and, in October 2008, a consultation document on record keeping transparency and exchange of information issues (E08-PC-34).

2008 Status Review Regulation and Unbundling
Ref. C08-URB-15-04
72/83
While in some cases regulators’ powers are enhanced, in others political interference in energy regulation still remains a concern. As regards the functional and budgetary independence, almost all regulators are legally separated from the Ministry. The power for appointment of regulators is, in most cases, vested with the competent ministry or the government / prime minister. About half of the regulators apply employment restrictions after termination of the staff member's mandate, i.e., the regulator (and other executive staff) may not be employed by an energy undertaking for a defined period of time or may be subject to other restrictions. The National Reports indicate some cases where regulators were increasingly required to coordinate decisions with “political” decision-makers or where politicians had a greater ability to influence regulators by other means, e.g., the power of the government to overrule decisions taken by the regulators, setting returns on capital or giving direct instructions to the board of directors of the regulator. Moreover, in 2007, laws altering the tasks entrusted to the regulators were adopted (transfer of competences from the regulator to the ministries on the assessment of regulated assets and the cost of capital regarding the grid tariffs, the power of proposal replaced by a simple opinion, etc.). Political influence has not been exerted in a transparent way but through increased direct influence by ministries or parliaments on some national regulatory authorities, in terms of appointment or even individual decisions. Some ministries have powers to approve, reject or amend regulatory decisions. This is harmful to the market development and market players. As last year, rising energy prices have prompted some countries to use political control over prices as a remedy for presumed insufficient competition or to reach diverse social goals. As mentioned in the different chapters, regulated prices for end-users who do not opt for the liberalised market still exist in several Member States. These markets are therefore dual markets, having both a regulated market and a liberalised one with market-based pricing. This situation, with artificially low regulated end-user prices, creates an obstacle to supplier switching.
7.3 Roles of TSOs in markets In 2007, in the electricity as well as in the gas sectors, regulators report some progress on transparency as regards provision of information by TSOs.

2008 Status Review Regulation and Unbundling
Ref. C08-URB-15-04
73/83
However, ERGEG’s monitoring of compliance with the Electricity32 and Gas Regulations33 shows that most network operators in the electricity and gas sectors still do not satisfactorily meet their statutory transparency requirements and duties of disclosure. Also, in relation to congestion management, TSO have a special role. They allocate capacity and, in some cases also own necessary market infrastructure, i.e., power exchanges, for implicit auctions. The 3rd Package envisages the development of cross-border gas and electricity network codes, drafted by the ENTSOs. The Commission’s initial proposals contain a list of 11 areas each for electricity and gas. These will constitute the basis for interactions between national gas and electricity networks and markets. The codes will be based on high level framework guidelines prepared by the future Agency. The guidelines and codes, taken together, are a major tool which, over time, should enable the diverse national and regional markets in the European Union to evolve towards an efficient single European energy market. As a consequence, the role of TSOs will be more important in the future. TSOs will have to be “market facilitators” for wholesale markets. Effective collaboration between the TSOs and NRAs is essential to build a competitive market.
7.4 Unbundling of TSOs and DSOs In 2007, there are no major changes with respect to the obligations on unbundling of electricity TSOs in Europe. The following table shows the number of ownership unbundled TSOs in 2007 (electricity).
32
See “Compliance with the Electricity Regulation 1228/2003 –An ERGEG Monitoring Report” (E07-EFG-23-06), 18 July 2007.
33 See “Compliance with Transparency Requirements of the Gas Regulation 1775/2005 – An ERGEG Monitoring Report” (E07-TRA-02-03), 18 July 2007 and “ERGEG’s Gas Transparency Requirements –An ERGEG Additional Monitoring Report” (E07-TRA-02-03b), 9 October 2007. The latter is additional monitoring by ERGEG, requested by the European Commission, which explains why TSO compliance with the legally binding requirements of the Regulation remains unsatisfactory.

2008 Status Review Regulation and Unbundling
Ref. C08-URB-15-04
74/83
Table 5: Unbundling of TSOs in electricity
Electricity Number of TSOs Number of TSOs
ownership unbundled
AUSTRIA 3 0
BELGIUM 1 0
BULGARIA 1 0
CYPRUS 1 0
CZECH REPUBLIC 1 1
DENMARK 1 1
ESTONIA 1 0
FINLAND 1 1
FRANCE 1 0
GERMANY 4 0
GREECE 1 0
HUNGARY 1 0
IRELAND 1 1
ITALY 11 134
LATVIA 1 0
LITHUANIA 1 1
LUXEMBOURG 1 0
MALTA
NORWAY 1 1
POLAND 1 1
PORTUGAL 3 1
ROMANIA 1 1
SLOVAKIA 1 1
SLOVENIA 1 1
SPAIN 1 1
SWEDEN 1 1
THE NETHERLANDS 1 1
UNITED KINGDOM 1 1 Sources: CEER Database /National Reports
The defining element of the ownership unbundled model is that the network is operated and owned by an independent company, which clarifies the incentives, responsibilities and liabilities for the network. In some countries more than one TSO is present (Italy, Portugal, Germany and Austria in electricity and Italy, Germany, France, Spain and Sweden in gas). If, in these countries ownership unbundling is implemented, it is evident that the relevance of the unbundling provisions depends crucially on the market relevance of the ownership unbundled TSO. For example, in Italy, the unbundled TSO in electricity controls 97% of the network while the
34
The ownership unbundled TSO is Terna Spa, which owns 97% of the national network.

2008 Status Review Regulation and Unbundling
Ref. C08-URB-15-04
75/83
unbundled TSO for gas owns only 5% of the network: the situation of unbundling in the two sectors is therefore quite different. Countries such as Sweden or Norway, have public ownership models. The effectiveness of unbundling of public owned companies assumes a degree of independence from those entities owning competitive and monopolistic parts of the value chain. In any case, regulatory supervision will still be necessary 35. The modification of the Spanish regulation is worth mentioning. In 2007, Spain included in its legislation functional and informational unbundling requirements to ensure the independence of the organisation and decision-making of TSOs and DSOs belonging to vertically integrated undertakings. The new regulation has established an obligation to transfer all grid assets to Red Electrica de España (REE, the Spanish TSO) and has established a new threshold for ownership of REE shared capital. REE must create a new company within its group and transfer all material and personal assets dedicated to transmission system management and operation. According to the new law, REE will not be able to sell shares of this new company to third parties. From 2008, there is a legal requirement to sell the remaining assets to REE. The purchase price will be based on market prices and, in case there is no agreement, the regulator will designate an arbitrator. Moreover, in order to increase TSOs independence, a new threshold for the share capital ownership and voting rights has been established.
In Portugal, the state has reduced its ownership in the TSO (70% in 2006 to 51% in 2007). During Spring 2008, EON proposed to initiate a process that will lead to full ownership unbundling of its transmission system, which is one of the options proposed by the European Commission with the 3rd Package. Regarding DSOs, the official deadline for legal unbundling was 1 July 2007. During 2007, most of the Member States implemented the “formal” legal unbundling for DSOs. Some regulators acknowledged that the separation is in progress and that operators are interested in developing an “unbundling culture”. Some regulators report significant progress due to new national law (legal rules on management and informational unbundling as well as plans to fully unbundle ownership of the network companies and competitive business). Regulators also use compliance programmes and reports to ensure functional unbundling. For instance, in 2007, Italy completed the framework relating to unbundling (introduction of accounting rules in terms of functional unbundling) Despite progress made, National Reports indicate that the integrated companies did not really establish fully functioning independent system operators capable of carrying out their business autonomously (lack of internal staff, own asset dedicated…)36.
35
German TSO Vattenfall is part of an integrated company, which is owned by the Swedish State. 36
Austria and Poland.

2008 Status Review Regulation and Unbundling
Ref. C08-URB-15-04
76/83
Moreover, it is evident that these companies have not yet developed an independent corporate culture, beyond legal obligation. This is shown by the use of the identical logos and the fact that the distribution system operator does not have its own website, independent from the Group, which negatively affects the image of impartiality and neutrality as required37. Thus, DSOs have not yet assumed the role of “market facilitators” for retail markets. Also, most national efforts for the implementation of the Directive seek to achieve non-discrimination and confidentiality, which is a much more passive role for DSOs.
Once again, the reports from national regulators show that many distribution companies that are part of a vertically integrated company are not set up to act independently. Table 6: Unbundling of DSOs in electricity
Electricity Number of
DSOs Number of DSOs legally unbundled
Application of 100.000 customer exemption
Number of DSOs with less than 100.000 customers
AUSTRIA 130 11 Yes 119
BELGIUM 26 26 No 14
BULGARIA 4 4 No 1
CYPRUS 1 0 Yes 0
CZECH REPUBLIC 280 3 Yes 277
DENMARK 101 101 No 96
ESTONIA 40 1 Yes 39
FINLAND 89 50 No 83
FRANCE 148 0 Yes 143
GERMANY 855 150 Yes 779
GREECE 1 0 No 0
HUNGARY 6 6 No 0
IRELAND 1 0 No 0
ITALY 163 NAP38
Yes 152 LATVIA 10 1 Yes 9
LITHUANIA 7 2 Yes 5
LUXEMBOURG 9 2 Yes 8
NORWAY 15939
55 Yes 152
POLAND 18 14 Yes 4
PORTUGAL 13 11 Yes 10
ROMANIA 30 7 Yes 22
SLOVAKIA 154 3 Yes 151
SLOVENIA 1 1 No 0
SPAIN 329 329 Yes 323
37
Portugal, Ireland, and Denmark. 38
In Italy the obligation of legal unbundling for DSOs entered into force for utilities serving more than 100,000
clients as of 1st January 2008. Note that this report refers to the situation in 2007.
39 DSOs are mainly held in public ownership.

2008 Status Review Regulation and Unbundling
Ref. C08-URB-15-04
77/83
SWEDEN 175 175 Yes 158
THE NETHERLANDS 8 8 No 5
UNITED KINGDOM 18 18 No 4 Sources: CEER Database /National Reports
The risk of insufficient unbundling of commercial and network activities can seriously hamper competition and liberalisation. It could be an obstacle to the European market integration. Indeed, insufficient unbundling or lack of implementation of unbundling requirements at a national level has consequences for European market integration. The analysis of the retail market in electricity40 shows that the low switching rates, especially for households and small industrial customers in many countries, could be interpreted as a sign of a lack of competition and integration at national level in this customer segment. This could be due to the fact that unbundling requirements are not always effectively implemented. In addition, regulators do not possess the necessary instruments to enforce effective unbundling and report a lack of legal powers to change the companies’ behaviour or to impose sanctions. All these elements require an exhaustive monitoring of company behaviour at national level and especially increased powers for the NRAs. For gas, only a few countries reported improvements in the unbundling of integrated gas companies. As an example, in Hungary, the gas transmission licensee company was legally unbundled from its owner, the MOL Nyrt. As a result, the transmission activity will to be performed by a separate organisational unit and an independent decision-making process will be ensured. In addition, the natural gas transmission company was physically unbundled (headquarters, office building) from all other business organisations active in the natural gas industry. As last year, regulators have reported improvements concerning transparency, as more important system information has been published. Regulators stated that the integrated companies did not fully establish functioning independent system operators capable of carrying out their business autonomously. Like in the electricity sector, the main reason may be lack of specificity in the transposition of unbundling obligations in the national law.
40
see Chapter 5: Electricity Retail.

2008 Status Review Regulation and Unbundling
Ref. C08-URB-15-04
78/83
The following table shows the number of ownership unbundled TSOs in 2007 (gas). Table 7: Unbundling of TSOs in natural gas
Gas
Number of TSOs Number of TSOs ownership unbundled
AUSTRIA 7 0
BELGIUM 1 0
BULGARIA 1 0
CYPRUS NAP NAP
CZECH REPUBLIC 1 0
DENMARK 1 1
ESTONIA 1 0
FINLAND 1 0
FRANCE 2 0
GERMANY 20 1
GREECE 1 0
HUNGARY 1 1
IRELAND 1 0
ITALY 241
1
LATVIA 1 0
LITHUANIA 1 0
LUXEMBOURG 1 0
MALTA
POLAND 1 1
PORTUGAL 1 1
ROMANIA 1 1
SLOVAKIA 1 0
SLOVENIA 1 0
SPAIN 8 1
SWEDEN 3 2
THE NETHERLANDS 1 1 UNITED KINGDOM 1 1
Sources: CEER Database /National Reports
41
The unbundled company Società Gasdotti SpA owns approximately 5% of the national network.

2008 Status Review Regulation and Unbundling
Ref. C08-URB-15-04
79/83
The following table shows the number of legally unbundled DSOs and the application of 100,000 customer exemption in 2007 (gas). Table 8: Unbundling of DSOs in natural gas
GAS Number of DSOs Number of DSOs
legally unbundled Application of 100.000 customer exemption
Number of DSOs with less than 100.000 customers
AUSTRIA 20 8 Yes 14
BELGIUM 18 18 No 9
BULGARIA 40 0 Yes 40
CYPRUS NAP NAP Yes
CZECH REPUBLIC 69 8 Yes 61
DENMARK 4 4 No 2
ESTONIA 27 1 Yes 27
FINLAND 32 0 Yes 32
FRANCE 23 0 Yes 20
GERMANY 697 145 Yes 668
GREECE 4 0 No 1
HUNGARY 10 5 Yes 5
IRELAND 1 0 No 0
ITALY 338 338 Yes 264
LATVIA 1 0 No 0
LITHUANIA 6 0 Yes 5
LUXEMBOURG 4 0 Yes 4
MALTA
POLAND 7 6 Yes 1
PORTUGAL 11 11 Yes 7
ROMANIA 36 36 Yes 34
SLOVAKIA 48 1 Yes 47
SLOVENIA 17 0 Yes 17
SPAIN 22 22 No 16
SWEDEN 5 5 Yes 5
THE NETHERLANDS 12 12 No 7
UNITED KINGDOM 8 5 No 0 Sources: CEER Database /National Reports
A few countries reported an evolution in their regulatory framework regarding unbundling (e.g., in Greece: DSOs are preparing the rules for accounting unbundling). In Spain a new law has been adopted relating to unbundling issues: legal unbundling of DSOs and measures to ensure independence where the DSO is a part of a vertically integrated undertaking have been implemented. Moreover, new limits have been set on the

2008 Status Review Regulation and Unbundling
Ref. C08-URB-15-04
80/83
shareholding in ENAGAS42, an ownership unbundled (TSO); shareholding voting rights are limited to 1% for integrated gas companies, and to 3% for any other company. In line with the deadlines of the Gas Directive, timely implementation has been more apparent in the electricity than in the natural gas sector, where several regulators report no significant change in unbundling. As last year, regulators mainly reported formal compliance with the legal and functional unbundling requirements of the 2003 Directives. However, in practice, it is difficult to distinguish network operators from the integrated company in most countries, thereby allowing integrated companies to benefit from the reputation of the network company. As mentioned in the CEER Guidelines for Good Practice on Functional and Informational Unbundling for DSOs43, effective unbundling means ensuring non-discriminatory access to networks by excluding any possibility of discrimination of network users and by removing any (commercial) incentive for the network operators to give preferential treatment to related companies. This includes:
– to effectively ensure that network operators act in full independence of any commercial interests to avoid any conflict of interest;
– to ensure that managers and employees act independently; – to allow full sovereignty of network operators in decision making; – to effectively monitor and enforce unbundling dispositions: precise written processes and
procedures which effectively ensure unbundling. According to National Reports, these minimum requirements are not always addressed by the national regulations.
7.5 Conclusions The potential for discrimination will always exist where a vertically integrated company includes both competitive and monopolistic businesses. Therefore, CEER/ERGEG has repeatedly stated that ownership unbundling is the preferred market structure for TSOs, in both the electricity and gas sectors. The present framework for legal unbundling is not sufficient for efficient regulatory monitoring and intervention. The risks and negative effects of insufficient unbundling of network and commercial activities show that effective unbundling is necessary for the development of a competitive European energy market. Furthermore, the lack of NRAs competences in competition issues as well as the inability of regulators to impose sanctions weaken the effectiveness of their decisions and adversely affect the effective functioning of the market. In addition, the independence of regulators remains insufficient. 42 Shareholding voting rights in ENAGAS are limited to 1% for integrated gas companies and to 3% to any other
company. 43
C06-CUB-12-04b

2008 Status Review Annex
Ref. C08-URB-15-04
81/83
8 Annex
8.1 References The CEER Database and the 2008 National Reports of the Regulatory Authorities to the European Commission were typically used without specific reference. Gas Wholesale:
ERGEG: GRI Coherence and Convergence – Conclusions Paper, Ref. E07-GRI-01-05b, 15 July 2007. Gas Retail:
ERGEG: End-user energy price regulation, An ERGEG position paper, Ref. E07-CPR-10-03, 18 July 2007 Electricity Wholesale:
The Moffat Associates Partnership: Client European Commission – DG TREN, July 2008. Electricity Retail:
ERGEG: Status review on end-user price regulation, Ref. E07-CPR-08-04, 14 June 2007 ERGEG: End-user energy price regulation, An ERGEG position paper, Ref. E07-CPR-10-03, 18 July 2007 ERGEG: Transposition of Consumer Rights Monitoring Report, Ref. E08-CPR-20-03, 13 October 2008 Infrastructure and Security of Supply
BP: Statistical Review of World Energy 2008, 57th edition, June 2008. Regulation and Unbundling
ERGEG: Compliance with the Electricity Regulation 1228/2003 – An ERGEG Monitoring Report”, Ref. E07-EFG-23-06, 18 July 2007. ERGEG: Compliance with Transparency Requirements of the Gas Regulation 1775/2005 – An ERGEG Monitoring Report” Ref. E07-TRA-02-03), 18 July 2007 ERGEG: Gas Transparency Requirements – An ERGEG Additional Monitoring Report, Ref. E07-TRA-02-03b), 9 October 2007

2008 Status Review Annex
Ref. C08-URB-15-04
82/83
8.2 Tables and Figures List of Tables Table 1: Traded gas volumes at exchanges in 2007 19 Table 2: Change of electricity price components (2007 vs 2006) for households
(Eurostat category Dc) 47 Table 3: Change of electricity price components (2007 vs 2006) for large industrial customers
(Eurostat category Ig) 47 Table 4: 2007 Switching rates in different countries (%) 49 Table 5: Unbundling of TSOs in electricity 74 Table 6: Unbundling of DSOs in electricity 76 Table 7: Unbundling of TSOs in natural gas 78 Table 8: Unbundling of DSOs in natural gas 79
List of Figures Figure 1: Term of new import contracts in Italy 2007 13 Figure 2: Consumption of natural gas in the EU and Norway in 2007 14 Figure 3: Production of natural gas in the EU and Norway in 2007 15 Figure 4: Concentration: Market share of biggest 3 shippers in available gas (import plus production)16 Figure 5: Highly correlated prices in NW region 17 Figure 6: Trade volumes on European Hubs 2007 18 Figure 7: Trade at French Hub PEG in 2007 19 Figure 8: Development of Hub Day Ahead Prices in Zeebrugge 20 Figure 9: Development of traded volumes at Austrian Hub 2005 - 2008 21 Figure 10: LNG flows at the Isle of Grain 22 Figure 11: Composition of total gas prices for standard domestic customers in 2007
(Eurostat category D3) 24 Figure 12: Development of total gas prices for standard customers D3 from 2006 to 2007 24 Figure 13: Composition of total gas prices for large industrial customers in 2007
(Eurostat category I4) 25 Figure 14: Development of total gas prices for large industrial customers (Eurostat category I4) 26 Figure 15: Composition of total gas prices for small industrial customers (Eurostat category I1) 26 Figure 16: Development of total gas prices for small industrial customers (Eurostat category I1) 27 Figure 17: Annual switching rates by eligible meter points and by volume for the total market 28 Figure 18: Annual switching rates by eligible meter points and by volume for households and
small industrial customers 28 Figure 19: Annual switching rates by eligible meter points and by volume for medium size industrial
customers 29 Figure 20: Annual switching rates by eligible meter points and by volume for large industrial
customers 29 Figure 21: Market shares of the three largest suppliers in national retail markets 30 Figure 22: Number of companies with at least 5% market share in comparison to market shares
of the three largest suppliers in the national retail market in 2007 31 Figure 23: Generation capacity in 2007 33 Figure 24: Generation of electricity in 2007 34 Figure 25: Electricity consumption in 2007 35 Figure 26: Concentration in generation capacity (CR3) 36 Figure 27: Trading volumes at PXs in 2006 vs 2007 37 Figure 28: Number of active traders in 2007 39 Figure 29: Composition of total electricity prices for households (Eurostat category Dc) in 2007 44 Figure 30: Composition of total electricity prices for large industrial customers in 2007
(Eurostat category Ig) 45

2008 Status Review Annex
Ref. C08-URB-15-04
83/83
Figure 31: Development of total electricity prices for households (Eurostat category Dc) 46 Figure 32: Development of total electricity prices for large industrial customers
(Eurostat category Ig) 46 Figure 33: Development of annual switching rates by eligible volume for household and small
industrial customers 50 Figure 34: Development of annual switching rates by eligible meter points 50 Figure 35: Development of annual switching rates by eligible volume for large industrial customers 51 Figure 36: Development of market shares of the three largest suppliers in the retail market 53 Figure 37: Number of companies with at least 5% market share in comparison to market shares
of the three largest suppliers in the national retail market in 2007 54 Figure 38: Development of consumption vs production of natural gas 59 Figure 39: Proved reserves of natural gas in 2007 60 Figure 40: Development of coal production vs consumption 61 Figure 41: LNG volumes vs pipeline volumes for specific countries in 2007 62 Figure 42: Gas storage as percentage of consumption in 2007 63