Embed Size (px)
Citation preview
ERD
C/EL
TR-
08-2
8
Wetlands Regulatory Assistance Program
Regional Supplement to the Corps of Engineers Wetland Delineation Manual: Arid West Region (Version 2.0)
U.S. Army Corps of Engineers September 2008
Envi
ronm
enta
l Lab
orat
ory
Approved for public release; distribution is unlimited.

Wetlands Regulatory Assistance Program ERDC/EL TR-08-28 September 2008
Regional Supplement to the Corps of Engineers Wetland Delineation Manual: Arid West Region (Version 2.0)
U.S. Army Corps of Engineers U.S. Army Engineer Research and Development Center 3909 Halls Ferry Road Vicksburg, MS 39180-6199
Final report Approved for public release; distribution is unlimited.
Prepared for U.S. Army Corps of Engineers Washington, DC 20314-1000
ERDC/EL TR-08-28 ii
Abstract: This document is one of a series of Regional Supplements to the Corps of Engineers Wetland Delineation Manual, which provides technical guidance and procedures for identifying and delineating wet-lands that may be subject to regulatory jurisdiction under Section 404 of the Clean Water Act or Section 10 of the Rivers and Harbors Act. The development of Regional Supplements is part of a nationwide effort to address regional wetland characteristics and improve the accuracy and efficiency of wetland-delineation procedures. This supplement is applicable to the Arid West Region, which consists of all or portions of 12 states: Arizona, California, Colorado, Idaho, Montana, Nevada, New Mexico, Oregon, Texas, Utah, Washington, and Wyoming.
DISCLAIMER: The contents of this report are not to be used for advertising, publication, or promotional purposes. Citation of trade names does not constitute an official endorsement or approval of the use of such commercial products. All product names and trademarks cited are the property of their respective owners. The findings of this report are not to be construed as an official Department of the Army position unless so designated by other authorized documents. DESTROY THIS REPORT WHEN NO LONGER NEEDED. DO NOT RETURN IT TO THE ORIGINATOR.

ERDC/EL TR-08-28 iii
Contents Figures and Tables.................................................................................................................................vi
Preface....................................................................................................................................................ix
1 Introduction..................................................................................................................................... 1 Purpose and use of this regional supplement........................................................................ 1 Applicable region and subregions ........................................................................................... 3 Physical and biological characteristics of the region ............................................................. 7
Interior deserts (LRR D) ............................................................................................................... 7 Columbia/Snake River Plateau (LRR B) ..................................................................................... 9 Mediterranean California (LRR C) ............................................................................................... 9
Types and distribution of wetlands.......................................................................................... 9 Wetland types............................................................................................................................... 9 Irrigated wetlands ......................................................................................................................11
2 Hydrophytic Vegetation Indicators.............................................................................................13 Introduction ............................................................................................................................13 Guidance on vegetation sampling and analysis ...................................................................15
Definitions of strata ...................................................................................................................17 Seasonal considerations and cautions.....................................................................................17
Hydrophytic vegetation indicators.........................................................................................18 Procedure ...................................................................................................................................21 Indicator 1: Dominance test .....................................................................................................21 Indicator 2: Prevalence index ...................................................................................................23 Indicator 3: Morphological adaptations...................................................................................25
3 Hydric Soil Indicators...................................................................................................................27 Introduction ............................................................................................................................ 27 Concepts.................................................................................................................................28
Iron and manganese reduction, translocation, and accumulation .........................................28 Sulfate reduction........................................................................................................................29 Organic matter accumulation....................................................................................................29
Cautions..................................................................................................................................30 Procedures for sampling soils ............................................................................................... 31
Observe and document the site ................................................................................................31 Observe and document the soil ................................................................................................32
Use of existing soil data .........................................................................................................34 Soil surveys.................................................................................................................................34 Hydric soils lists..........................................................................................................................35
Hydric soil indicators ..............................................................................................................35 All soils ........................................................................................................................................37
Indicator A1: Histosol ....................................................................................................38 Indicator A2: Histic Epipedon .......................................................................................38
ERDC/EL TR-08-28 iv
Indicator A3: Black Histic..............................................................................................39 Indicator A4: Hydrogen Sulfide.....................................................................................40 Indicator A5: Stratified Layers ......................................................................................40 Indicator A9: 1 cm Muck...............................................................................................41 Indicator A11: Depleted Below Dark Surface ..............................................................42 Indicator A12: Thick Dark Surface ...............................................................................43
Sandy soils..................................................................................................................................44 Indicator S1: Sandy Mucky Mineral .............................................................................45 Indicator S4: Sandy Gleyed Matrix ...............................................................................45 Indicator S5: Sandy Redox............................................................................................46 Indicator S6: Stripped Matrix........................................................................................47
Loamy and clayey soils ..............................................................................................................47 Indicator F1: Loamy Mucky Mineral .............................................................................48 Indicator F2: Loamy Gleyed Matrix...............................................................................48 Indicator F3: Depleted Matrix .......................................................................................49 Indicator F6: Redox Dark Surface ................................................................................50 Indicator F7: Depleted Dark Surface............................................................................52 Indicator F8: Redox Depressions .................................................................................53 Indicator F9: Vernal Pools.............................................................................................54
Hydric soil indicators for problem soils .................................................................................54 Indicator A9: 1 cm Muck...............................................................................................55 Indicator A10: 2 cm Muck ............................................................................................55 Indicator F18: Reduced Vertic ......................................................................................56 Indicator TF2: Red Parent Material ..............................................................................56
4 Wetland Hydrology Indicators.....................................................................................................58 Introduction ............................................................................................................................58 Growing season ......................................................................................................................59 Wetland hydrology indicators.................................................................................................61
Group A – Observation of Surface Water or Saturated Soils...................................................64 Indicator A1: Surface water ..........................................................................................64 Indicator A2: High water table ......................................................................................65 Indicator A3: Saturation................................................................................................66
Group B – Evidence of Recent Inundation ...............................................................................67 Indicator B6: Surface soil cracks..................................................................................67 Indicator B7: Inundation visible on aerial imagery......................................................68 Indicator B9: Water-stained leaves ..............................................................................68 Indicator B11: Salt crust ...............................................................................................69 Indicator B12: Biotic crust ............................................................................................69 Indicator B13: Aquatic invertebrates ...........................................................................72 Indicator B1: Water marks............................................................................................73 Indicator B2: Sediment deposits ..................................................................................74 Indicator B3: Drift deposits...........................................................................................75 Indicator B10: Drainage patterns.................................................................................75
Group C – Evidence of Current or Recent Soil Saturation .......................................................76 Indicator C1: Hydrogen sulfide odor.............................................................................76 Indicator C3: Oxidized rhizospheres along living roots................................................77 Indicator C4: Presence of reduced iron .......................................................................78 Indicator C6: Recent iron reduction in tilled soils .......................................................79 Indicator C7: Thin muck surface ..................................................................................80 Indicator C2: Dry-season water table ...........................................................................81 Indicator C8: Crayfish burrows .....................................................................................81
ERDC/EL TR-08-28 v
Indicator C9: Saturation visible on aerial imagery ......................................................82 Group D – Evidence from Other Site Conditions or Data.........................................................83
Indicator D3: Shallow aquitard.....................................................................................83 Indicator D5: FAC-neutral test ......................................................................................84
5 Difficult Wetland Situations in the Arid West ...........................................................................85 Introduction ............................................................................................................................85 Problematic hydrophytic vegetation ......................................................................................85
Description of the problem........................................................................................................85 Procedure ...................................................................................................................................86
Problematic hydric soils .........................................................................................................96 Description of the problem........................................................................................................96
Soils with faint or no indicators .....................................................................................96 Soils with relict or induced hydric soil indicators .........................................................97
Procedure ...................................................................................................................................98 Wetlands that periodically lack indicators of wetland hydrology .......................................102
Description of the problem......................................................................................................102 Procedure .................................................................................................................................102
References......................................................................................................................................... 108
Appendix A: Glossary........................................................................................................................ 111
Appendix B: Point-Intercept Sampling Procedure for Determining Hydrophytic Vegetation.................................................................................................................................. 118
Appendix C: Data Form .................................................................................................................... 120
Report Documentation Page
ERDC/EL TR-08-28 vi
Figures and Tables
Figures
Figure 1. Approximate boundaries of the Arid West Region and subregions. ...................................... 4 Figure 2. Plant list regional boundaries currently used by the U.S. Fish and Wildlife Service, National Wetlands Inventory, in the Arid West........................................................................20 Figure 3. Example of a Histosol, in which muck is greater than 3 ft thick.........................................38 Figure 4. Organic surface layer less than 16 in. thick. .........................................................................39 Figure 5. Black organic surface layer greater than 11 in. thick...........................................................39 Figure 6. Stratified layers in loamy material. ......................................................................................... 41 Figure 7. Stratified layers in sandy material........................................................................................... 41 Figure 8. Depleted matrix starts immediately below the black surface layer ....................................43 Figure 9. Deep observations may be necessary to identify the depleted or gleyed matrix below the dark surface layer. ..................................................................................................................44 Figure 10. The mucky modified sandy layer is approximately 3 in. thick............................................45 Figure 11. In this example, the gleyed matrix begins at the soil surface............................................45 Figure 12. Redox features in this soil begin at about 2 in....................................................................46 Figure 13. The layer stripped of organic matter begins beneath the dark surface layer. ................. 47 Figure 14. This gleyed matrix begins at the soil surface. .....................................................................48 Figure 15. Indicator F3, Depleted Matrix. Redox concentrations are present within a low-chroma matrix...........................................................................................................................................50 Figure 16. Redox concentrations at 2 in................................................................................................50 Figure 17. Redox features can be small and difficult to see within a dark soil layer. ........................ 51 Figure 18. Redox depletions (lighter colored areas) scattered within the darker matrix. .................52 Figure 19. In this example, the layer of redox concentrations begins at the soil surface and is slightly more than 2 in. thick........................................................................................................53 Figure 20. Inundation in a vernal pool. ..................................................................................................54 Figure 21. Wetland with surface water present. ...................................................................................64 Figure 22. High water table observed in a soil pit.................................................................................65 Figure 23. Water glistens on the surface of a saturated soil sample. ................................................66 Figure 24. Surface soil cracks in a seasonally ponded wetland..........................................................67 Figure 25. A hard salt crust in a dry temporary pool.............................................................................69 Figure 26. Ponding-remnant biotic crusts on the surfaces of mud-crack polygons. Biotic crusts often have up-turned edges with the surface layer darker than the underlying material. .................................................................................................................................................... 71 Figure 27. Ponding-remnant biotic crust showing polygons and curls detached from the underlying sediments. ............................................................................................................................. 71 Figure 28. Ponding-remnant biotic crust, showing dried algal caps on a domed mud-crack surface. ..................................................................................................................................................... 71
ERDC/EL TR-08-28 vii
Figure 29. Dark-colored material is benthic microflora consisting of blue-green and green algae in a hypersaline intertidal marsh.................................................................................................. 71 Figure 30. Remains of floating algal material in a seasonally inundated Juncus-dominated marsh. ....................................................................................................................................................... 71 Figure 31. Rough or pedicellate crust indicates no recent history of standing water........................ 71 Figure 32. Asphalt-like crust indicates no recent history of standing water.......................................72 Figure 33. Shells of aquatic snails in a seasonally ponded fringe wetland........................................72 Figure 34. Carapaces of tadpole shrimp and clam shrimp in dried sediments of an ephemeral pool ........................................................................................................................................72 Figure 35. Water marks on a boulder ....................................................................................................73 Figure 36. Sediment deposits on tree bases in a seasonally flooded area. ..................................... 74 Figure 37. Drift deposit on the upstream side of a sapling in a floodplain wetland. .........................75 Figure 38. Vegetation bent over in the direction of water flow across a stream terrace................... 76 Figure 39. Iron oxide plaque on a living root. Iron also coats the channel or pore from which the root was removed. .................................................................................................................. 77 Figure 40. When alpha, alpha-dipyridyl dye is applied to a soil containing reduced iron, a positive reaction is indicated by a pink or red coloration to the treated area. ...................................79 Figure 41. Redox concentrations in a recently cultivated soil..............................................................80 Figure 42. Crayfish burrow.......................................................................................................................82 Figure 43. Aerial photograph of an agricultural field with saturated soils indicated by darker colors.............................................................................................................................................83 Figure 44. Example of sparse and patchy plant cover in a wetland. Areas labeled as vegetated have 5 percent or more plant cover......................................................................................89 Figure 45. Mature Populus deltoides stand with a xeric understory on the Arikaree River, Colorado.................................................................................................................................................... 91 Figure 46. This soil exhibits colors associated with reducing conditions. ........................................100 Figure 47. Soil in Figure 46 after exposure to the air and oxidation..................................................100 Figure A1. Illustration of values and chromas that require 2 percent or more distinct or prominent redox concentrations and those that do not, for hue 10YR, to meet the definition of a depleted matrix. .............................................................................................................118 Figure A2. For hydric soil determinations, a gleyed matrix has the hues and chroma identified in this illustration with a value of 4 or more. ......................................................................119
Tables
Table 1. Sections of the Corps Manual replaced by this Regional Supplement for applications in the Arid West..................................................................................................................... 2 Table 2. Comparison of general landscape characteristics between the Arid West Region and the Western Mountains, Valleys, and Coast Region........................................................................ 5 Table 3. Selected references to additional vegetation sampling approaches that could be used in wetland delineation. ................................................................................................................... 16 Table 4. Example of the selection of dominant species by the 50/20 rule and determination of hydrophytic vegetation by the dominance test. .......................................................23 Table 5. Example of the Prevalence Index using the same data as in Table 4. .................................25 Table 6. Proportion of fibers visible with a hand lens...........................................................................30
ERDC/EL TR-08-28 viii
Table 7. Determining degree of decomposition of organic materials.................................................. 31 Table 8. Minimum thickness requirements for commonly combined indicators in the Arid West Region..............................................................................................................................................36 Table 9. Example of a soil that is hydric based on a combination of indicators F6 and F3.................................................................................................................................................. 37 Table 10. Example of a soil that is hydric based on a combination of indicators F6 and S5.................................................................................................................................................. 37 Table 11. Wetland hydrology indicators for the Arid West. ...................................................................63 Table A1. Tabular key for contrast determinations using Munsell notation......................................103
ERDC/EL TR-08-28 ix
Preface
This document is one of a series of Regional Supplements to the Corps of Engineers Wetland Delineation Manual. It was developed by the U.S. Army Engineer Research and Development Center (ERDC) at the request of Headquarters, U.S. Army Corps of Engineers (USACE), with funding provided through the Wetlands Regulatory Assistance Program (WRAP). This is Version 2.0 of the Arid West Regional Supplement; it replaces the “interim” version, which was published in December 2006.
This document was developed in cooperation with the Arid West Regional Working Group, whose members contributed their time and expertise to the project over a period of many months. Working Group meetings were held in Sacramento, CA, on 9–10 December 2003; Salt Lake City, UT, on 26–27 October 2004; Phoenix, AZ, on 15–16 February 2005; and Denver, CO, on 27–28 June 2006. Members of the Regional Working Group and contributors to this document were:
• James Wakeley, Project Leader and Working Group Chair, Environmental Laboratory (EL), ERDC, Vicksburg, MS
• Robert Lichvar, Chair, Vegetation Subcommittee, Cold Regions Research and Engineering Laboratory, ERDC, Hanover, NH
• Chris Noble, Chair, Soils Subcommittee, EL, ERDC, Vicksburg, MS • Ed Blake, U.S. Department of Agriculture (USDA), Natural Resources
Conservation Service (NRCS), Minden, NV • Roger Borine, USDA, Natural Resources Conservation Service,
Redmond, OR • Don Breckenfeld, USDA, Natural Resources Conservation Service,
Tucson, AZ • William Brostoff, EL, ERDC, Vicksburg, MS • Steve Caicco, U.S. Fish and Wildlife Service, Reno, NV • Robert Dummer, U.S. Army Engineer Los Angeles District, Arizona
Regulatory Office, Phoenix, AZ • Wade Eakle, U.S. Army Engineer South Pacific Division, San Francisco,
CA • Richard Gebhart, U.S. Army Engineer Sacramento District, Nevada
Regulatory Office, Reno, NV • Jim Goudzwaard, U.S. Army Engineer District, Portland, OR
ERDC/EL TR-08-28 x
• Jonathan Hall, National Wetlands Inventory, U.S. Fish and Wildlife Service, Portland, OR
• Bruce Henderson, U.S. Army Engineer District, Los Angeles, CA • Jim Herrington, U.S. Environmental Protection Agency, Dallas, TX • Deborah Knaub, U.S. Army Engineer District, Seattle, WA • Ken Laterza, U.S. Army Engineer District, Fort Worth, TX • Daniel Martel, U.S. Army Engineer District, San Francisco, CA • Greg Martinez, U.S. Army Engineer District, Walla Walla, WA • Chris McAuliffe, U.S. Army Engineer District, Seattle, WA • Janet Morlan, Oregon Department of State Lands, Salem, OR • Chandler Peter, U.S. Army Engineer Omaha District, Wyoming
Regulatory Office, Cheyenne, WY • Richard Prather, U.S. Environmental Protection Agency, Dallas, TX • Ralph Thomas Rogers, U.S. Environmental Protection Agency, Seattle,
WA • David Ruiter, U.S. Environmental Protection Agency, Denver, CO • James Wood, U.S. Army Engineer District, Albuquerque, NM • Tom Yocom, U.S. Environmental Protection Agency, San Francisco, CA • David Zoutendyk, U.S. Fish and Wildlife Service, Carlsbad, CA
Technical reviews were provided by the following members of the National Advisory Team for Wetland Delineation: Steve Eggers, U.S. Army Engineer (USAE) District, St. Paul, MN; Dan Martel, USAE District, San Francisco, CA; Jennifer McCarthy, U.S. Army Corps of Engineers, Washington, DC; Paul Minkin, USAE District, New England, Concord, MA; Ralph Thomas Rogers, EPA, Seattle, WA; Stuart Santos, USAE District, Jacksonville, FL; Ralph Spagnolo, EPA, Philadelphia, PA; Ralph Tiner, U.S. Fish and Wildlife Service, Hadley, MA; P. Michael Whited, NRCS, St. Paul, MN; and James Wood, USAE District, Albuquerque, NM. In addition, portions of this Regional Supplement that address soils issues were reviewed and endorsed by the National Technical Committee for Hydric Soils (Karl Hipple, chair).
Independent peer reviews were performed in accordance with Office of Management and Budget guidelines. The peer-review team consisted of Terri Skadeland, Chair, NRCS, Lakewood, CO; David Blauch, Ecological Resource Consultants, Inc., Boulder, CO; Nancy Keate, Utah Department of Natural Resources, Salt Lake City, UT; Stephanie MacDonald, EcoPlan Associates, Inc., Mesa, AZ; Richard McEldowney, PBS&J, Inc., Bozeman, MT; Maryann McGraw, New Mexico Environment Department, Surface

ERDC/EL TR-08-28 xi
Water Quality Bureau, Santa Fe, NM; Charles Newling, Wetlands Science Applications, Inc., Tacoma, WA; George Ruffner, EcoPlan Associates, Inc., Prescott, AZ; and Michelle Stevens, California Department of Water Resources, Sacramento, CA.
Technical editors for this Regional Supplement were Dr. James S. Wakeley, Robert W. Lichvar, and Chris V. Noble, ERDC. Katherine Trott was the project proponent and coordinator at Headquarters, USACE. During the conduct of this work, Dr. Morris Mauney was Chief of the Wetlands and Coastal Ecology Branch; Dr. David Tazik was Chief, Ecosystem Evaluation and Engineering Division; and Dr. Elizabeth Fleming was Director, EL.
COL Gary E. Johnston was Commander and Executive Director of ERDC. Dr. James R. Houston was Director.
The correct citation for this document is:
U.S. Army Corps of Engineers. 2008. Regional Supplement to the Corps of Engineers Wetland Delineation Manual: Arid West Region (Version 2.0), ed. J. S. Wakeley, R. W. Lichvar, and C. V. Noble. ERDC/EL TR-08-28. Vicksburg, MS: U.S. Army Engineer Research and Development Center.
ERDC/EL TR-08-28 1
1 Introduction Purpose and use of this regional supplement
This document is one of a series of Regional Supplements to the Corps of Engineers Wetland Delineation Manual (hereafter called the Corps Manual). The Corps Manual provides technical guidance and procedures, from a national perspective, for identifying and delineating wetlands that may be subject to regulatory jurisdiction under Section 404 of the Clean Water Act (33 U.S.C. 1344) or Section 10 of the Rivers and Harbors Act (33 U.S.C. 403). According to the Corps Manual, identification of wetlands is based on a three-factor approach involving indicators of hydrophytic vegetation, hydric soil, and wetland hydrology. This Regional Supplement presents wetland indicators, delineation guidance, and other information that is specific to the Arid West Region.
This Regional Supplement is part of a nationwide effort to address regional wetland characteristics and improve the accuracy and efficiency of wetland-delineation procedures. Regional differences in climate, geol-ogy, soils, hydrology, plant and animal communities, and other factors are important to the identification and functioning of wetlands. These differ-ences cannot be considered adequately in a single national manual. The development of this supplement follows National Academy of Sciences recommendations to increase the regional sensitivity of wetland-delineation methods (National Research Council 1995). The intent of this supplement is to bring the Corps Manual up to date with current knowl-edge and practice in the region and not to change the way wetlands are defined or identified. The procedures given in the Corps Manual, in combination with wetland indicators and guidance provided in this supplement, can be used to identify wetlands for a number of purposes, including resource inventories, management plans, and regulatory programs. The determination that a wetland is subject to regulatory jurisdiction under Section 404 or Section 10 must be made independently of procedures described in this supplement.
This Regional Supplement is designed for use with the current version of the Corps Manual (Environmental Laboratory 1987) and all subsequent versions. Where differences in the two documents occur, this Regional Supplement takes precedence over the Corps Manual for applications in
ERDC/EL TR-08-28 2
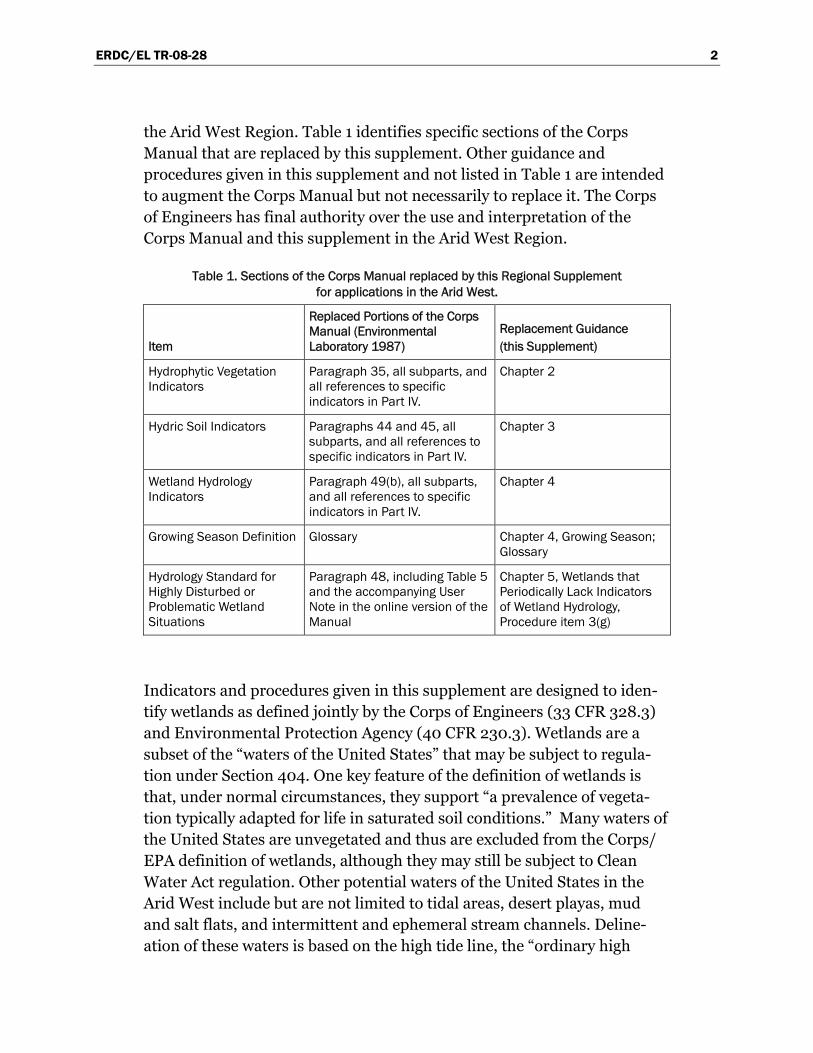
the Arid West Region. Table 1 identifies specific sections of the Corps Manual that are replaced by this supplement. Other guidance and procedures given in this supplement and not listed in Table 1 are intended to augment the Corps Manual but not necessarily to replace it. The Corps of Engineers has final authority over the use and interpretation of the Corps Manual and this supplement in the Arid West Region.
Table 1. Sections of the Corps Manual replaced by this Regional Supplement for applications in the Arid West.
Item
Replaced Portions of the Corps Manual (Environmental Laboratory 1987)
Replacement Guidance (this Supplement)
Hydrophytic Vegetation Indicators
Paragraph 35, all subparts, and all references to specific indicators in Part IV.
Chapter 2
Hydric Soil Indicators Paragraphs 44 and 45, all subparts, and all references to specific indicators in Part IV.
Chapter 3
Wetland Hydrology Indicators
Paragraph 49(b), all subparts, and all references to specific indicators in Part IV.
Chapter 4
Growing Season Definition Glossary Chapter 4, Growing Season; Glossary
Hydrology Standard for Highly Disturbed or Problematic Wetland Situations
Paragraph 48, including Table 5 and the accompanying User Note in the online version of the Manual
Chapter 5, Wetlands that Periodically Lack Indicators of Wetland Hydrology, Procedure item 3(g)
Indicators and procedures given in this supplement are designed to iden-tify wetlands as defined jointly by the Corps of Engineers (33 CFR 328.3) and Environmental Protection Agency (40 CFR 230.3). Wetlands are a subset of the “waters of the United States” that may be subject to regula-tion under Section 404. One key feature of the definition of wetlands is that, under normal circumstances, they support “a prevalence of vegeta-tion typically adapted for life in saturated soil conditions.” Many waters of the United States are unvegetated and thus are excluded from the Corps/ EPA definition of wetlands, although they may still be subject to Clean Water Act regulation. Other potential waters of the United States in the Arid West include but are not limited to tidal areas, desert playas, mud and salt flats, and intermittent and ephemeral stream channels. Deline-ation of these waters is based on the high tide line, the “ordinary high
ERDC/EL TR-08-28 3
water mark” (33 CFR 328.3), or other criteria and is beyond the scope of this Regional Supplement.
Amendments to this document will be issued periodically in response to new scientific information and user comments. Between published ver-sions, Headquarters, U.S. Army Corps of Engineers, may provide updates to this document and any other supplemental information used to make wetland determinations under Section 404 or Section 10. Wetland delineators should use the most recent approved versions of this document and supplemental information. See the Corps of Engineers Headquarters regulatory web site for information and updates (http://www.usace.army.mil/inet/functions/cw/cecwo/reg/). The Corps of Engineers has established an interagency National Advisory Team for Wetland Delineation whose role is to review new data and make recommendations for needed changes in wetland-delineation procedures to Headquarters, U.S. Army Corps of Engineers. Items for consideration by the team, including full documentation and supporting data, should be submitted to:
National Advisory Team for Wetland Delineation Regulatory Branch (Attn: CECW-CO) U.S. Army Corps of Engineers 441 G Street, N.W. Washington, DC 20314-1000
Applicable region and subregions
This supplement is applicable to the Arid West Region, which consists of all or portions of 12 states: Arizona, California, Colorado, Idaho, Montana, Nevada, New Mexico, Oregon, Texas, Utah, Washington, and Wyoming (Figure 1). The region encompasses a wide variety of landforms and ecosystems, but is differentiated from surrounding areas by its pre-dominantly dry climate and long summer dry season. Annual evapotrans-piration exceeds precipitation across most of the region (Bailey 1995).
The approximate spatial extent of the Arid West Region is shown in Figure 1 and is based mainly on a combination of Land Resource Regions (LRR) B, C, and D recognized by the U.S. Department of Agriculture (USDA Natural Resources Conservation Service 2006a). The region also corresponds generally to the combined Level I Ecoregions 10, 11, 12, and 13 of the Commission for Environmental Cooperation (CEC 1997). The region includes the associated coastal zone of southern California. The

ERDC/EL TR-08-28 4
Figure 1. Approximate boundaries of the Arid West Region and subregions (LRR B, C, and D).
This regional supplement is applicable throughout the highlighted areas, including coastal areas, with the following exceptions: (1) the cross-hatched portions of LRR D comprising the Sierra Nevada Mountains (MLRA 22A), the Southern Cascade Mountains (MLRA 22B), and
the Arizona and New Mexico Mountains (MLRA 39) and (2) other embedded mountain ranges not indicated on the map that support predominantly coniferous forests with interspersed
meadows, shrublands, and riparian woodlands above and including the ponderosa pine zone. See text and Table 2 for details.

ERDC/EL TR-08-28 5
Table 2. Comparison of general landscape characteristics between the Arid West Region and the Western Mountains, Valleys, and Coast Region
Landscape Characteristics Arid West Regional Supplement
Western Mountains, Valleys, and Coast Regional Supplement
Climate Generally hot and dry with a long summer dry season. Average annual precipitation mostly <15 in. (380 mm) except along the coast. Most precipitation falls as rain.
Cooler and more humid, with a shorter dry season. Average annual precipitation mostly >20 in. (500 mm). Except near the coast, much of the annual precipitation falls as snow, particularly at higher elevations.
Vegetation Little or no forest cover at the same elevation as the site and, if present, usually dominated by pinyon pine (e.g., P. monophylla or P. edulis), junipers (Juniperus), cottonwoods (e.g., Populus fremontii), willows (Salix), or hardwoods (e.g., Quercus, Platanus). Landscape mostly dominated by grasses and shrubs (e.g., sagebrush (Artemisia), rabbitbrush (Chrysothamnus), bitterbrush (Purshia), and creosote bush (Larrea)). Halophytes (e.g., Allenrolfea, Salicornia, Distichlis) present in saline areas.
Forests at comparable elevations in the local area dominated by conifers (e.g., spruce (Picea), fir (Abies), hemlock (Tsuga), Douglas-fir (Pseudotsuga), coast redwood (Sequoia), or pine (Pinus) except pinyon) or aspen (Populus tremuloides). In the Willamette Valley, Oregon ash (Fraxinus latifolia) and bigleaf maple (Acer macrophyllum) often dominate. Open areas generally dominated by grasses, sedges, shrubs (e.g., willows or alders (Alnus)), or alpine tundra.
Soils Mostly dry, poorly developed, low in organic matter content, and high in carbonates. Soils sometimes highly alkaline. Surface salt crusts and efflorescences common in low areas.
Generally better developed, higher in organic matter content, and low in carbonates. Surface salt features are less common except in geothermal areas.
Hydrology Drainage basins often lacking outlets. Temporary ponds (often saline), salt lakes, and ephemeral streams predominate. Water tables often perched. Major streams and rivers flow through but have headwaters outside the Arid West.
Streams and rivers often perennial. Open drainages with many natural, freshwater lakes. Water tables often continuous with deeper groundwater. Region serves as the headwaters of the major streams and rivers of the western United States.
Arid West Region is dominated mainly by grasslands, shrublands, hard-wood savannas, deciduous woodlands, and pinyon/juniper (e.g., Pinus monophylla or P. edulis / Juniperus spp.) woodlands.
The Arid West Region is surrounded by and interspersed with portions of the Western Mountains, Valleys, and Coast Region. The following areas are excluded from the Arid West Region because environmental conditions are more appropriate for application of the Western Mountains, Valleys, and Coast Regional Supplement (U.S. Army Corps of Engineers 2008, or current version):
• Sierra Nevada Mountains (Major Land Resource Area (MLRA) 22A) • Southern Cascade Mountains (MLRA 22B)
ERDC/EL TR-08-28 6
• Arizona and New Mexico Mountains (MLRA 39) • Other mountain ranges scattered throughout the West that support
mainly coniferous forests on the lower slopes, alpine tundra at the highest elevations (if present), and open coniferous woodlands, shrublands, meadows, and hardwood riparian woodlands in the valleys, down to the lower elevational limit of the ponderosa pine (Pinus ponderosa) zone or its local equivalent.
The decision to use the Arid West Regional Supplement or the Western Mountains, Valleys, and Coast Regional Supplement on a particular field site should be based on landscape and site conditions, and not solely on map location. Figure 1 is highly generalized and does not indicate many of the smaller mountain ranges where the Western Mountains, Valleys, and Coast supplement would be applicable. Furthermore, there are arid environments beyond the highlighted areas in Figure 1 where the Arid West Regional Supplement would be appropriate. Both regions are highly diverse and transitions between them can be gradual. Table 2 summarizes general patterns in climate, vegetation, soils, and hydrology that help to differentiate the two regions. In many areas of the West, the transition between the two regions is indicated by the upper limit of pinyon/juniper and associated shrub-dominated communities, and the lower limit of ponderosa pine or other coniferous forests.
Region and subregion boundaries are depicted in Figure 1 as sharp lines. However, climatic conditions and the physical and biological character-istics of landscapes do not change abruptly at the boundaries. In reality, regions and subregions often grade into one another in broad transition zones that may be tens or hundreds of miles wide. The lists of wetland indicators presented in these Regional Supplements may differ between adjoining regions or subregions. In transitional areas, the investigator must use experience and good judgment to select the supplement and indicators that are appropriate to the site based on its physical and bio-logical characteristics. Wetland boundaries are not likely to differ between two supplements in transitional areas, but one supplement may provide more detailed treatment of certain problem situations encountered on the site. If in doubt about which supplement to use in a transitional area, apply both supplements and compare the results. For additional guidance, contact the appropriate Corps of Engineers District Regulatory Office for guidance. Contact information for District regulatory offices is available at
ERDC/EL TR-08-28 7
the Corps Headquarters web site (http://www.usace.army.mil/inet/functions/cw/ cecwo/reg/district.htm).
Physical and biological characteristics of the region
The Arid West Region consists of desert and shrub-steppe ecosystems in the rain shadow of the Cascade and Sierra Nevada Mountain ranges, plus portions of central and southern California that have a Mediterranean climate with mild winters and dry summers. In general, the region is characterized by relatively high average temperatures, low humidity, and often extreme temporal and spatial variability in precipitation amounts. The Arid West is a vast and topographically diverse region containing enclosed basins, broad valleys, plateaus, canyons, arroyos, mesas, buttes, and numerous mountain ranges. Soils are generally dry, poorly developed, low in percentage of organic matter, and high in carbonates (CEC 1997). Native vegetation across much of the region is dominated mainly by grasses and shrubs with relatively few large trees except in the embedded mountain ranges and riparian zones along perennial streams (Bailey 1995, CEC 1997, USDA Natural Resources Conservation Service 2006a).
Within the Arid West Region, this supplement recognizes three subregions that differ sufficiently from each other in climate, landforms, biogeogra-phy, and/or wetland characteristics to warrant separate consideration of wetland indicators and delineation guidance. These subregions are the Interior Deserts (corresponds to LRR D), the Columbia/Snake River Plateau (LRR B), and Mediterranean California (LRR C) (Figure 1). Important characteristics of each subregion are described briefly below. However, most of the indicators presented in this Regional Supplement are applicable across all subregions of the Arid West.
Interior deserts (LRR D)
The Interior Deserts subregion consists of two distinct parts: the “hot desert” and the “cold desert.” Each part also contains extensive areas of mountains dominated by chaparral and coniferous forests. The hot desert consists of the combined Mojave, Sonoran, and Chihuahuan Deserts in southeastern California, southern Nevada, Arizona, New Mexico, and west Texas. Average annual temperature ranges from 50 to 75 °F (10 to 24 °C). Summers are long and very hot. The record high temperature for the United States of 134 °F (57 °C) was recorded in Death Valley, California, in 1913. Average annual precipitation ranges from approximately 2 to 10 in.

ERDC/EL TR-08-28 8
(50 to 250 mm) in the valleys with higher amounts in the mountains (Bailey 1995). Significant rainfall occurs in both winter and summer, and there is little snow (Barbour and Billings 1989). Winter frontal storms from the Pacific Ocean generally produce widespread rainfall of low inten-sity. Summer convective thunderstorms are common and may produce very high-intensity and short-duration rainfall in limited areas, leaving nearby areas dry. In addition, tropical cyclones that move northeastward across the Pacific Ocean toward Baja California and mainland Mexico can bring intense rain and occasional flooding to the area (Field 2004). The vegetation of the hot desert is derived mainly from the subtropical flora to the south. Several species are characteristic of the hot desert, but their abundance and distribution vary across the area. Creosote bush (Larrea divaricata) is commonly associated with the hot desert, along with other xeric shrubs, succulents, cacti, and short grasses. In various portions of the hot desert area, characteristic plants include Joshua tree (Yucca brevifolia), palo verde (Cercidium spp.), ocotillo (Fouquieria splendens), mesquite (Prosopis spp.), saguaro cactus (Carnegiea gigantea), and cholla and prickly pear cacti (Opuntia spp.).
The cold desert lies generally north of the hot desert and east of the Sierra Nevada Mountain range, and includes the basin-and-range province of eastern California, Nevada, southeastern Oregon, and Utah, and the Colorado Plateau in Arizona, Utah, Colorado, and New Mexico. Average annual temperature ranges from 40 to 55 °F (4 to 13 °C) and winters are cold. The area receives 5 to 20 in. (130 to 500 mm) of precipitation each year; winter precipitation falls mainly as snow (Bailey 1995). Winter Pacific frontal storms associated with low-pressure systems are an increasingly important source of moisture as one moves from south to north. These storms produce rain and snowfall of relatively low intensity and long duration over wide areas. Little rain falls during summer, except in the mountains (Field 2004). The basin-and-range province is domi-nated by fault-block mountain ranges and broad valleys, whereas the Colorado Plateau consists mainly of uplifted and highly eroded sedi-mentary rocks. Sagebrush (Artemisia tridentata) and rabbit brush (Chrysothamnus nauseosus) dominate much of the cold desert area, with saltbush (Atriplex spp.), iodine bush (Allenrolfea occidentalis), and greasewood (Sarcobatus vermiculatus) on the more alkaline soils. Pinyon/juniper and ponderosa pine woodlands occupy large areas of the Colorado Plateau, interspersed with native grasslands and shrub-steppes (Bailey 1995).
ERDC/EL TR-08-28 9
Columbia/Snake River Plateau (LRR B)
The Columbia/Snake River Plateau lies east of the Cascade Mountains in Washington, Oregon, and southern Idaho. Much of the subregion is covered by deposits of loess, volcanic ash, and basalt. The climate is semi-arid with average annual temperatures of 40 to 49 °F (5 to 10 °C) in much of the area and average annual precipitation in lowland areas ranging from 6 to 20 in. (150 to 510 mm) (Bailey 1995, USDA Natural Resources Conservation Service 2006a). Summers are dry. Natural vegetation across much of the area is dominated by sagebrush, saltbush, and short grasses, with greasewood on alkali flats. Willows and sedges are common along streams and in wet areas at the bases of the mountains (Bailey 1995). The Palouse area of southeastern Washington and west-central Idaho once supported extensive prairie ecosystems dominated by perennial bunch-grasses such as bluebunch wheatgrass (Agropyron spicatum) and Idaho fescue (Festuca idahoensis). However, this area has largely been converted to agriculture.
Mediterranean California (LRR C)
Mediterranean California is characterized by relatively warm, wet winters and dry summers. Average annual temperature ranges from approxi-mately 41 to 67 °F (5 to 20 °C). Average annual precipitation ranges from 6 in. (150 mm) in the upper San Joaquin Valley to more than 30 in. (760 mm) along the central California coast (USDA Natural Resources Conservation Service 2006a). The area is influenced mainly by winter frontal storms from the Pacific Ocean. Most precipitation falls from November to April; summers in the lowlands can be very dry (Bailey 1995, CEC 1997). Mediterranean California contains a variety of landscapes including broad valleys, foothills, mountains, and coastal areas. The sub-region supports a highly diverse mix of plant communities including chaparral, coastal strand, coastal sage scrub, valley grassland, oak wood-land, and foothill woodland (Hickman 1993).
Types and distribution of wetlands
Wetland types
While the Arid West is characterized by limited amounts of water, the varied landscapes included in this broad region support many different wetland types. Overall, however, wetlands and other shallow aquatic
ERDC/EL TR-08-28 10
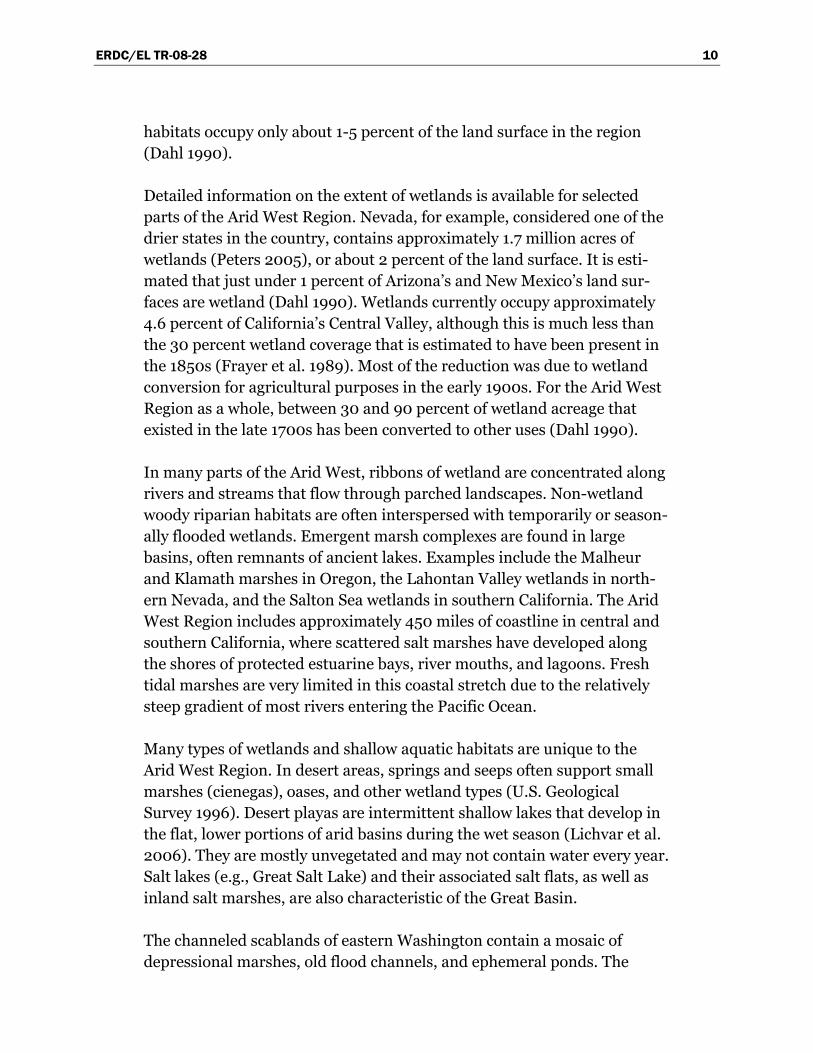
habitats occupy only about 1-5 percent of the land surface in the region (Dahl 1990).
Detailed information on the extent of wetlands is available for selected parts of the Arid West Region. Nevada, for example, considered one of the drier states in the country, contains approximately 1.7 million acres of wetlands (Peters 2005), or about 2 percent of the land surface. It is esti-mated that just under 1 percent of Arizona’s and New Mexico’s land sur-faces are wetland (Dahl 1990). Wetlands currently occupy approximately 4.6 percent of California’s Central Valley, although this is much less than the 30 percent wetland coverage that is estimated to have been present in the 1850s (Frayer et al. 1989). Most of the reduction was due to wetland conversion for agricultural purposes in the early 1900s. For the Arid West Region as a whole, between 30 and 90 percent of wetland acreage that existed in the late 1700s has been converted to other uses (Dahl 1990).
In many parts of the Arid West, ribbons of wetland are concentrated along rivers and streams that flow through parched landscapes. Non-wetland woody riparian habitats are often interspersed with temporarily or season-ally flooded wetlands. Emergent marsh complexes are found in large basins, often remnants of ancient lakes. Examples include the Malheur and Klamath marshes in Oregon, the Lahontan Valley wetlands in north-ern Nevada, and the Salton Sea wetlands in southern California. The Arid West Region includes approximately 450 miles of coastline in central and southern California, where scattered salt marshes have developed along the shores of protected estuarine bays, river mouths, and lagoons. Fresh tidal marshes are very limited in this coastal stretch due to the relatively steep gradient of most rivers entering the Pacific Ocean.
Many types of wetlands and shallow aquatic habitats are unique to the Arid West Region. In desert areas, springs and seeps often support small marshes (cienegas), oases, and other wetland types (U.S. Geological Survey 1996). Desert playas are intermittent shallow lakes that develop in the flat, lower portions of arid basins during the wet season (Lichvar et al. 2006). They are mostly unvegetated and may not contain water every year. Salt lakes (e.g., Great Salt Lake) and their associated salt flats, as well as inland salt marshes, are also characteristic of the Great Basin.
The channeled scablands of eastern Washington contain a mosaic of depressional marshes, old flood channels, and ephemeral ponds. The
ERDC/EL TR-08-28 11
pock-marked surface was formed when the volcanic rock in the area was deeply scoured by massive flooding thought to have occurred 12,000 to 20,000 years ago during and following the last Pleistocene glaciation (Houston and Vial 1995). Small, temporarily and seasonally ponded depressions called vernal pools occur in scattered areas from San Diego County, California, to the Modoc Plateau in southern Oregon. These wet-lands are found in a variety of landscapes where they are usually underlain by an impermeable layer such as a hardpan, claypan, or basalt. Vernal pools often fill and empty several times during the rainy season. Other wetland types in the Arid West include seeps near the bases of slopes; wet meadows; wetlands associated with the fringes of reservoirs; wetlands associated with ephemeral, intermittent, and perennial streams and rivers; and man-made depressional wetlands in mined areas, agricultural lands, suburban areas (e.g., golf courses), and wetland restoration sites.
Irrigated wetlands
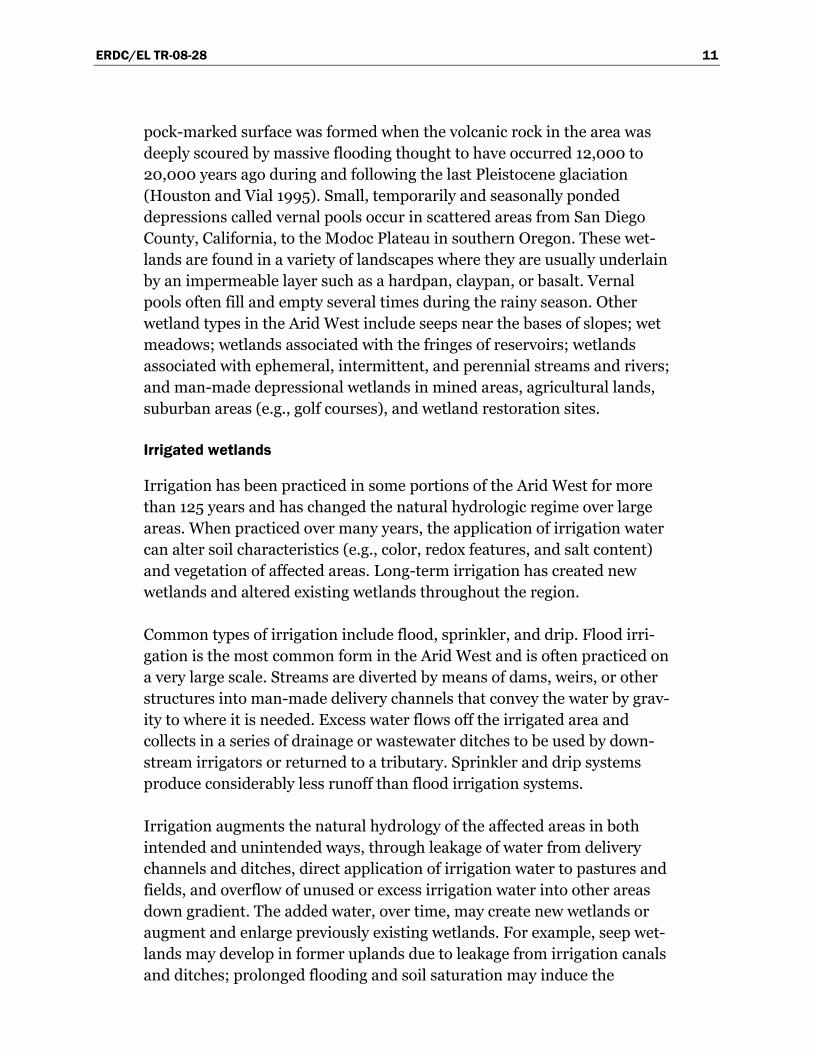
Irrigation has been practiced in some portions of the Arid West for more than 125 years and has changed the natural hydrologic regime over large areas. When practiced over many years, the application of irrigation water can alter soil characteristics (e.g., color, redox features, and salt content) and vegetation of affected areas. Long-term irrigation has created new wetlands and altered existing wetlands throughout the region.
Common types of irrigation include flood, sprinkler, and drip. Flood irri-gation is the most common form in the Arid West and is often practiced on a very large scale. Streams are diverted by means of dams, weirs, or other structures into man-made delivery channels that convey the water by grav-ity to where it is needed. Excess water flows off the irrigated area and collects in a series of drainage or wastewater ditches to be used by down-stream irrigators or returned to a tributary. Sprinkler and drip systems produce considerably less runoff than flood irrigation systems.
Irrigation augments the natural hydrology of the affected areas in both intended and unintended ways, through leakage of water from delivery channels and ditches, direct application of irrigation water to pastures and fields, and overflow of unused or excess irrigation water into other areas down gradient. The added water, over time, may create new wetlands or augment and enlarge previously existing wetlands. For example, seep wet-lands may develop in former uplands due to leakage from irrigation canals and ditches; prolonged flooding and soil saturation may induce the

ERDC/EL TR-08-28 12
formation of redoximorphic features and establishment of hydrophytic vegetation in irrigated pastures; and the accumulation of excess irrigation water in basins and swales may augment previously existing wetlands, raising their water tables and expanding their margins. On the other hand, groundwater withdrawal for irrigation purposes may also depress water tables in the vicinity of a well. Indicators given in this Regional Supple-ment can be used to identify all wetlands, whether natural or created arti-ficially by human activity. The appropriate Corps of Engineers District Regulatory Office should be consulted when it is necessary to distinguish between naturally occurring and irrigation-induced wetlands for Clean Water Act regulatory purposes.

ERDC/EL TR-08-28 13
2 Hydrophytic Vegetation Indicators Introduction
The Corps Manual defines hydrophytic vegetation as the community of macrophytes that occurs in areas where inundation or soil saturation is either permanent or of sufficient frequency and duration to exert a controlling influence on the plant species present. The manual uses a plant-community approach to evaluate vegetation. Hydrophytic vegetation decisions are based on the assemblage of plant species growing on a site, rather than the presence or absence of particular indicator species. Hydrophytic vegetation is present when the plant community is dominated by species that can tolerate prolonged inundation or soil saturation during the growing season. Hydrophytic vegetation in the Arid West is identified by using the indicators described in this chapter.
Many factors besides site wetness affect the composition of the plant com-munity in an area, including regional climate, local weather patterns, top-ography, soils, and plant distributional patterns at various spatial scales. The Arid West Region is best described as having extreme variability in many of these influencing characteristics. Community composition reflects the adaptive capabilities of the plant species present, superimposed on a complex spatial pattern of hydrologic, edaphic, and other environmental conditions. Disturbances and climatic fluctuations, such as floods, wild-fires, drought, grazing, tilling, and recent site modifications, are also important. They can set back or alter the course of plant-community development and may even change the hydrophytic status of the com-munity. See Chapter 5 for discussions of specific problematic vegetation situations in the region.
Arid western landscapes provide habitat for a variety of plant species that have special adaptations for survival in areas with saline conditions and ephemeral water sources. Halophytes and phreatophytes, for example, are associated with many wetland settings in the Arid West. The morphologi-cal and physiological adaptations of halophytes allow these species to exist in highly saline soil and water conditions. The long roots of phreatophytes are adapted to reach deep subsurface water tables, allowing these species to survive in locations that receive only intermittent surface-water inputs. Although often found in wetlands, halophytes and phreatophytes can

ERDC/EL TR-08-28 14
sometimes be misleading indicators of wetland conditions when they dominate areas that are highly saline but lack wetland hydrology or hydric soils, or they occur in areas where groundwater is below the depth required for wetland delineation purposes.
Arid-land vegetation is highly responsive to precipitation patterns, and the Arid West is known for a high degree of spatial and temporal variability in rainfall amounts (Reid and Frostick 1997). Wetlands subject to seasonal hydrology in the region often show substantial changes in species presence and abundance through the year. In addition to seasonal and annual vari-ability, decadal-scale shifts in the frequency and amount of precipitation influence many wetland types in the region. Long-term drought conditions may stress woody shrubs and trees, but they typically survive and persist at drought-influenced wetland sites. Shifts in the presence and species composition of herbaceous vegetation, however, can be rapid and dra-matic. Examples of wetland types that are influenced by seasonal and longer term climatic fluctuations in the Arid West include, but are not limited to, vernal pools, grassy playas, seeps, springs, and riparian wet-lands associated with ephemeral, intermittent, and perennial streams and rivers. Problematic wetland situations in the Arid West are discussed fur-ther in Chapter 5.
Hydrophytic vegetation decisions are based primarily on the wetland indi-cator status (Reed 1988, or current approved list) of species that make up the plant community. Species in the facultative categories (FACW, FAC, and FACU) are recognized as occurring in both wetlands and non-wetlands to varying degrees. Although most wetlands are dominated by species rated OBL, FACW, and FAC, some wetland communities may be dominated by FACU species and cannot be identified by dominant species alone. In those cases, other indicators of hydrophytic vegetation must also be considered. This situation is not necessarily due to inaccurate wetland indicator ratings; rather, it is due to the broad tolerances of certain plant species that allow them to be widely distributed across the moisture gradi-ent. Therefore, for some species, it is difficult to assign a single indicator status rating that encompasses all of the various landscape and ecological settings it can occupy.
Hydrophytic vegetation indicators and procedures presented in this chap-ter are designed to identify the majority of wetland plant communities in the Arid West. However, some wetland communities may lack any of these
ERDC/EL TR-08-28 15
indicators, at least at certain times. These situations are considered in Chapter 5 (Difficult Wetland Situations in the Arid West).
Guidance on vegetation sampling and analysis
General guidance on sampling of vegetation for wetland-delineation pur-poses is given in the Corps Manual for both the Routine and Comprehen-sive methods. Those procedures are intended to be flexible and may need to be modified for application in a given region or on a particular site. Vegetation sampling done as part of a wetland delineation is designed to characterize the site in question rapidly without the need for detailed scientific study or statistical methods. A balance must be established between the need to accomplish the work quickly and the need to characterize the site’s heterogeneity accurately and at an appropriate scale. The following guidance on vegetation sampling is intended to supplement the Corps Manual for applications in the Arid West.
The first step is to stratify the site so that the major landscape or vegeta-tion units can be evaluated separately. This may be done in advance using an aerial photograph or topographic map, or by walking over the site. In general, routine wetland determinations are based on visual estimates of percent cover of plant species that can be made either (1) within the vege-tation unit as a whole, or (2) within one or more sampling plots estab-lished in representative locations within each unit. Percent cover estimates are more accurate and repeatable if taken within a defined plot. This also facilitates field verification of another delineator’s work. The sizes and shapes of sampling plots, if used, may be modified as appropriate to adapt to site conditions and should be recorded on the field data form if they deviate from those recommended in the Corps Manual. Near the wetland boundary, it may be necessary to adjust plot size or shape to avoid over-lapping the boundary and extending into an adjacent community having different vegetation, soils, or hydrologic conditions. For wetland delinea-tion purposes, an area is considered to be vegetated if it has 5 percent or more total plant cover at the peak of the growing season. See “Sparse and Patchy Vegetation” in Chapter 5 for guidance on dealing with unvegetated wet areas.
If it is not possible to locate one or a few plots in a way that adequately represents the vegetation unit being sampled, then percent cover estimates can be made by walking the unit and visually estimating the coverage of each species over a broader area. If additional quantification of cover
ERDC/EL TR-08-28 16
estimates is needed, then an optional procedure for point-intercept sampling along transects (see Appendix B) may be used to characterize the vegetation unit. To use either of these sampling methods, soil and hydrologic conditions must be uniform across the sampled area.
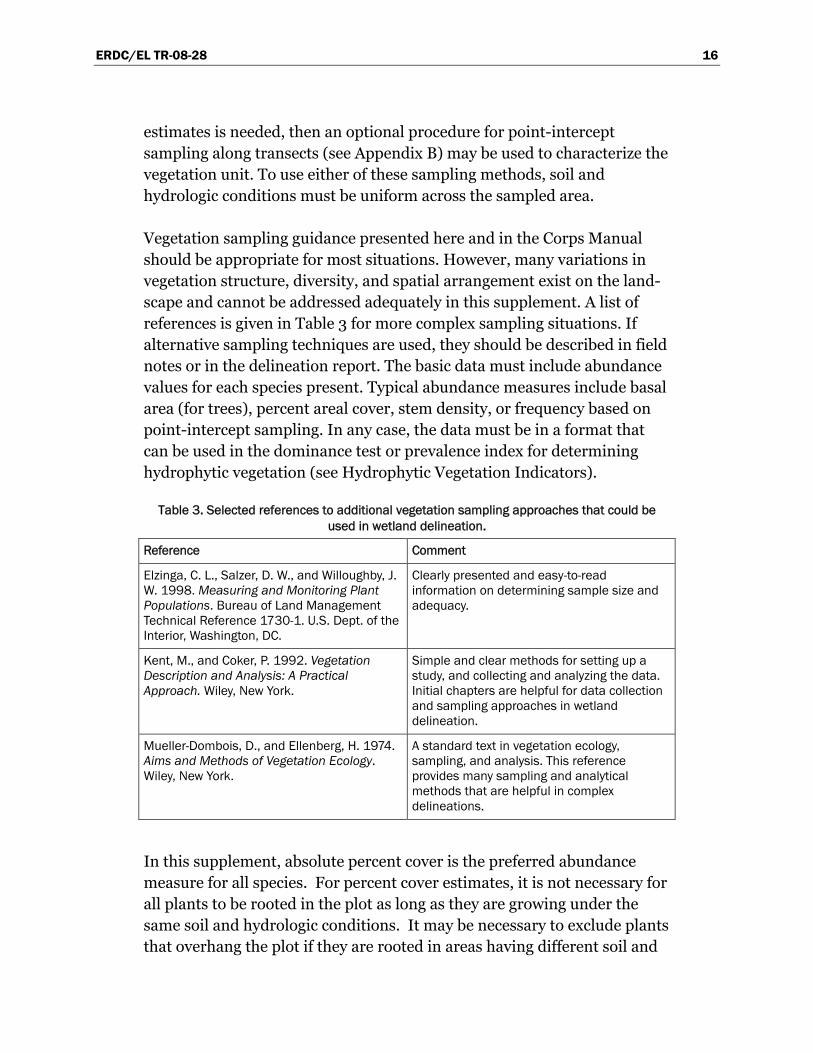
Vegetation sampling guidance presented here and in the Corps Manual should be appropriate for most situations. However, many variations in vegetation structure, diversity, and spatial arrangement exist on the land-scape and cannot be addressed adequately in this supplement. A list of references is given in Table 3 for more complex sampling situations. If alternative sampling techniques are used, they should be described in field notes or in the delineation report. The basic data must include abundance values for each species present. Typical abundance measures include basal area (for trees), percent areal cover, stem density, or frequency based on point-intercept sampling. In any case, the data must be in a format that can be used in the dominance test or prevalence index for determining hydrophytic vegetation (see Hydrophytic Vegetation Indicators).
Table 3. Selected references to additional vegetation sampling approaches that could be used in wetland delineation.
Reference Comment
Elzinga, C. L., Salzer, D. W., and Willoughby, J. W. 1998. Measuring and Monitoring Plant Populations. Bureau of Land Management Technical Reference 1730-1. U.S. Dept. of the Interior, Washington, DC.
Clearly presented and easy-to-read information on determining sample size and adequacy.
Kent, M., and Coker, P. 1992. Vegetation Description and Analysis: A Practical Approach. Wiley, New York.
Simple and clear methods for setting up a study, and collecting and analyzing the data. Initial chapters are helpful for data collection and sampling approaches in wetland delineation.
Mueller-Dombois, D., and Ellenberg, H. 1974. Aims and Methods of Vegetation Ecology. Wiley, New York.
A standard text in vegetation ecology, sampling, and analysis. This reference provides many sampling and analytical methods that are helpful in complex delineations.
In this supplement, absolute percent cover is the preferred abundance measure for all species. For percent cover estimates, it is not necessary for all plants to be rooted in the plot as long as they are growing under the same soil and hydrologic conditions. It may be necessary to exclude plants that overhang the plot if they are rooted in areas having different soil and
ERDC/EL TR-08-28 17
hydrologic conditions, particularly when sampling near the wetland boundary.
Definitions of strata
Vegetation strata within a plot are sampled separately when evaluating indicators of hydrophytic vegetation. The structure of vegetation varies greatly in wetland communities across the region. Throughout much of the Arid West, short-statured woody plants (i.e., less than 3.2 ft (1 m) high or “sub-shrubs”) are a common growth form. The Corps Manual combines short woody plants and herbaceous plants into a single “herb” stratum for sampling purposes. However, in the Arid West, more information about the plant community is gained when short shrubs and herbaceous plants are sampled separately. Therefore, the following vegetation strata are rec-ommended for use across the Arid West. This system places short woody shrubs in the sapling/shrub stratum and limits the herb stratum to only herbaceous plant species. Unless otherwise noted, a stratum for sampling purposes is defined as having 5 percent or more total plant cover. If either the tree or woody vine strata have less than 5 percent cover during the peak of the growing season, then any trees or vines present may be com-bined with the sapling/shrub stratum.
1. Tree stratum – Consists of woody plants 3 in. (7.6 cm) or more in diameter at breast height (DBH), regardless of height.
2. Sapling/shrub stratum – Consists of woody plants less than 3 in. DBH, regardless of height.
3. Herb stratum – Consists of all herbaceous (non-woody) plants, including herbaceous vines, regardless of size.
4. Woody vines – Consists of all woody vines, regardless of height.
Seasonal considerations and cautions
To the extent possible, the hydrophytic vegetation decision should be based on the plant community that is normally present during the wet portion of the growing season in a normal rainfall year. However, wetland determinations must often be performed at other times of year, or in years with unusual or atypical weather conditions. The Arid West has a highly seasonal climate, with hot dry summers, cool wet springs, and winters that can be cold and snowy in interior and northern areas. Vegetation sampling for a wetland determination can be challenging when some plants die back in response to seasonal or long-term drought, freezing temperatures, or
ERDC/EL TR-08-28 18
other factors. At these times, experience and professional judgment may be required to adapt the vegetation sampling scheme or use other sources of information to determine the plant community that is normally present.
For example, winter sampling in some areas may be hampered by snow and ice that cover the ground and make it impractical to identify plant species and estimate plant cover. When an on-site evaluation of the vegetation is impractical due to excessive snow and ice, one option is to use existing off-site data sources, such as National Wetlands Inventory (NWI) maps, soil surveys, and aerial photographs, to make a preliminary hydrophytic-vegetation determination. These sources may be supplemented with limited on-site data, including those plant species that can be identified. Later, when conditions are favorable, an on-site investigation must be made to verify the preliminary determination and complete the wetland delineation.
Other factors can alter the plant community on a site and affect a hydrophytic vegetation determination, including seasonal changes in species composition, intense grazing, wildfires and other natural disturbances, and human land-use practices. These factors are considered in Chapter 5.
Hydrophytic vegetation indicators
The following indicators should be applied in the sequence presented. The stepwise procedure is designed to reduce field effort by requiring that only one indicator, the dominance test, be evaluated in the majority of wetland determinations. Hydrophytic vegetation is present if any of the indicators is satisfied. All of these indicators are applicable throughout the entire Arid West Region.
Indicators of hydrophytic vegetation involve looking up the wetland indicator status of plant species on the wetland plant list (Reed 1988 or current list). For the purposes of this supplement, only the five basic levels of wetland indicator status (i.e., OBL, FACW, FAC, FACU, and UPL) (Reed 1988) are used in hydrophytic vegetation indicators. Plus (+) and minus (–) modifiers are not used (e.g., FAC–, FAC, and FAC+ plants are all con-sidered to be FAC). For species listed as NI (reviewed but given no regional indicator) or NO (no known occurrence in the region at the time the list was compiled), apply the indicator status assigned to the species in the nearest adjacent region. If the species is listed as NI or NO but no
ERDC/EL TR-08-28 19
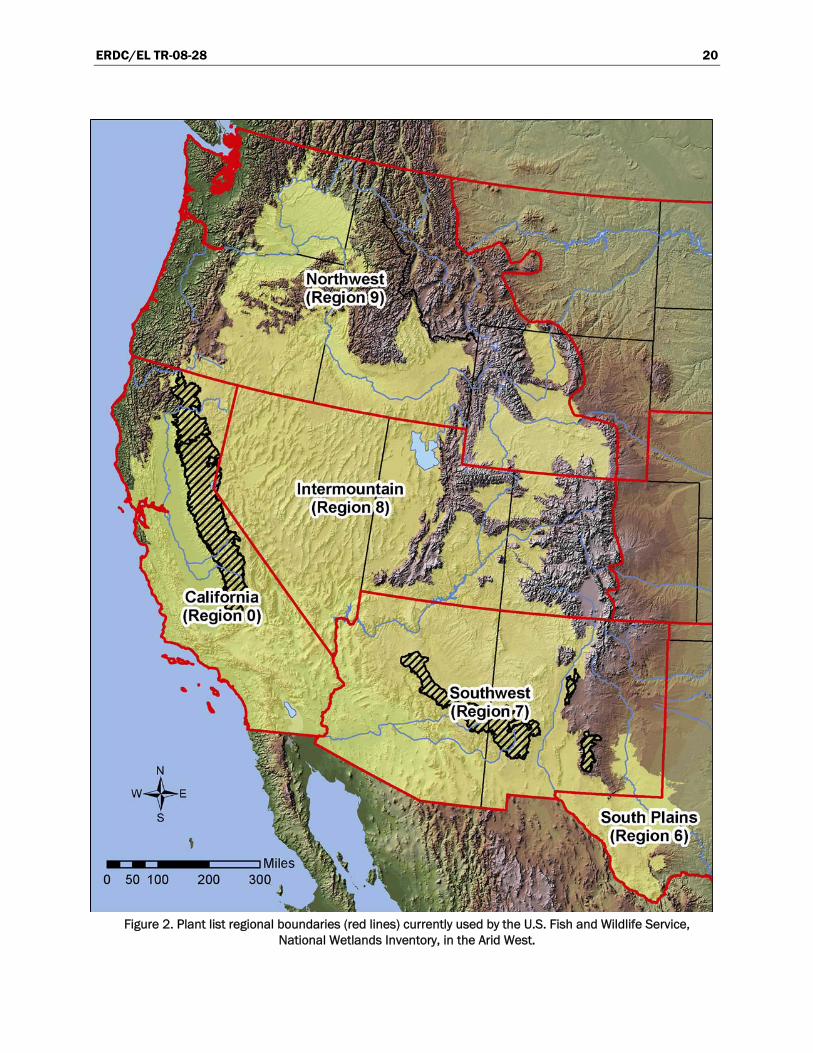
adjacent regional indicator is assigned, do not use the species to calculate hydrophytic vegetation indicators. In general, species that are not listed on the wetland plant list are assumed to be upland (UPL) species. However, recent changes in plant nomenclature have resulted in a number of species that are not listed by Reed (1988) but are not necessarily UPL plants. Procedures described in Chapter 5, section on Problematic Hydrophytic Vegetation, can be used if it is believed that individual FACU, NI, NO, or unlisted plant species are functioning as hydrophytes on a particular site. For Clean Water Act purposes, wetland delineators should use the latest plant lists approved by Headquarters, U.S. Army Corps of Engineers (Figure 2) (http://www.usace.army.mil/inet/functions/cw/cecwo/reg/reg_supp.htm).
The dominance test (Indicator 1) is the basic hydrophytic vegetation indi-cator and should be applied in every wetland determination. Most wet-lands in the Arid West have plant communities that will pass the domi-nance test, and this is the only indicator that needs to be used in most situations. However, some wetland plant communities may fail a test based only on dominant species. Therefore, in those cases where indi-cators of hydric soil and wetland hydrology are present, the vegetation should be re-evaluated with the prevalence index (Indicator 2), which takes into consideration all plant species in the community, not just a few dominants. In addition, plant morphological adaptations (Indicator 3) can be used to distinguish certain wetland plant communities in the Arid West, when indicators of hydric soil and wetland hydrology are present. Finally, certain problematic wetland situations may lack any of these indicators and are described in Chapter 5.
ERDC/EL TR-08-28 20
Figure 2. Plant list regional boundaries (red lines) currently used by the U.S. Fish and Wildlife Service,
National Wetlands Inventory, in the Arid West.
ERDC/EL TR-08-28 21
Procedure
The procedure for using hydrophytic vegetation indicators is as follows:
1. Apply Indicator 1 (Dominance Test). a. If the plant community passes the dominance test, then the vegetation
is hydrophytic and no further vegetation analysis is required. b. If the plant community fails the dominance test, and indicators of
hydric soil and/or wetland hydrology are absent, then hydrophytic vegetation is absent unless the site meets requirements for a prob-lematic wetland situation (see Chapter 5).
c. If the plant community fails the dominance test, but indicators of hydric soil and wetland hydrology are both present, proceed to step 2.
2. Apply Indicator 2 (Prevalence Index). This and the following step assume that at least one indicator of hydric soil and one primary or two secondary indicators of wetland hydrology are present. a. If the plant community satisfies the prevalence index, then the vegeta-
tion is hydrophytic. No further vegetation analysis is required. b. If the plant community fails the prevalence index, proceed to step 3.
3. Apply Indicator 3 (Morphological Adaptations). a. If the indicator is satisfied, then the vegetation is hydrophytic. b. If none of the indicators is satisfied, then hydrophytic vegetation is
absent unless indicators of hydric soil and wetland hydrology are present and the site meets the requirements for a problematic wetland situation (Chapter 5).
Indicator 1: Dominance test
Description: More than 50 percent of the dominant plant species across all strata are rated OBL, FACW, or FAC.
User Notes: Use the “50/20 rule” described below to select dominant species from each stratum of the community. Combine dominant species across strata and apply the dominance test to the combined list. Once a species is selected as a dominant, its cover value is not used in the domi-nance test; each dominant species is treated equally. Thus, a plant com-munity with seven dominant species across all strata would need at least four dominant species that are OBL, FACW, or FAC to be considered hydrophytic by this indicator. Species that are dominant in two or more strata should be counted two or more times in the dominance test.
ERDC/EL TR-08-28 22
Procedure for Selecting Dominant Species by the 50/20 Rule: Dominant plant species are the most abundant species in the community; they contribute more to the character of the community than do the other non-dominant species present. The 50/20 rule is a repeatable and objec-tive procedure for selecting dominant plant species and is recommended when data are available for all species in the community.
Dominant species are chosen independently from each stratum of the community. In general, dominants are the most abundant species that individually or collectively account for more than 50 percent of the total coverage of vegetation in the stratum, plus any other species that, by itself, accounts for at least 20 percent of the total. For the purposes of this regional supplement, absolute percent cover is the recommended abun-dance measure for plants in all vegetation strata. See Table 4 for an exam-ple application of the 50/20 rule in evaluating a plant community. Steps in selecting dominant species by the 50/20 rule are as follows:
1. Estimate the absolute percent cover of each species in the first stratum. Since the same data may be used later to calculate the prevalence index, the data should be recorded as absolute cover and not converted to relative cover.
2. Rank all species in the stratum from most to least abundant. 3. Calculate the total coverage of all species in the stratum (i.e., sum their
individual percent cover values). Absolute cover estimates do not neces-sarily sum to 100 percent.
4. Select plant species from the ranked list, in decreasing order of coverage, until the cumulative coverage of selected species exceeds 50 percent of the total coverage for the stratum. If two or more species are equal in coverage (i.e., they are tied in rank), they should all be selected. The selected plant species are all considered to be dominants. All dominants must be identi-fied to species.
5. In addition, select any other species that, by itself, is at least 20 percent of the total percent cover in the stratum. Any such species is also considered to be a dominant and must be accurately identified.
6. Repeat steps 1-5 for any other stratum present. Combine the lists of domi-nant species across all strata. Note that a species may be dominant in more than one stratum (e.g., a woody species may be dominant in both the tree and sapling/shrub strata).
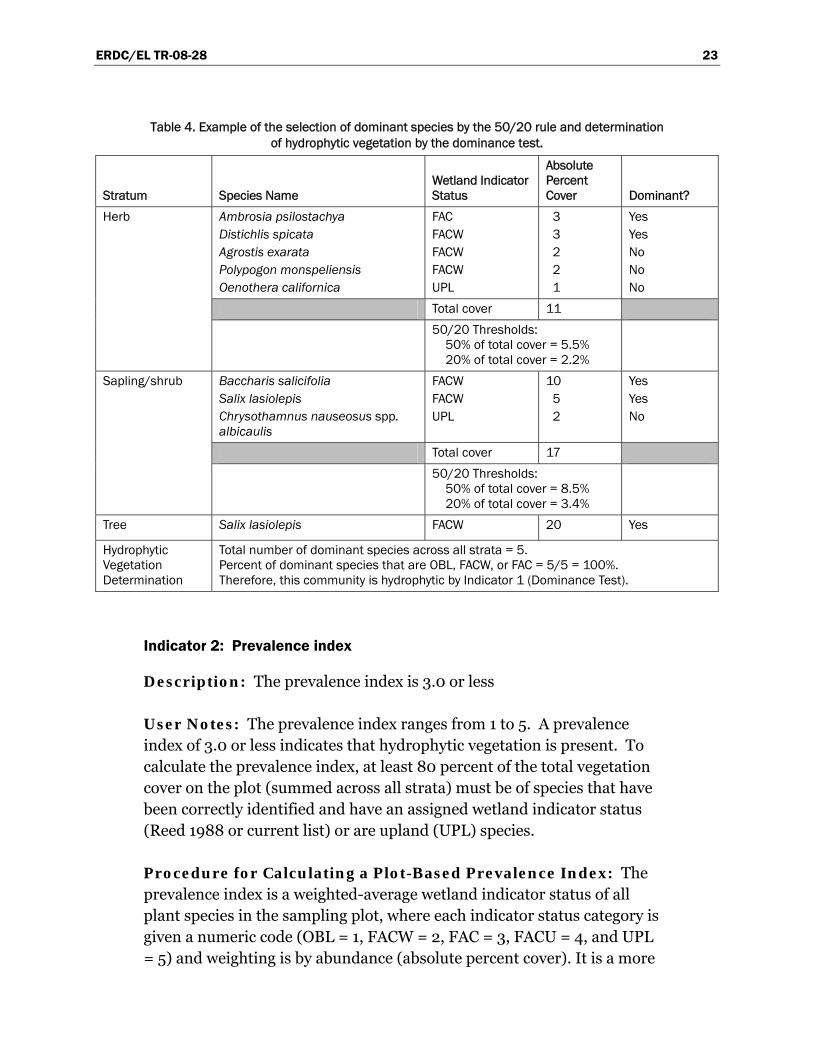
ERDC/EL TR-08-28 23
Table 4. Example of the selection of dominant species by the 50/20 rule and determination of hydrophytic vegetation by the dominance test.
Stratum Species Name Wetland Indicator Status
Absolute Percent Cover Dominant?
Ambrosia psilostachya Distichlis spicata Agrostis exarata Polypogon monspeliensis Oenothera californica
FAC FACW FACW FACW UPL
3 3 2 2 1
Yes Yes No No No
Total cover 11
Herb
50/20 Thresholds: 50% of total cover = 5.5% 20% of total cover = 2.2%
Baccharis salicifolia Salix lasiolepis Chrysothamnus nauseosus spp. albicaulis
FACW FACW UPL
10 5 2
Yes Yes No
Total cover 17
Sapling/shrub
50/20 Thresholds: 50% of total cover = 8.5% 20% of total cover = 3.4%
Tree Salix lasiolepis FACW 20 Yes
Hydrophytic Vegetation Determination
Total number of dominant species across all strata = 5. Percent of dominant species that are OBL, FACW, or FAC = 5/5 = 100%. Therefore, this community is hydrophytic by Indicator 1 (Dominance Test).
Indicator 2: Prevalence index
Description: The prevalence index is 3.0 or less
User Notes: The prevalence index ranges from 1 to 5. A prevalence index of 3.0 or less indicates that hydrophytic vegetation is present. To calculate the prevalence index, at least 80 percent of the total vegetation cover on the plot (summed across all strata) must be of species that have been correctly identified and have an assigned wetland indicator status (Reed 1988 or current list) or are upland (UPL) species.
Procedure for Calculating a Plot-Based Prevalence Index: The prevalence index is a weighted-average wetland indicator status of all plant species in the sampling plot, where each indicator status category is given a numeric code (OBL = 1, FACW = 2, FAC = 3, FACU = 4, and UPL = 5) and weighting is by abundance (absolute percent cover). It is a more
ERDC/EL TR-08-28 24
comprehensive analysis of the hydrophytic status of the community than one based on just a few dominant species. It is particularly useful (1) in communities with only one or two dominants, (2) in highly diverse com-munities where many species may be present at roughly equal coverage, and (3) when strata differ greatly in total plant cover (e.g., total herb cover is 80 percent but sapling/shrub cover is only 10 percent). The prevalence index is used in this supplement to determine whether hydrophytic vege-tation is present on sites where indicators of hydric soil and wetland hydrology are present but the vegetation initially fails the dominance test.
The following procedure is used to calculate a plot-based prevalence index. The method was described by Wentworth et al. (1988) and modified by Wakeley and Lichvar (1997). It uses the same field data (i.e., percent cover estimates for each plant species) that were used to select dominant species by the 50/20 rule, with the added constraint that at least 80 percent of the total vegetation cover on the plot must be of species that have been cor-rectly identified and have an assigned indicator status (including UPL for those species not on the wetland plant list). For any species that occurs in more than one stratum, cover estimates are summed across strata. Steps for determining the prevalence index are as follows:
1. Identify and estimate the absolute percent cover of each species in each stratum of the community. Sum the cover estimates for any species that is present in more than one stratum.
2. Organize all species (across all strata) into groups according to their wetland indicator status (i.e., OBL, FACW, FAC, FACU, or UPL) and sum their cover values within groups. Do not include species that were not identified.
3. Calculate the prevalence index using the following formula:
2 3 4 5OBL FACW FAC FACU UPL
OBL FACW FAC FACU UPL
A A A A APIA A A A A+ + + +
=+ + + +
where:
PI = Prevalence index AOBL = Summed percent cover values of obligate (OBL) plant species AFACW = Summed percent cover values of facultative wetland (FACW)
plant species

ERDC/EL TR-08-28 25
AFAC = Summed percent cover values of facultative (FAC) plant species
AFACU = Summed percent cover values of facultative upland (FACU) plant species
AUPL = Summed percent cover values of upland (UPL) plant species
See Table 5 for an example calculation of the prevalence index using the same data set as in Table 4. The following web link provides free public-domain software for simultaneous calculation of the 50/20 rule, dominance test, and prevalence index: http://www.crrel.usace.army.mil/rsgisc/wetshed/wetdatashed.htm.
Table 5. Example of the Prevalence Index using the same data as in Table 4.
Indicator Status Group Species Name
Absolute Percent Cover by Species
Total Cover by Group
Multiply by:1 Product
OBL species None 0 0 1 0 FACW species Distichlis spicata
Agrostis exarata Baccharis salicifolia Salix lasiolepis2 Polypogon monspeliensis
3 2 10 25 2
42
2
84
FAC species Ambrosia psilostachya 3 3 3 9 FACU species None 0 0 4 0 UPL species Oenothera californica
Chrysothamnus nauseosus ssp. albicaulis
1 2
3
5
15
Sum 48 (A) 108 (B) Hydrophytic Vegetation Determination
Prevalence Index = B/A = 108/48 = 2.25; therefore, this community is hydrophytic by Indicator 2 (Prevalence Index).
1 Where OBL = 1, FACW = 2, FAC = 3, FACU = 4, and UPL = 5. 2 Salix lasiolepis was recorded in two strata (see Table 4) so the cover estimates for this species were summed across strata.
Indicator 3: Morphological adaptations
Description: The plant community passes either the dominance test (Indicator 1) or the prevalence index (Indicator 2) after reconsideration of the indicator status of certain plant species that exhibit morphological adaptations for life in wetlands.
ERDC/EL TR-08-28 26
User Notes: Some hydrophytes in the Arid West develop easily recog-nized physical characteristics, or morphological adaptations, when they occur in wetland areas. Some of these adaptations may help them to sur-vive prolonged inundation or saturation in the root zone; others may simply be a consequence of living under such wet conditions. Common morphological adaptations in the Arid West include, but are not neces-sarily limited to, adventitious roots and shallow root systems developed on or near the soil surface. These adaptations may also develop on FACU species when they occur in wetlands, indicating that those individuals are functioning as hydrophytes in that setting.
To apply this indicator, these morphological features must be observed on more than 50 percent of the individuals of a FACU species living in an area where indicators of hydric soil and wetland hydrology are present. Follow this procedure:
1. Confirm that the morphological feature is present mainly in the potential wetland area and is not also common on the same species in the surround-ing non-wetlands.
2. For each FACU species that exhibits morphological adaptations, estimate the percentage of individuals that have the features. Record this percent-age on the data form.
3. If more than 50 percent of the individuals of a FACU species have mor-phological adaptations for life in wetlands, that species is considered to be a hydrophyte and its indicator status on that plot should be reassigned as FAC. All other species retain their published indicator statuses. Record any supporting information on the data sheet, including a description of the morphological adaptation(s) present and any other observations of the growth habit of the species in adjacent wetland and non-wetland locations (photo documentation is recommended).
4. Recalculate the dominance test (Indicator 1) and/or the prevalence index (Indicator 2) using a FAC indicator status for this species. The vegetation is hydrophytic if either test is satisfied.
ERDC/EL TR-08-28 27
3 Hydric Soil Indicators Introduction
The National Technical Committee for Hydric Soils (NTCHS) defines a hydric soil as a soil that formed under conditions of saturation, flooding, or ponding long enough during the growing season to develop anaerobic conditions in the upper part (USDA Soil Conservation Service 1994). Most hydric soils exhibit characteristic morphologies that result from repeated periods of saturation or inundation for more than a few days. Saturation or inundation, when combined with microbial activity in the soil, causes the depletion of oxygen. This anaerobiosis promotes certain biogeochemical processes, such as the accumulation of organic matter and the reduction, translocation, or accumulation of iron and other reducible elements. These processes result in distinctive characteristics that persist in the soil during both wet and dry periods, making them particularly useful for identifying hydric soils in the field (USDA Natural Resources Conservation Service 2006b).
This chapter presents indicators that are designed to help identify hydric soils in the Arid West Region. Indicators are not intended to replace or relieve the requirements contained in the definition of a hydric soil. Therefore, a soil that meets the definition of a hydric soil is hydric whether or not it exhibits indicators. Guidance for identifying hydric soils that lack indicators can be found later in this chapter (see the sections on documenting the site and its soils) and in Chapter 5 (Difficult Wetland Situations in the Arid West).
This list of indicators is dynamic; changes and additions to the list are anticipated with new research and field testing. The indicators presented in this supplement are a subset of the NTCHS Field Indicators of Hydric Soils in the United States (USDA Natural Resources Conservation Service 2006b or current version) that are commonly found in the Arid West. Any change to the NTCHS Field Indicators of Hydric Soils in the United States represents a change to this subset of indicators for the Arid West. Check the NRCS hydric soils web site (http://soils.usda.gov/use/hydric/) for updates to these indicators. To use the indicators properly, a basic knowledge of soil/landscape relationships is necessary.
ERDC/EL TR-08-28 28
Most of the hydric soil indicators presented in this supplement are appli-cable throughout the Arid West Region; however, some are specific to cer-tain subregions. As used in this supplement, subregions are equivalent to the Land Resource Regions (LRR) or Major Land Resource Areas (MLRA) recognized by the USDA Natural Resources Conservation Service (2006a) (see Chapter 1, Figure 1). It is important to understand that boundaries between subregions are actually broad transition zones. Although an indi-cator may be noted as most relevant in a specific subregion, it may also be applicable in the transition to an adjacent subregion.
Concepts
Hydric soil indicators are formed predominantly by the accumulation or loss of iron, manganese, sulfur, or carbon compounds in a saturated and anaerobic environment. These processes and the features that develop are described in the following paragraphs.
Iron and manganese reduction, translocation, and accumulation
Saturated or inundated soils. In an anaerobic environment, soil microbes reduce iron from the ferric (Fe3+) to the ferrous (Fe2+) form, and manganese from the manganic (Mn4+) to the manganous (Mn2+) form. Of the two, evidence of iron reduction is more commonly observed in soils. Areas in the soil where iron is reduced often develop characteristic bluish-gray or greenish-gray colors known as gley. Ferric iron is insoluble but ferrous iron easily enters the soil solution and may be moved or translocated to other areas of the soil. Areas that have lost iron typically develop characteristic gray or reddish-gray colors and are known as redox depletions. If a soil reverts to an aerobic state, iron that is in solution will oxidize and become concentrated in patches and along root channels and other pores. These areas of oxidized iron are called redox concentrations. Since water movement in these saturated or inundated soils can be multi-directional, redox depletions and concentrations can occur anywhere in the soil and have irregular shapes and sizes. Soils that are saturated and contain ferrous iron at the time of sampling may change color upon exposure to the air, as ferrous iron is rapidly converted to ferric iron in the presence of oxygen. Such soils are said to have a reduced matrix (Vepraskas 1992).
While indicators related to iron or manganese depletion or concentration are the most common in hydric soils, they cannot form in soils whose
ERDC/EL TR-08-28 29
parent materials are low in Fe or Mn. Soils formed in such materials may have low-chroma colors that are not related to saturation and reduction. For such soils, features formed through accumulation of organic carbon may be present.
Sulfate reduction
Sulfur is one of the last elements to be reduced by microbes in an anae-robic environment. The microbes convert SO42− to H2S, or hydrogen sulfide. This results in a very pronounced “rotten egg” odor in some soils that are inundated or saturated for very long periods. In non-saturated or non-inundated soils, sulfate is not reduced and there is no rotten egg odor. The presence of hydrogen sulfide is a strong indicator of a hydric soil, but this indicator is found only in the wettest sites in soils that contain sulfur-bearing compounds.
Organic matter accumulation
Since the efficiency of soil microbes is considerably lower in a saturated and anaerobic environment, less organic matter and organic carbon is consumed. Therefore, in saturated or inundated soils, partially decomposed organic matter and carbon may begin to accumulate. The result in wetlands is often the development of thick organic surfaces on the soil or dark organic-rich surface mineral layers.
Determining the texture of soil materials high in organic carbon. Material high in organic carbon could fall into three categories: organic, mucky mineral, or mineral. In lieu of laboratory data, the following estimation method can be used for soil material that is wet or nearly saturated with water. This method may be inconclusive with loamy or clayey textured mineral soils. Gently rub the wet soil material between forefinger and thumb. If upon the first or second rub the material feels gritty, it is mineral soil material. If after the second rub the material feels greasy, it is either mucky mineral or organic soil material. Gently rub the material two or three more times. If after these additional rubs it feels gritty or plastic, it is mucky mineral soil material; if it still feels greasy, it is organic soil material. If the material is organic soil material a further division should be made, as follows.
Organic soil materials are classified as sapric, hemic, or fibric. Differenti-ating criteria are based on the percentage of visible fibers observable with
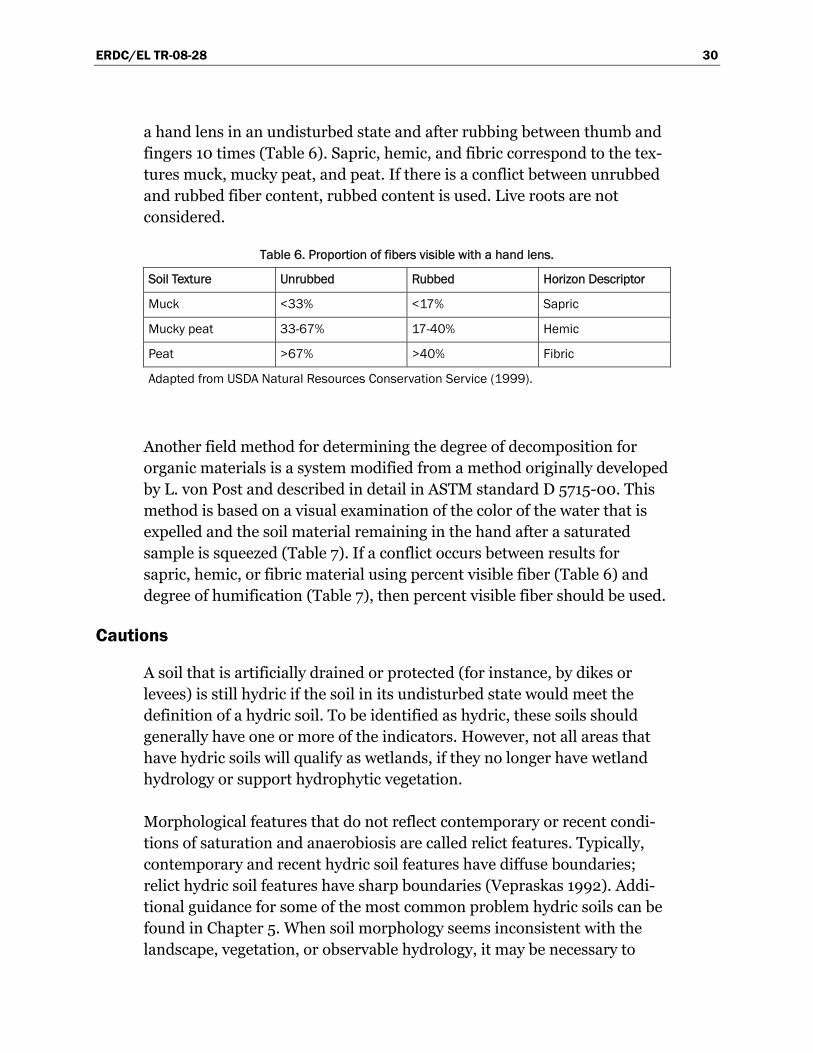
ERDC/EL TR-08-28 30
a hand lens in an undisturbed state and after rubbing between thumb and fingers 10 times (Table 6). Sapric, hemic, and fibric correspond to the tex-tures muck, mucky peat, and peat. If there is a conflict between unrubbed and rubbed fiber content, rubbed content is used. Live roots are not considered.
Table 6. Proportion of fibers visible with a hand lens.
Soil Texture Unrubbed Rubbed Horizon Descriptor
Muck <33% <17% Sapric
Mucky peat 33-67% 17-40% Hemic
Peat >67% >40% Fibric
Adapted from USDA Natural Resources Conservation Service (1999).
Another field method for determining the degree of decomposition for organic materials is a system modified from a method originally developed by L. von Post and described in detail in ASTM standard D 5715-00. This method is based on a visual examination of the color of the water that is expelled and the soil material remaining in the hand after a saturated sample is squeezed (Table 7). If a conflict occurs between results for sapric, hemic, or fibric material using percent visible fiber (Table 6) and degree of humification (Table 7), then percent visible fiber should be used.
Cautions
A soil that is artificially drained or protected (for instance, by dikes or levees) is still hydric if the soil in its undisturbed state would meet the definition of a hydric soil. To be identified as hydric, these soils should generally have one or more of the indicators. However, not all areas that have hydric soils will qualify as wetlands, if they no longer have wetland hydrology or support hydrophytic vegetation.
Morphological features that do not reflect contemporary or recent condi-tions of saturation and anaerobiosis are called relict features. Typically, contemporary and recent hydric soil features have diffuse boundaries; relict hydric soil features have sharp boundaries (Vepraskas 1992). Addi-tional guidance for some of the most common problem hydric soils can be found in Chapter 5. When soil morphology seems inconsistent with the landscape, vegetation, or observable hydrology, it may be necessary to
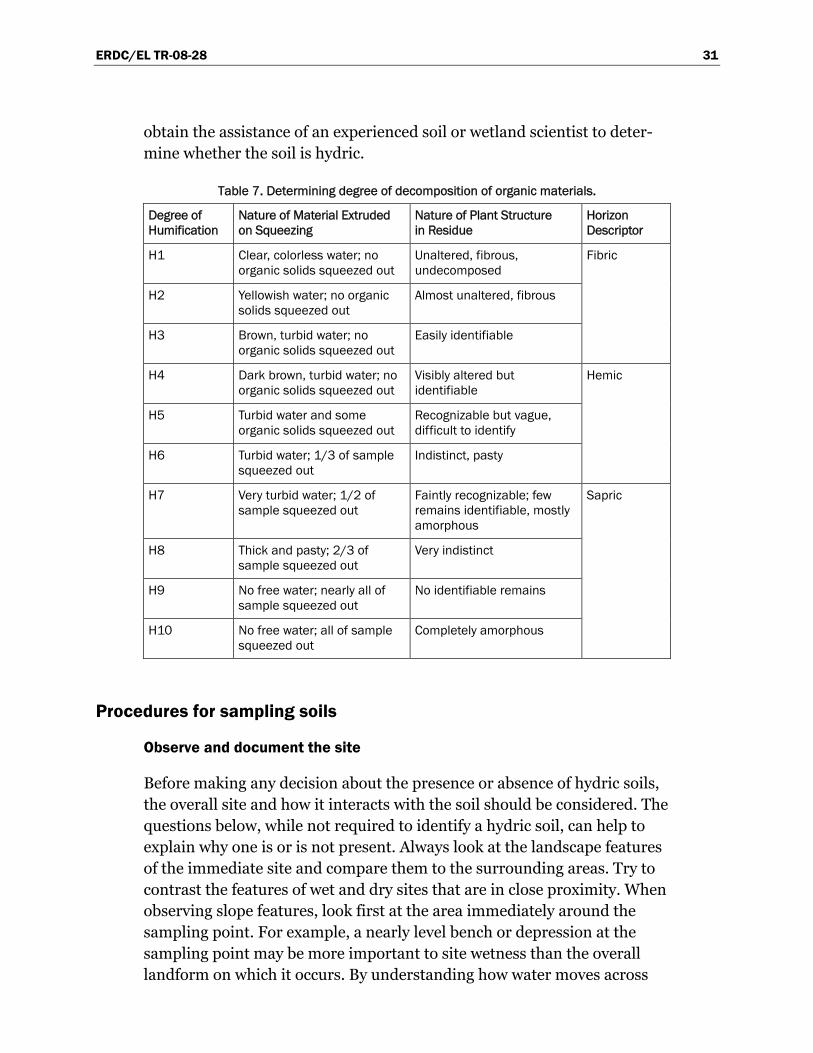
ERDC/EL TR-08-28 31
obtain the assistance of an experienced soil or wetland scientist to deter-mine whether the soil is hydric.
Table 7. Determining degree of decomposition of organic materials.
Degree of Humification
Nature of Material Extruded on Squeezing
Nature of Plant Structure in Residue
Horizon Descriptor
H1 Clear, colorless water; no organic solids squeezed out
Unaltered, fibrous, undecomposed
H2 Yellowish water; no organic solids squeezed out
Almost unaltered, fibrous
H3 Brown, turbid water; no organic solids squeezed out
Easily identifiable
Fibric
H4 Dark brown, turbid water; no organic solids squeezed out
Visibly altered but identifiable
H5 Turbid water and some organic solids squeezed out
Recognizable but vague, difficult to identify
H6 Turbid water; 1/3 of sample squeezed out
Indistinct, pasty
Hemic
H7 Very turbid water; 1/2 of sample squeezed out
Faintly recognizable; few remains identifiable, mostly amorphous
H8 Thick and pasty; 2/3 of sample squeezed out
Very indistinct
H9 No free water; nearly all of sample squeezed out
No identifiable remains
H10 No free water; all of sample squeezed out
Completely amorphous
Sapric
Procedures for sampling soils
Observe and document the site
Before making any decision about the presence or absence of hydric soils, the overall site and how it interacts with the soil should be considered. The questions below, while not required to identify a hydric soil, can help to explain why one is or is not present. Always look at the landscape features of the immediate site and compare them to the surrounding areas. Try to contrast the features of wet and dry sites that are in close proximity. When observing slope features, look first at the area immediately around the sampling point. For example, a nearly level bench or depression at the sampling point may be more important to site wetness than the overall landform on which it occurs. By understanding how water moves across
ERDC/EL TR-08-28 32
the site, the reasons for the presence or absence of hydric soil indicators should be clear.
If one or more of the hydric soil indicators given later in this chapter is present, then the soil is hydric. If no hydric soil indicators are present, the additional site information below may be useful in documenting whether the soil is indeed non-hydric or if it might represent a “problem” hydric soil.
• Hydrology–Is standing water observed on the site or is water observed in the soil pit? What is the depth of the water table in the area? Is there indirect evidence of ponding or flooding?
• Slope–Is the site level or nearly level so that surface water does not run off readily, or is it steeper where surface water would run off from the soil?
• Slope shape–Is the surface concave, where water would tend to collect and possibly pond on the soil surface? On hillsides, are there convergent slopes, where surface or groundwater may be directed toward a central stream or swale? Or is the surface or slope shape convex, causing water to run off or disperse?
• Landform–Is the soil on a low terrace or floodplain that may be subject to seasonal high water tables or flooding? Is it at the toe of a slope where runoff may tend to collect or groundwater emerge at or near the surface? Has the microtopography been altered by cultivation?
• Soil materials–Is there a restrictive layer in the soil that would slow or prevent the infiltration of water? This could include consolidated bed-rock, cemented layers such as duripans and petrocalcic horizons, layers of silt or substantial clay content, or strongly contrasting soil textures (e.g., silt over sand). Or is there relatively loose soil material (sand, gravel, or rocks) or fractured bedrock that would allow the water to flow laterally down slope?
• Vegetation–Does the vegetation at the site indicate wetter conditions than at other nearby sites, or is it similar to what is found at nearby upland sites?
Observe and document the soil
To observe and document a hydric soil, first remove any loose leaves, needles, or bark from the soil surface. Do not remove the organic surface layers of the soil, which usually consist of plant remains in varying stages of decomposition. Dig a hole and describe the soil profile. In general, the
ERDC/EL TR-08-28 33
hole should be dug to the depth needed to document an indicator or to confirm the absence of indicators. For most soils, the recommended excavation depth is approximately 20 in. (50 cm) from the soil surface, although a shallower soil pit may suffice for some indicators (e.g., A2 – Histic Epipedon). Digging may be difficult in some areas due to rocks and hardpans. Use the completed profile description to determine which hydric soil indicators have been met (USDA Natural Resources Conservation Service 2006b).
For soils with deep, dark surface layers, deeper examination may be required when field indicators are not easily seen within 20 in. (50 cm) of the surface. The accumulation of organic matter in these soils may mask redoximorphic features in the surface layers. Examination to 40 in. (1 m) or more may be needed to determine whether they meet the requirements of indicator A12 – Thick Dark Surface. A soil auger or probe may be useful for sampling soil materials below 20 in.
Whenever possible, excavate the soil deep enough to determine if there are layers or materials present that might restrict soil drainage. This will help to understand why the soil may or may not be hydric. Consider taking pho-tographs of both the soil and the overall site, including a clearly marked measurement scale in soil pictures.
Depths used in the indicators are measured from the muck surface, or from the mineral soil surface if a muck surface is absent. For indicators A1 (Histosols), A2 (Histic Epipedon), and A3 (Black Histic), depths are mea-sured from the top of the organic material (peat, mucky peat, or muck).
All colors noted in this supplement refer to moist Munsell® colors (Gretag/Macbeth 2000). Dry soils should be moistened until the color no longer changes and wet soils should be allowed to dry until they no longer glisten. Care should be taken to avoid over-moistening dry soil. Soil colors specified in the indicators do not have decimal points; however, intermediate colors do occur between Munsell chips. Soil chroma should not be rounded to qualify as meeting an indicator. For example, a soil matrix with a chroma between 2 and 3 should be listed as having a chroma of 2+. This soil material does not have a chroma of 2 and would not meet any indicator that requires a chroma of 2 or less. Always examine soil matrix colors in the field immediately after sampling. Ferrous iron, if
ERDC/EL TR-08-28 34
present, can oxidize rapidly and create colors of higher chroma or redder hue.
Soils that are saturated at the time of sampling may contain reduced iron and/or manganese that are not detectable by eye. Under saturated conditions, redox concentrations may be absent or difficult to see, particularly in dark-colored soils. It may be necessary to let the soil dry to a moist state (5 to 30 minutes or more) for the iron or manganese to oxidize and redox features to become visible.
Particular attention should be paid to changes in microtopography over short distances. Small changes in elevation may result in repetitive sequences of hydric/non-hydric soils, making the delineation of individual areas of hydric and non-hydric soils difficult. Often the dominant condi-tion (hydric or non-hydric) is the only reliable interpretation. The shape of the local landform can greatly affect the movement of water through the landscape. Significant changes in parent material or lithologic discontinu-ities in the soil can affect the hydrologic properties of the soil. After a suf-ficient number of exploratory excavations have been made to understand the soil-hydrologic relationships at the site, subsequent excavations can be limited to the depth needed to identify hydric soil indicators.
Use of existing soil data
Soil surveys
Soil surveys are available for many areas of the Arid West and can provide useful information regarding soil properties and soil moisture conditions for an area. Soil surveys in the Arid West, however, vary considerably in the mapping scale and the amount of ground-truthing used to document the survey. A list of available soil surveys is located at http://soils.usda.gov/ survey/online_surveys/ and soil maps and data are available online at http://websoilsurvey.nrcs.usda.gov/. Most detailed soil surveys in the region are mapped at a scale of 1:24,000 (2.64 in./mile). At this scale, the smallest soil areas delineated, called map units, are about 5 acres (2 ha) in size. Map units usually contain more than one soil type or component. They often contain several minor components or inclusions of soils with prop-erties that may be similar to or quite different from the major component. Those soils that are hydric are noted in the Hydric Soils List published separately from the soil survey report. Soil survey information can be
ERDC/EL TR-08-28 35
valuable for planning purposes, but it is not site-specific and does not preclude the need for an onsite investigation.
Hydric soils lists
Hydric Soils Lists are developed for each detailed soil survey. Using cri-teria approved by the NTCHS, these lists rate each soil component as either hydric or non-hydric based on soil property data. If the soil is rated as hydric, information is provided regarding which hydric criteria are met and on what landform the soil typically occurs. Hydric Soils Lists are use-ful as general background information for an onsite delineation. The hydric soils list should be used as a tool, indicating that hydric soil will likely be found within a given area. However, not all areas within a poly-gon identified as having hydric soils may be hydric.
Hydric Soils Lists developed for individual detailed soil surveys are known as Local Hydric Soils Lists. They are available from state or county NRCS offices and over the internet from the Soil Data Mart (http://soildatamart.nrcs .usda.gov/). Local Hydric Soils Lists have been compiled into a National Hydric Soils List available at http://soils.usda.gov/use/hydric/. However, use of Local Hydric Soils Lists is preferred since they are more current and reflect local variations in soil properties.
Hydric soil indicators
Many of the hydric soil indicators were developed specifically for wetland-delineation purposes. During the development of these indicators, soils in the interior of wetlands were not always examined; therefore, there are wetlands that lack any of the approved hydric soil indicators in the wettest interior portions. Wetland delineators and other users of the hydric soil indicators should concentrate their sampling efforts near the wetland edge and, if these soils are hydric, assume that soils in the wetter, interior portions of the wetland are also hydric even if they lack an indicator.
Hydric soil indicators are presented in three groups. Indicators for “All Soils” are used in any soil regardless of texture. Indicators for “Sandy Soils” are used in soil layers with USDA textures of loamy fine sand or coarser. Indicators for “Loamy and Clayey Soils” are used with soil layers of loamy very fine sand and finer. Both sandy and loamy/clayey layers may be present in the same soil profile. Therefore, a soil that contains a loamy surface layer over sand is hydric if it meets all of the requirements of
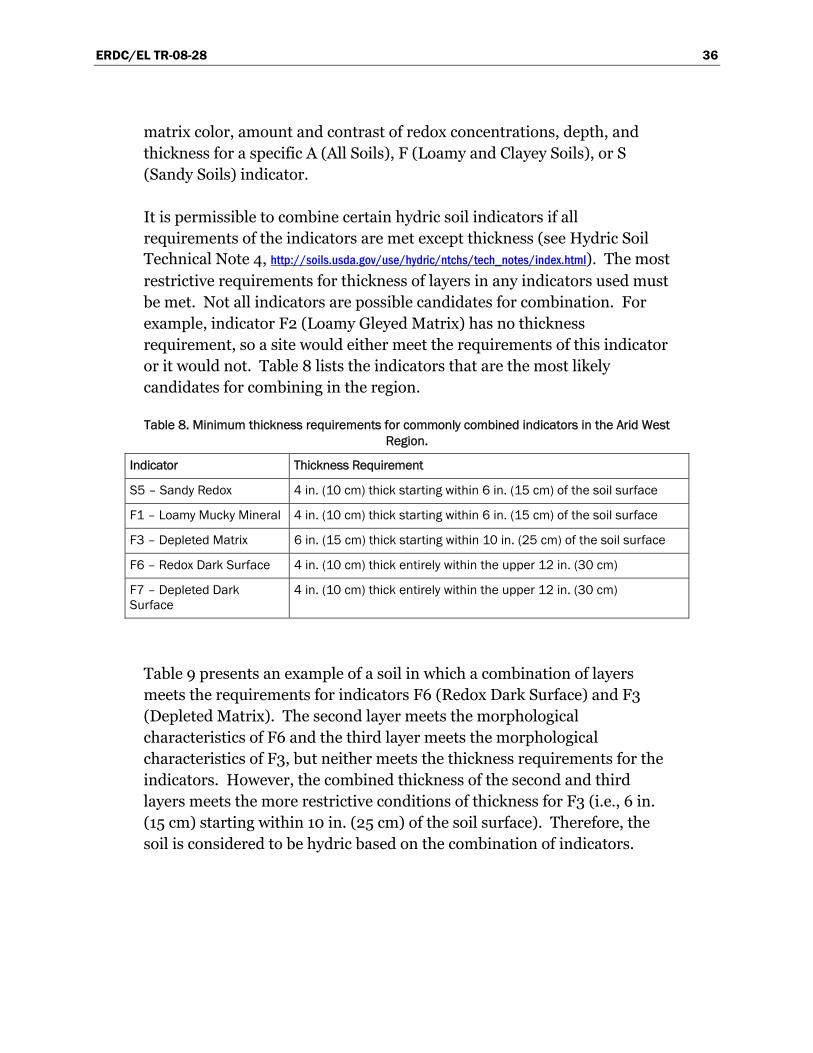
ERDC/EL TR-08-28 36
matrix color, amount and contrast of redox concentrations, depth, and thickness for a specific A (All Soils), F (Loamy and Clayey Soils), or S (Sandy Soils) indicator.
It is permissible to combine certain hydric soil indicators if all requirements of the indicators are met except thickness (see Hydric Soil Technical Note 4, http://soils.usda.gov/use/hydric/ntchs/tech_notes/index.html). The most restrictive requirements for thickness of layers in any indicators used must be met. Not all indicators are possible candidates for combination. For example, indicator F2 (Loamy Gleyed Matrix) has no thickness requirement, so a site would either meet the requirements of this indicator or it would not. Table 8 lists the indicators that are the most likely candidates for combining in the region.
Table 8. Minimum thickness requirements for commonly combined indicators in the Arid West Region.
Indicator Thickness Requirement
S5 – Sandy Redox 4 in. (10 cm) thick starting within 6 in. (15 cm) of the soil surface
F1 – Loamy Mucky Mineral 4 in. (10 cm) thick starting within 6 in. (15 cm) of the soil surface
F3 – Depleted Matrix 6 in. (15 cm) thick starting within 10 in. (25 cm) of the soil surface
F6 – Redox Dark Surface 4 in. (10 cm) thick entirely within the upper 12 in. (30 cm)
F7 – Depleted Dark Surface
4 in. (10 cm) thick entirely within the upper 12 in. (30 cm)
Table 9 presents an example of a soil in which a combination of layers meets the requirements for indicators F6 (Redox Dark Surface) and F3 (Depleted Matrix). The second layer meets the morphological characteristics of F6 and the third layer meets the morphological characteristics of F3, but neither meets the thickness requirements for the indicators. However, the combined thickness of the second and third layers meets the more restrictive conditions of thickness for F3 (i.e., 6 in. (15 cm) starting within 10 in. (25 cm) of the soil surface). Therefore, the soil is considered to be hydric based on the combination of indicators.

ERDC/EL TR-08-28 37
Table 9. Example of a soil that is hydric based on a combination of indicators F6 and F3.
Redox Concentrations Depth (inches)
Matrix Color
Color Abundance Contrast
Texture
0 – 3 10YR 2/1 -- -- -- Loamy
3 – 6 10YR 3/1 7.5YR 5/6 3 percent Prominent Loamy
6 – 10 10YR 5/2 7.5YR 5/6 5 percent Prominent Loamy
10 – 14 2.5Y 4/2 -- -- -- Loamy
Another common situation in which it is appropriate to combine the characteristics of hydric soil indicators is when stratified textures of sandy (i.e., loamy fine sand and coarser) and loamy (i.e., loamy very fine sand and finer) material occur in the upper 12 in. of the soil. For example, the soil shown in Table 10 is hydric based on a combination of indicators F6 (Redox Dark Surface) and S5 (Sandy Redox). This soil meets the morphological characteristics of F6 in the first layer and S5 in the second layer, but neither layer by itself meets the thickness requirements for the indicators. However, the combined thickness of the two layers (6 in.) meets the more restrictive thickness requirement of either indicator (4 in.).
Table 10. Example of a soil that is hydric based on a combination of indicators F6 and S5.
Redox Concentrations Depth (inches)
Matrix Color
Color Abundance Contrast
Texture
0 – 3 10YR 3/1 10YR 5/6 3 percent Prominent Loamy
3 – 6 10YR 4/1 10YR 5/6 3 percent Prominent Sandy
6 – 16 10YR 4/1 -- -- -- Loamy
All soils
“All soils” refers to soils with any USDA soil texture. Use the following indi-cators regardless of soil texture.
Unless otherwise indicated, all mineral layers above any of the indicators must have a dominant chroma of 2 or less, or the layer(s) with dominant chroma of more than 2 must be less than 6 in. (15 cm) thick to meet any hydric soil indicator. Nodules and concretions are not considered to be redox concentrations unless otherwise noted.
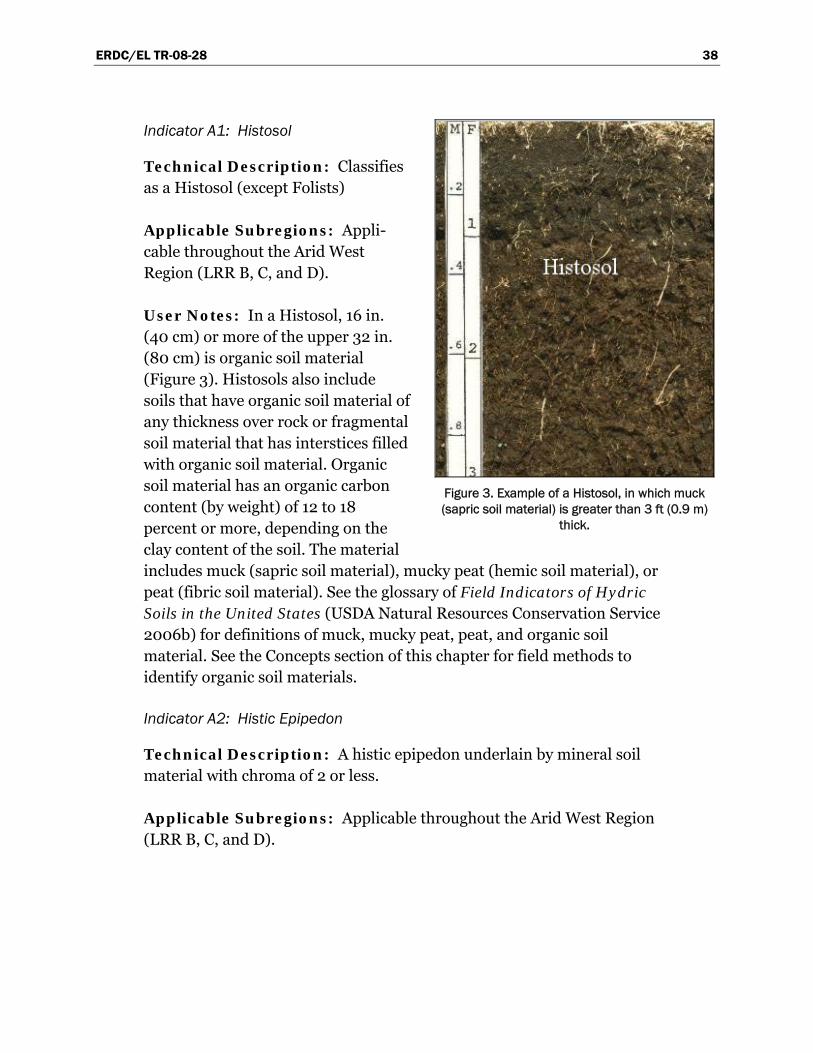
ERDC/EL TR-08-28 38
Indicator A1: Histosol
Technical Description: Classifies as a Histosol (except Folists)
Applicable Subregions: Appli-cable throughout the Arid West Region (LRR B, C, and D).
User Notes: In a Histosol, 16 in. (40 cm) or more of the upper 32 in. (80 cm) is organic soil material (Figure 3). Histosols also include soils that have organic soil material of any thickness over rock or fragmental soil material that has interstices filled with organic soil material. Organic soil material has an organic carbon content (by weight) of 12 to 18 percent or more, depending on the clay content of the soil. The material includes muck (sapric soil material), mucky peat (hemic soil material), or peat (fibric soil material). See the glossary of Field Indicators of Hydric Soils in the United States (USDA Natural Resources Conservation Service 2006b) for definitions of muck, mucky peat, peat, and organic soil material. See the Concepts section of this chapter for field methods to identify organic soil materials.
Indicator A2: Histic Epipedon
Technical Description: A histic epipedon underlain by mineral soil material with chroma of 2 or less.
Applicable Subregions: Applicable throughout the Arid West Region (LRR B, C, and D).
Figure 3. Example of a Histosol, in which muck (sapric soil material) is greater than 3 ft (0.9 m)
thick.
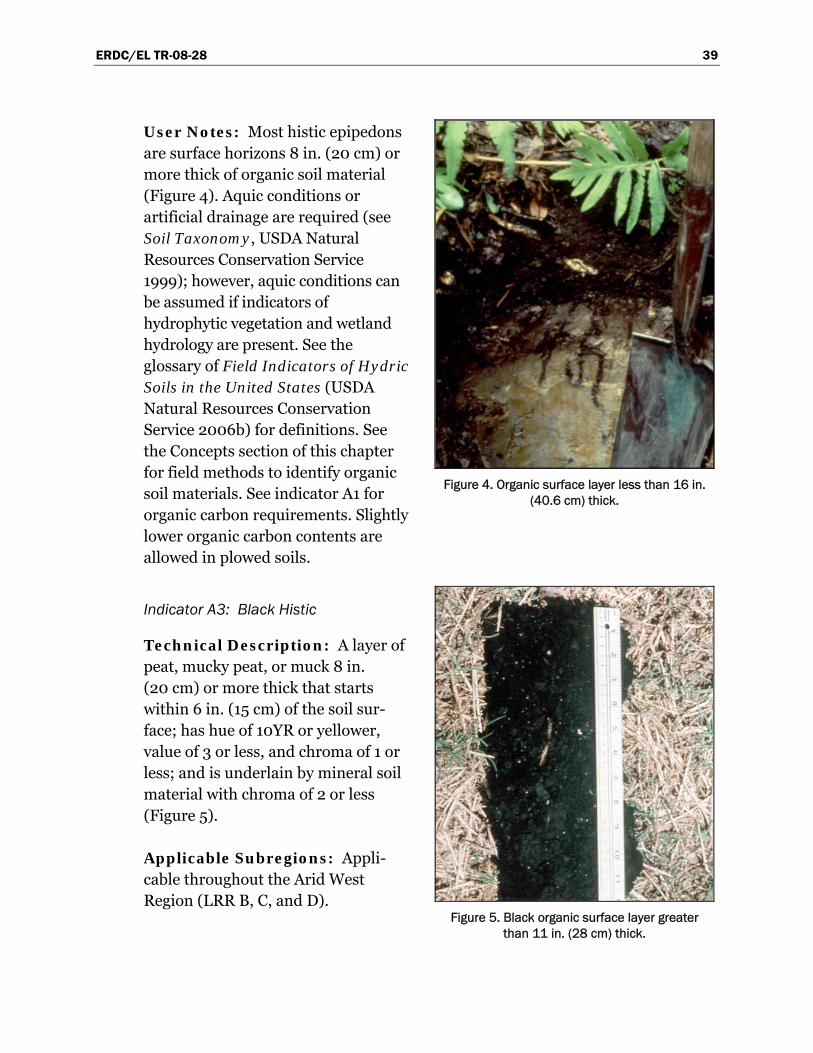
ERDC/EL TR-08-28 39
User Notes: Most histic epipedons are surface horizons 8 in. (20 cm) or more thick of organic soil material (Figure 4). Aquic conditions or artificial drainage are required (see Soil Taxonomy, USDA Natural Resources Conservation Service 1999); however, aquic conditions can be assumed if indicators of hydrophytic vegetation and wetland hydrology are present. See the glossary of Field Indicators of Hydric Soils in the United States (USDA Natural Resources Conservation Service 2006b) for definitions. See the Concepts section of this chapter for field methods to identify organic soil materials. See indicator A1 for organic carbon requirements. Slightly lower organic carbon contents are allowed in plowed soils.
Indicator A3: Black Histic
Technical Description: A layer of peat, mucky peat, or muck 8 in. (20 cm) or more thick that starts within 6 in. (15 cm) of the soil sur-face; has hue of 10YR or yellower, value of 3 or less, and chroma of 1 or less; and is underlain by mineral soil material with chroma of 2 or less (Figure 5).
Applicable Subregions: Appli-cable throughout the Arid West Region (LRR B, C, and D).
Figure 4. Organic surface layer less than 16 in. (40.6 cm) thick.
Figure 5. Black organic surface layer greater than 11 in. (28 cm) thick.
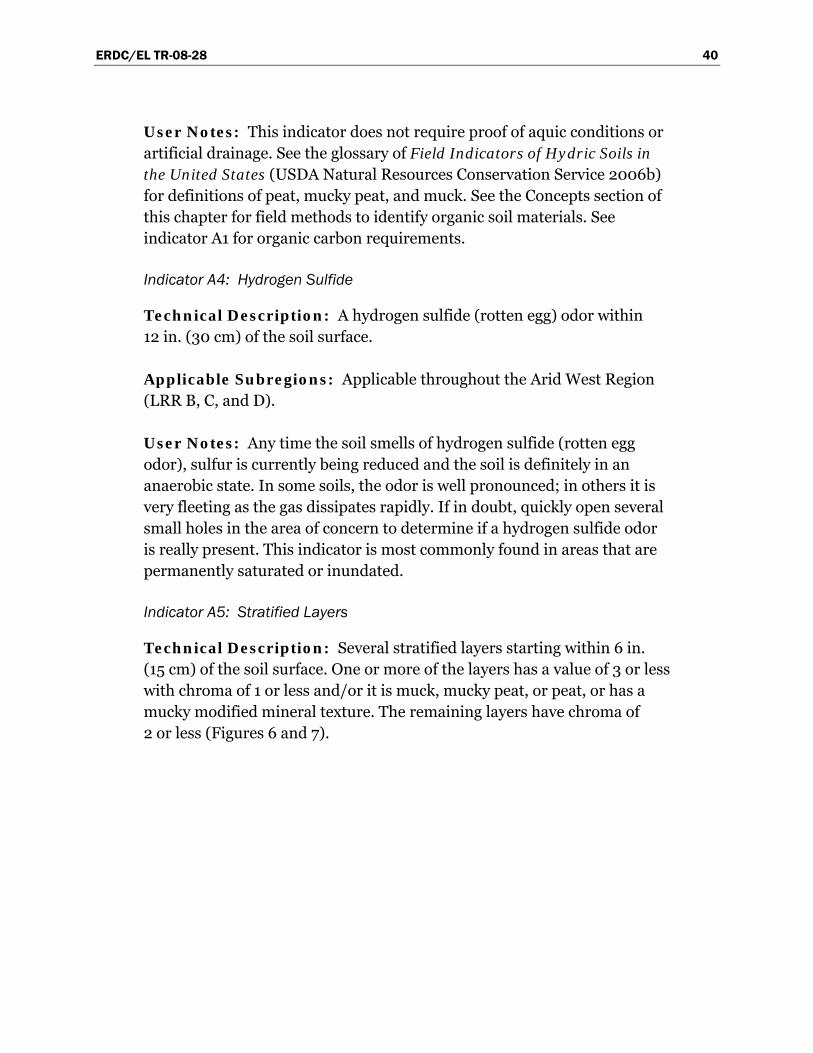
ERDC/EL TR-08-28 40
User Notes: This indicator does not require proof of aquic conditions or artificial drainage. See the glossary of Field Indicators of Hydric Soils in the United States (USDA Natural Resources Conservation Service 2006b) for definitions of peat, mucky peat, and muck. See the Concepts section of this chapter for field methods to identify organic soil materials. See indicator A1 for organic carbon requirements.
Indicator A4: Hydrogen Sulfide
Technical Description: A hydrogen sulfide (rotten egg) odor within 12 in. (30 cm) of the soil surface.
Applicable Subregions: Applicable throughout the Arid West Region (LRR B, C, and D).
User Notes: Any time the soil smells of hydrogen sulfide (rotten egg odor), sulfur is currently being reduced and the soil is definitely in an anaerobic state. In some soils, the odor is well pronounced; in others it is very fleeting as the gas dissipates rapidly. If in doubt, quickly open several small holes in the area of concern to determine if a hydrogen sulfide odor is really present. This indicator is most commonly found in areas that are permanently saturated or inundated.
Indicator A5: Stratified Layers
Technical Description: Several stratified layers starting within 6 in. (15 cm) of the soil surface. One or more of the layers has a value of 3 or less with chroma of 1 or less and/or it is muck, mucky peat, or peat, or has a mucky modified mineral texture. The remaining layers have chroma of 2 or less (Figures 6 and 7).
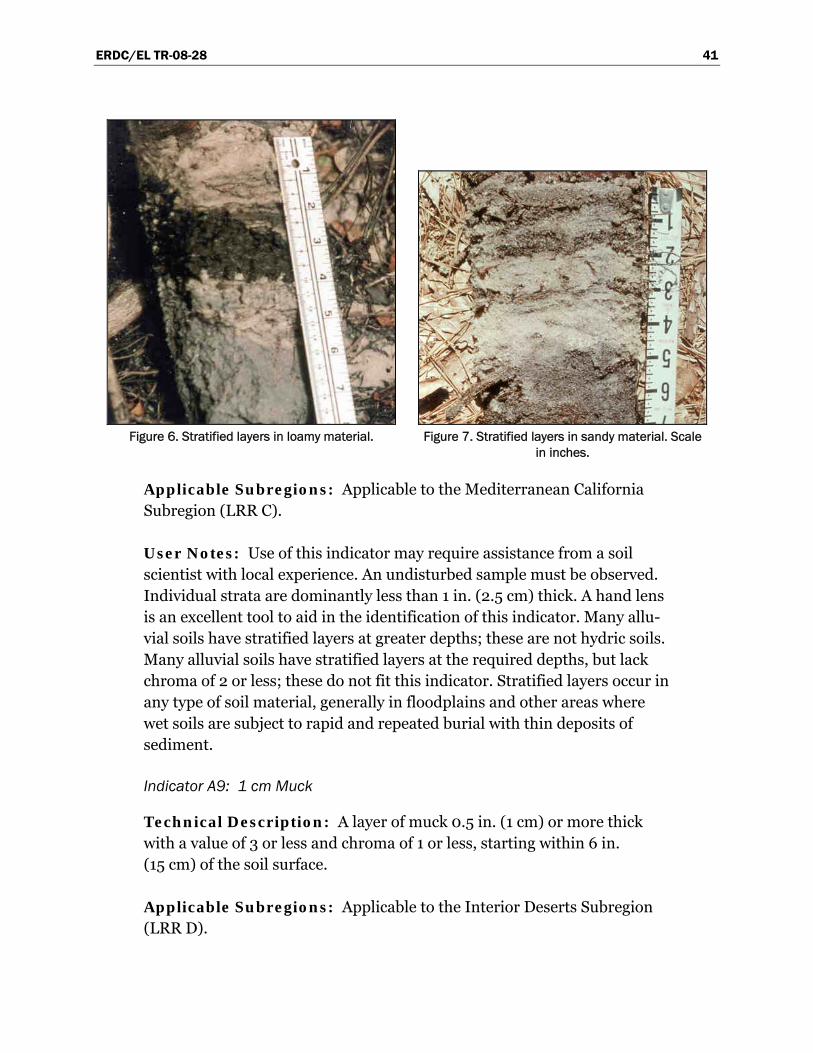
ERDC/EL TR-08-28 41
Figure 6. Stratified layers in loamy material. Figure 7. Stratified layers in sandy material. Scale
in inches.
Applicable Subregions: Applicable to the Mediterranean California Subregion (LRR C).
User Notes: Use of this indicator may require assistance from a soil scientist with local experience. An undisturbed sample must be observed. Individual strata are dominantly less than 1 in. (2.5 cm) thick. A hand lens is an excellent tool to aid in the identification of this indicator. Many allu-vial soils have stratified layers at greater depths; these are not hydric soils. Many alluvial soils have stratified layers at the required depths, but lack chroma of 2 or less; these do not fit this indicator. Stratified layers occur in any type of soil material, generally in floodplains and other areas where wet soils are subject to rapid and repeated burial with thin deposits of sediment.
Indicator A9: 1 cm Muck
Technical Description: A layer of muck 0.5 in. (1 cm) or more thick with a value of 3 or less and chroma of 1 or less, starting within 6 in. (15 cm) of the soil surface.
Applicable Subregions: Applicable to the Interior Deserts Subregion (LRR D).
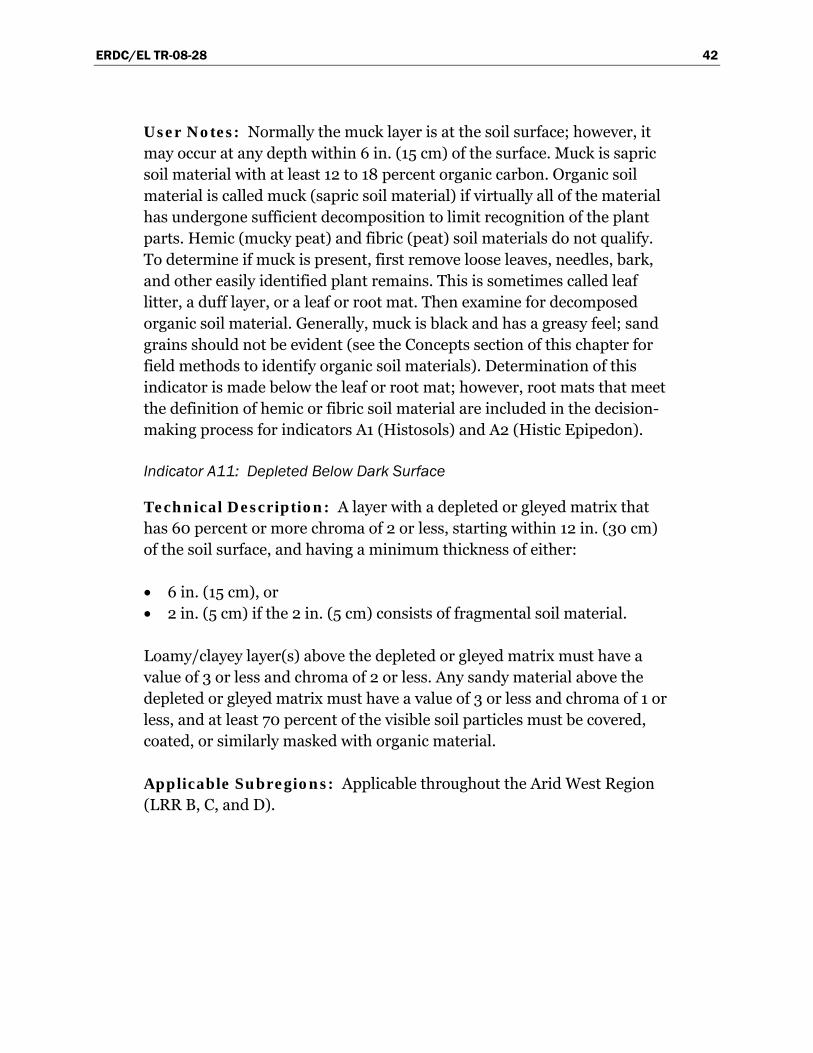
ERDC/EL TR-08-28 42
User Notes: Normally the muck layer is at the soil surface; however, it may occur at any depth within 6 in. (15 cm) of the surface. Muck is sapric soil material with at least 12 to 18 percent organic carbon. Organic soil material is called muck (sapric soil material) if virtually all of the material has undergone sufficient decomposition to limit recognition of the plant parts. Hemic (mucky peat) and fibric (peat) soil materials do not qualify. To determine if muck is present, first remove loose leaves, needles, bark, and other easily identified plant remains. This is sometimes called leaf litter, a duff layer, or a leaf or root mat. Then examine for decomposed organic soil material. Generally, muck is black and has a greasy feel; sand grains should not be evident (see the Concepts section of this chapter for field methods to identify organic soil materials). Determination of this indicator is made below the leaf or root mat; however, root mats that meet the definition of hemic or fibric soil material are included in the decision-making process for indicators A1 (Histosols) and A2 (Histic Epipedon).
Indicator A11: Depleted Below Dark Surface
Technical Description: A layer with a depleted or gleyed matrix that has 60 percent or more chroma of 2 or less, starting within 12 in. (30 cm) of the soil surface, and having a minimum thickness of either:
• 6 in. (15 cm), or • 2 in. (5 cm) if the 2 in. (5 cm) consists of fragmental soil material.
Loamy/clayey layer(s) above the depleted or gleyed matrix must have a value of 3 or less and chroma of 2 or less. Any sandy material above the depleted or gleyed matrix must have a value of 3 or less and chroma of 1 or less, and at least 70 percent of the visible soil particles must be covered, coated, or similarly masked with organic material.
Applicable Subregions: Applicable throughout the Arid West Region (LRR B, C, and D).
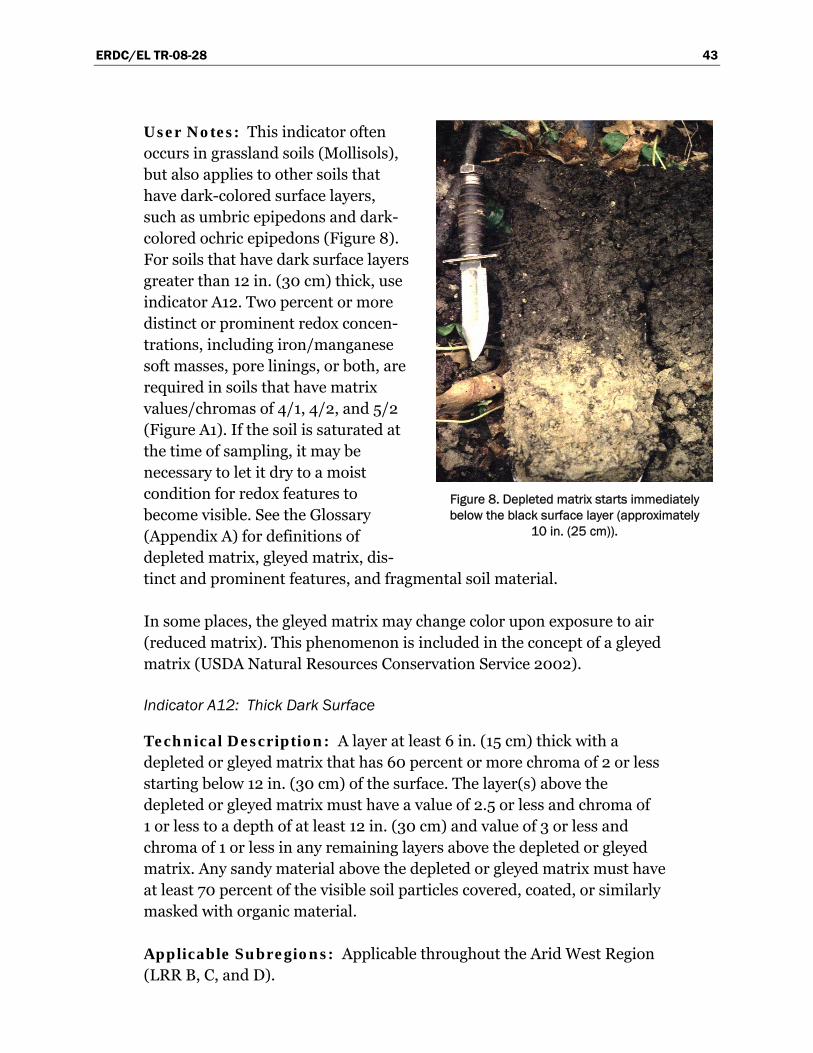
ERDC/EL TR-08-28 43
User Notes: This indicator often occurs in grassland soils (Mollisols), but also applies to other soils that have dark-colored surface layers, such as umbric epipedons and dark-colored ochric epipedons (Figure 8). For soils that have dark surface layers greater than 12 in. (30 cm) thick, use indicator A12. Two percent or more distinct or prominent redox concen-trations, including iron/manganese soft masses, pore linings, or both, are required in soils that have matrix values/chromas of 4/1, 4/2, and 5/2 (Figure A1). If the soil is saturated at the time of sampling, it may be necessary to let it dry to a moist condition for redox features to become visible. See the Glossary (Appendix A) for definitions of depleted matrix, gleyed matrix, dis-tinct and prominent features, and fragmental soil material.
In some places, the gleyed matrix may change color upon exposure to air (reduced matrix). This phenomenon is included in the concept of a gleyed matrix (USDA Natural Resources Conservation Service 2002).
Indicator A12: Thick Dark Surface
Technical Description: A layer at least 6 in. (15 cm) thick with a depleted or gleyed matrix that has 60 percent or more chroma of 2 or less starting below 12 in. (30 cm) of the surface. The layer(s) above the depleted or gleyed matrix must have a value of 2.5 or less and chroma of 1 or less to a depth of at least 12 in. (30 cm) and value of 3 or less and chroma of 1 or less in any remaining layers above the depleted or gleyed matrix. Any sandy material above the depleted or gleyed matrix must have at least 70 percent of the visible soil particles covered, coated, or similarly masked with organic material.
Applicable Subregions: Applicable throughout the Arid West Region (LRR B, C, and D).
Figure 8. Depleted matrix starts immediately below the black surface layer (approximately
10 in. (25 cm)).
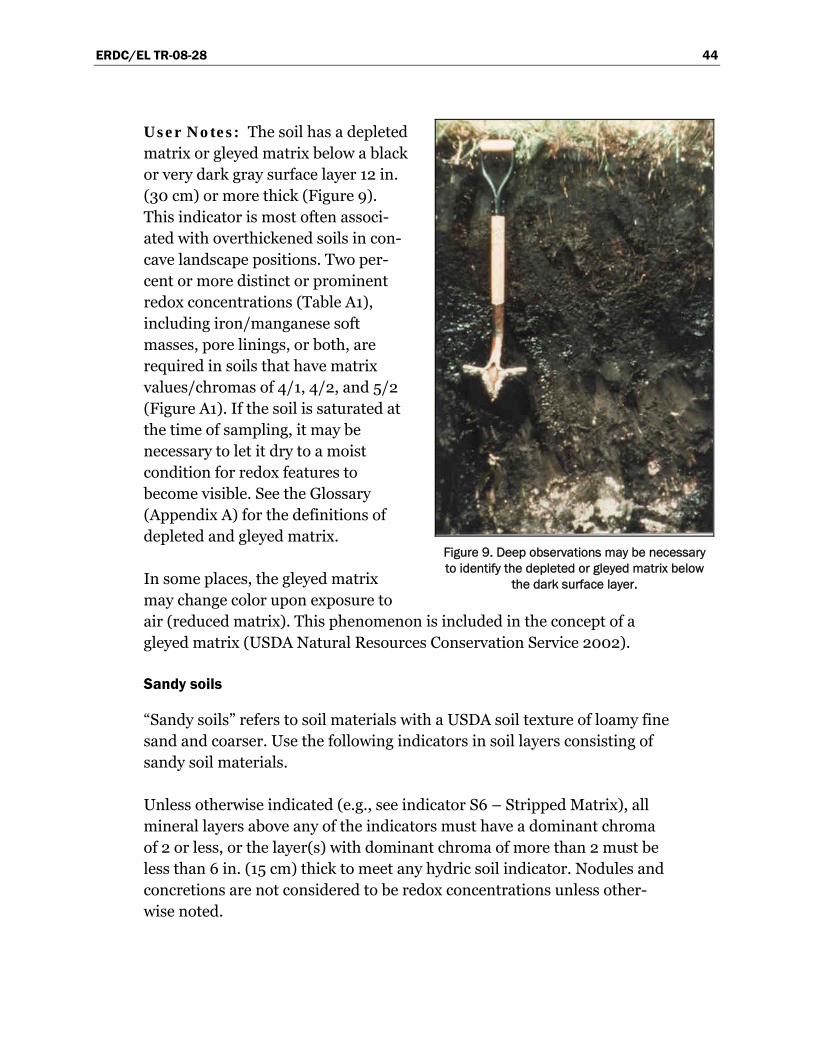
ERDC/EL TR-08-28 44
User Notes: The soil has a depleted matrix or gleyed matrix below a black or very dark gray surface layer 12 in. (30 cm) or more thick (Figure 9). This indicator is most often associ-ated with overthickened soils in con-cave landscape positions. Two per-cent or more distinct or prominent redox concentrations (Table A1), including iron/manganese soft masses, pore linings, or both, are required in soils that have matrix values/chromas of 4/1, 4/2, and 5/2 (Figure A1). If the soil is saturated at the time of sampling, it may be necessary to let it dry to a moist condition for redox features to become visible. See the Glossary (Appendix A) for the definitions of depleted and gleyed matrix.
In some places, the gleyed matrix may change color upon exposure to air (reduced matrix). This phenomenon is included in the concept of a gleyed matrix (USDA Natural Resources Conservation Service 2002).
Sandy soils
“Sandy soils” refers to soil materials with a USDA soil texture of loamy fine sand and coarser. Use the following indicators in soil layers consisting of sandy soil materials.
Unless otherwise indicated (e.g., see indicator S6 – Stripped Matrix), all mineral layers above any of the indicators must have a dominant chroma of 2 or less, or the layer(s) with dominant chroma of more than 2 must be less than 6 in. (15 cm) thick to meet any hydric soil indicator. Nodules and concretions are not considered to be redox concentrations unless other-wise noted.
Figure 9. Deep observations may be necessary to identify the depleted or gleyed matrix below
the dark surface layer.
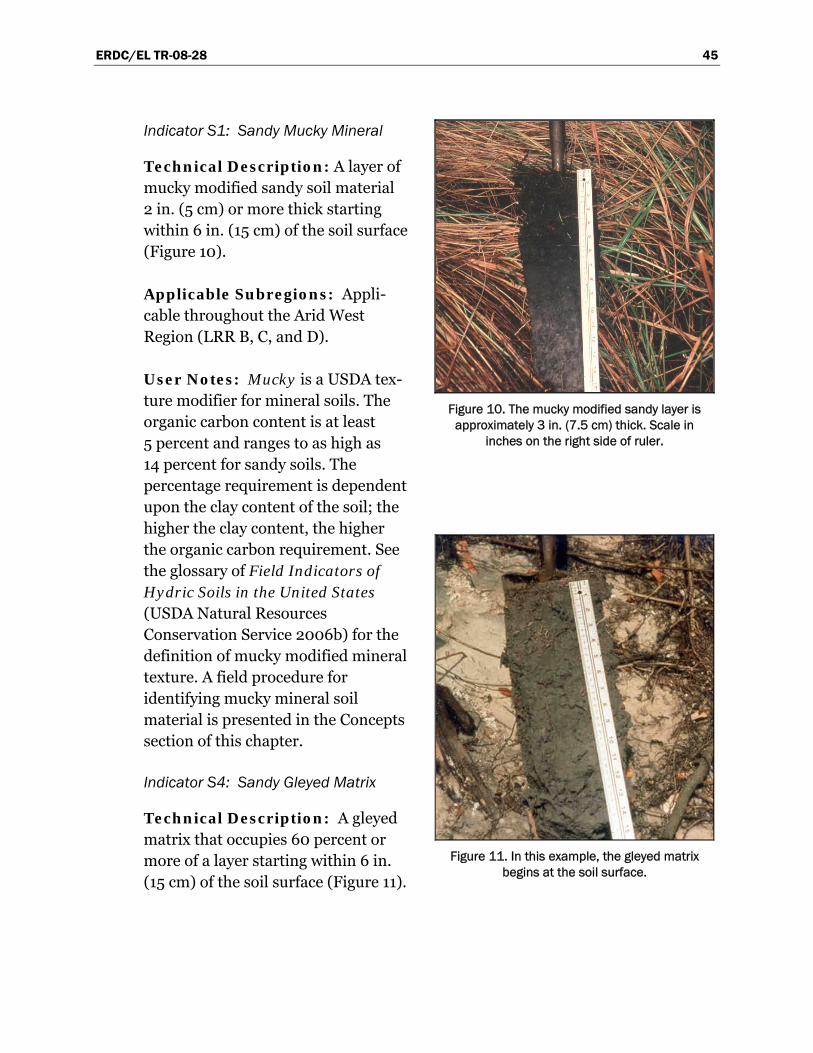
ERDC/EL TR-08-28 45
Indicator S1: Sandy Mucky Mineral
Technical Description: A layer of mucky modified sandy soil material 2 in. (5 cm) or more thick starting within 6 in. (15 cm) of the soil surface (Figure 10).
Applicable Subregions: Appli-cable throughout the Arid West Region (LRR B, C, and D).
User Notes: Mucky is a USDA tex-ture modifier for mineral soils. The organic carbon content is at least 5 percent and ranges to as high as 14 percent for sandy soils. The percentage requirement is dependent upon the clay content of the soil; the higher the clay content, the higher the organic carbon requirement. See the glossary of Field Indicators of Hydric Soils in the United States (USDA Natural Resources Conservation Service 2006b) for the definition of mucky modified mineral texture. A field procedure for identifying mucky mineral soil material is presented in the Concepts section of this chapter.
Indicator S4: Sandy Gleyed Matrix
Technical Description: A gleyed matrix that occupies 60 percent or more of a layer starting within 6 in. (15 cm) of the soil surface (Figure 11).
Figure 10. The mucky modified sandy layer is approximately 3 in. (7.5 cm) thick. Scale in
inches on the right side of ruler.
Figure 11. In this example, the gleyed matrix begins at the soil surface.
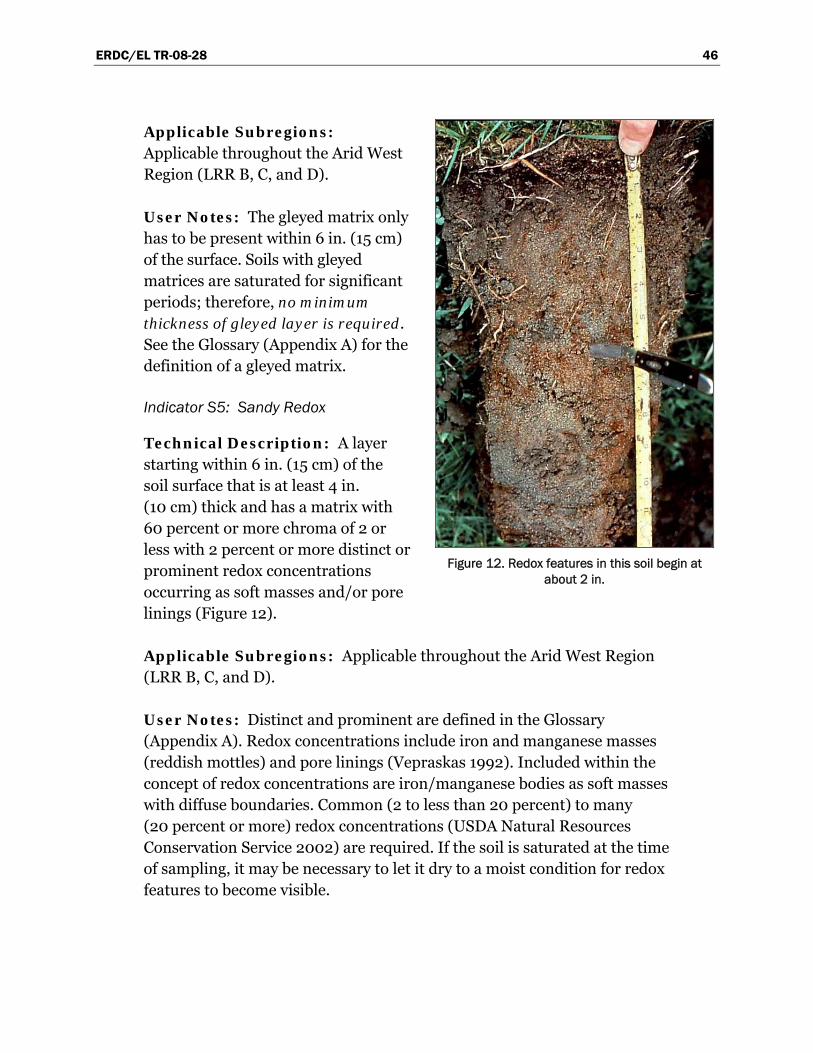
ERDC/EL TR-08-28 46
Applicable Subregions: Applicable throughout the Arid West Region (LRR B, C, and D).
User Notes: The gleyed matrix only has to be present within 6 in. (15 cm) of the surface. Soils with gleyed matrices are saturated for significant periods; therefore, no minimum thickness of gleyed layer is required. See the Glossary (Appendix A) for the definition of a gleyed matrix.
Indicator S5: Sandy Redox
Technical Description: A layer starting within 6 in. (15 cm) of the soil surface that is at least 4 in. (10 cm) thick and has a matrix with 60 percent or more chroma of 2 or less with 2 percent or more distinct or prominent redox concentrations occurring as soft masses and/or pore linings (Figure 12).
Applicable Subregions: Applicable throughout the Arid West Region (LRR B, C, and D).
User Notes: Distinct and prominent are defined in the Glossary (Appendix A). Redox concentrations include iron and manganese masses (reddish mottles) and pore linings (Vepraskas 1992). Included within the concept of redox concentrations are iron/manganese bodies as soft masses with diffuse boundaries. Common (2 to less than 20 percent) to many (20 percent or more) redox concentrations (USDA Natural Resources Conservation Service 2002) are required. If the soil is saturated at the time of sampling, it may be necessary to let it dry to a moist condition for redox features to become visible.
Figure 12. Redox features in this soil begin at about 2 in.
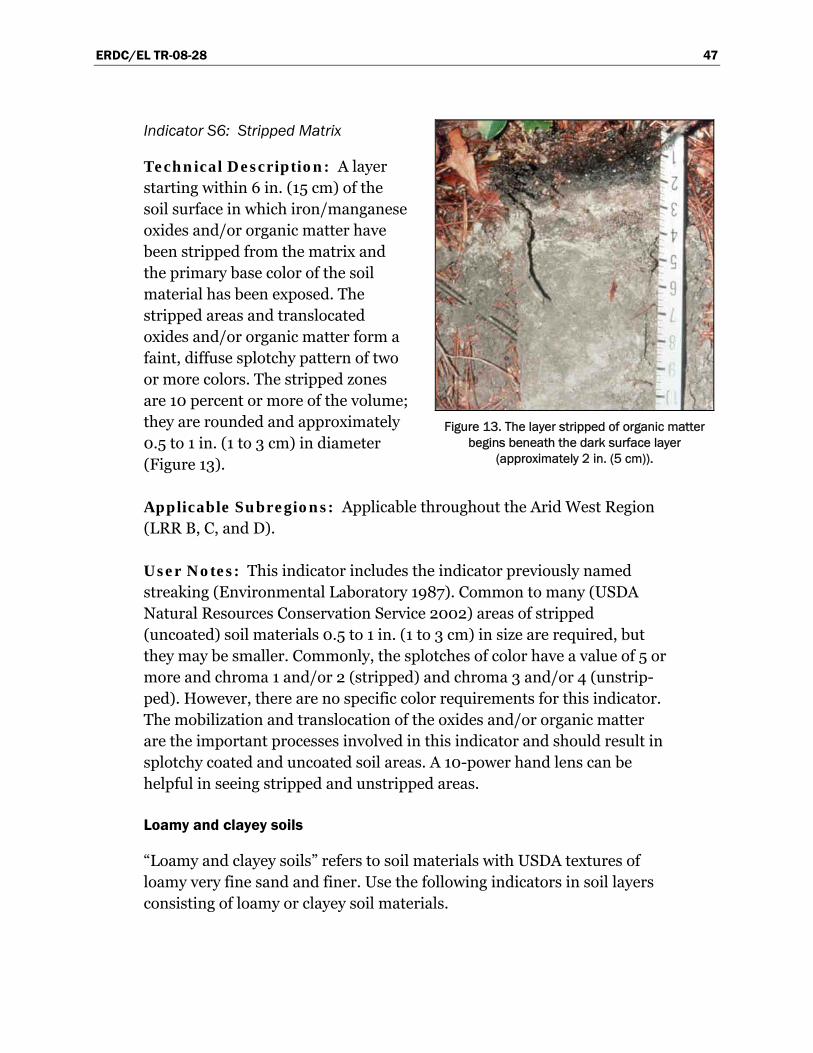
ERDC/EL TR-08-28 47
Indicator S6: Stripped Matrix
Technical Description: A layer starting within 6 in. (15 cm) of the soil surface in which iron/manganese oxides and/or organic matter have been stripped from the matrix and the primary base color of the soil material has been exposed. The stripped areas and translocated oxides and/or organic matter form a faint, diffuse splotchy pattern of two or more colors. The stripped zones are 10 percent or more of the volume; they are rounded and approximately 0.5 to 1 in. (1 to 3 cm) in diameter (Figure 13).
Applicable Subregions: Applicable throughout the Arid West Region (LRR B, C, and D).
User Notes: This indicator includes the indicator previously named streaking (Environmental Laboratory 1987). Common to many (USDA Natural Resources Conservation Service 2002) areas of stripped (uncoated) soil materials 0.5 to 1 in. (1 to 3 cm) in size are required, but they may be smaller. Commonly, the splotches of color have a value of 5 or more and chroma 1 and/or 2 (stripped) and chroma 3 and/or 4 (unstrip-ped). However, there are no specific color requirements for this indicator. The mobilization and translocation of the oxides and/or organic matter are the important processes involved in this indicator and should result in splotchy coated and uncoated soil areas. A 10-power hand lens can be helpful in seeing stripped and unstripped areas.
Loamy and clayey soils
“Loamy and clayey soils” refers to soil materials with USDA textures of loamy very fine sand and finer. Use the following indicators in soil layers consisting of loamy or clayey soil materials.
Figure 13. The layer stripped of organic matter begins beneath the dark surface layer
(approximately 2 in. (5 cm)).
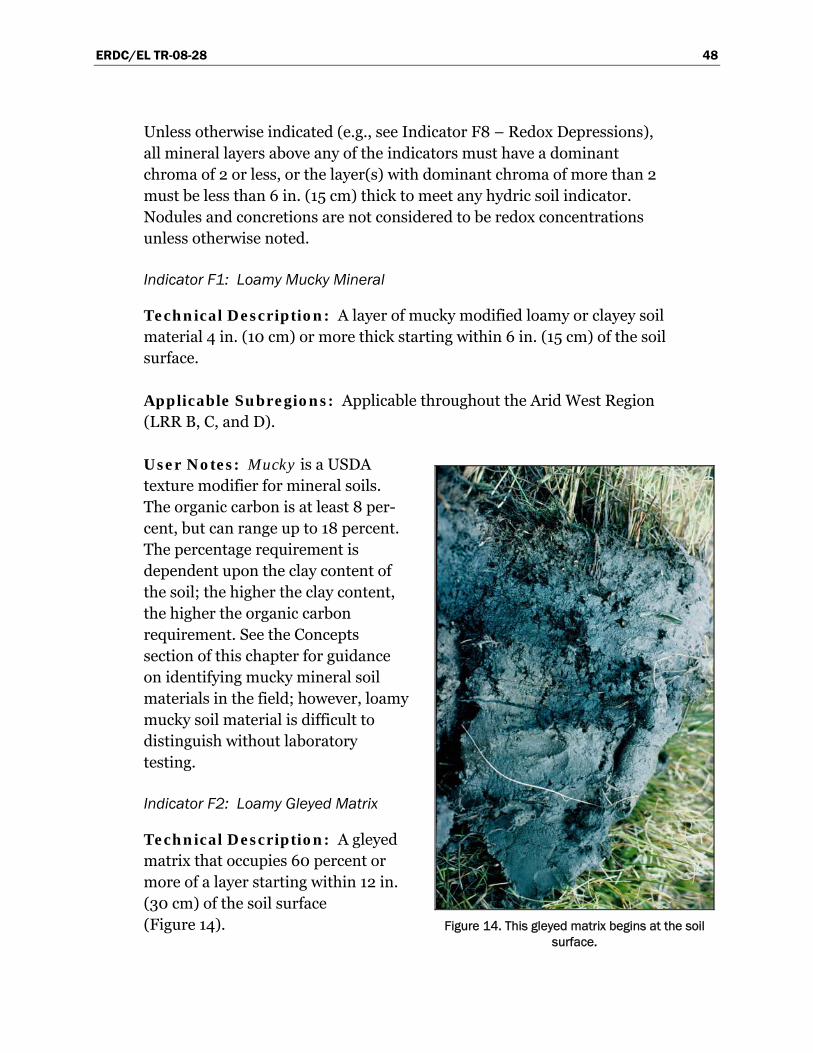
ERDC/EL TR-08-28 48
Unless otherwise indicated (e.g., see Indicator F8 – Redox Depressions), all mineral layers above any of the indicators must have a dominant chroma of 2 or less, or the layer(s) with dominant chroma of more than 2 must be less than 6 in. (15 cm) thick to meet any hydric soil indicator. Nodules and concretions are not considered to be redox concentrations unless otherwise noted.
Indicator F1: Loamy Mucky Mineral
Technical Description: A layer of mucky modified loamy or clayey soil material 4 in. (10 cm) or more thick starting within 6 in. (15 cm) of the soil surface.
Applicable Subregions: Applicable throughout the Arid West Region (LRR B, C, and D).
User Notes: Mucky is a USDA texture modifier for mineral soils. The organic carbon is at least 8 per-cent, but can range up to 18 percent. The percentage requirement is dependent upon the clay content of the soil; the higher the clay content, the higher the organic carbon requirement. See the Concepts section of this chapter for guidance on identifying mucky mineral soil materials in the field; however, loamy mucky soil material is difficult to distinguish without laboratory testing.
Indicator F2: Loamy Gleyed Matrix
Technical Description: A gleyed matrix that occupies 60 percent or more of a layer starting within 12 in. (30 cm) of the soil surface (Figure 14). Figure 14. This gleyed matrix begins at the soil
surface.
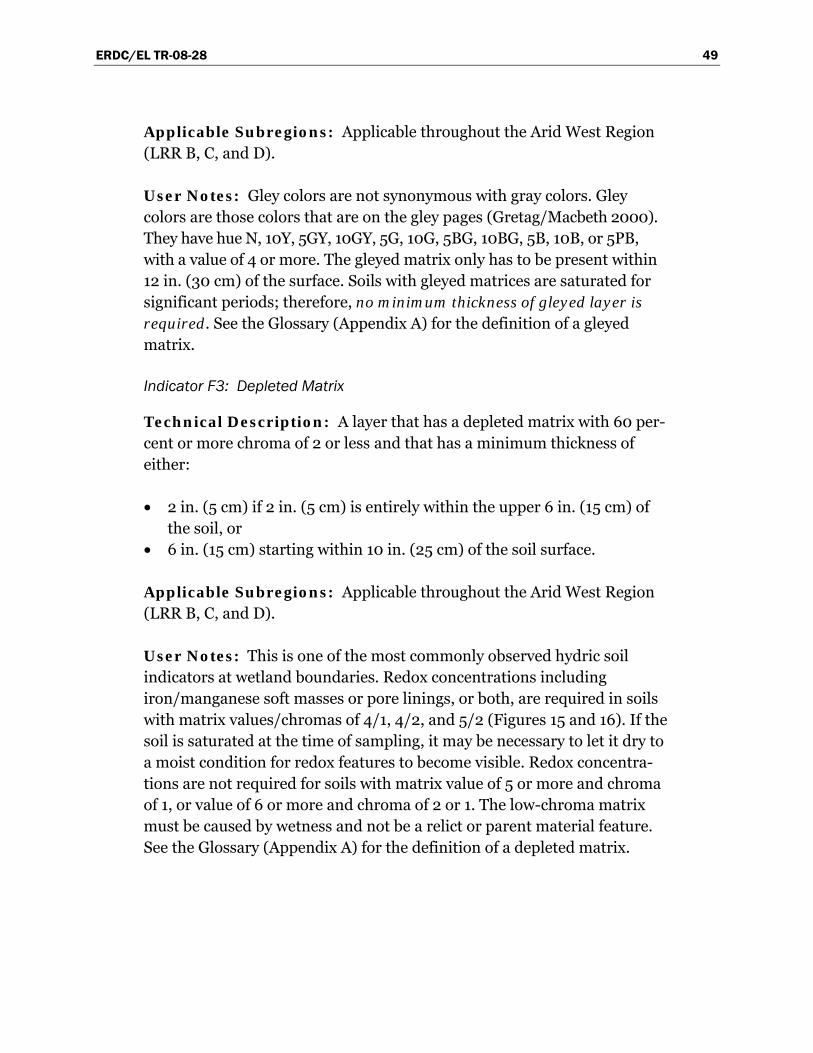
ERDC/EL TR-08-28 49
Applicable Subregions: Applicable throughout the Arid West Region (LRR B, C, and D).
User Notes: Gley colors are not synonymous with gray colors. Gley colors are those colors that are on the gley pages (Gretag/Macbeth 2000). They have hue N, 10Y, 5GY, 10GY, 5G, 10G, 5BG, 10BG, 5B, 10B, or 5PB, with a value of 4 or more. The gleyed matrix only has to be present within 12 in. (30 cm) of the surface. Soils with gleyed matrices are saturated for significant periods; therefore, no minimum thickness of gleyed layer is required. See the Glossary (Appendix A) for the definition of a gleyed matrix.
Indicator F3: Depleted Matrix
Technical Description: A layer that has a depleted matrix with 60 per-cent or more chroma of 2 or less and that has a minimum thickness of either:
• 2 in. (5 cm) if 2 in. (5 cm) is entirely within the upper 6 in. (15 cm) of the soil, or
• 6 in. (15 cm) starting within 10 in. (25 cm) of the soil surface.
Applicable Subregions: Applicable throughout the Arid West Region (LRR B, C, and D).
User Notes: This is one of the most commonly observed hydric soil indicators at wetland boundaries. Redox concentrations including iron/manganese soft masses or pore linings, or both, are required in soils with matrix values/chromas of 4/1, 4/2, and 5/2 (Figures 15 and 16). If the soil is saturated at the time of sampling, it may be necessary to let it dry to a moist condition for redox features to become visible. Redox concentra-tions are not required for soils with matrix value of 5 or more and chroma of 1, or value of 6 or more and chroma of 2 or 1. The low-chroma matrix must be caused by wetness and not be a relict or parent material feature. See the Glossary (Appendix A) for the definition of a depleted matrix.
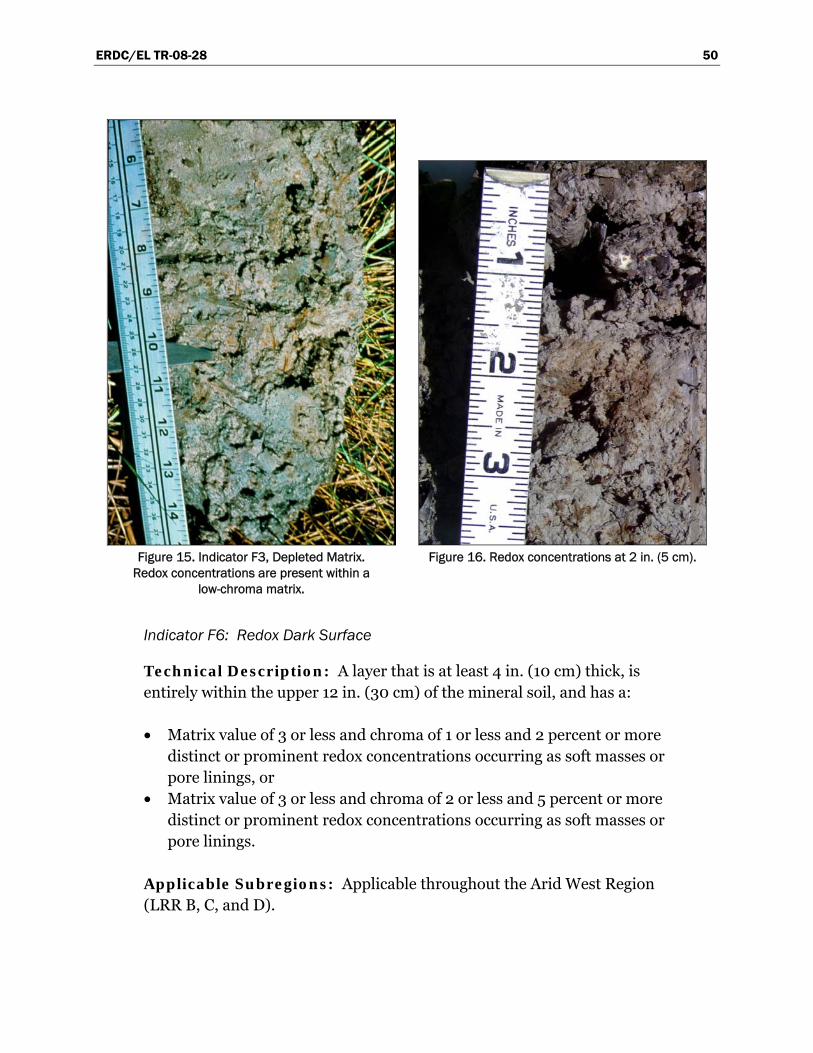
ERDC/EL TR-08-28 50
Figure 15. Indicator F3, Depleted Matrix.
Redox concentrations are present within a low-chroma matrix.
Figure 16. Redox concentrations at 2 in. (5 cm).
Indicator F6: Redox Dark Surface
Technical Description: A layer that is at least 4 in. (10 cm) thick, is entirely within the upper 12 in. (30 cm) of the mineral soil, and has a:
• Matrix value of 3 or less and chroma of 1 or less and 2 percent or more distinct or prominent redox concentrations occurring as soft masses or pore linings, or
• Matrix value of 3 or less and chroma of 2 or less and 5 percent or more distinct or prominent redox concentrations occurring as soft masses or pore linings.
Applicable Subregions: Applicable throughout the Arid West Region (LRR B, C, and D).
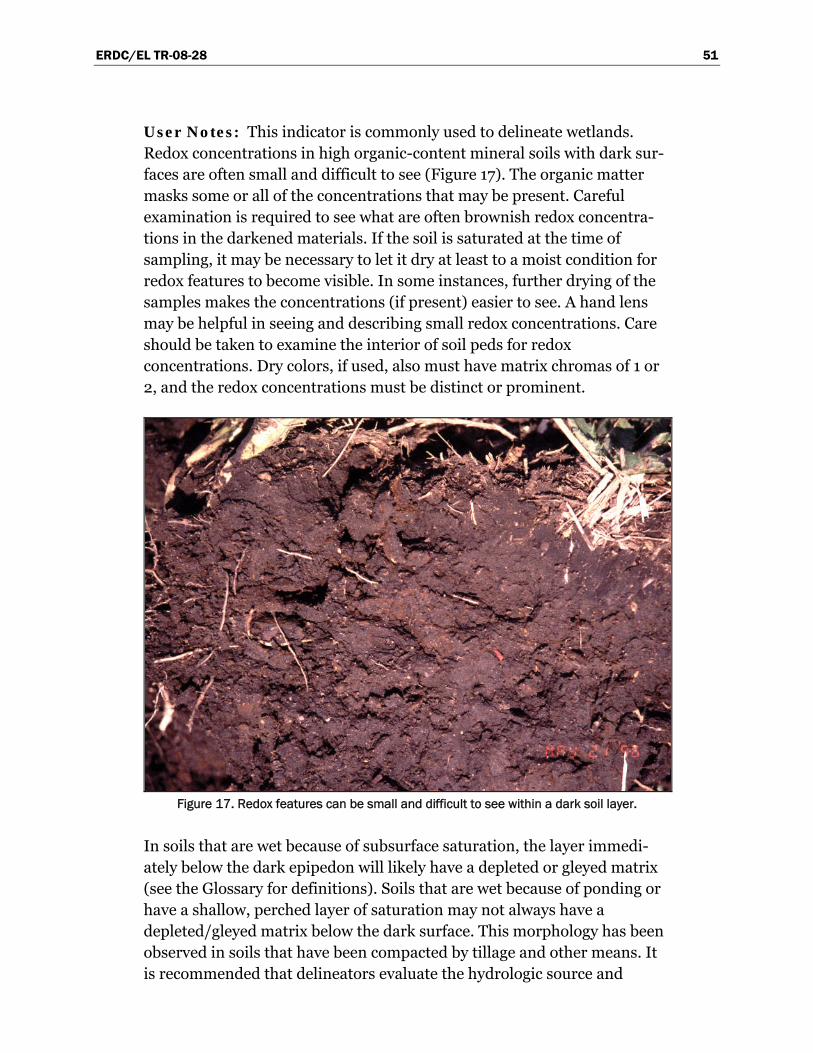
ERDC/EL TR-08-28 51
User Notes: This indicator is commonly used to delineate wetlands. Redox concentrations in high organic-content mineral soils with dark sur-faces are often small and difficult to see (Figure 17). The organic matter masks some or all of the concentrations that may be present. Careful examination is required to see what are often brownish redox concentra-tions in the darkened materials. If the soil is saturated at the time of sampling, it may be necessary to let it dry at least to a moist condition for redox features to become visible. In some instances, further drying of the samples makes the concentrations (if present) easier to see. A hand lens may be helpful in seeing and describing small redox concentrations. Care should be taken to examine the interior of soil peds for redox concentrations. Dry colors, if used, also must have matrix chromas of 1 or 2, and the redox concentrations must be distinct or prominent.
Figure 17. Redox features can be small and difficult to see within a dark soil layer.
In soils that are wet because of subsurface saturation, the layer immedi-ately below the dark epipedon will likely have a depleted or gleyed matrix (see the Glossary for definitions). Soils that are wet because of ponding or have a shallow, perched layer of saturation may not always have a depleted/gleyed matrix below the dark surface. This morphology has been observed in soils that have been compacted by tillage and other means. It is recommended that delineators evaluate the hydrologic source and
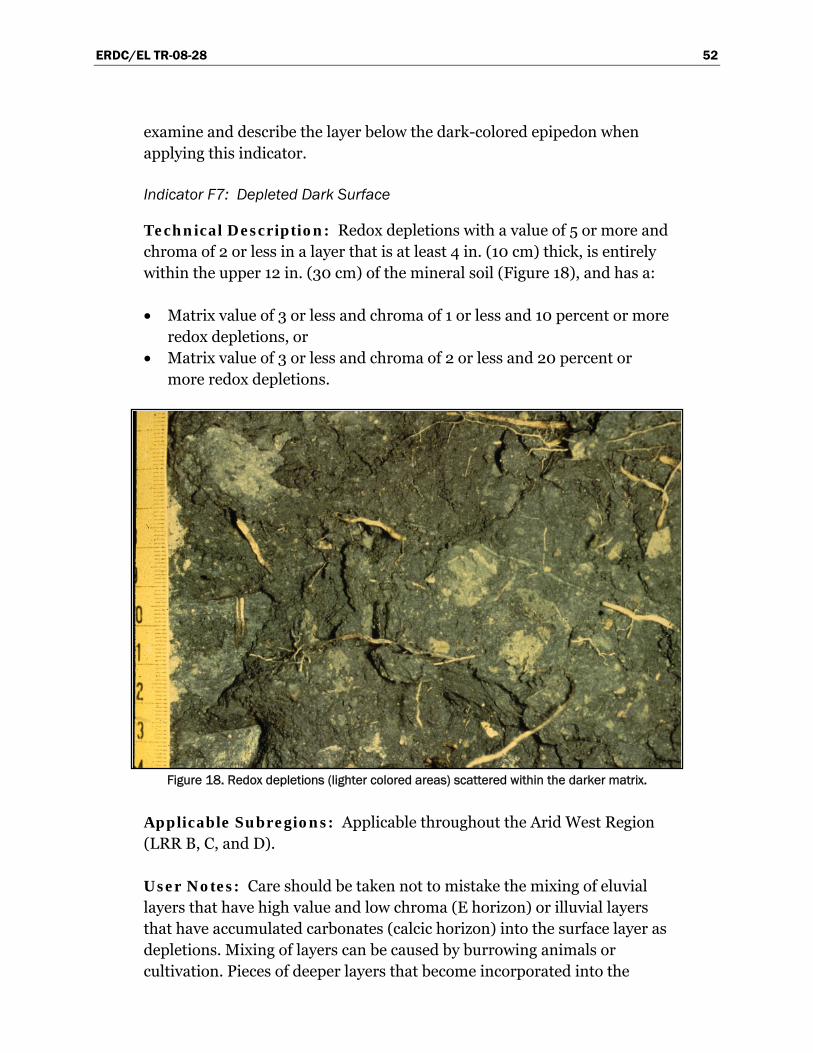
ERDC/EL TR-08-28 52
examine and describe the layer below the dark-colored epipedon when applying this indicator.
Indicator F7: Depleted Dark Surface
Technical Description: Redox depletions with a value of 5 or more and chroma of 2 or less in a layer that is at least 4 in. (10 cm) thick, is entirely within the upper 12 in. (30 cm) of the mineral soil (Figure 18), and has a:
• Matrix value of 3 or less and chroma of 1 or less and 10 percent or more redox depletions, or
• Matrix value of 3 or less and chroma of 2 or less and 20 percent or more redox depletions.
Figure 18. Redox depletions (lighter colored areas) scattered within the darker matrix.
Applicable Subregions: Applicable throughout the Arid West Region (LRR B, C, and D).
User Notes: Care should be taken not to mistake the mixing of eluvial layers that have high value and low chroma (E horizon) or illuvial layers that have accumulated carbonates (calcic horizon) into the surface layer as depletions. Mixing of layers can be caused by burrowing animals or cultivation. Pieces of deeper layers that become incorporated into the
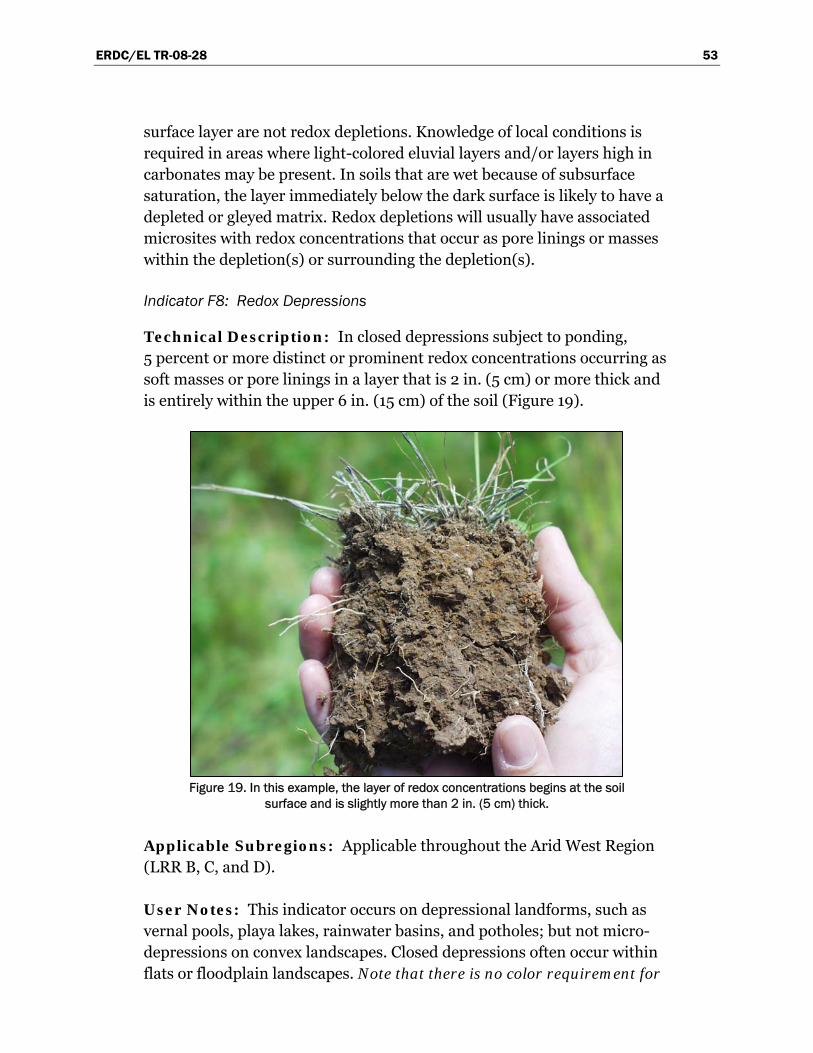
ERDC/EL TR-08-28 53
surface layer are not redox depletions. Knowledge of local conditions is required in areas where light-colored eluvial layers and/or layers high in carbonates may be present. In soils that are wet because of subsurface saturation, the layer immediately below the dark surface is likely to have a depleted or gleyed matrix. Redox depletions will usually have associated microsites with redox concentrations that occur as pore linings or masses within the depletion(s) or surrounding the depletion(s).
Indicator F8: Redox Depressions
Technical Description: In closed depressions subject to ponding, 5 percent or more distinct or prominent redox concentrations occurring as soft masses or pore linings in a layer that is 2 in. (5 cm) or more thick and is entirely within the upper 6 in. (15 cm) of the soil (Figure 19).
Figure 19. In this example, the layer of redox concentrations begins at the soil surface and is slightly more than 2 in. (5 cm) thick.
Applicable Subregions: Applicable throughout the Arid West Region (LRR B, C, and D).
User Notes: This indicator occurs on depressional landforms, such as vernal pools, playa lakes, rainwater basins, and potholes; but not micro-depressions on convex landscapes. Closed depressions often occur within flats or floodplain landscapes. Note that there is no color requirement for
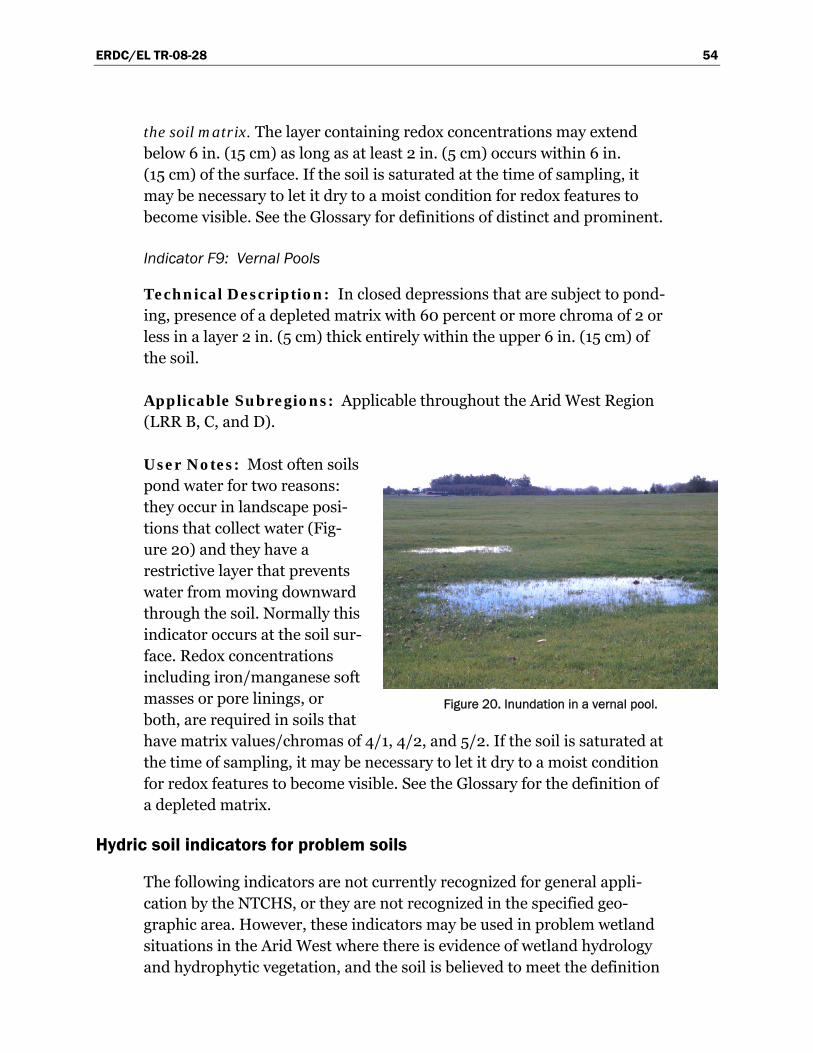
ERDC/EL TR-08-28 54
the soil matrix. The layer containing redox concentrations may extend below 6 in. (15 cm) as long as at least 2 in. (5 cm) occurs within 6 in. (15 cm) of the surface. If the soil is saturated at the time of sampling, it may be necessary to let it dry to a moist condition for redox features to become visible. See the Glossary for definitions of distinct and prominent.
Indicator F9: Vernal Pools
Technical Description: In closed depressions that are subject to pond-ing, presence of a depleted matrix with 60 percent or more chroma of 2 or less in a layer 2 in. (5 cm) thick entirely within the upper 6 in. (15 cm) of the soil.
Applicable Subregions: Applicable throughout the Arid West Region (LRR B, C, and D).
User Notes: Most often soils pond water for two reasons: they occur in landscape posi-tions that collect water (Fig-ure 20) and they have a restrictive layer that prevents water from moving downward through the soil. Normally this indicator occurs at the soil sur-face. Redox concentrations including iron/manganese soft masses or pore linings, or both, are required in soils that have matrix values/chromas of 4/1, 4/2, and 5/2. If the soil is saturated at the time of sampling, it may be necessary to let it dry to a moist condition for redox features to become visible. See the Glossary for the definition of a depleted matrix.
Hydric soil indicators for problem soils
The following indicators are not currently recognized for general appli-cation by the NTCHS, or they are not recognized in the specified geo-graphic area. However, these indicators may be used in problem wetland situations in the Arid West where there is evidence of wetland hydrology and hydrophytic vegetation, and the soil is believed to meet the definition
Figure 20. Inundation in a vernal pool.
ERDC/EL TR-08-28 55
of a hydric soil despite the lack of other indicators of a hydric soil. To use these indicators, follow the procedure described in the section on Problematic Hydric Soils in Chapter 5. If any of the following indicators is observed, it is recommended that the NTCHS be notified by following the protocol described in the “Comment on the Indicators” section of Field Indicators of Hydric Soils in the United States (USDA Natural Resources Conservation Service 2006b).
Indicator A9: 1 cm Muck
Technical Description: A layer of muck 0.5 in. (1 cm) or more thick with a value of 3 or less and chroma of 1 or less, starting within 6 in. (15 cm) of the soil surface.
Applicable Subregions: For use with problem soils in the Mediter-ranean California Subregion (LRR C).
User Notes: See the User Notes for Indicator A10 below.
Indicator A10: 2 cm Muck
Technical Description: A layer of muck 0.75 in. (2 cm) or more thick with a value of 3 or less and chroma of 1 or less, starting within 6 in. (15 cm) of the soil surface.
Applicable Subregions: For use with problem soils in the Columbia/ Snake River Plateau Subregion (LRR B).
User Notes: Normally the muck layer is at the soil surface; however, it may occur at any depth within 6 in. (15 cm) of the surface. Muck is sapric soil material with at least 12 to 18 percent organic carbon. Organic soil material is called muck if virtually all of the material has undergone suffi-cient decomposition to limit recognition of the plant parts. Hemic (mucky peat) and fibric (peat) soil materials do not qualify. To determine if muck is present, first remove loose leaves, needles, bark, and other easily identi-fied plant remains. This is sometimes called leaf litter, a duff layer, or a leaf or root mat. Then examine for decomposed organic soil material. Gen-erally, muck is black and has a greasy feel; sand grains should not be evi-dent (see the Concepts section of this chapter for field methods to identify organic soil materials). Determination of this indicator is made below the leaf or root mat; however, root mats that meet the definition of hemic or
ERDC/EL TR-08-28 56
fibric soil material are included in the decision-making process for indi-cators A1 (Histosols) and A2 (Histic Epipedon).
Indicator F18: Reduced Vertic
Technical Description: In Vertisols and Vertic intergrades, a positive reaction to alpha, alpha-dipyridyl that:
• Is the dominant (60 percent or more) condition of a layer at least 4 in. (10 cm) thick within the upper 12 in. (30 cm) (or at least 2 in. (5 cm) thick within the upper 6 in. (15 cm)) of the mineral or muck soil surface,
• Occurs for at least 7 continuous days and 28 cumulative days, and • Occurs during a normal (within 16 to 84 percent of probable pre-
cipitation) or drier season and month.
Applicable Subregions: For use with problem soils throughout the Arid West Region (LRR B, C, and D).
User Notes: The time requirements for this indicator were identified from research in MLRA 150A in LRR T (Gulf Coastal Prairies); these or slightly modified time requirements may be found to identify wetland Vertisols and Vertic intergrades in other parts of the nation. These soils usually have thick dark surface horizons but indicators A11, A12, and F6 are often lacking, possibly due to masking of redoximorphic features by organic carbon. Follow the procedures and note the considerations in Hydric Soil Technical Note 8 (http://soils.usda.gov/use/hydric/ntchs/tech_notes/ index.html).
Indicator TF2: Red Parent Material
Technical Description: In parent material with a hue of 7.5YR or redder, a layer at least 4 in. (10 cm) thick with a matrix value and chroma of 4 or less and 2 percent or more redox depletions and/or redox concen-trations occurring as soft masses and/or pore linings. The layer is entirely within 12 in. (30 cm) of the soil surface. The minimum thickness require-ment is 2 in. (5 cm) if the layer is the mineral surface layer.
Applicable Subregions: For use with problem soils throughout the Arid West Region (LRR B, C, and D).

ERDC/EL TR-08-28 57
User Notes: Redox features that are most noticeable in red material include redox depletions and soft manganese masses that are black or dark reddish black. If the soil is saturated at the time of sampling, it may be necessary to let it dry to a moist condition for redox features to become visible.
ERDC/EL TR-08-28 58
4 Wetland Hydrology Indicators Introduction
Wetland hydrology indicators are used in combination with indicators of hydric soil and hydrophytic vegetation to determine whether an area is a wetland under the Corps Manual. Indicators of hydrophytic vegetation and hydric soil generally reflect a site’s medium- to long-term wetness history. They provide readily observable evidence that episodes of inundation or soil saturation lasting more than a few days during the growing season have occurred repeatedly over a period of years and that the timing, dura-tion, and frequency of wet conditions have been sufficient to produce a characteristic wetland plant community and hydric soil morphology. If hydrology has not been altered, vegetation and soils provide strong evidence that wetland hydrology is present (National Research Council 1995). Wetland hydrology indicators provide evidence that the site has a continuing wetland hydrologic regime and that hydric soils and hydro-phytic vegetation are not relicts of a past hydrologic regime. Wetland hydrology indicators confirm that an episode of inundation or soil satura-tion occurred recently, but may provide little additional information about the timing, duration, or frequency of such events (National Research Council 1995).
Hydrology indicators are often the most transitory of wetland indicators. Those involving direct observation of surface water or saturated soils are usually present only during the normal wet portion of the growing season and may be absent during the dry season or during drier-than-normal years. The Arid West is characterized by extended dry seasons in most years and by extreme temporal and spatial variability in rainfall, even in “normal” years. Many wetlands in the region are dry for much of the year and, at those times, may lack hydrology indicators entirely. Therefore, lack of an indicator is not evidence for the absence of wetland hydrology. See Chapter 5 (Difficult Wetland Situations in the Arid West) for help in iden-tifying wetlands that may lack wetland hydrology indicators during the dry season or in drought years. On the other hand, some indicators could be present on a non-wetland site immediately after a heavy rain or during a period of unusually high precipitation, river stages, runoff, or snowmelt. Therefore, it is important to consider weather conditions prior to the site visit to minimize both false-positive and false-negative wetland hydrology
ERDC/EL TR-08-28 59
decisions. An understanding of normal seasonal and annual variations in rainfall, temperature, and other climatic conditions is essential in interpreting hydrology indicators in the Arid West. Some useful sources of climatic data are described in Chapter 5.
Areas that have hydrophytic vegetation and hydric soils generally also have wetland hydrology unless the hydrologic regime has changed due to natural events or human activities (National Research Council 1995). Therefore, when wetland hydrology indicators are absent from an area that has indicators of hydric soil and hydrophytic vegetation, further infor-mation may be needed to determine whether or not wetland hydrology is present. If possible, one or more site visits should be scheduled to coincide with the normal wet portion of the growing season, the period of the year when the presence or absence of wetland hydrology indicators is most likely to reflect the true wetland/non-wetland status of the site. In addi-tion, aerial photography or remote sensing data, stream gauge data, runoff estimates, scope-and-effect equations for ditches and subsurface drain lines, or groundwater modeling may help to determine whether wetland hydrology is present when indicators are equivocal or lacking (e.g., USDA Natural Resources Conservation Service 1997). On highly disturbed or problematic sites, direct hydrologic monitoring may be needed to deter-mine whether wetland hydrology is present. The U.S. Army Corps of Engineers (2005) provides a technical standard for monitoring hydrology on such sites. This standard requires 14 or more consecutive days of flooding or ponding, or a water table 12 in. (30 cm) or less below the soil surface, during the growing season at a minimum frequency of 5 years in 10 (50 percent or higher probability) (National Research Council 1995). See Chapter 5 for further information on these techniques.
Growing season
Beginning and ending dates of the growing season may be needed to evaluate certain wetland indicators, such as visual observations of flooding, ponding, or shallow water tables on potential wetland sites. In addition, growing season dates are needed in the event that recorded hydrologic data, such as stream gauge or water-table monitoring data, must be analyzed to determine whether wetland hydrology is present on highly disturbed or problematic sites.
Depletion of oxygen and the chemical reduction of nitrogen, iron, and other elements in saturated soils during the growing season is the result of
ERDC/EL TR-08-28 60
biological activity occurring in plant roots and soil microbial populations (National Research Council 1995). Two indicators of biological activity that are readily observable in the field are (1) above-ground growth and development of vascular plants, and (2) soil temperature. Therefore, if information about the growing season is needed and on-site data gathering is practical, the following approaches should be used in this region to determine growing season dates in a given year. The growing season has begun and is ongoing if either of these conditions is met. Therefore, the beginning of the growing season in a given year is indicated by whichever condition occurs earlier, and the end of the growing season is indicated by whichever condition persists later.
1. The growing season has begun on a site in a given year when two or more different non-evergreen vascular plant species growing in the wetland or surrounding areas exhibit one or more of the following indicators of biological activity:
a. Emergence of herbaceous plants from the ground. b. Appearance of new growth from vegetative crowns (e.g., in graminoids,
bulbs, and corms). c. Coleoptile/cotyledon emergence from seed. d. Bud burst on woody plants (i.e., some green foliage is visible between
spreading bud scales). e. Emergence or elongation of leaves of woody plants. f. Emergence or opening of flowers.
This determination should not include evergreen species. Observations should be made in the wetland or in surrounding areas subject to the same climatic conditions (e.g., similar elevation and aspect); however, soil moisture conditions may differ. Supporting data should be reported on the data form, in field notes, or in the delineation report, and should include the species observed (if identifiable), their abun-dance and location relative to the potential wetland, and type of bio-logical activity observed. A one-time observation of biological activity during a single site visit is sufficient, but is not required unless growing season information is necessary to evaluate particular wetland hydrology indicators. However, if long-term hydrologic monitoring is planned, then plant growth, maintenance, and senescence should be monitored for
ERDC/EL TR-08-28 61
continuity over the same period. Early plant senescence due to the initiation of the summer dry season does not necessarily indicate the end of the growing season and alternative procedures (e.g., soil temperature) should be used.
2. The growing season has begun in spring, and is still in progress, when soil temperature measured at the 12-in. (30-cm) depth is 41 °F (5 °C) or higher. A one-time temperature measurement during a single site visit is sufficient, but is not required unless growing season information is necessary to evaluate particular wetland hydrology indicators. However, if long-term hydrologic monitoring is planned, then soil temperature should also be monitored to ensure that it remains continuously at or above 41 °F during the monitoring period. Soil temperature can be measured directly in the field by inserting a soil thermometer into the wall of a freshly dug soil pit.
If the timing of the growing season based on vegetation growth and development and/or soil temperature is unknown and on-site data collection is not practical, such as when analyzing previously recorded stream-gauge or monitoring-well data, then growing season dates may be approximated by the median dates (i.e., 5 years in 10, or 50 percent probability) of 28 °F (−2.2 °C) air temperatures in spring and fall, based on long-term records gathered at National Weather Service meteorological stations (U.S. Army Corps of Engineers 2005). These dates are reported in WETS tables available from the NRCS National Water and Climate Center (http://www.wcc.nrcs.usda.gov/climate/wetlands.html) for the nearest appropriate weather station.
Wetland hydrology indicators
In this chapter, wetland hydrology indicators are presented in four groups. Indicators in Group A are based on the direct observation of surface water or groundwater during a site visit. Group B consists of evidence that the site is subject to flooding or ponding, although it may not be inundated currently. These indicators include water marks, drift deposits, sediment deposits, and similar features. Group C consists of other evidence that the soil is saturated currently or was saturated recently. Some of these indicators, such as oxidized rhizospheres surrounding living roots and the presence of reduced iron or sulfur in the soil profile, indicate that the soil has been saturated for an extended period. Group D consists of vegetation and soil features that indicate contemporary rather than historical wet
ERDC/EL TR-08-28 62
conditions. Wetland hydrology indicators are intended as one-time observations of site conditions that are sufficient evidence of wetland hydrology in areas where hydric soils and hydrophytic vegetation are present. All indicators are applicable throughout the Arid West Region.
Within each group, indicators are divided into two categories – primary and secondary – based on their estimated reliability in this region. One primary indicator from any group is sufficient to conclude that wetland hydrology is present; the area is a wetland if indicators of hydric soil and hydrophytic vegetation are also present. In the absence of a primary indi-cator, two or more secondary indicators from any group are required to conclude that wetland hydrology is present. Indicators of wetland hydrol-ogy include, but are not necessarily limited to, those listed in Table 11 and described on the following pages. Other evidence of wetland hydrology may also be used with appropriate documentation.
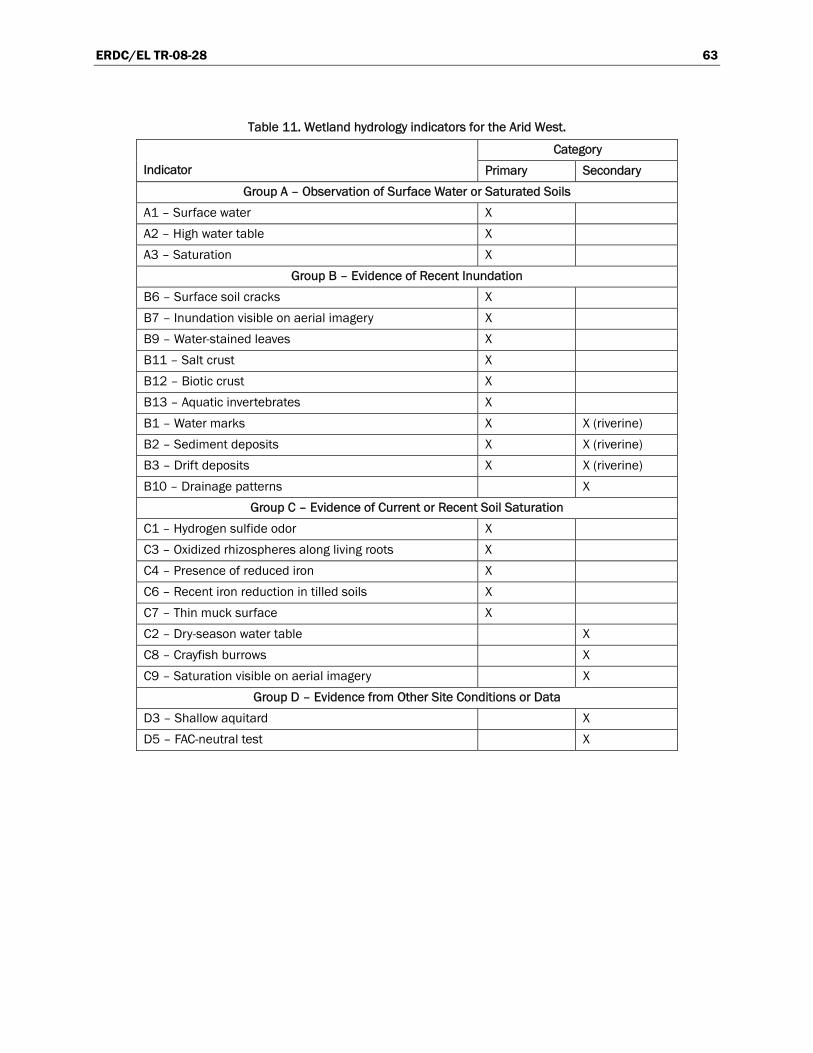
ERDC/EL TR-08-28 63
Table 11. Wetland hydrology indicators for the Arid West.
Category Indicator Primary Secondary
Group A – Observation of Surface Water or Saturated Soils A1 – Surface water X A2 – High water table X A3 – Saturation X
Group B – Evidence of Recent Inundation B6 – Surface soil cracks X B7 – Inundation visible on aerial imagery X B9 – Water-stained leaves X B11 – Salt crust X B12 – Biotic crust X B13 – Aquatic invertebrates X B1 – Water marks X X (riverine) B2 – Sediment deposits X X (riverine) B3 – Drift deposits X X (riverine) B10 – Drainage patterns X
Group C – Evidence of Current or Recent Soil Saturation C1 – Hydrogen sulfide odor X C3 – Oxidized rhizospheres along living roots X C4 – Presence of reduced iron X C6 – Recent iron reduction in tilled soils X C7 – Thin muck surface X C2 – Dry-season water table X C8 – Crayfish burrows X C9 – Saturation visible on aerial imagery X
Group D – Evidence from Other Site Conditions or Data D3 – Shallow aquitard X D5 – FAC-neutral test X

ERDC/EL TR-08-28 64
Group A – Observation of Surface Water or Saturated Soils
Indicator A1: Surface water
Category: Primary
General Description: This indicator consists of the direct, visual obser-vation of surface water (flooding or ponding) during a site visit (Figure 21).
Cautions and User Notes: Care must be used in applying this indicator because surface water may be present in non-wetland areas immediately after a rainfall event or during periods of unusually high precipitation, runoff, tides, or river stages. Furthermore, some non-wetlands flood fre-quently for brief periods. Surface water observed during the non-growing season may be an acceptable indicator if experience and professional judg-ment suggest that wet conditions normally extend into the growing season for sufficient duration in most years. If this is questionable and other hydrology indicators are absent, a follow-up visit during the growing sea-son may be needed. Note that surface water may be absent from a wetland during the normal dry season or during extended periods of drought. Even under normal rainfall conditions, some wetlands do not become inundated or saturated every year (i.e., wetlands are inundated or saturated at least 5 out of 10 years, or 50 percent or higher probability). In addition, ground-water-dominated wetland systems may never or rarely contain surface water.
Figure 21. Wetland with surface water present.
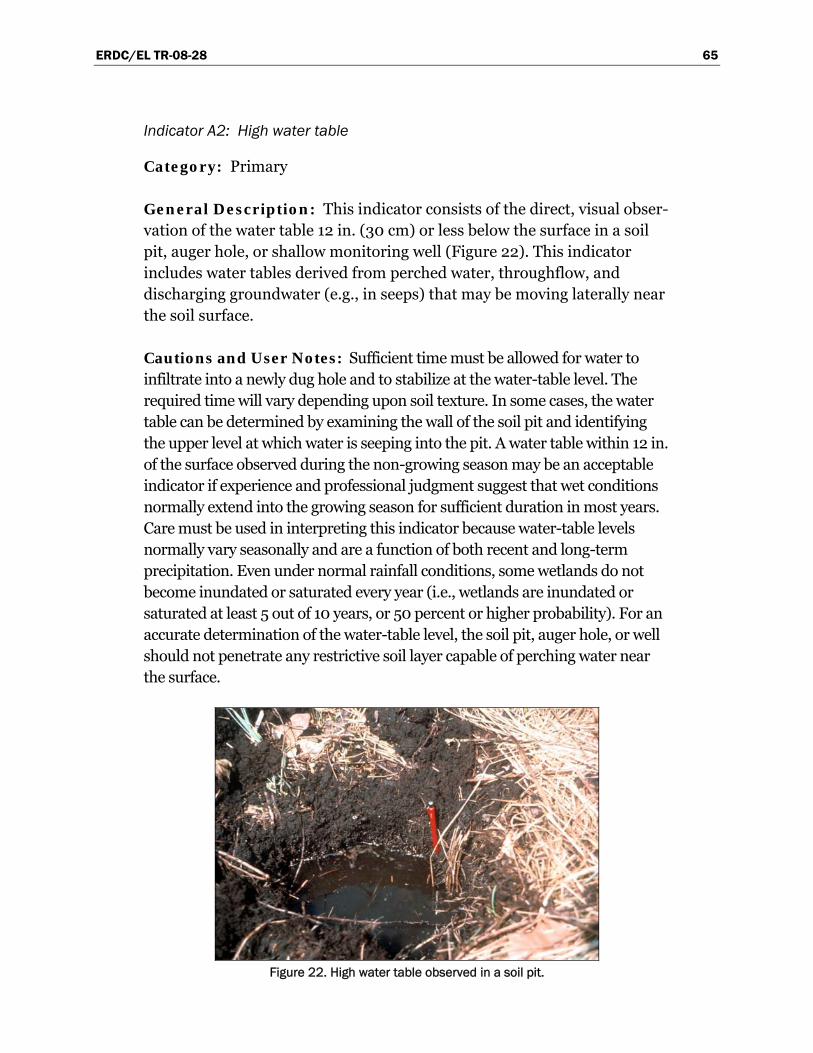
ERDC/EL TR-08-28 65
Indicator A2: High water table
Category: Primary
General Description: This indicator consists of the direct, visual obser-vation of the water table 12 in. (30 cm) or less below the surface in a soil pit, auger hole, or shallow monitoring well (Figure 22). This indicator includes water tables derived from perched water, throughflow, and discharging groundwater (e.g., in seeps) that may be moving laterally near the soil surface.
Cautions and User Notes: Sufficient time must be allowed for water to infiltrate into a newly dug hole and to stabilize at the water-table level. The required time will vary depending upon soil texture. In some cases, the water table can be determined by examining the wall of the soil pit and identifying the upper level at which water is seeping into the pit. A water table within 12 in. of the surface observed during the non-growing season may be an acceptable indicator if experience and professional judgment suggest that wet conditions normally extend into the growing season for sufficient duration in most years. Care must be used in interpreting this indicator because water-table levels normally vary seasonally and are a function of both recent and long-term precipitation. Even under normal rainfall conditions, some wetlands do not become inundated or saturated every year (i.e., wetlands are inundated or saturated at least 5 out of 10 years, or 50 percent or higher probability). For an accurate determination of the water-table level, the soil pit, auger hole, or well should not penetrate any restrictive soil layer capable of perching water near the surface.
Figure 22. High water table observed in a soil pit.
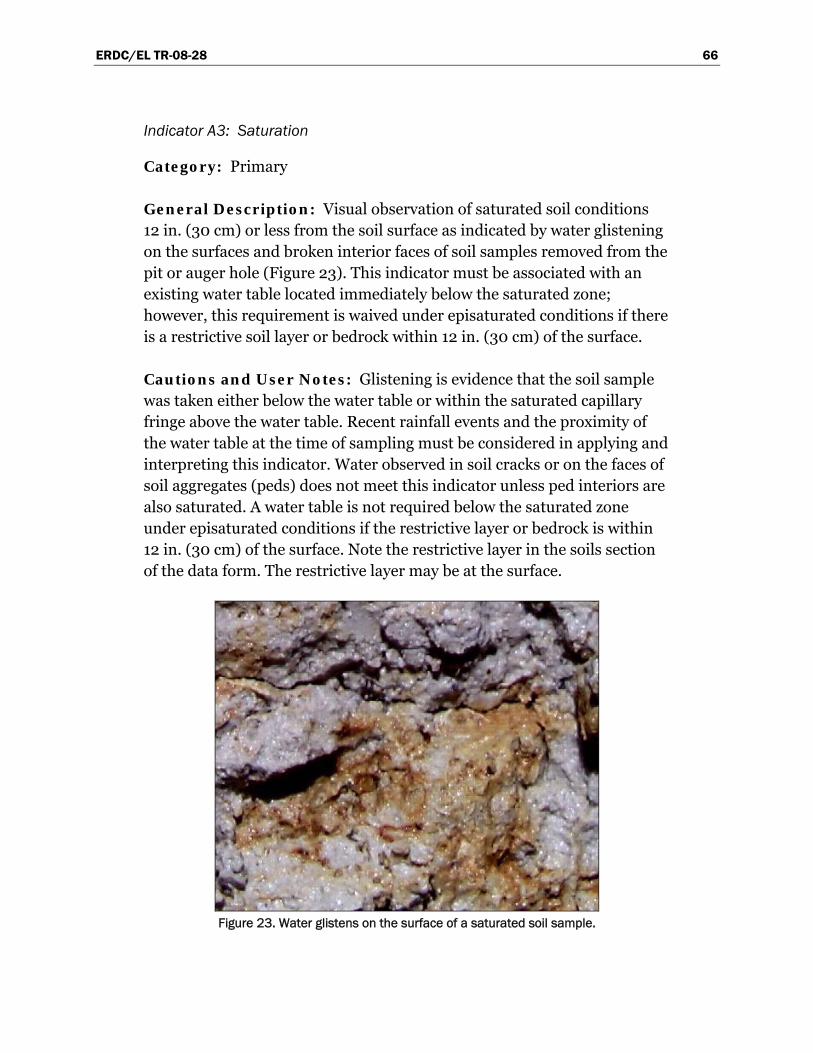
ERDC/EL TR-08-28 66
Indicator A3: Saturation
Category: Primary
General Description: Visual observation of saturated soil conditions 12 in. (30 cm) or less from the soil surface as indicated by water glistening on the surfaces and broken interior faces of soil samples removed from the pit or auger hole (Figure 23). This indicator must be associated with an existing water table located immediately below the saturated zone; however, this requirement is waived under episaturated conditions if there is a restrictive soil layer or bedrock within 12 in. (30 cm) of the surface.
Cautions and User Notes: Glistening is evidence that the soil sample was taken either below the water table or within the saturated capillary fringe above the water table. Recent rainfall events and the proximity of the water table at the time of sampling must be considered in applying and interpreting this indicator. Water observed in soil cracks or on the faces of soil aggregates (peds) does not meet this indicator unless ped interiors are also saturated. A water table is not required below the saturated zone under episaturated conditions if the restrictive layer or bedrock is within 12 in. (30 cm) of the surface. Note the restrictive layer in the soils section of the data form. The restrictive layer may be at the surface.
Figure 23. Water glistens on the surface of a saturated soil sample.
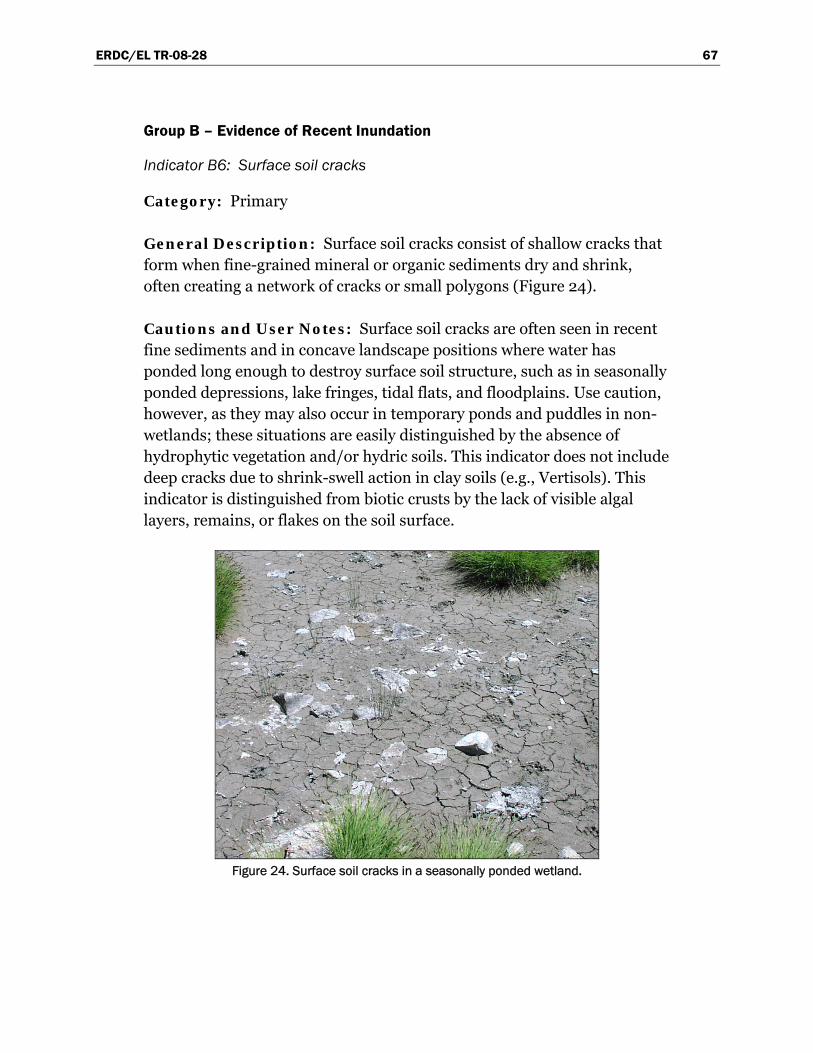
ERDC/EL TR-08-28 67
Group B – Evidence of Recent Inundation
Indicator B6: Surface soil cracks
Category: Primary
General Description: Surface soil cracks consist of shallow cracks that form when fine-grained mineral or organic sediments dry and shrink, often creating a network of cracks or small polygons (Figure 24).
Cautions and User Notes: Surface soil cracks are often seen in recent fine sediments and in concave landscape positions where water has ponded long enough to destroy surface soil structure, such as in seasonally ponded depressions, lake fringes, tidal flats, and floodplains. Use caution, however, as they may also occur in temporary ponds and puddles in non-wetlands; these situations are easily distinguished by the absence of hydrophytic vegetation and/or hydric soils. This indicator does not include deep cracks due to shrink-swell action in clay soils (e.g., Vertisols). This indicator is distinguished from biotic crusts by the lack of visible algal layers, remains, or flakes on the soil surface.
Figure 24. Surface soil cracks in a seasonally ponded wetland.
ERDC/EL TR-08-28 68
Indicator B7: Inundation visible on aerial imagery
Category: Primary
General Description: One or more recent aerial photographs or satellite images show the site to be inundated.
Cautions and User Notes: Care must be used in applying this indicator because surface water may be present on a non-wetland site immediately after a heavy rain or during periods of unusually high precipitation, runoff, tides, or river stages. See Chapter 5 for procedures to evaluate the nor-mality of precipitation prior to the photo date. Surface water observed during the non-growing season may be an acceptable indicator if experience and professional judgment suggest that wet conditions normally extend into the growing season for sufficient duration in most years. Surface water may be absent from a wetland during the normal dry season or during extended periods of drought. Even under normal rainfall conditions, some wetlands do not become inundated or saturated every year (i.e., wetlands are inundated or saturated at least 5 out of 10 years, or 50 percent or higher probability). If available, it is recommended that multiple years of photography be evaluated. If 5 or more years of aerial photography are available, the procedure described by the USDA Natural Resources Conservation Service (1997, section 650.1903) is recommended.
Indicator B9: Water-stained leaves
Category: Primary
General Description: Water-stained leaves are fallen or recumbent dead leaves that have turned grayish or blackish in color due to inundation for long periods.
Cautions and User Notes: Water-stained leaves are not commonly seen in arid areas but can be found in depressional wetlands and along streams in shrub-dominated or forested habitats; they may also occur in herbaceous communities. Staining often occurs in leaves that are in contact with the soil surface while inundated for long periods. Water-stained leaves maintain their blackish or grayish colors when dry. They should contrast strongly with fallen leaves in nearby non-wetland landscape positions.
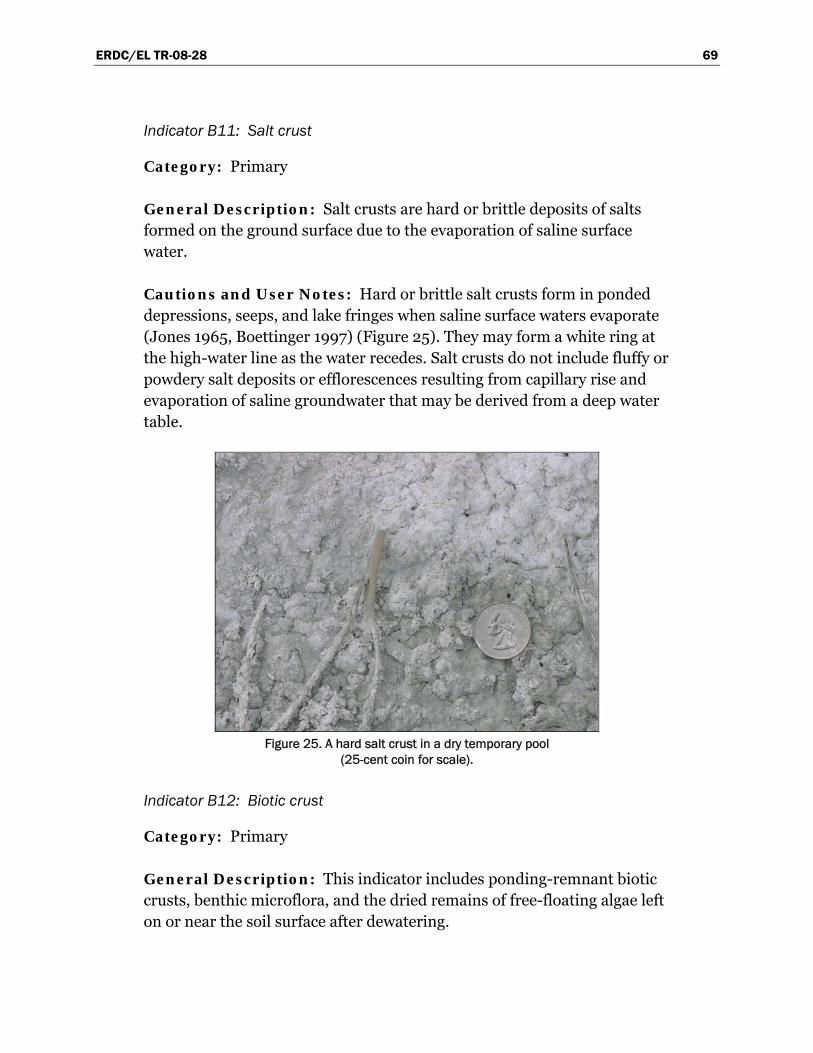
ERDC/EL TR-08-28 69
Indicator B11: Salt crust
Category: Primary
General Description: Salt crusts are hard or brittle deposits of salts formed on the ground surface due to the evaporation of saline surface water.
Cautions and User Notes: Hard or brittle salt crusts form in ponded depressions, seeps, and lake fringes when saline surface waters evaporate (Jones 1965, Boettinger 1997) (Figure 25). They may form a white ring at the high-water line as the water recedes. Salt crusts do not include fluffy or powdery salt deposits or efflorescences resulting from capillary rise and evaporation of saline groundwater that may be derived from a deep water table.
Figure 25. A hard salt crust in a dry temporary pool
(25-cent coin for scale).
Indicator B12: Biotic crust
Category: Primary
General Description: This indicator includes ponding-remnant biotic crusts, benthic microflora, and the dried remains of free-floating algae left on or near the soil surface after dewatering.
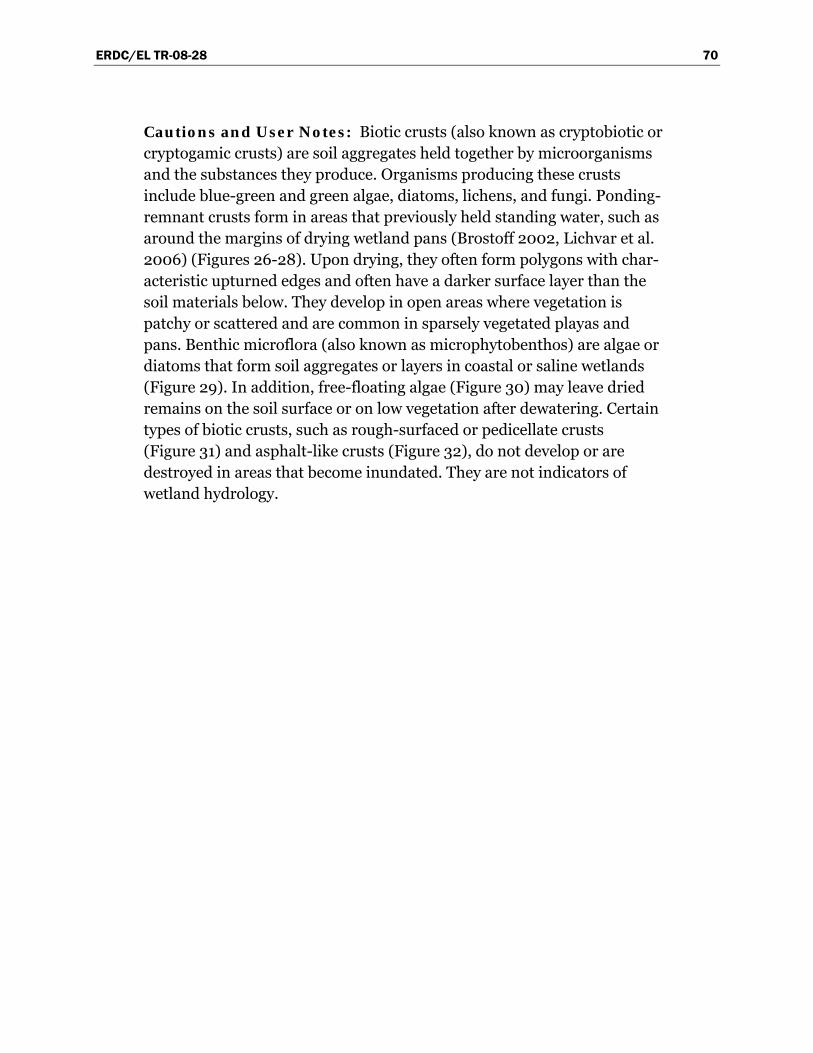
ERDC/EL TR-08-28 70
Cautions and User Notes: Biotic crusts (also known as cryptobiotic or cryptogamic crusts) are soil aggregates held together by microorganisms and the substances they produce. Organisms producing these crusts include blue-green and green algae, diatoms, lichens, and fungi. Ponding-remnant crusts form in areas that previously held standing water, such as around the margins of drying wetland pans (Brostoff 2002, Lichvar et al. 2006) (Figures 26-28). Upon drying, they often form polygons with char-acteristic upturned edges and often have a darker surface layer than the soil materials below. They develop in open areas where vegetation is patchy or scattered and are common in sparsely vegetated playas and pans. Benthic microflora (also known as microphytobenthos) are algae or diatoms that form soil aggregates or layers in coastal or saline wetlands (Figure 29). In addition, free-floating algae (Figure 30) may leave dried remains on the soil surface or on low vegetation after dewatering. Certain types of biotic crusts, such as rough-surfaced or pedicellate crusts (Figure 31) and asphalt-like crusts (Figure 32), do not develop or are destroyed in areas that become inundated. They are not indicators of wetland hydrology.
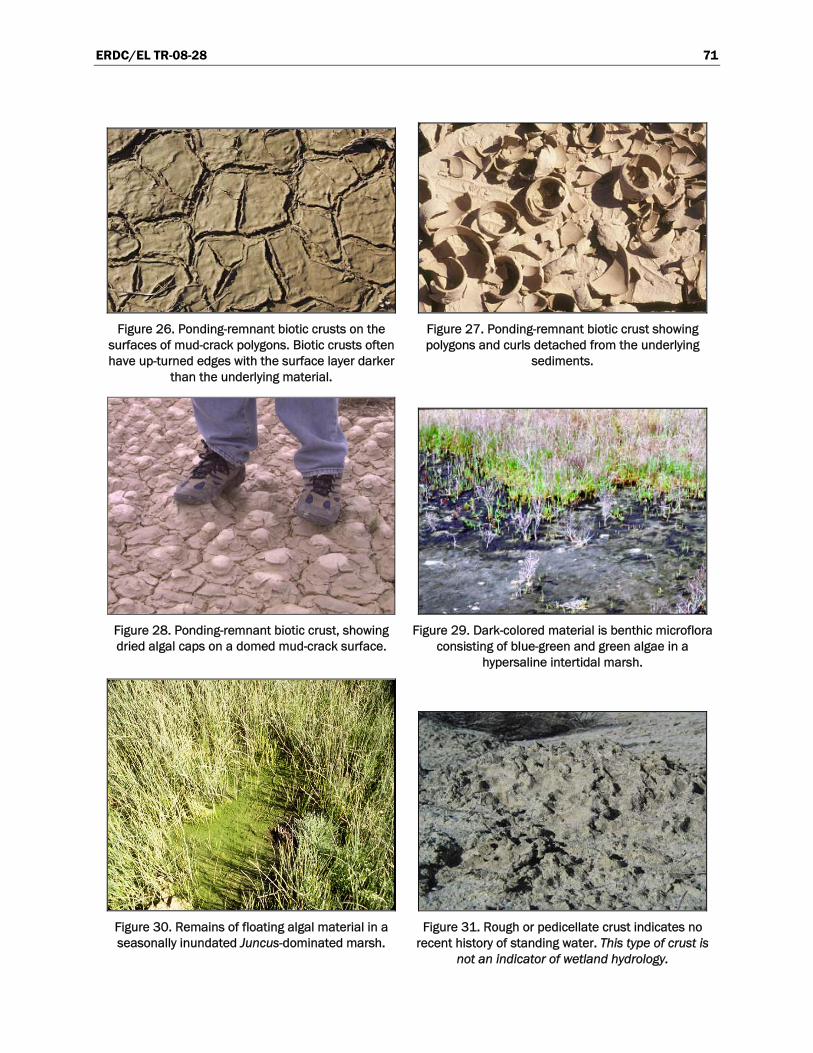
ERDC/EL TR-08-28 71
Figure 26. Ponding-remnant biotic crusts on the
surfaces of mud-crack polygons. Biotic crusts often have up-turned edges with the surface layer darker
than the underlying material.
Figure 27. Ponding-remnant biotic crust showing polygons and curls detached from the underlying
sediments.
Figure 28. Ponding-remnant biotic crust, showing dried algal caps on a domed mud-crack surface.
Figure 29. Dark-colored material is benthic microflora consisting of blue-green and green algae in a
hypersaline intertidal marsh.
Figure 30. Remains of floating algal material in a seasonally inundated Juncus-dominated marsh.
Figure 31. Rough or pedicellate crust indicates no recent history of standing water. This type of crust is
not an indicator of wetland hydrology.
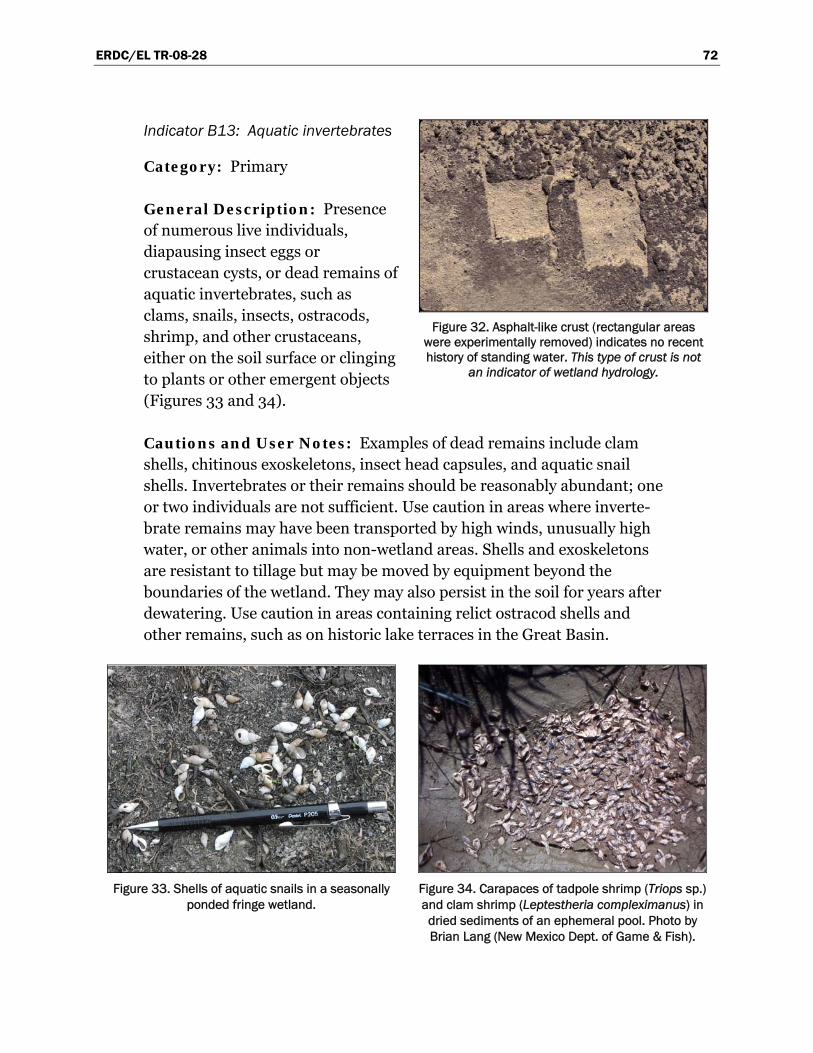
ERDC/EL TR-08-28 72
Indicator B13: Aquatic invertebrates
Category: Primary
General Description: Presence of numerous live individuals, diapausing insect eggs or crustacean cysts, or dead remains of aquatic invertebrates, such as clams, snails, insects, ostracods, shrimp, and other crustaceans, either on the soil surface or clinging to plants or other emergent objects (Figures 33 and 34).
Cautions and User Notes: Examples of dead remains include clam shells, chitinous exoskeletons, insect head capsules, and aquatic snail shells. Invertebrates or their remains should be reasonably abundant; one or two individuals are not sufficient. Use caution in areas where inverte-brate remains may have been transported by high winds, unusually high water, or other animals into non-wetland areas. Shells and exoskeletons are resistant to tillage but may be moved by equipment beyond the boundaries of the wetland. They may also persist in the soil for years after dewatering. Use caution in areas containing relict ostracod shells and other remains, such as on historic lake terraces in the Great Basin.
Figure 33. Shells of aquatic snails in a seasonally
ponded fringe wetland. Figure 34. Carapaces of tadpole shrimp (Triops sp.) and clam shrimp (Leptestheria compleximanus) in dried sediments of an ephemeral pool. Photo by Brian Lang (New Mexico Dept. of Game & Fish).
Figure 32. Asphalt-like crust (rectangular areas were experimentally removed) indicates no recent history of standing water. This type of crust is not
an indicator of wetland hydrology.
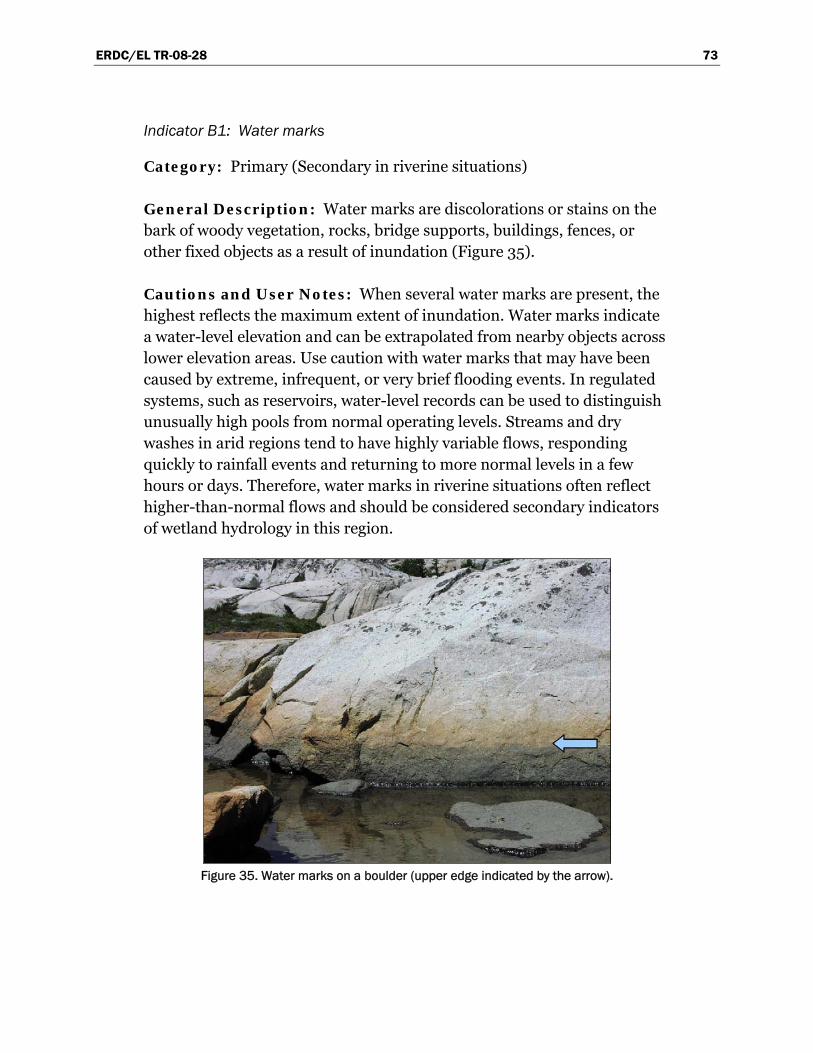
ERDC/EL TR-08-28 73
Indicator B1: Water marks
Category: Primary (Secondary in riverine situations)
General Description: Water marks are discolorations or stains on the bark of woody vegetation, rocks, bridge supports, buildings, fences, or other fixed objects as a result of inundation (Figure 35).
Cautions and User Notes: When several water marks are present, the highest reflects the maximum extent of inundation. Water marks indicate a water-level elevation and can be extrapolated from nearby objects across lower elevation areas. Use caution with water marks that may have been caused by extreme, infrequent, or very brief flooding events. In regulated systems, such as reservoirs, water-level records can be used to distinguish unusually high pools from normal operating levels. Streams and dry washes in arid regions tend to have highly variable flows, responding quickly to rainfall events and returning to more normal levels in a few hours or days. Therefore, water marks in riverine situations often reflect higher-than-normal flows and should be considered secondary indicators of wetland hydrology in this region.
Figure 35. Water marks on a boulder (upper edge indicated by the arrow).
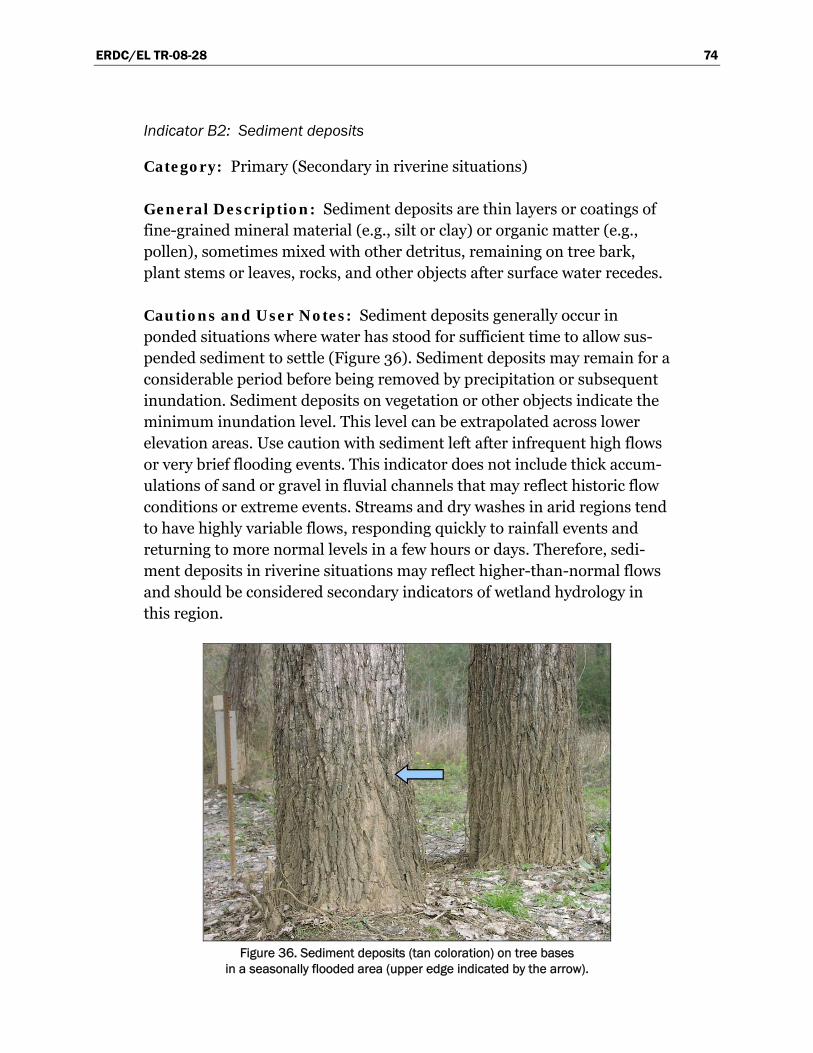
ERDC/EL TR-08-28 74
Indicator B2: Sediment deposits
Category: Primary (Secondary in riverine situations)
General Description: Sediment deposits are thin layers or coatings of fine-grained mineral material (e.g., silt or clay) or organic matter (e.g., pollen), sometimes mixed with other detritus, remaining on tree bark, plant stems or leaves, rocks, and other objects after surface water recedes.
Cautions and User Notes: Sediment deposits generally occur in ponded situations where water has stood for sufficient time to allow sus-pended sediment to settle (Figure 36). Sediment deposits may remain for a considerable period before being removed by precipitation or subsequent inundation. Sediment deposits on vegetation or other objects indicate the minimum inundation level. This level can be extrapolated across lower elevation areas. Use caution with sediment left after infrequent high flows or very brief flooding events. This indicator does not include thick accum-ulations of sand or gravel in fluvial channels that may reflect historic flow conditions or extreme events. Streams and dry washes in arid regions tend to have highly variable flows, responding quickly to rainfall events and returning to more normal levels in a few hours or days. Therefore, sedi-ment deposits in riverine situations may reflect higher-than-normal flows and should be considered secondary indicators of wetland hydrology in this region.
Figure 36. Sediment deposits (tan coloration) on tree bases
in a seasonally flooded area (upper edge indicated by the arrow).
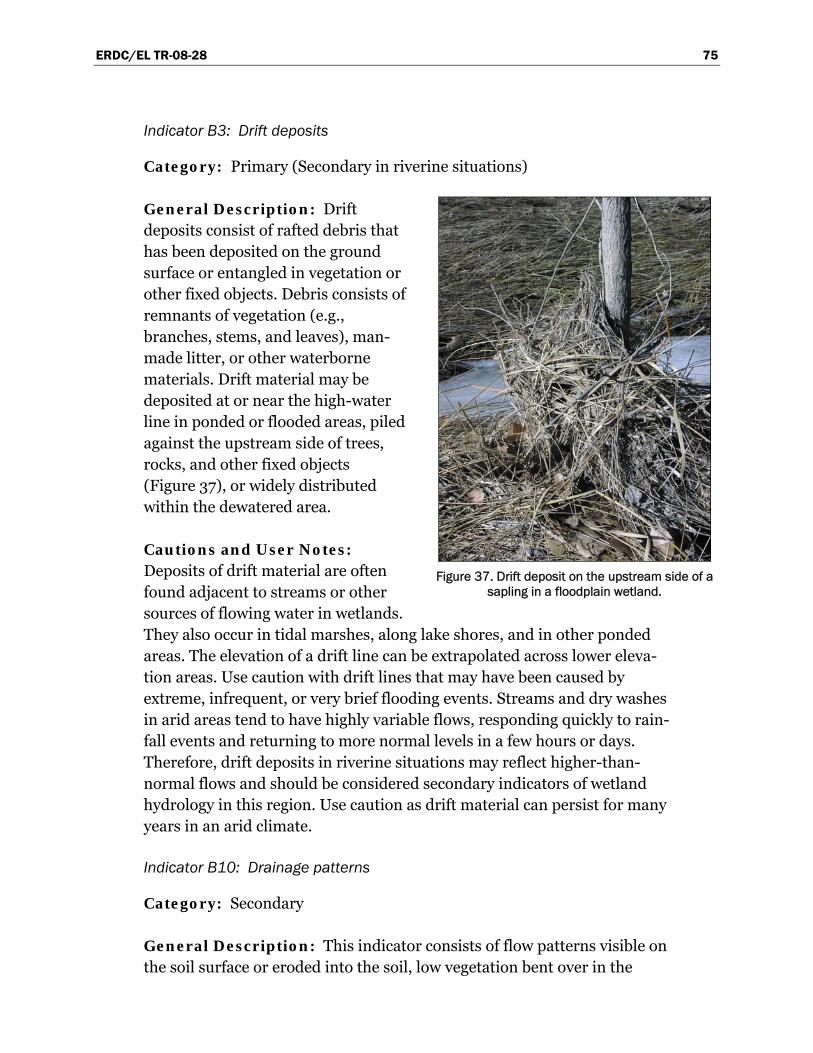
ERDC/EL TR-08-28 75
Indicator B3: Drift deposits
Category: Primary (Secondary in riverine situations)
General Description: Drift deposits consist of rafted debris that has been deposited on the ground surface or entangled in vegetation or other fixed objects. Debris consists of remnants of vegetation (e.g., branches, stems, and leaves), man-made litter, or other waterborne materials. Drift material may be deposited at or near the high-water line in ponded or flooded areas, piled against the upstream side of trees, rocks, and other fixed objects (Figure 37), or widely distributed within the dewatered area.
Cautions and User Notes: Deposits of drift material are often found adjacent to streams or other sources of flowing water in wetlands. They also occur in tidal marshes, along lake shores, and in other ponded areas. The elevation of a drift line can be extrapolated across lower eleva-tion areas. Use caution with drift lines that may have been caused by extreme, infrequent, or very brief flooding events. Streams and dry washes in arid areas tend to have highly variable flows, responding quickly to rain-fall events and returning to more normal levels in a few hours or days. Therefore, drift deposits in riverine situations may reflect higher-than-normal flows and should be considered secondary indicators of wetland hydrology in this region. Use caution as drift material can persist for many years in an arid climate.
Indicator B10: Drainage patterns
Category: Secondary
General Description: This indicator consists of flow patterns visible on the soil surface or eroded into the soil, low vegetation bent over in the
Figure 37. Drift deposit on the upstream side of a sapling in a floodplain wetland.
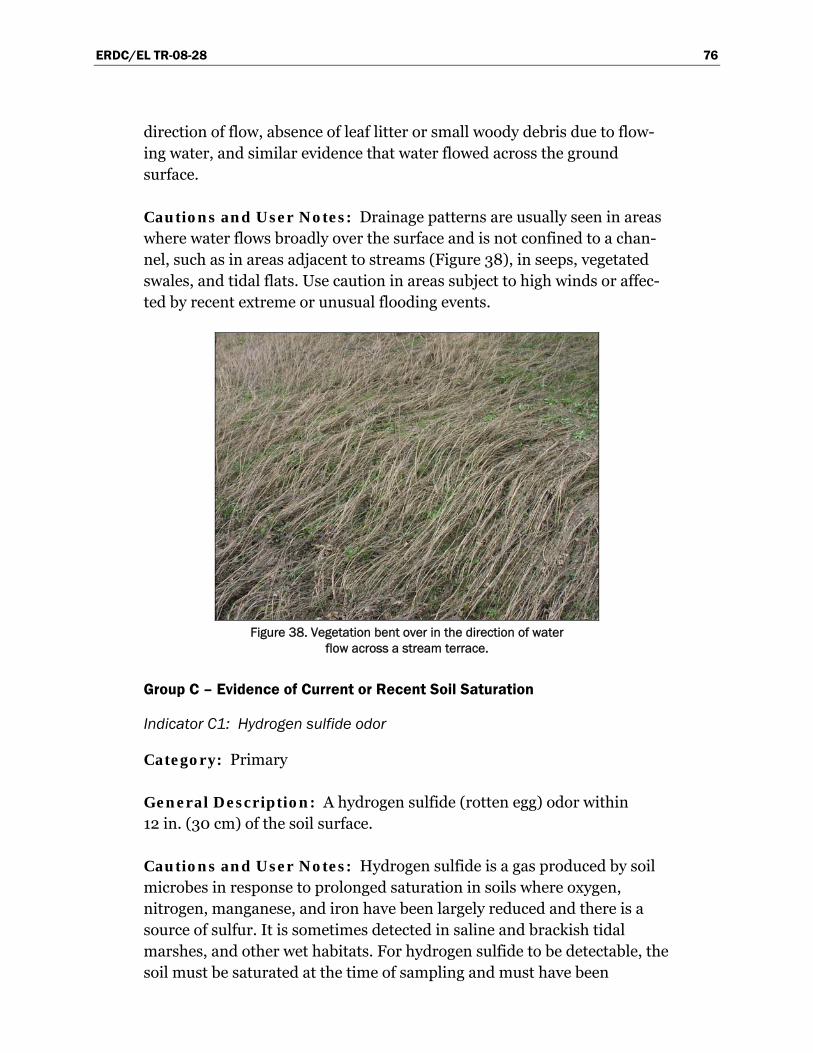
ERDC/EL TR-08-28 76
direction of flow, absence of leaf litter or small woody debris due to flow-ing water, and similar evidence that water flowed across the ground surface.
Cautions and User Notes: Drainage patterns are usually seen in areas where water flows broadly over the surface and is not confined to a chan-nel, such as in areas adjacent to streams (Figure 38), in seeps, vegetated swales, and tidal flats. Use caution in areas subject to high winds or affec-ted by recent extreme or unusual flooding events.
Figure 38. Vegetation bent over in the direction of water
flow across a stream terrace.
Group C – Evidence of Current or Recent Soil Saturation
Indicator C1: Hydrogen sulfide odor
Category: Primary
General Description: A hydrogen sulfide (rotten egg) odor within 12 in. (30 cm) of the soil surface.
Cautions and User Notes: Hydrogen sulfide is a gas produced by soil microbes in response to prolonged saturation in soils where oxygen, nitrogen, manganese, and iron have been largely reduced and there is a source of sulfur. It is sometimes detected in saline and brackish tidal marshes, and other wet habitats. For hydrogen sulfide to be detectable, the soil must be saturated at the time of sampling and must have been
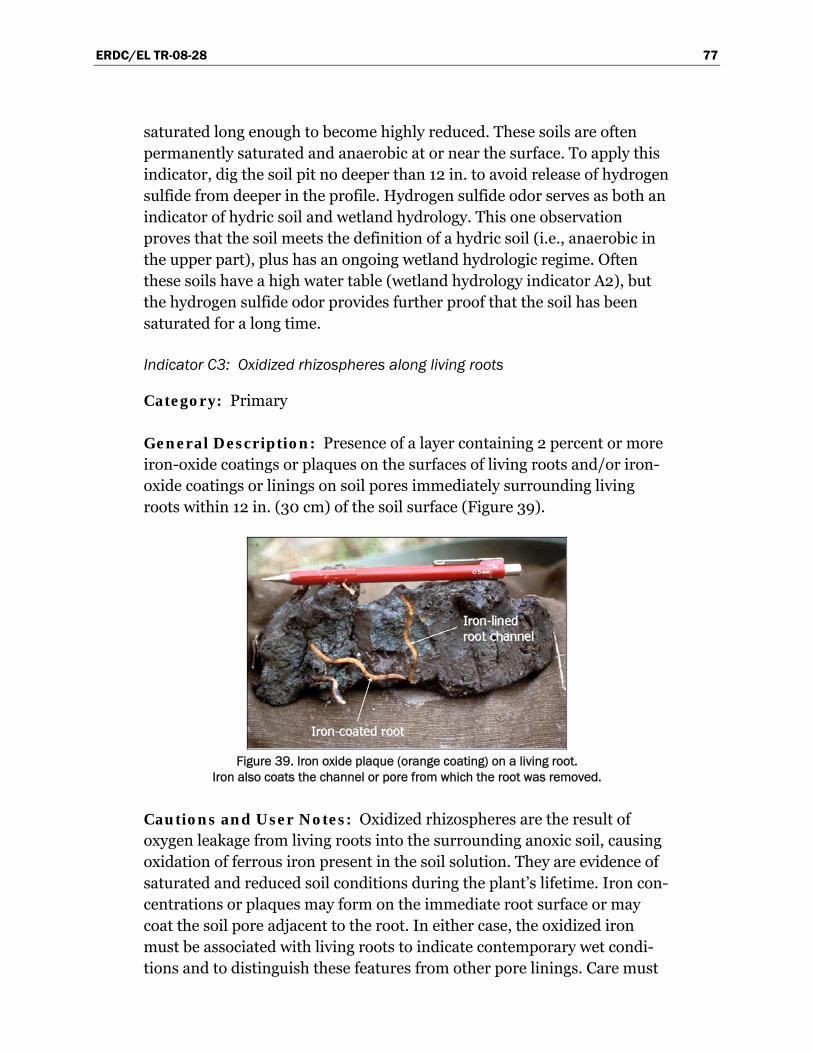
ERDC/EL TR-08-28 77
saturated long enough to become highly reduced. These soils are often permanently saturated and anaerobic at or near the surface. To apply this indicator, dig the soil pit no deeper than 12 in. to avoid release of hydrogen sulfide from deeper in the profile. Hydrogen sulfide odor serves as both an indicator of hydric soil and wetland hydrology. This one observation proves that the soil meets the definition of a hydric soil (i.e., anaerobic in the upper part), plus has an ongoing wetland hydrologic regime. Often these soils have a high water table (wetland hydrology indicator A2), but the hydrogen sulfide odor provides further proof that the soil has been saturated for a long time.
Indicator C3: Oxidized rhizospheres along living roots
Category: Primary
General Description: Presence of a layer containing 2 percent or more iron-oxide coatings or plaques on the surfaces of living roots and/or iron-oxide coatings or linings on soil pores immediately surrounding living roots within 12 in. (30 cm) of the soil surface (Figure 39).
Figure 39. Iron oxide plaque (orange coating) on a living root.
Iron also coats the channel or pore from which the root was removed.
Cautions and User Notes: Oxidized rhizospheres are the result of oxygen leakage from living roots into the surrounding anoxic soil, causing oxidation of ferrous iron present in the soil solution. They are evidence of saturated and reduced soil conditions during the plant’s lifetime. Iron con-centrations or plaques may form on the immediate root surface or may coat the soil pore adjacent to the root. In either case, the oxidized iron must be associated with living roots to indicate contemporary wet condi-tions and to distinguish these features from other pore linings. Care must
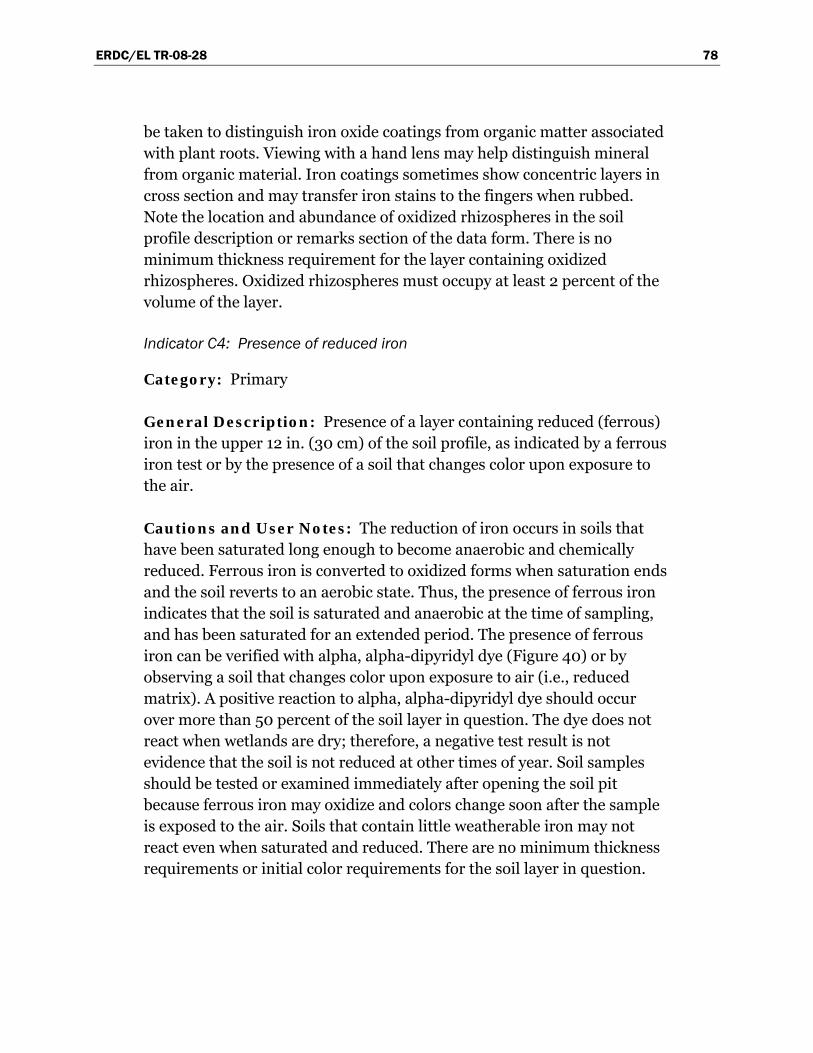
ERDC/EL TR-08-28 78
be taken to distinguish iron oxide coatings from organic matter associated with plant roots. Viewing with a hand lens may help distinguish mineral from organic material. Iron coatings sometimes show concentric layers in cross section and may transfer iron stains to the fingers when rubbed. Note the location and abundance of oxidized rhizospheres in the soil profile description or remarks section of the data form. There is no minimum thickness requirement for the layer containing oxidized rhizospheres. Oxidized rhizospheres must occupy at least 2 percent of the volume of the layer.
Indicator C4: Presence of reduced iron
Category: Primary
General Description: Presence of a layer containing reduced (ferrous) iron in the upper 12 in. (30 cm) of the soil profile, as indicated by a ferrous iron test or by the presence of a soil that changes color upon exposure to the air.
Cautions and User Notes: The reduction of iron occurs in soils that have been saturated long enough to become anaerobic and chemically reduced. Ferrous iron is converted to oxidized forms when saturation ends and the soil reverts to an aerobic state. Thus, the presence of ferrous iron indicates that the soil is saturated and anaerobic at the time of sampling, and has been saturated for an extended period. The presence of ferrous iron can be verified with alpha, alpha-dipyridyl dye (Figure 40) or by observing a soil that changes color upon exposure to air (i.e., reduced matrix). A positive reaction to alpha, alpha-dipyridyl dye should occur over more than 50 percent of the soil layer in question. The dye does not react when wetlands are dry; therefore, a negative test result is not evidence that the soil is not reduced at other times of year. Soil samples should be tested or examined immediately after opening the soil pit because ferrous iron may oxidize and colors change soon after the sample is exposed to the air. Soils that contain little weatherable iron may not react even when saturated and reduced. There are no minimum thickness requirements or initial color requirements for the soil layer in question.
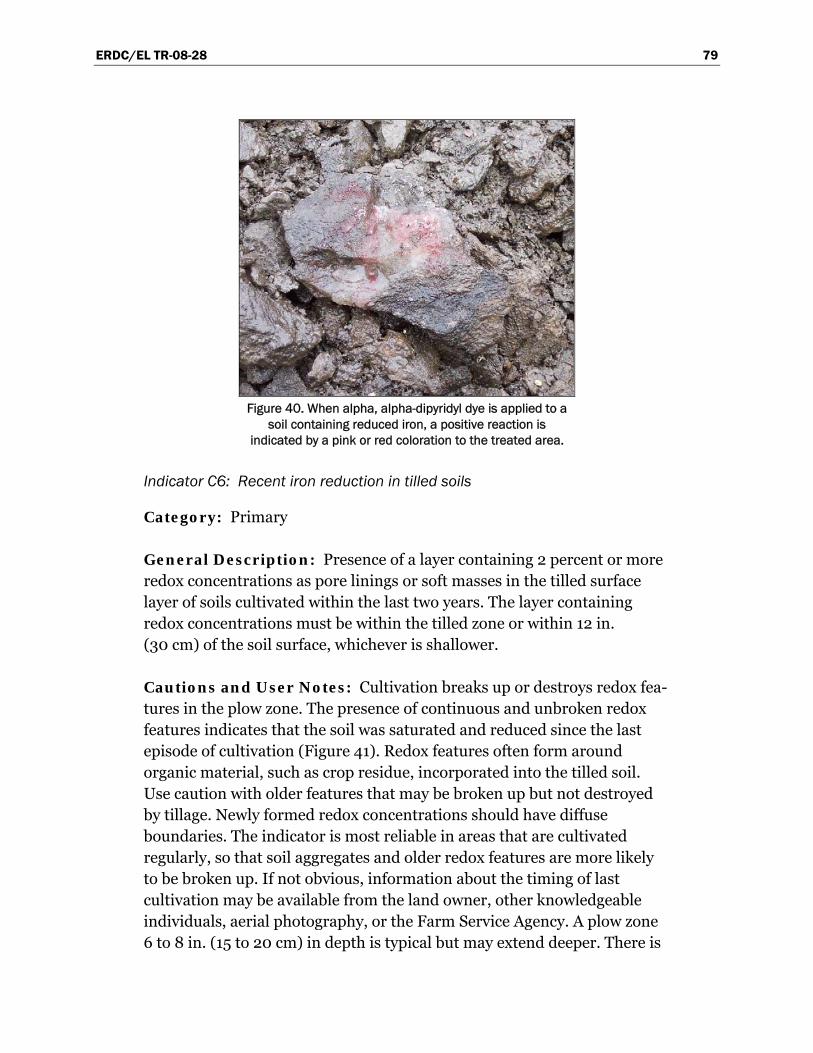
ERDC/EL TR-08-28 79
Figure 40. When alpha, alpha-dipyridyl dye is applied to a
soil containing reduced iron, a positive reaction is indicated by a pink or red coloration to the treated area.
Indicator C6: Recent iron reduction in tilled soils
Category: Primary
General Description: Presence of a layer containing 2 percent or more redox concentrations as pore linings or soft masses in the tilled surface layer of soils cultivated within the last two years. The layer containing redox concentrations must be within the tilled zone or within 12 in. (30 cm) of the soil surface, whichever is shallower.
Cautions and User Notes: Cultivation breaks up or destroys redox fea-tures in the plow zone. The presence of continuous and unbroken redox features indicates that the soil was saturated and reduced since the last episode of cultivation (Figure 41). Redox features often form around organic material, such as crop residue, incorporated into the tilled soil. Use caution with older features that may be broken up but not destroyed by tillage. Newly formed redox concentrations should have diffuse boundaries. The indicator is most reliable in areas that are cultivated regularly, so that soil aggregates and older redox features are more likely to be broken up. If not obvious, information about the timing of last cultivation may be available from the land owner, other knowledgeable individuals, aerial photography, or the Farm Service Agency. A plow zone 6 to 8 in. (15 to 20 cm) in depth is typical but may extend deeper. There is
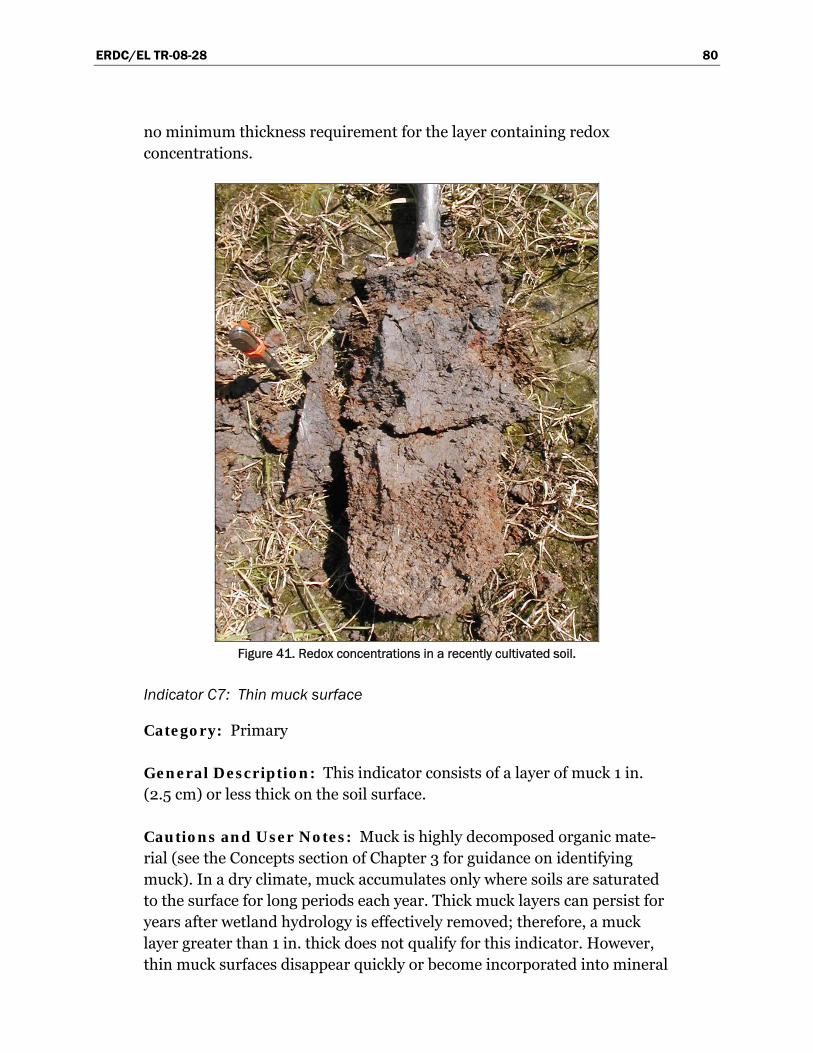
ERDC/EL TR-08-28 80
no minimum thickness requirement for the layer containing redox concentrations.
Figure 41. Redox concentrations in a recently cultivated soil.
Indicator C7: Thin muck surface
Category: Primary
General Description: This indicator consists of a layer of muck 1 in. (2.5 cm) or less thick on the soil surface.
Cautions and User Notes: Muck is highly decomposed organic mate-rial (see the Concepts section of Chapter 3 for guidance on identifying muck). In a dry climate, muck accumulates only where soils are saturated to the surface for long periods each year. Thick muck layers can persist for years after wetland hydrology is effectively removed; therefore, a muck layer greater than 1 in. thick does not qualify for this indicator. However, thin muck surfaces disappear quickly or become incorporated into mineral

ERDC/EL TR-08-28 81
horizons when wetland hydrology is withdrawn. Therefore, the presence of a thin muck layer on the soil surface indicates an active wetland hydrologic regime.
Indicator C2: Dry-season water table
Category: Secondary
General Description: Visual observation of the water table between 12 and 24 in. (30 and 60 cm) below the surface during the normal dry season or during a drier-than-normal year.
Cautions and User Notes: Due to normal seasonal fluctuations, water tables in wetlands often drop below 12 in. during the summer dry season. A water table between 12 and 24 in. during the dry season, or during an unusually dry year, indicates a normal wet-season water table within 12 in. of the surface. Sufficient time must be allowed for water to infiltrate into a newly dug hole and to stabilize at the water-table level. The required time will vary depending upon soil texture. In some cases, the water table can be determined by examining the wall of the soil pit and identifying the upper level at which water is seeping into the pit. For an accurate deter-mination of the water-table level, the soil pit, auger hole, or well should not penetrate any restrictive soil layer capable of perching water near the surface. Water tables in wetlands often drop well below 24 in. during dry periods. Therefore, a dry-season water table below 24 in. does not neces-sarily indicate a lack of wetland hydrology. See Chapter 5 (section on Wetlands that Periodically Lack Indicators of Wetland Hydrology) for determining average dry-season dates and drought periods.
Indicator C8: Crayfish burrows
Category: Secondary
General Description: Presence of crayfish burrows, as indicated by openings in soft ground up to 2 in. (5 cm) in diameter, often surrounded by chimney-like mounds of excavated mud.
Cautions and User Notes: Both native and introduced crayfishes are found in the Arid West. Crayfish breathe with gills and require at least per-iodic contact with water. Some species dig burrows for refuge and breed-ing (Figure 42). Crayfish burrows are usually found near streams, ditches,
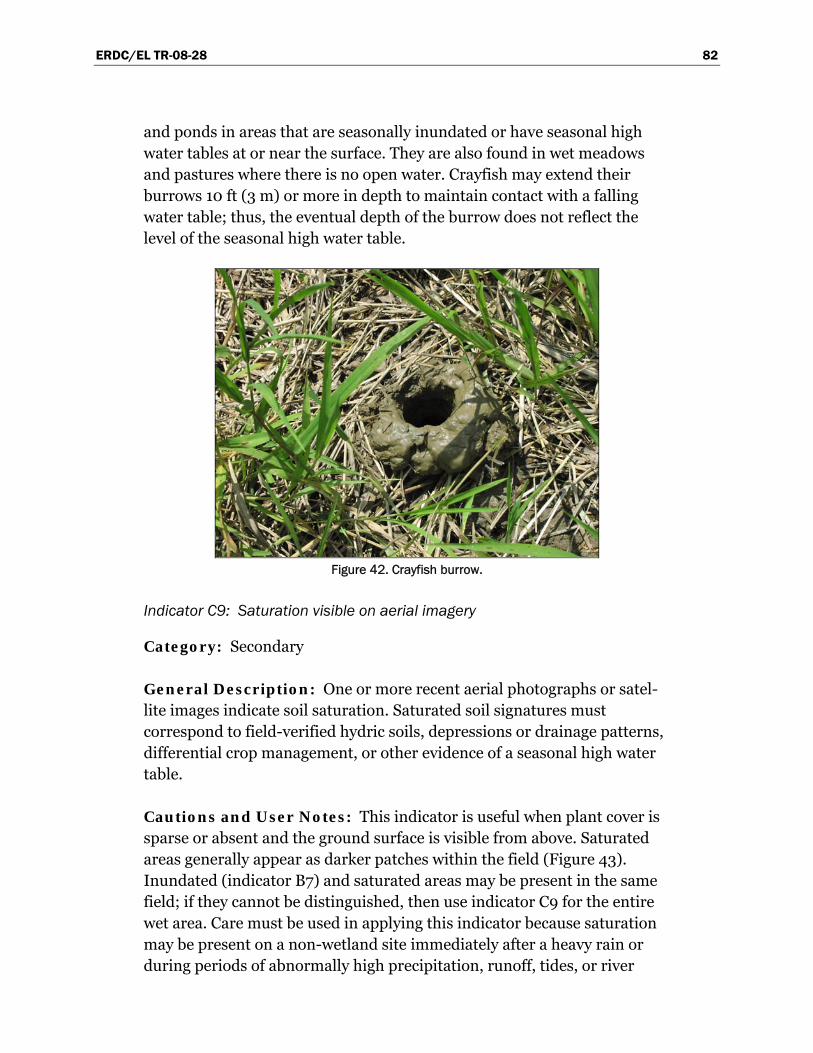
ERDC/EL TR-08-28 82
and ponds in areas that are seasonally inundated or have seasonal high water tables at or near the surface. They are also found in wet meadows and pastures where there is no open water. Crayfish may extend their burrows 10 ft (3 m) or more in depth to maintain contact with a falling water table; thus, the eventual depth of the burrow does not reflect the level of the seasonal high water table.
Figure 42. Crayfish burrow.
Indicator C9: Saturation visible on aerial imagery
Category: Secondary
General Description: One or more recent aerial photographs or satel-lite images indicate soil saturation. Saturated soil signatures must correspond to field-verified hydric soils, depressions or drainage patterns, differential crop management, or other evidence of a seasonal high water table.
Cautions and User Notes: This indicator is useful when plant cover is sparse or absent and the ground surface is visible from above. Saturated areas generally appear as darker patches within the field (Figure 43). Inundated (indicator B7) and saturated areas may be present in the same field; if they cannot be distinguished, then use indicator C9 for the entire wet area. Care must be used in applying this indicator because saturation may be present on a non-wetland site immediately after a heavy rain or during periods of abnormally high precipitation, runoff, tides, or river
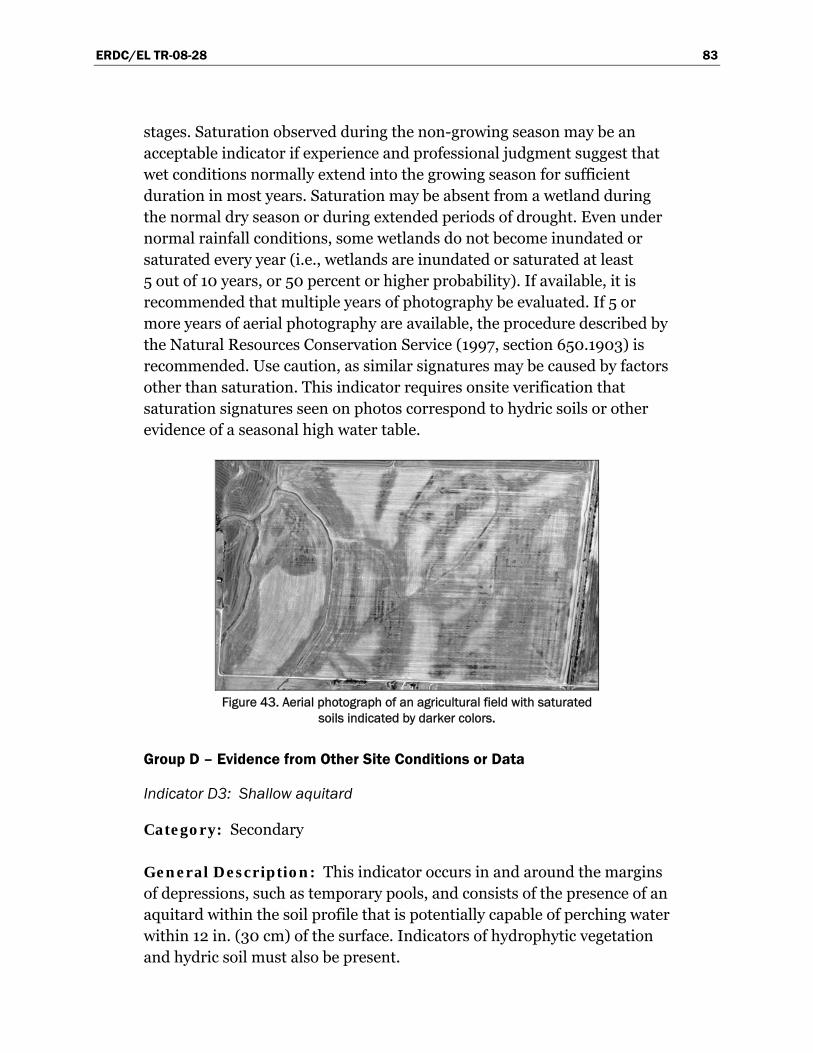
ERDC/EL TR-08-28 83
stages. Saturation observed during the non-growing season may be an acceptable indicator if experience and professional judgment suggest that wet conditions normally extend into the growing season for sufficient duration in most years. Saturation may be absent from a wetland during the normal dry season or during extended periods of drought. Even under normal rainfall conditions, some wetlands do not become inundated or saturated every year (i.e., wetlands are inundated or saturated at least 5 out of 10 years, or 50 percent or higher probability). If available, it is recommended that multiple years of photography be evaluated. If 5 or more years of aerial photography are available, the procedure described by the Natural Resources Conservation Service (1997, section 650.1903) is recommended. Use caution, as similar signatures may be caused by factors other than saturation. This indicator requires onsite verification that saturation signatures seen on photos correspond to hydric soils or other evidence of a seasonal high water table.
Figure 43. Aerial photograph of an agricultural field with saturated
soils indicated by darker colors.
Group D – Evidence from Other Site Conditions or Data
Indicator D3: Shallow aquitard
Category: Secondary
General Description: This indicator occurs in and around the margins of depressions, such as temporary pools, and consists of the presence of an aquitard within the soil profile that is potentially capable of perching water within 12 in. (30 cm) of the surface. Indicators of hydrophytic vegetation and hydric soil must also be present.
ERDC/EL TR-08-28 84
Cautions and User Notes: An aquitard is a relatively impermeable soil layer or bedrock that slows the downward infiltration of water and can produce a perched water table, generally in flat or depressional landforms. In some cases, the aquitard may be at the surface and cause water to pond on the surface. Potential aquitards include fragipans, cemented layers, dense glacial till, lacustrine deposits, and clay layers, and can often be identified by the lack of root penetration through the layer. Redoximorphic features often are evident in the layer(s) above the aquitard. Local experience and professional judgment should indicate that the perched water table is likely to occur during the growing season for sufficient duration in most years.
Indicator D5: FAC-neutral test
Category: Secondary
General Description: The plant community passes the FAC-neutral test.
Cautions and User Notes: The FAC-neutral test is performed by com-piling a list of dominant plant species across all strata in the community, and dropping from the list any species with a Facultative indicator status (i.e., FAC, FAC–, and FAC+). The FAC-neutral test is met if more than 50 percent of the remaining dominant species are rated FACW and/or OBL. This indicator may be used in communities that contain no FAC dominants. If there are an equal number of dominants that are OBL and FACW versus FACU and UPL, nondominant species should be considered. This indicator is only applicable to wetland hydrology determinations.
ERDC/EL TR-08-28 85
5 Difficult Wetland Situations in the Arid West
Introduction
Some wetlands can be difficult to identify because wetland indicators may be missing due to natural processes or recent disturbances. This chapter provides guidance for making wetland determinations in difficult-to-identify wetland situations in the Arid West. It includes regional examples of problem area wetlands and atypical situations as defined in the Corps Manual, as well as other situations that can make wetland delineation more challenging. Problem area wetlands are naturally occurring wetland types that lack indicators of hydrophytic vegetation, hydric soil, or wetland hydrology periodically due to normal seasonal or annual variability, or permanently due to the nature of the soils or plant species on the site. Atypical situations are wetlands in which vegetation, soil, or hydrology indicators are absent due to recent human activities or natural events. The chapter is organized into the following sections:
• Problematic Hydrophytic Vegetation • Problematic Hydric Soils • Wetlands that Periodically Lack Indicators of Wetland Hydrology
The list of difficult wetland situations presented in this chapter is not intended to be exhaustive and other such situations may exist in the region. See the Corps Manual for general guidance. Furthermore, more than one wetland factor (i.e., vegetation, soil, and/or hydrology) may be disturbed or problematic on a given site. In general, wetland determinations on difficult or problematic sites must be based on the best information available to the field inspector, interpreted in light of his or her professional experience and knowledge of the ecology of wetlands in the region.
Problematic hydrophytic vegetation
Description of the problem
Many factors affect the structure and composition of plant communities in the Arid West, including climatic variability, ephemeral water sources,
ERDC/EL TR-08-28 86
saline soils, and human land-use practices. As a result, some wetlands may exhibit indicators of hydric soil and wetland hydrology but lack any of the hydrophytic vegetation indicators presented in Chapter 2, at least at cer-tain times. To identify and delineate these wetlands may require special procedures or additional analysis of factors affecting the site. To the extent possible, the hydrophytic vegetation decision should be based on the plant community that is normally present during the wet portion of the growing season in a normal rainfall year. The following procedure addresses sev-eral examples of problematic vegetation situations in the Arid West.
Procedure
Problematic hydrophytic vegetation can be identified and delineated using a combination of observations made in the field and/or supplemental information from the scientific literature and other sources. These pro-cedures should be applied only where indicators of hydric soil and wetland hydrology are present, unless one or both of these factors is also disturbed or problematic, but no indicators of hydrophytic vegetation are evident. The following procedures are recommended:
1. Verify that at least one indicator of hydric soil and one primary or two secondary indicators of wetland hydrology are present. If indicators of either hydric soil or wetland hydrology are absent, the area is likely non-wetland unless soil and/or hydrology are also disturbed or problematic. If indicators of hydric soil and wetland hydrology are present (or are absent due to disturbance or other problem situations), proceed to step 2.
2. Verify that the area is in a landscape position that is likely to collect or concentrate water. Appropriate settings are listed below. If the landscape setting is appropriate, proceed to step 3.
a. Concave surface (e.g., depression or swale). b. Floodplain. c. Level or nearly level area (e.g., 0- to 3-percent slope). d. Toe slope or an area of convergent slopes. e. Fringe of another wetland or water body. f. Area with a restrictive soil layer or aquitard within 24 in. (60 cm) of the
surface. g. Area where groundwater discharges (e.g., a seep). h. Other (explain in field notes why this area is likely to be inundated or
saturated for long periods).
ERDC/EL TR-08-28 87
3. Use one or more of the approaches described in step 4 (Specific Problematic Vegetation Situations below) or step 5 (General Approaches to Problematic Hydrophytic Vegetation on page 94) to determine whether the vegetation is hydrophytic. In the remarks section of the data form or in the delineation report, explain the rationale for concluding that the plant community is hydrophytic even though indicators of hydrophytic vegetation described in Chapter 2 were not observed.
4. Specific Problematic Vegetation Situations:
a. Temporal shifts in vegetation. As described in Chapter 2, the species composition of some wetland plant communities in the Arid West can change in response to seasonal weather patterns and long-term climatic fluctuations. Wetland types that are influenced by these shifts include vernal pools, playa edges, seeps, and springs. Lack of hydro-phytic vegetation during dry periods should not immediately eliminate a site from further consideration as a wetland. A site qualifies for fur-ther consideration if the plant community at the time of sampling does not exhibit hydrophytic vegetation indicators, but indicators of hydric soil and wetland hydrology are present. The following sampling and analytical approaches are recommended in these situations:
(1) Seasonal Shifts in Plant Communities:
(a) If possible, return to the site during the normal wet portion of the growing season and re-examine the site for indicators of hydrophytic vegetation.
(b) Examine the site for identifiable plant remains, either alive or dead, or other evidence that the plant community that was present during the normal wet portion of the growing season was hydrophytic.
(c) Use off-site data sources to determine whether the plant com-munity that is normally present during the wet portion of the growing season is hydrophytic. Appropriate data sources include early growing season aerial photography, NWI maps, soil survey reports, remotely sensed data, public interviews, and previous reports about the site. If necessary, re-examine the site at a later date to verify the hydrophytic vegetation determination.

ERDC/EL TR-08-28 88
(d) If the vegetation on the site is substantially the same as that on a wetland reference site having similar soils, landscape position, and known wetland hydrology, then consider the vegetation to be hydrophytic (see step 5b in this procedure (page 95) for more information).
(2) Drought Conditions (lasting more than one growing season):
(a) Investigate climate records (e.g., WETS tables, drought indices) to determine if the area is under the influence of a drought (for more information, see the section on “Wetlands that Periodic-ally Lack Indicators of Wetland Hydrology” later in this chap-ter). If so, evaluate any offsite data that provide information on the plant community that exists on the site during normal years, including aerial photography, NWI maps, other remote sensing data, soil survey reports, public interviews, and previous site reports. Determine whether the vegetation that is present dur-ing normal years is hydrophytic.
(b) If the vegetation on the drought-affected site is substantially the same as that on a wetland reference site in the same general area having similar soils and known wetland hydrology, then consider the vegetation to be hydrophytic (see step 5b (page 95) in this procedure).
b. Sparse and patchy vegetation. Many wetlands in the Arid West have
sparse or patchy vegetation cover. Examples include some playas, clay pans, and saline wetlands that may be influenced by seasonal ponding of water or discharge of groundwater along their edges. These areas may have indicators of hydric soils and wetland hydrology, but the vegetation is not continuous across or along the boundary of the wet-land. Delineation of these areas can be confusing due to the intersper-sion of wetlands and other potential waters of the United States. For delineation purposes, an area should be considered vegetated (and a potential wetland) if there is 5 percent or more areal cover of plants at the peak of the growing season. Unvegetated areas have less than 5 percent plant cover. Patchy vegetation is a mosaic of both vegetated and unvegetated areas (Figure 44). In some cases, the unvegetated portions of a site may be considered as other waters of the United States if they exhibit ordinary high water (OHW) indicators (33 CFR 328.3). Approved OHW indicators may be available from the
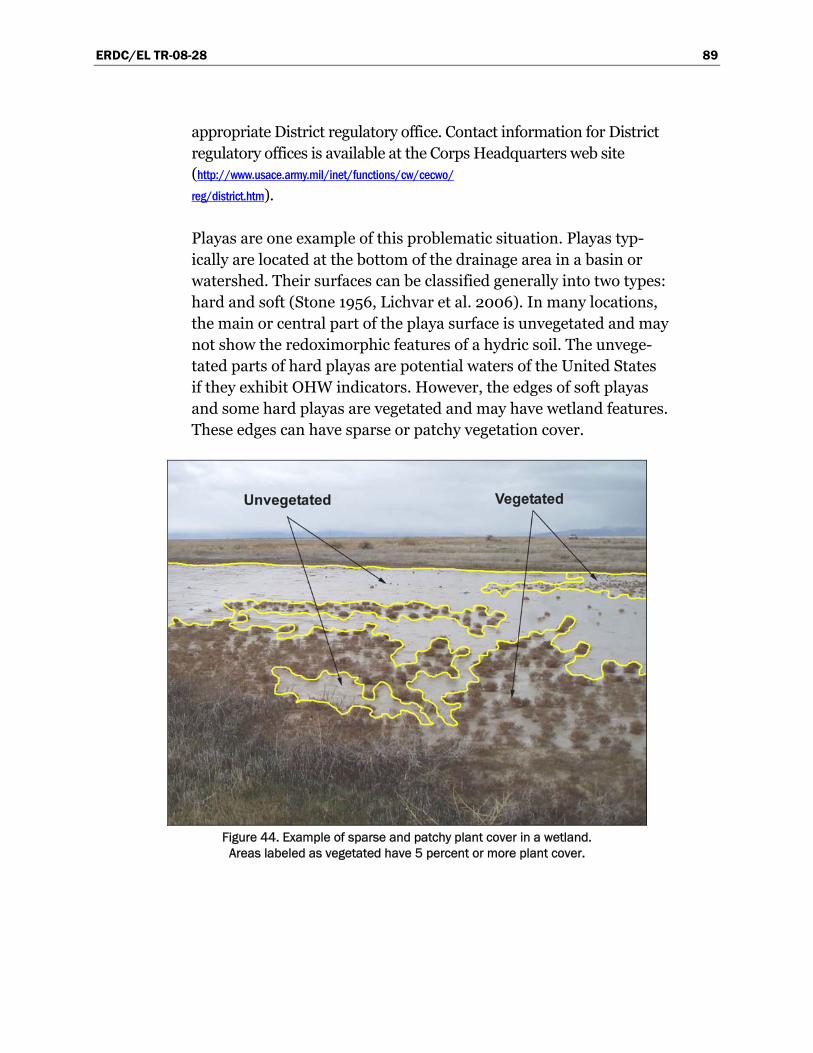
ERDC/EL TR-08-28 89
appropriate District regulatory office. Contact information for District regulatory offices is available at the Corps Headquarters web site (http://www.usace.army.mil/inet/functions/cw/cecwo/ reg/district.htm).
Playas are one example of this problematic situation. Playas typ-ically are located at the bottom of the drainage area in a basin or watershed. Their surfaces can be classified generally into two types: hard and soft (Stone 1956, Lichvar et al. 2006). In many locations, the main or central part of the playa surface is unvegetated and may not show the redoximorphic features of a hydric soil. The unvege-tated parts of hard playas are potential waters of the United States if they exhibit OHW indicators. However, the edges of soft playas and some hard playas are vegetated and may have wetland features. These edges can have sparse or patchy vegetation cover.
Figure 44. Example of sparse and patchy plant cover in a wetland.
Areas labeled as vegetated have 5 percent or more plant cover.
ERDC/EL TR-08-28 90
The following procedure is recommended in these situations:
(1) Develop a site map showing the vegetated and unvegetated areas of concern. Sampling points should be placed in representative loca-tions within both the vegetated and unvegetated areas.
(2) In the vegetated areas (i.e., 5 percent or more plant cover), begin by using the standard three-factor approach for identifying wetlands. If indicators of hydrophytic vegetation, hydric soil, and wetland hydrology are present, then these areas are wetlands. Use caution when vegetation, soils, or hydrology are problematic.
(3) In unvegetated areas (less than 5 percent plant cover), and in vegetated areas that fail the three-factor wetland test, examine the site for OHW indicators. If OHW indicators are present, these areas should be identified as potential non-wetland waters of the United States.
(4) If present, identify any unvegetated areas that lack OHW indicators but have indicators of hydric soil and wetland hydrology. These areas should be included in the delineation if they are part of a mosaic with vegetated wetlands and other waters.
(5) The final delineation should encompass (a) all vegetated areas determined to be wetlands (i.e., indicators of hydrophytic vege-tation, hydric soil, and wetland hydrology are present), (b) areas that are potential other waters of the United States (i.e., OHW indicators are present), and (c) interspersed areas that are unvege-tated but have indicators of hydric soils and wetland hydrology.
c. Riparian areas. Riparian ecosystems are highly variable across the
Arid West, and can contain both wetland and non-wetland components. Riparian corridors can be lined with hydrophytic vegeta-tion, upland vegetation, unvegetated areas, or a mosaic of these types. Soils may lack hydric soil indicators in recently deposited materials (i.e., Entisols) even when indicators of hydrophytic vegetation and wetland hydrology are present. Surface hydrology can vary from perennial to intermittent and, after a flooding event, water tables can drop quickly to low levels. Therefore, wetland delineation in western riparian areas is often a challenge and should consider the potential interspersion of wetlands and other potential waters of the United States. In addition, many riparian areas contain remnant stands of tree species that may have germinated during unusually high water events or under wetter conditions than currently exist at the site (Figure 45).
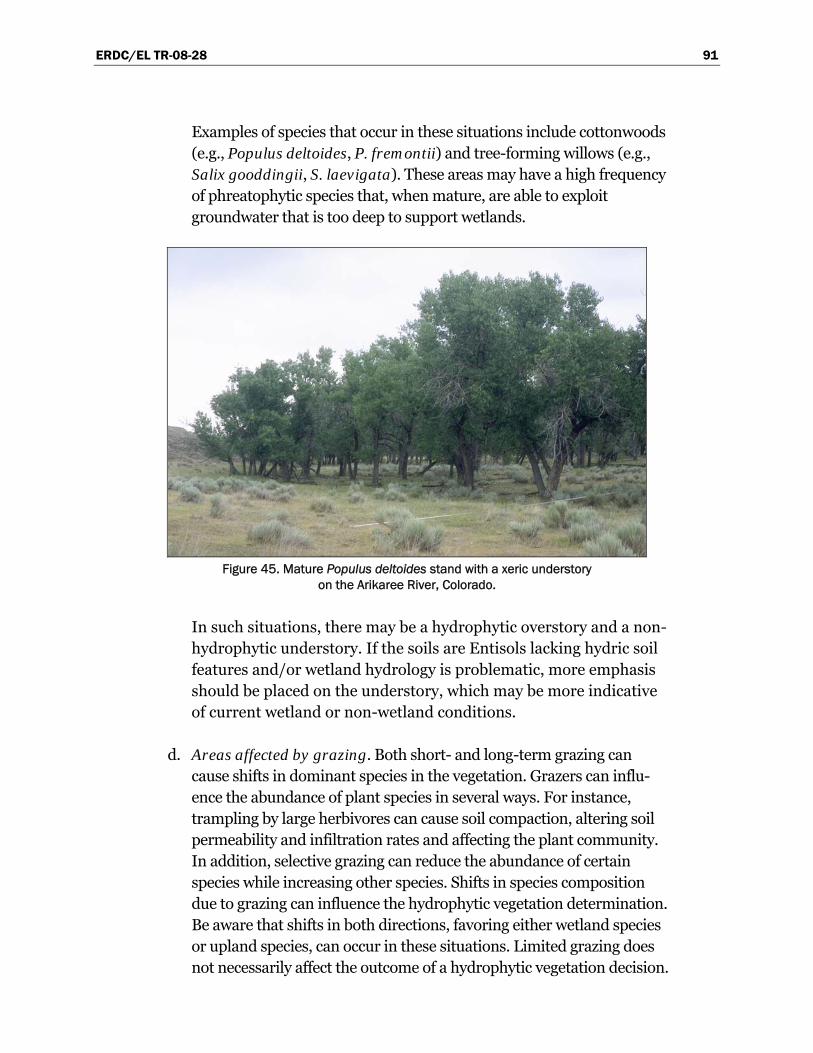
ERDC/EL TR-08-28 91
Examples of species that occur in these situations include cottonwoods (e.g., Populus deltoides, P. fremontii) and tree-forming willows (e.g., Salix gooddingii, S. laevigata). These areas may have a high frequency of phreatophytic species that, when mature, are able to exploit groundwater that is too deep to support wetlands.
Figure 45. Mature Populus deltoides stand with a xeric understory
on the Arikaree River, Colorado.
In such situations, there may be a hydrophytic overstory and a non-hydrophytic understory. If the soils are Entisols lacking hydric soil features and/or wetland hydrology is problematic, more emphasis should be placed on the understory, which may be more indicative of current wetland or non-wetland conditions.
d. Areas affected by grazing. Both short- and long-term grazing can cause shifts in dominant species in the vegetation. Grazers can influ-ence the abundance of plant species in several ways. For instance, trampling by large herbivores can cause soil compaction, altering soil permeability and infiltration rates and affecting the plant community. In addition, selective grazing can reduce the abundance of certain species while increasing other species. Shifts in species composition due to grazing can influence the hydrophytic vegetation determination. Be aware that shifts in both directions, favoring either wetland species or upland species, can occur in these situations. Limited grazing does not necessarily affect the outcome of a hydrophytic vegetation decision.
ERDC/EL TR-08-28 92
However, the following procedure is recommended in cases where the hydrophytic vegetation determination would be unreliable or mis-leading due to the effects of grazing.
(1) Examine the vegetation on a nearby, ungrazed reference site having
similar soils and hydrologic conditions. Ungrazed areas may be present on adjacent properties or in fenced exclosures or stream-side management zones. If soils and hydrology are comparable, assume that the same plant community would exist on the grazed site in the absence of grazing.
(2) If feasible, remove livestock or fence representative livestock exclu-sion areas to allow the vegetation time to recover from grazing, and reevaluate the vegetation during the next growing season.
(3) If an appropriate ungrazed area cannot be located or if the ungrazed vegetation condition cannot be determined, make the wetland determination based on indicators of hydric soil and wetland hydrology.
e. Managed plant communities. Many natural plant communities
throughout the Arid West have been altered and are managed to meet human goals. Examples include clearing of woody vegetation on range-lands, periodic disking or plowing, mowing, planting of native and non-native species (including cultivars or planted species that have escaped and become established on other sites), irrigation of pastures and hayfields, suppression of wildfires, and the use of herbicides. These actions can result in elimination of certain species and their replace-ment with other species, changes in abundance of certain plants, and shifts in dominant species, possibly influencing a hydrophytic vegeta-tion determination. The following procedure is recommended if the natural vegetation has been altered through management to such an extent that a hydrophytic vegetation determination may be unreliable:
(1) Examine the vegetation on a nearby, unmanaged reference site
having similar soils and hydrologic conditions. Assume that the same plant community would exist on the managed site in the absence of human alteration.
(2) For recently cleared or plowed areas (not planted or seeded), leave representative areas unmanaged for at least one growing season with normal rainfall and reevaluate the vegetation.
ERDC/EL TR-08-28 93
(3) If management was initiated recently, use offsite data sources such as aerial photography, NWI maps, and interviews with the land owner and other persons familiar with the area to determine what plant community was present on the site before the management occurred.
(4) If the unmanaged vegetation condition cannot be determined, make the wetland determination based on indicators of hydric soil and wetland hydrology.
f. Areas affected by fires, floods, and other natural disturbances. Wild-
fires, floods, and other catastrophic disturbances can dramatically alter the vegetation on a site. Vegetation can be completely or partially removed, or its composition altered, depending upon the intensity of the disturbance. Limited disturbance does not necessarily affect the investigator’s ability to determine whether the plant community is or is not hydrophytic. However, if the vegetation on a site has been removed or made unidentifiable by a recent fire, flood, or other disturbance, then one or more of the following procedures may be used to deter-mine whether the vegetation present before the disturbance was hydrophytic. Additional guidance can be found in Part IV, Section F (Atypical Situations) of the Corps Manual.
(1) Examine the vegetation on a nearby, undisturbed reference site
having similar soils and hydrologic conditions. Assume that the same plant community would exist on the disturbed site in the absence of disturbance.
(2) Use offsite information sources such as aerial photography, NWI maps, and public interviews to determine the plant community present on the site before the disturbance.
(3) If the undisturbed vegetation condition cannot be determined, make the wetland determination based on indicators of hydric soil and wetland hydrology.
g. Vigor and stress responses to wetland conditions. Plant responses to
wet site conditions are often easily observable. Many plants develop stress-related features, such as stunting in agricultural crops and browning or yellowing of native or planted vegetation, when subjected to long periods of soil saturation in the root zone. Crop stress in wet agricultural fields is identifiable both in the field and on aerial pho-tography. In addition, many species show increased abundance or
ERDC/EL TR-08-28 94
plant vigor when growing on wet sites, particularly later in the growing season when adjacent areas are drying out but moist soils are still pres-ent in wetlands. These responses are not species specific or easily mea-surable but are evident when the vegetation of wetlands and adjacent non-wetlands is compared. The following procedure can help deter-mine whether an observed increase or decrease in plant vigor or stress is the result of growing in wetlands. The procedure assumes that indi-cators of hydric soil and wetland hydrology are present in the potential wetland area. Use caution in areas where variations in plant vigor or stress may be due to variations in salinity or other soil conditions, uneven application of fertilizers or herbicides, or other factors not related to wetness.
(1) Compare and describe in field notes the size, vigor, or other stress-
related characteristics of individuals of the same species between the potential wetland area and the immediately surrounding non-wetlands. Emphasize features that can be measured or photo-graphed and include this information in the field report. To qualify for this procedure, most individuals of the affected species must show vigor/stress responses in the wet area. If there are clear differences in plant vigor/stress responses between potential wetland and adjacent non-wetland areas, proceed to step 2.
(2) Observe and describe trends in plant vigor or stress conditions along the topographic or wetness gradient from the potential wet-land to the adjacent non-wetland areas. Trends in plant vigor/ stress responses must reflect the distribution of hydric soils, wetland hydrology indicators, topography, and/or landscape conditions relevant to wetlands. If so, proceed to step 3.
(3) Consider the area containing indicators of hydric soil, wetland hydrology, and evidence of increased plant vigor or stress to be a wetland. Determine the wetland boundary based on the spatial patterns in these features plus topography and landscape characteristics.
5. General Approaches to Problematic Hydrophytic Vegetation – The follow-
ing general procedures are provided to identify hydrophytic vegetation in difficult situations not necessarily associated with specific vegetation types or management practices, including wetlands dominated by FACU, NI, NO, or unlisted species that are functioning as hydrophytes. These procedures should be applied only where indicators of hydric soil and
ERDC/EL TR-08-28 95
wetland hydrology are present (or are absent due to disturbance or other problem situations) but indicators of hydrophytic vegetation are not evident. The following approaches are recommended:
a. Direct hydrologic observations. Verify that the plant community
occurs in an area subject to prolonged inundation or soil saturation during the growing season. This can be done by visiting the site at 2- to 3-day intervals during the portion of the growing season when surface water is most likely to be present or water tables are normally high. Hydrophytic vegetation is considered to be present, and the site is a wetland, if surface water is present and/or the water table is 12 in. (30 cm) or less from the surface for 14 or more consecutive days during the growing season during a period when antecedent precipitation has been normal or drier than normal. If necessary, microtopographic highs and lows should be evaluated separately. The normality of the current year’s rainfall must be considered in interpreting field results, as well as the likelihood that wet conditions will occur on the site at least every other year (for more information, see the section on “Wetlands that Periodically Lack Indicators of Wetland Hydrology” in this chapter).
b. Reference sites. If indicators of hydric soil and wetland hydrology are present, the site may be considered to be a wetland if the landscape setting, topography, soils, and vegetation are substantially the same as those on nearby wetland reference areas. Hydrologic characteristics of wetland reference areas should be documented through long-term monitoring or by repeated application of the procedure described in item 5a above. Reference sites should be minimally disturbed and provide long-term access. Soils, vegetation, and hydrologic conditions should be thoroughly documented and the data kept on file in the district or field office.
c. Technical literature. Published and unpublished scientific literature may be used to support a decision to treat specific FACU species or species with no assigned indicator status (e.g., NI, NO, or unlisted) as hydrophytes or certain plant communities as hydrophytic. Preferably, this literature should discuss the species’ natural distribution along the moisture gradient, its capabilities and adaptations for life in wetlands, wetland types in which it is typically found, or other wetland species with which it is commonly associated.
ERDC/EL TR-08-28 96
Problematic hydric soils
Description of the problem
Soils with faint or no indicators
Some soils that meet the hydric soil definition may not exhibit any of the indicators presented in Chapter 3. These problematic hydric soils exist for a number of reasons and their proper identification requires additional information, such as landscape position, presence or absence of restrictive soil layers, or information about hydrology. This section describes several soil situations in the Arid West Region that are considered to be hydric if additional requirements are met. In some cases, these hydric soils may appear to be non-hydric due to the color of the parent material from which the soils developed. In others, the lack of hydric soil indicators is due to conditions that inhibit the development of redoximorphic features despite prolonged soil saturation and anoxia. In addition, recently developed wetlands may lack hydric soil indicators because insufficient time has passed for their development. In general, the development of hydric soil indicators in arid areas is not as well understood as in other regions. Additional work is needed to assess the need for new or revised indicators. Examples of problematic hydric soils in the Arid West include, but are not limited to, the following:
1. Moderately to Very Strongly Alkaline Soils. The formation of redox concentrations and depletions requires that soluble iron, manganese, and organic matter be present in the soil. In a neutral to acidic soil, iron and manganese readily enter into solution as reduction occurs and then precipitate in the form of redox concentrations as the soil becomes oxidized. Identifiable iron or manganese features do not readily form in saturated soils with high pH. High pH (7.9 or higher) can be caused by many factors. In the Arid West, salt content is a common cause of high soil pH. If the pH is high, indicators of hydrophytic vegetation and wetland hydrology are present, and landscape position is consistent with wetlands in the area, then the soil may be hydric even in the absence of a recognized hydric soil indicator. In the absence of an approved indicator, thoroughly document soil conditions, including pH, in addition to the rationale for identifying the soil as hydric (e.g., landscape position, vegetation, evidence of hydrology, etc.). The concept of high pH includes the USDA terms
ERDC/EL TR-08-28 97
Moderately Alkaline, Strongly Alkaline, and Very Strongly Alkaline (USDA Natural Resources Conservation Service 2002).
2. Volcanic Ash. Soils of volcanic origin that have high levels of volcanic ash (silica) are inherently low in iron, manganese, and sulfur. Many hydric soil indicators are formed predominantly by the accumulation or loss of iron, manganese, or sulfur and, therefore, cannot form in these soils. In the absence of an approved indicator, soil and landscape conditions should be documented thoroughly, along with the rationale for considering the soil to be hydric (e.g., landscape position, vegetation, evidence of hydrology, etc.). A soil scientist with local experience may be needed to help determine whether soils are volcanic in origin.
3. Vegetated Sand and Gravel Bars within Floodplains. Coarse-textured soils commonly occur on vegetated bars above the active channel of rivers and streams. In some cases, these soils lack hydric soil indicators due to seasonal or annual deposition of new soil material, low iron or manganese content, and low organic matter content. Redox concentrations can sometimes be found on the bottoms of coarse fragments and should be examined closely to see if they satisfy an indicator.
4. Recently Developed Wetlands. Recently developed wetlands include mitigation sites, wetland management areas (e.g., for waterfowl), other wetlands intentionally or unintentionally produced by human activities, and naturally occurring wetlands that have not been in place long enough to develop hydric soil indicators.
5. Seasonally Ponded Soils. Seasonally ponded, depressional wetlands occur in basins and valleys throughout the Arid West. Most are perched systems, with water ponding above a restrictive soil layer, such as a hardpan or clay layer, that is at or near the surface (e.g., in Vertisols). Some of these wetlands lack hydric soil indicators due to limited saturation depth, saline conditions, or other factors.
Soils with relict or induced hydric soil indicators
Some soils in the Arid West exhibit redoximorphic features and hydric soil indicators that formed in the recent or distant past when conditions may have been wetter than they are today. These features have persisted even though wetland hydrology may no longer be present. For example, relict redoximorphic features can be found throughout the former lake basins of the Great Basin that were inundated during the Pleistocene epoch. In addi-tion, wetlands that were drained for agricultural purposes starting in the
ERDC/EL TR-08-28 98
1800s, such as large areas of California’s Central Valley, may contain per-sistent hydric soil features. Wetland soils drained during historic times are still considered to be hydric but they may no longer support wetlands. Relict hydric soil features may be difficult to distinguish from con-temporary features. However, if indicators of hydrophytic vegetation and wetland hydrology are present, then hydric soil indicators can be assumed to be contemporary.
There are also areas where hydric soil features have developed in former uplands due to human activities, such as the diversion of water for irriga-tion or other uses. The application of irrigation water to upland areas can create wetland hydrology and, given adequate time, induce the formation of hydric soil indicators. In some cases, a soil scientist can distinguish naturally occurring hydric soil features from those induced by irrigation. Characterizing the naturally occurring hydrology is often important to the determination, and the timing of field observations can be critical. Obser-vations made during the early part of the growing season, when natural hydrology is often at its peak and irrigation has not yet begun, may help to differentiate naturally occurring and irrigation-induced hydric soil features.
Procedure
Soils that are thought to meet the definition of a hydric soil but do not exhibit any of the indicators described in Chapter 3 can be identified by the following recommended procedure. This procedure should be used only where indicators of hydrophytic vegetation and wetland hydrology are present (or are absent due to disturbance or other problem situations) but indicators of hydric soil are not evident.
1. Verify that one or more indicators of hydrophytic vegetation are present or that the vegetation is disturbed or problematic. If so, proceed to step 2.
2. Verify that at least one primary or two secondary indicators of wetland hydrology are present or that indicators are absent due to disturbance or other factors. If so, proceed to step 3. If indicators of hydrophytic vegetation and/or wetland hydrology are absent, then the area is probably non-wetland and no further analysis is required.
3. Thoroughly describe and document the soil profile and landscape setting. Verify that the area is in a landscape position that is likely to collect or
ERDC/EL TR-08-28 99
concentrate water. Appropriate settings are listed below. If the landscape setting is appropriate, proceed to step 4.
a. Concave surface (e.g., depression or swale). b. Floodplain. c. Level or nearly level area (e.g., 0- to 3-percent slope). d. Toe slope or an area of convergent slopes. e. Fringe of another wetland or water body. f. Area with a restrictive soil layer or aquitard within 24 in. (60 cm) of the
surface. g. Area where groundwater discharges (e.g., a seep). h. Other (explain in field notes why this area is likely to be inundated or
saturated for long periods).
4. Use one or more of the following approaches to determine whether the soil is hydric. In the remarks section of the data form or in the delineation report, explain why it is believed that the soil lacks any of the NTCHS hydric soil indicators described in Chapter 3 and why it is believed that the soil meets the definition of a hydric soil.
a. Determine whether one or more of the following indicators of
problematic hydric soils is present. Descriptions of each indicator are given in Chapter 3. If one or more indicators is present, then the soil is hydric.
(1) 1 cm Muck (A9) (applicable to LRR C). (2) 2 cm Muck (A10) (applicable to LRR B). (3) Reduced Vertic (F18) (applicable to LRR B, C, and D). (4) Red Parent Material (TF2) (applicable to LRR B, C, and D).
b. Determine whether one or more of the following problematic soil situations is present. If present, consider the soil to be hydric.
(1) Moderately to Very Strongly Alkaline Soils. (2) Volcanic Ash. (3) Vegetated Sand and Gravel Bars within Floodplains. (4) Recently Developed Wetlands. (5) Seasonally Ponded Soils.

ERDC/EL TR-08-28 100
(6) Other (in field notes, describe the problematic soil situation and explain why it is believed that the soil meets the hydric soil definition).
c. Soils that have been saturated for long periods and have become
chemically reduced may change color when exposed to air due to the rapid oxidation of ferrous iron (Fe2+) to Fe3+ (i.e., a reduced matrix) (Figures 46 and 47). If the soil contains sufficient iron, this can result in an observable color change, especially in hue or chroma. The soil is hydric if a mineral layer 4 in. (10 cm) or more thick starting within 12 in. (30 cm) of the soil surface that has a matrix value of 4 or more and chroma of 2 or less becomes redder by one or more pages in hue and/or increases one or more in chroma when exposed to air within 30 minutes (Vepraskas 1992).
Reduced
Oxidized
Figure 46. This soil exhibits colors associated with reducing conditions. Scale is 1 cm.
Figure 47. Soil in Figure 46 after exposure to the air and oxidation.
Care must be taken to obtain an accurate color of the soil sample immediately upon excavation. The colors should be observed closely and examined again after several minutes. Do not allow the sample to become dry. Dry soils will usually have a different color than wet or moist soils. As always, do not obtain colors while wearing sunglasses. Colors must be obtained in the field under natural light and not under artificial light.
d. If the soil is saturated at the time of sampling, alpha, alpha-dipyridyl dye can be used in the following procedure to determine if reduced
ERDC/EL TR-08-28 101
(ferrous) iron is present. If ferrous iron is present as described below, then the soil is hydric.
Alpha, alpha-dipyridyl is a dye that reacts with reduced iron. In some cases, it can be used to provide evidence that a soil is hydric when it lacks other hydric soil indicators. The soil is likely to be hydric if application of alpha, alpha-dipyridyl dye to mineral soil material in at least 60 percent of a layer at least 4 in. (10 cm) thick within a depth of 12 in. (30 cm) of the soil surface results in a positive reaction within 30 seconds evidenced by a pink or red coloration to the dye during the growing season.
Using a dropper, apply a small amount of dye to a freshly broken ped face to avoid any chance of a false positive test due to iron contamination from digging tools. Look closely at the treated soil for evidence of color change. If in doubt, apply the dye to a sample of known upland soil and compare the reaction to the sample of interest. A positive reaction will not occur in soils that lack iron and may not occur in soils with high pH. The lack of a positive reaction to the dye does not preclude the presence of a hydric soil. Specific information about the use of alpha, alpha-dipyridyl can be found in NRCS Hydric Soils Technical Note 8 (http://soils.usda.gov/use/hydric/ntchs/tech_notes/index.html).
e. Using gauge data, water-table monitoring data, or repeated direct hydrologic observations, determine whether the soil is ponded or flooded, or the water table is 12 in. (30 cm) or less from the surface, for 14 or more consecutive days during the growing season in most years (at least 5 years in 10, or 50 percent or higher probability) (U.S. Army Corps of Engineers 2005). If so, then the soil is hydric. Furthermore, any soil that meets the NTCHS hydric soil technical standard (NRCS Hydric Soils Technical Note 11, http://soils.usda.gov/use/hydric/ntchs/tech_notes/index.html) is hydric.
ERDC/EL TR-08-28 102
Wetlands that periodically lack indicators of wetland hydrology
Description of the problem
Wetlands are areas that are flooded or ponded or have soils that are saturated with water for long periods during the growing season in most years. If a site is visited during a period of normal precipitation amounts and it is inundated or the water table is near the surface, then the wetland hydrology determination is straightforward. However, the Arid West Region is characterized by long, hot summer dry seasons. During the dry season, surface water recedes from wetland margins, water tables drop, and many wetlands dry out completely. Superimposed on this seasonal variability are high spatial and annual variability in precipitation amounts. Wetlands in general are inundated or saturated in most years (at least 5 years in 10, or 50 percent or higher probability) over a long-term record. However, many wetlands in the Arid West do not become inundated or saturated in some years and, during drought cycles, may not inundate or saturate for several years in a row.
Wetland hydrology determinations are based on indicators, many of which were designed to be used during dry periods when the direct observation of surface water or a shallow water table is not possible. However, some wetlands may lack any of the listed hydrology indicators, particularly dur-ing the long dry season or in a dry year. The evaluation of wetland hydrol-ogy requires special care on any site where indicators of hydrophytic vege-tation and hydric soil are present but hydrology indicators appear to be absent. Among other factors, this evaluation should consider the timing of the site visit in relation to normal seasonal and annual hydrologic vari-ability, and whether the amount of rainfall prior to the site visit has been normal. This section describes a number of approaches that can be used to determine whether wetland hydrology is present on sites where indicators of hydrophytic vegetation and hydric soil are present but hydrology indicators may be lacking due to normal variations in rainfall or runoff, human activities that destroy hydrology indicators, and other factors.
Procedure
1. Verify that indicators of hydrophytic vegetation and hydric soil are present, or are absent due to disturbance or other problem situations. If so, proceed to step 2.
ERDC/EL TR-08-28 103
2. Verify that the site is in a landscape position that is likely to collect or concentrate water. Appropriate settings are listed below. If the landscape setting is appropriate, proceed to step 3.
a. Concave surface (e.g., depression or swale). b. Floodplain. c. Level or nearly level area (e.g., 0- to 3-percent slope). d. Toe slope or an area of convergent slopes. e. Fringe of another wetland or water body. f. Area with a restrictive soil layer or aquitard within 24 in. (60 cm) of the
surface. g. Area where groundwater discharges (e.g., a seep). h. Other (explain in field notes why this area is likely to be inundated or
saturated for long periods).
3. Use one or more of the following approaches to determine whether wet-land hydrology is present and the site is a wetland. In the remarks section of the data form or in the delineation report, explain the rationale for concluding that wetland hydrology is present even though indicators of wetland hydrology described in Chapter 4 were not observed.
a. Site visits during the dry season. Determine whether the site visit
occurred during the normal annual “dry season.” The dry season, as used in this supplement, is the period of the year when soil moisture is normally being depleted and water tables are falling to low levels in response to decreased precipitation and/or increased evapotranspir-ation, usually during late spring and summer. It also includes the beginning of the recovery period in late summer or fall. The Web-Based Water-Budget Interactive Modeling Program (WebWIMP) is one source for approximate dates of wet and dry seasons for any terrestrial location based on average monthly precipitation and esti-mated evapotranspiration (http://climate.geog.udel.edu/~wimp/). In general, the dry season in a typical year is indicated when potential evapotranspir-ation exceeds precipitation (indicated by negative values of DIFF in the WebWIMP output), resulting in drawdown of soil moisture storage (negative values of DST) and/or a moisture deficit (positive values of DEF, also called the unmet atmospheric demand for moisture). Actual dates for the dry season vary by locale and year.

ERDC/EL TR-08-28 104
In many wetlands, direct observation of flooding, ponding, or a shallow water table would be unexpected during the dry season. Wetland hydrology indicators, if present, would most likely be limited to indirect evidence, such as water marks, drift deposits, or surface cracks. In some situations, hydrology indicators may be absent during the dry season. If the site visit occurred during the dry season on a site that contains hydric soils and hydrophytic vegetation and no evidence of hydrologic manipulation (e.g., no drainage ditches, dams, levees, water diversions, etc.), then con-sider the site to be a wetland. If necessary, revisit the site during the normal wet season and check again for the presence or absence of wetland hydrology indicators. The highly variable spatial and temp-oral distribution of rainfall in the Arid West makes generalities difficult. However, if wetland hydrology indicators are absent dur-ing the wet portion of the growing season in a normal or wetter-than-normal rainfall year, the site is probably non-wetland.
b. Periods with below-normal rainfall. Determine whether the amount of rainfall that occurred in the 2-3 months preceding the site visit was normal, above normal, or below normal based on the normal range reported in WETS tables. WETS tables are provided by the NRCS National Water and Climate Center (http://www.wcc.nrcs.usda.gov/climate/ wetlands.html) and are calculated from long-term (30-year) weather records gathered at National Weather Service meteorological stations. To determine whether precipitation was normal prior to the site visit, actual rainfall in the current month and previous 2-3 months should be compared with the normal ranges for each month given in the WETS table (USDA Natural Resources Conservation Service 1997, Sprecher and Warne 2000). The lower and upper limits of the normal range are indicated by the columns labeled “30% chance will have less than” and “30% chance will have more than” in the WETS table. The USDA Natural Resources Conservation Service (1997, Section 650.1903) also gives a procedure that can be used to weight the information from each month and determine whether the entire period was normal, wet, or dry. In mountainous areas, average precipitation amounts can vary considerably over short distances. Therefore, use caution in areas where elevation, aspect, rain shadow effects, or other conditions differ between the site of interest and the location of the nearest weather station. Sometimes a more distant station is more representative of the site in question.
ERDC/EL TR-08-28 105
When precipitation has been below normal, wetlands may not flood, pond, or develop shallow water tables even during the typical wet portion of the growing season and may not exhibit other indi-cators of wetland hydrology. Therefore, if precipitation was below normal prior to the site visit, and the site contains hydric soils and hydrophytic vegetation and no evidence of hydrologic manipulation (e.g., no drainage ditches, dams, levees, water diversions, etc.), it should be identified as a wetland. If necessary, the site can be revisited during a period of normal rainfall and checked again for hydrology indicators.
c. Drought years. Determine whether the area has been subject to drought. Droughts lasting two to several years in a row are common in the Arid West. Drought periods can be identified by comparing annual rainfall totals with the normal range of annual rainfall given in WETS tables or by examining trends in drought indices, such as the Palmer Drought Severity Index (PDSI) (Sprecher and Warne 2000). PDSI takes into account not only precipitation but also temperature, which affects evapotranspiration, and soil moisture conditions. The index is usually calculated on a monthly basis for major climatic divisions within each state. Therefore, the information is not site-specific. PDSI ranges generally between –6 and +6 with negative values indicating dry periods and positive values indicating wet periods. An index of –1.0 indicates mild drought, –2.0 indicates moderate drought, –3.0 indi-cates severe drought, and –4.0 indicates extreme drought. Time-series plots of PDSI values by month or year are available from the National Climatic Data Center (http://www.ncdc.noaa.gov/oa/climate/onlineprod/drought/ xmgr.html#ds). If wetland hydrology indicators appear to be absent on a site that has hydrophytic vegetation and hydric soils, no evidence of hydrologic manipulation (e.g., no drainage ditches, dams, levees, water diversions, etc.), and the region has been affected by drought, then the area should be identified as a wetland.
d. Years with unusually low winter snowpack. Determine whether the
site visit occurred following a winter with unusually low snowpack. Some wetlands in the Arid West, particularly those located in or near mountain ranges, depend upon the melting winter snowpack as a major water source. In areas where the snowpack persists throughout the winter, water availability in spring and early summer depends in part on winter water storage in the form of snow and ice. Therefore,
ERDC/EL TR-08-28 106
springtime water availability in a given year can be evaluated by com-paring the liquid equivalent of snowfall over the previous winter (e.g., October through April) against 30-year averages calculated for NRCS Snowpack Telemetry (SNOTEL) sites (http://www.wcc.nrcs.usda.gov/factpub/ads/) or for National Weather Service meteorological stations (may require a fee, http://lwf.ncdc.noaa.gov/oa/ncdc.html). This procedure may not be reliable in areas where the snowpack is not persistent and water is released inter-mittently throughout the winter.
In years when winter snowpack is appreciably less than the long-term average, wetlands that depend on snowmelt as an important water source may not flood, pond, or develop shallow water tables and may not exhibit other wetland hydrology indicators. Under these conditions, a site that contains hydric soils and hydrophytic vegetation and no evidence of hydrologic manipulation should be considered to be a wetland. If necessary, the site can be revisited following a winter with normal snowpack conditions and checked again for wetland hydrology indicators.
e. Reference sites. If indicators of hydric soil and hydrophytic vegetation are present on a site that lacks wetland hydrology indicators, the site may be considered to be a wetland if the landscape setting, topography, soils, and vegetation are substantially the same as those on nearby wet-land reference areas. Hydrology of wetland reference areas should be documented through long-term monitoring (see item g below) or by repeated application of the procedure described in item 5a on page 95 (Direct Hydrologic Observations) of the procedure for Problematic Hydrophytic Vegetation in this chapter. Reference sites should be minimally disturbed and provide long-term access. Soils, vegetation, and hydrologic conditions should be thoroughly documented and the data kept on file in the district or field office.
f. Hydrology tools. The “Hydrology Tools” (USDA Natural Resources
Conservation Service 1997) is a collection of methods that can be used to determine whether wetland hydrology is present on a potential wet-land site that lacks indicators due to disturbance or other reasons, particularly on lands used for agriculture. Generally they require addi-tional information, such as aerial photographs or stream-gauge data, or involve hydrologic modeling and approximation techniques. They should be used only when an indicator-based wetland hydrology
ERDC/EL TR-08-28 107
determination is not possible or would give misleading results. A hydrologist may be needed to help select and carry out the proper analysis. The seven hydrology tools are used to:
(1) Analyze stream and lake gauge data. (2) Estimate runoff volumes to determine duration and frequency of
ponding in depressional areas. (3) Evaluate the frequency of wetness signatures on repeated aerial
photography. (4) Model water-table fluctuations in fields with parallel drainage
systems using the DRAINMOD model. (5) Estimate the “scope and effect” of drainage ditches or subsurface
drain lines. (6) Use NRCS state drainage guides to estimate the effectiveness of
agricultural drainage systems. (7) Analyze data from groundwater monitoring wells (see item g below
for additional information).
g. Long-term hydrologic monitoring. On sites where the hydrology has been manipulated by man (e.g., with ditches, dams, levees, water diver-sions, land grading) or where natural events (e.g., downcutting of streams, volcanic activity) have altered conditions such that hydrology indicators may be missing or misleading, direct monitoring of surface and groundwater may be needed to determine the presence or absence of wetland hydrology. The U.S. Army Corps of Engineers (2005) pro-vides minimum standards for the design, construction, and installation of water-table monitoring wells, and for the collection and interpreta-tion of groundwater monitoring data, in cases where direct hydrologic measurements are needed to determine whether wetlands are present on highly disturbed or problematic sites. This standard calls for 14 or more consecutive days of flooding, ponding, or a water table 12 in. (30 cm) or less below the soil surface during the growing season at a minimum frequency of 5 years in 10 (50 percent or higher probability), unless a different standard has been established for a particular geo-graphic area or wetland type. A disturbed or problematic site that meets this standard has wetland hydrology. This standard is not intended (1) to overrule an indicator-based wetland determination on a site that is not disturbed or problematic, or (2) to test or validate exist-ing or proposed wetland indicators.
ERDC/EL TR-08-28 108
References Bailey, R. G. 1995. Description of the ecoregions of the United States, second edition.
Miscellaneous Publication 1391 (revised). Washington, DC: U.S. Department of Agriculture, Forest Service. (http://www.fs.fed.us/land/ecosysmgmt/ecoreg1_home.html)
Barbour, M. G., and W. D. Billings. 1989. North American terrestrial vegetation. New York: Cambridge University Press.
Boettinger, J. L. 1997. Aquisalids (Salorthids) and other wet saline and alkaline soils: Problems identifying aquic conditions and hydric soils. In Aquic conditions and hydric soils: The problem soils. Special Publication Number 50, 79–97. Madison, WI: Soil Science Society of America.
Brostoff, W. N. 2002. Algae of a cryptobiotic crust dominated dune/pan system in the Western Mojave Desert. Journal of Arid Environments 51: 339–361.
Commission for Environmental Cooperation (CEC). 1997. Ecological regions of North America: Toward a common perspective. Montreal, Quebec, Canada. (http://www.cec.org/files/PDF/BIODIVERSITY/eco-eng_EN.pdf)
Dahl, T. E. 1990. Wetlands losses in the United States 1780’s to 1980’s. Washington, DC: U.S. Fish and Wildlife Service.
Elzinga, C. L., D. W. Salzer, and J. W. Willoughby. 1998. Measuring and monitoring plant populations. Bureau of Land Management Technical Reference 1730-1. Washington, DC: U.S. Department of the Interior.
Environmental Laboratory. 1987. Corps of Engineers wetlands delineation manual. Technical Report Y-87-1. Vicksburg, MS: U.S. Army Engineer Waterways Experiment Station. (http://el.erdc.usace.army.mil/wetlands/pdfs/wlman87.pdf)
Field, J. J. 2004. Hydrology literature review for ordinary high water mark delineation in the Arid Southwest. Chapter 2 in Review of ordinary high water mark indicators for delineating arid streams in the southwestern United States, ed. R. W. Lichvar and J. S. Wakeley. Technical Report ERDC TR-04-1. Hanover, NH: U.S. Army Engineer Research and Development Center, Cold Regions Research and Engineering Laboratory. (http://www.crrel.usace.army.mil/techpub/CRREL_Reports/reports/ERDC-TR-04-1.pdf)
Frayer, W. E., D. D. Peters, and H. R. Pywell. 1989. Wetlands of the California Central Valley: Status and trends 1939 to mid-1980’s. Portland, OR: U.S. Fish and Wildlife Service.
Freeze, R. A., and J. A. Cherry. 1979. Groundwater. Englewood Cliffs, NJ: Prentice-Hall.
Gretag/Macbeth. 2000. Munsell® color. New Windsor, NY.
Hickman, J. C. 1993. The Jepson manual: Higher plants of California. Berkeley, CA: University of California Press.
ERDC/EL TR-08-28 109
Houston, M., and M. Vial. 1995. Birds of the channeled scablands of Eastern Washington. Jamestown, ND: Bureau of Land Management.
Jones, B. F. 1965. The hydrology and mineralogy of Deep Springs Lake, Inyo County, California. Professional Paper 502-A. Washington, DC: U.S. Geological Survey.
Kent, M., and P. Coker. 1992. Vegetation description and analysis: A practical approach. New York: Wiley.
Lichvar, R., W. Brostoff, and S. Sprecher. 2006. Surficial features associated with ponded water on playas of the arid southwestern United States: Indicators for delineating regulated areas under the Clean Water Act. Wetlands 26: 385–399.
Mueller-Dombois, D., and H. Ellenberg. 1974. Aims and methods of vegetation ecology. New York: Wiley.
National Research Council. 1995. Wetlands: Characteristics and boundaries. Washington, DC: National Academy Press.
Peters, D. D. 2005. Wetlands of Nevada (Draft). Portland, OR: U.S. Fish and Wildlife Service.
Reed, P. B., Jr. 1988. National list of plant species that occur in wetlands: 1988 national summary. Biological Report 88(24). Washington, DC: U.S. Fish and Wildlife Service. (http://www.fws.gov/nwi/Plants/plants.htm)
Reid, I., and L. E. Frostick. 1997. Channel form, flow, and sediments in deserts. In Arid zone geomorphology: Process, form and change in drylands, second edition. ed. D.S.G. Thomas, 205–229. Chichester, UK: John Wiley and Sons.
Sprecher, S. W., and A. G. Warne. 2000. Accessing and using meteorological data to evaluate wetland hydrology. Technical Report ERDC/EL TR-WRAP-00-1. Vicksburg, MS: U.S. Army Engineer Research and Development Center. (http://el.erdc.usace.army.mil/elpubs/pdf/wrap00-1/wrap00-1.pdf)
Stone, R. O. 1956. A geological investigation of playa lakes. Ph.D. dissertation. Los Angeles, CA: University of Southern California.
Tiner, R. W. 1999. Wetland indicators: A guide to wetland identification, delineation, classification, and mapping. Boca Raton, FL: Lewis Publishers.
U.S. Army Corps of Engineers. 2005. Technical standard for water-table monitoring of potential wetland sites. Technical Note ERDC TN-WRAP-05-02. Vicksburg, MS: U.S. Army Engineer Research and Development Center. (http://el.erdc.usace.army.mil/wrap/pdf/tnwrap05-2.pdf)
______. 2008. Interim regional supplement to the Corps of Engineers wetland delineation manual: Western mountains, valleys, and coast region. ed. J. S. Wakeley, R. W. Lichvar, and C. V. Noble. ERDC/EL TR-08-13. Vicksburg, MS: U.S. Army Engineer Research and Development Center. (http://el.erdc.usace.army.mil/elpubs/pdf/trel08-13.pdf)
ERDC/EL TR-08-28 110
USDA Natural Resources Conservation Service. 1997. Hydrology tools for wetland determination. Chapter 19 in Engineering field handbook. Fort Worth, TX: U.S. Department of Agriculture, NRCS. (http://directives.sc.egov.usda.gov/pdf/EFH-Ch19.pdf)
______. 1999. Soil taxonomy: A basic system of soil classification for making and interpreting soil surveys. Agriculture Handbook 436. Washington, DC: U.S. Department of Agriculture. (http://soils.usda.gov/technical/classification/taxonomy/)
______. 2002. Field book for describing and sampling soils, Version 2.0. ed. P. J. Schoeneberger, D. A. Wysocki, E. C. Benham, and W. D. Broderson. Lincoln, NE: National Soil Survey Center. (http://soils.usda.gov/technical/fieldbook/)
______. 2005. National soil survey handbook, Part 629, Glossary. Washington, DC: U.S. Department of Agriculture. (http://soils.usda.gov/technical/handbook/contents/ part629glossary1.html)
______. 2006a. Land resource regions and major land resource areas of the United States, the Caribbean, and the Pacific Basin. Agriculture Handbook 296. Washington, DC: U.S. Department of Agriculture. (http://soils.usda.gov/survey/ geography/mlra/index.html)
______. 2006b. Field indicators of hydric soils in the United States, Version 6.0. ed. G. W. Hurt and L. M. Vasilas. Fort Worth, TX: USDA NRCS in cooperation with the National Technical Committee for Hydric Soils. (http://soils.usda.gov/use/hydric/)
USDA Soil Conservation Service. 1994. Changes in hydric soils of the United States. Federal Register 59(133): 35680–35681, July 13, 1994.
U.S. Geological Survey. 1996. National water summary on wetland resources. Reston, VA.
Vepraskas, M. J. 1992. Redoximorphic features for identifying aquic conditions. Technical Bulletin 301. Raleigh, NC: North Carolina Agricultural Research Service, North Carolina State Univ.
Vepraskas, M. J., and S. W. Sprecher. 1997. Aquic conditions and hydric soils: The problem soils. Special Publication Number 50. Madison, WI: Soil Science Society of America.
Wakeley, J. S., and R. W. Lichvar. 1997. Disagreement between plot-based prevalence indices and dominance ratios in evaluations of wetland vegetation. Wetlands 17: 301–309.
Wentworth, T. R., G. P. Johnson, and R. L. Kologiski. 1988. Designation of wetlands by weighted averages of vegetation data: A preliminary evaluation. Water Resources Bulletin 24: 389–396.
ERDC/EL TR-08-28 111
Appendix A: Glossary
This glossary is intended to supplement those given in the Corps Manual and other available sources. See the following publications for terms not listed here:
• Corps Manual (Environmental Laboratory 1987) (http://el.erdc.usace.army.mil/wetlands/pdfs/wlman87.pdf).
• Field Indicators of Hydric Soils in the United States (USDA Natural Resources Conservation Service 2006b) (http://soils.usda.gov/use/hydric/).
• National Soil Survey Handbook, Part 629 (USDA Natural Resources Conservation Service 2005) (ftp://ftp-fc.sc.egov.usda.gov/NSSC/Soil_Survey_Handbook/629_glossary.pdf).
Absolute cover. In vegetation sampling, the percentage of the ground surface that is covered by the aerial portions (leaves and stems) of a plant species when viewed from above. Due to overlapping plant canopies, the sum of absolute cover values for all species in a community or stratum may exceed 100 percent. In contrast, “relative cover” is the absolute cover of a species divided by the total coverage of all species in that stratum, expressed as a percent. Relative cover cannot be used to calculate the prevalence index.
Aquitard. A layer of soil or rock that retards the downward flow of water and is capable of perching water above it. For the purposes of this supplement, the term aquitard also includes the term aquiclude, which is a soil or rock layer that is incapable of transmitting significant quantities of water under ordinary hydraulic gradients.
Contrast. The color difference between a redox concentration and the dominant matrix color. Differences are classified as faint, distinct, or prominent and are defined in the glossary of USDA Natural Resources Conservation Service (2006b) and illustrated in Table A1.
Depleted matrix. The volume of a soil horizon or subhorizon from which iron has been removed or transformed by processes of reduction and translocation to create colors of low chroma and high value. A, E, and calcic horizons may have low chromas and high values and may therefore
ERDC/EL TR-08-28 112
be mistaken for a depleted matrix. However, they are excluded from the concept of a depleted matrix unless common or many, distinct or prominent redox concentrations as soft masses or pore linings are present. In some places the depleted matrix may change color upon exposure to air (reduced matrix); this phenomenon is included in the concept of a depleted matrix. The following combinations of value and chroma identify a depleted matrix:
• Matrix value of 5 or more and chroma of 1, with or without redox con-centrations occurring as soft masses and/or pore linings, or
• Matrix value of 6 or more and chroma of 2 or 1, with or without redox concentrations occurring as soft masses and/or pore linings, or
• Matrix value of 4 or 5 and chroma of 2, with 2 percent or more distinct or prominent redox concentrations occurring as soft masses and/or pore linings, or
• Matrix value of 4 and chroma of 1, with 2 percent or more distinct or prominent redox concentrations occurring as soft masses and/or pore linings (USDA Natural Resources Conservation Service 2006b).
Common (2 to less than 20 percent) to many (20 percent or more) redox concentrations (USDA Natural Resources Conservation Service 2002) are required in soils with matrix colors of 4/1, 4/2, and 5/2 (Figure A1). Redox concentrations include iron and manganese masses and pore linings (Vepraskas 1992). See “contrast” in this glossary for the definitions of “distinct” and “prominent.”
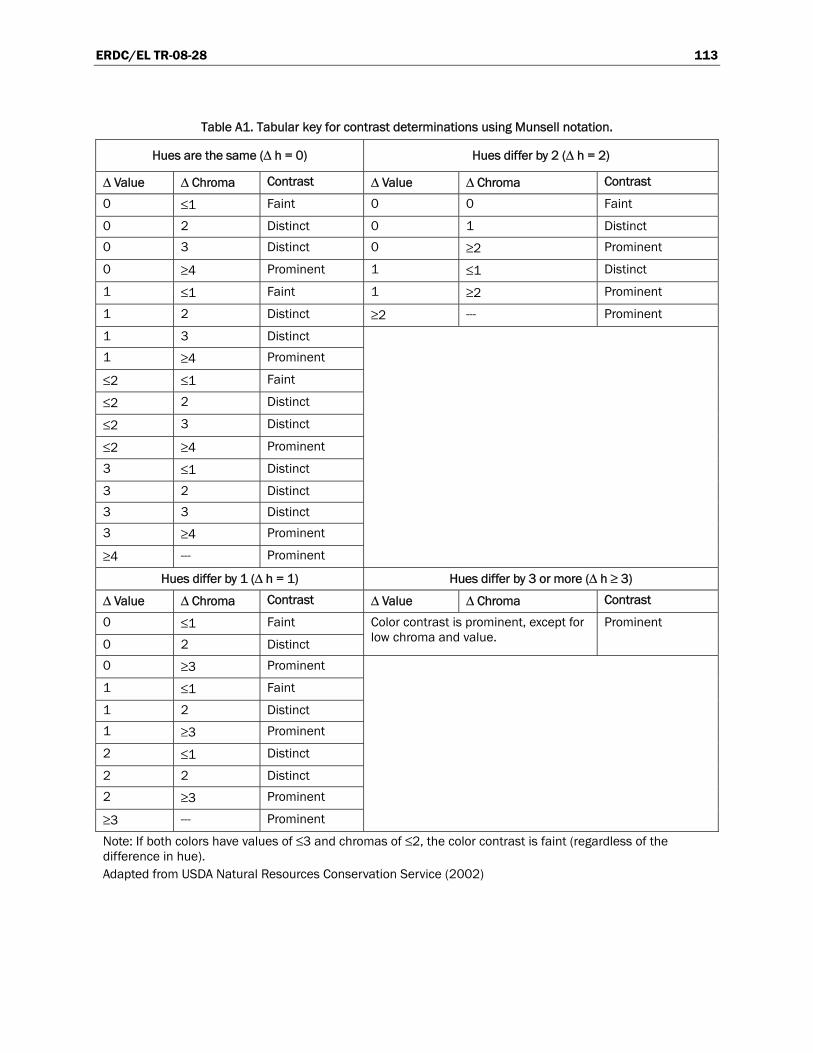
ERDC/EL TR-08-28 113
Table A1. Tabular key for contrast determinations using Munsell notation.
Hues are the same (Δ h = 0) Hues differ by 2 (Δ h = 2)
Δ Value Δ Chroma Contrast Δ Value Δ Chroma Contrast
0 ≤1 Faint 0 0 Faint
0 2 Distinct 0 1 Distinct 0 3 Distinct 0 ≥2 Prominent
0 ≥4 Prominent 1 ≤1 Distinct
1 ≤1 Faint 1 ≥2 Prominent
1 2 Distinct ≥2 --- Prominent
1 3 Distinct 1 ≥4 Prominent
≤2 ≤1 Faint
≤2 2 Distinct
≤2 3 Distinct
≤2 ≥4 Prominent
3 ≤1 Distinct
3 2 Distinct 3 3 Distinct 3 ≥4 Prominent
≥4 --- Prominent
Hues differ by 1 (Δ h = 1) Hues differ by 3 or more (Δ h ≥ 3)
Δ Value Δ Chroma Contrast Δ Value Δ Chroma Contrast
0 ≤1 Faint
0 2 Distinct
Color contrast is prominent, except for low chroma and value.
Prominent
0 ≥3 Prominent
1 ≤1 Faint
1 2 Distinct 1 ≥3 Prominent
2 ≤1 Distinct
2 2 Distinct 2 ≥3 Prominent
≥3 --- Prominent
Note: If both colors have values of ≤3 and chromas of ≤2, the color contrast is faint (regardless of the difference in hue). Adapted from USDA Natural Resources Conservation Service (2002)
ERDC/EL TR-08-28 114
Diapause. A period during which growth or development is suspended and physiological activity is diminished, as in certain aquatic invertebrates in response to drying of temporary wetlands.
Distinct. See Contrast.
Episaturation. Condition in which the soil is saturated with water at or near the surface, but also has one or more unsaturated layers below the saturated zone. The zone of saturation is perched on top of a relatively impermeable layer.
Fragmental soil material. Soil material that consists of 90 percent or more rock fragments; less than 10 percent of the soil consists of particles 2 mm or smaller (USDA Natural Resources Conservation Service 2006b).
Gleyed matrix. A gleyed matrix has one of the following combinations of hue, value, and chroma and the soil is not glauconitic (Figure A2):
• 10Y, 5GY, 10GY, 10G, 5BG, 10BG, 5B, 10B, or 5PB with value of 4 or more and chroma of 1; or
• 5G with value of 4 or more and chroma of 1 or 2; or • N with value of 4 or more (USDA Natural Resources Conservation
Service 2006b).
Growing season. In the Arid West Region, growing season dates are determined through onsite observations of the following indicators of biological activity in a given year: (1) above-ground growth and development of vascular plants, and/or (2) soil temperature (see Chapter 4 for details). If onsite data gathering is not practical, growing season dates may be approximated by using WETS tables available from the NRCS National Water and Climate Center to determine the median dates of 28 °F (−2.2 °C) air temperatures in spring and fall based on long-term records gathered at the nearest appropriate National Weather Service meteorological station.
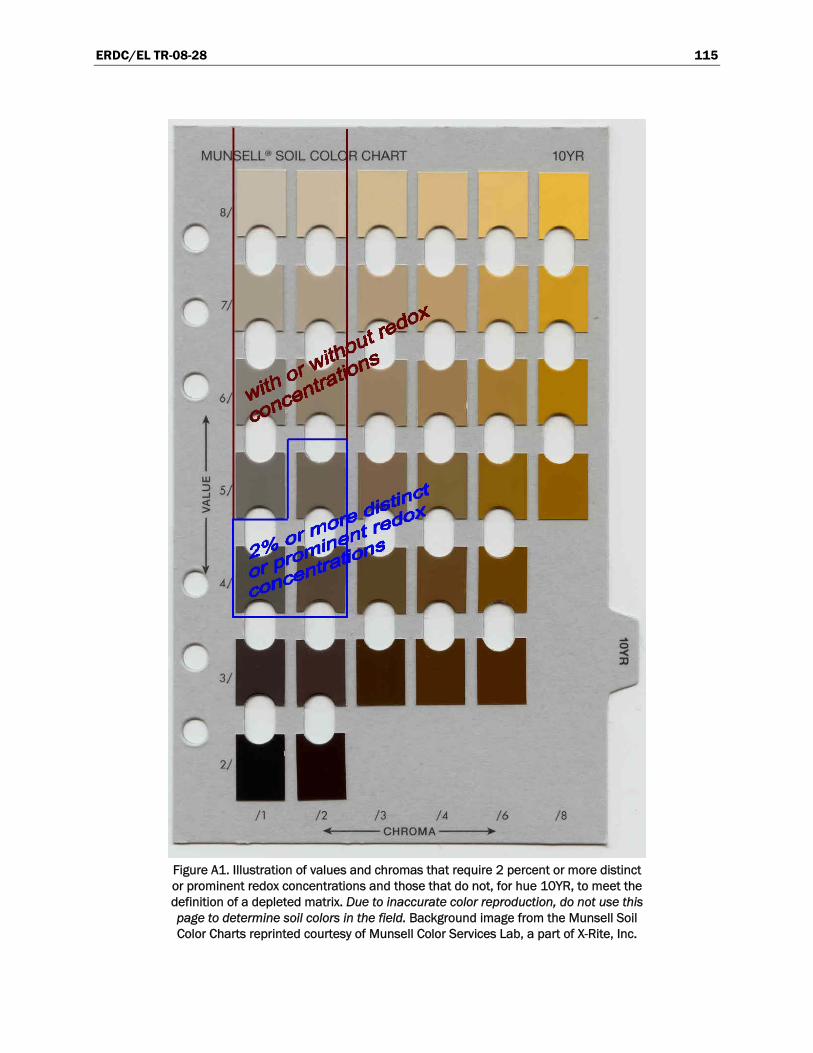
ERDC/EL TR-08-28 115
Figure A1. Illustration of values and chromas that require 2 percent or more distinct or prominent redox concentrations and those that do not, for hue 10YR, to meet the definition of a depleted matrix. Due to inaccurate color reproduction, do not use this page to determine soil colors in the field. Background image from the Munsell Soil Color Charts reprinted courtesy of Munsell Color Services Lab, a part of X-Rite, Inc.
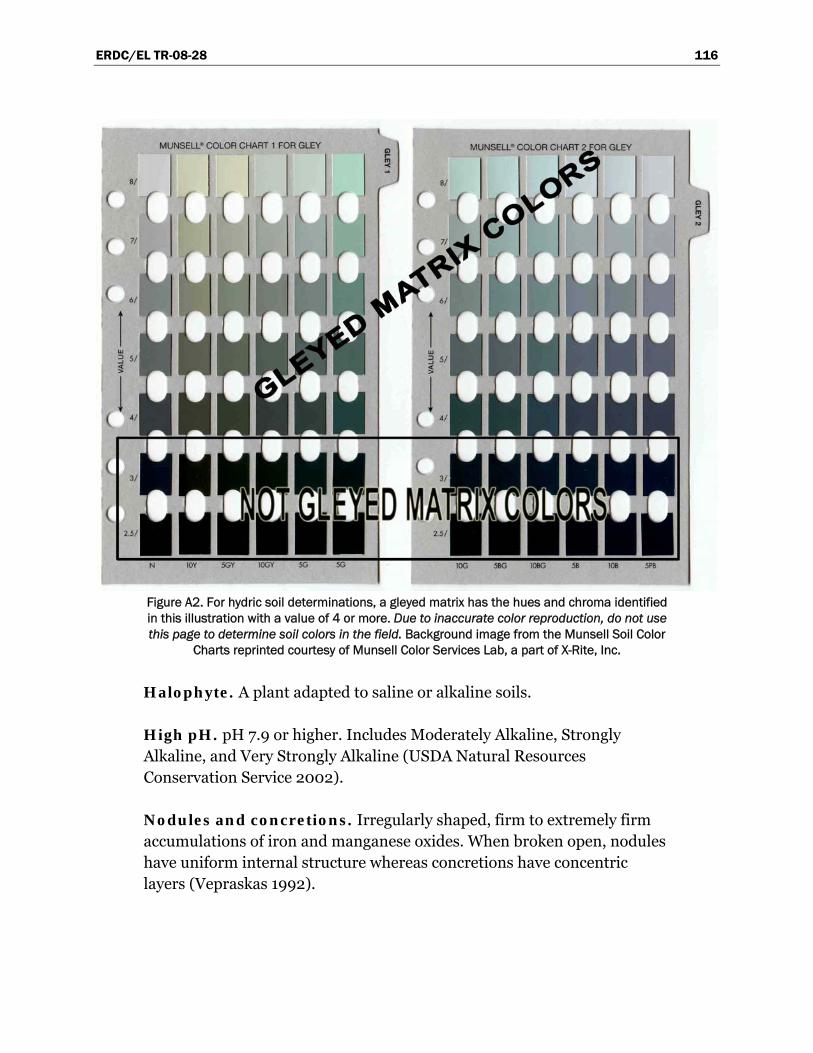
ERDC/EL TR-08-28 116
Figure A2. For hydric soil determinations, a gleyed matrix has the hues and chroma identified in this illustration with a value of 4 or more. Due to inaccurate color reproduction, do not use this page to determine soil colors in the field. Background image from the Munsell Soil Color
Charts reprinted courtesy of Munsell Color Services Lab, a part of X-Rite, Inc.
Halophyte. A plant adapted to saline or alkaline soils.
High pH. pH 7.9 or higher. Includes Moderately Alkaline, Strongly Alkaline, and Very Strongly Alkaline (USDA Natural Resources Conservation Service 2002).
Nodules and concretions. Irregularly shaped, firm to extremely firm accumulations of iron and manganese oxides. When broken open, nodules have uniform internal structure whereas concretions have concentric layers (Vepraskas 1992).
ERDC/EL TR-08-28 117
Phreatophyte. A deep-rooted plant that obtains water from the water table or permanent groundwater source.
Prominent. See Contrast.
Reduced matrix. Soil matrix that has a low chroma in situ due to presence of reduced iron, but whose color changes in hue or chroma when exposed to air as Fe2+ is oxidized to Fe3+ (Vepraskas 1992).
Saturation. For wetland delineation purposes, a soil layer is saturated if virtually all pores between soil particles are filled with water (National Research Council 1995, Vepraskas and Sprecher 1997). This definition includes part of the capillary fringe above the water table (i.e., the tension-saturated zone) in which soil water content is approximately equal to that below the water table (Freeze and Cherry 1979).
ERDC/EL TR-08-28 118
Appendix B: Point-Intercept Sampling Procedure for Determining Hydrophytic Vegetation
The following procedure for point-intercept sampling is an alternative to plot-based sampling methods to estimate the abundance of plant species in a community. The approach may be used with the approval of the appropriate Corps of Engineers District to evaluate vegetation as part of a wetland delineation. Advantages of point-intercept sampling include better quantification of plant species abundance and reduced bias com-pared with visual estimates of cover. The method is useful in communities with high species diversity, and in areas where vegetation is patchy or heterogeneous, making it difficult to identify representative locations for plot sampling. Disadvantages include the increased time required for sampling and the need for vegetation units large enough to permit the establishment of one or more transect lines within them. The approach also assumes that soil and hydrologic conditions are uniform across the area where transects are located. In particular, transects should not cross the wetland boundary. Point-intercept sampling is generally used with a transect-based prevalence index (see below) to determine whether vege-tation is hydrophytic.
In point-intercept sampling, plant occurrence is determined at points located at fixed intervals along one or more transects established in ran-dom locations within the plant community or vegetation unit. If a transect is being used to sample the vegetation near a wetland boundary, the tran-sect should be placed parallel to the boundary and should not cross either the wetland boundary or into other communities. Usually a measuring tape is laid on the ground and used for the transect line. Transect length depends upon the size and complexity of the plant community and may range from 100 to 300 ft (30 to 90 m) or more. Plant occurrence data are collected at fixed intervals along the line, for example every 2 ft (0.6 m). At each interval, a “hit” on a species is recorded if a vertical line at that point would intercept the stem or foliage of that species. Only one “hit” is recorded for a species at a point even if the same species would be inter-cepted more than once at that point. Vertical intercepts can be determined using a long pin or rod protruding into and through the various vegetation
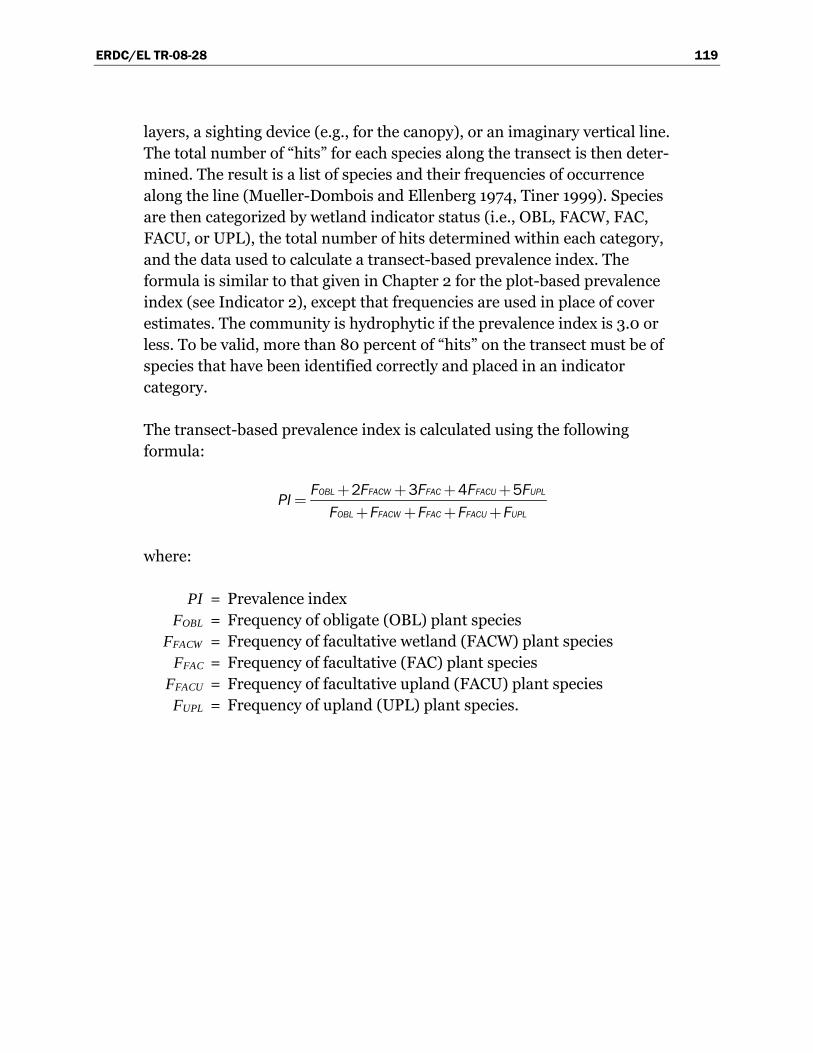
ERDC/EL TR-08-28 119
layers, a sighting device (e.g., for the canopy), or an imaginary vertical line. The total number of “hits” for each species along the transect is then deter-mined. The result is a list of species and their frequencies of occurrence along the line (Mueller-Dombois and Ellenberg 1974, Tiner 1999). Species are then categorized by wetland indicator status (i.e., OBL, FACW, FAC, FACU, or UPL), the total number of hits determined within each category, and the data used to calculate a transect-based prevalence index. The formula is similar to that given in Chapter 2 for the plot-based prevalence index (see Indicator 2), except that frequencies are used in place of cover estimates. The community is hydrophytic if the prevalence index is 3.0 or less. To be valid, more than 80 percent of “hits” on the transect must be of species that have been identified correctly and placed in an indicator category.
The transect-based prevalence index is calculated using the following formula:
2 3 4 5OBL FACW FAC FACU UPL
OBL FACW FAC FACU UPL
F F F F FPIF F F F F+ + + +
=+ + + +
where:
PI = Prevalence index FOBL = Frequency of obligate (OBL) plant species FFACW = Frequency of facultative wetland (FACW) plant species FFAC = Frequency of facultative (FAC) plant species FFACU = Frequency of facultative upland (FACU) plant species FUPL = Frequency of upland (UPL) plant species.

ERDC/EL TR-08-28 120
Appendix C: Data Form
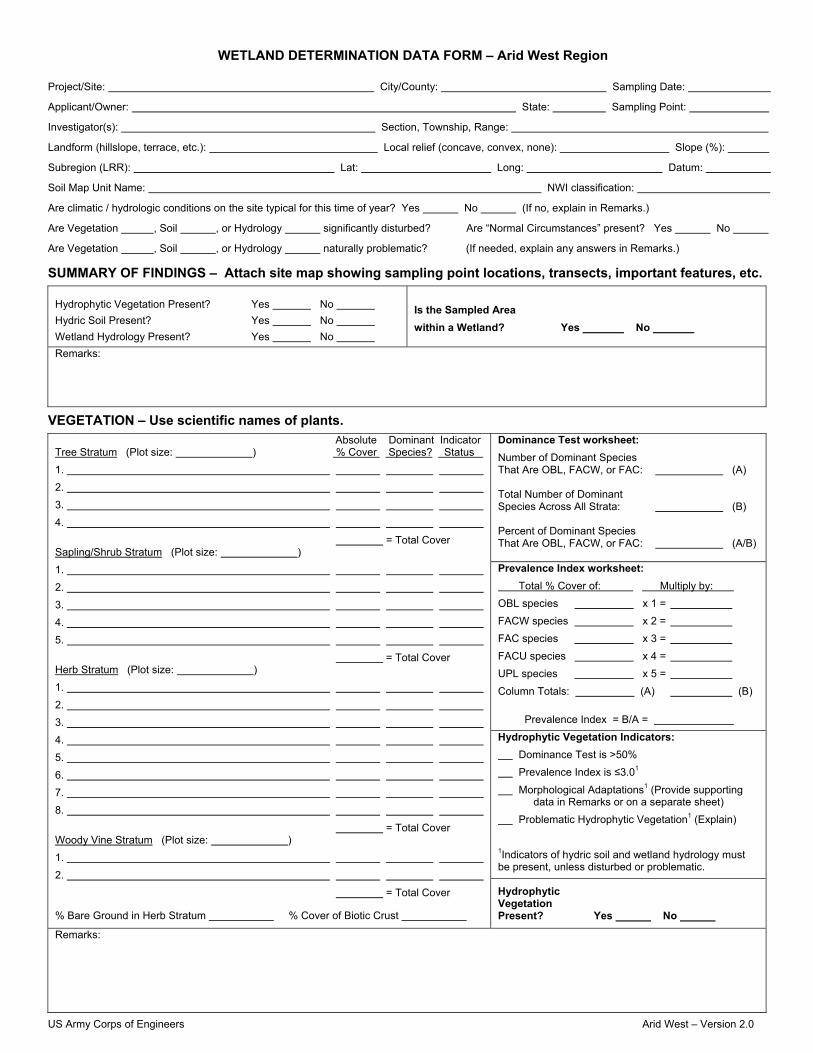
US Army Corps of Engineers Arid West – Version 2.0
WETLAND DETERMINATION DATA FORM – Arid West Region Project/Site: City/County: Sampling Date:
Applicant/Owner: State: Sampling Point:
Investigator(s): Section, Township, Range:
Landform (hillslope, terrace, etc.): Local relief (concave, convex, none): Slope (%):
Subregion (LRR): Lat: Long: Datum:
Soil Map Unit Name: NWI classification:
Are climatic / hydrologic conditions on the site typical for this time of year? Yes No (If no, explain in Remarks.)
Are Vegetation , Soil , or Hydrology significantly disturbed? Are “Normal Circumstances” present? Yes No
Are Vegetation , Soil , or Hydrology naturally problematic? (If needed, explain any answers in Remarks.)
SUMMARY OF FINDINGS – Attach site map showing sampling point locations, transects, important features, etc.
Hydrophytic Vegetation Present? Yes No Hydric Soil Present? Yes No Wetland Hydrology Present? Yes No
Is the Sampled Area within a Wetland? Yes No
Remarks:
VEGETATION – Use scientific names of plants. Dominance Test worksheet: Number of Dominant Species That Are OBL, FACW, or FAC: (A) Total Number of Dominant Species Across All Strata: (B) Percent of Dominant Species That Are OBL, FACW, or FAC: (A/B)
Prevalence Index worksheet: Total % Cover of: Multiply by: OBL species x 1 = FACW species x 2 = FAC species x 3 = FACU species x 4 = UPL species x 5 = Column Totals: (A) (B)
Prevalence Index = B/A = Hydrophytic Vegetation Indicators: Dominance Test is >50% Prevalence Index is ≤3.01 Morphological Adaptations1 (Provide supporting data in Remarks or on a separate sheet) Problematic Hydrophytic Vegetation1 (Explain) 1Indicators of hydric soil and wetland hydrology must be present, unless disturbed or problematic.
Absolute Dominant Indicator Tree Stratum (Plot size: ) % Cover Species? Status 1. 2. 3. 4. = Total Cover Sapling/Shrub Stratum (Plot size: ) 1. 2. 3. 4. 5. = Total Cover Herb Stratum (Plot size: ) 1. 2. 3. 4. 5. 6. 7. 8. = Total Cover Woody Vine Stratum (Plot size: ) 1. 2. = Total Cover
% Bare Ground in Herb Stratum % Cover of Biotic Crust
Hydrophytic Vegetation Present? Yes No
Remarks:
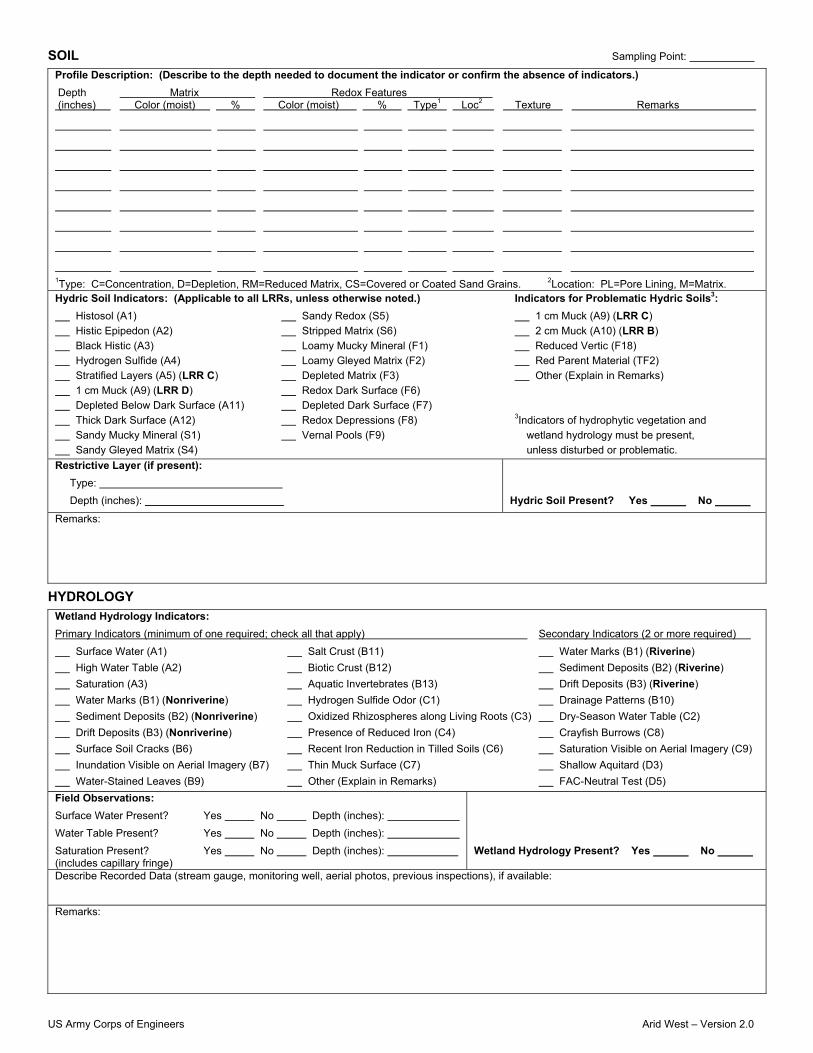
US Army Corps of Engineers Arid West – Version 2.0
SOIL Sampling Point:
Profile Description: (Describe to the depth needed to document the indicator or confirm the absence of indicators.) Depth Matrix Redox Features (inches) Color (moist) % Color (moist) % Type1 Loc2 Texture Remarks
1Type: C=Concentration, D=Depletion, RM=Reduced Matrix, CS=Covered or Coated Sand Grains. 2Location: PL=Pore Lining, M=Matrix. Hydric Soil Indicators: (Applicable to all LRRs, unless otherwise noted.) Indicators for Problematic Hydric Soils3: Histosol (A1) Sandy Redox (S5) 1 cm Muck (A9) (LRR C) Histic Epipedon (A2) Stripped Matrix (S6) 2 cm Muck (A10) (LRR B) Black Histic (A3) Loamy Mucky Mineral (F1) Reduced Vertic (F18) Hydrogen Sulfide (A4) Loamy Gleyed Matrix (F2) Red Parent Material (TF2) Stratified Layers (A5) (LRR C) Depleted Matrix (F3) Other (Explain in Remarks) 1 cm Muck (A9) (LRR D) Redox Dark Surface (F6) Depleted Below Dark Surface (A11) Depleted Dark Surface (F7) Thick Dark Surface (A12) Redox Depressions (F8) 3Indicators of hydrophytic vegetation and Sandy Mucky Mineral (S1) Vernal Pools (F9) wetland hydrology must be present, Sandy Gleyed Matrix (S4) unless disturbed or problematic. Restrictive Layer (if present): Type: Depth (inches):
Hydric Soil Present? Yes No
Remarks:
HYDROLOGY Wetland Hydrology Indicators: Primary Indicators (minimum of one required; check all that apply) Secondary Indicators (2 or more required) Surface Water (A1) Salt Crust (B11) Water Marks (B1) (Riverine) High Water Table (A2) Biotic Crust (B12) Sediment Deposits (B2) (Riverine) Saturation (A3) Aquatic Invertebrates (B13) Drift Deposits (B3) (Riverine) Water Marks (B1) (Nonriverine) Hydrogen Sulfide Odor (C1) Drainage Patterns (B10) Sediment Deposits (B2) (Nonriverine) Oxidized Rhizospheres along Living Roots (C3) Dry-Season Water Table (C2) Drift Deposits (B3) (Nonriverine) Presence of Reduced Iron (C4) Crayfish Burrows (C8) Surface Soil Cracks (B6) Recent Iron Reduction in Tilled Soils (C6) Saturation Visible on Aerial Imagery (C9) Inundation Visible on Aerial Imagery (B7) Thin Muck Surface (C7) Shallow Aquitard (D3) Water-Stained Leaves (B9) Other (Explain in Remarks) FAC-Neutral Test (D5) Field Observations: Surface Water Present? Yes No Depth (inches): Water Table Present? Yes No Depth (inches): Saturation Present? Yes No Depth (inches): (includes capillary fringe)
Wetland Hydrology Present? Yes No
Describe Recorded Data (stream gauge, monitoring well, aerial photos, previous inspections), if available: Remarks:
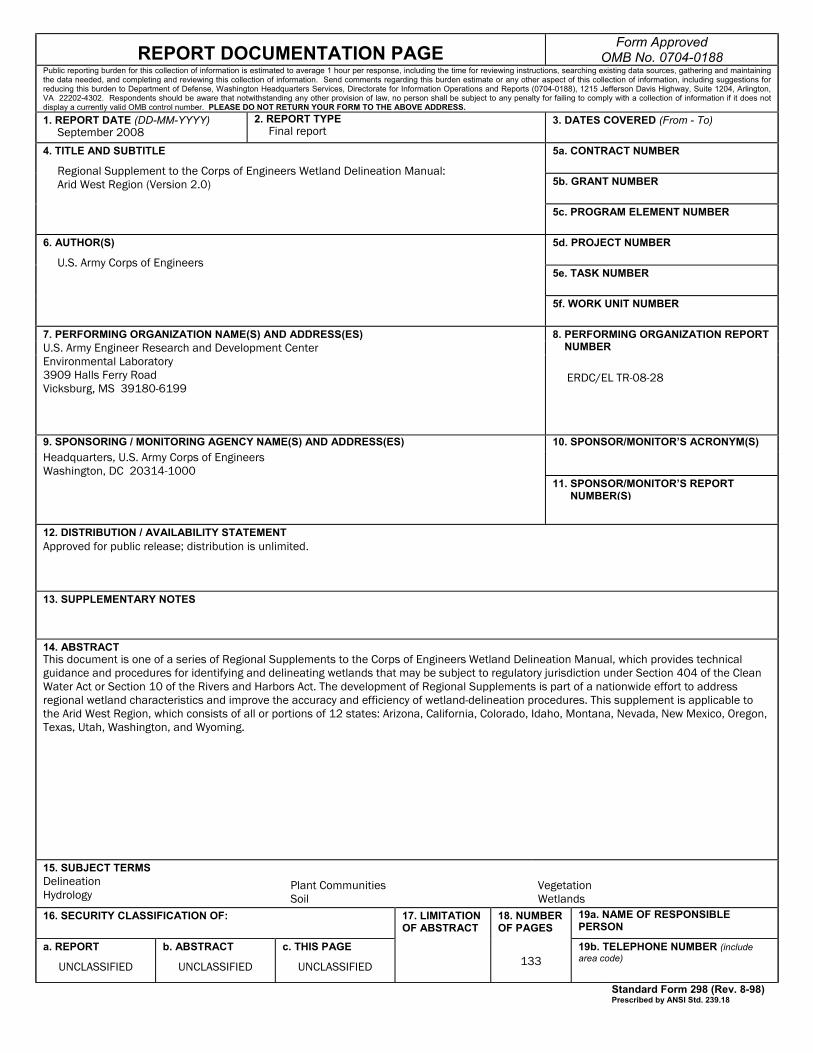
REPORT DOCUMENTATION PAGE Form Approved
OMB No. 0704-0188 Public reporting burden for this collection of information is estimated to average 1 hour per response, including the time for reviewing instructions, searching existing data sources, gathering and maintaining the data needed, and completing and reviewing this collection of information. Send comments regarding this burden estimate or any other aspect of this collection of information, including suggestions for reducing this burden to Department of Defense, Washington Headquarters Services, Directorate for Information Operations and Reports (0704-0188), 1215 Jefferson Davis Highway, Suite 1204, Arlington, VA 22202-4302. Respondents should be aware that notwithstanding any other provision of law, no person shall be subject to any penalty for failing to comply with a collection of information if it does not display a currently valid OMB control number. PLEASE DO NOT RETURN YOUR FORM TO THE ABOVE ADDRESS.
1. REPORT DATE (DD-MM-YYYY) September 2008
2. REPORT TYPE Final report
3. DATES COVERED (From - To)
5a. CONTRACT NUMBER
5b. GRANT NUMBER
4. TITLE AND SUBTITLE
Regional Supplement to the Corps of Engineers Wetland Delineation Manual: Arid West Region (Version 2.0)
5c. PROGRAM ELEMENT NUMBER
5d. PROJECT NUMBER
5e. TASK NUMBER
6. AUTHOR(S)
U.S. Army Corps of Engineers
5f. WORK UNIT NUMBER
7. PERFORMING ORGANIZATION NAME(S) AND ADDRESS(ES) 8. PERFORMING ORGANIZATION REPORT NUMBER U.S. Army Engineer Research and Development Center
Environmental Laboratory 3909 Halls Ferry Road Vicksburg, MS 39180-6199
ERDC/EL TR-08-28
9. SPONSORING / MONITORING AGENCY NAME(S) AND ADDRESS(ES) 10. SPONSOR/MONITOR’S ACRONYM(S)
11. SPONSOR/MONITOR’S REPORT NUMBER(S)
Headquarters, U.S. Army Corps of Engineers Washington, DC 20314-1000
12. DISTRIBUTION / AVAILABILITY STATEMENT Approved for public release; distribution is unlimited.
13. SUPPLEMENTARY NOTES
14. ABSTRACT This document is one of a series of Regional Supplements to the Corps of Engineers Wetland Delineation Manual, which provides technical guidance and procedures for identifying and delineating wetlands that may be subject to regulatory jurisdiction under Section 404 of the Clean Water Act or Section 10 of the Rivers and Harbors Act. The development of Regional Supplements is part of a nationwide effort to address regional wetland characteristics and improve the accuracy and efficiency of wetland-delineation procedures. This supplement is applicable to the Arid West Region, which consists of all or portions of 12 states: Arizona, California, Colorado, Idaho, Montana, Nevada, New Mexico, Oregon, Texas, Utah, Washington, and Wyoming.
15. SUBJECT TERMS Delineation Hydrology
Plant Communities Soil
Vegetation Wetlands
16. SECURITY CLASSIFICATION OF: 17. LIMITATION OF ABSTRACT
18. NUMBER OF PAGES
19a. NAME OF RESPONSIBLE PERSON
a. REPORT
UNCLASSIFIED
b. ABSTRACT
UNCLASSIFIED
c. THIS PAGE
UNCLASSIFIED 133 19b. TELEPHONE NUMBER (include area code)
Standard Form 298 (Rev. 8-98) Prescribed by ANSI Std. 239.18