Embed Size (px)
Citation preview

ERCBH2S A Model for Calculating Emergency Response and Planning Zones for Sour Gas Wells, Pipelines, and Production Facilities Volume 3: User Guide, Version 1.20

ERCBH2S was developed for the Energy Resources Conservation Board (ERCB) by:
Michael J. Zelensky, M.Sc., P.Eng. Public Safety and Air Quality Management (PSAQM Inc.)
Brian W. Zelt, Ph.D., P.Eng. Zelt Professional Services Inc.
The project was managed by Gary Neilson, B.Sc. (Hons), P.Phys. of the ERCB’s Field Surveillance and Operations Branch. The Emergency Management Group’s patience and creative suggestions are gratefully acknowledged.
The models and reports were prepared for the ERCB Field Surveillance and Operations Branch. The Emergency Management Group’s support, patience and creative suggestions are gratefully acknowledged. Clearstone Engineering Ltd. provided the real fluids thermodynamic program ERCBFLASH. Special thanks go to Dr. David J. Wilson, P.Eng. of the University of Alberta, who provided expert technical guidance and several new solutions for hazard analysis implemented in the models.
This project has benefited from a review by stakeholders. The Canadian Association of Petroleum Producers also sponsored a peer-review of the science, provided funding for the batch input function and participated in a Pilot Project to test the model. Thank-you for your comments and support.
The December 2006 draft was prepared by Brian Zelt. The January 2008 draft was revised by Michael Zelensky. The April 2008 release was revised by Kathy Hubbard of the ERCB with assistance from Brian and Michael. The July 2008 release was revised by Kathy Hubbard with final editing by Michael J. Zelensky. The December 2010 release was revised by Hua Deng with final editing by Michael J. Zelensky. ENERGY RESOURCES CONSERVATION BOARD ERCBH2S: A Dispersion Model for Calculating Emergency Response and Planning Zones for Sour Wells, Sour Pipelines, and Sour Production Facilities, Volume 3: User Guide, Version 1.20 December 2010 Published by
Energy Resources Conservation Board Centennial Place Suite 1000, 250 – 5 Street SW Calgary, Alberta T2P 0R4 Telephone: 403-297-2625 Fax: 403-297-3520 Web site: www.ercb.ca

Liability Disclaimer
These models, software and documentation were prepared by the ERCB (Energy Resources Conservation Board) and/or Clearstone Engineering Ltd., to the specifications set by ERCB. ERCB warrants that the SOFTWARE will perform substantially in accordance with the provided documentation. Neither ERCB and/or Clearstone Engineering Ltd., nor any person acting on their behalf, makes any warranty, guarantee, or representation, expressed or implied, that the software and related materials, without limitation, are free of errors, are consistent with any standard of merchantability or will meet user's requirements for a particular application, that any calculations performed by the software are correct or accurate, that the software is compatible with particular computer systems, computer peripherals and other software packages, or that the software will run uninterrupted.
EXCEPT AS PROVIDED ABOVE, THIS DOCUMENTATION AND SOFTWARE IS LICENSED "AS IS" WITHOUT WARRANTY AS TO ITS PERFORMANCE. NO OTHER WARRANTIES APPLY. ERCB AND/OR CLEARSTONE ENGINEERING LTD., DISCLAIM ALL OTHER WARRANTIES, EITHER EXPRESS OR IMPLIED, INCLUDING BUT NOT LIMITED TO IMPLIED WARRANTIES OF MERCHANTABILITY AND FITNESS FOR A PARTICULAR PURPOSE. THIS LIMITED WARRANTY GIVES YOU SPECIFIC LEGAL RIGHTS. YOU MAY HAVE OTHERS, WHICH VARY FROM PROVINCE TO PROVINCE.
IN NO EVENT SHALL ERCB AND/OR CLEARSTONE ENGINEERING LTD., OR THEIR SUPPLIERS BE LIABLE FOR ANY DAMAGES WHATSOEVER INCLUDING, WITHOUT LIMITATION, DAMAGES FOR LOSS OF BUSINESS PROFITS, BUSINESS INTERRUPTION, LOSS OF BUSINESS INFORMATION, CONSEQUENTIAL DAMAGES, OR OTHER PECUNIARY LOSS, HOWSOEVER ARISING OUT OF THE USE, ATTEMPTED USE OF OR INABILITY TO USE THIS PRODUCT, EVEN IF ERCB AND/OR CLEARSTONE ENGINEERING LTD. HAS BEEN ADVISED OF THE POSSIBILITY OF SUCH DAMAGES.

TABLE OF CONTENTS 1. Introduction...................................................... 1
Emergency Response and Planning Zone Requirements........................................1 Where to begin?............................................................................................................2 ERCBH2S Components................................................................................................3 User Qualifications .......................................................................................................3
Suitable Technical Background 4 ERCBH2S Users 5
Further Information ......................................................................................................6 How this Document is Organized ...............................................................................6
2. Installation ....................................................... 7 Minimum System Requirements .................................................................................8 About this Guide...........................................................................................................8 Where to Go for Help....................................................................................................9
ERCB Support 9 Overview of the Installation Process..........................................................................9 STEP 1: Installing setup.exe: Complete Program Installation..............................10 STEP 2: Activating the ERCBH2S Add-In.................................................................12
Add-In Manager Activation (Recommended) 12 Single Session Activation 14
3. Quick-Start ..................................................... 16
4. Program Operation......................................... 27 Introduction.................................................................................................................27 User-Interface..............................................................................................................28
Overview – The ERCBH2S Template file in Excel 28 The ERCBH2S Excel Pages 29 Typical or Technical View? Hidden Technical Pages 32 Excel Functionality 33 ERCBH2S Excel Menus 33
Technical Submenu 34 Batch Submenu 35 Setup Submenu 37
ERCBH2S Excel Button-Bar 38 Saving Scenarios as Excel Files 40 Importing and Exporting ERCBH2S BATCH Page 40 ERCBH2S Excel Print Settings 43 ERCBH2S Excel Pages – RED FLAG WARNINGS 43
The ERCBH2S Calculation Process..........................................................................43 Run ERCBSLAB 43 Gas Well Calculation Process 46 Liquid Pipeline and Liquid Well Calculation Process 48 Gas Pipeline Calculation Process 48
ESD Closure 49 Ae/Ap Ratio Search 50
Calculate EPZ 51
5. INPUTS Page .................................................. 53 Entering Data ..............................................................................................................54 Erasing the Inputs Page.............................................................................................55
TABLE OF CONTENTS i

Red Flags and other Warnings..................................................................................55 Red Flag Warnings 55
Missing Entry 56 Out of Bounds Entry 56 Recalculation Required 56
Orange Warnings 57 Orange Resets 58 Green Notifications 59
Administrative.............................................................................................................59 ERCBH2S Page Labels 63 Sour Operation Type 63 Analysis Type 65
SOURCE MITIGATION - General 66 Licensee/Applicant Responsibility 66
Gas Pipeline ................................................................................................................67 Gas Pipeline Group- Source Mitigation Sub-section 71
When to Change the Default Settings 72 Gas Pipeline Group - Orange Resets 74
Gas Well.......................................................................................................................75 Gas Well - Source Mitigation Sub-section 77
When to Change the Default Settings 78 Gas Well Group - Orange Resets 79
Liquid Pipeline or Liquid Well ...................................................................................79 Liquid Pipeline and Liquid Well Group - Source Mitigation Sub-section 86
When to Change the Default Settings 87 Liquid Pipeline or Liquid Well Group - Orange Resets 88
Sour Gas Composition...............................................................................................89 Advanced User Selected Case ..................................................................................90
6. Calculation Pages .......................................... 92 Common Pages...........................................................................................................92
CONSTANTS 92 ERCB Default Inputs 92 Physical Constants 95
SHARED 96 ERCBFLASH 96 ERCBFLASH OUTPUT 96 ERCBSLAB 96 ERCBSLAB OUTPUT 96 TOX OUTPUT 97 MAX OUTPUT 97 METMATRIX 97 HAZARD DISTANCES 98
Gas Pipeline Pages.....................................................................................................99 SOUR GAS PIPELINE 99 ESD CLOSURE 100 AeAp ITERATION 100
Gas Well Page ...........................................................................................................100 SOUR GAS WELL 100
Liquid Pipeline/Well Page ........................................................................................101 SOUR LIQUID 101
7. Output Pages................................................ 102 ERP SUMMARY.........................................................................................................102
Erasing Calculation Results 105 HAZARDS ..................................................................................................................106
User Selected Case 106 Maximum of Screening Hazard Cases 108
TABLE OF CONTENTS ii

GRAPH-MET ..............................................................................................................109 GRAPH-ERCBSLAB (x) ............................................................................................112 GRAPH-TRANSIENT(x).............................................................................................113 GRAPH-STEADY(x)...................................................................................................115
8. Batch Page ................................................... 117 Introduction...............................................................................................................117 Working with the BATCH Page – Summary Overview..........................................118
Data Entry 118 Calculating Emergency Response and Planning Zones 118
Batch Page / Inputs Page Relationship ..................................................................119 General 119 Input Data Connection Between the Pages 119 Calculation Results (Outputs) Data Connection Between the Pages 120
From INPUTS to BATCH 120 From BATCH to INPUTS 121
Entering Data to the Batch Page.............................................................................122 Copying, Deleting, and Editing Rows of Data on the BATCH Page 123
Deleting Rows of Data 124 Checking for Red Flag and Other Warnings 125
Batch Control Group ................................................................................................126 Run or Not Run 126 Print/Save 126
Batch Operations......................................................................................................127 Check for Scenario Duplicates 127 Batch Run ERCBSLAB 128 Batch Calculate EPZ 128
Batch Output Group .................................................................................................129 Errors 129 Output Data Fields 130
Saving a Batch Page as an Excel File ....................................................................130 Creating a Batch Export File for ERCB Submission.............................................131 Batch Page Tutorial ..................................................................................................132
9. Pipeline Gathering Systems......................... 133 Overview....................................................................................................................133
Equivalent Segment Length (between ESDs) 134 Equivalent Cumulative Pipeline Volume (between ESDs) 135
Gathering System Analysis .....................................................................................136 NODE 136 PIPELINE SEGMENT 137 Example Illustration 1 (Single Segment) 137 Illustration 1 - Summary Discussion 138 Example Illustration 2 (Connecting Segments) 138 Illustration 2 – Summary Discussion 140 Conclusion 140
Gas Gathering System Analysis – Tutorial ............................................................141 Introduction 141
NODE LABEL 141 NODE NUMBER 141 NODE POSITION 143 PIPELINE SEGMENT LABEL (SCENARIO NAME) 143
Tutorial 143 Tutorial Variation 1 – Complex Node Location 148 Tutorial Variation 2 – Other Licensee Tie-in 150
Formulae for Pipeline Networks..............................................................................153
10. EXAMPLE 1: Gas Pipeline ........................... 154
TABLE OF CONTENTS iii

TABLE OF CONTENTS iv
Tutorial.......................................................................................................................154 Step-By-Step Procedure 157 Variation 1: Segment Length 164
11. EXAMPLE 2: Gas Well.................................. 168 Tutorial.......................................................................................................................168
Step-By-Step Procedure 169 Variation 1: Sour Gas Well – Change Time to Ignition 177
12. Troubleshooting and FAQs........................... 183 Non-reportable Error Messages..............................................................................183 Reportable Error Messages.....................................................................................183
ERROR #9 184 ERROR #1004 184 ERROR #9005 184 Version Issue 185
Installation Troubleshooting ...................................................................................186 Program Troubleshooting........................................................................................186
Not an ERCBH2S Spreadsheet 186 General Troubleshooting .........................................................................................186
Excel Security Levels and Running the ERCBSLAB Application 186 Interfacing with other User Spreadsheets 187
ERCBFLASH ERRORS .............................................................................................188 ERCBSLAB ERRORS ...............................................................................................189
13. References ................................................... 197

Introduction 1
1. Introduction
ERCBH2S, a Model for Calculating Emergency Response and Planning Zones for Sour Gas Facilities
Emergency Response and Planning Zone Requirements The Energy Resources Conservation Board (ERCB) has developed ERCBH2S for Calculating Emergency Response and Planning Zones for Sour Gas Facilities which are compliant with the requirements of Directive 071 – Emergency Preparedness and Response Requirements for the Petroleum Industry.
This User Guide is for the ERCBH2S Emergency Response and Planning (ERP) zones dispersion modelling spreadsheet.
The User Guide outlines how to calculate ERP zones using the model and provides much of the information about the User inputs required for the calculations. For a submission to the ERCB, complete requirements are provided in Directive 071.
1

Where to begin? Several chapters in this manual take the user step-by-step through various applications of the ERCBH2S model, while others are designed for user reference. To use ERCBH2S it is not necessary to read the entire User Guide. A suggested format (in order) for a first time user is:
1. User Qualifications in Chapter 1 (this chapter)
2. Program Installation – Chapter 2
3. Quick-Start – Chapter 3
4. Inputs Page – Chapter 5. This chapter describes the ERCBH2S INPUTS page in detail, cell by cell. No user should be entering data to ERCBH2S without referencing this chapter.
5. *Gas Well Example Tutorial – Chapter 11
6. Batch Page – Chapter 8
If modelling pipelines, then continue through:
7. Gas Pipeline Example Tutorial – Chapter 10
8. Pipeline Gathering Systems – Chapter 9
*Even if a user is not modelling wells, the Gas Well Example Tutorial is recommended because it requires fewer inputs than pipeline modelling, and it acquaints the user with the ERCBH2S BATCH page.
1 Introduction 2

ERCBH2S Components The ERCBH2S model documentation is comprised of several components that are described in the following table.
Volume Description Directive 071: Emergency Preparedness and Response Requirements for the Petroleum Industry
This directive provides the requirements for the industrial operator. It covers not only sour operations but any activity where a hazard exists with the potential to cause a risk to the public.
Overview Written for industrial operators and public with a particular interest in ERCBH2S. It provides an overview of the ERCB hazard management process and presents a higher level summary of the key components of the ERCBH2S software.
Volume 1: Technical Reference Document Version 1.20
Written for the technical specialist and to document the complex science within ERCBH2S. It provides the science required to calculate the hazard zone and the basis for selecting the components used to make the calculations within ERCBH2S.
Volume 2: Emergency Response Planning Endpoints
Written for the technical specialist with a particular interest in toxicology. It presents the data available to choose an EPZ endpoint, toxicological calculations and the EPZ endpoint values for H2S.
Volume 3: User Guide Version 1.20
Written for the ERCBH2S user, it provides a description of the spreadsheet program usage, including installation instructions, descriptions of input and output from the program. Step-by-step tutorials to help familiarize the user with the program interface and interpret results are included.
ERCBH2S Spreadsheet based program used to calculate planning zones. Includes ERCBSLAB and ERCBFLASH programs.
All of these documents are available on the ERCB website.
User Qualifications ERCBH2S is freely distributed to update emergency response planning within Alberta. ERCBH2S is a complex tool that calculates site-specific ERP zones
1 Introduction 3

using thermodynamics, fluid dynamics, atmospheric dispersion modelling, and toxicology. Hazard assessment is a multidisciplinary and iterative task with many assumptions and judgments. The approach, default ERCB inputs and constants have been carefully selected in order to balance hazard and safety to ensure that the ERP zones are representative yet err on the side of public safety.
ERCBH2S models were created so that a minimal amount of technical background is required to run the models. However, there remains some technical knowledge required to supply suitable inputs and the ability to understand whether the output is appropriate for the inputs and meets the needs of stakeholders. The user must recognise that the models are technical in nature and the correct interpretation of the result may require technical expertise that proceeds from consequences of the inputs. That is, garbage-in equates to garbage-out.
The models have been created with a professional commitment to environmental protection and safeguarding the well-being of the public. It is the responsibility of the software user to accept and continue this commitment in their application of the software. The software is supplied as a tool to assist the user to comply with applicable statutes, regulations and bylaws. Neither the software nor application of the software is intended to replace statutes, regulations or bylaws.
Suitable Technical Background Environmental issues are interdisciplinary in nature. The practice of environmental science requires the integration of diverse disciplines and philosophies; many projects will require a team of appropriate specialists to address complex environmental issues. Persons doing the assessment should undertake only that aspect of environmental work that they are competent to perform by virtue of training and experience. Thus they should seek out and use appropriate Environmental Specialists to provide expert advice on certain environmental issues.
The basis of the models is technical with expertise required in chemistry, thermodynamics, atmospheric physics, meteorological processes, industrial processes and regulatory affairs. While the full technical background is not a requirement to execute the models, the user of the software is required to have a general engineering and environmental science background; a general knowledge of the emission sources: wells, pipelines, and pipeline networks; and a working knowledge of the most current version of:
• ERCB Directive 071 – Emergency Preparedness and Response Requirements for the Petroleum Industry
• ERCB Directive 056 – Energy Development Applications and Schedules • ERCB Directive 026 – Setback Requirements for Oil Effluent Pipelines • Alberta Environment Air Quality Modelling Guideline.
1 Introduction 4

ERCBH2S Users 1. should develop and maintain a reasonable level of understanding, awareness
and monitoring system (check that outputs are appropriate for model inputs) of the software, its inputs and its outputs;
2. shall use appropriate expertise of specialists in areas where the user’s knowledge alone is not adequate to address the input or interpret the output;
3. shall apply professional and responsible judgment in their considerations of the model inputs and outputs;
4. shall comply with regulatory requirements and endeavour to exceed or better them;
5. shall disclose information necessary to protect public safety to appropriate authorities; and,
6. should actively work with others improve their understanding and practices.
There are many technical inputs required by ERCBH2S to perform the ERP zone calculations. Some have been prescribed by ERCB mandatory default entries. Others are input by the User for the specific sour gas facility. Source Mitigation entries must be based on actual capabilities. Use of ERCBH2S and understanding whether the predictions are appropriate for the user inputs still, however, requires some specific technical understanding. If terminology such as “hazards, endpoints, fluctuations, choked flow, or stability class” is unfamiliar, you may require further expertise to operate the model and describe the results.
1 Introduction 5

6 1 Introduction
Further Information For all of the information related to ERCBH2S and latest updates visit the ERCB website:
http://www.ercb.ca/portal/server.pt/gateway/PTARGS_0_0_303_263_0_43/http%3B/ercbContent/publishedcontent/publish/ercb_home/industry_zone/rules__regul
ations__requirements/directives/directive071_model.aspx
How this Document is Organized This User Guide is organized as both an instructional guide and a tutorial. This guide does not describe the technical basis (see the companion document “Volume 1: Technical Reference Document” for a technical description of the equations and formulations), but describes the installation and use of the ERCBH2S program. This guide is divided into the following chapters:
Installation How to install the ERCBH2S program
Quick-Start A tutorial to familiarize the user with basic functions to navigate the program
Operation How the ERCBH2S program works
INPUTS page A description of the user inputs
Calculation Pages A description of the calculation pages
Output Pages A description of the output pages
Batch Processing A description of how to set up the ERCBH2S program in batch mode processing
Pipeline Gathering Systems A description of how to set up the ERCBH2S program for assessment of gas and liquid pipeline gathering system networks, including a tutorial example
Example 1: Gas Pipeline A tutorial for a gas pipeline segment release
Example 2: Gas Well A tutorial for a gas well release

2. Installation
This chapter describes how to install the ERCBH2S software. The install package includes the following modules:
• ERCBH2S.xla - a Microsoft®-Excel application software for Windows® containing macros and detailed calculations to determine emergency response and planning Zones for gas wells, gas pipelines and liquid pipelines.
• ERCBH2S-Inputs(V120).xls- a template spreadsheet that is the user-interface with intermediate calculations for sour gas emergency response planning for gas well, gas pipelines, and liquid pipelines/wells.
• Example files - spreadsheets using the ERCBH2S-Inputs(V120).xls with example values already filled in.
• ERCBSLAB.dll – a stand-alone program based upon the USEPA-SLAB heavier than air, air quality model. ERCBSLAB includes calculations for gas well blowouts, gas pipeline blowdowns, liquid pipeline vapours, indoor exposures and toxic load for sour gas releases containing hydrogen sulphide (H2S) releases.
• ERCBFLASH.dll – a stand-alone program to calculate real gas properties of hydrocarbons required for the characterization of the releases.
The program extension .dll stands for dynamic link library. Programs are converted into dlls to allow accessible functionality with Microsoft Excel. The ERCBH2S installation contains all of the ERCBH2S programs, application and the template spreadsheets.
2 Installation 7

Minimum System Requirements ERCBH2S is a Windows® based software application requiring Microsoft® Excel. The minimum system requirements* are:
• Windows® 7, Vista, XP, 2000, NT 4.0(SP3 or greater)
• Microsoft® Excel. (Program testing completed on Office 2000, Office 2002,Office 2003, Office 2007and Office 2010. The program only runs on 32bit Office.)
• 16 MB free hard disk space • 800x600 resolution • 300 MHz processor • 256 MB RAM • Windows® - compatible mouse • Optional: colour or b/w printer (300 dpi or better
recommended) * The installation of the software requires Administration level security privileges on the computer. If you do not have these privileges
About this Guide The following symbols and conventions are used in this guide
Bold Used for menu, command, and keyboard selections you make and screens you will see.
Italics Used for emphasis and to identify new terms
text User typed responses or entries
Helpful information about a particular topic.
Important information to prevent problems and ensure that you are successful in using the software.
link A hyperlink to a section within the User Guide, an internet web site or email address
2 Installation 8

Where to Go for Help For additional help with the ERCBH2S program, its installation and use, contact the following:
ERCB Support Check the site below for detailed support for ERCBH2S including the latest revisions of the model, technical reference document, user guide and for important user messages:
http://www.ercb.ca/portal/server.pt/gateway/PTARGS_0_0_303_263_0_43/http%3B/ercbContent/publishedcontent/publish/ercb_home/industry_zone/rules__regul
ations__requirements/directives/directive071_model.aspx
Please send comments, program operation problems and problem spreadsheets to:
Overview of the Installation Process If you have not already done so, download the installation software from the ERCB website (see above).
The single install program setup.exe file contains all of the software required for the ERCBH2S program (including ERCBSLAB, ERCBFLASH and template spreadsheet) to run within the users existing Microsoft Office (including Excel) environment.
STEP 1: The install program (provided in the software download) installs the ERCBH2S as a program in the system registry.
The installation software allows two options for the software installation:
• Full Installation (Recommended) Installs ERCBH2S, ERCBSLAB, ERCBFLASH and template spreadsheet. Creates a subdirectory for the spreadsheet template files.
• Custom Installation Installs only selected components.
2 Installation 9

STEP 2: After you have run the install software, you must complete the installation using either of two options:
• You may activate the ERCBH2S Excel add-in so that ERCBH2S is loaded every time you open Excel, or
• You can launch the ERCBH2S program for a single Excel session.
The install program will create folders and copy the following files to the folders, or you may select the destination:
File Default folder
ERCBH2S.xla ERCBH2S-inputs(V120).xls Uninstall ERCBH2S
C:\program files\ERCBModels\ERCBH2S
ERCBSLAB.for MODULES.for
C:\program files\ERCBModels\ERCBH2S\SOURCE
ERCB_SLAB.dll ERCB_FLASH.dll ERCB_THERMOU.dll
C:\windows\system32
The dynamic link library (*.dll) files may be installed to alternate folder locations during the installation.
STEP 1: Installing setup.exe: Complete Program Installation
If you get an error message regarding Administrator privileges refer to the “Administration Privilege for Windows” in the “Troubleshooting and FAQs” section, later in this guide.
To ensure a successful installation, follow the steps outlined below.
2 Installation 10

1. Using Windows Explorer or the My Computer icon on your computer desktop, locate the installation file you downloaded from the ERCB website.
Double click the installation file to open and run the install sequence.
The InstallShield Preparing to Install window will be briefly displayed.
The Welcome to the InstallShield Wizard for ERCBH2S welcome and loading screen will appear.
Answer Next to continue installing the ERCBH2S software, or Cancel to end the installation.
2. The ERCBH2S License Agreement screen will appear.
The License Agreement covers both the ERCBSLAB and ERCBFLASH programs.
3. After reading the License Agreement, select I accept the terms of the license agreement.
Click Next to continue
4. The Customer Information screen will appear.
5. Enter you User Name and Company Name.
If there are separate users that log in to use your computer, you can choose whether you would like all users to be able to use the software or just you. The All Users option is recommended.
Make your choice and click Next.
The Destination Folder screen will appear.
6. In the Destination Folder section of the screen, you can see the default location where the software will be installed. If you wish to change this, click Browse and choose a new location.
When you are ready, click Next.
The InstallShield Ready to Install the Program window should appear.
2 Installation 11

7. Click Install.
The InstallShield Installing… window will briefly appear and display the status of the installation of the program modules being installed.
The InstallShield Wizard Complete window will appear.
8. Click Finish to end the wizard InstallShield and complete the installation of the ERCBH2S program.
STEP 2: Activating the ERCBH2S Add-In In STEP 1, the software required for the ERCBSLAB and ERCBFLASH programs is installed. STEP 2 - Activating the ERCBH2S ADD-In, the ERCBH2S.xla is configured to run within Microsoft Excel. There are two options for this configuration:
1. Configure Excel so that ERCBH2S.xla application is loaded every time Excel is opened. (Recommended) The advantage with this configuration is that a template file (ERCBH2S-inputs(V120).xls or example files) can be opened and the ERCBH2S calculations can be performed without requiring the user to additionally load the ERCBH2S.xla application program.
2. Run the ERCBH2S.xla program for a single session of calculations. The advantage with this configuration is that users using Excel frequently for other than ERCBH2S calculations are not loading the ERCBH2S.xla application and unnecessarily occupying computer resources.
The user can change the configuration between the two options at a later date, by de-activating the ERCBH2S Add-in within Excel and using the alternative configuration.
Add-In Manager Activation (Recommended) The Excel Add-in Manager is used to activate Excel Add-in applications. Note that by activating the add-in in this way, it will always be available in the menu bar when you start Excel (unless you turn it off manually). In this case, you do not need to change Excel’s security setting.
2 Installation 12

By activating the ERCBH2S.xla Add-in using the Excel Add-in Manager, the ERCBH2S application will always be available in the menu bar when you start Excel (until such time as you turn it off, also using Excel Add-in Manager).
The ERCBH2S application menu bar is displayed but is active only with ERCBH2S template files (e.g., ERCB-inputs(V120).xls or renamed copies).
Follow these steps to activate the add-in.
1. Open Microsoft Excel
ERCBH2S is designed to be compatible with Microsoft Excel from Office® 2000 or higher version.
2. On the main menu bar, click on Tools
Select Add-Ins… from the list of operations.
If “Add-Ins…” is not displayed on the menu, select “»” to display the full list of menu options. Alternatively, right-click in the tool-bar area, select Options and un-check the “Menus show recently used commands first”
3. The Add-Ins manager window will appear
A list of Excel add-ins that are currently registered with the Add-In Manager are displayed. Several may appear activated, by displaying a check mark next to the title of the add-in.
Click Browse… to locate the ERCBH2S.xla add-in.
4. The Browse window will be displayed.
5. Locate the ERCBSLAB.xla add-in by navigating to the installation folder you selected during STEP 1 - Software Installation. If you installed to the default directory, the path is: C:\Program Files\ERCBMODELS\ERCBH2S
6. Click on the ERCBH2S.xla file.
A version number may be displayed after the “ERCBH2S” to identify the program version number.
2 Installation 13

7. Click OK.
The ERCBH2S add-in will be displayed in the add-in Manager, as shown below. If the ERCBH2S add-in is not ‘checked’, then click using the mouse in the box beside “ERCBH2S”, to display a check-mark.
8. Click OK to complete the process.
ERCBH2S will now be displayed in the main menu bar.
The ERCBH2S button bar will appear when an ERCBH2S template spreadsheet is opened
9. Skip the “Single Session Activation” and follow the instructions in the “Quick-Start” section
Single Session Activation To launch the ERCBH2S.xla add-in for a single session, follow these steps:
10. Click on the Start menu button on your computer desktop.
Select Programs
2 Installation 14

2 Installation 15
Select ERCBMODELS
Select ERCBH2S
Select Launch ERCBH2S.xla
11. The Microsoft Excel application window will open.
ERCBH2S will now be displayed in the main menu bar.
The ERCBH2S button bar will appear when an ERCBH2S template spreadsheet is opened
To change the security setting in Excel, go to the Tools menu then select Macro and then Security. In the Security window, you can change the setting to Medium, which will allow you to run the macro.
When Excel is closed the ERCBH2S application will close also. If Excel is restarted, the ERCBH2S application will not be opened unless you repeat the procedure described in this section.
12. Continue to follow the instructions in the “Quick-Start” section.

3. Quick-Start
Now that you have installed the software you will run a Quick-Start tutorial to become familiar with ERCBH2S and how to calculate Emergency Response and Planning (ERP) zones. Complete the following steps:
If you have pre-set the install option for ERCBH2S.xla (STEP 2: Activating the ERCBH2S Add-In on page 12) go directly to step 2 in this Quick-Start tutorial. Otherwise, begin at step 1.
1. Click on the Start menu button on your computer desktop.
Select Programs
Select ERCBModels
Select ERCBH2S
Select Launch ERCBH2S.xla
(The ERCBH2S menu in Excel is now launched)
Choose ‘Enable Macros’
2. Click on the Start menu button on your computer desktop.
Re-select Programs
Re-select ERCBModels
Select ERCBH2S-Inputs(V120).xls
(An ERCBH2S example file in Microsoft Excel is now launched)
3 Quick-Start 16

3. The example files already contain in the row 11-13 in the BATCH page. It opens on the ABOUT page, which provides a summary of the Introduction section of the User Guide and brief Instructions. Notice the Legend and colour scheme used for cells and sheet tabs. (Some earlier versions of Excel do not display the page/sheet tabs in colour.)
4. Are the ERCBH2S menu and menu-bar displayed and activated (non-grey)? If so, continue to the next step. If not, then ERCBH2S.xla was NOT launched, and you need to return to step 1 in this Quick-Start tutorial.
5. Select the INPUTS page.
Scroll up and down. The INPUTS page for example files are already completed, allowing the user to view example entries.
Because this INPUTS page was created for a tutorial, each of the three ‘details’ sections (Gas Pipeline, Gas Well and Liquid Pipeline/Well) have been completed with sample user entries. Normally a user completes only one of the three the details sections – the one related to the sour operation type being modelled.
Input fields are shown with white background, input prompts and comments in green, and default or calculation (protected) fields in grey. All user entries are in column C.
3 Quick-Start 17

3 Quick-Start 18
6. The first section of the INPUTS page, titled ADMINISTRATIVE, is always available for user inputs (column C).
7. Delete the user entry for ‘BA CODE’ in row 4.
Notice the red flag warning at the top of the page.
The red flag indicates 1 missing entry for the ERCB Submission and the Required for ERCB submission warning appears in column E.
Now delete the user entry for Surface Elevation in row 21.
Notice that the red flag remains but the message inside it has changed. Also, there is now a warning in column E for row 21 Required for calculation .
This warning appears for missing user inputs that are required for the ERCBH2S calculations to proceed. Either select the ‘Undo’ button twice (to replace the last two deleted entries) or replace the “A” entry in row 4 and the “1000” entry in row 21. The red flag disappears along with the orange warnings in column E.
For the remainder of this tutorial, you can ignore any red flags that appear at the top and bottom of the page.
8. Below ADMINISTRATIVE are three sections titled – GAS PIPELINE, GAS WELL, and LIQUID PIPELINE OR LIQUID WELL.

Access to each of these three sections is controlled by the user selection in SOUR OPERATIONS TYPE (located within ADMINISTRATIVE).
9. Locate SOUR OPERATIONS TYPE within the ADMINISTRATIVE section.
The type of sour gas or sour liquid operation selected determines which part of the INPUTS page is ‘active’.
Toggle between the eleven sour operations types and observe how the SELECTED INPUTS FLAVOUR: GAS PIPELINE, GAS WELL and LIQUID PIPELINE/WELL display changes on the rest of the INPUTS page. Depending on the user selection, one of the sour operations sections is available for user input (non-grey) and the other two are greyed-out.
Remember; for this tutorial you can ignore red flags that appear at the top and bottom of the page. Some selections will generate a red flag.
Also notice that, depending on the selection made, there are some rows within the ‘Gas Pipeline’ and ‘Liquid Well or Liquid Pipeline’ sections that are greyed out. Depending on the user selection in SOUR OPERATIONS TYPE, ERCBH2S does not require all of the inputs within a given section.
10. Within each of the three sour operations sections (GAS PIPELINE, GAS WELL and LIQUID PIPELINE/WELL), there is a sub-section titled SOURCE MITIGATION.
SOURCE MITIGATION choices reflect very specific valves and/or operational settings, along with licensee ‘action’ commitments for reducing source duration for improved hazard management. Short, smaller amounts
3 Quick-Start 19

of hydrogen sulphide released to the atmosphere equates to a smaller hazard which equates to smaller ERP zones.
Access to this sub-section is controlled by the user selection for ANALYSIS TYPE.
11. Locate ANALYSIS TYPE within ADMINISTRATIVE.
Toggle between, NO MITIGATION and WITH MITIGATION and observe how the display changes within the sour operations group selected.
12. You may have observed that the final two sections of the INPUTS page are always available for user input.
These two sections are discussed in more detail in other tutorials, and in Chapter 5 of the ERCBH2S User Guide under Sour Gas Composition and Advanced User Selected Case.
13. Using the page tabs at the bottom of the screen, select the ERP SUMMARY page.
The first part of this page to observe is the upper portion – the part above the title ‘RESULTS’ (in row 36).
The first part of the ERP SUMMARY page is a summary of all of the inputs related to whatever sour operations type is selected on the INPUTS page.
If you toggle back to the INPUTS page and change the sour operations type, the ‘inputs display’ portion of the ERP SUMMARY changes too - it always displays whatever is currently ‘active’ on the INPUTS page.
14. The ERP SUMMARY page also provides a graphic and tabular summary of the ERP zones calculated, along with a table describing applicable land-use setback information and certain other details. This information is
3 Quick-Start 20

displayed on the lower part of the page below the title ‘RESULTS’ (in row 36).
At any given time, there is only one set of calculation results (outputs) shown on the lower part of the ERP SUMMARY page. If these results don’t ‘match’ the inputs on the upper part of the page, a red flag appears at the top and bottom of almost every ERCBH2S page, including the ERP SUMMARY page.
For the tutorial example, a red flag can be removed by returning to the INPUTS page and selecting the SOUR OPERATIONS TYPE ‘LIQUID PIPELINE/WELL’ and the ANALYSIS TYPE ‘WITH MITIGATION’. This example input file already received the program ‘run’ command ‘Calculate EPZ’ - therefore these are the calculation results shown at the bottom of the ERP SUMMARY page.
15. Return to the INPUTS page. To complete the calculations required for submission to the ERCB you will run a new example file:
Select GAS PIPELINE for the Sour Operations Type.
Select NO MITIGATION for the Analysis Type.
Go to row 13 and change SCENARIO NAME to ‘Scenario 4’.
Observe that these changes caused a red flag to appear at the top of the page (because the inputs no longer match the calculation results or ‘outputs’).
Select Calculate EPZ from the ERCBH2S menu item, or select on the button bar.
As part of the ERP zones’ calculation sequence, the ERCBSLAB program (among other things) runs a total of 594 times for a pipeline. The program searches for the worst gas pipeline release ‘failure size’ (the hole size fraction exit area ratio – there are 11 of them) that produces the largest hazard zone for each of 54 different meteorological conditions (combinations of wind speed, atmospheric stability class) to get 54 different worst-release hazard distances. The weighted-averaged value of these 54 distances is calculated by multiplying the hazard distance in each of the 54 categories by the fraction of time that each meteorological condition occurs.
3 Quick-Start 21

It may take several moments to complete the calculations - depending on the speed of your computer. Pipeline calculations take longer than wells because where pipeline a pipeline calculation runs 11 x 54 times (594 times), a well runs only 54 times.
16. When the calculations are completed, the ERCBH2S program displays the ERP SUMMARY page. Review the results. If there is a red flag at the top and bottom of the page, the calculation results are invalid for ERCB submission.
Never use predicted ERP zones or include the ERP SUMMARY page printout in your ERP if a red flag appears at the top and bottom of the ERP SUMMARY page.
If a printout is required, use the printer icon , in the ERCBH2S button-bar. The ERP SUMMARY page will be sent to your default printer.
Now you will create the export file required for ERCB submission, by first saving the completed scenario to the BATCH page.
3 Quick-Start 22

17. Return to the INPUTS page. Go to ‘ERCBH2S’ on the menu-bar, select ‘Batch’, then select ‘Save INPUTS and Results to Batch Page’. Alternatively, select the Save INPUTS and Results to Batch Page
command from the button-bar.
Select the BATCH page tab at the bottom of the screen. Notice that the BATCH page has four records (rows) on it. There were already three completed records in it when you opened the Quick-Start tutorial file, and you just added another one.
Each row on the BATCH page represents a column of user inputs (from column C on the INPUTS page), and calculation results that correspond to those inputs. The BATCH page is very large and can hold hundreds of scenarios of all different sour operations types.
It is the electronic copy of the BATCH page a licensee/applicant is required to submit to the ERCB. Make a habit of scrolling over to column DO to verify that there is no error messages (red flags) listed before you create the export file for submission.
3 Quick-Start 23

18. Go to ‘ERCBH2S’ on the menu-bar, select ‘Technical’, then select ‘Batch Export’.
A prompt will appear for you to name the export file. The ERCB requires licensees/applicants to use the following file naming protocol:
BA code - ERP Plan Ref# - Date (DD/MMM/YY)
For example, if a company with the BA code of WXYZ submits a file on July 5th, 2008, the file would be named:
WXYZ-1234-05Jul08.csv
The .csv file extension - ‘comma separated variable - is automatically attached to the file name. This is the file required for ERCB submission.
The .csv file does not contain user information added to the NOTES page.
19. OPTIONAL Return to the INPUTS page. Select other combinations of sour operations type and with/without mitigation, or try changing required numerical inputs. After making some changes, selecting Calculate EPZ will activate the required calculation sequence, and a revised ERP SUMMARY page will be displayed.
20. OPTIONAL How does ERCBH2S perform all of these predictions? To see the more detailed intermediate calculation pages and results, the user can select a different ‘view’ – the technical view.
Return to the INPUTS page, and go to the menu item ERCBH2S→Setup→Hide Technical Sheets. With ‘hide technical sheets’ checked, the detailed calculation pages are hidden, and only certain
3 Quick-Start 24

pre-selected input and output pages are displayed and menu-bar buttons are active. This is considered a ‘typical view’.
Click to remove the check-mark and observe that many more page tabs are displayed at the bottom of the screen. Visit the pages and view the displayed information. This is considered a ‘technical view’.
Most users prefer the ‘typical view’, because it provides the necessary information to determine the ERP zones. However, some ERP Planners may choose the ‘technical view’ to better understand the hazards and how they can be mitigated at the source.
21. OPTIONAL Return to the INPUTS page, and go to the menu item ERCBH2S→About ERCBH2S. The following window box will appear:
This provides the information about the program and the version numbers. By clicking on the OK button, the macros are reset and the display disappears.
3 Quick-Start 25

3 Quick-Start 26
22. Exit without saving (to prevent over-writing the Quick-Start tutorial file).
Now that you have run the Quick-Start tutorial you can learn more about the inputs, calculations, outputs, batch processing, and try a few more examples.
To continue working with the ERCBH2S program, the next chapter to review is Chapter 5 – Inputs. This chapter provides detailed instruction for what to enter (and what not to enter) into the ERCBH2S INPUTS page. Until a user is well acquainted with ERCBH2S, Chapter 5 should always be referenced when completing the INPUTS page.
Until a user is well acquainted with ERCBH2S, Chapter 5 should always be referenced when completing the INPUTS page.

4. Program Operation
This chapter provides the following information about the general operation of the ERCBH2S program:
• what the principal files are and how they work together
• what the buttons/menu items do
• overview of the calculation processes
• importing and exporting model inputs
• printing the results
Introduction The ERCBH2S program uses the familiar Microsoft Excel as host for the calculations. The ERCBH2S application consists of two parts
• ERCBH2S.xla program (the macros and detailed calculations with links to the dynamic link library - .dll), and
• ERCBH2S-INPUTS.xls.
To run the ERCBH2S program, both the ERCBH2S.xla program and an ERCBH2S – INPUTS.xls file must be open.
If the ERCBH2S application is configured as an Add-in for automatic loading when Excel is started, it is not necessary to open both the .xla and .xls files each time. ERCBH2S.xla will open automatically every time an .xls file is opened. See Activating the ERCBH2S Add-In in Chapter 2.
ERCBH2S.xla is a set of macros and programming that runs as a Microsoft Excel add-in (an application that runs within Excel, adding extra functions and capabilities). One of its many functions is linking to the .dll program files.
Dynamic link library files (.dll) are program files loaded into your computer when ERCBH2S is installed. These programs; ERCBSLAB, and ERCBFLASH are accessed (linked) via ERCBH2S.xla.
4 Program Operation 27

ERCBH2S-INPUTS.xls contains the user-interface for the calculations, allowing the user to input information and view calculation results.
ERCBH2S-INPUTS.xls is an Excel spreadsheet file (.xls) that acts as a template file for the ERCBH2S application.
All inputs and outputs are stored within the ERCBH2S- INPUTS. xls template file. Although technical debugging files are stored in separate text files in the same directory as the ERCBH2S template file, most users do not require using these extra text files.
User-Interface
Overview – The ERCBH2S Template file in Excel All user input and output are controlled using an ERCBH2S template file for Microsoft Excel. The template file (.xls) contains several Excel worksheets (pages). While user inputs for the ERCBH2S calculations are on a single page, calculations and outputs are displayed on several pages - all within the same template file.
You may use either a template (blank) or example file to build your release scenario. It is recommended that you create a new folder for your scenario files. It is also recommended that you create a file naming convention for your scenario files to avoid over-writing the ‘pre-packaged’ blank template or example files. Following this advice allows the user to create new projects from the same known starting point.
If you accidentally overwrite the blank template or example files, you can re-install them by
1. re-naming the existing template and example files; and
2. re-running the install program to re-install selected components.
4 Program Operation 28

Within the single blank template or example file (both ‘.xls’ files), initial user selections on the INPUTS page lead to one of three sour operation ‘types’ (or ‘flavours’):
1. GAS PIPELINE. Used to model gas pipeline releases. A gas pipeline release has a transient flow rate (transient jet).
2. GAS WELL. Used to model gas well releases. A gas well release has a steady in flow rate (steady jet).
3. LIQUID PIPELINE OR LIQUID WELL. Used to model liquid releases from pipelines or wells. A liquid release creates a pool of liquid on the ground, with the sour gas rapidly coming out of solution. The release has a steady flow rate (steady jet).
ERCBH2S calculation process differs for each of the sour operation types. Processes details are described later in this chapter under Calculation Process.
The ERCBH2S Excel Pages ERCBH2S has the following four types of pages in the Excel user interface – each category identified by name and page tab colour (for Office 2002 and newer versions of Excel only):
USER INFORMATION ERCB contacts, brief instructions and error code descriptions, and a blank page for user ‘notes’. (Blue page tabs)
INPUTS Prompts and data entry boxes for user specified values for the ERCBH2S models. (Green page tabs)
TECHNICAL/CALCULATION (INTERMEDIATE) Intermediate steps in the modelling process: for the input into ERCBSLAB or ERCBFLASH; and for post-processing of the data into a user-friendly format. Calculations are divided between Excel (the user can view these calculations within Excel) and compiled code programs, ERCBSLAB, and ERCBFLASH (the equations used in these programs are described in the Technical Reference Document and in the USEPA SLAB User Guide). (Yellow page tabs)
SUMMARY GRAPHICS (OUTPUT) Output information summarized in both tabular and graphical form. (Pink page tabs)
4 Program Operation 29

Tabs for the page types are colour coded for Office 2002 and newer versions of Excel (earlier versions do not display the page colours). User information pages are blue, input pages are green, calculation pages are yellow, and output pages are pink.
Recall that the ERCBH2S model uses an industry standard model (US EPA SLAB model), modified to perform additional calculations. The input / output format used by the ERCBH2S model is adapted from the USEPA SLAB model. ERCBH2S reconfigures the user-specific inputs into the proper format for the ERCBH2S model.
A complete list of user-interface pages are described in the following table:
4 Program Operation 30

View Page Name Purpose Typical Technical Description
ABOUT User Information
General information and instructions for use of the spreadsheet and submission of the results to the ERCB. Use this sheet to link to the latest information regarding ERCBH2S.
ERROR CODES User Information Error code listing. Consult this sheet to interpret error codes.
NOTES User Information A formatted sheet for the User to record details about the inputs.
BATCH Input and Results User input for batch processing (multiple scenarios in a single file) and
pipeline gathering system plus summary of results.
INPUTS Input User input for administrative, facility, mitigation and sour gas composition data.
CONSTANTS Input ERCB default inputs, not editable.
SHARED Calculation Includes calculations of chemical/physical properties and gas composition that are common to all ERCBH2S analysis flavours, not editable
ERCBFLASH Calculation ERCBFLASH input variables are created from the calculations on other pages.
ERCBFLASH OUTPUT Read Only Data Output variables from ERCBFLASH.
ERCBSLAB Calculation ERCBSLAB input variables are created from the calculations on other pages.
ERCBSLAB OUTPUT Read Only Data Variables from ERCBSLAB. Selected values from this page are graphed on the GRAPH-ERCBSLAB(x).
TOX OUTPUT Read Only Data Predictions from ERCBSLAB for user selected case. Provides concentrations and toxic load-equivalent concentrations as a function of down wind distance. Data from this page are graphed on the GRAPH-TRANSIENT EVENT (X) or GRAPH-STEADY EVENT (X).
MAX OUTPUT Read Only Data Maximum of predictions from ERCBSLAB for all screening cases. Provides concentrations and toxic load-equivalent concentrations as a function of down wind distance. Data from this page are graphed on the GRAPH-TRANSIENT EVENT (X) or GRAPH-STEADY EVENT (X).
ERP SUMMARY Output Summary of Inputs and Emergency Response and Planning Zones. This page to be included for each well and pipeline segment in the Emergency Response Plan.
HAZARDS Tabular Summary Summary of Release Description, User Selected Case Hazard Distances,
Maximum of Screening Hazard Cases ERP Zones.
GRAPH-MET Graphic
Summary Tabular and graphical representation of the METMATRIX data. Hazard distances for the range of meteorological conditions and wind speeds. Presented in tabular and graphical format. The maximum computed distance is highlighted.
GRAPH-ERCBSLAB(x) Graphic
Summary Graph showing how variables change as the release moves away from the source.
METMATRIX Tabular
Summary Hazard distances for the Screening Matrix of 54 different stability class / wind speed combinations.
HAZARD DISTANCES Tabular
Summary Calculates worst-release with worst-dispersion distance and worst-release with averaged-dispersion distance.
SOUR GAS PIPELINE flavour SOUR GAS PIPELINE Calculation Calculates inputs to ERCBFLASH and uses output from ERCBFLASH to
calculate inputs to ESD CLOSURE and ERCBSLAB.
ESD CLOSURE Tabular
Summary Intermediate calculation page to determine ESD valve closure time for the input settings for the user selected AeAp.
AeAp-ITERATION Tabular and
Graphic Summary
Intermediate calculation page to determine the pipeline source exit area to pipeline area that leads to the largest ERP Zones
GRAPH-TRANSIENT EVENT(x)
Graphic Summary Graphical representation of the TOX OUTPUT and MAX OUTPUT
concentrations. The Planning and Alert Criteria are highlighted on the graph
4 Program Operation 31

4 Program Operation 32
View Page Name Purpose Typical Technical Description
SOUR GAS WELL flavour SOUR GAS WELL Calculation Calculates inputs to ERCBFLASH and uses output from ERCBFLASH to
calculate inputs to ERCBSLAB.
GRAPH-STEADY EVENT(x)
Graphic Summary Graphical representation of the TOX OUTPUT and MAX OUTPUT
concentrations. The Planning and Alert Criteria are highlighted on the graph
SOUR LIQUID PIPELINE/WELL flavour SOUR LIQUID Calculation Calculates inputs to ERCBFLASH and uses output from ERCBFLASH to
calculate inputs to ERCBSLAB.
GRAPH-STEADY EVENT(x)
Graphic Summary Graphical representation of the TOX OUTPUT and MAX OUTPUT
concentrations. The Planning and Alert Criteria are highlighted on the graph
Hidden Technical Pages All ERCBH2S Excel pages (sheets) are available in the blank template or example files. Because most users require only a few of the pages, the blank template and example files open with most of the technical pages ‘hidden’. This is referred to as the ‘typical view’. The typical view displays five page tabs – ABOUT, NOTES, BATCH, INPUTS and ERP SUMMARY. Most users prefer the typical view because it provides the necessary information to determine the ERP zones.
Some ERP Planners prefer access to all ERCBH2S Excel pages to better understand the hazards and how they can be mitigated at the source. This view is referred to as the ‘technical view’. To access this view, from the INPUTS page the user must go to the menu item ERCBH2S→Setup→Hide Technical Sheets. With ‘hide technical sheets’ checked, the detailed calculation pages are hidden, and only five pre-selected input and output pages are displayed (the typical view).

With the check-mark ‘clicked’ for removal, all the ERCBH2S Excel page tabs are displayed at the bottom of the screen. This is the technical view.
For users choosing the technical view, a copy of the ERCBH2S User-Interface Page Guide will provide handy reference (previous section).
Excel Functionality The ERCBH2S user-interface was developed within Excel to provide a relatively common platform for most technical users. The Excel spreadsheet also provides a transparent implementation of the model as opposed to compiled code. Because Excel is used as the interface, much of the Excel functionality is retained within the ERCBH2S program. That is, user input boxes can accept numeric or text information, as well as calculations including Excel function calls.
Using function calls, a technical user can link input cells (such as on the BATCH page, see page 117) to other spreadsheets.
Information can be copied to and from the template files using standard Excel methods, such as the Cut, Copy and Paste edit commands.
The ERCBH2S program template spreadsheets include security protection on non-user-input cells and pages. You will not be able to Cut or Paste to these cells.
ERCBH2S Excel Menus The ERCBH2S application menu is added to the main menu-bar for Excel when the ERCBH2S application is loaded using the Add-in Manager or when the XLA file is opened using File→Open→ERCBH2S.xla. The ERCBH2S application menu is shown below. These options link to the principal ERCBH2S program operations.
4 Program Operation 33

BUTTON DESCRIPTION
Run the ERCBSLAB calculation for the inputs on the INPUTS page for the user selected wind speed, meteorological stability and exit area ratio.
Run the ESD Closure calculation for the gas pipeline entries on the INPUTS page
Run the Ae/Ap Ratio Search (exit area ratio) for the gas pipeline entries on the INPUTS page for the user selected wind speed and meteorological stability.
Calculate EPZ for the inputs on the INPUTS page to determine the ERP zones for all wind speeds, meteorological stabilities and (for sour gas pipelines) exit area ratio and ESD timing.
Print the ERP SUMMARY page.
Many selections shown under menu item ERCBH2S (and some of the sub-menu items) also appear as ‘Buttons’ on the ERCBH2S Button-bar.
Technical Submenu
The Technical submenu is shown below with a description of the menu items. These operations are provided for the technical user or for operations debugging. These operations allow the user to complete individual program steps (ERCBFLASH and ERCBSLAB) as described below.
4 Program Operation 34

BUTTON DESCRIPTION
Run ERCBFLASH Only… Runs the ERCBFLASH calculations for the current model configuration
Run ERCBSLAB Only… Runs ERCBFLASH and then runs the ERCBSLAB calculations for the current model configuration and the current ERCBFLASH output information
Erase all output fields in the template spreadsheet file (does NOT erase output data stored on the BATCH page).
Erase all input fields on the INPUTS page (does NOT erase input data stored on the BATCH page)
Imports a BATCH export file to the BATCH page.
Exports a BATCH import file (input and ERP SUMMARY Results) with data stored on BATCH page.
Batch Submenu
The BATCH submenu is shown below with a description of the menu items. The BATCH page is very large and can hold hundreds of scenarios of all different sour operations types. BATCH operations assist in loading and saving information from the INPUTS page. While ERP zone calculations can be done directly from the BATCH page, information can be moved back and forth between the BATCH page and INPUTS page. Other menu items are for selecting run-time functions for testing or full processing.
4 Program Operation 35

ERCB Submission Requirements – Licensees/applicants are required to submit an electronic copy (export file) of the BATCH page for the subject submission. Details about the BATCH page (including the ERCB file naming protocol) are in Chapter 8 - Batch Page.
BUTTON DESCRIPTION
INPUTS page is active: Saves parameters from the INPUTS page and results to a new line (row) on the Batch page, or overwrite an existing record with the same Scenario Name.
BATCH page is active: Copy the selected INPUT record from the BATCH page to the INPUTS page (calculation results are NOT brought over to the ERP SUMMARY page).
INPUTS page is active: Fetch the first record on the BATCH page to the INPUTS page (calculation results are NOT brought over to the ERP SUMMARY page).
INPUTS page is active: Fetch the previous record on the BATCH page to the INPUTS page. The previous record is ‘above’ the record with the “Scenario Name” that matches what is currently displayed on the INPUTS page (calculation results are NOT brought over to the ERP SUMMARY page).
4 Program Operation 36

INPUTS page is active: Fetch the next record on the BATCH page and read (copy) the records to the INPUTS page. The next record is ‘below’ the record with the “Scenario Name” that matches what is currently displayed on the INPUTS page (calculation results are NOT brought over to the ERP SUMMARY page).
INPUTS page is active: Fetch the last record on the BATCH page to the INPUTS page (calculation results are NOT brought over to the ERP SUMMARY page).
Batch Run ERCBSLAB for each record marked RUN on the BATCH page. This is a ‘test run’ and is not sufficient for ERCB submission – user must run the Batch Calculate EPZ calculation for ERCB submission.
Batch Calculate EPZ calculates ERP Zones for each record marked RUN on the BATCH page.
Check for Scenario Duplicates Check the scenario name of each record on the BATCH page for duplicate names.
Setup Submenu
The Setup submenu is shown below with a description of the menu items.
4 Program Operation 37

BUTTON DESCRIPTION
Hide Technical Sheets This toggle switch hides/shows the technical calculation pages (typical or technical view). Most users will not require viewing of the technical sheets.
ERCBSLAB debug This toggle switch is used to turn on/off the creation of text output file generation of the output from the ERCBSLAB model to the current working folder.
Silent Start This toggle switch is used to turn off/on the confirmation prompts for when BATCH calculations are about to be performed, and suppresses error message dialog pop-ups. This switch is useful when automating BATCH processes.
ERCBH2S Excel Button-Bar The ERCBH2S application button bar is added to the Excel window when the ERCBH2S application is loaded using the Add-in Manager or when the XLA file is opened using File→Open→ERCBH2S.xla. The ERCBH2S application button bar (shown below) displays principal commands for ERCBH2S program operation. All of the buttons are also listed as choices under ERCBH2S in the menu-bar.
BUTTON DESCRIPTION
Print the ERP SUMMARY page.
Erase all output fields in the template spreadsheet file (does NOT erase output data stored on the BATCH page).
INPUTS page is active: Save INPUTS and Results to a new line (row) on the Batch page, or overwrite an existing record with the same Scenario Name.
BATCH page is active: Copy the selected record from the BATCH page to the INPUTS page (calculation results are NOT brought over to the ERP SUMMARY page).
INPUTS page is active: Fetch the first record on the BATCH page to the INPUTS page (calculation results are NOT brought over to the ERP SUMMARY page).
4 Program Operation 38

INPUTS page is active: Fetch the previous record on the BATCH page to the INPUTS page. The previous record is ‘above’ the record with the “Scenario Name” that matches what is currently displayed on the INPUTS page (calculation results are NOT brought over to the ERP SUMMARY page).
INPUTS page is active: Fetch the next record on the BATCH page and read (copy) the records to the INPUTS page. The next record is ‘below’ the record with the “Scenario Name” that matches what is currently displayed on the INPUTS page (calculation results are NOT brought over to the ERP SUMMARY page).
INPUTS page is active: Fetch the last record on the BATCH page to the INPUTS page (calculation results are NOT brought over to the ERP SUMMARY page).
‘Test run’ the BATCH page inputs. This command runs the ERCBSLAB calculation for each record marked RUN on the BATCH page. This is not sufficient for ERCB submission – user must run the Batch Calculate EPZ calculation for ERCB submission.
Run the Batch Calculate EPZ calculation for each record marked RUN on the BATCH page.
Run the ERCBSLAB calculation for the inputs on the INPUTS page for the user selected wind speed, meteorological stability and exit area ratio.
Run the ESD Closure calculation for the gas pipeline entries on the INPUTS page
Run the Ae/Ap Ratio Search (exit area ratio) for the entries on the INPUTS page for the user selected wind speed and meteorological stability.
Run the Calculate EPZ for the inputs on the INPUTS page to determine the ERP zones for all wind speeds, meteorological stabilities and (for sour gas pipelines) exit area ratio and ESD timing.
Note that as you move your cursor across the button-bar that active buttons are framed and in colour. If the button is inactive, it will appear gray in colour. The activity depends on the Sour Operations Type, if the technical sheets are hidden or what sheet is active.
4 Program Operation 39

Saving Scenarios as Excel Files ERCBH2S scenarios are saved as Excel files. It is recommended that you save scenarios with a logical description, such as the pipeline segment name or scenario name. Remember not to overwrite the original blank template file. This ensures new scenarios have consistent ‘starting data’ to help minimize calculation problems.
If using the ERCBH2S ‘Gathering System Analysis’ feature on the BATCH page (Chapter 9 - Pipeline Gathering Systems), refer to the suggested scenario naming format in Chapter 9 under Pipeline Segment Label (Scenario Name).
Unless saving a BATCH file for ERCB submission needs, it is recommended that you choose another file naming convention. The required file naming protocol for ERCB submissions is described in this chapter under Importing and Exporting ERCBH2S Batch Files.
To save a scenario file:
1. Click File in the menu-bar and select Save As.
2. Create a file name for your scenario and click the Save button. This method of file saving also stores any information added to the NOTES page.
You are not restricted in your selection of folder in which to save your scenario files. It is recommended that you create a new folder and naming convention to store related scenarios.
You may also use the BATCH Page (see page 117) to store multiple scenarios or sensitivity tests within a single file.
Importing and Exporting ERCBH2S BATCH Page The input and certain key ERP output data stored on the BATCH page can be exported to an ERCBH2S export file for convenient email transfer or backup. From the menu-bar, ERCBH2S→Technical→ Batch Export... prompts the user using common windows file dialog window for a folder and a file name.
4 Program Operation 40

For ERCB submissions, licensees/applicants are required to use the following file naming protocol:
BA code - ERP Plan Ref# - Date (DD/MMM/YY)
For example, if a company with the BA code of WXYZ submits a file on July 5th, 2008, the file would be named:
WXYZ-1234-05Jul08.csv
The .csv file extension (comma separated variable) is automatically attached to the file name. The variable names are those expected by ERCBH2S to match the INPUTS page - the order of the variables in the file is not important.
The batch export file can be viewed using Excel or Notepad or other text editor. Note that the .csv file does not contain user information added to the NOTES page.
An ERCBH2S batch export file can be reloaded to a BATCH page using the batch-import function ERCBH2S→Technical→Batch Import... from the menu bar.
BATCH page submissions to the ERCB must not have any error codes in column DO!
An example .csv export file is provided in the listing below.
4 Program Operation 41

ERCBH2S File Version,1 ERCBH2S Version, 1.2 ERCBH2S Spreadsheet Version,1.21.0002 ERCBH2S Macro Version,1.21.0002 ERCBSLAB Version, 001.002.0001 ERCBFLASH Version, 001.000.0001 [START ------------------------------------------- ] Admin_BAcode,A Admin_Licensee,B Admin_Address,C Admin_City,D Admin_PostalCode,E Admin_ContactName,F Admin_Phone,G Admin_Fax,H Admin_eMail,I Calc_ScenarioName,Label 3 Gas Well Calc_SubstanceType,1 Calc_AnalysisType,1 Admin_FacilityName,Label 1 Admin_FacilityLicense,K Admin_SurfaceLocation,Label 2 Admin_SurfaceLocation_Start,M Admin_SurfaceLocation_End,N Admin_Elevation,1000 Admin_EPZExisting,na Admin_Datum,7 Pipeline_StartX,O Pipeline_StartY,P Pipeline_EndX,Q Pipeline_EndY,R Pipeline_MOP,9930 Pipeline_Pressure,5000 Pipeline_OutsideDiameter,273.1 Pipeline_WallThickness,9.3 Pipeline_SegmentLengthActual,1000 Pipeline_EquivalentLength,5420 Pipeline_EquivalentVolume, Pipeline_GOR, Pipeline_H2SMax,14 Pipeline_H2SConcentration,7 Pipeline_Ti, Pipeline_ESDTclose, Pipeline_ESDPressureTrigger, Pipeline_ESDPROCTrigger, Pipeline_ESDTpoll, Pipeline_TESDManual, Pipeline_TimeBeforeMitigation, Well_Phase,2 Well_IsCritical,1 Well_UniqueWellIdentifier,O
Figure 1: Export/Import CSV file sample
4 Program Operation 42

ERCBH2S Excel Print Settings Each page has been paginated for proper display of the data on Letter size paper (North American, 8.5in ×11in or 216mm×279mm). Any page may be printed by clicking the standard Excel print icon.
The ERCBH2S→PRINT REQUIRED command, , automatically sends the ERP SUMMARY page to the default printer.
ERCBH2S Excel Pages – RED FLAG WARNINGS A red flag warning appears as a banner at the top of many ERCBH2S Excel pages when user inputs are missing, outside of allowable ranges, or have changed since the last calculation sequence was performed. It is important to remember that at any one time, there is only one current set of calculation results displayed on the ERCBH2S Excel pages (other than the BATCH page, which can store many different sets of calculation result records). Red flag warnings are described in detail under Red Flag Warnings in Chapter 5.
The ERCBH2S Calculation Process Calculations are controlled by the ERCBH2S.xla application file. All user input, intermediate calculations and output displays are done in the ERCBH2S template file for Microsoft Excel, ERCBH2S-INPUTS.xls. Major calculations are done in the dynamic link library programs (dll) as directed by ERCBH2S.xla.
Run ERCBSLAB There are eight steps in the basic calculation process known as Run
ERCBSLAB with the button , as described below and shown in the flow diagram that follows:
1. Basic information about the scenario Flavour and release description are entered on the INPUTS page. The user then presses the ERCBH2S→ERCBSLAB command to start the sequence of calculations.
2. Intermediate calculations are immediately performed by Excel when data changes on the INPUTS page. Depending on the scenario Flavour, calculations are performed on one of the SOUR GAS PIPELINE, SOUR
4 Program Operation 43

GAS WELL or SOUR LIQUID pages. The intermediate calculations prepare a model input file for the ERCBFLASH program.
The model input file is listed on the ERCBFLASH page. The input file is compared to the previous input file for ERCBFLASH. If the input is the same as the previous file, the ERCBFLASH is not required to be executed again, and the results from the previous run are still valid. In this case, the ERCBH2S program calculations will continue at step 4. If the input file is new, then the calculations continue at Step 3.
3. After the ERCBFLASH program has completed its calculations of real gas properties for the gas composition and physical parameters input, output data is displayed on the ERCBFLASH OUTPUT page. The ERCBH2S program resumes the calculation process.
4. Intermediate calculations then proceed on either the SOUR GAS PIPELINE, SOUR GAS WELL or SOUR LIQUID pages depending on the scenario flavour, using the real gas properties calculated by the ERCBFLASH program for the physical conditions entered in the INPUTS page.
5. Intermediate calculations are performed by Excel on either the SOUR GAS PIPELINE, SOUR GAS WELL or SOUR LIQUID pages to calculate source parameters for dispersion modelling using the ERCBSLAB program. The intermediate calculations prepare a model input file for the ERCBSLAB program.
The model input file is listed on the ERCBSLAB page. The input file is compared to the previous input file for ERCBSLAB. If the input is not the same as the previous file, the red flag may appear, indicating that the previous results are invalid. Different than the ERCBFLASH process, the ERCBH2S program will always re-run the ERCBSLAB program when the Run ERCBSLAB command is used.
4 Program Operation 44

6. After the ERCBSLAB program has completed its dispersion calculations for the real gas properties and physical parameters input, output data is displayed on the intermediate calculation technical ERCBSLAB OUTPUT and TOXOUT pages.
7. The Intermediate calculations then proceed on the GRAPH-ERCBSLAB (x), GRAPH-TRANSIENT(x), or GRAPH-STEADY(x) pages, depending on the scenario flavour. These pages display the technical intermediate calculation results in a graphical format. Each of these graphs display information as a function of downwind distance or x-distance.
8. After the ERCBSLAB program has completed its dispersion calculations for the parameters input, output data is displayed on the intermediate calculation technical MET MATRIX page.
The final results of the calculations are displayed on the HAZARD DISTANCES page, in the form of a table. The table lists the calculated Worst-Release Hazard Distance for the meteorological stability class, wind speed and exit area ratio on the INPUT page.
4 Program Operation 45

Gas Well Calculation Process There are two basic flow sequences for the WELL flavour as shown in the following calculation flow graphic. The basic ‘once through’ Run ERCBSlab
sequence (A) is a single iteration of the overall calculation process as shown in the preceding graphic. The calculation is performed using the single meteorological stability class and wind speed entered on the INPUTS page.
A series of calculation processes is performed for the Calculate EPZ command to iterate automatically to calculate the Dispersion Condition Probability Weighted Hazard Distances. The calculation process is shown as flow pattern (B) in the following graphic. The overall process is similar to the process (A), except that the ERCBSLAB calculations are repeated many times to calculate the Worst-Release Hazard Distances for different meteorological stability class and wind speed. The iteration process in (B) is repeated 54-times for the various combinations of meteorological conditions and results 54 Hazard Distances. The dispersion condition probability weighted value of these 54 distances is calculated by multiplying the hazard distance in each of the 54 categories by the fraction of time that each meteorological condition occurs, and results the Worst-Release with Averaged-Dispersion Hazard Distances. The final results of the calculations are displayed on the HAZARD DISTANCE page, in the form of a table.
For the detailed technical description of the calculations and methods used in the programs see Volume 1 - Technical Reference Document Version 1.20.
4 Program Operation 46

The results reflect the user-selected meteorological stability, windspeed, and Ae/Ap ratio
FLAVOR
INPUTS
Run ERCBSLAB
User Selected Wind speed Stability Class Ae/Ap Ratio
ERCB_FLASH.dll
ERCB_SLAB.dll
TOX output
ERCBSLAB output
GRAPHS
GAS WELL & LIQUID PIPELINE/WELL
Loop for new wind speed and stability
FLAVOR
TOX output
Worst-release Hazard Distance for 54 meteorological conditions
Dispersion condition Probability Weighted Distances
GRAPHS ERCBSLAB output
ERCB_SLAB.dll
ERCB_FLASH.dll
CALCULATE EPZ
INPUTS
GAS WELL & LIQUID PIPELINE/WELL
A B
4 Program Operation 47

Liquid Pipeline and Liquid Well Calculation Process There are also two basic flow sequences for the LIQUID flavour. The parameters are entered for the LIQUID flavour on the INPUTS page and intermediate calculations are provided on the technical LIQUID page. The LIQUID calculation process is the same as the WELL calculation process illustrated as process (A), and (B) in the above graphic.
Gas Pipeline Calculation Process There are three basic flow sequences for the PIPELINE flavour as shown in the following calculation flow graphic. The basic ‘once through’ sequence (C) is a single iteration of the overall calculation process, already described in Run ERCBSLAB. The calculation is performed using the selected meteorological stability class, wind speed and pipeline exit area ratio entered on the INPUTS page.
For the PIPELINE Flavour, a release and the calculated downwind concentrations are a function of the hole size, which is expressed as the exit area to pipeline area ratio (Ae/Ap). Ae/Ap ratios vary from 0.01 (a small hole) to 2.00 (the pipeline is severed in two). Ae/Ap ratio affects the rate and duration at which sour gas is released from the pipeline and input to ERCBSLAB.
For large Ae/Ap ratio, the release is a suddenly large cloud of gas with a short duration. For small Ae/Ap ratio, the release is long duration and relatively steady in release rate. Often the intermediate release holes can produce the largest ERP zones. To assist in the search for the worst release exit area ratio, the ERCBH2S program has been automated to repeat the overall calculation process for a range of hole size ratios. The calculation process is represented as the flow pattern (D) in the following graphic. The Worst-Release Hazard Distance is estimated based on the iteration for exit area ratio using the selected meteorological stability class and wind speed entered on the INPUTS page. The results are listed on the METMATRIX page (Hazard Distances for Meteorological Matrix).
A third calculation process is performed for the PIPELINE flavour, to iterate automatically to use the Worst-Release condition (the exit area ratio that produces the largest hazard zone) for each of different meteorological conditions to get different Worst-Release Hazard Distances. The calculation process is shown as flow pattern (E) in the following graphic. The overall process is similar to the process (D), except that the ERCBSLAB calculation is repeated many times for different meteorological and release conditions. The iteration process in (E) is
4 Program Operation 48

repeated 54-times for the various combinations of meteorological stability and wind speeds and 11-times for each of the exit area ratios.
For the detailed technical description of the calculations and methods used in the programs see Volume 1 - Technical Reference Document Version 1.20.
C D E
The results reflect the user-selected meteorological stability, windspeed, and Ae/Ap ratio
FLAVOR
INPUT
Run ERCBSLAB User Selected Windspeed, Stability Class, Ae/Ap Ratio
ERCB_FLASH.dll
ERCB_SLAB.dll
TOX output ERCBSLAB output
GRAPHS
GAS PIPELINE
EDS Closure Timing
Loop for new Ae/Ap
FLAVOR
INPUT
Ae/Ap ITERATIONUser Selected Windspeed, Stability Class, Ae/Ap Ratio
ERCB_FLASH.dll
ERCB_SLAB.dll
TOX output ERCBSLAB output
GRAPHS
GAS PIPELINE
EDS Closure Timing
Ae/Ap that produces worst-release hazard distance for user specified meteorology
2Loop for new
Ae/Ap
FLAVOR
INPUT
CALCULATE EPZ User Selected Windspeed, Stability Class, Ae/Ap Ratio
ERCB_FLASH.dll
ERCB_SLAB.dll
TOX output ERCBSLAB output
GRAPHS
GAS PIPELINE
EDS Closure Timing
Ae/Ap that produces worst-release hazard distance
Worst-release hazard distances for 54 meteorological conditions
1 Loop for new
windspeed and stability
Dispersion Condition Probability weighted hazard distances
ESD Closure
For an Ae/Ap ratio, the rate of release is used to determine how fast the automated emergency shut down (ESD) valves can respond to the release rate. The ESD valves can respond in three ways: by the responding to a drop in pressure from the current operating pressure (ESD Valve Low Pressure Setting, Pesd, on the INPUTS page); on the rate of change of pressure (ESD Valve Pressure rate of change, dP/dt, on the INPUTS page); or by manual closure time (on the INPUTS page). The pressure changes at the valve are used to determine which of the two automation controls will trigger the valve closure first and then
4 Program Operation 49

compared to the manual valve closure time. This timing plus the time it takes to the ESD to close, is used to calculate the amount of gas that passes through the valve from the time of the release to the closing of the valve. The total release volume is the calculated standing volume between ESD valves plus the above estimated extra volume that flows by the valves before they close.
This calculation is started using the ERCBH2S→ESD Closure command. Results are displayed on the ESD CLOSURE page for the selected hole size ratios.
The user can vary the parameters such as distance between ESD valves, pipe sizes, ESD closure settings, or hole size, to investigate the effects these parameters have on the calculated ESD Closure timing. For large holes, the results demonstrate that either pressure ratio or the pressure rate of change can trigger the closing of the valve depending on the site-specific parameters entered. Pressure rate of change settings can have a strong influence on reducing release volumes. For small holes, the ESD Closure calculations indicate that that neither the pressure ratio nor the pressure rate of change settings may trigger the closing of the valve, rather manual closure is required.
The ESD CLOSURE page is described in more detail on page 100.
Ae/Ap Ratio Search
For the PIPELINE flavour scenario, a release and the calculated downwind concentrations are a function of the hole size, which is expressed as the exit area to pipeline cross-section area ratio (Ae/Ap). To assist in the search for the worst case exit area ratio, the ERCBH2S program has been automated to repeat the overall calculation process for a range of hole size ratios. This iteration process is
started using the ERCBH2S→Ae/Ap Ratio Search command and intermediate calculations are displayed on the AeAp-Iteration page where the selected hole size ratios are listed. This calculation process calls on the ESD Closure routine to determine the ESD closure timing which determines the release rate and duration for each of 11 hole sizes.
The exit area ratio iteration is initialized by completing the Basic Calculation sequence, Ae/Ap Ratio Search. A Worst-Release Hazard Distance is estimated based on the iteration for exit area ratio using the single meteorological stability class and wind speed entered on the INPUTS page. The results are listed on the HAZARD DISTANCES page. Intermediate results are displayed on the AeAp-Iteration that also displays a tabular matrix of results and also a graphical representation. These results were calculated for a selected meteorological wind speed and stability class entered in the INPUTS page. The user can vary the parameters such as distance between ESD valves, pipe sizes,
4 Program Operation 50

ESD closure settings, hole size or meteorological parameters, to investigate the effects these parameters have on the calculated ERP zones.
The exit area ratio iteration is relatively quick but may take several moments to complete the various calculations. It is recommended that you do not use your computer for other purposes during the calculations.
If a user-specific Ae/Ap Ratio is entered on the INPUTS page, the CALCULATE EPZ calculation is performed for all meteorological cases for the user-specific Ae/Ap Ratio, thus by-passing the Ae/Ap search. Red flag are displayed to warn the user that results displayed do not represent the complete EPZ calculation process. The user-specific Ae/Ap Ratio field must be cleared in order to complete the EPZ calculation process.
The AeAp-ITERATION page is described in more detail on page 100.
Calculate EPZ The ERP zones are determined for the WELL, PIPELINE and LIQUID flavours, by iterating to determine the meteorological stability class, wind speed and exit area ratio (for PIPELINE flavour) that is associated with the Dispersion Condition Probability Weighted Hazard Distances. The iteration process is started
using the ERCBH2S→Calculate EPZ command.
The iteration process is repeated 54-times for the various combinations of meteorological stability and wind speeds. For the PIPELINE flavour, the ESD Closure timing and Ae/Ap Ratio Search calculations are also performed for 11 release area fractions.
The iteration for calculating Worst-Release Hazard Distance is relatively quick but may take several moments to complete the numerous calculations. It is recommended that you do not use your computer for other purposes during the calculations.
If a user-specific Ae/Ap Ratio is entered on the INPUTS page, the CALCULATE EPZ calculation is performed for all meteorological cases for the user-specific Ae/Ap Ratio, thus by-passing the Ae/Ap Search. Red flags are displayed to warn the user that results displayed do not represent the complete EPZ calculation process. The user-specific Ae/Ap Ratio field must be cleared in order to complete the EPZ calculation process.
4 Program Operation 51

4 Program Operation 52
The run progress is shown at the bottom of the Excel page. You may stop the Screening Matrix calculations at any time by clicking the Space Bar or the ESC key.
The results are listed in sections METMATRIX (page 97), GRAPH-MET (page 110), HAZARDS (page 107), and HAZARD DISTANCE (page 99).
.

5. INPUTS Page
Input pages have a green sheet tab (note that some versions of Windows do not display the page/sheet tabs in colour). In this section, the INPUTS page is described in detail. The BATCH page is described on page (117). There are many parameters required by ERCBH2S and these have been divided into the following logical sections:
SECTION ENTRY DESCRIPTION
Administrative Mandatory Information about the applicant, the location under study, the scenario name, and selection of the Flavour for the template and analysis type.
Gas Pipeline Mandatory If the Flavour is GAS PIPELINE, physical characteristics of the pipeline are specified.
Gas Well Mandatory If the Flavour is GAS WELL, physical characteristics of the well are specified.
Liquid Pipeline or Liquid Well Mandatory
If the Flavour is LIQUID PIPELINE/WELL, physical characteristics of the liquid release are specified.
Sour Gas Composition Mandatory A representative chemical composition of the gas phase in the pipeline or well is specified (dry).
Advanced User Selected Case
Optional – user entries in this
section are not acceptable for
ERCB submission
For Advanced Users Only This section allows the user to control calculations for selected meteorological conditions and pipeline release hole size rather than running the complete screening matrix.
The WITH MITIGATION analysis may be helpful to determine ignition commitments or advanced technology to mitigate the hazard.
The input cells have conditional formatting that can be over-written when cells are copied from one location to another. If the INPUTS page does not look quite right, open the blank ERCBH2S-Inputs.xls and re-enter the data.
5 Inputs Page 53

Entering Data User specific data is entered in the ERCBH2S program following steps below:
1. Select Launch ERCBH2S.xla. Then open an ERCBH2S-Inputs.xls file or a ERCBH2S example file, such as ERCBH2S-Pipeline.xls or ERCBH2S-Well.xls. These files can be found using Windows Explorer and navigating to the installation directory for the ERCBH2S program. Alternatively, links to these file have been included under the Windows desktop START menu, under the ERCBH2S program.
2. Navigate to the INPUTS page by clicking the “INPUTS” tab for the worksheet.
3. The cells and pages are presented in colours to assist in the data entry process. Note that earlier versions of Excel do not display the page/sheet tabs in colour.
LEGENDcells Prompt description or commentcells Entry prompt cells Protected or locked calculationcells Warning regarding a prompt or calculation that requires special attentioncells Default value, Lockedcells Protected or locked calculation output
sheet tabs Inputssheet tabs Summary/Graphicssheet tabs Calculationssheet tabs User Information
5 Inputs Page 54
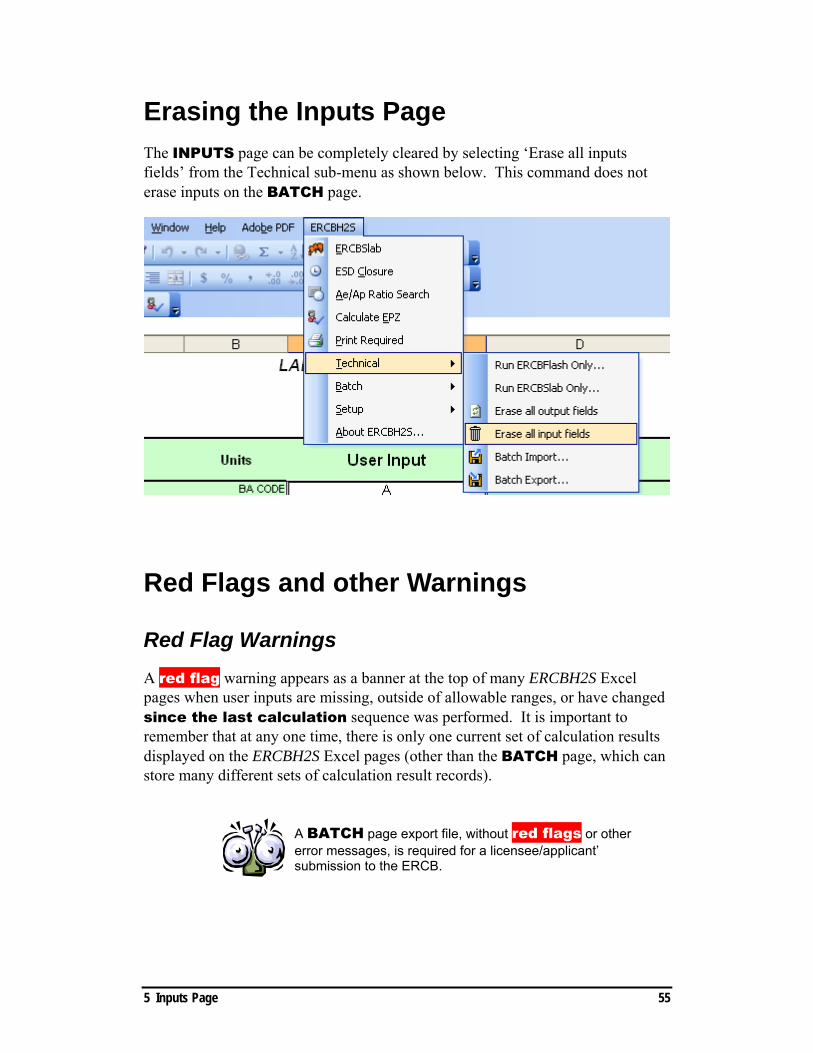
Erasing the Inputs Page The INPUTS page can be completely cleared by selecting ‘Erase all inputs fields’ from the Technical sub-menu as shown below. This command does not erase inputs on the BATCH page.
Red Flags and other Warnings
Red Flag Warnings A red flag warning appears as a banner at the top of many ERCBH2S Excel pages when user inputs are missing, outside of allowable ranges, or have changed since the last calculation sequence was performed. It is important to remember that at any one time, there is only one current set of calculation results displayed on the ERCBH2S Excel pages (other than the BATCH page, which can store many different sets of calculation result records).
A BATCH page export file, without red flags or other error messages, is required for a licensee/applicant’ submission to the ERCB.
5 Inputs Page 55

Missing Entry
There are two types of missing input data flags. Missing entries for ERCB Submission do not effect the calculation but are required for completeness:
**(1) Missing entry(s) for ERCB Submission**
Missing entries for calculations will effect the calculation. Notice that as a result, inputs to several other programs have changed so the displayed outputs do not match the inputs.
Out of Bounds Entry
Out of bounds entries must be corrected before submission. The program will calculate the ERP zones based on the model inputs (either on user inputs or model ‘orange re-sets’ – described later in this section), but the error flag will continue.
**(1) Out of bounds entry(s)**
Recalculation Required
Calculations in the ERCBH2S program can be computationally intensive, requiring several minutes to complete. Rather than recalculate output for every change of input or immediately erasing all output when input information changes, ERCBH2S displays the following:
ERCBH2S describes the individual program components that must be re-run based on the changed inputs. Selecting ‘Calculate EPZ’ automatically runs the necessary programs, and these descriptions in the red flag will be removed (if there are no other errors encountered).
If the flavour selected is a pipeline and the User Selected Case (bottom of the INPUTS page) includes an entry for the Gas Pipeline Release Hole Size Fraction, the following flag will appear if you just ran Calculate EPZ:
INPUTS DO NOT MATCH DISPLAYED OUTPUT PAGES -- RECALCULATIONS REQUIRED: ,AeAp Calculation
5 Inputs Page 56

5 Inputs Page 57
Delete the Gas Pipeline Release Hole Size Fraction and Run Calculate EPZ to remove the flag. User ‘over-rides’ of default entries in ‘User Selected Case’ on the INPUTS page always create a red flag and are therefore not suitable for ERCB submission. Work in this section of the INPUTS page is reserved for the advanced technical user to investigate intermediate calculations and mitigation strategies for a selected meteorological and/or Gas Pipeline Release Hole Size (Fraction).
A red flag can also be displayed if the user has not selected a flavour for the current scenario; either, GAS PIPELINE, GAS WELL or LIQUID PIPELINE/WELL. Calculations cannot proceed without selecting a flavour.
To remove red flags that contain calculation messages, the CALCULATE EPZ command must be run. This command runs all the calculations for the GAS PIPELINE, GAS WELL or LIQUID PIPELINE/WELL flavours for all screening meteorological cases, and will end by running the individual meteorological case specified on the INPUTS page.
To remove red flags with calculations messages, the CALCULATE EPZ command must be run.
If default settings in User Selected Case have been changed, a red flag will occur. These calculation results are not acceptable for ERCB submission.
Orange Warnings Notice the right hand column (column E) on the ERCBH2S INPUTS page. The heading for this column (as shown in the next section on ‘Administrative’) is:
Warnings (if applicable)
Try deleting a few of the Administrative entries. Note that entries with the warning Required for ERCB submission are required for ERCB submission but are not required for the calculation to proceed.
Entries with the warning Required for calculation are required for ERCBH2S calculations to proceed and must be entered. Note that all fields accept text input and have a general format.

Orange Warnings will cause a red flag error message. If not addressed by the user, this flag will be attached to the calculation results. Calculation results with a red flag error message are not acceptable for ERCB submission.
The user must verify that the data is entered in accordance with the units specified beside each data entry location.
If not addressed by the User, Orange Warnings cause a red flag error message which will persist through to the calculation results. Calculation results with a red flag error message attached to them are not acceptable for ERCB submission.
The ERCBH2S-INPUTS.xls template worksheets are security protected to prevent accidental overwriting of the intermediate calculations or general formatting. Although the formulae in the worksheets cannot be changed, the formulae can be viewed by selecting the worksheet cell and tracing the logic.
Orange Resets
Many user inputs have an ERCB prescribed value range – a minimum and maximum value that can be entered. The allowable range for each row (where applicable) is shown to the right of the INPUTS page in columns H and I. Column J describes the ‘model action’ associated with user inputs that are outside of the acceptable range. Observe that some model actions are listed as ‘resets’. These are referred to as ‘orange resets’.
For rows with orange reset actions, if the user entry is below the minimum limit, the model resets the entry to the lowest allowable value. If the entry is above the maximum limit, the model resets the entry to the highest allowable value. For model ‘resets’, it is important to remember that the user entry (in column C) is not changed - instead the reset value appears in column E and is coloured orange to warn the user that one of their entries has been reset.
If orange reset entries appear on the INPUTS page, ERCBH2S calculations will be based on these values (for the applicable field), and NOT the user entry. To remove the orange reset warning from column E (and subsequently a red flag error message attached to the calculation results); the user must change their entry to be within the allowable limits BEFORE activating any ERCBH2S program run commands.
5 Inputs Page 58

When ERCBH2S resets a user entry, the ‘reset’ model entry (shown in column E on the INPUTS page) appears in orange, and planning zone calculations will be performed using the orange reset entry. To remove the orange reset warning, the user must change their entry (column C) to be within allowable limits. If this is not done, there will be a red flag error message attached to the calculation results, and the results are not acceptable for ERCB submission.
Green Notifications Green notifications that appear in column E on the INPUTS page are for user information purposes only. A red flag error message is not generated.
An example of this notification can be found next to Datum for Surface
Locations: Optional . The entry field is included to assist the user in data record management, but relates to location inputs in each details group.
Administrative In the Administrative input section, shown below, input is required to identify the licensee, contact information, scenario name, sour operation type, analysis type, and certain operation location descriptions/identifiers.
5 Inputs Page 59

5 Inputs Page 60

The following table describes the data required in the Administrative input section.
Field Description
BA Code Business Associate code assigned by ERCB.
Licensee/Applicant The name of the licensee or prospective licensee.
Mailing Address City and Province
Postal Code
The complete address to be used for mail correspondence relating to the submission.
Contact Name Phone
Fax E-mail
The name of the individual responsible for submitting the evaluation. This person may be contacted for additional information or supporting assessments regarding the submission.
Scenario Name
Each analysis must be given a unique identifying scenario name. This is especially important for operating the ERCBH2S program in Batch mode, where the Scenario Name is used as the identifier for the record in the database. If using the ERCBH2S ‘Gathering System Analysis’ feature on the BATCH page (Chapter 9 - Pipeline Gathering Systems), refer to the suggested scenario naming format in Chapter 9 under Pipeline Segment Label (Scenario Name). See Page Label 3.
Sour Operation Type
This selection determines which one of three modelling methods the user will activate. Depending upon the choice made, two of the three sour operations details groups (further down the INPUTS page) will be ‘greyed out’. See Sour Operation Type later in this chapter for further details.
Analysis Type
This selection turns off/on access to SOURCE MITIGATION entries in the applicable sour operations details group (shown further down on the INPUTS page). While access to SOURCE MITIGATION allows a user to deviate from ERCB default source mitigation values, justification, proof and/or a demonstration of the licensee/applicant’s ability to conduct/apply the mitigative control within the specified time-frame (for each deviation) may be requested by the ERCB. See Analysis Type later in this chapter for further details.
Name of Well or Pipeline Licence Number
As per the licence or application. For new pipeline applications without a licence number, enter “na”. See Page Label 1.
5 Inputs Page 61

5 Inputs Page 62
Field Description Well Licence Number or
Application Number As per the well licence or application. For a pipeline or new well, enter “na”.
Legal Surface Location of Well or Pipeline Line
Number
The well’s surface location or the pipeline line number. If modelling a portion of a pipeline line number, attach an alphabetical character to the line number - describing the sub-segment being modelled and the extent of sub-segments possible. For example, if modelling the second ‘sub-segment’ of line number 17 and the line is modelled in five sub-segments, enter ‘Line 17b of e’. See Page Label 2.
Pipeline From Location
As per the pipeline licence or application. If modelling a portion of a pipeline line number, enter the LSD/SEC/TWP/RGE/MER location of the upstream/start of the pipeline sub-segment. If modelling a well, enter “na”.
Pipeline To Location
As per the pipeline licence or application. If modelling a portion of a pipeline line number, enter the LSD/SEC/TWP/RGE/MER location of the downstream/end of the pipeline sub-segment. If modelling a well, enter “na”.
Surface Elevation
The average EPZ elevation (metres above sea level, as determined from topographical maps) is used to determine the average atmospheric pressure and is important to accurately convert mass emissions of H2S into volume concentrations of parts per million (ppm). If this cell is left blank, a value of zero (for sea level) is used by ERCBH2S. For a well, enter the well’s surface elevation. For a pipeline, enter the pipeline’s average elevation (+/- 100 m).
Existing EPZ Distance For the implementation phase of ERCBH2S, the existing EPZ distance for a facility, in kilometres, is required for comparison. For new facilities, enter “na”.

5 Inputs Page 63
Field Description
Datum for surface locations
To accommodate the various mapping standards that may be applied by users, each application can specify the datum and projection adopted for the entry of mapped locations. The datum and project may be one of:
• UTM NAD27 zone 11 • UTM NAD27 zone 12 • UTM NAD83 zone 11 • UTM NAD83 zone 12 • 10TM NAD83 • WGS84 (latitude/longitude) • Other
This optional entry allows ERCBH2S to integrate with GIS systems used for ERP and mapping. If “Other” is specified
• the user may elect not to enter mapping coordinates in the facility details group (further down on the INPUTS page), or
• the applicant may choose to enter mapping coordinates in the facility details group (further down on the INPUTS page), however, the application should* clearly indicate the mapping datum and projection referenced (*if the user wishes to integrate with a graphics package).
ERCBH2S Page Labels Each ERCBH2S page has a label attached to it so you can track the pages. The label is derived from certain user inputs in the Administrative group on the INPUTS page, described below.
For a well, the label is created using: Well name (Label 1)/Legal surface location (Label 2)/Scenario name (Label 3)
For a pipeline, the label is created using: Pipeline licence No. (Label 1)/Line number (Label 2)/Scenario name (Label 3)
Sour Operation Type There are three sour operations types (analysis flavours): GAS PIPELINE, GAS WELL and LIQUID PIPELINE/WELL. One of the three flavours must be selected in order for calculations to proceed.

SOUR OPERATION TYPE
DESCRIPTION
GAS PIPELINE (transient jet)
Determined by the pipeline substance category as defined by ERCB Directive 056, with the exception of the substance ‘Acid Gas’. Acid Gas is defined as
Gas that is separated in the treating of solution or non-associated gas that contains hydrogen sulphide (H2S), totally reduced sulphur compounds, and/or carbon dioxide (CO2).
For ERCBH2S, the ERCB requires that pipelines containing Acid Gas be identified separately from other Sour Gas pipelines, even though they are licensed as ‘Sour Gas’ pipelines. ‘Gas Pipeline’ modelling is also required for Oil Effluent pipelines with:
• a Gas to Liquid Ratio (GLR) > 1000 (at stock-tank conditions of 15º C and 101.325 kPa), and
• an H2S concentration ≥0.01 % (mole percent, equivalent to 0.1 mol/kmol or 0.0001 mole fraction or 100 ppm) in the gas phase (dry).
Gas pipeline releases are characterized by a high pressure transient jet (a non-steady release rate). Pipeline releases are assumed to occur at the midpoint of the pipeline segment. Special notice concerning HVP pipelines that contain H2S; - these pipelines must be modelled in ERCBH2S to compare the size of the resulting EPZ with that derived from an HVP model (see Directive 071). Because HVP is NOT one of the pipeline substances listed on the ERCBH2S INPUTS page, the user must select the “LVP Products Pipeline with GLR ≤ 1000” from the Sour Operation Type drop-down list. Be aware that the gas being modelled must be from stock-tank conditions of 15°C and 101.325 kPa (dry analysis).
GAS WELL (steady jet)
Primarily used for gas wells containing sour gas (hydrogen sulphide, H2S), ‘Gas Well’ modelling is also required for wells of any substance (including liquids) with:
• a Gas to Liquid Ratio (GLR) > 1000 (at stock-tank conditions of 15º C and 101.325 kPa), and
• an H2S concentration ≥0.01 % (mole percent, equivalent to 0.1 mol/kmol or 0.0001 mole fraction or 100 ppm) in the gas phase (dry).
Gas well releases are characterized by a steady flow rate jet at the specified rate. Gas well releases of sour gas are not permitted to discharge continuously and may be required to be ignited.
5 Inputs Page 64

5 Inputs Page 65
SOUR OPERATION TYPE
DESCRIPTION
LIQUID PIPELINE or LIQUID WELL
(steady jetl)
Primarily used for oil and produced water, ‘Liquid Pipeline or Liquid Well’ modelling is required for any fluid with:
• a Gas to Liquid Ratio (GLR) ≤ 1000 (at stock-tank conditions of 15º C and 101.325 kPa), and
• an H2S concentration ≥0.01 % (mole percent, equivalent to 0.1 mol/kmol or 0.0001 mole fraction or 100 ppm) in the gas phase (dry).
Liquid releases are characterized by a steady flow jet of gas and a pool of liquid on the ground. The release leads to the immediate volatile liberation of sour solution gas.
If modelling a drilling well with potential to encounter both gas and liquid H2S bearing formations (e.g. one zone is gas while another is liquid), the user must model the Cumulative H2S Release Rate using only the Gas Well portion of the INPUTS page.
Analysis Type
(Source Mitigation… it’s all about time)
1NO MITIGATION
WITH MITIGATION
The Analysis Type, either, NO MITIGATION or WITH MITIGATION, effectively turns off or on user access to the subsection called SOURCE MITIGATION contained within each of the three details groups - GAS WELL, GAS PIPELINE, and LIQUID PIPELINE or LIQUID WELL.
For a NO MITIGATION analysis, user inputs are set to ERCBH2S DEFAULT values and cannot be changed. The SOURCE MITIGATION descriptions and values appear greyed-out, and the values listed under the Model Input heading (column E) are used. Any user inputs are formatted to appear invisible because the model does not use them. After completing a NO MITIGATION analysis, the user may choose to assess the site-specific source mitigation inputs in more detail.
2NO MITIGATION
WITH MITIGATION
When the user selects a WITH MITIGATION analysis type, the SOURCE MITIGATION subsection is ‘opened up’ (appears non-grey) and the

input parameters are unlocked. The user may now deviate from the recommended ERCBH2S DEFAULT values in the WITH MITIGATION, provided the user input is within allowable limits.
SOURCE MITIGATION - General
Allowable Limits
The lower (minimum), upper (maximum) and ‘Model Action’ for each SOURCE MITIGATION row is shown to the immediate right on the INPUTS page, in columns H, I and J. Observe that the ‘Model Action’ is always ‘Resets’. This means that if the user enters a value outside of the allowable limits, the model automatically ‘resets’ the user entry, and the reset entry is displayed in column E under MODEL INPUT. The resulting ‘orange reset’ creates a red flag error message. For more details on managing an ‘orange reset’, see Orange Resets in this chapter. There is a detailed discussion of the source mitigation options for each of the details groups within each section (Gas Pipeline, Gas Well, and Liquid Pipeline or Liquid Well).
Licensee/Applicant Responsibility
When changing ERCB default entries in the SOURCE MITIGATION subsection of any of the details groups, the licensee/applicant is required to document and be prepared to defend the model input values, as they must do with any of the other model inputs.
A WITH MITIGATION analysis may result in smaller calculated ERP zones because the source duration is reduced. As source mitigation improves, the size of the hazard decreases. Note that while some planning zones sizes decrease with changes to the source mitigation time, significant EPZ changes are not realized until mitigation time is reduced to 3 hours (180 minutes) or less.
The user should provide documented justification in the Audit Package for each entry in a WITH MITIGATION analysis that deviates from the ERCB default value.
Note that while some planning zones sizes decrease with changes to the source mitigation time, significant EPZ changes are not realized until mitigation time is reduced to 3 hours (180 minutes) or less.
For ERCB submission, applicants are required to activate the program run command ‘Calculate EPZ’, and submit either the NO MITIGATION or the WITH MITIGATION analysis – depending on mitigation controls available to the operation being modelled.
5 Inputs Page 66

Remember that source mitigation requires commitments to earlier ignition, shut in of flow, specified emergency shutdown valve closure or other pre-planned actions that stop the release of H2S.
Gas Pipeline The Gas Pipeline details group is also designed for Oil Effluent pipelines with a Gas to Liquid Ratio (GLR) > 1000 as measured at stock-tank conditions of 15º C and 101.325 kPa (dry gas analysis). Gassy Oil Effluent pipelines are included in this group because they will have a transient blow-down.
The Gas Pipeline details group has two sections. The first section is open to any user whose initial selection (in SOUR OPERATIONS TYPE) brought them to this group. The second ‘sub-section’, titled SOURCE MITIGATION, is only open to those users who selected the analysis type WITH MITIGATION. When the NO MITIGATON analysis is selected, the source mitigation inputs are disabled as shown below. General details on allowable entry limits, and licensee/applicant responsibility for changing default entries in SOURCE MITIGATION can be found under Source Mitigation - General in this chapter. Details specific to the Source Mitigation subsection for the Gas Pipeline group are described later in this section.
5 Inputs Page 67

Notice the Comments column (column D) to the right of the user input column (column C). It contains additional information on some of the cell requirements.
Field Description
Pipeline Segment From Location Coordinates
The ‘beginning/upstream’ pipeline segment (or sub-segment) coordinates according to the mapping datum and projection selected in the Administrative inputs section. These entries are optional and may be left blank.
Pipeline Segment To Location Coordinates
The ending/downstream’ pipeline segment (or sub-segment) coordinates according to the mapping datum and projection selected in the Administrative inputs section. These entries are optional and may be left blank.
Licenced Maximum Operating Pressure
The maximum operating pressure (MOP) for which the pipeline is licensed, kPa (gauge).
Expected Maximum Operating Pressure
The highest operating pressure expected – under any circumstances, kPa (gauge). This pressure must not be exceeded without first recalculating the emergency planning zones and proceeding with an ERP modification/update in accordance with ERCB Directive 071 requirements Emergency planning zone calculations are referenced from the Expected Maximum Operating Pressure. This pressure can be lower than the licenced maximum operating pressure, but under no circumstances can it be higher.
Pipeline Outside Diameter The diameter of the pipe outside diameter, mm
Pipeline Wall Thickness The wall thickness of the pipe, mm
Segment Length
The length of pipeline segment being modelled (entered in metres). It must be one continuous piece of pipe with consistent characteristics such as describe a pipeline licence line number – governed by ERCB Directive 056. Smaller ‘sub-segments’ can be modelled as defined by ‘node’ locations (see Gas Gathering System Analysis - Tutorial in Chapter 9). Nodes are defined as changes in operating conditions, physical pipe changes, substance changes, tie-ins, ESD valves and check valves.
5 Inputs Page 68

5 Inputs Page 69
Field Description
*Equivalent Segment Length between ESDs
(enter Length or Volume below)
The equivalent length of pipeline between emergency shut down valves (entered in metres), as determined by the pipeline gathering system network analysis, or by manual calculation. See Chapter 9 - Pipeline Gathering Systems (which also describes the manual calculation). The Equivalent Segment Length can be the same as the Segment Length (above) IF, when all flow control valves are in a closed position, there is no additional pipeline substance material that can flow into the subject pipeline segment. Under no circumstances can the Equivalent Segment Length be less than the Segment Length. The user must enter either this Equivalent Segment Length OR the Equivalent Cumulative Pipeline Volume (next row down on the INPUTS page). Do not enter both values. When one value is entered, the other row is greyed-out. Emergency planning zone calculations are referenced from the Equivalent Segment Length.
*Equivalent Cumulative Pipeline Volume between ESDs
(enter Volume, or Length above)
The equivalent cumulative pipeline volume between emergency shut down valves, as determined by the formula described in the pipeline gathering system network analysis (entered as m3). See Equivalent Cumulative Pipeline Volume (between ESDs in Chapter 9). The user must enter either this Equivalent Cumulative Pipeline Volume OR the Equivalent Segment Length (previous row on the INPUTS page). Do not enter both values. When one value is entered, the other row is greyed-out. Emergency planning zone calculations are referenced from the Equivalent Segment Length calculated from the equivalent cumulative pipeline volume.
*Next to ‘Equivalent Segment Length between ESDs’ and ‘Equivalent Cumulative Pipeline Volume’, observe that the ‘comment’ cell in column D on the INPUTS page is ‘active’. When one of the two entries is provided by the user, ERCBH2S calculates the ‘missing’ user entry and displays the result in column D. If the user entered the Equivalent Segment Length, column D immediately displays the calculated volume (next to the Equivalent Cumulative Pipeline Volume). If the user entered the Cumulative Pipeline Volume, column D immediately displays the calculated length (next to the Equivalent Segment Length between ESDs).
Expected Maximum Gas to Liquid Ratio
The modelled solution gas to liquid ratio (m3/m3) as measured at stock tank conditions of 15º C and 101.325 kPa (dry gas). This row is only applicable to Oil Effluent pipelines. In the Sour Operations Type (Administrative section of INPUTS page), if the user selected a pipeline substance of Sour Gas, Natural Gas or Acid Gas, this row is greyed-out.

5 Inputs Page 70
Field Description
Licensed Maximum H2S Concentration
The maximum H2S concentration of the pipeline licence (entered in percent (%). The maximum H2S concentration does not have to match the reference composition provided in the gas composition (lower portion of INPUTS page). Pipelines directed to this category with an H2S below 0.01 % (mole percent, equivalent to 0.1 mol/kmol or 0.0001 mole fraction or 100 ppm) do not have to be modelled (ERCB Directive 071). If they are modelled, the results do not need to be submitted to the ERCB.
Expected Maximum H2S Concentration
The highest H2S expected – under any circumstances, entered in percent (%). This H2S must not be exceeded without first recalculating the emergency planning zones and proceeding with an ERP modification/update in accordance with ERCB Directive 071 requirements. This H2S can be lower than the licensed maximum H2S, but under no circumstances can it be higher. If the H2S entry is lower than the licensed maximum, it must not be exceeded during pipeline operations. The H2S entered must accommodate all production scenarios – with consideration given to scenarios where only the highest H2S well is producing through the pipeline if other wells are shut-in. The Expected Maximum H2S Concentration does not have to match the reference composition provided in the gas composition (lower portion of INPUTS page). Note that emergency planning zone calculations are referenced from the Expected Maximum H2S Concentration, and not the Licensed Maximum. Pipelines with an Expected Maximum H2S below 0.01 % (mole percent, equivalent to 0.1 mol/kmol or 0.0001 mole fraction or 100 ppm) do not have to be modelled (ERCB Directive 071). If they are modelled, the results do not need to be submitted to the ERCB.

5 Inputs Page 71
Field Description
Minimum Gas Pipeline Temperature
(ºC)
The pipeline operating temperature in degrees Celsius (ºC). Although some pipelines may be heated to avoid hydrate formation, it is the normal minimum temperature in a pipeline segment that should be entered. If the user entry cell is left blank a default value of 5°C (ground temperature), is used. The allowable temperature range is shown to the right of the INPUTS page, in columns H and I. Observe that in column J, the ‘model action’ for this row is ‘resets’. This means that if a user entry is outside the allowable range, an ‘orange reset’ will be applied. To understand more about orange resets (and why a user must change their entry to remove them) see Orange Resets in this chapter.
Notice that the comment in cells M38 and M39 are ‘active’. They provide the H2S release volume (m3) based on the User Inputs of pressure (kPa), equivalent pipeline length (m), pipeline inside diameter (mm), H2S Concentration (licenced and normal, %) and temperature (°C). The licenced release volume in Cell M38 uses atmospheric pressure of 101.325 kPa and the licenced maximum operating pressure to determine the absolute pressure, the model input temperature and the equivalent segment length. It is used for the pipeline release volume calculation and Level Designation. The actual release volume in Cell M39 uses the calculated atmospheric pressure which is less than 101.325 kPa and the expected maximum operating pressure to determine the absolute pressure, the model input temperature and the equivalent segment length. The display may note that the volumes are for an ideal gas. To determine the real gas values run ERCBH2S→Technical→Run ERCBFlash Only....
Gas Pipeline Group- Source Mitigation Sub-section If the WITH MITIGATION analysis was selected in the Administrative section of the INPUTS page, several more parameters are available for entry to manage pipeline emergency response planning. The WITH MITIGATION analysis entries (see below) include mitigation controls for emergency shutdown (ESD) valves on the pipeline. ERCBH2S accounts for five ESD valve mitigation measures: the time it takes the valve to close once it has been activated to close; the low pressure setting that will trigger the valve to close, the Pressure Rate of Change (PROC) that will trigger the valve to close (including an instrument sampling time to determine the pressure rate of change), the time to manually trigger valve closure; and the time to ignite/draw-down or otherwise terminate the release.

For additional information on a licensee/applicant’s responsibility when changing default entries in the SOURCE MITIGATION section, see Source Mitigation - Licensee/Applicant Responsibility in this chapter.
When to Change the Default Settings
The ERCB default settings in this group result in no effective ESD control for a pipeline release.
A user should only change the valve settings (over-ride the default settings) IF the material flow of the pipeline segment being modelled is completely controlled by ESD valves, or a combination of ESD and back-flow check valves. This includes other pipelines tying into the modelled segment (if these other pipelines can contribute material to the subject pipeline segment in the event of a release).
At each point where material can enter the subject pipeline – both upstream and downstream – the user must follow the source(s) back until a flow control device is located. The flow control device with the lowest setting is the setting that can be modelled. If there is any instance where a flow control device cannot be located, then the default settings in this group must not be changed. Note that for modelling purposes, check valves are assumed to close immediately and completely.
Pre-set ERCBH2S valve settings DO NOT PROVIDE EFFECTIVE ESD CONTROL for a pipeline. The user must adjust the setting if the material flow (both to and from the pipeline segment) is COMPLETELY controlled by ESDs or a combination of ESDs and back-flow check valves. The ERCB default settings in this group result in no effective ESD control for a pipeline release
When modelling a pipeline segment with multiple valve settings (as happens in some gathering systems), the lowest valve setting must be used.
Note that while some planning zones sizes decrease with changes to the source mitigation time, significant EPZ changes are not realized until mitigation time is reduced to 3 hours (180 minutes) or less. The model assumes infinite flow from both upstream and downstream of a pipeline. If the ESD valve does not have a LP trigger setting, then the default of 10 % of the expected maximum operating pressure is used. A low pressure trigger of 10 % means that the pipeline has to depressure to of its total operating MOP before the ESDs will close. This means the associated EPZ will be very large,
5 Inputs Page 72

almost equal to a case suing no mitigation. If the user has an ESD valve, the recommended LP trigger setting is at least 50 % of the expected maximum operating pressure. A low pressure trigger of 90 % is generally unreasonable, as daily fluctuations in pipeline pressure would cause the ESDs to close.
Field Description
ESD Valve Closure Time once Triggered
(s)
The closure time is the time it takes the ESD valve to close once it has been activated to close, either by low pressure setting or pressure rate of change, (seconds). If the cell is left blank then the large default value of 60 s is used.
ESD Valve Low Pressure Trigger, Pesd (kPa gauge)
The normal low pressure (LP) setting is entered as kPa (gauge). If the ESD valve does not have a LP trigger setting, then the cell is left blank and the default of 10 % of the expected maximum operating pressure is used. If the user has an ESD valve, the recommended LP trigger setting is at least 50 % of the expected maximum operating pressure. Note that the ERCB may field verify valve settings. The percent that was modelled (ratio of Valve Setting to Expected Maximum Operating Pressure) will be applied to the actual operating pressure. Licensee must ensure their pipeline is not operating with valve settings (percent/ratio) any lower than what was modelled.
ESD Valve Pressure Rate of Change (PROC) Trigger, dP/dt
(kPa/s)
The pressure rate of change (PROC) trigger setting is used to control the closure of the ESD valve based upon how quickly the pressure is changing at the ESD. PROC is entered in units of kPa/s. If the ESD valve does not have a PROC trigger setting, then the cell must be left blank. The default pressure drop of the normal operating pressure over 1 second will be used – which effectively cancels any potential mitigation advantage due to PROC.
5 Inputs Page 73

5 Inputs Page 74
Field Description
ESD Valve Pressure Rate of Change (PROC) Sampling Time
(s)
The pressure rate of change (PROC) is determined by the valve instrumentation using a sampling time (seconds). If the ESD valve does not have a PROC trigger setting, then the cell is left blank and a large default is used (3600 s) – which effectively cancels any potential mitigation advantage due to PROC.
Time from initial release until ESDs manually or remotely closed
(minutes)
The time it takes from the moment the release occurs to manually (or remotely) close the valve (minutes). The total time entered must provide time to
• detect the release (usually through odour complaint), • contact the operator, • travel to the site, • verify a release is occurring, and • trigger valve closure.
Unless the licensee can perform the above actions, for all related valves (that ensure complete pipeline isolation) in less than 720 minutes (12 hours), this field should be left blank.
Time from initial release until ignition or stop flow
(minutes)
The time it takes from the moment the release occurs to igniting the release, plugging the hole or a drawdown of the pressure (minutes). Effectively the H2S release is completely stopped. The total time entered must provide time to
• detect the release (usually through odour complaint), • contact the operator, • travel to the site, • verify a release is occurring, and • perform a prescribed, pre-planned action that prevents
additional H2S from being released, such as ignition. Unless the licensee can perform the above actions in less than 720 minutes (12 hours), this field should be left blank.
Gas Pipeline Group - Orange Resets
The lower (minimum), upper (maximum) and Model Action for each SOURCE MITIGATION row is shown to the immediate right on the INPUTS page, in columns H, I and J. Observe that the ‘Model Action’ is always ‘Resets’. This means that if the user enters a value outside of the allowable limits, the model automatically ‘resets’ the user entry, and the reset entry is displayed in column E under MODEL INPUT. The resulting ‘orange reset’ creates a red flag error message which must be dealt with.
For details on why orange resets occur, why they must be managed and how, see Orange Resets in this chapter.

Gas Well The Gas Well details group is also designed for liquid and other wells with a Gas to Liquid Ratio (GLR) > 1000 as measured at stock-tank conditions of 15ºC and 101.325 kPa. These gassy wells are included in this group because they will have a steady jet release.
The Gas Well details group has two sections. The first section is open to any user whose initial selection (in SOUR OPERATIONS TYPE) brought them to this group. The second ‘sub-section’, titled SOURCE MITIGATION, is only open to those users who selected the analysis type WITH MITIGATION. When the NO MITIGATON analysis is selected, the source mitigation inputs are disabled as shown below. For general details on allowable entry limits and licensee/applicant responsibility for changing default entries in SOURCE MITIGATION, see Source Mitigation - General in this chapter. Details specific to the Source Mitigation subsection for the Gas Well group are described later in this section.
Notice the Comments column (column D) to the right of the user input column (column C). It contains additional information on some of the cell requirements.
Field Description
Phase of Well Operations? Specify drilling, completion/servicing/workover or producing/injection/suspended from the dropdown list.
Is Well Classified as Critical?Specify Yes or No using the buttons provided. This classification is determined from the criteria in Guide 56–Schedule 4
Unique Well Identifier Specify the unique well identifier as per the well licence or application.
5 Inputs Page 75

5 Inputs Page 76
Field Description
Well CentreSurface Location Coordinates
The well’s surface location coordinates according to the mapping datum and projection selected in the Administrative inputs section. These entries are optional and may be left blank.
Casing or Tubing Inside Diameterat Exit
The inside diameter at the exit (in mm), of either the casing or tubing. For Oil Effluent wells modelled as gas wells, the area taken up by the diameter of the sucker rod (pumping wells only) can be ignored; just use the tubing inside diameter.
*Expected Maximum H2S Concentration
The highest H2S possible (appropriate to the phase of well operation being modelled), entered in percent (%). For new wells, this is the H2S provided in the well licence application. For existing wells, it is the highest possible H2S from any formation capable of flowing to surface. The Hazard Modelling H2S Concentration does not have to match the reference composition provided in the gas composition (lower portion of INPUTS page). Note that emergency planning zone calculations are referenced from the Hazard Modelling H2S Concentration. Wells with an H2S below 0.01 % (mole percent, equivalent to 0.1 mol/kmol or 0.0001 mole fraction or 100 ppm) do not have to be modelled (ERCB Directive 071). If they are modelled, the results do not need to be submitted to the ERCB.
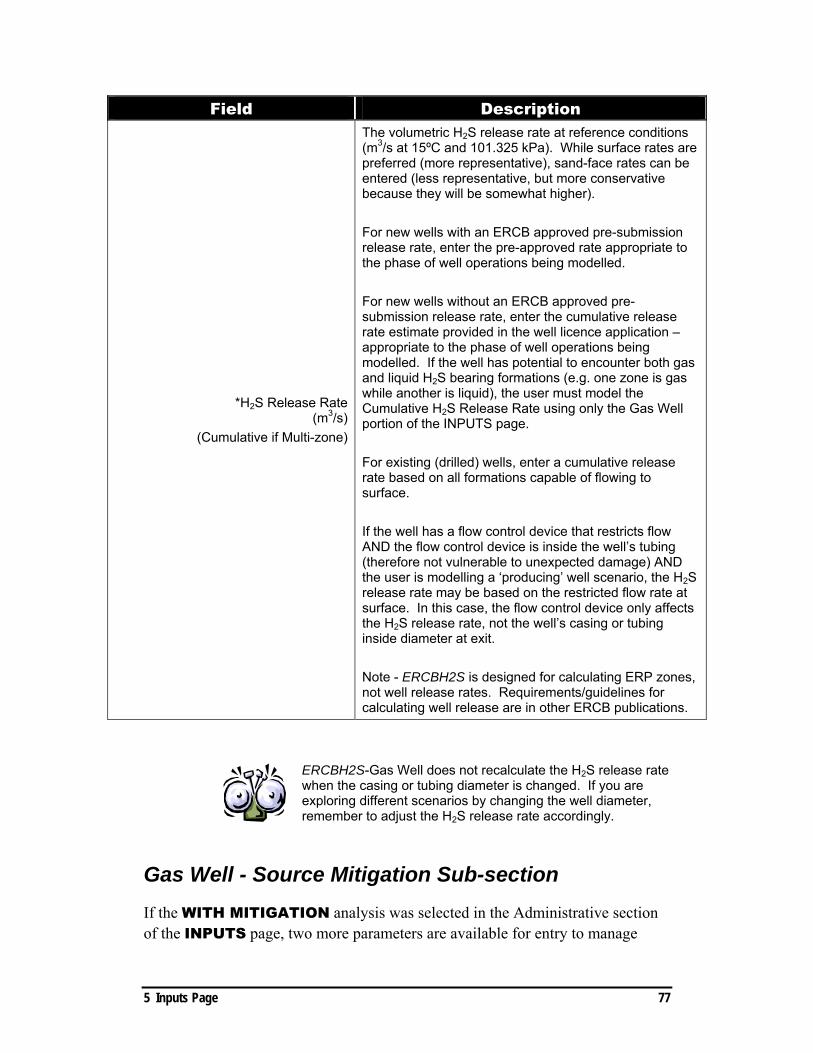
5 Inputs Page 77
Field Description
*H2S Release Rate(m3/s)
(Cumulative if Multi-zone)
The volumetric H2S release rate at reference conditions (m3/s at 15ºC and 101.325 kPa). While surface rates are preferred (more representative), sand-face rates can be entered (less representative, but more conservative because they will be somewhat higher). For new wells with an ERCB approved pre-submission release rate, enter the pre-approved rate appropriate to the phase of well operations being modelled. For new wells without an ERCB approved pre-submission release rate, enter the cumulative release rate estimate provided in the well licence application – appropriate to the phase of well operations being modelled. If the well has potential to encounter both gas and liquid H2S bearing formations (e.g. one zone is gas while another is liquid), the user must model the Cumulative H2S Release Rate using only the Gas Well portion of the INPUTS page. For existing (drilled) wells, enter a cumulative release rate based on all formations capable of flowing to surface. If the well has a flow control device that restricts flow AND the flow control device is inside the well’s tubing (therefore not vulnerable to unexpected damage) AND the user is modelling a ‘producing’ well scenario, the H2S release rate may be based on the restricted flow rate at surface. In this case, the flow control device only affects the H2S release rate, not the well’s casing or tubing inside diameter at exit. Note - ERCBH2S is designed for calculating ERP zones, not well release rates. Requirements/guidelines for calculating well release are in other ERCB publications.
ERCBH2S-Gas Well does not recalculate the H2S release rate when the casing or tubing diameter is changed. If you are exploring different scenarios by changing the well diameter, remember to adjust the H2S release rate accordingly.
Gas Well - Source Mitigation Sub-section If the WITH MITIGATION analysis was selected in the Administrative section of the INPUTS page, two more parameters are available for entry to manage

‘well’ emergency response planning. The WITH MITIGATION analysis entries (see below) include mitigation controls for Surface Controlled Sub-Surface Safety Valves (SCSSSV) – a yes/no entry for producing wells only, and time from initial release until ignition or stop flow (input value).
For additional information on a licensee/applicant’s responsibility when changing a default entry in the SOURCE MITIGATION section, see Source Mitigation - Licensee/Applicant Responsibility in this chapter.
When to Change the Default Settings
A user should only change the default settings (over-ride the default settings) in this group IF the licensee can perform/coordinate the following actions within the time frame indicated in this section of the model:
• detect the release,
• contact the operator (if the well operation is un-manned),
• travel to the site (if the well operation is un-manned),
• verify a release is occurring (if the well operation is un-manned), and
• perform a prescribed, pre-planned action that prevents additional H2S from being released (such as igniting the well or closing a valve).
Unless the licensee can perform the above actions in less than the time shown as a default entry for this group, this field should be left blank. Note that the default setting for ‘Time from initial release until ignition or stop flow’ changes with the phase of well operation – which indicates if the site is manned or un-manned (subsequently affecting the time to implement mitigation measures). In addition, producing wells with a Surface- Controlled Sub-Surface Safety Valve (SCSSSV) have a significantly reduced default setting.
Note that while some planning zones sizes decrease with changes to the source mitigation time, significant EPZ changes are not realized until mitigation time is reduced to 3 hours (180 minutes) or less.
5 Inputs Page 78

The ERCB may request documentation that supports a licensee’s non-default Time from Initial Release until Ignition or Stop Flow values
Gas Well Group - Orange Resets
The lower (min.), upper (max.) allowable values for ‘Time from initial release until ignition or stop flow’ change with the phase of well operation, and with the presence of a SCSSSV. The allowable limits are shown to the immediate right on the INPUTS page, in columns H and I. Observe that in column ‘J’ the ‘Model Action’ is ‘Resets’. This means that if the user enters a value outside of the allowable limits, the model automatically ‘resets’ the user entry, and the reset entry is displayed in column E under MODEL INPUT. The resulting ‘orange reset’ creates a red flag error message which must be dealt with.
For details on why orange resets occur, why they must be managed and how, see Orange Resets in this chapter.
Liquid Pipeline or Liquid Well The Liquid Pipeline or Liquid Well details group is designed for both pipelines and wells with a Gas to Liquid Ratio (GLR) ≤ 1000 as measured at stock-tank conditions of 15º C and 101.325 kPa. These fluid releases contain no free gas – the solution gas is released from the pool of liquid that forms as the liquid pumps onto the ground. The release is modelled as a steady jet.
The Liquid Pipeline or Liquid Well details group has two sections. The first section is open to any user whose initial selection (in SOUR OPERATIONS TYPE) brought them to this group. The second ‘sub-section’, titled SOURCE MITIGATION, is only open to those users who selected the analysis type WITH MITIGATION. When the NO MITIGATON analysis is selected, the source mitigation inputs are disabled as shown below. For general details on allowable entry limits and licensee/applicant responsibility for changing default entries in SOURCE MITIGATION, see Source Mitigation - General in this chapter. Details specific to the Source Mitigation subsection for the Liquid Pipeline or Liquid Well group are described later in this section. The following ‘screen capture’ is for a pipeline.
5 Inputs Page 79

The look changes if a well is selected, as shown below:
5 Inputs Page 80

Notice the Comments column (column D) to the right of the user input column (column C). It contains additional information on some of the cell requirements.
Depending on the user’s selected SOUR OPERATIONS TYPE (in the Administrative section of the INPUTS page), certain cells/rows will appear greyed-out. While some rows pertain only to pipelines and others to wells, most rows are pertinent to both pipelines and wells.
Field Description
Phase of Well Operations?
Specify drilling, completion/servicing/workover or producing/injection/suspended from the dropdown list. For pipelines, this entry is greyed-out.
Is Well Classified as Critical?
Specify Yes or No using the buttons provided. This classification is determined from the criteria in Guide 56–Schedule 4 For pipelines, this entry is greyed-out.
Unique Well Identifier Specify the unique well identifier as per the well licence or application. For pipelines, this entry is greyed-out.
Well Centre Surface Location Coordinates,
or Pipeline Segment From Location
Coordinates
The well surface coordinates or the ‘beginning/upstream’ pipeline segment (or sub-segment) coordinates, according to the mapping datum and projection selected in the Administrative inputs section. These entries are optional and may be left blank.
Pipeline Segment To Location Coordinates
The ‘ending/downstream’ pipeline segment (or sub-segment) coordinates, according to the mapping datum and projection selected in the Administrative inputs section. These entries are optional and may be left blank. For wells, these entries are greyed-out.
Licenced Maximum Operating Pressure
if oil effluent pipeline
For oil effluent pipelines only. For other pipeline substances and wells, this entry is greyed-out. The maximum operating pressure (MOP) for which the pipeline is licensed, kPa (gauge). The Land Use Setback volume calculations use Licenced Maximum Operating Pressure.
*Pipe Outside Diameter
The pipe outside diameter, (mm). For wells, this is the tubing (for the producing phase) or the casing (for the drilling or servicing phase). For pumping wells with a ‘producing’ well phase, the area taken up by the diameter of the sucker rod can be ignored; just use the tubing inside diameter.
*Pipe Wall Thickness The pipe wall thickness, (mm). For wells, this will be the tubing (for the producing phase) or the casing (for drilling or servicing phase).
5 Inputs Page 81

5 Inputs Page 82
Field Description
Segment Length if oil effluent pipeline
For oil effluent pipelines only. For other pipeline substances and wells, this entry is greyed-out. Length of oil effluent pipeline segment being modelled (m). It must be one continuous piece of pipe with consistent characteristics such as described by a pipeline licence line number – governed by ERCB Directive 056. Smaller ‘sub-segments’ can be modelled as defined by ‘node’ locations (see Gas Gathering System Analysis - Tutorial in Chapter 9). Nodes are defined as changes in operating conditions, physical pipe changes, substance changes, tie-ins, ESD valves and check valves.
**Equivalent Segment Length between ESDs, if oil effluent pipeline
(enter Length or Volume below)
For oil effluent pipelines only. For other pipeline substances and wells, this entry is greyed-out. The equivalent length of oil effluent pipeline between emergency shut down valves, as determined by the pipeline gathering system network analysis (m), or by manual calculation. See Chapter 9 Pipeline Gathering Systems, which also describes the manual calculation. The Equivalent Segment Length can be the same as the Segment Length (above) IF, when all flow control valves are in a closed position, there is no additional pipeline substance material that can flow into the subject pipeline segment. Under no circumstances can this Equivalent Segment Length be less than the Segment Length. The user must enter either this Equivalent Segment Length OR the Equivalent Cumulative Pipeline Volume (next row down on the INPUTS page). Do not enter both values. When one value is entered, the other row is greyed-out.
**Equivalent Cumulative Pipeline
Volume between ESDs,
if oil effluent pipeline (enter Volume or
Length above)
For oil effluent pipelines only. For other pipeline substances and wells, this entry is greyed-out. The equivalent cumulative oil effluent pipeline volume between emergency shut down valves, as determined by the formula described in the pipeline gathering system network analysis (m3) see Chapter 9 Equivalent Cumulative Pipeline Volume (between ESDs). The user must enter either this Equivalent Cumulative Pipeline Volume OR the Equivalent Segment Length (previous row on the INPUTS page). Do not enter both values. When one value is entered, the other row is greyed-out.

5 Inputs Page 83
Field Description **Next to ‘Equivalent Segment Length between ESDs’ and ‘Equivalent Cumulative Pipeline Volume’, observe that the ‘comment’ cell in column D on the INPUTS page is ‘active’. When one of the two entries is provided by the user, ERCBH2S calculates the ‘missing’ user entry and displays the result in column D. If the user entered the Equivalent Segment Length, column D immediately displays the calculated volume (next to the Equivalent Cumulative Pipeline Volume). If the user entered the Cumulative Pipeline Volume, column D immediately displays the calculated length (next to the Equivalent Segment Length between ESDs).
Expected Maximum Liquid Flow Rate of Pipeline Fluid [m³/d]
Enter the maximum liquid flow rate (oil and water or other liquid), [m³/d] for PIPELINE fluids. For wells, this entry is greyed-out.
Expected Maximum Gas to Liquid Ratio
The modelled solution gas to liquid ratio (m3) as measured at stock tank conditions of 15º C and 101.325 kPa (dry gas). If the liquid is pressurized and heated, the gas release is from the liquid that has been cooled to near atmospheric conditions. This approach allows for any gas that stays in the liquid.
Licensed Maximum H2S Concentration
if oil effluent pipeline
For oil effluent pipelines only. For all other pipeline substances and wells, this row is greyed out. The maximum H2S concentration of the pipeline licence (entered in percent (%). The maximum H2S concentration does not have to match the reference composition provided in the gas composition (lower portion of INPUTS page). Note that emergency planning zone calculations are referenced from the Expected Maximum H2S Concentration, not the Licensed Maximum. The Land Use Setback volume calculations use the Licenced Maximum H2S Concentration.

5 Inputs Page 84
Field Description
Expected Maximum H2S Concentration
FOR PIPELINES (DESCRIPTIONS FOR WELLS IN NEXT SECTION)
The highest H2S expected – under any circumstance, entered in percent (%). This H2S must not be exceeded without first recalculating the emergency planning zones and proceeding with an ERP modification/update in accordance with ERCB Directive 071 requirements. For pipelines where the licensed H2S is not representative of the actual H2S maximum (due to previous requirements of Directive 056 regarding certain pipeline substances), this H2S entry can be higher than the pipeline licence. For pipelines with licences that have representative H2S maximums, this H2S entry cannot exceed the licensed maximum. For all pipelines, this H2S entry can be lower than the licensed maximum provided it is not exceeded during pipeline operations. The H2S entered must accommodate all production scenarios – with consideration given to scenarios where only the highest H2S well is producing through the pipeline if other wells are shut-in. The Expected Maximum H2S Concentration does not have to match the reference composition provided in the gas composition (lower portion of INPUTS page). Pipelines with an Expected Maximum H2S below 0.01 % (mole percent, equivalent to 0.1 mol/kmol or 0.0001 mole fraction or 100 ppm) do not have to be modelled (ERCB Directive 071). If they are modelled, the results do not need to be submitted to the ERCB. Note that emergency planning zone calculations are referenced from the Expected Maximum H2S Concentration, not the Licensed Maximum.

5 Inputs Page 85
Field Description
Expected Maximum H2S Concentration
FOR WELLS (DESCRIPTIONS FOR PIPELINES IN PREVIOUS SECTION)
The highest H2S possible (appropriate to the phase of well operation being modelled), entered in percent (%). For new wells, this is the H2S provided in the well licence application. For all existing wells, it is the highest possible H2S from any formation capable of flowing to surface. For pumping wells, it is the highest possible H2S from any formation being pumped to surface. For injection or disposal wells, it is the highest possible H2S that can be released at the surface. The Expected Maximum H2S Concentration does not have to match the reference composition provided in the gas composition (lower portion of INPUTS page). Wells with an H2S below 0.01 % (mole percent, equivalent to 0.1 mol/kmol or 0.0001 mole fraction or 100 ppm) do not have to be modelled (ERCB Directive 071). If they are modelled, the results do not need to be submitted to the ERCB. Note that emergency planning zone calculations are referenced from the Expected Maximum H2S Concentration.
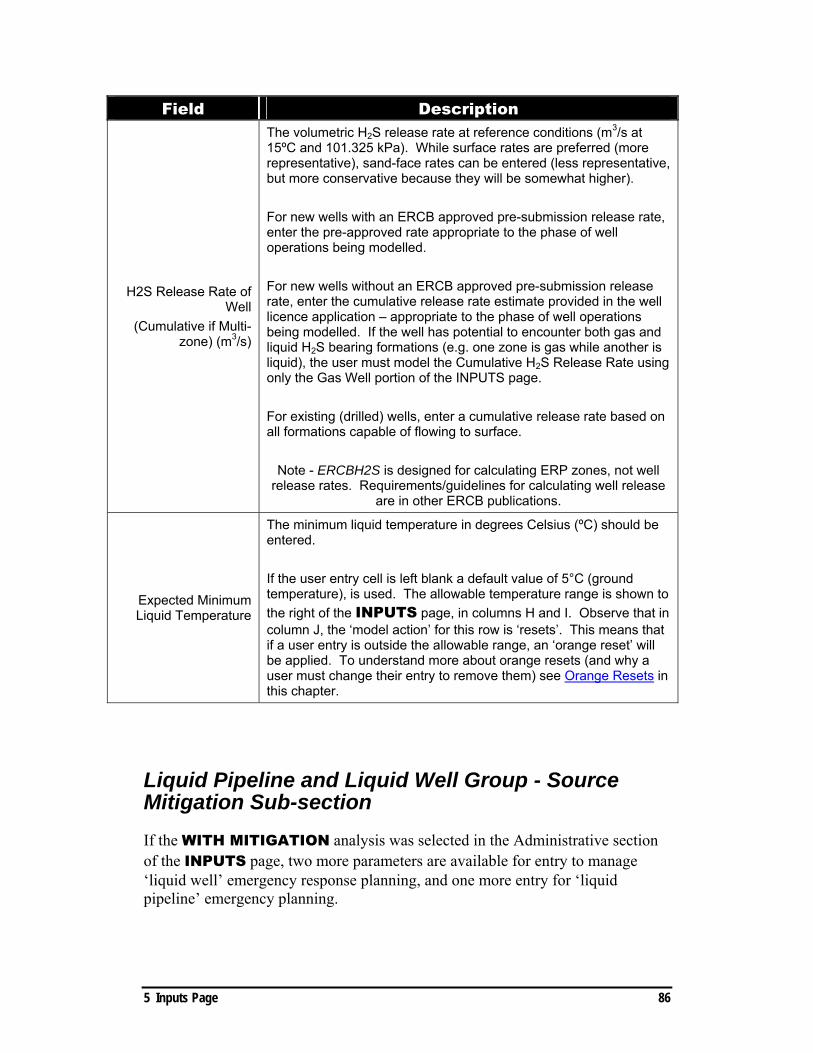
5 Inputs Page 86
Field Description
H2S Release Rate of Well
(Cumulative if Multi-zone) (m3/s)
The volumetric H2S release rate at reference conditions (m3/s at 15ºC and 101.325 kPa). While surface rates are preferred (more representative), sand-face rates can be entered (less representative, but more conservative because they will be somewhat higher). For new wells with an ERCB approved pre-submission release rate, enter the pre-approved rate appropriate to the phase of well operations being modelled. For new wells without an ERCB approved pre-submission release rate, enter the cumulative release rate estimate provided in the well licence application – appropriate to the phase of well operations being modelled. If the well has potential to encounter both gas and liquid H2S bearing formations (e.g. one zone is gas while another is liquid), the user must model the Cumulative H2S Release Rate using only the Gas Well portion of the INPUTS page. For existing (drilled) wells, enter a cumulative release rate based on all formations capable of flowing to surface.
Note - ERCBH2S is designed for calculating ERP zones, not well release rates. Requirements/guidelines for calculating well release
are in other ERCB publications.
Expected Minimum Liquid Temperature
The minimum liquid temperature in degrees Celsius (ºC) should be entered. If the user entry cell is left blank a default value of 5°C (ground temperature), is used. The allowable temperature range is shown to the right of the INPUTS page, in columns H and I. Observe that in column J, the ‘model action’ for this row is ‘resets’. This means that if a user entry is outside the allowable range, an ‘orange reset’ will be applied. To understand more about orange resets (and why a user must change their entry to remove them) see Orange Resets in this chapter.
Liquid Pipeline and Liquid Well Group - Source Mitigation Sub-section If the WITH MITIGATION analysis was selected in the Administrative section of the INPUTS page, two more parameters are available for entry to manage ‘liquid well’ emergency response planning, and one more entry for ‘liquid pipeline’ emergency planning.

The WITH MITIGATION analysis entries (see below) include mitigation controls for Surface Controlled Sub-Surface Safety Valves (SCSSSV) – a yes/no entry (producing wells only), and time from initial release until ignition or stop flow (input value for pipelines or wells).
For additional information on a licensee/applicant’s responsibility when changing a default entry in the SOURCE MITIGATION section, see Source Mitigation - Licensee/Applicant Responsibility in this chapter.
When to Change the Default Settings
A user should only change the default settings (over-ride the default settings) in this group IF the licensee can perform/coordinate the following actions within the time frame indicated in this section of the model:
• detect the release,
• contact the operator (for wells, consider whether or not it is a manned operation),
• travel to the site (for wells, again consider whether or not it is a manned operation),
• verify a release is occurring (for wells, again consider whether or not it is a manned operation), and
• perform a prescribed, pre-planned action that prevents additional H2S from being released (such as igniting the well or pipeline, closing a valve, or ‘drawing down’ a pipeline).
Unless the licensee can perform the above actions in less time than shown as a default entry for this group, this field should be left blank. Note that for wells, the default setting for ‘Time from initial release until ignition or stop flow’ changes with the phase of well operation – which indicates if the site is manned or un-manned (subsequently affecting the time to implement mitigation measures). In addition, producing wells with a Surface- Controlled Sub-Surface Safety Valve (SCSSSV) have a significantly reduced default setting. To change the SCSSSV option, a ‘with mitigation’ analysis must be selected.
For pipelines, the default entry and the allowable value range for ‘Time from initial release until ignition or stop flow’ remain constant. The SCSSSV row is greyed-out for pipelines.
5 Inputs Page 87

Note that for liquid pipelines, the duration of the release is a function of whether the release has been manually detected - since emergency shutdown valves are not normally employed on this type of pipeline. Consequently, production pumps continue at capacity until the release is detected. For this reason, ERCBH2S assumes the maximum modelling time of 12 hours before the leak is detected. Durations longer than 12 hours will not impact the size of the ERP zones. If site-specific controls are available to limit this time, a WITH MITIGATION analysis allows the user to change the Time from Initial Release till Stop Flow or Ignition.
In all cases where SOURCE MITIGATION default values are changed, the ERCB may request documentation to support a licensee’s entries.
Note that while some planning zones sizes decrease with changes to the source mitigation time, significant EPZ changes are not realized until mitigation time is reduced to 3 hours (180 minutes) or less.
The ERCB may request documentation that supports a licensee’s non-default Time from Initial Release until Ignition or Stop Flow values
Liquid Pipeline or Liquid Well Group - Orange Resets
The lower (min.), upper (max.) allowable values for ‘Time from initial release until ignition or stop flow’ change with the phase of well operation, and with the presence of a SCSSSV. For pipelines, they remain the same (the SCSSSV row is greyed-out for pipelines).
The allowable limits are shown to the immediate right on the INPUTS page, in columns H and I. Observe that in column ‘J’ the ‘Model Action’ is ‘Resets’. This means that if the user enters a value outside of the allowable limits, the model automatically ‘resets’ the user entry, and the reset entry is displayed in column E under MODEL INPUT. The resulting ‘orange reset’ creates a red flag error message which must be dealt with.
For details on why orange resets occur, why they must be managed and how, see Orange Resets in this chapter.
5 Inputs Page 88

Sour Gas Composition In the Sour Gas Composition input section, enter a representative composition of the sour gas stream according to a reference analysis. The data format is in component molar fractions input on a dry basis. For the analysis should be for the gas phase, at standard conditions of 15º C and 101.325 kPa – dry basis.
If a well has multiple zones, if possible - choose the zone with the highest H2S. Otherwise, as long as the analysis composition is representative of at least one of the zones, differences from one analysis to another make little difference in the calculated size of the planning zones. ERCBH2S adjusts the user entered analysis H2S value to equal the H2S entered for modelling purposes (in the Gas Pipeline, Gas Well, or Liquid Pipeline or Liquid Well section of the INPUTS page – the Expected Maximum H2S). All other composition components are pro-rated according to their new fractional contribution to the total (renormalized). The adjusted analysis can be immediately viewed on the ERP summary page because the calculations performed by Excel – no ERCBH2S program ‘run’ commands are needed for this conversion. All ERCBH2S calculations will reference the adjusted analysis.
Representative gas composition requirements are as described in other current ERCB publications, such as Directive 056 and Directive 040.
Data entered must be normalized; that is, the molar fractions of the listed components must sum to 1.0. ERCBH2S will not correct the data for you. A warning error next to the will appear when values are not normalized as shown in the illustration above. This warning is used to prevent user entry errors if gas components are skipped or miss-entered. Sometimes, due to rounding, a gas analysis may add up to slightly more than 1. In this event, subtract the ‘extra’ mass from whichever component has the highest mole fraction, and entered the adjusted values.
5 Inputs Page 89

If the maximum H2S value specified in the Details section is different than the value specified in the gas composition field, ERCBH2S readjusts the composition specified to use the specified value. The stream composition will be renormalized and then this new composition will be used for all subsequent calculations.
Advanced User Selected Case For ERCB submission, the default entries in this section must not be changed. User over-ride of the default entries creates a red flag error message that will remain attached to the calculation results.
This section provides an opportunity for the advanced technical user to investigate intermediate calculations and mitigation strategies for a selected meteorological and/or Gas Pipeline Release Hole Size (Fraction).
Field Description
Ambient Wind Speed at measurement height, Uref
Ambient wind speed, in m/s. The DEFAULT value is 2.0 m/s.
Stability Class
Atmospheric turbulence conditions as defined by Pasquill Gifford stability classes. The DEFAULT stability is Class F (also represented by a numerical value of 6). The Pasquill-Gifford scale is: 1 = A: very unstable (very turbulent) 2 = B: moderately unstable 3 = C: slightly unstable 4 = D: neutral conditions (breezy, overcast) 5 = E: moderately stable 6 = F: very stable (calm) 7 = none (default)
Pipeline Release Hole Size Fraction, Ae/Ap
The Ae/Ap ratio entered includes the discharge coefficient due to compressibility effects at the exit orifice.
5 Inputs Page 90

5 Inputs Page 91
All rows in the User Selected Case group have pre-determined entry limits shown to the immediate right on the INPUTS page, in columns H and I. Observe that in column ‘J’ the ‘Model Action’ is ‘Resets’. This means that if the user enters a value outside of the allowable limits, the model automatically ‘resets’ the user entry, and the reset entry is displayed in column E under MODEL INPUT.
For details on why orange resets occur, why they must be managed and how, see Orange Resets in this chapter.
ERCBH2S normally iterates through 54-combinations of stability class and wind speed for 11 pipeline hole size fractions to calculate the largest ERP zones (i.e., worst-release hazard distances) for each of 54 different meteorological conditions. To enable the user to perform ‘what-if’ analyses, a user selected case may be entered to override the automatic search. These inputs are for the technical user only.
Default over-rides in the User Selected Case group are not acceptable for ERCB submission. A red flag error message will be attached to the calculation results.

6. Calculation Pages
Calculation pages have a yellow sheet tab. Intermediate calculation pages are not displayed for normal operation of the ERCBH2S program. A list of the intermediate calculation pages is provided in Chapter 4 under “User-Interface”.
Intermediate calculation pages are not displayed for normal operation of the ERCBH2S program operation. The Hide Technical Pages switch can be toggled to display these pages in the ERCBH2S template file.
Some of the intermediate calculation pages are general in nature and are displayed whenever the Hide Technical Pages toggle is deactivated. Other pages are only visible depending on the assessment flavour. For example, if the ERCBH2S flavour has been set to SOUR GAS PIPELINE, then the SOUR GAS WELL and SOUR OIL related pages will remain hidden.
Common Pages
CONSTANTS The CONSTANTS page has a green sheet tab for inputs because it contains a variety of ERCB mandated default input values as well as physical and chemical constants required for the calculations. There are many parameters in ERCBH2S that require advanced scientific expertise and judgement. The selected default values are mandatory parameters for ERCBH2S to avoid arbitrary selection while providing a common assessment basis for ERP zones calculations. The values on this page are security protected and are not editable.
ERCB Default Inputs
The following table describes the parameters that have been selected by the ERCB as default entries.
6 Calculation Pages 92

Source Description
Release Angle
Orientation of the source release. HORIZONTAL means that the release is parallel to the ground surface. VERTICAL means that the release is directed upwards, away from the ground surface. The DEFAULT is horizontal
D Plane Drag Coefficient, CD
Drag Coefficient is an empirical factor to account for losses of momentum due to the jet release interactions with surfaces, such as the ground or obstacles. The Drag Coefficient can affect the dispersion results, especially in the near field, because of the momentum loss, plume rise and travel time effects. The drag coefficient is between 0 and 1. The default value is 0.5. Producing wells are typically free of well site infrastructure; therefore 0.25 is used as the default.
Water Content of Sour Gas The water (moisture) content in the gas stream is specified. The DEFAULT water content of gas is 0 mg of water per standard m3 of wet gas.
Meteorology Description Ambient Temperature, Ta Ambient air temperature. The DEFAULT value is 5°C, a typical
6 Calculation Pages 93

annual average temperature in Alberta.
Relative Humidity, rh Relative humidity of air. The DEFAULT value is 60 %.
Ambient Measurement Height zaHeight at which the wind speed is measured. The DEFAULT value is 4 m to be consistent with plume dispersion parameterization used in ERCBSLAB.
Surface Roughness Height, Zo
Surface roughness height is an effective height of surface conditions as they affect atmospheric turbulence. Typical values range from 0.001 m (very smooth) to 2.0 m (hilly or urban). The DEFAULT value is 0.10 m.
Exposure Description Planning Endpoint, TLeCp
(TLeC=Toxic Load Equivalent Concentration)
Concentration used in calculating the equivalent toxic load threshold for planning purposes. The DEFAULT value is 100 ppm.
Planning Endpoint Duration tp Duration used in calculating the equivalent toxic load threshold for planning. The DEFAULT value is 60 minutes.
Response Endpoint, TLeCr (TLeC=Toxic Load Equivalent
Concentration)
Concentration used in calculating the equivalent toxic load threshold for response purposes. The DEFAULT value is 100 ppm.
Response Endpoint Duration tr Duration used in calculating the equivalent toxic load threshold for Response. The DEFAULT value is 150 minutes.
Concentration Exponentfor Toxic Load, n
Exponent used in calculation of toxic load. The DEFAULT value is 3.5.
Building Air Changes per Hour, ACH
Building air changes is the ventilation rate of the building and is used to estimate indoor H2S concentrations for sheltering. Values range from 0 (no exchange) to more than 35 (lots of exchange, automobile). For buildings, the range is 0.1 to 5 building air changes per hour. The DEFAULT value of 0.5 is for leaky residential buildings.
Maximum Exposure Time Maximum duration, exposure and averaging time for the release. The DEFAULT value is 10800 seconds (3 hours).
Reference Total Fluctuation Intensity iref
A measure of how much the concentration varies from the average for a given averaging time. The DEFAULT value is 0.25.
Reference Time for Reference Total Fluctuation Intensity
The DEFAULT value is 180 seconds (3 minutes)
Gas Pipeline Description
Gas Pipeline Release Height, hsSource height for sour gas pipeline releases. The DEFAULT value is 0 m.
Pipe Absolute RoughnessRoughness of the inside wall of the pipeline. The DEFAULT value is 0.05 mm.
Blowdown Inertial Delay Factor, KiConstant used in calculations to determine the mass release rate. The DEFAULT value is 0.5.
Gas Well Description
Gas Well Release Height, hs Height from which the well release occurs, measured in m. The DEFAULT value is 1 m.
6 Calculation Pages 94

Stagnation Temperature, Ti
Stagnation temperature of the wellhead release includes the temperature rise that would occur if the flowing gas were stopped to a velocity of zero. The DEFAULT value is calculated based upon the average of the ideal gas properties of the release to result in a dense release and the typical ground temperature of 5 °C.
Liquid Pipeline/Well Description
Liquid Release Height, hsSource height for sour liquid pipeline/well releases. The DEFAULT value is 0 m for pipelines and 1 m for wells.
See ERCBH2S document Volume 1: Technical Reference Document and ERCBH2S document Volume 2: Emergency Response Planning Endpoint for more information.
Physical Constants
ERCBH2S makes use of several chemical-physical constants. The values used in ERCBH2S, ERCBFLASH and ERCBSLAB are listed below.
ERCBH2S also calculates the thermodynamics for moist air as listed below.
6 Calculation Pages 95

SHARED The SHARED page contains gas calculations that are common to all ERCBH2S analysis flavours. The page includes calculations of chemical/physical properties and gas composition. The values on this page are security protected and are not editable.
ERCBFLASH The ERCBFLASH page lists the inputs to the ERCBFLASH program. The ERCBFLASH program calculates ‘real gas’ chemical/physical properties for the well or pipeline release exit conditions. Real gas properties can vary significantly from ‘ideal gas’ properties due to extreme conditions such as pressure or temperature. The values on this page are security protected and are not editable.
ERCBFLASH OUTPUT The ERCBFLASH OUTPUT page displays the ERCBFLASH program output information. The output consists of a listing of the calculated ‘real gas’ properties. The values on this page are security protected and are not editable.
ERCBSLAB The ERCBSLAB page lists the inputs to the ERCBSLAB program for H2S dispersion modeling. A note at the top of the page indicates if the run is dense or passive/ buoyant. The values on this page are security protected and are not editable.
The ERCBSLAB input file is similar to the original US EPA Slab program input file. The input variables that are different than the original program are highlighted by bold typeface
ERCBSLAB OUTPUT The ERCBSLAB OUTPUT page displays output from the ERCBSLAB program. The output from ERCBSLAB is a modified version of the original USEPA SLAB format, but maintains the same concepts. The values on this page are security protected and are not editable.
6 Calculation Pages 96

The ERCBSLAB output file can be produced by activating the ERCBSLAB debug switch ERCBH2S→ Setup→ERCBSLAB Debug. The output file is written to the default folder.
TOX OUTPUT The TOX OUTPUT page displays the ERCBSLAB program secondary output file for toxic load calculations for the User Selected Case of meteorology and pipeline release fraction. The listing shows concentrations and toxic load equivalent concentrations with distance for each of the indoor and outdoor, planning and alert criteria combinations. The values on this page are security protected and are not editable.
The ERCBSLAB secondary output ToxOutput file can be produced by activating the ERCBSLAB debug switch ERCBH2S→ Setup→ERCBSLAB Debug. The output file is written to the default folder.
MAX OUTPUT The MAX OUTPUT page displays the ERCBSLAB program secondary output file for toxic load calculations for all screening meteorology cases and the user selected pipeline release fraction. The listing shows the maximum concentrations and toxic load equivalent concentrations with distance for each of the indoor and outdoor, planning and alert criteria combinations. The values on this page are security protected and are not editable.
The ERCBSLAB secondary output MaxOutput file can be produced by activating the ERCBSLAB debug switch ERCBH2S→ Setup→ERCBSLAB Debug. The output file is written to the default folder.
METMATRIX The METMATRIX page displays output from screening matrix calculations. That stability class and wind speed values specified on the INPUTS page have a significant effect on the calculated hazard distances. To help efficiently examine the worst-release hazard distances incurred by varying the stability class and wind speed values over the possible combinations, the various hazard distances are
6 Calculation Pages 97

calculated and presented in tabular format. In total 54-combinations of stability class and wind speed based on the regulatory screening matrix are calculated. The calculation matrix is displayed on the METMATRIX page. If the Pipeline flavour is selected, then the METMATRIX page will also display the results of the Ae/Ap Ratio Search for each meteorological condition.
HAZARD DISTANCES The HAZARD DISTANCES page displays the calculation matrix and predicted output of the Dispersion Condition Probability Weighted Hazard Distance that supports the calculated distances for the Planning and Response zones.
The Dispersion Condition Probability Weighted Hazard Distance is a weighted-averaged value of 54 Worst-Release Hazard Distances, which is calculated by multiplying the hazard distance in each of 54 categories by fraction of time that each meteorological condition occurs.
The results of Maximum of Primary and Secondary Hazard Distances from the METMATRIX page are displayed as the Worst-Release Hazard Distances in the HAZARD DISTANCES page. The model uses the Average Probability of PG Stability Class and Wind Speed in Alberta (historical data from Alberta Environment) to determine the fraction of time that each of the dispersion conditions occurs and weights the Worst-Release Hazard Distances to produce the Dispersion Condition Probability Weighted Hazard Distance.
Note: The Worst-Release with Worst-Dispersion Distance is also displayed in the HAZARD DISTANCES page. However, these values are not displayed in the ERP SUMMARY page.
The Hazard distances are not rounded, but show distances to a resolution of 1 m. The ERP planner should use these distances in conjunction with other planning information (egress routes, population density, etc...) and finalize the ERP zones to a logical site-specific distance.
Although the ERCBH2S models may predict Hazard distances greater than 30000 m (30km) the maximum suggested EPZ, IIZ, or PAZ is 30000 m (30km). This is the largest distance to where the model predictions can be applied.
6 Calculation Pages 98

Gas Pipeline Pages
SOUR GAS PIPELINE The ERCBH2S calculation pages for each sour operations type are divided into the following sections:
Section Title Description
Release Description General data describing pipeline segment and factors needed for subsequent calculations.
Source CalculationsInput and outputs from ERCBFLASH used to calculate the Mass Release Rate and Duration and Receptor Exposure.
Receptor Exposure Calculations Exposure calculation data, as defined by user and release.
From ERCBFLASH Output data from ERCBFLASH. This information will only be updated after the program has been run.
Data calculated from real fluid properties
Compares choked flow properties to ERCBSLAB inputs to determine flow type.
Buoyancy Flux A comparison of buoyancy values using different methods to ensure consistency.
Inputs to ERCBSLAB Input data for the ERCBSLAB program. Uses the second ERCBFLASH data.
Jet Expansion Planes, Both JetsComparison of gas stream properties for jet expansion planes (I, E, Q, D and R). R plane data is used as input for ERCBSLAB.
Drag Test Calculations
This section allows the user to determine what drag coefficient to use based on a velocity or velocity ratio. It also gives the force required to slow down and change directions of the jet. Note the default drag coefficient can not be changed by the user.
The calculations are security protected and are not editable. These calculations are displayed in order to provide information about the calculation process and aid in understanding the theory behind the models. You may note that some cells have the labels “not used” beside them in the page. This is because although ERCBFLASH calculates these properties they are not used in the ERCBH2S program. They are presented here for your information only.
The SOUR GAS PIPELINE page uses the input data to calculate the physical characteristics of the release. Refer to the section on Gas Pipeline Calculation Process for a general overview of the calculation process. The approach and
6 Calculation Pages 99

assumptions involved in the estimates are described in Volume 1 - Technical Reference Document.
ESD CLOSURE The amount of mass released during a pipeline failure can be a function of the spacing of emergency shut-down (ESD) valves. The blow-down of the pipeline takes some time for the pipeline to depressurize. The pipeline does not depressurize uniformly, but in a non-linear fashion from the release location. It may take some time before the pressure at the location of the ESD is sufficient to trigger the closure of the valve and will also depend on the pressure set-point of the valve and its sensitivity. The time required for the triggering of the ESD is estimated on the ESD Closure page. See also the description of the ESD Closure on page 49.
AeAp-ITERATION The AeAp-ITERATION page shows the calculation matrix used to determine the sensitivity of the ERP Zones for the meteorological case (single wind speed and stability class) tested and Ae/Ap ratios listed in the table. The results of the exit area ratio are displayed in a graph below the table showing the variation of ERP zones with change in Ae/Ap ratio. See also the description of the Ae/Ap calculation process on page 50.
Gas Well Page
SOUR GAS WELL The ERCBH2S calculation page sections were described in the SOUR GAS PIPELINE section of this chapter. The SOUR GAS WELL page uses the input data to calculate the physical characteristics of the release. Refer to Gas Well Calculation Process in Chapter 4 for a general overview of the calculations on this page. The approach and assumptions involved in the estimates are described in Volume 1 - Technical Reference Document.
6 Calculation Pages 100

6 Calculation Pages 101
Liquid Pipeline/Well Page
SOUR LIQUID The ERCBH2S calculation page sections were described in the SOUR GAS PIPELINE section of this chapter. The SOUR LIQUID page uses the input data to calculate the physical characteristics of the release. Refer to the section on Liquid Pipeline and Liquid Well Calculation Process for a general overview of the calculation process. The approach and assumptions involved in the estimates are described in Volume 1 - Technical Reference Document.

Output Pages 102
7. Output Pages
Output pages have a pink sheet tab. Several other output pages are provided and provide a varying level of sophistication for the technical user. These pages are briefly described below:
Page Name Purpose Description
ERP SUMMARY Output Summary of Inputs and Emergency Response and Planning Zones. This page to be included for each well and pipeline segment in the Emergency Response Plan.
HAZARDS Tabular Summary
Summary of Release Description, User Selected Case Hazard Distances, Maximum of Screening Hazard Cases ERP Zones.
GRAPH-MET Graphic Summary
Tabular and graphical representation of the METMATRIX data. Hazard distances for the range of meteorological conditions and wind speeds. Presented in tabular and graphical format. The maximum computed distance is highlighted.
GRAPH-ERCBSLAB(x) Graphic Summary
Graph showing how variables change as the release moves away from the source.
GRAPH-STEADY(x) WELL and LIQUID
Graphic Summary
Graphical representation of the TOX OUTPUT and MAX OUTPUT concentrations. The Planning and Alert Criteria are highlighted on the graph
GRAPH-TRANSIENT(x) PIPELINE ONLY
Graphic Summary
Graphical representation of the TOX OUTPUT and MAX OUTPUT concentrations. The Planning and Alert Criteria are highlighted on the graph
ERP SUMMARY The ERCBH2S program results are summarized on a single output page called ERP SUMMARY that displays an executive summary of the information displayed on the INPUTS and HAZARD DISTANCES pages. It lists administrative data, the calculated ERP zones for the pipeline, well or liquid release, and a graphic that represents the relative relationship between calculated distances.
The red flags may continue to appear if the User has specified a Gas Pipeline Release Hole Size Fraction on the INPUTS page. Delete the entry and run Calculate EPZ to remove the red flags.
7

The Advanced User Selected Case on the INPUTS page can include the wind speed and stability class but not the Pipeline Release Hole Fraction. Delete the wind speed and stability class and run Calculate EPZ to remove the red flags.
The Administrative and Facility Inputs table displays information that was entered on the INPUTS page. Next the Gas Pipeline Details, Gas Well Details or Liquid Pipeline/Well Details information that was entered on the INPUTS page is echoed. A sample is provided below:
7 Output Pages 103

The Results table (see below) displays the calculated Land Use Setback H2S release rate or volume (if applicable), the Level Designation (if applicable) and the compressibility factor used based on user input licenced conditions. The Existing EPZ (user entry on the INPUTS page – Administrative) and the Normograph EPZ calculation (based on the H2S release rate or volume) are also provided.
The predictions from the Worst-Release with Averaged-Dispersion Distances on the HAZARD DISTANCES page are displayed graphically on the ERP SUMMARY page (see example below).
The graphic displays four predicted distances and represents several concepts:
• IIZ (Initial Isolation Zone) is colour coded in pink. Within this circle, sheltering-in place may not be a viable public protection measure; all persons within this zone should be evacuated immediately. Therefore sheltering-in place within this zone can only be considered a temporary response measure. It is based upon the indoor toxic load criteria.
7 Output Pages 104

• EPZ (Emergency Planning Zone) is a colour coded in orange. It is the distance requiring specific emergency response planning, preparedness and response and is based upon the outdoor toxic load criteria. The ERCBH2S EPZ must include all people within this radius. The final EPZ submitted to the ERCB will reflect other considerations such as egress and local population densities.
• PAZ (Protective Action Zone) is a pie-wedge area within the EPZ with a red dash border. It indicates an area downwind of a hazardous release where outdoor pollutant concentrations may result in life-threatening or serious and possibly irreversible health effects on the public. The PAZ endpoint is defined as a 130 ppm concentration of H2S over a 60-minute exposure time. The PAZ endpoint is protective of unconsciousness. The PAZ is an emergency response distance and therefore is dependent upon the meteorology (wind blowing to) at the time of the incident and must be assessed frequently for change of direction.
The width of the sectors in the graphic is for presentation purposes only. The width of the sector during emergency response must be determined by responders based on field measurements.
The ERP Zones are the Worst-Release with Averaged-Dispersion Distances from the HAZARD DISTANCES page. For reference, the faction of time that of each of the dispersion conditions occurs is displayed in the Average Probability of PG Stability Class and Wind Speed in Alberta table on the HAZARD DISTANCES page.
Each Emergency Planning and Response zone submitted as part of an ERP must reflect site-specific features such as population density, topography, access/egress routes and any other identifiable factors that may affect timely implementation of emergency response procedures. Thus each zone distance calculated by ERCBH2S may require further consideration for planning or during response. The implied shape of the combined planning zones represented by the ERCBH2S outputs, therefore, is a schematic simplification for display purposes.
Erasing Calculation Results Calculation results (outputs) on the ERP SUMMARY page can be erased by selecting “Erase all output fields’ from the technical sun-menu as shown below or
7 Output Pages 105

by selecting the ‘Erase all output fields’ button from the button bar. This command also erases outputs from other ERCBH2S ‘Summary/Graphics’ pages, but does not erase outputs stored on the BATCH page.
HAZARDS The Hazards page displays output for a single selected meteorological condition results and the EPZ screening meteorological results that supports the calculated distances for the Planning zones.
The Release Description displays some of the input information and calculated properties of the defined case. The release type indicates whether the release was modelled as transient blow-down (pipeline) or a constant rate release (well).
User Selected Case The third table, titled Selected Meteorology Case, displays the hazard zone distances for both planning and alert limits for the single stability and single wind speed case. An example is shown below.
7 Output Pages 106

ERCBH2S-Well & Liquid The Ae/Ap ratio columns are not relevant for the ERCBH2S-Well or Liquid flavours.
The Hazard distances are not rounded, but show distances to a resolution of 1 m. The ERP planner should use these distances in conjunction with other planning information (egress routes, population density, etc...) and finalize the ERP zones to a logical site-specific distance.
Although the ERCBH2S models may predict Hazard distances greater than 30000 m (30km) the maximum suggested EPZ, IIZ, or PAZ is 30000 m (30km). This is the largest distance to where the model predictions can be applied.
This table displays results for a single selected meteorological case (in the example shown above: stability Class F and wind speed 2 m/s). The predictions show in the example are for the Wind Speed and Stability Class specified in the User Selected Case input group on the INPUTS page. The wind speed and stability class columns in the Primary Zone section have identical values for each row based upon the selected meteorology entered and are therefore disabled (greyed) to avoid confusion.
The Secondary Hazard columns will display data for a situation that can sometimes occur if the release is initially near the ground and then rises further down wind (see example below). When a secondary hazard is predicted the table will populate the Secondary Hazard zone columns and colour code the prediction (warning-orange). Otherwise, these columns will be blank as shown above. For more information on the calculation of secondary zones, see Volume 1: Technical Reference Document. In the example below, EPZ is shown to have a Secondary Hazard zone with distance prediction having both a primary distance (1547 m) and a secondary distance (1560 m).
7 Output Pages 107

The classification of Near Field and Far Field densities, displayed in the Source Conditions table are determined by the density of the release relative to the air density.
• Near field characteristics are defined by the exit conditions of the release. The plume trajectory is dominated by the initial conditions.
• Far field is defined when an infinite amount of air is added to the release. At this point, the plume has reached the final rise.
There is a transition from near-field to far-field for each release, which depends on the release properties.
Classification Gas Density
is greater than Air Density
Gas Density is less than Air Density
Near Field (density at exit)
Initially dense Initially buoyant
Far Field (equivalent density)
Dense Buoyant
Maximum of Screening Hazard Cases The data in this table is only updated when the Calculate EPZ command has been run. The Calculate EPZ command searches through all the meteorological cases and selects the largest predicted hazard distance. As a result, each row of the Maximum of Screening Hazard Cases table may have different values in the Wind Speed or Stability Class columns. If there is a Secondary Hazard detected, these values will be displayed in the Secondary Hazard columns.
7 Output Pages 108

GRAPH-MET Once the Calculate EPZ command has been run, the Maximum of the Screening Hazard Cases section of the HAZARDS page will be updated. The GRAPH-MET page contains a graphic representation of the METMATRIX page. The user may select the desired data to display using the drop down list. The table and the graph are then populated with corresponding data from the METMATRIX page. An example of the table and graph are shown below.
Many of the matrix cells are greyed (disabled). Within the Pasquill-Gifford (PG) meteorological classification, these combinations of wind speed and atmospheric stability have been demonstrated to not occur. Additionally, within Alberta, Class A stability with winds above 1 m/s does not occur; and therefore have been removed from the ERP screening matrix for selection of the maximum hazard distances.
Also, many studies have shown that for ground-based releases, the regulatory dispersion parameters do not account for plume meandering during low wind speed stable dispersion conditions resulting in unreasonably high predictions. Therefore the predictions for Class E at 1 m/s and Class F below 1.5 m/s, have been removed from the ERP screening matrix for selection of the maximum hazard distances.
The graph shows the sensitivity of the hazard distances to the meteorological conditions as a family of curves grouped by atmospheric stability class. Although this example shows relatively well behaved (i.e., explained curves) the family of curves can often show complex relationships; in which case, careful consideration of plume buoyancy, plume rise and dispersion must be included in the interpretation.
The screening matrix calculation must be performed and included as part of your submission to the ERCB.
7 Output Pages 109

Wind speeds above 1 m/s for Class A do not occur at meteorological stations within Alberta, thus these meteorological conditions are removed from ERP zone calculation.
The effect of meandering is underestimated in the turbulence parameterization for 1 m/s Class E and F and 1.5 m/s Class F, thus these meteorological conditions are removed from ERP zone calculation.
7 Output Pages 110

7 Output Pages 111
EPZ1: Outdoor Planning (m)Wind Speed (m/s) Class A Class B Class C Class D Class E Class F
1 1422 2225 3370 1005 808 541.5 619 1161 3146 1720 2454 21552 527 818 2812 3951 3008 4132
2.5 464 725 1231 3683 5048 71293 423 655 1115 1593 4776 7275
3.5 605 1016 1478 2960 72534 554 952 1368 1952 7268
4.5 526 887 1269 18505 499 832 1208 17478 649 93310 572 81915 65720 557
Maximum Distance=7275m
meandering of ground based release underestimatedwindspeed that is unlikely for the given stability class
Calculations for Scenario: EXAMPLE|1-2-3-4 W5M|Hazard Distances for Meteorological MatrixOutdoor Toxic Load Equivalent H2S Concentration
(100 ppm for 60 minutes with n= 3.50)
0
1000
2000
3000
4000
5000
6000
7000
8000
0 5 10 15 20
Dis
tanc
e to
Haz
ard
Leve
l (m
)
Wind Speed (m/s)
Class A Class B Class C Class D Class E Class F
EPZ1: Outdoor Planning (m)
Maximum Distance=7275m

GRAPH-ERCBSLAB (x) The GRAPH-ERCBSLAB (x) page presents a graphical display of some of the technical values calculated by ERCBSLAB. The graph shows the change in various parameters as the release moves away from the source (instantaneously spatially averaged cloud parameters). The values for this graph are taken from the ERCBSLAB Output page. An example is shown below.
The graph displays the information summarized in the following table.
Symbol Parameter Units
zc Profile centre height: the height above ground of the centre of the vertical concentration profile.
m
h Box height: vertical dimension of the simplified concentration profile.
m
bb Box half width: the half-width of the across-wind dimension of
m
7 Output Pages 112
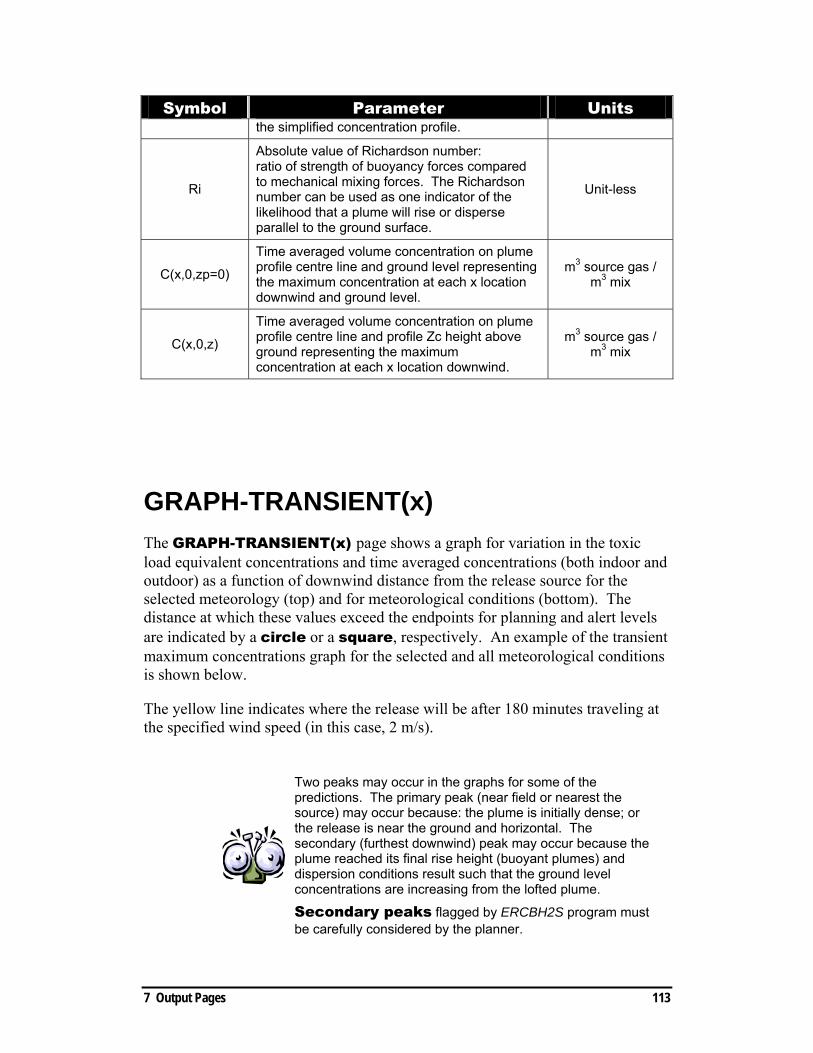
Output Pages 113
Symbol Parameter Units the simplified concentration profile.
Ri
Absolute value of Richardson number: ratio of strength of buoyancy forces compared to mechanical mixing forces. The Richardson number can be used as one indicator of the likelihood that a plume will rise or disperse parallel to the ground surface.
Unit-less
C(x,0,zp=0)
Time averaged volume concentration on plume profile centre line and ground level representing the maximum concentration at each x location downwind and ground level.
m3 source gas / m3 mix
C(x,0,z)
Time averaged volume concentration on plume profile centre line and profile Zc height above ground representing the maximum concentration at each x location downwind.
m3 source gas / m3 mix
GRAPH-TRANSIENT(x) The GRAPH-TRANSIENT(x) page shows a graph for variation in the toxic load equivalent concentrations and time averaged concentrations (both indoor and outdoor) as a function of downwind distance from the release source for the selected meteorology (top) and for meteorological conditions (bottom). The distance at which these values exceed the endpoints for planning and alert levels are indicated by a circle or a square, respectively. An example of the transient maximum concentrations graph for the selected and all meteorological conditions is shown below.
The yellow line indicates where the release will be after 180 minutes traveling at the specified wind speed (in this case, 2 m/s).
Two peaks may occur in the graphs for some of the predictions. The primary peak (near field or nearest the source) may occur because: the plume is initially dense; or the release is near the ground and horizontal. The secondary (furthest downwind) peak may occur because the plume reached its final rise height (buoyant plumes) and dispersion conditions result such that the ground level concentrations are increasing from the lofted plume.
Secondary peaks flagged by ERCBH2S program must be carefully considered by the planner.
7

7 Output Pages 114

GRAPH-STEADY(x) The GRAPH-STEADY(x) shows the variation in the toxic load equivalent concentrations and time averaged concentrations (both indoor and outdoor) as a function of downwind from the release source for the selected meteorology (top) and for meteorological conditions (bottom). The distance at which they exceed the endpoints for planning and response are indicated by a circle or a square, respectively. An example of a GRAPH-STEADY(x) result for selected and all meteorological conditions is shown below.
The yellow line indicates where the release will be after 180 minutes traveling at the specified wind speed (in this case, 2 m/s).
An example of the hazard distances for all meteorological conditions is shown. The figure was generated from the same conditions as the selected meteorology. The meteorological conditions that lead to the maximum concentration at a distance are not related to the meteorological conditions that lead to the maximum concentration at an adjacent location. Therefore, the predictions are not necessarily smoothly continuous.
Two peaks may occur in the graphs for some of the predictions. The primary peak (near field or nearest the source) may occur because: the plume is initially dense; or the release is near the ground and horizontal. The secondary (furthest downwind) peak may occur because the plume reached its final rise height (buoyant plumes) and dispersion conditions result such that the ground level concentrations are increasing from the lofted plume.
Secondary peaks flagged by ERCBH2S program must be carefully considered by the planner.
7 Output Pages 115

116
7 Output Pages

8. Batch Page
Introduction ERCBH2S has a batch processing feature to accommodate calculation of the ERP zones in sequence for several facilities without user intervention. It functions like a database wherein each row of data is an input/output record (row in spreadsheet) and each column is an input/output field (variable on inputs page).
The batch processing database (input/output list) is found on the BATCH page. Variables on the BATCH page are arranged (horizontally) – in a similar order to those found on the INPUT page (arranged vertically – column C).
A new input group (Batch Control) appears at the front of the input fields to control BATCH operations. Two other new groups appear at the end of the input fields - one for calculating ERP zones for gas and liquid gathering systems (see ‘Performing a Gas Pipeline Network Analysis – Tutorial’ on page 141), and the other to record ERCBH2S calculation outputs. BATCH processing groups are listed below.
GROUP DESCRIPTION
Batch Control Integer variables to control the operation of the batch process
Administrative Information about the applicant and the location under study
Calculation Controls Selection of the Flavour for the template, analysis type and scenario name.
Pipeline Details If the Flavour is GAS PIPELINE, physical characteristics of the gas pipeline are specified.
Well Details If the Flavour is GAS WELL, physical characteristics of the gas well are specified.
Liquid Details If the Flavour is LIQUID PIPELINE/WELL, physical characteristics of the oil/produced water pipeline/well are specified.
Sour Gas Composition The chemical composition of the gas released is specified.
Advanced User Selected Case
This section allows advanced users to control calculations for selected meteorological conditions
8 Batch Page 117

and pipeline release hole fraction rather than the complete screening matrix.
Gas Gathering System Pipeline Networking
Input variables and calculations for pipeline networks (see Chapter 9 - Pipeline Gathering Systems)
Liquid Gathering System Pipeline Networking
Input variables and calculations for pipeline networks (see Chapter 9 - Pipeline Gathering Systems)
Output Calculation predictions of the ERP zones from the HAZARD DISTANCES page are recorded.
Working with the BATCH Page – Summary Overview
Data Entry Data Entry (and data removal) is discussed in more detail further on.
Data may be entered directly into the BATCH page, or data may be entered on the INPUT page and saved to the BATCH page using the SAVE TO BATCH
command on the ERCBH2S menu or button-bar, . Similarly, the user can select a row on the BATCH page and copy the input fields to the INPUT page
using the READ command, . The user can also scroll through BATCH
records FROM the INPUTS page by using the FIRST , PREVIOUS ,
NEXT or LAST commands.
The user may enter numeric values, text or functions for any of the input fields. This allows the ERCBH2S program to be linked to user specific databases or calculation spreadsheets. Deleting or moving columns (fields) and re-formatting is not permitted.
The BATCH page may contain any mixture of Sour Operations Types (Gas Pipeline, Gas Well or Liquid Pipeline/Well), or pipeline gathering system records.
Calculating Emergency Response and Planning Zones
Similar to pressing the CALCULATE EPZ command, , the batch equivalent
is the Batch Calculate EPZ, . Batch Calculate EPZ steps through
8 Batch Page 118

the entire batch page database of input records, loads each record to the INPUTS page, executes the CALCULATE EPZ command, and then copies the calculation results (along with any error codes) back to the ‘Output’ section of the BATCH record/row.
Because the calculations can be time consuming, the user is prompted “Are you sure you want to run this ...” before starting the assessment. The user may turn off this prompt by toggling the SILENT START option from the menu-bar ERCBH2S→Setup→Silent Start. A progress meter displays the progress of the BATCH operation calculations. Pressing the CANCEL button on the dialog or the ESC keyboard button will terminate the batch analysis.
Batch Page / Inputs Page Relationship
General Before using the batch processing feature, it is vital that the user understand the relationship between the INPUTS page and the BATCH page.
The INPUTS page is never erased. It always displays whatever data was LAST entered to it.
If the last ERCBH2S action was Calculate EPZ, the INPUTS page displays the inputs that coordinate with calculation results displayed on the ERP SUMMARY page.
If the last ERCBH2S action was BATCH Calculate EPZ, the INPUTS page displays the last BATCH record ‘run’ by ERCBH2S.
If the last action involved user entries directly to the INPUTS page, then that page is displayed.
If the last action was transferring a BATCH record to the INPUTS page, then that BATCH record is displayed.
Input Data Connection Between the Pages For user inputs, data entry is not linked between the INPUTS page and the BATCH page. While data can be moved from one page to the other, changes to one page do not affect the other page, even if the scenario names match.
8 Batch Page 119
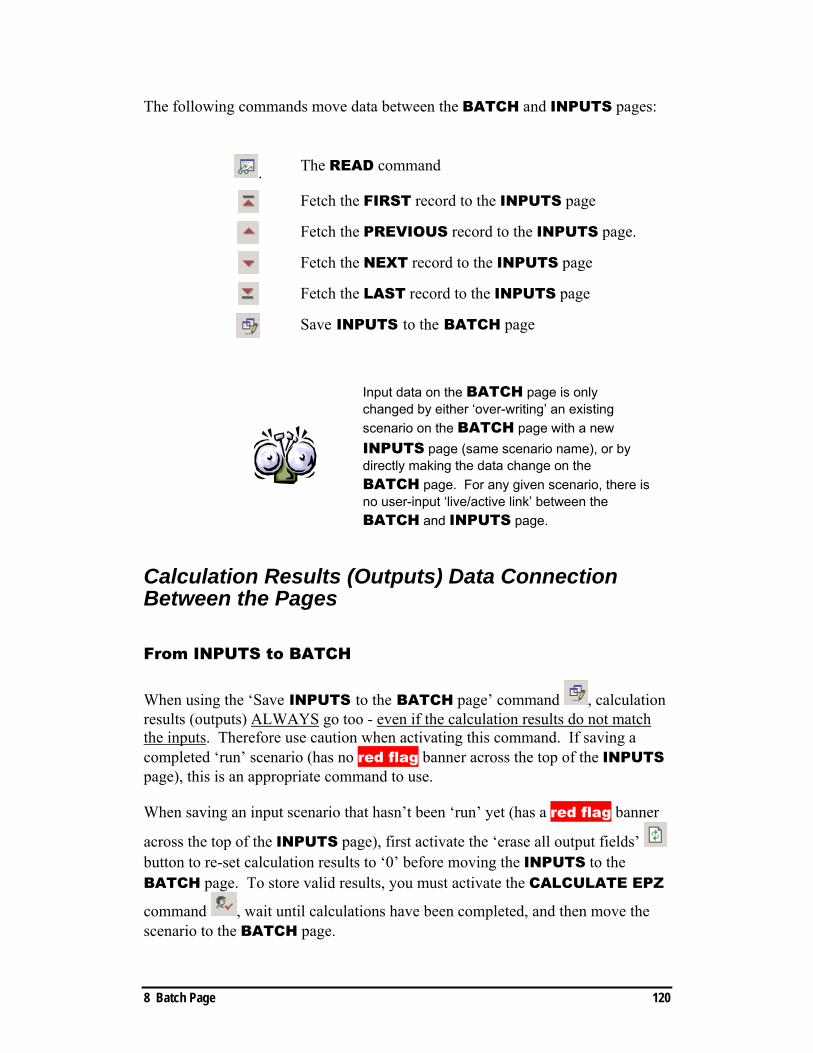
The following commands move data between the BATCH and INPUTS pages:
. The READ command
Fetch the FIRST record to the INPUTS page
Fetch the PREVIOUS record to the INPUTS page.
Fetch the NEXT record to the INPUTS page
Fetch the LAST record to the INPUTS page
Save INPUTS to the BATCH page
Input data on the BATCH page is only changed by either ‘over-writing’ an existing scenario on the BATCH page with a new INPUTS page (same scenario name), or by directly making the data change on the BATCH page. For any given scenario, there is no user-input ‘live/active link’ between the BATCH and INPUTS page.
Calculation Results (Outputs) Data Connection Between the Pages
From INPUTS to BATCH
When using the ‘Save INPUTS to the BATCH page’ command , calculation results (outputs) ALWAYS go too - even if the calculation results do not match the inputs. Therefore use caution when activating this command. If saving a completed ‘run’ scenario (has no red flag banner across the top of the INPUTS page), this is an appropriate command to use.
When saving an input scenario that hasn’t been ‘run’ yet (has a red flag banner
across the top of the INPUTS page), first activate the ‘erase all output fields’ button to re-set calculation results to ‘0’ before moving the INPUTS to the BATCH page. To store valid results, you must activate the CALCULATE EPZ
command , wait until calculations have been completed, and then move the scenario to the BATCH page.
8 Batch Page 120

The ‘Erase all output fields’ button does not erase calculation results stored on the BATCH page – it erases them from the other ERCBH2S pages.
When the ‘erase all output fields’ command is activated, a red flag banner appears at the top of the INPUTS page, cautioning the user that calculation results do not match user inputs. This is because calculation results now show ‘0’ distances.
When using the ‘Save INPUTS to the BATCH page’ button ,a prompt will appear if the scenario name on the INPUTS page matches a scenario name already recorded on the BATCH page.
STOP AND THINK – do you want to completely overwrite this particular record on the BATCH page with this new data ‘set’ (Input AND Calculation Results)? Remember that if there is output data stored on the BATCH page for this particular scenario, it will be over-written with whatever calculation results (outputs) are currently displayed on the other Excel pages.
From BATCH to INPUTS
The following commands will move a record (row) from the BATCH page to the INPUTS page:
The READ command (done from the BATCH page).
Fetch the FIRST record to the INPUTS page (done from the INPUTS page).
8 Batch Page 121

8 Batch Page 122
Fetch the PREVIOUS record to the INPUTS page (done from the INPUTS page).
Fetch the NEXT record to the INPUTS page (done from the INPUTS page).
Fetch the LAST record to the INPUTS page (done from the INPUTS page).
When a record or row is brought from the BATCH page to the INPUTS page, only the inputs are copied – not the calculation results (outputs). The only way to change calculation results shown at the bottom of the ERP SUMMARY page is to activate a program ‘run’ command such as CALCULATE EPZ or BATCH CALCULATE EPZ.
When copying an INPUTS page to a BApage, ALL calculation results (OUTPUTappended/copied to the BATCH row/recordthe particular scenario identified.
TCH S) are
for
owever, when copying/reading/fetching a ,
HBATCH record/row to the INPUTS pageonly the BATCH input records are copied ovAny associated calculation results for the BATCH row/record
er.
are not brought along.
UT page as
er.
or
res
Entering Data to the Batch Page The ‘safest’ way to enter data to the BATCH page is to use the INPthe user interface. Enter data to the input fields the same way as for a standard analysis. Particular attention should be directed towards the SCENARIO NAME, since the batch processing uses this field as the unique row identifiThat is, each record in the batch processing database must have a different (unique) SCENARIO NAME. By using the INPUTS page to enter data feach scenario – standard error checking, orange warnings, orange resets and general comments appear to help the user correct invalid entries. These featudo not appear on the BATCH page.

Red flag warning banners, orange warnings and orange resets related to user inputs do not appear on the BATCH page.
Once the INPUTS page entries have been completed, the data may be saved to
the BATCH page using the SAVE TO BATCH command . The SAVE TO BATCH button is only visible when the INPUT page is active, preventing accidental saves.
If the INPUTS page data is saved to the BATCH page and the SCENARIO NAME already exists, the user is prompted to accept the save operation or to cancel.
• If the user cancels the operation, then the SCENARIO NAME should be changed to a unique name and the operation attempted again.
• If the user accepts the save operation, then the record on the BATCH page with the same SCENARIO NAME is COMPLELETY overwritten with new data from the INPUTS page – along with all calculation results (outputs) that appear on the other Excel pages. Therefore any existing calculation results on the BATCH page (with the same SCENARIO NAME) are erased and replaced.
Copying, Deleting, and Editing Rows of Data on the BATCH Page Once data has been saved to the BATCH page, the user may make changes to the data by editing the variables directly on the BATCH page. This is particularly useful for sensitivity or uncertainty testing of input variables.
8 Batch Page 123

To perform a sensitivity test, records (rows) on the BATCH page can be duplicated several times (use the Excel copy and paste functions) and the test variable can be changed for each copy to perform the test. Remember to change the SCENARIO NAME for each duplicate copy. If the scenario is for a pipeline AND the ‘Pipeline Gathering System’ portion of the BATCH page has been used (see Pipeline Gathering Systems in Chapter 9), do not copy the row/scenario any further than column CN.
Be extra careful when copying or duplicating rows. For instance, the Excel auto-fill button and mouse drag can create errors in the input file by auto-incrementing numeric fields
Use caution when copying rows on the BATCH page – you may end up copying calculation results you don’t want, and/or gathering system details (segments and nodes).
If you chose to copy the OUTPUT results from the original scenario and apply them to the new scenarios (unless the output results are zeros), the safest option is to simply delete the results for the new rows/scenarios (OUTPUTS group on the BATCH page - beginning at column DO). Otherwise, future input changes to the new rows will appear to coordinate with ‘old’ calculation results. Eventually the new inputs will be used for new calculations, but until then - it is better not to list ‘false’ results.
Deleting Rows of Data
To delete a row of data on the BATCH page, left ‘click’ on the row number you wish to remove, then ‘right click’ and select ‘clear contents’. To move other rows of data ‘up’ to fill in empty spaces on the BATCH page (not required), use the Excel cut and paste functions.
Empty data rows in between rows of data on the BATCH page are acceptable, but the user must remember to label these rows with a “0” in column A. Otherwise, when the BATCH CALCULATE EPZ process identifies rows on the BATCH page that require processing, it will stop when it comes to a blank in this column, and assume there is no further data on the BATCH page. Blank data rows (other than at the end of a spreadsheet) must not be left in when creating an ERCBH2S export file. Other rows of data must be moved up to fill in blank rows (use the Excel cut and paste features).
8 Batch Page 124

Checking for Red Flag and Other Warnings Red flags, orange warnings, orange resets and other comments are visible on the INPUTS page and are not shown on the BATCH page. Further, orange flags for entries that have been reset by ERCBH2S (column E on the INPUTS page) cannot be seen on the BATCH page. To view these important warnings, a BATCH row/scenario must be brought to the INPUTS page.
red flag warning banners, orange warnings and orange resets related to user inputs do not appear on the BATCH page.
When ERCBH2S assigns a different value to a user entry (an ‘orange reset’), the ‘reset’ value does not appear on the BATCH page. The only way to see an orange reset for a BATCH page scenario/record is to view the record on the INPUTS page.
Unless a user is well experienced with ERCBH2S inputs, it is recommended to use these user input error checking features on the INPUTS page by viewing each
BATCH record before activating (Batch Calculate EPZ). This helps avoid most calculation error messages.
Red flags, orange warnings and orange resets are described in more detail in Chapter 5 under Red Flags and other Warnings.
To view a BATCH scenario on the INPUTS page
• From the BATCH page, input fields on the BATCH page can be copied
to the INPUT page using the READ command, . The READ command is only visible while the BATCH page is the active page, to prevent copying data unknown records from the BATCH page. The active row on the BATCH page is copied with the READ command. The active row is the row with the cursor, the highlighted row or the row selected with the mouse.
• From the INPUTS page, the user can scroll through BATCH records
using the FIRST , PREVIOUS , NEXT or LAST
commands. These commands use the SCENARIO NAME for each record and look for the record before or the record after the scenario name listed on the INPUTS page.
8 Batch Page 125

Batch operations work on all fields on the BATCH page. This means that if some of the records are not visible because of the AutoFilter settings, the records will still be evaluated in the batch operation depending on the Batch Control setting for each record.
Batch Control Group
Run or Not Run The RUN or NOT RUN field is used to include or exclude the record (row) from the Batch Operation. The setting is either “0” (do not include this record in the Batch operation) or “1” (include this record in the Batch operation).
If there are any blank rows in between rows of data on the BATCH page, they must be labelled with a “0” in this column. Otherwise, when the BATCH CALCULATE EPZ process identifies rows on the BATCH page that require processing, it will stop when it comes to a blank in this column, and assume there is no further data on the BATCH page.
Print/Save The Print/Save field is used to perform operations between Batch Calculation Operations. It tells ERCBH2S what to do while a BATCH Calculate EPZ (or other BATCH run function) is operating. The command entered will perform at the end of each row/scenario execution.
The field entry is cumulative and is described in the table below.
1 Print ERP Summary Pages to the default printer after each
Batch Operation
2 Save the entire spreadsheet after the Batch Operation
3 (=1+2) By summing the values, a combination of the commands is performed, e.g., a field entry of 3 performs both print and a save after the record has been evaluated.
The file save operation is useful for large assessments with many rows in the database. Making use of frequent file saves ensures that the results of the
8 Batch Page 126

computations are backed up in the unfortunate event of a computer malfunction during subsequent computations. It is not necessary to save the results after the analysis for each record (it slows down the process), but perhaps after every tenth analysis. If one of the records is marked to be saved for a batch operation, then during the initialization phase of the batch command, a save operation is immediately performed. This ensures the save operations perform effectively before the user leaves during the batch process.
When performing batch operations, save your work before you start the time consuming runs, and include the save command (2, in Column B) occasionally.
Batch Operations
Check for Scenario Duplicates Duplicate scenario names can lead to confusion when interpreting the results. Before performing any batch program ‘run’ command, it is recommended that you first use the ‘Check for Scenario Duplicates’ menu item as shown below.
8 Batch Page 127

If scenarios were saved to the BATCH page from the INPUTS page, a scenario duplication check was already preformed. If scenarios were created directly on the BATCH page (especially when using Excel’s copy and paste functions), then no scenario duplication check will have been performed by the program.
Batch Run ERCBSLAB
The Batch Run ERCBSLAB command, , runs the ERCBSLAB calculation for each record in the batch processing list. The ERCBSLAB program is run for the single meteorological wind speed and atmospheric stability class entered in the User Selected Case input fields or the ERCB default values. Calculation results using this feature are not acceptable for ERCB submission.
Because the single meteorological case calculation is considerably faster than the screening matrix calculations, this command is useful for sensitivity testing of input variables or for testing inputs for large databases. For testing purposes, once the Batch Run ERCBSLAB command has been completed, the error messages can be reviewed to check for issues with inputs to the model.
Batch Calculate EPZ
The Batch Calculate EPZ command, , executes the complete set of 54-meteorological cases in the screening matrix calculation for each record in the database. For pipelines, the screening matrix calculation also includes 11-Ae/Ap exit hole assessments and ESD timing calculations. The ignited release calculations are also performed.
The Batch Calculate EPZ command calculations are extensive and may take some time to complete, especially for large databases. It is recommended that assessments for large databases be assessed in smaller sets (such as several hundreds of records) and or in combination with the use of the PRINT/SAVE settings. It is not necessary to divide the assessment into different spreadsheets.
To assist the user in avoiding excuses, save your work!
8 Batch Page 128

Batch Output Group
Errors
Error message dialogs are suppressed during batch operations, and instead, errors are recorded in the ERROR output column on the BATCH page (column DO). The error output column is illustrated below.
Errors codes below 1000 are listed as a cumulative index as described in the ERROR CODES page of ERCBH2S and summarized in the following table. Therefore, an error index of 7 means that ERCBFLASH (code=1), ERCBSLAB (code=2) and MetMatrix (code=4) were not executed successfully. Error codes starting at 5000 are for ERCBSLAB. Error codes starting at 9000 are for ERCBFLASH.
8 Batch Page 129

ERROR CODE DESCRIPTION
1 ERCBFlash failed to complete successfully 2 ERCBSLAB failed to complete successfully 4 MetMatrix failed to complete successfully 16 AeAp Iteration failed to complete successfully
32 Calculation process was cancelled by user or system interruption
64 ERCBH2S was run in a nonregulatory mode
1000+ Other Fatal Error; see ERROR CODES PAGE in ERCBH2S
Output Data Fields The output data fields are the same as the HAZARD DISTANCES page. Refer to Chapter 6 – Calculation Pages under ‘Erasing Calculation Results’.
Calculation results (outputs) on the ERP SUMMARY page can be erased by selecting ‘Erase all output fields’ from the technical sub-menu as shown below or
by selecting the ‘Erase all output fields’ button from the button bar. This command also erases output from other ERCBH2S ‘Summary/Graphics’ pages, but does not erase outputs stored on the BATCH page.
Saving a Batch Page as an Excel File Saving ERCBH2S scenarios as Excel files is described in Chapter 3 under Saving Scenarios as Excel Files.
8 Batch Page 130

It is strongly recommended that you save your work!
Creating a Batch Export File for ERCB Submission The input and key ERP output data stored on the BATCH page can be exported to an ERCBH2S batch export file for convenient email transfer or backup.
From the menu-bar, ERCBH2S→Technical→ Batch Export... prompts the user using common windows file dialog wind for a folder and a file name. For ERCB submission, licensees/applicants are required to use the following file naming protocol:
BA code - ERP Plan Ref# - Date (DD/MMM/YY)
For example, if a company with the BA code of WXYZ submits a file on July 5th, 2008, the file would be named:
WXYZ-1234-05Jul08.csv
The .csv file extension - ‘comma separated variable - is automatically attached to the file name. The variable names are those expected by ERCBH2S to match the INPUTS page - the order of the variables in the file is not important.
The export file can be viewed using Excel or Notepad or other text editor.
An ERCBH2S batch export file can be reloaded to a BATCH page using the batch-import function ERCBH2S→Technical→Batch Import... from the menu bar.
8 Batch Page 131

8 Batch Page 132
The .csv file does not contain user information added to the NOTES page.
BATCH page submissions to the ERCB must not have any error codes in column DO!
Batch Page Tutorial Part of the Gas Well Tutorial in Chapter 10 (beginning at step 11) describes how to work with the BATCH page.

9 Pipeline Gathering Systems 133
9. Pipeline Gathering Systems
Overview The ERCBH2S Gas1 Gathering System analysis feature calculates the Equivalent Segment Length for sour gas, acid gas and oil effluent pipelines with a GLR>1000. The equivalent length is used to determine both the ERP zones using gas pipeline calculations, and ERCB Sour Gas Level Designation.
The ERCBH2S Liquid2 Gathering System analysis feature calculates the Equivalent Segment Length for oil effluent pipelines with a GLR ≤ 1000. The equivalent length is used only to determine an ERCB Sour Gas Level Designation, and is not used to determine the ERP zones using liquid pipeline calculations. Currently, the only liquid pipeline substance with potential to have an ERCB Sour Gas Level Designation is oil effluent.
ERCBH2S calculates emergency response and planning zones for individual gas pipeline segments, assuming there is an Emergency Shut Dow (ESD) valve at each end. Calculations also assume that the only source of gas (or other material) available for release is contained within the described segment plus whatever additional material can be provided from each end - upstream and downstream, before the ESD valves close3.
Real pipeline gathering systems frequently do not fit this description because there are pipeline tie-ins in-between pipeline ‘from’ and ‘to’ locations – tie-ins that may not have a flow control device to prevent product flow into the modelled pipeline segment.
1 Liquid pipelines with a GLR > 1000 are modelled in the Gas Pipeline group. The User is
directed there automatically on the ERCBH2S INPUTS page when the pipeline substance is selected.
2 Liquid pipelines with a GLR ≤ 1000 are modelled in the Liquid Pipeline group. The User is directed there automatically on the ERCBH2S INPUTS page when the pipeline substance is selected.
3 Additional flow to the segment is determined by ERCBH2S (during Calculate EPZ calculations) based on expected MOP and H2S, and the ESD closure time setting specified by the user on the INPUTS page. The ESD closure setting must represent the SLOWEST valve closure setting. If there is even one no flow control node, ERCB SOURCE MITIGATION default valve settings must not be over-ridden by user inputs unless the licensee has pre-planned actions to ignite, draw-down or otherwise stop the flow of H2S to atmosphere. ERCBH2S default SOURCE MITIGATION settings provide no effective ESD valve closure.

To allow for this additional source of material, ERCBH2S inputs for gas or liquid pipelines require either:
1. Equivalent Segment Length (between ESDs),
OR
2. Equivalent Cumulative Pipeline Volume (between ESDs)
These entries account for the total mass of H2S (based on licensed levels) in a pipeline segment PLUS segments upstream and downstream, to points where flow control devices that can prevent additional flow to the modelled segment are encountered, or the pipeline start or end is encountered (e.g., well, plant, battery, etc.). When the user supplies one of these two entries, ERCBH2S calculates the other value. Therefore, only one of the entries is needed.
This approach (total mass of H2S based on licensed levels) is consistent with the previous ERCB approach of cumulative H2S release volumes for pipelines.
A gas pipeline gathering system segment has an equivalent cumulative pipeline length determined by the total mass of H2S (based on licensed levels) in the segment and in segments upstream or downstream, to points where flow control devices that can prevent additional flow to the modelled segment are encountered, or the pipeline limit is encountered (e.g., well, plant, battery, etc.). The release from a segment is modelled using the gas characteristics of the segment, not the average of adjoining segments.
The chemical and physical properties used in the ERCBH2S analysis for ERP zone determination are the specific values entered for the modelled segment. These are reasonable estimates for the screening level analysis given that the ERP zones are dependent on the high initial flow rates form the rupture.
Equivalent Segment Length (between ESDs) Equivalent Segment Length is easily calculated IF the interconnecting pipelines (followed ALL THE WAY back to points where flow control devices that can prevent additional flow to the modelled segment are encountered, or the pipeline limit is encountered, e.g., well, plant, battery, etc.), have precisely the same qualities as the pipeline being modelled (inside diameter, licensed pressure, and
9 Pipeline Gathering Systems 134

licensed H2S %). In these cases, segment lengths can just be summed to arrive at the Equivalent Length entry for ERCBH2S.
When any pertinent, interconnecting pipeline has one or more different qualities (as already described), equivalent length calculations are much more complicated. For these cases, the user may choose to either supply the alternate entry (Equivalent Cumulative Pipeline Volume), or use the ‘Gathering System Analysis Feature’ provided on the ERCBH2S BATCH page (described later in this chapter) to calculate the equivalent segment length. The Gathering System Analysis feature is essentially a calculator used to arrive at an equivalent segment length, and it must be used BEFORE ERCBH2S dispersion modelling (Calculate EPZ) is performed.
If a gathering system is described on the Gathering System Analysis portion of the ERCBH2S BATCH page, and one or more portions of the system have Equivalent Segment Lengths ‘manually’ calculated, refer to the next section in this chapter for important details.
Illustrations 1 and 2 in this chapter (to follow) further describe why pipeline H2S volumes must sometimes be cumulative.
Equivalent Cumulative Pipeline Volume (between ESDs) Similar to Equivalent Segment Length between ESDs, the Equivalent Cumulative Pipeline Volume accounts for a volume of the modelled segment PLUS additional ‘volumes’ available to the segment from upstream and downstream, to points where flow control devices that can prevent additional flow to the modelled segment are encountered, or the pipeline limit is encountered (e.g., well, plant, battery, etc.).
Performing the calculations needed for this entry is sometimes preferable to using the ‘Gathering System Analysis Feature’ provided on the ERCBH2S BATCH page (described later in this chapter).
The formula for this calculation is provided in the ERCBH2S Technical Reference Document in section 5.4. Note that if the licensed maximum operating pressure, minimum operating temperature and licensed maximum H2S concentration is the same for all segments, the calculation is the straightforward sum of segment lengths ‘times’ the pipe area.
9 Pipeline Gathering Systems 135
Equivalent Cumulative Pipeline Volume may be entered as an input to ERCBH2S instead of Equivalent Segment Length. Equivalent Cumulative Pipeline Volume calculations are performed manually by the user according to the formula described in the ERCBH2S Technical Reference document, section 5.4. This method may be preferred for gathering systems with multiple, complex interconnections that are cumbersome to describe on the BATCH page for the ERCBH2S Gathering System Analysis feature. This method must be used for any portions of a gathering system that have more than one outlet (e.g., a lateral used occasionally to divert pipeline flow).
Gathering System Analysis To use the ERCBH2S Gathering System Analysis feature, a simple schematic of the gathering system should be prepared. The schematic assists the user in creating a labelling scheme based on nodes and pipeline segments. The labels are listed in a summary table that provides the user with entries required for the ERCBH2S Gathering System Analysis feature on the BATCH page. The labels, numbering scheme and summary tables are described later in this chapter under Gas Gathering System Analysis - Tutorial.
Preliminary discussions (based on two example illustrations that follow) reference the following terms. These terms are used throughout this chapter and in other sections of the ERCBH2S User Guide.
NODE
• The start of a modelled pipeline segment or sub-segment (from location)
• The end of a modelled pipeline segment or sub-segment (to location)
• An ESD valve
• A back-flow check valve (CV)
9 Pipeline Gathering Systems 136

• A tie in with another pipeline
• A change in pipeline modelling conditions such as pressure, H2S concentration, outside diameter, wall thickness, or temperature.
PIPELINE SEGMENT
• Has ONLY one node at each end.
• Does not have nodes between the beginning and ending nodes.
A pipeline segment length is entered as the distance between nodes. If using the Gathering System Analysis portion of the BATCH page, the equivalent segment length is left blank for now.
The following two illustrations and discussions are provided only to explain why some H2S volumes must be ‘summed’ before performing ERCBH2S dispersion modelling. They are presented here only as background for subsequent discussions, and require no action by the user.
Example Illustration 1 (Single Segment)
Two pipeline segments shown in the following diagram are defined by a start node tag “1” and terminated with an end node tag “2”. The top segment starts with an open flow condition at node-1 and ends with an ESD valve at node-2. In the event of a rupture of this pipeline segment (between nodes-1 and-2), gas could flow continuously from beyond node-1 (upstream) into the segment, and could ‘back-flow’ for some time from beyond node-2 (downstream) into the segment until the ESD valve detects a pressure sufficient to close the valve and stop the flow (or until the valve is manually closed).
The second pipeline segment in the preceding diagram (the lower line) also begins with an open flow condition at node-1, but ends with a ‘back-flow check valve’ at node-2. In the event of a rupture of this pipeline segment (between nodes-1 and-2), whereas gas could flow continuously from beyond node-1 (upstream) into the segment, back-flow from beyond node-2 is prevented by the check valve. In ERCBH2S, check valves are assumed to function (perfectly and immediately) when a downstream flow reversal is detected.
9 Pipeline Gathering Systems 137

Illustration 1 - Summary Discussion
When pipeline segments are connected, a pipeline network analysis is used to estimate the amount of material that could be released. The analysis of high pressure blow-down in pipeline networks is complex, and the analysis used in ERCBH2S is a simplification using ‘ideal gas’ properties to determine the approximate combined volumes in pipeline networks. The ‘ideal gas’ model provides an estimate of the total volume available for release by assuming adjacent segments have similar compressibility. The ERP zone calculations for the release modelled in ERCBH2S for each segment uses ‘real gas’ properties.
Summary discussions continue following Illustration 2.
A gas pipeline gathering system analysis assumes that each segment has similar compressibility. If the compressibility significantly changes within the gathering system, the system should be divided into separate analyses ‘groups’.
Example Illustration 2 (Connecting Segments)
Now consider the simple joining of two pipelines as shown in the following diagram. The example shows ESD valves at nodes 1, 3 and 4. The two pipelines are joined at node 2 – where there is no flow control device. If a rupture occurred in segment N1-N2 (node 1 to node 2), material could escape through the rupture from upstream of the segment (node 1) until it closed. Because there is no flow control device at node 2, material could ‘back-flow’ from both downstream segments (N2-N3 and N4-N3). These segments would provide material to the emission scenario until the respective ESD valves closed, (nodes 3 and 4).
The ‘Equivalent Segment Length between ESDs’ used by ERCBH2S, is determined by
1. summing the material/product that could escape between flow-control devices (or the physical limits of the pipeline), and
9 Pipeline Gathering Systems 138

2. using the total/cumulative volume calculation to re-calculate individual segment lengths (node to node), based on the characteristics of the individual segments.
When the pipeline dimensions and gas compositions are the same for all segments, equivalent segment lengths can be readily determined by summing segment lengths. However, for real pipeline networks, pipeline dimensions change as well as gas compositions and pressure levels. Therefore, the mass of material escaping must be accounted for from each segment.
The ERCBH2S Gathering System Analysis feature on the BATCH page is designed for these calculations by acting as a ‘calculator’; summing H2S volumes from interconnecting segments according to the segments and nodes described to it by the user. This ‘user directed’ action is done BEFORE ERCBH2S dispersion modelling (Calculate EPZ) is performed.
If there were a pipeline failure in segment N1 – N2:
• Segment N1-N2 would have the total mass of H2S determined for segments N1-N2, N2-N3, and N4-N2. Subsequently
• the Equivalent Segment Length between ESD valves is determined using the total mass of H2S, and the pressure, diameter and gas composition for segment N1-N2 that equates to the total H2S mass.
ERP zones for pipeline segment N1-N2 must therefore based upon an ERCBH2S analysis using the characteristics of segment N1-N2, but with an Equivalent Segment Length determined by the total mass of H2S from adjoining segments.
Again, the ERCBH2S Gathering System Analysis feature on the BATCH page is designed to automatically perform these calculations, and can be utilized by properly describing the gathering system in terms of ‘segments’ and ‘nodes’ as described in the tutorial later in this chapter.
Similarly, for a failure in segment N4–N2, the total mass of H2S is the same as already determined for segment N1-N2’s calculation (previous), but the Equivalent Segment Length is determined using the pressure, diameter and gas composition for segment N4-N2 that equates to the total H2S mass that could potentially escape. ERP zones for this pipeline segment are therefore, based upon the characteristics of segment, but with an Equivalent Segment Length determined by the total mass of H2S from adjoining segments.
9 Pipeline Gathering Systems 139

Illustration 2 – Summary Discussion
The network model used in ERCBH2S uses an ideal gas assumption to determine the total mass of H2S within the segment group bounded by flow control valves or the pipeline physical limits (e.g., well, plant, battery, etc).
Conclusion
The ERCBH2S Gathering System Analysis feature (on the BATCH page) determines Equivalent Segment Lengths for each individual segment described to it, using the gas composition and described pipeline characteristics for the individual segment. In order to get reliable calculation results, users must carefully follow the directions provided in this chapter of the ERCBH2S User Guide when describing a gathering system on the ERCBH2S BATCH page.
The Gathering System Analysis feature is essentially a calculator used to arrive at an Equivalent Segment Length BEFORE ERCBH2S dispersion modelling (Calculate EPZ) is performed. ‘Node descriptions’ provided in the ‘gathering system analysis’ section of the BATCH page are not referenced in ERCBH2S dispersion modelling. They are used only to identify when pipeline H2S mass should (and should not) be summed together. This is done by logic built into the spreadsheet - activated by the user as described in the tutorial later in this chapter.
A pipeline gathering system segment has an Equivalent Segment Length determined by the total mass of H2S in the segment and in segments upstream or downstream (based on licensed levels), to points where flow control devices that can prevent additional flow to the modelled segment are encountered, or the pipeline limit is encountered (e.g., well, plant, battery, etc.). The release from a segment is modelled using the gas characteristics of the segment. Modelling (e.g., Calculate EPZ) is based on expected maximum MOP and H2S.
The amount of material available for release from a particular segment is therefore a function of the joined segments and their flow controls at the nodes. The simplified total Equivalent Segment Length is modelled in ERCBH2S. The chemical and physical properties used in the ERCBH2S analysis for the determination of the ERP zones are based on the specific values entered for the segment. These are reasonable estimates for the screening level analysis given that the ERP zones are dependent on the high initial flow rates from a failure.
9 Pipeline Gathering Systems 140

9 Pipeline Gathering Systems 141
Gas Gathering System Analysis – Tutorial
Introduction To work through this tutorial, in addition to the terms ‘Node’ and ‘Pipeline Segment’, the following terms are used:
NODE LABEL
Each Node Number has only one Node Label. Node Label and Node Position (identified by the BATCH column the Node Number is entered in – either upstream or downstream) are essential for ERCBH2S ‘total H2S-mass’ calculations, and subsequent Equivalent Segment Length calculations.
Label choices are:
ESD Emergency Shut-down Valve
CV Back-flow check valve
- -4 Open flow- no flow control
NODE NUMBER
Unique
A node number is unique. It identifies a physical place and has a specific characteristic (the Node Label). As long as a pipeline segment is physically connected to a particular Node, the Node Number can be re-referenced. It can be referenced as many times as there are pipeline segments physically connected to it.
Numbering Protocol
Because Node Numbers may become part of the Pipeline Segment Label, users may wish to keep Node Numbers brief; e.g. N1, N2, N3 and so on. However, 4 ERCBH2S ‘Equivalent Segment Length’ calculations ‘look’ for ESD or CV when determining what H2S masses to sum together. If ANYTHING else is entered, the calculations consider it an ‘open flow’. Therefore it is acceptable to label, for example, a manual valve as ‘MAN’. For ‘summing’ calculation purposes, ERCBH2S considers this an ‘open flow’ since it is labeled neither as ESD or CV. Manual valves are considered ‘open flow’ because they do not close automatically.

Node Numbering can follow any protocol chosen by the user. A suggested format is an alpha character followed by a number. Some gathering systems may already have an ESD, Back-flow Check-valve, tie-in numbering convention; e.g., ESD1, ESD2, or CV15, CV16, or TY22, TY23, and so on. As long as the number is UNIQUE - only references one exact location with one exact characteristic (the Node Label), anything can be chosen.
Sequential or Out-of-Order?
While it is recommended that Node Numbers generally increase in the direction of flow, it is not essential. If new tie-ins occur, or if additional flow controls are installed thereby creating a ‘new Node’ amongst ‘existing Nodes’, the existing Node Numbering does not have to be changed as long as the new Node is given a unique Node Number, and the BATCH gathering system descriptions of pipeline segments connected to/interrupted by the new Node are changed accordingly.
Multiple Analyses on a BATCH page
There can be multiple gathering system analyses on a BATCH page provided Node Numbers are not re-used to label different locations.
Ambiguous Nodes
Re-using a Node Number for a ‘new’ physical location, or assigning ambiguous Node Labels to a Node Number on the same BATCH page can cause circular references and/or calculation errors. Subsequent equivalent segment length calculations will either fail or the results may be unreliable.
Other Licensee Tie-ins
If material can be contributed to the user’s pipeline from another licensee’s pipeline (e.g. not connected at a flow control device that prevents flow into the user’s pipeline), additional material must be accounted for when determining Equivalent Segment Length or Equivalent Cumulative Pipeline Volume. For pipelines such as these, the user must
1. Perform a manual calculation for any of the user’s pipelines to which it is applicable (see Formulae for Pipeline Networks), or
2. Use the Gathering System Analysis portion of an ERCBH2S BATCH page to arrive at the Equivalent Segment Length, and then manually enter this number for any of the user’s pipelines to which it is applicable. When doing this, use a separate BATCH page as you will need to include details of the other licensee’s pipeline(s). This page does not need to be submitted to the ERCB, you are only using it to arrive at the Equivalent Segment Length for your pipeline(s). See ‘Tutorial Variation 2’ later in this chapter.
9 Pipeline Gathering Systems 142

To do this, the other licensee must be contacted regarding the location and type of flow control devices and other licensing details (to enable calculations). Both licensees must consider this material contribution to their respective gathering systems.
NODE POSITION
A Node is either at the upstream end of a pipeline segment or sub-segment (segment from location), or the downstream end (segment to location). This is described to ERCBH2S by whatever BATCH column the Node Number is entered to.
PIPELINE SEGMENT LABEL (SCENARIO NAME)
Pipeline Segment Labels allows users to identify gathering system segments as modelled Node by Node on the ERCBH2S BATCH page.
For each segment, this label is entered as the Scenario Name (Administrative details group on the INPUTS page, or column ‘L’ on the BATCH page). Each label must be unique and should identify the segment according to the described from location Node Number and to location Node Numbers; e.g., N1 – N2, or N35 – N27, or ESD1 – CV 14, and so on. If the subject segment is ‘lease piping’, modelled so that the gathering system continues to be ‘connected’ for purposes of summing volumes, then the user should use slightly different scenario names. Names such as ‘Lease Piping N3 – N4’ highlight that the modelled segment does not have a pipeline line number or is not licensed by the ERCB. In these cases, ‘Lease Piping’ would also be entered for the pipeline line number. Even if the pipeline is not licensed by the ERCB, it should be assigned the same pipeline licence number as the connecting gathering system.
Tutorial The same three-segment pipeline group shown in Example Illustration 2 is used here to build an example gas gathering system analysis. The file ERCBH2S-eg-Net1.xls contains these example calculations. This example is for pipelines modelled as ‘Gas Pipelines’. There is a similar area on the BATCH page for ‘Liquid Gathering Systems’ (columns DB – DN).
Before using the Gathering System Analysis calculation feature, users must first fill out the pipeline details portion of the BATCH page, with the exception of ‘Equivalent Segment Length between ESDs’. For the following example, these details have are filled out for you.
9 Pipeline Gathering Systems 143

1. Step 1 – Table Preparation
Flow Schematic and Tables: Describing a gathering system in terms of Nodes and Pipeline Segments is easier with a schematic of the system to be analyzed, clearly showing all of the ‘Node’ locations.
Using the schematic, carefully prepare a table listing each Node by Node Number and Node Label. The Node Numbers should be added to the schematic as illustrated in the following example.
NODE TABLE
Node Number Node Label
(Flow Control) N1 ESD N2 -- N3 ESD N4 ESD
Finally, using the labelled schematic and the Node Table, the gathering system can be described in a larger table, as shown in this example. This table will be used for the inputs to the ERCBH2S BATCH page. Remember to keep both tables and the schematic for future reference.
A user may wish to prepare a bigger table, with more references such as pipeline licence number, and line number (or line number segment portion – as per the Administrative group of the inputs), ‘from’ and ‘to location’, etc.
BATCH Page Input Table
BATCH page row
Scenario Name
Column L
Upstream Node
Number
Downstream Node Number
Upstream Node Label (Valve Type)
Downstream Node Label (Valve Type)
9 Pipeline Gathering Systems 144

number Column CO
Column CP
Column CQ
Column CR
Row 11 N1-N2 N1 N2 ESD --
Row 12 N2-N3 N2 N3 -- ESD
Row 13 N4-N2 N4 N2 ESD --
Careful preparation of a Node Table, a BATCH Page Input Table and a system schematic (complete with labels) will help a user to avoid ambiguous Nodes.
Once labelled and described, it is a good idea to keep the gathering system schematic and the tables for future reference. They will be particularly useful if any of the gathering system changes (new Nodes, changed Nodes, etc.)
2. On the BATCH page, scroll across to the Gas Gathering System-Pipeline Networking input group (begins at column CO).
There are two parts to the input group which are colour coded white (user input-column “CO to CR”) and orange (calculations column “CS to DA”).
3. Enter user input. When entering Node Labels, ERCBH2S requires exact text for “ESD” and “CV” in order to perform calculations. The text string for open flow or other can be any text the user selects, although two dashes can easily alert the viewer to flow control ‘gaps’.
For each record in the pipeline gathering system database, enter corresponding Node information as described in the table from Step 1. Copy the formulas
The first record on the BATCH page (row 10 – orange-coloured cells in the ‘Gas Gathering System – Pipeline Networking’ group of the BATCH page) contains formulae that must be copied/applied to the user’s pipeline gathering system analysis rows.
Use the mouse to highlight range “CS10:DA10”. Right click and select COPY. Then, using the mouse, left click and drag on the range of rows for the analysis, e.g., CS11:CS13 (for this tutorial example). Right click and select PASTE. ERCBH2S has just calculated ‘Equivalent Segment Lengths’ for each pipeline segment included in this analysis group.
9 Pipeline Gathering Systems 145

The formulae can be copied to more rows for later use.
If you have rows of pipeline data for which you do NOT want to calculate Equivalent Segment Lengths (because they have manual calculations), copy the formulae with care. Simply ‘dragging’ it may apply the formulae to rows of data you are not including in the analysis.
4. You Should See
After entering the data and pasting the formula (step 4), you should see calculated Equivalent Segment Length Between ESD Valves, as shown in the illustration below. Compare these values to the Segment Length Between ESD Valves. Because of the pipeline networking, the equivalent segment lengths can be much larger than the original segment.
In the example below, the tutorial case gas composition was used with 10 % H2S in segments N1-N2 and N2-N3, and a 20 % H2S used for segment N4-N2 (licensed maximum H2S and pressure are used in the calculations).
9 Pipeline Gathering Systems 146

5. Don’t forget to Link the results!
There is a formula that links the Gathering System Analysis Calculation Result (the Equivalent Segment Length between ESDs) to the input cell(s) ERCBH2S references for the ERP zone calculations (column AF). The user must complete this step in order to have the ‘Effective Segment Length’ in a place where ERCBH2S can find it when dispersion modelling calculations are performed.
Left click on cell “AF10”, then right click and select COPY. Then, using the mouse, left click and drag on the range of rows for the analysis (AF11:AF13 for this tutorial example). Right click and select PASTE.
Use care when copying this action down the column, as it causes entries in the column to be replaced with coordinating entries from the Gathering System Analysis portion of the BATCH page. Any rows of pipeline data that have manual calculations should NOT be included in the ‘dragging’ action. Instead, the formula should be selectively ‘copied’ to the data rows it applies to. Applying it to rows of data with Manual length calculations will result in Equivalent Segment Lengths of 0 overwriting any lengths manually entered.
The user must remember to complete this step in order for ERCBH2S to reference the Equivalent Segment Length when the ERP zone calculations are performed.
ERCBH2S ERP calculations do not use Equivalent Segment Lengths unless the user has properly provided certain key information and activated certain calculation sequences on the BATCH page.
9 Pipeline Gathering Systems 147

9 Pipeline Gathering Systems 148
The formula entered in field range AF: “Equivalent Segment Length between ESD Valves” can be overwritten if the user selects the SAVE TO BATCH command from the INPUTS page (if the INPUTS page has the same scenario name as the BATCH row!) It is therefore important to remember to re-enter the formula (column AF) if it has been over-written. Using the PREVIOUS and NEXT commands does not write to the BATCH page, therefore these commands can be safely used without affecting the formula. ERCBH2S warns the user if it is about to overwrite a formula.
6. Change the Pipe Diameter
To illustrate how segment lengths are adjusted for a given H2S volume, try changing the Outside Diameter of one of the pipelines. Because the cells are now ‘linked’ in a calculation sequence, changes to key cells cause immediate changes to the Equivalent Segment Length.
As the Outside Diameter becomes smaller, the Equivalent Segment Length becomes longer. As the Outside Diameter becomes larger, the Equivalent Segment Length becomes shorter.
Tutorial Variation 1 – Complex Node Location For this example, we examine how to organize, number, and label an input table for a complex tie-in location.
ESD1 ESD21 23
4 ESD3
5
ESD4

NODE TABLE
Node Number Node Label
(Flow Control) N1 ESD N2 ESD N3 -- N4 ESD N5 ESD
In this example, nodes 5 and 3 are actually at the same location.
BATCH Page Input Table BATCH
page row
number
Scenario Name
Column L
Upstream Node
Number Column
CO
Downstream Node Number Column
CP
Upstream Node Label (Valve Type)
Column CQ
Downstream Node Label (Valve Type)
Column CR
Row 11 N1-N5 N1 N5 ESD ESD
Row 12 N5-N3 N5 N3 ESD --
Row 13 N4-N3 N4 N3 ESD --
Row 14 N3-N2 N3 N2 -- ESD
In this example, if only one node is described at the tie-in location, only one node description can be assigned (remember that nodes must be unique). If the tie-in is labelled as ESD, it indicates that all pipelines tying-into this location begin or end with this ESD, which in this case is incorrect (e.g.: the pipeline coming from node 4 does not end at the ESD). If we label the location as ‘open flow’, then it indicates that all pipelines tying into this location begin or end with an ‘open flow’, which is also incorrect (e.g.: the pipeline coming from node 1 ends at an ESD). The only solution is to create two nodes at the tie-in location, labelling one as an ESD, and the other as an ‘open flow’. Remember that the actual ‘physical flow control’ for the beginning and ending of a pipeline segment must be accurately described.
When describing complex tie-ins, the user must describe ‘short’ pieces of pipeline connecting one node to another. These segments can be no shorter than 1 metre. Beyond this, users should use actual lengths whenever possible. If the piping in question is not part of the licensed system (as may be the case with certain lease piping) it must be described anyway. Without it, the ERCBH2S ‘Gathering
9 Pipeline Gathering Systems 149

System Analysis’ calculation feature cannot correctly ‘sum’ the H2S mass of the gathering system because the system is effectively ‘disconnected’ at this location.
Because lease piping may not have an ERCB licence number, the user can indicate this in the Administrative section of the Inputs page (or the BATCH page). For the line number, the user can indicate which pipelines are being ‘connected’ by the lease piping (helps to understand how the gathering system is put together).
The last column in the following table illustrates how ERCBH2S ‘sums’ the H2S mass described in this example.
BATCH Page Table
BATCH page row
number
Scenario Name
Column L
Upstream Node
Number Column
CO
Downstream Node
Number Column
CP
Upstream Node Label (Valve Type)
Column CQ
Downstream Node Label (Valve Type)
Column CR
How ERCBH2S
‘sums’ the H2S Mass
Row 11 N1-N5 N1 N5 ESD ESD = N1-N5
Row 12 N5-N3 N5 N3 ESD -- = N5-N3 +
N4-N3 +N3-N2
Row 13 N4-N3 N4 N3 ESD -- = N5-N3 +
N4-N3 +N3-N2
Row 14 N3-N2 N3 N2 -- ESD = N5-N3 +
N4-N3 +N3-N2
Tutorial Variation 2 – Other Licensee Tie-in In the following example, two different licensees are tied-in together at Node 2, where there is no flow control. This means that each licensee must account for H2S from the other licensee’s gathering system – to a point where flow control
9 Pipeline Gathering Systems 150

devices are encountered that stop additional material from entering the subject group of pipelines. In this example, each licensee is submitting a separate ERCBH2S file to the ERCB.
To arrive at an Equivalent Segment Length for each pipeline in this group, the user can perform manual calculations according to section 5.4 of the VOLUME 1 Technical Reference Document. Alternatively, the Gathering System Analysis portion of a ‘separate’ BATCH page can be used as a ‘calculator’ to save time. This page will not be submitted to the ERCB because each licensee is submitting a separate file pertaining to their respective pipelines.
Below is the BATCH page table for this pipeline group. The last column identifies how ERCBH2S sums the H2S mass for this group. Notice that although the check-valve at Node 6 prevents additional mass from being added back to Row 15, mass from Row 15 is added to the rest of the pipelines in this group.
Also notice that although Nodes 6 and 7 are at the same location, they must be identified separately (with a short piece of pipeline connecting them). If only the check-valve was identified at this location, then the pipeline coming from Node 4
9 Pipeline Gathering Systems 151

would directly tie-into a check-valve, which is incorrect. Describing this location in the manner shown ‘links’ all of the pipelines together, thereby allowing ERCBH2S to correctly ‘sum’ the H2S mass.
BATCH Page Table
BATCH page row
number
Scenario Name
Column L
Upstream Node
Number
ColumnCO
Downstream Node
Number
Column CP
Upstream Node Label (Valve Type)
Column CQ
Downstream Node Label (Valve Type)
Column CR
How ERCBH2S ‘sums’ the H2S Mass
Row 11 N1-N2 N1 N2 ESD - -
=N1-N2 +N2-N3 + N4-N7 + N7-N2 + N5-N6 + N6-N7
Row 12 N2-N3 N2 N3 - - ESD
=N1-N2 +N2-N3 + N4-N7 + N7-N2 + N5-N6 + N6-N7
Row 13 N4-N7 N4 N7 ESD - -
=N1-N2 +N2-N3 + N4-N7 + N7-N2 + N5-N6 + N6-N7
Row 14 N7-N2 N7 N2 - - - -
=N1-N2 +N2-N3 + N4-N7 + N7-N2 + N5-N6 + N6-N7
Row 15 N5-N6 N5 N6 ESD CV = N5-N6
Row 16 N6-N7 N6 N7 CV - -
=N1-N2 +N2-N3 + N4-N7 + N7-N2 + N5-N6 + N6-N7
9 Pipeline Gathering Systems 152

9 Pipeline Gathering Systems 153
Remember, this particular BATCH page is being used only as a ‘calculator’; it will not be submitted to the ERCB.
Once the Equivalent Segment Lengths have been calculated, they can be entered manually in column AF on each licensee’s respective BATCH page. For example, the pipeline described on this page as Row 12 may in fact be Row 185 on Licensee ABC’s BATCH page.
Remember that when manual calculation are entered in column AF, the user MUST NOT ‘drag’ the formula from Cell AF10 over the manual entries (see Step 6 in the first Tutorial example in this chapter).
Formulae for Pipeline Networks The formulae for the pipeline gathering system calculations in Excel are provided in VOLUME 1 Technical Reference Document (section 5.4). The ERCBH2S Gathering System Analysis feature determines the H2S mass of each pipeline segment (determined using ideal gas properties, and based on licensed maximums). The simplification ignores compressibility effects (z factor), and assumes compressibility is similar between each segment. Actual compressibility becomes a factor once dispersion modelling is performed.
Remember, for Equivalent Segment Length, if the pipeline inside diameter, licensed maximum operating pressure and licensed H2S are the same, then the segment lengths can be simply added together to arrive at the correct number. If any of these factors are not the same, refer to section 5.4 of the Technical Reference Document.
For Equivalent Cumulative Pipeline Volume, if the licensed maximum operating pressure, minimum operating temperature and licensed H2S are the same for ALL segments, then the calculation is the straightforward ‘sum’ of the segment lengths times the pipe area. If any of these factors are not the same, refer to section 5.4 of the VOLUME 1 Technical Reference Document.
10. EXAMPLE 1: Gas Pipeline
Tutorial By working through pre-loaded example files, you will become acquainted with:
• the ERCBH2S screen in Excel,
• some of the pages in ERCBH2S (Inputs and ERP Summary Page),
• user controlled input data, and
• terminology used throughout the guide.
If you have not done the tutorial ‘QUICK-START TUTORIAL’ (Chapter 3 -page 16) please do it now.
If you have not read Chapter 5 - INPUTS PAGE (page 53), please do it now (it is pre-requisite familiarity for the tutorials).
In ERCBH2S, emergency response and planning (ERP) zone calculations have certain assumptions and processes to model the sour gas well release and its subsequent behaviour. To acquaint the user with some of these attributes and terminology, the following summary is provided:
Sour Gas Release Characteristics
• Source conditions are determined for a high-pressure pipeline blow down.
• Flow rate decreases as the high-pressure decreases as the release progresses. Because the flow rate is not steady (not constant with time), a sour gas pipeline release is called a ‘transient release’ (transient jet).
• Flow from the pipeline (failure site) occurs at the mid-length location of the pipeline segment to simplify the analysis.
Individual Pipeline Analysis versus a Gathering System Analysis
• For an individual pipeline segment analysis:
10 Example 1: Gas Pipeline 154

o At each end of the pipeline segment there is an ESD valve or other flow control device that can completely stop product flow into the subject,
o the only source of product for the segment being modelled comes from upstream and downstream of the segment (there are no other pipelines tying-into the segment), and
o up-stream and downstream pipelines have identical specifications as the segment being modelled – including expected maximum operating pressure and expected maximum H2S concentration.
• In real gathering systems where some pipeline segments may not begin and/or end with a flow control device, or for segments that have other pipelines ‘tying-in’ in-between the beginning and end of the pipeline segment, ERCBH2S has a Pipeline Gathering System analysis feature to account for these circumstances. This process is described in Chapter 9 - Pipeline Gathering Systems. If you are modelling pipelines, we STRONGLY recommend you read Chapter 9.
What a pipeline segment means to ERCBH2S
• There are identical flow control devices at each end of the pipeline, and both flow control devices close at the same time. Therefore, pipelines that begin and end with ‘non-identical’ ESD valve settings, or have non-identical types of flow control must be modelled with the ‘lowest’ valve setting. Check valves are assumed to work correctly and completely.
• There are no pipelines tying into the pipeline segment in-between the start and end of the segment*. In the event of a failure, additional product flow can only come from each end of the pipeline.
o *F.Y.I. - This is why segment lengths must sometimes be adjusted (‘Equivalent’ Segment Length); because other pipelines tie into the modelled pipeline in between the beginning and ending of the modelled pipeline. Again, this is described in Chapter 9 - Pipeline Gathering Systems. For this example, there are no pipelines tying in between the beginning and ending of the segment, AND the pipeline begins and ends with an ESD valve.
Flow Control
• User inputs to ERCBH2S provide for the following types of flow control:
o ‘Low-pressure set point’ ESD control trigger - if pressure falls below a pre-determined set point, the valve will close.
10 Example 1: Gas Pipeline 155

o ‘Pressure rate of change’ (PROC) ESD control trigger - if a pre-determined pressure drop occurs over a pre-set sampling time – the valve will close.
o Manual closure at a specified time after the release begins. The time must include detection of the release, notification of the operator, travel to the segment, verifying the release by locating it, and shutting the valves.
o No flow control.
• ESD valves have a specified time to shut-in (once activated to close - the amount of time it takes them to close). This operation of the valve means that gas from the pipeline will exit from both between the ESD valves (volume based on the segment length), and from upstream and downstream of the two ESD valves until closure is triggered (additional gas volume). ERCBH2S calculates the total release volume – which depends on the time it takes the valve closure to be activated.
• Following valve closure, a pipeline continues to blow-down until the two halves have drained to atmospheric pressure, unless the pipeline is ignited or ‘drawn-down’. ERCBH2S inputs also provide for these very specific pre-planned user actions.
Ground-level Release
A nominal height of 0 m is used in the air quality modelling simulations, as most pipelines are buried and the release exits at ground-level. A large/high pressure sour gas pipeline rupture is typically a catastrophic release that removes surface soils and flattens the ground around the release site. Failures from leaks (small holes) can also remove surface soils with their high-pressure ‘jet’ release (created by the ‘choked flow’ effect).
Horizontal or Vertical Release
Sour gas pipeline releases are assumed to be horizontal releases resulting from a catastrophic rupture of the pipeline. Less damaging ruptures or lower pressure sour gas pipelines may have a deflected jet releasing vertically through soils (or overburden), the resultant jet could be either horizontal (parallel to the ground surface) or vertical (perpendicular to the ground surface). Because horizontal releases do not rise as much as vertical releases, the horizontal release errs on the side of caution.
Dense or Buoyant
A buried sour gas pipeline is typically at or near ground temperature of 5ºC. When the flow exits the source (failure site) to atmospheric pressure, a ‘choked
10 Example 1: Gas Pipeline 156
flow’ condition occurs. Due to the expansion effects of the released material, its temperature drops and initial dispersion conditions may be dense. ERCBH2S uses real gas effects and determines whether the release is dense or buoyant.
Hole Size (Ae/Ap Ratio)
Pipelines can fail by a complete sever (guillotine rupture) - in catastrophic fashion, or by leaks from a hole in a pipeline. Leaks from holes in sour gas pipelines are also high-pressure releases (the ‘choked flow’ effect), but the pipeline blow-down takes much longer than with a guillotine rupture. Consequently, while the rate of release may be significantly smaller, the release duration may be much longer. This is because ESD valve automatic closure trigger ‘times’ may be significantly longer (i.e., ESD valves will not trigger closure because the pressure drop is not significant enough, so a manual trigger must occur).
In the case of a guillotine rupture, gas escapes through equally sized holes from each half of the ruptured pipeline (200 % of the pipeline’s flow area). All other failure hole size scenarios examined by ERCBH2S are considered as single holes (≤100 % of the pipe area), also expressed as a release hole size fraction (Aexit/Apipe or Ae/Ap).
Failure (Release) Location
For modelling, the failure (release) site is always the pipeline midpoint.
Step-By-Step Procedure
To follow along with this hands-on sour gas pipeline release example:
If you have pre-set the install option for ERCBH2S.xla (STEP 2: Activating the ERCBH2S Add-In on page 12) go directly to step 2 in this tutorial. Otherwise, begin at step 1.
1. Click on the Start menu button on your computer desktop.
Select Programs
Select ERCBModels
Select ERCBH2S
Select Launch ERCBH2S.xla
(The ERCBH2S menu in Excel is now launched)
10 Example 1: Gas Pipeline 157
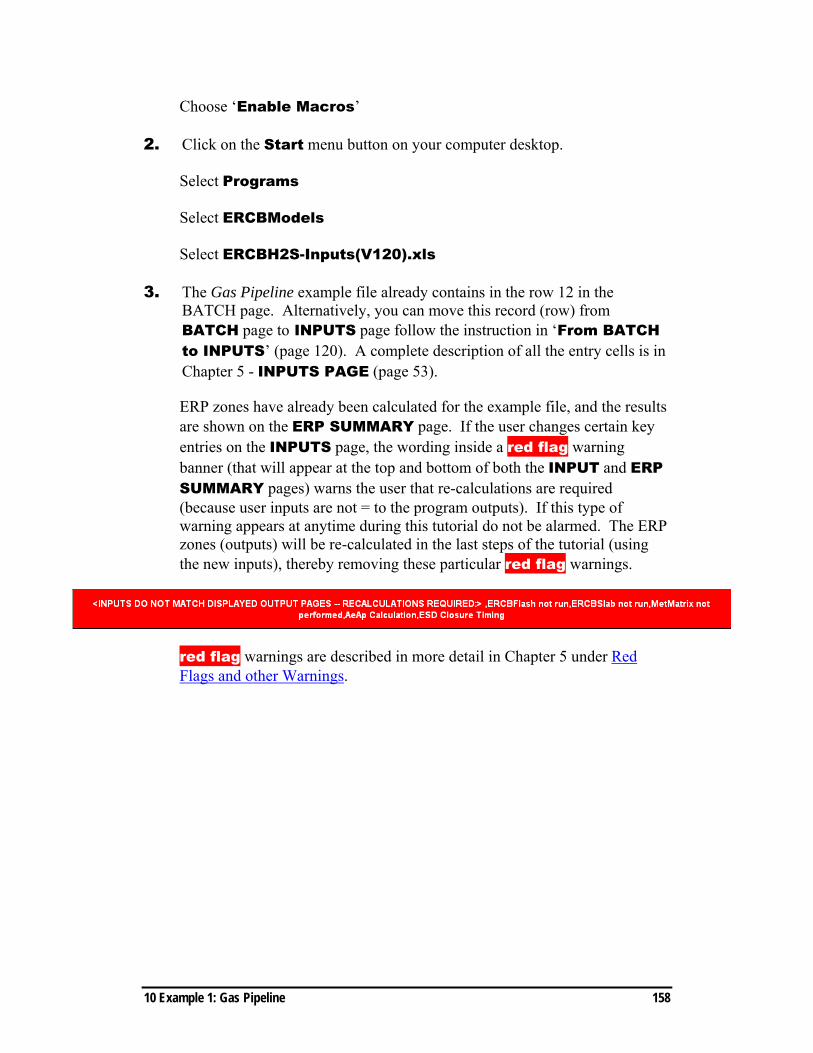
Choose ‘Enable Macros’
2. Click on the Start menu button on your computer desktop.
Select Programs
Select ERCBModels
Select ERCBH2S-Inputs(V120).xls
3. The Gas Pipeline example file already contains in the row 12 in the BATCH page. Alternatively, you can move this record (row) from BATCH page to INPUTS page follow the instruction in ‘From BATCH to INPUTS’ (page 120). A complete description of all the entry cells is in Chapter 5 - INPUTS PAGE (page 53).
ERP zones have already been calculated for the example file, and the results are shown on the ERP SUMMARY page. If the user changes certain key entries on the INPUTS page, the wording inside a red flag warning banner (that will appear at the top and bottom of both the INPUT and ERP SUMMARY pages) warns the user that re-calculations are required (because user inputs are not = to the program outputs). If this type of warning appears at anytime during this tutorial do not be alarmed. The ERP zones (outputs) will be re-calculated in the last steps of the tutorial (using the new inputs), thereby removing these particular red flag warnings.
red flag warnings are described in more detail in Chapter 5 under Red Flags and other Warnings.
10 Example 1: Gas Pipeline 158

4. Administrative Input Group
The entry titled ‘Surface Elevation’ is for an average EPZ elevation near the pipeline based upon a review of topographical maps of the area within a radius of about 5 km (determined from maps), or based on well-site elevations. Pipelines with significant elevation changes must be modelled in separate segments if elevation changes are more than +/- 100m. Additional details concerning this and all other user inputs are in Chapter 5 - INPUTS PAGE (page 53).
Try deleting some of the entries, and observe the warnings that appear in column ‘E’. This column provides warnings for the user. Warnings also appear inside a red flag warning banner across the top and bottom of the page.
Select the ‘undo’ button to replace the entries, and the warnings will be removed. Warnings are described in more detail in Chapter 5 under Red Flags and other Warnings.
5. Calculation Controls portion of the ADMINISTRATIVE Group
10 Example 1: Gas Pipeline 159

For pipelines, Sour Operations Type is determined by a pipeline’s ERCB Directive 056 licensed substance, with the exception of Acid Gas. Acid Gas pipelines must be identified separately, even though they are licensed as Sour Gas pipelines.
Use the drop-down box to select a pipeline substance. By trying different selections, you will see that some choices move you to the Liquid Pipeline/Well group. Replace the original selection of Sour Gas Pipeline.
6. Gas Pipeline Details Input Group
Notice that the Licensed Maximum Operating Pressure (MOP) is 9930 kPa (gauge), but the ‘Expected Maximum Operating Pressure’ is only 5000 kPa. There is a similar difference for the H2S entries – the Licenced Maximum H2S Concentration is 14 %, but the Expected Maximum H2S Concentration is only 7 %. Representative operating maximum values that are lower than licensed limits and will not be exceeded can be used instead of licensed maximums.
Now look at the two pipeline length entries. If this pipeline had ESD valves (or equivalent) at each end, and there was no other pipeline tying into it, the two length entries would be the same. For this example, it appears there is either no ESD at one (or both) ends of the pipeline, and/or there are other pipelines tying into the subject segment. ‘Equivalent Segment Length’ is described in more detail in Chapter 9 - Pipeline Gathering Systems.
10 Example 1: Gas Pipeline 160

10 Example 1: Gas Pipeline 161
The Equivalent Cumulative Pipeline Volume cell appears greyed-out. This is because a user must enter only ONE of either the Equivalent Segment Length between ESDs (ESL) OR Equivalent Cumulative Pipeline Volume (ECPV). Notice the entry in column D for the ECPV row - ERCBH2S has calculated the equivalent volume based on other user entries.
Delete the 4973 entry for ESL, and both the ESL and ECPV cells are now open for user input. Enter 253 for ECPV, and observe that the ESL entry is greyed-out and column D displays the calculated length.
Delete the entry for ECPV. Enter 900 for ESL. An Entry out of bounds warning appears in column E because the ESL between ESDs’ cannot be less than the Segment Length (allowable entry ranges are displayed to the right of the INPUTS page – in columns H and I). Also notice the red flag banner that appears at the top and bottom of the page. The user entry is obviously an ‘out of bounds’ error and has to be corrected for the model to run. Re-enter the 4973 and the ‘Entry out of bounds’ warning disappears.
The ‘Modelled Solution Gas to Liquid Ratio’ cell is greyed-out because the pipeline substance is not Oil Effluent (selected in ‘Sour Operations Type’ - the Administrative section).
Additional details concerning these (and all other) user inputs are in Chapter 5 - INPUTS PAGE (page 53).
7. Minimum Pipeline Temperature
Even though this pipeline has a line heater installed to prevent hydrate formation, the normal minimum operating temperature is ground temperature. Therefore, the default setting of 5° C is not changed.
Enter a value of 160, and the model input changes to 150; as indicated by the ‘orange reset’ in column E. This is because the user entry is above the allowable range for this field – as indicated in columns H and I (to the right). Notice that column J describes the associated model action (for entries outside the allowable range) as ‘resets’. This means that instead of the user entry, the model will use the closest allowable value. Unless the user entry is changed to be within allowable limits, a red flag will be attached to the calculation results, and they will not be acceptable for ERCB submission.
Delete the 160 entry, and the orange reset is removed. The model will again use the default value of 5° C.

10 Example 1: Gas Pipeline 162
Warnings are described in more detail in Chapter 5 under Red Flags and other Warnings.
8. Source Mitigation
The SOURCE MITIGATION sub-section is not currently ‘open’ because the NO MITIGATION analysis type is selected in the ADMINISTRATIVE section of the INPUTS page. The model will use the default values as shown.
Note that the ERCB default settings in this group result in no effective ESD control for a pipeline release.
GAS PIPELINE source mitigation is discussed in more detail under Gas Pipeline Group- Source Mitigation Section in Chapter 5.
9. Sour Gas Composition Input Group
The gas composition (mole fraction) for the example pipeline segment release is provided. This particular sample represents a composite average of sour wells in Alberta, and is intended for use only in this tutorial (users must supply appropriate representative analysis data for the sour gas pipeline being modeled).
Sour Gas Composition(gas phase at 15°C & 101.325 kPa, dry, representative analysis)
Units User Input Comments Warnings
H2 mole fraction 0He mole fraction 0.0006N2 mole fraction 0.0283
CO2 mole fraction 0.0427
H2S 0.0259mole fractionAdjusted to Maximum H2S Input for Level and Modelled H2S Input for EPZ
CH4 mole fraction 0.8137C2H6 mole fraction 0.0488C3H8 mole fraction 0.0208
i-C4H10 mole fraction 0.0036n-C4H10 mole fraction 0.0065i-C5H12 mole fraction 0.002
n-C5H12 mole fraction 0.0021n-C6H14 mole fraction 0.002
n-C7H16+ mole fraction 0.003
Total mole fraction 1 Sum must equal one

Observe the comment in column D beside the H2S entry. For this particular example file, this comment means that although the gas analysis H2S content is less than 3 %, the analysis will be re-adjusted to the Expected Maximum H2S Concentration of 14 % (entered in the GAS PIPELINE details group). The Licensed Maximum H2S Concentration (14 %) is used for setback calculations, and not for planning zone calculations.
In adjusting a gas analysis composition, ERCBH2S changes the reference H2S entry to equal the ‘Maximum Expected H2S’ entry, and then pro-rates all other reference gas analysis components according to their new fractional contribution to the total analysis (renormalized). The adjusted analysis can be immediately viewed on the ERP SUMMARY page, because the calculations are performed by Excel – no ERCBH2S program ‘run’ commands are needed for the conversion. All ERCBH2S program modelling calculations will reference the adjusted analysis.
See Sour Gas Composition in Chapter 5 for more information.
10. Run Calculate EPZ
After pressing the Calculate EPZ button, , a confirmation dialog is presented, asking if you are sure you want to continue. The calculations
10 Example 1: Gas Pipeline 163

may take several moments to perform depending on the processing power of the computer used. Select OK to continue.
After the ERCBH2S calculations are completed, the ERP SUMMARY page is displayed to view a summary of the calculation results.
11. ERP SUMMARY Page Results
The ERP SUMMARY page displays a planning and response zone graphic, as shown below.
The table to the right of the schematic lists each of the emergency response and planning zones.
Variation 1: Segment Length
The Equivalent Segment Length considered above was 4973 m between ESD valves. Next we consider another segment of the same pipeline. The distance between ESD valves is 1000 m in this segment, whereas all of the other conditions are the same. ERP zones must be defined for each segment of the pipeline, because the blow-down calculations for each segment will be different.
Click on the INPUTS page and change Segment Length and Equivalent Segment Length in the Gas Pipeline details input group to 1000.
10 Example 1: Gas Pipeline 164
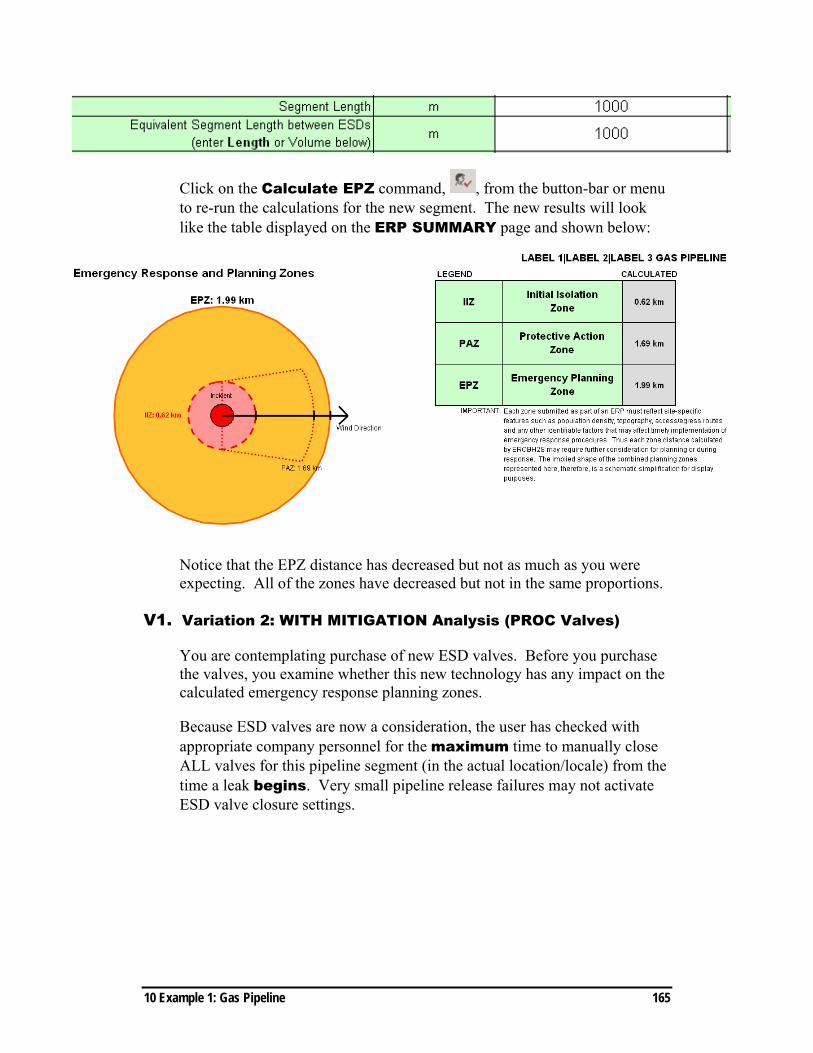
Click on the Calculate EPZ command, , from the button-bar or menu to re-run the calculations for the new segment. The new results will look like the table displayed on the ERP SUMMARY page and shown below:
Notice that the EPZ distance has decreased but not as much as you were expecting. All of the zones have decreased but not in the same proportions.
V1. Variation 2: WITH MITIGATION Analysis (PROC Valves)
You are contemplating purchase of new ESD valves. Before you purchase the valves, you examine whether this new technology has any impact on the calculated emergency response planning zones.
Because ESD valves are now a consideration, the user has checked with appropriate company personnel for the maximum time to manually close ALL valves for this pipeline segment (in the actual location/locale) from the time a leak begins. Very small pipeline release failures may not activate ESD valve closure settings.
10 Example 1: Gas Pipeline 165

V2. On the INPUTS page in the ADMINISTRATIVE inputs group – Analysis Type, select a WITH MITIGATION analysis.
In the GAS PIPELINE details group, change ‘Equivalent Segment Length’ back to 4973.
Because this is a tutorial, the user inputs for SOURCE MITIGATION in GAS PIPELINE have been already entered. Notice the ‘over-ride’ of most of the default entries (ERCB default settings in this group result in no effective ESD control for a pipeline release).
To see the effect the new ESD valves could have on the planning zone sizes, the pipeline will be modelled with flow completely controlled using PROC-ESD’s of identical settings. Also, the time for manual closure applies to ALL of the valves for the pipeline segment. (Remember that the flow control device with the lowest setting must be modelled. GAS PIPELINE source mitigation is discussed in more detail under Gas Pipeline Group- Source Mitigation Section in Chapter 5.)
The entries correspond to the ESD specification of a Valve Closure time of 1 s and a sensitive PROC trigger of 100 kPa/s that is sampled every 60 s. In addition, the valves have a low pressure setting, which (to be effective) will not be set at less than 50 % of the Expected Maximum Operating Pressure (this is the ERCB expectation for sour gas pipelines with greater than 1 % H2S).
10 Example 1: Gas Pipeline 166

10 Example 1: Gas Pipeline 167
V3. Click on the Calculate EPZ command, , from the button-bar or menu to re-run the calculations for the new entries. The new results will look like the table displayed on the ERP SUMMARY page and shown below:
On the ERP SUMMARY page, the hazard zones are significantly reduced from the NO MITIGATION ESD instrumentation settings. These results may be advantageous from an emergency planning perspective and for general public safety. It remains to be examined by the operator if the normal fluctuation of pressure through the pipeline segment (due to process or load fluctuations) may trigger false ESD closures.

11. EXAMPLE 2: Gas Well
Tutorial By working through pre-loaded example files, you will become acquainted with:
• the ERCBH2S screen in Excel,
• some of the pages in ERCBH2S (Inputs, Batch and ERP Summary Page),
• user controlled input data, and
• terminology used throughout the guide.
If you have not done the tutorial ‘QUICK-START TUTORIAL’ (Chapter 3 -page 16) please do it now.
If you have not read Chapter 5 - INPUTS PAGE (page 53), please do it now (it is pre-requisite familiarity for the tutorials).
In ERCBH2S, emergency response and planning (ERP) zone calculations have certain assumptions and processes to model the sour gas well release and its subsequent behaviour. To acquaint the user with some of these attributes and terminology, the following summary is provided:
Sour Gas Release Characteristics
• Source conditions are determined by reservoir engineering. Flow rate to surface is not regulated by engineering controls and the failure is typically an uncontrolled-high pressure, high flow rate, low temperature release.
• A sour gas well release is typically a steady flow rate (constant with time) release (steady jet).
Release Height
A nominal height of 1 m is used in the air quality modelling simulations. Well releases typically result from a loss of control situation (during drilling, work-overs, completion or re-completion), or during production, with the emission point to atmosphere at or near ground level.
11 Example 2: Gas Well 168

Horizontal or Vertical Release
A sour gas well release jet could be re-directed as a result of interaction with nearby obstacles such as the rig itself or piping. The release jet could also be from a malfunction or piping failure at the well head. Therefore, the resultant jet could be horizontal (parallel to the ground surface) or vertical (perpendicular to ground surface). A horizontal release, which errs on the side of caution, is assumed in ERCBH2S.
Dense or buoyant
A sour gas well is supplied by a reservoir at high pressure and high temperature. As the release flows up the well bore it cools due to expansion and transfers heat to the ground. Using a stagnation temperature, ERCBH2S determines the exit pressure according to the specified flow rate. When the flow exits the well bore to atmospheric pressure, a choked flow condition occurs. Resulting expansion effects cause temperature drop, creating initial dispersion conditions that may be dense. ERCBH2S selects the stagnation temperature which results in a dense release, thereby erring on the side of caution.
Step-By-Step Procedure
To follow along with this hands-on sour gas well release example:
If you have pre-set the install option for ERCBH2S.xla (STEP 2: Activating the ERCBH2S Add-In on page 12) go directly to step 2 in this tutorial. Otherwise, begin at step 1.
1. Click on the Start menu button on your computer desktop.
Select Programs
Select ERCBModels
Select ERCBH2S
Select Launch ERCBH2S.xla
(The ERCBH2S menu in Excel is now launched)
Choose ‘Enable Macros’
2. Click on the Start menu button on your computer desktop.
Select Programs
11 Example 2: Gas Well 169

Select ERCBMODELS
Select ERCBH2S
Select ERCBModels
Select ERCBH2S-Inputs(V120).xls
3. The Gas Well example file already contains in the row 11 in the BATCH page. Alternatively, you can move this record (row) from BATCH page to INPUTS page follow the instruction in ‘From BATCH to INPUTS’ (page 120). A complete description of all the entry cells is in Chapter 5 - INPUTS PAGE (page 53).
ERP zones have already been calculated for the example file, and the results are shown on the ERP SUMMARY page. If the user changes certain key entries on the INPUTS page, the wording inside a red flag warning banner (that will appear at the top and bottom of both the INPUT and ERP SUMMARY pages) warns the user that re-calculations are required (because user inputs are not = to the program outputs). If this type of warning appears at anytime during this tutorial do not be alarmed. The ERP zones (outputs) will be re-calculated in the last steps of the tutorial (using the new inputs), thereby removing these particular red flag warnings.
INPUTS DO NOT MATCH DISPLAYED OUTPUT PAGES -- RECALCULATIONS REQUIRED: ,ERCBFlash,ERCBSlab,MetMatrix
Red flag warnings are described in more detail in Chapter 5 under Red Flags and other Warnings.
11 Example 2: Gas Well 170

4. Administrative Input Group
Try deleting some of the entries, and observe the warnings that appear in column ‘E’. This column provides warnings for the user. Warnings also appear inside a red flag warning banner across the top and bottom of the page.
Select the ‘undo’ button to replace the entries, and the warnings will be removed. Warnings are described in more detail in Chapter 5 under Red Flags and other Warnings.
Use the drop-down box to select the pipeline substance category according to ERCB Directive 056. Acid Gas pipelines must be identified separately, even though they are licensed as ‘Sour Gas’ pipelines.
5. Calculation Controls portion of the ADMINISTRATIVE Group
For wells, ‘Sour Operations Type’ is determined by the well’s ‘ERCB Directive 056’ substance, and the wells’ Gas to Liquid Ratio (GLR).
Use the drop-down box to select the substance. By trying different selections, you will see that some choices move you to the ‘Liquid Pipeline/Well’ group. Replace the original selection of ‘Sour Gas Well’.
11 Example 2: Gas Well 171

11 Example 2: Gas Well 172
6. Gas Well Details Input Group
There are three types of ‘Phase of Well Operations’: Drilling, Completion/Servicing/Workover, and Producing/Injection/Suspended.
Try deleting the 165.6 entry and entering 1656, a typo. Notice the Entry out of bounds warning appears in column E because the Casing or Tubing Inside-Diameter must not be greater than 500 mm (allowable entry ranges are displayed to the right of the INPUTS page – in columns H and I). Also notice the red flag banner that appeared at the top and bottom of the page. The user entry is obviously an ‘out of bounds’ error and has to be corrected for the model to run. Re-enter the 165.6, and the ‘Entry out of bounds’ warning disappears.
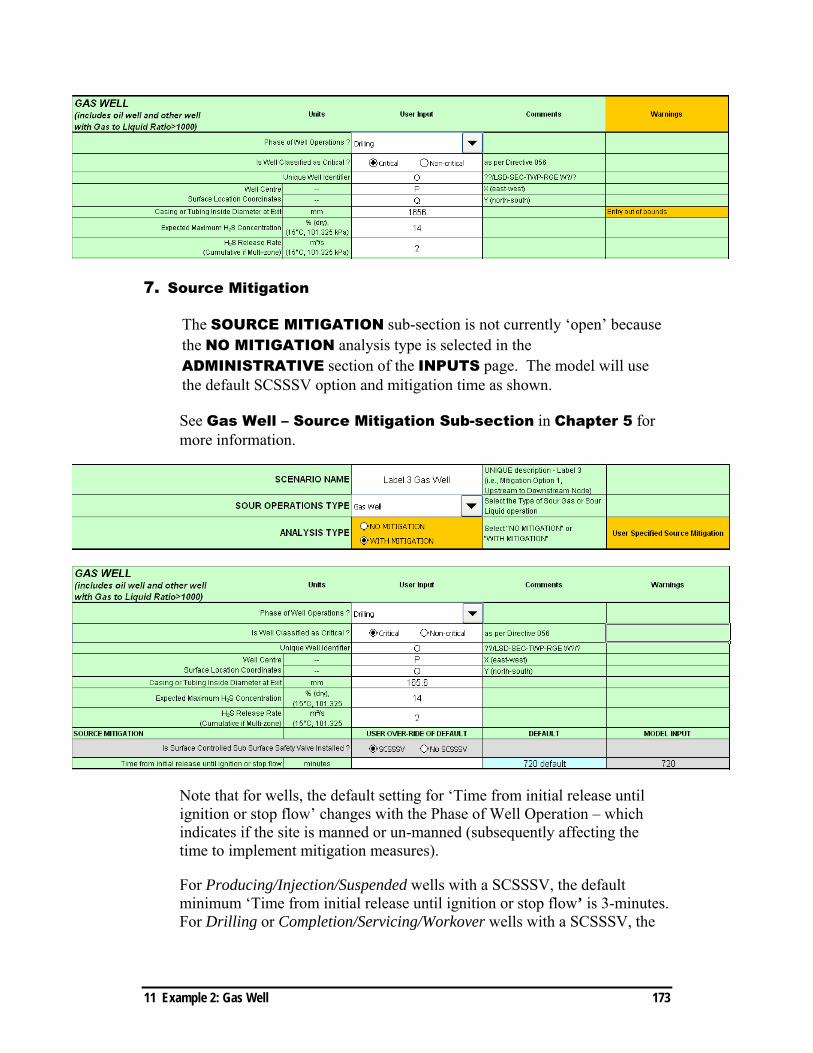
7. Source Mitigation
The SOURCE MITIGATION sub-section is not currently ‘open’ because the NO MITIGATION analysis type is selected in the ADMINISTRATIVE section of the INPUTS page. The model will use the default SCSSSV option and mitigation time as shown.
See Gas Well – Source Mitigation Sub-section in Chapter 5 for more information.
Note that for wells, the default setting for ‘Time from initial release until ignition or stop flow’ changes with the Phase of Well Operation – which indicates if the site is manned or un-manned (subsequently affecting the time to implement mitigation measures).
For Producing/Injection/Suspended wells with a SCSSSV, the default minimum ‘Time from initial release until ignition or stop flow’ is 3-minutes. For Drilling or Completion/Servicing/Workover wells with a SCSSSV, the
11 Example 2: Gas Well 173

default minimum ‘Time from initial release until ignition or stop flow’ is 15-minutes.
If the User Input is out of the range of the default settings, the MODEL INPUT cell gives an Orange Warnings. For example, for a Drilling well, if the user inputs 3-minutes for ‘Time from initial release until ignition or stop flow’, the MODEL INPUT cell shows a warning. Because the user input is less than the default minimum 15-minutes ignition time for a drilling phase.
However, if the user chooses a Producing phase instead of a Drilling phase, the 3-minutes ignition time is acceptable because the minimum ignition time for a Producing phase is 3-minutes. The MODEL INPUT cell does not show any warnings here.
The default setting for ‘Time from initial release until ignition or stop flow’ changes with the Phase of Well Operation. It is user’s responsibility to choose the correct Phase of Well Operation.
11 Example 2: Gas Well 174

8. Sour Gas Composition Input Group
The gas composition (mole fraction) for the example well file is provided. This particular sample represents a composite average of sour wells in Alberta, and is intended only for use in this tutorial (users must supply appropriate representative analysis data for the sour gas well being modeled).
Observe the comment in column D beside the H2S entry. For this particular example file, this comment means that although the gas analysis H2S content is less than 3 %, the analysis will be re-adjusted to the expected maximum H2S concentration of 14 % (entered in the GAS WELL details group).
In adjusting a gas analysis composition, ERCBH2S changes the reference H2S entry to equal the ‘maximum expected H2S’ entry, and then pro-rates all other reference gas analysis components according to their new fractional contribution to the total analysis (renormalized). The adjusted analysis can be immediately viewed on the ERP summary page, because the calculations are performed by Excel – no ERCBH2S program ‘run’ commands are needed for the conversion. All ERCBH2S program calculations will reference the adjusted analysis.
11 Example 2: Gas Well 175

See Sour Gas Composition in Chapter 5 for more information.
9. Run Calculate EPZ
After pressing the Calculate EPZ button, , a confirmation dialog is presented, asking if you are sure you want to continue. The calculations may take several moments to perform depending on the processing power of the computer used. Select OK to continue.
After the ERCBH2S calculations are completed, the ERP SUMMARY page is displayed to view a summary of the calculation results.
10. ERP SUMMARY Page Results
The ERP SUMMARY page displays a planning and response zone graphic, as shown below.
11 Example 2: Gas Well 176

The table to the right of the schematic lists each of the emergency response and planning zones.
11. Saving data to the BATCH Page
Save entries from the INPUTS page to the BATCH page, by pressing the
Save INPUTS and Results to Batch Page button, , while on the INPUTS page. This command also saves all calculation results – including the OUTPUT data.
Select the BATCH page tab. Notice that row 11 has entries. Scroll across the sheet to see the inputs and outputs. Further changes to this scenario can now be made directly on the BATCH page. When the new scenarios are ‘run’, the calculation results can be easily compared to each other because the results will be listed one over the other – all within one column and all of one page. For example, calculated EPZ results are listed in column DO on the BATCH page.
Variation 1, performed from the BATCH page, provides important practice in working between the BATCH and INPUTS pages. The actions described are applicable to other ERCBH2S applications – not just sour gas wells.
Variation 1: Sour Gas Well – Change Time to Ignition
Additional information has been obtained for this sour gas well through expert training and testing on-site. The report suggests that the well could be ignited if required in 12 minutes. Although your expert testing and
11 Example 2: Gas Well 177

11 Example 2: Gas Well 178
documentation indicates 12 minute ignition time is possible, ERCB Directive 071 does not allow for ignition times of less than 15 minutes.
On the BATCH page, duplicate the first scenario/row you entered (previous step 11) using Excel’s usual ‘click and copy’ feature to copy the row’s INPUT details (which end at column DN); then append/paste them to the same range in row 12. Now avoid making changes to row 11 on the BATCH page to maintain the input and output data integrity of this row.
Change the scenario name for the new row (row 12) in column L on the BATCH page.
Use caution if you chose to copy the OUTPUT results from the original scenario and apply them to the newest scenario. If you did, the safest option is to simply delete them for the new row/scenario (OUTPUTS begin at column DO). Otherwise, future input changes for the new row may appear to coordinate with ‘old’ output results since they are also on the same row on the BATCH page. Eventually, the new inputs will be used for new calculation but until then, it is better not to list false results.
The ‘Erase all output fields’ button does not erase anything stored on the BATCH page – it erases outputs fother ERCBH2S pages.
rom
V1a. Scroll over to column BA in the Well Details Group (Time from initial release till ignition or stop flow) and enter 12 (do not include units of minutes).
V1b. Now ensure the new scenario/row is flagged appropriately for ‘run/not run’. The Run/Not Run column (column ‘A’) should have a 1 in it to ensure the new scenario is ‘run’ when one of the ERCBH2S program-RUN commands is activated. You may wish to change the Run/Not Run indicator of the last scenario/row to a 0 since calculations for this scenario do not need to be repeated.
V1c. Click on the row number for the new row/scenario (extreme left side of the BATCH page). Then click on the Copy current batch record to
INPUTS command, from the button bar. This copies the entries for the new scenario over to the INPUTS page. The screen automatically changes to show the INPUTS page, populated with input data from whatever row was highlighted on the BATCH page.

Note - this is the only way to view any data entry warnings and/or ‘orange re-sets’.
Red flag warning banners, orange warnings and orange resets related to user inputs do not appear on the BATCH page.
V1d. Scroll down the INPUTS page to ‘Time from initial release till ignition or stop flow’ in the Gas Well details group under Source Mitigation. Notice that although you entered 12 minutes for this entry on the BATCH page, the field is ‘greyed out’ on the INPUTS page; and the ‘Model Input’ value assigned to this field is 720 minutes (shown in the right-hand column).
This is because in the Administrative section, the Analysis Type selected is still NO MITIGATION. Change it WITH MITIGATION.
Now your entry of 12 minutes is allowed to appear. This input was brought over from the BATCH page with all of the other inputs, but appeared ‘greyed-out’ because access to Source Mitigation was not activated.
Observe that in the right-hand column under Model Input, ERCBH2S has an ‘orange reset’ entry of 15 minutes.
This is because 15 minutes is the minimum allowed value for this field.
Toggle back over to the BATCH page. Notice that the option selected in column N (Analysis Type) is still a 1 (NO MITIGATION). When this option was changed on the INPUTS page, the change was not automatically reflected on the BATCH page.
Input data on the BATCH page is only changed by either ‘over-writing an existing scenario on the BATCH page with a new INPUTS page (same scenario name), or by directly making the data change on the BATCH page. For any given scenario, there is no ‘live/active link’ between the BATCH and INPUTS page.
11 Example 2: Gas Well 179

11 Example 2: Gas Well 180
Also notice that the user input for column BA (Time from initial release till ignition or stop flow) is still 12 minutes, even though you know the model will use 15 minutes.
When ERCBH2S assigns a different value to a user entry (an ‘orange reset’), the ‘reset’ value does not appear on the BATCH page. The only way to see an ‘orange reset’ for a BATCH page scenario/record is to view the record on the INPUTS page.
V1e. For practice, make the needed changes from the INPUTS page rather than making them directly on the BATCH page.
Toggle back over to the INPUTS page. It appears EXACTLY as you last left it. Because ‘Analysis Type’ is already changed to WITH MITIGATION, the only other needed change is the user input in ‘Source Mitigation’. Change the entry from 12 to 15, and the ‘orange reset’ is removed.
V1f. Now you will ‘over-write’ a scenario on the BATCH page with a new INPUTS page.
Recall that when an INPUTS page is saved to the BATCH page, ALL calculation results (including OUTPUTS) go with it. Right now the ERP SUMARY page still has calculation results from the last scenario that was ‘run’, and you do NOT want these results to be saved for your new row on the BATCH page.
When copying an INPUTS page to a BApage, ALL calculation results (including OUTPUTS) are appended/copied to the BATCH row/record.
TCH
However, when copying/reading a BATCH record/row to the INPUTS page, only the BATCH input records are copied over. Any associated calculation results for the BATCH row/record are not brought along.
Activate the ‘erase all output fields’ button to re-set calculation results to ‘0’ before moving the INPUTS page to a BATCH record.

From the INPUTS page, activate the SAVE TO BATCH button . Because the scenario name already exists on the BATCH page, the user is prompted to either accept the save operation or to cancel. Choose the ‘save’ operation, and the record on the BATCH page with the identical SCENARIO NAME is completely overwritten with the new data from the INPUTS page (including whatever calculation results and output data is tied to the INPUTS page).
V1g. View the changed row on the BATCH page. Go to the outputs area (column DO) and observe the recorded outputs. Recall that you erased the outputs before you performed the save. Also notice the error messages in column DO, cautioning the user that the outputs listed do not match the inputs. This message appears because it was copied over when you performed the save. Messages in this column are not activated by simply changing information on the BATCH page. They are recorded only through either a ‘SAVE TO Batch’ operation, or when a scenario on the BATCH page has received a ‘Batch Calculate EPZ’ command (or other program ‘run’ commands).
V1h. Finally, activate the Batch Calculate EPZ command, from the button-bar at the top of the BATCH page. This executes the complete set of 54-meteorological cases in the screening matrix calculation for each scenario/row on the BATCH page that is included in the ‘run’ (has a ‘1’ in column ‘A’ on the BATCH page).
V1i. The new results will look like the table displayed on the ERP SUMMARY page as shown below:
11 Example 2: Gas Well 181

11 Example 2: Gas Well 182
V1j. To compare the EPZ results from the first scenario to the new scenario, go to column DP on the BATCH page. Notice that the EPZ distance has decreased. In fact, all of the zones have decreased but not in the same proportions.

12. Troubleshooting and FAQs
Non-reportable Error Messages Many of the error messages are shown to assist the user. They have been generated as a result of user inputs that create calculation errors or that something non-routine has occurred and the program is trying to recover. Most of these types of errors follow from inputs that exceed normal ranges of the parameter. To problem solve these error messages, follow the steps below:
1. Review the inputs relating to the error message. Ensure that the inputs are within the normal ranges for the field-operation and within the normal range suggested in the spreadsheet input. Check for missing inputs. Re-read the User Guide or Technical Reference Document to ensure that you have interpreted the inputs correctly for what the program expects.
2. Use the example inputs provided in the User Guide as a starting point for your assessment of the operation. Then change the example inputs to match your conditions. (Remember to save the file with a new name so the original template file is not changed).
3. Compare each input to one of your own assessments that works correctly.
4. If all of your inputs appear satisfactory, but an error message still occurs, then report the error message and provide a copy of the inputs to ERCB. See section ‘Reportable Error Messages’.
Reportable Error Messages While every attempt has been made to ensure programming errors and compatibility issues don’t arise, computer configurations vary by personal preferences and therefore issues may arise. If an issue is discovered, please report it to ERCB for inclusion in the next ERCBH2S release along with a copy of the spreadsheet that may duplicate the error, to:
13 References 183

ERROR #9
This error message could result from a software compatibility error. Contact ERCB and send the ERCB a copy of your spreadsheet that duplicates the error message occurrence along with a description of how to duplicate the error message.
ERROR #1004
This error message may occur due to a programming error or compatibility issue. If modelling pipelines with very short line lengths (less than 10 m), try increasing the line length 1 metre at a time to see if ‘Calculate EPZ’ can be executed without getting the same message. You shouldn’t need to go higher than about 10 metres. If this solves the problem, then simply subtract the extra line length from the adjoining pipelines.
ERROR #9005
This error message is a result of the ERCBH2S FLASH program encountering ‘solving’ difficulties based on user inputs. First, user inputs should be reviewed for accuracy. If all inputs are correct, sometimes small changes to the inputs will help the FLASH program overcome
13 References 184

the ‘solving’ difficulties. Although the following recommended ‘alterations’ require a user to deviate from the actual ‘real’ input scenario, the deviations are very minor and would not be considered in any ERCB enforcement action. If slight alterations to a user’s inputs are necessary to help the FLASH program solve, the input changes should be noted in a letter to the ERCB that accompanies the ERCBH2S submission. Suggested input ‘alterations’ and acceptable degree of variation from ‘actual’ values:
1. Tubing or Casing Inside-Diameter affects the back pressure – first make sure the input diameter, H2S release rate and H2S concentration are reasonable. Does the cac pressure in INUTS K57 seem reasonable? Try increasing the diameter slightly. Sometimes a change of only 1 mm solves the FLASH problem. Do not change this input more than 10 %.
2. Gas Analysis – try changing some of the heavy ends. Add the C7’s to
the C6’s. If this doesn’t work, add the C7’s and C6’s, to the C5’s. If this doesn’t work, add the C7’s, C6’s and the C5’s, to the C4’s. Do not change an analysis anymore than this. While analysis changes like these do not normally affect the size of the EPZ, they may help the FLASH program to solve.
3. Temperature – if temperature was available as a user input, try
changing the temperature a few degrees. Do not change the temperature by more than a few degrees.
Version Issue
ERCBH2S was tested to operate with Excel 2000 (Excel Version 9), 2002 (Excel Version 10), 2003 (Excel Version 11), 2007 (Excel Version 12), and 2010. While every attempt has been made to ensure compatibility issues don’t arise, computer configurations vary by personal preferences and therefore compatibility issues may arise. If an issue is discovered, please report it to ERCB for inclusion in the next ERCBH2S release. There have been reported issues related to running the ERCBH2S Application with Excel 97. The ERCBH2S Application is not supported on Excel 97.
13 References 185

Installation Troubleshooting 1. Administration Privilege for Windows
During software installation, the Windows operating system may display a message regarding a requirement for Administrator Privilege to install the software. To check if you have Administrator Privilege for the account you use to Logon into Windows, follow these steps:
a. Click the Windows Start button, select Settings, choose Control Panel.
b. Double click the User Accounts icon. c. If you account Logon is displayed at the bottom of this window
with the description: Computer Administrator, you have the correct administrator privileges to install the software.
Program Troubleshooting
Not an ERCBH2S Spreadsheet
This error message may be displayed if a ERCBSLAB application menu or calculation was attempted on an Excel spreadsheet that was not a recognized ERCBSLAB spreadsheet.
General Troubleshooting
Excel Security Levels and Running the ERCBSLAB Application
If your Excel security setting is High, the ERCBH2S application may be prevented from running. You can either reset your security level to allow it
13 References 186

to run or add the ERCBH2S add-in via the Add-In manager. Check with your computer network administrator regarding security level protection and running add-in macros on your computer.
Interfacing with other User Spreadsheets
The Batch page is designed to be flexible and adaptable to user modifications for linking to in-house databases or networks. Data in the Batch page:
• can be a stand alone database for user;
• can be expressions referencing values in the user database;
• although columns cannot be created or destroyed, cells to the right of the Batch records can be modified as the user requires to link their database to this required input cells;
• rows cannot be created or destroyed due to the security protection on the datasheet. However, information in the row can be erased (cleared) and gaps between rows can be filled by moving the data in the rows up or down to accommodate the gaps;
• use of the Silent Start option allows interfacing of ERCBH2S with programs such as Crystal Ball© and @Risk©.
13 References 187

ERCBFLASH ERRORS The following error numbers may be returned from the ERCBFLASH program. These errors typically result from extreme gas compositions where chemical-physical properties are difficult to predict or where critical levels are reached and phase changes may occur. To correct the problem, the gas composition may be documented and modified slightly.
ERCBH2S
ERROR CODE ERCBFLASH ERROR CODE
DESCRIPTION
9000 0 Normal termination
9001 1 Error: Pure Helium specified Complete Data not available in database
9002 2 Bad source type specification: It can be only 1 or 2 for Pipeline or Well respectively
9003 3 Error All Input Components' Compositions are Zero
9004 4 The initial conditions of the source type not set properly
9005 5 Flash Calculation Failure Please Check the Input Data
9006 6 Failure in Bubble Temperature Calculations. Please Check the Input Data
9007 7 Cp Vapour Calculation Failure Please Check the Input Data
9008 8 Maximum Iterations Exceeded during ambient pressure critical flow checking
9009 9 Error Calculating Isentropic Back Pressure for subsonic flow
13 References 188

ERCBSLAB ERRORS The following error codes are returned from ERCBSLAB. These Error codes in ERCBH2S are prefixed by 5000.
ERCBH2S
ERROR CODE ERCBSLAB
ERROR CODE DESCRIPTION
5000 0 Normal program termination. No errors detected 5001 1 Zo <0 termination flag set. The original SLAB program used Zo
to control looping. This flag has been maintained for consistency.
5003 3 Source height too tall. Input source height (hs) is greater than the calculated mixing layer height (hmx) minus the stack half width (bs).
Invalid Input Parameter Errors 6001 1001 WMS Molar mass of source material was <=0. or >1.0 kg/mole6002 1002 CPS, Vapour heat capacity was <=100. or >10000.0 J/kg/K 6003 1003 TBP, Boiling point temperature was <=1. or >1000.0 K 6004 1004 CMEDO, Initial liquid mass fraction was <0. or >1.0 6005 1005 DHE, Heat of vaporization was <1.E2 or >1.E12 J/kg 6006 1006 CPSL, Liquid specific heat was <100. or >1.E6 J/kg/K 6007 1007 RHOSL, liquid density was <.1 or >1.E4 kg/m3 6008 1008 xxALPHA, Time factor was <0. 6009 1009 xxBETA, time constant was <0., s 6010 1010 TN, Concentration exponent for toxic load was <0. or >10. 6011 1011 TKL, Toxic load factor to account for fluctuations was <0. 6012 1012 TACH, Building air changes per hour was <0. 6013 1013 TH2S, Percent H2S in source mixture was <=0. or >100 % 6014 1014 TS, Temperature of source material was <23.K or >1273.K 6015 1015 QS, Mass source rate was <0.0 kg/s 6016 1016 AS, Source area was <0.0 m2 6017 1017 TSD, Continuous source duration was < 0 kg 6018 1018 QTIS, Instantaneous source mass released was <0. kg 6019 1019 HS, Source height was < 0 m 6020 1020 HS, Source height was < 0 m 6021 1021 XFFM, Maximum downwind distance for ERCBSLAB
calculations was <1 or > 30000 m 6022 1022 ZA, Reference height for ambient wind speed anemometer was
<1 or >100 m 6023 1023 UA, Ambient wind speed was <0 or >100 m/s 6024 1024 TA, Ambient temperature was <173K or >373K 6025 1025 RH, Relative Humidity was <0 or >100 % 6026 1026 PA, Atmospheric pressure was <60000. or >105000.0 Pa 6027 1027 STAB, Stability class number was <0 or > 7
13 References 189

FAQs Issue: Sweet pipeline tie-in to a sour gathering system.
A company is tying a sweet pipeline into one containing H2S. Since the model assumes flow from either end of the pipeline until the ESD shuts, the company assumes that there will be a possibility of H2S flowing back into the sweet line, and that therefore there could be a release. The company has tried to model this sweet line and the sour one, assuming the model will account for the backflow and provide a small EPZ for the sweet line.
Answer:
ERCBH2S only has the capability of modelling gas that contains H2S. When a company enters 0 % H2S into the model, it is forced to divide by zero, producing no answer. The key message is that the ERCB has never asked companies to account for backflow and calculate EPZs for sweet lines. The model is not built to handle that calculation. Therefore companies should assume 0 m EPZ on all sweet lines.
Issue: How do ESDs and check valves (CV) differ in the model?
A company indicates in its model that a pipeline has an ESD on one end of its line and a CV on the other end. Given that a CV immediately prevents backflow, the company assumed that any additional flow to the line between the time of a pipeline release and the time the ESD shut would only come from the end of the line where the ESD is located. However, when the company ran the model, a much larger EPZ than anticipated was predicted.
Answer:
ERCBH2S treats ESD valves and check valves the same for EPZ calculations. This means that the model assumes there could be backflow into a line, when in reality there would not be. The model was written this way for simplicity. If there is enough concern from industry, we may recommend that the model be changed.
Issue: Large EPZs on very short lines.
In some instances a line that is only 5 or 10 m in length can have EPZs several kilometres in diameter.
Answer:
13 References 190

There are three main things to look for here:
• whether the company has used mitigation or not,
• what the pressure rate of change on the ESDs is, and
• what the upstream and downstream line properties are.
The model assumes infinite flow from both upstream and downstream of a pipeline. Therefore a short line with no mitigation or a very low pressure rate of change (10 %) will have continual flow into it from both upstream and downstream. To mitigate this, the applicant must increase its pressure rate of change to ensure that the ESDs close sooner.
Issue: What does the ESD valve low pressure trigger mean?
Answer:
The low pressure trigger is the pressure set point where the ESDs on a pipeline close. The model asks companies to enter this value as a pressure value (kPa), but it is commonly discussed in terms of percentages. A low pressure trigger of 10 % means that the pipeline has to depressure to 10 % of its total operating MOP before the ESDs will close. Essentially, the pipeline must be empty before the ESDs close. This means the associated EPZ will be very large, almost equal to a case using no mitigation. A low pressure trigger of 90 % is generally unreasonable, as daily fluctuations in pipeline pressure would cause the ESDs to close. Many companies choose to use a low pressure trigger somewhere in the range of 50 %.
Issue: Lines with differing lengths having very similar EPZs.
All other input being equal, why do lines with differing lengths have virtually the same EPZ?
Answer:
The first this to do is check whether the company has modelled the lines using mitigation or not. If they have not (which will most likely be the case in these scenarios), the model assumes that the line will flow for 12 hours before the ESDs shut. If they have chosen “With Mitigation” but have a very low “low pressure trigger” (say, 10%), this is virtually the same as having no mitigation at all. The model assumes that the sections upstream and downstream of the ESD are infinite and will supply as much gas as needed until the pressure drops to the set point or the valves are closed manually. By selecting “With Mitigation” and entering values above the default, the EPZ becomes more sensitive to the line length.
Issue: The .csv file will not import into the model.
After importing, the model provides a message that states “Batch import successful! 0 records imported.”
13 References 191

Answer:
First, open the .csv file to make sure it looks correct and is the proper version (v1.19). The company may not have exported it correctly on its end. Instructions on how to export model runs are found on page 40 of the user guide. If the .csv looks correct, the company may have accidentally saved it as an Excel file. Once a model run is exported, changes cannot be made to it. If you open the .csv, change something (or not), and then press “Save,” Excel will automatically change it to Excel format. Even though the suffix is still .csv, it is actually now an Excel file. The only way to make changes to a .csv file is to import it back into the model, make changes on the input page, and then reexport it.
Issue: MOP input values.
Should the MOP values be for a sustained rate or should they include very short duration high pressure anomalies?
Answer:
The intent of the program is to calculate EPZs based on normal operating conditions, not anomalous or maintenance conditions. Therefore, all values entered should be reflective of normal operating conditions.
Issue: Companies want to use values lower than the default in the model.
There are cases where companies want to use values that are lower than the default. Specifically, they would like to use lower than 10 % for the low pressure trigger.
Answer:
The defaults in the model are there as safety measures; therefore, even if a company enters a lower value, the model will default to the higher number. If the company feels that the default is unreasonable, it can send feedback to [email protected], and ERCB staff will look at it for future model revisions. In the case of wanting a low pressure trigger less than 10 %, this number is already so low that it means the line will be virtually depressured before the ESDs close. If the company would like to use a lower value, it should choose “No Mitigation” instead.
Issue: Gas lift wells.
Answer:
13 192

Gas lift wells must be entered into the model using the release rate and H2S when the lift is operating.
Issue: Wells that are “suspended” but do not meet the requirements of Directive 013.
Answer:
As these wells have not been suspended in accordance with Directive 013, companies must use the last available flow rate and gas analysis to calculate an EPZ.
Issue: CO2 modelling
Does the model take into account hazards associated with CO2?
Answer:
The model does have an input for CO2; however, it is meant to create an EPZ for hazards associated with H2S only. If a company wishes to create a corporate-level plan to deal with CO2 hazards, it will have to do its own modelling to determine an EPZ.
Issue: Setback designation on summary page.
Why does the setback level sometimes indicate N/A?
Answer:
Setbacks only apply to sour gas pipelines with greater than 1 % H2S, not natural gas pipelines. For model runs less that 1 %, N/A appears.
Issue: Different EPZ sizes for drilling and completions.
Applicants run the model for both drilling and completions and get different results. Which .csv should be submitted with the ERP? Which EPZ should be used for the ERP?
Answer:
If it is a drilling and completions ERP, it must be based on the larger EPZ of the two operations. The .csv for the larger operation must be submitted along with the ERP.
Issue: The EPZ on the Directive 056 application is for production. Does that mean the ERP should be based on that EPZ?
13 References 193

Directive 056 requires that companies input the EPZ for the largest of (a) drilling, (b) completions/servicing, or (c) producing/suspended in the Schedule 4.3 application. In some cases, the largest EPZ will be associated with production.
Answer:
Though Directive 056 requires notification to be based on the largest zone, Directive 071 requirements are for drilling/completions only. Therefore, the ERCB does not expect a company’s drilling/completions plan to be based on a production EPZ, nor does it expect applicants to do their Directive 071 consultation out to the estimated production EPZ. The applicant will have to provide an explanation of why the EPZ in the application does not match that in the ERP.
Issue: What is the largest EPZ that the model will calculate?
Answer:
The largest EPZ the model will calculate is 30 km. Companies can change their operating procedures to try to reduce this value. Using mitigation, especially in populated areas, is strongly recommended. In remote areas, companies will have to do an analysis of whether the benefits of a reduced planning zone outweigh the costs of additional mitigation.
Issue: What release rate/release volume from the model should be used for the Directive 056 application?
There are several different release rates/release volumes in the model. Which one is the correct one to use for the licence application?
Answer:
The Land Use Setback and OLD EPZ H2S Release Rate or Volume at Licensed Conditions in column DV on the batch sheets is the number that should be used.
Issue: Low-end cut-off point for EPZ sizes.
In the old directive, there was a low-end cut off for EPZ sized. For example, if the H2S RR was below 0.01m3/s H2S, the only requirement was for a corporate ERP (and the EPZ was 0 km as the release was likely contained on lease). In the new Directive 071, it is not clear if the minimum criteria still exists.
Answer:
At this point, there is no low-end cut off other than those referred to in Directive 071. The ERCB recognizes that there are concerns around this issue and that a process will need to be created to deal with it. However, until this issue is dealt
13 References 194

with through the implementation plan (in July 2009), all EPZs are valid, regardless of size.
Issue: Expected maximum liquid flow rate of pipeline fluid.
The expected maximum liquid flow rate influences the EPZ size for the GLR<1000 model and companies are concerned that it may be difficult to derive this value for a complex system.
Answer: The operator should have this information available based on production accounting. For example, if well A is assigned flow A and well B assigned flow B, then the pipeline that is joined to each well is modelled with flows A and B respectively. At the tie-in of the two lines, the flow would just be A + B.
To be conservative, one could use the total cumulative flow rate at the discharge of the gathering system for each pipeline segment in the system. For example: Well 1 is producing 10 m3/d of oil, 5 m3/d of water, and 50 m3/d of gas Well 2 is producing 20 m3/d of oil, 10 m3/d of water, and 50 m3/d of gas Flow 1 = 15 m3/d Flow 2 = 30 m3/d Flow 3 (combined 2 & 3) = 45 m3/d So the GLR inputs are: Well 1 GLR = 50/15 Well 2 GLR = 50/30 Combined GLR = (50 + 50)/(15 + 30) = 100/45
Issue: Pipelines with larger H2S concentrations giving EPZs smaller than pipelines with smaller H2S concentrations.
All other things being equal, why would a pipeline with 60 % H2S give a smaller EPZ than one with 20 % H2S?
Answer:
The reason for this centres around buoyancy. Basically, the more H2S in a mixture, the denser it is and the less buoyant it is. Therefore, the gas would have the tendency to spread out over an area rather than disperse horizontally. In very basic terms, with 55 % H2S your plume would be more circular, with 20 % H2S it would be long and skinny.
13 References 195

Issue: New pipeline tying into an existing system. Is recalculation of the system required?
Answer:
When the directive was released, the ERCB stated that for well supplements or pipeline tie-in, the new operation has to be modelled and that EPZ adopted. The existing pipelines don't have to be modelled and the ERP does not have to be rewritten. Therefore, the ERCB does not require that the entire system be recalculated unless there is a significant change to the H2S or release volume. However, should a company choose to remodel the entire system (the ERCB always encourages being proactive), then it would have to complete its notification in accordance with the directive. This may result in a review and variance (R&V) application from local residents, which would be dealt with by the ERCB Law Branch.
13 References 196

197 13 References
13. References
Energy Resources Conservation Board (ERCB). 2010. ERCBH2S A Model for Calculating Emergency Response and Planning Zones for Sour Gas Facilities. Volume 2: Emergency Response Planning Endpoints. http://www.ercb.ca/docs/public/sourgas/eubmodelsdraft/Volume2_ERPEndPoints.pdf
Energy Resources Conservation Board (ERCB). 2010. ERCBH2S A Model for Calculating Emergency Response and Planning Zones for Sour Gas Facilities. Volume 1: Technical Reference Document Version 1.20. http://www.ercb.ca/docs/public/sourgas/eubmodelsdraft/Volume1_TechnicalReference.pdf
Energy Resources Conservation Board (ERCB). 2008. Directive 071– Emergency Preparedness and Response Requirements for the Petroleum Industry. http://www.ercb.ca/docs/documents/directives/Directive071_draft_200712.pdf