Embed Size (px)
Citation preview
BIO
PAPER
International Conference OnSoftware Testing Analysis & Review
November 4-8, 2002Anaheim, CA USA
W12
November 6, 20023:15 PM
"EXCEL-ERATING" TEST STATUS
REPORTING
Earl Burba and Jim HazenSysTest Labs

Page 1 of 1
Earl BurbaEarl has over 20 years experience in software development and testing. Earl is a SeniorProject Manager with SysTest Labs in Denver, Colorado.
Earl has worked in various positions within industry. Earl’s experience includes flightsystems, telephony, database, business and real-time embedded systems. Earl is anaward winning author, and holds patents on software testing tools and methodologies.
Jim HazenJim has 15 years experience in software development and testing. Jim is a TestEngineer with SysTest Labs in Denver, Colorado. Jim is a Certified Software TestEngineer through the Quality Assurance Institute.
Jim has worked in various capacities as a test lead / project manager, automationdeveloper, and department manager. He has worked with a wide variety of applicationson DOS, OS/2, Windows, and Web environments.
Page 1 of 14
‘Excel’erating Test Status Reporting
Jim Hazen & Earl Burba, SysTest Labs303.575.6881 [email protected] [email protected]
Extended Abstract:
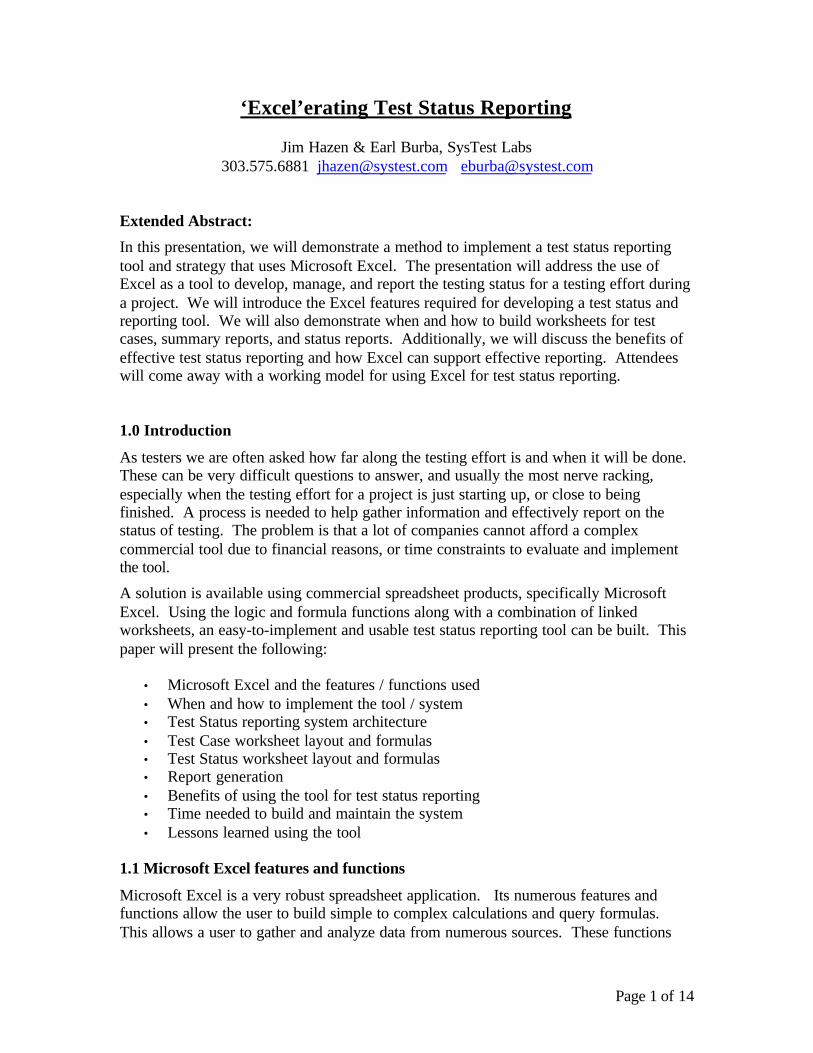
In this presentation, we will demonstrate a method to implement a test status reportingtool and strategy that uses Microsoft Excel. The presentation will address the use ofExcel as a tool to develop, manage, and report the testing status for a testing effort duringa project. We will introduce the Excel features required for developing a test status andreporting tool. We will also demonstrate when and how to build worksheets for testcases, summary reports, and status reports. Additionally, we will discuss the benefits ofeffective test status reporting and how Excel can support effective reporting. Attendeeswill come away with a working model for using Excel for test status reporting.
1.0 Introduction
As testers we are often asked how far along the testing effort is and when it will be done.These can be very difficult questions to answer, and usually the most nerve racking,especially when the testing effort for a project is just starting up, or close to beingfinished. A process is needed to help gather information and effectively report on thestatus of testing. The problem is that a lot of companies cannot afford a complexcommercial tool due to financial reasons, or time constraints to evaluate and implementthe tool.
A solution is available using commercial spreadsheet products, specifically MicrosoftExcel. Using the logic and formula functions along with a combination of linkedworksheets, an easy-to-implement and usable test status reporting tool can be built. Thispaper will present the following:
• Microsoft Excel and the features / functions used• When and how to implement the tool / system• Test Status reporting system architecture• Test Case worksheet layout and formulas• Test Status worksheet layout and formulas• Report generation• Benefits of using the tool for test status reporting• Time needed to build and maintain the system• Lessons learned using the tool
1.1 Microsoft Excel features and functions
Microsoft Excel is a very robust spreadsheet application. Its numerous features andfunctions allow the user to build simple to complex calculations and query formulas.This allows a user to gather and analyze data from numerous sources. These functions
Page 2 of 14
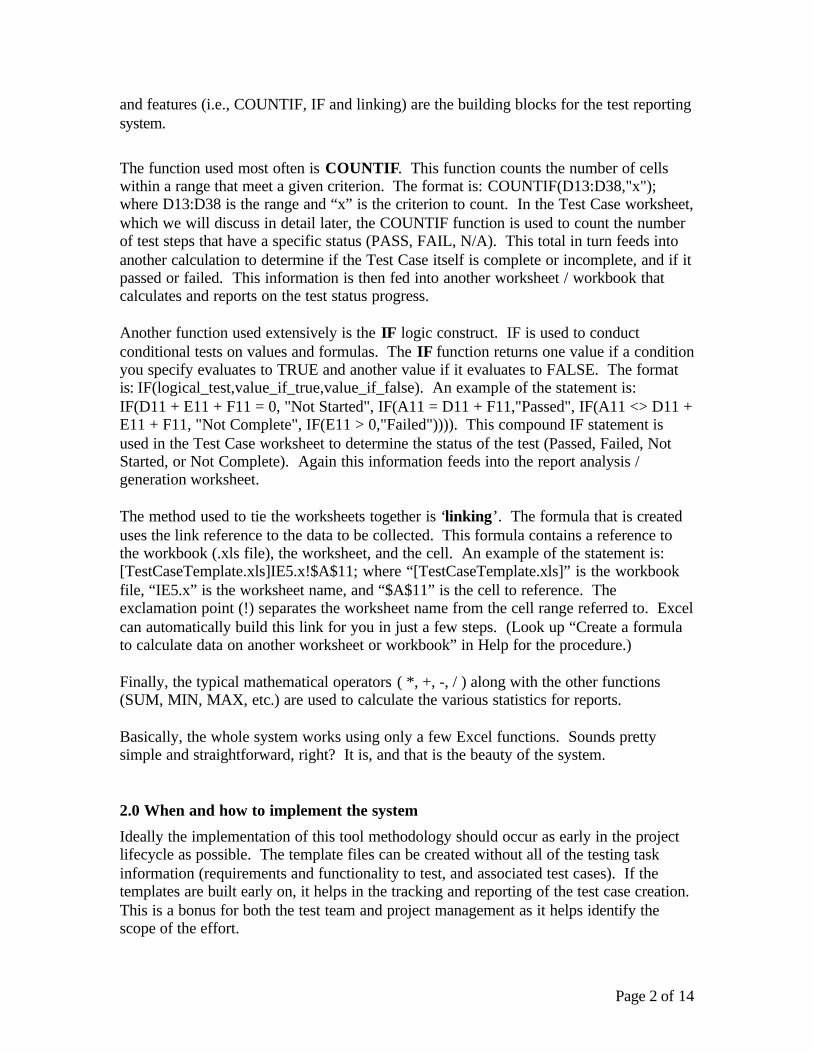
and features (i.e., COUNTIF, IF and linking) are the building blocks for the test reportingsystem.
The function used most often is COUNTIF. This function counts the number of cellswithin a range that meet a given criterion. The format is: COUNTIF(D13:D38,"x");where D13:D38 is the range and “x” is the criterion to count. In the Test Case worksheet,which we will discuss in detail later, the COUNTIF function is used to count the numberof test steps that have a specific status (PASS, FAIL, N/A). This total in turn feeds intoanother calculation to determine if the Test Case itself is complete or incomplete, and if itpassed or failed. This information is then fed into another worksheet / workbook thatcalculates and reports on the test status progress.
Another function used extensively is the IF logic construct. IF is used to conductconditional tests on values and formulas. The IF function returns one value if a conditionyou specify evaluates to TRUE and another value if it evaluates to FALSE. The formatis: IF(logical_test,value_if_true,value_if_false). An example of the statement is:IF(D11 + E11 + F11 = 0, "Not Started", IF(A11 = D11 + F11,"Passed", IF(A11 <> D11 +E11 + F11, "Not Complete", IF(E11 > 0,"Failed")))). This compound IF statement isused in the Test Case worksheet to determine the status of the test (Passed, Failed, NotStarted, or Not Complete). Again this information feeds into the report analysis /generation worksheet.
The method used to tie the worksheets together is ‘linking’. The formula that is createduses the link reference to the data to be collected. This formula contains a reference tothe workbook (.xls file), the worksheet, and the cell. An example of the statement is:[TestCaseTemplate.xls]IE5.x!$A$11; where “[TestCaseTemplate.xls]” is the workbookfile, “IE5.x” is the worksheet name, and “$A$11” is the cell to reference. Theexclamation point (!) separates the worksheet name from the cell range referred to. Excelcan automatically build this link for you in just a few steps. (Look up “Create a formulato calculate data on another worksheet or workbook” in Help for the procedure.)
Finally, the typical mathematical operators ( *, +, -, / ) along with the other functions(SUM, MIN, MAX, etc.) are used to calculate the various statistics for reports.
Basically, the whole system works using only a few Excel functions. Sounds prettysimple and straightforward, right? It is, and that is the beauty of the system.
2.0 When and how to implement the system
Ideally the implementation of this tool methodology should occur as early in the projectlifecycle as possible. The template files can be created without all of the testing taskinformation (requirements and functionality to test, and associated test cases). If thetemplates are built early on, it helps in the tracking and reporting of the test case creation.This is a bonus for both the test team and project management as it helps identify thescope of the effort.
Page 3 of 14
In our experience the system is implemented following the completion of the test plan.
The implementation of the system is very straightforward.
1. Create a repository on the network. This is just a directory/folder that everyonehas access to. All interested parties will need access to the information.
2. Build the Test Status Tracking System for your project from the template files.
a) The first template to be modified is the Test Case template. The templateshould be populated with all of the desired test cases, without modifying theformulas and functions.
b) The next will be the Test Status template. This template should be modifiedto track the test cases appropriately as they are completed.
3. Link the worksheet templates together. The test cases and their data will need tobe associated to the status worksheet.
4. Finally, begin building actual test cases and update/add them into the test statusworksheet. Again, this is a very straightforward approach.
2.1 Test Status System Architecture
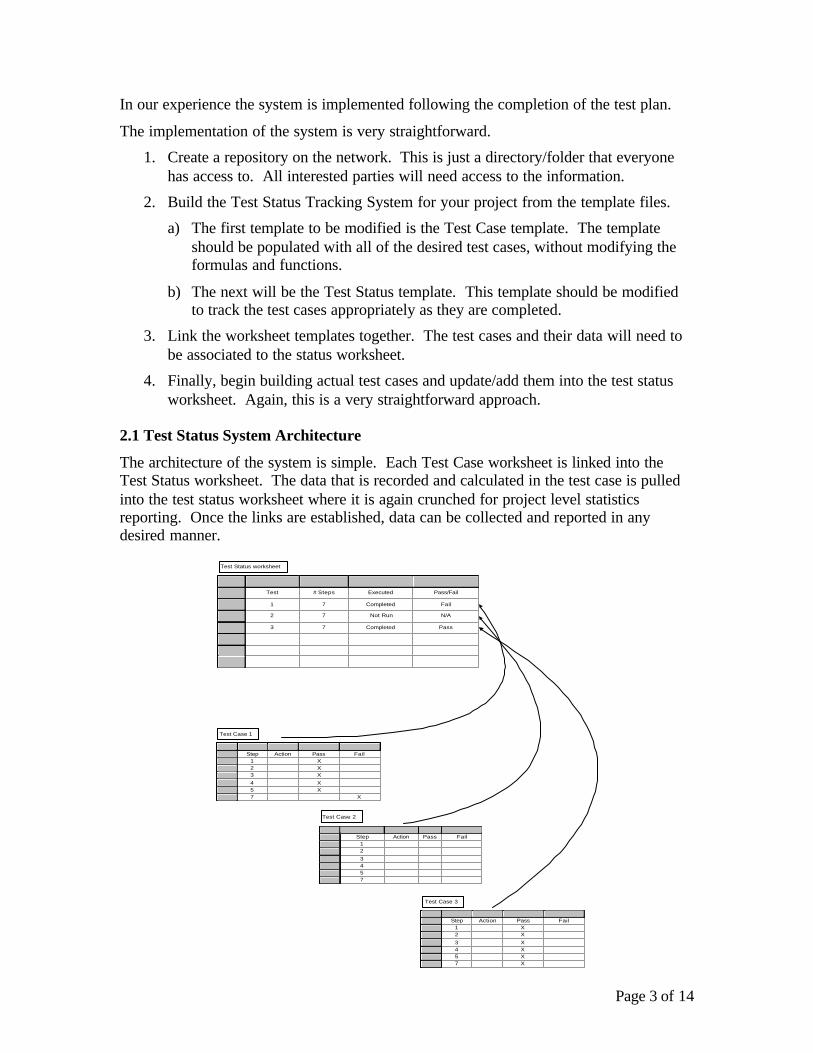
The architecture of the system is simple. Each Test Case worksheet is linked into theTest Status worksheet. The data that is recorded and calculated in the test case is pulledinto the test status worksheet where it is again crunched for project level statisticsreporting. Once the links are established, data can be collected and reported in anydesired manner.
Test # Steps
1
2
3
7
7
Executed
Completed
Not Run
Completed
Pass/Fail
Fail
N/A
Pass
7
Step Action123
457
PassXXX
XX
Fail
X
Step Action12
3457
Pass Fail
Step Action12
3457
PassXX
XXXX
Fail
Test Status worksheet
Test Case 1
Test Case 2
Test Case 3
Page 4 of 14
2.2 Test Case Worksheet
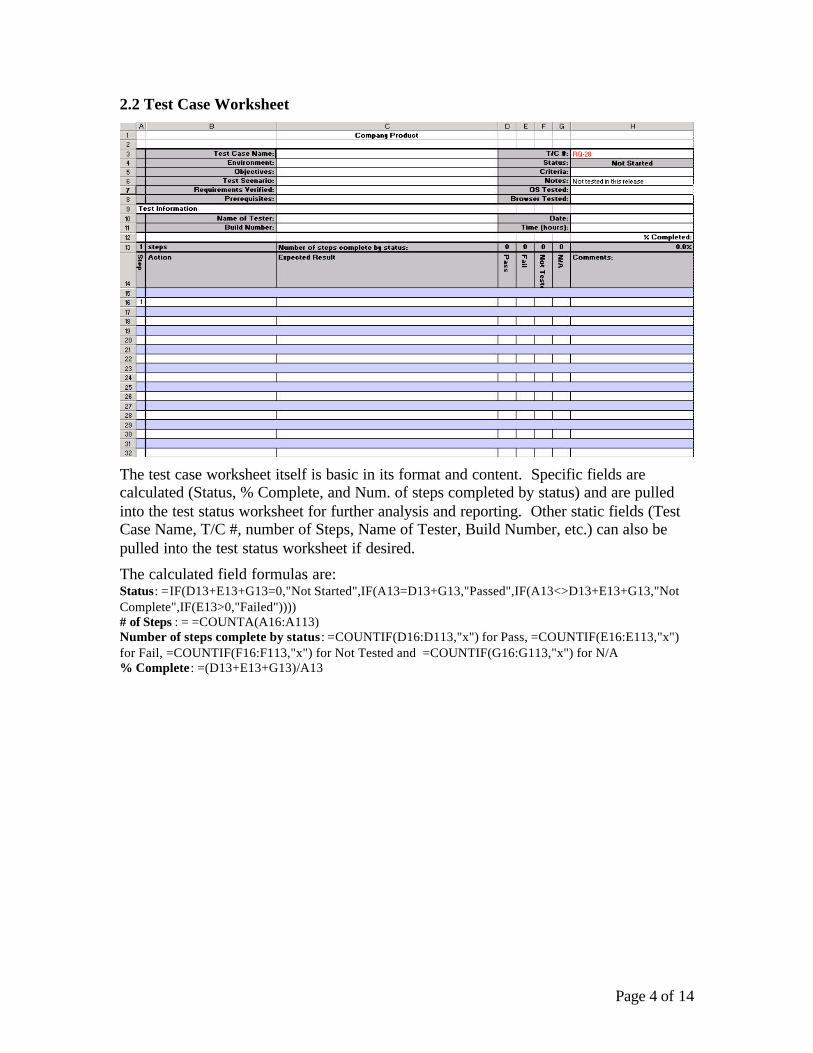
The test case worksheet itself is basic in its format and content. Specific fields arecalculated (Status, % Complete, and Num. of steps completed by status) and are pulledinto the test status worksheet for further analysis and reporting. Other static fields (TestCase Name, T/C #, number of Steps, Name of Tester, Build Number, etc.) can also bepulled into the test status worksheet if desired.
The calculated field formulas are:Status: =IF(D13+E13+G13=0,"Not Started",IF(A13=D13+G13,"Passed",IF(A13<>D13+E13+G13,"NotComplete",IF(E13>0,"Failed"))))# of Steps : = =COUNTA(A16:A113)Number of steps complete by status : =COUNTIF(D16:D113,"x") for Pass, =COUNTIF(E16:E113,"x")for Fail, =COUNTIF(F16:F113,"x") for Not Tested and =COUNTIF(G16:G113,"x") for N/A% Complete: =(D13+E13+G13)/A13
Page 5 of 14
2.3 Test Status worksheet
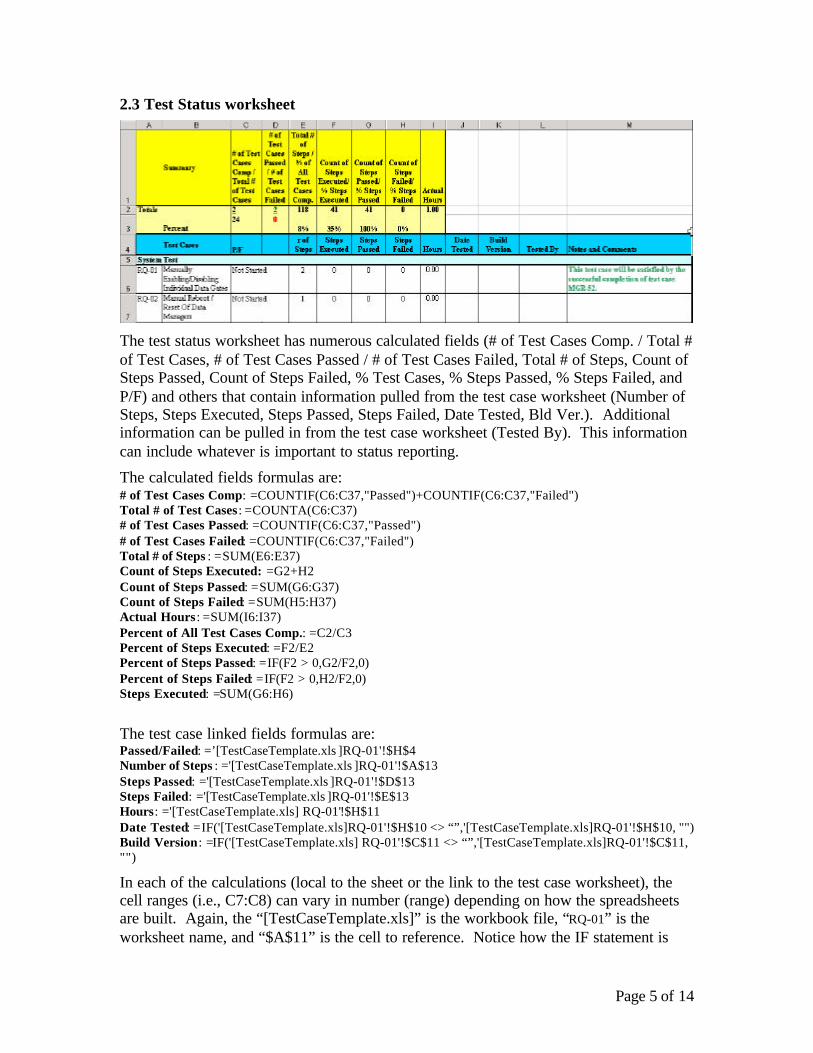
The test status worksheet has numerous calculated fields (# of Test Cases Comp. / Total #of Test Cases, # of Test Cases Passed / # of Test Cases Failed, Total # of Steps, Count ofSteps Passed, Count of Steps Failed, % Test Cases, % Steps Passed, % Steps Failed, andP/F) and others that contain information pulled from the test case worksheet (Number ofSteps, Steps Executed, Steps Passed, Steps Failed, Date Tested, Bld Ver.). Additionalinformation can be pulled in from the test case worksheet (Tested By). This informationcan include whatever is important to status reporting.
The calculated fields formulas are:# of Test Cases Comp: =COUNTIF(C6:C37,"Passed")+COUNTIF(C6:C37,"Failed")Total # of Test Cases : =COUNTA(C6:C37)# of Test Cases Passed: =COUNTIF(C6:C37,"Passed")# of Test Cases Failed: =COUNTIF(C6:C37,"Failed")Total # of Steps : =SUM(E6:E37)Count of Steps Executed: =G2+H2Count of Steps Passed: =SUM(G6:G37)Count of Steps Failed: =SUM(H5:H37)Actual Hours: =SUM(I6:I37)Percent of All Test Cases Comp.: =C2/C3Percent of Steps Executed: =F2/E2Percent of Steps Passed: =IF(F2 > 0,G2/F2,0)Percent of Steps Failed: =IF(F2 > 0,H2/F2,0)Steps Executed: =SUM(G6:H6)
The test case linked fields formulas are:Passed/Failed: =’[TestCaseTemplate.xls ]RQ-01'!$H$4Number of Steps : ='[TestCaseTemplate.xls ]RQ-01'!$A$13Steps Passed: ='[TestCaseTemplate.xls ]RQ-01'!$D$13Steps Failed: ='[TestCaseTemplate.xls ]RQ-01'!$E$13Hours: ='[TestCaseTemplate.xls] RQ-01'!$H$11Date Tested: =IF('[TestCaseTemplate.xls]RQ-01'!$H$10 <> “”,'[TestCaseTemplate.xls]RQ-01'!$H$10, "")Build Version: =IF('[TestCaseTemplate.xls] RQ-01'!$C$11 <> “”,'[TestCaseTemplate.xls]RQ-01'!$C$11,"")
In each of the calculations (local to the sheet or the link to the test case worksheet), thecell ranges (i.e., C7:C8) can vary in number (range) depending on how the spreadsheetsare built. Again, the “[TestCaseTemplate.xls]” is the workbook file, “RQ-01” is theworksheet name, and “$A$11” is the cell to reference. Notice how the IF statement is
Page 6 of 14
used to either get data from the test case worksheet (as in Build Version) or calculate avalue based on other cells in the status worksheet.
Presented here is the core functionality, and it can be expanded upon based on need.
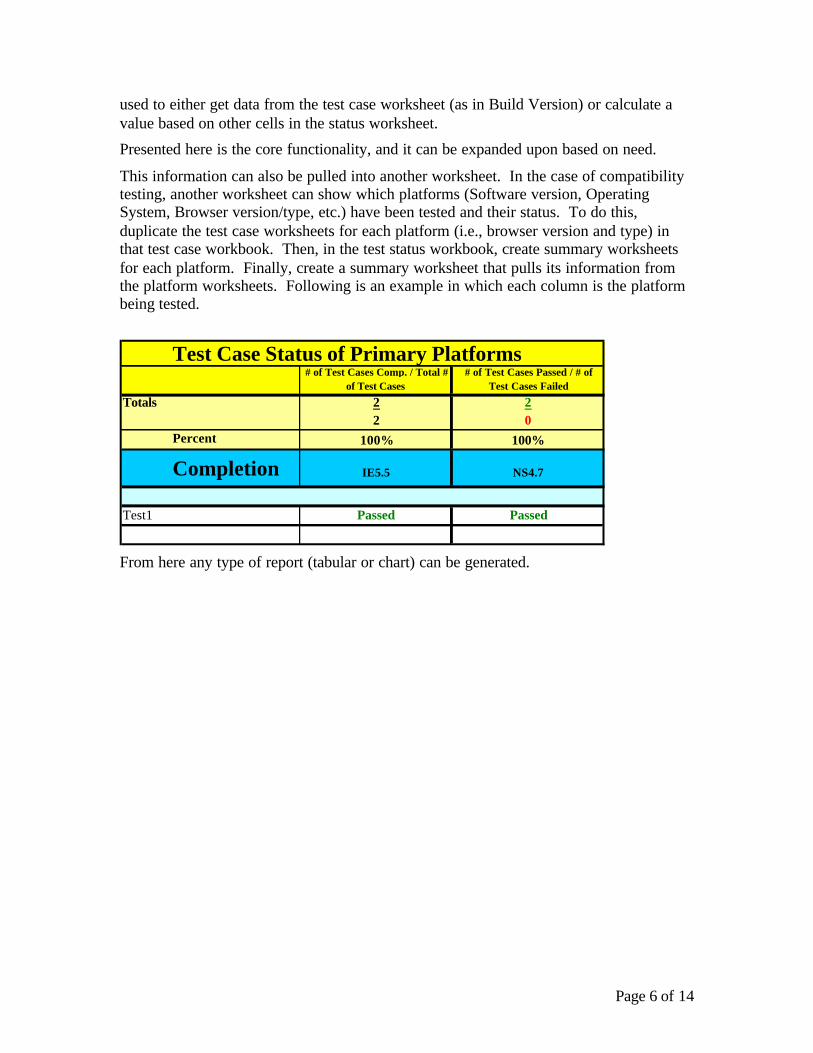
This information can also be pulled into another worksheet. In the case of compatibilitytesting, another worksheet can show which platforms (Software version, OperatingSystem, Browser version/type, etc.) have been tested and their status. To do this,duplicate the test case worksheets for each platform (i.e., browser version and type) inthat test case workbook. Then, in the test status workbook, create summary worksheetsfor each platform. Finally, create a summary worksheet that pulls its information fromthe platform worksheets. Following is an example in which each column is the platformbeing tested.
From here any type of report (tabular or chart) can be generated.
Test Case Status of Primary Platforms# of Test Cases Comp. / Total #
of Test Cases# of Test Cases Passed / # of
Test Cases Failed
Totals 2 22 0
Percent 100% 100%
Completion IE5.5 NS4.7
Test1 Passed Passed
Page 7 of 14
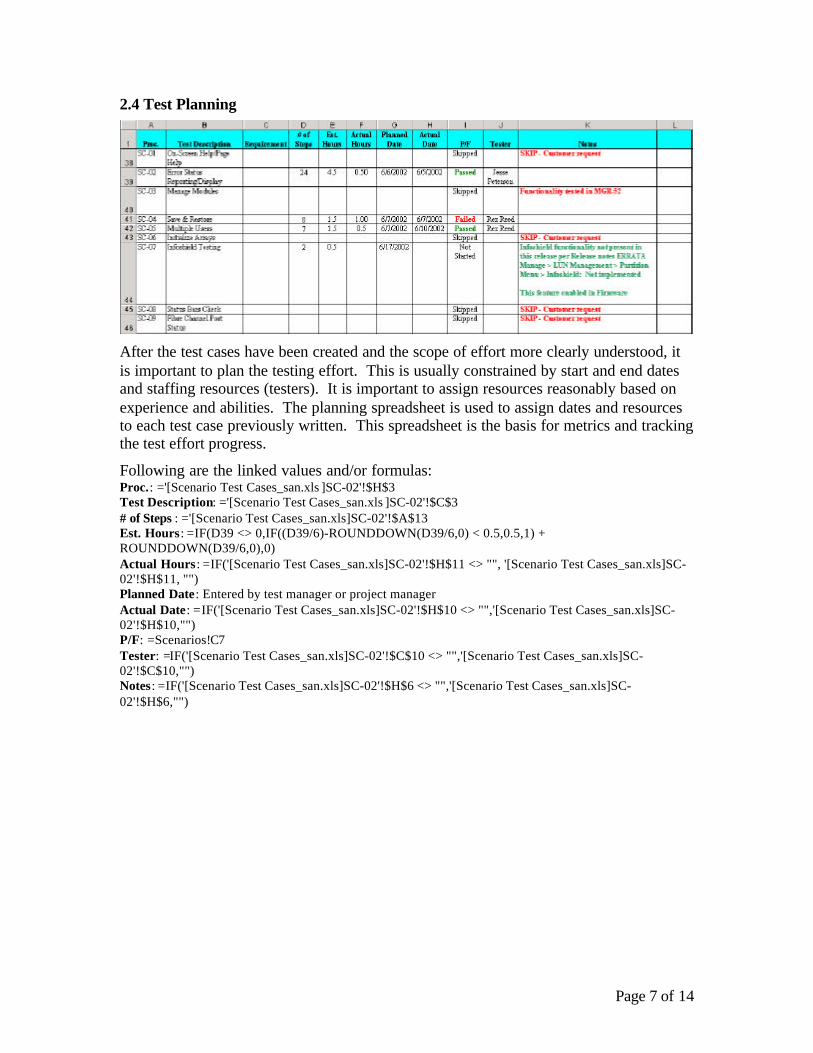
2.4 Test Planning
After the test cases have been created and the scope of effort more clearly understood, itis important to plan the testing effort. This is usually constrained by start and end datesand staffing resources (testers). It is important to assign resources reasonably based onexperience and abilities. The planning spreadsheet is used to assign dates and resourcesto each test case previously written. This spreadsheet is the basis for metrics and trackingthe test effort progress.
Following are the linked values and/or formulas:Proc.: ='[Scenario Test Cases_san.xls ]SC-02'!$H$3Test Description: ='[Scenario Test Cases_san.xls ]SC-02'!$C$3# of Steps : ='[Scenario Test Cases_san.xls]SC-02'!$A$13Est. Hours: =IF(D39 <> 0,IF((D39/6)-ROUNDDOWN(D39/6,0) < 0.5,0.5,1) +ROUNDDOWN(D39/6,0),0)Actual Hours: =IF('[Scenario Test Cases_san.xls]SC-02'!$H$11 <> "", '[Scenario Test Cases_san.xls]SC-02'!$H$11, "")Planned Date: Entered by test manager or project managerActual Date: =IF('[Scenario Test Cases_san.xls]SC-02'!$H$10 <> "",'[Scenario Test Cases_san.xls]SC-02'!$H$10,"")P/F: =Scenarios!C7Tester: =IF('[Scenario Test Cases_san.xls]SC-02'!$C$10 <> "",'[Scenario Test Cases_san.xls]SC-02'!$C$10,"")Notes: =IF('[Scenario Test Cases_san.xls]SC-02'!$H$6 <> "",'[Scenario Test Cases_san.xls]SC-02'!$H$6,"")
Page 8 of 14
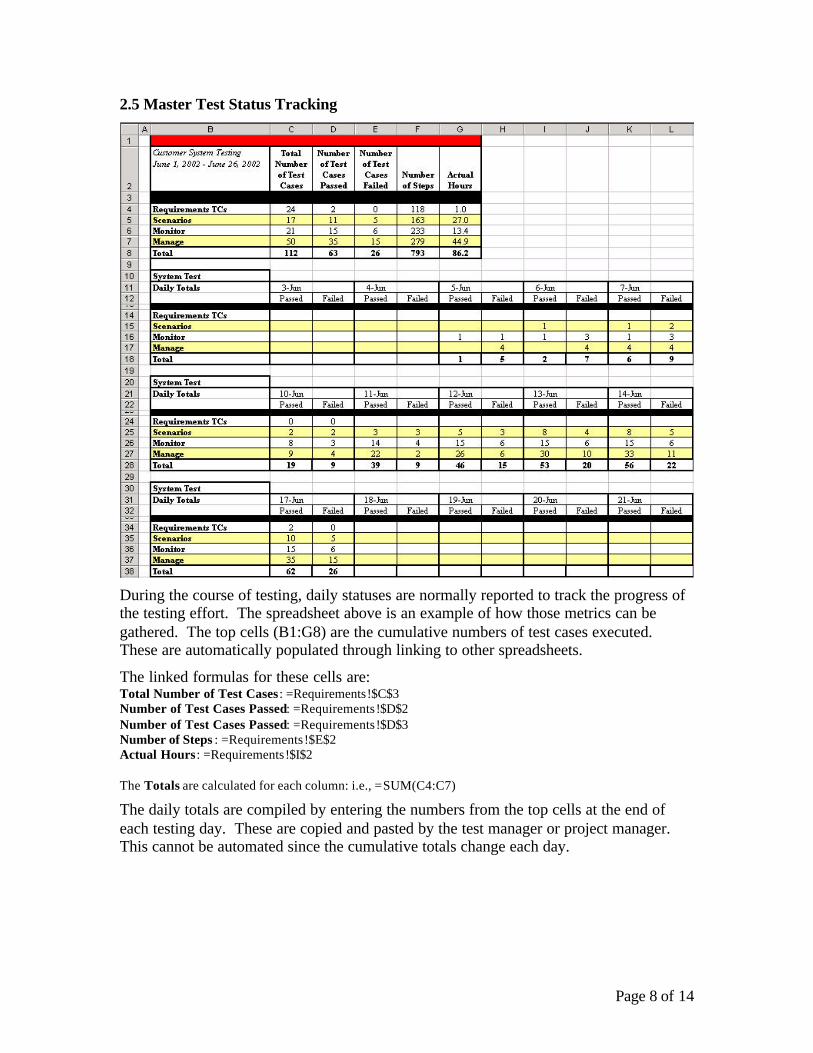
2.5 Master Test Status Tracking
During the course of testing, daily statuses are normally reported to track the progress ofthe testing effort. The spreadsheet above is an example of how those metrics can begathered. The top cells (B1:G8) are the cumulative numbers of test cases executed.These are automatically populated through linking to other spreadsheets.
The linked formulas for these cells are:Total Number of Test Cases : =Requirements!$C$3Number of Test Cases Passed: =Requirements!$D$2Number of Test Cases Passed: =Requirements!$D$3Number of Steps : =Requirements!$E$2Actual Hours: =Requirements!$I$2
The Totals are calculated for each column: i.e., =SUM(C4:C7)
The daily totals are compiled by entering the numbers from the top cells at the end ofeach testing day. These are copied and pasted by the test manager or project manager.This cannot be automated since the cumulative totals change each day.
Page 9 of 14
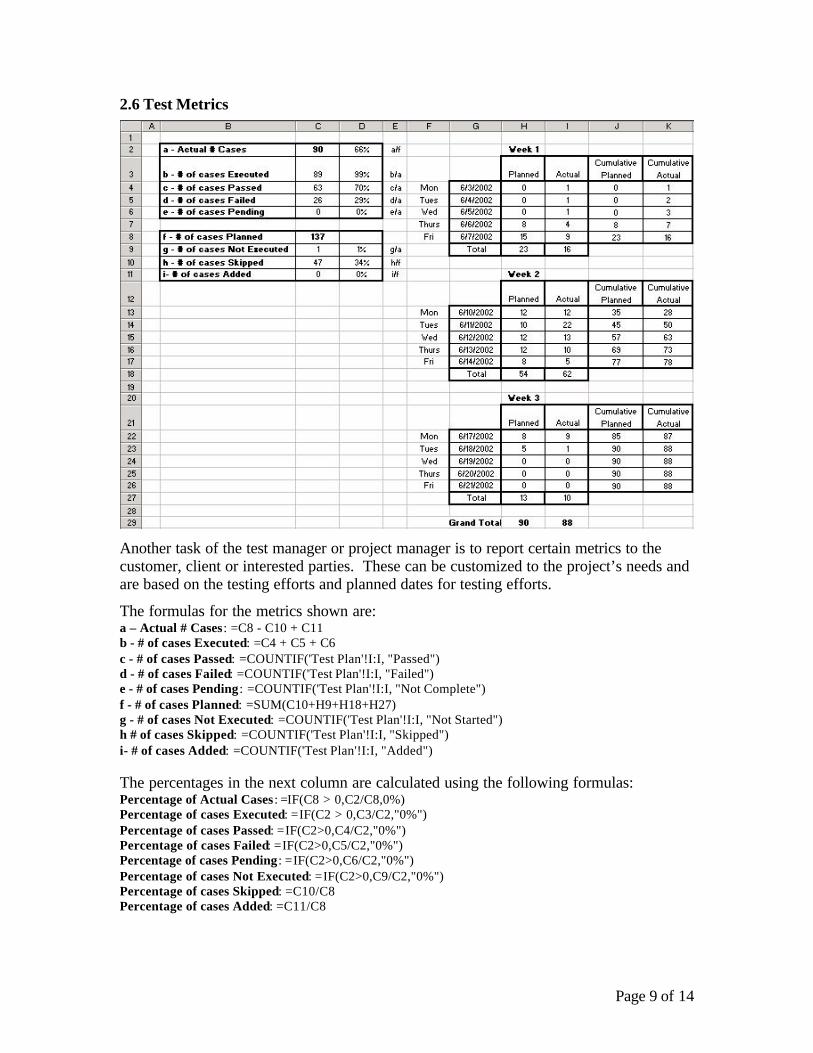
2.6 Test Metrics
Another task of the test manager or project manager is to report certain metrics to thecustomer, client or interested parties. These can be customized to the project’s needs andare based on the testing efforts and planned dates for testing efforts.
The formulas for the metrics shown are:a – Actual # Cases: =C8 - C10 + C11b - # of cases Executed: =C4 + C5 + C6c - # of cases Passed: =COUNTIF('Test Plan'!I:I, "Passed")d - # of cases Failed: =COUNTIF('Test Plan'!I:I, "Failed")e - # of cases Pending : =COUNTIF('Test Plan'!I:I, "Not Complete")f - # of cases Planned: =SUM(C10+H9+H18+H27)g - # of cases Not Executed: =COUNTIF('Test Plan'!I:I, "Not Started")h # of cases Skipped: =COUNTIF('Test Plan'!I:I, "Skipped")i- # of cases Added: =COUNTIF('Test Plan'!I:I, "Added")
The percentages in the next column are calculated using the following formulas:Percentage of Actual Cases : =IF(C8 > 0,C2/C8,0%)Percentage of cases Executed: =IF(C2 > 0,C3/C2,"0%")Percentage of cases Passed: =IF(C2>0,C4/C2,"0%")Percentage of cases Failed: =IF(C2>0,C5/C2,"0%")Percentage of cases Pending : =IF(C2>0,C6/C2,"0%")Percentage of cases Not Executed: =IF(C2>0,C9/C2,"0%")Percentage of cases Skipped: =C10/C8Percentage of cases Added: =C11/C8
Page 10 of 14
The second part of this spreadsheet is the Planned vs. Actual test case execution metric.This metric reports how close the project is to being on its planned target. If the numbersof test cases being executed are not within tolerance bands, management should benotified immediately. Also, this set of metrics can be used for future planning ashistorical evidence (i.e., how many modules of this type can potentially be tested perday). The dates in the formulas for the Planned and Actual columns are entered based onthe testing period and must be entered appropriately for the task. It should be noted thatthese numbers will be used in the customized graphical charts that the client, customerand/or management sees (Section 3.0 Report Generation).
The formulas for Week 1 day 6/7/2002 of our example are as follows:Planned: =COUNTIF('Test Plan'!G:G, "6/7")Actual: =COUNTIF('Test Plan'!H:H, "6/7")Cumulative Planned: =SUM(J7+H8)Cumulative Actual : =SUM(K7+I8)
Page 11 of 14
3.0 Report Generation
The test summary spreadsheets themselves are used as the standard reports. Most people(management and other groups outside of Test/QA) want to know how many tests passedand failed, how many tests have been executed, and how many are left to execute. Theymay also want to know who executed them or who is assigned to execute them. This lastitem helps in keeping tests assigned to staff and ensuring that the tests are being executedin a timely fashion. There is nothing worse than at the end of a project realizing animportant test was not executed because it fell through the cracks, or that an importantplatform was not tested.
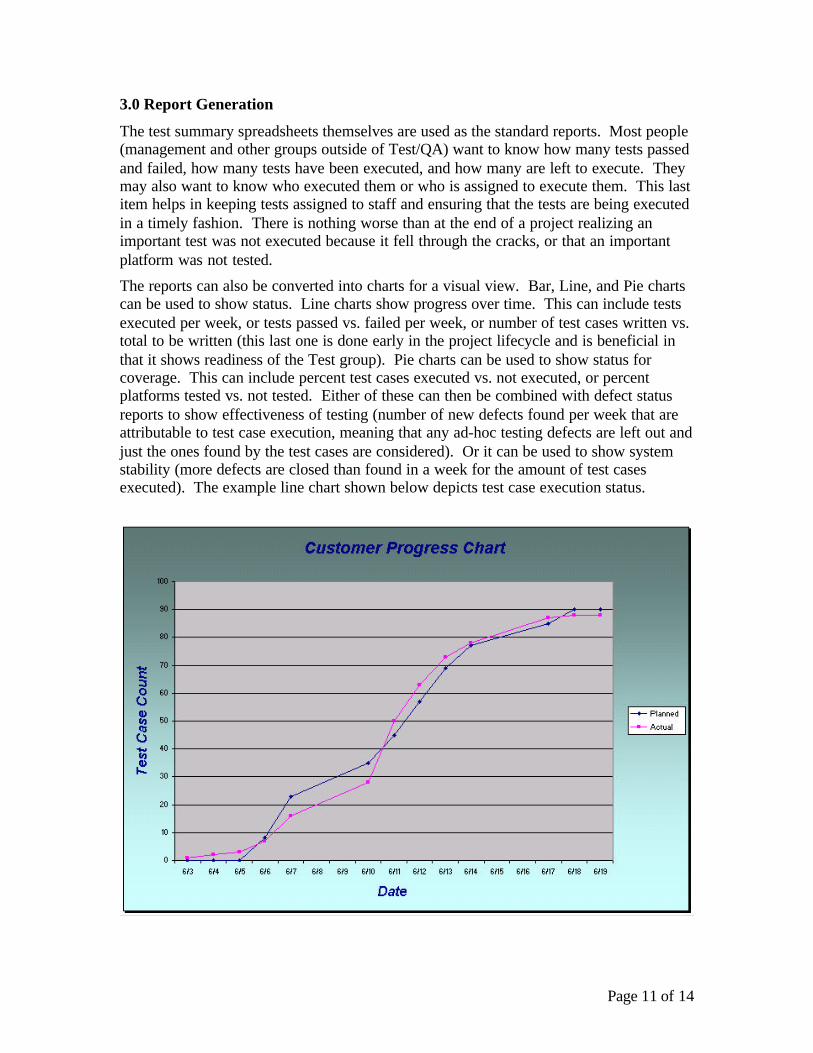
The reports can also be converted into charts for a visual view. Bar, Line, and Pie chartscan be used to show status. Line charts show progress over time. This can include testsexecuted per week, or tests passed vs. failed per week, or number of test cases written vs.total to be written (this last one is done early in the project lifecycle and is beneficial inthat it shows readiness of the Test group). Pie charts can be used to show status forcoverage. This can include percent test cases executed vs. not executed, or percentplatforms tested vs. not tested. Either of these can then be combined with defect statusreports to show effectiveness of testing (number of new defects found per week that areattributable to test case execution, meaning that any ad-hoc testing defects are left out andjust the ones found by the test cases are considered). Or it can be used to show systemstability (more defects are closed than found in a week for the amount of test casesexecuted). The example line chart shown below depicts test case execution status.
Page 12 of 14
4.0 Benefits of using the tool
Although there is some initial preliminary setup required and maintenance is neededto allow for changes in testing scope, many benefits can be realized by implementingthis type of method.
• This method allows higher accuracy of reporting testing status. Because the toolis automated and the format is standardized, the chance for miscalculation isminimized, with no direct interaction from tester.
• It provides earlier warning if the project / test effort is in trouble or off-track.
• Individual or project progress can be tracked, allowing for better estimates ofcompletion dates, percentages complete, rates of failure etc.
• Results can easily be incorporated into daily and project reports in otherdocuments. This saves time and effort on the part of the test manager and otherinterested parties.
• The data is in a centralized repository and is more accessible.
• It saves time and money. Because Excel is part of Microsoft Office, it is readilyavailable, and the cost of the system is in the time spent to build it. No othersoftware is needed. There isn’t any ramp up time to learn or develop a third partytool.
Page 13 of 14
5.0 Summary
Using Excel as an alternative to a third party tool is a viable solution for companies whodo not have the time or the budget to implement other tools. Utilizing its built-infunctions and formulas, and a little bit of inspiration, a customized and flexible test statusreporting system can be built. With the information presented here, anyone can jumpstartthe implementation process.
We have found, out of necessity, that proper test management and status reporting arevital to the success of a project. By using the test status system we have saved ourselvestime and money, increased our reporting accuracy, and kept our testing projects undercontrol.

Page 14 of 14
Author(s) Biography:
Jim Hazen - Jim has 15 years experience in software development and testing. Jim is aTest Engineer with SysTest Labs in Denver, Colorado. Jim is a Certified Software TestEngineer through the Quality Assurance Institute.
Jim has worked in various capacities as a test lead / project manager, automationdeveloper, and department manager. He has worked with a wide variety of applicationson DOS, OS/2, Windows, and Web environments.
Earl Burba – Earl has over 20 years experience in software development and testing.Earl is a Senior Project Manager with SysTest Labs in Denver, Colorado.
Earl has worked in various positions within industry. Earl’s experience includes flightsystems, telephony, database, business and real-time embedded systems. Earl is an awardwinning author, and holds patents on software testing tools and methodologies.