Embed Size (px)
Citation preview

Erasmus University RotterdamErasmus School of EconomicsBachelor thesis Financial EconomicsP.W. Boxhoorn 280462Supervisor. Dr. W. De Maeseneire
Value-drivers and valuation in professional sports: A European-American comparison
September 2009

Table of contents1. Introduction.............................................................................................................................32. Description of environment....................................................................................................5
2.1 Economic comparison of professional sports...................................................................52.2 Organizational comparison of professional sports............................................................5
2.2.1 Similarities.................................................................................................................72.2.2 Differences.................................................................................................................7
2.3 Goal comparison of team owners in professional sports..................................................93. Focus on two particular leagues............................................................................................10
3.1 Major League Baseball...................................................................................................103.1.1 Structure...................................................................................................................103.1.2 Financial overview...................................................................................................103.1.3 Ownership................................................................................................................11
3.2 European Football...........................................................................................................133.2.1 Structure...................................................................................................................133.2.2 Financial overview...................................................................................................133.2.3 Ownership................................................................................................................15
4. Creating value in sports........................................................................................................174.1 Common revenue drivers................................................................................................17
4.1.1 Broadcasting revenue...............................................................................................174.1.2 Stadium and ticket revenues....................................................................................184.1.3 Sponsorship and merchandising revenues...............................................................18
4.2 League specific revenue drivers......................................................................................194.2.1 Naming rights...........................................................................................................194.2.2 Transfer fees.............................................................................................................19
4.3 Common cost drivers......................................................................................................204.4 League specific cost drivers............................................................................................20
5. Valuation...............................................................................................................................215.1 Valuation methods..........................................................................................................21
5.1.1 Asset-based approach...............................................................................................215.1.2 Income based approach............................................................................................215.1.3 Market based approach............................................................................................23
5.2 Valuation obstacles.........................................................................................................245.2.1 Information shortages..............................................................................................255.2.2 Cash flows and the WACC......................................................................................255.2.3 Business units...........................................................................................................265.2.4 Relative valuation....................................................................................................265.2.5 Valuation of intangibles...........................................................................................27
5.3 Valuation methods choice...............................................................................................275.3.1 European football.....................................................................................................275.3.2 Major League Baseball............................................................................................28
6. Behavioral aspects of potential team owners........................................................................297. Intermezzo.............................................................................................................................318. Risk factors...........................................................................................................................329. Value drivers.........................................................................................................................4110. Conclusion..........................................................................................................................54References.................................................................................................................................55
2

1. Introduction
Sports has many functions in society, it is used for social interaction, entertainment purposes
and staying in shape. Most individuals will come in contact with sports during their daily lives
in some form. A smaller part of the population has actually chosen a certain sport which they
practice professionally. These sport practitioners earn income by playing for professional
teams such as football or baseball, or individually by competing in tennis or auto sports.
Recently some European football clubs like Real Madrid and Manchester City hit the news
headlines. These clubs decided to spend millions on new player transfer and salaries.
Meanwhile, Europe is in the midst of full blown recession with many of its inhabitants
struggeling to hold on to their jobs. Backed by the owner’s deep pockets, players have been
transferred for previously unimaginable amounts. The signing of Portuguese winger
Christiano Ronaldo cost Real Madrid EUR 94m. Another example was the contract offer
made to Barcelona’s striker Samuel Eto’o by Manchester City, rumoured to be GBP 190.000
a week.
This thesis focuses on professional sport teams, which are run like companies and can
genuinely be called businesses. Annually firms such as Forbes Magazine and Deloitte publish
studies which put a value tag on well known teams in North America and Europe. The
valuation methodology which determine these figures is unfortunately not available to the
reader of these publications. This thesis tries to bridge this gap and answer the following
research question.
´How can value be assessed in professional sports?´
The question will be answered through two methods of research. First an extensive
descriptive study of literature will be presented, which will offer the potential reader an
overview of the most important aspects of professional sports. Throughout this part, the
situations in North America and Europe will be compared. The second part will be an
empirical study into the two parts of the literature which did not provide adequate clarity. By
performing regression analysis value drivers in Major League Baseball (MLB) will be
uncovered. Furthermore a detailed investigations into offering memoranda will try to present
risk factors which British football club face.
This thesis will shed light on several important features of professionalised sports on both
sides of the Atlantic. Besides the fact that both continents have different preferences when it
3

comes to sports, their organisational structure is also very different. For example, relegation is
an unseen phenomenon in America, while relocation is unheard of in Europe. Other
differences can be detected when analysing the goals of team owners. The way in which
owners see their team as a potential profitable business varies to a great degree. Earning
revenues is important in order to take a team to the next level and both sport markets share
identical sources of revenue. However a specific European source of income are fees paid for
players who transfer between clubs. The comparison of two kinds of professional sports will
show that certain league characteristics have a huge influence on the financial stability of
professional teams. Subsequent valuation of these teams is a tough task due to the lack of
publicly available information and the dependence on comparable analysis. Behavioural
aspects also play an important role in modern day sports, with a rising number of billionaires
deciding to buy professional soccer teams. The first empirical part of this thesis will show,
that in terms of risk factors in professional sports, special attention must be attributed to the
human factor. Players and personnel are the vital ingredients for success. Another empirical
study will show that uncovering significant value drivers in Major League Baseball is not an
easy task due to the nature of the variables used. Moreover, not all explanatory factors, which
are found, provide an obvious and interpretable explanation of their influence on value.
The contribution of this thesis is the fact that it gives a carefully assembled summary of
available literature into this specific business. It adds to that a comparison of two major
markets and empirical studies which can help valuators better understand the dynamics and
complexity of the professional sports business. Readers on both sides of the Atlantic can use
this knowledge to improve their valuation processes.
The remainder of this thesis is structured as follows. Section 2 provides a description of the
professional sports environment. Sections 3 & 4 focus on MLB and European football,
providing an overview of organisational structure and revealing the main business drivers.
Section 5 provides the basics on valuation, while section 6 touches upon behavioural aspects.
Section 7 summarizes the development of research so far and introduces the empirical work
of section 8 and 9. Section 10 summarises and concludes this thesis on valuation in
professional sports.
4

2. Description of environment
Sport culture is very different when comparing the two largest continents in the northern
hemisphere. Focusing on team sports rather than individual sports is essential in order to value
the organisation behind these teams. Before making an in-depth analysis of a specific
professional sport franchise, a broad overview of the business is helpful.
2.1 Economic comparison of professional sports
Most of Europe thrives on soccer, which is by far its most popular sport with the highest
number of spectators. In the US there is a fierce competition between Major League Baseball
(MLB), NFL (American football), NBA (basketball) and NHL (ice hockey). Soccer (football),
united in MLS has only just started out in 1994 and plays a smaller role in the
professionalized sports arena. There are, of course, all kinds of other professionalized sports
in Europe, but their magnitude does not add up to its American counterparts.
Table 1 gives us a rough overview of some interesting numbers concerning the US sports
industry. With an estimated size of USD 411bn yearly it is comparable to the GDP of a
country like Austria1. When taking a closer look into the above mentioned leagues, Plunkett
Research estimates their total revenue at USD 17.8bn2.
A detailed look into the scope of European soccer is somewhat more difficult, due to its
dispersion over countries and leagues. According to Deloitte’s Annual Review of Football
Finance 2008, the total turnover in the European market was EUR 13.6bn in 06/07 season.
Within Europe, its biggest leagues3 create approximately half of these revenues.
Comparing the two continents gives the impression that football dominates the European
market and is larger than the four major sports in the US.
2.2 Organizational comparison of professional sports
The previous section has already stated that professionalised sports has economic
significance. Organizational structure of a certain branch of professional sports is essential for
its survival. Without this structure competition cannot be created and spectators would have
nothing to cheer about. There are some common characteristics in organizational format
which are seen on both sides of the Atlantic, but most features are organised differently.
1 According to data retrieved from the website of the International Monetary Fund2 Total revenue of MLB, NFL, NHL and NBA added together.3 Being: English Premier League, Italian Serie A, Spanish La Liga, German Bundesliga and the French Ligue 1.
5

Table 1: US sports statistics
Source: Plunkett Research
6

2.2.1 Similarities
In order to create a product that customers will want to consume a certain structure is needed.
Therefore the last 100 years, leagues have been created in professional sports. Examples are
the National Football League in American football, Premier League in English soccer but also
in individualised sports like auto sports and tennis. This phenomenon is one that can been
detected worldwide.
Usage of leagues
Leeds & von Allmen (2008) have identified four reasons for the creation of leagues. They are
to: set rules, promote competitive balance & share revenue, limit entry and market their
product. According to them these are the ingredients for making a good product and
subsequent revenue in sports. Creating a product in sports is having two clubs compete for
some result. If an organisation does not perform the above mentioned tasks, there will be no
incentive for spectators to watch a game. This due to lack of competition, attractiveness and
tension.
The creation of a league creates interdependencies between participants and potential conflict
in goals. When discussing interdependencies Cooke (1994) puts it this way: teams not only
depend upon the existence of other teams to play against but also teams which can provide
opposition that is attractive to spectators on a regular basis. The above quote makes the case
for organising professionalised sports the way it is currently done around the world.
2.2.2 Differences
Sandy, Sloane and Rosentraub (2004) and Cooke (1994) recognise several organisational
differences between the US and European professionalised sport structures. Examples of
these are possibility of relocation, relegation and participation in multiple (international)
leagues.
Relocation
In the history of American professionalised sports, certain franchises have moved around the
country quite a bit. Sandy et al. (2004) mentions profitable new locations, under-provision of
teams and public-sector support as the reasons for relocations. It does not need mentioning
that the US market is geographically larger and demographically more diverse than the
European counterpart.
7

Relegation
Relegation is a typical European practice, which is not observed in the US. It comes down to
being demoted to a lower less prestigious league with teams of less quality and revenue, due
to poor on-field performance. Besides the emotional aspects for fans, relegation also has
financial consequences for the club and its players. Leeds & von Allmen (2008) conclude
that a so called ‘open system’ creates financial dangers and greatly complicates the structure
and relationships of leagues. US leagues do not offer the option of relegation, perhaps adding
to their stability. Looking at it from an attractiveness point of view one could say that this
leads to structural underperformance of bad teams. There is no incentive to perform and since
most of the revenue is shared (which is the case in many US sports) a lackluster approach will
not be punished. Since relegation is detrimental to your club, a team must invest in order to
stay at the highest level. Cooke (1994) mentions that bad performance will create less
attendance, but very large crowds if the outcome of matches towards the end of the season are
likely to determine whether or not they remain in the higher division. Whether or not the
option of relegation is positive or negative for revenues is a debatable question and will
depend heavily on the actions of spectators. Either a boost of revenue will occur due to
increased importance all matches during competition, or a reduction takes place by playing in
a less notable and decorated league. Thus the answer, based on literature, is rather
inconclusive.
Participation in multiple leagues
Besides playing regular season games in a domestic context, European football clubs also
compete in additional domestic and international cups. These cups are competitions in which
teams from different divisions play each other in a knockout system. In some countries even
clubs consisting of amateur players are involved, which leads to interesting matchups. The
Champions League and Europe League are international competitions with clubs from
different UEFA4 member countries playing each other. The best teams in Europe qualify
through their achievements in their respective domestic leagues5. The only thing to come
close to resembling such a multiple league system is perhaps post-season play. US sports play
regular season games to qualify for playoffs which ultimately brings together the best teams
within a league. Through a number of knock-out rounds the ultimate champion of the league
is determined. These grand finales have familiar names like the Stanley Cup (NHL),
4 UEFA is the governing body of European football and consist of 53 members.5 Qualification for the UEFA Champions League and Europe League is based on domestic performance the season prior to possible contention.
8

Superbowl (NFL), World Series (MLB) and the NBA Finals (NBA). European football teams
need to be aware of performance in multiple competitions over many years and divide their
strength accordingly. Their American counterparts can focus solely on winning one prize and
start each season with a clean sheet.
2.3 Goal comparison of team owners in professional sports
Why would one own a sport franchise? Because you love the game or maybe you are only in
for the profits. In order to analyse value in professional sports we first need to see what goals
owners have. Are they simply looking to add some pleasure to their lives or is it just plain
profit. In the literature a choice is made in order to do further analysis. Sandy et al. (2004)
conclude that utility maximisation appears to be the norm throughout Europe. Looking in
retrospect clubs and teams have had negative operating income for many years, thus cannot
objectively be labeled profit maximizing entities. The US is a totally different story, clubs do
make a profit but it not clear if that is their premier goal. Cooke (1994) adds to this a
somewhat different point of view: there are club owners who make an adequate return on
their investment. In many cases this may be a payment in kind, reflecting enhanced personal
prestige, rather than the prospect of any long-term financial gain. Leeds & von Allmen
(2008) see profit maximization one of several possible motivations for a team owner in North
America.
Differences between goals stem from tradition and from regulation implemented by public
institutions. Leeds & von Allmen (2008) note: European soccer teams face a very different
business climate than do North American sport teams. While some teams are highly
profitable, most struggle financially. This is partly due to the fact that soccer has only
recently been regarded as a business…. The question arising from this last part is why.
One thing that ought to be remembered is that not every professional sport team in these two
continents strictly adheres to the division mentioned above. The US market has franchises
which make losses because of owner desires’ to prolong other goals. On the other side
football clubs like Manchester United have made considerable profits, perhaps due to
American ownership.
When trying to make a clear division of ownerships goals the following quote from Lago et al
(2006) is important: American commentators, however, also broadly agree that the owners of
sporting franchises are driven primarily by commercial objectives. In Europe , by contrast,
there is a broad consensus that profit motives have been more constrained, although cases
vary according to country Reilly & Schweihs (2004) add to this the following: many sports
9

teams are owned by entrepreneurs who have already made their fortunes … The sports teams
allow their owners to compete in a very public forum either that are beloved by their local
communities. In many cases, professional sports team ownership is as much of a hobby as it is
a business for the extraordinarily wealthy team owners.
It is too easy to just divide the continents in profit and non profit maximisers. In reality each
owner of a professional sports team has different views and goals when he buys and operates
a certain club.
3. Focus on two particular leagues
In order to thoroughly analyse a sport in more detail an outline of its characteristics is helpful.
Focus will, from this point onwards, be put on two sports being baseball and football. The
most important details of European football will be investigated, while baseball will be
covered by analysing MLB. Introducing these two sports now is essential for understanding
the empirical work in Sections 8 & 9.
3.1 Major League Baseball
3.1.1 Structure
Professional baseball in the US is run by MLB. Two leagues consisting of 15 teams compete
with each other, during a 162 game long season. Baseball is called ‘the national pasttime’ by
many US citizens and its season runs form March till October. It concludes with the well
known World Series, where the winners of the so called ‘American’ and ‘National’ league
meet.
Parallel to the major leagues, with teams in the biggest US cities, the minor leagues also play
a vital role. These teams located in the regional US function as a farm system for talent.
Players which wind up with a major league club through a draft, are then sent to the minor
league affiliates of the club to develop. Each major league club has about 6 to 7 minor league
affiliates, which have their own management and ownership.
3.1.2 Financial overview
Yearly, Forbes magazine publishes a report with key financial data regarding Major League
Baseball. The results of the most recent report, which compiled the data for the year 2007 can
be seen in Table 2. A deeper analysis into how this value is derived will be presented in
Section 9.
10

The New York Yankees are by far the most successful and well known baseball team winning
a total of 26 championships6. However, as in many other sports, having the biggest payroll
does not make you the obvious winner. In the last ten years the Florida Marlins have won
twice making the case for the argument ‘money does not buy rings’7. When examining Table
2 one thing that strikes is the big difference in value between teams and the level of operating
income. Earlier on it was stated that American team owners are interested in creating value by
running profitable companies. From the Forbes report it is observed that in 2007 only 3 teams
had negative operating income. Two of those teams were the ones having the highest payroll.
3.1.3 Ownership
According to Forbes’ Business of Baseball report certain MLB franchises are owned by
wealthy individuals, others by listed companies. None of them are directly traded on a public
exchange. However some listed media and communication companies have majority stakes in
MLB teams like Liberty Media8, Tribune Company9, Rogers Communication10 and
Nintendo11. Leeds & von Allmen (2008) note that joint ownership of sports franchises (and
media company) creates vertical integration, the combination of different stages of
production, and cross subsidization, the movement of revenues and expenses from one part of
a company to another. Due to the matter in which teams are owned and integrated, separation
of revenue and profit from pure on-field activities is difficult. For example the Red Sox
private parent company NESV12 owns the team, the stadium and the TV station which airs its
games. As can be seen in Table 2 the Red Sox had a negative operating margin last year. It is
however very likely that its mother company NESV compensated this loss with revenue from
the other businesses related to the Red Sox. No proof of this hypothesis can be provided
because the company is privately owned and has very limited disclosure obligations.
Listed companies like Liberty Media and Tribune Company have their own TV stations and
are the majority shareholders of the Atlanta Braves and Chicago Cubs. Leeds & von Allmen
(2008) argue that: The Braves and Cubs may not have generated as much revenue this way as
they could have by selling the rights on the open market, but their parent companies were less
interested in which subsidiary made a profit than in their overall profits. This could very well
be the case with the Red Sox and their parent company NESV.
6 Source: MLB.com7 Rings refer to the commemoration that players receive for winning the World Series.8 www.libertymedia.com9 www.tribune.com10 www.rogers.com11 www.nintendo.com12 New England Sport Ventures
11

Table 2: MLB Team value Forbes
Source: Forbes Magazine

3.2 European Football
3.2.1 Structure
Giving a clear description what the European football market is comprised of is somewhat
more difficult. This is due to the fact that the European market consists of many countries and
leagues. In their ‘Annual review of Football Finance 2008’ Deloitte focuses on clubs
participating in the highest levels of the English, German, Spanish, French and German
market. This has some logic to it because clubs included in these leagues create the most
revenue. Most of the time these leagues also produce the winner of the prestigious UEFA
Champions League and the UEFA Cup. Besides the above mentioned markets the most
notable are the Dutch, Portuguese, Scottish, Turkish and Greek. Teams from these markets
have had occasional international success, such as AFC AJAX (Holland) and FC Porto
(Portugal). As mentioned at an earlier stage relegation from the highest league is a common
feature in Europe.
All the teams in Europe have their own domestic leagues, with the number of matches
depending on the number of participants in their respective leagues. Apart from these regular-
season matchups, teams compete with sides from lower divisions in so called ‘cups”.
Examples are the “FA cup” “League Cup” (UK), “DFB Pokal” (Germany), “Copa del Rey”
(Spain) and the “KNVB beker” (The Netherlands). Aside from their domestic obligations,
some clubs also compete internationally, in more lucrative tournaments, such as the
Champions League and Europe League.
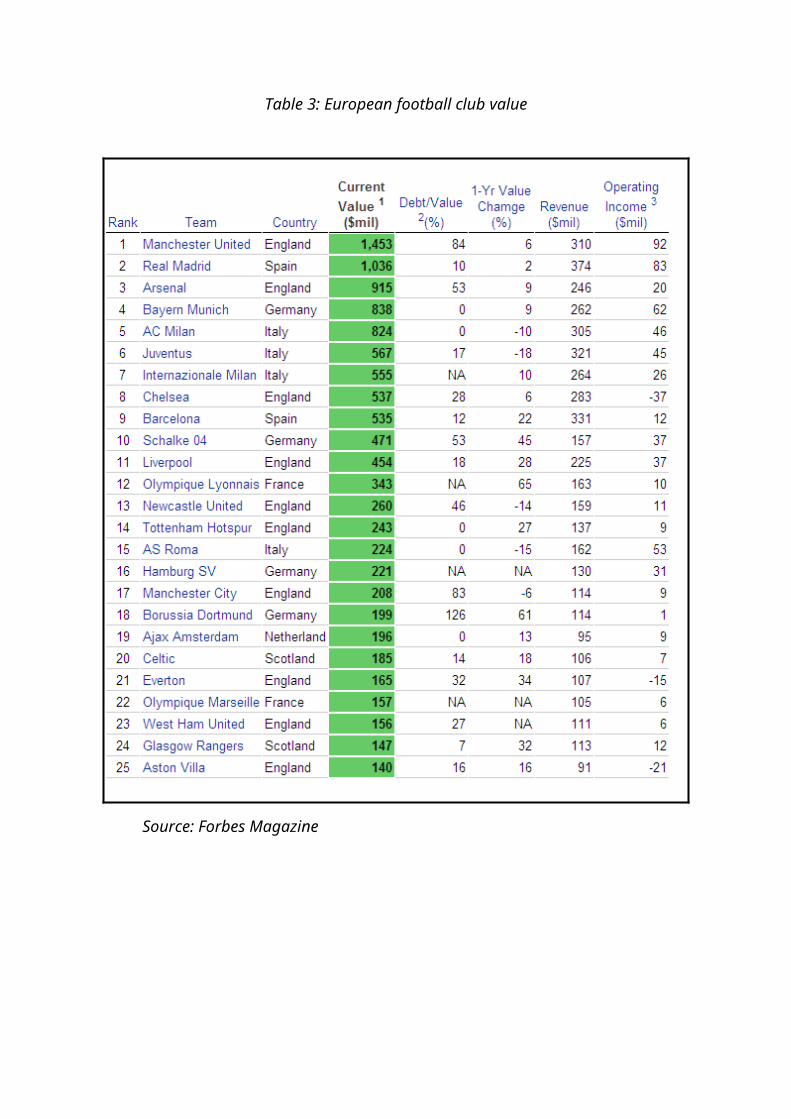
3.2.2 Financial overview
Forbes not only focuses on their US home market when analyzing value in professional
sports. Table 3 offers insight into their European football findings. Based on research by
Deloitte Forbes comprised a list of the most valuable professional football teams in Europe.
The composition of table 3 is not surprising as it is filled with teams from Europe’s highest
revenue creating leagues as mentioned in section 2.1. Another interesting feature is that
English football clubs are well represented in this list. Further research on the value of these
clubs will be conducted in section 9.
In connection to value, Lago et al (2006) comment on the dramatic increases in income which
have been observed since the mid 1990’s. These are mainly due to higher income through TV
rights and other sorts of revenue such as merchandising. On first hand this would look like a
positive development, but according to the authors it has triggered a European wide
phenomenon of overspending.

Table 3: European football club value
Source: Forbes Magazine
14

Due to lack of supervision in some European leagues and irresponsible behavior by owners, a
number of clubs have run into financial hardship in recent years. This has mostly been the
case for relatively small clubs, for which the additional income was a big part of their budget.
When cable companies realised that they had overpaid for certain TV rights, some were
already bankrupt or renegotiated securing lower costs. This development was fatal for some
of the smaller teams in European football.
3.2.3 Ownership
An in-depth view of ownership in European football creates a very diverse picture. Some
teams are owned by private companies or wealthy families, others by publicly listed firms.
Thorough research with the help of Thomson One Banker has created the output shown in
Table 4. This table shows all the currently traded firms.
Sandy et al. (2004) suggested the trend toward publicly traded teams in Europe may reduce
the apparent differences between North America and Europe. When comparing Morrow
(1999) and more recent information, a reduction in the number of listed teams can be
observed. In 1999 21 British clubs were listed, compared to only seven today. These clubs
were removed from the stock exchange because their publicly traded share capital was bought
by a single or consortium of investors.
One example is the delisting of Manchester United Plc. During a period from
November/December 2005 Malcolm Glazer acquired the decorated club by buying out its
minority owners and other shareholders. Glazer was the first American to enter the British
football market. He was not new to owning sport franchises; the Tampa Bay Buccaneers, a
NFL franchise, is also under his control. According to UKinvestementadvice.co.uk (2005) the
takeover bid was valued at GBP 790m. Due to the high leverage character of this acquisition
it was met with resistance from fans. They expected an increase in the ticket prices and a
reduction in quality player investments.
In contrast to Manchester United, which was publicly seen as an investment, it was opposite
to the takeover of Chelsea FC. The Russian oligarch Roman Abramovich bought this club in
the summer of 2003 and invested a huge sum of his own money. His goal was to win prizes
right out of the gate, without years of careful teambuilding. After two years of sizeable player
investments, Chelsea won the Premier League in the 2004/2005 and 2005/2006 season.
Apart from public ownership, most clubs are owned by associations, which have passionate
members with voting rights. The southern part of Europe is characterised for its ownership by
rich industrial families which have governed clubs for years.
15

Table 4: Publicly listed football club in Europe
Share Thomson One banker code Club CountryAalborg Boldspilklub A/S AAB-KO (C000056597) AaB DenmarkAik Fotboll AB AIK'B-SK (C902356205) AIK SwedenAFC Ajax NV AJAX-AE (C000048768) AJAX NetherlandsArhus Elite A/S ELITE'B-KO (C000048790) Aarhus Elite DenmarkAS Roma ASR-MI (C000071298) AS Roma ItalyBirmingham City PLC BMC-LN (C000049101) Birmingham City EnglandBorussia Dortmund BVB-FF (C000073999) Borussia Dortmund GermanyBrondby IF A/S BIF'B-KO (C000006812) Brondby IF DenmarkCeltic PLC CCP-LN (C000039610) Celtic ScotlandFenerbahce Sportif AS FENER-IS (C901273987) Fenerbahce TurkeyFutebol Clube Do Porto FCP-LB (C000049800) FC Porto PortugalHeart Of Midlothian PLC HTM (C000048587) Hearts ScotlandJuventus Football Club JUVE-MI (C000080188) Juventus ItalyLazio SSL-MI (C000047863) Lazio Roma ItalyMillwall Holdings PLC MWH-LN (C000057189) Millwall EnglandNewcastle United PLC NCU-LN (C000041074) Newcastle United EnglandParken Sport & Entertainment A/S PARKEN-KO (C000038895) FC Kopenhagen DenmarkPreston North End PLC PNE-LN (C000041296) Preston North End EnglandSheffield United PLC SUT-LN (C000016079) Sheffield United EnglandSouthampton Leisure Holdings PLC SOO-LN (C000048642) Southampton EnglandSIF Fodbold Support A/S SIF'B-KO (C000050700) SILKEBORG IF Demark
Sporting SA SCP-LB (C000054280)Sporting Club de Portugal Portugal
Tottenham Hotspur PLC TTNM-LN (C000016673) Tottenham Hotspur EnglandWatford Leisure PLC WFC-LN (C000078886) Watford England
16

4. Creating value in sports
Whatever the owners’ goal might be, whether it be maximizing profit or utility, value is
always present. In order to find out what drives this value a closer look is needed. Value is not
only created through means of revenue, cost and profit. These are all monetary means of
expressing value. Generation of more utility by means of personal entertainment also has a
certain value. These behavioral aspects are beyond the scope of this chapter and will be
touched upon in section 6. This section will focus on revenue and cost drivers, identifying
common and league specific items.
Leeds & von Allmen (2008) identify gate receipts, broadcasting rights, licensing income and
stadium income as sources of revenue. Reilly & Schweichs (2004) name seven profit factors:
national and local broadcasting revenue, ticket revenue, stadium leases, naming rights,
sponsoring agreements and the ‘Collective bargaining agreement’. There might be some
overlap between Europe and the US, that is why common revenue drivers will be attended to
first. Besides organisational differences already discussed, revenue creation also has its
continent specific characteristics.
4.1 Common revenue drivers
4.1.1 Broadcasting revenue
Televising of games and radio play-by-play is done in both MLB and European football. In
the US revenues are divided between national broadcasting income and income from local
broadcasts. This division is logical for the US because of the pure size of its market. In
Europe revenue is derived from either the live-showing of games or the highlights.
Major League Baseball
National broadcasting agreements, whose revenues are shared equally among teams generate
USD 713m annually13. Local broadcasts constitute for a far bigger share of total TV revenue
in the US. Referring to the large differences in revenues between MLB franchises, Leeds &
von Allmen (2008) conclude: baseball disparities occur because big-market teams have such
large local revenues. Reilly & Schweichs (2004) mention that local broadcasting revenue is
tied to the size of each team’s immediate market. This fact could potentially hurt the
competitive nature of the league, due to the wide division in market size.
13 Leeds & von Allmen (2008)
17

European soccer
The MLB division of broadcasting revenue is not observed in Europe. There is no division of
revenue between national and local broadcasts. The five biggest European leagues do
however receive income through selling television rights internationally. Especially the
English Premier League games have become a serious export product. The introduction of
Pay TV has helped boost revenues across Europe. Until the mid 1990’s most football leagues
collectively sold their TV rights to suppliers of television content. This changed in the years
after with all kinds new innovative agreements. The Journal of Sport Economics published an
overview of the Europe’s major soccer markets in 2006. Lago et al (2006) state a dramatic
increase in revenue from television rights which ignited a lot of spending in European soccer
since the mid 1990’s. When taking a look at the English, German, Italian, French and Spanish
market, Baroncelli & Lago (2006) reveal that almost 30% to 50% of all revenue comes from
broadcasting rights. These percentages have however started to decrease since 2002.
4.1.2 Stadium and ticket revenues
Ticket revenue is the combined revenue of single game tickets and season tickets holders.
Over time the capacity of stadiums in Europe has increased making additional revenue
possible. When looking at soccer this source of revenue contributes 16% to 30% of total
revenue. It should be noted however that not all clubs are owner of their own stadium. Most
of the time municipalities are owners of facility, because they financed them with public
funds.
In MLB ticket revenues are about 10% to 15% of total revenues. Other revenue regarding
stadium activities once again depends on the ownership status of the stadium. If owned by the
team, they can reap the benefits of renting the facility to other users.
4.1.3 Sponsorship and merchandising revenues
Sports teams are entities which have a lot of media exposure and a solid brand name.
Businesses and individuals alike want to be identified with such teams. For companies this is
a way of putting a certain product or brand in the public eye. Additionally, individuals have a
natural urge to be part of group and dress a certain way to be accepted. These two motives are
the basis for sponsoring clubs through advertisement in stadiums and the buying of t-shirts,
sweaters and other merchandise.
In European football these revenues have been on the rise and currently average around 18%
of total revenues. In recent years a lot has been done to target the Asian market. For both
18

MLB and European football teams this has meant, besides more revenues from television
rights, a huge increase in merchandising revenues.
4.2 League specific revenue drivers
Besides the common revenue drivers there are some specific revenues which are not found on
both sides of the Atlantic.
4.2.1 Naming rights
One very important specific football revenue is income from jersey naming rights. It is a kind
of revenue which is only seen in football. The outfits worn by players are usually covered
with the trademark of a corporate sponsor. This kind of advertisement is not seen in MLB or
in any other major sport in the US. However it is worth mentioning because of its economic
significance. Leeds & von Allmen (2008) show in their book that the annual revenues can be
as high as EUR 20m.
A specific MLB revenue which is not all that popular in Europe is revenue from stadium
naming rights. Large corporations regularly buy the rights to name a certain stadium from
those who own them. Examples are Minute Maid Park (MLB team Houston Astros) and
Citifield (MLB New York Mets). These deals yield revenues up to 10 million a year with
contracts sometimes running for up to 30 years.
Both sports profit from selling naming rights albeit in two totally different ways.
4.2.2 Transfer fees
Another European football specific revenue is the transfer fee. A little background
information is probably needed in order to explain these revenues. When a player is under
contract with a certain team and another team wishes to sign this player a transfer fee must be
paid to his current employer. This is in sharp contrast with the American system, where
players change team because their contract runs out or they are traded. When traded other
players are involved or salary is deferred to the original team.
Traditionally some European leagues have been sellers and others have been buyers. Those
clubs which offer the highest salaries tend to attract the best players. Even within countries
sharp differences can occur, with some clubs always being net buyers. The revenue created by
these transfers could of course be very lucrative, but will deplete your team of talent and
potential success in the future. The level of revenue fluctuates between leagues and over time.
For a long time the biggest transfer in monetary terms was completed 2000 when Zinedine
Zidane was bought by Real Madrid for EUR 76m. Until the summer 2009 of the transfer top
19

1314 was comprised of 10 deals which were done in the period of 1999-2001, which was at the
height of the television rights boom. In the years after total revenues have dropped and as a
consequence so have the level of transfer fees. The European soccer governing body UEFA
has also done its part by introducing regulation and putting limits on transfers for a certain
group of players. However the summer of 2009 changed the transfer landscape once more.
Real Madrid and Manchester City competed with each other to sign the world’s best players.
Real took out a EUR 300m loan to finance the acquisitions of 7 new players. City showed that
its new Arabian owners have deep pockets by spending around EUR 200m.
4.3 Common cost drivers
When talking about costs, the one key driver that truly stands out is wage costs. Of course
operating a team also brings other general expenses, such as travel, marketing and
administrative expenses. MLB clubs as well as European soccer teams also share another cost
driver; player development costs. Both have a broad minor league system and numerous
youth teams which have to be financially supported.
Leeds & von Allmen (2008) state that: salaries, which include deferred payments, bonuses,
workers’ compensation expenses, and pension contributions, make up over half a team’s costs
in every major sport. This citation is based on American sports.
When looking at European soccer teams, the share of wages costs varies across the different
leagues. They tend to be 40% to 60% of total costs. Expenses besides wages make up 15% of
costs when taking the average of the five major European soccer leagues. These percentages
are based on publications in the Journal of Sport Economics (2006).
4.4 League specific cost drivers
When adding up the percentages of costs for European football teams costs there is still a
portion unassigned. The part which is missing is made up of amortization costs. As is true in
every company certain assets depreciate in value and have to be amortized. These
amortization costs, in European football, are a direct product of the transfer system. Players
are bought and placed on the balance sheet based on their transfer fee. Sometimes a player is
sold again and a profit is made. This is of course not always the case and when a player leaves
the club at the end of his contract, the balance sheet must be corrected. Due to the excessive
transfer fees paid around the year 2000, clubs are now faced with the burden of amortization.
Those clubs using a lot of home grown talent, make big profits, due to the fact that these
14 Source: www.vi.nl
20

players have balance sheet value of zero15 and thus a potential high transfer profit.
Amortization costs make up the last big piece of European football team expenses.
5. Valuation
In order to come to an objective assessment of value in any enterprise, a measurement method
must be chosen. There is not a single optimal procedure and some might simply not work.
Presented below are some techniques which are regularly used in practice. In order to valuate
a sports team certain approaches might not work due to the distinct nature of the companies
activities. These obstacles will be discussed in the second part of this section. This section
concludes by picking a valuation methodology which is most appropriate for the particular
kind of sport.
5.1 Valuation methods
In general Reilly & Schweihs (2004) identify three methods of assessing value within an
entity. These three being the asset-based approach, income based approach and the market
approach.
5.1.1 Asset-based approach
According to Damodaran (2002) this valuation approach can result in a liquidation value or a
value based on replacement costs. The first will put a dollar amount on a distressed company
and value assets at market prices. Reilly & Schweihs (2004) characterize the amount of
replacement costs as expenses reassembling the business tangible and intangible assets and
costs to reestablish the business. The asset-based approach closely resembles the cost
approach of Smith & Parr (1994) although this does not fully integrate Damodaran’s concept
of liquidation value.
5.1.2 Income based approach
This approach, unlike the asset-based, takes the future into account when making value
calculations. One of the most frequently used methods is discounted cashflow analysis (DCF).
This procedure discounts future cash flows of an entity to present day value. It is a concept
which is widely used when valuing all sorts of companies in different industries. The already
mentioned discount factor can better be described as the rate of return which is required by an
investor from a project or company. Reilly & Schweihs (2004) characterise the income based
15 Zero= near to zero player development cost could be activated on the balance sheet.
21

approach as follows: the projection of the future cash flows and residual value are discounted
to present value using a rate of return that incorporates the risk and timing of these projected
cash flow.
Important items are, as can be deduced from the statement above, the mapping of free cash
flows through earnings forecasts and the determination of the discount factor which is often
called the ‘weighted average cost of capital’ (WACC). These two items, used together, can
provide a value estimate and are the centerpieces of DCF analysis.
Free cash flow development
The income based approach makes use of future cash flows when determining today’s value.
In order to determine value, a projection of earnings development must be made.
Determination of growth rates, margin development and potential investments or divestments
will heavily determine the level of free cash flows. Revenue growth is subject to business
specific drivers. Section 4 has already listed a number of revenue and cost drivers which are
found in professionalised sports. A further detailed investigation into value and revenue
drivers in MLB will be presented section 9. In a general manufacturing company setting, sales
growth and margin are important determinants of the EBITDA of the firm. Deducting
depreciation, interest and tax expenses will result in the company’s net income. Adding to that
depreciation charges again and subtracting increases in capital expenditures/working capital
provides the free cash flow.
When performing DCF analysis growth and margin figures will have to be estimated, based
on sound research. Information can be derived from industry research reports and estimates
by government agencies. Any business is subject to risks which can severely affect revenues.
A shutdown of production due to malfunctioning production equipment or a deteriorating
economic climate can be very harmful for short term earnings. Specific risks related to
professionalised sports can be found in section 8. Risk creates a certain margin of uncertainty
in revenues projections. Arbitrary forecasting will always surround DCF analysis. This why
valuation specialists use DCF analysis in combination with other valuation approaches.
Weighted average cost of capital (WACC)
The discount factor is an essential part of DCF analysis. It provides the valuator with an
assessment of present day value while encompassing future streams of income and taking into
account the cost of capital provided by parties. This discount factor is not randomly chosen,
but calculated by taking into account the capital structure of the company. Different balance
22
sheet liabilities have different costs. Equity owners are likely to ask different compensation
than debt holders. The company’s leverage weighs the cost of equity and debt resulting in the
WACC.
Large publicly listed firms can extract capital from liquid capital markets, where the costs are
relatively transparent. Private firms, such as most football and MLB teams, are less
transparent and determination of their WACC is a bit harder. Owners of professionalised
sports teams know the return they want on their invested equity and should be able to
compute the cost of debt which they are paying on their loans. This provides the owner with a
WACC with which the value of the team can be calculated. Independent valuators will have
to make their own assumptions and projections when trying the derive the correct WACC for
a private firm. However listed professional sports teams could offer some kind of guidance
due to their similar business characteristics.
The costs of different kinds of capital are based on the risks the owner will have to endure
over holding period of the asset. A higher return can be only be achieved by taking more risk.
As stated earlier a company’s risk profile is determined through the markets in which it
operates. Specific risks associated with the operation of a professionialised sports team can be
found in section 8.
5.1.3 Market based approach
The market based approach is a method which makes use of relative valuation. The
comparison of two or more firms could have some informational value, but only relative to
each other. The market plays center stage when comparing firms. It provides the information
you need to compare a certain team with other league participants and compute a multiple.
Comparable company analysis
Popular methods used in relative firm valuation are price-sales ratio, price-cash flow ratio,
price to dividends ratio and EBITD(A)16 to enterprise value. The multiples are applicable in
any industry or sector when the information is publicly available. Comparable company
analysis has as purpose the comparison of currently operating companies based on
fundamentals. Besides well known multiples stated above, new ones are introduced on a
regular basis. The internet sector was especially keen on creating multiples based on
operational data at the height of the internet boom in the 1990’s. Enterprise value was
compared to web site hits, unique visitors or number of subscribers according to Koller et al
16 EBITD(A) = Earnings before Interest Taxes Deprecation (Amortization)
23
(2005). Traditional comparability ratio would not suffice for these specific companies due to
the fact the just started their business and were in an exceptional growth phase. In theory any
sector unique detail could be used to compare firms within that sector. Professionalised sports
teams have specific revenue and value drivers listed in section 9 which could serve as the
starting point for comparison. Making value calculation based solely on one multiple is not a
wise thing to do. Using two or three different multiples can render better results because it
compares companies based on more than one piece of financial data. The major shortcoming
of the market based valuation approach is that it does not provide an absolute figure of value.
It only states how a certain company performs relative to its peers.
Comparable transaction analysis
Another method which can be used to compute a company’s value is analyzing past
transactions involving similar firms. Financial performance attributes can be transformed into
ratios using the value of the transaction. Number of times sales or EBITDA paid are popular
figures. A certain company which wants to value itself can take a look at transactions in its
peer group to get an indication. Transactions are done continuously and thus the deal size
will depend on the assessment of future growth and risk at a particular moment. Especially
when numerous transactions have taken place an industry average can be derived. This
method uses the relative valuation technique with multiples just like the comparable company
analysis. The only major difference is that the comparable transaction analysis uses historical
performance data of past transactions, where company analysis uses only the most recent data.
Combining the results of both can make value assessment based on multiples more robust.
Specialised web sites keep track all deals in a wide array of sectors. Information on listed
firms is usually better accessible. Whenever a transaction takes place its deal size is usually
disclosed through major media outlets. Changes in ownerships of professional sports teams is
often given a lot of attention. Owners of other teams are particulary interested because it can
give them an updated view on the value of their own assets.
5.2 Valuation obstacles
When trying to actually valuate a professional sports team, certain difficulties immediately
arise. Some are related to the specific characteristics of a sports team, others due to
information shortages in general.
The following sub sections will address some of these difficulties. Identifying these obstacles
is essential when trying to create a model which provides sound valuations.
24

5.2.1 Information shortages
Valuation is based on information, which either is or is not available at a certain point of time.
Information availability is also highly dependent on ownership structure. The structures under
investigation are, besides some publicly traded football clubs, private companies or
subsidiaries of publicly traded companies. For the group of companies which are investigated
valuation is largely dependent on estimations or documentation deposited at the Chamber of
Commerce. This is not ideal because estimations could be based on flawed information and
the documentation might be very difficult to obtain and compare. Damodaran (2002) offers
some techniques when valuing private companies. One of these techniques is comparing
private and public firms in the same sector. This only partly solves the valuation problem,
because only European football clubs have listed peers.
Luckily, several media outlets publish yearly rankings, which contain financial data of teams.
However most do not list sources or base their results on own research which is unverifiable
for outsiders.
5.2.2 Cash flows and the WACC
Cash flows and the proper determination of the WACC are essential inputs when performing
discounted cash flow analysis. When neither can be determined, the income based approach to
valuation will not work. Analysis is nearly impossible when cash flow is negative or very
volatile. Reilly & Schweihs (2004) mention the following: unlike other businesses, annual
cash flows during the investment holding period of a sports team are often zero or negative.
Even more important is the estimation of the WACC, which is not necessarily the same over
time and between certain sports. The WACC is often based on the amount of risk a certain
entity runs. Risk factors are quantified into a rate which has to be covered before a project or
company is deemed valuable. Furthermore, even when risk factors for profesionalised sports
teams are uncovered, as is done in section 8, quantifying is a difficult and often arbitrary task.
For listed firms the equity part of the WACC is often derived by using the CAPM. By
analysing the way stocks in a certain sector perform relative to the market a parameter called
beta is derived. Together with the beta component, risk free rate and several premia the cost
of equity is determined. Uncovering this cost for private firms is almost impossible, because
this heavily depends on the owner’s preferences.
25

5.2.3 Business units
Some professional sports teams in Major League Baseball are part of larger publicly traded
companies. Their activities are consolidated in the financial statements of the parent company.
Information on these subsidiaries is often difficult to find and not very elaborate. Even when
available the same obstacles, already described earlier, will arise. The parent company is
faced with different kinds of risk due to the variety of businesses which it is involved in. Each
separate business unit has its own specific risks and discount factor. Another important
obstacle is the one described in section 3.1.3. Cash flows are entangled between businesses
and thus almost impossible to sort out. This makes isolation and discounting of core sport
team cash flows a tiresome task. When the transaction value of a deal is used to estimate the
value of its peers, it must be clear what the deal contains. Whether or not the stadium, tv
station or other parts of the club are part of the transaction can have a huge impact on the
potential value of the transaction. Attributing an absolute dollar figure to each part could also
be a daunting task.
5.2.4 Relative valuation
Valuation based on multiples is often based on two principles. The first being comparables
the other being fundamentals. These principles allow us to make insight into value a little
easier, but allowing for these simplifications comes with a degree of subjectivity.
Assumptions must be made in order to perform a valuation based on multiples.
When basing your analysis on comparables, firms in the same line of business are identified,
to base calculations on. However as Koller et al (2005) mention from a valuation perspective,
not every company in the sample is truly comparable. This is exactly the flaw which is
inherent to this kind of valuation. Not all firms in the sample will strictly be in the same line
of business and company specific items will always have an effect on performance. A certain
ratio is calculated using a certain item of financial information which is available. This
process is repeated for the other firms being investigated and the results are subsequently
compared. The outcome gives an overview of how a group of firms performs relatively to
others, making no judgement about the validity of the assumed underlying value. In order to
cope with this problem fundamentals are used. Using fundamentals according to Damodaran
(2002) is equivalent to using discounted cash flow models, requiring the same information
and yielding the same results. Issues which are directly related to the business will directly be
shown in the multiple.
26

Concluding, it can be said that multiple valuation provides ratios which are easy to interpret.
A certain amount of caution is needed when using these ratios, because these are not a product
of in-depth company analysis. The estimation of these comparative figures just includes well
known top line financial information and certainly does not include all the available company
or sector information.
5.2.5 Valuation of intangibles
Certain assets have an identifiable tangible value such as owning a building, inventory or
perhaps equipment. Financial assets such as investments in other companies have a price
which can be related to their consolidation value. Another category of assets which can be of
significant value are intangible assets. Smith & Parr (1994) define these assets as all the
elements of a business enterprise that exist in addition to monetary and tangible assets .. and
often are the primary contributors to earning power of the enterprise. Examples of popular
intangible assets are goodwill, patents, trademarks, certain contracts and agreements.
European football club have players which are put on the balance sheet an serve as assets
based on their transfer fees. In all of sports the players are of key importance when operating
a professional team. Section 8 will try to analyse the risk factors which apply in modern day
football, undoubtedly players will play an important role. The way in which intangible assets
are treated and calculated can be of important value.
5.3 Valuation methods choice
When taking into consideration the knowledge of sections 5.1 and 5.2 a choice can be made
about which valuation procedure would best fit professional sports teams. Presented will be
methods which take into consideration the potential obstacles which were mentioned earlier
on. The approaches will not be similar for both the continents, due to the different structures
and availability of information.
5.3.1 European football
Unfortunately there is no clear cut solution when addressing the valuation question in
European football. The availability of public data certainly helps a lot when valuating a
certain business. Insights into cash flows through financial statements are vital when trying to
perform a DCF analysis. When a certain company is listed and valued by discounting its free
cash flows it can give some indication of value for non listed companies operating in same
line of business. However not all European countries have football clubs which are listed
which makes comparison of clubs on certain national levels difficult. When comparing clubs
27

on a European level it must be noted that revenues and costs differ significantly between the
different leagues.
Comparison based on standard or sector specific multiple might offer a solution for the
valuation of European football teams. Firms which are publicly traded can be seen listed in
table 4. Public financial data such EBITDA or sales figures can be used to compute multiples
which can serve as an indication of the average multiples for football clubs. The availability
of financial figures of private clubs will determine which multiples can be calculated.
Otherwise non financial figures, derived in section 9 as potential value drivers could serve as
sector specific multiples. Examples of this could be a multiple based on attendance,
performance or population characteristics.
Concluding, valuation in European football can best be performed by comparing the available
data from privately owned companies with their listed peers.
5.3.2 Major League Baseball
The European procedure cannot be implemented in MLB. This is due to the fact that most of
clubs are in private hands or when public do not provide adequate information. In this
environment stock markets give no indication of potential value or a reliable starting point for
valuation. Reilly & Schweihs (2004) comment on this by stating: the market approach is a
typical valuation approach to value professional sports teams. Potential buyers generally
consider the price paid for other teams and the comparative strengths and weaknesses of the
“comparable” teams. This approach closely resembles comparable transaction analysis
which was discussed in section 5.1.3. One can easily note several shortcomings of such an
approach. First of all if the initial price which is paid for a certain club is not representative of
true value, subsequent acquisitions will be based on incorrect assumptions. Secondly
transactions take place under different circumstances each time which makes reliable
comparison very difficult.
Once again the development of a sector specific multiple might of good use. This form of
relative valuation could be introduced and provide insight into sector specific value
determinants. The only problem is that in order to create a multiple the transaction values
mentioned earlier must be used. This input is essential in order to perform a multiple analysis
but as stated above transaction data might not always be representative of actual value. It
good very well that inadequate input data is used to conduct further research, which can lead
to even poorer value estimates.
28

6. Behavioral aspects of potential team owners
Constructing a framework for valuation is the objective of this thesis. Trying to put a
normative framework into place has its merits. Having that said the real world is usually much
more dynamic and complex. It is important to take a look at potential behavioural aspects
which might play a role in acquisitions of professionalised sports teams. As already
mentioned in section 2.3 not all owners have the same goals. Some do indeed own teams and
turn them into profitable companies from which they subsequently extract dividends. Others
however think that owning a football club can help elevate them on the social ladder and thus
act on basis of personal prestige. The last group contains those who simply have too much
money to spend and decide that running a sports team is their next challenge.
In the previous section the subject of valuation has been discussed. A precise calculation of
value is much more important to those who intend to run their professional team like an
ordinary company. Paying to much upfront will jeopardize value creation going forward.
Those who treat their football team as their next toy, usually try to take control of clubs which
have been underperforming both financially and on the pitch. Former management has
invested money but could not turn the team around and now have to be bailed out. Otherwise
the team might be relegated and those in control will be subjected to severe public scrutiny. In
these cases s transaction price is often not disclosed and control is swiftly transferred to the
new shareholder. The former owner will not be obliged to continue investing his own money
into a loss making team.
The acquisitions of English Premier League teams which have occurred in last five years can
roughly be divided in two categories.
Chelsea already mentioned in section 3.2.3 and Manchester City are clearly acquisitions by
individuals who have too much money to spend. The only thing that drives these individuals
is a certain need for attention and world wide recognition. They inject their respective clubs
with so much money, that the people in charge overbid on the transfer market in order to lure
the best players to the club and instantly produce a winning team. Roman Abramovitsj did
this four years ago with Chelsea, igniting a buying spree of players. In August 2008
Manchester City Football Club was bought by a consortium called the ‘Abu Dhabi United
Group for Development and Investment’. The new owners clearly stated their ambition of
overtaking city rivals Manchester United while using Chelsea as a source of inspiration.
29

Putting their money where their mouth is, they offered massive contracts to almost all the top
players in Europe. While only capturing one player in August 2008, the owners went on to
sign many more.
Other acquisitions such as Manchester United FC, Liverpool FC and Aston Villa,
predominantly by American investors, can be categorised somewhat differently. These have
occurred without big influxes of cash. In most cases highly leveraged transactions brought in
a different mentality. The American business sense has prompted clubs to start expanding
stadiums and make more money from activities such as merchandising. A clear contrast can
be seen between this approach and those of prestige driven oil-billionaires.
When analysing acquisitions of Major League Baseball teams, a vast number of obstacles are
present. Objective comparability of acquisition prices is almost impossible due to information
limitation. Acquisition of solely a club’s baseball operation is a rarity. In most acquisitions a
broadcast channel is involved or a stadium. Attributing value to the individual part is not an
easy task. One thing does however differentiate American owners from their European
counterparts, which is the stability of the operations they own. According to Lago et al (2006)
the organisational structure in the US is built around the idea of financial stability. In Europe
clubs always have to incorporate the possibility of relegation due to short term
underperformance. This phenomenon can lead to distinct behavior by team owners.
30

7. Intermezzo
Up to this point this thesis has been generally been of descriptive nature. Through extensive
literature research an elaborate overview has been presented. This is very helpful for those
who are not highly interested in sports or whose knowledge is confined to European football.
By comparing the two continents interesting similarities and differences have been uncovered.
However the question posed in the introduction has not been answered adequately. Especially
the descriptive part on valuation has left some unanswered questions. The purpose of the
following empirical work is to cover this void between the literature and the real world. As
mentioned the available information is scarce and must be used optimally in order to be of
relevance.
This thesis will now continue with the presentation of two empirical studies. The first one
uses publicly available offering memoranda of UK football clubs to provide an overview of
risk factors. These factors are of key importance when determining the WACC in a
discounted cash flow analysis as mentioned in section 5.2.2. The study does not quantify this
discount factor but does uncover specific sources of revenue.
The second empirical study uses regression analysis to find significant value drivers in MLB.
This method of analysis is chosen due to lack of public data. It uses Forbes value information
presented in table 2 as its starting point.
Both studies also comment on whether or not risk factors and value drivers found in their
research are applicable beyond their original source. This is in line with the comparison based
perspective which has been used throughout this thesis.
31

8. Risk factors
Introduction
All commercial enterprises run certain risks which affects how they do business and create
income. These are usually closely related to different revenue streams, through which the
company receives money. When these enterprises are listed on a stock exchange market
participants analyse these risks and price them into a stock quote. Private companies operate
under less scrutiny than their listed peers, but probably are affected by the same factors. It has
already been established that certain sports teams can best be seen as commercial enterprises,
which are run highly professionally. In order to identify the risks that sports companies run, a
closer look at listed companies is helpful, due to their disclosure obligations.
Sport franchises which are listed are a rarity in the US. Europe does however have a
significant amount of listed football entities as can been seen in table 4. At the time of their
initial public offering (IPO) they must submit a document, known as an offering
memorandum. These filings provide information on the company’s characteristics to the
general public. Some items which are regularly included in such a document are:
organizational structure, history, list of employees including players and coaches, use of IPO
proceeds, financials and a specific section on risk factors. Potential investors must be
provided with adequate and reliable information before deciding whether or not to participate
in a company by buying shares. These documents are not only mandatory at the time of an
IPO but also at other events which could affect the current shareholders such as additional
share offerings or rights issues.
This empirical study will analyse the risk factors which are mentioned in the available
company documents of UK-listed football clubs. The UK is chosen due to the availability of
sufficient offering memoranda and the fact that the documents are available through Thomson
One Banker in English. Besides presenting a description of mentioned factors, an overview of
potential revenue implications will be provided. An important point that will be discussed is
whether or not the risk factors which are found could also apply in other sports and countries.
The remainder of this study is structured as follows. The dataset will first be presented and an
overview of the risk factors will given. After this the focus will be on rationale behind and
32

the implications of the risk factors. The last part will discuss if the items found are applicable
in another environment. The conclusion will reiterate some key items found in this study.
Data
The set of companies analysed is comprised of all currently and formerly listed UK football
clubs on the London Stock Exchange (LSE) or the Alternative Investment Market (AIM). Not
every company has all the information available in Thomson as can be seen in Table 5.
Table 5: Publicly traded UK football clubs
Company Club ProspectusRisk factors
Trading Status
Aberdeen Football Club plc Aberdeen yes yes InactiveAston Villa plc Aston Villa yes no InactiveBirmingham City plc Birmingham City yes yes ActiveBurnden Leisure plc Bolton Wanderers yes no InactiveCeltic plc Celtic yes yes ActiveCharlton Atheletic plc Charlton Atheletic yes yes InactiveChelsea Village plc Chelsea yes no InactiveHeart of Midlothian plc Heart of Midlothian yes no ActiveLeeds United Holding plc Leeds United n.a. no InactiveLeicester City plc Leicester City yes yes InactiveLoftus Road plc Queens Park Rangers yes yes InactiveManchester United plc Manchester United n.a. no InactiveMillwall Holding plc Millwall yes yes ActiveNewcastle United plc Newcastle United yes no InactiveNottingham Forest plc Nottingham Forest yes yes InactivePreston North End plc Present North End yes yes ActiveSheffield United plc Sheffield United yes no InactiveSouthampton Leisure Holdings plc Southampton yes no ActiveSunderland plc Sunderland yes no InactiveTottenham Hotspur plc Tottenham Hotspur yes no ActiveWatford Leisure Plc Watford yes yes ActiveWest Bromwich Albion plc West Bromwhich Albion n.a. no Inactive
Results
A total of ten clubs (bold) passed the information criteria and were analysed in greater detail.
Most of the factors which were found are fairly identical to each other, both in number as in
description. At the time most of the offerings were announced, in the mid and late end 90’s,
the market conditions were fairly similar for all companies. Financial advisors, which usually
write offering memoranda, must have saved themselves time by sometimes copying the exact
wording in subsequent documentation. Some reports were more elaborate than others as can
be seen in table 6 which gives an overview of risk factors per company.
33
Table 6: Risk factors per club
Team Event Date Type
of i
nves
tmen
t
Stat
us o
f the
clu
b
Team
per
form
ance
Attra
ctio
n an
d re
tent
ion
of
key
empl
oyee
s
Play
ers
insu
ranc
e
Cont
rol o
f con
tract
ual
oblig
atio
ns
Tran
sfer
mar
ket
Divid
ends
Inju
ry to
pla
yers
Shar
e va
lue
Requ
irmen
t for
furth
er
fund
s
Stad
ium
Dev
elop
men
t
Nottingham Forest Offer for Subscription Sep-97 x x x x x x xAberdeen Rights issue Jan-00 x x x x x x x x xWatford Offer for Subscription Jul-01 x x x x x x x x xLeicster City Offer for Subscription Sep-97 x x x x x x xCeltic Offer for Subscription Dec-94 x x x x x xPrestion North End Offer for Subscription Sep-95 x x x x x xQueens Park Rangers Offer for Subscription Oct-96 x x x x x x x xBirmingham City Offer for Subscription Feb-97 x x x x x x x x xCharlton Atheletic Offer for Subscription Feb-97 x x x x x x x x xMillwall Capital Reconstruction Jun-97 x x x x x x x
34

Description and implications of risk factors
A rational investor would take a position in a certain stock after making the trade-off between
risk and return. He or she can earn money by investing money now and hope that a part of
future cash flow will come to him or her. This could occur through dividend payouts or a
rising stock price.
A stock quote is at any time an investor perception of the company’s state going forward.
Certain risks have to be accepted by stockholders in order to make a decent return. One thing
that an investor must remember is that owning a share in a football company is not like any
other company. This is exactly what the risk factor section in offering memoranda warns for.
All risk factors which were found will be individually addressed below.
Type of investment
Description: due to the size of the equity offering and the number of shareholders, the
stock will not be very liquid. This implies that prospective buyer or seller will find it
difficult to acquire or dispose of the company’s shares.
Implication: if an investor changes his beliefs about the attractiveness of the company
prospects or the role it plays in his total portfolio, he is unable to trade. This
unattractive feature is also a risk for the company itself, because it could create
difficulties when attracting investors.
Status of the club
Description: football clubs can be relegated and promoted to different leagues. At the
time of offering a team might be at a certain level, which does not necessarily have to
be same as the years before and after.
Implication: relegation can adversely affect the revenue streams in a football
organisation, while promotion can boost income. Factors which come into play are for
example the level of ticket prices, income from broadcasting rights, level of
merchandising revenue and many others.
35

Team performance
Description: if a team performs well and wins games, there will be a positive
sentiment in and around the club. On pitch performance can lead to promotion and
potential trophies. The opposite can also be reality, losing games and relegation are
also part of football.
Implication: ultimately football is just like any other sport, there is always a winner
and a loser. Performance determines whether fans go home happy or disappointed.
Winning (losing) can, in the long run, lead to full (empty) stands, increasing
(decreasing) revenue and a rise in (loss of) club popularity. Together these could have
a significant effect on profitability and future cash flows of the company.
Attraction and retention of key employees
Description: a football club needs players, instructors and managers in order to
compete. The composition of a team changes through time either voluntarily or due to
management decisions. This year’s squad which for example won a trophy does not
necessarily have to be identical to next year’s squad.
Implication: when a club produces a star striker or a young talent which delivers a lot
of goals, he becomes valuable for other clubs. If this important piece of a squad is
subsequently transferred to another club and not replaced club performance could
subdue. On-field and financial performance is also affected by injuries, retirement or
suspension of key personnel.
Player insurance
Description: some clubs insure their most important employees against all injuries,
others only against permanent health complications. This is the outcome of an internal
cost-benefits analysis due to the fact that insurance premiums are high and full
coverage is not always possible.
Implication: football is not a production process which is highly automated with
replaceable operating staff. Players can determine the outcome of a match, even
though clubs are insured for loss of players, competing without your best players will
cost you points.
36

Control of contractual obligations
Description: football clubs participate in leagues, which enter into contracts on behalf
of its members. By giving the league the authority to do business for them, teams lose
full control over the outcome of negotiations. Clubs participate in these collectives due
to the increased market power they create.
Implication: broadcasting and merchandising agreements are usually bargained
centrally by league representatives. The risk of centralised bargaining is that an
individual club does not receive the amount which was presumed. Especially when the
economic climate is depressed, some clubs might rather sell their own rights in stead
of taking a part of the collective pie.
Transfer market
Description: before the Bosman ruling clubs could ask rival clubs for a transfer fee
even though the player was out of contract. This changed when a EU ruling made this
illegal and subsequently a thing of the past. Players can sign a contract with another
club a half year before the end of their current contract. Clubs only receive
compensation for development cost for players under 24.
Implication: the Bosman ruling will have a significant effect on how players change
employer. Clubs are not indefinite owners and need to be very careful in choosing the
length of a contract. Losing your biggest star, without earning a transfer fee, could of
course have negative effect on team performance and fan morale. Clubs will encounter
a significant drop in revenues due to lower transfer revenue for players which are out
of contract.
Dividends
Description: a company has the option to share a portion of profits with its
shareholders through a dividend payout. These payout are not very likely due to the
volatility of revenues and other characteristics of football companies.
Implication: when investing in a stock you expect to get return through dividend or an
increase in the share price. When dividends are cut out, because they are reinvested in
the club, owning a share in a football club might become less attractive.
37

Injuries to players
Description: a football team needs to be in good health in order to perform at its top
level. If certain key players are not able to perform due to short or long term injuries it
will be detrimental to team performance.
Implication: football is a game of physical strength, whatever team is in better shape
will have an edge. On field performance will be determined by the overall team shape,
if a key player is injured this could have severe adverse effects. A whole season could
go to waste if an adequate substitute can not be found or is unsuccessful in replacing
the injured player.
Share value
Description: it is inevitable that share prices might increase and decrease over time,
potential investors need to be aware of this.
Implication: partly due to the illiquidity of the shares, it is difficult to sell your shares
when prices move in the wrong direction.
Requirement for further funds
Description: the company might decide to raise fresh capital to expand its business or
finance ongoing operations.
Implication: whenever new shares are offered either through a rights offering or
secondary offering, potential profits must be divided over more parties. This is called
dilution and is a risk which must be looked at seriously by investors.
Stadium development
Description: a team’s stadium is of key importance because its capacity determines
the amount of fans which can watch the game. Expanding the home ground through
further development is pivotal. Additional funds are often extracted from the market to
invest in the infrastructure of a club.
38

Implication:
City council approval and local support are key when a club wishes to expand its
home ground. A bigger stadium can seriously boost income and bring a club to the
next level.
Use of stadium
Description: when the stadium facility is co-owned or shared with another user
potential problems can arise. The same can occur when a stadium is multifunctional
and facilitates music concerts or other spectacles.
Implication: when a rugby club uses the same stadium as the football club, potential
problems can arise regarding who has foremost right of use. One of the party’s actions
could negatively affect the other’s ability to operate. For example the postponement of
a game due to poor pitch conditions can lead to fines and potential loss of attendance
revenue.
Applicability of risk factor in other environments
The risk factors that were discussed previously can broadly be divided in two parts. On the
one side the risks which are a consequence of being listed on the stock exchange and on the
other the risks related to the game of football. Factors such as illiquidity of shares, level of
dividends, dilution and varying share values are applicable for any listed company. The
circumstances under which these risks arise may be different in each case, but the
implications are likely to be the same. The remaining factors are closely related to operations
of the club and game it plays. It could very well be that non-listed European football clubs
perceive the same risks when looking at their own business. Professionalised football
throughout Europe is organised similarly and spectators are likely to have the same human
emotions.
When looking even broader, these factors probably also play a role in other sports and in the
US. Most of the factors have implications on financial performance of club. Besides the risk
associated with transfer market risk17 and the fact that relegation is not possible in US sports,
there is no reason to assume that for instance a MLB team would not face the factors which
have been described.
17 In the US, players are only exchanged by clubs for other players and not for money. When a player is out of contract he is free to choose another employer
39

Conclusion
Publicly traded firms are not fully comparable with private companies, due to the
characteristics of the stock market. All information that could influence the future value of the
company must be publicly disclosed. Private firms are able to operate in relative calmness,
without being scrutinized by all sorts of investors. This also constituted the weakness of
private firms. Their ability to attract funds is confined to a relative small group of investors.
Public firms are able to use the stock market to solicit capital in order to grow their business.
For the sake of protection of public interest companies must send out offering memoranda
when engaging in major corporate actions such as offering of new shares. The company must
be truthful about which risks investors run when taking part in an offering of shares.
This empirical study has unveiled the risk factors which investors face when investing in a
listed UK football company. The factors found were both general, applicable to all listed
firms, and specific, risks related to football companies. It gives a clear overview which
repercussions certain events have on club finances.
Although this research focused on UK companies only, most risk factors found are
universally applicable. Most professional sport companies are likely to incur similar
difficulties in day to day business.
A potential extension to the work done in this empirical study is looking at other listed
football companies in Europe. This supplemental analysis could indeed verify if risk factors
are indeed the same around football. As mentioned earlier, due to language issues, this further
research was not included in this study. Having now determined which risks are present in
professional sports companies, it is much easier to imagine how this business works.
40

9. Value drivers
Introduction
Determining the value of a private company is often a delicate task. Information limitations
make it hard to identify whether or not a company is creating value. Unlike listed firms
disclosure of profit/loss accounts and revenue statements is often not mandatory or hard to
find. Another key problem when valuing private companies such as MLB teams is the fact
that they are usually a part of bigger conglomerates. This makes an accurate comparison of
the for example 30 MLB teams almost a daunting task. Some teams own their stadium and
may also have their own broadcasting company. All of this makes an assessment of core team
value very difficult. Luckily Forbes Magazine publishes a team value rankings yearly, giving
us some indication of what a team is actually worth. The only problem is that Forbes
publishes these figures and cites several unverifiable sources. In the following empirical study
the Forbes team values from the Forbes Business of Baseball report are taken as given.
Potential value drivers are transformed into explanatory variables and tested with regression
analysis. The ultimate goal is to be able to provide a set of significant factors which explain
differences in value between MLB teams in the best way.
This empirical study will start with a hypothesis in which potential value drivers are
presented with a reasoning behind their potential relevance. Subsequently the variables will be
presented and the statistical methods used will be explained. After this the different analysis
steps and results will be presented, followed by the rationale behind the significant variables.
The conclusion will try to combine the different factors and determine if they are applicable
outside of MLB.
41
Hypothesis
It has already been determined that the data which Forbes uses cannot be verified through
public sources. That is why this study will need to come up with a hypothesis on what drives
value in Major League Baseball. Section 4 has explained revenue and cost drivers in detail.
These drivers ultimately determine profit which will enhance team value when retained within
the companies operating the professional sports team. Aside from enhancing it, value is also
already in place, due to years of operation. The price which is paid for a particular team could
be based on both tangible as intangible assets present within the club. Another determinant of
value could be the brand name of a team and its historical reputation.
As was mentioned in section 5.1.2 valuation is largely based on the future development of
cash flows. The present value of these cash flows together with value of historically
developed assets will be the basis for a value estimate.
A huge number of potential variables could potentially affect the value of a MLB team. When
looking at determinants of revenue, attendance figures come to mind. Ticket revenue will be
determined through the number of fans coming to the ballpark. Those not able to come to the
ballpark can watch the game through broadcast on TV and the internet. The number of people
who are interested in watching baseball depends of course on the size of market in which the
team operates. For example a team in New York has a larger potential fan base than a team
somewhere in Alaska, due to the difference in population. However people will only be
interested to watch their favourite team play when the wins more often than not. If the home
team always loses fans will probably stop coming or watching the games on TV.
Besides revenues, costs are also very important when trying to make a profit. Salaries is the
biggest cost which professionalised sports teams have to endure. This is why payroll could
very well be a essential element of MLB team value determination.
As mentioned earlier on, the history of team can be of importance because of effect of its
reputation. When looking at the Forbes list team such as the Marlins, Rays and Rockies are
listed lower than those teams which have been around for years. These three teams have only
started playing in the majors during the last 15 years. It is interesting to investigate if
historical achievements have significant effect on value.
To summarize this study will investigate whether population, attendance, performance,
payroll and revenues figures have an effect on value. Historical achievements of a team will
also be investigated as potential value driver by extensive performing statistical analysis.
42

Data
As stated in section 3.1.2 this empirical study tries to uncover explanatory variables which
affect team value. In their yearly research Forbes offers key pieces of data for every MLB
team (30 in total). These are: operating income, debt/value ratio, revenues and current team
values. In the following research team values will serve as explained variable while the
explanatory variables can be placed in the following six different categories as stated in the
hypothesis: population, historical achievements, attendance, payroll, performance and
revenue. A lot of data is publicly available, which makes correct interpretation more difficult,
this is why multiple variable setups are created per category. The revenue data which Forbes
provides will also be used, due to the fact that most hypothesised value drivers have some sort
of revenue implication.
Table 7 gives an overview of the variables used in the analysis.
Statistical tests
Before any regressions are run, the correlation between the different variables will be
determined. The way in which variables are linearly related to each other and to what degree
is the starting point for further analysis. Correlation is denoted with the symbol ρ and
calculated by dividing the covariation of two variables by the product of their standard
deviations:
ρ = (cov (α,β)) / (σα*σβ) (1)
The value of ρ ranges form -1 to 1, with -1 denoting perfect negative correlation and 1
representing perfect positive correlation. The statistical software package SPSS will be used
to create a correlation matrix which will display the nature of univariate relationships between
the different variables.
In order to find significant variables linear regression analysis will be used. The data will be
be tested in a multivariate setting. Multivariate regression is performed with more than one
explanatory variables.
Y= α + β1*X1 + β2*X2 + β3*X3 + β4*X4 + β5*X5 + є (2)
43

Y is the explained variable (team value in this case study), X1 are the different explanatory
variables (one of the independent variables from table 7) and є the error term associated with
each observation.
Regression tries to fit a straight line through the data, with the method of least squares.
According to Moore et al. (2009) this method chooses the β’s that make the sum of squares of
the residuals as small as possible. The residual is the difference between the observed
response (data which is collected) and predicted response (based on the model).
The regression analysis is done with statistical software package SPSS, since hand calculation
is complicated. SPSS produces valuable output relating to the size of the coefficients α & β
and their significance. Other output includes the F-statistic, R2 and many other statistical
results.
When deciding whether or not a variable is significant in explaining another, a hypothesis
needs to be made. In all the following tests the following hypotheses will be tested:
H0: no relationship between the explained variable and the explanatory variable
H1: there is a relationship between the explained and explanatory variable
This means that the β’s in the formula 1 and 2 are either zero/nearly zero or significantly
different from zero. This last case implies that the explanatory variables explain the dependent
variable in a significant way. Typical significance levels (or confidence levels) vary from 90
to 99 percent. The higher the percentages the more confidence can be put in the estimated
coefficients α & β’s.
The performance of a particular model will be evaluated using two measures, the F-statistic
and R2. The F-statistic is the ratio of amount of variation (between the dependent and the
independent variables) captured by the variables and the residuals. R2 is almost the same, but
expressed as a percentages and known as the ‘goodness of fit’ of a model. It measures the
amount of variation captured in de dependent variable divided by the total variation present
between the variables. For both measures it is important to know that a higher value indicates
a better model.
44
Table 7: Variables overview
Dependent variableName Description Relevance hypothesis Source
ForbesValue 02-07 average value in USDm over 2002-2007 period average value has more historical background Forbes
Independent variableName Description Relevance hypothesis Source
PopulationSize metropolitan area number of residents in MLB teams' area bigger market; more potential income US Census BureauSize metropolitan area : 2 when the area has multiple MLB teams number of residents divided by two market divided by number of suppliers US Census BureauSize city number of residents in MLB teams' city bigger market; more potential income US Census BureauSize city: 2 when the city has multiple MLB teams number of residents divided by two market divided by number of suppliers US Census BureauNumber of major league teams all proffesionalised sports teams (MLB, NFL, NBA, NHL) more leisure suppliers; less income per team ESPN.comHousehold income metropoliton area income earned per household in the MLB teams' area more income; more leisure US Census Bureau
Historical achievementNumber of years existence number of years the team has participated in MLB relationship between teams' legacy and value MLB.comNumber of titles number of World Series the team has won in its existence past success might influence current value MLB.com
Attendance6-year average total home attendance is averaged over 6 years higher attendance; higher revenu; higher income ESPN.com6-year average percentage average of home field capacity takes away differences in stadium size ESPN.com
Payroll6-year average salaries paid to players more salary; more costs; value? ESPN.com
Performance6-year average rating best performing team gets 30 points, worst 1 point average is taken higher rating; higher value ESPN.com
6-year average games won number of wins is averaged more games won; higher value ESPN.com
Revenues Revenues 07 revenues of the MLB team higher revenues; higher value ForbesRevenues 02-07 average revenues of MLB over the period 2002-2007 average value has more historical background Forbes
45

Process
Step 1
The first step in finding relevant factors influencing MLB team value is the creation of a
correlation matrix. Using formula 1 SPSS produces this table and shows the correlation
coefficient as well its significance. It is important to take a look at the relationships between
dependent and independent variables, but also at the correlations between independents.
These correlations could have major implications when switching from a univariate to a
multivariate regression setting.
Step 2
In this step the statistical analysis will continue by performing multivariate regression. All
possible combinations of dependent variables will be analysed. A variable from each category
will be regressed against the independent variable ‘value 02-07’ using formula 2. In total 48
regressions will be run and the significance of dependent variables will examined. The R2
measure as well as the F-statistic will be used to judge the different combinations. The
variable revenue consist of data from Forbes magazine, which is not verifiable. The analysis
will result in two best models being presented, one with five factors (excluding Forbes data)
and one with six factors.
Step 3
Since finding a model with significant variables only is very unlikely further analysis is
needed. This step will eliminate irrelevant non-significant factors and try and deal with any
statistical problems which might arise. The goal is providing robust and significant factors
which determine MLB team value.
Step 4
Variables can be significant, however spurious regression does exist. This last step will
analyse the likelihood of the significant factors. For regression analysis to make sense there
must be some kind of logic behind the results which are found.
46

Results
Correlation (step 1)
The correlation matrix can be seen in table 8. In total 120 unique univariate relationships are
presented in the table, of which 96 are found to have significant correlation. All but 1 of the
independent variables has significant correlation with the dependent value variable. At first
glance this is positive because these variables might be of good uses when performing
regression analysis. However, when taking a closer look, a lot of independent variables have
high values of ρ and are significantly correlated to those in another category. Combining these
variables in a multivariate setting could create the problem of multicollinearity. As Brooks
(2008) mentions a small degree of association between explanatory variables will almost
always occur. Near multicollinearity is a phenomenon which happens in practice and arises
when there is a non-ignorable relationship between two or more of the explanatory variables.
Due to the fact that some independent variables in the data used are highly correlated caution
must be advised when using these variables in a multivariate setting.
Multivariate regression analysis (step 2)
In order to find the value drivers which significantly effect team value, multiple variables
must be analysed together. In the table 9 the results of all the 48 multiple regressions are
shown. The independent variable ‘revenues’ is added after the ‘best’ model was found with
five factors.
The model which performs the best, when solely looking at the F-statistic and R2 with five
factors, describing MLB team value:
Value of MLB team = 16.768+5.283*(payroll 6 year average)-5.024*(Performance 6 year
average rating)+4.552*(historic number of titles)-82.987*(Attendance average 6 year % of
capacity) +.001*(household income metropolitan area)
It is awkward to see that payroll has a positive effect on value, while it is cost. On the other
side higher attendance capacity has a negative relationship with value, while it is a revenue.
What must be noted is that three of the six variables do not meet the standard confidence level
requirements.
47

If Forbes data on revenue is added to the regression the following model is:
Value of MLB team = -175.678+1.193*(payroll 6 year average)-1.422*(Performance 6 year
average rating)+4.814*(historic number of titles)-143.942*(Attendance average 6 year % of
capacity) +.001*(household income metropolitan area)+3.387*(Revenues 6 year average)
Once again, also with this model setup, it must be noted that three of seven variables do not
meet the regular confidence level requirements.
Goodness of fit The two models give two different outcomes for R2, when running statistical test on these
values a significant R2 change is found. This means that adding the independent variable
‘revenues’ significantly strengthens the model.
The analysis in this step was based on R2 statistic which is probably not the best measure. A
better comparative statistic would have been the adjusted R2. Due to the fact that it adjusts
the ‘goodness of fit’ measure for the number of explanatory variables used in the regression.
This would result in lower figures for all the regressions in table 8, but would not deliver the
a different best performing model.
Multicollinearity
As noted in the previous step the results which are presented the data used contains
explanatory variables which are heavily correlated with one another. This introduces the
problem of multicollinearity into the statistical analysis. As a result the R2 will be high
implying a regression which performs on a good level18. However when a closer look is taken
at the individual independent variables most do not turn to be significant. These symptoms
can be found in the regressions which are presented above. Multicollinearity makes the
individual contribution of each variable difficult to observe according to Brooks (2008).
Adding or removing an explanatory variable could lead to large changes in to coefficient
values or significance of other variables.
Potential solutions for the presence of multicollinearity range from ignoring it, dropping
certain variables or transforming the data. In the following step the second option is chosen,
which results in excluding some of the collinear explanatory variables used until now.
18 R2 is the square of the correlation coefficient ρ relating the dependent and independent variables
48

Table 8: Correlations
49

Table 9: Results multivariate regression analysisconstant z z z z z z z z z z z z z z z z z z x x x x x x x x x x x x yPopulation size population metro z z z z zPopulation size metro/2 z z z z zpopulation size city z z z z zpopulation size city /2 z z z z zPopulation number of major league teams z z z z zPopulation Household income metropolions area data z z z z z zHistoric achievement number of year existence z z z z z z zHistoric achievement number of titels y y y y z z z z z z z y y z z z z z y z y y y yAttendence 6year average z z z z z z z z z z z z z z z z z z zAttendence 6 year % of capacity average z z z z z z z z z z z zPayroll 6 year average x x x x x x x x x x x x x x x x x x x x x x x x x x x x x x xPerformance 6 year rating (0-30) x x x x x x x x x x x x x x x x x xPerformance 6 year games won x x y y y y x x x x x x y
F-statistic 46,0
1
46,1
1
46,4
8
46,0
5
46,1
1
45,7
4
52,0
5
52,0
8
52,6
7
52,8
3
51,8
0
51,7
2
53,4
4
53,2
3
53,7
2
53,6
2
53,3
254
,09
51,9
6
51,1
5
51,2
9
51,4
0
51,1
9
51,4
7
49,8
7
49,7
4
50,4
4
50,2
549
,95
50,0
5
43,5
2
R2
0,90
6
0,90
6
0,90
6
0,90
6
0,90
6
0,90
5
0,91
6
0,91
6
0,91
6
0,91
7
0,91
5
0,91
5
0,91
8
0,91
7
0,91
8
0,91
8
0,91
70,
918
0,91
5
0,91
4
0,91
4
0,91
5
0,91
4
0,91
5
0,91
2
0,91
2
0,91
3
0,91
30,
912
0,91
2
0,90
1
constant y y y y y z z z z z z z y y y y y x xPopulation size population metro z z zPopulation size metro/2 z z zpopulation size city z z zpopulation size city /2 z z zPopulation number of major league teams z z zPopulation Household income metropolions area data z z z zHistoric achievement number of year existence z z z z z z z z z z z z z z z z zHistoric achievement number of titels y xAttendence 6year average z z z z zAttendence 6 year % of capacity average z z z z z z z z z z z z y xPayroll 6 year average x x x x x x x x x x x x x x x x x z zPerformance 6 year rating (0-30) y y y y y x x zPerformance 6 year games won x y y x x y y z z z y x significant at 5% confidence intervalRevenues 07 x y significant at 10% confidence intervalRevenues 6-year average 02-07 x z not signifcant
F-statistic 43,7
5
43,6
6
44,0
2
44,0
5
43,9
3
48,2
9
48,4
3
47,9
4
47,7
5
47,7
9
48,0
4
45,9
0
45,6
4
45,6
1
45,7
4
46,5
7
46,3
783
,98
121,
24
R2
0,90
1
0,90
1
0,90
2
0,90
2
0,90
1
0,91
0
0,91
0
0,90
9
0,90
9
0,90
9
0,90
9
0,90
5
0,90
5
0,90
5
0,90
5
0,90
7
0,90
60,
956
0,96
9
50

Model with significant variables only (step 3)
A model which contains only significant variables is statistically more robust. In the
preceding step a variable from every category was included to determine their potential
explanatory power. It was concluded that multicollinearity was present which has severe
consequences which have already been discussed earlier. Nevertheless, this step will show
which variables are significantly relevant in determining the value of a MLB team.
After investigating the variables more carefully the following two models were found to be
the most robust. Two different setups will be shown, one with and one without Forbes data.
Without Forbes data
When the confidence level is set at 10% the best model is:
R2 = .915 F-statistic = 93.134
When the confidence level is set at 5% the model would be:
R2 = .903 F-statistic = 126.012
If the non-significant variables from the previous section are added to the regression the R2
would not be significantly improved. This is proved by the following analysis:
51

The value of .240 is larger than the confidence level of 0.05, this states that the added
insignificant variables do not significantly raise the R2
With Forbes data:
When the confidence level is set at 5% the model would be:
R2 = .964 F-statistic = 233.512
Although this step has succeeded in uncovering significant variables, there is still need for a
word of caution. When studying the correlation matrix, it can be seen that the significant
explanatory variables are highly correlated with each other. The ρ ranges from 0.388 to .713
and are all significant at the 5% confidence level. Unfortunately this creates the same
undesirable consequences for the statistical analysis as was noted in the previous step.
Rationality behind the models found (step 4)
Finding statistical significant models is very important when performing regression analysis.
However, the results must also be explainable in real life.
Some observations:
Payroll positively affects the value of a team: common sense would say that
higher costs would not immediately create more value. However better players,
attracted by higher salaries, could make your team more valuable.
Attendance as percentage of stadium capacity does not enhance value: if a
MLB team sells out all its games this would create a lot of revenue and
subsequent value. This is counter intuitive.
Performance has a negative effect on value: this result also seems counter
intuitive. A possible explanation could be that a team will be popular due to its
name even though games are lost more often than won.
52

Teams history is important when determining current value: popularity of team
and the size of its fan base could have been created through the legacy of a
team.
It is very well possible that other factors, not mentioned in this empirical study, determine
value. The variables used in the preceding analysis were available and verifiable. A potential
problem which is likely present in the data is a kind of circularity. One factor may cause
another, which then effects MLB team value. This effect makes it very difficult to disentangle
the effect and point out a primary value driver.
Conclusion
In this empirical study finding significant value drivers, with regression analysis, was the
objective. Team values of MLB teams were given by Forbes magazine in its yearly edition of
the ‘Business of Baseball’. In total 15 potential revenue drivers, divided over six categories,
were created by careful data collection. In several steps and sound statistical analysis,
significant value drivers were found. Depending on the setup and the confidence levels
several variables were found to be significant. These were for example an average of past
revenues, number of World Series titles, average performance of the last six years and payroll
averages. Unfortunately, the regressions did not always result in self-explanatory signs in
front of the different variables. It is not clear why better team performance or higher
attendance figures would have a negative effect on value, while a higher payroll has a positive
one. This could be due to misspecification of the independent variables or errors in the
dataset. A problem which appeared in the data was multicollinearity which can seriously alter
the results of the statistical analysis. The fact of the matter is that significant correlation
between independent variables is present in this analysis and is hard to deal with due to the
size of the dataset. Furthermore the list of independent variables which was used in this study
is by no means complete. Some might be unobservable, immeasurable or lacking public
disclosure.
This regression analysis approach can be expanded to all major sports US which Forbes
magazine covers. It could also be extended to Europe where football team values are listed.
Whether the same variables are also applicable to these other sports is a topic for further
research. However it is likely that the factors uncovered in this empirical study are also
important when determining value of other sports enterprises.
53

10. Conclusion
This thesis has shown that professional sports teams should be regarded as truly unique
businesses. Their characteristics are very different when comparing North America and
Europe, which has implications for specific valuations approaches. Throughout this thesis
data limitations have played an important role, but this has not prevented the execution of
empirical research. The data which was at hand was used optimally and has added significant
value to the elaborate overview of available literature on this subject.
Value is determined by factors such as structure of leagues, actions by owners, revenue
drivers but also a charateristic such as team history. Standard valuations methods are not fully
equipped to be directly extended to professional sports teams. This is due to the fact that these
valuation methods are usually designed for ordinary manufacturing or service providing
companies. Another important factor is the occurrence that most teams are not listed on a
stock exchange, which limits the amount of publicly disclosed data. Those that are, provide a
wealth of information which can be used and applied on comparable companies. Together
with historical and sector specific information an estimation of value can be made albeit with
some reservations. Where standard textbooks do provide some important insights, the
empirical research in this thesis provides additional views on valuation in professional sports.
Although this thesis would have liked to provide a quantified discount factor and a waterproof
valuation framework, common sense would have already precluded this. Instead it has given
the reader a thorough and detailed overview of very interesting aspects of modern day
professional sports. The value of these businesses are changing every day and they attract the
attention of many. Those who are interested can use the knowledge in this field, which was
displayed in this thesis, to understand the processes which drive value. The limitations of this
thesis are its focus on only two specific parts of professional sports. However, the two
empirical studies have already stated that the methodology which was applied, could also be
implemented on other sports and markets. This further research could be used to verify the
conclusions of the empirical studies in a different setting.
Another avenue of research would be focussing purely on listed football clubs and investigate
if their stock prices is affected by changes in different revenue streams or risk factors
presented in this thesis. This element was behond the scope of this thesis.
54

References
Articles:
Andreff, W. & Staudohar, P.D. (2000) The evolving European model of Professional sports Finance. Journal of Sport Economics, 1, 257-276
Ascari, G. & Gagnepain, P. (2006) Spanish Football. Journal of Sport Economics 7, 76-89
Buraimo, B., Simmons, R. & Szymanski, S. English Football. Journal of Sport Economics 29-46
Baroncelli, A. & Lago, U (2006) Italian Football. Journal of Sport Economics, 7, 13-28.
Frick, B & Prinz, J. (2006) Crisis? What crisis? Football in Germany. Journal of Sport Economics, 7, 60-75
Gouget, J-J. & Primault, D. (2006) The French Expection Journal of Sport Economics, 7, 47-59
Lago, U., Simmons, R. & Szymanski, S. (2006) The Financial Crisis in European Football: An Introduction Journal of Sport Economics, 7, 3-12
Books:
Brooks, C. (2008) Introductory econometrics for finance. Cambridge: Cambridge University Press
Cooke, A. (1994) The economics of leisure and sport. London: Routledge
Damodaran, A. (2002) Investment valuation. New York: John Wiley & Sons Inc.
Koller, T., Goedhart, M. & Wessels, D. (2005) Valuation: Measuring and Managing the Value of Companies. Hoboken: McKinsey & Company Inc.
Leeds, M.A. & von Allmen, P. (2008) The economics of sports. Boston: Pearson Education
Moore, D.S., McCabe, G.P., Duckworth, W.M. & Alwan, L.C. (2009) The practice of Business statistics. New York: W.H. Freeman and Co.
Morrow, S. (1999) The new business of football. London: Macmillan Press Ltd.
Reilly, R.F. & Schweihs, R.P. (2004) The handbook of business valuation and intellectual property analysis. New York: McGraw-Hill
Sandy, R., Sloane, P.J. & Rosentraub, M.S. (2004) The economics of sport: An international perspective. New York: Palgrave Macmillan
55

Smith, G.V. & Parr, R.L. (1994) Valuation of intellectual property an intangible assets. (1994) New York: John Wiley & Sons Inc.
Online reports:
Business of Baseball 2008:
http://www.forbes.com/sportsbusiness/2008/04/16/baseball-team-values-bix-sports-baseball08-cx_mo_kb_0416baseball_land.html
by Michael K. Ozanian and Kurt Badenhausen
The Most Valuable Soccer Teams
http://www.forbes.com/2008/04/30/valuable-soccer-teams-biz-soccer08-cx_jg_pm_0430soccer_land.html
by Jack Gage and Paul Maidment
Annual review of Football Finance: Sterling Silverware
29th May 2008 Deloitte
56