Embed Size (px)
Citation preview
Two-Dimensional Modeling of the Effect of Relative Humidity on Volatile
Organic Compounds Adsorption in a Fixed Bed Adsorber
by
Imranul Islam Laskar
A thesis submitted in partial fulfillment of the requirements for the degree of
Master of Science
in
Environmental Engineering
Department of Civil and Environmental Engineering
University of Alberta
© Imranul Islam Laskar, 2017

ii
ABSTRACT
Water vapor can affect adsorption of volatile organic compound (VOC) onto
activated carbon. In this research, a two-dimensional heterogenous computational fluid
dynamics model was developed and validated to understand the mechanism and kinetics
during competitive adsorption between VOC and water vapor in a beaded activated
carbon (BAC) fixed-bed adsorber. The model comprised of a VOC-water vapor
multicomponent competitive adsorption isotherm and governing transport phenomena
equations. The multicomponent competitive adsorption isotherm was based on Manes
method, which requires only single-component adsorption isotherms of adsorbates as
inputs. Consequently, a modified Dubinin-Radushkevich (MDR) isotherm equation and
Qi-Hay-Rood (QHR) isotherm equation were used to describe the pure single-component
adsorption equilibrium of VOC (type I) and water vapor (type V), respectively. The MDR
and QHR isotherm equations fitted the experimental data of pure VOC adsorption and
water vapor adsorption on BAC with an overall r2 value of 0.998 and 0.999 respectively.
The governing transport phenomena component of the model consists of macroscopic
mass, momentum, and energy conversation equations. The model predicted the
competitive adsorption isotherms, breakthrough and bed temperature profiles of selected
VOCs (2-propanol, acetone, toluene, n-butanol, 1,2,4-trimethylbenzene) with a mean
relative absolute error (MRAE) of 3.6%, 15.4% and 2.2% respectively. Sensitivity analysis
was also conducted to test the robustness of the model in detecting the impact of relative
humidity (RH) on VOC adsorption with change in adsorption temperature and inlet
adsorbate concentration; and an overall MRAE of 6.6% was observed between the
experimental and simulated results. The model, hence, can be used for optimizing

iii
adsorber design and operating conditions to minimize the impact of RH during
adsorption of contaminants from gas streams.

iv
I dedicate this dissertation to my beloved parents, Saleha and Ashraful-Haque, my
dearest grandparents, Abdul-Latif and Aklasun-Nessa, and my adorable sister,
Sabina. They have been a constant source of support, motivation, and perseverance
for me throughout my life.
v
ACKNOWLEDGEMENTS
First and foremost, I would like to express my deepest gratitude to my supervisor,
Dr. Zaher Hashisho, for his supervision, guidance and generous support throughout my
course work and research. I highly appreciate his invaluable comments and continuous
feedback throughout my MSc research. This work could not have been accomplished
without his profound knowledge, guidance and passion.
I would like to acknowledge the financial support from the Ford Motor Company,
and the Natural Sciences and Engineering Research Council (NSERC) of Canada.
I would also like to thank my colleagues in Air Quality Characterization Lab, for
their suggestions and assistance in my experiments.
I am grateful to the technicians in the Department of Civil and Environmental
Engineering, Chen Liang and David Zhao, for their help and support during this research
work.
Finally, I would like to thank my friends and anyone who directly or indirectly have
lent their helping hands in this research.
vi
TABLE OF CONTENTS
ABSTRACT .................................................................................................................................................. ii
ACKNOWLEDGEMENTS ......................................................................................................................... v
TABLE OF CONTENTS ............................................................................................................................ vi
LIST OF TABLES....................................................................................................................................... ix
LIST OF FIGURES ..................................................................................................................................... x
LIST OF ACRONYMS .............................................................................................................................. xii
CHAPTER 1 INTRODUCTION .......................................................................................................... 1
1.1 Background ................................................................................................................................. 2
1.1.1 Volatile Organic Compounds (VOCs) .................................................................................. 2
1.1.2 Sources of VOCs emissions ................................................................................................... 2
1.1.3 Impact of VOCs on Human Health and Environment ...................................................... 3
1.1.4 Methods and Techniques to Curb VOCs Emissions .......................................................... 4
1.1.5 Importance of Mathematical Modeling in Adsorption ..................................................... 5
1.2 Problem Statement .................................................................................................................... 6
1.3 Research Objectives ................................................................................................................... 7
1.4 Research Significance ................................................................................................................ 8
1.5 Thesis Outline ............................................................................................................................. 9
1.6 References ................................................................................................................................. 10
CHAPTER 2 LITERATURE REVIEW ................................................................................................... 16
2.1 Competitive Adsorption of Water Vapor and VOCs ............................................................ 17
2.1.1 Special Behaviour of Water Vapor on Activated Carbon ................................................ 17
2.1.2 Impact of Relative Humidity on Adsorption Capacity for VOCs ............................... 19
2.2 Adsorption Isotherm Models for Predicting Equilibria ...................................................... 21
2.2.1 Single-Component Adsorption Isotherm Models for VOCs ....................................... 22
2.2.1.1 Langmuir Isotherm Model ......................................................................................... 22
2.2.1.2 Freundlich Isotherm Model ....................................................................................... 23
2.2.1.3 Brunauer-Emmett-Teller Isotherm Model .............................................................. 23
2.2.1.4 Toth Isotherm Model .................................................................................................. 24
2.2.1.5 Dubinin-Radushkevich Isotherm Model ................................................................. 25
2.2.1.6 Dubinin-Astakhov Isotherm Model .......................................................................... 27
2.2.1.7 Modified Dubinin-Radushkevich Isotherm Model ................................................ 27
2.2.2 Single-Component Adsorption Isotherm Models for Water Vapor .......................... 29
vii
2.2.2.1 Modified Dubinin-Astakhov Isotherm Model ...................................................... 29
2.2.2.2 Dubinin-Serpinski Isotherm Model ....................................................................... 30
2.2.2.3 Qi-Hay-Rood Isotherm Model................................................................................ 31
2.2.2.4 Talu-Meunier Isotherm Model ............................................................................... 33
2.2.2.5 Qi-LeVan Isotherm Model ...................................................................................... 34
2.2.2.6 Do and Do Isotherm Model .................................................................................... 35
2.2.3 Multicomponent Competitive Adsorption Isotherm Models ..................................... 36
2.2.3.1 Jain and Snoeyink’s Extended Langmuir Isotherm Model ................................ 36
2.2.3.2 Ideal Adsorbed Solution Theory ............................................................................. 39
2.2.3.3 Real Adsorbed Solution Theory .............................................................................. 42
2.2.3.4 Vacancy Solution Model .......................................................................................... 44
2.2.3.5 Method of Chou and Chiou ..................................................................................... 45
2.2.3.6 Virial Mixture Coefficient Method ......................................................................... 46
2.2.3.7 Method of Doong and Yang .................................................................................... 48
2.2.3.8 Method of Okazaki, Tamon and Toei .................................................................... 50
2.2.3.9 Method of Manes ...................................................................................................... 52
2.3 Summary and Conclusions ..................................................................................................... 55
2.4 References ................................................................................................................................. 62
Chapter 3 MATERIALS AND METHODS ............................................................................................ 69
3.1 Experimental Setup and Method ........................................................................................... 70
3.2 Model Development ................................................................................................................. 74
3.2.1 Physical Model .................................................................................................................. 74
3.2.2 VOC-Water Vapor Multicomponent Adsorption Isotherm Formulation ................. 81
3.2.2.1 Input Parameters for Manes Method ....................................................................... 83
3.2.2.1.1 Pure Single-Component VOC Adsorption Isotherm ......................................... 83
3.2.2.1.2 Pure Single-Component Water Vapor Adsorption Isotherm .......................... 83
3.2.2.2 Solving Manes Method ............................................................................................ 84
3.2.3 Transport Phenomena Formulation .............................................................................. 90
3.2.3.1 Governing Transport Phenomena ............................................................................. 90
3.2.3.1.1 Gas-Phase Mass Balance ....................................................................................... 90
3.2.3.1.2 Adsorbed-Phase Mass Balance ............................................................................ 92
3.2.3.1.3 Momentum Balance .............................................................................................. 93
3.2.3.1.4 Energy Balance ...................................................................................................... 94
viii
3.2.3.2 Variable and Parameters Definition ...................................................................... 95
3.2.3.3 Initial and Boundary Conditions ............................................................................ 96
3.2.3.4 Solution Method ....................................................................................................... 96
3.3 Model Validation Method ....................................................................................................... 97
3.4 References ............................................................................................................................... 100
Chapter 4 RESULTS AND DISCUSSION ........................................................................................... 104
4.1 Validation of Pure Single-Component Isotherms .............................................................. 105
4.2 Validation of VOC-Water Vapor Multicomponent Competitive Adsorption Isotherm 109
4.3 Validation of Adsorption Breakthrough Profiles ............................................................... 116
4.4 Absorbed-Phase Concentration Distribution ..................................................................... 120
4.5 Absorber Bed Temperature Distribution ............................................................................ 123
4.5 Sensitivity Analysis ................................................................................................................ 127
4.5.1 Effect of Adsorption Temperature ............................................................................... 127
4.5.2 Effect of Inlet Gas Concentration ................................................................................. 128
4.6 References ............................................................................................................................... 131
Chapter 5 CONCLUSIONS AND RECOMMENDATIONS ........................................................ 133
5.1 Thesis Overview ...................................................................................................................... 134
5.2 Conclusions ............................................................................................................................. 135
5.3 Recommendations for Future Work .................................................................................... 137
5.4 References ............................................................................................................................... 139
WORKS CITED ....................................................................................................................................... 140
APPENDIX A MATLAB CODE FOR MANES METHOD .......................................................... 153
ix
LIST OF TABLES
Table 2-1. Advantages and disadvantages of the commonly used adsorption isotherms ............ 57
Table 3-1. Model variables and parameters ....................................................................................... 76
Table 3-2. Initial and boundary conditions ........................................................................................ 96
Table 4-1. Multitemperature fitting parameters of MDR isotherms for adsorption of pure VOCs
on BAC at 298.15 K ................................................................................................................................ 105
Table 4-2. Multitemperature fitting parameters of QHR isotherm for adsorption of pure water
vapor on BAC at 298.15 K ..................................................................................................................... 109
Table 4-3. Physical properties of the selected adsorbates (Haynes, 2017) .................................. 114
Table 4-4. Surface diffusion, pore diffusion, and external mass transfer coefficient of the
selected adsorbates at 298.15 K ........................................................................................................... 117

x
LIST OF FIGURES
Figure 3-1. Bench-scale experimental setup for competitive adsorption between VOC and water
vapor. ......................................................................................................................................................... 72
Figure 3-2. Simplification of the simulated adsorption unit into an 2D axisymmetric geometry.
.................................................................................................................................................................... 75
Figure 3-3. Flowchart describing the procedure to numerically solve Manes-method and its
extension for water-miscible VOCs. ...................................................................................................... 88
Figure 4-1. Experimental and fitted MDR isotherms for (a) toluene, (b) n-butanol, (c) 1,2,4-
TMB, (d) acetone, (e) 2-propanol adsorption onto BAC at 298.15 K. ............................................ 107
Figure 4-2. Experimental and fitted QHR isotherm for water adsorption onto BAC at 298.15 K.
.................................................................................................................................................................. 108
Figure 4-3. Polar versus non-polar VOC: comparison of experimental and modeled
equilibrium adsorption capacities of (a) VOC and (b) water vapor during their competitive
adsorption on BAC at 298.15 K. ........................................................................................................... 111
Figure 4-4. 2D competitive adsorption isotherm for water vapor and non-polar VOC at 298.15
K on BAC: Amount of (a) toluene, (b) water vapor adsorbed in toluene-water vapor system; (c)
n-butanol, (d) water vapor adsorbed in n-butanol-water vapor system; (e) 1,2,4-TMB, (f) water
vapor adsorbed in 1,2,4-TMB-water vapor system. .......................................................................... 115
Figure 4-5. 2D competitive adsorption isotherm for water vapor and polar VOC at 298.15 K on
BAC: Amount of (a) acetone, (b) water vapor adsorbed in acetone-water vapor system; (c) 2-
propanol, (d) water vapor adsorbed in 2-propanol-water vapor system. ...................................... 116
Figure 4-6. Comparison of experimental and modeled breakthrough curves during competitive
adsorption of water vapor with (a) 2-propanol, (b) acetone, (c) n-butanol, (d) toluene, and (e)
1,2,4-TMB on BAC at 298.15 K. ............................................................................................................ 119
Figure 4-7. 2D adsorbed-phase concentration distribution of 2-propanol during competitive
adsorption with water vapor on BAC at 298.15 K. ............................................................................. 122
Figure 4-8. Comparison of experimental and modeled BAC-bed temperature profiles at the
centre of the reactor (r = 0.0 cm, z = 7.5 cm) during competition adsorption of water vapor with
(a) 2-propanol, (b) acetone, (c) n-butanol, (d) toluene, (e) 1,2,4-TMB. ......................................... 124
Figure 4-9. 2D adsorber bed temperature distribution during competitive adsorption of 2-
propanol with water vapor at 298.15 K. .............................................................................................. 126
Figure 4-10. Comparison of experimental and modeled breakthrough curves during
competition adsorption of water vapor with 2-propanol on BAC at 298.15 K and 305.15 K. ..... 128

xi
Figure 4-11. Competitive adsorption of water vapor and 1,2,4-TMB on BAC at 298.15 K: (a)
comparison of experimental and modeled breakthrough curves; (b) comparison of experimental
equilibrium adsorption capacity with modeled results. ................................................................... 130
xii
LIST OF ACRONYMS
1,2,4-TMB 1,2,4-Trimethylbenzene
2D Two-Dimensional
AC Activated Carbon
ACC Activated Carbon Cloth
BAC Beaded Activated Carbon
BDDT Brunauer-Deming-Deming-Teller
BET Brunauer-Emmett-Teller
DA Dubinin-Astakhov
DAC Data Acquisition and Control
DR Dubinin-Radushkevich
DS Dubinin-Serpinski
FID Flame Ionization Detector
GAC Granular Activated Carbon
HTZ Heat Transfer Zone
IAST Ideal Adsorbed Solution Theory
LDF Linear Driving Force
MDA Modified Dubinin-Astakhov
MDR Modified Dubinin-Radushkevich
MRAE Mean Relative Absolute Error
MTZ Mass Transfer Zone
NRMSE Normalized Root-Mean-Square Error
PDE Partial Differential Equation
xiii
QHR Qi-Hay-Rood
QLV Qi-LeVan
RAST Real Adsorbed Solution Theory
RH Relative Humidity
RMSE Root-Mean-Square Error
SLPM Standard Liters Per Minute
TCE Trichloroethylene
TM Talu-Meunier
UNIQUAC UNIversal QUAsiChemical
VMC Virial Mixture Coefficient
VOC Volatile Organic Compound
VSM Vacancy Solution Model
WHO World Health Organization

1
CHAPTER 1 INTRODUCTION

2
1.1 Background
1.1.1 Volatile Organic Compounds (VOCs)
Volatile organic compounds (VOCs) are among the most common environmental
contaminants that can negatively impact human health and wellness (Khan and Ghoshal,
2000; Pramar and Rao, 2009). Environment and Climate Change Canada defines VOCs
as “organic compounds containing one or more carbon atoms that evaporate readily to
the atmosphere, and do not include photochemically non-reactive compounds such as
methane, ethane and the chlorofluorocarbons” (Environment and Climate Change
Canada, 2016). Similarly, according to the United States Environmental Protection
Agency, VOC means “any compound of carbon, excluding carbon monoxide, carbon
dioxide, carbonic acid, metallic carbides or carbonates and ammonium carbonate, which
participates in atmospheric photochemical reactions” (United States Environmental
Protection Agency, 2017). VOCs are sometimes classified by their boiling points. For
example, the European Union defines VOCs as “organic compounds having an initial
boiling point less than or equal to 250 oC measured at a standard atmospheric pressure
of 101.3 kPa” (The European Union, 2004). The World Health Organization (WHO) also
categorizes VOCs based on their boiling point. They classify VOCs as organic compounds
with boiling point ranging from (50 - 100 oC) to (240 - 260 oC) (WHO, 1989).
1.1.2 Sources of VOCs emissions
VOCs are released to the atmosphere from both natural and anthropogenic
sources. Natural sources are wetlands, forests, oceans, and volcanoes (Guenther, 1995).
Man-made or anthropogenic sources of VOCs include vehicular emissions, oil refineries,
chemical process facilities, commercial, and household products (Piccot et al., 1992;

3
United States Environmental Protection Agency, 2016). In 2014, the total VOC emissions
in Canada were 2.157 megatonnes, which is an increase of 1% from 2013 levels. The largest
contributors were the oil and gas sector (34%), industries handling paints and solvents
(15%), and agricultural activities (12%). By province, Alberta emitted the highest
percentage of national emissions (35%), followed by Ontario (18%), and Quebec (14%)
(Environment and Climate Change Canada, 2016). In North America, automotive
painting operations are one of the major sources of VOC emissions with an estimated
usage of about 6.58 kg VOCs as paint solvents per vehicle in a typical automobile
manufacturing plant (Kim, 2011; Papasavva et al., 2001). Such emission streams contain
a mixture of low and high molecular weight organic compounds such as aromatic
hydrocarbons, aliphatic hydrocarbons, alcohols, esters, ethers, ketones, polyaromatic
hydrocarbons, etc. (Kim, 2011).
1.1.3 Impact of VOCs on Human Health and Environment
Due to their volatility and photochemical reactivity, VOCs are the main precursors
to the formation of ground-level ozone in the atmosphere, giving rise to photochemical
smog (Kim, 2011; Pramar and Rao, 2009). Such type of air pollution is known to have
adverse effects on human health and environment (Environment and Climate Change
Canada, 2016). Exposure to VOCs could lead to eye, nose and throat irritation, nausea,
dizziness, headaches, and damage to lungs, kidney, liver and central nervous system
(Leslie, 2000; Kampa and Castanas, 2008). Some VOCs are also listed as human
carcinogens by the National Toxicology Program, and may react in the atmosphere to
form mutagenic or carcinogenic species (National Toxicology Program, 2016; Fletcher et
al., 2006). Moreover, VOCs are detrimental to the environment, since their exposure to

4
crops and forests could lead to reduced yields, growth, and increased susceptibility of
plants to diseases, pests, and severe weather (Environment and Climate Change Canada,
2016). Because of the effects mentioned above, environmental legislations to limit and
ultimately reduce air pollution have been introduced in recent years by several
governments and intergovernmental organizations (Fletcher et al., 2006). Hence,
enhanced and efficient abatement methods are a necessity, especially for the treatment of
VOC laden streams.
1.1.4 Methods and Techniques to Curb VOCs Emissions
Technologies mainly used to control VOCs emissions include adsorption,
absorption, condensation, oxidation, incineration, catalytic and thermal oxidation, and
biofiltration, and membrane separation (Pramar and Rao, 2009; Leethochawalit et al.,
2001). Adsorption is one of the most commonly used methods for the treatment of waste
gaseous and aqueous streams because of its low operation and maintenance costs, high
removal efficiency at low contaminant concentrations, adsorbent reusability, and the
possibility of adsorbate recovery and reuse (Dabrowski et al., 2005; Efremenko and
Sheintuch, 2006; Gupta and Verma, 2002; Hung and Bai, 2008; Lapkin et. al., Joyce and
Crittenden, 2004; Pelekani and Snoeyink, 1999; Ramos et al., 2010; Shonnard and Hiew,
2000). Out of the many commercially available adsorbents, activated carbon is the most
widely used adsorbent for such treatment processes. It is inexpensive, has large surface
area, high adsorption capacity for organics, and can have its physical and chemical
properties tailored to suit process conditions (Aktas and Cecen, 2006, 2007; Alvarez et
al., 2005; Dabrowski et al., 2005; Hashisho et al., 2005, 2008; Kawasaki et al., 2004;
Popescu et al., 2003; Yang, 2003). Activated carbon is also available in many forms such

5
as fibres, beads, powders, monoliths, and granules, and therefore, has a wide range of
applications (Yang, 2003). Such advantages make activated carbon adsorption systems
very attractive, and they are mostly carried out in a fixed bed configuration. Fixed bed
adsorption processes are omnipresent throughout the chemical process industry and are
frequently used for small-scale and industrial-scale air pollution control processes
(Calvert and Englund, 1984). However, optimization of the design and process
parameters such as adsorption capacity, breakthrough time, etc., are critical to a highly
efficient, economical and environmentally sustainable fixed bed adsorption system for
VOCs emissions control (Yang, 1987).
1.1.5 Importance of Mathematical Modeling in Adsorption
Adsorption process and design parameters have been conventionally based on the
experimental results from laboratory and pilot-plant tests. But such experiments only
help in predicting the parameters specifically tested, and are not suitable for extrapolating
other non-tested variables or parameters. Also for holistic design of processes such as
adsorption several runs of experiments are required, which put significant amount of
stress on resources from an economics and environment protection point of view
(Thomas and Crittenden, 1998; Weber and Smith, 1987). However, verified mathematical
models can be used to facilitate optimization of an adsorber by drastically reducing the
number of tests required to evaluate various operating conditions and design parameters
(Thomas and Crittenden, 1998). Such models are generally validated from few simple and
well-controlled bench-scale experiments. Once verified, a mathematical model can be
utilized to predict non-tested process variables and conduct sensitivity analysis. It can
also be used to evaluate and enhance the performance of an adsorber at a variety of
6
operating conditions, in addition to those that were experimented at (Weber and Smith,
1987; Xu et al., 2013). The aforementioned sentences signify the many advantages of
mathematical modelling.
1.2 Problem Statement
Water vapor is typically present in VOC-laden streams and ambient air directed to
fixed bed adsorption columns for separation, purification, and recovery. In such
scenarios, water vapor would compete with VOCs for adsorption sites on the surface of
the adsorbent, and even reduce the adsorption capacity for VOCs and service life of a fixed
bed adsorber (Nastaj et al., 2016; Huggahalli and Fair, 1996; Linders et al., 2001; Qi et
al., 2000; Cal et al., 1996; Ye et al., 2003; Taqvi et al., 1999; Li et al., 2010). Therefore, it
is imperative to understand the effects of water vapor on the fixed bed adsorption of
VOCs. This would require an accurate prediction of multicomponent coadsorption
equilibria and kinetics of water vapor and VOCs, which can serve as a reference for
designing and operating fixed bed adsorbers to control VOC emissions (Yang, 1987).
Most mathematical models involving competitive adsorption do not account for
water vapor due to the difficulty in modeling the behavior of competing water molecules.
In addition, the majority of the models are one-dimensional and focus only on axial
variation of adsorption process parameters. They fail to analyse important factors such as
radial dispersion and channeling effects in an adsorber column, and therefore have
limitations in comprehensively simulating a fixed bed adsorption process (Fournel et al.,
2010; Joly and Perrard, 2009; Murillo et al., 2004; Chuang et al., 2003; Puértolas et al.,
2010). In recent years, there were a few studies which carried out two-dimensional (axial
and radial) mathematical modeling to predict the transport processes (mass, momentum,

7
and energy) in a fixed bed adsorber, and had good accuracy (Tefera et al., 2014, 2013;
Schlüter et al., 2016; Coker et al., 2015). However, these models do not consider the
impact of water vapor on the adsorption process. As mentioned earlier, water vapor or
relative humidity (RH) (amount of water vapor in air at a given temperature and pressure)
significantly affects the equilibrium and kinetics of adsorption processes used for the
control of VOCs emissions from waste gas streams, especially at low concentrations
(Nastaj et al., 2016). Unfortunately, research on multicomponent competitive adsorption
equilibrium between water vapor and VOCs have been very rare, and very few reports
exist in literature. The existing models for predicting competitive adsorption equilibrium
between organics and water vapor are generally empirical or semi-empirical, and their
solution methods being either graphical or numerical (Appel et al., 1998; Do, 1998;
Gun’ko et al., 2008; Linders et al., 2001; Manes, 1984; Nastaj et al., 2016; Okazaki et al.,
1978; Qi and LeVan, 2005a; Qi et al., 2000). A few of them have fairly good accuracy but
are thermodynamically inconsistent (Nastaj et al., 2016). But in all cases, application of
these equilibria models for predicting a dynamic fixed bed adsorber operation is
extremely tedious and difficult, and is considerably incompatible with simulation (Tien,
2013). Therefore, there is a need for thermodynamically consistent and simulation-
friendly multicomponent competitive adsorption equilibria for organics-water vapor
systems.
1.3 Research Objectives
The goal of this research work is to study, develop, and validate a two-dimensional
(2D) mathematical model for predicting the effects of carrier gas relative humidity on

8
adsorption of VOCs mainly emitted from automotive painting operations, on a fixed bed
of beaded activated carbon (BAC). The main objectives can be described as given below:
• Modeling and validation of a 2D multicomponent competitive adsorption
isotherm which clearly describes the equilibria between the amount of water
vapor and VOCs adsorbed, and the amount of water vapor and VOCs in the
bulk gas phase. The isotherm will cover all ranges of concentrations of the
components involved.
• 2D modeling and verification of the transport phenomena in a fixed bed
adsorber during coadsorption of VOCs and water vapor. The
multicomponent adsorption isotherm is taken as an input for
simultaneously solving the mass, momentum, and energy transfer
equations in the adsorber. The model will then be used to perform
sensitivity analysis of the fixed bed adsorber.
• Experiments for model validation will be carried out in a small-scale fixed
bed adsorber setup, and their results will be compared to the modeled
results for the same set of design and operating conditions.
1.4 Research Significance
This study will investigate the impact of water vapor on competitive adsorption by
investigating, suggesting, and developing a suitable thermodynamically consistent model
which will coherently predict the multi-component adsorption equilibria and transport
phenomena of all the components involved. The model will be able to analyse both radial
and axial variations in adsorption parameters and will also be sensitive to changes in
operational conditions. This will contribute to a better understanding of the mechanism
9
of the competing water vapor and VOC molecules during competitive adsorption. The
model developed in this study will help the industry in optimizing adsorber design and
operation conditions to minimize the severe impact of RH during adsorption of
contaminants from gas streams.
1.5 Thesis Outline
This thesis consists of five chapters. Critical literature reviews of existing studies
on the impact of relative humidity on adsorption of VOCs and other gases, as well as
available multicomponent competitive adsorption isotherm models are provided in
Chapter 2. Chapter 3 provides details on the materials and methods applied to develop
and experimentally validate two-dimensional mathematical model for multicomponent
competitive adsorption of water vapor with VOCs. Chapter 4 focuses on the results of the
mathematical modelling, their discussions, and verifications. Finally, a summary of the
findings of this study, the main conclusions, and recommendations for future works are
presented in Chapter 5.
10
1.6 References
Aktas, O., & Cecen, F. (2006). Effect of type of carbon activation on adsorption and its
reversibility. J. Chem. Technol. Biot., 81, 94-101.
Aktas, O., & Cecen, F. (2007). Competitive adsorption and desorption of a bi-solute
mixture: Effect of activated carbon type. Adsorption, 13, 159-169.
Alvarez, P., Garcia-Araya, J., Beltran, F., Masaa, F., & Medina, F. (2005). Ozonation of
activated carbons: Effect on the adsorption of selected phenolic compounds from
aqueous solutions. J. Colloid Interf. Sci., 283, 503-512.
Appel, W., LeVan, M., & Finn, J. (1998). Nonideal adsorption equilibria described by pure
component isotherms and virial mixture coefficients. Ind. Eng. Chem. Res., 37,
4774-4782.
Cal, M., Rood, M., & Larson, S. (1996). Removal of VOCs from humidified gas streams
using activated carbon cloth. Gas Sep. Purif., 10, 117-121.
Calvert, S., & Englund, H. (1984). Handbook of Air Pollution Technology. New York:
John Wiley & Sons, Inc.
Chuang, C., Chiang, P., & Chang, E. (2003). Modeling VOCs adsorption onto activated
carbon. Chemosphere, 53, 17-27.
Coker, R., Gomez, C., & Schunk, G. (2015). Multi-Dimensional Adsorption Model of
CO2/H2O Sorbent Bed. COMSOL Conference. Boston: COMSOL.
Dabrowski, A., Podkoscielny, P., Hubicki, Z., & Barczak, M. (2005). Adsorption of
phenolic compounds by activated carbon - A critical review. Chemosphere, 58,
1049-1070.
Do, D. (1998). Adsorption Analysis: Equilibria and Kinetics. London: Imperial College
Press.
Efremenko, I., & Sheintuch, M. (2006). Predicting solute adsorption on activated carbon:
phenol. Langmuir, 22, 3614-3621.
Environment and Climate Change Canada . (2016). Volatile Organic Compounds in
Consumer and Commercial Products. Retrieved from http://www.ec.gc.ca/cov-
voc/Default.asp?lang=En&n=BEE9D2C5-1
11
Environment and Climate Change Canada. (2016). Volatile Organic Compound
Emissions. Retrieved from https://www.ec.gc.ca/indicateurs-
indicators/default.asp?lang=en&n=64B9E95D-1
Environment and Climate Change Canada. (2016). Volatile organic compounds that
participate in atmospheric photochemical reactions. Retrieved from
http://www.ec.gc.ca/toxiques-toxics/Default.asp?lang=En&n=98E80CC6-
1&xml=075320D0-CF6E-4261-890E-90725A29E3C4
Fletcher, A., Kennedy, M., Zhao, X., Bell, J., & Thomas, K. (2006). Adsorption of Organic
Vapour Pollutants on Activated Carbon. Recent Advances in Adsorption Processes
for Environmental Protection and Security (pp. 29-54). Kiev: NATO Science for
Peace and Security.
Fournel, L., Mocho, P., Brown, R., & Le Cloirec, P. (2010). Modeling breakthrough curves
of volatile organic compounds on activated carbon fibers. Adsorption, 16, 147-153.
Guenther, A. (1995). A global model of natural volatile organic compound emissions. J.
Geophy. Res., 100(D5), 8873-8892.
Gun’ko, V., Turov, V., & Kozynchenko, O. (2008). Characteristics of adsorption phase
with water/organic mixtures at a surface of activated carbons possessing
intraparticle and textural porosities. App. Surf. Sci., 25, 3220-3231.
Gupta, V., & Verma, N. (2002). Removal of volatile organic compounds by cryogenic
condensation followed by adsorption. Chem. Eng. Sci., 57, 2679-2696.
Hashisho, Z., Emamipour, H., Rood, M., Hay, K., Kim, B., & Thurston, D. (2008).
Concomitant adsorption and desorption of organic vapor in dry and humid air
streams using microwave and direct electrothermal swing adsorption. Environ.
Sci. Technol., 42, 9317-9322.
Hashisho, Z., Rood, M., & Botich, L. (2005). Microwave-swing adsorption to capture and
recover vapors from air streams with activated carbon fiber cloth. Environ. Sci.
Technol., 39, 6851-6859.
Huggahalli, M., & Fair, J. (1996). Prediction of Equilibrium Adsorption of Water onto
Activated Carbon. Ind. Eng. Chem. Res., 35, 2071-2074.

12
Hung, C., & Bai, H. (2008). Adsorption behaviors of organic vapors using mesoporous
silica particles made by evaporation induced self-assembly method. Chem. Eng.
Sci., 63, 1997-2005.
Joly, A., & Perrard, A. (2009). Linear driving force models for dynamic adsorption of
volatile organic compound traces by porous adsorbent beds. Math. Comp. Sim.,
79, 3492-3499.
Kampa, M., & Castanas, E. (2008). Human health effects of air pollution. Environ. Pollut.,
151, 362-367.
Kawasaki, N., Kinoshita, H., Oue, T., Nakamura, T., & Tanada, S. (2004). Study on
adsorption kinetic of aromatic hydrocarbons onto activated carbon in gaseous flow
method. J. Colloid Interface Sci., 275, 40-43.
Khan, F., & Ghoshal, A. (2000). Removal of volatile organic compounds from polluted
air. J. Loss Prev. Process Ind., 13, 527-545.
Kim, B. (2011). VOC emissions from automotive painting and their control: A review.
Environ. Eng. Res., 16, 1-9.
Lapkin, A., Joyce, L., & Crittenden, B. (2004). Framework for evaluating the “Greenness”
of chemical processes: Case studies for a novel VOC recovery technology. Environ.
Sci. Technol., 38, 5815-5823.
Leethochawalit, M., Bustard, M., Wright, P., & Meeyoo, V. (2001). Novel vapor-phase
biofiltration and catalytic combustion of volatile organic compounds. Ind. Eng.
Chem. Res., 40(23), 5334-5341.
Leslie, G. (2000). Health risks from indoor air pollutants: Public alarm and toxicological
reality. Indoor Built Environ., 9, 5-16.
Li, C., Xuemin, H., Fangning, F., & Fengli, J. (2010). Effect of relative humidity on
adsorption capacity of organic vapors on activated carbon and prediction by the
modified D-R equation. International Conference on Digital Manufacturing &
Automation , (pp. 608-611). Changha, Hunan.
Linders, M., van den Broeke, L., Kapteijn, F., & Moulijn, J. A. (2001). Binary Adsorption
Equilibrium of Organics and Water on Activated Carbon. AIChE J., 47, 1885-1892.

13
Manes, M. (1984). Estimation of the effects of humidity on the adsorption onto activated
carbon of the vapors of water-immiscible organic liquids. Fundamentals of
Adsorption (pp. 335-344). New York: Engineering Foundation.
Murillo, R., García, T., Aylón, E., Callén, M., Navarro, M., López, J., & Mastral, A. (2004).
Adsorption of Phenanthrene on Activated Carbons: Breakthrough Curve
Modeling. Carbon, 42, 2009-2017.
Nastaj, J., Witkiewicz, K., & Chybowska, M. (2016). Modeling of multicomponent and
multitemperature adsorption equilibria of water vapor and organic compounds on
activated carbons. Ads. Sci. Technol., 34, 144-175.
National Toxicology Program. (2016). 14th Report on Carcinogens. Retrieved from
https://ntp.niehs.nih.gov/pubhealth/roc/index-1.html
Okazaki, M., Tamon, H., & Toei, R. (1978). Prediction of binary adsorption equilibria of
solvent and water vapor on activated carbon. J. Chem. Eng. Japan, 11, 209-215.
Papasavva, S., Kia, S., Claya, J., & Gunther, R. (2001). Characterization of automotive
paints: An environmental impact analysis. Prog. Org. Coat., 43, 193-206.
Pelekani, C., & Snoeyink, V. (1999). Competitive adsorption in natural water: role of
activated carbon pore size. Water Res., 33, 1209-1219.
Piccot, S. D., Watson, J. J., & Jones, J. W. (1992). A global inventory of volatile organic
compound emissions from anthropogenic sources. J. Geophy. Res., 97(D9), 9897-
9912.
Popescu, M., Joly, J. P., Carre, J., & Danatoiu, C. (2003). Dynamical adsorption and
temperature-programmed desorption of VOCs (toluene, butyl acetate and butanol)
on activated carbons. Carbon, 41, 739-748.
Pramar, G., & Rao, N. (2009). Emerging control technologies for volatile organic
compounds. Cri. Rev. Environ. Sci. Technol., 39, 41-78.
Puértolas, B., López, M., Navarro, M., López, J., Murillo, R., García, T., & Mastral, A.
(2010). Modelling the breakthrough curves obtained from the adsorption of
propene onto microporous inorganic solids. Ads. Sci Technol., 28, 761-775.
Qi, N., & LeVan, M. (2005a). Adsorption equilibrium modeling for water on activated
carbons. Carbon, 43, 2258-2263.

14
Qi, S., Hay, K., & Cal, M. (2000). Predicting humidity effect on adsorption capacity of
activated carbon for water-immiscible organic vapors. Adv. Environ. Res., 4, 357-
362.
Ramos, M., Bonelli, P., Cukierman, A., Ribeiro Carrott, M., & Carrott, P. (2010).
Adsorption of volatile organic compounds onto activated carbon cloths derived
from a novel regenerated cellulosic precursor. J. Hazard. Mater., 177, 175-182.
Schlüter, S., Hennig, T., Schieferstein, E., & Meller, K. (2016). Simulator for Automotive
Evaporative Emissions Restraint Systems. COMSOL Conference. Munich:
COMSOL.
Shonnard, D., & Hiew, D. (2000). Comparative environmental assessments of VOC
recovery and recycle design alternatives for a gaseous waste stream. Environ. Sci.
Technol., 34, 5222-5228.
Taqvi, S., Appel, W., & LeVan, M. (1999). Coadsorption of Organic Compounds and Water
Vapor on BPL Activated Carbon. 4. Methanol, Ethanol, Propanol, Butanol, and
Modeling. Ind. Eng. Chem. Res., 38, 240-250.
Tefera, D., Hashisho, Z., Philips, J., Anderson, J., & Nichols, M. (2014). Modeling
Competitive Adsorption of Mixtures of Volatile Organic Compounds in a Fixed-
Bed of Beaded Activated Carbon. Environ. Sci. Technol., 48, 5108-5117.
Tefera, D., Lashaki, M., Fayaz, M., Hashisho, Z., Philips, J., Anderson, J., & Nichols, M.
(2013). Two-Dimensional Modeling of Volatile Organic Compounds Adsorption
onto Beaded Activated Carbon. Environ. Sci. Technol., 47, 11700-11710.
The European Union. (2004). Directive 2004/42/CE of the European Parliament and
the Council. Retrieved from http://eur-
lex.europa.eu/LexUriServ/LexUriServ.do?uri=OJ:L:2004:143:0087:0096:EN:P
DF
Thomas, W., & Crittenden, B. (1998). Adsorption Technology and Design. Boston:
Butterworth Publishers.
Tien, C. (2013). Adsorption Calculations and Modelling. Butterworth_Heinemann.
United States Environmental Protection Agency. (2016). Volatile Organic Compounds'
Impact on Indoor Air Quality. Retrieved from https://www.epa.gov/indoor-air-
quality-iaq/volatile-organic-compounds-impact-indoor-air-quality#Sources

15
United States Environmental Protection Agency. (2017). Technical Overview of Volatile
Organic Compounds. Retrieved from https://www.epa.gov/indoor-air-quality-
iaq/technical-overview-volatile-organic-compounds#5
Weber, W., & Smith, E. (1987). Simulation and design models for adsorption processes.
Environ. Sci Technol., 21, 1040-1050.
WHO. (1989). Indoor air quality: organic pollutants. Report on a WHO meeting. EURO
Rep Stud, 111, 1-70.
Xu, Z., Cai, J., & Pan, B. (2013). Mathematically modeling fixed-bed adsorption in
aqueous systems. J. Zhejiang Univ. Sci. A, 16, 147-153.
Yang, R. (1987). Gas Separation by Adsorption Processes. Stoneham, Massachusetts:
Butterworth Publishers.
Yang, R. (2003). Adsorbents: Fundamentals and Application. New Jersey: John Wiley &
Sons, Inc.
Ye, X., Qi, N., & LeVan, M. (2003). Prediction of adsorption equilibrium using a modified
D-R equation: organic-water vapor mixtures on BPL carbon. Carbon, 41, 2519-
2525.

16
CHAPTER 2 LITERATURE REVIEW

17
2.1 Competitive Adsorption of Water Vapor and VOCs
Competitive adsorption between water vapor and VOCs can significantly reduce
the adsorption capacities of activated carbon (AC) for VOCs, particularly at RH above 60%
(Keener and Zhou, 1990; Huggahalli et al., 1996; Russell and LeVan, 1997; Qi et al.,
2000a; Huasheng et al., 2002; Qi et al., 2006). The potency of the negative impact by
water vapor on adsorption of VOC also depends on the concentration levels of VOCs in
the polluted gas streams (Manes, 1984). To further evaluate this effect, there is a need to
understand the mechanism of water vapor adsorption on activated carbon.
2.1.1 Special Behaviour of Water Vapor on Activated Carbon
There is a significant difference between the adsorption of VOCs and water vapor
on AC. Adsorption of VOCs is characterized by strong dispersion interactions and
superposition of adsorption potential energy functions in the micropores of AC, thereby
exhibiting Brunauer-Deming-Deming-Teller (BDDT) type I adsorption isotherms as per
the classification of Brunauer et al. (1938) (Huggahalli et al., 1996; Taqvi et al., 1999). An
adsorption isotherm describes the equilibrium relationship between an adsorbate and an
adsorbent at a given temperature (Suzuki, 1990). As seen from Figure 2.1a, much of the
pore volume is filled at low relative pressures of VOCs.
On the other hand, adsorption of water vapor onto the surface of AC involves
primary and secondary adsorptive sites (Qi et al., 2000a). Primary adsorptive sites consist
of surface functional groups such as those containing oxygen. Adsorption of water vapor
on the primary adsorptive sites mainly occurs at low water vapor relative pressures or RH
levels (Qi et al., 1998; 2000a). Several studies have reported the presence of oxygen-based
functional groups on the surface of granular activated carbon (GAC), and BAC

18
(Lodewyckx et al., 1999; Lashaki et al., 2016a; 2016b). It can be implied from the reports
that an increase in surface functional groups containing oxygen on AC also increases the
amount of water vapor adsorbed, particularly at low RH levels (Gregg and Sing, 1982;
Salame and Bandosz, 1999). These functional groups form hydrogen bonds with water
vapor on the surface of AC. As water vapor relative pressure increases, adsorption occurs
chiefly at the secondary adsorptive sites. These secondary adsorptive sites consist of the
previously adsorbed water vapor molecules, which enhance adsorption due to the ability
of water molecules to form hydrogen bonds with each other. Cluster of water molecules
thus formed, are characteristic of capillary condensation at the available pore volume, and
thereby exhibiting a BDDT type V (S-shaped) isotherm (Figure 2.1b) (Huggahalli et al.,
1996; Taqvi et al., 1999; Qi et al., 2000a;).
Figure 2.1. BDDT adsorption isotherms (a) Type I (b) Type V (Bansal and Goyal, 2005)
Adsorption of water vapor on microporous AC does not necessarily follow
Gurvitsch rule, which states that any two adsorbates at saturation shall occupy the same
volume on a given porous solid or adsorbent (Gregg and Sing, 1982). In many cases, the
19
adsorbed liquid volume of water was found to be less than that of the other adsorbates at
saturation. Such observations suggest that the adsorbed water molecules are present in a
form substantially less dense than normal water or ice. This is typically due to hydrogen
bonding between the water vapor molecules and the oxygen-based surface functional
groups, leading to a more open structure (Gregg and Sing, 1982).
2.1.2 Impact of Relative Humidity on Adsorption Capacity for VOCs
As mentioned earlier in Chapter 1, the presence of RH has a detrimental effect on
the performance of adsorbents. Adsorption capacity is often the determinant of the
service life of a fixed bed adsorber for capturing VOCs (Qi et al., 2000b). An overwhelming
majority of studies from literature observed similar effects, in addition to a few
exceptions.
Underhill et al. (1999) tested the effect of RH on the adsorption of selected water-
miscible VOCs such as acetic acid, allyl alcohol, ethoxyethanol, piperidine, and pyridine
by AC at concentrations ranging from 100 mg/m3 to 1,000 mg/m3. They found that the
presence of water vapor at saturation (RH at 100%) reduced the adsorption capacity
significantly for all the selected VOCs. Similar study was conducted by Nastaj et al. (2016)
for VOCs such as toluene, and n-butanol on AC at 25 – 90% RH. As expected, the negative
effect on adsorption capacity was the highest at an RH of 90%. These studies quantified
the adsorption capacity reduction using multicomponent adsorption equilibria. Keener et
al. (1990) investigated relative humidity effect on AC adsorption using five VOCs: toluene,
carbon tetrachloride, ethylbenzene, methylene chloride, and ethanol, with organic
loading ranging from 3oo to 900 ppmv and relative humidity varying from 54% to 92%.

20
They too observed up to 75% reduction in adsorption capacity for the VOCs, from their
adsorption breakthrough profile studies.
Taqvi et al. (1999) reported competitive coadsorption of common alcohols such as
methanol, ethanol, propanol, butanol, and water vapor on GAC at 298.15 K. Presence of
water vapor enhanced the adsorption of lower alcohols such as methanol and ethanol, and
inhibited the adsorption of higher alcohols such as propanol and butanol. This is mainly
due to the ability of alcohol to form hydrogen bonding with water molecules, which act as
additional adsorption sites at high RH levels (Taqvi et al., 1999). Similar observations
were recorded by Linders et al. (2001) and Qi et al. (2006) for methanol and ethanol,
especially at low concentration levels of the alcohols (1 – 100 ppm).
Li et al. (2010) and Huasheng et al. (2002) observed up to 50% reduction in AC
adsorption capacity of VOCs such as benzene, toluene, acetone, and ethyl acetate at 90%
RH and VOC inlet concentration ranging 500 – 8,000 mg/m3. They concluded that the
relative humidity and the polarity of the VOCs, are directly proportional to the intensity
of the detrimental impact on adsorption capacity.
Few studies reported the effects of RH on adsorption of benzene with activated
carbon cloths (ACC), and organic loading varying from 500 ppmv to 1,000 ppmv with RH
up to 90%. The decrease in benzene adsorption capacity at 90% RH was found to be about
45% and 31% for 500 ppmv and 1,000 ppmv inlet concentration respectively (Cal, et al.,
1996; Qi et al., 2000b).
Lee et al. (2005) studied the effect of relative humidity on AC adsorption of
trichloroethylene (TCE) under a relative humidity range of 40 – 80% and TCE relative
pressure of about 0.1. They found that the water vapor in TCE stream had negligible effect
on TCE adsorption capacity up to 80% RH.

21
Chou et al. (1997) reported that the adsorption capacities of a GAC for two
hydrophobic VOCs, hexane and cyclohexane decreased by up to 50% due to the presence
of moisture in the inlet air stream at 90% RH and 307 K. They also carried out
experiments at 350 K to reduce the effect of moisture, but did not observe any positive
impact on adsorption capacity. This tendency makes sense as AC adsorption is an
exothermic process, and adsorption efficiency typically decreases with the increase in
temperature of an adsorber bed (Chou and Chiou, 1997).
Russell et al. (1997) tested the adsorption of alkanes such as ethane and propane
with water vapor on GAC, and observed up to 60% reduction in adsorption capacity at
50% RH and low alkane relative pressures.
The aforementioned research emphasized how presence of water vapor greatly
hampers adsorption of VOCs onto AC, despite the hydrophobicity of the carbon surface.
This is mainly due to the interactions of water molecules and oxygen-based functional
groups via hydrogen bonding on the surface (Do and Do, 2000).
Furthermore, as mentioned in Chapter 1, to comprehend these effects, an accurate
prediction of multicomponent competitive adsorption equilibria and kinetics of water
vapor and VOCs is essential. Hence, a clear and detailed understanding of both single and
multicomponent isotherm models which describe equilibria concerning VOCs and water
vapor is needed.
2.2 Adsorption Isotherm Models for Predicting Equilibria
Adsorption capacity of AC for any adsorbate(s) can be found from their
corresponding adsorption isotherm (Foo and Hameed, 2010). There are distinct models
available which can be used for single-component adsorption or multicomponent
22
competitive adsorption. Some of the most widely used adsorption isotherm models are
described in the following segments.
2.2.1 Single-Component Adsorption Isotherm Models for VOCs
2.2.1.1 Langmuir Isotherm Model
The Langmuir adsorption isotherm is a simple model describes the adsorptions of
gases on solid sorbents (Langmuir, 1916). Adsorption is assumed to occur in a monolayer
and on a given number of homogenous energetic sites with no lateral interactions and
steric hindrance among adsorbates (Langmuir, 1916). These conditions are rarely valid
and are the main weak points of this model (Jain and Snoeyink, 1973). However, the
model remains of basic importance for expressing dynamic adsorption equilibrium. It
follows Henry’s law at low concentration levels and therefore, is thermodynamically
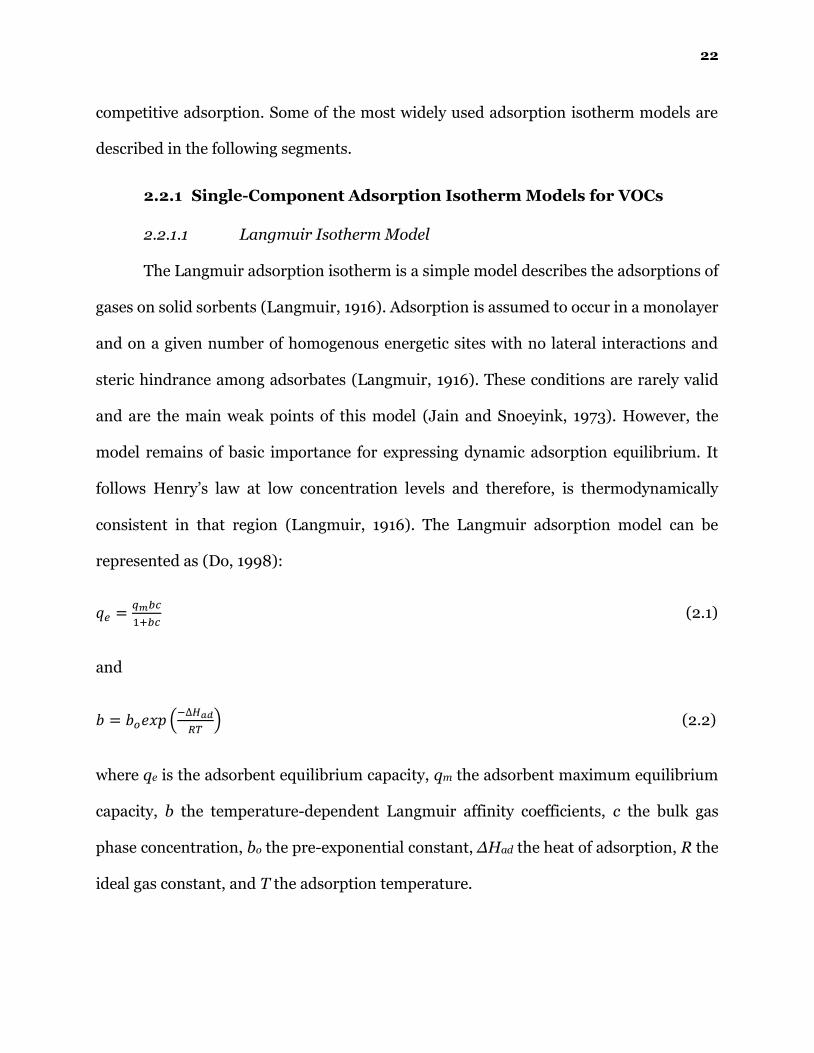
consistent in that region (Langmuir, 1916). The Langmuir adsorption model can be
represented as (Do, 1998):
𝑞𝑒 =𝑞𝑚𝑏𝑐
1+𝑏𝑐 (2.1)
and
𝑏 = 𝑏𝑜𝑒𝑥𝑝 (−∆𝐻𝑎𝑑
𝑅𝑇) (2.2)
where qe is the adsorbent equilibrium capacity, qm the adsorbent maximum equilibrium
capacity, b the temperature-dependent Langmuir affinity coefficients, c the bulk gas
phase concentration, bo the pre-exponential constant, ΔHad the heat of adsorption, R the
ideal gas constant, and T the adsorption temperature.
23
2.2.1.2 Freundlich Isotherm Model
The Freundlich adsorption isotherm model is an empirical model and describes
non-ideal and reversible adsorption (Freundlich, 1906). Adsorption may occur in
multilayers and on heterogenous sites with different levels of affinities and heats of
adsorption (Foo and Hameed, 2010). However, the model is not thermodynamically
consistent and does not approach Henry’s law at low concentrations. It also has no
saturation limit at high concentrations (Do, 1998).
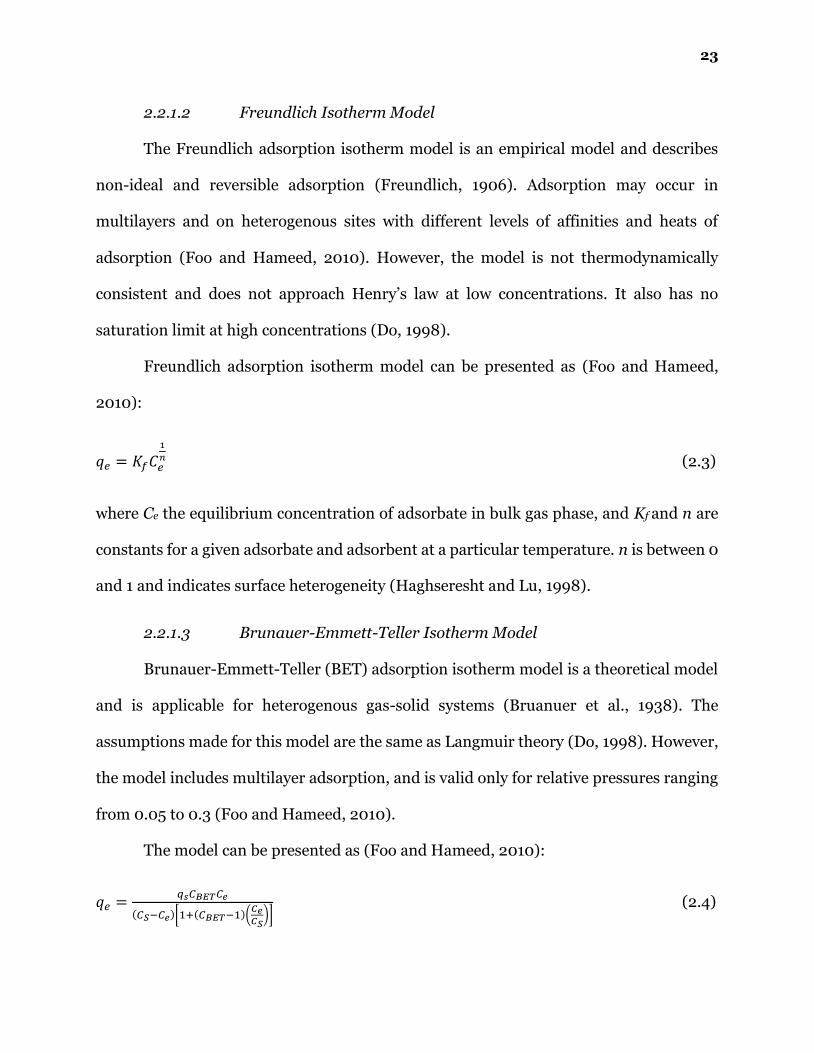
Freundlich adsorption isotherm model can be presented as (Foo and Hameed,
2010):
𝑞𝑒 = 𝐾𝑓𝐶𝑒
1
𝑛 (2.3)
where Ce the equilibrium concentration of adsorbate in bulk gas phase, and Kf and n are
constants for a given adsorbate and adsorbent at a particular temperature. n is between 0
and 1 and indicates surface heterogeneity (Haghseresht and Lu, 1998).
2.2.1.3 Brunauer-Emmett-Teller Isotherm Model
Brunauer-Emmett-Teller (BET) adsorption isotherm model is a theoretical model
and is applicable for heterogenous gas-solid systems (Bruanuer et al., 1938). The
assumptions made for this model are the same as Langmuir theory (Do, 1998). However,
the model includes multilayer adsorption, and is valid only for relative pressures ranging
from 0.05 to 0.3 (Foo and Hameed, 2010).
The model can be presented as (Foo and Hameed, 2010):
𝑞𝑒 =𝑞𝑠𝐶𝐵𝐸𝑇𝐶𝑒
(𝐶𝑆−𝐶𝑒)[1+(𝐶𝐵𝐸𝑇−1)(𝐶𝑒𝐶𝑆
)] (2.4)
24
where CBET is the ratio of monolayer and multilayer heats of adsorption, Ce the
equilibrium concentration of adsorbate in gas phase, Cs the adsorbate monolayer
saturation concentration, qs the theoretical isotherm saturation capacity, and qe the
equilibrium adsorption capacity. Typically, CBET is significantly larger than unity.
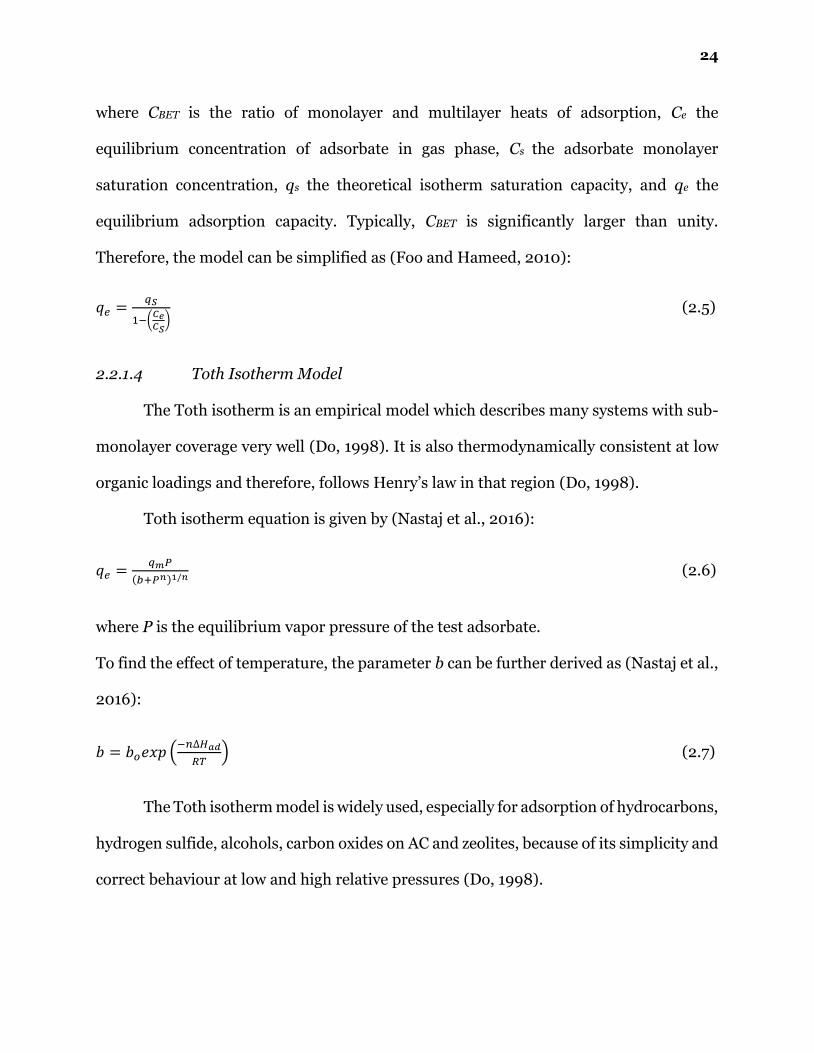
Therefore, the model can be simplified as (Foo and Hameed, 2010):
𝑞𝑒 =𝑞𝑆
1−(𝐶𝑒𝐶𝑆
) (2.5)
2.2.1.4 Toth Isotherm Model
The Toth isotherm is an empirical model which describes many systems with sub-
monolayer coverage very well (Do, 1998). It is also thermodynamically consistent at low
organic loadings and therefore, follows Henry’s law in that region (Do, 1998).
Toth isotherm equation is given by (Nastaj et al., 2016):
𝑞𝑒 =𝑞𝑚𝑃
(𝑏+𝑃𝑛)1/𝑛 (2.6)
where P is the equilibrium vapor pressure of the test adsorbate.
To find the effect of temperature, the parameter b can be further derived as (Nastaj et al.,
2016):
𝑏 = 𝑏𝑜𝑒𝑥𝑝 (−𝑛∆𝐻𝑎𝑑
𝑅𝑇) (2.7)
The Toth isotherm model is widely used, especially for adsorption of hydrocarbons,
hydrogen sulfide, alcohols, carbon oxides on AC and zeolites, because of its simplicity and
correct behaviour at low and high relative pressures (Do, 1998).

25
2.2.1.5 Dubinin-Radushkevich Isotherm Model
Dubinin-Radushkevich (DR) adsorption isotherm model is based on the potential
theory of adsorption developed by Polanyi (Dubinin and Radushkevich, 1947). It is
fundamentally sound and highly regarded compared to other isotherm models, due to its
core thermodynamic basis (Do, 1998).
The potential theory (Bansal and Goyal, 2005), is based on the concept that the
adsorbed gases or vapors at the surface of a microporous adsorbent such as AC are
compressed by the forces of attraction acting from the surface to a distance into the
surrounding space. As the forces facilitating adsorption deteriorate with distance away
from the surface, the multimolecular adsorbed film can be considered to be an
intermolecular potential gradient. The forces of attraction at any point in the adsorbed
film can be easily measured by the adsorption potential (ε), which is defined as the
amount of work done by adsorption forces in bringing molecules from bulk gas phase to
that point. It is given by (Bansal and Goyal, 2005):
휀 = 𝑅𝑇 𝑙𝑛𝑃𝑆
𝑃 (2.8)
where R is the ideal gas constant, T the adsorption temperature, PS the saturated vapor
pressure of the test adsorbate at test temperature, and P the equilibrium vapor pressure
of the test adsorbate.
This thermodynamic theory of formation of adsorbed film can be represented by
the following relation (Do, 1998):
𝑊 = 𝑓(휀) (2.9)

26
where W is the volume of adsorbate adsorbed. The function above is characteristic to a
particular gas-solid system, and therefore is called the characteristic curve. Moreover,
the curve is independent of temperature since the adsorption potential is mainly based
on the work of temperature-independent dispersion forces. It makes the potential theory
very flexible as once the characteristic curve at one temperature is established, it is
possible to predict the adsorption at other temperatures for the same gas-solid system
(Do, 1998).
With the basis of Polanyi potential theory and characteristic curve, Dubinin and
Radushkevich suggested that for microporous sorbents such as AC the volume of
adsorbed film can be expressed as a Gaussian function of adsorption potential (Bansal
and Goyal, 2005). The function is given by:
𝑊 = 𝑊𝑜𝑒𝑥𝑝 [−𝐾 (𝛽
)2
] (2.10)
where Wo is the limiting pore volume of the adsorbent, K a constant related to the
adsorbent pore-size distribution, β the affinity coefficient which considers the
polarizability of the adsorbate. The above equation can also be written as:
𝑊 = 𝑊𝑜𝑒𝑥𝑝 [− (𝐸
)2
] (2.11)
where E is the characteristic energy which is a measure of adsorption strength between
adsorbate and adsorbent. Equation (2.11) can be rearranged further as:
𝑙𝑛 𝑊 = 𝑙𝑛 𝑊𝑜 −𝐾
𝛽2(𝑅𝑇)2 (𝑙𝑛
𝑃𝑆
𝑃)
2
(2.12)

27
This equation is known as the DR equation (Bansal and Goyal, 2005). The DR isotherm
is an empirical model and was initially developed for adsorption of vapors onto
microporous adsorbents with heterogenous surface such as AC (Do, 1998). The model
successfully predicts equilibrium adsorption capacities at intermediate and high
concentrations by pore filling mechanism (Bansal and Goyal, 2005) but fails to approach
Henry’s law at low concentration levels (Kapoor et al., 1989).
2.2.1.6 Dubinin-Astakhov Isotherm Model
Dubinin-Astakhov (DA) isotherm model has the same basis as the DR model and
is mainly applied to carbonaceous solids which have high degree of heterogeneity, due to
a wider pore size distribution (Do, 1998). The model is a more general form of the DR
equation, and is written as:
𝑙𝑛 𝑊 = 𝑙𝑛 𝑊𝑜 −𝐾
𝛽2(𝑅𝑇)2 (𝑙𝑛
𝑃𝑆
𝑃)
𝑚
(2.13)
where m is related to the pore size distribution. This equation is more flexible as it
contains three parameters (Wo, 𝐾
𝛽2 , m) whereas DR equation includes only two (Wo, 𝐾
𝛽2).
However, like DR isotherm the DA model also fails to approach Henry’s law at low
concentrations and therefore, is thermodynamically inconsistent in that region (Do,
1998).
2.2.1.7 Modified Dubinin-Radushkevich Isotherm Model
As mentioned earlier, the Dubinin isotherm models are not thermodynamically
consistent in the Henry’s law region (limit of zero loading) even though they perform well
in fitting most equilibrium data of AC adsorption during medium and high loadings
(Kapoor et al., 1989). Typically, in this region a thermodynamically consistent adsorption
28
isotherm reduces itself into a Henry’s adsorption isotherm or linear adsorption isotherm
with a limiting slope:
𝑙𝑖𝑚𝑃→0
𝑑𝑊
𝑑𝑃= 𝑙𝑖𝑚
𝑃→0
𝑊
𝑃= 𝐻 (2.14)
where H is the Henry’s law constant. The DR equation (2.12) does not follow this trend.
However, Kapoor et al. (1989) modified the equation to include a proper Henry’s law. This
modified Dubinin-Radushkevich (MDR) equation has a valid Henry’s law region at low
relative pressures and retains the original form and qualities of the DR equation at
moderate to high relative pressures. Hence, the MDR equation can be applied over the
whole relative pressure range. The equation is presented as:
𝑊 = [1 − 𝑒𝑥𝑝 (−𝛼𝑃
𝑃𝑆)] 𝑊𝑜𝑒𝑥𝑝 [−
𝐾
𝛽2(𝑅𝑇)2 (𝑙𝑛
𝑃𝑆
𝑃)
2
] + 𝑒𝑥𝑝 (−𝛼𝑃
𝑃𝑆) 𝑊1
𝑃
𝑃𝑆 (2.15)
where α, W1, are additional fitting parameters. The above equation reduces to equation
(2.14) when 𝑃 → 0 as 𝐻 =𝑊1
𝑃𝑆 gives the Henry’s law adsorption isotherm (Kapoor et al.,
1989).
The MDR model works in such a way that the second term of the equation becomes
significant only at very low relative pressures and the first term remains applicable over
the rest of the relative pressure range up to 1. The model contains four fitting parameters
(α, Wo, 𝐾
𝛽2 , W1) compared to two in the D-R model, and therefore is more flexible (Kapoor
et al., 1989). Hung and Lin (2007) too conducted similar modifications to the DR model
by integrating the DR equation and the Langmuir isotherm simultaneously for the entire
relative pressure range. Their model also reduced to Henry’s linear isotherm at low
pressures, and produced comparable results as that of Kapoor et al. (1989).
29
2.2.2 Single-Component Adsorption Isotherm Models for Water
Vapor
As discussed earlier, adsorption of water vapor on AC follows a type V isotherm.
Owing to the sigmoidal shape of type V isotherm, the functional form of type I isotherm
models described above cannot be used to predict the adsorption equilibrium of water
vapor (Huggahalli et al., 1996). However, there are a limited number of reliable isotherm
models which have been applied successfully to describe pure water vapor adsorption
equilibrium on activated carbons. They are described in the following section.
2.2.2.1 Modified Dubinin-Astakhov Isotherm Model
The DA equation has been applied reasonably well in describing adsorption
equilibria for VOCs on AC (Do, 1998). However, like other Dubinin models the equation
does not predict adsorption equilibria correctly at low pressures due to zero slope at zero
loading. DA equation, therefore, has an inflexion point and its position depends on the
value of the characteristic energy (Do, 1998). The lower the characteristic energy the
higher the relative pressure value at which inflexion occurs and vice versa (Do, 1998). This
zero slope and inflexion point have been utilised by some studies to describe the type V
water adsorption on AC (Do, 1998; Slasli et al., 2003).
The modified DA (MDA) isotherm model for water adsorption is usually expressed
as an amalgamation of two similar forms of the original DA equation: type I for adsorption
on the surface functional groups, and type V for adsorption into the micropores (Stoeckli
et al., 1994; Slasli et al., 2003; Kim and Agnihotri, 2008). The modified DA can be
presented as (Stoeckli, 2002):
30
𝑊 = 𝑊𝑜(𝐼)𝑒𝑥𝑝 [− (
𝐸(𝐼))
𝑚(𝐼)
] + 𝑊𝑜(𝑉)𝑒𝑥𝑝 [− (
𝐸(𝑉))
𝑚(𝑉)
] (2.16)
where 𝑊𝑜(𝐼), 𝑊𝑜(𝑉)
are the limiting volumes adsorbed with corresponding characteristic
energies 𝐸(𝐼) and 𝐸(𝑉) in type I and type V regions respectively; likewise 𝑚(𝐼) and 𝑚(𝑉)
denote the adsorbent surface heterogeneity.
The application of DA isotherm model for water adsorption, however, is very
limited since it is based on potential theory and micropore filling mechanism; and neither
consider cluster formation mechanism during water adsorption, nor follow Henry’s law
at low loadings (Do and Do, 2000; Qi et al., 2005b; Kim and Agnihotri, 2008).
2.2.2.2 Dubinin-Serpinski Isotherm Model
The Dubinin-Serpinski (DS) equation is one of the earliest models formulated for
describing water adsorption equilibrium (Dubinin and Serpinsky, 1981). Recognizing the
deficiency of DA model, DS suggested a kinetic theory of water adsorption onto primary
and secondary sites, and desorption. The model also has a specific allowance for a finite
maximum adsorbent capacity, which was considered empirically. The DS equation is
given as (Do, 1998):
𝑃
𝑃𝑆=
𝐶𝜇
𝑐(1−𝑘𝐶𝜇)(𝐶𝜇𝑜+𝐶𝜇) (2.17)
where 𝐶𝜇 is the amount of water adsorbed at a relative pressure of 𝑃
𝑃𝑆 , 𝐶𝜇𝑜 is the
concentration of primary adsorption sites (typically used to categorize adsorbents with
various degrees of surface oxidation), 𝑐 the dimensionless ratio of the equilibrium rate
constants for adsorption and desorption of water, 𝑘 another fitting parameter which
31
represents the rate of loss of the secondary sites during water adsorption because of the
finiteness of the maximum adsorbed volume.
The model has had reasonable success in predicting water adsorption equilibria on
AC (Dubinin and Serpinsky, 1981; Do, 1998; Sullivan et al., 2007; Kim and Agnihotri,
2008). However, it fails at low pressure region due to its hyperbolic behaviour (Do and
Do, 2000). Few studies also noted that the DS model does not have a proper basis to
predict the maximum water adsorption capacity, as the model gives more emphasis on
the kinetic parameters rather than the adsorbent pore volume (Do and Do, 2000; Kim
and Agnihotri, 2008; Do et al., 2009).
2.2.2.3 Qi-Hay-Rood Isotherm Model
The Qi-Hay-Rood (QHR) isotherm considers water adsorption on surface
functional groups (primary adsorption sites) at low water vapor pressures, and cluster
formation mechanism (secondary adsorption sites) at medium to high water vapor
pressures (Qi et al., 1998). Its assumptions are:
• The number of secondary adsorption sites is directly proportional to the amount
of water adsorbed (𝑞𝑒) at a certain 𝑃
𝑃𝑆.
• The number of primary adsorption sites is proportional to the remaining water
adsorption capacity (𝑞𝑚 − 𝑞𝑒) at a given 𝑃
𝑃𝑆.
• The driving force for the change in adsorption capacity with respect to the change
in relative pressure is proportional to the product of (𝑞𝑚 − 𝑞𝑒) and (𝑞𝑒).
These assumptions give the following equation:
32
𝑑(𝑞𝑒
𝑞𝑚)
𝑑(𝑃
𝑃𝑆)
= 𝑘𝑝 [1 − (𝑞𝑒
𝑞𝑚)] (
𝑞𝑒
𝑞𝑚) (2.18)
where 𝑘𝑝 is a proportionality constant. Equation (2.18) generates a sigmoidal curve and
upon further integration it gives:
𝑞𝑒 =𝑞𝑚
1+𝑒𝑥𝑝[𝑘𝑝(𝑃50𝑃𝑆
−𝑃
𝑃𝑆)]
(2.19)
where 𝑃50 is an isotherm constant, and 𝑃 = 𝑃50 at 𝑞𝑒 𝑞𝑚⁄ = 0.5.
To express the effect of adsorption temperature, 𝑞𝑚 was assumed to be constant at
all temperatures as an adsorbent structural property, and empirical modifications of the
proportionality constant and the isotherm constant were applied to the above equation
(Qi et al., 1998). They are given as:
𝑃50
𝑃𝑆= 𝑎 + 𝑏𝑇 (2.20)
and
𝑘𝑝 = 𝐴𝑒−(𝐸𝑎 𝑅𝑇⁄ ) (2.21)
where 𝑎, 𝑏, 𝐸𝑎 are QHR multitemperature constants, 𝐴 a pre-exponential factor.
The multitemperature QHR isotherm model gives a better fit for describing water
adsorption equilibria at various temperatures, when compared to the DS equation (Qi et
al., 1998, 2000a). The model was successfully tested for water vapor adsorption onto ACC
and GAC at relative vapor pressures from 0.0 to 0.95 and temperatures between 288 and
373 K (Qi et al., 1998).
33
2.2.2.4 Talu-Meunier Isotherm Model
The Talu-Meunier (TM) isotherm model is based on classical thermodynamics
(Talu and Meunier, 1996). It considers water adsorption on surface functional groups at
low loading, cluster formation mechanism at medium to high loadings, and caps the
maximum amount adsorbed up to a finite adsorbent micropore volume. The model gives
a type V isotherm and is therefore used for predicting water adsorption equilibrium. The
TM equation is given by:
𝑃
𝑃𝑆=
𝐻𝜓
1+𝐾𝑒𝑞𝜓𝑒𝑥𝑝 (
𝜓
𝑞𝑚) (2.22)
where 𝐾𝑒𝑞 is the equilibrium constant for the association of water molecules to form
clusters on the adsorbent. Parameter 𝜓 is further defined as:
𝜓 =−1+√1+4𝐾𝑒𝑞
2𝐾𝑒𝑞 (2.23)
where
휁 =𝑞𝑚𝑞𝑒
(𝑞𝑚−𝑞𝑒) (2.24)
For the effect of temperature on adsorption, Talu and Meunier (1996) suggested
modifications to the Henry’s law constant 𝐻 and equilibrium constant 𝐾𝑒𝑞 in its original
equation (2.22). They are given as:
𝐻 = 𝑒𝑥𝑝 (𝐻𝑜 +𝐻1
𝑇) (2.25)
and
𝐾𝑒𝑞 = 𝑒𝑥𝑝 (𝐾𝑒𝑞𝑜+
𝐾𝑒𝑞1
𝑇) (2.26)

34
where 𝐻𝑜, 𝐻1, 𝐾𝑒𝑞𝑜, 𝐾𝑒𝑞1
, are the multitemperature fitting parameters.
Using equation (2.22) only five temperature-independent parameters 𝑞𝑚, 𝐻𝑜, 𝐻1,
𝐾𝑒𝑞𝑜, and 𝐾𝑒𝑞1
are required to describe water adsorption at any temperature. The
multitemperature TM isotherm model gives a good fit when describing water adsorption
on AC and has been tested successfully at temperatures ranging from 298.15 K to 398.15
K (Talu and Meunier, 1996; Sullivan et al., 2007).
2.2.2.5 Qi-LeVan Isotherm Model
Qi-LeVan (QLV) isotherm model has similar basis as the TM model except that it
does not consider the cluster formation of water molecules as a chemical reaction (Talu
and Meunier, 1996; Qi et al., 2005b). It is presented as (Qi et al., 2005b):
𝑃
𝑃𝑆=
𝑞𝑒
𝜉𝑜+𝜉1𝑞𝑒+𝜉2𝑞𝑒2+𝜉3𝑞𝑒
3+⋯+𝜉𝑖𝑞𝑒𝑖 (2.27)
where 𝜉𝑜, 𝜉1, 𝜉2, 𝜉3, 𝜉𝑖 are the model parameters.
The multitemperature QLV isotherm for describing water adsorption equilibrium
is given by (Qi et al., 2005b):
𝑃
𝑃𝑆= (
𝑃
𝑃𝑆)
𝑟𝑒𝑓𝑒𝑥𝑝 [
𝛿𝑜+𝛿1𝑞𝑒
𝑅(
1
𝑇−
1
𝑇𝑟𝑒𝑓) +
𝛿2
2𝑅(
1
𝑇2 −1
𝑇𝑟𝑒𝑓2 )] (2.28)
where 𝛿𝑜, 𝛿1, 𝛿2, are the temperature and loading independent fitting parameters. (𝑃
𝑃𝑆)
𝑟𝑒𝑓
is the reference relative vapor pressure at a particular temperature 𝑇𝑟𝑒𝑓, and is derived
from the original equation (2.27).
Once the reference adsorption isotherm at a given temperature is fixed, the model
can be used to generate adsorption isotherms at different temperatures (Qi et al., 2005b).

35
The multitemperature QLV model usually needs four parameters to accurately predict
water adsorption on AC and is mathematically simpler than TM model. It is
thermodynamically consistent at Henry’s law region, and has been successfully validated
at adsorption temperatures ranging 298.15 to 398.15 K with ACs having different types of
surface functional groups, and pore structures (Qi et al., 2005b).
2.2.2.6 Do and Do Isotherm Model
The Do and Do isotherm model emphasizes the water adsorption mechanism and
the role of adsorbent microstructure in the process (Do and Do, 2000). It assumes that
water molecules are chemisorbed onto the surface functional groups at the mesopores
and at the entrance to the micropores. With the increase in water loading, the clusters of
water formed grows up to the size of a pentamer (five molecules, approximate width 0.6
nm) on the functional groups. The pentamers acquire sufficient dispersive energy to move
into the micropores. This process continues until the micropores are filled. At very high
relative pressures of about 0.9 capillary condensation occurs, which fills up the
mesopores. The Do and Do model for AC is a BET-type equation, and consists of two parts.
The first part includes adsorption on surface functional groups, and the second part
consists of micropore filling due to dispersive forces. The model is given by:
𝑊 = 𝑊𝑓
𝐾𝑓 ∑ 𝑖(𝑃
𝑃𝑆)
𝑖𝑁𝑖=1
1+𝐾𝑓 ∑ (𝑃
𝑃𝑆)
𝑖𝑁𝑖=1
+ 𝑊𝜇
𝐾𝜇(𝑃
𝑃𝑆)
6
𝐾𝜇(𝑃
𝑃𝑆)
6
+(𝑃
𝑃𝑆)
(2.29)
where 𝑊𝜇 is the limiting volume adsorbed due to micropore filling during water
adsorption, 𝑊𝑓 a fitting parameter, 𝐾𝑓, 𝐾𝜇 are the unitless equilibrium rate constants for
the chemisorption of water on surface functional groups and water filling of micropores

36
respectively, 𝑁 the average number of water molecules in a fully developed cluster on the
surface functional groups.
Do and Do equation has been extensively used for describing water adsorption
equilibrium. It fits very well with experimental data, especially for adsorption on GAC,
ACC, and single-walled carbon nanotube (SWNT) (Do and Do, 2000; Sullivan et al., 2007;
Kim and Agnihotri, 2008; Do et al., 2009).
2.2.3 Multicomponent Competitive Adsorption Isotherm Models
Multicomponent adsorption equilibrium is an area of increasing research interest
(Wood, 2000; Foo and Hameed, 2010; Nastaj et al., 2016). Although it is a well-known
fact that water vapor is ubiquitous during VOC adsorption and that it has strong effects
on VOC adsorption capacity, multicomponent competitive adsorption equilibria
involving VOCs and water vapor are limited and rarely reported in literature (Taqvi et al.,
1999; Furmaniak et al., 2008; Nastaj et al., 2016). The following section will review and
discuss some of the most widely applied multicomponent competitive adsorption
isotherm models which describe equilibria for organic-organic systems and/or organic-
water vapor systems.
2.2.3.1 Jain and Snoeyink’s Extended Langmuir Isotherm Model
Langmuir model for competitive adsorption is one of the first models to describe
multicomponent adsorption equilibrium in multi-adsorbate systems (Butler and Ockrent,
1930). It was first developed by Butler and Ockrent and includes the same assumptions
as the original Langmuir isotherm model for single-components. The model for a two-
component system is given by:

37
𝑞𝑒,1 =𝑞𝑚,1𝑏1𝑐1
1+𝑏1𝑐1+𝑏2𝑐2 (2.30)
𝑞𝑒,2 =𝑞𝑚,2𝑏2𝑐2
1+𝑏1𝑐1+𝑏2𝑐2 (2.31)
where 𝑞𝑒,1, 𝑞𝑒,2 are the equilibrium adsorbent capacities for component 1 and 2
respectively at equilibrium concentrations of component 1 (𝑐1) and component 2 (𝑐2);
𝑞𝑚,1, 𝑞𝑚,2 are the maximum equilibrium adsorbent capacities for component 1 and 2
respectively obtained from their corresponding pure single-adsorbate isotherms; 𝑏1, 𝑏2
are the respective Langmuir affinity coefficient of component 1 and component 2.
The above model assumes that there is competition for all the adsorption sites
(Butler and Ockrent, 1930). However, this is not always the case in reality. A difference in
molecular size of adsorbates can result in the smaller adsorbate having easy access to
smaller pores without competition (Butler and Ockrent, 1930). Furthermore, different
adsorption sites on the surface of an adsorbent contain different chemical composition
and functional groups which attract a specific kind of adsorbates, leading to no
competition (Butler and Ockrent, 1930).
Jain and Snoeyink (1973) extended the Langmuir competitive adsorption model to
include the factors mentioned above. The extended version of the model for a binary
system can be presented as:
𝑞𝑒,1 =(𝑞𝑚,1−𝑞𝑚,2)𝑏1𝑐1
1+𝑏1𝑐1+
𝑞𝑚,2𝑏1𝑐1
1+𝑏1𝑐1+𝑏2𝑐2 (2.32)
𝑞𝑒,2 =𝑞𝑚,2𝑏2𝑐2
1+𝑏1𝑐1+𝑏2𝑐2 (2.33)
where (𝑞𝑚,1 > 𝑞𝑚,2)
38
The first term of equation (2.32) considers the amount of component 1 adsorbed without
competition, which is proportional to (𝑞𝑚,1 − 𝑞𝑚,2). The second part of the equation
represents the amount of component 1 adsorbed when under competition with
component 2. Equation (2.33) is the same as equation (2.31), and includes the amount of
component 2 adsorbed when under competition with component 1. The extended
Langmuir isotherm model for competitive adsorption can also be written for the ith
component as (Jain and Snoeyink, 1973):
𝑞𝑒,𝑖 = ∑𝑏𝑖𝑐𝑖𝑎𝑥
1+(∑ 𝑏𝑗𝑐𝑗𝑥𝑗=1 )
𝑦𝑥=𝑖 (2.34)
where 𝑞𝑒,𝑖 is the equilibrium adsorption capacity for the ith component (𝑖 = 1 𝑡𝑜 𝑦); 𝑎𝑥 =
(𝑞𝑚,𝑥 − 𝑞𝑚,𝑥+1) for 𝑥 = 𝑖 𝑡𝑜 𝑦 − 1, and 𝑎𝑥 = 𝑞𝑚,𝑦 for 𝑥 = 𝑦; and 𝑏𝑗 is the Langmuir affinity
coefficient where 𝑗 = 1 𝑡𝑜 𝑥.
and
𝑏𝑖 = 𝑏𝑜,𝑖𝑒𝑥𝑝 (−∆𝐻𝑎𝑑,𝑖
𝑅𝑇) (2.35)
where 𝑏𝑜,𝑖, ∆𝐻𝑎𝑑,𝑖 are the pre-exponential constant and heat of adsorption of the ith
component respectively.
The model has been tested experimentally with reasonable success by various
studies, especially for competitive adsorption on AC involving mixtures of gases and VOCs
(Jain and Snoeyink, 1973; Tefera et al., 2014). It is valid only for components with similar
adsorption profiles, and cannot be applied to organic mixtures containing water vapor
because of the difference in adsorption mechanism and isotherm type of water and
organic vapors (Huggahalli et al., 1996). The multicomponent Langmuir isotherm model
39
contains all the shortcomings of the original single-component model, and is
thermodynamically consistent only in the special case where 𝑞𝑚,1 = 𝑞𝑚,2 (considering
binary systems) (Jain and Snoeyink, 1973).
2.2.3.2 Ideal Adsorbed Solution Theory
The thermodynamically consistent ideal adsorbed solution theory (IAST) was
developed by Myers and Prausnitz (Myers and Prausnitz, 1965). It is based on solution
thermodynamics and Raoult’s law. The main assumptions of this theory include:
• The adsorbent is thermodynamically inert, and no change in its internal energy
occurs during adsorption.
• The adsorbent has a temperature-invariant surface, which is available to all the
adsorbates.
• The Gibbs definition of adsorption is considered, which usually involves the
volumetric technique of obtaining experimental adsorption isotherm.
During equilibrium, the chemical potential in the adsorbed phase is equal to the
chemical potential in the gas phase (Myers and Prausnitz, 1965). Using this concept, the
equation of equilibrium for mixed gas adsorption for the ith component at a constant
temperature is given as:
𝑃𝑡𝑦𝑖 = 𝑃𝑖𝑜(𝜋)𝑥𝑖𝛾𝑖 {𝑖 = 1,2, … , 𝑁} (2.36)
where 𝑃𝑡 is the total pressure, 𝑦𝑖 the mole fraction of component i in gas phase, 𝑥𝑖 the mole
fraction of component i in the adsorbed phase, 𝛾𝑖 the activity coefficient of component i
in the adsorbed phase, and 𝑁 the number of components present in the mixture. 𝑃𝑖𝑜(𝜋) is
the pure adsorbate vapor pressure of component i at the same temperature and spreading

40
pressure 𝜋 of the mixture. If the adsorbed mixture is ideal, the activity coefficients are
equal to unity. Equation (2.36) then reduces to Raoult’s law. For a pure component i,
integration of Gibbs adsorption isotherm at constant temperature yields the spreading
pressure 𝜋𝑖, given by (Myers and Prausnitz, 1965):
𝜋𝑖(𝑃𝑖𝑜) =
𝑅𝑇
𝐴∫
𝑛𝑖𝑜(𝑃)
𝑃
𝑃𝑖𝑜
0𝑑𝑃 (2.37)
where 𝐴 is the specific area of the adsorbent, 𝑛𝑖𝑜 is the amount of pure component i
adsorbed at the spreading pressure 𝜋𝑖 and temperature of the mixture, that is, at 𝑃𝑖𝑜. 𝑛𝑖
𝑜(𝑃)
is represented through different single-component isotherms. Since the mixing process is
carried out at a constant spreading pressure 𝜋, the spreading pressure is equal for all the
components involved in adsorption. That is:
𝜋1𝑜 = 𝜋2
𝑜 = 𝜋𝑁𝑜 (2.38)
Other conditions in solving IAST theory are (Myers and Prausnitz, 1965):
∑ 𝑥𝑖𝑁𝑖=1 = 1 (2.39)
and
1
𝑛𝑡= ∑
𝑥𝑖
𝑛𝑖𝑜
𝑁𝑖=1 (2.40)
where 𝑛𝑡 is the total amount adsorbed. Equations (2.36), (2.37), (2.38), (2.39), and (2.40)
are solved simultaneously to predict multicomponent adsorption equilibria (Myers and
Prausnitz, 1965).
IAST has been extensively used with good agreement to predict multicomponent
competitive equilibria for mixtures of gases and VOCs, mainly due to its minimal input
41
requirements (Myers and Prausnitz, 1965; O'Brien and Myers, 1985; Myers and
Valenzuela, 1986; Benjamin, 2009; Ilic et al., 2010; Chen et al., 2011; Landa and Flockerzi,
2013; Mangano et al., 2015; Simon et al., 2016 ). An IAST-based model does not need any
mixture parameters to estimate equilibria, as the predictions are based entirely on the
pure single-component adsorption isotherms (Myers and Prausnitz, 1965). Furthermore,
the success of the IAST in predicting multicomponent competitive adsorption equilibria
depends solely on the quality of these pure single-component data (Richter et al., 1989).
An advantage of IAST is that any kind of single-component isotherm model which fits
experimental data well can be applied (Richter et al., 1989).
Several single-component adsorption isotherm models such as Langmuir,
Freundlich, DR, DA have been integrated to measure the spreading pressure in IAST
model (Richter et al., 1989; Linders et al., 2001). However, studies have pointed out the
mathematical difficulty in solving them both numerically or analytically, especially for
Polanyi-based DR and DA equations (Wood, 2000; Linders et al., 2001). Some
researchers developed alternative Polanyi-type correlations to minimise the
mathematical complications (Wood, 2000).
Linders et al. (2001) applied IAST model to study the effect of water vapors on
water-miscible VOC adsorption on AC, and were able to get a fairly good agreement for
up to 60% RH. But most studies available in literature contradict with Linders et al.
(2001) regarding the application of IAST in VOC mixtures involving water vapor
(Huggahalli et al., 1996; Qi et al., 2000b; Ye et al., 2003; Li et al., 2010; ). This is because
there is a fundamental difference in the adsorption mechanism of water and VOCs, which
the IAST model does not consider (Huggahalli et al., 1996; Tien, 2013). Furthermore, no
explanation was provided by Linders et al. (2001) regarding IAST’s non-applicability

42
beyond an RH level of 60%. Several reports also highlighted the rather poor performances
of IAST model when water vapor is one of the components in a mixture (Tien, 2013;
Wood, 2000). The IAS theory is, therefore, recommended only for components exhibiting
similar adsorption isotherm profiles.
2.2.3.3 Real Adsorbed Solution Theory
The real adsorbed solution theory (RAST) is basically the adsorbed solution theory
developed by Myers and Prausnitz, which has been extended for non-ideal adsorbed
phases and gas phases (Myers and Prausnitz, 1965).
During equilibrium between the chemical potentials of the gas phase and the
adsorbed phase in non-ideal and high pressure scenarios, the equation based on RAST is
represented using fugacity instead of pressure (Myers and Prausnitz, 1965). It is given as:
𝑃𝑡𝑦𝑖𝜙𝑖 = 𝑓𝑖𝑜(𝜋)𝑥𝑖𝛾𝑖 {𝑖 = 1,2, … , 𝑁} (2.41)
where 𝜙𝑖(=𝑓𝑡
𝑃𝑡) is the fugacity coefficient of component i, and 𝑓𝑖
𝑜(𝜋) is the pure adsorbate
fugacity of component i at the same temperature and spreading pressure 𝜋 of the mixture.
𝜙𝑖 is equal to unity for ideal gases, and denotes the extent of deviation of vapors from ideal
behaviour. For RAST, the activity coefficients γ of the adsorbed phase are measured from
binary equilibrium experimental data and their theoretical models (Gothard et al., 1976;
Myers et al., 1983). Wilson and UNIQUAC (UNIversal QUAsiChemical) models are the
most well-known models for activity coefficients (Yun et al., 1996).
Wilson equation for a binary mixture is given as (Yun et al., 1996):
𝑙𝑛 𝛾1 = − 𝑙𝑛(𝑥1 + 𝛬12𝑥2) + 𝑥2 (𝛬12
𝑥1+𝛬12𝑥2−
𝛬21
𝑥2+𝛬21𝑥1) (2.42)

43
𝑙𝑛 𝛾2 = − 𝑙𝑛(𝑥2 + 𝛬21𝑥1) − 𝑥1 (𝛬12
𝑥1+𝛬12𝑥2−
𝛬21
𝑥2+𝛬21𝑥1) (2.43)
where Λ12, Λ21 are the binary interaction parameters between components 1 and 2.
UNIQUAC equations for a binary mixture is represented as (Yun et al., 1996):
𝑙𝑛 𝛾1 = 𝑙𝑛𝛷1
𝑥1+
𝑧
2𝑞1 𝑙𝑛
𝜃1
𝛷1+ 𝛷2 (𝜄1 −
𝑟1
𝑟2𝜄2) − 𝑞1𝑙𝑛(𝜃1 + 𝜃2𝜏21) + 𝜃2𝑞1 (
𝜏21
𝜃1+𝜃2𝜏21−
𝜏12
𝜃2+𝜃1𝜏12)
(2.44)
𝑙𝑛 𝛾2 = 𝑙𝑛𝛷2
𝑥2+
𝑧
2𝑞2 𝑙𝑛
𝜃2
𝛷2+ 𝛷2 (𝜄2 −
𝑟2
𝑟1𝜄1) − 𝑞2𝑙𝑛(𝜃2 + 𝜃1𝜏12) + 𝜃1𝑞2 (
𝜏12
𝜃2+𝜃1𝜏12−
𝜏21
𝜃1+𝜃2𝜏21)
(2.45)
and
𝛷1 =𝑥1𝑟1
𝑥1𝑟1+𝑥2𝑟2 (2.46)
𝛷2 =𝑥2𝑟2
𝑥1𝑟1+𝑥2𝑟2 (2.47)
𝜃1 =𝑥1𝑞𝑚𝑠1
𝑥1𝑞𝑚𝑠1+𝑥2𝑞𝑚𝑠2 (2.48)
𝜃2 =𝑥2𝑞𝑚𝑠2
𝑥1𝑞𝑚𝑠1+𝑥2𝑞𝑚𝑠2 (2.49)
𝜄1 =𝑧
2(𝑟1 − 𝑞𝑚𝑠1) − (𝑟1 − 1) (2.50)
𝜄2 =𝑧
2(𝑟2 − 𝑞𝑚𝑠2) − (𝑟2 − 1) (2.51)
where 𝜏12, 𝜏21 are the binary interaction parameters; 𝑧 the coordination number; 𝑟1, 𝑟2,
𝑞𝑚𝑠1, 𝑞𝑚𝑠2 are the pure component molecular structure constants depending on molecular
size and external surface area. Some activity coefficients models are also based on
spreading pressure to provide more flexibility to the RAST (Talu and Zwiebel, 1987; Talu
et al., 1995). The theory considers the same fundamental equations and spreading-
44
pressure relations as those of IAST, which can be solved simultaneously with the activity
coefficient models mentioned above (Myers and Prausnitz, 1965).
The RAST model is applied usually when there are significant deviations from
ideality for both the adsorbed and gas phases (Talu and Zwiebel, 1986; Chen et al., 1990;
Sakuth et al., 1998; Siperstein and Myers, 2001; Myers, 2005; Heinonen et al., 2012; Hefti
et al., 2015;). It has similar advantages (Myers and Prausnitz, 1965) and limitations
(Huggahalli et al., 1996) as those of IAST, and therefore, is recommended for
multicomponent competitive adsorption equilibria involving components with similar
adsorption profiles and mechanism. However, an additional limitation might be the
mathematical and experimental complications of measuring activity coefficients (Wood,
2000).
2.2.3.4 Vacancy Solution Model
The vacancy solution model (VSM) was first developed by Suwanayuen and
Danner (Suwanayuen and Danner, 1980). It assumes that the adsorption system consists
of vacancies, and two solutions: gas phase and adsorbed phase. The composition and
density of the solutions differ, with the adsorbed phase being denser than the gas phase
(Suwanayuen and Danner, 1980). The vacancies are considered to be vacuum spaces
which act as the solvent of the system, and have the same size as the adsorbate molecules
(Suwanayuen and Danner, 1980).
At equilibrium, according to VSM, chemical potential of the vacancies is equal at
the adsorbed phase and at the gas phase (Suwanayuen and Danner, 1980). The equation
is presented as:
𝜋 = −𝑅𝑇
𝜎𝑙𝑛(𝛾𝑥) (2.52)
45
where 𝜎 is the partial molar surface area of adsorbed molecules. The activity coefficient 𝛾
is equal to unity for ideal solutions, and is measured through binary equilibrium
experimental data and models for non-ideal solutions (Yun et al., 1996).
The main inputs for this model are the pure single-component isotherms to
measure the mixture spreading pressure 𝜋 (Suwanayuen and Danner, 1980), similar to
the solution procedures for IAST and RAST (Myers and Prausnitz, 1965). Equation (2.52)
can be applied to any number of components in a mixture. It has been successful to
describe adsorption of many VOCs on AC (Wood, 2000). However, since the VSM model
does not consider the unique behaviour of water vapor adsorption, it cannot be applied to
predict the effect of RH on VOC adsorption (Huggahalli et al., 1996). Other limitations of
this model include the ones mentioned for IAST and RAST.
2.2.3.5 Method of Chou and Chiou
Chou and Chiou (1997) developed a simple Freundlich-like model which predicts
the VOC adsorption capacity in humid conditions. Its main inputs are the pure single-
component adsorption isotherms for VOC and water vapor.
The model considers that the pure VOC adsorption isotherm is represented by the
Langmuir model. For pure water vapor adsorption equilibrium, Freundlich isotherm is
considered. Chou and Chiou (1997) assumed that some adsorption sites on AC are
relatively more hydrophilic than the others and therefore adsorb more water vapor. The
remaining sites and pores are covered by VOCs. The proposed model is given as:
𝑞𝑉𝑂𝐶
𝑞𝑉𝑂𝐶,𝑅𝐻=0= 1 − 𝐾𝑓𝑅𝐻
1
𝑛 (2.53)
46
where qVOC is the equilibrium adsorption capacity for VOC at a given RH, 𝑞𝑉𝑂𝐶,𝑅𝐻=0 is the
equilibrium adsorption capacity for VOC at dry conditions derived from the pure single-
component Langmuir isotherm at the same temperature. Other parameters in equation
(2.53) are same as defined for Freundlich isotherm earlier.
The Chou and Chiou model has been used by a few studies with reasonable success,
especially for predicting adsorption capacity for VOCs such as hexane, cyclohexane,
benzene, toluene, methanol, acetone in humid streams on GAC (Chou and Chiou, 1997;
Wood, 2000) and more recently on zeolites (Tao et al., 2004). However, its application is
very limited mainly due to its failure to consider the fundamental difference in adsorption
mechanism of water and VOCs, and its lack of a finite limit for adsorption capacity at
saturation (Chou and Chiou, 1997; Wood, 2000).
2.2.3.6 Virial Mixture Coefficient Method
In the virial mixture coefficient (VMC) approach, multicomponent adsorption
equilibria are predicted using thermodynamically consistent two-dimensional equation
of states (EOS) (Taqvi and LeVan, 1997). The two-dimensional virial equation of state
(2D-VEOS) is given as:
𝜋𝐴
𝑅𝑇= 𝑞 +
1
𝐴∑ ∑ 𝑞𝑖𝑞𝑗𝐵𝑖𝑗𝑗𝑖 +
1
𝐴2∑ ∑ ∑ 𝑞𝑖𝑞𝑗𝑞𝑘𝐶𝑖𝑗𝑘 + ⋯𝑘𝑗𝑖 (2.54)
where 𝑞𝑖, 𝑞𝑗, 𝑞𝑘 are the concentration of component i, j, k respectively in the solid phase;
𝐵𝑖𝑗, 𝐶𝑖𝑗𝑘 are the virial coefficients. These coefficients account for molecular interactions
between adsorbed molecules. Interactions between adsorbates and adsorbent are
described by Henry’s law, and are considered by pure single-component adsorption
isotherms. Virial coefficients with the same subscripts such as 𝐵11, 𝐶333 represent

47
interactions between same components. Interactions between different components are
described by VMCs such as 𝐵12, 𝐶123.
For a binary competitive adsorption equilibrium, 2D-VEOS is written as (Taqvi
and LeVan, 1997):
𝜋𝐴
𝑅𝑇= 𝑞1 +
1
𝐴𝐵11𝑞1
2 +1
𝐴2 𝐶111𝑞13 + ⋯ + 𝑞2 +
1
𝐴𝐵22𝑞2
2 +1
𝐴2 𝐶222𝑞23 + ⋯ +
2
𝐴𝐵12𝑞1𝑞2 +
3
𝐴2 𝐶112𝑞12𝑞2 +
3
𝐴2 𝐶122𝑞1𝑞22 + ⋯ (2.55)
Equation (2.55) can also written as:
𝜋𝐴
𝑅𝑇= [
𝜋𝐴
𝑅𝑇]
𝑝𝑢𝑟𝑒 1+ [
𝜋𝐴
𝑅𝑇]
𝑝𝑢𝑟𝑒 2+ [
𝜋𝐴
𝑅𝑇]
𝑚𝑖𝑥𝑡𝑢𝑟𝑒 (2.56)
Therefore, for a binary adsorption system, it can be clearly seen that the mixture term is
an adjustment to the spreading pressure contributions from the pure components.
The basis of VMC approach was postulated by Van Ness (1969), who derived a
relation between spreading pressure of adsorbed components and their fugacities from
Helmholtz free energy. The model when combined with equation (2.56) is given as (Appel
et al., 1998):
𝑙𝑛 𝑓𝑖 = 𝑙𝑛 𝑓𝑝𝑢𝑟𝑒 𝑖 + ∫ (𝛿([
𝜋𝐴
𝑅𝑇]
𝑚𝑖𝑥𝑡𝑢𝑟𝑒)
𝛿𝑞𝑖)
𝑇,𝐴,𝑞𝑗
∞
𝐴
𝑑𝐴
𝐴 (2.57)
Equation (2.57) implies that for component i in a multicomponent adsorption system, the
adsorption equilibrium of i is equal to a sum of adsorption of pure component i and a
term which considerers interactions of i with other adsorbates in the mixture. Assuming
ideal behaviour, fugacity can be replaced by partial pressure, and the mixture term in

48
equation (2.57) can be substituted with equation (2.55). After rearrangement and
integration, the VMC-based equation can be given as (Nastaj et al., 2016):
𝑙𝑛 𝑃𝑖 = 𝑙𝑛 𝑃𝑝𝑢𝑟𝑒 𝑖 +2
𝐴∑ ∑ 𝐵𝑖𝑗𝑞𝑖𝑗𝑖 +
3
2𝐴2∑ ∑ ∑ 𝐶𝑖𝑗𝑘𝑞𝑗𝑞𝑘 + ⋯𝑘𝑗𝑖 (2.58)
The pure component adsorption term in equation (2.58) can be represented either by a
good fitting isotherm or by an EOS, and the VMCs are measured as approximate
parameters by minimizing the objective function (Appel et al., 1998):
𝑓𝑚𝑖𝑛 = ∑ ∑ (𝑙𝑛 𝑃𝑖𝑗
𝑐𝑎𝑙 − 𝑙𝑛 𝑃𝑖𝑗
𝑒𝑥𝑝)2
𝑀𝑗=1
𝑁𝑖=1 (2.59)
VMC approach to multicomponent competitive adsorption equilibria is relatively
a new method. It shows good agreement with several experimental data conducted by
Taqvi et al. (1997,1999), Nastaj et al. (2016), Qi et al. (2005a, 2006), and Appel et al.
(1998) involving organic-organic and organic-water vapor systems. However, it is
mathematically more intensive and complex compared to other models.
2.2.3.7 Method of Doong and Yang
Doong and Yang developed a thermodynamically consistent model based on
Polanyi potential theory to predict multicomponent adsorption equilibria involving
organics and water vapor (Tien, 2013). They modified the DR equation to include a term
to account for water hysteresis, and activity coefficients for the adsorbed phase. For a
binary system, Doong and Yang’s model can be given as (Tien, 2013):
𝑊1 = (𝑊𝑜 − 𝑊2)𝑒𝑥𝑝 {− (𝑅𝑇
𝛽1𝐸𝑜)
2
[(𝑙𝑛𝛾1𝑃𝑆1
𝑃1)
2
− (𝑙𝑛 ℎ𝑜1
1−𝑃2
𝑜
𝛾2𝑜𝑃𝑆2
)
2
]} (2.60)
49
𝑊2 = (𝑊𝑜 − 𝑊1)𝑒𝑥𝑝 {− (𝑅𝑇
𝛽2𝐸𝑜)
2
[(𝑙𝑛𝛾2𝑃𝑆2
𝑃2)
2
− (𝑙𝑛 ℎ𝑜2
1−𝑃1
𝑜
𝛾1𝑜𝑃𝑆1
)
2
]} (2.61)
where 𝑊1, 𝑊2 are the adsorbed volumes of component 1 (VOC) and 2 (water vapor) at
relative pressures 𝑃1
𝑃𝑆1 and
𝑃2
𝑃𝑆2 with activity coefficients 𝛾1, 𝛾2 respectively; 𝐸𝑜 is the
characteristic energy which can be determined from a standard reference adsorbate; 𝛽1,
𝛽2 are the affinity coefficients of the characteristic curve; ℎ𝑜1, ℎ𝑜2 the relative pressures of
component 1 and 2 respectively at the beginning of the hysteresis loop; and 𝑃1
𝑜
𝑃𝑆1,
𝑃2𝑜
𝑃𝑆2 the
pure single-component relative pressures of component 1 and 2 respectively.
In an organic-water system, the model assumes the activity coefficient for organic
vapors to be unity. Similarly, for water vapor the activity coefficient may also be assumed
to be unity if relative pressure is more than 0.6. For relative pressures lower than 0.6, 𝛾
can be measured using the following empirical equation (Tien, 2013):
(𝑊2𝑜 + ��)(1 + 𝐽1𝑊2
𝑜)𝑃2
𝑜
𝛾2𝑜𝑃𝑆2
= 𝐽2�� (2.62)
where ��, 𝐽1, 𝐽2 are the model fitting parameters; and 𝑊2𝑜 is the total adsorbed volume
during pure water vapor adsorption at a certain 𝑃2
𝑜
𝑃𝑆2.
From equations (2.60) and (2.61), it can be noted that it is a volume exclusion
model (fixed total pore volume). The equations can also be used to estimate the
adsorption of pure single component isotherms, by neglecting the volume exclusion term
(𝑊𝑜 − 𝑊2) and replacing it with only the total limiting pore volume (𝑊𝑜) (Wood, 2000).
50
The model equations are non-linear and coupled, and are solved by an iterative
procedure (Wood, 2000). This Polanyi-based concept was successfully validated by
numerous experiments for binary systems involving methanol-water vapor, acetone-
water vapor, benzene-water vapor, and toluene-water vapor (Keener and Zhou, 1990;
Huasheng et al., 2002; Li et al., 2010). Doong and Yang’s model, however, is less flexible
than multicomponent models such as VMC because it relies only on DR-based equations
which do not universally describe water adsorption equilibria and mechanism. It also
does not consider the interactions that may occur between VOCs and water vapor during
adsorption.
2.2.3.8 Method of Okazaki, Tamon and Toei
Okazaki et al. (1978) proposed a model exclusively to predict binary competitive
adsorption equilibrium between organics and water vapor on AC. They assumed that the
total amount of adsorbed organic component in humid streams is attributed to the
following three sources:
• Adsorption of organic vapor in non-wetted pores where no condensation of water
vapor takes place, ��1.
• Liquid-phase adsorption of organic compound within wetted pores where capillary
condensation takes place, ��2.
• Dissolution of organic vapor in the condensed water, ��3.
Therefore, the total amount of organic vapor adsorbed in humid streams can be written
as:
��𝑡 = ��1 + ��2 + ��3 (2.63)
51
and
��1 = 𝑞𝑔𝑜 (
𝐴𝑑
𝐴) (2.64)
��2 = 𝑞𝑙𝑜 (
𝐴𝑐
𝐴) (2.65)
��3 = [𝑉𝑐 − (𝑞𝑤
𝜌𝑤)] 𝜌𝑣 − ��2 (2.66)
where 𝑞𝑔𝑜 is the equilibrium adsorption capacity for the organic adsorbate measured from
its pure single-component adsorption isotherm at the mixture relative pressure; 𝑞𝑙𝑜 is the
equilibrium adsorption capacity for the organic adsorbate in an aqueous solution and is
obtained from its liquid phase adsorption isotherm at the mixture relative pressure; 𝐴𝑑,
𝐴𝑐 account for the dry and wet surface areas of the adsorbent respectively; 𝑉𝑐 denotes
volume of the condensed phase; 𝑞𝑤 is the amount of water vapor adsorbed; 𝜌𝑤, 𝜌𝑣 are the
densities of water and organic vapor in their adsorbed state respectively.
The values of 𝑉𝑐, 𝐴𝑑, 𝐴𝑐 are determined from the desorption isotherm data of water
vapor, and the Kelvin equation modified by Okazaki et al. (1978). The modified equation
is given as:
𝑟 =2𝜎𝑡𝑣𝑚 𝑐𝑜𝑠 𝜃
(𝑅𝑇 𝑙𝑛𝑃𝑡
𝑃𝑡𝑆)
(2.67)
and
𝑃𝑡𝑆 = 𝑃𝑤𝑆𝑥𝑤′ + 𝑃𝑣𝑆(1 − 𝑥𝑤
′ ) (2.68)
where r is the pore radius; 𝑣𝑚 the molar volume of the liquid adsorbate; 𝜎𝑡 the surface
tension; 𝜃 the contact angle; 𝑃𝑡𝑆 the saturated total (water and organic) vapor pressure of
the condensed phase; 𝑃𝑤𝑆 and 𝑃𝑣𝑆 are the saturated vapor pressures of water vapor and

52
organic vapor, respectively; and 𝑥𝑤′ the mole fraction of water vapor in the condensed
phase.
Once 𝑉𝑐, 𝐴𝑑, 𝐴𝑐 are determined, the total amount of adsorbed organic vapor in
humid conditions can easily be calculated from equations (2.63), (2.64), (2.65), and
(2.66). The method of Okazaki et al (1978) was applied by few studies. However, the
accuracy of the model’s predictions was found to be inferior, in terms of accuracy, for
selected VOC-water systems in comparison with the Doong and Yang model (Tien, 2013).
Furthermore, the model also requires significantly higher number of input requirements
such as adsorption profiles of gas phase and liquid phase organic vapors, desorption
profile of water vapor, adsorbent specific surface area, adsorbent cumulative pore volume,
adsorbent pore radius, and adsorbed phase composition; unlike Doong and Yang’s model.
2.2.3.9 Method of Manes
Manes (1984) developed a graphical model to describe the effects of humidity on
AC adsorption of water-immiscible VOCs. It is based on Polanyi’s potential theory and is
therefore, thermodynamically consistent. The model requires only the pure adsorption
profiles of the organic vapor and water vapor as input. Initially, these profiles were
represented by the adsorption characteristic curves and therefore, the model was solved
graphically. However, the characteristic curves can be replaced with good fitting single-
component adsorption isotherms for all the components in a mixture. These
modifications make the model more compatible for computer simulation of a dynamic
adsorption process (Qi et al., 2000b).
The major assumptions of this model for a binary (organic vapor and water vapor)
mixture coadsorption on AC are (Manes, 1984):
53
• At the relative pressures of organic (𝑃𝑣
𝑃𝑣𝑆) and water vapor (
𝑃𝑤
𝑃𝑤𝑆) in the mixture, if
the adsorbed volume of pure organic vapor (𝑉𝑣𝑜) is more than the adsorbed volume
of pure water vapor (𝑉𝑤𝑜), then there is no interference by water vapor on the
adsorption capacity for organic vapor during multicomponent adsorption.
Therefore, the adsorbed volume of organic vapor adsorbed during competitive
adsorption (𝑉𝑣) with water vapor can be directly given by its pure single-
component adsorption isotherm.
• Similarly at 𝑃𝑣
𝑃𝑣𝑆 and
𝑃𝑤
𝑃𝑤𝑆, if 𝑉𝑣
𝑜 is less than 𝑉𝑤𝑜, then there is significant effect by water
vapor on the organic adsorption capacity during multicomponent competitive
adsorption. This phenomenon is predicted using Manes’ derivation based on
Polanyi’s potential theory.
For the first condition (𝑉𝑣𝑜 > 𝑉𝑤
𝑜), the model equations are written as:
𝑞𝑤 = 0 (2.69)
𝑞𝑣 = 𝜌𝑣𝑉𝑣𝑜 (2.70)
where 𝑞𝑤 and 𝑞𝑣 are the equilibrium adsorption capacities for water and organic vapor in
a mixture, respectively; 𝑉𝑣𝑜 is measured directly from the pure single-component organic
vapor adsorption isotherm.
For the second condition (𝑉𝑣𝑜 < 𝑉𝑤
𝑜), the equations involved are given as:
𝑣′
𝑣𝑣= 𝑣
𝑜
𝑣𝑣− 𝑤
𝑜
𝑣𝑤−
𝑅𝑇
𝑣𝑤𝑙𝑛
𝑃𝑤
𝑃𝑤𝑆 (2.71)
휀𝑣′ = 휀𝑣
𝑜 − 휀𝑤𝑜 (
𝑣𝑣
𝑣𝑤) (2.72)

54
휀𝑣𝑜 = 𝑅𝑇 𝑙𝑛
𝑃𝑣𝑆
𝑃𝑣𝑜 (2.73)
휀𝑣′ = 𝑅𝑇 𝑙𝑛
𝑃𝑣𝑆
𝑃𝑣′ (2.74)
휀𝑤𝑜 = 𝑅𝑇 𝑙𝑛
𝑃𝑤𝑆
𝑃𝑤𝑜 (2.75)
where 휀𝑣𝑜 and 휀𝑣
′ are the adsorption potentials of organic vapor in its pure and mixture
state, respectively; 휀𝑤𝑜 the adsorption potential of water vapor in its pure state; 𝑣𝑣 and 𝑣𝑤
are the molar volumes of organic and water vapors, respectively; and 𝑃𝑣
𝑜
𝑃𝑣𝑆 and
𝑃𝑤𝑜
𝑃𝑤𝑆 the
relative pressures of organic and water vapors in their pure component systems,
respectively.
Equation (2.71) is the thermodynamic potential theory-based relation derived by
Manes (1984); which shows that the net adsorption potential of an organic vapor in a
mixture at 𝑉𝑣𝑜 < 𝑉𝑤
𝑜 is equal to its adsorption potential in pure state, diminished by the
adsorption potential of an equal volume of pure water vapor, and corrected for water
vapor pressure less than saturation. It reduces to equation (2.72) at 𝑃𝑤
𝑃𝑤𝑆 equal to unity,
that is, at an RH of 100%.
For multicomponent organic mixtures with water vapor, the condition of Grant
and Manes (1966) may be considered:
1
𝑉1𝑙𝑜𝑔 𝑥1 (
𝑃𝑆
𝑃)
1=
1
𝑉2𝑙𝑜𝑔 𝑥2 (
𝑃𝑆
𝑃)
2=
1
𝑉3𝑙𝑜𝑔 𝑥3 (
𝑃𝑆
𝑃)
3= ⋯ (2.76)
where 𝑉1, 𝑉2, 𝑉3, are the total adsorbed volume of component 1, 2, 3 respectively; at mole
fractions 𝑥1, 𝑥2, 𝑥3; and relative pressures (P
PS)
1, (
P
PS)
2, (
P
PS)
3 of component 1, 2, 3
respectively.
55
The competitive adsorption between organic and water adsorbates onto an AC can
generally be predicted by Manes’ method either through an iterative procedure
numerically (Qi et al., 2000b) or graphically (Manes, 1984) to satisfy equation (2.71). It
provides good predictions and was successfully verified experimentally for selected water-
immiscible VOC-water systems on AC (Manes, 1984; Cal, et al., 1996). The model is
thermodynamically consistent, flexible, easy to use, and its results are far superior to that
of the method of Okazaki et al. (Tien, 2013). However, the Manes model does not take
into account the solubility of VOCs in water and vice versa during competitive adsorption
(Manes, 1984).
2.3 Summary and Conclusions
This chapter provided an overview of the existing studies on the impact of relative
humidity on adsorption of VOCs and other gases onto activated carbon. It also included a
critical literature review of the single- and multicomponent adsorption isotherms
involving VOCs and water vapor to understand the mechanism of water vapor adsorption
on activated carbon, especially during competitive adsorption, and to support the
development of a dynamic and predictive multicomponent competitive adsorption model.
For the VOCs, Polanyi’s potential-theory-based models such as the DR, DA, and
MDR isotherm equations seem to be the most versatile and proven single-component
adsorption models and are recommended for predicting adsorption capacities. The
original equations of DR and the more generic DA are thermodynamically consistent at
medium and high concentrations, except at low loadings. This issue was addressed by
other researchers (Kapoor et al., 1989; Hung and Lin, 2007), who modified the Dubinin-
equations to make them thermodynamically consistent in all the regions. Other isotherm

56
equations such as Langmuir, Freundlich, and Toth are useful for fitting experimental
isotherm data but have little value in predicting adsorption capacities due to the lack of
strong fundamental basis.
For single-component water vapor adsorption, QHR, TM, QLV, and Do and Do
isotherm models are recommended for predicting adsorption capacities. All of them
consider the fundamental mechanism related to water adsorption on AC, i.e., adsorption
on surface functional groups (primary adsorption sites) at low loadings, and cluster
formation mechanism (secondary adsorption sites) at medium to high loadings. The
models have been successfully verified and tested on several types of AC at different
adsorption temperatures. The Dubinin-based models for water adsorption such as MDA,
DS have limited use as they do not consider cluster formation mechanism.
For prediction of competitive adsorption equilibria involving organic-organic
systems, the IAST, RAST, VSM, and VMC models are suggested, mainly because they are
based on solution thermodynamics and are therefore thermodynamically consistent
throughout the entire region. All of them are mathematically straightforward to solve,
except for VMC.
For organic-water vapor systems, VMC, method of Doong and Yang, and method
of Manes are recommended. All of these are thermodynamically consistent and account
for water vapor adsorption mechanism exclusively during competitive adsorption. Most
of these multicomponent adsorption models are solved through iterations and are
therefore mathematically intensive. They have been extensively tested and were found to
be more accurate than other organic-water vapor competitive adsorption isotherm
models such as the method of Okazaki et al., the method of Chou and Chou, and the IAST.
The models are also flexible enough for computer simulations and numerical solutions.
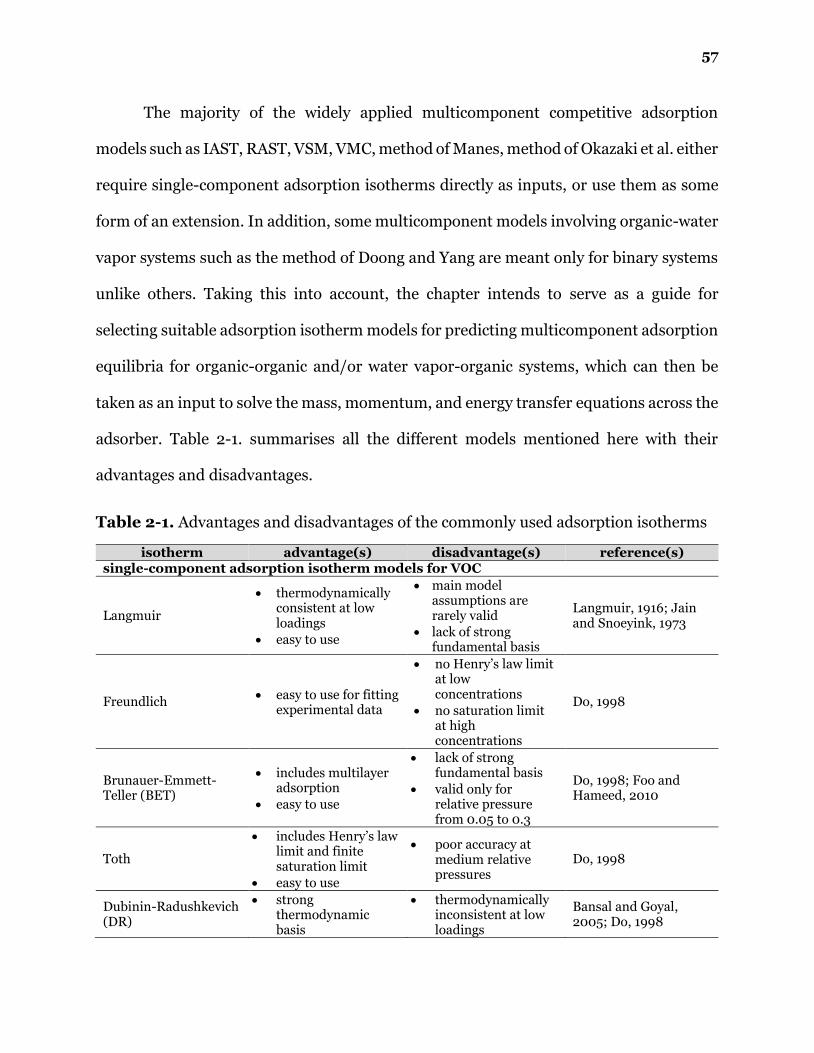
57
The majority of the widely applied multicomponent competitive adsorption
models such as IAST, RAST, VSM, VMC, method of Manes, method of Okazaki et al. either
require single-component adsorption isotherms directly as inputs, or use them as some
form of an extension. In addition, some multicomponent models involving organic-water
vapor systems such as the method of Doong and Yang are meant only for binary systems
unlike others. Taking this into account, the chapter intends to serve as a guide for
selecting suitable adsorption isotherm models for predicting multicomponent adsorption
equilibria for organic-organic and/or water vapor-organic systems, which can then be
taken as an input to solve the mass, momentum, and energy transfer equations across the
adsorber. Table 2-1. summarises all the different models mentioned here with their
advantages and disadvantages.
Table 2-1. Advantages and disadvantages of the commonly used adsorption isotherms
isotherm advantage(s) disadvantage(s) reference(s) single-component adsorption isotherm models for VOC
Langmuir
• thermodynamically consistent at low loadings
• easy to use
• main model assumptions are rarely valid
• lack of strong fundamental basis
Langmuir, 1916; Jain and Snoeyink, 1973
Freundlich • easy to use for fitting
experimental data
• no Henry’s law limit at low concentrations
• no saturation limit at high concentrations
Do, 1998
Brunauer-Emmett-Teller (BET)
• includes multilayer adsorption
• easy to use
• lack of strong fundamental basis
• valid only for relative pressure from 0.05 to 0.3
Do, 1998; Foo and Hameed, 2010
Toth
• includes Henry’s law limit and finite saturation limit
• easy to use
• poor accuracy at medium relative pressures
Do, 1998
Dubinin-Radushkevich (DR)
• strong thermodynamic basis
• thermodynamically inconsistent at low loadings
Bansal and Goyal, 2005; Do, 1998
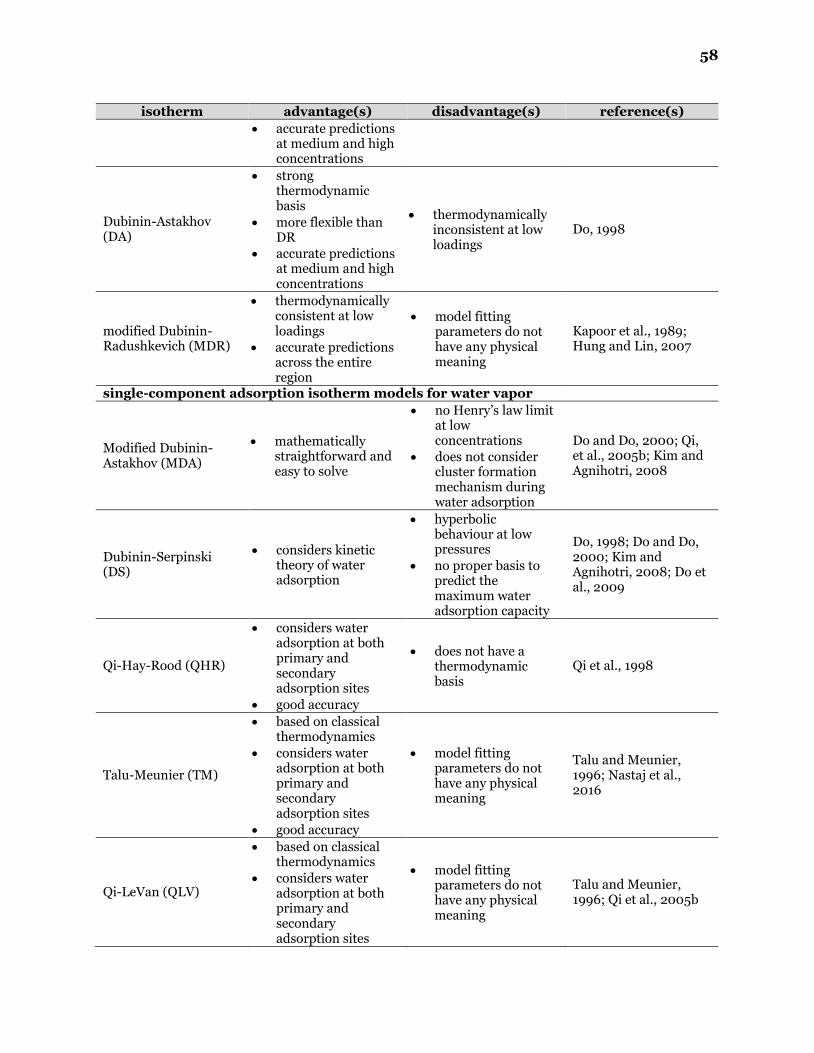
58
isotherm advantage(s) disadvantage(s) reference(s)
• accurate predictions at medium and high concentrations
Dubinin-Astakhov (DA)
• strong thermodynamic basis
• more flexible than DR
• accurate predictions at medium and high concentrations
• thermodynamically inconsistent at low loadings
Do, 1998
modified Dubinin-Radushkevich (MDR)
• thermodynamically consistent at low loadings
• accurate predictions across the entire region
• model fitting parameters do not have any physical meaning
Kapoor et al., 1989; Hung and Lin, 2007
single-component adsorption isotherm models for water vapor
Modified Dubinin-Astakhov (MDA)
• mathematically straightforward and easy to solve
• no Henry’s law limit at low concentrations
• does not consider cluster formation mechanism during water adsorption
Do and Do, 2000; Qi, et al., 2005b; Kim and Agnihotri, 2008
Dubinin-Serpinski (DS)
• considers kinetic theory of water adsorption
• hyperbolic behaviour at low pressures
• no proper basis to predict the maximum water adsorption capacity
Do, 1998; Do and Do, 2000; Kim and Agnihotri, 2008; Do et al., 2009
Qi-Hay-Rood (QHR)
• considers water adsorption at both primary and secondary adsorption sites
• good accuracy
• does not have a thermodynamic basis
Qi et al., 1998
Talu-Meunier (TM)
• based on classical thermodynamics
• considers water adsorption at both primary and secondary adsorption sites
• good accuracy
• model fitting parameters do not have any physical meaning
Talu and Meunier, 1996; Nastaj et al., 2016
Qi-LeVan (QLV)
• based on classical thermodynamics
• considers water adsorption at both primary and secondary adsorption sites
• model fitting parameters do not have any physical meaning
Talu and Meunier, 1996; Qi et al., 2005b
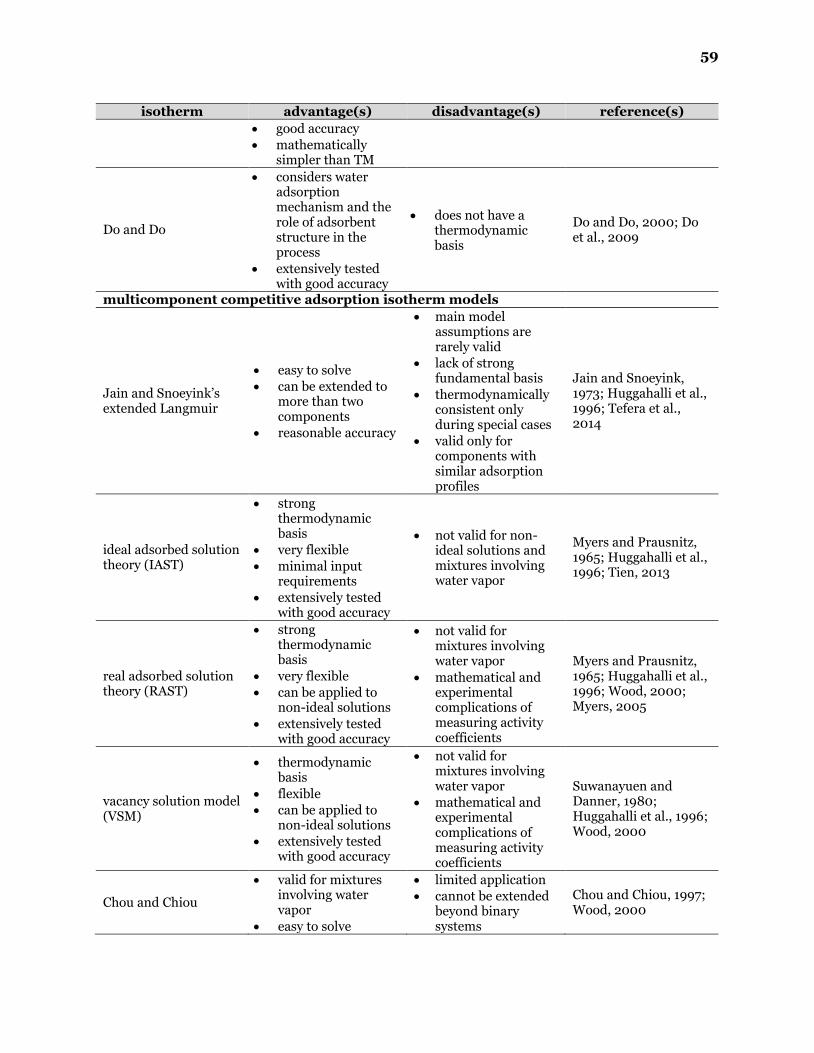
59
isotherm advantage(s) disadvantage(s) reference(s)
• good accuracy
• mathematically simpler than TM
Do and Do
• considers water adsorption mechanism and the role of adsorbent structure in the process
• extensively tested with good accuracy
• does not have a thermodynamic basis
Do and Do, 2000; Do et al., 2009
multicomponent competitive adsorption isotherm models
Jain and Snoeyink’s extended Langmuir
• easy to solve
• can be extended to more than two components
• reasonable accuracy
• main model assumptions are rarely valid
• lack of strong fundamental basis
• thermodynamically consistent only during special cases
• valid only for components with similar adsorption profiles
Jain and Snoeyink, 1973; Huggahalli et al., 1996; Tefera et al., 2014
ideal adsorbed solution theory (IAST)
• strong thermodynamic basis
• very flexible
• minimal input requirements
• extensively tested with good accuracy
• not valid for non-ideal solutions and mixtures involving water vapor
Myers and Prausnitz, 1965; Huggahalli et al., 1996; Tien, 2013
real adsorbed solution theory (RAST)
• strong thermodynamic basis
• very flexible
• can be applied to non-ideal solutions
• extensively tested with good accuracy
• not valid for mixtures involving water vapor
• mathematical and experimental complications of measuring activity coefficients
Myers and Prausnitz, 1965; Huggahalli et al., 1996; Wood, 2000; Myers, 2005
vacancy solution model (VSM)
• thermodynamic basis
• flexible
• can be applied to non-ideal solutions
• extensively tested with good accuracy
• not valid for mixtures involving water vapor
• mathematical and experimental complications of measuring activity coefficients
Suwanayuen and Danner, 1980; Huggahalli et al., 1996; Wood, 2000
Chou and Chiou
• valid for mixtures involving water vapor
• easy to solve
• limited application
• cannot be extended beyond binary systems
Chou and Chiou, 1997; Wood, 2000

60
isotherm advantage(s) disadvantage(s) reference(s)
• does not consider the difference in adsorption mechanism of water vapor and VOCs
• no finite limitation in adsorption capacity at saturation
• does not consider the interactions between VOCs and water vapor during adsorption
• not valid for mixtures without water vapor
virial mixture coefficient (VMC)
• strong thermodynamic basis
• valid for any kind of mixtures
• good accuracy
• mathematically more intensive than other models
Taqvi et al., 1997, 1999; Nastaj et al., 2016
Doong and Yang
• valid for mixtures involving water vapor
• thermodynamically consistent
• accounts for water hysteresis
• extensively tested with good accuracy
• does not consider the difference in adsorption mechanism of water vapor and VOCs
• cannot be extended beyond binary systems
• not valid for mixtures without water vapor
• requires iterative solution method
• does not consider the interactions between VOCs and water vapor during adsorption
Wood, 2000; Huasheng et al., 2002; Tien, 2013
Okazaki et al. • valid for mixtures
involving water vapor
• high number of input parameters
• lower accuracy compared to Doong and Yang model
• cannot be extended beyond binary systems
• not valid for mixtures without water vapor
Okazaki et al., 1978; Tien, 2013
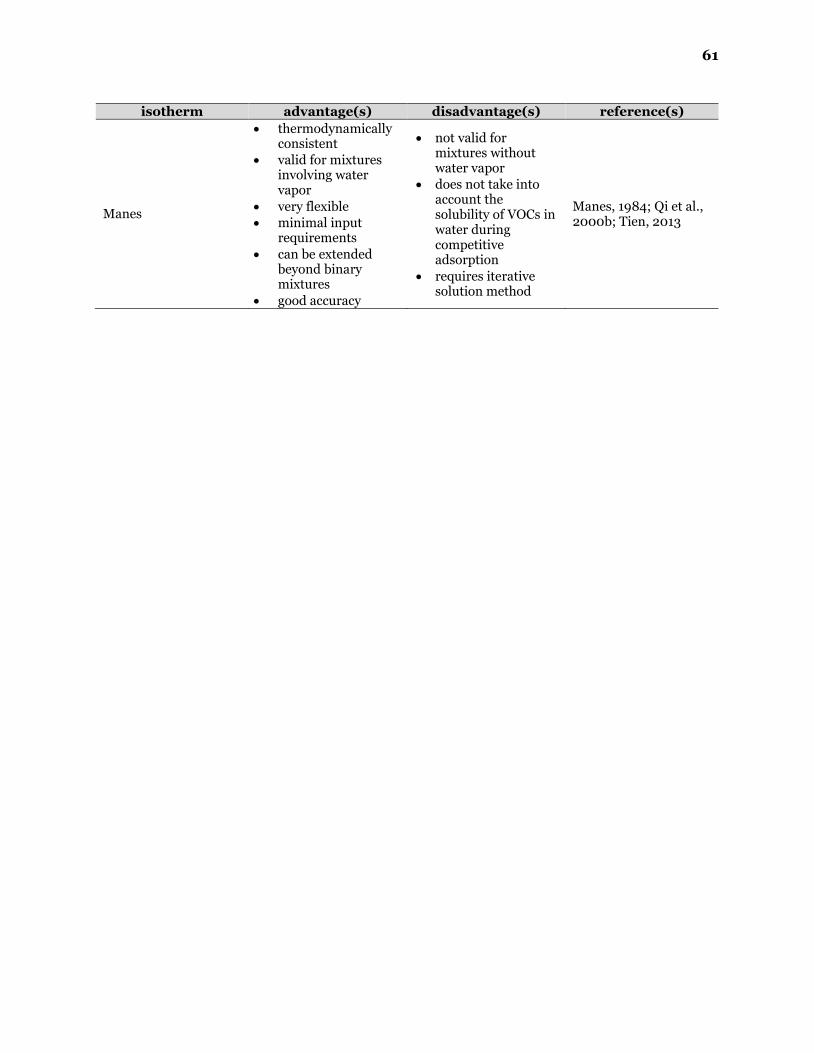
61
isotherm advantage(s) disadvantage(s) reference(s)
Manes
• thermodynamically consistent
• valid for mixtures involving water vapor
• very flexible
• minimal input requirements
• can be extended beyond binary mixtures
• good accuracy
• not valid for mixtures without water vapor
• does not take into account the solubility of VOCs in water during competitive adsorption
• requires iterative solution method
Manes, 1984; Qi et al., 2000b; Tien, 2013
62
2.4 References
Appel, W., LeVan, M., & Finn, J. (1998). Nonideal adsorption equilibria described by pure
component isotherms and virial mixture coefficients. Ind. Eng. Chem. Res., 37,
4774-4782.
Bansal, R., & Goyal, M. (2005). Activated Carbon Adsorption. Taylor & Francis Group.
Benjamin, M. (2009). New Conceptualization and Solution Approach for the Ideal
Adsorbed Solution Theory (IAST). Environ. Sci. Technol., 43, 2530-2536.
Bruanuer, S., Emmett, P., & Teller, E. (1938). Adsorption of gases in multimolecular
layers. J. Am. Chem. Soc, 60, 309-319.
Butler, J., & Ockrent, C. (1930). Studies in Electrocapillarity. Part III. J. Phys. Chem., 34,
2841-2859.
Cal, M., Rood, M., & Larson, S. (1996). Removal of VOCs from humidified gas streams
using activated carbon cloth. Gas Sep. Purif., 10, 117-121.
Chen, J., Loo, L., & Wang, K. (2011). An Ideal Absorbed Solution Theory (IAST) Study of
Adsorption Equilibria of Binary Mixtures of Methane and Ethane on a Templated
Carbon. J. Chem. Eng. Data, 56, 1209-1212.
Chen, Y., Ritter, J., & Yang, R. (1990). Nonideal Adsorption from Multicomponent Gas
Mixtures at Elevated Pressures on a 5A Molecular Sieve. Chem. Eng. Sci., 45, 2877-
2894.
Chou, M., & Chiou, J. (1997). Modeling effects of moisture on adsorption capacity of
activated carbon for VOCs. J. Environ. Eng., 123, 437-443.
Do, D. (1998). Adsorption Analysis: Equilibria and Kinetics. London: Imperial College
Press.
Do, D., & Do, H. (2000). A model for water adsorption in activated carbon. Carbon, 38,
767-773.
Do, D., Junpirom, S., & Do, H. (2009). A new adsorption–desorption model for water
adsorption in activated carbon. Carbon, 47, 1466-1473.
Dubinin, M., & Radushkevich, L. (1947). The equation of the characteristic curve of the
activated charcoal. Proc. Acad. Sci. USSR Phys. Chem. Sec., 55, 331-337.
63
Dubinin, M., & Serpinsky, V. (1981). Isotherm equation for water vapor adsorption by
microporous carbonaceous adsorbents. Carbon, 19, 402-403.
Foo, K., & Hameed, B. (2010). Insights into the modeling of adsorption isotherm systems.
Chem. Eng. J., 156, 2-10.
Freundlich, H. (1906). Over the adsorption in solution. J. Phys. Chem., 57, 385-471.
Furmaniak, S., Gauden, P., Terzyk, A., & Rychlicki, G. (2008). Water adsorption on
carbons — Critical review of the most popular analytical approaches. Adv. Colloid
Interface Sci., 137, 82-143.
Gothard, F., Clobanu, M., Breban, D., & Bucur, C. (1976). Predicting the Parameters in
the Wilson Equations for Activity Coefficients in Binary Hydrocarbon Systems.
Ind. Eng. Chem. Process Des. Dev., 15, 333-337.
Grant, R., & Manes, M. (1966). Adsorption of Binary Hydrocarbon Gas Mixtures on
Activated Carbon. Ind. Eng. Chem. Fund., 5, 490-498.
Gregg, S., & Sing, K. (1982). Adsorption, Surface Area and Porosity. New York: Academic
Press.
Haghseresht, F., & Lu, G. (1998). Adsorption characteristics of phenolic compounds onto
coal-reject-derived adsorbents. Energy Fuels, 12, 1100-1107.
Hefti, M., Marx, D., Joss, L., & Mazzotti, M. (2015). Adsorption equilibrium of binary
mixtures of carbon dioxide and nitrogen on zeolites ZSM-5 and 13X. Microporous
Mesoporous Mater., 215, 215-228.
Heinonen, J., Landa, H., Sainio, T., & Seidel-Morgenstern, A. (2012). Use of Adsorbed
Solution theory to model competitive and co-operative sorption on elastic ion
exchange resins. Sep. Purif. Technol., 95, 235-247.
Huasheng, G., Dahui, W., Yunchun, Y., & Tian'en, T. (2002). Binary Adsorption
Equilibrium of Benzene-Water Vapor Mixtures on Activated Carbon. Chinese J.
Chem. Eng., 10, 367-370.
Huggahalli, M., & Fair, J. (1996). Prediction of Equilibrium Adsorption of Water onto
Activated Carbon. Ind. Eng. Chem. Res., 35, 2071-2074.
Hung, H., & Lin, T. (2007). Prediction of the Adsorption Capacity for Volatile Organic
Compounds onto Activated Carbons by the Dubinin–Radushkevich–Langmuir
Model. J. Air & Waste Manage. Assoc., 57, 497-506.

64
Ilic, M., Flockerzi, D., & Seidel-Morgenstern, A. (2010). A thermodynamically consistent
explicit competitive adsorption isotherm model based on second-order single
component behaviour. J. Chromatogr. A, 1217, 2132-2137.
Jain, J., & Snoeyink, V. (1973). Adsorption from bisolute systems on active carbon. J.
Water Pollut. Control Fed., 45, 2463-2479.
Kapoor, A., Ritter, J., & Yang, R. (1989). On the Dubinin-Radushkevich Equation for
Adsorption in Microporous Solids in the Henry's Law Region. Langmuir, 5, 1118-
1121.
Keener, T., & Zhou, D. (1990). Prediction of Activated Carbon Adsorption Performance
Under High Relative Humidity Conditions. Environ. Progr., 9, 40-46.
Kim, P., & Agnihotri, S. (2008). Application of water–activated carbon isotherm models
to water adsorption isotherms of single-walled carbon nanotubes. J. Colloid
Interface Sci., 325, 64-73.
Landa, H., & Flockerzi, D. (2013). A Method for Efficiently Solving the IAST Equations
with an Application to Adsorber Dynamics. AIChE J., 59, 1263-1277.
Langmuir, I. (1916). The constitution and fundamental properties of solids and liquids. J.
Am. Chem. Soc., 38, 2221-2295.
Lashaki, M., Atkinson, J., Hashisho, Z., Phillips, J., Anderson, J., & Nichols, M. (2016a).
The role of beaded activated carbon’s surface oxygen groups on irreversible
adsorption of organic vapors. J. Hazard. Mater., 317, 284-294.
Lashaki, M., Atkinson, J., Hashisho, Z., Phillips, J., Anderson, J., Nichols, M., & Misovski,
T. (2016b). Effect of desorption purge gas oxygen impurity on irreversible
adsorption of organic vapors. Carbon, 99, 310-317.
Lee, J., Choi, D., Kwak, D., & Jung, H. (2005). Adsorption Dynamics of Water Vapor on
Activated Carbon. Adsorption, 11, 437-441.
Li, C., Xuemin, H., Fangning, F., & Fengli, J. (2010). Effect of relative humidity on
adsorption capacity of organic vapors on activated carbon and prediction by the
modified D-R equation. International Conference on Digital Manufacturing &
Automation , (pp. 608-611). Changha, Hunan.
Linders, M., van den Broeke, L., Kapteijn, F., & Moulijn, J. A. (2001). Binary Adsorption
Equilibrium of Organics and Water on Activated Carbon. AIChE J., 47, 1885-1892.
65
Lodewyckx, P., & Vansant, E. (1999). Water Isotherms of Activated Carbons with Small
Amounts of Surface Oxygen. Carbon, 37, 1647-1649.
Manes, M. (1984). Estimation of the effects of humidity on the adsorption onto activated
carbon of the vapors of water-immiscible organic liquids. Fundamentals of
Adsorption (pp. 335-344). New York: Engineering Foundation.
Mangano, E., Friedrich, D., & Brandani, S. (2015). Robust Algorithms for the Solution of
the Ideal Adsorbed Solution Theory Equations. AIChE J., 61, 981-991.
Myers, A. (1983). Activity Coefficients of Mixtures Adsorbed on Heterogeneous Surfaces.
AIChE J., 29, 691-693.
Myers, A. (2005). Prediction of Adsorption of Nonideal Mixtures in Nanoporous
Materials. Adsorption, 11, 37-42.
Myers, A., & Prausnitz, J. (1965). Thermodynamics of Mixed-Gas Adsorption. AIChE J.,
11, 121-126.
Myers, A., & Valenzuela, D. (1986). Computer Algorithm and Graphical Method for
Calculating Adsorption Equilibria of Gas Mixtures. J. Chem. Eng. Jap., 19, 392-
395.
Nastaj, J., Witkiewicz, K., & Chybowska, M. (2016). Modeling of multicomponent and
multitemperature adsorption equilibria of water vapor and organic compounds on
activated carbons. Ads. Sci. Technol., 34, 144-175.
O'Brien, J., & Myers, A. (1985). Rapid Calculations of Multicomponent Adsorption
Equilibria from Pure Isotherm Data. Ind. Eng. Chem. Process Des. Dev., 24, 1188-
1191.
Okazaki, M., Tamon, H., & Toei, R. (1978). Prediction of binary adsorption equilibria of
solvent and water vapor on activated carbon. J. Chem. Eng. Japan, 11, 209-215.
Qi, N., & LeVan, M. (2005a). Coadsorption of Organic Compounds and Water Vapor on
BPL Activated Carbon. 5. Methyl Ethyl Ketone, Methyl Isobutyl Ketone, Toluene,
and Modeling. Ind. Eng. Chem. Res., 44, 3733-3741.
Qi, N., & LeVan, M. (2005b). Adsorption equilibrium modeling for water on activated
carbons. Carbon, 43, 2258-2263.
Qi, N., Appel, W., & LeVan, M. (2006). Adsorption Dynamics of Organic Compounds and
Water Vapor in Activated Carbon Beds. Ind. Eng. Chem. Res., 45, 2303-2314.

66
Qi, S., Hay, K., & Cal, M. (2000b). Predicting humidity effect on adsorption capacity of
activated carbon for water-immiscible organic vapors. Adv. Environ. Res., 4, 357-
362.
Qi, S., Hay, K., & Rood, M. (1998). Isotherm Equation for Water Vapor Adsorption onto
Activated Carbon. J. Environ. Eng., 124, 1130-1134.
Qi, S., Hay, K., Rood, M., & Cal, M. (2000a). Equilibrium and Heat of Adsorption for
Water Vapor and Activated Carbon. J. Environ. Eng., 126, 267-271.
Richter, E., Schutz, W., & Myers, A. (1989). Effect of Adsorption Equation on Prediction
of Multicomponent Adsorption Equilibria by the Ideal Adsorbed Solution Theory.
Chem. Eng. Sci., 44, 1609-1616.
Russell, B., & LeVan, M. (1997). Coadsorption of Organic Compounds and Water Vapor
on BPL Activated Carbon. 3. Ethane, Propane, and Mixing Rules. Ind. Eng. Chem.
Res., 36, 2380-2389.
Sakuth, M., Meyer, J., & Gmehling, J. (1998). Measurement and prediction of binary
adsorption equilibria of vapors on dealuminated Y-zeolites (DAY). Chem. Eng.
Process, 37, 267-277.
Salame, I., & Bandosz, T. (1999). Experimental Study of Water Adsorption on Activated
Carbons. Langmuir, 15, 587-593.
Simon, C., Smit, B., & Haranczyk, M. (2016). pyIAST: Ideal adsorbed solution theory
(IAST) Python package. Comput. Phys. Commun., 200, 364-380.
Siperstein, F., & Myers, A. (2001). Mixed-Gas Adsorption. AIChE J., 47, 1141-1159.
Slasli, A., Jorge, M., Stoeckli, F., & Seaton, N. (2003). Water adsorption by activated
carbons in relation to their microporous structure. Carbon, 41, 479-486.
Stoeckli, F. (2002). Water adsorption in activated carbons of various degrees of oxidation
described by the Dubinin equation. Carbon, 40, 969-971.
Stoeckli, F., Jakubov, T., & Lavanchy, A. (1994). Water Adsorption in Active Carbons
described by the Dubinin-Astakhov Equation. J. Chem. Soc. Faraday. Trans., 90,
783-786.
Sullivan, P., Stone, B., Hashisho, Z., & Rood, M. (2007). Water adsorption with hysteresis
effect onto microporous activated carbon fabrics. Adsorption, 13, 173-189.

67
Suwanayuen, S., & Danner, R. (1980). A gas adsorption isotherm equation based on
vacancy solution theory. AIChE J., 26, 68-76.
Suzuki, M. (1990). Adsorption Engineering. Amsterdam: Elsevier Science Publishing
Company, Inc.
Talu, O., & Meunier, F. (1996). Adsorption of Associating Molecules in Micropores and
Application to Water on Carbon. AIChE J., 42, 809-819.
Talu, O., & Zwiebel, I. (1986). Multicomponent Adsorption Equilibria of Nonideal
Mixtures. AIChE J., 32, 1263-1276.
Talu, O., & Zwiebel, I. (1987). Spreading Pressure Dependent Equation for Adsorbate
Phase Acitivity Coefficients. React. Polym., 5, 81-91.
Talu, O., Li, J., & Myers, A. (1995). Activity Coefficients of Adsorbed Mixtures.
Adsorption, 1, 103-112.
Tao, W., Yang, T., Chang, Y., Chang, L., & Chung, T. (2004). Effect of Moisture on the
Adsorption of Volatile Organic Compounds by Zeolite 13X. J. Environ. Eng., 130,
1210-1216.
Taqvi, S., & LeVan, M. (1997). Virial Description of Two-Component Adsorption on
Homogeneous and Heterogeneous Surfaces. Ind. Eng. Chem. Res., 36, 2197-2206.
Taqvi, S., Appel, W., & LeVan, M. (1999). Coadsorption of Organic Compounds and Water
Vapor on BPL Activated Carbon. 4. Methanol, Ethanol, Propanol, Butanol, and
Modeling. Ind. Eng. Chem. Res., 38, 240-250.
Tefera, D., Hashisho, Z., Philips, J., Anderson, J., & Nichols, M. (2014). Modeling
Competitive Adsorption of Mixtures of Volatile Organic Compounds in a Fixed-
Bed of Beaded Activated Carbon. Environ. Sci. Technol., 48, 5108-5117.
Tefera, D., Lashaki, M., Fayaz, M., Hashisho, Z., Philips, J., Anderson, J., & Nichols, M.
(2013). Two-Dimensional Modeling of Volatile Organic Compounds Adsorption
onto Beaded Activated Carbon. Environ. Sci. Technol., 47, 11700-11710.
Tien, C. (2013). Adsorption Calculations and Modelling. Butterworth_Heinemann.
Underhill, D., & Kawar, K. (1999). Effect of Relative Humidity on the Adsorption of
Selected Water-Miscible Organic Vapors by Activated Carbon. AIHA J., 60, 730-
736.
68
Van Ness, H. (1969). Adsorption of gases on solids: Review of the role of thermodynamics.
Ind. Eng. Chem. Fundam., 8, 464-473.
Wood, G. (2000). Review of Models for Adsorption of Single Vapors, Mixtures of Vapors,
and Vapors at High Humidities on Activated Carbon for Applications including
Predicting Service Lives of Organic Vapor Respirator Cartridges. Washington,
D.C.: Los Alamos National Laboratory.
Ye, X., Qi, N., & LeVan, M. (2003). Prediction of adsorption equilibrium using a modified
D-R equation: organic-water vapor mixtures on BPL carbon. Carbon, 41, 2519-
2525.
Yun, J., Park, H., & Moon, H. (1996). Multicomponent Adsorption Calculations Based on
Adsorbed Solution Theory. Korean J. Chem. Eng., 13, 246-254.

69
Chapter 3 MATERIALS AND METHODS
70
The chapter provides a detailed description of the materials and methods used for
the thesis research. It is divided into three sections. The first section describes the setup
used for experimental validation. The second section explains the basis and parameters
of the model including the VOC-water vapor multicomponent adsorption isotherm, the
governing equations, and the initial and boundary conditions. The third section provides
details on the statistical approach used to verify the developed model.
3.1 Experimental Setup and Method
Figure 3-1 portrays the bench-scale adsorption unit used for the experimental
study of competitive adsorption between the VOC and water vapor onto a fixed bed of
BAC. The measured data were then used to verify the model at the same operating
conditions and parameters.
The experimental setup consisted of an adsorption tube containing the BAC
adsorbent bed, a VOC-water vapor mixture generation system, a gas detection system, a
heating system with variac, and a data acquisition and control (DAC) system. The
adsorption tube was a cylindrical stainless-steel tube measuring 15.24 cm in length and
1.575 cm inner diameter. It was loaded with 13.3 g of dry virgin BAC such that the BAC
bed length (L) was 11.5 cm. The BAC had a BET area of 1390 m2/g, micropore volume of
0.51 cm3/g, and total pore volume of 0.57 cm3/g. A 1.5-cm-thick glass wool was used as a
support for the fixed BAC bed at the bottom and top of the adsorption tube.
The VOC-water vapor mixture generation system consisted of two impingers,
diffuser stones, mass flow controllers, and a syringe pump. The flow rate of dry air was
controlled with a 0-20 standard liters per minute (SLPM) mass flow controller (Alicat
Scientific). Dry air stream was humidified using two water-filled impingers (1 L) with
71
diffuser stones, connected in parallel. A parallel configuration of impingers provided a
stable supply of required relative humidity levels. A syringe pump (KD Scientific, KDS-
220) was then used to inject the VOC into the humidified air stream, which is then
introduced to the fixed-bed adsorption tube.
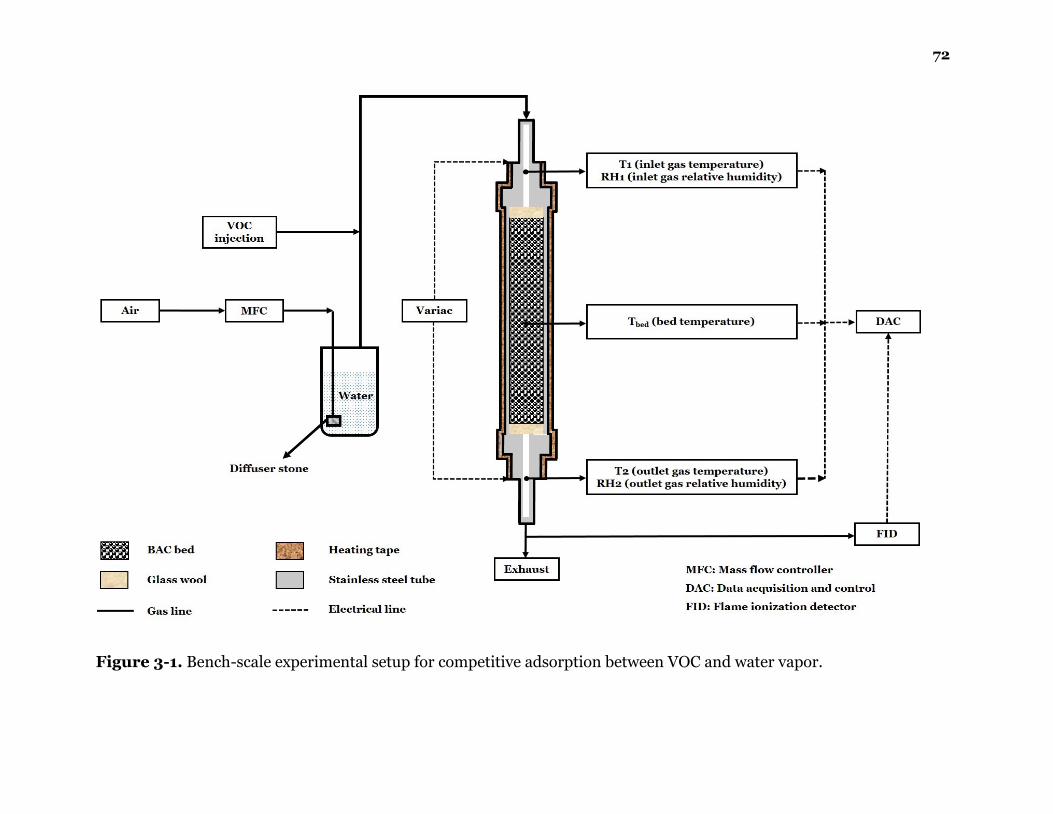
72
Figure 3-1. Bench-scale experimental setup for competitive adsorption between VOC and water vapor.

73
The gas detection system consisted of a flame ionization detector (FID) (Baseline
Mocon, Series 9000) to measure the adsorbent bed effluent VOC concentration, and RH
sensors (Vaisala HMT330) to measure the gas relative humidity. Two-point calibration of
the FID was conducted with fresh air for zero and a steady state concentration of the dry
adsorbate stream from the VOC-water vapor mixture generation system for span. Before
the start of each adsorption test, the generated adsorbate gas stream was monitored using
the FID and RH sensor, and was used as a reference for monitoring effluent stream. After
a steady concentration stream is achieved, the gas stream was directed into the inlet of
the adsorber tube to start the adsorption. A slip stream from the effluent was directed to
the FID for effluent concentration measurement. Adsorption was continued until the BAC
was fully saturated, as indicted by stable effluent concentrations, equal to the influent
concentrations, measured by the FID.
The heating system consisted of a heating tape (Omega) wrapped around the
adsorption tube, which was connected to a variable transformer (Staco Energy Products
Co.). The heating tape is a fiberglass-covered electrical resistive wire to convert electrical
energy to heat energy. The heating tape was used to provide constant energy to the fixed
bed of BAC throughout the adsorption process. The tested bed temperatures for this work
were 298.15 K (25 oC) and 305.15 K (32 oC). As adsorption progresses, the bed
temperature variations were measured by a 0.9 mm type K thermocouple (Omega),
inserted at the center of the tube. Resistant temperature detectors integrated with the RH
meter probes (Vaisala HMT 330) measured gas temperature at the inlet and outlet of the
adsorption tube.
The DAC system consisted of LabVIEW software package (National Instruments)
and a data logger (National Instruments, CompactDAQ) with analog input and output
74
modules. For this experimental setup, the data logger was interfaced with the FID, RH
sensors, and thermocouples to record the signals from these sensors.
More information about the experimental setup and method can be found
elsewhere (Lashaki et al., 2012a; Wang et al., 2012).
3.2 Model Development
3.2.1 Physical Model
The simulated bench-scale adsorber consisted of a cylindrical stainless steel tube
with a 0.787-cm inner radius (R), containing 11.5-cm-long fixed bed of BAC particles
(mean diameter = 0.75 mm) as shown in Figure 3-1. During dry conditions, a 10-SLPM
dry air stream containing 1000 ppmv of VOC entered from the top of the fixed-bed
adsorption tube at a superficial velocity (us) of 0.856 m/s and exited from the bottom of
the tube. During wet conditions, the air stream with a flow rate of 10 SLPM was
humidified up to 55 to 95% RH and then mixed with the VOC to generate a concentration
of 1,000 ppmv before being fed into the fixed bed adsorber.
Major assumptions implemented for the proposed model development include
negligible variation of flow properties in the angular direction of the cylindrical tube;
negligible adsorption of the carrier gas (air); ideal gas behaviour; and symmetric flow
conditions. These assumptions simplified the model geometry representing the adsorber
into a 2D axisymmetric geometry (Figure 3-2), which also reduces the overall
computation cost.

75
Figure 3-2. Simplification of the simulated adsorption unit into an 2D axisymmetric geometry.
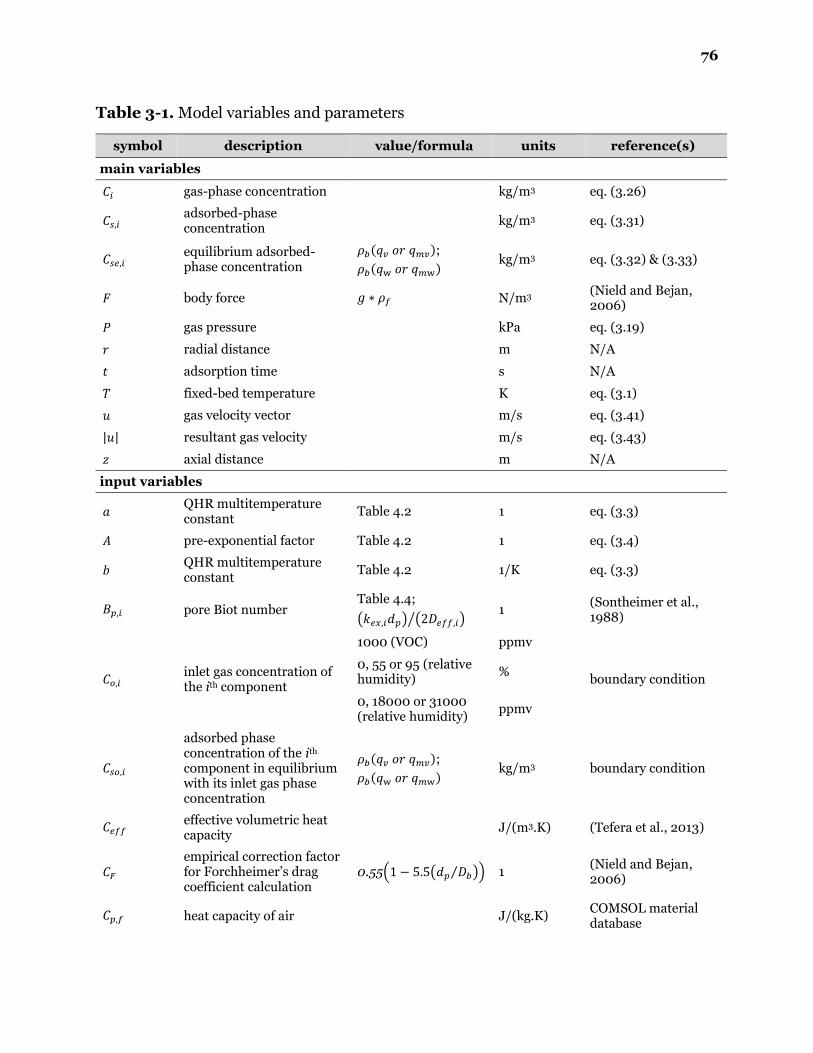
76
Table 3-1. Model variables and parameters
symbol description value/formula units reference(s)
main variables
𝐶𝑖 gas-phase concentration kg/m3 eq. (3.26)
𝐶𝑠,𝑖 adsorbed-phase concentration
kg/m3 eq. (3.31)
𝐶𝑠𝑒,𝑖 equilibrium adsorbed-phase concentration
𝜌𝑏(𝑞𝑣 𝑜𝑟 𝑞𝑚𝑣);
𝜌𝑏(𝑞w 𝑜𝑟 𝑞𝑚w) kg/m3 eq. (3.32) & (3.33)
𝐹 body force 𝑔 ∗ 𝜌𝑓 N/m3 (Nield and Bejan, 2006)
𝑃 gas pressure kPa eq. (3.19)
𝑟 radial distance m N/A
𝑡 adsorption time s N/A
𝑇 fixed-bed temperature K eq. (3.1)
𝑢 gas velocity vector m/s eq. (3.41)
|𝑢| resultant gas velocity m/s eq. (3.43)
𝑧 axial distance m N/A
input variables
𝑎 QHR multitemperature constant
Table 4.2 1 eq. (3.3)
𝐴 pre-exponential factor Table 4.2 1 eq. (3.4)
𝑏 QHR multitemperature constant
Table 4.2 1/K eq. (3.3)
𝐵𝑝,𝑖 pore Biot number Table 4.4;
(𝑘𝑒𝑥,𝑖𝑑𝑝) (2𝐷𝑒𝑓𝑓,𝑖)⁄ 1
(Sontheimer et al., 1988)
𝐶𝑜,𝑖 inlet gas concentration of the ith component
1000 (VOC) ppmv
boundary condition 0, 55 or 95 (relative humidity)
%
0, 18000 or 31000 (relative humidity)
ppmv
𝐶𝑠𝑜,𝑖
adsorbed phase concentration of the ith
component in equilibrium with its inlet gas phase concentration
𝜌𝑏(𝑞𝑣 𝑜𝑟 𝑞𝑚𝑣);
𝜌𝑏(𝑞w 𝑜𝑟 𝑞𝑚w) kg/m3 boundary condition
𝐶𝑒𝑓𝑓 effective volumetric heat capacity
J/(m3.K) (Tefera et al., 2013)
𝐶𝐹 empirical correction factor for Forchheimer’s drag coefficient calculation
0.55(1 − 5.5(𝑑𝑝 𝐷𝑏⁄ )) 1 (Nield and Bejan, 2006)
𝐶𝑝,𝑓 heat capacity of air J/(kg.K) COMSOL material database

77
symbol description value/formula units reference(s)
𝐶𝑝,𝑝 heat capacity of BAC 706.7 J/(kg.K) (Tefera et al., 2013)
𝐷𝑏 tube inner diameter 0.01575 m measured
𝑑𝑝 average BAC particle diameter
7.5 * 10-4 m (Lashaki et al., 2012a)
𝐷𝑎𝑥,𝑖 axial dispersion coefficient m2/s eq. (3.29)
𝐷𝐴𝐵,𝑖 molecular diffusivity m2/s eq. (3.30)
𝐷𝑒𝑓𝑓,𝑖 effective diffusion coefficient
m2/s eq. (3.38)
𝐷𝑖 symmetric mass dispersion tensor
m2/s eq. (3.27)
𝐷𝑝,𝑖 pore diffusion coefficient Table 4.4 m2/s eq. (3.40)
𝐷𝑟,𝑖 radial dispersion coefficient
m2/s eq. (3.28)
𝐷𝑠,𝑖 surface diffusion coefficient
Table 4.4 m2/s eq. (3.39)
𝐷𝑠𝑜 surface diffusion constant 1.1 * 10-8 m2/s (Suzuki, 1990)
𝐸𝑎 QHR multitemperature constant
Table 4.2 J/mol eq. (3.4)
𝑔 acceleration of gravity 9.81 m2/s
ℎ adsorber wall heat transfer coefficient
(2.4 𝑑𝑝⁄ )𝑘𝑝
+ 0.054(𝑘𝑓 𝑑𝑝⁄ ) (1
− (𝑑𝑝 𝐷𝑏⁄ )) 𝑅𝑒𝑝𝑃𝑟1/3
W/(m2.K) (Bey and Eigenberger, 2001)
∆𝐻𝑣𝑎𝑝,𝑖 adsorbate heat of vaporization
Table 4.3 kJ/mol eq. (3.47)
∆𝐻𝑎𝑑,𝑖 heat of adsorption kJ/mol eq. (3.47)
∆𝐻𝑠𝑜𝑙,𝑖 heat of dissolution
17.42 (acetone-water system)
kJ/mol (Kister and Waldman, 1958)
210.35 (2-propanol-water system)
kJ/mol (Lama and Lu, 1965; (Fujisawa et al., 2002))
𝐼𝑃𝑖 ionization potential Table 4.3 eV eq. (3.47); (Haynes, 2017)
𝐽 shear stress N/m2 eq. (3.42)
𝐾 MDR fitting parameter mol2/J2 eq. (3.1)
𝑘𝑎𝑥 axial thermal conductivity W/(m.K) eq. (3.52)
𝑘𝑏 stagnant bed thermal conductivity
W/(m.K) eq. (3.53)
𝑘𝑒𝑓𝑓 effective thermal conductivity tensor
W/(m.K) eq. (3.50)
𝑘𝑒𝑥,𝑖 external mass transfer coefficient
Table 4.4 m/s eq. (3.36)

78
symbol description value/formula units reference(s)
𝑘𝑓 air thermal conductivity W/(m.K) COMSOL material database
𝑘𝑖𝑛,𝑖 internal mass transfer coefficient
1/s eq. (3.37)
𝑘𝑜𝑣,𝑖 overall mass transfer coefficient
1/s eq. (3.35)
𝑘𝑝 BAC particle thermal conductivity
0.17 W/(m.K) (Kuwagaki et al., 2003)
𝑘𝑟 radial thermal conductivity
W/(m.K) eq. (3.51)
𝑘𝑄𝐻𝑅 QHR fitting parameter 1 eq. (3.4)
𝐿 tube bed length 0.115 m measured
𝑀𝐴,𝑖 molecular weight of adsorbate
Table 4.3 g/mol (Haynes, 2017); eq. (3.30)
𝑀𝐵 molecular weight of air 29 g/mol (Haynes, 2017)
𝑚𝐵𝐴𝐶 mass of BAC in tube 13.3 g measured
𝑃𝑒𝑜 molecular Peclet number for heat transfer
(𝑢𝑠𝜌𝑓𝐶𝑝,𝑓𝑑𝑝) 𝑘𝑓⁄ 1 (Kwapinski, 2009)
𝑃𝑟 Prandtl number (𝜇𝑓𝐶𝑝,𝑓) 𝑘𝑓⁄ 1 (Bey and Eigenberger, 2001)
𝑃𝑣𝑜
VOC vapor pressure in a pure component system
kPa eq. (3.1)
𝑃𝑣𝑆 saturated VOC vapor pressure
Table 4.3 kPa (Haynes, 2017); eq. (3.1)
𝑃𝑣′
VOC vapor pressure in a mixture
kPa eq. (3.5)
𝑃𝑤𝑜
water vapor pressure in a pure component system
kPa eq. (3.2)
𝑃𝑤𝑆 saturated water vapor pressure
Table 4.3 kPa (Haynes, 2017)
𝑃𝑤′
water vapor pressure in a mixture
kPa eq. (3.6)
𝑃50 QHR fitting parameter kPa eq. (3.2)
𝑞𝑚𝑣 equilibrium adsorption capacity for water-miscible VOC in a mixture
kg/kg eq. (3.24)
𝑄 gas flow rate 10 SLPM measured
𝑞𝑤 equilibrium adsorption capacity for water vapor in a mixture
kg/kg eq. (3.7) & (3.18)
𝑞𝑣 equilibrium adsorption capacity for VOC in a mixture
kg/kg eq. (3.8) & (3.17)
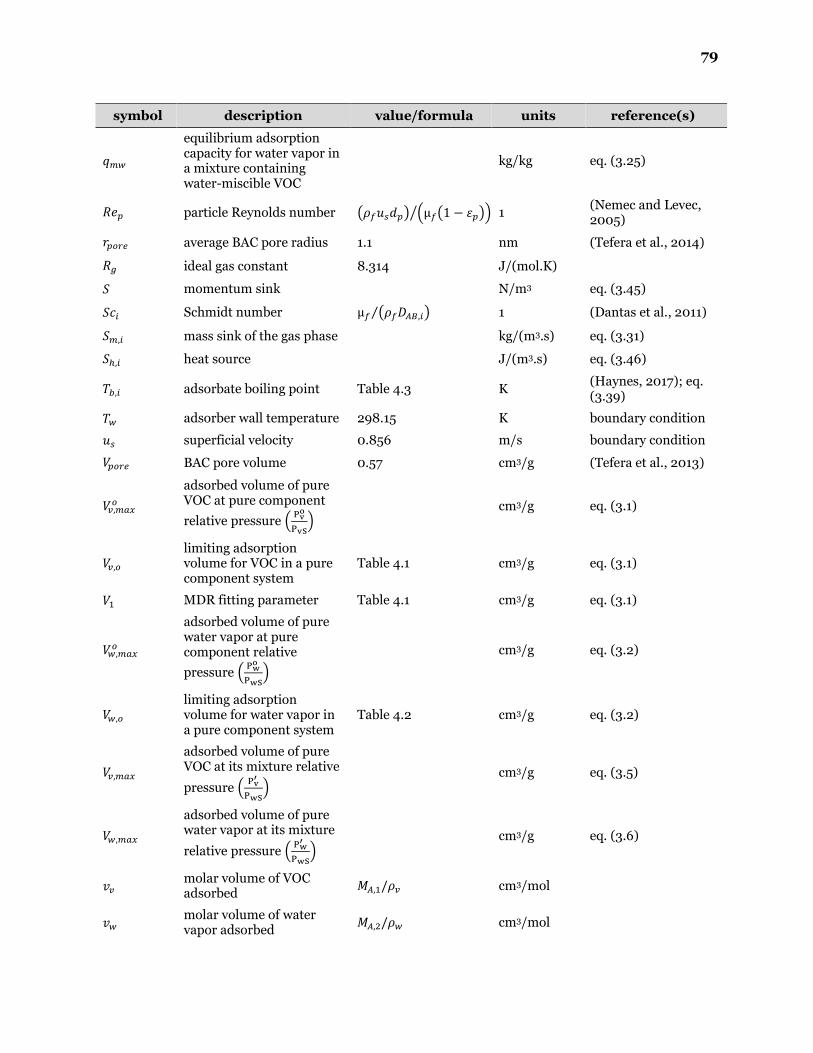
79
symbol description value/formula units reference(s)
𝑞𝑚𝑤
equilibrium adsorption capacity for water vapor in a mixture containing water-miscible VOC
kg/kg eq. (3.25)
𝑅𝑒𝑝 particle Reynolds number (𝜌𝑓𝑢𝑠𝑑𝑝) (µ𝑓(1 − 휀𝑝))⁄ 1 (Nemec and Levec, 2005)
𝑟𝑝𝑜𝑟𝑒 average BAC pore radius 1.1 nm (Tefera et al., 2014)
𝑅𝑔 ideal gas constant 8.314 J/(mol.K)
𝑆 momentum sink N/m3 eq. (3.45)
𝑆𝑐𝑖 Schmidt number µ𝑓 (𝜌𝑓𝐷𝐴𝐵,𝑖)⁄ 1 (Dantas et al., 2011)
𝑆𝑚,𝑖 mass sink of the gas phase kg/(m3.s) eq. (3.31)
𝑆ℎ,𝑖 heat source J/(m3.s) eq. (3.46)
𝑇𝑏,𝑖 adsorbate boiling point Table 4.3 K (Haynes, 2017); eq. (3.39)
𝑇𝑤 adsorber wall temperature 298.15 K boundary condition
𝑢𝑠 superficial velocity 0.856 m/s boundary condition
𝑉𝑝𝑜𝑟𝑒 BAC pore volume 0.57 cm3/g (Tefera et al., 2013)
𝑉𝑣,𝑚𝑎𝑥𝑜
adsorbed volume of pure VOC at pure component
relative pressure (Pv
o
PvS)
cm3/g eq. (3.1)
𝑉𝑣,𝑜 limiting adsorption volume for VOC in a pure component system
Table 4.1 cm3/g eq. (3.1)
𝑉1 MDR fitting parameter Table 4.1 cm3/g eq. (3.1)
𝑉𝑤,𝑚𝑎𝑥𝑜
adsorbed volume of pure water vapor at pure component relative
pressure (Pw
o
PwS)
cm3/g eq. (3.2)
𝑉𝑤,𝑜 limiting adsorption volume for water vapor in a pure component system
Table 4.2 cm3/g eq. (3.2)
𝑉𝑣,𝑚𝑎𝑥
adsorbed volume of pure VOC at its mixture relative
pressure (Pv
′
PwS)
cm3/g eq. (3.5)
𝑉𝑤,𝑚𝑎𝑥
adsorbed volume of pure water vapor at its mixture
relative pressure (Pw
′
PwS)
cm3/g eq. (3.6)
𝑣𝑣 molar volume of VOC adsorbed
𝑀𝐴,1/𝜌𝑣 cm3/mol
𝑣𝑤 molar volume of water vapor adsorbed
𝑀𝐴,2/𝜌𝑤 cm3/mol

80
symbol description value/formula units reference(s)
𝑤𝑚𝑖𝑐 average micropore width of BAC
1.02 nm (Tefera et al., 2013)
𝑥𝑣 mole fraction of VOC in adsorbed phase
1 eq. (3.19)
𝑥𝑤 mole fraction of water vapor in adsorbed phase
1 eq. (3.20)
𝑦𝑣 mole fraction of VOC in gas phase
1 eq. (3.19)
𝑦𝑤 mole fraction of water vapor in gas phase
1 eq. (3.20)
𝛼𝑖 polarizability Table 4.3 cm3 x 10-24 (Haynes, 2017); eq. (3.47)
𝛼 MDR fitting parameter Table 4.1 1 eq. (3.1)
𝛼0 empirical correction factor for mass diffusion terms
20 1 (Dantas et al., 2011)
𝛽 affinity coefficient 1 eq. (3.1)
𝛽𝑓 Forchheimer’s drag coefficient
ρf(CF √κ⁄ ) kg/m4 (Nield and Bejan, 2006)
𝛾𝑣 activity coefficient of VOC in adsorbed phase
1 eq. (3.19)
𝛾𝑤 activity coefficient of water vapor in adsorbed phase
1 eq. (3.20)
휀𝑏 bulk bed porosity 0.379
+ (0.078 ((𝐷𝑏 𝑑𝑝⁄ ) − 1.8)⁄ ) 1 (Nield and Bejan, 2006)
휀𝑝 particle porosity 𝑉𝑝𝑜𝑟𝑒𝜌𝑝 1 (Tefera et al., 2013)
휀𝑟 bed porosity as a function of radial distance from the center
휀𝑏 (1 + ((1 − 휀𝑏) 휀𝑏⁄ )
∗ 𝑒𝑥𝑝((−6 ∗ (𝑅 − 𝑟)) 𝑑𝑝⁄ )) 1
(Nield and Bejan, 2006)
휀𝑣′
adsorption potential of VOC in a mixture
J/mol eq. (3.12)
휀𝑣𝑜
adsorption potential of VOC in a pure component system
J/mol eq. (3.12)
휀𝑤𝑜
adsorption potential of water vapor in a pure component system
J/mol eq. (3.12)
𝜅 bed permeability (εr3dp
2) (150(1 − εr)2)⁄ m2
(Nield and Bejan, 2006)
µ𝑓 air viscosity temperature dependent
Pa.s COMSOL material database
𝜌𝑏 bulk bed density 595 kg/m3 measured
𝜌𝑤 density of adsorbed water vapor
0.92 g/ cm3 (Alcaniz-Monge et al., 2002)
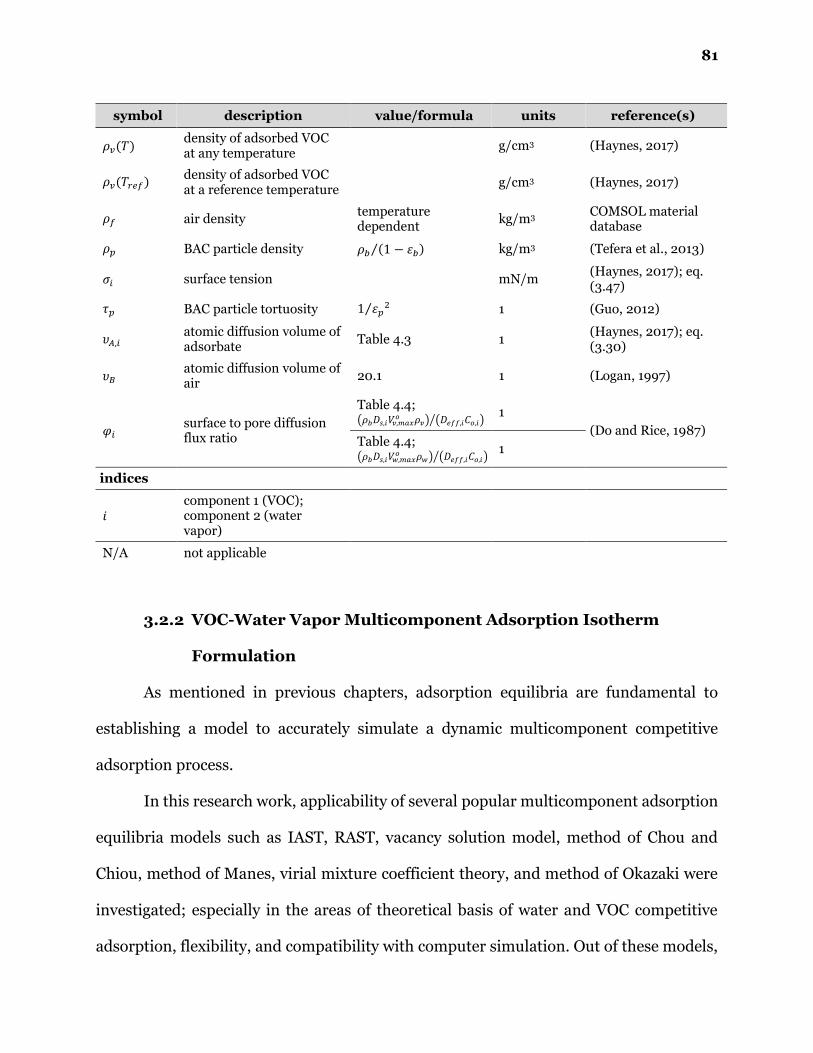
81
symbol description value/formula units reference(s)
𝜌𝑣(𝑇) density of adsorbed VOC at any temperature
g/cm3 (Haynes, 2017)
𝜌𝑣(𝑇𝑟𝑒𝑓) density of adsorbed VOC at a reference temperature
g/cm3 (Haynes, 2017)
𝜌𝑓 air density temperature dependent
kg/m3 COMSOL material database
𝜌𝑝 BAC particle density 𝜌𝑏 (1 − 휀𝑏)⁄ kg/m3 (Tefera et al., 2013)
𝜎𝑖 surface tension mN/m (Haynes, 2017); eq. (3.47)
𝜏𝑝 BAC particle tortuosity 1 휀𝑝2⁄ 1 (Guo, 2012)
𝜐𝐴,𝑖 atomic diffusion volume of adsorbate
Table 4.3 1 (Haynes, 2017); eq. (3.30)
𝜐𝐵 atomic diffusion volume of air
20.1 1 (Logan, 1997)
𝜑𝑖 surface to pore diffusion flux ratio
Table 4.4; (𝜌𝑏𝐷𝑠,𝑖𝑉𝑣,𝑚𝑎𝑥
𝑜 𝜌𝑣) (𝐷𝑒𝑓𝑓,𝑖𝐶𝑜,𝑖)⁄ 1
(Do and Rice, 1987) Table 4.4; (𝜌𝑏𝐷𝑠,𝑖𝑉𝑤,𝑚𝑎𝑥
𝑜 𝜌𝑤) (𝐷𝑒𝑓𝑓,𝑖𝐶𝑜,𝑖)⁄ 1
indices
𝑖 component 1 (VOC); component 2 (water vapor)
N/A not applicable
3.2.2 VOC-Water Vapor Multicomponent Adsorption Isotherm
Formulation
As mentioned in previous chapters, adsorption equilibria are fundamental to
establishing a model to accurately simulate a dynamic multicomponent competitive
adsorption process.
In this research work, applicability of several popular multicomponent adsorption
equilibria models such as IAST, RAST, vacancy solution model, method of Chou and
Chiou, method of Manes, virial mixture coefficient theory, and method of Okazaki were
investigated; especially in the areas of theoretical basis of water and VOC competitive
adsorption, flexibility, and compatibility with computer simulation. Out of these models,
82
the Manes method was selected to represent the competitive adsorption equilibria
between water vapor and a VOC on activated carbon. The method was previously verified
experimentally by a few studies for selected water-immiscible VOC-water systems on AC
(Manes, 1984; Cal et al., 1996; Qi et al., 2000b). The main reasons for this selection
include:
• Manes method is thermodynamically-consistent as it is based on Polanyi’s
adsorption potential theory (Manes, 1984).
• The main input requirements are pure single-component adsorption isotherm
models of the VOC and water vapor (Manes, 1984), making it highly flexible and
compatible with computer simulation compared to other multicomponent
adsorption isotherm models.
• Unlike other models the Manes method has no requirements for vapor-liquid
equilibrium data, and complex models for adsorbed-phase activity coefficients,
which are dependent on experimental data (Myers and Prausnitz, 1965;
Suwanayuen and Danner, 1980; Manes, 1984).
• The method explicitly considers the difference in fundamental adsorption
mechanism of water vapor and VOC during competitive adsorption; which is the
main shortcoming of several popular models such as IAST, RAST, and VSM (Myers
and Prausnitz, 1965; Suwanayuen and Danner, 1980; Manes, 1984).
Further details on all the aforementioned multicomponent adsorption isotherm
models including Manes method are given in Chapter 2. Definitions of model parameters
and variables are presented in Table 3-1.

83
3.2.2.1 Input Parameters for Manes Method
3.2.2.1.1 Pure Single-Component VOC Adsorption Isotherm
A modified Dubinin-Radushkevich (MDR) isotherm was chosen to fit the VOC
experimental isotherms and predict the adsorption equilibrium of the pure VOC on BAC
at different VOC concentrations. The MDR isotherm easily aligns with the Manes method
as it also based on potential theory (Manes, 1984; Kapoor, et al., 1989). It is a modified
version of Dubinin-Radushkevich (DR) equation, and has a valid Henry’s law term at low
loadings (Kapoor et al., 1989). Therefore, it is thermodynamically consistent throughout
the entire relative pressure range. The MDR model has been very successful in predicting
equilibrium adsorption capacities for VOCs in microporous adsorbents such as AC
(Kapoor et al., 1989; Hung and Lin, 2007). Its equation is given as (Kapoor et al., 1989):
𝑉𝑣,𝑚𝑎𝑥𝑜 = [1 − 𝑒𝑥𝑝 (−𝛼
𝑃𝑣𝑜
𝑃𝑣𝑆)] 𝑉𝑣,𝑜𝑒𝑥𝑝 [−
𝐾
𝛽2 (𝑅𝑔𝑇)2
(𝑙𝑛𝑃𝑣𝑆
𝑃𝑣𝑜 )
2
] + 𝑒𝑥𝑝 (−𝛼𝑃𝑣
𝑜
𝑃𝑣𝑆) 𝑉1
𝑃𝑣𝑜
𝑃𝑣𝑆 (3.1)
Once the above equation is fitted at a given adsorption temperature, the same
equation can be used for multiple adsorption temperatures by applying a minor
modification to 𝑉𝑣,𝑜, given as 𝑉𝑣,𝑜 [𝜌𝑣(𝑇)
𝜌𝑣(𝑇𝑟𝑒𝑓)] (Do, 1998).
More information on MDR and other single-component adsorption isotherm
models for VOCs can be found in Chapter 2.
3.2.2.1.2 Pure Single-Component Water Vapor Adsorption Isotherm
Adsorption equilibrium of pure water vapor onto BAC was modeled using the Qi-
Hay-Rood (QHR) isotherm. It considers the unique behaviour of water vapor adsorption
on BAC; mainly adsorption through surface functional groups at low loadings, and cluster
formation mechanism at medium to high loadings (Qi et al., 1998). These processes are
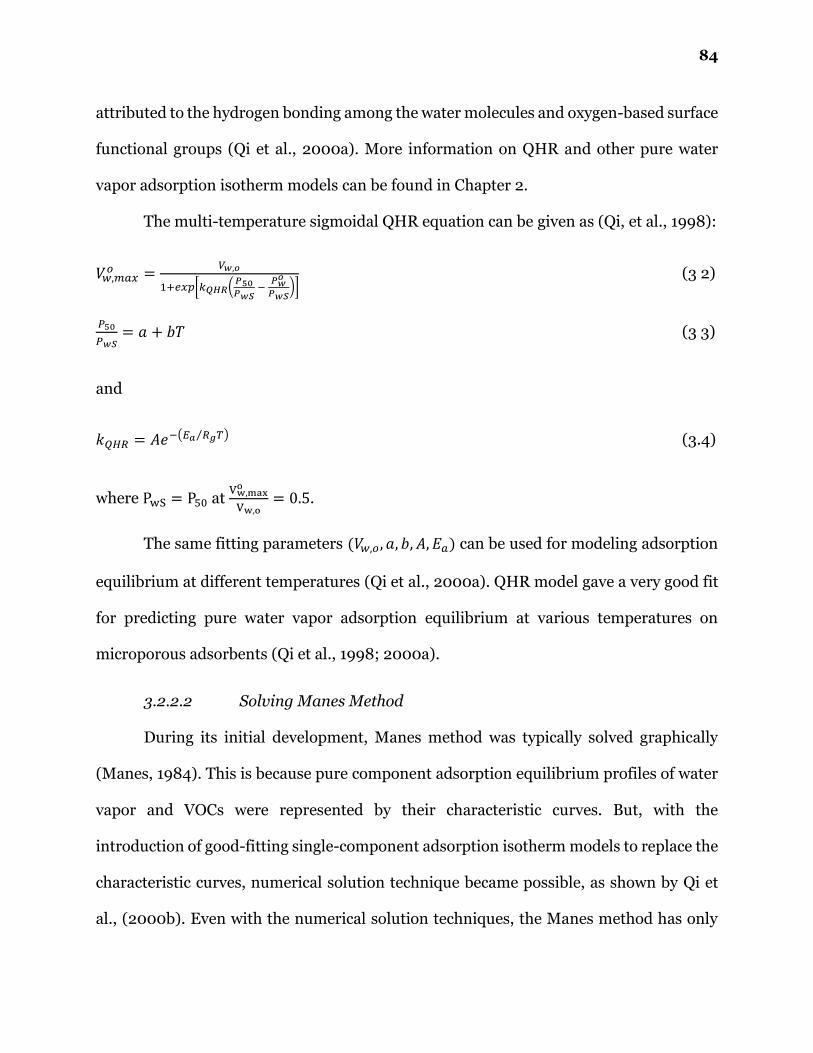
84
attributed to the hydrogen bonding among the water molecules and oxygen-based surface
functional groups (Qi et al., 2000a). More information on QHR and other pure water
vapor adsorption isotherm models can be found in Chapter 2.
The multi-temperature sigmoidal QHR equation can be given as (Qi, et al., 1998):
𝑉𝑤,𝑚𝑎𝑥𝑜 =
𝑉𝑤,𝑜
1+𝑒𝑥𝑝[𝑘𝑄𝐻𝑅(𝑃50𝑃𝑤𝑆
− 𝑃𝑤
𝑜
𝑃𝑤𝑆)]
(3 2)
𝑃50
𝑃𝑤𝑆= 𝑎 + 𝑏𝑇 (3 3)
and
𝑘𝑄𝐻𝑅 = 𝐴𝑒−(𝐸𝑎 𝑅𝑔𝑇⁄ ) (3.4)
where PwS = P50 at Vw,max
o
Vw,o= 0.5.
The same fitting parameters (𝑉𝑤,𝑜 , 𝑎, 𝑏, 𝐴, 𝐸𝑎) can be used for modeling adsorption
equilibrium at different temperatures (Qi et al., 2000a). QHR model gave a very good fit
for predicting pure water vapor adsorption equilibrium at various temperatures on
microporous adsorbents (Qi et al., 1998; 2000a).
3.2.2.2 Solving Manes Method
During its initial development, Manes method was typically solved graphically
(Manes, 1984). This is because pure component adsorption equilibrium profiles of water
vapor and VOCs were represented by their characteristic curves. But, with the
introduction of good-fitting single-component adsorption isotherm models to replace the
characteristic curves, numerical solution technique became possible, as shown by Qi et
al., (2000b). Even with the numerical solution techniques, the Manes method has only
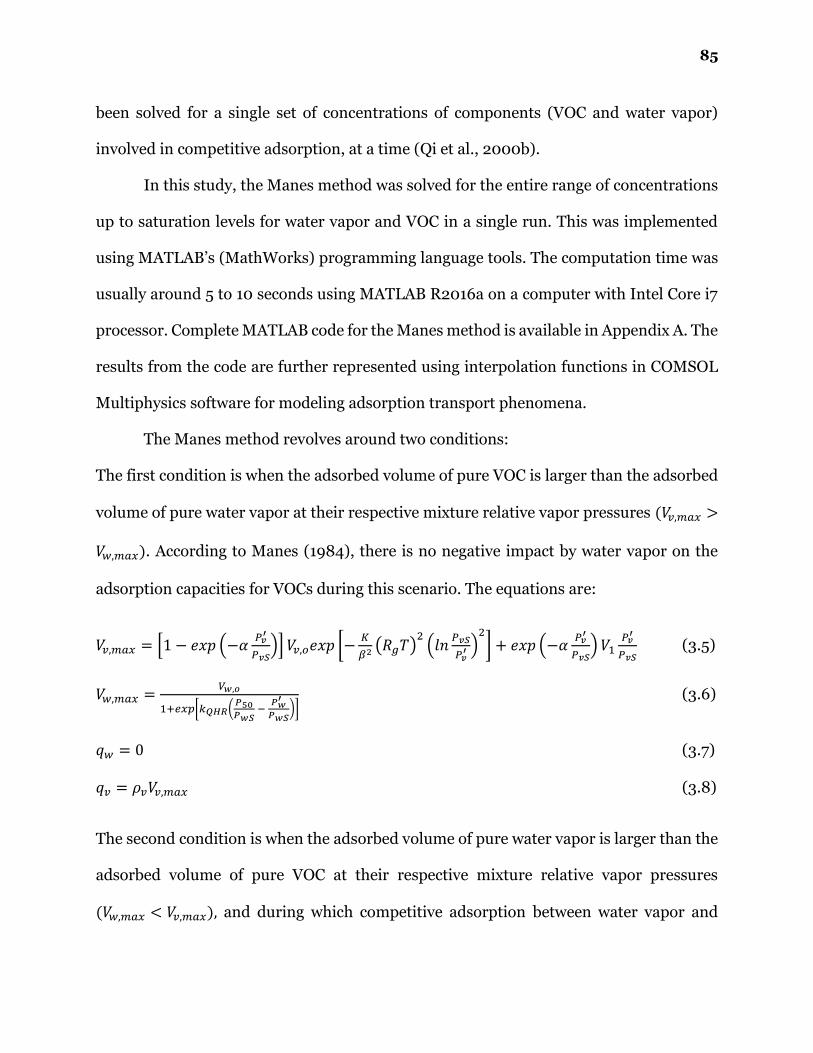
85
been solved for a single set of concentrations of components (VOC and water vapor)
involved in competitive adsorption, at a time (Qi et al., 2000b).
In this study, the Manes method was solved for the entire range of concentrations
up to saturation levels for water vapor and VOC in a single run. This was implemented
using MATLAB’s (MathWorks) programming language tools. The computation time was
usually around 5 to 10 seconds using MATLAB R2016a on a computer with Intel Core i7
processor. Complete MATLAB code for the Manes method is available in Appendix A. The
results from the code are further represented using interpolation functions in COMSOL
Multiphysics software for modeling adsorption transport phenomena.
The Manes method revolves around two conditions:
The first condition is when the adsorbed volume of pure VOC is larger than the adsorbed
volume of pure water vapor at their respective mixture relative vapor pressures (𝑉𝑣,𝑚𝑎𝑥 >
𝑉𝑤,𝑚𝑎𝑥). According to Manes (1984), there is no negative impact by water vapor on the
adsorption capacities for VOCs during this scenario. The equations are:
𝑉𝑣,𝑚𝑎𝑥 = [1 − 𝑒𝑥𝑝 (−𝛼𝑃𝑣
′
𝑃𝑣𝑆)] 𝑉𝑣,𝑜𝑒𝑥𝑝 [−
𝐾
𝛽2 (𝑅𝑔𝑇)2
(𝑙𝑛𝑃𝑣𝑆
𝑃𝑣′ )
2
] + 𝑒𝑥𝑝 (−𝛼𝑃𝑣
′
𝑃𝑣𝑆) 𝑉1
𝑃𝑣′
𝑃𝑣𝑆 (3.5)
𝑉𝑤,𝑚𝑎𝑥 =𝑉𝑤,𝑜
1+𝑒𝑥𝑝[𝑘𝑄𝐻𝑅(𝑃50𝑃𝑤𝑆
− 𝑃𝑤
′
𝑃𝑤𝑆)]
(3.6)
𝑞𝑤 = 0 (3.7)
𝑞𝑣 = 𝜌𝑣𝑉𝑣,𝑚𝑎𝑥 (3.8)
The second condition is when the adsorbed volume of pure water vapor is larger than the
adsorbed volume of pure VOC at their respective mixture relative vapor pressures
(𝑉𝑤,𝑚𝑎𝑥 < 𝑉𝑣,𝑚𝑎𝑥), and during which competitive adsorption between water vapor and

86
VOC occurs (Manes, 1984). Adsorption of VOC during this scenario results in displacing
an equal volume of pure condensed water (equation (3.9)). 𝑉𝑣,𝑚𝑎𝑥 and 𝑉𝑤,𝑚𝑎𝑥 are
calculated using equations (3.5) and (3.6). When 𝑉𝑣,𝑚𝑎𝑥 < 𝑉𝑤,𝑚𝑎𝑥, VOC adsorption
capacity decreases due to its lower adsorption potential compared to water vapor’s.
𝑉𝑣,𝑚𝑎𝑥𝑜 = 𝑉𝑤,𝑚𝑎𝑥
𝑜 (3.9)
Using equation (3.9) with (3.2) gives:
𝑉𝑣,𝑚𝑎𝑥𝑜 =
𝑉𝑤,𝑜
1+𝑒𝑥𝑝[𝑘𝑄𝐻𝑅(𝑃50𝑃𝑤𝑆
− 𝑃𝑤
𝑜
𝑃𝑤𝑆)]
(3.10)
Arranging equation (3.10):
𝑃𝑤𝑜
𝑃𝑤𝑆=
𝑃50
𝑃𝑤𝑆−
1
𝑘𝑄𝐻𝑅𝑙𝑛 [
𝑉𝑤,𝑜
(𝑉𝑣,𝑚𝑎𝑥𝑜 )
− 1] (3.11)
The other important equations involved in this condition are (Manes, 1984):
𝑣′
𝑣𝑣= 𝑣
𝑜
𝑣𝑣− 𝑤
𝑜
𝑣𝑤−
𝑅𝑔𝑇
𝑣𝑤𝑙𝑛
𝑃𝑤′
𝑃𝑤𝑆 (3.12)
휀𝑣′ = 휀𝑣
𝑜 − 휀𝑤𝑜 (
𝑣𝑣
𝑣𝑤) (3.13)
휀𝑣′ = 𝑅𝑔𝑇 𝑙𝑛
𝑃𝑣𝑆
𝑃𝑣′ (3.14)
휀𝑣𝑜 = 𝑅𝑔𝑇 𝑙𝑛
𝑃𝑣𝑆
𝑃𝑣𝑜 (3.15)
휀𝑤𝑜 = 𝑅𝑔𝑇 𝑙𝑛
𝑃𝑤𝑆
𝑃𝑤𝑜 (3.16)
𝑞𝑣 = 𝜌𝑣𝑉𝑣,𝑚𝑎𝑥𝑜 (3.17)
𝑞𝑤 = 𝜌𝑤(𝑉𝑤,𝑚𝑎𝑥 − 𝑉𝑣,𝑚𝑎𝑥𝑜 ) (3.18)
87
Equation (3.12) is the adsorption-potential-theory-based relation derived by Manes
(1984), which shows that the net adsorption potential of VOC in a mixture is equal to its
adsorption potential in pure state, reduced by the adsorption potential of an equal volume
of pure water vapor, and corrected for water vapor pressure less than saturation. Equation
(3.12) reduces to equation (3.13) when RH is 100%. The solution of this model requires
an iterative procedure in such a way that the guesses satisfy equation (3.12) (Figure 3-3).
The criterion considered here was up to eight decimal places; to minimize errors, and that
no significant change in results occurs with further increase in decimal places.

88
Figure 3-3. Flowchart describing the procedure to numerically solve Manes-method and its extension for water-miscible VOCs.
89
Manes method is exclusively for water-immiscible VOCs due to its direct
dependency on potential theory (Manes, 1984). However, in this research work it has also
been applied for water-miscible VOCs by introducing a Raoult’s-law-like relation:
𝑃𝑦𝑣 = 𝛾𝑣𝑥𝑣𝑃𝑣𝑆 (3.19)
𝑃𝑦𝑤 = 𝛾𝑤𝑥𝑤𝑃𝑤𝑆 (3.20)
𝑥𝑣 + 𝑥𝑤 = 1 (3.21)
Similar relation was also used by Okazaki et al. (1978) for their multicomponent
adsorption model. Here, the purpose of the relation is to calculate the composition of
Manes-method-calculated water adsorbed phase during competitive adsorption;
considering complete dissolution of the VOC into that phase. The composition is then
used to predict the effect of RH on VOC adsorption capacity. Manes-method-calculated
VOC adsorbed phase was not considered here because it is extremely underestimated for
water-miscible VOCs and therefore, can be neglected. The activity coefficients of the
components in the mixture in equations (3.19) and (3.20) are assumed to be ideal and
therefore, are equal to unity. The equations then reduce to:
𝑃𝑦𝑣 = 𝑥𝑣𝑃𝑣𝑆 (3.22)
𝑃𝑦𝑤 = 𝑥𝑤𝑃𝑤𝑆 (3.23)
Adsorption capacities for water-miscible VOC and water vapor during competitive
adsorption can be calculated by:
𝑞𝑚𝑣 = 𝜌𝑣𝑉𝑣,𝑚𝑎𝑥𝑜 + 𝑥𝑣𝑞𝑤 (3.24)
𝑞𝑚𝑤 = 𝑥𝑤𝑞𝑤 (3.25)
90
Equations (3.24) and (3.25) are only applicable when 𝑉𝑣,𝑚𝑎𝑥 < 𝑉𝑤,𝑚𝑎𝑥.
3.2.3 Transport Phenomena Formulation
An accurate prediction of multicomponent adsorption isotherm serves as a good
basis to describe the dynamics of a fixed-bed adsorber with competitive adsorption
between water vapor and VOC (Yang, 1987). The adsorption transfer kinetics considered
here is discussed below.
3.2.3.1 Governing Transport Phenomena
The transport phenomena model used here is an extension of the model developed
by Tefera et al. (2013, 2014) for single and multicomponent VOC adsorption. The transfer
kinetics to be simulated are: adsorbate mass balance in the gas phase and adsorbed phase
as well as the heat and momentum balance across the fixed bed adsorber. These transport
phenomena are described by partial differential equations (PDEs), ordinary differential
equations, and algebraic equations; as given in the following subsections.
3.2.3.1.1 Gas-Phase Mass Balance
Adsorbate mass transfer in the gas phase of a fixed-bed adsorber is governed by
dispersion and convection. The equation describing this behaviour is given as (Yang,
1987):
−𝛻(𝐷𝑖 ∗ 𝛻𝐶𝑖) + (𝑢 ∗ 𝛻𝐶𝑖) +𝜕𝐶𝑖
𝜕𝑡+ (
1− 𝑝
𝑝) ∗ 𝑆𝑚,𝑖 = 0 (3.26)
where 𝐷𝑖 is the symmetric mass dispersion tensor:
𝐷𝑖 = |𝐷𝑟,𝑖 0
0 𝐷𝑎𝑥,𝑖| (3.27)

91
The radial (𝐷𝑟,𝑖) and axial (𝐷𝑎𝑥,𝑖) dispersion coefficients are described in equations
(3.28) and (3.29) respectively (Dantas et al., 2011; Cohen and Metzner, 1981).
𝐷𝑟,𝑖 = (𝛼0 +𝑆𝑐𝑖𝑅𝑒𝑝
8)
𝐷𝐴𝐵,𝑖
𝑏 (3.28)
𝐷𝑎𝑥,𝑖 = (𝛼0 +𝑆𝑐𝑖𝑅𝑒𝑝
2)
𝐷𝐴𝐵,𝑖
𝑏 (3.29)
where 𝐷𝐴𝐵,𝑖 is the molecular diffusivity of the ith component described as (Logan, 1997):
𝐷𝐴𝐵,𝑖 =
0.0101325∗(10−3𝑇1.75√𝑀𝐴,𝑖+𝑀𝐵
𝑀𝐴,𝑖𝑀𝐵)
𝑃((∑ 𝜐)𝐴,𝑖0.33
−(∑ 𝜐)𝐵0.33
)2 (3.30)
The mass sink (𝑆𝑚,𝑖) of the gas phase is represented by the linear driving force
(LDF) model given as (Sircar and Hufton, 2000):
𝑆𝑚,𝑖 = 𝑘𝑜𝑣,𝑖(𝐶𝑠𝑒,𝑖 − 𝐶𝑠,𝑖) (3.31)
The LDF has similar accuracy when compared to other complex diffusion models in
modeling mass transfer kinetics in an adsorbent particle. The complex diffusion models
rely on individual particle mass transfer and therefore are time-consuming and
computationally costlier, unlike the LDF model (Sircar and Hufton, 2000).
𝐶𝑠𝑒,𝑖, the equilibrium adsorbed-phase concentration, is obtained from the
multicomponent competitive adsorption isotherm (equations (3.32) and (3.33)).
𝐶𝑠𝑒,1 = 𝜌𝑏(𝑞𝑣 𝑜𝑟 𝑞𝑚𝑣) (3.32)
𝐶𝑠𝑒,2 = 𝜌𝑏(𝑞𝑤 𝑜𝑟 𝑞𝑚𝑤) (3.33)

92
Here, the LDF-based gas-phase mass sink acts as the source for the adsorbed phase
(Sircar and Hufton, 2000).
3.2.3.1.2 Adsorbed-Phase Mass Balance
The diffusive adsorbate transport in the adsorbed phase is characterized using the
LDF model as mentioned above, and is given as (Yang, 1987; Sircar and Hufton, 2000):
𝜕𝐶𝑠,𝑖
𝜕𝑡= 𝑘𝑜𝑣,𝑖(𝐶𝑠𝑒,𝑖 − 𝐶𝑠,𝑖) = 𝑆𝑚,𝑖 (3.34)
The LDF overall mass transfer coefficient (𝑘𝑜𝑣,𝑖) here considers both the internal (1/𝑘𝑖𝑛,𝑖)
and external (1/𝑘𝑒𝑥,𝑖) mass transfer resistances described as (Dantas, et al., 2011; Jarvie,
et al., 2005):
1
𝑘𝑜𝑣,𝑖=
𝑑𝑝
𝑘𝑒𝑥,𝑖+
1
𝑘𝑖𝑛,𝑖 (3.35)
where
𝑘𝑒𝑥,𝑖 =[1+1.5(1− 𝑏)]𝐷𝐴𝐵,𝑖
𝑑𝑝(2 + 0.644𝑅𝑒𝑝
1/2𝑆𝑐𝑖
1/3) (3.36)
𝑘𝑖𝑛,𝑖 =60 𝑝𝐶𝑜,𝑖𝐷𝑒𝑓𝑓,𝑖
𝜏𝑝𝐶𝑠𝑜,𝑖𝑑𝑝2 (3.37)
The internal mass transfer coefficient here is controlled by macropore molecular diffusion
system (Dantas, et al., 2011). Applicability of the external mass transfer resistance
depends on the pore Biot number (𝐵𝑝,𝑖). If 𝐵𝑝,𝑖 is larger than unity, then the effect of
external mass transfer resistance is negligible and the overall mass transfer is governed
by internal or intraparticle diffusion (Shaverdi, 2012).

93
The effective diffusion coefficient (𝐷𝑒𝑓𝑓,𝑖 ) comprises surface (𝐷𝑠,𝑖 ) and pore (𝐷𝑝,𝑖 )
diffusion; and is written as (Suzuki, 1990; Hui et al., 2003; Chahbani and Tondeur,
2000):
𝐷𝑒𝑓𝑓,𝑖 = 𝐷𝑝,𝑖 +𝜕𝐶𝑠,𝑖
𝜕𝐶𝑖𝐷𝑠,𝑖 (3.38)
𝐷𝑠,𝑖 = 𝐷𝑠𝑜𝑒𝑥𝑝 (−5.38𝑇𝑏,𝑖
𝑇) (3.39)
𝐷𝑝,𝑖 = 𝐷𝐴𝐵,𝑖 (3.40)
Surface diffusion can be neglected from the effective diffusion resistance if the surface to
pore diffusion flux ratio (𝜑𝑖) is found to be less than unity; otherwise pore diffusion can
be neglected (Do and Rice, 1987). Here, pore diffusion consists of molecular diffusion.
3.2.3.1.3 Momentum Balance
The momentum balance equation considered here accounts for Darcy and
Brinkman viscous terms, Navier-Stokes’ convective term, and Forchheimer’s inertial term
(Nield and Bejan, 2006). This model has been previously applied with good success
(Tefera, et al., 2013, 2014), and is given by:
𝜌𝑓
𝑟((
𝜕𝑢
𝜕𝑡) + (𝑢 ∗ 𝛻)
𝑢
𝑟) = −𝛻𝑃 + 𝛻𝐽 − 𝑆 + 𝐹 (3.41)
The shear stress (𝐽) in terms of gas viscosity (𝜇𝑓) is written as:
𝐽 = (𝜇𝑓1
𝑟((𝛻𝑢 + (𝛻𝑢)′) − (
2
3∗ (𝛻𝑢))) (3.42)
94
Momentum dissipation of the gas flow across the fixed-bed adsorber is represented
by Darcy’s friction loss factor, Forchheimer’s inertial term, and a sink term due to the
adsorption of VOC and/or water vapor (equation (3.43)).
𝑆 = (𝜇𝑓
𝜅+ 𝛽𝑓|𝑢| +
1
𝑟(∑
𝜕𝐶𝑠,𝑖
𝜕𝑡
2𝑖=1 )) 𝑢 (3.43)
The continuity equation given below accounts for the compressibility of the gas
flow in the fixed-bed adsorber and the sink due to VOC and/or water vapor adsorption.
𝜕( 𝑟𝜌𝑓)
𝜕𝑡+ 𝛻 ∗ (𝜌𝑓𝑢) = ∑
𝜕𝐶𝑠,𝑖
𝜕𝑡
2𝑖=1 (3.44)
3.2.3.1.4 Energy Balance
The main assumptions for formulating energy balance equation across the fixed-
bed adsorber are: local thermal equilibrium between the solid adsorbent and the gas; and
negligible pressure work and viscous heat dissipation. The convection-diffusion-based
heat transfer equation was previously validated for single and multicomponent
adsorption systems (Tefera, et al., 2013, 2014).
𝐶𝑒𝑓𝑓𝜕𝑇
𝜕𝑡+ 𝐶𝑝,𝑓𝜌𝑓𝑢 ∗ 𝛻𝑇 − 𝛻(𝑘𝑒𝑓𝑓𝛻𝑇) = ∑ 𝑆ℎ,𝑖
2𝑖=1 (3.45)
The domain heat source is the heat of adsorption of the ith component (equation
(3.46)).
𝑆ℎ,𝑖 = (−∆𝐻𝑎𝑑,𝑖)𝑑𝐶𝑠,𝑖
𝑑𝑡 (3.46)
where the heat of adsorption (∆𝐻𝑎𝑑,𝑖) is dependent on the properties of the adsorbate and
the solid adsorbent (Giraudet, et al., 2006):
95
−∆𝐻𝑎𝑑,𝑖 = 103.2 + 1.16𝛼𝑖 + 0.76∆𝐻𝑣𝑎𝑝,𝑖 − 3.87(𝐼𝑃𝑖) − 0.7𝜎𝑖 − 26.1𝑤𝑚𝑖𝑐 (3.47)
In mixtures involving polar adsorbates and water vapor, heat of dissolution (∆𝐻𝑠𝑜𝑙,𝑖) was
also considered additionally (equation (3.48)).
𝑆ℎ,𝑖 = (−∆𝐻𝑎𝑑,𝑖 − ∆𝐻𝑠𝑜𝑙,𝑖)𝑑𝐶𝑠,𝑖
𝑑𝑡 (3.48)
The effective volumetric heat capacity (𝐶𝑒𝑓𝑓) of the solid-gas system is calculated from:
𝐶𝑒𝑓𝑓 = (1 − 휀𝑝)𝜌𝑝𝐶𝑝,𝑝 + 휀𝑝𝜌𝑓𝐶𝑝,𝑓 (3.49)
The effective thermal conductivity tensor (𝑘𝑒𝑓𝑓) is given as:
𝑘𝑒𝑓𝑓 = |𝑘𝑟 00 𝑘𝑎𝑥
| (3.50)
𝑘𝑟 and 𝑘𝑎𝑥 are the radial and axial effective thermal conductivities (Suzuki, 1990) of the
fixed-bed adsorber respectively (equations (3.51) and (3.52)).
𝑘𝑟 = 𝑘𝑏 +1
8𝑃𝑒𝑜𝑘𝑓 (3.51)
𝑘𝑎𝑥 = 𝑘𝑏 +1
2𝑃𝑒𝑜𝑘𝑓 (3.52)
where 𝑘𝑏 is the stagnant bed thermal conductivity, that is, the thermal conductivity of the
fixed-bed with stagnant gas (Suzuki, 1990).
𝑘𝑏 = (1 − 휀𝑝)𝑘𝑝 + 휀𝑝𝑘𝑓 (3.53)
3.2.3.2 Variable and Parameters Definition
Table 3-1 exclusively describes and defines the model parameters and variables.

96
3.2.3.3 Initial and Boundary Conditions
The initial and boundary conditions applied to the 2D mathematical model here
are described in Table 3-2 and graphically in Figure 3-2. For mass transfer, a constant
concentration boundary condition and a flux boundary condition are set at the inlet and
the outlet of the fixed-bed adsorption tube, respectively. For momentum balance; a
normal inflow velocity boundary condition at the inlet, an atmospheric pressure at the
outlet, and a no slip boundary condition was applied to the wall of the adsorption tube.
For heat transfer; a constant temperature boundary condition, a flux boundary condition,
and a convective heat flux were specified at the inlet, outlet, and wall of the fixed-bed
adsorber respectively.
Table 3-2. Initial and boundary conditions
physics inlet (𝒁 = 𝑳) outlet (𝒁 = 𝟎) adsorber wall
(𝒓 = 𝑹)
initial condition
(𝒕 = 𝟎)
mass
transfer
𝐶𝑖 = 𝐶𝑜,𝑖
𝐶𝑠,𝑖 = 𝐶𝑠𝑜,𝑖
boundary flux,
−𝑛 ∗ (𝐷𝑖𝛻𝐶𝑖) = 0,
−𝑛 ∗ (𝐷𝑖𝛻𝐶𝑠,𝑖) = 0
zero flux 𝐶𝑜,𝑖 = 0
𝐶𝑠𝑜,𝑖 = 0
momentum
transfer
normal velocity (𝑢𝑠 =
0.856 𝑚/𝑠) 𝑃 = 101.325 𝑘𝑃𝑎 no slip
𝑢 = 0 m/s
𝑃 = 101.325 𝑘𝑃𝑎
heat transfer 𝑇 = 298.15 𝐾 −𝑛 ∗ (𝑘𝑒𝑓𝑓𝛻𝑇) = 0 𝑞𝑜 = ℎ ∗ (𝑇𝑤 − 𝑇) 𝑇 = 298.15 𝐾
3.2.3.4 Solution Method
The mass, momentum, and heat transfer across the fixed-bed adsorber were
coupled, and simultaneously solved using COMSOL Multiphysics software (Version 4.3a).
This simulation was also coupled with interpolation-function-based MATLAB-coded
Manes method as mentioned earlier. In COMSOL Multiphysics, the governing equations
were solved numerically using the finite element method. The software’s coefficient form

97
PDE interfaces, built-in momentum and energy interfaces were used respectively to
represent the mass, momentum, and heat transfer equations. A second-order element
was used for concentration, pressure and temperature; and a third-order element for
velocity to improve model convergence and stability (Oliemans, 2000; Hutton, 2001;
Oberkampf and Trucano, 2002). Convergence of the model was validated by using
systematic mesh refinement to its geometry until grid-independent results were obtained.
The meshing of the 2D model’s geometry was finally optimized to 4,488 mesh elements,
which showed a relative deviation of only 0.7% from the solution obtained through fine
meshing (25,964 mesh elements).
3.3 Model Validation Method
To validate the model, adsorption capacities, breakthrough concentrations, and
bed temperatures were measured and compared with the model output. The deviations
between the modeled and experimental values were represented using two error metrics.
The nonzero data points from the experiment and model were compared through the
mean relative absolute error (MRAE) (Lashaki et al., 2012b).
𝑀𝑅𝐴𝐸 =1
𝑁∑ (
|𝑒𝑥𝑝𝑒𝑟𝑖𝑚𝑒𝑛𝑡𝑎𝑙 𝑣𝑎𝑙𝑢𝑒−𝑚𝑜𝑑𝑒𝑙𝑒𝑑 𝑣𝑎𝑙𝑢𝑒|
𝑒𝑥𝑝𝑒𝑟𝑖𝑚𝑒𝑛𝑡𝑎𝑙 𝑣𝑎𝑙𝑢𝑒∗ 100%)𝑁
1 (3.54)
where N is the number of data points.
The normalized root-mean-square error (NRMSE) was also used to evaluate the overall
error between the experimental and modeled values (Tefera, et al., 2013).
𝑁𝑅𝑀𝑆𝐸 =√
1
𝑁∑ (𝑒𝑥𝑝𝑒𝑟𝑖𝑚𝑒𝑛𝑡𝑎𝑙 𝑣𝑎𝑙𝑢𝑒−𝑚𝑜𝑑𝑒𝑙𝑒𝑑 𝑣𝑎𝑙𝑢𝑒)2𝑁
1
𝑖𝑛𝑓𝑙𝑢𝑒𝑛𝑡 𝑠𝑡𝑟𝑒𝑎𝑚 𝑣𝑎𝑙𝑢𝑒 ∗ 100% (3.55)

98
For measuring deviations in bed temperature results using MRAE and NRMSE, the
temperature data points were expressed in degree Celsius instead of Kelvin to avoid low
relative error bias.
To determine the single-component MDR isotherm model parameters of the
selected VOCs (toluene, 2-propanol, acetone, n-butanol), their corresponding
experimental isotherms were obtained from a previous study (Lashaki et al., 2012b) and
the isotherm model was fitted to the experimental values. For 1,2,4- trimethylbenzene,
the experimental adsorption isotherm was obtained by conducting a mass balance on a
fixed-bed adsorber with 1g of BAC that was subjected to concentrations ranging from 60
to 2600 ppmv of 1,2,4- trimethylbenzene in a 10-SLPM air stream at 25 oC. The MDR
isotherm model was then similarly fitted to the measured data. The adsorber setup
mentioned above is similar to the one described at the beginning of this chapter.
For pure water vapor, its adsorption isotherm was obtained gravimetrically using
a sorption analyzer (TA Instruments, model VTI-SA) at 25 oC and nitrogen as a carrier
gas. The system logged the equilibrium weight of the BAC sample (3 to 5 mg) in response
to a step change in the concentration of the water vapor in the carrier gas. The equilibrium
was assumed to be reached when the weight change is less than 0.001 % in 5 minutes. The
QHR model parameters were then determined and fitted to the measured data.
The fitting of the isotherm models was conducted through the least squares
method in MATLAB.
𝐿𝑆𝑀 = ∑ (𝑒𝑥𝑝𝑒𝑟𝑖𝑚𝑒𝑛𝑡𝑎𝑙 𝑣𝑎𝑙𝑢𝑒 − 𝑚𝑜𝑑𝑒𝑙𝑒𝑑 𝑣𝑎𝑙𝑢𝑒)2𝑁1 (3.56)
where equation (3.56) (Vahabi, et al., 2011) runs until it reaches an optimized minimum
with a relative change in residuals of about 4.09 * 10-8.

99
The root-mean-square error (RMSE) was also used to evaluate the overall
error of the isotherm models (Willmott and Matsuura, 2005).
𝑅𝑀𝑆𝐸 = √1
𝑁∑ (𝑒𝑥𝑝𝑒𝑟𝑖𝑚𝑒𝑛𝑡𝑎𝑙 𝑣𝑎𝑙𝑢𝑒 − 𝑚𝑜𝑑𝑒𝑙𝑒𝑑 𝑣𝑎𝑙𝑢𝑒)2𝑁
1 (3.57)

100
3.4 References
Alcaniz-Monge, J., Linares-Solano, A., & Rand, B. (2002). Mechanism of Adsorption of
Water in Carbon Micropores As Revealed by a Study of Activated Carbon Fibers.
J. Phys. Chem. B, 106, 3209-3216.
Bey, O., & Eigenberger, G. (2001). Gas flow and heat transfer through catalyst filled tubes.
Int. J. Therm. Sci., 40, 152-164.
Cal, M., Rood, M., & Larson, S. (1996). Removal of VOCs from humidified gas streams
using activated carbon cloth. Gas Sep. Purif., 10, 117-121.
Chahbani, M., & Tondeur, D. (2000). Mass transfer kinetics in pressure swing adsorption.
Sep. Purif. Technol., 20, 185-196.
Cohen, Y., & Metzner, A. B. (1981). Wall effects in laminar flow of fluids through packed
beds. AIChE J., 27, 705-715.
Dantas, T., Luna, F., Silva Jr., I., Torres, A., de Azevedo, D., Rodrigues, A., & Moreira, R.
(2011). Modeling of the fixed-bed adsorption of carbon dioxide and a carbon
dioxide-nitrogen mixture on zeolite 13X. Braz. J. Chem. Eng., 28, 533-544.
Do, D. (1998). Adsorption Analysis: Equilibria and Kinetics. London: Imperial College
Press.
Do, D., & Rice, R. (1987). On the relative importance of pore and surface diffusion in non-
equilibrium adsorption rate processes. Chem. Eng. Sci., 42, 2269-2284.
Fujisawa, M., Maeda, M., Takagi, S., & Kimura, T. (2002). Enthalpies of dilution of mono-
, di- and poly-alcohols in dilute aqueous solutions at 298.15 K. J. Therm. Anal.
Calorim., 69, 841-848.
Giraudet, S., Pre, P., Tezel, H., & Le Cloirec, P. (2006). Estimation of adsorption energies
using the physical characteristics of activated carbons and the molecular
properties of volatile organic compounds. Carbon, 44, 2413-2421.
Guo, P. (2012). Dependency of tortuosity and permeability of porous media on directional
distribution of pore voids. Transp. Porous Media, 95, 285-303.
Haynes, W. (2017). CRC Handbook of Chemistry and Physics (97th ed.). Boca Raton,
Florida: CRC Press/Taylor & Francis.
Hui, C., Chen, B., & McKay, G. (2003). Pore-surface diffusion model for batch adsorption
processes. Langmuir, 19, 4188-4196.

101
Hung, H., & Lin, T. (2007). Prediction of the Adsorption Capacity for Volatile Organic
Compounds onto Activated Carbons by the Dubinin–Radushkevich–Langmuir
Model. J. Air & Waste Manage. Assoc., 57, 497-506.
Hutton, A. G. (2001). Quality and trust in industrial computational fluid dynamics.
Houille Blanche, 3-4, 25-28.
Jarvie, M. E., Hand, D. W., Bhuvendralingam, S., Crittenden, J. C., & Hokanson, D. R.
(2005). Simulating the performance of fixed-bed granular activated carbon
adsorbers: Removal of synthetic organic chemicals in the presence of background
organic matter. Water Res., 39, 2407-2421.
Kapoor, A., Ritter, J., & Yang, R. (1989). On the Dubinin-Radushkevich Equation for
Adsorption in Microporous Solids in the Henry's Law Region. Langmuir, 5, 1118-
1121.
Kister, A., & Waldman, D. (1958). Heat of mixing of acetone with water and with
methanol. J. Phys. Chem., 62, 245-246.
Kuwagaki, H., Meguro, T., Tatami, J., Komeya, K., & Tamura, K. (2003). An improvement
of thermal conduction of activated carbon by adding graphite. J. Mater. Sci., 38,
3279-3284.
Kwapinski, W. (2009). Combined wall and thermal effects during nonisothermal packed
bed adsorption. Chem. Eng. J., 152, 271-276.
Lama, R., & Lu, B.-Y. (1965). Excess Thermodynamic Properties of Aqueous Alcohol
Solutions. J. Chem. Eng. Data, 10, 216-219.
Lashaki, M., Fayaz, M., Niknaddaf, S., & Hashisho, Z. (2012b). Effect of the adsorbate
kinetic diameter on the accuracy of the Dubinin-Radushkevich equation for
modeling adsorption of organic vapors on activated carbon. J. Hazard. Mater.,
241-242, 154-163.
Lashaki, M., Fayaz, M., Wang, H., Hashisho, Z., Philips, J., Anderson, J., & Nichols, M.
(2012a). Effect of Adsorption and Regeneration Temperature on Irreversible
Adsorption of Organic Vapors on Beaded Activated Carbon. Environ. Sci. Technol.,
46, 4083-4090.
Logan, D. (1997). Estimating physical properties for control equipment design. Environ.
Prog., 16, 237-242.
102
Manes, M. (1984). Estimation of the effects of humidity on the adsorption onto activated
carbon of the vapors of water-immiscible organic liquids. Fundamentals of
Adsorption (pp. 335-344). New York: Engineering Foundation.
Myers, A., & Prausnitz, J. (1965). Thermodynamics of Mixed-Gas Adsorption. AIChE J.,
11, 121-126.
Nemec, D., & Levec, J. (2005). Flowthrough packed bed reactors: 2. Two-phase
concurrent downflow. Chem. Eng. Sci., 60, 6958-6970.
Nield, D., & Bejan, A. (2006). Convection in Porous Media. New York: Springer.
Oberkampf, W., & Trucano, T. (2002). Verification and validation in computational fluid
dynamics. Prog. Aerospace Sci., 38, 209-272.
Okazaki, M., Tamon, H., & Toei, R. (1978). Prediction of binary adsorption equilibria of
solvent and water vapor on activated carbon. J. Chem. Eng. Japan, 11, 209-215.
Oliemans, R. (2000). ERCOFTAC’s role in promoting computational fluid dynamics.
Houille Blanche, 7-8, 43-46.
Qi, S., Hay, K., & Cal, M. (2000b). Predicting humidity effect on adsorption capacity of
activated carbon for water-immiscible organic vapors. Adv. Environ. Res., 4, 357-
362.
Qi, S., Hay, K., & Rood, M. (1998). Isotherm Equation for Water Vapor Adsorption onto
Activated Carbon. J. Environ. Eng., 124, 1130-1134.
Qi, S., Hay, K., Rood, M., & Cal, M. (2000a). Equilibrium and Heat of Adsorption for
Water Vapor and Activated Carbon. J. Environ. Eng., 126, 267-271.
Shaverdi, G. (2012). Developing a Model for Mass Transfer in Adsorption Packed-bed
Filters . Montreal: Concordia University.
Shi, Y., Lee, Y., & Kim, A. (2012). Knudsen Diffusion Through Cylindrical Tubes of
Varying Radii: Theory and Monte Carlo Simulations. Transp. Porous Media, 93,
517-541.
Sircar, S., & Hufton, J. R. (2000). Why does the linear driving force model for adsorption
kinetics work? Adsorption, 6, 137-147.
Sontheimer, H., Crittenden, J., & Summers, S. (1988). Activated carbon for water
treatment (2nd ed.). Karlsruhe: DVGW-Forschungsstelle, Engler-Bunte-Institut,
Universität Karlsruhe.
103
Suwanayuen, S., & Danner, R. (1980). A gas adsorption isotherm equation based on
vacancy solution theory. AIChE J., 26, 68-76.
Suzuki, M. (1990). Adsorption Engineering. Amsterdam: Elsevier Science Publishing
Company, Inc.
Tefera, D., Hashisho, Z., Philips, J., Anderson, J., & Nichols, M. (2014). Modeling
Competitive Adsorption of Mixtures of Volatile Organic Compounds in a Fixed-
Bed of Beaded Activated Carbon. Environ. Sci. Technol., 48, 5108-5117.
Tefera, D., Lashaki, M., Fayaz, M., Hashisho, Z., Philips, J., Anderson, J., & Nichols, M.
(2013). Two-Dimensional Modeling of Volatile Organic Compounds Adsorption
onto Beaded Activated Carbon. Environ. Sci. Technol., 47, 11700-11710.
Vahabi, M., Mehdizadeh, E., Kabganian, M., & Barazandeh, F. (2011). Experimental
identification of IPMC actuator parameters through incorporation of linear and
nonlinear least squares methods. Sens. Actuators A Phys., 168, 140-148.
Wang, H., Lashaki, M., Fayaz, M., Hashisho, Z., Phillips, J., Anderson, J., & Nichols, M.
(2012). Adsorption and Desorption of Mixtures of Organic Vapors on Beaded
Activated Carbon. Environ. Sci. Technol., 46, 8341-8350.
Willmott, C., & Matsuura, K. (2005). Advantages of the mean absolute error (MAE) over
the root mean square error (RMSE) in assessing average model performance. Clim.
Res., 30, 79-82.
Yang, R. (1987). Gas Separation by Adsorption Processes. Stoneham, Massachusetts:
Butterworth Publishers.

104
Chapter 4 RESULTS AND DISCUSSION
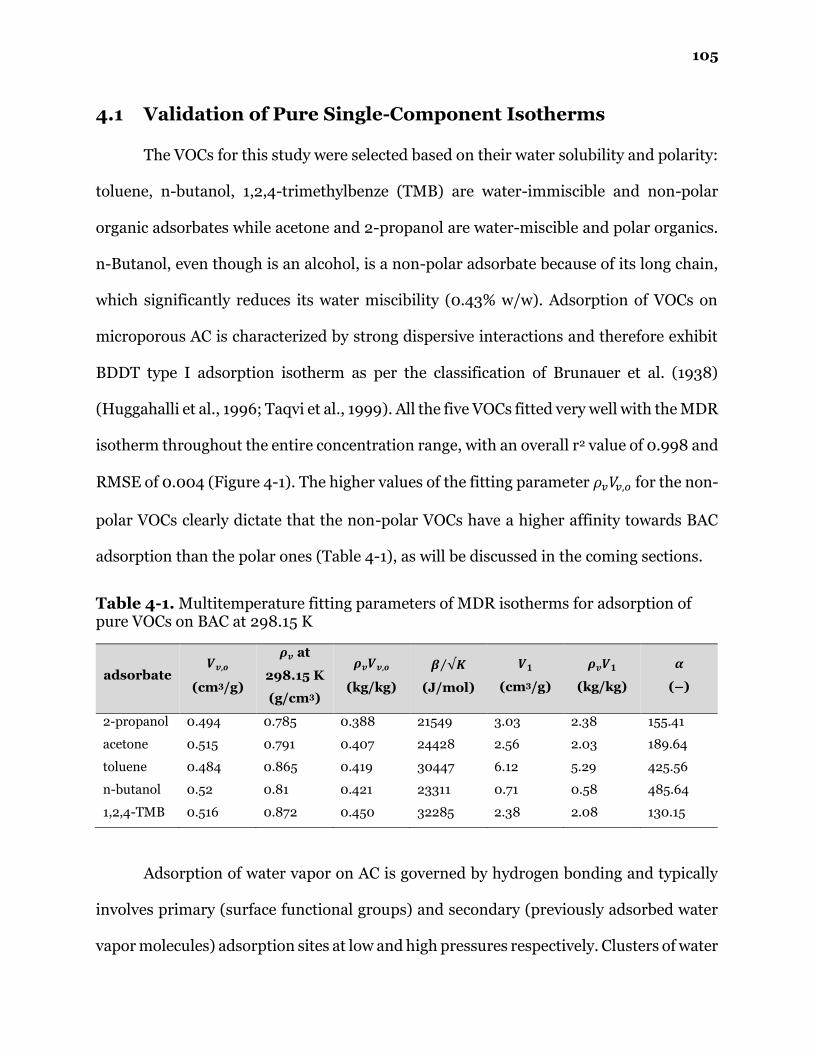
105
4.1 Validation of Pure Single-Component Isotherms
The VOCs for this study were selected based on their water solubility and polarity:
toluene, n-butanol, 1,2,4-trimethylbenze (TMB) are water-immiscible and non-polar
organic adsorbates while acetone and 2-propanol are water-miscible and polar organics.
n-Butanol, even though is an alcohol, is a non-polar adsorbate because of its long chain,
which significantly reduces its water miscibility (0.43% w/w). Adsorption of VOCs on
microporous AC is characterized by strong dispersive interactions and therefore exhibit
BDDT type I adsorption isotherm as per the classification of Brunauer et al. (1938)
(Huggahalli et al., 1996; Taqvi et al., 1999). All the five VOCs fitted very well with the MDR
isotherm throughout the entire concentration range, with an overall r2 value of 0.998 and
RMSE of 0.004 (Figure 4-1). The higher values of the fitting parameter 𝜌𝑣𝑉𝑣,𝑜 for the non-
polar VOCs clearly dictate that the non-polar VOCs have a higher affinity towards BAC
adsorption than the polar ones (Table 4-1), as will be discussed in the coming sections.
Table 4-1. Multitemperature fitting parameters of MDR isotherms for adsorption of pure VOCs on BAC at 298.15 K
adsorbate 𝑽𝒗,𝒐
(cm3/g)
𝝆𝒗 at
298.15 K
(g/cm3)
𝝆𝒗𝑽𝒗,𝒐
(kg/kg)
𝜷 √𝑲⁄
(J/mol)
𝑽𝟏
(cm3/g)
𝝆𝒗𝑽𝟏
(kg/kg)
𝜶
(–)
2-propanol 0.494 0.785 0.388 21549 3.03 2.38 155.41
acetone 0.515 0.791 0.407 24428 2.56 2.03 189.64
toluene 0.484 0.865 0.419 30447 6.12 5.29 425.56
n-butanol 0.52 0.81 0.421 23311 0.71 0.58 485.64
1,2,4-TMB 0.516 0.872 0.450 32285 2.38 2.08 130.15
Adsorption of water vapor on AC is governed by hydrogen bonding and typically
involves primary (surface functional groups) and secondary (previously adsorbed water
vapor molecules) adsorption sites at low and high pressures respectively. Clusters of water

106
molecules formed at high pressures are characteristic of capillary condensation, and
therefore water vapor adsorption exhibits a BDDT type V isotherm (Huggahalli et al.,
1996). For pure water vapor adsorption isotherm, QHR isotherm fitting parameters
achieved good agreement with experimental values; with 0.999 R-squared value and
RMSE of 0.007. The isotherm generates the desired type V (S-shaped) curve
demonstrating the unique adsorption mechanism of water on AC (Figure 4-2).
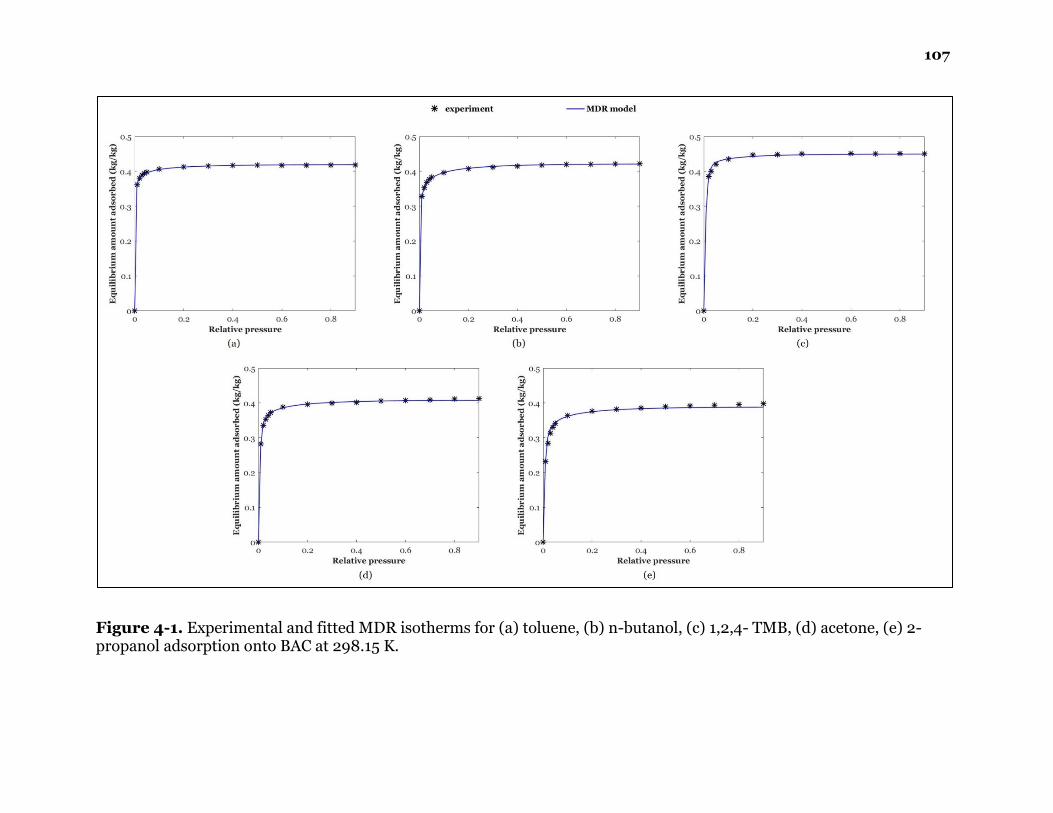
107
Figure 4-1. Experimental and fitted MDR isotherms for (a) toluene, (b) n-butanol, (c) 1,2,4- TMB, (d) acetone, (e) 2-propanol adsorption onto BAC at 298.15 K.

108
Figure 4-2. Experimental and fitted QHR isotherm for water adsorption onto BAC at 298.15 K.
The accuracy of single-component adsorption isotherms is very critical and affects
the reliability of the Manes method. Since the fittings of both these isotherm models
(MDR and QHR) were encouraging, they were used as inputs for Manes’ multicomponent
competitive adsorption isotherm model between organics and water vapor.
The multitemperature fitting parameters of the QHR isotherm are given in Table
4-2.

109
Table 4-2. Multitemperature fitting parameters of QHR isotherm for adsorption of pure water vapor on BAC at 298.15 K
adsorbate 𝑽𝒘,𝒐
(cm3/g)
𝝆𝒘𝑽𝒘,𝒐
(kg/kg)
𝑨
(–)
𝑬𝒂
(J/mol)
𝒂
(–)
𝒃
(1/K)
water 0.487 0.448 26.06 0.053 0.0979 0.0019
4.2 Validation of VOC-Water Vapor Multicomponent
Competitive Adsorption Isotherm
Figure 4-3a compares the experimental and modeled equilibrium adsorption
capacities for the selected VOCs during their competitive adsorption with water vapor at
298.15 K. As noted from the figure, Manes method and its extension for water-miscible
organics describe the VOC-water vapor equilibria well and satisfactorily. The method
predicted the adsorption capacity for VOCs during competitive adsorption with water
vapor with an overall MRAE of 1.9% for non-polar VOCs and 5.2% for polar VOCs. Among
the selected VOCs, the polar VOCs 2-propanol and acetone experienced the highest
reduction in their adsorption capacity of 17.5% and 14.1% respectively at about 95% RH.
This was followed by the non-polar adsorbates; with VOC adsorption capacity reduction
being 6.4%, 5.8%, and 0.2% for n-butanol, toluene, and 1,2,4-TMB respectively. The trend
follows the affinity of the adsorbate towards BAC adsorption; with non-polar VOCs such
as 1,2,4-TMB having the highest affinity among the selected adsorbates understandably
encounters no impact by relative humidity. The opposite can be said for the water-
miscible/polar VOCs, acetone and 2-propanol. In their case, high water-miscibility in
addition to low adsorption affinity, play a role in the significant decrease in their
adsorption capacities. This is mainly due to the formation of hydrogen bonding between
water and acetone/2-propanol molecules during competitive adsorption (Okazaki et al.,

110
1978). At 55% RH, no impact on adsorption capacity was observed for all the concerned
VOCs chiefly due to water vapor’s low affinity towards BAC adsorption at that
concentration. This behavior was correctly predicted by the model as it generated similar
results at 0% and 55% RH. The model predictions were encouraging; and therefore, were
further applied to simulate the adsorption kinetics.
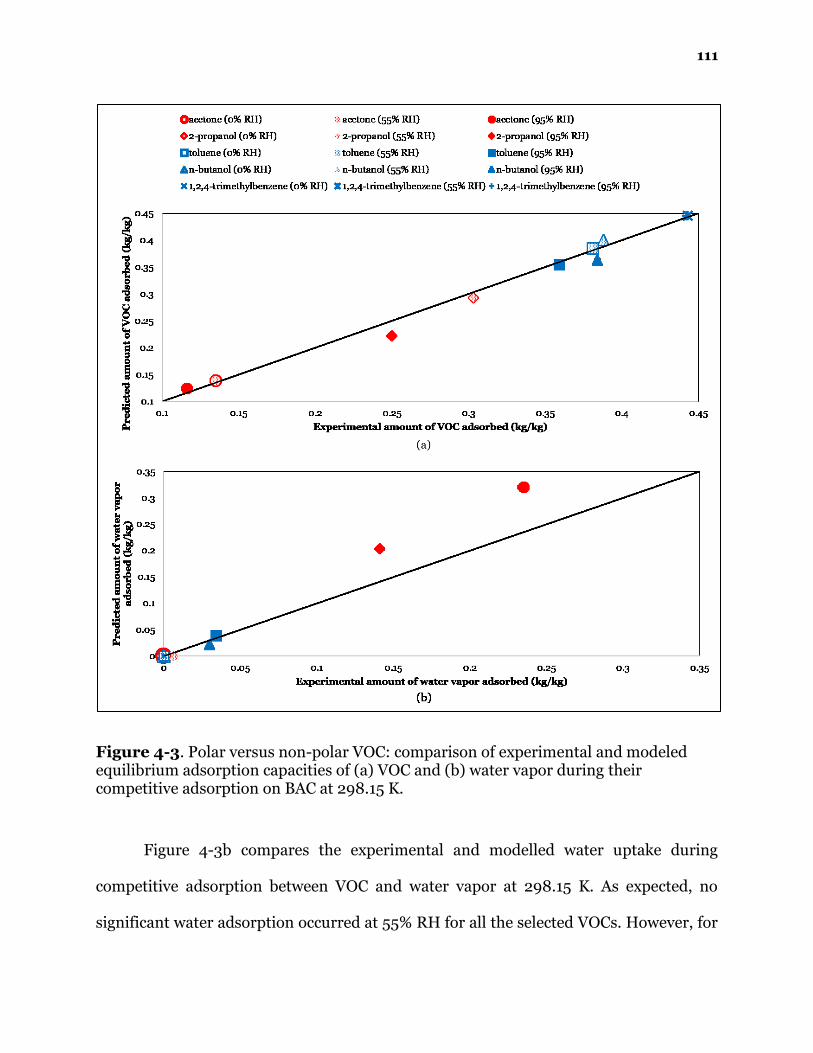
111
Figure 4-3. Polar versus non-polar VOC: comparison of experimental and modeled equilibrium adsorption capacities of (a) VOC and (b) water vapor during their competitive adsorption on BAC at 298.15 K.
Figure 4-3b compares the experimental and modelled water uptake during
competitive adsorption between VOC and water vapor at 298.15 K. As expected, no
significant water adsorption occurred at 55% RH for all the selected VOCs. However, for

112
acetone there was 4% water uptake at 55% RH, which was mostly due to its hydrogen
bonding with water molecules (Okazaki et al., 1978). The extension of Manes method for
water-miscible adsorbates is considered only when RH is upwards 75%; and therefore,
the 4% water uptake at 55% RH was not predicted by the model. At about 95% RH, the
model projected the water uptake during competitive adsorption with an overall MRAE
of 14.9% for non-polar VOCs and 40.1% for polar VOCs. With respect to non-polar VOCs,
the error could be attributed to the smaller amounts of water adsorbed which would lead
to large relative absolute error. For polar VOCs, non-ideality in the adsorbed phase could
be a contributor to the error; since it is not considered by the model and therefore, leading
to over- or under-estimation of the amount of water vapor uptake. In addition, numerical
error in modelling and experimental error in measuring adsorption capacity could also be
factors for both polar and non-polar VOCs. Acetone had the highest water vapor uptake
of 67%, followed by 2-propanol (36.1%), toluene (8.7%), n-butanol (7.6%), and 1,2,4-TMB
(0%). This trend in water vapor adsorption can be explained by adsorption potential. At
their given inlet concentrations, pure adsorption potential (휀𝑣𝑜) was the highest for
acetone, and lowest for 1,2,4-TMB among the selected VOCs (Table 4-3). Since at 95%
RH, the pure adsorption potential for water vapor (휀𝑤𝑜 ) was significantly lower than the
VOCs’ (Table 4-3); during competitive adsorption, the extent of water adsorbed onto BAC
was governed by their respective adsorption potentials. In this case, if the pure adsorption
potential of water vapor is very low compared to the adsorption potential of VOC in the
water-VOC mixture, the affinity of water vapor towards BAC would be higher and
therefore higher amount of water is adsorbed; and vice versa. Additionally, for polar

113
VOCs, hydrogen bonding with water molecules may also play a part in promoting water
adsorption during competitive adsorption (Okazaki et al., 1978).
Figure 4-4 and Figure 4-5 demonstrate 2D multicomponent competitive
adsorption equilibria between the selected VOCs and water vapor for the entire
concentration range of water vapor and up to 0.1 relative pressure for the VOCs. As can
be seen in Figure 4-4, the impact of water vapor occurs at 75% RH levels (or 0.75 relative
water vapor pressure) and beyond, depending upon the VOC concentration, which
decreases VOC adsorption capacity and increases water uptake on BAC. Similar behavior
was also predicted for polar VOCs except that at RH levels between 75% and 90% and
VOC relative vapor pressure within 0.02 and 0.1, about 1% increase in VOC adsorption
capacity was observed (Figure 4-5). This is primarily due to the dissolution of polar VOCs
in water during competitive adsorption among them, which in turn is accounted for by
the Raoult’s-law-like extension to Manes method. Such exceptions are consistent with
previous adsorption studies conducted on polar organic and water vapors (Taqvi et al.,
1999; Linders et al., 2001; Qi et al., 2006).
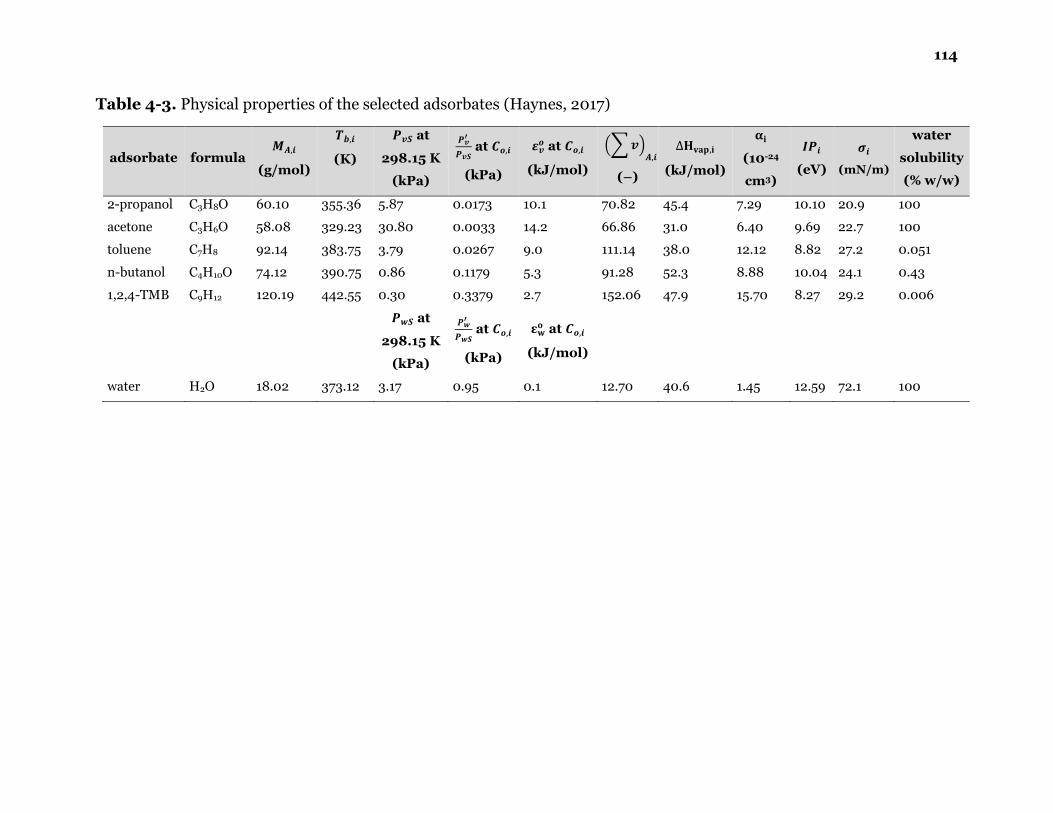
114
Table 4-3. Physical properties of the selected adsorbates (Haynes, 2017)
adsorbate formula 𝑴𝑨,𝒊
(g/mol)
𝑻𝒃,𝒊
(K)
𝑷𝒗𝑺 at
298.15 K
(kPa)
𝑷𝒗′
𝑷𝒗𝑺 at 𝑪𝒐,𝒊
(kPa)
𝜺𝒗𝒐 at 𝑪𝒐,𝒊
(kJ/mol)
(∑ 𝒗)𝑨,𝒊
(–)
∆𝐇𝐯𝐚𝐩,𝐢
(kJ/mol)
𝛂𝐢
(10-24
cm3)
𝑰𝑷𝒊
(eV)
𝝈𝒊
(mN/m)
water
solubility
(% w/w)
2-propanol C3H8O 60.10 355.36 5.87 0.0173 10.1 70.82 45.4 7.29 10.10 20.9 100
acetone C3H6O 58.08 329.23 30.80 0.0033 14.2 66.86 31.0 6.40 9.69 22.7 100
toluene C7H8 92.14 383.75 3.79 0.0267 9.0 111.14 38.0 12.12 8.82 27.2 0.051
n-butanol C4H10O 74.12 390.75 0.86 0.1179 5.3 91.28 52.3 8.88 10.04 24.1 0.43
1,2,4-TMB C9H12 120.19 442.55 0.30 0.3379 2.7 152.06 47.9 15.70 8.27 29.2 0.006
𝑷𝒘𝑺 at
298.15 K
(kPa)
𝑷𝒘′
𝑷𝒘𝑺 at 𝑪𝒐,𝒊
(kPa)
𝛆𝐰𝐨 at 𝑪𝒐,𝒊
(kJ/mol)
water H2O 18.02 373.12 3.17 0.95 0.1 12.70 40.6 1.45 12.59 72.1 100
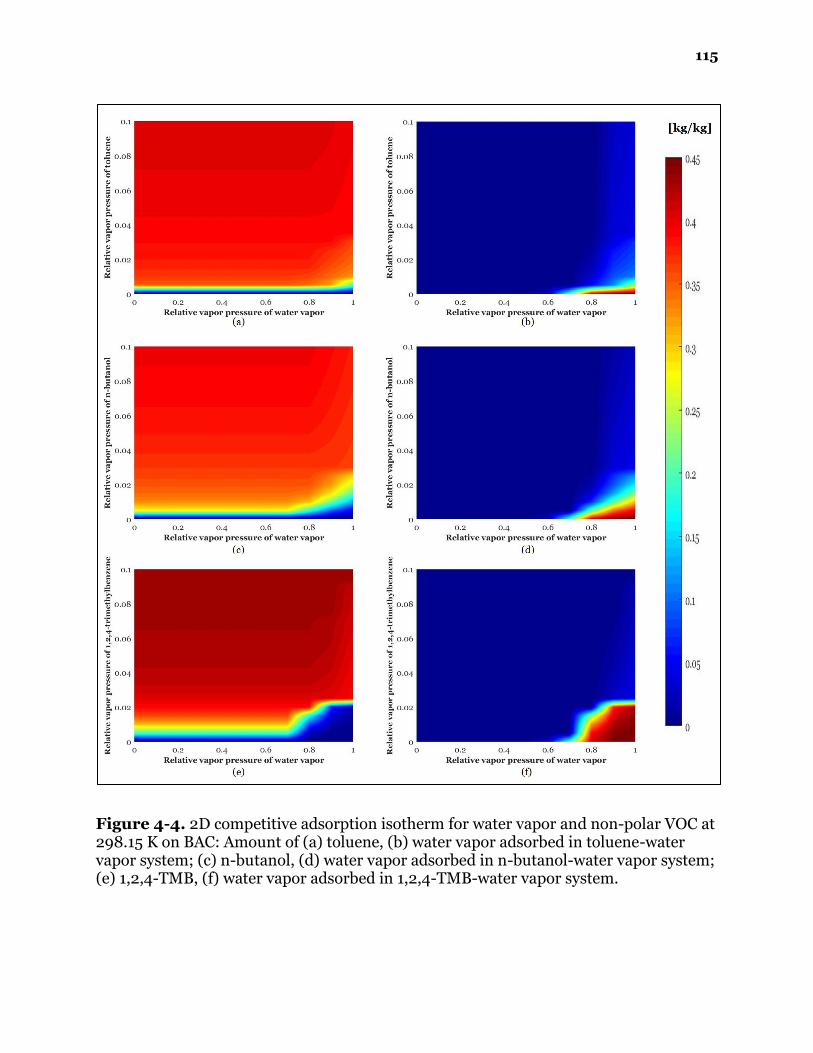
115
Figure 4-4. 2D competitive adsorption isotherm for water vapor and non-polar VOC at 298.15 K on BAC: Amount of (a) toluene, (b) water vapor adsorbed in toluene-water vapor system; (c) n-butanol, (d) water vapor adsorbed in n-butanol-water vapor system; (e) 1,2,4-TMB, (f) water vapor adsorbed in 1,2,4-TMB-water vapor system.
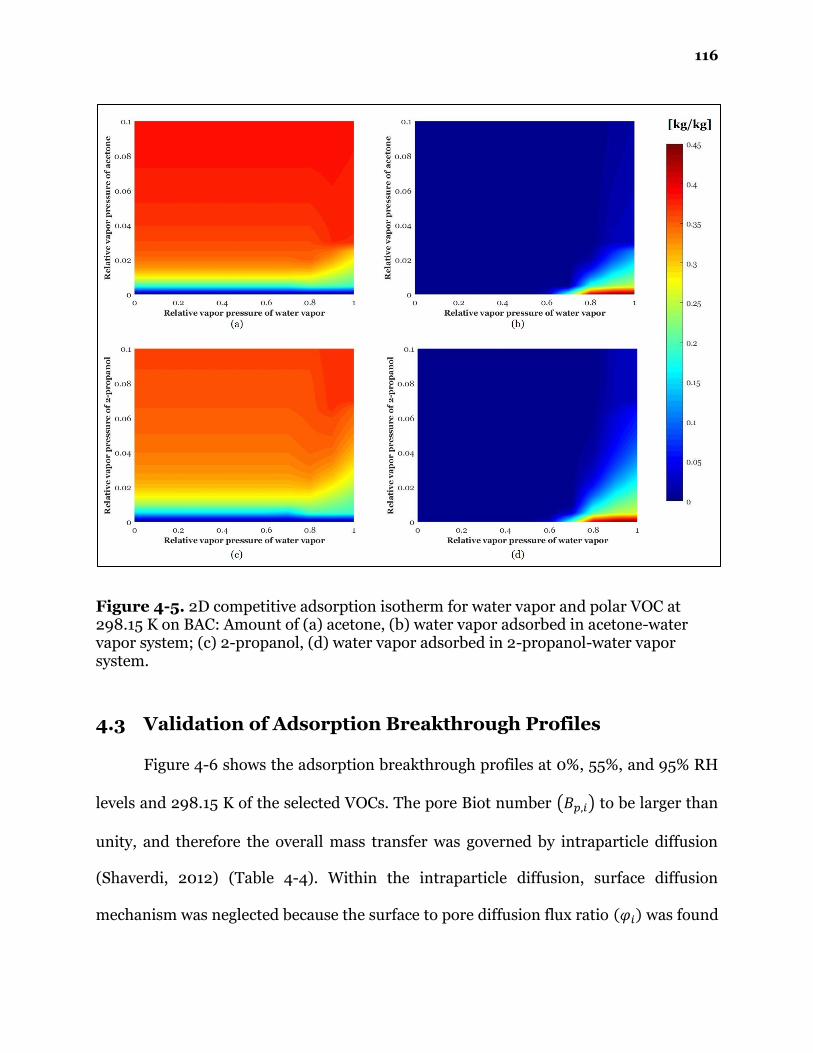
116
Figure 4-5. 2D competitive adsorption isotherm for water vapor and polar VOC at 298.15 K on BAC: Amount of (a) acetone, (b) water vapor adsorbed in acetone-water vapor system; (c) 2-propanol, (d) water vapor adsorbed in 2-propanol-water vapor system.
4.3 Validation of Adsorption Breakthrough Profiles
Figure 4-6 shows the adsorption breakthrough profiles at 0%, 55%, and 95% RH
levels and 298.15 K of the selected VOCs. The pore Biot number (𝐵𝑝,𝑖) to be larger than
unity, and therefore the overall mass transfer was governed by intraparticle diffusion
(Shaverdi, 2012) (Table 4-4). Within the intraparticle diffusion, surface diffusion
mechanism was neglected because the surface to pore diffusion flux ratio (𝜑𝑖) was found
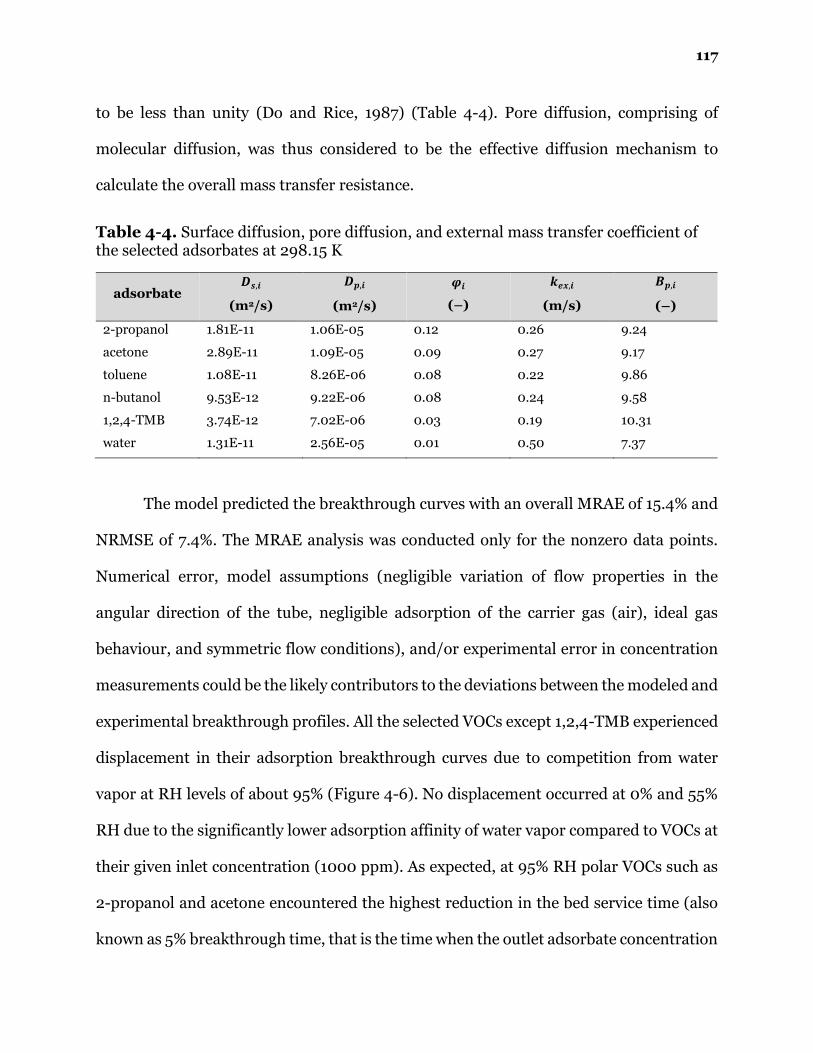
117
to be less than unity (Do and Rice, 1987) (Table 4-4). Pore diffusion, comprising of
molecular diffusion, was thus considered to be the effective diffusion mechanism to
calculate the overall mass transfer resistance.
Table 4-4. Surface diffusion, pore diffusion, and external mass transfer coefficient of the selected adsorbates at 298.15 K
adsorbate 𝑫𝒔,𝒊
(m2/s)
𝑫𝒑,𝒊
(m2/s)
𝝋𝒊
(–)
𝒌𝒆𝒙,𝒊
(m/s)
𝑩𝒑,𝒊
(–)
2-propanol 1.81E-11 1.06E-05 0.12 0.26 9.24
acetone 2.89E-11 1.09E-05 0.09 0.27 9.17
toluene 1.08E-11 8.26E-06 0.08 0.22 9.86
n-butanol 9.53E-12 9.22E-06 0.08 0.24 9.58
1,2,4-TMB 3.74E-12 7.02E-06 0.03 0.19 10.31
water 1.31E-11 2.56E-05 0.01 0.50 7.37
The model predicted the breakthrough curves with an overall MRAE of 15.4% and
NRMSE of 7.4%. The MRAE analysis was conducted only for the nonzero data points.
Numerical error, model assumptions (negligible variation of flow properties in the
angular direction of the tube, negligible adsorption of the carrier gas (air), ideal gas
behaviour, and symmetric flow conditions), and/or experimental error in concentration
measurements could be the likely contributors to the deviations between the modeled and
experimental breakthrough profiles. All the selected VOCs except 1,2,4-TMB experienced
displacement in their adsorption breakthrough curves due to competition from water
vapor at RH levels of about 95% (Figure 4-6). No displacement occurred at 0% and 55%
RH due to the significantly lower adsorption affinity of water vapor compared to VOCs at
their given inlet concentration (1000 ppm). As expected, at 95% RH polar VOCs such as
2-propanol and acetone encountered the highest reduction in the bed service time (also
known as 5% breakthrough time, that is the time when the outlet adsorbate concentration

118
is 5% of the inlet) of 16.9% and 10.7% respectively. This was followed by the non-polar
VOCs in the order: n-butanol (9.6%), toluene (7.8%), and 1,2,4-TMB (0.0%). The trend in
adsorption breakthrough time reduction is consistent with the decrease in VOC
adsorption capacity at 95% RH. This proves the coherency of the multicomponent
adsorption isotherm and transport phenomena equations in the model. The high
susceptibility of polar VOCs to the impact of RH during competitive adsorption with VOCs
was also reported in other studies where adsorption capacity for polar VOCs such as
acetone experienced reduction of up to 50% compared to about 40% for non-polar VOCs
such as benzene, toluene at 90% RH and 303 K on GAC and inlet concentrations ranging
from 500 – 8000 mg/m3 (Huasheng et al., 2002; Li et al., 2010). The breakthough curve
results here for dry conditions are consistent with previous studies on single-component
adsorption on BAC for VOCs such as acetone, toluene, 1,2,4-TMB at 298.15 K (Tefera et
al., 2013).
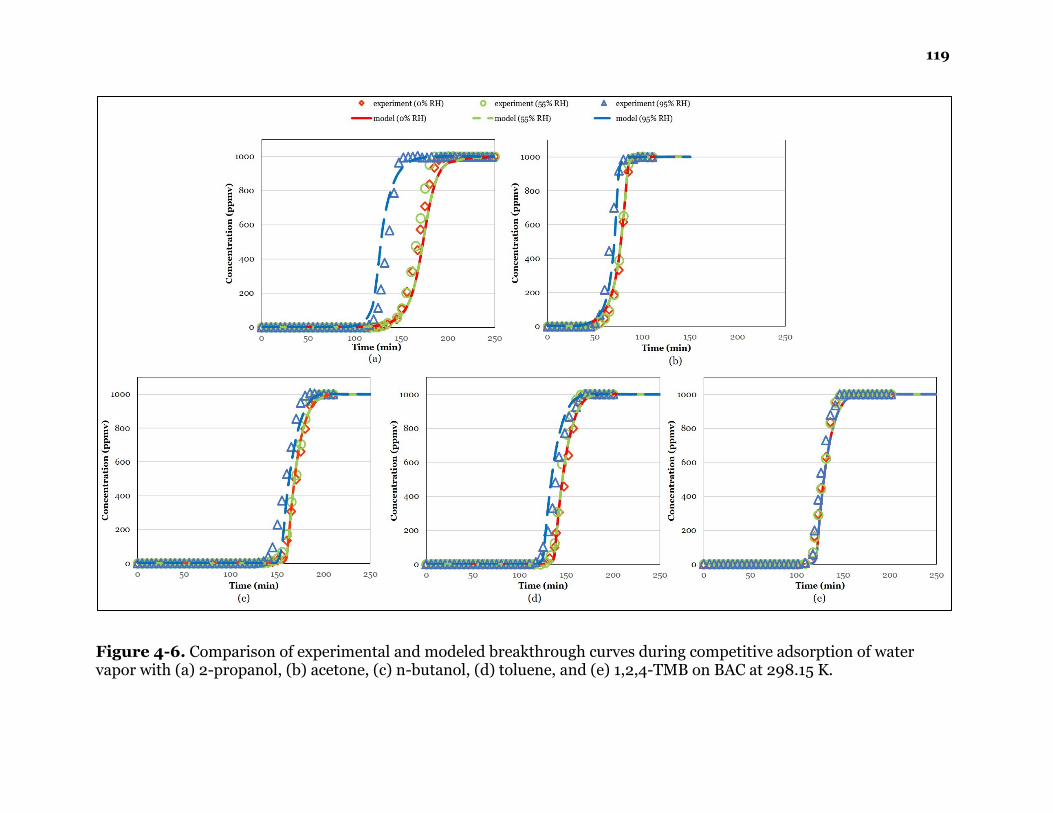
119
Figure 4-6. Comparison of experimental and modeled breakthrough curves during competitive adsorption of water vapor with (a) 2-propanol, (b) acetone, (c) n-butanol, (d) toluene, and (e) 1,2,4-TMB on BAC at 298.15 K.
120
4.4 Absorbed-Phase Concentration Distribution
Figure 4-7 shows the development of two-dimensional adsorbed-phase
concentration distribution of 2-propanol during its competitive adsorption with water
vapor at 298.15 K, and its comparison with dry conditions at 0%RH. As observed earlier
with the validations of adsorption capacity and breakthrough profile predictions, the
model here too generates the same results at 0% and 55% RH. 30 min after the start of
adsorption, it can be seen that the movement of mass transfer zone (MTZ) at higher RH
levels is faster than at lower RH or dry conditions; with the MTZ at 95% RH at about 35
mm from the adsorber inlet compared to 25 mm for 0%/55% RH. In addition, 17.5%
reduction in equilibrium adsorption capacity at 30 min and 95% RH can also be noted
from the figure; as predicted by the extended Manes method. Such behavior at high
humidity is due to competition between 2-propanol and water molecules for the limited
adsorption sites in the BAC fixed-bed adsorber; which results in displacement of the
VOC’s MTZ and reduction in its adsorption capacity. In general, it can be said that the
extent of reduction in breakthrough time is governed by the affinity, adsorption potential,
and polarity of the concerned VOC and water vapors at their given inlet concentrations
during competitive adsorption. The difference between the MTZs at 0%/55% and 95% RH
continued to be within 10 to 20 mm (9 to 17% of the entire bed length) throughout the
adsorption period until saturation; which in turn leads to an early bed-saturation at 160
min for 95% RH compared to 200 min for 0%/55% RH. The movement of MTZ in 2-
propanol’s adsorbed-phase concentration distribution is consistent with its adsorption
breakthrough profile measured at the centre of the adsorber outlet (Figure 4-6).
Furthermore, the mass transfer resistance of 2-propanol did not experience any

121
significant impact during high humidity conditions; especially because of very low
diffusion resistance of the competing water vapor molecules, owing to their much smaller
size when compared to 2-propanol’s (Table 4-4). The same can be said for all the selected
VOCs.

122
Figure 4-7. 2D adsorbed-phase concentration distribution of 2-propanol during competitive adsorption with water vapor on BAC at 298.15 K.
123
Also, the variation of the adsorbed phase concentration in the radiation direction
reveals that the bed becomes was saturated near the wall earlier than at its centre due to
wall channeling. This observation is consistent with previous 2D adsorption modeling
studies (Tefera et al., 2013, 2014; Coker et al., 2015; Schlüter et al., 2016). A one-
dimensional simulation would have mostly generated an earlier breakthrough in the same
scenario.
4.5 Absorber Bed Temperature Distribution
Figure 4-8 demonstrates the experimental and modeled adsorber bed temperature
profiles at the center of the bed (r = 0.0 cm, z = 7.5 cm) during competitive adsorption
between different VOC-water vapor systems. The model predictions were good with an
MRAE and NRMSE of 2.6% and 3.4% for the polar VOCs, and 1.9% and 2.5% for the non-
polar VOCs, respectively. While experimental error in measuring bed temperatures could
be a factor, the most likely contributor to the error could be the model’s assumption of
ideal adsorbed-phase for polar VOCs. Except 1,2,4-TMB, all the selected VOC-water vapor
systems experienced an increase in average bed temperature of up to 1 to 2 K during
competitive adsorption at 95% RH when compared to 0%/55% RH. Adsorption being an
exothermic process, the temperature rise can be attributed to the adsorbate(s) loading,
heat of adsorption, and heat of dissolution (for polar adsorbates in a gas mixture). The
polar VOCs, which depicted a more severe impact of RH, had the highest average bed-
temperature increase of up to 2 K during competitive adsorption with water vapor. For
non-polar VOCs, it was about 1 K.
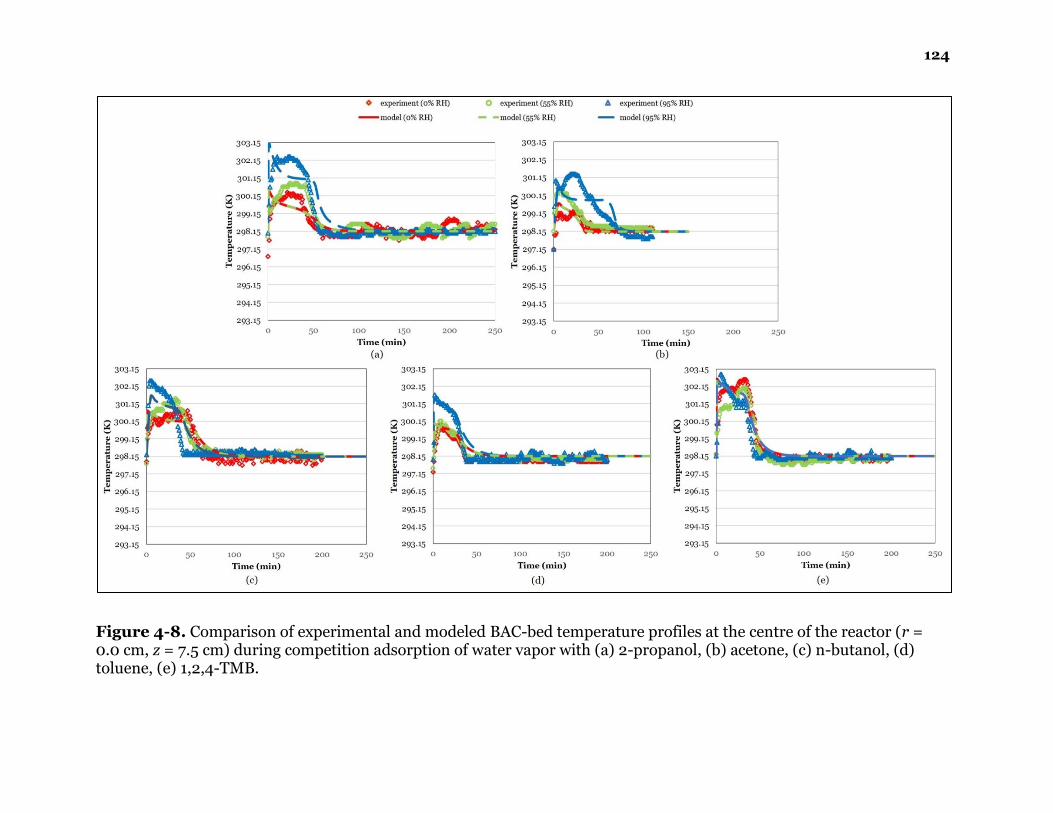
124
Figure 4-8. Comparison of experimental and modeled BAC-bed temperature profiles at the centre of the reactor (r = 0.0 cm, z = 7.5 cm) during competition adsorption of water vapor with (a) 2-propanol, (b) acetone, (c) n-butanol, (d) toluene, (e) 1,2,4-TMB.

125
Following bed temperature validations, a 2D adsorber bed temperature
distribution was generated which shows the evolution and comparison of heat transfer
zones (HTZ) with and without competitive adsorption between 2-propanol and water
vapor (Figure 4-9). Higher temperature, as predicted earlier, was observed in the 2D
temperature plot at 95% RH. This lead to a difference in HTZ at 0%/55% RH and 95%
RH of up to 30 mm (26% of the entire bed length) throughout the adsorption period.
Consequently, the fixed-bed at 0%/55% RH reached thermal equilibrium with the
adsorption temperature at least 40 min earlier at 200 min than the fixed-bed at 95% RH.
The 2D temperature distribution plot corresponds well with the 2D adsorbed-phase
concentration plot (Figure 4-7); albeit the HTZ had a higher velocity than the MTZ,
creating a difference of at least 10 mm at all times and conditions during adsorption. It
should also be noted that the temperature during adsorption varied across the bed, and
was higher at the center than at the periphery because of convective heat transfer at the
tube wall. In dry conditions, similar observations in adsorber bed temperature and HTZ
across the adsorber bed were made in previous modeling and experimental works on AC
adsorption of VOCs such as benzene, toluene, acetone, ethanol, pentane (Marivoet et al.,
1974; Kwapinski, 2009; Tefera et al., 2013; Schlüter et al., 2016), which strengthens the
reliability of the model for simulating heat transfer kinetics during competitive
adsorption between VOC and water vapor.

126
Figure 4-9. 2D adsorber bed temperature distribution during competitive adsorption of 2-propanol with water vapor at 298.15 K.
127
4.5 Sensitivity Analysis
Humidity in contaminated gas streams varies with operating conditions and is
highly sensitive to temperature. The extent of impact of RH on VOC adsorption capacity
is also critically depended on the inlet VOC concentration levels. Therefore, a proper
sensitivity analysis focussing on these factors is a necessity.
4.5.1 Effect of Adsorption Temperature
Figure 4-10 shows the experimental and modeled adsorption breakthrough
profiles of 2-propanol at 298.15 K and 305.15 K at RH levels of 0%, 55%, and 95%.
Increasing the temperature from 298.15 K to 305.15 K completely negated the impact of
RH on the bed service time and VOC adsorption capacity, which were reduced by 16.9%
and 17.5% respectively at 298.15 K and 95% RH. No deterioration in the 5% breakthrough
time and the VOC adsorption capacity was found at 305.15 K and the selected RH levels.
However, the VOC adsorption capacity decreased by 11% at 305.15 K compared to
298.15K, 0%/55% RH. Therefore, optimization of bed temperature is a very critical
requirement to maintain a balance between the effect of temperature on RH and
adsorption, and its effect on the bed service time and adsorption capacity. This is where
the utility and stability of the model is crucial. The model predicted the adsorption
behavior of 2-propanol at 305.15 K (0%, 55%, 95% RH) with an overall MRAE of 12.4%
and 7.1% for the breakthrough profiles and adsorption capacity respectively, which shows
that it is sensitive to changes in operational conditions. The model’s utility in optimizing
bed temperature for minimizing impact of RH would lead to an increase in adsorber
service lifetime; hence, a decrease in overall fixed-bed adsorber operational costs.
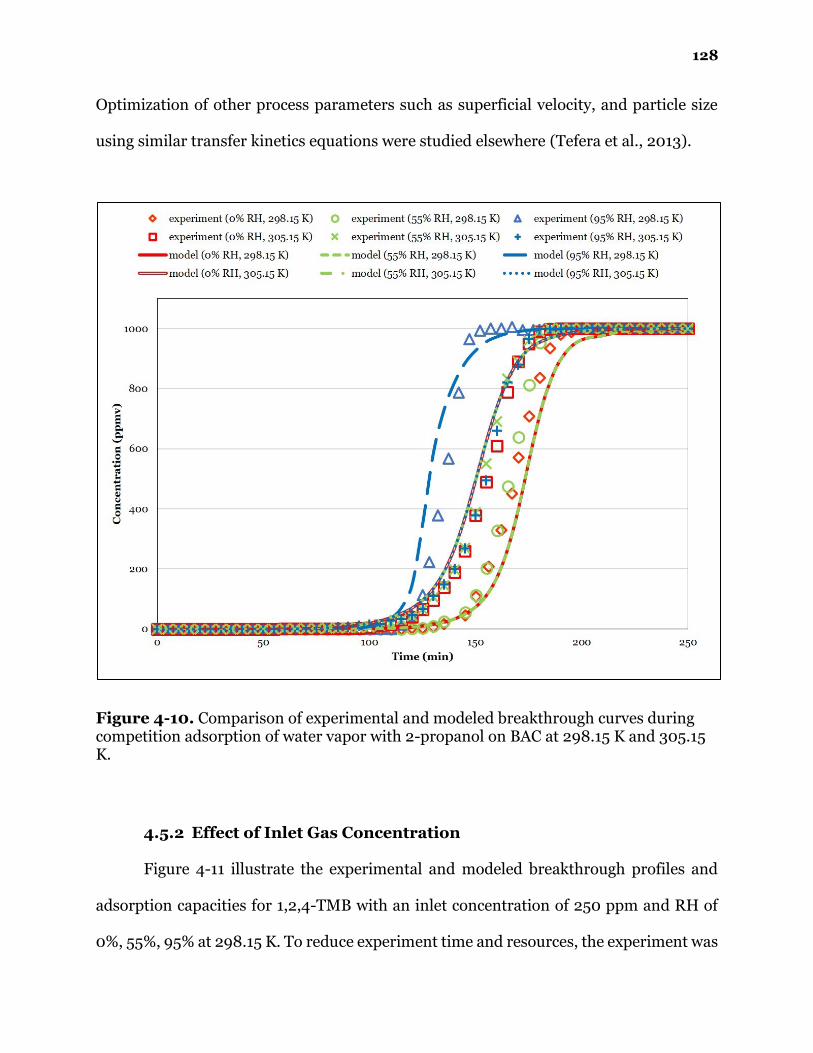
128
Optimization of other process parameters such as superficial velocity, and particle size
using similar transfer kinetics equations were studied elsewhere (Tefera et al., 2013).
Figure 4-10. Comparison of experimental and modeled breakthrough curves during competition adsorption of water vapor with 2-propanol on BAC at 298.15 K and 305.15 K.
4.5.2 Effect of Inlet Gas Concentration
Figure 4-11 illustrate the experimental and modeled breakthrough profiles and
adsorption capacities for 1,2,4-TMB with an inlet concentration of 250 ppm and RH of
0%, 55%, 95% at 298.15 K. To reduce experiment time and resources, the experiment was
129
conducted in a 3.5-cm fixed bed containing 4 g of BAC particles; all the other experimental
conditions were maintained same as earlier. The inlet concentration of 1,2,4-TMB (250
ppm) was selected to analyse the impact of RH at low concentration levels, considering
that at concentrations four times higher (1,000 ppm) no impact of RH was observed. At
55% RH, no effect of RH was felt on 1,2,4-TMB adsorption; however, at 95%RH, 1,2,4-
TMB adsorption capacity decreased by 6.4% leading to a 7.6% reduction in bed service
time and 4.6% water uptake. This is mainly due to the lower affinity of 1,2,4-TMB at 250
ppm compared to 1,000 ppm, against the competing water vapor molecules at 95% RH.
The model predicted this behavior well with an overall MRAE of 1.6% and 5.1% for
adsorption capacity and service time respectively. This signifies the robustness of the
Manes method and the overall model in sensitivity analysis.
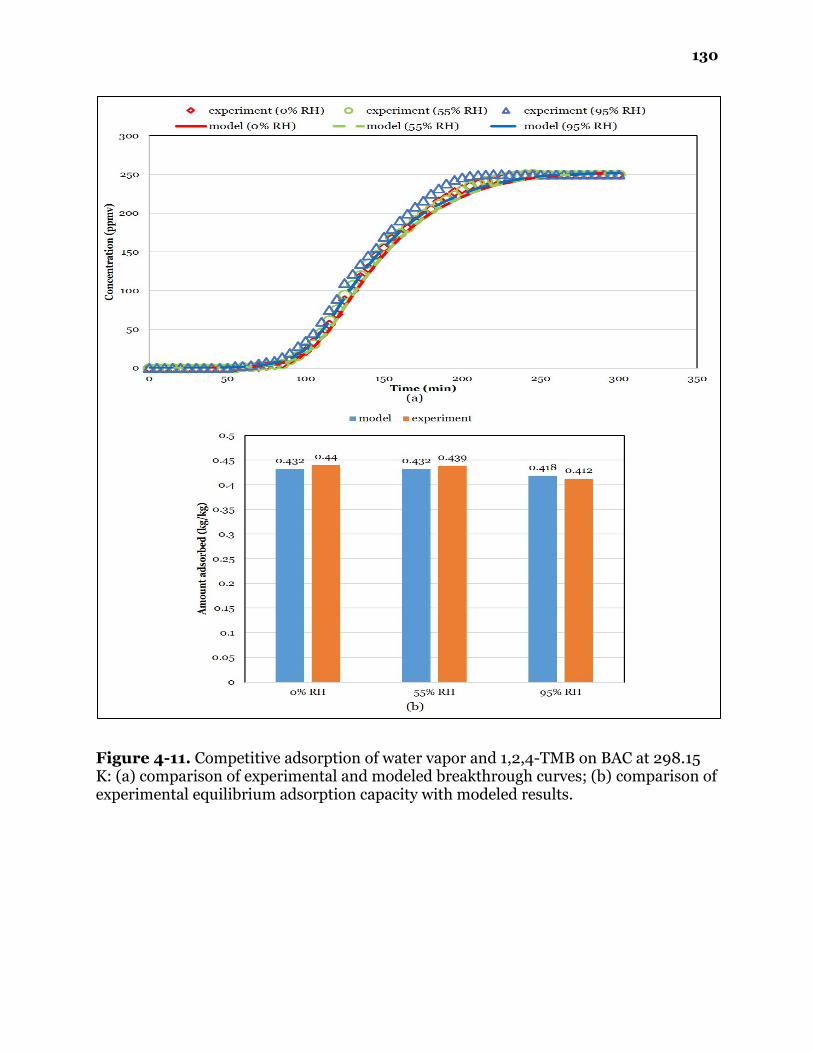
130
Figure 4-11. Competitive adsorption of water vapor and 1,2,4-TMB on BAC at 298.15 K: (a) comparison of experimental and modeled breakthrough curves; (b) comparison of experimental equilibrium adsorption capacity with modeled results.

131
4.6 References
Bruanuer, S., Emmett, P., & Teller, E. (1938). Adsorption of gases in multimolecular
layers. J. Am. Chem. Soc, 60, 309-319.
Coker, R., Gomez, C., & Schunk, G. (2015). Multi-Dimensional Adsorption Model of
CO2/H2O Sorbent Bed. COMSOL Conference. Boston: COMSOL.
Do, D., & Rice, R. (1987). On the relative importance of pore and surface diffusion in non-
equilibrium adsorption rate processes. Chem. Eng. Sci., 42, 2269-2284.
Haynes, W. (2017). CRC Handbook of Chemistry and Physics (97th ed.). Boca Raton,
Florida: CRC Press/Taylor & Francis.
Huasheng, G., Dahui, W., Yunchun, Y., & Tian'en, T. (2002). Binary Adsorption
Equilibrium of Benzene-Water Vapor Mixtures on Activated Carbon. Chinese J.
Chem. Eng., 10, 367-370.
Huggahalli, M., & Fair, J. (1996). Prediction of Equilibrium Adsorption of Water onto
Activated Carbon. Ind. Eng. Chem. Res., 35, 2071-2074.
Kwapinski, W. (2009). Combined wall and thermal effects during nonisothermal packed
bed adsorption. Chem. Eng. J., 152, 271-276.
Li, C., Xuemin, H., Fangning, F., & Fengli, J. (2010). Effect of relative humidity on
adsorption capacity of organic vapors on activated carbon and prediction by the
modified D-R equation. International Conference on Digital Manufacturing &
Automation , (pp. 608-611). Changha, Hunan.
Linders, M., van den Broeke, L., Kapteijn, F., & Moulijn, J. A. (2001). Binary Adsorption
Equilibrium of Organics and Water on Activated Carbon. AIChE J., 47, 1885-1892.
Marivoet, J., Teodoroiu, P., & Wajc, S. (1974). Porosity, velocity and temperature profiles
in cylindrical packed beds. Chem. Eng. Sci., 29, 1836-1840.
Nastaj, J., Witkiewicz, K., & Chybowska, M. (2016). Modeling of multicomponent and
multitemperature adsorption equilibria of water vapor and organic compounds on
activated carbons. Ads. Sci. Technol., 34, 144-175.
Okazaki, M., Tamon, H., & Toei, R. (1978). Prediction of binary adsorption equilibria of
solvent and water vapor on activated carbon. J. Chem. Eng. Japan, 11, 209-215.
Qi, N., Appel, W., & LeVan, M. (2006). Adsorption Dynamics of Organic Compounds and
Water Vapor in Activated Carbon Beds. Ind. Eng. Chem. Res., 45, 2303-2314.
132
Schlüter, S., Hennig, T., Schieferstein, E., & Meller, K. (2016). Simulator for Automotive
Evaporative Emissions Restraint Systems. COMSOL Conference. Munich:
COMSOL.
Shaverdi, G. (2012). Developing a Model for Mass Transfer in Adsorption Packed-bed
Filters . Montreal: Concordia University.
Taqvi, S., Appel, W., & LeVan, M. (1999). Coadsorption of Organic Compounds and Water
Vapor on BPL Activated Carbon. 4. Methanol, Ethanol, Propanol, Butanol, and
Modeling. Ind. Eng. Chem. Res., 38, 240-250.
Tefera, D., Hashisho, Z., Philips, J., Anderson, J., & Nichols, M. (2014). Modeling
Competitive Adsorption of Mixtures of Volatile Organic Compounds in a Fixed-
Bed of Beaded Activated Carbon. Environ. Sci. Technol., 48, 5108-5117.
Tefera, D., Lashaki, M., Fayaz, M., Hashisho, Z., Philips, J., Anderson, J., & Nichols, M.
(2013). Two-Dimensional Modeling of Volatile Organic Compounds Adsorption
onto Beaded Activated Carbon. Environ. Sci. Technol., 47, 11700-11710.

133
Chapter 5 CONCLUSIONS AND
RECOMMENDATIONS

134
5.1 Thesis Overview
This research investigated the impact of water vapor on VOC adsorption onto AC
and developed a suitable 2D thermodynamically consistent model to predict the
multicomponent adsorption equilibria and the transfer kinetics during the competitive
adsorption process involving a VOC and water vapor. The VOCs selected for this research
work were selected based on their polarity and water solubility to evaluate different
scenarios during competitive adsorption of polar or non-polar VOC with water vapor.
The model consists of two major components: VOC-water vapor multicomponent
adsorption isotherm, and the adsorption transport phenomena. The multicomponent
competitive adsorption isotherm was modeled using the Manes method, which was
modified for its use with polar VOCs. It is thermodynamically consistent and requires only
the single-component adsorption isotherms of the tested VOC and water vapor as inputs.
Therefore, the accuracy of the single-component adsorption isotherms, modeled using
the MDR and QHR isotherm equations, is highly critical to the success of the Manes
method. The MDR and QHR isotherm equations were applied to fit the experimental data
of VOC adsorption (type I) and water vapor adsorption (type V) on AC, with an overall r2
value of 0.998 and 0.999 respectively. The Manes method then predicted the adsorption
capacity for VOCs during competitive adsorption with water vapor with an overall MRAE
of 5.2% and 1.9% for polar and non-polar VOCs respectively. The method also predicted
the water uptake during competitive adsorption with VOC at about 95% RH with an
overall MRAE of 40.1% for polar VOCs and 14.9% for non-polar VOCs.
The adsorption transport phenomena model used here is an extension of the model
developed by Tefera et al., (2013, 2014). The transfer kinetics simulated here were the
adsorbate mass balance in the gas and adsorbed phase, and the heat and momentum
135
balance across the fixed-bed adsorber of BAC particles. The model predicted the VOC
breakthrough profile curves during competitive adsorption with water vapor with an
overall MRAE (non-zero data points only) of 14.8% for polar VOCs and 15.8% for non-
polar VOCs. The experimental and modeled adsorbed bed temperature profiles at the
centre of the fixed-bed (r = 0.0 cm, z = 7.5 cm) were also compared, and were found to
have an overall MRAE of 2.6% and 1.9% for the tested polar and non-polar VOCs
respectively. After the validations of the multicomponent competitive adsorption
isotherm, breakthrough and adsorber bed temperature profiles, 2D adsorbed-phase
concentration and temperature distribution was generated.
5.2 Conclusions
The model built in this study will help the industry to optimize adsorber design
and operating conditions to minimize the severe impact of RH during adsorption of VOCs
from gas streams, and will also reduce the number of pilot-scale tests required to optimize
the effect of process parameters and variables. The model results were encouraging,
especially because it is thermodynamically consistent and its main inputs were
independently determined adsorbate and adsorbent properties, adsorber geometry and
operating conditions. The work conducted here contributes to a better understanding of
the mechanism of the competing polar or non-polar VOC with water vapor molecules
during competitive adsorption.
The main conclusions from the VOC-water vapor competitive adsorption equilibria
study and modeling are as follows:
136
• Appreciable impact of RH on VOC adsorption on BAC can only be observed at RH
levels higher than 75% due to water vapor’s low affinity towards BAC adsorption
at RH below those levels.
• Polar VOCs were found to be highly susceptible to RH compared to non-polar
VOCs, owing to their low affinity towards BAC and high water-miscibility.
• The impact of RH on a VOC adsorption decreases with higher adsorption affinity
of the VOC towards BAC.
• In the case of water uptake during competitive adsorption with VOC on BAC, the
amount of water adsorbed increased with the pure VOC adsorption potential and
vice versa.
The main conclusions from the study and modeling of the transport processes
during competitive adsorption between VOC and water vapor are as follows:
• The changes to the adsorption breakthrough profiles of VOC during competitive
adsorption with water vapor on BAC follows the trend of adsorption affinity, with
low adsorption-affinity VOCs such as polar VOCs experiencing a higher reduction
in bed service time and thereby a faster movement of MTZ, compared to high
adsorption-affinity VOCs such as non-polar VOCs.
• Polar VOCs, which experienced a more severe impact of water vapor than the non-
polar VOCs during competitive adsorption, had a higher adsorber-bed
temperature increase. This is mainly due to the adsorbate(s) loading, heat of
adsorption and heat of dissolution (for polar VOCs in the VOC-water vapor
mixture).
137
The extent of the impact of RH on VOC adsorption on BAC is also highly sensitive
to the adsorption temperature and the inlet concentrations of the adsorbates in the VOC-
water vapor mixture. The model developed here was found to be sensitive towards
changes in adsorber bed temperature, inlet gas concentrations, and carrier gas RH
simultaneously, signifying its overall utility in optimizing the adsorber service lifetime.
The main conclusion from the sensitivity analysis is as follows:
• For a given inlet concentration of VOC and RH level, optimization of adsorber bed
temperature is critically important to maintain the balance between the effect of
temperature on carrier gas RH and its effect on the bed service time and VOC
adsorption capacity.
5.3 Recommendations for Future Work
This research investigated and developed a multicomponent competitive
adsorption model to predict the effect of RH on VOC adsorption in a fixed-bed adsorber.
Based on the obtained results and conclusions, the following recommendations can be
made for future research:
• Many VOC-laden gas streams contain mixtures of VOCs (polar and non-polar)
together-with water vapor, which compete for the available adsorption sites. The
model developed in this research could be extended further to account for more
than one VOC in a VOC-water vapor mixture.
• The model developed here considers the gas mixture to be ideal. Activity
coefficients models such as Wilson, UNIQUAC, therefore, can be used and applied
to the existing model to generate better results and account for non-ideality of a
mixture.

138
• Thermodynamically-consistent model such as VMC could be applied for predicting
multicomponent competitive adsorption equilibria, as it does not need any
extension, and the same model can be used for both VOC-VOC systems and VOC-
water vapor systems for any number of adsorbates in a mixture. It is
mathematically intensive, and needs to be revised for computer simulation.
• The VOC-water vapor competitive adsorption isotherm developed here using
Manes method can be applied to different adsorber configurations such as
fluidized bed, and moving bed. This could assist in selecting the best adsorber
configuration for a particular contaminant capture application.
• The competitive adsorption model built here could also be applied to adsorbents
other than AC such as molecular sieves, zeolites, etc., for any kind of single-VOC-
water vapor mixtures.
139
5.4 References
Tefera, D., Hashisho, Z., Philips, J., Anderson, J., & Nichols, M. (2014). Modeling
Competitive Adsorption of Mixtures of Volatile Organic Compounds in a Fixed-
Bed of Beaded Activated Carbon. Environ. Sci. Technol., 48, 5108-5117.
Tefera, D., Lashaki, M., Fayaz, M., Hashisho, Z., Philips, J., Anderson, J., & Nichols, M.
(2013). Two-Dimensional Modeling of Volatile Organic Compounds Adsorption
onto Beaded Activated Carbon. Environ. Sci. Technol., 47, 11700-11710.

140
WORKS CITED
Aktas, O., & Cecen, F. (2006). Effect of type of carbon activation on adsorption and its
reversibility. J. Chem. Technol. Biot., 81, 94-101.
Aktas, O., & Cecen, F. (2007). Competitive adsorption and desorption of a bi-solute
mixture: Effect of activated carbon type. Adsorption, 13, 159-169.
Alcaniz-Monge, J., Linares-Solano, A., & Rand, B. (2002). Mechanism of Adsorption of
Water in Carbon Micropores As Revealed by a Study of Activated Carbon Fibers.
J. Phys. Chem. B, 106, 3209-3216.
Alvarez, P., Garcia-Araya, J., Beltran, F., Masaa, F., & Medina, F. (2005). Ozonation of
activated carbons: Effect on the adsorption of selected phenolic compounds from
aqueous solutions. J. Colloid Interf. Sci., 283, 503-512.
Appel, W., LeVan, M., & Finn, J. (1998). Nonideal adsorption equilibria described by pure
component isotherms and virial mixture coefficients. Ind. Eng. Chem. Res., 37,
4774-4782.
Bansal, R., & Goyal, M. (2005). Activated Carbon Adsorption. Taylor & Francis Group.
Benjamin, M. (2009). New Conceptualization and Solution Approach for the Ideal
Adsorbed Solution Theory (IAST). Environ. Sci. Technol., 43, 2530-2536.
Bey, O., & Eigenberger, G. (2001). Gas flow and heat transfer through catalyst filled tubes.
Int. J. Therm. Sci., 40, 152-164.
Bruanuer, S., Emmett, P., & Teller, E. (1938). Adsorption of gases in multimolecular
layers. J. Am. Chem. Soc, 60, 309-319.
Butler, J., & Ockrent, C. (1930). Studies in Electrocapillarity. Part III. J. Phys. Chem., 34,
2841-2859.
Cal, M., Rood, M., & Larson, S. (1996). Removal of VOCs from humidified gas streams
using activated carbon cloth. Gas Sep. Purif., 10, 117-121.
Calvert, S., & Englund, H. (1984). Handbook of Air Pollution Technology. New York:
John Wiley & Sons, Inc.
Chahbani, M., & Tondeur, D. (2000). Mass transfer kinetics in pressure swing adsorption.
Sep. Purif. Technol., 20, 185-196.
141
Chen, J., Loo, L., & Wang, K. (2011). An Ideal Absorbed Solution Theory (IAST) Study of
Adsorption Equilibria of Binary Mixtures of Methane and Ethane on a Templated
Carbon. J. Chem. Eng. Data, 56, 1209-1212.
Chen, Y., Ritter, J., & Yang, R. (1990). Nonideal Adsorption from Multicomponent Gas
Mixtures at Elevated Pressures on a 5A Molecular Sieve. Chem. Eng. Sci., 45, 2877-
2894.
Chou, M., & Chiou, J. (1997). Modeling effects of moisture on adsorption capacity of
activated carbon for VOCs. J. Environ. Eng., 123, 437-443.
Chuang, C., Chiang, P., & Chang, E. (2003). Modeling VOCs adsorption onto activated
carbon. Chemosphere, 53, 17-27.
Cohen, Y., & Metzner, A. B. (1981). Wall effects in laminar flow of fluids through packed
beds. AIChE J., 27, 705-715.
Coker, R., Gomez, C., & Schunk, G. (2015). Multi-Dimensional Adsorption Model of
CO2/H2O Sorbent Bed. COMSOL Conference. Boston: COMSOL.
Dabrowski, A., Podkoscielny, P., Hubicki, Z., & Barczak, M. (2005). Adsorption of
phenolic compounds by activated carbon - A critical review. Chemosphere, 58,
1049-1070.
Dantas, T., Luna, F., Silva Jr., I., Torres, A., de Azevedo, D., Rodrigues, A., & Moreira, R.
(2011). Modeling of the fixed-bed adsorption of carbon dioxide and a carbon
dioxide-nitrogen mixture on zeolite 13X. Braz. J. Chem. Eng., 28, 533-544.
Do, D. (1998). Adsorption Analysis: Equilibria and Kinetics. London: Imperial College
Press.
Do, D., & Do, H. (2000). A model for water adsorption in activated carbon. Carbon, 38,
767-773.
Do, D., & Rice, R. (1987). On the relative importance of pore and surface diffusion in non-
equilibrium adsorption rate processes. Chem. Eng. Sci., 42, 2269-2284.
Do, D., Junpirom, S., & Do, H. (2009). A new adsorption–desorption model for water
adsorption in activated carbon. Carbon, 47, 1466-1473.
Dubinin, M., & Radushkevich, L. (1947). The equation of the characteristic curve of the
activated charcoal. Proc. Acad. Sci. USSR Phys. Chem. Sec., 55, 331-337.
Dubinin, M., & Serpinsky, V. (1981). Isotherm equation for water vapor adsorption by
microporous carbonaceous adsorbents. Carbon, 19, 402-403.
142
Efremenko, I., & Sheintuch, M. (2006). Predicting solute adsorption on activated carbon:
phenol. Langmuir, 22, 3614-3621.
Environment and Climate Change Canada . (2016). Volatile Organic Compounds in
Consumer and Commercial Products. Retrieved from http://www.ec.gc.ca/cov-
voc/Default.asp?lang=En&n=BEE9D2C5-1
Environment and Climate Change Canada. (2016). Volatile Organic Compound
Emissions. Retrieved from https://www.ec.gc.ca/indicateurs-
indicators/default.asp?lang=en&n=64B9E95D-1
Environment and Climate Change Canada. (2016). Volatile organic compounds that
participate in atmospheric photochemical reactions. Retrieved from
http://www.ec.gc.ca/toxiques-toxics/Default.asp?lang=En&n=98E80CC6-
1&xml=075320D0-CF6E-4261-890E-90725A29E3C4
Fletcher, A., Kennedy, M., Zhao, X., Bell, J., & Thomas, K. (2006). Adsorption of Organic
Vapour Pollutants on Activated Carbon. Recent Advances in Adsorption Processes
for Environmental Protection and Security (pp. 29-54). Kiev: NATO Science for
Peace and Security.
Foo, K., & Hameed, B. (2010). Insights into the modeling of adsorption isotherm systems.
Chem. Eng. J., 156, 2-10.
Fournel, L., Mocho, P., Brown, R., & Le Cloirec, P. (2010). Modeling breakthrough curves
of volatile organic compounds on activated carbon fibers. Adsorption, 16, 147-153.
Freundlich, H. (1906). Over the adsorption in solution. J. Phys. Chem., 57, 385-471.
Fujisawa, M., Maeda, M., Takagi, S., & Kimura, T. (2002). Enthalpies of dilution of mono-
, di- and poly-alcohols in dilute aqueous solutions at 298.15 K. J. Therm. Anal.
Calorim., 69, 841-848.
Furmaniak, S., Gauden, P., Terzyk, A., & Rychlicki, G. (2008). Water adsorption on
carbons — Critical review of the most popular analytical approaches. Adv. Colloid
Interface Sci., 137, 82-143.
Giraudet, S., Pre, P., Tezel, H., & Le Cloirec, P. (2006). Estimation of adsorption energies
using the physical characteristics of activated carbons and the molecular
properties of volatile organic compounds. Carbon, 44, 2413-2421.
143
Gothard, F., Clobanu, M., Breban, D., & Bucur, C. (1976). Predicting the Parameters in
the Wilson Equations for Activity Coefficients in Binary Hydrocarbon Systems.
Ind. Eng. Chem. Process Des. Dev., 15, 333-337.
Grant, R., & Manes, M. (1966). Adsorption of Binary Hydrocarbon Gas Mixtures on
Activated Carbon. Ind. Eng. Chem. Fund., 5, 490-498.
Gregg, S., & Sing, K. (1982). Adsorption, Surface Area and Porosity. New York: Academic
Press.
Guenther, A. (1995). A global model of natural volatile organic compound emissions. J.
Geophy. Res., 100(D5), 8873-8892.
Gun’ko, V., Turov, V., & Kozynchenko, O. (2008). Characteristics of adsorption phase
with water/organic mixtures at a surface of activated carbons possessing
intraparticle and textural porosities. App. Surf. Sci., 25, 3220-3231.
Guo, P. (2012). Dependency of tortuosity and permeability of porous media on directional
distribution of pore voids. Transp. Porous Media, 95, 285-303.
Gupta, V., & Verma, N. (2002). Removal of volatile organic compounds by cryogenic
condensation followed by adsorption. Chem. Eng. Sci., 57, 2679-2696.
Haghseresht, F., & Lu, G. (1998). Adsorption characteristics of phenolic compounds onto
coal-reject-derived adsorbents. Energy Fuels, 12, 1100-1107.
Hashisho, Z., Emamipour, H., Rood, M., Hay, K., Kim, B., & Thurston, D. (2008).
Concomitant adsorption and desorption of organic vapor in dry and humid air
streams using microwave and direct electrothermal swing adsorption. Environ.
Sci. Technol., 42, 9317-9322.
Hashisho, Z., Rood, M., & Botich, L. (2005). Microwave-swing adsorption to capture and
recover vapors from air streams with activated carbon fiber cloth. Environ. Sci.
Technol., 39, 6851-6859.
Haynes, W. (2017). CRC Handbook of Chemistry and Physics (97th ed.). Boca Raton,
Florida: CRC Press/Taylor & Francis.
Hefti, M., Marx, D., Joss, L., & Mazzotti, M. (2015). Adsorption equilibrium of binary
mixtures of carbon dioxide and nitrogen on zeolites ZSM-5 and 13X. Microporous
Mesoporous Mater., 215, 215-228.
144
Heinonen, J., Landa, H., Sainio, T., & Seidel-Morgenstern, A. (2012). Use of Adsorbed
Solution theory to model competitive and co-operative sorption on elastic ion
exchange resins. Sep. Purif. Technol., 95, 235-247.
Huasheng, G., Dahui, W., Yunchun, Y., & Tian'en, T. (2002). Binary Adsorption
Equilibrium of Benzene-Water Vapor Mixtures on Activated Carbon. Chinese J.
Chem. Eng., 10, 367-370.
Huggahalli, M., & Fair, J. (1996). Prediction of Equilibrium Adsorption of Water onto
Activated Carbon. Ind. Eng. Chem. Res., 35, 2071-2074.
Hui, C., Chen, B., & McKay, G. (2003). Pore-surface diffusion model for batch adsorption
processes. Langmuir, 19, 4188-4196.
Hung, C., & Bai, H. (2008). Adsorption behaviors of organic vapors using mesoporous
silica particles made by evaporation induced self-assembly method. Chem. Eng.
Sci., 63, 1997-2005.
Hung, H., & Lin, T. (2007). Prediction of the Adsorption Capacity for Volatile Organic
Compounds onto Activated Carbons by the Dubinin–Radushkevich–Langmuir
Model. J. Air & Waste Manage. Assoc., 57, 497-506.
Hutton, A. G. (2001). Quality and trust in industrial computational fluid dynamics.
Houille Blanche, 3-4, 25-28.
Ilic, M., Flockerzi, D., & Seidel-Morgenstern, A. (2010). A thermodynamically consistent
explicit competitive adsorption isotherm model based on second-order single
component behaviour. J. Chromatogr. A, 1217, 2132-2137.
Jain, J., & Snoeyink, V. (1973). Adsorption from bisolute systems on active carbon. J.
Water Pollut. Control Fed., 45, 2463-2479.
Jarvie, M. E., Hand, D. W., Bhuvendralingam, S., Crittenden, J. C., & Hokanson, D. R.
(2005). Simulating the performance of fixed-bed granular activated carbon
adsorbers: Removal of synthetic organic chemicals in the presence of background
organic matter. Water Res., 39, 2407-2421.
Joly, A., & Perrard, A. (2009). Linear driving force models for dynamic adsorption of
volatile organic compound traces by porous adsorbent beds. Math. Comp. Sim.,
79, 3492-3499.
Kampa, M., & Castanas, E. (2008). Human health effects of air pollution. Environ. Pollut.,
151, 362-367.

145
Kapoor, A., Ritter, J., & Yang, R. (1989). On the Dubinin-Radushkevich Equation for
Adsorption in Microporous Solids in the Henry's Law Region. Langmuir, 5, 1118-
1121.
Kawasaki, N., Kinoshita, H., Oue, T., Nakamura, T., & Tanada, S. (2004). Study on
adsorption kinetic of aromatic hydrocarbons onto activated carbon in gaseous flow
method. J. Colloid Interface Sci., 275, 40-43.
Keener, T., & Zhou, D. (1990). Prediction of Activated Carbon Adsorption Performance
Under High Relative Humidity Conditions. Environ. Progr., 9, 40-46.
Khan, F., & Ghoshal, A. (2000). Removal of volatile organic compounds from polluted
air. J. Loss Prev. Process Ind., 13, 527-545.
Kim, B. (2011). VOC emissions from automotive painting and their control: A review.
Environ. Eng. Res., 16, 1-9.
Kim, P., & Agnihotri, S. (2008). Application of water–activated carbon isotherm models
to water adsorption isotherms of single-walled carbon nanotubes. J. Colloid
Interface Sci., 325, 64-73.
Kister, A., & Waldman, D. (1958). Heat of mixing of acetone with water and with
methanol. J. Phys. Chem., 62, 245-246.
Kuwagaki, H., Meguro, T., Tatami, J., Komeya, K., & Tamura, K. (2003). An improvement
of thermal conduction of activated carbon by adding graphite. J. Mater. Sci., 38,
3279-3284.
Kwapinski, W. (2009). Combined wall and thermal effects during nonisothermal packed
bed adsorption. Chem. Eng. J., 152, 271-276.
Lama, R., & Lu, B.-Y. (1965). Excess Thermodynamic Properties of Aqueous Alcohol
Solutions. J. Chem. Eng. Data, 10, 216-219.
Landa, H., & Flockerzi, D. (2013). A Method for Efficiently Solving the IAST Equations
with an Application to Adsorber Dynamics. AIChE J., 59, 1263-1277.
Langmuir, I. (1916). The constitution and fundamental properties of solids and liquids. J.
Am. Chem. Soc., 38, 2221-2295.
Lapkin, A., Joyce, L., & Crittenden, B. (2004). Framework for evaluating the “Greenness”
of chemical processes: Case studies for a novel VOC recovery technology. Environ.
Sci. Technol., 38, 5815-5823.
146
Lashaki, M., Atkinson, J., Hashisho, Z., Phillips, J., Anderson, J., & Nichols, M. (2016a).
The role of beaded activated carbon’s surface oxygen groups onirreversible
adsorption of organic vapors. J. Hazard. Mater., 317, 284-294.
Lashaki, M., Atkinson, J., Hashisho, Z., Phillips, J., Anderson, J., Nichols, M., & Misovski,
T. (2016b). Effect of desorption purge gas oxygen impurity on irreversible
adsorption of organic vapors. Carbon, 99, 310-317.
Lashaki, M., Fayaz, M., Niknaddaf, S., & Hashisho, Z. (2012b). Effect of the adsorbate
kinetic diameter on the accuracy of the Dubinin-Radushkevich equation for
modeling adsorption of organic vapors on activated carbon. J. Hazard. Mater.,
241-242, 154-163.
Lashaki, M., Fayaz, M., Wang, H., Hashisho, Z., Philips, J., Anderson, J., & Nichols, M.
(2012a). Effect of Adsorption and Regeneration Temperature on Irreversible
Adsorption of Organic Vapors on Beaded Activated Carbon. Environ. Sci. Technol.,
46, 4083-4090.
Lee, J., Choi, D., Kwak, D., & Jung, H. (2005). Adsorption Dynamics of Water Vapor on
Activated Carbon. Adsorption, 11, 437-441.
Leethochawalit, M., Bustard, M., Wright, P., & Meeyoo, V. (2001). Novel vapor-phase
biofiltration and catalytic combustion of volatile organic compounds. Ind. Eng.
Chem. Res., 40(23), 5334-5341.
Leslie, G. (2000). Health risks from indoor air pollutants: Public alarm and toxicological
reality. Indoor Built Environ., 9, 5-16.
Li, C., Xuemin, H., Fangning, F., & Fengli, J. (2010). Effect of relative humidity on
adsorption capacity of organic vapors on activated carbon and prediction by the
modified D-R equation. International Conference on Digital Manufacturing &
Automation , (pp. 608-611). Changha, Hunan.
Linders, M., van den Broeke, L., Kapteijn, F., & Moulijn, J. A. (2001). Binary Adsorption
Equilibrium of Organics and Water on Activated Carbon. AIChE J., 47, 1885-1892.
Lodewyckx, P., & Vansant, E. (1999). Water Isotherms of Activated Carbons with Small
Amounts of Surface Oxygen. Carbon, 37, 1647-1649.
Logan, D. (1997). Estimating physical properties for control equipment design. Environ.
Prog., 16, 237-242.

147
Manes, M. (1984). Estimation of the effects of humidity on the adsorption onto activated
carbon of the vapors of water-immiscible organic liquids. Fundamentals of
Adsorption (pp. 335-344). New York: Engineering Foundation.
Mangano, E., Friedrich, D., & Brandani, S. (2015). Robust Algorithms for the Solution of
the Ideal Adsorbed Solution Theory Equations. AIChE J., 61, 981-991.
Marivoet, J., Teodoroiu, P., & Wajc, S. (1974). Porosity, velocity and temperature profiles
in cylindrical packed beds. Chem. Eng. Sci., 29, 1836-1840.
Murillo, R., García, T., Aylón, E., Callén, M., Navarro, M., López, J., & Mastral, A. (2004).
Adsorption of Phenanthrene on Activated Carbons: Breakthrough Curve
Modeling. Carbon, 42, 2009-2017.
Myers, A. (1983). Activity Coefficients of Mixtures Adsorbed on Heterogeneous Surfaces.
AIChE J., 29, 691-693.
Myers, A. (2005). Prediction of Adsorption of Nonideal Mixtures in Nanoporous
Materials. Adsorption, 11, 37-42.
Myers, A., & Prausnitz, J. (1965). Thermodynamics of Mixed-Gas Adsorption. AIChE J.,
11, 121-126.
Myers, A., & Valenzuela, D. (1986). Computer Algorithm and Graphical Method for
Calculating Adsorption Equilibria of Gas Mixtures. J. Chem. Eng. Jap., 19, 392-
395.
Nastaj, J., Witkiewicz, K., & Chybowska, M. (2016). Modeling of multicomponent and
multitemperature adsorption equilibria of water vapor and organic compounds on
activated carbons. Ads. Sci. Technol., 34, 144-175.
National Toxicology Program. (2016). 14th Report on Carcinogens. Retrieved from
https://ntp.niehs.nih.gov/pubhealth/roc/index-1.html
Nemec, D., & Levec, J. (2005). Flowthrough packed bed reactors: 2. Two-phase
concurrent downflow. Chem. Eng. Sci., 60, 6958-6970.
Nield, D., & Bejan, A. (2006). Convection in Porous Media. New York: Springer.
Oberkampf, W., & Trucano, T. (2002). Verification and validation in computational fluid
dynamics. Prog. Aerospace Sci., 38, 209-272.
O'Brien, J., & Myers, A. (1985). Rapid Calculations of Multicomponent Adsorption
Equilibria from Pure Isotherm Data. Ind. Eng. Chem. Process Des. Dev., 24, 1188-
1191.

148
Okazaki, M., Tamon, H., & Toei, R. (1978). Prediction of binary adsorption equilibria of
solvent and water vapor on activated carbon. J. Chem. Eng. Japan, 11, 209-215.
Oliemans, R. (2000). ERCOFTAC’s role in promoting computational fluid dynamics.
Houille Blanche, 7-8, 43-46.
Papasavva, S., Kia, S., Claya, J., & Gunther, R. (2001). Characterization of automotive
paints: An environmental impact analysis. Prog. Org. Coat., 43, 193-206.
Pelekani, C., & Snoeyink, V. (1999). Competitive adsorption in natural water: role of
activated carbon pore size. Water Res., 33, 1209-1219.
Piccot, S. D., Watson, J. J., & Jones, J. W. (1992). A global inventory of volatile organic
compound emissions from anthropogenic sources. J. Geophy. Res., 97(D9), 9897-
9912.
Popescu, M., Joly, J. P., Carre, J., & Danatoiu, C. (2003). Dynamical adsorption and
temperature-programmed desorption of VOCs (toluene, butyl acetate and butanol)
on activated carbons. Carbon, 41, 739-748.
Pramar, G., & Rao, N. (2009). Emerging control technologies for volatile organic
compounds. Cri. Rev. Environ. Sci. Technol., 39, 41-78.
Puértolas, B., López, M., Navarro, M., López, J., Murillo, R., García, T., & Mastral, A.
(2010). Modelling the breakthrough curves obtained from the adsorption of
propene onto microporous inorganic solids. Ads. Sci Technol., 28, 761-775.
Qi, N., & LeVan, M. (2005a). Coadsorption of Organic Compounds and Water Vapor on
BPL Activated Carbon. 5. Methyl Ethyl Ketone, Methyl Isobutyl Ketone, Toluene,
and Modeling. Ind. Eng. Chem. Res., 44, 3733-3741.
Qi, N., & LeVan, M. (2005b). Adsorption equilibrium modeling for water on activated
carbons. Carbon, 43, 2258-2263.
Qi, N., Appel, W., & LeVan, M. (2006). Adsorption Dynamics of Organic Compounds and
Water Vapor in Activated Carbon Beds. Ind. Eng. Chem. Res., 45, 2303-2314.
Qi, S., Hay, K., & Cal, M. (2000b). Predicting humidity effect on adsorption capacity of
activated carbon for water-immiscible organic vapors. Adv. Environ. Res., 4, 357-
362.
Qi, S., Hay, K., & Rood, M. (1998). Isotherm Equation for Water Vapor Adsorption onto
Activated Carbon. J. Environ. Eng., 124, 1130-1134.
149
Qi, S., Hay, K., Rood, M., & Cal, M. (2000a). Equilibrium and Heat of Adsorption for
Water Vapor and Activated Carbon. J. Environ. Eng., 126, 267-271.
Ramos, M., Bonelli, P., Cukierman, A., Ribeiro Carrott, M., & Carrott, P. (2010).
Adsorption of volatile organic compounds onto activated carbon cloths derived
from a novel regenerated cellulosic precursor. J. Hazard. Mater., 177, 175-182.
Richter, E., Schutz, W., & Myers, A. (1989). Effect of Adsorption Equation on Prediction
of Multicomponent Adsorption Equilibria by the Ideal Adsorbed Solution Theory.
Chem. Eng. Sci., 44, 1609-1616.
Russell, B., & LeVan, M. (1997). Coadsorption of Organic Compounds and Water Vapor
on BPL Activated Carbon. 3. Ethane, Propane, and Mixing Rules. Ind. Eng. Chem.
Res., 36, 2380-2389.
Sakuth, M., Meyer, J., & Gmehling, J. (1998). Measurement and prediction of binary
adsorption equilibria of vapors on dealuminated Y-zeolites (DAY). Chem. Eng.
Process, 37, 267-277.
Salame, I., & Bandosz, T. (1999). Experimental Study of Water Adsorption on Activated
Carbons. Langmuir, 15, 587-593.
Schlüter, S., Hennig, T., Schieferstein, E., & Meller, K. (2016). Simulator for Automotive
Evaporative Emissions Restraint Systems. COMSOL Conference. Munich:
COMSOL.
Shaverdi, G. (2012). Developing a Model for Mass Transfer in Adsorption Packed-bed
Filters . Montreal: Concordia University.
Shi, Y., Lee, Y., & Kim, A. (2012). Knudsen Diffusion Through Cylindrical Tubes of
Varying Radii: Theory and Monte Carlo Simulations. Transp. Porous Media, 93,
517-541.
Shonnard, D., & Hiew, D. (2000). Comparative environmental assessments of VOC
recovery and recycle design alternatives for a gaseous waste stream. Environ. Sci.
Technol., 34, 5222-5228.
Simon, C., Smit, B., & Haranczyk, M. (2016). pyIAST: Ideal adsorbed solution theory
(IAST) Python package. Comput. Phys. Commun., 200, 364-380.
Siperstein, F., & Myers, A. (2001). Mixed-Gas Adsorption. AIChE J., 47, 1141-1159.
Sircar, S., & Hufton, J. R. (2000). Why does the linear driving force model for adsorption
kinetics work? Adsorption, 6, 137-147.
150
Slasli, A., Jorge, M., Stoeckli, F., & Seaton, N. (2003). Water adsorption by activated
carbons in relation to their microporous structure. Carbon, 41, 479-486.
Sontheimer, H., Crittenden, J., & Summers, S. (1988). Activated carbon for water
treatment (2nd ed.). Karlsruhe: DVGW-Forschungsstelle, Engler-Bunte-Institut,
Universität Karlsruhe.
Stoeckli, F. (2002). Water adsorption in activated carbons of various degrees of oxidation
described by the Dubinin equation. Carbon, 40, 969-971.
Stoeckli, F., Jakubov, T., & Lavanchy, A. (1994). Water Adsorption in Active Carbons
described by the Dubinin-Astakhov Equation. J. Chem. Soc. Faraday. Trans., 90,
783-786.
Sullivan, P., Stone, B., Hashisho, Z., & Rood, M. (2007). Water adsorption with hysteresis
effect onto microporous activated carbon fabrics. Adsorption, 13, 173-189.
Suwanayuen, S., & Danner, R. (1980). A gas adsorption isotherm equation based on
vacancy solution theory. AIChE J., 26, 68-76.
Suzuki, M. (1990). Adsorption Engineering. Amsterdam: Elsevier Science Publishing
Company, Inc.
Talu, O., & Meunier, F. (1996). Adsorption of Associating Molecules in Micropores and
Application to Water on Carbon. AIChE J., 42, 809-819.
Talu, O., & Zwiebel, I. (1986). Multicomponent Adsorption Equilibria of Nonideal
Mixtures. AIChE J., 32, 1263-1276.
Talu, O., & Zwiebel, I. (1987). Spreading Pressure Dependent Equation for Adsorbate
Phase Acitivity Coefficients. React. Polym., 5, 81-91.
Talu, O., Li, J., & Myers, A. (1995). Activity Coefficients of Adsorbed Mixtures.
Adsorption, 1, 103-112.
Tao, W., Yang, T., Chang, Y., Chang, L., & Chung, T. (2004). Effect of Moisture on the
Adsorption of Volatile Organic Compounds by Zeolite 13X. J. Environ. Eng., 130,
1210-1216.
Taqvi, S., & LeVan, M. (1997). Virial Description of Two-Component Adsorption on
Homogeneous and Heterogeneous Surfaces. Ind. Eng. Chem. Res., 36, 2197-2206.
Taqvi, S., Appel, W., & LeVan, M. (1999). Coadsorption of Organic Compounds and Water
Vapor on BPL Activated Carbon. 4. Methanol, Ethanol, Propanol, Butanol, and
Modeling. Ind. Eng. Chem. Res., 38, 240-250.

151
Tefera, D., Hashisho, Z., Philips, J., Anderson, J., & Nichols, M. (2014). Modeling
Competitive Adsorption of Mixtures of Volatile Organic Compounds in a Fixed-
Bed of Beaded Activated Carbon. Environ. Sci. Technol., 48, 5108-5117.
Tefera, D., Lashaki, M., Fayaz, M., Hashisho, Z., Philips, J., Anderson, J., & Nichols, M.
(2013). Two-Dimensional Modeling of Volatile Organic Compounds Adsorption
onto Beaded Activated Carbon. Environ. Sci. Technol., 47, 11700-11710.
The European Union. (2004). Directive 2004/42/CE of the European Parliament and
the Council. Retrieved from http://eur-
lex.europa.eu/LexUriServ/LexUriServ.do?uri=OJ:L:2004:143:0087:0096:EN:P
DF
Thomas, W., & Crittenden, B. (1998). Adsorption Technology and Design. Boston:
Butterworth Publishers.
Tien, C. (2013). Adsorption Calculations and Modelling. Butterworth-Heinemann.
Underhill, D., & Kawar, K. (1999). Effect of Relative Humidity on the Adsorption of
Selected Water-Miscible Organic Vapors by Activated Carbon. AIHA J., 60, 730-
736.
United States Environmental Protection Agency. (2016). Volatile Organic Compounds'
Impact on Indoor Air Quality. Retrieved from https://www.epa.gov/indoor-air-
quality-iaq/volatile-organic-compounds-impact-indoor-air-quality#Sources
United States Environmental Protection Agency. (2017). Technical Overview of Volatile
Organic Compounds. Retrieved from https://www.epa.gov/indoor-air-quality-
iaq/technical-overview-volatile-organic-compounds#5
Vahabi, M., Mehdizadeh, E., Kabganian, M., & Barazandeh, F. (2011). Experimental
identification of IPMC actuator parameters through incorporation of linear and
nonlinear least squares methods. Sens. Actuators A Phys., 168, 140-148.
Van Ness, H. (1969). Adsorption of gases on solids: Review of the role of thermodynamics.
Ind. Eng. Chem. Fundam., 8, 464-473.
Wang, H., Lashaki, M., Fayaz, M., Hashisho, Z., Phillips, J., Anderson, J., & Nichols, M.
(2012). Adsorption and Desorption of Mixtures of Organic Vapors on Beaded
Activated Carbon. Environ. Sci. Technol., 46, 8341-8350.
Weber, W., & Smith, E. (1987). Simulation and design models for adsorption processes.
Environ. Sci Technol., 21, 1040-1050.

152
WHO. (1989). Indoor air quality: organic pollutants. Report on a WHO meeting. EURO
Rep Stud, 111, 1-70.
Willmott, C., & Matsuura, K. (2005). Advantages of the mean absolute error (MAE) over
the root mean square error (RMSE) in assessing average model performance. Clim.
Res., 30, 79-82.
Wood, G. (2000). Review of Models for Adsorption of Single Vapors, Mixtures of Vapors,
and Vapors at High Humidities on Activated Carbon for Applications including
Predicting Service Lives of Organic Vapor Respirator Cartridges. Washington,
D.C.: Los Alamos National Laboratory.
Xu, Z., Cai, J., & Pan, B. (2013). Mathematically modeling fixed-bed adsorption in
aqueous systems. J. Zhejiang Univ. Sci. A, 16, 147-153.
Yang, R. (1987). Gas Separation by Adsorption Processes. Stoneham, Massachusetts:
Butterworth Publishers.
Yang, R. (2003). Adsorbents: Fundamentals and Application. New Jersey: John Wiley &
Sons, Inc.
Ye, X., Qi, N., & LeVan, M. (2003). Prediction of adsorption equilibrium using a modified
D-R equation: organic-water vapor mixtures on BPL carbon. Carbon, 41, 2519-
2525.
Yun, J., Park, H., & Moon, H. (1996). Multicomponent Adsorption Calculations Based on
Adsorbed Solution Theory. Korean J. Chem. Eng., 13, 246-254.

153
APPENDIX A MATLAB CODE FOR MANES METHOD
154
%%
%Imranul Islam Laskar
%Content first created: 1 July 2016
%% Declaring global variables for the program
tic
global R T P C
R = 8.314; %Gas constant in J/K/mol
T = 298.15; %Adsorption temperature in Kelvin
P = 101.325; %Adsorption pressure in kPa, 101.325 kPa = 1 atm
C = R*T;
%% **Modified Dubinin-Raduskevich (MD-R) Curve Fitting for 2- Propanol**
Psv = 5.866; %Saturated pressure of 2- Propanol in kPa at 25degC and P (From Sigma
Aldrich)
MWv = 60.095; %Molecular weight of 2- Propanol in g/mol (HCP)
Dv = 0.772; %Liquid Density of 2- Propanol in g/cc at T and P (From Sigma Aldrich)
MVv = MWv/Dv; %Molar volume of 2- Propanol at T and P
erpv = [0.00 0.01 0.02 0.03 0.04 0.05 0.10 0.20 0.30 0.40 0.50 0.60 0.70...
0.80 0.90]; %p/ps, relative pressure
eqsv = [0 0.231687679 0.284011059 0.313108692 0.329777718 0.340868721...
0.3635075 0.376392517 0.38177494 0.385461082 0.389114571...
0.391626358 0.393583603 0.395638695 0.397791595];
%experimental maximum 2- Propanol adsorbed per gram of adsorbent,g/g
calcqsv = @(c,erpv) (1-exp(-(c(1).*erpv))).*(c(2).*(exp(-(((C/c(3)).^2)...
.*((log(erpv)).^2)))))+(exp(-(c(1).*erpv))).*(c(4).*erpv);
%calculated maximum 2- Propanol adsorbed per gram of adsorbent,g/g
c0 = [10,0.55,2000,0.2]; %Initial guesses of D-R parameters, c(1),c(2),c(3),c(4)
c = lsqcurvefit(calcqsv,c0,erpv,eqsv); %MD-R parameters optimization
Z=c(2).*(0.775./0.785);
155
%% **Qi-Hay-Rood Water Isotherm Curve Fitting**
Psw = 3.17; %Saturated pressure of Water in kPa at T and P (From HCP)
MWw = 18.015; %Molecular weight of Water in g/mol (From HCP)
Dw = 0.90; %Solid Density of Water in g/cc at T and P (From HCP)
MVw = MWw/Dw; %Molar volume of Water at T and P
erpw = [0.0006 0.0489 0.1010 0.1494 0.1999 0.2502 0.2995 0.3499 0.3992...
0.4491 0.4990 0.5488 0.5990 0.6497 0.7007 0.7497 0.7998 0.8493...
0.8993]; %p/ps, relative pressure
eqsw = [0.0000 0.0003 0.0006 0.0013 0.0021 0.0028 0.0037 0.0052 0.0074...
0.0113 0.0164 0.0247 0.0618 0.1516 0.2963 0.4135 0.4324 0.4384...
0.4425];
%experimental maximum water adsorbed per gram of adsorbent,g/g
calcqsw = @(k,erpw) (k(1)./(1 + exp(k(2).*(((k(3)./Psw)-erpw)))));
%calculated maximum water adsorbed per gram of adsorbent,g/g
k0 = [0.3,15,1]; %Initial guesses of Q-H-R parameters, c(1),c(2), and c(3)
k = lsqcurvefit(calcqsw,k0,erpw,eqsw); %Q-H-R parameters optimization
%% **Competitive adsorption of carrier gas humidity with 2- Propanol, Polanyi-based
model**
i=1;
j=1;
for rpv = 0:0.0006:0.012 %reduced iterations
for rpw = 0.95 %reduced iterations
T1=298.15;
B = R*T1;
qv = (1-exp(-(c(1).*rpv))).*(Z.*(exp(-(((B/c(3)).^2)...
.*((log(rpv)).^2)))))+(exp(-(c(1).*rpv))).*(c(4).*rpv);
Vv = qv./Dv;
156
qw = (k(1)./(1 + exp(k(2).*(((k(3)./3)-rpw)))));
Vw = qw./Dw;
if (rpv==0.0000 & rpw==0.0000)
Qv(i,j) = 0;
Qw(i,j) = 0;
plot3(rpv,rpw,Qv(i,j),'mo',rpv,rpw,Qw(i,j),'bo')
xlabel('Relative vapor pressure of 2- Propanol')
ylabel('Relative vapor pressure of Water')
zlabel('Amount Adsorbed,(g/g)')
legend('2- Propanol Loading','Water Loading')
j=j+1;
grid on
grid minor
hold on
continue
elseif (rpv==0.0000 & (Vw>Vv))
Qv(i,j) = 0;
Qw(i,j) = qw;
plot3(rpv,rpw,Qv(i,j),'mo',rpv,rpw,Qw(i,j),'bo')
grid on
grid minor
hold on
j=j+1;
continue
elseif ((Vv>Vw))
Qw(i,j) = 0;
Qv(i,j) = qv;
plot3(rpv,rpw,Qv(i,j),'mo',rpv,rpw,Qw(i,j),'bo')
grid on
grid minor
hold on
157
j=j+1;
continue
elseif ((Vw>Vv))
for g2 = rpv:-0.000001:0.0000001
qv1 = (1-exp(-(c(1).*g2))).*(Z.*(exp(-(((C/c(3)).^2)...
.*((log(g2)).^2)))))+(exp(-(c(1).*g2))).*(c(4).*g2);
Vv1 = qv1./Dv;
Av = C.*(log(1./g2));
J1 = Av./MVv;
rpw1 = (k(3)./Psw)-((1./k(2)).*(log((k(1)./Vv1)-1)));
Aw = C.*(log(1./rpw1));
J2 = Aw./MVw;
J3 = (C./MVw).*(log(rpw));
J = J1-J2-J3;
J4 = ((J.*MVv)./C);
J5 = exp(J4);
g3 = (1./J5);
Qv(i,j) = qv1;
Qw(i,j) = (Dw.*(Vw-Vv1));
if ((g3-rpv)<=0.00000001)
break
else continue
end
end
plot3(rpv,rpw,Qv(i,j),'k*',rpv,rpw,Qw(i,j),'y*')
grid on
grid minor
hold on
158
j=j+1;
continue
end
end
i=i+1;
end
toc


