Embed Size (px)
Citation preview
Equity story of
FORTUM – For a cleaner worldInvestor / Analyst material
June 2021
Disclaimer
This presentation does not constitute an invitation to underwrite,subscribe for, or otherwise acquire or dispose of any Fortum shares.
Past performance is no guide to future performance,and persons needing advice should consult an independent financial adviser.
Any references to the future represent the management’s current best understanding.However the final outcome may differ from them.
2
Fortum in brief 4 – 12
Fortum’s strategy 13 – 21
Energy market transition 22 – 26
Interim report Q1 2021 27 – 44
Appendices 45
European and Nordic power markets 46 – 55
Fortum’s Nordic power generation in detail 56
Fortum’s history 57
Historical achieved prices 58
Dividend 59
IR contact 60
3
Content
India
Power generation assets
4
Fortum in brief
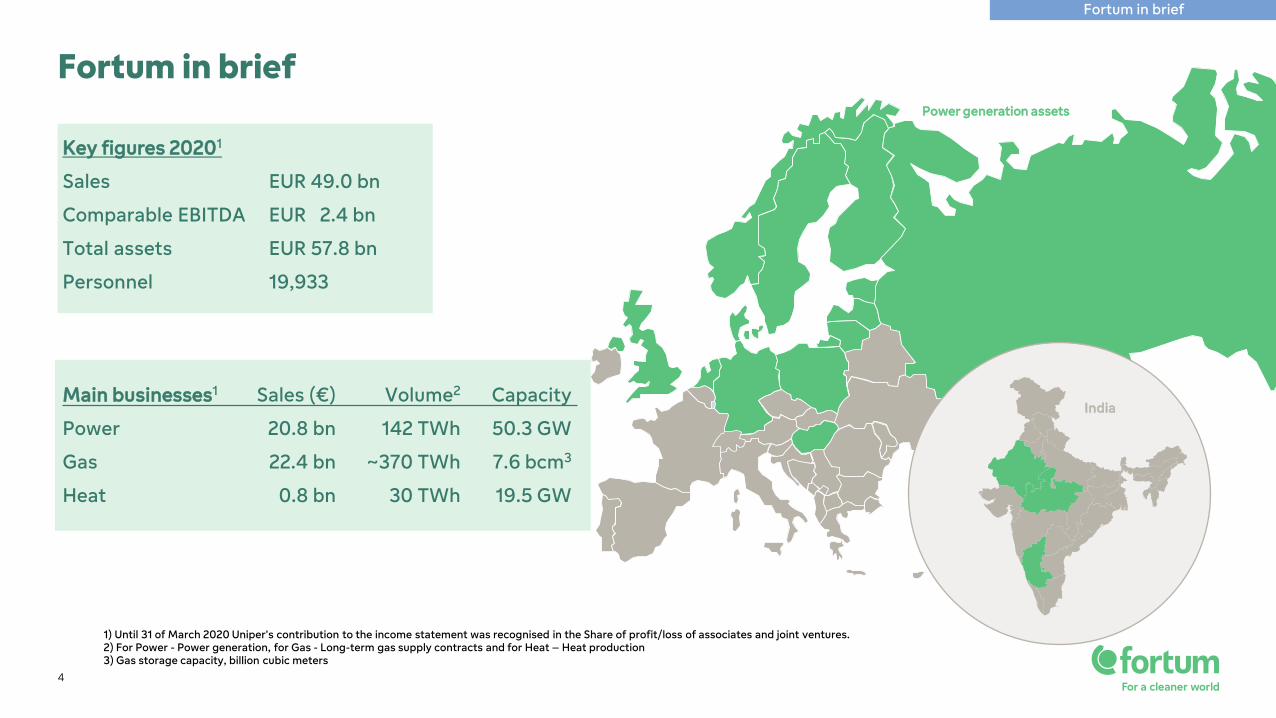
1) Until 31 of March 2020 Uniper's contribution to the income statement was recognised in the Share of profit/loss of associates and joint ventures.2) For Power - Power generation, for Gas - Long-term gas supply contracts and for Heat – Heat production 3) Gas storage capacity, billion cubic meters
Fortum in brief
Key figures 20201
Sales EUR 49.0 bn
Comparable EBITDA EUR 2.4 bn
Total assets EUR 57.8 bn
Personnel 19,933
Main businesses1
Power
Gas
Heat
Volume2
142 TWh
~370 TWh
30 TWh
Capacity
50.3 GW
7.6 bcm3
19.5 GW
Sales (€)
20.8 bn
22.4 bn
0.8 bn
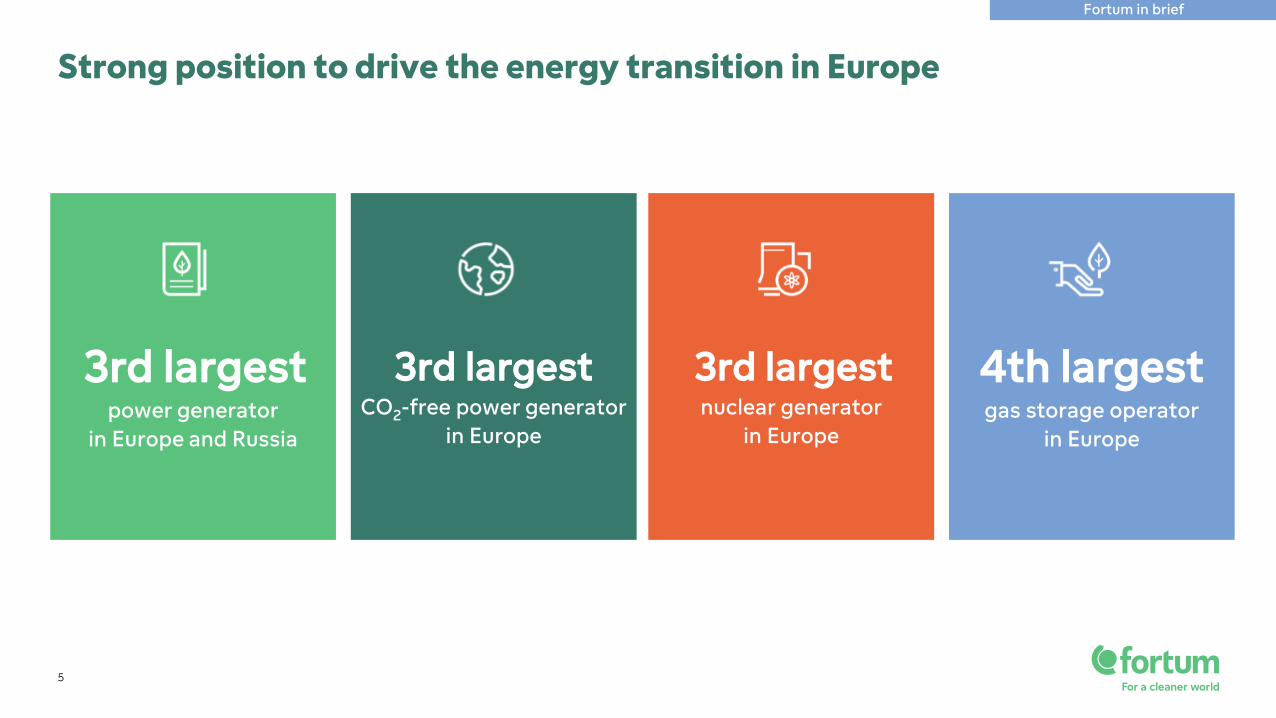
Strong position to drive the energy transition in Europe
3rd largestpower generator
in Europe and Russia
3rd largestCO2-free power generator
in Europe
3rd largestnuclear generator
in Europe
4th largest gas storage operator
in Europe
Fortum in brief
5
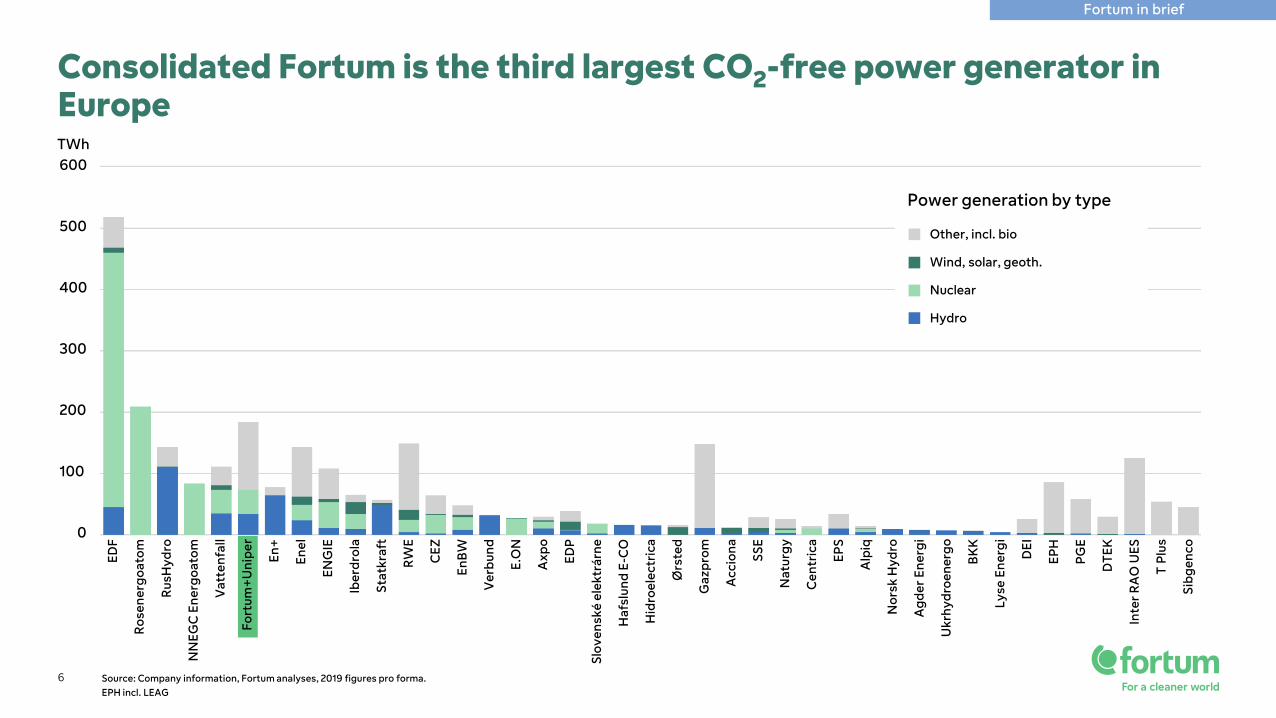
Power generation by type
Hydro
Nuclear
Wind, solar, geoth.
Other, incl. bio
600
500
400
300
200
100
0
EDF
Ros
ener
goat
om
Fort
um+
Uni
per
Rus
Hyd
ro
NN
EGC
Ene
rgoa
tom
Vat
tenf
all
En+
Enel
ENG
IE
Iber
drol
a
Stat
kraf
t
RW
E
CEZ
EnB
W
Ver
bund
E.O
N
Axp
o
EDP
Slov
ensk
é el
ektr
árne
Haf
slun
d E-
CO
Hid
roel
ectr
ica
Ørs
ted
Gaz
prom
Acc
iona
SSE
Nat
urgy
Cen
tric
a
EPS
Alp
iq
Nor
sk H
ydro
Agd
er E
nerg
i
Ukr
hydr
oene
rgo
BK
K
Lyse
Ene
rgi
DEI
EPH
PG
E
DTE
K
Inte
r RA
O U
ES
T P
lus
Sibg
enco
TWh
6
Consolidated Fortum is the third largest CO2-free power generator in Europe
Source: Company information, Fortum analyses, 2019 figures pro forma.EPH incl. LEAG
Fortum in brief
7
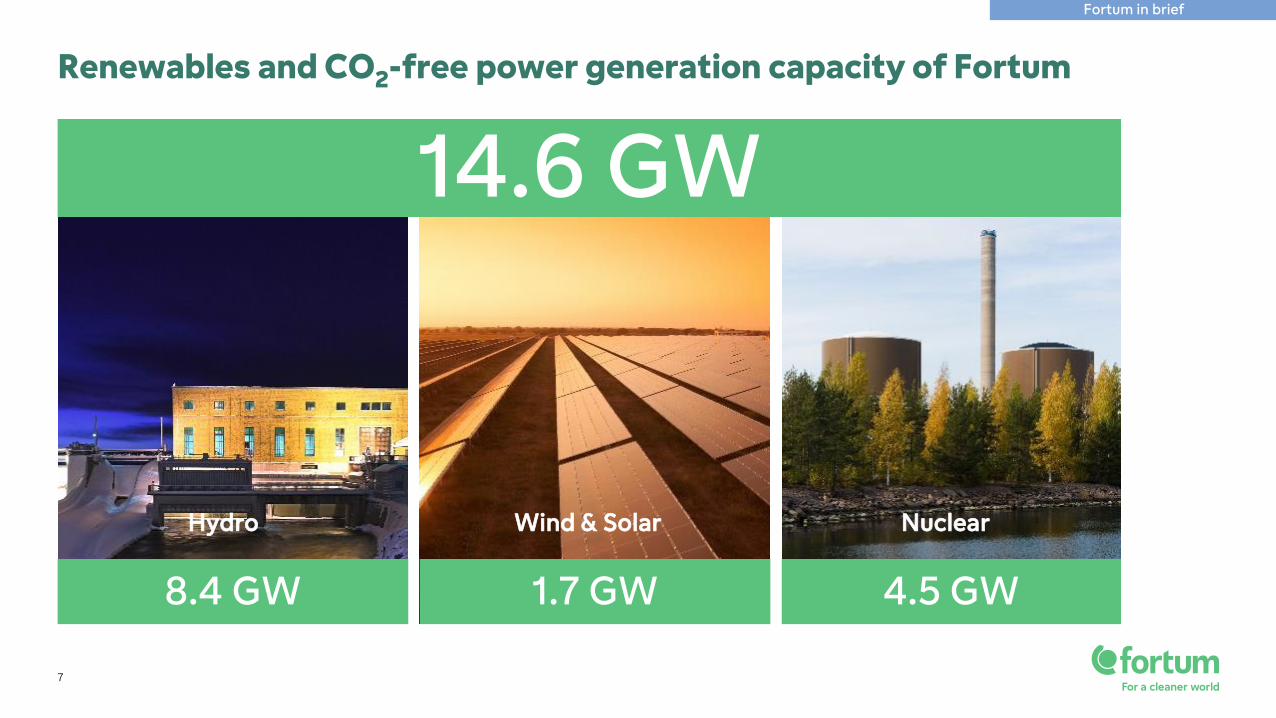
Renewables and CO2-free power generation capacity of Fortum
Fortum in brief
14.6 GW
8.4 GW 1.7 GW 4.5 GW
Hydro Wind & Solar Nuclear

Fortum is well positioned for the energy transition
8
Third largest CO2-free power generator in Europe with growing portfolio of wind and solar
Significant provider of flexible hydro and gas-fired power generation
Major provider and trader of gas for Europe’s energy and industrial customers
Versatile portfolio of decarbonisation and environmental solutions
Phase out or exit announced of ~8 GW coal-fired generation by 2030
Fortum in brief
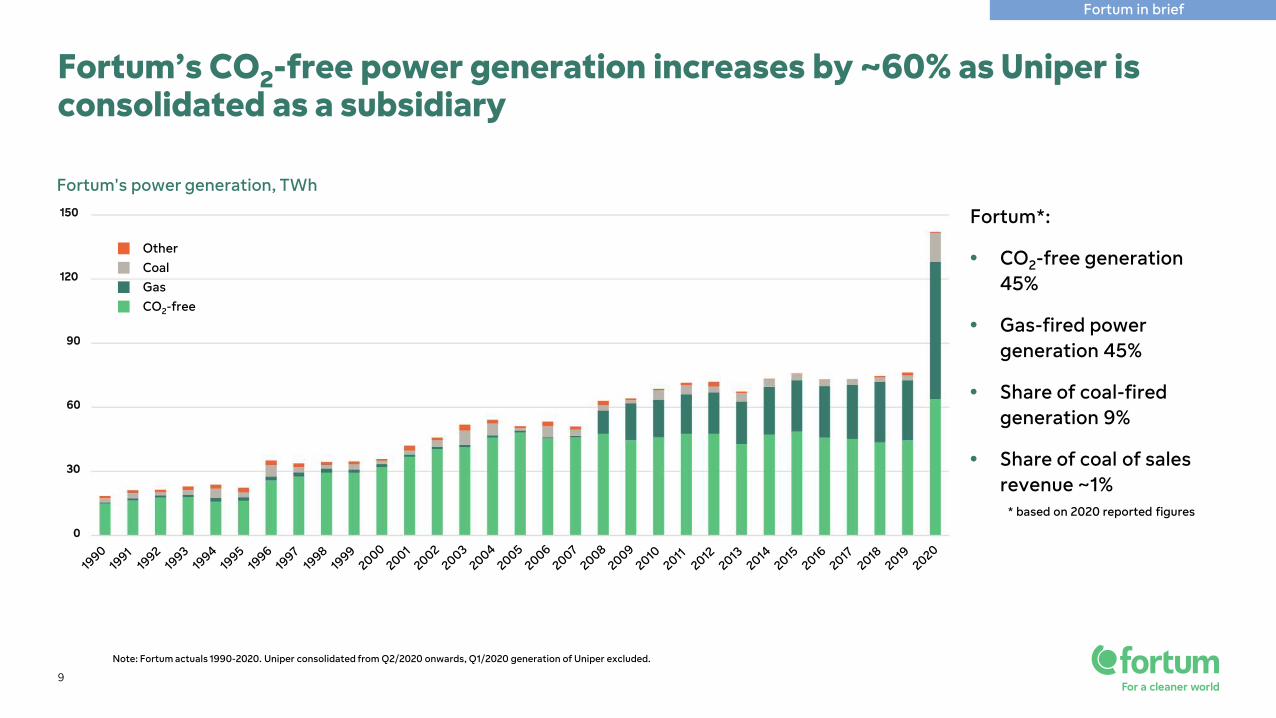
CO2-freeGasCoalOther
150
120
90
60
30
0
Fortum's power generation, TWh
9
Fortum’s CO2-free power generation increases by ~60% as Uniper is consolidated as a subsidiary
Fortum*:
• CO2-free generation45%
• Gas-fired power generation 45%
• Share of coal-fired generation 9%
• Share of coal of sales revenue ~1%
Note: Fortum actuals 1990-2020. Uniper consolidated from Q2/2020 onwards, Q1/2020 generation of Uniper excluded.
* based on 2020 reported figures
Fortum in brief
Signatory of TCFDFortum an official signatory of TCFD on March 2021
10
Fortum is a forerunner in sustainability
Specific CO2 emissionsFortum’s specific CO2 emissions from total energy production in Europe were188 gCO2/kWh in 2020, and 287 gCO2/kWh globally.
Growing in solar and windTargeting a multi-gigawatt wind and solar portfolio, which is subject to the capital recycling business model. Targeting an indicative growth capex for EUR 3 billionfor 2021-2025, of which 50-55% to renewables.
3rd largest CO2-free generator in Europe CO2-free power generation, including renewable and nuclear power, was 64 TWh in 2020.73% of power generation in Europe, and 45% of total power generation was CO2-free.
Fortum is listed in severalsustainability indices and ratings:
Our purpose is to drive the change for a cleaner world. We are securing a fast
and reliable transition to a carbon-neutral economy by providing customers
and societies with clean energy and sustainable solutions. This way we deliver
excellent shareholder value.
MSCI ESG RATINGS DISCLAIMER STATEMENT: THE USE BY FORTUM CORPORATION OF ANY MSCI ESG RESEARCH LLC OR ITS AFFILIATES (“MSCI”) DATA, AND THE USE OF MSCI LOGOS, TRADEMARKS, SERVICE MARKS OR INDEX NAMES HEREIN, DO NOT CONSTITUTE A SPONSORSHIP, ENDORSEMENT, RECOMMENDATION, OR PROMOTION OF FORTUM CORPORATION BY MSCI. MSCI SERVICES AND DATA ARE THE PROPERTY OF MSCI OR ITS INFORMATION PROVIDERS, AND ARE PROVIDED ‘AS-IS’ AND WITHOUT WARRANTY. MSCI NAMES AND LOGOS ARE TRADEMARKS OR SERVICE MARKS OF MSCI.
Fortum in brief
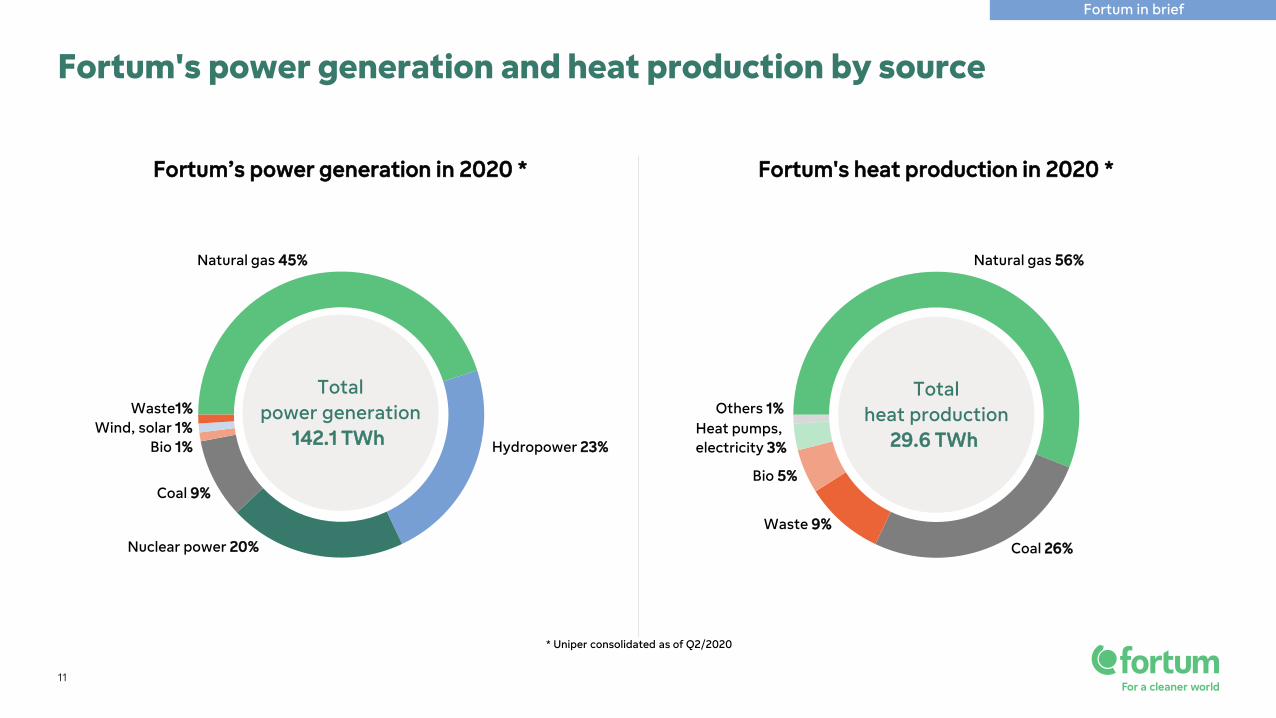
Fortum’s power generation in 2020 * Fortum's heat production in 2020 *
11
Fortum's power generation and heat production by source
Totalheat production
29.6 TWh
Totalpower generation
142.1 TWh
* Uniper consolidated as of Q2/2020
Nuclear power 20%
Coal 9%
Bio 1% Hydropower 23%Wind, solar 1%
Waste1%
Natural gas 45%
Bio 5%
Heat pumps, electricity 3%
Waste 9%
Natural gas 56%
Coal 26%
Others 1%
Fortum in brief
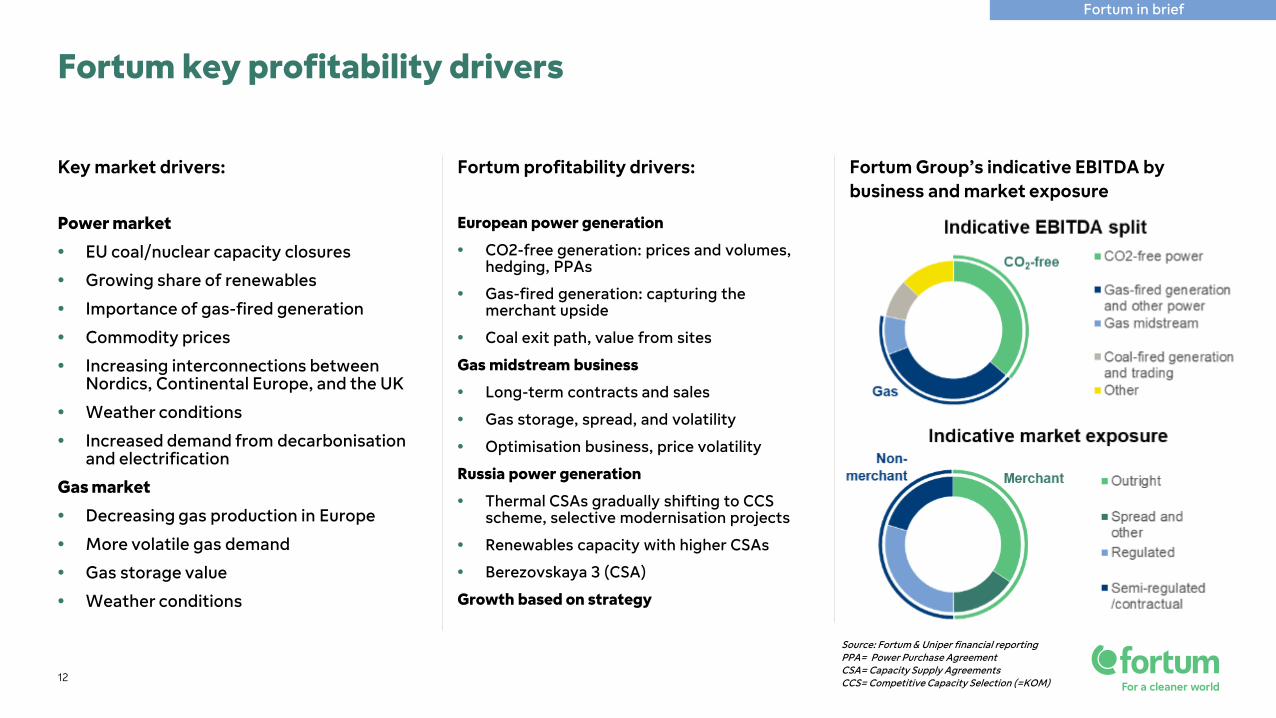
Key market drivers:
Power market
• EU coal/nuclear capacity closures
• Growing share of renewables
• Importance of gas-fired generation
• Commodity prices
• Increasing interconnections between Nordics, Continental Europe, and the UK
• Weather conditions
• Increased demand from decarbonisation and electrification
Gas market
• Decreasing gas production in Europe
• More volatile gas demand
• Gas storage value
• Weather conditions
European power generation
• CO2-free generation: prices and volumes, hedging, PPAs
• Gas-fired generation: capturing the merchant upside
• Coal exit path, value from sites
Gas midstream business
• Long-term contracts and sales
• Gas storage, spread, and volatility
• Optimisation business, price volatility
Russia power generation
• Thermal CSAs gradually shifting to CCS scheme, selective modernisation projects
• Renewables capacity with higher CSAs
• Berezovskaya 3 (CSA)
Growth based on strategy
Fortum Group’s indicative EBITDA by business and market exposure
Fortum profitability drivers:
Fortum key profitability drivers
12
Source: Fortum & Uniper financial reportingPPA= Power Purchase AgreementCSA= Capacity Supply AgreementsCCS= Competitive Capacity Selection (=KOM)
Fortum in brief
13
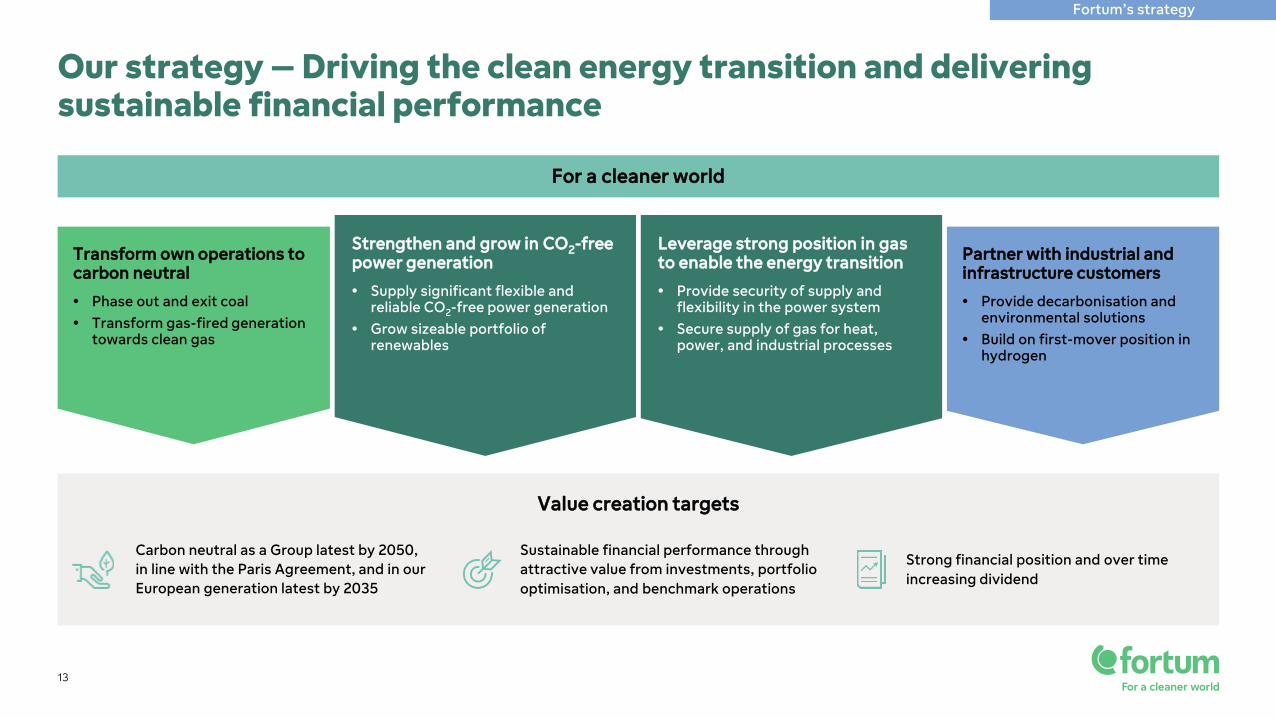
Our strategy – Driving the clean energy transition and delivering sustainable financial performance
For a cleaner world
Transform own operations to carbon neutral
• Phase out and exit coal• Transform gas-fired generation
towards clean gas
Strengthen and grow in CO2-free power generation
• Supply significant flexible and reliable CO2-free power generation
• Grow sizeable portfolio of renewables
Leverage strong position in gas to enable the energy transition
• Provide security of supply and flexibility in the power system
• Secure supply of gas for heat, power, and industrial processes
Partner with industrial and infrastructure customers
• Provide decarbonisation and environmental solutions
• Build on first-mover position in hydrogen
Value creation targets
Carbon neutral as a Group latest by 2050, in line with the Paris Agreement, and in our European generation latest by 2035
Sustainable financial performance through attractive value from investments, portfolio optimisation, and benchmark operations
Strong financial position and over time increasing dividend
Fortum’s strategy
14
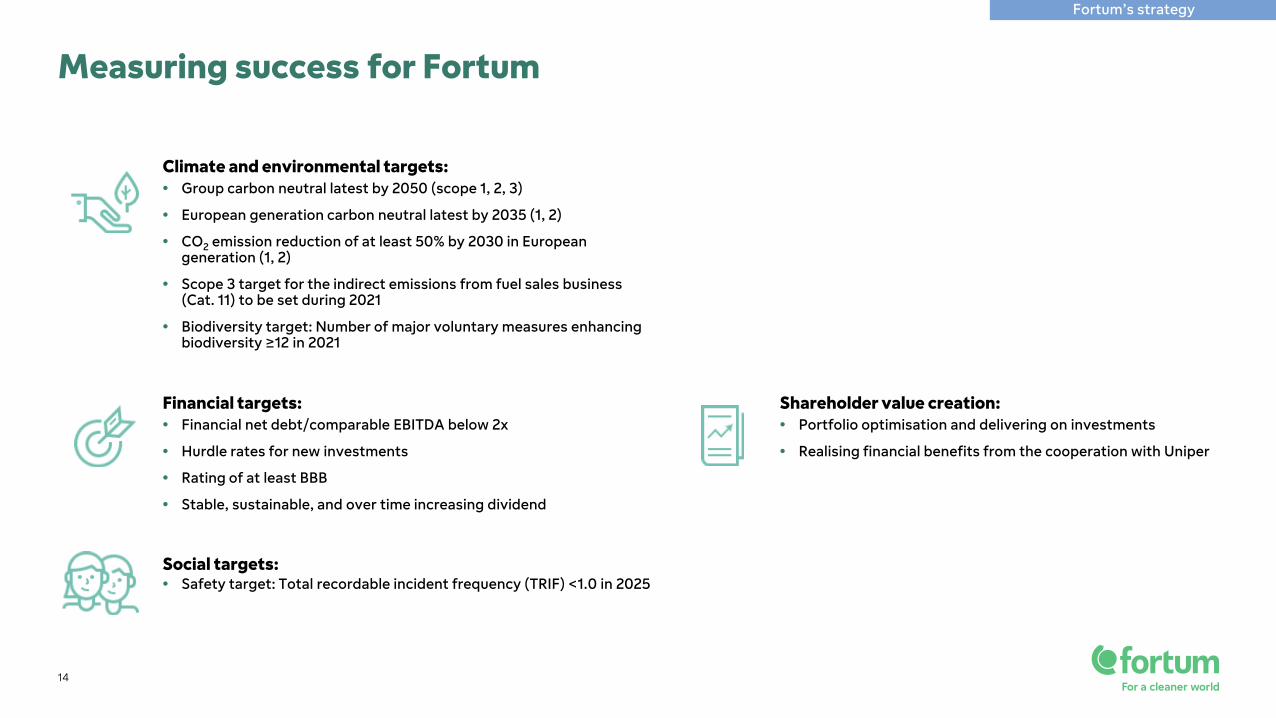
Measuring success for Fortum
Climate and environmental targets:• Group carbon neutral latest by 2050 (scope 1, 2, 3)
• European generation carbon neutral latest by 2035 (1, 2)
• CO2 emission reduction of at least 50% by 2030 in European generation (1, 2)
• Scope 3 target for the indirect emissions from fuel sales business (Cat. 11) to be set during 2021
• Biodiversity target: Number of major voluntary measures enhancing biodiversity ≥12 in 2021
Financial targets:• Financial net debt/comparable EBITDA below 2x
• Hurdle rates for new investments
• Rating of at least BBB
• Stable, sustainable, and over time increasing dividend
Social targets:• Safety target: Total recordable incident frequency (TRIF) <1.0 in 2025
Shareholder value creation:• Portfolio optimisation and delivering on investments
• Realising financial benefits from the cooperation with Uniper
Fortum’s strategy
15
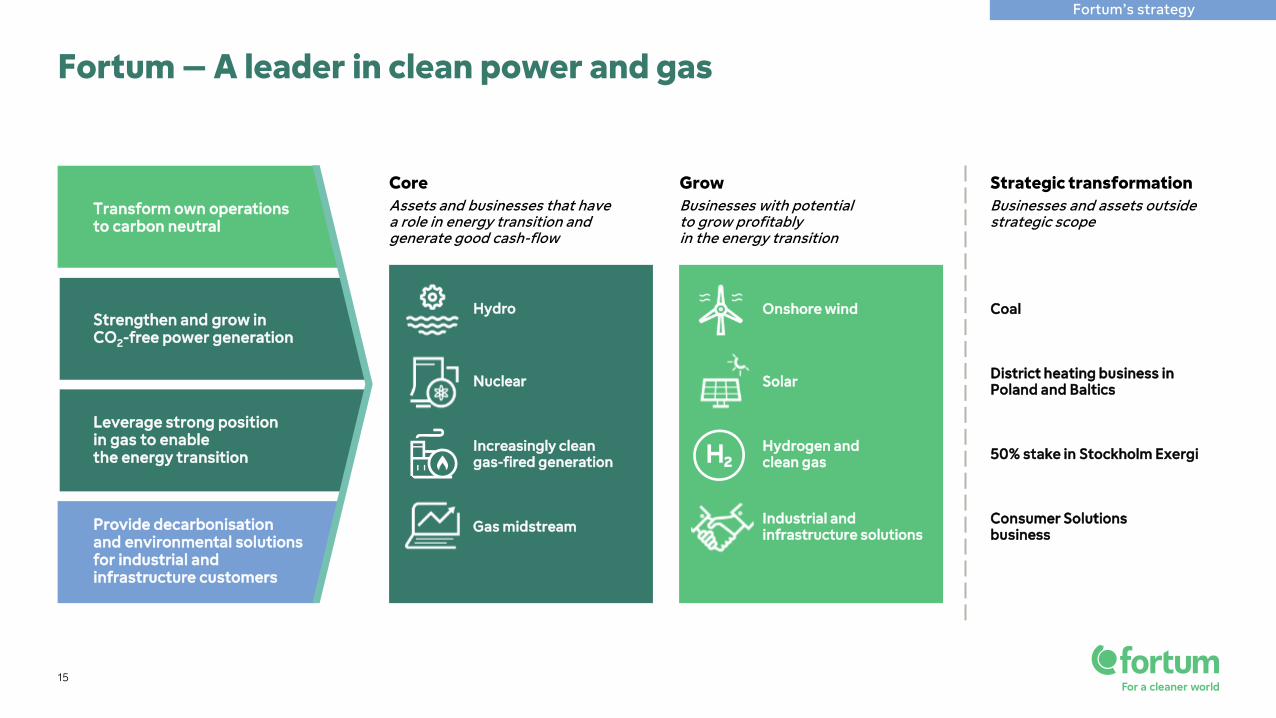
Fortum – A leader in clean power and gas
CoreAssets and businesses that have a role in energy transition and generate good cash-flow
GrowBusinesses with potential to grow profitably in the energy transition
Hydro
Increasingly clean gas-fired generation
Nuclear
Gas midstream
Onshore wind
Solar
Hydrogen and clean gas
Industrial and infrastructure solutions
Transform own operations to carbon neutral
Leverage strong position in gas to enable the energy transition
Provide decarbonisation and environmental solutions for industrial and infrastructure customers
Strengthen and grow in CO2-free power generation
Strategic transformationBusinesses and assets outside strategic scope
Coal
District heating business in Poland and Baltics
50% stake in Stockholm Exergi
Consumer Solutions business
Fortum’s strategy
16
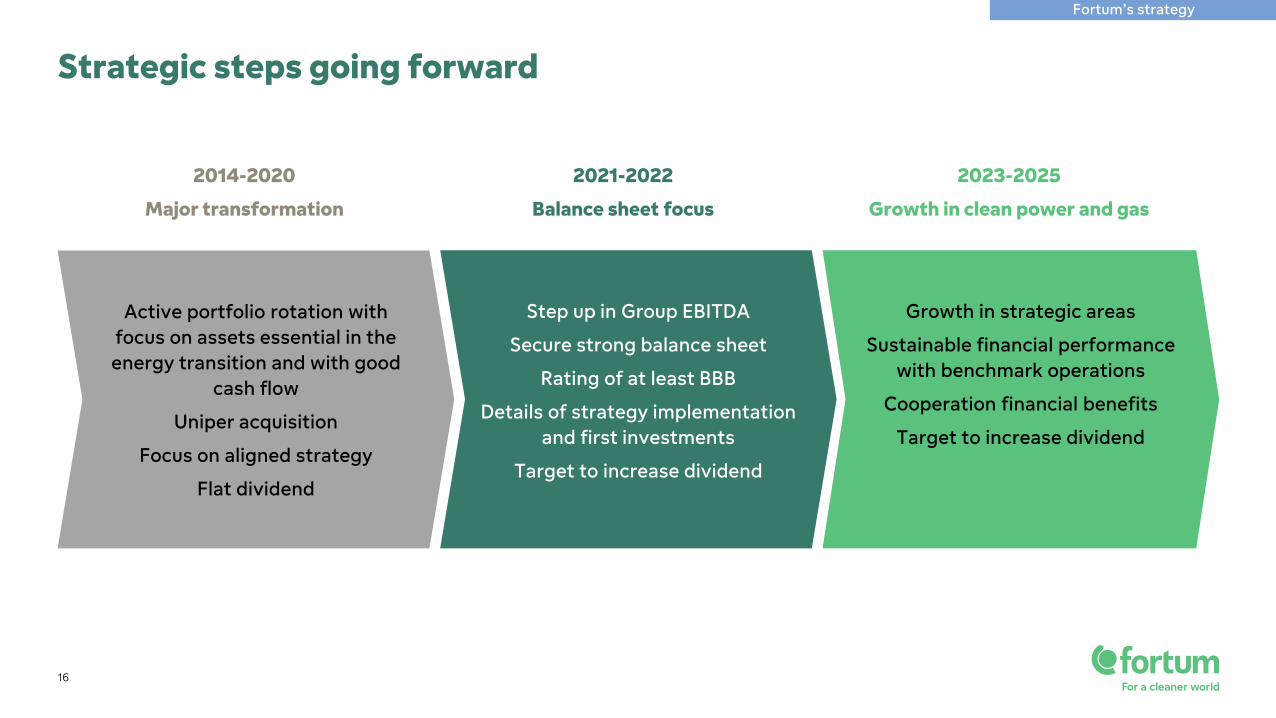
Strategic steps going forward
2014-2020
Major transformation
Active portfolio rotation with focus on assets essential in the energy transition and with good
cash flow
Uniper acquisition
Focus on aligned strategy
Flat dividend
2021-2022
Balance sheet focus
Step up in Group EBITDA
Secure strong balance sheet
Rating of at least BBB
Details of strategy implementation and first investments
Target to increase dividend
2023-2025
Growth in clean power and gas
Growth in strategic areas
Sustainable financial performance with benchmark operations
Cooperation financial benefits
Target to increase dividend
Fortum’s strategy
17
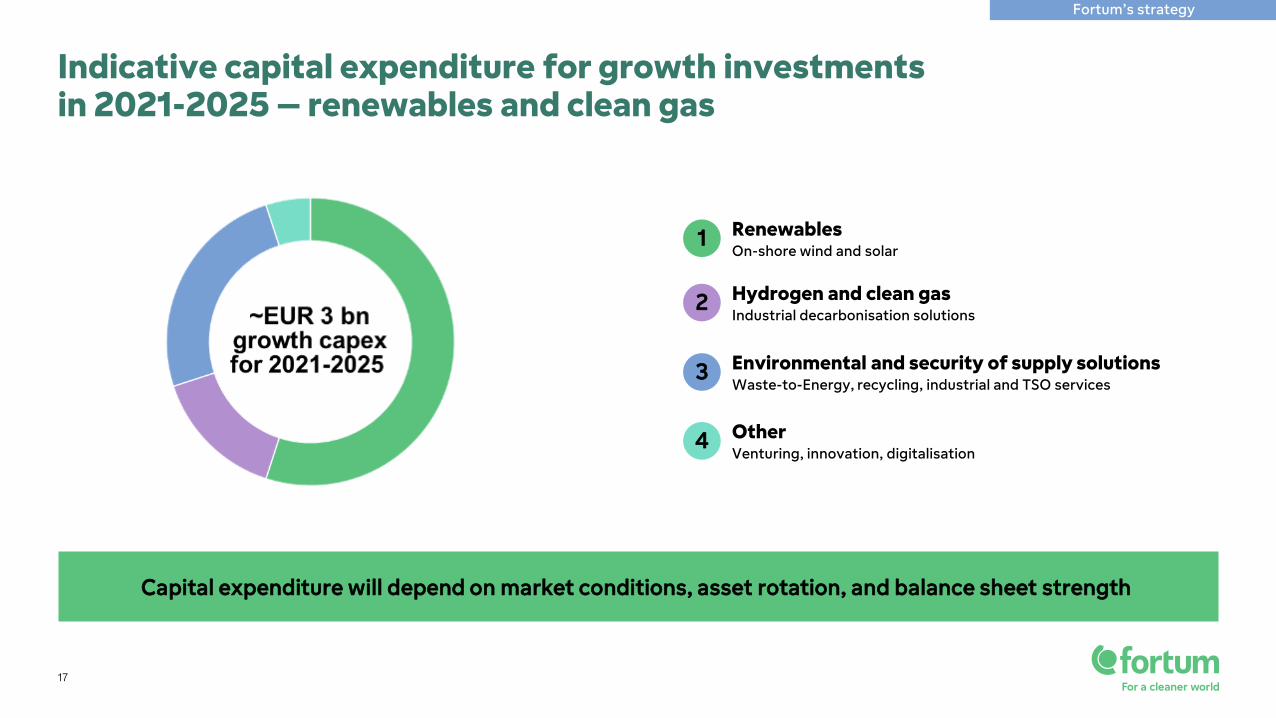
Indicative capital expenditure for growth investmentsin 2021-2025 – renewables and clean gas
OtherVenturing, innovation, digitalisation
4
Environmental and security of supply solutionsWaste-to-Energy, recycling, industrial and TSO services
3
Hydrogen and clean gasIndustrial decarbonisation solutions
2
RenewablesOn-shore wind and solar
1
Capital expenditure will depend on market conditions, asset rotation, and balance sheet strength
Fortum’s strategy
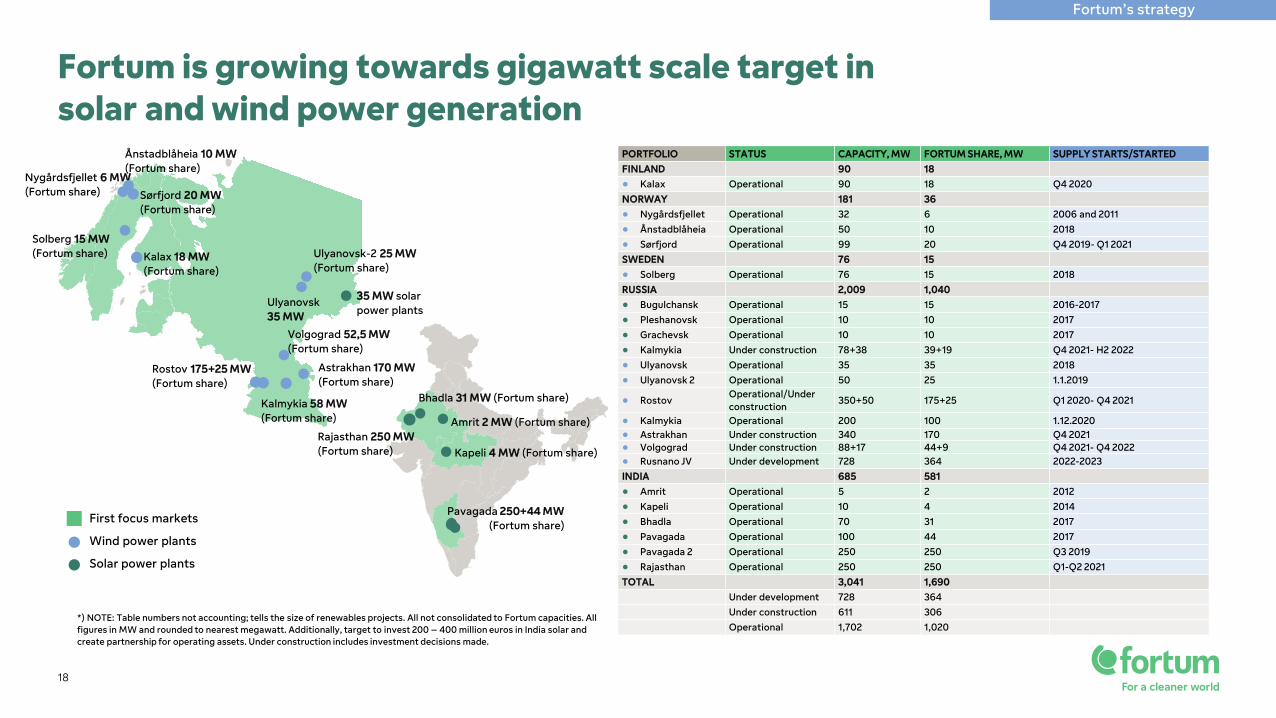
PORTFOLIO STATUS CAPACITY, MW FORTUM SHARE, MW SUPPLY STARTS/STARTED
FINLAND 90 18● Kalax Operational 90 18 Q4 2020
NORWAY 181 36● Nygårdsfjellet Operational 32 6 2006 and 2011● Ånstadblåheia Operational 50 10 2018● Sørfjord Operational 99 20 Q4 2019- Q1 2021
SWEDEN 76 15● Solberg Operational 76 15 2018
RUSSIA 2,009 1,040● Bugulchansk Operational 15 15 2016-2017● Pleshanovsk Operational 10 10 2017● Grachevsk Operational 10 10 2017● Kalmykia Under construction 78+38 39+19 Q4 2021- H2 2022● Ulyanovsk Operational 35 35 2018● Ulyanovsk 2 Operational 50 25 1.1.2019
● RostovOperational/Under construction
350+50 175+25 Q1 2020- Q4 2021
● Kalmykia Operational 200 100 1.12.2020● Astrakhan Under construction 340 170 Q4 2021● Volgograd Under construction 88+17 44+9 Q4 2021- Q4 2022● Rusnano JV Under development 728 364 2022-2023
INDIA 685 581● Amrit Operational 5 2 2012● Kapeli Operational 10 4 2014● Bhadla Operational 70 31 2017● Pavagada Operational 100 44 2017● Pavagada 2 Operational 250 250 Q3 2019● Rajasthan Operational 250 250 Q1-Q2 2021
TOTAL 3,041 1,690
Under development 728 364
Under construction 611 306
Operational 1,702 1,020
18
Fortum is growing towards gigawatt scale target in solar and wind power generation
*) NOTE: Table numbers not accounting; tells the size of renewables projects. All not consolidated to Fortum capacities. All figures in MW and rounded to nearest megawatt. Additionally, target to invest 200 – 400 million euros in India solar and create partnership for operating assets. Under construction includes investment decisions made.
First focus markets
Wind power plants
Solar power plants
Ulyanovsk35 MW
Nygårdsfjellet 6 MW (Fortum share)
Solberg 15 MW (Fortum share)
Sørfjord 20 MW(Fortum share)
35 MW solar power plants
Ulyanovsk-2 25 MW(Fortum share)
Ånstadblåheia 10 MW (Fortum share)
Kalax 18 MW (Fortum share)
Rostov 175+25 MW(Fortum share)
Kalmykia 58 MW(Fortum share)
Astrakhan 170 MW(Fortum share)
Amrit 2 MW (Fortum share)
Kapeli 4 MW (Fortum share)
Bhadla 31 MW (Fortum share)
Pavagada 250+44 MW(Fortum share)
Rajasthan 250 MW(Fortum share)
Volgograd 52,5 MW(Fortum share)
Fortum’s strategy
19
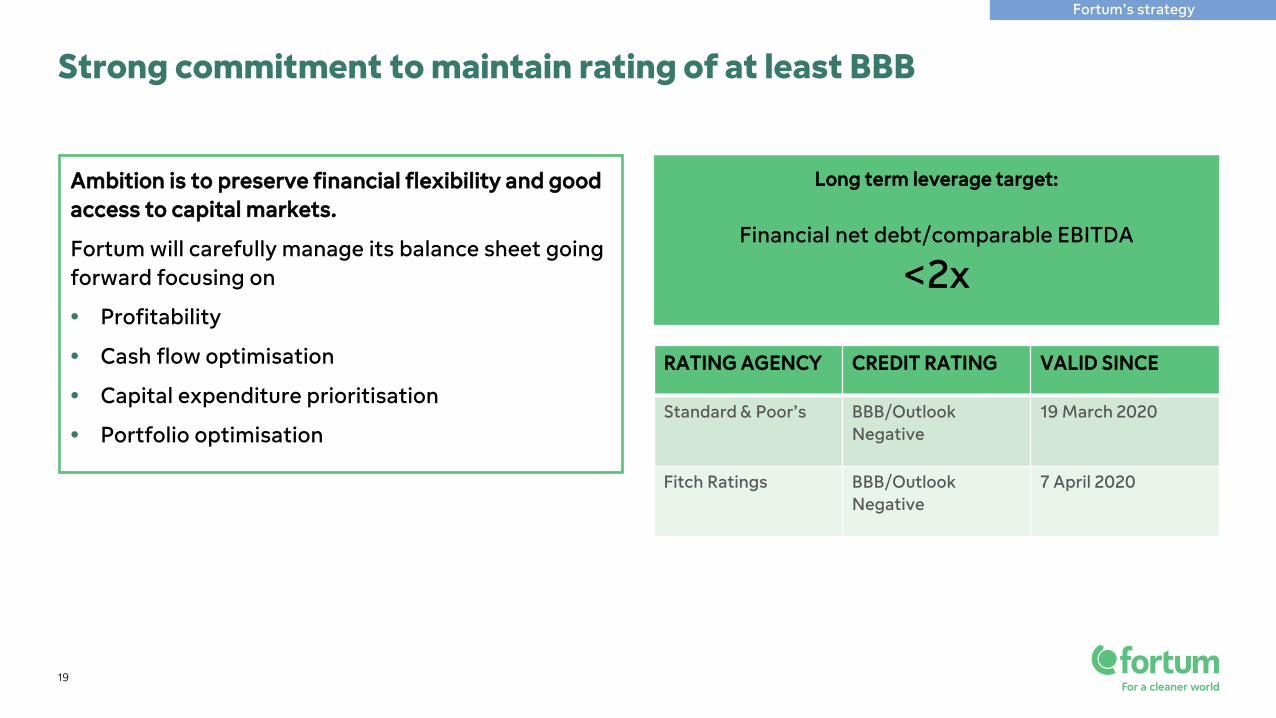
Strong commitment to maintain rating of at least BBB
Long term leverage target:
Financial net debt/comparable EBITDA
<2x
Ambition is to preserve financial flexibility and good access to capital markets.
Fortum will carefully manage its balance sheet going forward focusing on
• Profitability
• Cash flow optimisation
• Capital expenditure prioritisation
• Portfolio optimisation
RATING AGENCY CREDIT RATING VALID SINCE
Standard & Poor’s BBB/Outlook Negative
19 March 2020
Fitch Ratings BBB/Outlook Negative
7 April 2020
Fortum’s strategy
20
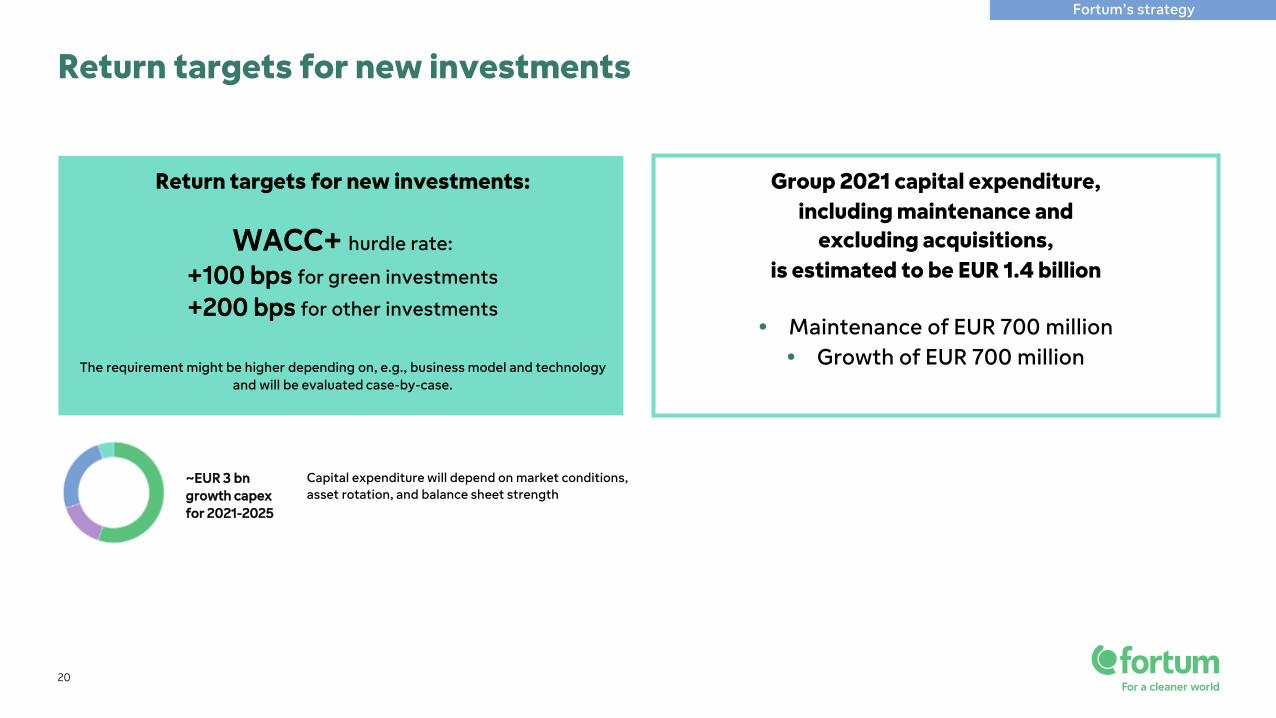
Return targets for new investments
Return targets for new investments:
WACC+ hurdle rate:
+100 bps for green investments
+200 bps for other investments
The requirement might be higher depending on, e.g., business model and technology and will be evaluated case-by-case.
Group 2021 capital expenditure, including maintenance and
excluding acquisitions, is estimated to be EUR 1.4 billion
• Maintenance of EUR 700 million • Growth of EUR 700 million
Capital expenditure will depend on market conditions, asset rotation, and balance sheet strength
~EUR 3 bn growth capex for 2021-2025
Fortum’s strategy
• Positive cash impact on a consolidated group basis is estimated to be ~EUR 100 million annually
• > EUR 50 million of these annual benefits gradually materialising by the end of 2023 and reaching full annual impact in 2025
• Approx. 450 people have been involved in various work streams
21
Fortum and Uniper cooperation estimated to deliver significant financial benefits
Cooperation benefits focus on monetary, safety, and environmental actions
Fortum’s strategy
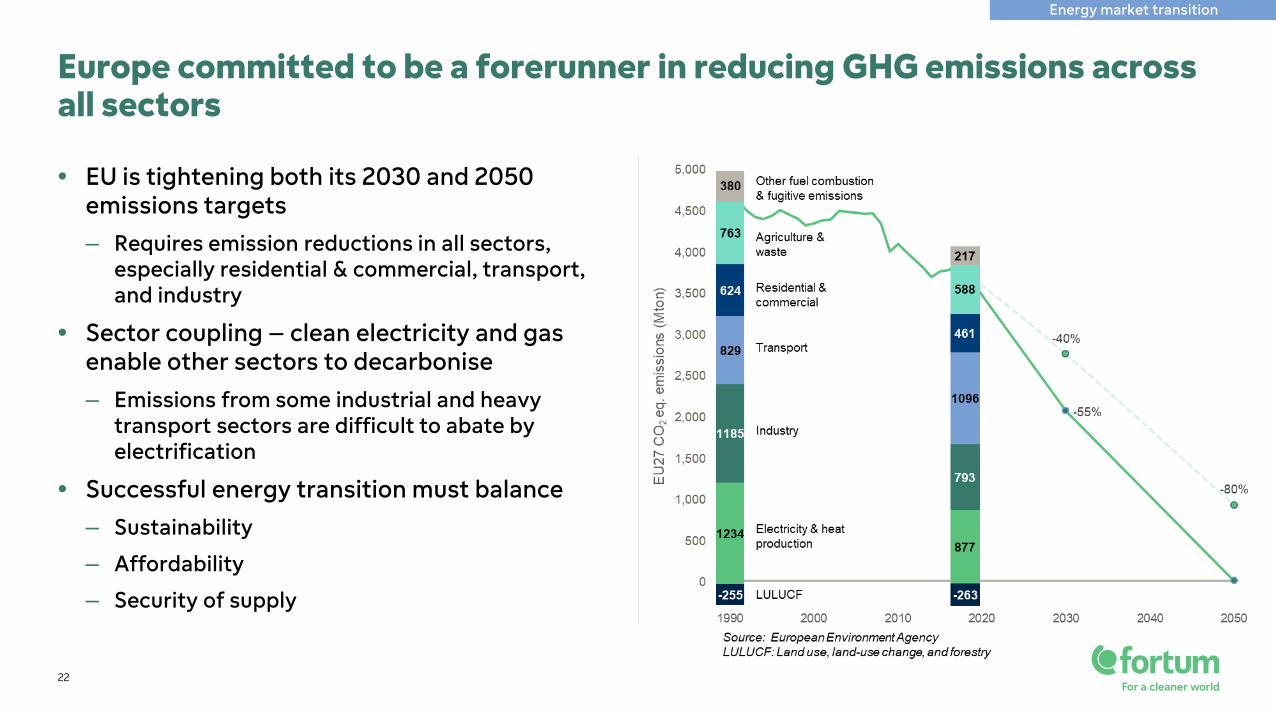
• EU is tightening both its 2030 and 2050 emissions targets– Requires emission reductions in all sectors,
especially residential & commercial, transport, and industry
• Sector coupling – clean electricity and gas enable other sectors to decarbonise– Emissions from some industrial and heavy
transport sectors are difficult to abate by electrification
• Successful energy transition must balance– Sustainability
– Affordability
– Security of supply
22
Europe committed to be a forerunner in reducing GHG emissions across all sectors
Energy market transition
23
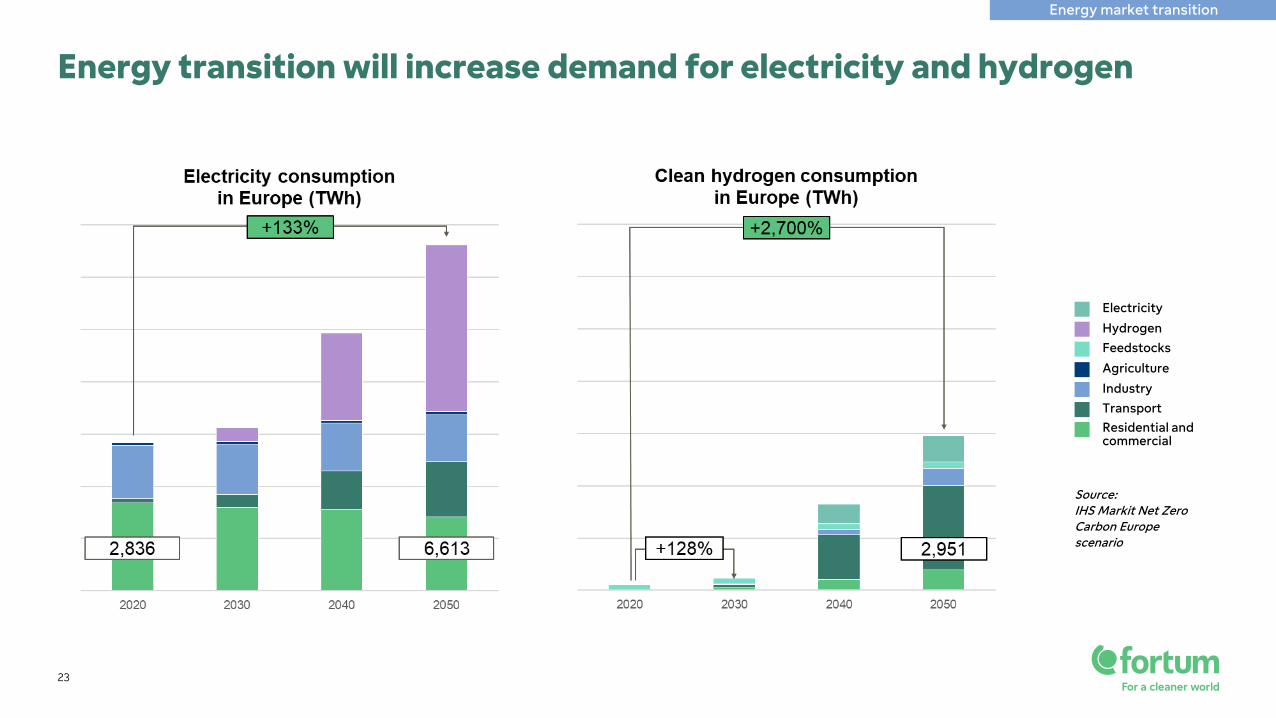
Energy transition will increase demand for electricity and hydrogen
Source: IHS Markit Net Zero Carbon Europe scenario
Electricity
HydrogenFeedstocks
Agriculture
IndustryTransportResidential and commercial
Energy market transition
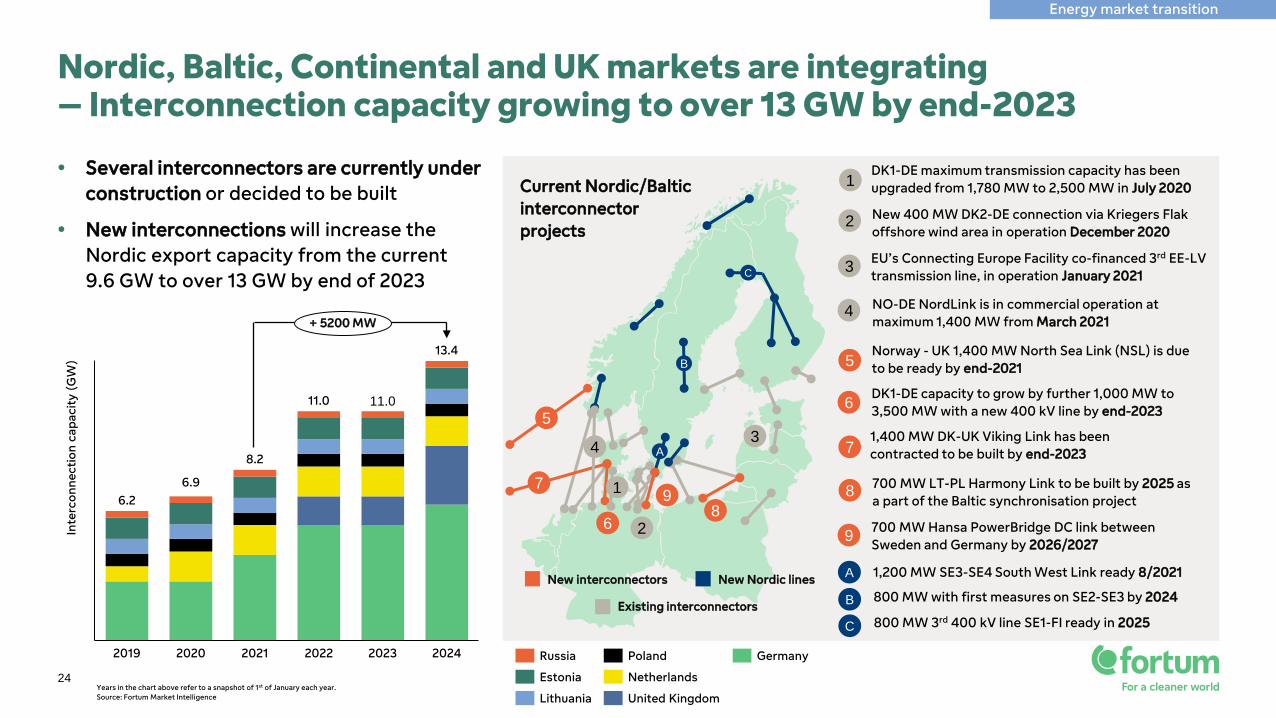
• Several interconnectors are currently under construction or decided to be built
• New interconnections will increase theNordic export capacity from the current9.6 GW to over 13 GW by end of 2023
24
Nordic, Baltic, Continental and UK markets are integrating– Interconnection capacity growing to over 13 GW by end-2023
Years in the chart above refer to a snapshot of 1st of January each year.Source: Fortum Market Intelligence
Inte
rcon
nect
ion
capa
city
(G
W)
2023
8.2
2019 20242020 2021 2022
6.26.9
11.0 11.0
13.4
+ 5200 MW
Lithuania
Russia Germany
Netherlands
Poland
Estonia
United Kingdom
Energy market transition
DK1-DE capacity to grow by further 1,000 MW to 3,500 MW with a new 400 kV line by end-2023
Norway - UK 1,400 MW North Sea Link (NSL) is due to be ready by end-2021
DK1-DE maximum transmission capacity has been upgraded from 1,780 MW to 2,500 MW in July 2020
NO-DE NordLink is in commercial operation at maximum 1,400 MW from March 2021
New 400 MW DK2-DE connection via Kriegers Flak offshore wind area in operation December 2020
1,200 MW SE3-SE4 South West Link ready 8/2021
EU’s Connecting Europe Facility co-financed 3rd EE-LV transmission line, in operation January 2021
1,400 MW DK-UK Viking Link has been contracted to be built by end-2023
700 MW Hansa PowerBridge DC link between Sweden and Germany by 2026/2027
6
5
7
1
4
A
3
9
2
700 MW LT-PL Harmony Link to be built by 2025 as a part of the Baltic synchronisation project
8
800 MW 3rd 400 kV line SE1-FI ready in 2025
B
C
800 MW with first measures on SE2-SE3 by 2024
5
7
6
3
2
9
4
18
A
New Nordic lines
Existing interconnectors
New interconnectors
C
B
Current Nordic/Balticinterconnector projects
25
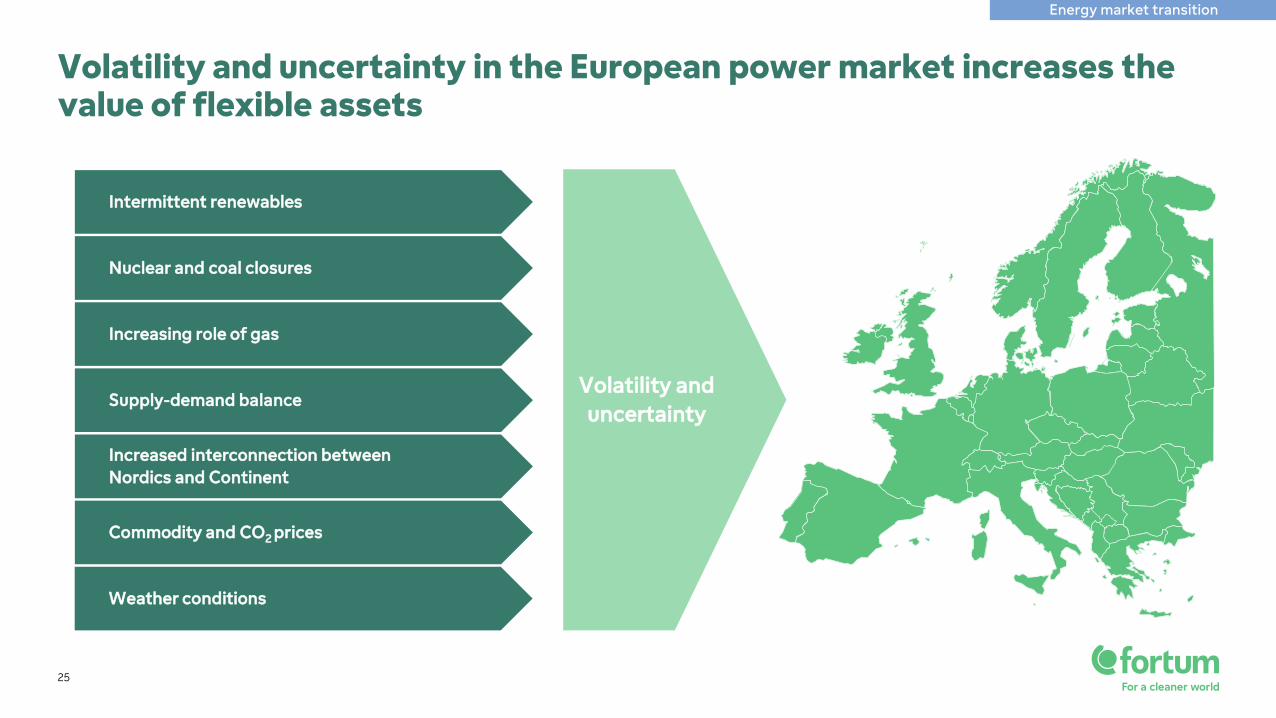
Volatility and uncertainty in the European power market increases the value of flexible assets
Increasing role of gas
Increased interconnection between Nordics and Continent
Supply-demand balance
Commodity and CO2 prices
Intermittent renewables
Nuclear and coal closures
Weather conditions
Volatility and uncertainty
Energy market transition
26
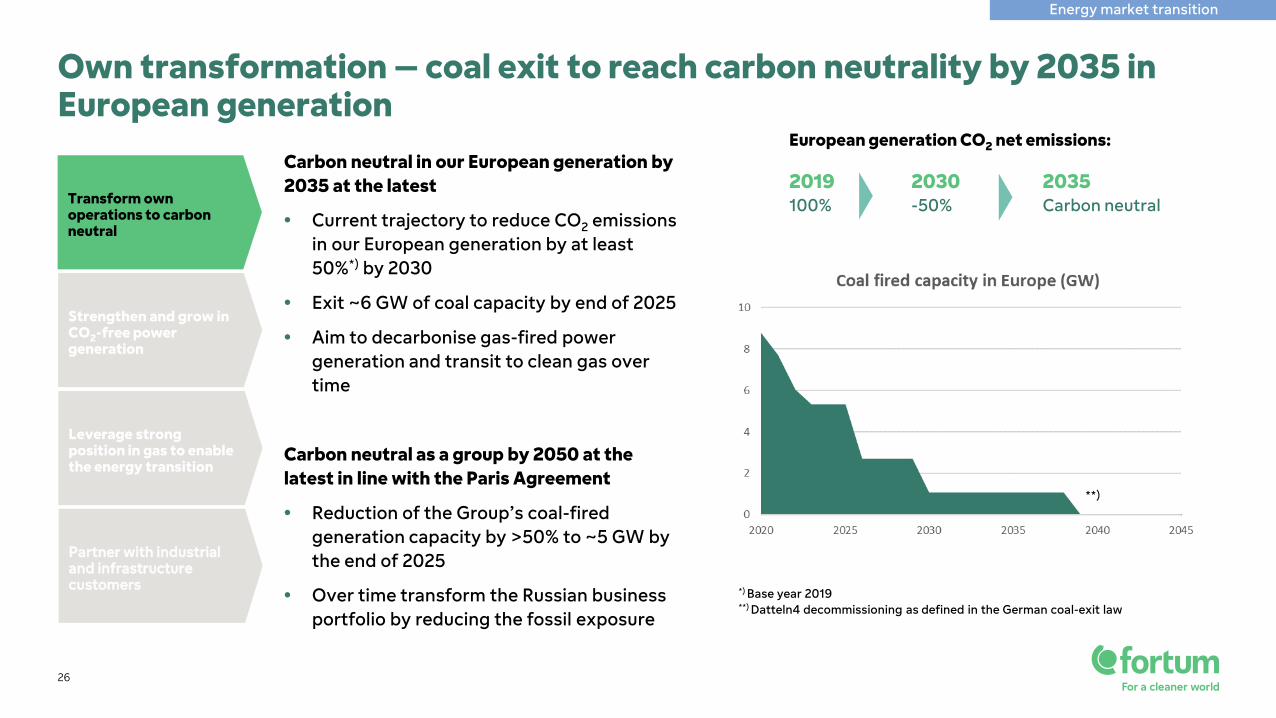
Own transformation – coal exit to reach carbon neutrality by 2035 in European generation
Carbon neutral in our European generation by 2035 at the latest
• Current trajectory to reduce CO2 emissions in our European generation by at least 50%*) by 2030
• Exit ~6 GW of coal capacity by end of 2025
• Aim to decarbonise gas-fired power generation and transit to clean gas over time
Carbon neutral as a group by 2050 at the latest in line with the Paris Agreement
• Reduction of the Group’s coal-fired generation capacity by >50% to ~5 GW by the end of 2025
• Over time transform the Russian business portfolio by reducing the fossil exposure
Transform own operations to carbon neutral
Strengthen and grow in CO2-free power generation
Leverage strong position in gas to enable the energy transition
Partner with industrial and infrastructure customers
Energy market transition
European generation CO2 net emissions:
2019 2030 2035100% -50% Carbon neutral
*) Base year 2019**) Datteln4 decommissioning as defined in the German coal-exit law
**)
FORTUM CORPORATION
12 May 2021
Interim ReportJanuary-March 2021
Markus RauramoPresident and CEO
28
Interim report Q1 2021
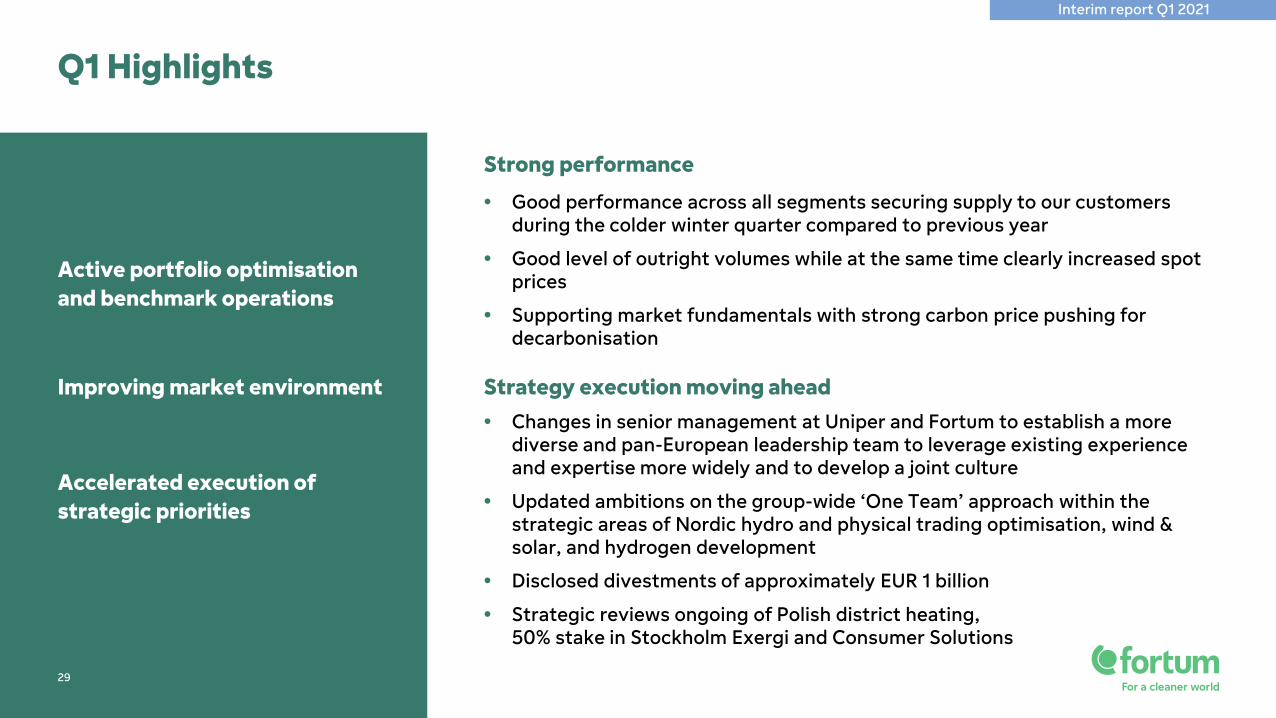
Q1 Highlights
29
Active portfolio optimisation and benchmark operations
Strong performance
Improving market environment
Accelerated execution of strategic priorities
• Changes in senior management at Uniper and Fortum to establish a more diverse and pan-European leadership team to leverage existing experience and expertise more widely and to develop a joint culture
• Updated ambitions on the group-wide ‘One Team’ approach within the strategic areas of Nordic hydro and physical trading optimisation, wind & solar, and hydrogen development
• Disclosed divestments of approximately EUR 1 billion
• Strategic reviews ongoing of Polish district heating, 50% stake in Stockholm Exergi and Consumer Solutions
Strategy execution moving ahead
• Good performance across all segments securing supply to our customers during the colder winter quarter compared to previous year
• Good level of outright volumes while at the same time clearly increased spot prices
• Supporting market fundamentals with strong carbon price pushing for decarbonisation
Interim report Q1 2021
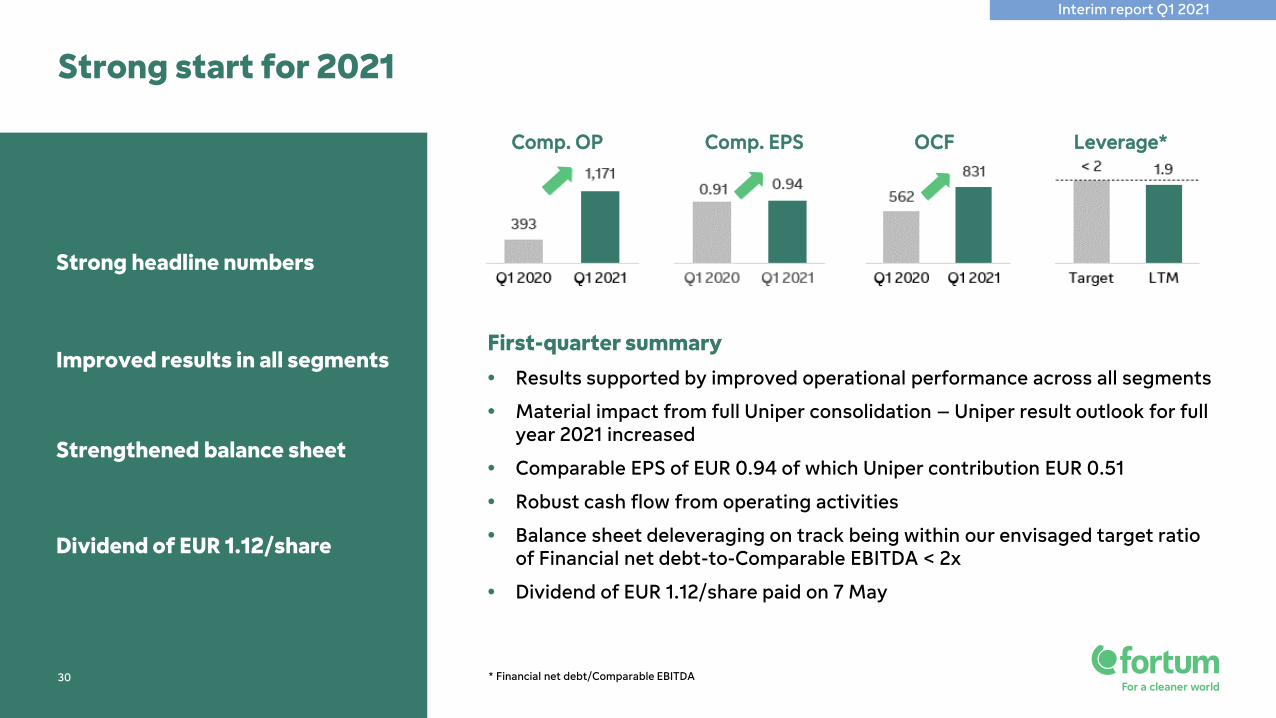
First-quarter summary• Results supported by improved operational performance across all segments
• Material impact from full Uniper consolidation – Uniper result outlook for full year 2021 increased
• Comparable EPS of EUR 0.94 of which Uniper contribution EUR 0.51
• Robust cash flow from operating activities
• Balance sheet deleveraging on track being within our envisaged target ratio of Financial net debt-to-Comparable EBITDA < 2x
• Dividend of EUR 1.12/share paid on 7 May
Strong start for 2021
30
Comp. OP Comp. EPS OCF Leverage*
Improved results in all segments
* Financial net debt/Comparable EBITDA
Strengthened balance sheet
Dividend of EUR 1.12/share
Strong headline numbers
Interim report Q1 2021

Higher achieved power prices
31
Substantially higher spot power prices in the Nordics
Increased achieved power prices
Russian power demand picking up with increasing electricity prices
Russian achieved price in rubles increased while declining in euro terms
1 068 1 0211 109 1 074 1 158
Q1/2020 Q2/2020 Q3/2020 Q4/2020 Q1/2021
RUB/MWh
34,0 33,637,1 35,2 37,2
Q1/2020 Q2/2020 Q3/2020 Q4/2020 Q1/2021
EUR/MWh
Fortum Generation's Nordic power price
15,4
5,68,9
13,8
42,1
Q1/2020 Q2/2020 Q3/2020 Q4/2020 Q1/2021
EUR/MWh
System spot power price, Nord Pool
Achieved power price, Russia segment*
24,5 23,3 23,1 22,5 21,1
Q1/2020 Q2/2020 Q3/2020 Q4/2020 Q1/2021
EUR/MWh
Spot power price, Urals hub
NOTE: Achieved power price (includes capacity payments) in RUBincreased by 3%
* Does not include Uniper’s subsidiary Unipro
Interim report Q1 2021
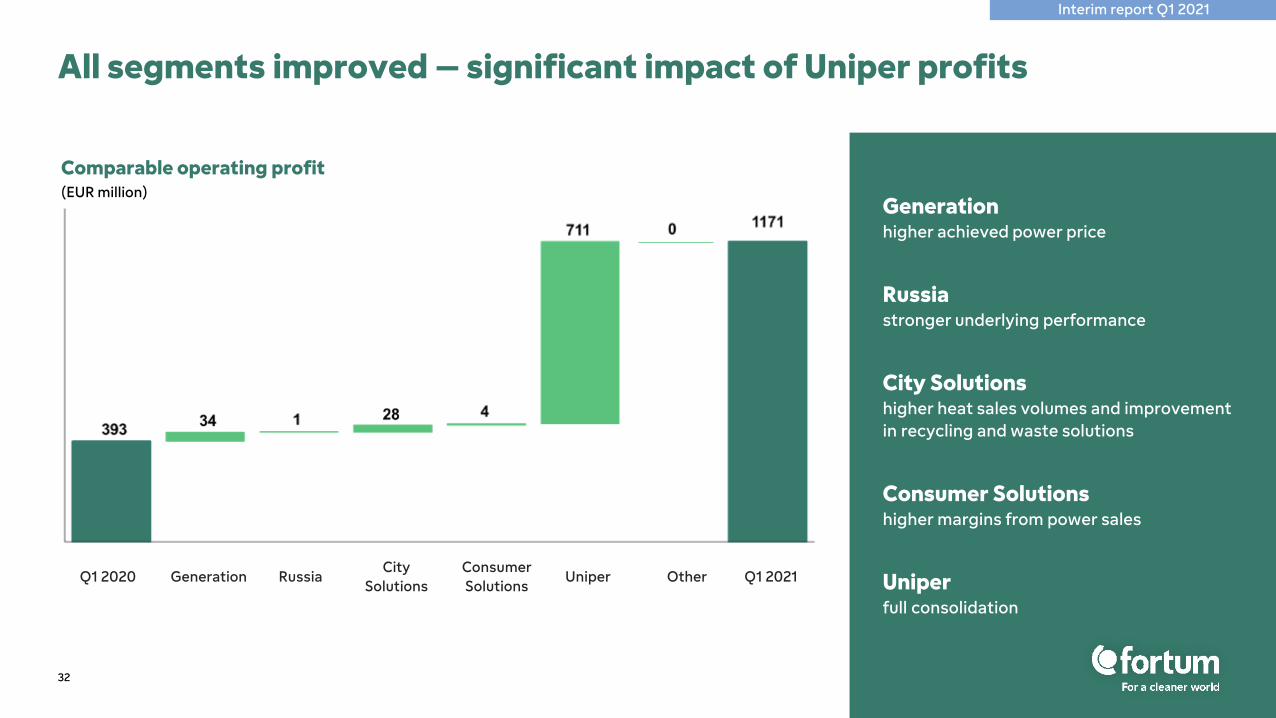
All segments improved – significant impact of Uniper profits
32
(EUR million)
Comparable operating profit
Generationhigher achieved power price
Russiastronger underlying performance
City Solutionshigher heat sales volumes and improvement in recycling and waste solutions
Consumer Solutionshigher margins from power sales
Uniperfull consolidation
Q1 2020 Q1 2021Generation RussiaCity
SolutionsConsumer Solutions
Uniper Other
Interim report Q1 2021
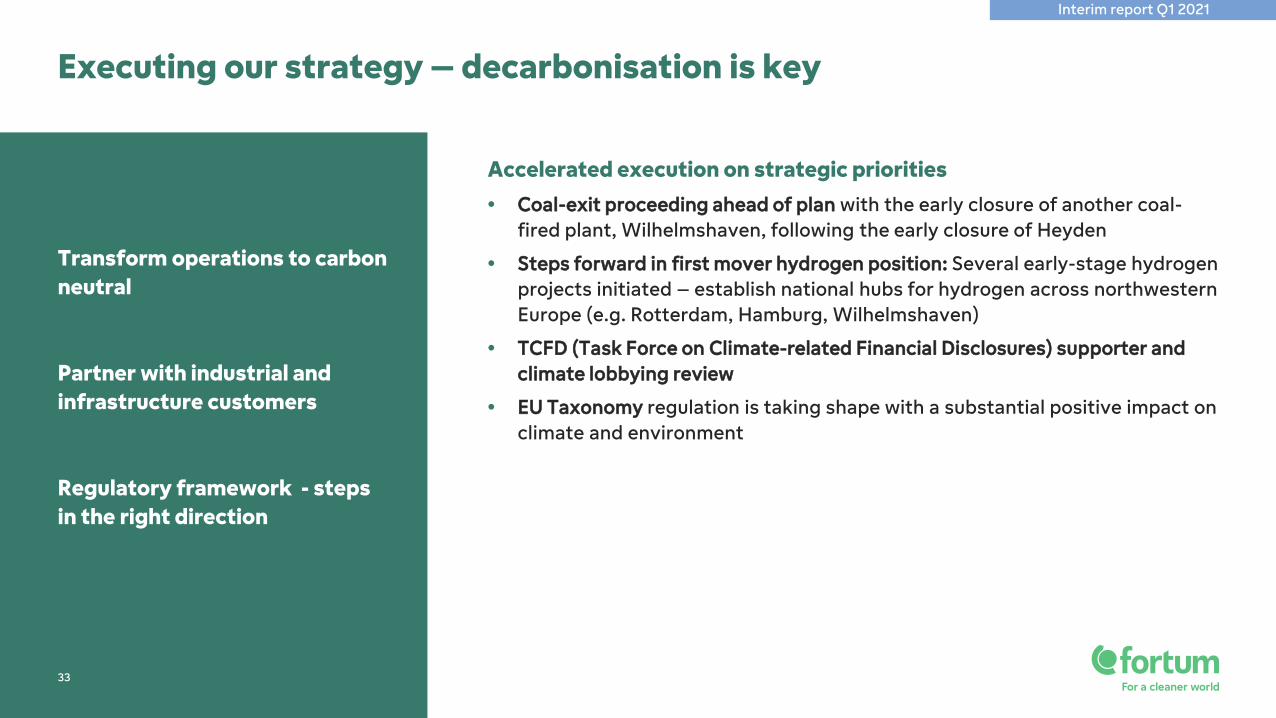
Accelerated execution on strategic priorities• Coal-exit proceeding ahead of plan with the early closure of another coal-
fired plant, Wilhelmshaven, following the early closure of Heyden
• Steps forward in first mover hydrogen position: Several early-stage hydrogen projects initiated – establish national hubs for hydrogen across northwesternEurope (e.g. Rotterdam, Hamburg, Wilhelmshaven)
• TCFD (Task Force on Climate-related Financial Disclosures) supporter and climate lobbying review
• EU Taxonomy regulation is taking shape with a substantial positive impact on climate and environment
Executing our strategy – decarbonisation is key
Fortum Interim Report January-March 202133
Transform operations to carbon neutral
Partner with industrial and infrastructure customers
Regulatory framework - steps in the right direction
33
Interim report Q1 2021
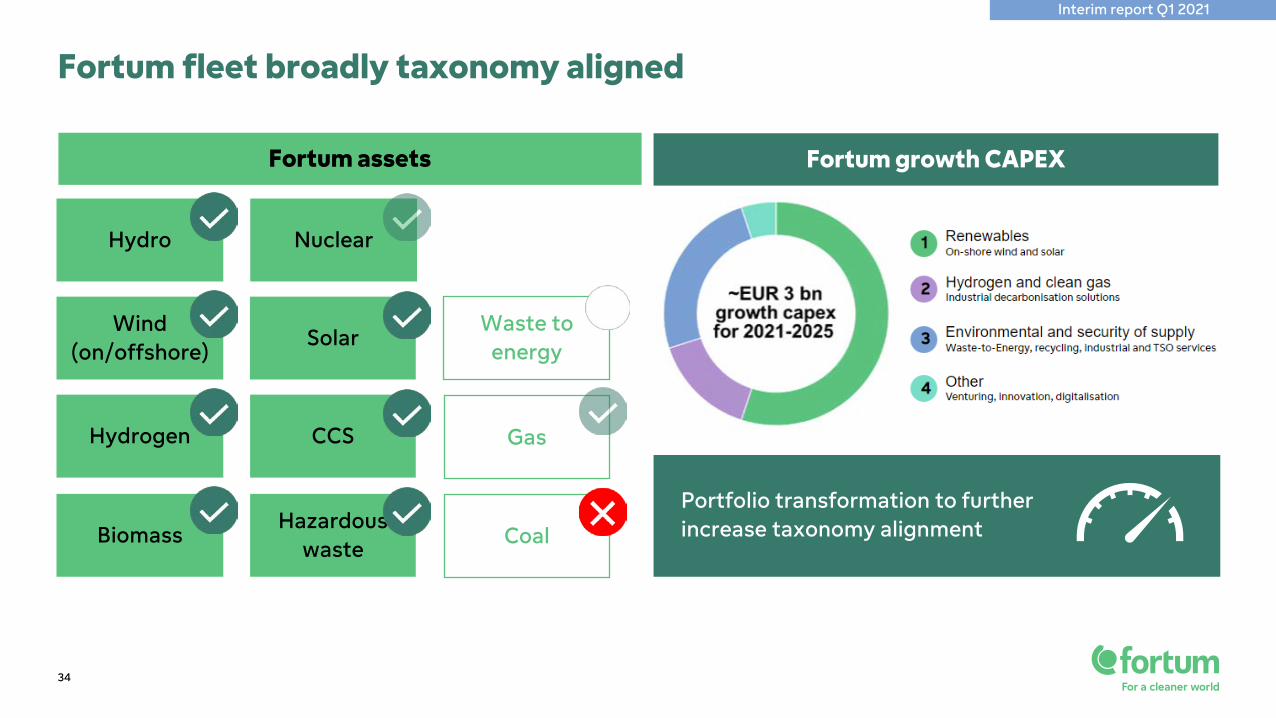
Nuclear
Solar
CCS
34
Fortum fleet broadly taxonomy aligned
Hydro
Wind(on/offshore)
Hydrogen
BiomassHazardous
waste
Waste to energy
Gas
Coal
Fortum assets Fortum growth CAPEX
Portfolio transformation to further increase taxonomy alignment
Interim report Q1 2021
Bernhard GüntherCFO
35
Interim report Q1 2021
MEUR Q1 2021 Q1 2020 2020 LTM
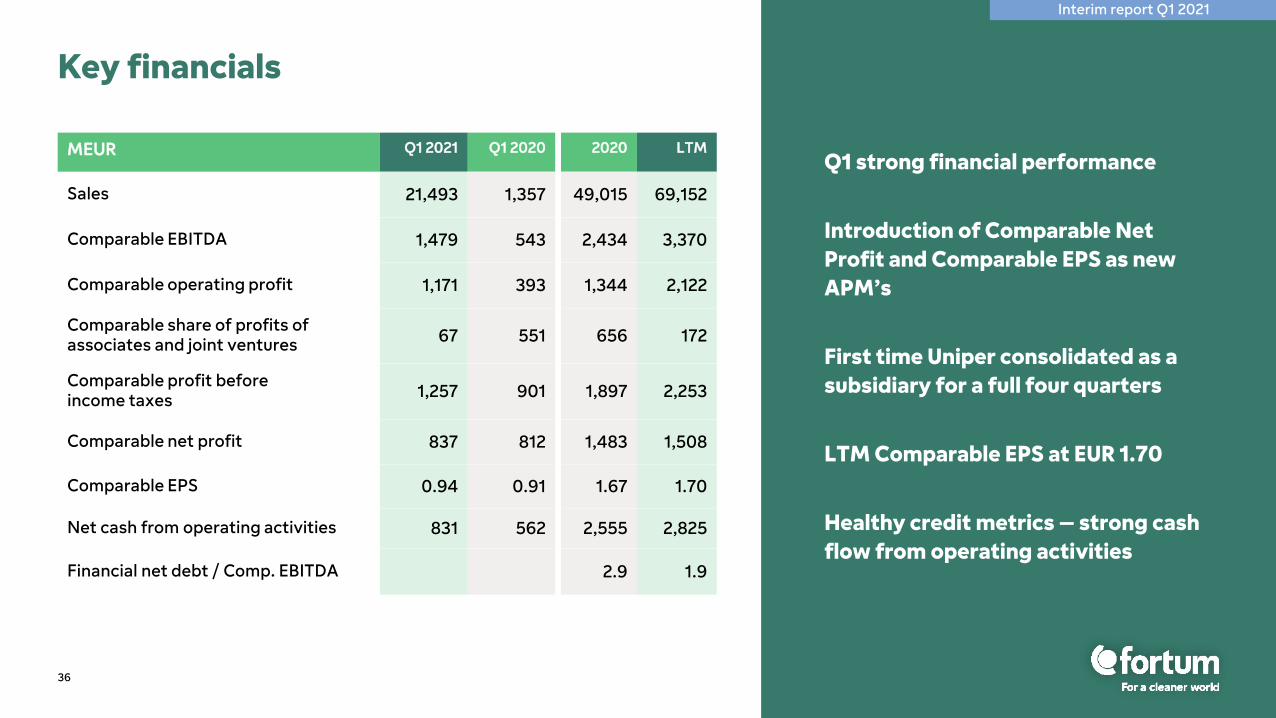
Sales 21,493 1,357 49,015 69,152
Comparable EBITDA 1,479 543 2,434 3,370
Comparable operating profit 1,171 393 1,344 2,122
Comparable share of profits of associates and joint ventures 67 551 656 172
Comparable profit before income taxes 1,257 901 1,897 2,253
Comparable net profit 837 812 1,483 1,508
Comparable EPS 0.94 0.91 1.67 1.70
Net cash from operating activities 831 562 2,555 2,825
Financial net debt / Comp. EBITDA 2.9 1.9
Key financials
36
Q1 strong financial performance
Introduction of Comparable Net Profit and Comparable EPS as new APM’s
First time Uniper consolidated as a subsidiary for a full four quarters
LTM Comparable EPS at EUR 1.70
Healthy credit metrics – strong cash flow from operating activities
Interim report Q1 2021
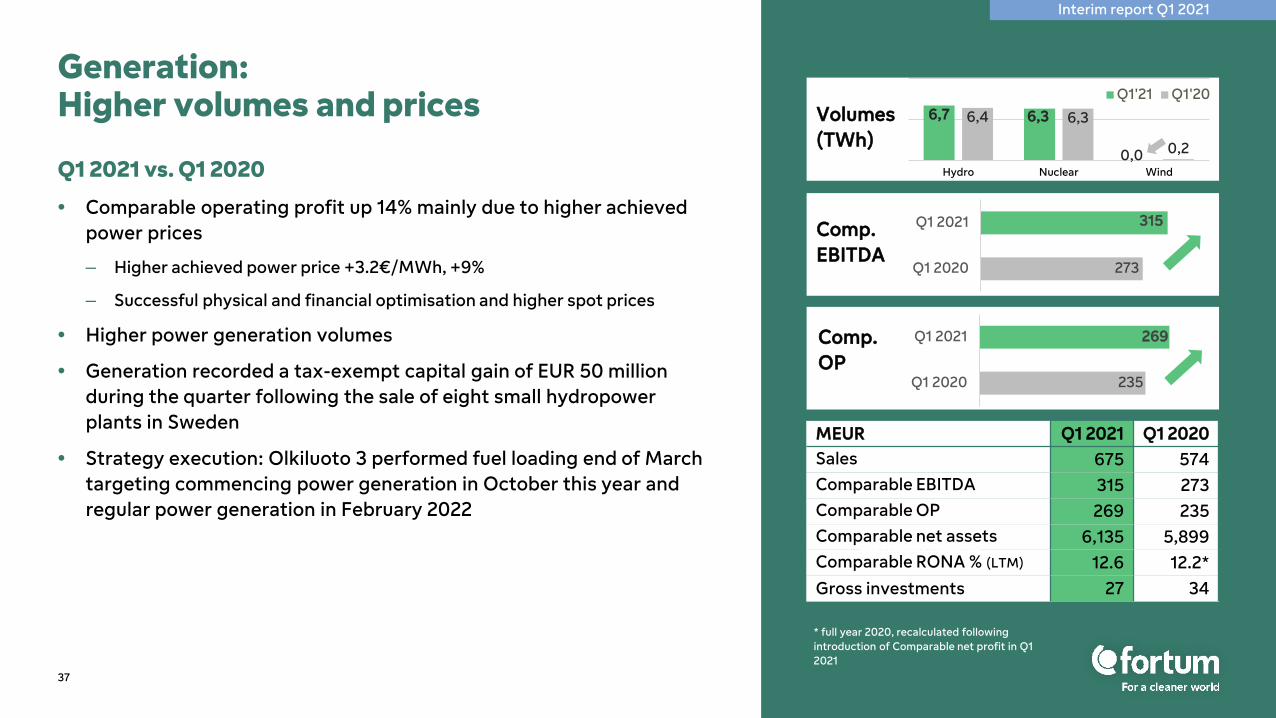
Q1 2021 vs. Q1 2020
• Comparable operating profit up 14% mainly due to higher achieved power prices
– Higher achieved power price +3.2€/MWh, +9%
– Successful physical and financial optimisation and higher spot prices
• Higher power generation volumes
• Generation recorded a tax-exempt capital gain of EUR 50 million during the quarter following the sale of eight small hydropower plants in Sweden
• Strategy execution: Olkiluoto 3 performed fuel loading end of March targeting commencing power generation in October this year and regular power generation in February 2022
Generation: Higher volumes and prices
37
Loviisa, FinlandNyagan, Russia
Comp. OP
Volumes(TWh)
6,7 6,3
0,0
6,4 6,3
0,2
Hydro Nuclear Wind
Q1'21 Q1'20
273
315
Q1 2020
Q1 2021Comp. EBITDA
MEUR Q1 2021 Q1 2020Sales 675 574Comparable EBITDA 315 273Comparable OP 269 235Comparable net assets 6,135 5,899Comparable RONA % (LTM) 12.6 12.2*Gross investments 27 34
235
269
Q1 2020
Q1 2021
* full year 2020, recalculated following introduction of Comparable net profit in Q1 2021
Interim report Q1 2021
38
Nordic hydro reservoirs towards normal levels while spot prices are catching up
Hyd
ro re
serv
oirs
Pow
er p
rice
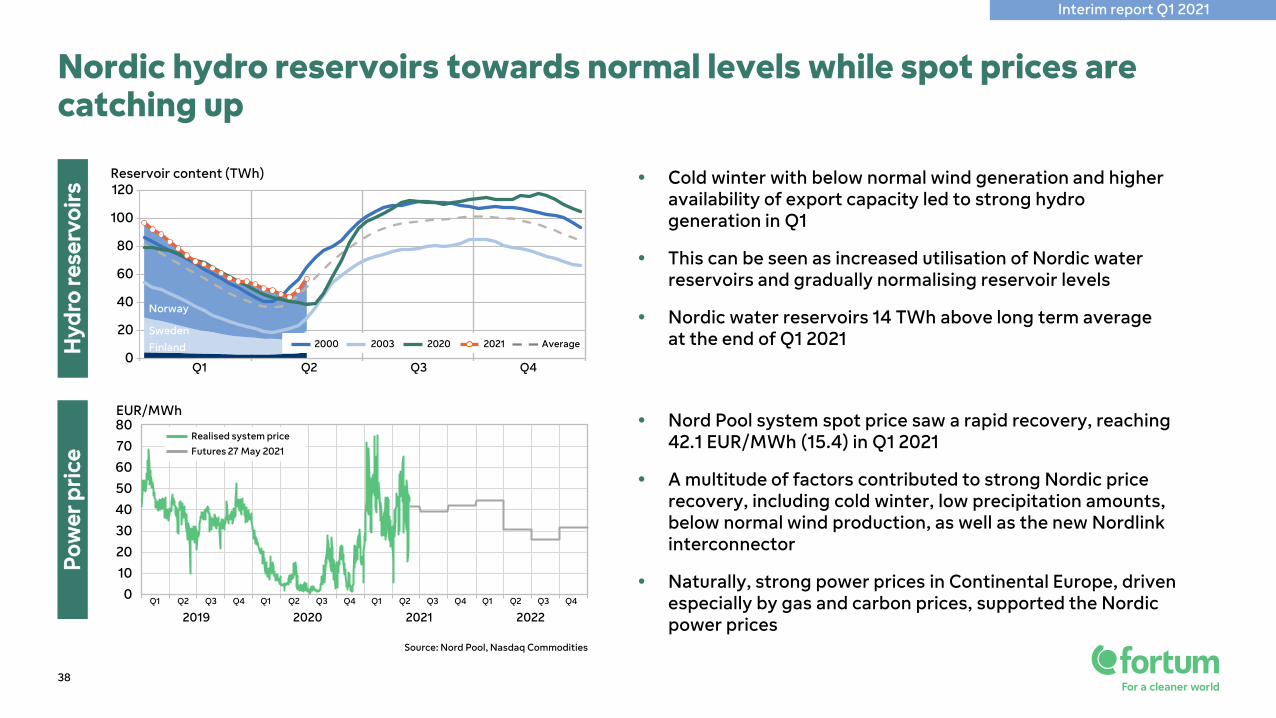
• Cold winter with below normal wind generation and higher availability of export capacity led to strong hydro generation in Q1
• This can be seen as increased utilisation of Nordic water reservoirs and gradually normalising reservoir levels
• Nordic water reservoirs 14 TWh above long term average at the end of Q1 2021
• Nord Pool system spot price saw a rapid recovery, reaching 42.1 EUR/MWh (15.4) in Q1 2021
• A multitude of factors contributed to strong Nordic price recovery, including cold winter, low precipitation amounts, below normal wind production, as well as the new Nordlink interconnector
• Naturally, strong power prices in Continental Europe, driven especially by gas and carbon prices, supported the Nordic power prices
Q1 Q2 Q3 Q4
0
20
40
60
80
100
120
2000 2003 2020 Average2021
Reservoir content (TWh)
FinlandSweden
Norway
EUR/MWh
Q1 Q2 Q3 Q4 Q1 Q2 Q3 Q4 Q1 Q2 Q3 Q4Q1 Q2 Q3 Q4
2019 2020 2021 2022
0
10
20
30
40
50
60
80
70 Futures 27 May 2021
Realised system price
Source: Nord Pool, Nasdaq Commodities
Interim report Q1 2021
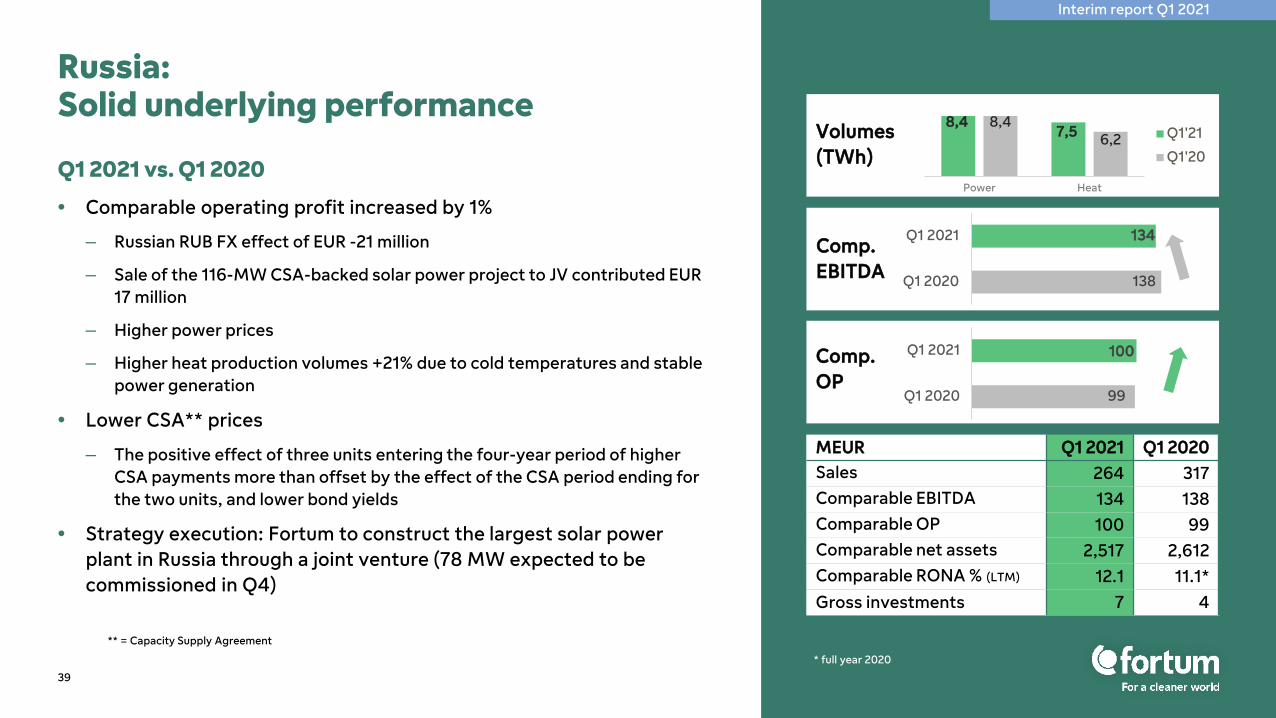
Q1 2021 vs. Q1 2020
• Comparable operating profit increased by 1%
– Russian RUB FX effect of EUR -21 million
– Sale of the 116-MW CSA-backed solar power project to JV contributed EUR 17 million
– Higher power prices
– Higher heat production volumes +21% due to cold temperatures and stable power generation
• Lower CSA** prices
– The positive effect of three units entering the four-year period of higher CSA payments more than offset by the effect of the CSA period ending for the two units, and lower bond yields
• Strategy execution: Fortum to construct the largest solar power plant in Russia through a joint venture (78 MW expected to be commissioned in Q4)
Russia: Solid underlying performance
39
** = Capacity Supply Agreement
Comp. EBITDA
Comp. OP
MEUR Q1 2021 Q1 2020Sales 264 317Comparable EBITDA 134 138Comparable OP 100 99Comparable net assets 2,517 2,612Comparable RONA % (LTM) 12.1 11.1*Gross investments 7 4
Volumes(TWh)
8,47,5
8,46,2
Power Heat
Q1'21
Q1'20
138
134
Q1 2020
Q1 2021
99
100
Q1 2020
Q1 2021
* full year 2020
Interim report Q1 2021
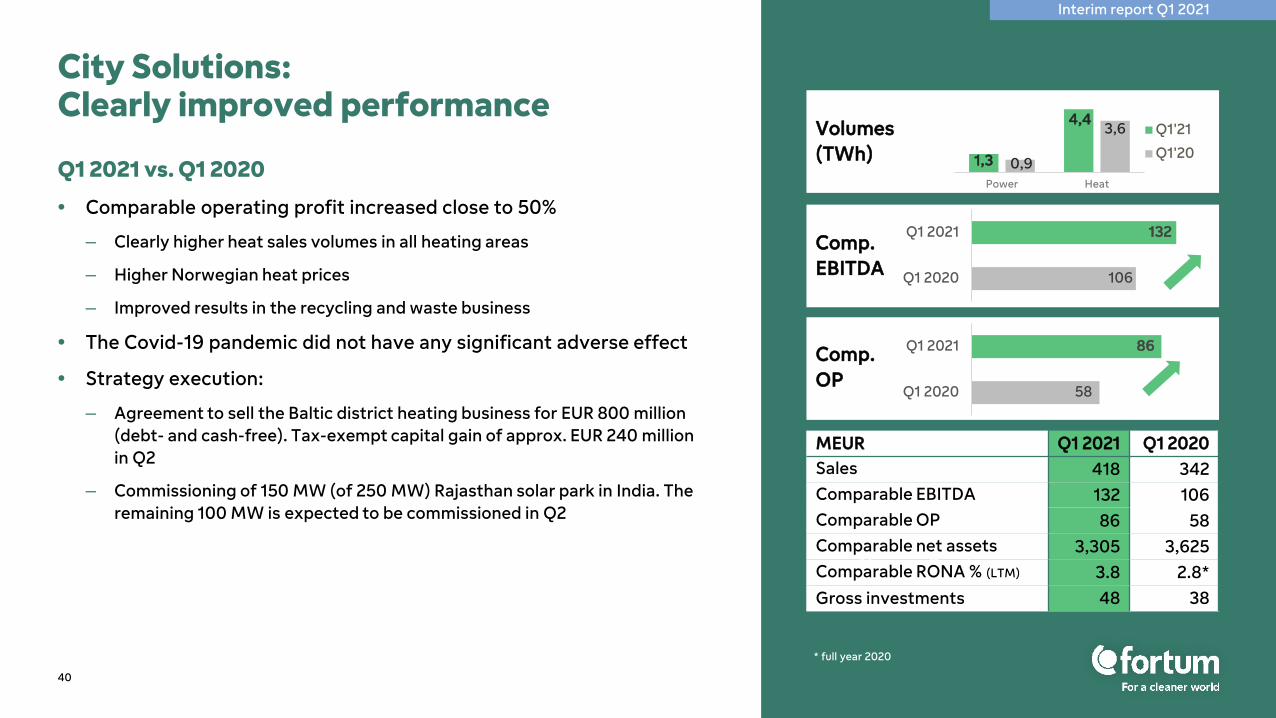
Q1 2021 vs. Q1 2020
• Comparable operating profit increased close to 50%
– Clearly higher heat sales volumes in all heating areas
– Higher Norwegian heat prices
– Improved results in the recycling and waste business
• The Covid-19 pandemic did not have any significant adverse effect
• Strategy execution:
– Agreement to sell the Baltic district heating business for EUR 800 million (debt- and cash-free). Tax-exempt capital gain of approx. EUR 240 million in Q2
– Commissioning of 150 MW (of 250 MW) Rajasthan solar park in India. The remaining 100 MW is expected to be commissioned in Q2
City Solutions:Clearly improved performance
40
Nyagan, Russia
Comp. EBITDA
Comp. OP
Volumes(TWh) 1,3
4,4
0,9
3,6
Power Heat
Q1'21
Q1'20
MEUR Q1 2021 Q1 2020Sales 418 342Comparable EBITDA 132 106Comparable OP 86 58Comparable net assets 3,305 3,625Comparable RONA % (LTM) 3.8 2.8*Gross investments 48 38
106
132
Q1 2020
Q1 2021
58
86
Q1 2020
Q1 2021
* full year 2020
Interim report Q1 2021
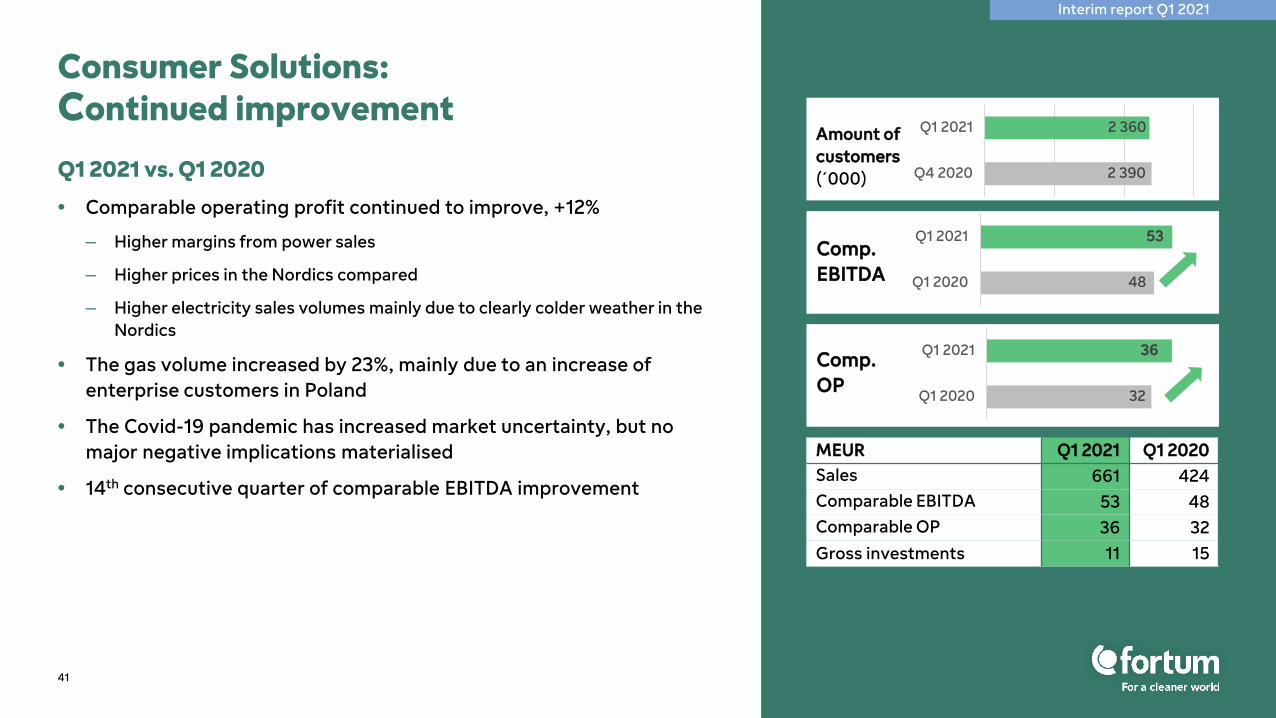
Q1 2021 vs. Q1 2020
• Comparable operating profit continued to improve, +12%
– Higher margins from power sales
– Higher prices in the Nordics compared
– Higher electricity sales volumes mainly due to clearly colder weather in the Nordics
• The gas volume increased by 23%, mainly due to an increase of enterprise customers in Poland
• The Covid-19 pandemic has increased market uncertainty, but no major negative implications materialised
• 14th consecutive quarter of comparable EBITDA improvement
Consumer Solutions: Continued improvement
41
2 390
2 360
Q4 2020
Q1 2021Amount of customers(´000)
Comp. EBITDA
Comp. OP
MEUR Q1 2021 Q1 2020Sales 661 424Comparable EBITDA 53 48Comparable OP 36 32Gross investments 11 15
48
53
Q1 2020
Q1 2021
32
36
Q1 2020
Q1 2021
Interim report Q1 2021
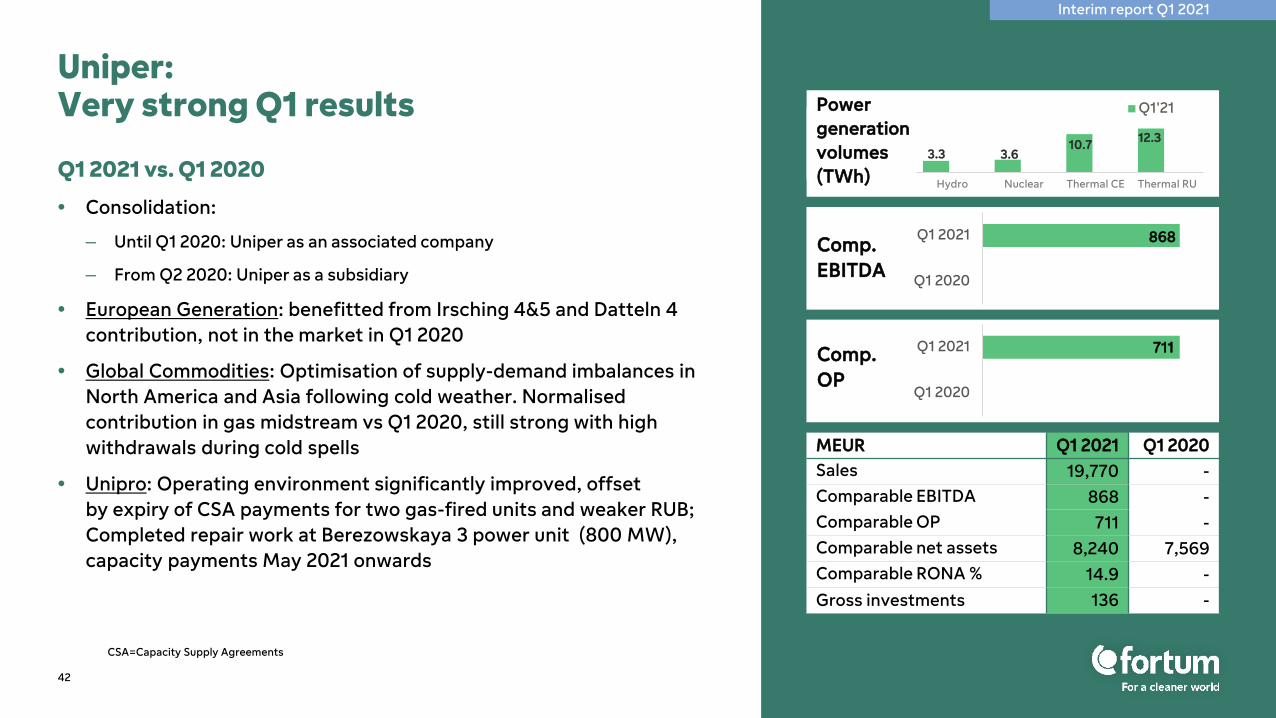
Q1 2021 vs. Q1 2020
• Consolidation:
– Until Q1 2020: Uniper as an associated company
– From Q2 2020: Uniper as a subsidiary
• European Generation: benefitted from Irsching 4&5 and Datteln 4 contribution, not in the market in Q1 2020
• Global Commodities: Optimisation of supply-demand imbalances in North America and Asia following cold weather. Normalised contribution in gas midstream vs Q1 2020, still strong with high withdrawals during cold spells
• Unipro: Operating environment significantly improved, offset by expiry of CSA payments for two gas-fired units and weaker RUB; Completed repair work at Berezowskaya 3 power unit (800 MW), capacity payments May 2021 onwards
Uniper: Very strong Q1 results
42
CSA=Capacity Supply Agreements
MEUR Q1 2021 Q1 2020Sales 19,770 -Comparable EBITDA 868 -Comparable OP 711 -Comparable net assets 8,240 7,569Comparable RONA % 14.9 -Gross investments 136 -
Powergenerationvolumes(TWh)
Q1 2020
Q1 2021Comp. EBITDA
868
Comp. OP
Q1 2020
Q1 2021 711
3.3 3.610.7 12.3
Hydro Nuclear Thermal CE Thermal RU
Q1'21
Interim report Q1 2021
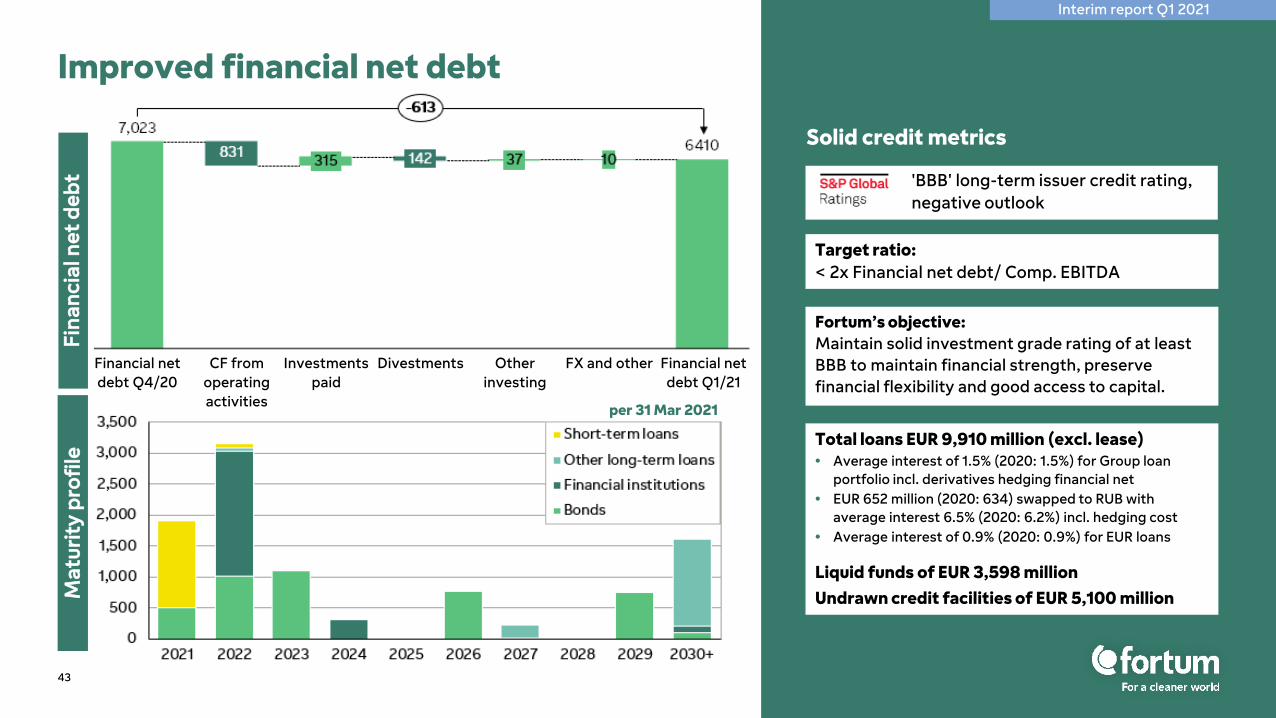
Improved financial net debt
43
'BBB' long-term issuer credit rating, negative outlook
Target ratio:< 2x Financial net debt/ Comp. EBITDA
Fortum’s objective:Maintain solid investment grade rating of at least BBB to maintain financial strength, preserve financial flexibility and good access to capital.
Total loans EUR 9,910 million (excl. lease)• Average interest of 1.5% (2020: 1.5%) for Group loan
portfolio incl. derivatives hedging financial net• EUR 652 million (2020: 634) swapped to RUB with
average interest 6.5% (2020: 6.2%) incl. hedging cost• Average interest of 0.9% (2020: 0.9%) for EUR loans
Liquid funds of EUR 3,598 millionUndrawn credit facilities of EUR 5,100 million
Fina
ncia
l net
deb
t
Solid credit metrics
Mat
urit
y pr
ofile
Fina
ncia
l net
deb
t
Interim report Q1 2021
per 31 Mar 2021
Financial net debt Q4/20
DivestmentsInvestments paid
CF from operating activities
Other investing
FX and other Financial net debt Q1/21
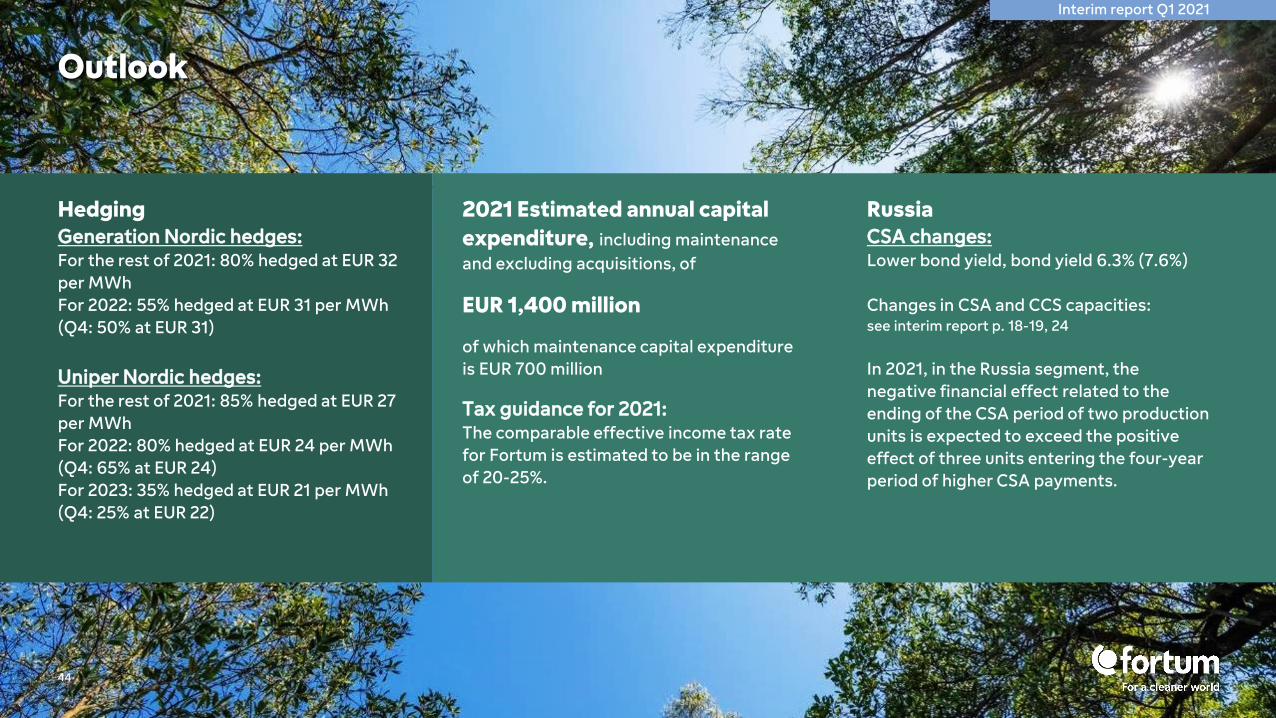
Outlook
44
2021 Estimated annual capital expenditure, including maintenance and excluding acquisitions, of
EUR 1,400 million
of which maintenance capital expenditure is EUR 700 million
Tax guidance for 2021:The comparable effective income tax rate for Fortum is estimated to be in the range of 20-25%.
HedgingGeneration Nordic hedges:For the rest of 2021: 80% hedged at EUR 32 per MWh For 2022: 55% hedged at EUR 31 per MWh (Q4: 50% at EUR 31)
Uniper Nordic hedges:For the rest of 2021: 85% hedged at EUR 27 per MWhFor 2022: 80% hedged at EUR 24 per MWh(Q4: 65% at EUR 24) For 2023: 35% hedged at EUR 21 per MWh (Q4: 25% at EUR 22)
RussiaCSA changes:Lower bond yield, bond yield 6.3% (7.6%)
Changes in CSA and CCS capacities:see interim report p. 18-19, 24
In 2021, in the Russia segment, the negative financial effect related to the ending of the CSA period of two production units is expected to exceed the positive effect of three units entering the four-year period of higher CSA payments.
Interim report Q1 2021
Appendices
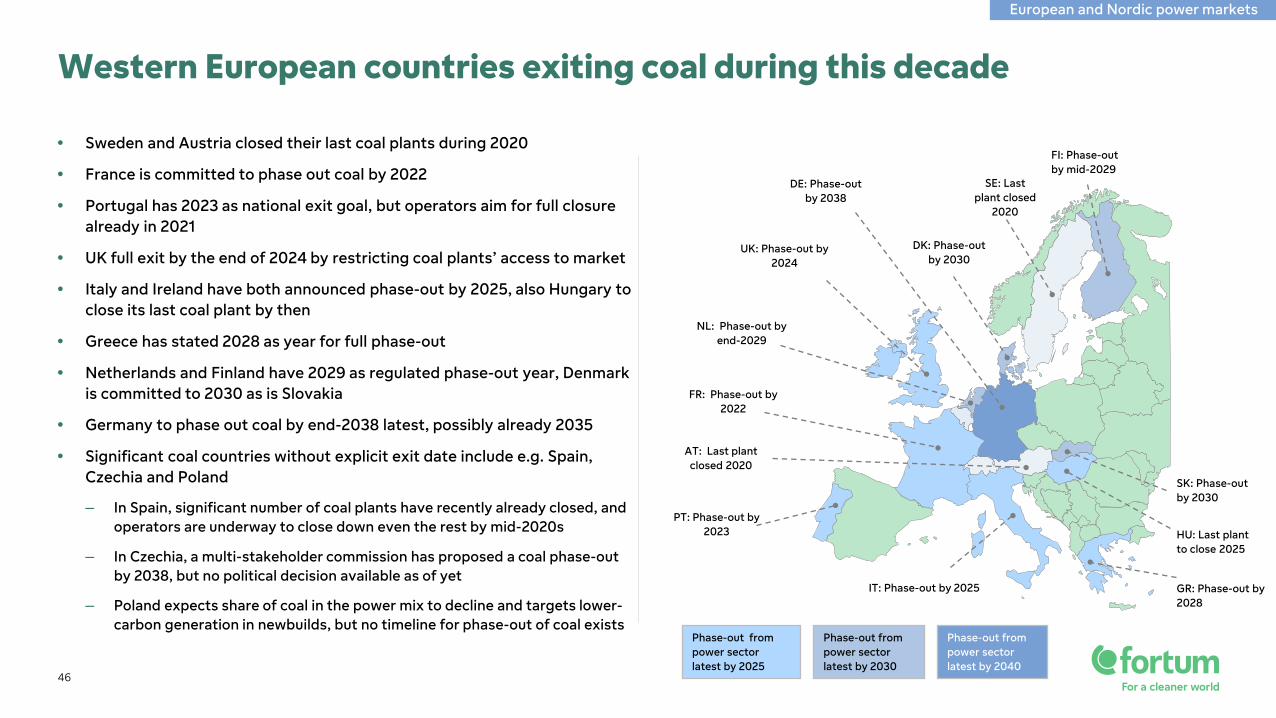
• Sweden and Austria closed their last coal plants during 2020
• France is committed to phase out coal by 2022
• Portugal has 2023 as national exit goal, but operators aim for full closure already in 2021
• UK full exit by the end of 2024 by restricting coal plants’ access to market
• Italy and Ireland have both announced phase-out by 2025, also Hungary to close its last coal plant by then
• Greece has stated 2028 as year for full phase-out
• Netherlands and Finland have 2029 as regulated phase-out year, Denmark is committed to 2030 as is Slovakia
• Germany to phase out coal by end-2038 latest, possibly already 2035
• Significant coal countries without explicit exit date include e.g. Spain, Czechia and Poland
– In Spain, significant number of coal plants have recently already closed, and operators are underway to close down even the rest by mid-2020s
– In Czechia, a multi-stakeholder commission has proposed a coal phase-out by 2038, but no political decision available as of yet
– Poland expects share of coal in the power mix to decline and targets lower-carbon generation in newbuilds, but no timeline for phase-out of coal exists
46
Western European countries exiting coal during this decade
IT: Phase-out by 2025
AT: Last plant closed 2020
FI: Phase-out by mid-2029
UK: Phase-out by 2024
NL: Phase-out by end-2029
PT: Phase-out by 2023
Phase-out from power sector latest by 2025
Phase-out from power sector latest by 2030
SE: Last plant closed
2020
DE: Phase-out by 2038
Phase-out from power sector latest by 2040
European and Nordic power markets
DK: Phase-out by 2030
GR: Phase-out by 2028
HU: Last plant to close 2025
SK: Phase-out by 2030
FR: Phase-out by 2022
0
100
200
300
400
2017 2018 2019 2020
Eur/t
47
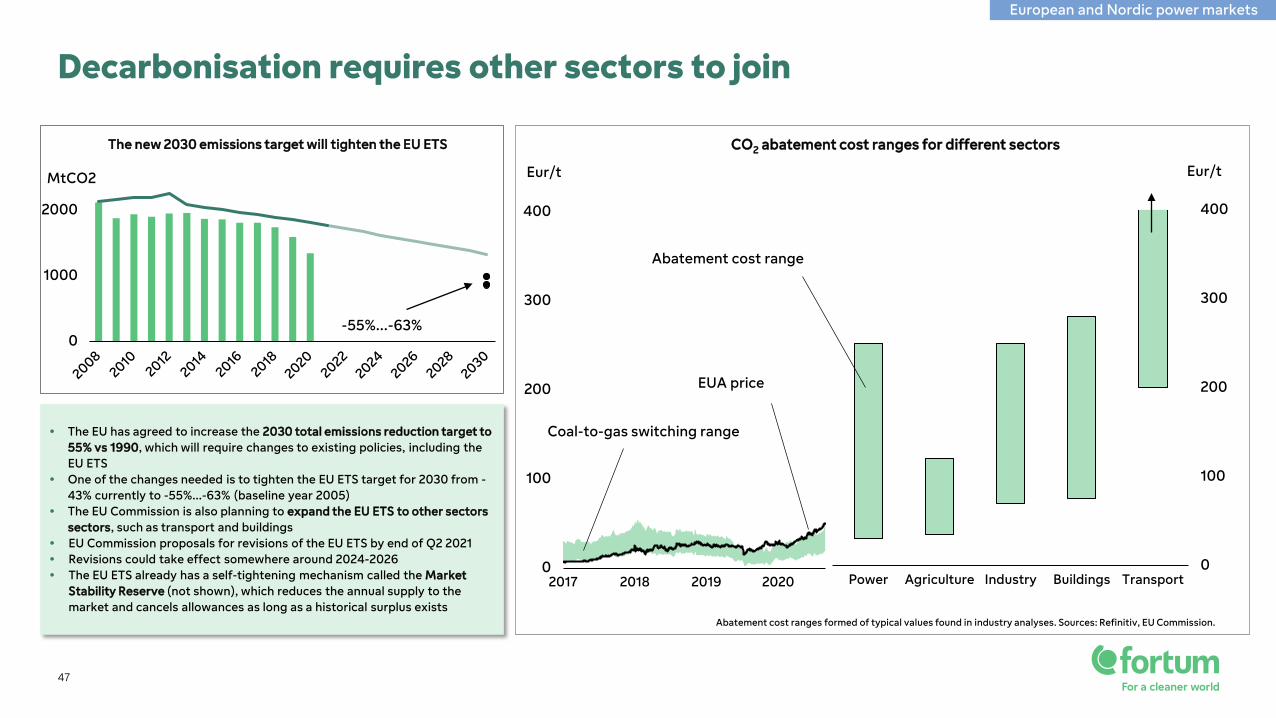
Decarbonisation requires other sectors to join
• The EU has agreed to increase the 2030 total emissions reduction target to 55% vs 1990, which will require changes to existing policies, including the EU ETS
• One of the changes needed is to tighten the EU ETS target for 2030 from -43% currently to -55%...-63% (baseline year 2005)
• The EU Commission is also planning to expand the EU ETS to other sectors sectors, such as transport and buildings
• EU Commission proposals for revisions of the EU ETS by end of Q2 2021• Revisions could take effect somewhere around 2024-2026• The EU ETS already has a self-tightening mechanism called the Market
Stability Reserve (not shown), which reduces the annual supply to the market and cancels allowances as long as a historical surplus exists
CO2 abatement cost ranges for different sectors
European and Nordic power markets
0
100
200
300
400
Power Agriculture Industry Buildings Transport
Eur/t
Coal-to-gas switching range
EUA price
Abatement cost range
Abatement cost ranges formed of typical values found in industry analyses. Sources: Refinitiv, EU Commission.
0
1000
2000
MtCO2
The new 2030 emissions target will tighten the EU ETS
-55%...-63%
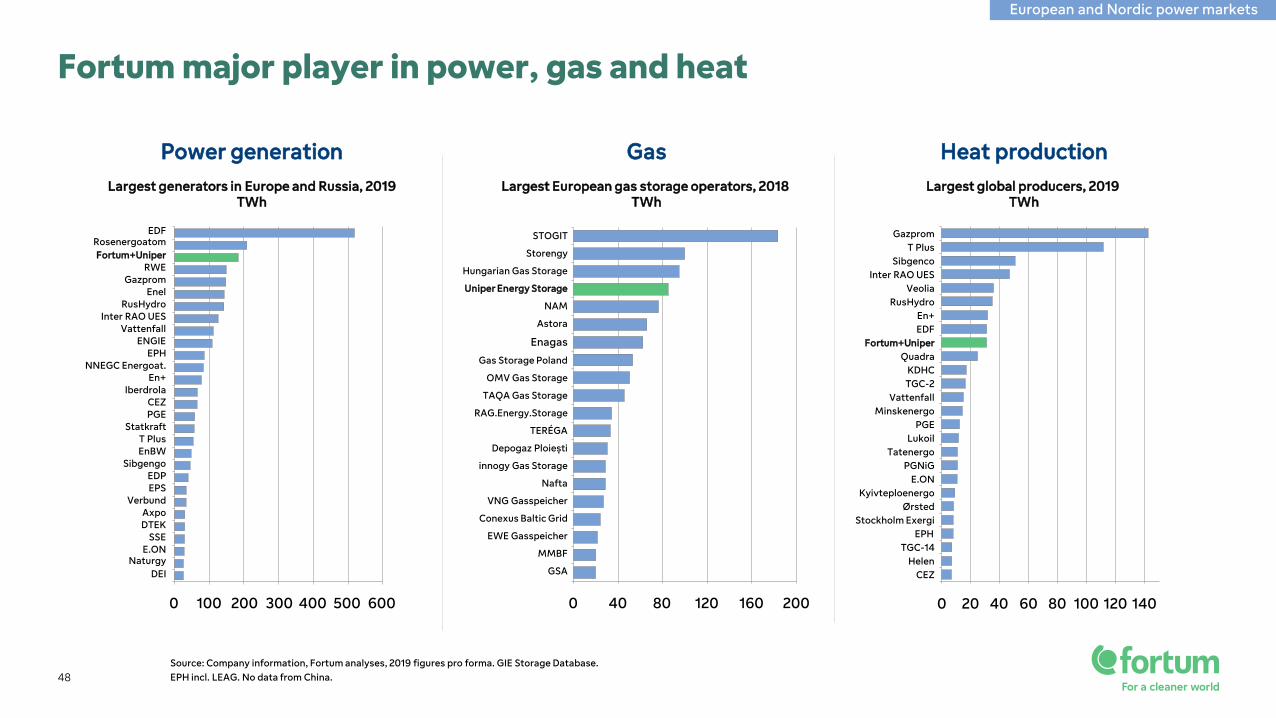
Fortum major player in power, gas and heat
48
0 100 200 300 400 500 600
NNEGC Energoat.En+
RusHydro
Rosenergoatom
T Plus
DEI
Fortum+Uniper
EPH
Statkraft
Enel
CEZ
E.ON
EnBW
GazpromRWE
EDF
Inter RAO UES
EDP
ENGIEVattenfall
Sibgengo
DTEK
EPS
PGE
Iberdrola
Verbund
SSE
Axpo
Naturgy
0 20 40 60 80 100 120 140
KDHC
En+
TGC-2
Minskenergo
Quadra
TatenergoLukoil
Kyivteploenergo
Sibgenco
Fortum+Uniper
Ørsted
TGC-14
T Plus
Vattenfall
PGNiG
Inter RAO UES
EDF
RusHydroVeolia
Gazprom
Stockholm Exergi
CEZ
PGE
Helen
E.ON
EPH
0 80 20040 120 160
NAM
Hungarian Gas Storage
Astora
Enagas
STOGIT
TAQA Gas Storage
OMV Gas Storage
Uniper Energy Storage
Storengy
Gas Storage Poland
RAG.Energy.Storage
TERÉGA
Depogaz Ploiești
innogy Gas Storage
Nafta
VNG Gasspeicher
Conexus Baltic Grid
EWE Gasspeicher
MMBF
GSA
Power generationLargest generators in Europe and Russia, 2019
TWh
GasLargest European gas storage operators, 2018
TWh
Heat productionLargest global producers, 2019
TWh
European and Nordic power markets
Source: Company information, Fortum analyses, 2019 figures pro forma. GIE Storage Database.EPH incl. LEAG. No data from China.
Q2/21Q1/19 Q2/19 Q3/19 Q4/19 Q1/20 Q3/20Q2/20 Q4/20 Q1/21
USD / bbl100
80
60
40
20
0
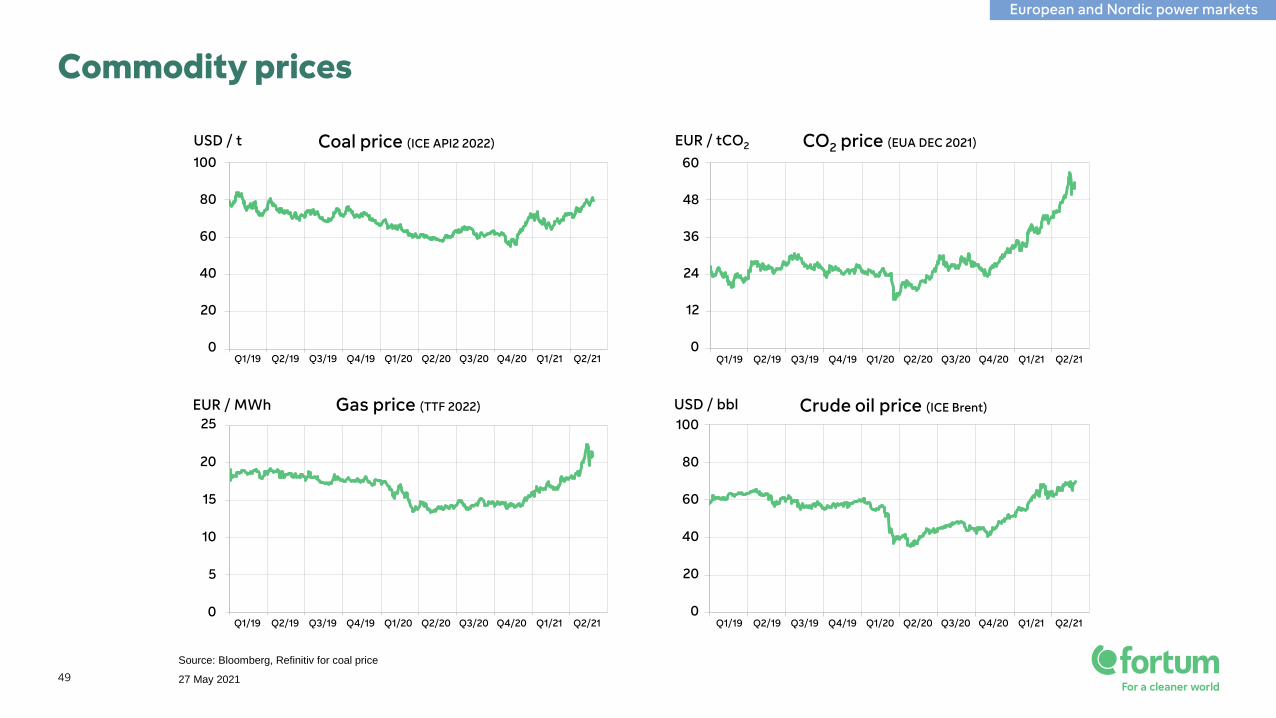
Crude oil price (ICE Brent)
Q2/21Q1/19 Q2/19 Q3/19 Q4/19 Q1/20 Q3/20Q2/20 Q4/20 Q1/21
EUR / tCO2 CO2 price (EUA DEC 2021)
60
48
36
24
12
0
Q2/21Q1/19 Q2/19 Q3/19 Q4/19 Q1/20 Q3/20Q2/20 Q4/20 Q1/21
USD / t Coal price (ICE API2 2022)
100
80
60
40
20
0
EUR / MWh25
20
15
10
5
0
Gas price (TTF 2022)
Q2/21Q1/19 Q2/19 Q3/19 Q4/19 Q1/20 Q3/20Q2/20 Q4/20 Q1/21
49
Commodity prices
Source: Bloomberg, Refinitiv for coal price
27 May 2021
European and Nordic power markets
50
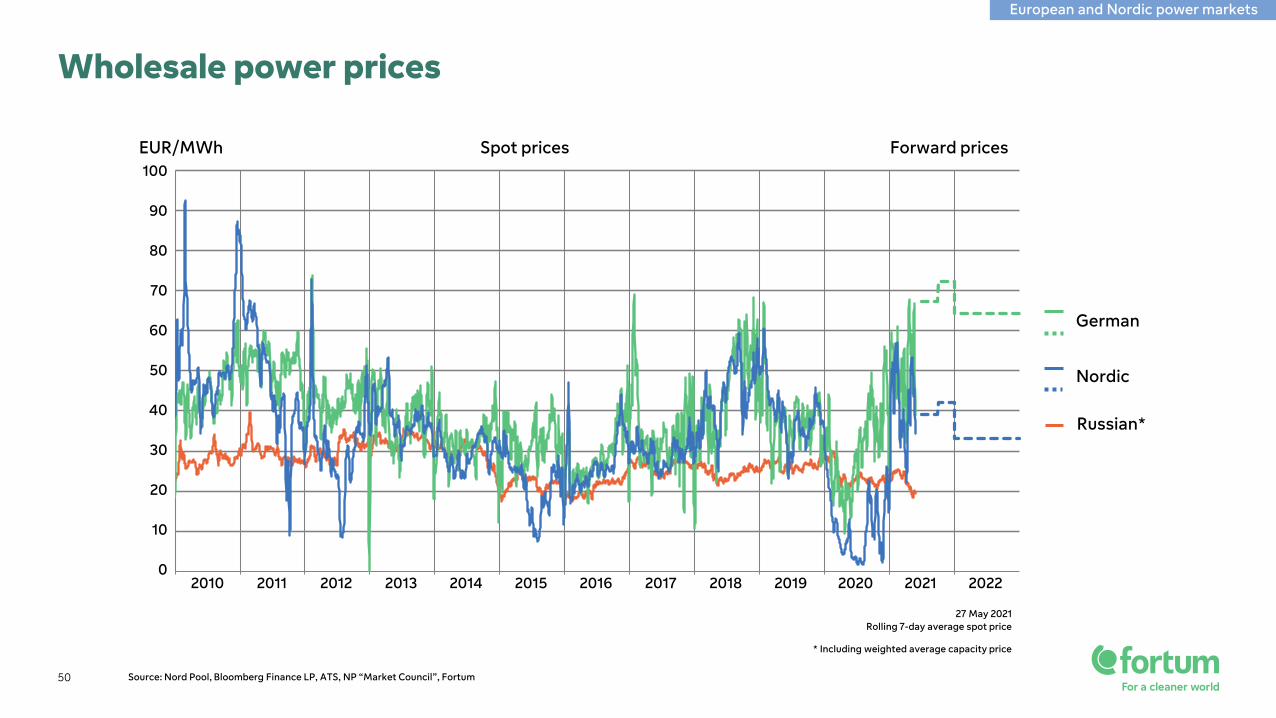
Wholesale power prices
Source: Nord Pool, Bloomberg Finance LP, ATS, NP “Market Council”, Fortum
* Including weighted average capacity price
27 May 2021Rolling 7-day average spot price
German
Nordic
Russian*
Spot prices Forward pricesEUR/MWh
10
20
30
40
50
60
70
80
90
100
02010 2011 2012 2013 2014 2015 2016 2017 2018 2019 20222020 2021
European and Nordic power markets

51
Nordic year forwards
Source: Nasdaq Commodities, Bloomberg
European and Nordic power markets
0
10
20
30
40
50
60
70
€/MWh
20142008 2009 2010 2011 2012 2013 2015 2016 2017 2018 20212019 2020
Year15 Year17 Year19Year10 Year11 Year12 Year13 Year14 Year16 Year18 Year20 Year21 Year22 Year23
27 May 2021
Apr2021
Mar2021
Feb2021
Year22
Year23
May2021
52
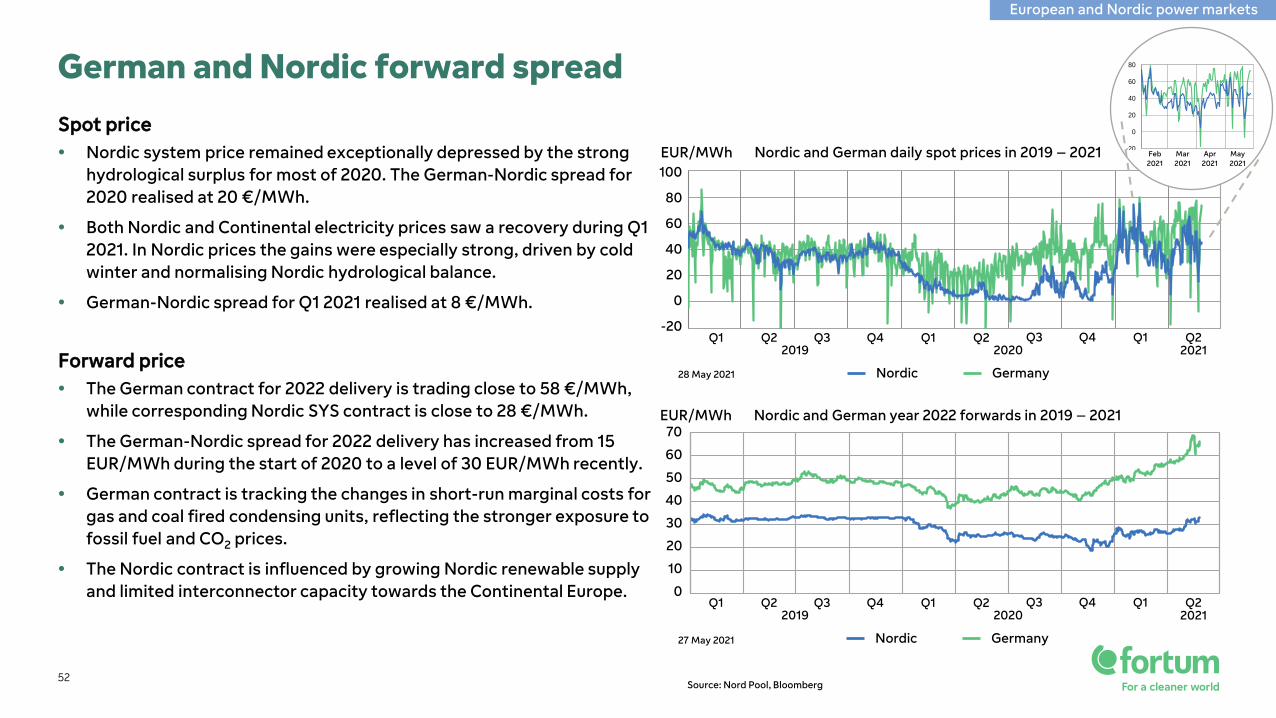
German and Nordic forward spreadSpot price• Nordic system price remained exceptionally depressed by the strong
hydrological surplus for most of 2020. The German-Nordic spread for 2020 realised at 20 €/MWh.
• Both Nordic and Continental electricity prices saw a recovery during Q1 2021. In Nordic prices the gains were especially strong, driven by cold winter and normalising Nordic hydrological balance.
• German-Nordic spread for Q1 2021 realised at 8 €/MWh.
Forward price• The German contract for 2022 delivery is trading close to 58 €/MWh,
while corresponding Nordic SYS contract is close to 28 €/MWh.
• The German-Nordic spread for 2022 delivery has increased from 15 EUR/MWh during the start of 2020 to a level of 30 EUR/MWh recently.
• German contract is tracking the changes in short-run marginal costs for gas and coal fired condensing units, reflecting the stronger exposure to fossil fuel and CO2 prices.
• The Nordic contract is influenced by growing Nordic renewable supply and limited interconnector capacity towards the Continental Europe.
Source: Nord Pool, Bloomberg
European and Nordic power markets
Nordic and German year 2022 forwards in 2019 – 2021EUR/MWh
GermanyNordic
Q1 Q32019
Q2 Q4 Q12020
Q2 Q4Q3 Q12021Q2
0
20
40
60
10
30
50
70
27 May 2021
-20
20
40
60
100
80
0
Nordic and German daily spot prices in 2019 – 2021EUR/MWh
Q1 Q32019
Q2 Q4 Q12020
Q2 Q4Q3 Q12021Q2
GermanyNordic28 May 2021
-20
0
20
40
60
80
Mar2021
Feb2021
Apr2021
May2021
0
10
20
30
40
50
60
70
80EUR / tCO2 CO2 price (EUA DEC 2021) & Nordic sys spot price
Oct Nov Dec Jan Feb March April May
53
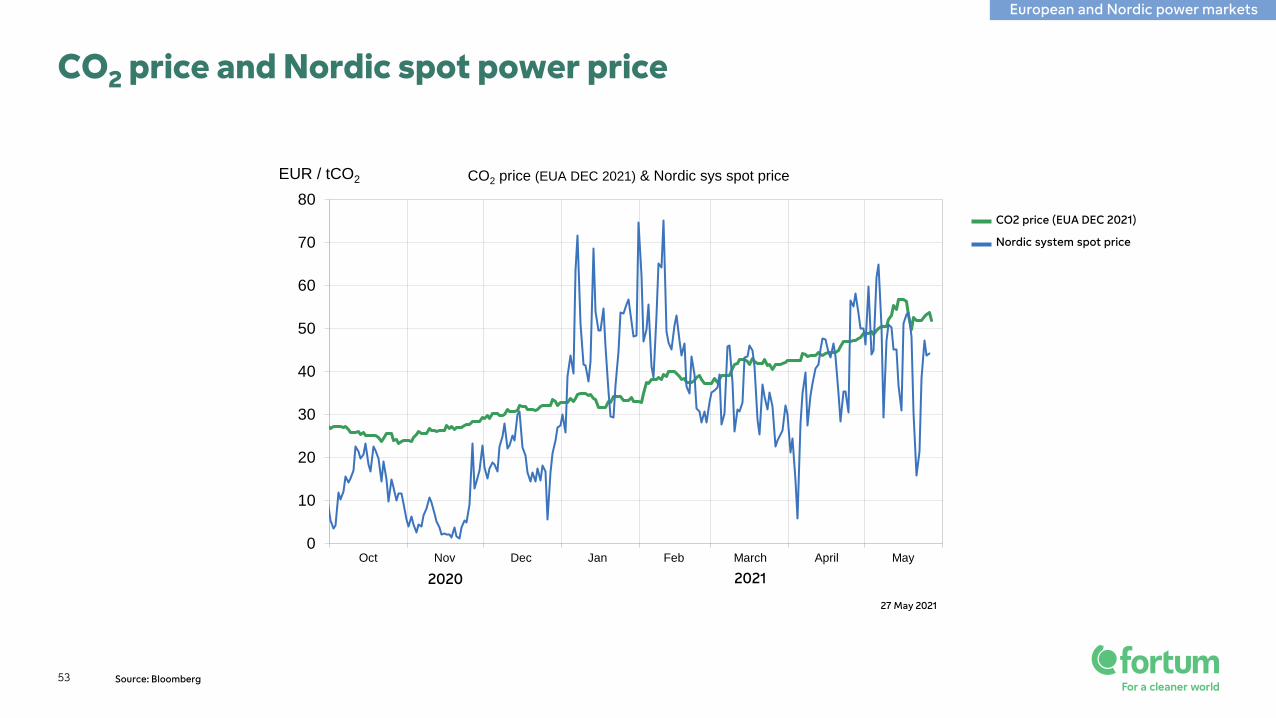
CO2 price and Nordic spot power price
Source: Bloomberg
Nordic system spot price
CO2 price (EUA DEC 2021)
2020 2021
27 May 2021
European and Nordic power markets
0
10
20
30
40
50
60EUR / tCO2 CO2 price (EUA DEC 2021) & Year 22 forward price
Oct Nov Dec Jan Feb March April May
54
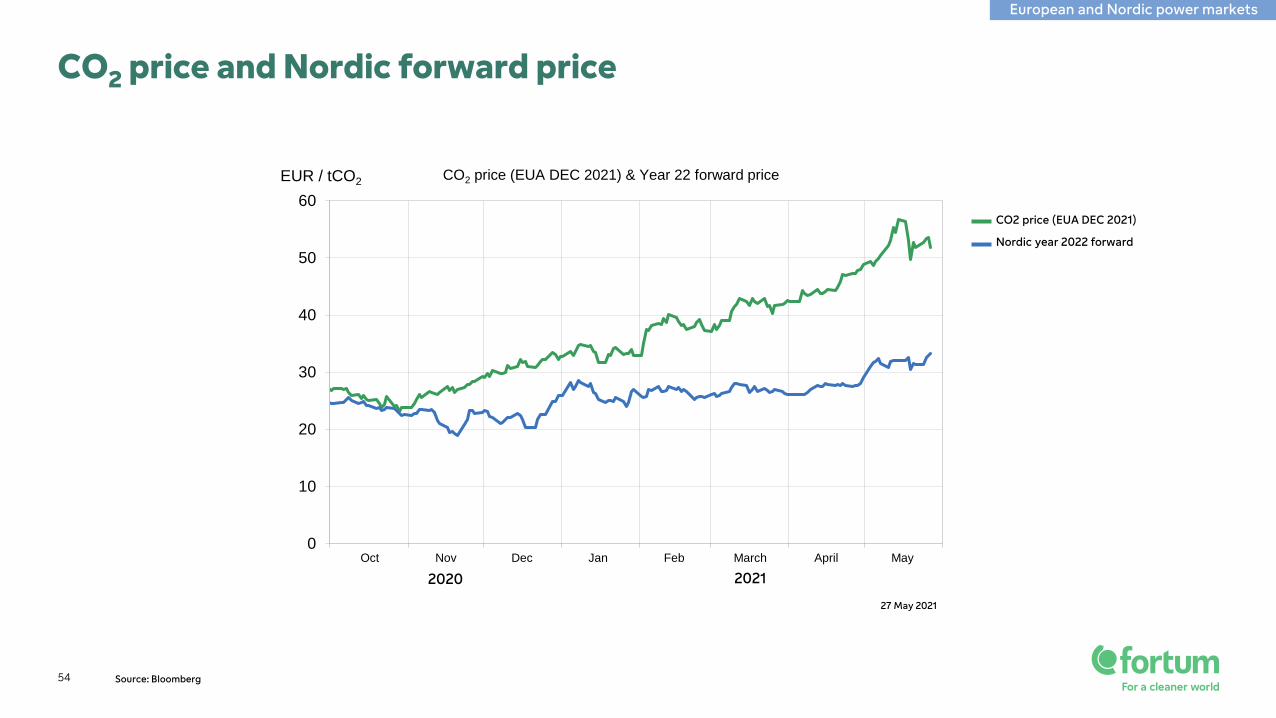
CO2 price and Nordic forward price
Nordic year 2022 forward
CO2 price (EUA DEC 2021)
2020 2021
Source: Bloomberg
27 May 2021
European and Nordic power markets
55
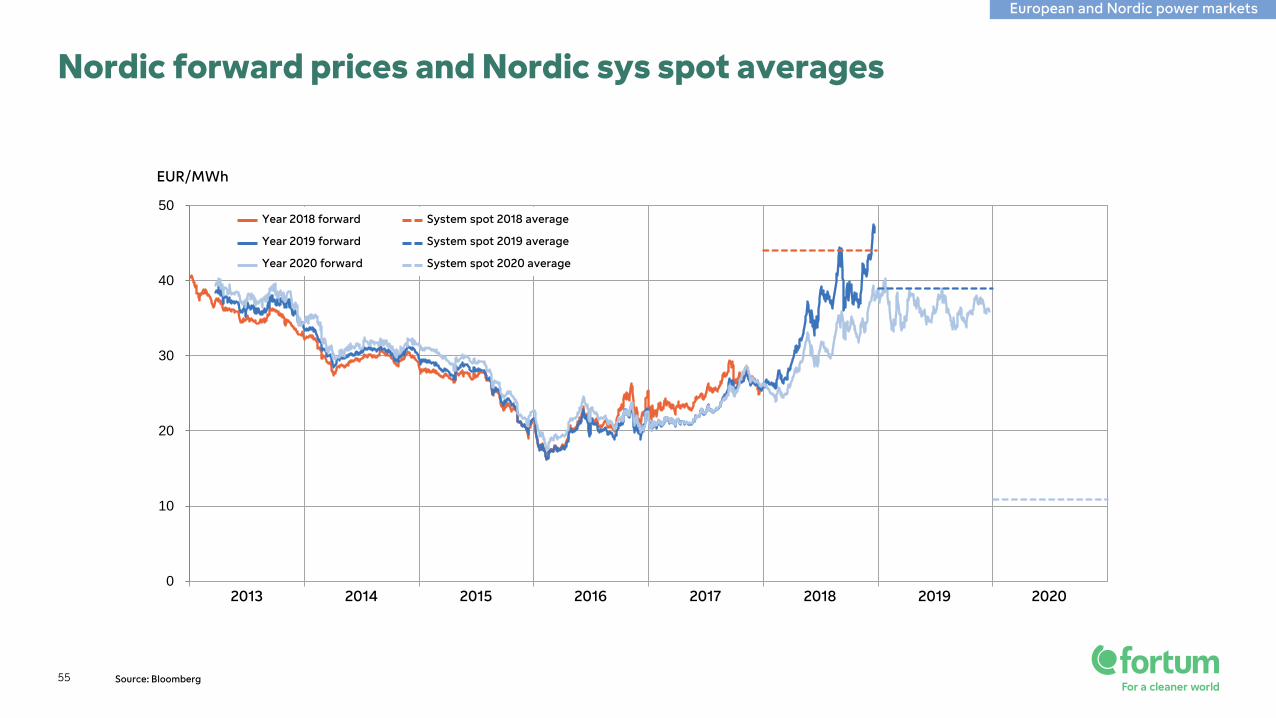
Nordic forward prices and Nordic sys spot averages
Source: Bloomberg
0
10
20
30
40
50
2013 2014 2015 2016 2017 2018 2019 2020
EUR/MWh
Year 2019 forward
Year 2018 forward
Year 2020 forward
System spot 2019 average
System spot 2018 average
System spot 2020 average
European and Nordic power markets
56
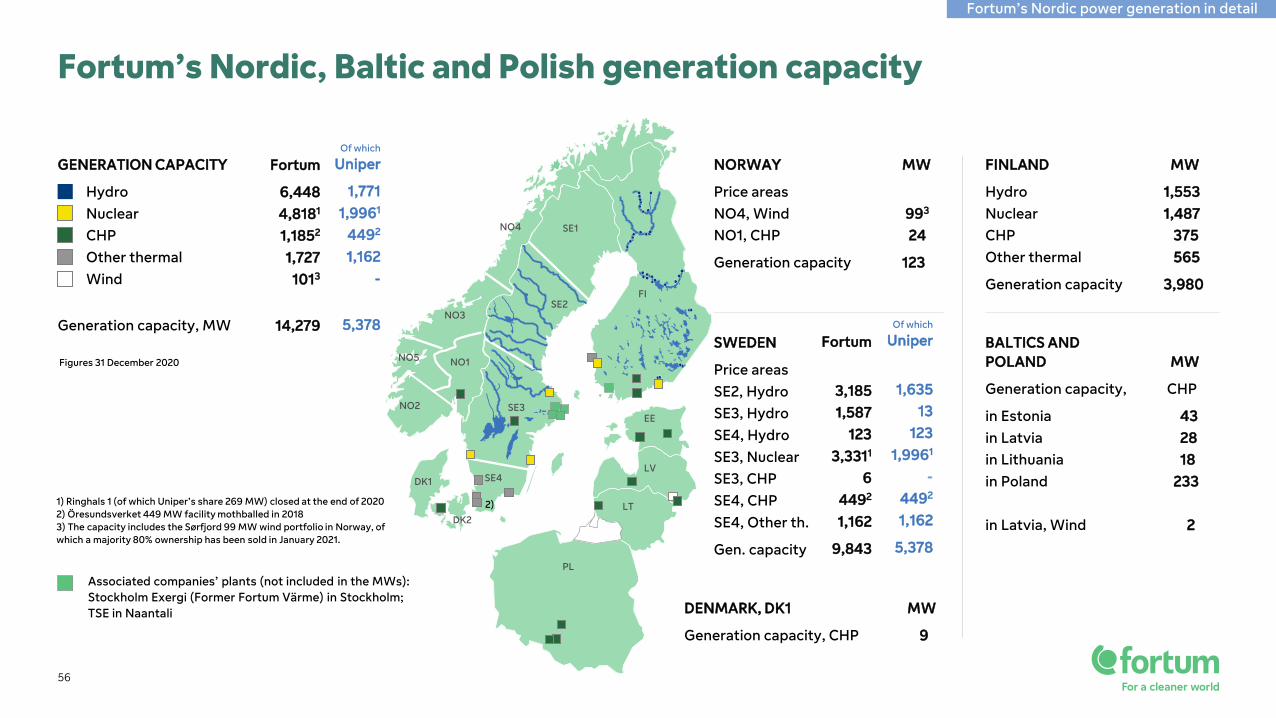
Fortum’s Nordic, Baltic and Polish generation capacity
1)
NO2
NO5 NO1
NO3
NO4 SE1
SE2
SE4
EE
LV
LT
PL
FI
SE3
DK1
DK2
2)
Associated companies’ plants (not included in the MWs): Stockholm Exergi (Former Fortum Värme) in Stockholm; TSE in Naantali
1) Ringhals 1 (of which Uniper’s share 269 MW) closed at the end of 20202) Öresundsverket 449 MW facility mothballed in 20183) The capacity includes the Sørfjord 99 MW wind portfolio in Norway, of which a majority 80% ownership has been sold in January 2021.
Figures 31 December 2020
Of which
Uniper
1,7711,9961
4492
1,162-
5,378
GENERATION CAPACITY
HydroNuclearCHPOther thermalWind
Generation capacity, MW
Fortum
6,4484,8181
1,1852
1,7271013
14,279
DENMARK, DK1 MW
Generation capacity, CHP 9
FINLAND MW
Hydro 1,553Nuclear 1,487CHP 375Other thermal 565
Generation capacity 3,980
NORWAY MW
Price areasNO4, Wind 993
NO1, CHP 24
Generation capacity 123
SWEDEN
Price areasSE2, Hydro SE3, HydroSE4, HydroSE3, NuclearSE3, CHPSE4, CHP SE4, Other th.
Gen. capacity
BALTICS ANDPOLAND MW
Generation capacity, CHP
in Estonia 43in Latvia 28in Lithuania 18in Poland 233
in Latvia, Wind 2
Of which
Uniper
1,63513
1231,9961
-4492
1,162
5,378
Fortum
3,1851,587
1233,3311
64492
1,162
9,843
Fortum’s Nordic power generation in detail
57
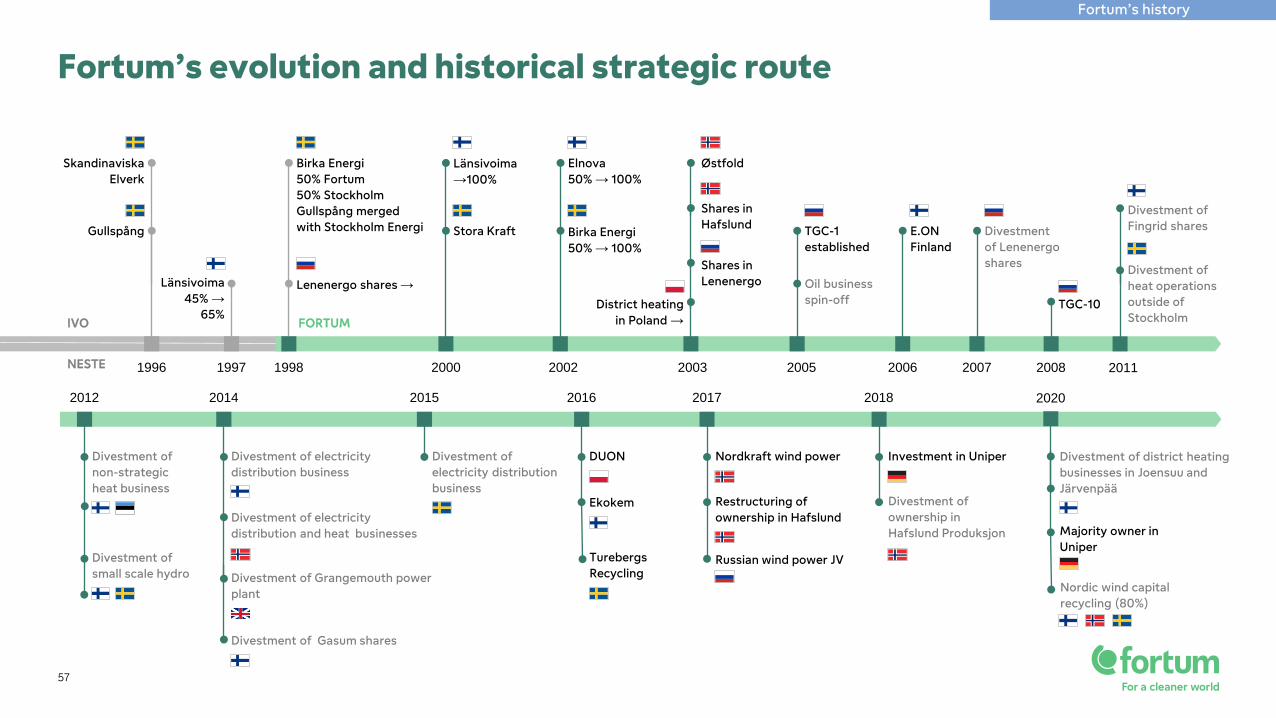
Fortum’s evolution and historical strategic route
NESTE
IVO
Divestment of Lenenergoshares
20072006
E.ON Finland
Oil businessspin-off
TGC-1established
2005
Birka Energi50% → 100%
Elnova50% → 100%
2002
Stora Kraft
Länsivoima→100%
2000
2015
Divestment of electricity distributionbusiness
Russian wind power JV
Restructuring of ownership in Hafslund
Nordkraft wind power
2017
DUON
Ekokem
2016
Turebergs Recycling
TGC-10
2008
Investment in Uniper
2018
Divestment of ownership in Hafslund Produksjon
Divestment of electricity distribution and heat businesses
Divestment of electricity distribution business
Divestment of Grangemouth power plant
2014
Divestment of Gasum shares
Østfold
Shares inLenenergo
Shares inHafslund
District heating in Poland →
2003
Gullspång
SkandinaviskaElverk
1996
Länsivoima45% →
65%
1997
Birka Energi50% Fortum50% StockholmGullspång mergedwith Stockholm Energi
FORTUM
Lenenergo shares →
1998
Divestment ofnon-strategicheat business
Divestment ofsmall scale hydro
2012
Divestment ofheat operations outside ofStockholm
Divestment of Fingrid shares
2011
2020
Majority owner in Uniper
Divestment of district heating businesses in Joensuu andJärvenpää
Nordic wind capital recycling (80%)
Fortum’s history

Hedging improves stability and predictability– principles based on risk mitigation, (Generation segment)
582009 onwards thermal and import from Russia excluded
Historical achieved prices
59
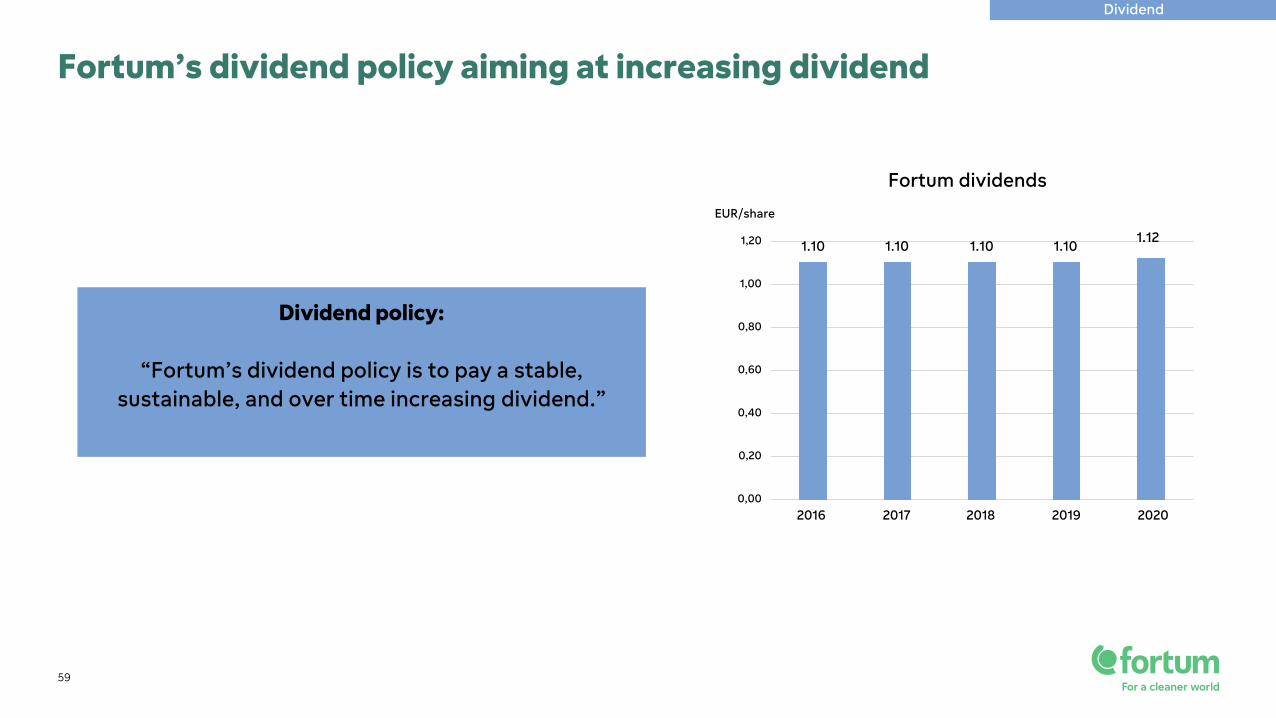
Fortum’s dividend policy aiming at increasing dividend
Fortum dividends
EUR/share
0,00
0,20
0,40
0,60
0,80
1,00
1,20 1.10 1.101.10 1.101.12
Dividend policy:
“Fortum’s dividend policy is to pay a stable, sustainable, and over time increasing dividend.”
2016 2017 2018 2019 2020
Dividend
Ingela UlfvesVice President,Investor Relations and Financial Communication+358 (0)40 515 [email protected]
Rauno TiihonenManager
+358 (0)10 453 [email protected]
Måns HolmbergManager
+358 (0)44 518 [email protected]
Pirjo LifländerIR Specialist
+358 (0)40 643 [email protected]
For more information,please visit www.fortum.com/investors
Fortum Investor Relations andFinancial Communications
www.twitter.com/Fortum www.linkedin.com/company/fortum www.youtube.com/user/fortumFortum ForEnergy blog at fortumforenergyblog.wordpress.com
Follow us on:
Next events: January-June Interim Report on 17 August 2021January-September Interim Report on 12 November 2021
To subscribe Fortum's releases, please fill out the subscription form on our websitehttps://www.fortum.com/about-us/media/media-room/subscribe-press-releases
Camilla NikkCoordinator
+358 (0)50 516 [email protected]
Carlo BeckManager
+49 172 751 [email protected]