Embed Size (px)
DESCRIPTION
Equity Research Analysis of Dish tv ltd.
Citation preview
“EQUITY RESEARCH ON
DISH TV INDIA LIMITED”
SUMMER INTERNSHIP PROGRAM
UNDER
ESCORTS SECURITIES LTD.
ON
1
PRESENTED BY- RISHABH SAWHNEY MBA(B&F)
Index
• introduction • Objectives • Research methodology • Economic health • Industry health and future
prospective • Dish tv an overview with ratio
analysis • Findings and recommendation
2
Introduction
• Equity research is a study of equities or stocks for the purpose of investments.
• Fundamental analysis is a stock valuation methodology that uses financial and economic analysis to envisage the movement of stock prices.
• Technical analysis attempts to understand the emotions in the market by studying the market itself, as opposed to its components.
3
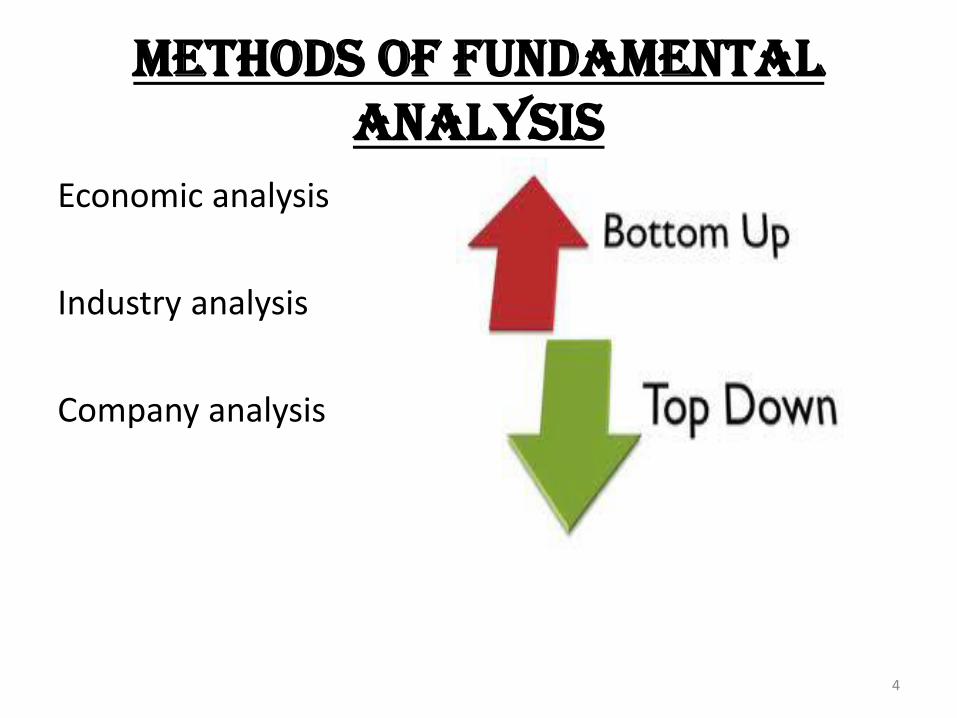
Methods of fundamental analysis
Economic analysis
Industry analysis
Company analysis
4
Objectives
• To determine a company's intrinsic value or its growth prospects.
• To study the economical factors which directly or indirectly affect on performance of Dish TV India.
• To take an overview of industrial and company aspects of the company.
5
Research Methodology
• The annual report of Dish TV India for the year 2009-2012 to interpret the ratios of the company.
• Books on portfolio management and financial management.
6
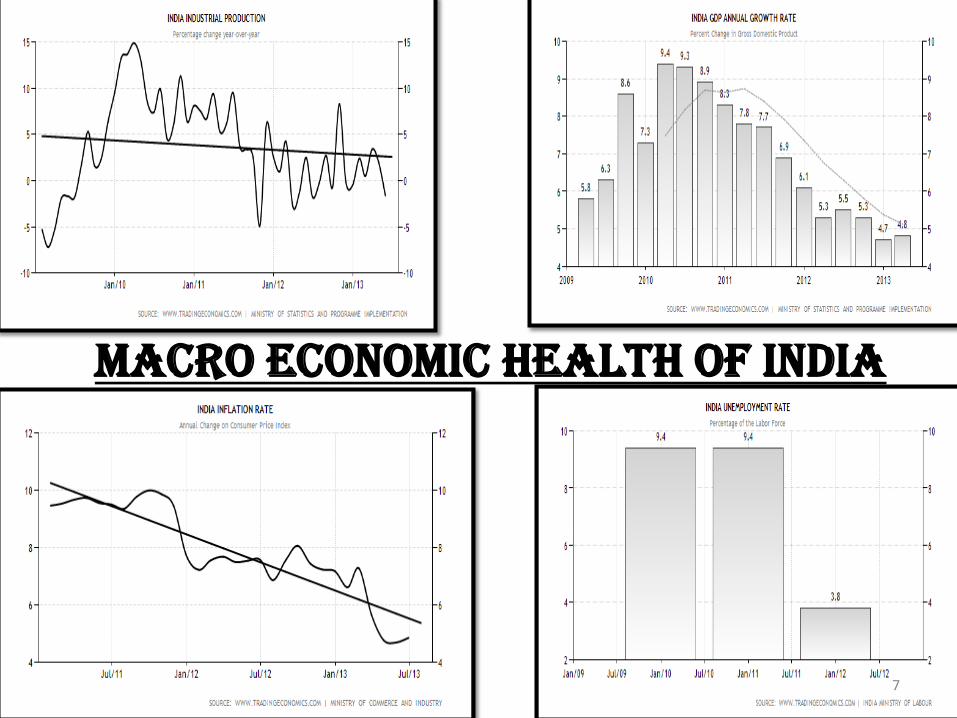
Macro economic health of India
7
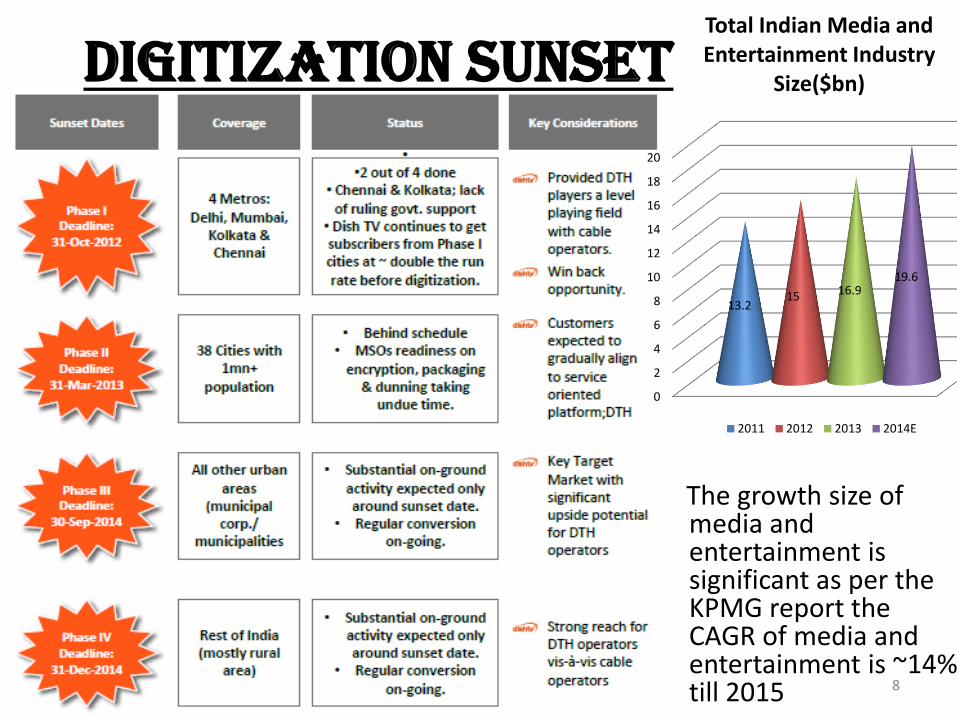
Digitization sunset
The growth size of media and entertainment is significant as per the KPMG report the CAGR of media and entertainment is ~14% till 2015 8
0
2
4
6
8
10
12
14
16
18
20
13.2 15 16.9
19.6
Total Indian Media and Entertainment Industry
Size($bn)
2011 2012 2013 2014E
Growth expectations of media and entertainment
9
• The Government's drive towards digitalisation and addressability for cable television by 2014 is expected to provide a boost to direct-to-home (DTH) and digital cable growth. Indian media and entertainment (M&E) industry is one of the fastest growing industries in the world.
• The Indian M&E industry is anticipated to clock revenues worth Rs 917 billion growing 11.8 per cent in 2013 (up from Rs. 820 billion)in 2012 .
• The growth estimates till 2014 are due to a rapid growth in the subscriber base for DTH.
• Indian Film Industry is one of the world's largest with more than 1000 movie releases and over 3 million movie goers annually.
• In 2009, the print media industry stood at US$ 3.8 billion and showed a moderate growth of 2 per cent. The industry is projected to grow at a CAGR of 9 per cent and reach around US$ 5.9 billion by 2014.
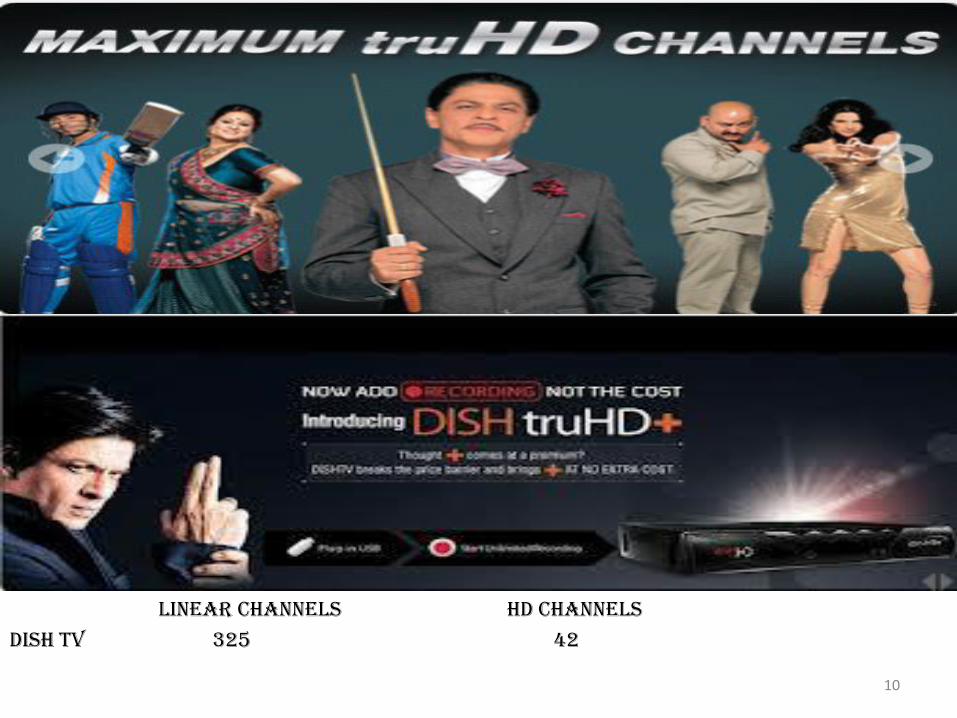
linear channels hd channels
Dish tv 325 42
10
Largest DTH Provider in Asia by Subscribers #1 DTH provider in India by Market Share and Profitability Largest transponder capacity amongst DTH players in India – highest channel offering ONLY listed Indian DTH player with a Market Cap of $1.3bn(1) Promoted by a leading Indian Media Group—Essel Group
11
12
Analysis of key financial ratios
13
QUICK AND CURRENT RATIO
14
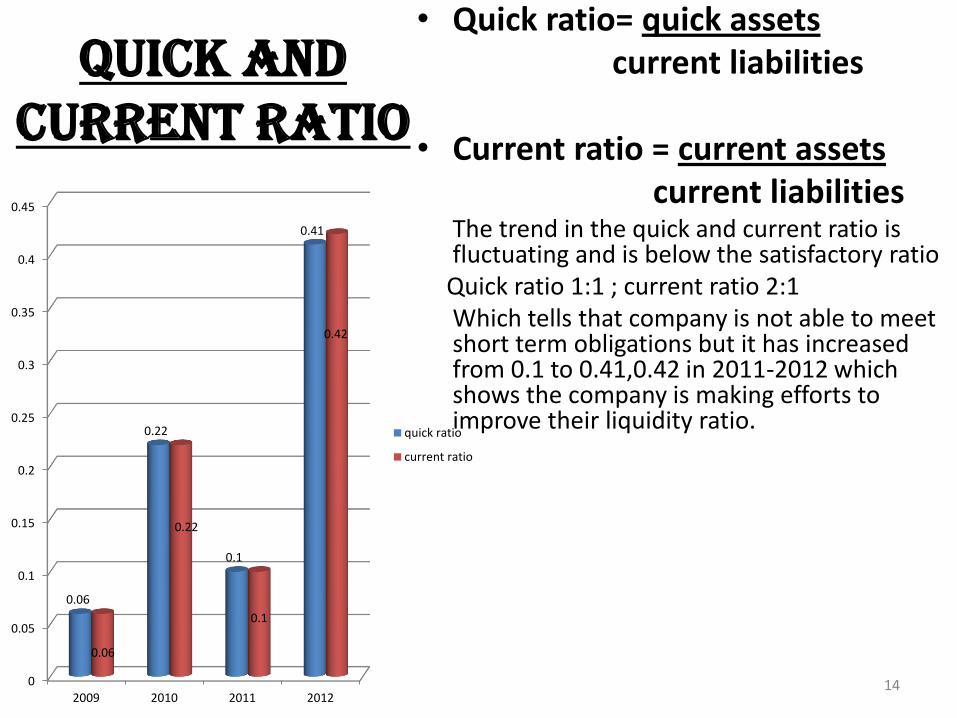
• Quick ratio= quick assets current liabilities • Current ratio = current assets current liabilities The trend in the quick and current ratio is
fluctuating and is below the satisfactory ratio Quick ratio 1:1 ; current ratio 2:1 Which tells that company is not able to meet
short term obligations but it has increased from 0.1 to 0.41,0.42 in 2011-2012 which shows the company is making efforts to improve their liquidity ratio.
0
0.05
0.1
0.15
0.2
0.25
0.3
0.35
0.4
0.45
2009 2010 2011 2012
0.06
0.22
0.1
0.41
0.06
0.22
0.1
0.42
quick ratio
current ratio
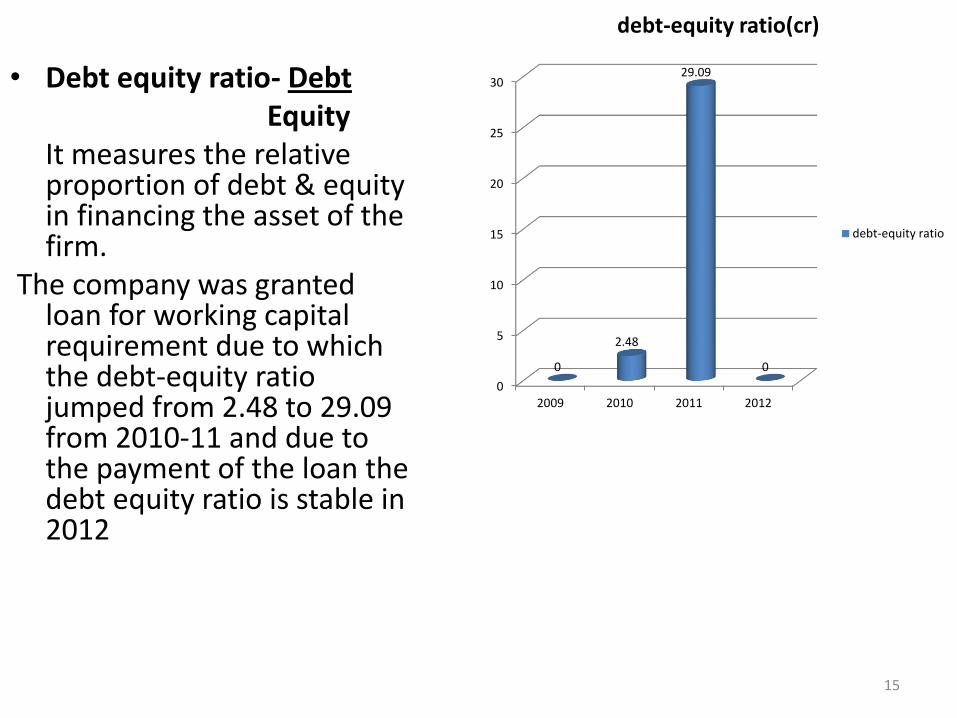
• Debt equity ratio- Debt Equity It measures the relative
proportion of debt & equity in financing the asset of the firm.
The company was granted loan for working capital requirement due to which the debt-equity ratio jumped from 2.48 to 29.09 from 2010-11 and due to the payment of the loan the debt equity ratio is stable in 2012
15
0
5
10
15
20
25
30
2009 2010 2011 2012
0
2.48
29.09
0
debt-equity ratio(cr)
debt-equity ratio
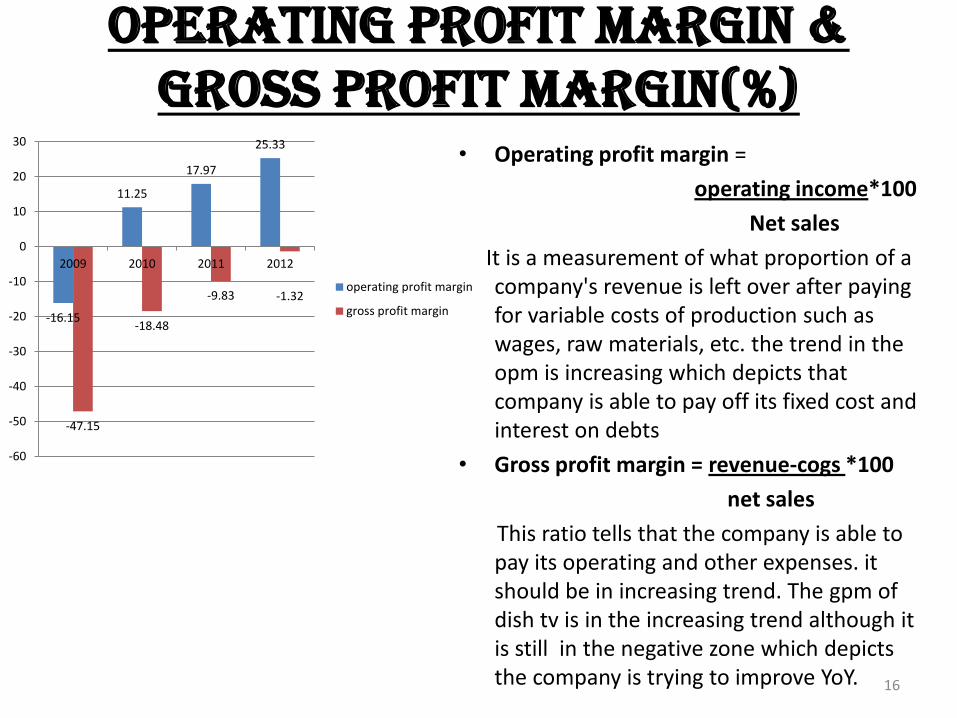
Operating profit margin & gross profit margin(%)
• Operating profit margin =
operating income*100
Net sales
It is a measurement of what proportion of a company's revenue is left over after paying for variable costs of production such as wages, raw materials, etc. the trend in the opm is increasing which depicts that company is able to pay off its fixed cost and interest on debts
• Gross profit margin = revenue-cogs *100
net sales
This ratio tells that the company is able to pay its operating and other expenses. it should be in increasing trend. The gpm of dish tv is in the increasing trend although it is still in the negative zone which depicts the company is trying to improve YoY. 16
-16.15
11.25
17.97
25.33
-47.15
-18.48
-9.83 -1.32
-60
-50
-40
-30
-20
-10
0
10
20
30
2009 2010 2011 2012
operating profit margin
gross profit margin
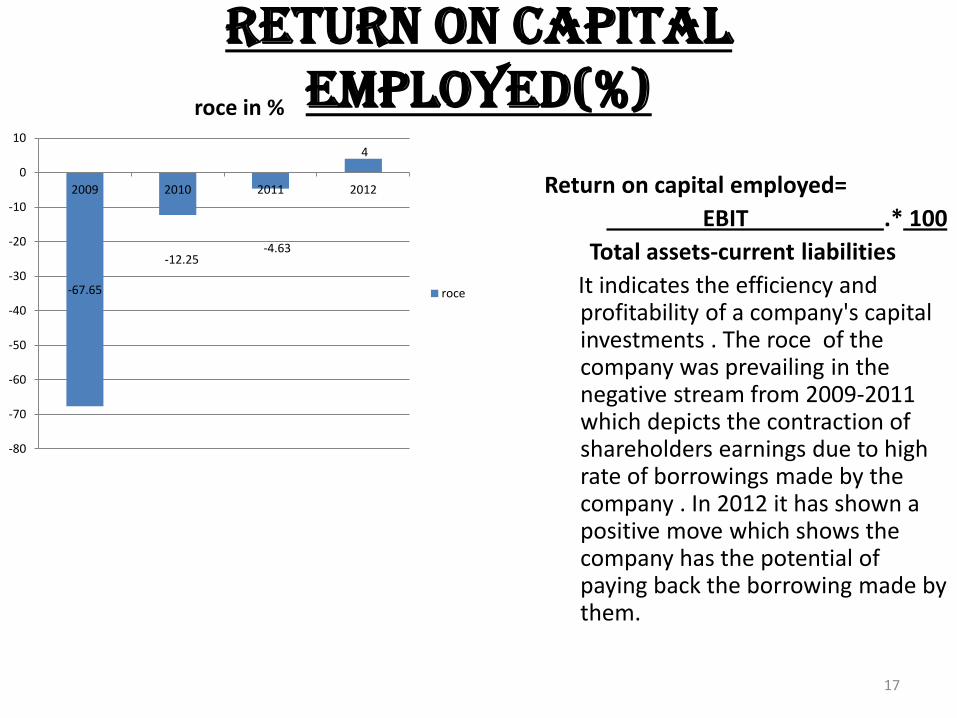
RETURN ON CAPITAL EMPLOYED(%)
17
Return on capital employed=
EBIT .* 100
Total assets-current liabilities
It indicates the efficiency and profitability of a company's capital investments . The roce of the company was prevailing in the negative stream from 2009-2011 which depicts the contraction of shareholders earnings due to high rate of borrowings made by the company . In 2012 it has shown a positive move which shows the company has the potential of paying back the borrowing made by them.
-67.65
-12.25 -4.63
4
-80
-70
-60
-50
-40
-30
-20
-10
0
10
2009 2010 2011 2012
roce in %
roce
-119.21
122.17
258.24
495.99
-200
-100
0
100
200
300
400
500
600
2009
2010
2011
2012
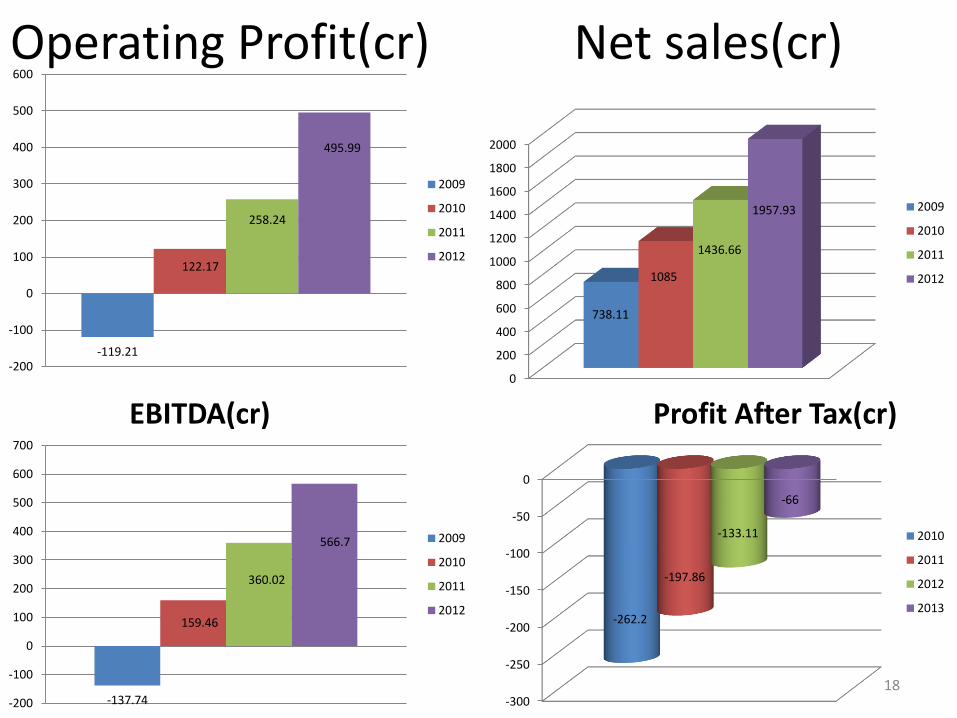
Operating Profit(cr) Net sales(cr)
0
200
400
600
800
1000
1200
1400
1600
1800
2000
738.11
1085
1436.66
1957.93 2009
2010
2011
2012
-137.74
159.46
360.02
566.7
-200
-100
0
100
200
300
400
500
600
700
2009
2010
2011
2012
EBITDA(cr)
-300
-250
-200
-150
-100
-50
0
-262.2
-197.86
-133.11
-66
2010
2011
2012
2013
Profit After Tax(cr)
18
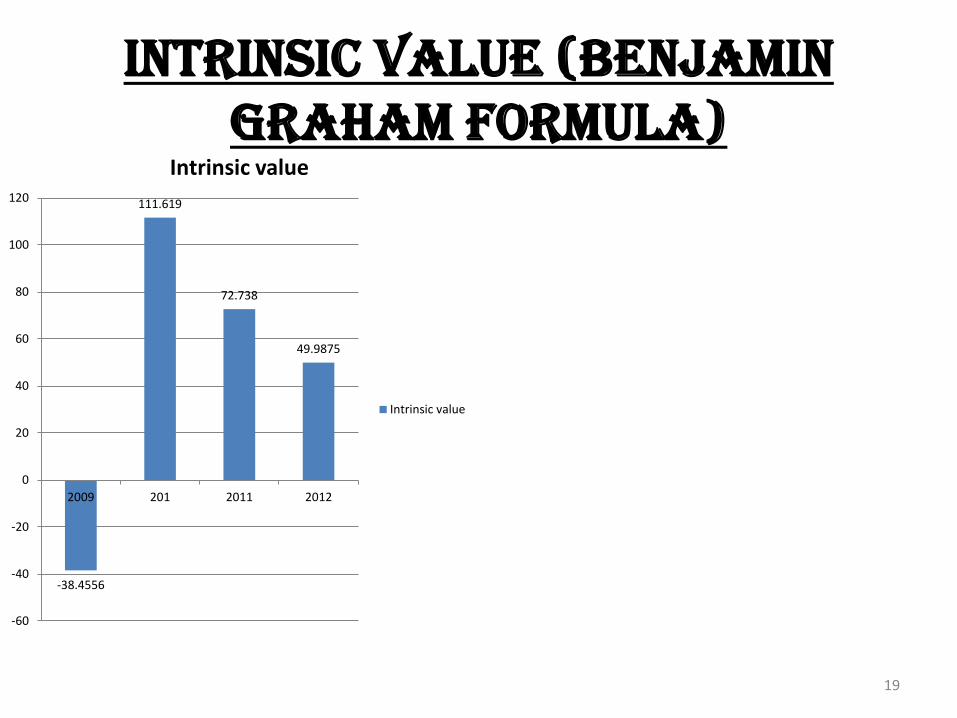
Intrinsic value (Benjamin Graham formula)
19
-38.4556
111.619
72.738
49.9875
-60
-40
-20
0
20
40
60
80
100
120
2009 201 2011 2012
Intrinsic value
Intrinsic value
20
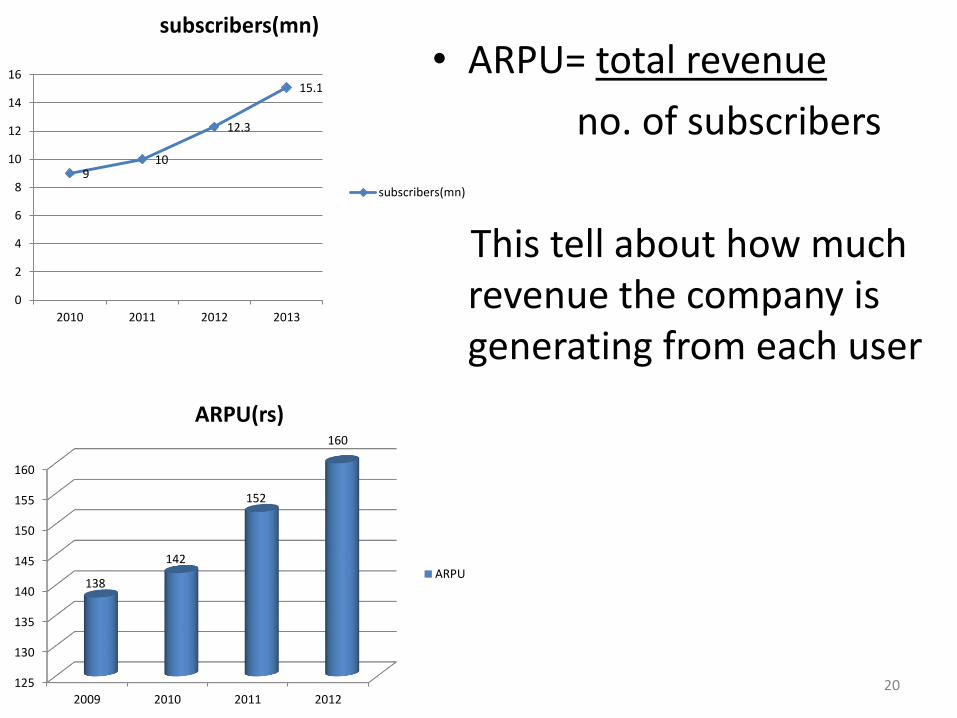
• ARPU= total revenue
no. of subscribers
This tell about how much revenue the company is generating from each user
125
130
135
140
145
150
155
160
2009 2010 2011 2012
138
142
152
160
ARPU(rs)
ARPU
9 10
12.3
15.1
0
2
4
6
8
10
12
14
16
2010 2011 2012 2013
subscribers(mn)
subscribers(mn)
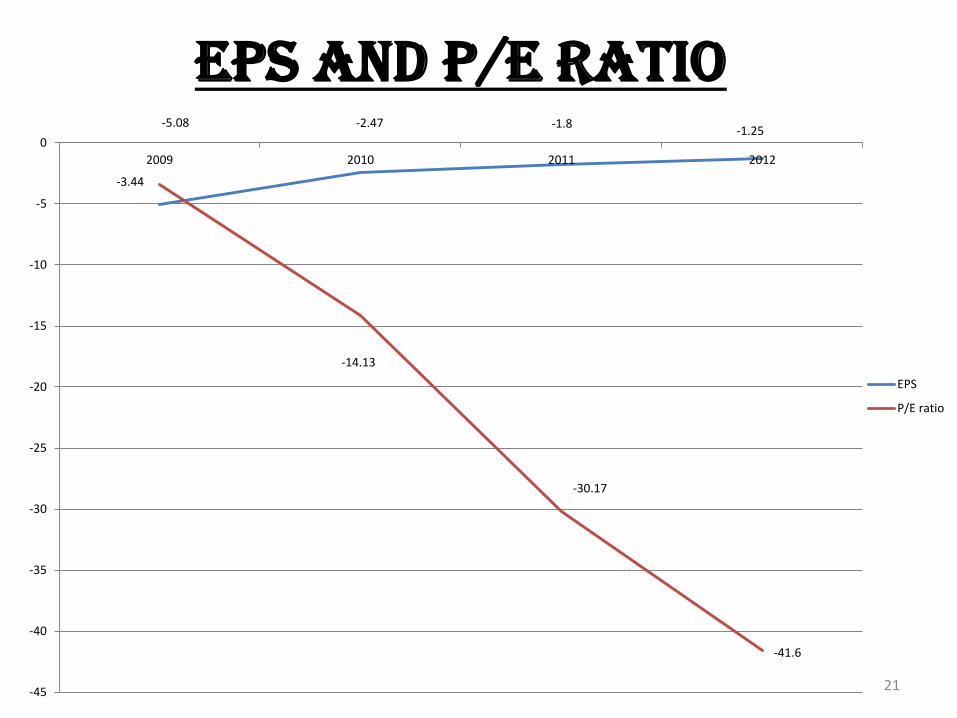
EPS and P/E ratio
21
-5.08 -2.47 -1.8 -1.25
-3.44
-14.13
-30.17
-41.6
-45
-40
-35
-30
-25
-20
-15
-10
-5
0
2009 2010 2011 2012
EPS
P/E ratio
22
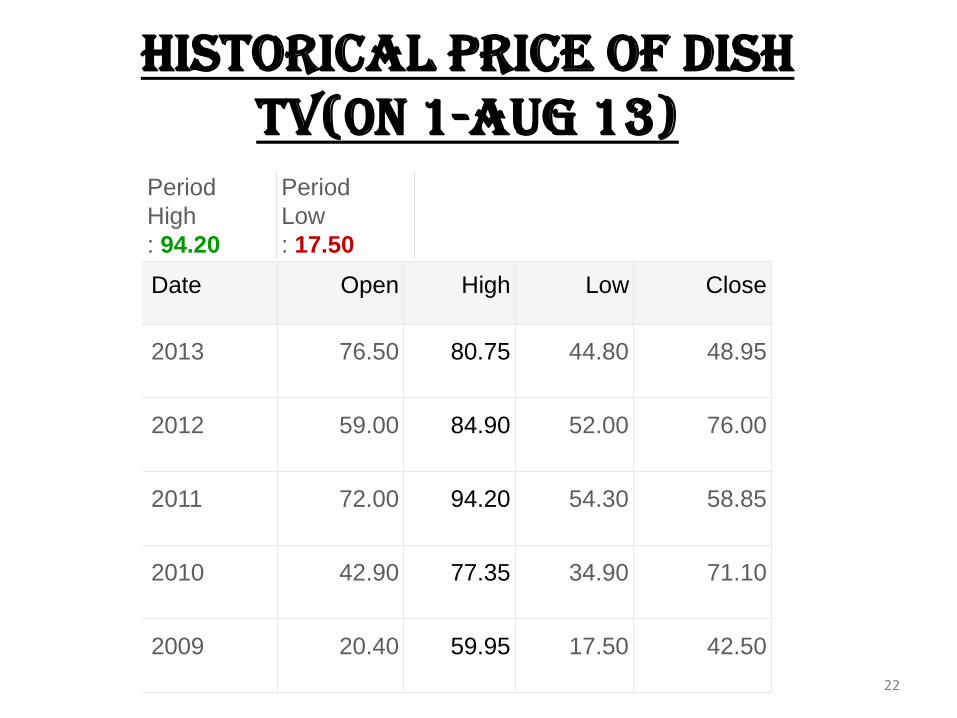
Period
High
: 94.20
Period
Low
: 17.50
Date Open High Low Close
2013 76.50 80.75 44.80 48.95
2012 59.00 84.90 52.00 76.00
2011 72.00 94.20 54.30 58.85
2010 42.90 77.35 34.90 71.10
2009 20.40 59.95 17.50 42.50
Historical price of Dish tv(0n 1-aug 13)
Findings and Recommendation
• The growth in the media and entertainment sector is strongly expected as the digitization process might be completed by 2017 which might increase the ARPU which will help as an supporting factor for financial health of Dish tv in generating more revenues.
• After looking deep into Dish tv YoY performance I found that the financial health is a matter of concern but if we compare the recovery of the financial has been significant.
• This stock is available at much discounted rate than what digital cable peers such as Den Networks and Hathway Cable are trading at (12-15 times).
• I would recommend a buy call on the stock as it is trading below the intrinsic value of the firm and in near future term it is expected to grow at good rate due to digitization process.
23

24