Embed Size (px)
Citation preview
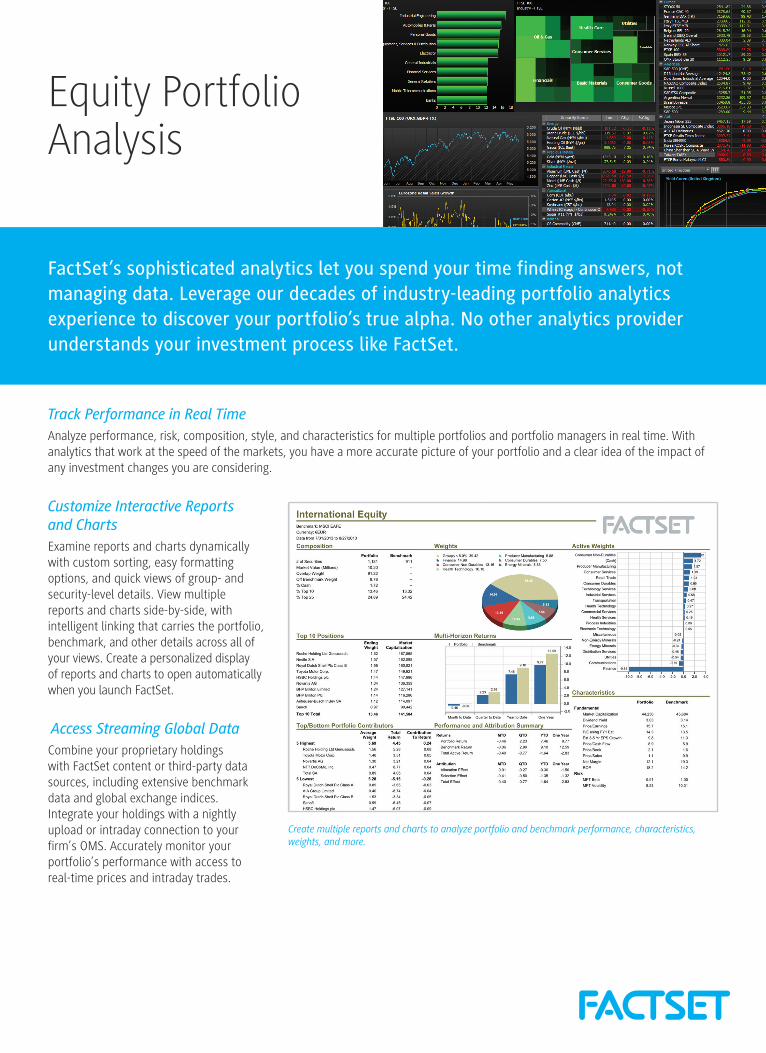
Track Performance in Real TimeAnalyze performance, risk, composition, style, and characteristics for multiple portfolios and portfolio managers in real time. With analytics that work at the speed of the markets, you have a more accurate picture of your portfolio and a clear idea of the impact of any investment changes you are considering.
Customize Interactive Reports and ChartsExamine reports and charts dynamically with custom sorting, easy formatting options, and quick views of group- and security-level details. View multiple reports and charts side-by-side, with intelligent linking that carries the portfolio, benchmark, and other details across all of your views. Create a personalized display of reports and charts to open automatically when you launch FactSet.
Access Streaming Global DataCombine your proprietary holdings with FactSet content or third-party data sources, including extensive benchmark data and global exchange indices. Integrate your holdings with a nightly upload or intraday connection to your firm’s OMS. Accurately monitor your portfolio’s performance with access to real-time prices and intraday trades.
FactSet’s sophisticated analytics let you spend your time finding answers, not managing data. Leverage our decades of industry-leading portfolio analytics experience to discover your portfolio’s true alpha. No other analytics provider understands your investment process like FactSet.
Equity Portfolio Analysis
Create multiple reports and charts to analyze portfolio and benchmark performance, characteristics, weights, and more.
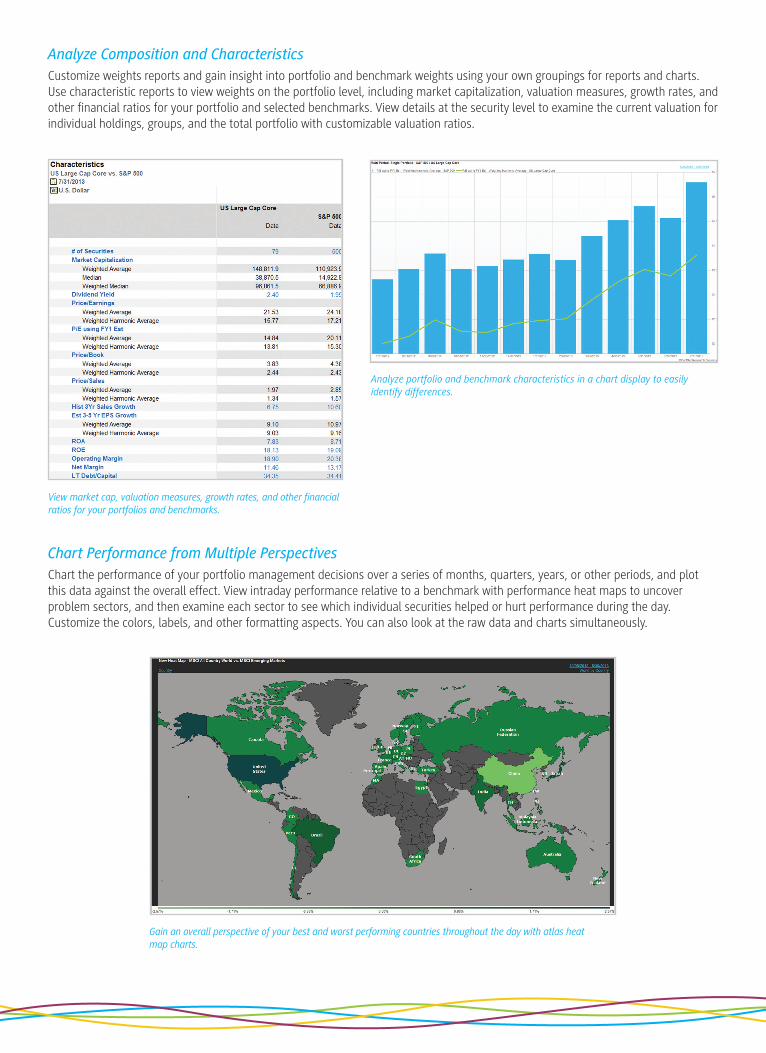
Analyze Composition and CharacteristicsCustomize weights reports and gain insight into portfolio and benchmark weights using your own groupings for reports and charts. Use characteristic reports to view weights on the portfolio level, including market capitalization, valuation measures, growth rates, and other financial ratios for your portfolio and selected benchmarks. View details at the security level to examine the current valuation for individual holdings, groups, and the total portfolio with customizable valuation ratios.
Chart Performance from Multiple PerspectivesChart the performance of your portfolio management decisions over a series of months, quarters, years, or other periods, and plot this data against the overall effect. View intraday performance relative to a benchmark with performance heat maps to uncover problem sectors, and then examine each sector to see which individual securities helped or hurt performance during the day. Customize the colors, labels, and other formatting aspects. You can also look at the raw data and charts simultaneously.
View market cap, valuation measures, growth rates, and other financial ratios for your portfolios and benchmarks.
Analyze portfolio and benchmark characteristics in a chart display to easily identify differences.
Gain an overall perspective of your best and worst performing countries throughout the day with atlas heat map charts.
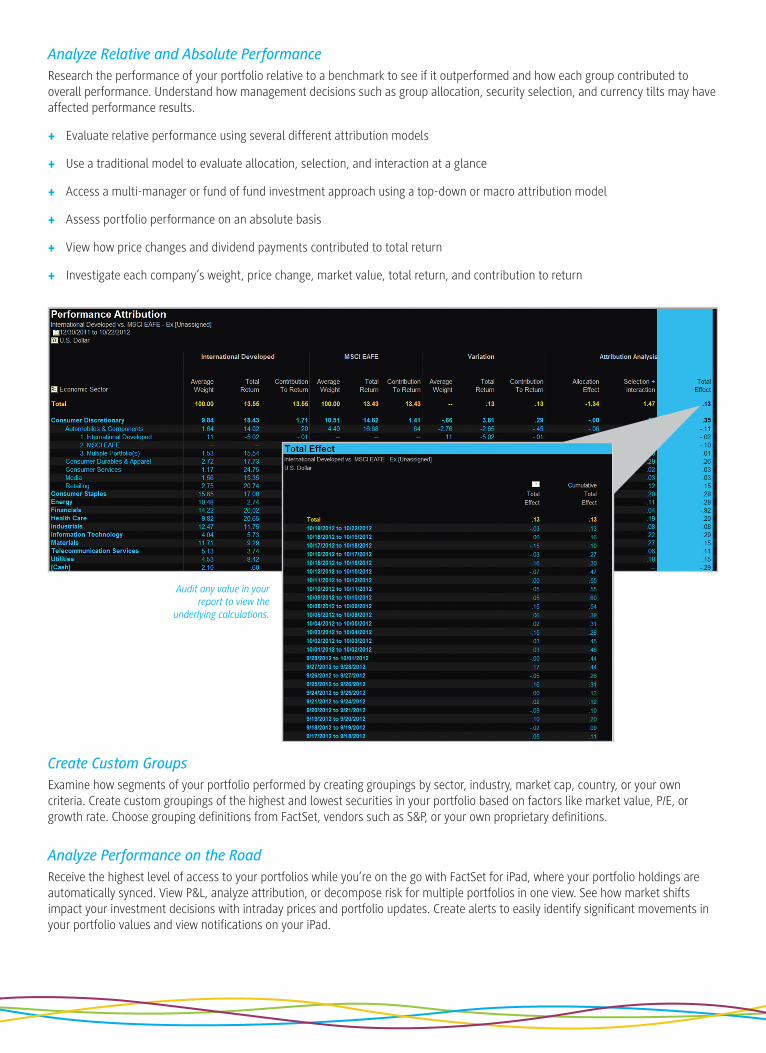
Analyze Relative and Absolute PerformanceResearch the performance of your portfolio relative to a benchmark to see if it outperformed and how each group contributed to overall performance. Understand how management decisions such as group allocation, security selection, and currency tilts may have affected performance results.
+ Evaluate relative performance using several different attribution models
+ Use a traditional model to evaluate allocation, selection, and interaction at a glance
+ Access a multi-manager or fund of fund investment approach using a top-down or macro attribution model
+ Assess portfolio performance on an absolute basis
+ View how price changes and dividend payments contributed to total return
+ Investigate each company’s weight, price change, market value, total return, and contribution to return
Create Custom GroupsExamine how segments of your portfolio performed by creating groupings by sector, industry, market cap, country, or your own criteria. Create custom groupings of the highest and lowest securities in your portfolio based on factors like market value, P/E, or growth rate. Choose grouping definitions from FactSet, vendors such as S&P, or your own proprietary definitions.
Analyze Performance on the RoadReceive the highest level of access to your portfolios while you’re on the go with FactSet for iPad, where your portfolio holdings are automatically synced. View P&L, analyze attribution, or decompose risk for multiple portfolios in one view. See how market shifts impact your investment decisions with intraday prices and portfolio updates. Create alerts to easily identify significant movements in your portfolio values and view notifications on your iPad.
Audit any value in your report to view the
underlying calculations.
About FactSet FactSet is a leading provider of financial information and analytic applications to investment professionals around the globe.For More Information To learn more about Equity Portfolio Analysis, contact [email protected] www.factset.com
Copy
righ
t ©
201
3 Fa
ctSe
t Re
sear
ch S
yste
ms
Inc.
All
rig
hts
res
erve
d. #
1033
6/09
13/F
SM20
2
Choose the Analysis that Fits Your StrategyFactSet gives you the flexibility to evaluate according to your unique investment style, whether it includes fixed income, alternative assets, fund of funds, macro/asset allocation, a long/short strategy, or currency hedging. Reveal the exposure of index futures, ETFs, or mutual funds to a particular security or risk factor. Examine long/short and long-only portfolios by splitting the portfolio into long and short positions and creating a market-neutral benchmark.
Track the Impact of Your Investment IdeasUnderstand how anticipated security changes in your portfolio or portfolio changes to your composite will impact composition and characteristics. Simulate trades before they are executed and view the implications for predicted risk, style, or fundamental characteristics and weights.
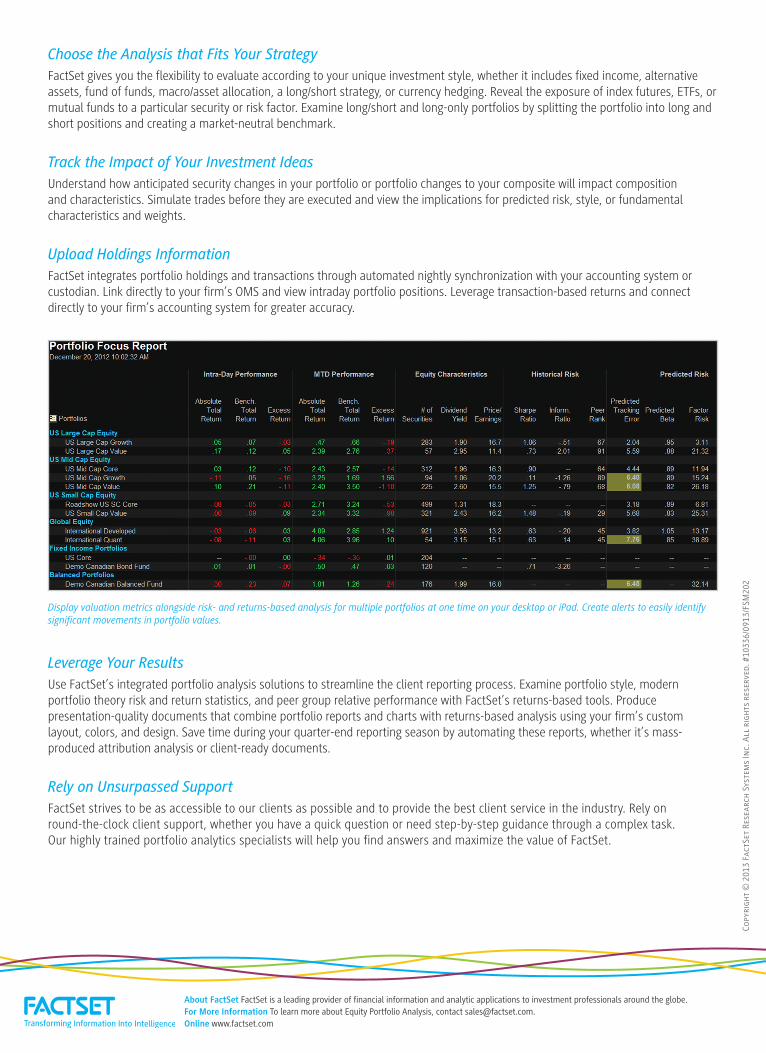
Upload Holdings InformationFactSet integrates portfolio holdings and transactions through automated nightly synchronization with your accounting system or custodian. Link directly to your firm’s OMS and view intraday portfolio positions. Leverage transaction-based returns and connect directly to your firm’s accounting system for greater accuracy.
Leverage Your ResultsUse FactSet’s integrated portfolio analysis solutions to streamline the client reporting process. Examine portfolio style, modern portfolio theory risk and return statistics, and peer group relative performance with FactSet’s returns-based tools. Produce presentation-quality documents that combine portfolio reports and charts with returns-based analysis using your firm’s custom layout, colors, and design. Save time during your quarter-end reporting season by automating these reports, whether it’s mass-produced attribution analysis or client-ready documents.
Rely on Unsurpassed SupportFactSet strives to be as accessible to our clients as possible and to provide the best client service in the industry. Rely on round-the-clock client support, whether you have a quick question or need step-by-step guidance through a complex task. Our highly trained portfolio analytics specialists will help you find answers and maximize the value of FactSet.
Display valuation metrics alongside risk- and returns-based analysis for multiple portfolios at one time on your desktop or iPad. Create alerts to easily identify significant movements in portfolio values.