Embed Size (px)
Citation preview

Research Paper N° 16
FAME - International Center for Financial Asset Management and Engineering
THE GRADUATE INSTITUTE OFINTERNATIONAL STUDIES
40, Bd. du Pont d’ArvePO Box, 1211 Geneva 4
Switzerland Tel +41(0)22 312 09 61 Fax +41(0)22 312 10 26
www.fame.ch [email protected]
Innovation and First-Mover Advantages in Corporate
Research Paper N° 74November 2002
Equity Linked SecuritiesUnderwriting: Evidence from
HEC-University of Lausanne and FAME Enrique SCHROTH

INTERNATIONAL CENTER FOR FINANCIAL ASSET MANAGEMENT AND ENGINEERING 40 bd du Pont d'Arve • P.O. Box 3 • CH-1211 Geneva 4 • tel +41 22 / 312 0961 • fax +41 22 / 312 1026
http://www.fame.ch • e-mail: [email protected]
RESEARCH PAPER SERIES The International Center for Financial Asset Management and Engineering (FAME) is a private foundation created in 1996 at the initiative of 21 leading partners of the finance and technology community together with three Universities of the Lake Geneva Region (Universities of Geneva, University of Lausanne and the Graduate Institute of International Studies). Fame is about research, doctoral training, and executive education with “interfacing” activities such as the FAME lectures, the Research Day/Annual Meeting, and the Research Paper Series. The FAME Research Paper Series includes three types of contributions: • First, it reports on the research carried out at FAME by students and research fellows. • Second, it includes research work contributed by Swiss academics and practitioners
interested in a wider dissemination of their ideas, in practitioners' circles in particular. • Finally, prominent international contributions of particular interest to our constituency are
included as well on a regular basis. FAME will strive to promote the research work in finance carried out in the three partner Universities. These papers are distributed with a ‘double’ identification: the FAME logo and the logo of the corresponding partner institution. With this policy, we want to underline the vital lifeline existing between FAME and the Universities, while simultaneously fostering a wider recognition of the strength of the academic community supporting FAME and enriching the Lemanic region. Each contribution is preceded by an Executive Summary of two to three pages explaining in non-technical terms the question asked, discussing its relevance and outlining the answer provided. We hope the series will be followed attentively by all academics and practitioners interested in the fields covered by our name. I am delighted to serve as coordinator of the FAME Research Paper Series. Please contact me if you are interested in submitting a paper or for all suggestions concerning this matter. Sincerely,
Prof. Martin Hoesli University of Geneva, HEC 40 bd du Pont d'Arve 1211 Genève 4 Tel: +41 (022) 705 8122 [email protected]

Innovation and First-Mover Advantages inCorporate Underwriting: Evidence from
Equity Linked Securities
Enrique Schroth1
HEC - University of Lausanne2
andFAME
First draft: October 1st, 2001.This draft: November 9th, 2002.
1I am grateful to the members of my thesis committee, Douglas Gale, BoyanJovanovic, and Marti Subrahmanyam. I also acknowledge helpful comments byFranklin Allen, Chris Flinn, Helios Herrera, Eugenio Miravete, Franco Peracchiand Michael Rockinger. Any errors in the paper are mine. I also thank IngoWalter, Iftekhar Hasan and the Berkley Center for Entrepreneurial Studies whomade possible my access to the data.
2BFSH 1, 1015 Lausanne, Switzerland; e-mail: [email protected].

Abstract
Investment banks develop new securities permanently even when their com-petitors can imitate them almost immediately and at signi…cantly smallerdevelopment costs. Using data of all the new issues of Equity Linked andDerivative Securities since 1985 compiled by SDC, and …rm …nancial datafrom COMPUSTAT, I test if innovators have a demand advantage over theimitators when they compete to underwrite new issues using innovative cor-porate products. If the innovator has private information about the innova-tion, his own variety of the security may be better valued than the imitators’varieties by the issuers. I estimate the issuers’ demand for the banker’s un-derwriting service across di¤erent varieties of equity-linked securities. Usinga nested-logit model of discrete choice I …nd that, ceteris paribus, the de-mand for innovators’ varieties is larger than for imitators’. I also …nd thatthis demand advantage is decreasing in time, suggesting that imitators learnfrom observing deals made in the past by the innovator and by themselves.The initial innovator’s advantage is larger for securities that appear later ina sequence of innovations but it diminishes faster.
JEL classi…cation: G24, C25, L89.
Keywords: Financial Innovation, Investment Banking, Underwriting,First-Mover Advanatges, Demand Estimation.

1 IntroductionThe last twenty years have witnessed the introduction of a remarkable num-ber of innovations in corporate securities.1 Most of these have been broughtabout by investment banks through the business of underwriting new cor-porate issues. It is also remarkable that investment banks have found itpro…table to develop new securities even when their competitors have beenable to imitate them almost immediately and at signi…cantly smaller de-velopment costs. The empirical evidence so far has suggested that, despitethese disadvantages, innovators are compensated with the largest share ofthe underwriting market. In this paper I estimate the demand of …rms forthe underwriting services of investment banks that use innovative corporateproducts. This will allow me to measure the di¤erent value to …rms from rais-ing money using a security engineered by an innovator or an imitator andthus explain the innovator’s market share advantage. The dynamic setup ofthe econometric model will allow a characterization of this advantage overtime and shed light on the question of what makes innovators have a demandadvantage over imitators.
Product innovation in …nance is particularly interesting because innova-tors face many disadvantages. Tufano (1989) provides evidence showing thatimitation occurs shortly after the …rst issue of a new security, leaving virtuallyno time for innovators to be the sole underwriters for that new type of secu-rity. He also observes that the development cost is signi…cantly smaller forimitators than for innovators. Further, the design of new securities is rapidlyrevealed to competing banks because of SEC rules of disclosure. Most strik-ingly, imitation cannot be precluded by any form of legal protection, i.e.,patents.
In his seminal contribution, Tufano (1989) observes that what compen-sates innovators for these disadvantages is the largest share of the market forunderwriting corporate new issues: given a security, the bank that createsit is able to underwrite more capital than its largest imitator over all thesecurity’s history. Why innovators are able to have such an unchallengedlead in these markets is perhaps the …rst question that this evidence raises.This paper takes the …rst step towards answering the question empirically.For that purpose I model the choice of a …rm that needs to raise moneyexternally through the issue of a security. This …rm has to choose the typeof security to be used and the bank that will underwrite it. Aggregating thechoices of all the …rms that need to make an o¤ering, the model predicts the
1For a list of innovations in corporate securities until 1991, and a description of someof them, see Finnerty (1992). All innovations in equity-linked and derivative corporatesecurities until March 2001 are listed in this paper.
1

market shares of underwriting by di¤erent banks using di¤erent securitiesconditional, among other things, on the characteristics of the banks (e.g.,if they are imitators or innovators). Thus, after estimating this model, wecan test whether innovators have an advantage because their security is morevaluable to issuers.
This paper introduces two features that allow us to get a better descrip-tion of the facts of …nancial innovation. One of them is the use of a frameworkof di¤erentiated products to model and estimate the demand for underwritingservices. An inspection of recent innovations in corporate products suggestsclearly that di¤erent securities are created to target di¤erent types of issuersor investors. For example, two similar debt products that tie the repay-ment of the principal to the performance of other indices provide di¤erenthedging devices to investors: the Stock Market Annual Reset Term Notes(SMARTs) are corporate bonds that pay a capped ‡oating rate that is tiedto the American Stock Exchange Oil Stocks Index while the Currency Pro-tected Notes (CPNs) are bonds that pay a ‡oating rate that is inversely tiedto the Canadian six-month bankers acceptance rate. By taking into accountthe location of securities in a product space, it is possible to identify con-sistently a demand function for underwriting that depends on the price ofunderwriting (the underwriting spread).2 This is possible because we canassociate the variation in market shares with the variation in underwritingspreads of varieties of the same security by di¤erent banks, and the variationin underwriting spreads of similar varieties which can be close substitutes.3
The other feature is that this study focuses also on the dynamic patternof market shares. Instead of comparing the market shares of innovators andimitators over the whole history of a given innovation, I observe them overtime and estimate the innovator’s demand advantage accordingly. This willreveal whether the innovator’s advantage is preserved steadily through thelife cycle of the security or if imitators catch up with (or continue to fallbehind) innovators. This dynamic setup also allows a comparison betweenthe demands for sequences of securities. In fact, most securities appear se-quentially, later ones as improvements of earlier ones. It appears that the lifecycle of a security ends when an innovation that modi…es the older design isintroduced.
The empirical …nance literature has not yet addressed extensively the2The underwriting spead is the fee charged by an investment bank or a syndicate, equal
to the di¤erence between the gross sales to investors and the net proceeds received by theissuer.
3Tufano’s study, for example, compares spreads only between banks issuing the samesecurity. In that sense, it is not a demand estimation for the underwriting services ofbanks across di¤erent securities.
2
question of why innovators have advantages over imitators. In fact, mostauthors have examined extensively the causes of the demand for innovativesecurities. The focus has been on trying to explain what made each particularinnovation attractive to investors or issuers but not on why it is privatelypro…table to develop such instruments. Miller (1986), for example, arguesthat the major impulse to …nancial innovations between the sixties and theeighties came from ever changing tax codes and regulations that broughtabout pro…t opportunities (e.g., tax money saved) through the design of new…nancial products that circumvented these laws.4
Not much work has been done, though, to try to solve the puzzle of whyan unpatentable innovation is worth its R&D expenditure if imitation is lesscostly and immediate. In particular, not much has been said about whatgives innovators an advantage over imitators. On one hand, some authorshave tried to explain Tufano’s stylized facts at the theoretical level by arguingthat innovators are infra-marginal competitors, i.e., that have lower marginalcosts than imitators. By moving …rst, innovators may face lower search costsof identifying potential issuers and investors (Allen and Gale, 1994, Chapter4) or lower average marketing costs if there is lumpiness in the set up costs ofmarketing networks (Ross, 1989) or if innovation signals skill and creativitycredibly (Tufano, 1989). On the other hand, Battacharyya and Nanda (2000)provide a model in which the innovator is able to appropriate the value ofits innovation and pro…t from it despite being imitated if it is costly for itsclients to switch to other underwriters.5;6
By contrast with these views, I analyze the possibility that the asymme-try between innovators and imitators is on the information owned by thesetwo types of banks. If some of the information that innovators have aboutthe security remains private, a larger proportion of the R&D added valuecan be appropriated. In other words, the innovator can pro…t because it isimitated imperfectly. This possibility was explored in a theoretical paper byHerrera and Schroth (2000). In it, innovators of derivatives that move oneperiod in advance receive private informative signals from their clients or the
4Tufano (1995) and Finnerty (1992) also describe the reasons for the appearance of themost important innovations between 1830 and 1930 and since the 1970s, respectively.
5According to anecdotal evidence gathered by Naslund (1986), though, …rms usuallyturn to the services of expert issuers of innovative products, i.e., innovators, even if theyused another bank for other services. This evidence comes from the testimonies of twenty…nancial product developers in New York.
6Black and Silber (1986) also study …rst-mover advantages in …nance but they focusin futures exchanges as the innovators, not in investment banks. They claim that futuresexchanges that develop new contracts have the advantage that they provide liquidity forinvestors earlier than the competing exchanges so they are able to attract agents that haveto choose where to trade.
3

market. This allows them to o¤er deals that are more attractive to …rmsthan what imitators can o¤er. For recent innovations in corporate securi-ties, it is possible that imitation is imperfect. Equity-Linked securities andother derivative corporate products are sophisticated securities, speci…ed bymany parameters, some of which vary from deal to deal. Thus, it is possiblethat imitators cannot reverse-engineer perfectly the observed new securitiesfrom only a few deals. For example, the Equity-Linked Note (ELK) wasthe …rst debt product to tie the repayment of principal to the stock priceof another publicly traded company. The optimal choice of the stock of thecompany to tie the notes to is observable but the knowledge of what stocksare optimal for di¤erent issuers or investors is a private component of R&D.Imitators that want to underwrite issues of ELKs for a potential client mayknow how to structure such instruments, but may not know exactly, fromwhat is observable, what stock to choose to tie the repayment of the debt oftheir client.
Using data on all the new issues of equity-linked and corporate deriva-tive securities, the (qualitative) results of the estimation of the demand forunderwriting services can be summarized as follows:
² the demand for underwriting services using this type of securities issensitive to the underwriting spread (i.e., its price);
² on average, the …rms’ demand for an innovator’s variety of the securityis bigger than the one for imitators;
² this di¤erence disappears during the security’s life cycle, so imitatorscatch up with innovators;
² imitators catch up with innovators faster if securities are later improve-ments on past innovations.
Thus, this paper provides the …rst empirical test that the advantage toinnovators may come from a bigger demand for the innovators’ products.The dynamic patterns of competition it identi…es are consistent with thepredictions of Van Horne (1985) when imitators enter the market.7 Theyare also consistent with the hypothesis that the advantage to innovators issuperior information that allows them to engineer their securities better thanimitators.
In the next section of the paper I describe the data set I use and presentsome preliminary results that motivate the assumptions of the model I will
7Kanemasu, Litzenberger and Rolfo (1986) observe the same pattern for the case ofstripped treasury securities.
4

take to the data later. In Section 3 I develop the model that will allow meto characterize the preferences of …rms for the di¤erent types of underwriters(innovators and imitators). In the theory subsection I present the formalsetup for the discrete-choice decision problem of …rms. I show that …rmsshould derive additional value if they chose an innovator rather than imitatorsas their underwriter. The rest of the section explains how this conjecturewill be tested using multinomial logit and nested logit models of demand. InSection 4 I present the results of the estimation and Section 5 summarizesthe main claims of the paper.
2 Some Preliminary EvidenceThe data used in this research is obtained from the Securities Data Com-pany’s online databases of …nancial transactions. I use all the private andpublic o¤erings of equity-linked and derivative corporate securities in theNew Issues database and record as many details of the o¤er as possible: thename of the issuer, the principal issued, the name of the underwriter, the un-derwriter’s fees (underwriting spread), and details of the security, like o¤eredyield to maturity, average life, spread of coupon over treasury notes, call op-tions, etc. I merge this data set with the quarterly COMPUSTAT database(using six digit CUSIP numbers) to have …nancial information about theissuer.
In his study, Tufano (1989) uses all types of securities between 1974 and1986. Here I restrict the sample to equity-linked securities because this type…ts better the motivation that …rst-mover advantages come from informationasymmetries between underwriters. This type of securities are complex andunderwriters have to choose many parameters to engineer such deals (InTable 1 I show the relative size of this market). Variations on mortgagebacked products, for example, may be already too familiar to investmentbanks to hide something in their structure to imitators.
Below I describe some important facts observed for this type of securities.I pay particular attention to the evolution of market shares in the marketsof initial o¤erings.
The …rst thing to realize is that all the securities in our sample can beclassi…ed into groups. The SDC database identi…es 50 di¤erent types of newequity-linked or derivative corporate securities but a closer look indicates thatsome of these securities are related to each other in terms of their structureand purpose. For example, MIPS and TOPRS are instruments used byissuers to deduct debt interest payments from their taxable income, but theformer are issued by a limited liability company while the latter by a specially
5

conformed business trust.8 To classify all the 50 corporate products in theSDC database I have relied on the experts’ opinion about the uses of theseproducts for corporations and investors.9 I found eleven distinct categories,which I summarize in Table 2. For the rest of the paper I will refer to thesecategories as “groups” or “families” of securities interchangeably.
I will refer to each one of these securities as an innovation, since foreach one there is a unique feature that distinguishes it from everything thatalready existed. However, depending on the group they are in and the orderin which they appeared, I will assign to each security a generation number.For example, since MIPS were the …rst tax advantage preferred debt, I willcall them the …rst generation of this family, and TOPRS the fourth.
I follow Tufano’s (1989) criterion to de…ne the innovator of a securityas the underwriter of the …rst public o¤er using that security. Similar towhat Tufano found, for equity-linked corporate securities we do observe thatinnovators have an edge over imitators in terms of market shares. Only 18of the 50 products are imitated. In 13 of these, innovators lead in principalunderwritten, and in 15 they lead in number of new issues. Also, imitationwas fast: for 10 of these securities, the second underwriting deal was madeby an imitator (see Table 3).
In this paper I want to study why innovators have a competitive advan-tage over imitators. In particular, I want to test if issuers have strongerpreferences for innovators than imitators as the underwriter of the o¤er. Tochoose an appropriate framework to study the demand for the underwriterof the issue it is worth examining the dynamics of the market for a new issuewithin each security and within each family. In Figures 1 and 2 I show thetotal quarterly principal underwritten by investment banks using the mostimportant securities of two families. As we can see, each security seems tobe popular for a certain period of time until a next generation appears andleads the market for issues of that group.
Another interesting feature for some families is that the market shareadvantage of innovators over imitators seems to be bigger in the early gener-ations. In …gures 3 through 5 I show the evolution in time of the accumulatedunderwritten principal using a given security. Each …gure represents a gener-ation of the same family (convertible preferred stocks). For later generations,imitators end up accumulating a larger principal relative to the innovator.
8See Pratt (1995) for a detailed comparison of MIPS and TOPRS.9For every product I have compiled articles in Investment Dealers’ Digest, American
Banker, Dow Jones Newswires and others found using the ABI Search Engine. For everyone I was able to …nd a description of the product, and a reference to an older productwhich was similar to it. I am especially indebted to Tom Pratt, who writes a descriptivearticle of almost every corporate security invented.
6

In some cases the innovator is overtaken. A similar feature is observed in thefamily of index-tied principal appreciation securities (…gures 6 and 7). It isless clear, though, if this is true for other families, like the tax-advantage debtor equity products. On average, still, it seems the innovators’s advantage isweaker on late generations: Table 4 shows the average ratios of principal un-derwritten by imitators relative to principal underwritten by innovators. Theratio for …rst generation securities is half the ratio that includes all imitatedsecurities.
The evidence above suggests that innovators seem to have an advantageover imitators that is stronger for earlier generations of securities within thefamily. Further inspection suggests that the appropriate framework to ana-lyze the securities in this sample may be one of di¤erentiated products: itis clear from an inspection of the de…nition of the 50 securities that thesecorporate products o¤er di¤erent bene…ts to issuers or investors. Some pro-vide a tax-advantage, others provide a hedge against the risk of defaultingon debt. Interestingly, within imitated securities there seems to be di¤erenti-ation across underwriters. Some of the characteristics of the same securities(e.g., yield, o¤er to yield at maturity, years of call option protection, etc.)di¤er signi…cantly across the banks that underwrote the o¤er (Table 5). An-other interesting fact is that the within-variety variation for some of thesecharacteristics is smaller for imitators than for the innovator (Table 6). Theprice of underwriting, i.e., the underwriting spread, does not seem to di¤ersigni…cantly, although the within security sample mean of the underwritingfee for innovators is larger than for imitators (Table 7).
I will interpret this evidence as I present the econometric model and as Idiscuss the results of the econometric estimation. What I conclude from thisevidence is that a useful model to describe competition between investmentbanks to underwrite corporate issues using this type of securities must beone of product di¤erentiation in an oligopolistic industry. Di¤erentiationoccurs at the underwriters level, where innovators are distinguished fromtheir imitators. Thus, from now on I will call a variety a distinct combinationof a security and an underwriter.
3 The Model
3.1 TheoryThe model I present below is built to illustrate the decision making processof …rms that want to raise capital and have to choose an appropriate securityand the best underwriter, that is, the investment bank or “book-manager”
7
that will engineer the security and sell it. I will use a stylized model of …rms’preferences and underwriters’ information to …nd the demand for underwrit-ing services by the di¤erent banks using their variety. The objective is tomotivate a reduced form that can then be taken to the data and will allowus to test if those underwriters that invented the security have an advantageover the other underwriters that engineered the same security for their clients(the imitators). In particular, the model shows that …rms will place a highervalue to underwriting deals made with innovators than imitators.
It is worth to point out that the ultimate source of the innovator’s advan-tage, the information asymmetry, is taken as given in this paper. The modelthat follows illustrates how the asymmetry is built into the demand functionand what would be the empirical implications.10
3.1.1 The Setup
Firms that want to raise capital, the issuers, demand underwriting servicesfrom investment banks. These banks compete to underwrite the issue of acorporate security, and for this they o¤er di¤erentiated products: debt orequity types of deals that o¤er investors di¤erent payo¤ schedules, horizons,call options, convertibility possibilities, etc. Thus, they compete for issuersthat could use a non-standard variety of …nancial instruments. I formalizethis setup below.
A …rm that needs to issue a security to raise capital is indexed by i 2 I: Ata given period, there is a set of varieties of instruments, J =f1; 2; :::; Jg fromwhich it can choose one. Let g be an index for groups of varieties, g = 1; :::; G;such that G · J and let there be a partition G =fJ1;J2; :::;JGg of J so thateach set Jg contains those varieties which are closer to each other in terms oftheir characteristics. In this setup, for example, if consumers were choosingmodels and brands of a car then a set Jg would contain all brands of, say,Sport Utility Vehicles and some other set, Jh; would contain all brands ofcompact models.
In our case, the groups in G are securities that have the same name, e.g.,PERCS, LYONS or TOPRS and each variety would be determined by thename of the bank that underwrote the issue, e.g., PERCS by Morgan Stanley
10We can …nd some attempts in the literature to endogeneize the advantage of an in-novator over its imitators. Herrera and Schroth (2000) provide a model that explainswhy innovators of derivatives acquire superior information over competitors. In a di¤erentperspective, Black and Silber (1986) derive an advantage to pionnering exchanges thatestablish liquidity early and Allen and Gale (1994, Chapter 4) show how …rst-movers canpreempt imitation choosing their initial capacity as a Stackelberg leader.
8

or PERCS by Merrill Lynch.11 Let b represent an underwriter in the set ofbanks, B.
The …rm chooses one security and one underwriter among those that o¤erthat security. A variety j 2 J is given by a unique (b; g) combination. Letuij be the value to …rm i of choosing the variety, j: The setup for this decisionis illustrated in Figure 8.
The utility function uij is central to this paper since it is the functionwhose parameters I will estimate using the data. I will characterize thisfunction when I derive the preferences of issuers for underwriters that areinnovators and underwriters that are imitators. The empirical literaturethat deals with the estimation of preference parameters in models of discretechoice uses special cases of the general speci…cations of linear preferencesby Caplin and Nalebu¤ (1991) or Anderson et. al. (1989). In these studies,agents value a product according to a weighted sum of its components. Thesecomponents, in general, are functions of the observable characteristics of theproduct. We shall see, below, how this structure is particularly appropriatefor our study.
3.1.2 Preferences of Firms
In a typical underwriting deal of equity-linked or derivative corporate secu-rities the …rm will issue a security engineered by the underwriter. The …rmhas preferences over the set of possible structures for that security. I willde…ne the underwriting deal as a combination of a vector of characteristicsand an underwriting fee. Let µ 2 £ ½ <m be this vector, and p the fee.
De…nition 1 An underwriting deal between a bank b 2 B and a …rm i 2 Iis fully characterized by fj; i;µ; pg:
The vector of characteristics could include, for example, the premiumover dividend paid by common stock, the date of maturity of the security, thenumber of periods this security is protected from a call option by the issuer,or, more broadly, discrete variables that determine whether the security isconvertible or not, if it is convertible to common stock or debt, etc.
Let us start with a general random value function for the i¡th …rm in agiven period, t. If a …rm chooses some variety j its value depends on how
11Some securities can also be grouped into categories of similar intruments, i.e., whatI referred to above as “families ”. For example, SIRENS or ICONS are dividend payingconvertible debt instruments, while ELKS or YEELDS are zero-coupon intruments withprincipal payment tied to the appreciation of a given stock portfolio. I do not deal withthis prior level of classi…cation in the theoretical model but we do account for proximityof securities between di¤erent groups in the econometric model.
9
the security has been engineered, i.e., on µj; and its “net income” after thefee is paid. Let this value function be denoted by
uijt = u(yit ¡ pjt;µjt;qt; ²t)+"ijt: (1)
Note that this value function has already been maximized with respectto other goods, that have prices q:12 As shown by McFadden (1981), thisfunction is continuous in y ¡ p and µ and twice continuously di¤erentiablein the same arguments provided that the function is continuous and twicecontinuously di¤erentiable in other goods and in µ:²t is assumed to be an observable economy-wide shock that varies in
time and changes the preferences temporarily. It can be thought of as, forexample, a sudden urge for cash or a period of unusual underpricing of newissues. The term "ijt is assumed to be an additive random component thatcaptures the random preferences of a given …rm for a particular variety.It is unobservable to underwriters, and distributed independently with acontinuously di¤erentiable cumulative distribution function, G("):
3.1.3 Underwriters
At each period underwriters engineer and price their own varieties of secu-rities such that they maximize their pro…ts. I assume that underwriters areBertrand-Nash competitors in prices and µ. Their pro…ts are given by
¼jt = pjtqjt ¡ c(qjt); (2)
where the demand for the particular variety j is
qjt = q(pt;µt; ²t) = MtZ
Aj(u)
dG("); (3)
and c(:) is the total cost, such that c0(:) ¸ 0: The demand for a particularvariety is a function of the prices of all varieties the vector µ; and the ob-servable economy-wide shocks. The set Aj(u) is the set of all the possiblerealizations of these shocks, ("i1; :::; "iJ); such that uij > uik ; k 6= j; i.e., theset of all the states of nature that lead an issuer to a choice of variety j: M isa measure of the total number of …rms, so that qj is obtained by multiplyingM by the share of …rms that choose j of the total number of …rms that wantto raise capital.
12We will drop this argument for what remains of this paper to avoid unnecessarycomplications.
10

The next proposition will simplify our work signi…cantly. It shows that anunderwriter’s choice of µj that maximizes each …rm’s individual utility con-ditional on its available information also maximizes the underwriter’s pro…ts.I assume that u(:) is twice continuously di¤erentiable, strictly increasing andstrictly concave.
Proposition 1 For a given shock ² and a price pj; if µ¤jmaximizes uijt(yi ¡pj;µj;²t; "ij; :) then µ¤jmaximizes ¼j:
I prove this proposition in the appendix, but the intuition is very simple.Since the unobservable component of utility is independent of the character-istics of the security and consumers taste shocks are independent, then theaggregate demand for a variety j is strictly increasing in the utility of anyissuer. I have derived this result now because it allows me to eliminate µjfrom the issuers’ value function, by substituting the optimal choice of µj:The objective in the next section is to explain how that choice di¤ers acrossunderwriters with di¤erent information sets and, as a consequence, how thevalue of …rms di¤ers depending on the chosen underwriter.13
3.1.4 Asymmetric Information
The crucial feature that distinguishes an innovator from an imitator in thispaper is that innovators exploit an informational asymmetry and are able tosign the largest share of …rms using the security they invented while sustain-ing rents in equilibrium. In this paper I do not provide a model that explainswhy moving …rst gives the innovator an advantage, as Herrera and Schroth(2000) do. Instead, I take as given that innovators will possess an advantageover imitators and formalize it in this theory section to derive a the reducedform that will be taken to the data.
Let £0 2 £ be the prior (common) knowledge set of all the possiblecharacteristics that a security can have, and uijt the utility function in (1),which is also common knowledge to all underwriters at some point in time.To relate this abstraction to the case of equity-linked or derivative securities,imagine £0 as a set of all possible engineering choices for a security beforeconvertible debt was invented. Before the …rst innovation, debt securitieswould be zero coupon or would have paid a …xed or a ‡oating rate, so anyvector in £0 would have zero entries for other characteristics yet to be used,e.g., for convertibility to common stock.
13The reader may have noticed already that this approach is equivalenet to the derivationof an indirect utility function.
11
If an underwriter spends resources on R&D to come up with a new se-curity, it will discover new possible combinations of characteristics a …rmmay …nd valuable, possibly changing zero entries to add new dimensions tothe structure of a security. The PERC, for example, was the …rst issue ofpreferred stock convertible to common stock with capped and ‡oored ap-preciation. This new set of possible engineering choices must be tied to thediscovery of …rms’s preferences for some previously non-existent feature of asecurity. In the case of the PERC, its innovator, Morgan Stanley, …gured outthat in the uncertain environment for investment in late 1991, an issue of aPERC would allow …rms to attract investors with stable high yields, pricingthe o¤er better than common stock while capping the security’s appreciationpotential (Pratt, 1991).
De…nition 2 An innovation is a new security g; tied to two private discov-eries:
(i) a set £g ½ £ such that £g ¡ £0 6= fÁg; and
(ii) a decomposition of unobservable preferences for a variety k of g
"ik = º(µk; ²; :) + e"ik:
Based on this de…nition, after an investment bank invests on R&D itdiscovers some systematic component, º(:); in the previously random termof any issuers’ preferences, ". This component depends on the engineering ofthe security, µ; and on a time-variant economy-wide shock,². This componentof utility can also depend on new attributes of the µ vector, i.e., it can bede…ned for newer features of a security, that previously had a zero entry (e.g.,convertibility of preferred stock, stock portfolio-tied appreciation of principal,etc.). Thus, the innovator also enlarges its set of possible choices for µ.
Example 1 The Equity-Linked Security or ELK was the …rst debt productto tie the repayment of principal to the stock price of another publicly tradedcompany. Based on our de…nition:
(i) the set of choices is now expanded with all the possible …rms that canbe chosen to tie their stock price to the repayment of principal, and
(ii) the discovered component º(µk; ²; :) would be a function of how issuers’cash ‡ows are correlated with each …rm whose stock price could be cho-sen to be tied to the repayment of principal.
12

When the …rst underwriting deal is made using a new security the in-novator reveals a particular vector µ: The whole set of possible engineeringchoices for this particular security, £g is kept private, though.
The goal now is to show that the optimal choices of µ for innovators andimitators will di¤er, in general, and this will be re‡ected in the value functionof a …rm signing an underwriting deal with either. Proposition 1 allows meto eliminate the vector µ of the said function and express the indirect utilityas a function of the bank’s identity. To see this, note that what distinguishesan innovator from an imitator is the set from which it can choose any µ: Forthe innovator, this set is £0[ £g; and for the imitator this set is £0[µk: Letus summarize the identity of an investment banks by
b =½
1 if the underwriter is the innovator,0 else, (4)
and let v(yi ¡ p; b; ²) ´maxµ2£b
u(yi ¡ p;µ; ²):
Proposition 2 For any couple of varieties j; l of the same security g; if j isissued by an innovator then vj(yi ¡ p; 1;²) ¸vl(yi ¡ p; 0;²).
The result is trivial. £1g is the set of choices of the innovator and £0
g isthe set of choices of the representative imitator. Since £0
g µ £1g; the result
follows.The Proposition above has established that given prices and economy-
wide shocks, innovators have an advantage over imitators. This advantagecan be measured by the additional value to issuers if they were to choose aninnovators’ variety. Let this di¤erence be named
¢vj ´ v(yi ¡ p; 1;²)¡v(yi ¡ p; 0;²): (5)
Note the importance of the time-variant shock. It provides the source ofvariation that makes the optimal choice of µ; for a given security, change.This is crucial, because otherwise the revelation of µ in the …rst deal wouldsu¢ce to make innovators and imitators identical in terms of their informa-tion. Note too that an underwriting deal can be de…ned simpler than inDe…nition 1. Now it can be summarized by fj; i; b; pg:
This result is convenient for the estimation because what I want to captureis exactly the di¤erence in preferences for the di¤erent underwriters. Also,working with a value function, in which µ has been eliminated, avoids losing alarge proportion of observations for which the full µ is not available. In otherwords, my interest is to distinguish preferences for these two types of banksmore than to estimate the marginal valuation (and the derived elasticities)
13

for a given characteristic of a security, e.g., years of call protection, yieldadvantage, etc.
Another reason is that preferences for the choices of each attribute in µmay be complicated functions that make the estimation di¢cult. Thus, usinga simpler function that summarizes all the attributes seems reasonable. Thisapproach has been used by Caplin and Nalebu¤ (1991), who use a utilityfunction that is linear in functions that map the dimensions of the productcharacteristics onto a di¤erent space. Using their own example, the bene…tsof a car could include only comfort and speed, but these could be morecomplicated functions of the physical attributes of the car.
3.1.5 Market Shares in Equilibrium
Here I discuss what Proposition 2 implies for the equilibrium in the marketfor underwriting. In this type of setup with di¤erentiated products, there isa demand function for each variety. The next proposition establishes that,ceteris paribus, the demand for an innovator’s variety of a given security isbigger than the demand for an imitator’s variety of the same product.
Proposition 3 Proposition 2 implies that for two varieties j; k of the samesecurity g and for a …xed vector of underwriting spreads, p 2 <J+ such thatpj = pk then
qj(p; :) ¸qk(p; :)if j is the innovator’s variety.
I prove this proposition in the appendix. Note that if ¢vj > 0 then theproposition above holds with a strict inequality.
I will not show formally that in equilibrium innovators have bigger within-securities market shares than imitators. In fact, it is not obvious that thiswill be the equilibrium outcome. It is true though that, under mild regularityconditions on G(:) and v(:), the game becomes one of strategic complemen-tarity.14 Moreover, if the best response function of the innovator “shiftsright” if his advantage is positive, i.e., if ¢v > 0; and if marginal costs arethe same among underwriters then in equilibrium the innovator will chargea larger underwriting spread for his variety of the same security higher and
14Su¢cient conditions for strategic complementarity would be that @ 2qj@pj@pk
> 0 and@ qj@pk
> 0: The latter condition is obvious just by inspecting the aggregate demand (seeappendix). The former will be met if v(:) is not too concave.
14

have a larger market share within that security. If this advantage eventu-ally decreases, then the innovator’s equilibrium price should decrease andconverge to a symmetric equilibrium as the advantage goes to zero.15
3.2 The Econometric ModelI argued above that the market of underwriting new issues using equity-linkedsecurities and other corporate derivatives may be well approached as one ofdi¤erentiated products. Each variety o¤ered is given by a combination of asecurity structure or name and the identity of an underwriter. In this section Ipresent the model that I take to the data. This model will be a reduced formequation obtained from aggregating the individual …rms’ demands for thedi¤erent varieties. I establish di¤erent sets of assumptions for the aggregationof individual …rm demands, and the results will be di¤erent reduced formsto estimate: the multinomial logit and the nested logit demand models, eachone requiring a di¤erent method of estimation.
3.2.1 The General Setup
I consider each time period t = 1; :::; T a di¤erent market in which an issueri 2 It chooses its desired variety j 2 Jt: As the standard of the empiricalliterature of discrete models of demand, I will specify the value of this issueras a function of observed and unobserved characteristics of the issuer and ofthe product o¤ered by the underwriter, and of the relevant parameters. Let
uijt = ®(yit ¡ pjt) + xjt¯ + »jt +X
k
¾kxkjtºkit + "ijt: (6)
I assume that the value of net income is separable and linear. In otherwords, I am imposing that preferences are quasi-linear and as a consequencewealth e¤ects are ruled out (® would be the (constant) marginal utility ofincome). This assumption is not only tractable and convenient for the es-timation but quite reasonable for some types of products.16 I believe thisassumption is justi…ed for this particular data set: the amount paid in un-derwriting fees is small relative to the value of the outstanding equity of
15The su¢cient conditions for this would be that @qj@¢v > 0 and @2qj
@qj@¢v : Again, theformer holds and it is veri…ed just by inspecting the aggregate demand function. Thelatter condition is met only under certain assumptions about G(:) and v(:):
16Nevo (2000) argues that it is reasonable to assume quasi-linearity for ready-to-eatcereal because their price represents a small share of household expenditures. By thesame token, it is not reasonable to make this assumption for the demand of cars. In fact,Berry, Levinsohn and Pakes (1995) use a Cobb-Douglas utility function, i.e., the additiveterm for net income is ® log(yit ¡ pjt):
15
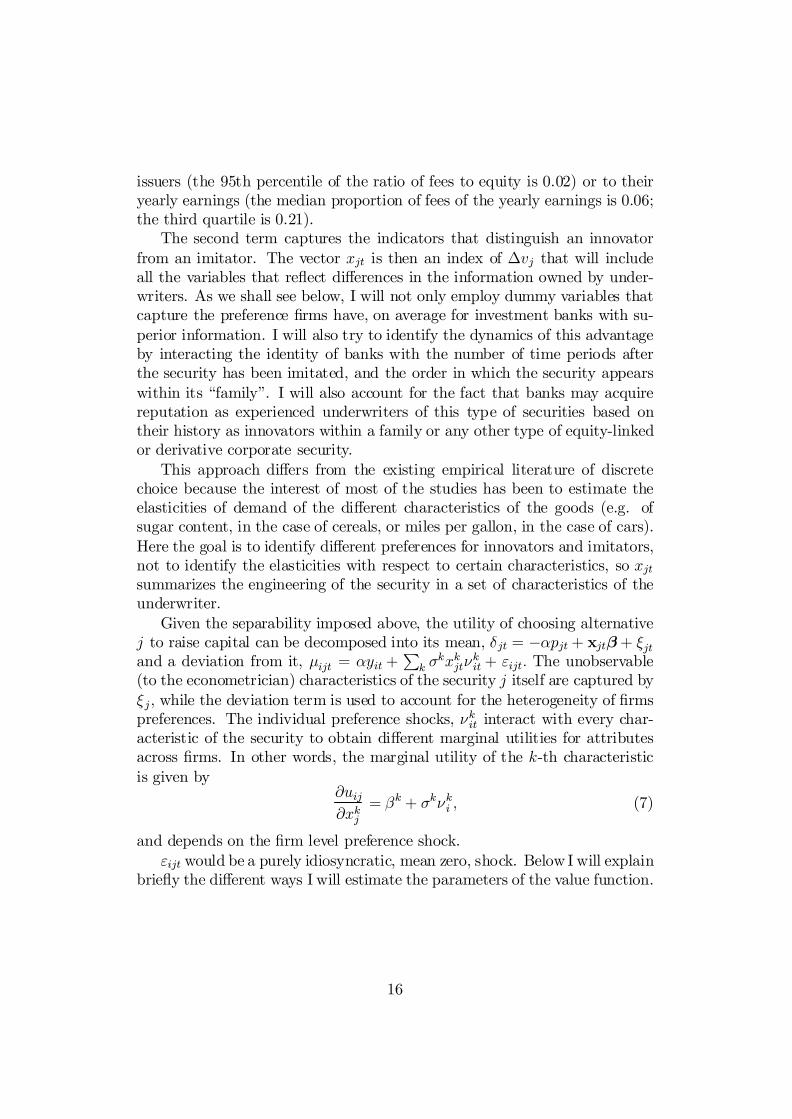
issuers (the 95th percentile of the ratio of fees to equity is 0.02) or to theiryearly earnings (the median proportion of fees of the yearly earnings is 0.06;the third quartile is 0.21).
The second term captures the indicators that distinguish an innovatorfrom an imitator. The vector xjt is then an index of ¢vj that will includeall the variables that re‡ect di¤erences in the information owned by under-writers. As we shall see below, I will not only employ dummy variables thatcapture the preference …rms have, on average for investment banks with su-perior information. I will also try to identify the dynamics of this advantageby interacting the identity of banks with the number of time periods afterthe security has been imitated, and the order in which the security appearswithin its “family”. I will also account for the fact that banks may acquirereputation as experienced underwriters of this type of securities based ontheir history as innovators within a family or any other type of equity-linkedor derivative corporate security.
This approach di¤ers from the existing empirical literature of discretechoice because the interest of most of the studies has been to estimate theelasticities of demand of the di¤erent characteristics of the goods (e.g. ofsugar content, in the case of cereals, or miles per gallon, in the case of cars).Here the goal is to identify di¤erent preferences for innovators and imitators,not to identify the elasticities with respect to certain characteristics, so xjtsummarizes the engineering of the security in a set of characteristics of theunderwriter.
Given the separability imposed above, the utility of choosing alternativej to raise capital can be decomposed into its mean, ±jt = ¡®pjt + xjt¯ + »jtand a deviation from it, ¹ijt = ®yit +
Pk ¾kxkjtºkit + "ijt: The unobservable
(to the econometrician) characteristics of the security j itself are captured by»j; while the deviation term is used to account for the heterogeneity of …rmspreferences. The individual preference shocks, ºkit interact with every char-acteristic of the security to obtain di¤erent marginal utilities for attributesacross …rms. In other words, the marginal utility of the k-th characteristicis given by
@uij@xkj
= ¯k + ¾kºki ; (7)
and depends on the …rm level preference shock."ijt would be a purely idiosyncratic, mean zero, shock. Below I will explain
brie‡y the di¤erent ways I will estimate the parameters of the value function.
16

3.2.2 Logit Demand
Berry (1994) shows that if we make some assumptions about the unobservedcomponents and distributional assumptions about "ijt we can identify theparameters of a simpli…ed version of (6) using the observed market sharesof all varieties, j: Note that the market share is the proportion of …rms thatchoose security j of the total number of …rms that make a new corporateissue.
Assuming thatPk ¾kxkjtºkit is zero for every variety, i.e., no random coe¢-
cients, and that "ijt has a density function f(") = exp(¡ exp(¡")) the marketshares predicted by the model, bsjt; which are obtained by integrating all therealizations of unobservables that lead to a choice of j over all other varieties,will be given by the well-known closed form solution (the logit formula):
bsjt(±t) =e±jt
1 +PJl=1 e±lt
: (8)
Note that the average utility of the outside alternative is normalized to zero(±0t = 0) and that the term ®yit drops out because it is common to allthe choices. The logit formula has the property that the market shares areuniquely pinned down by the average utility of a choice j: Thus, ® and ¯can be obtained from a regression of the di¤erence of the logarithms of theobserved market share of j and an outside alternative, on xjt and pjt; e.g.:
ln sjt ¡ ln s0t = ¡®pjt + xjt¯ + »jt: (9)
The estimation of this model is simple. The challenge is to …nd appro-priate instruments for the price because it is very likely that it is correlatedwith the unobservables, »jt: This is a typical problem found in studies thatuse product characteristics as regressors. In this case, xjt uses issuers’ char-acteristics that summarize the full description of the product, so it is lesslikely that »jt contains product unobservables correlated with the price.
There may still be other costs of imposing this particularly convenientstructure. As a consequence of assuming that the "ijt are independent andhomoskedastic, the odds ratios of choosing one variety over another do notdepend on the value of other varieties. This can be problematic: supposethe demand for MIPS were evenly split between Goldman, Sachs and MerrillLynch, and each were half the demand for Salomon Brother’s ELKS. Thismodel would predict that the ratio of the market share of Goldman’s MIPSto Salomon’s ELKS would still be one half, even if Merrill increases its under-writing fee by any magnitude. Implicitly, the business lost by Merrill Lynchwould be absorbed by both Goldman and Salomon so as to preserve the ratio,
17
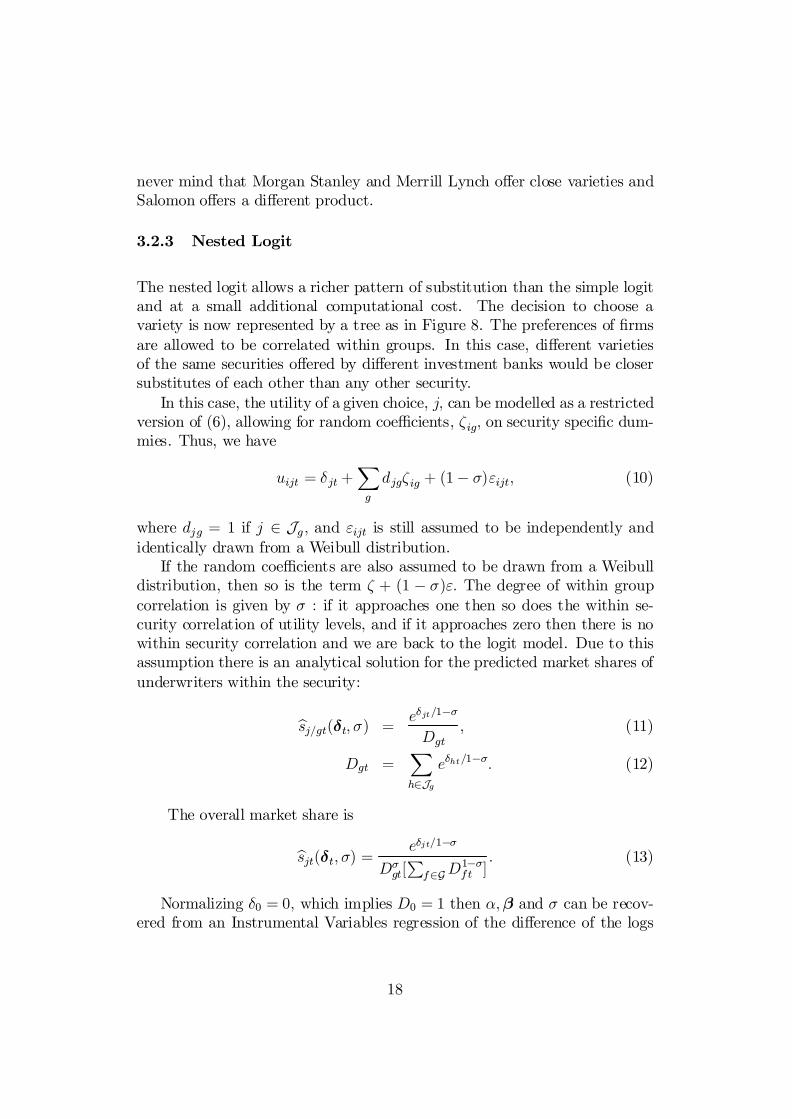
never mind that Morgan Stanley and Merrill Lynch o¤er close varieties andSalomon o¤ers a di¤erent product.
3.2.3 Nested Logit
The nested logit allows a richer pattern of substitution than the simple logitand at a small additional computational cost. The decision to choose avariety is now represented by a tree as in Figure 8. The preferences of …rmsare allowed to be correlated within groups. In this case, di¤erent varietiesof the same securities o¤ered by di¤erent investment banks would be closersubstitutes of each other than any other security.
In this case, the utility of a given choice, j; can be modelled as a restrictedversion of (6), allowing for random coe¢cients, ³ig; on security speci…c dum-mies. Thus, we have
uijt = ±jt +X
g
djg³ig + (1¡ ¾)"ijt; (10)
where djg = 1 if j 2 Jg ; and "ijt is still assumed to be independently andidentically drawn from a Weibull distribution.
If the random coe¢cients are also assumed to be drawn from a Weibulldistribution, then so is the term ³ + (1 ¡ ¾)": The degree of within groupcorrelation is given by ¾ : if it approaches one then so does the within se-curity correlation of utility levels, and if it approaches zero then there is nowithin security correlation and we are back to the logit model. Due to thisassumption there is an analytical solution for the predicted market shares ofunderwriters within the security:
bsj=gt(±t; ¾) = e±jt=1¡¾
Dgt; (11)
Dgt =X
h2Jge±ht=1¡¾: (12)
The overall market share is
bsjt(±t; ¾) =e±jt=1¡¾
D¾gt[Pf2GD
1¡¾ft ]: (13)
Normalizing ±0 = 0; which implies D0 = 1 then ®;¯ and ¾ can be recov-ered from an Instrumental Variables regression of the di¤erence of the logs
18

of the observed market share of j and the outside alternative on xjt; pjt andsj=gt because
ln sjt ¡ ln s0t = ¾ ln sj=gt ¡ ®pjt +xjt¯ + »jt: (14)
Again, instruments for prices and additional instruments for within securitymarket shares must be used to obtain consistent estimates because bothvariables are endogenous.17
As I mentioned, this variation of the random indirect utility will allowmore reasonable substitution patterns. Let us inspect the price elasticitiesof this model. For two varieties, j and l, the price elasticities @sjpl@plsj
would begiven by:
´jl =
8<:
¡®pjf 11¡¾ ¡ sj[1 + ¾
1¡¾D1¡¾g
Pf2G D
1¡¾f ]g for j = l 2 Jg;
®plslf1 + ¾1¡¾D
1¡¾g
Pf2G D
1¡¾f for j 6= l; and j; l 2 Jg;
®plsl otherwise.(15)
Cross-price elasticities for two di¤erent varieties within the same group willbe di¤erent than cross-price elasticities for varieties across di¤erent groups,even if they have the same prices and market shares (provided that ¾ > 0).Still, the cross-price elasticity of one variety with varieties of other groupswill be identical, even if one variety belongs to a group that is closer to theother in terms of the uses of the security.
3.2.4 Issuer Heterogeneity
The two models above deal only with mean utility levels, ±; and assume awaythe individual preference shocks. This imposed some undesirable restrictionson the substitution patterns. To deal with this, I use data from COMPU-STAT about all the …rms that did new issues using equity-linked securityin the sample. This will introduce issuer heterogeneity that will relax therestrictions on cross-price elasticities in (15).
In this case, I consider a vector of f …rm characteristics vi; each one tobe interacted with the price to obtain the following estimable relationship:
ln sjt ¡ ln s0t = ¡®pjt + xjt¯ + pjtX
f
¾fºfit + »jt: (16)
As we shall see in the results, the cost is that we will lose a signi…cantproportion of the observations in the sample. Many of the issuers of equity-linked securities had no record in COMPUSTAT.
17See Berry (1994) for a proof.
19
3.3 The DataAs I mentioned before, the SDC Database of New Issues records all the publicand some private o¤erings made since 1962. For securities de…ned in SDCas equity-linked or derivative corporate securities there are 662 o¤erings upto March 2001 (the …rst issue, a LYON, was made in April of 1985). Thereare 50 securities and a total of 98 varieties. I compute the varieties’ marketshares over the whole market of new issues and over the varieties within thesecurity at di¤erent time periods.
I divide the whole sample in time periods rather than aggregate the databy varieties over the whole time span studied. Overall aggregation wouldreduce signi…cantly the number of observations (to 98) and would also elimi-nate the time variation of market shares and underwriting fees, compromisingseriously the consistency of the estimators. Thus, I treat each time period asan independent market, so that there is a demand function for each variety ateach time. The parameters of this function are identi…ed by cross-sectionalvariation in prices, in the identity of the underwriter, and the issuer’s char-acteristics and by the time variation in prices and issuer “experience”. Thepanel structure of the data is crucial since I want to study the dynamics ofthe advantage to innovators.
To form the panel I must choose the length of each time period, though.The shorter the length of each period increases the size of the usable dataset but increases the risk of aggregating very few or unique deals per period,which would increase dramatically the variation in the market shares. Toavoid arbitrariness in the choice of the length I do the estimations at fourdi¤erent levels of aggregation: using 16 periods (annually), 8 periods (bian-nually), 11 periods (18 months) and 12 periods (16 months). In this way wecan also have an assessment of the robustness of the results to this choice.
The panel is unbalanced because not all securities are o¤ered at eachperiod. Only two varieties are o¤ered in the …rst period and 98 in the last. Iconsider standard equity as the outside option to issuers, i.e., standard equityis the variety j = 0: I approximate the total size of the market for new issuesusing
M = q0 + q1 + :::+ qJ : (17)
The unit of demand is number of deals, not dollars underwritten. Thisassumes that …rms set ex-ante the amount of cash they want to raise inthe o¤er, and the choice I model here is the choice of the security and theunderwriter.
20

3.3.1 Variables
Market Shares Overall market shares, sj; are the observed aggregatenumber of deals for that variety in a given period divided by the total numberof new issues. Within-security market shares divide the number of deals bythe total number of issues using the relevant security:18
sjt =qjtMt;
sj=gt = qjtPl2Jg qlt
:
Prices Prices of underwriting are the fees charged by the investment bankthat leads the syndicate of book managers of an o¤er. They are expressed asa percentage of the principal underwritten and called underwriting spreads.Usually this spread can be disaggregated in the underwriting fees and man-agement fees. This disaggregation is seldom observable though, so the pricevariable I will use is the total spread.19
Demand Shifters in xjt The demand shifters that do not exactly indicatethe information asymmetry between underwriters are variables about theunderwriter’s experience and reputation issuing this type of securities. I usethe total number of innovations in equity-linked products and innovationswithin the particular family of the security accumulated by the underwriter.I use time period dummies to control for observable economy-wide shocksand group dummy variables.
Advantage to Innovators One way to test if innovators have advantageson the revenue side is by including a dummy variable that equals one when
18 In some periods, market shares of existing varieties are zero. The computation oflogit and nested logit models requires taking the logarithm if these shares. To avoidthe indeterminacy problem I use a transformation sj that does not alter its distributionsigni…cantly. I compute instead
lns¤jt = ln(sjt + 0:00001);
lns¤j=g = ln(sj=gt + 0:00001):
Excluding these observations would not only bias the sample selection but also imply aloss of 191 observations that actually reveal that the demand was zero.
19For periods of zero market shares no information of the bids made by potential un-derwirters is observed. Since these varieties were available to …rms, although none choseto use them, we assume there is a going price for them. We approximate this price withthe last observed price for that variety.
21
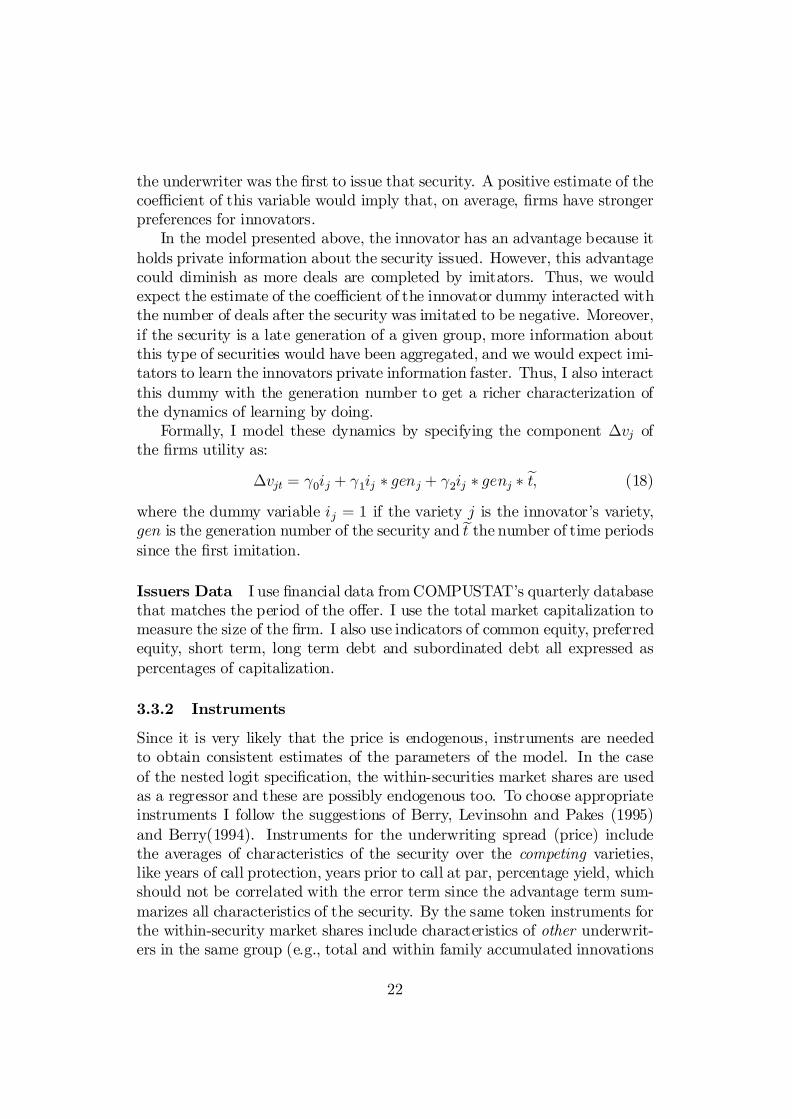
the underwriter was the …rst to issue that security. A positive estimate of thecoe¢cient of this variable would imply that, on average, …rms have strongerpreferences for innovators.
In the model presented above, the innovator has an advantage because itholds private information about the security issued. However, this advantagecould diminish as more deals are completed by imitators. Thus, we wouldexpect the estimate of the coe¢cient of the innovator dummy interacted withthe number of deals after the security was imitated to be negative. Moreover,if the security is a late generation of a given group, more information aboutthis type of securities would have been aggregated, and we would expect imi-tators to learn the innovators private information faster. Thus, I also interactthis dummy with the generation number to get a richer characterization ofthe dynamics of learning by doing.
Formally, I model these dynamics by specifying the component ¢vj ofthe …rms utility as:
¢vjt = °0ij + °1ij ¤ genj + °2ij ¤ genj ¤ et; (18)
where the dummy variable ij = 1 if the variety j is the innovator’s variety,gen is the generation number of the security and et the number of time periodssince the …rst imitation.
Issuers Data I use …nancial data from COMPUSTAT’s quarterly databasethat matches the period of the o¤er. I use the total market capitalization tomeasure the size of the …rm. I also use indicators of common equity, preferredequity, short term, long term debt and subordinated debt all expressed aspercentages of capitalization.
3.3.2 Instruments
Since it is very likely that the price is endogenous, instruments are neededto obtain consistent estimates of the parameters of the model. In the caseof the nested logit speci…cation, the within-securities market shares are usedas a regressor and these are possibly endogenous too. To choose appropriateinstruments I follow the suggestions of Berry, Levinsohn and Pakes (1995)and Berry(1994). Instruments for the underwriting spread (price) includethe averages of characteristics of the security over the competing varieties,like years of call protection, years prior to call at par, percentage yield, whichshould not be correlated with the error term since the advantage term sum-marizes all characteristics of the security. By the same token instruments forthe within-security market shares include characteristics of other underwrit-ers in the same group (e.g., total and within family accumulated innovations
22

by the other underwriters of the same security). To test if these instru-ments over-identify the parameters of the models I perform a Hausman testof over-identifying restrictions.
4 Results
4.1 Logit DemandTo serve as a benchmark, …rst, I …t the simplest, yet most restrictive, de-mand model: the multinomial logit. I only report here the results for theaggregation at 12 time periods for the sake of parsimony (the subsequentestimations will include all aggregation levels to show the robustness of theresults). Table 8 reports the estimates of the parameters of (9), allowingfor unobservable (to the econometrician) attributes in the di¤erent varietiesand using an instrumental variables method to account for the correlationbetween the price and the unobservables (the standard errors were estimatedusing the Huber/White variance estimators, allowing for heteroskedasticityand serial correlation within securities). I …t two models: one that only in-cludes the innovator indicator from equation (18) (reported in the “AverageAdvantage” column) and another one that speci…es the full dynamics in (18).I use time period-speci…c dummies and …xed e¤ects for the security group.
We can see, for both columns, that most estimates have the expectedsign. The average value to an issuer increases if the number of innovationsin equity-linked securities accumulated by its chosen underwriter increases.The negative sign of the number of accumulated innovations within thatsecurity’s group, though, is an unexpected anomaly.
The underwriter’s fee (the price) is signi…cant at the 90% level. Notethat I report the estimated ® (with positive sign) to be consistent with ournotation above, where the price component of utility appears as ¡®p: Inconsistency with oligopolistic behavior, this estimate must produce price-inelastic demands. In Table 9 I report the number of demands (of 323) thatviolate this condition. Both logit models imply 50 and 49 inelastic demands,respectively, out of 323 estimates. The average elasticity, though, is wellabove 1.
In both columns, the innovator dummy has a positive coe¢cient, signif-icant to the 99% level of con…dence, suggesting stronger preferences for theinnovator’s variety, ceteris paribus. The second column reveals an interestingresult. The coe¢cients on the innovator dummy, on the dummy interactedwith the generation number, and on the dummy interacted with the gen-eration number and the time after imitation are all signi…cant to the 99%
23
level of con…dence. The estimate of the coe¢cient of the …rst interactionterm, i ¤ gen; is positive, revealing that the later the generation, the higherthe average initial advantage of the innovator. The second interaction term,i ¤ gen ¤ et; has a negative estimated coe¢cient, showing that this advantagedecreases in the number of periods that imitators have been in the market,and that this advantage diminishes faster the later the generation.
The previous results assumed that varieties of the same security were asclose to each other in the product space as varieties of di¤erent securities.Group dummies may have accounted for proximity within the family, but notwithin the security. The results that follow are for the nested logit model,that deals with this problem.
4.2 Nested Logit DemandThe estimation procedure for the nested logit demand model is similar tothe one used for the multinomial logit. The di¤erence is that, here, I includeas a regressor the within-security market shares for each variety in order toobtain an estimate of the intra-security substitution e¤ect. For this matter,additional instruments must be used since the new regressor is believed to becorrelated with the variety’s unobservable characteristics. This model was…tted for the four di¤erent aggregations of data: 8,11,12, and 16 periods.The results are shown in Table 10.
The estimated coe¢cient of price still has the correct sign for all theaggregations. It is signi…cant at least at the 95% level but for the casewhere t = 8 (where its p-value is 0.115). The estimated elasticities increasessharply after accounting for the proximity of varieties, and as a consequencethe implied number of inelastic demands is much smaller (10 at most).
The estimated coe¢cient for the substitution parameter is signi…cant inall cases, and the estimate is within the appropriate bounds, 0 and 1 (0:615 <b¾ < 0:729). This result is consistent with the theoretical setup in whichvarieties within a security type are closer substitutes than varieties outsidethe security type: issuers switch bankers before using a di¤erent securitystructure.
For all these cases I have …tted the model that describes the dynamicsof the innovator’s advantage. The estimates of the innovator’s advantagecomponent reveal the same dynamic pattern as before: the innovator dummyhas a positive estimated coe¢cient, as well as the dummy interacted withthe generation number. The coe¢cient of the interactions of the innovatordummy with the generation number and the number of periods after the …rstimitation is negative.
Figures 9 to 12 illustrate better what the estimates for the dynamics of
24

the advantage mean in terms of the time during which issuers value innova-tor’s varieties more than imitators’. I plot the estimated advantage of theinnovator, i.e., the predicted ratio of the innovator’s market share to theimitator’s ( sInsIm ), in the vertical axis against time, measured in years, in thehorizontal axis. We can see that, for all aggregations, the innovator of a …rstgeneration security has the smallest initial advantage over his imitators. Inall cases, this advantage disappears slowly (in 12 years, on average). In sharpcontrast, an innovator of, say, a seventh generation security enjoys a biggeraverage initial advantage over other competing underwriters. This advan-tage, though, will be gone shortly after the product’s second year of havingbeen imitated (that happens when both market shares are predicted to beequal to each other). One possible interpretation of this result is that lategenerations are often very complicated modi…cations of existing securities.At …rst it is di¢cult for imitators to learn how innovators are engineeringthe deals, but in time they should learn faster given that more informationhas been aggregated about the security type or of the family of securities.
Since I estimate this model using instrumental variables, I test if therestrictions imposed by using the chosen instruments over-identify the pa-rameters of the model (the F-statistic for the test and its p-value are alsoreported in Table 10). The hypothesis that the model is over-identi…ed isrejected in all aggregations but the last one, when the sample is split in 8periods. Rejection may be due to the fact that the instruments chosen donot introduce su¢cient independent variation themselves to account for thevariation in all the endogenous variables of the model (price and within-typemarket shares). It is also possible that the model is not fully speci…ed and theinstruments themselves are correlated with other excluded exogenous vari-ables. However, it is interesting that the model seems to be over-identi…edwhen each observation is the result of aggregating over 2 years and not less(when t = 8). Thus, it is possible that within shorter intervals, the instru-ments used are strongly correlated between themselves, while this may notbe the case for longer periods. It is also worth pointing out that, the rejec-tion of over-identi…cation at some levels of aggregation is not strong evidenceagainst our choice of instruments, since the results are consistent over all theaggregations (the over-identi…ed models and those that are seemingly not).
4.3 Issuers HeterogeneityThe estimation by instrumental variables of the logit and nested logit demandmodels above may have allowed us to obtain consistent estimates of the own-price elasticity, but it may still yield implausible cross-price elasticities forvarieties in di¤erent groups. Also, the test of over-identifying restrictions
25

for the nested logit speci…cation revealed that the model may still have notbeen completely speci…ed. Below (Table 11), I show the results after addingthe characteristics of the issuer to the model via interactions with the pricevariable. Although it is not my goal to estimate these cross-price elasticities,adding heterogeneity will di¤erentiate own-price elasticities by the type of…rms.
Although I lose observations when using issuers’ data, Table 11 showsresults that do not di¤er qualitatively to the previous ones. The same dy-namic behavior of the innovators advantage is observed in all four cases. Forall aggregations over time, the initial advantage is bigger than in the pre-vious speci…cation but it also decreases at a much faster rate. On average,for all cases of the model with interactions, the advantage of each generationwould be gone almost by the time predicted in the nested logit model withoutinteractions (see Figure 13 for the case when t = 8):
Of the …ve issuers variables that I interact with price, only market cap-italization and preferred stock as a percentage of market cap were found tobe signi…cant at a level higher than 90%. Their estimated coe¢cients wereboth positive. One possible explanation is that market capitalization is anapproximation for the available sources of …nance to the issuer. Similarly,since most of the varieties are forms of preferred stock or convertible to pre-ferred stock, …rms with a larger proportion of this type of stock have moreavailable instruments to raise capital and thus their demands are more elasticto underwriting spreads.
Even though estimates of the elasticity of demand are much higher, thenumber of inelastic demands increases relative to the total number of usabledata points, most likely due to the large variation in the issuers characteris-tics.
Although I added more regressors to the model, this did not change sub-stantially the result for the tests of over-identifying restrictions. We stillcannot reject that the model is over-identi…ed in the case where t = 8.Now, however, we obtain a similar result when the time periods are shortest(t = 16). As before, although the model does not seem to be over-identi…edin all the cases, the estimates are consistent over all the estimations: theimplied elasticities for each speci…cation and the implied speeds at whichthe innovator’s advantage diminishes do not di¤er signi…cantly across thedi¤erent time aggregations.
26

5 SummaryThis paper has provided new evidence of the sources of …rst-mover advan-tages in innovations in …nance. The existing empirical literature of …nancialinnovation identi…ed the following stylized fact: that investment banks areable to pro…t from innovation despite being imitated almost immediately.Whatever advantage they had over competitors, the clue to the pro…tabil-ity of unpatentable innovation in …nance was that innovators were able tounderwrite the largest market shares of corporate initial o¤erings.
This paper has tried to provide an answer to the question of what isthe source of the advantage. For this purpose I used data of all the NewIssues using Equity-Linked and derivative corporate securities. This paperhas tested empirically the hypothesis that …rms have stronger preferences forunderwriters that are innovators, not imitators. The theoretical motivationfor this conjecture was the following: …rms that need to raise capital haveto use a security which is engineered by investment banks that act as under-writers. If the underwriter is the innovator of the security, this signals he isbetter informed about the choices that will be best for the …rm. On average,the value to the …rm from doing the issue with the innovator will be larger.
To …nd an appropriate method to test this hypothesis I started by an-alyzing preliminary evidence that suggested that innovations in corporateproducts such as equity-linked securities are frequently improvements or gen-erations of previous designs, so that families of securities could be identi…ed.I also noted that banks o¤ered di¤erentiated underwriting services. Thus, Iused the discrete choice theory of product di¤erentiation as the framework tomodel the decisions of …rms to choose security structures and underwriters.The evidence also suggested that innovators had advantages that presumablydissipated over time. Thus, I decided not only to study the overall advantageof innovators, but its dynamics.
For that purpose I speci…ed the value to a …rm for choosing a particularsecurity and a particular underwriter whose parameters were estimable. Iclaimed that the advantage that the innovator had over its competitors inthe market to underwrite new issues can be summarized in an index thatincluded his identity, the time elapsed after the innovator was imitated, andthe generation of a security. Moreover, this index appeared directly in thevalue function of a …rm because banks make di¤erent engineering choicescontingent on their private information.
Using data of all the new issues of corporate securities from the Securi-ties Data Company Database I estimated the parameters of the dynamicsof the innovators’ advantage for multinomial logit and nested logit demandmodels. I also used …nancial data from COMPUSTAT about the …rms that
27

issued the securities in the sample to enrich the speci…cation. A result con-sistent to all the speci…cations was that preferences for innovators are, onaverage, stronger than for imitators. Interestingly, these preferences wereinitially stronger the later generation of an innovation, possibly re‡ectingthe fact that late generations get more complex and are therefore harder tounderstand to imitators. The preference for an innovator over an imitatordiminishes in time, possibly as a result of imitators catching up with inno-vators. Further, the speed of the reduction in the preference for innovatorsover imitators was larger for later generations. I interpreted this as the factthat late generations appear naturally when more information has been ag-gregated about the family of securities they belong to, making learning aboutthe innovator’s private information easier.
The scope of the paper has been limited by the availability of data. Costdata was unavailable for most of the observations, making it unworthy toestimate the model jointly with a pricing equation. This would have alsoallowed to test if innovators and imitators have di¤erent marginal costs forunderwriting o¤ers, another potential source of …rst-mover advantages.
This paper has also taken innovation as exogenous. The set of choicesavailable to …rms was taken as given at each time. Certainly, one interestingway to continue this line of research would be to identify the preferences of…rms for new securities at each time they make their choices. If the choicesof the …rm were to choose a security of a set of already existing securities orto rather choose to be the …rst issuer of a new security, then the data in eachdeal could reveal what determines when an innovation is to be introduced.
28

APPENDIX
Proof of Proposition 1. The value of choosing variety j is u(µj; :)+"ij:Thus, given the properties of u(:); if µ¤j maximizes uijt then it must be that
8m @u(:)@µmj
jµ¤j = um(µ¤j ; :) = 0; (19)
where µmj corresponds to each entry of the µj vector.To …nd the pro…t maximizing choices, let us …rst solve for the demand
function for some variety j, as given in (3). Note …rst that the probabilitythat an arbitrary issuer chooses variety j over any other variety k is
Pr(uij ¸ uik) = Pr("ik · u(µj) ¡ u(µk) + "ij)= G(u(µj)¡ u(µk) + "ij):
Further, since each "ik is drawn independently from G(:); the probabilitythat j is the chosen variety for i is
Y
k6=jG(u(µj)¡ u(µk) + "ij);
and the aggregate demand for this variety is just
qj(µj; :) = MZ
"
Y
k6=jG(u(µj)¡ u(µk) + "0)dG("0):
A pro…t maximizing choice of eµj would solve the set of …rst-order condi-tions
8m @¼j@µmj
jeµj = 0:
Note that any of these …rst-order conditions have the form:
@¼j@µmj
= pj@qj(µj; :)@µmj
¡ c0(qj(µj; :))@qj(µj; :)@µmj
;
where
@qj(µj; :)@µmj
= MZ
"
um(µj)fX
k6=j
G0(u(µj) ¡ u(µk) + "0)G(u(µj) ¡ u(µk) + "0)
gY
k 6=jG(u(µj)¡u(µk)+"0)dG("0):
29

Thus, since @¼j@µmj
= fpj ¡ c0(qj(µj; :))g@qj(µj ;:)@µmjand p¡ c0 > 0, it must be that
@qj (µj;:)@µmj
= 0 if each µmj is a maximizer. Moreover,
@qj(µj; :)@µmj
= Mum(µj)Z
"
um(µj)fX
k6=j
G0(u(µj) ¡ u(µk) + "0)G(u(µj) ¡ u(µk) + "0)
gY
k6=jG(u(µj)¡u(µk)+"0)dG("0)
where G0(:) > 0; G(:) > 0 so the integral above is strictly positive. @qj(µj;:)@µmj= 0
is only satis…ed when um(µj) = 0 8m and that is only when µj = µ¤j:Proof of Proposition 3. Let j and k; l be varieties of the same security
g, and q an arbitrary variety of another arbitrary security. By Proposition 2
vj(y ¡ p; 1; :) ¸ vk(y ¡ p; 0; :);vj(y ¡ p; 1; :) ¸ vl(y ¡ p; 0; :):
The aggregate demand for the innovator’s variety, given than varieties ofthe same security are priced symmetrically is
qj(p; :) =Z
"G(¢vg + "0)
Y
l 6=k;l2JgG(v(y ¡ p; 1; :) ¡ v(y¡ pl; 0; :) + "0)
¤Y
q6=j;q =2JgG(v(y¡ p; 1; :) ¡ v(y ¡ pq; b; :) + "0)dG("0):
For the imitators’ varieties, the demand is
qk(p; :) =Z
"G(¡¢vg + "0)
Y
l6=k;l2JgG(v(y ¡ p; 0; :)¡ v(y ¡ pl; 0; :) + "0)
¤Y
q6=k;q =2JgG(v(y ¡ p; 0; :)¡ v(y ¡ pq; b; :) + "0)dG("0):
Clearly, since G(:) is a strictly increasing function, by Proposition 2
G(¢vg + "0) ¸ G(¡¢vg + "0);G(v(y ¡ p; 1; :)¡ v(y ¡ pl; 0; :) + "0) ¸
G(v(y ¡ p; 0; :)¡ v(y ¡ pl; 0; :) + "0);and G(v(y ¡ p; 1; :) ¡ v(y¡ pq; b; :) + "0) ¸
G(v(y ¡ p; 0; :)¡ v(y ¡ pq; b; :) + "0):
and thusqj(p; :) ¸qk(p; :):
Note that if ¢vg > 0; then qj(p; :) >qk(p; :).
30

ReferencesAllen, F., and D. Gale (1994): Financial Innovation and Risk Sharing.
MIT Press, Cambridge, MA.
Anderson, S., A. DePalma, and J.-F. Thisse (1989): “Demand forDi¤erentiated Products, Discrete Choice Models, and the CharacteristicsApproach,” Review of Economics Studies, 56(1), 21–35.
Berry, S. (1994): “Estimating Discrete-Choice Models of Product Di¤er-entiation,” RAND Journal of Economics, 25(2), 242–262.
Berry, S., J. Levinsohn, and A. Pakes (1995): “Automobile Prices inMarket Equilibrium,” Econometrica, 63(4), 841–890.
Bhattacharyya, S., and V. Nanda (2000): “Client Discretion, SwitchingCosts, and Financial Innovation,” The Review of Financial Studies, 13(4),1101–1127.
Black, D., and W. Silber (1986): “Pionnering Products: Some EmpiricalEvidence from Futures Markets,” Salomon Brothers Center for the Studyof Financial Institutions Working Paper 395, New York University.
Caplin, A., and B. Nalebuff (1991): “Aggregation and Imperfect Com-petition: On the Existence of Equilibrium,” Econometrica, 59(1), 25–59.
Finnerty, J. (1992): “An Overview of Corporate Securities Innovation,”Journal of Applied Corporate Finance, 4(1), 23–39.
Herrera, H., and E. Schroth (2000): “Pro…table Innovation WithoutPatent Protection: The Case of Credit Derivatives,” Berkeley Center forEntrepreneurial Studies Working Paper 01-02, New York University.
Kanemasu, H., R. Litzenberger, and J. Rolfo (1986): “Financial In-novation in an Incomplete Market: An Empirical Study of Stripped Gov-ernment Securities,” Rodney White Center Working Paper 26-86, Univer-sity of Pennsylvania.
McFadden, D. (1981): “Econometric Models of Probabilistic Choice,” inStructural Analysis of Discrete Data with Econometric Applications, ed.by C. Manski, and D. McFadden, pp. 198–272. MIT Press.
Miller, M. (1986): “Financial Innovation: The Last Twenty Years and theNext,” Journal of Financial and Quantitative Analysis, 21, 459–471.
31

Naslund, B. (1986): “Financial Innovations: A Comparison with Researchand Development in Physical Products,” Salomon Brothers Center for theStudy of Financial Institutions Working Paper 531, New York University.
Nevo, A. (2000): “A Practitioner’s Guide to Estimation of Random-Coe¢cients Logit Models of Demand,” Journal of Economics and Man-agement Strategy, 9(4), 513–548.
Pratt, T. (1991): “How Percs Became the Year’s Hottest Product,” In-vestment Dealers’ Digest, 57(48), 20.
(1995): “SEC Issues No-Action Letters on Streamlined Trust‘MIPS’,” Investment Dealers’ Digest, 13(61).
Ross, S. (1989): “Institutional Markets, Financial Marketing, and FinancialInnovation,” The Journal of Finance, 44(3), 541–556.
Tufano, P. (1989): “First-Mover Advantages in Financial Innovation,”Journal of Financial Economics, 3(2), 350–370.
(1995): “Securities Innovations: A Historical and Functional Per-spective,” Journal of Applied Corporate Finance, 7(4), 90 – 104.
VanHorne, J. (1985): “Of Financial Innovations and Excesses,” The Jour-nal of Finance, 40(3), 621–631.
32

93-IV 94-II 94-IV 95-II 95-IV 96-II 96-IV 97-II 97-IV 98-II 98-IV 99-II 99-IV 00-II00-IV
0
500
1000
1500
2000
2500
3000
3500
4000
4500
5000U
S$ M
illio
ns
Quarters
MIPS
QUIPS
TOPRS
QUICS
Figure 1: Principal Underwritten Using Tax-Deductible Preferred Products
91-II 91-IV 92-II 92-IV 93-II 93-IV 94-II 94-IV 95-II 95-IV 96-II 96-IV 97-II 97-IV 98-II 98-IV 99-II 99-IV 00-II 00-IV
0
500
1000
1500
2000
2500
3000
US
$ M
illio
ns
Quarters
PERCs
STRYPES PEPS
DECS
Figure 2: Principal Underwritten Using Convertible Preferred Products
33

0
2000
4000
6000
8000
10000
0 500 1000 1500 2000 2500
Days
$ M
illion
s
Morgan Stanley
Dean-Witter
Merrill Lynch
Figure 3: Cumulative Principal Underwritten, by banks, using PERCS (1stgeneration)
0
500
1000
1500
2000
2500
3000
0 500 1000 1500 2000 2500
Days
US $
Million
s
Salomon
Lehman
Figure 4: Cumulative Principal Underwritten, by banks, using DECS (3rdgeneration)
34
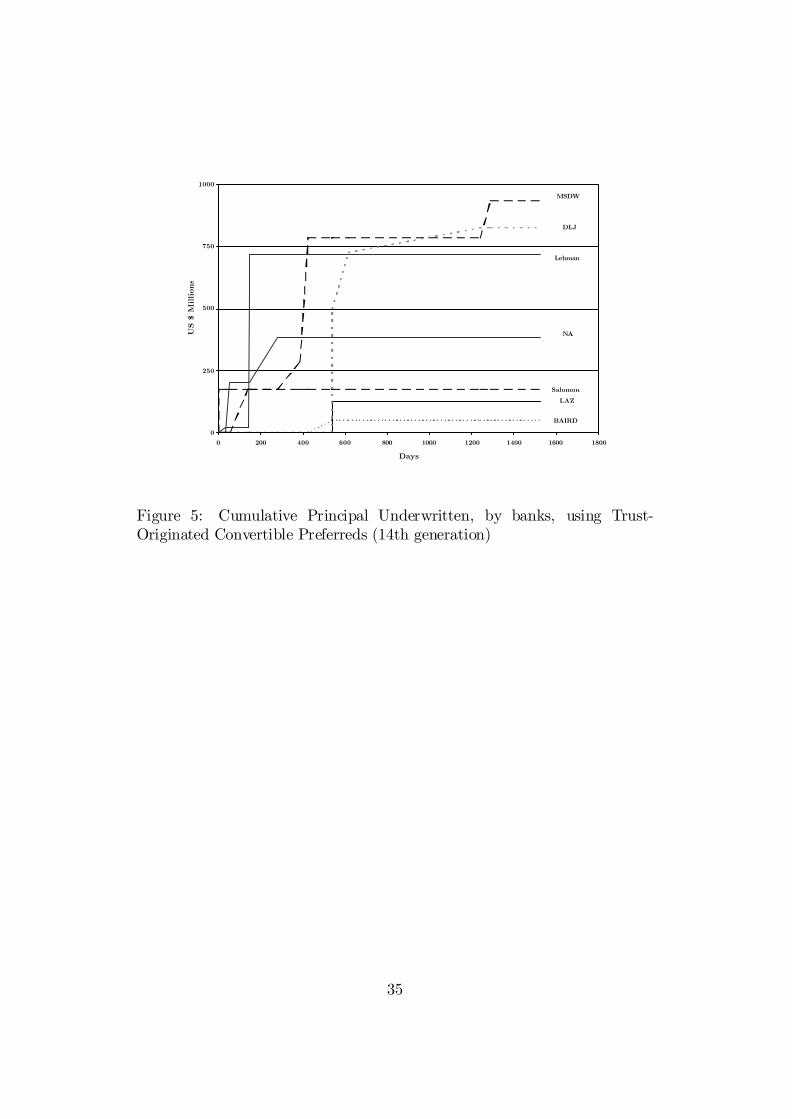
0
250
500
750
1000
0 200 400 600 800 1000 1200 1400 1600 1800
Days
US $
Million
s
Salomon
Lehman
MSDW
DLJ
NA
LAZ
BAIRD
Figure 5: Cumulative Principal Underwritten, by banks, using Trust-Originated Convertible Preferreds (14th generation)
35

0
400
800
1200
1600
2000
0 500 1000 1500 2000 2500 3000 3500
Days
US $
Million
s
Morgan Stanley
Goldman, Sachs
Figure 6: Cumulative Principal Underwritten, by banks, using PERLS (1stgeneration)
0
20
40
60
80
100
120
0 200 400 600 800 1000 1200 1400 1600
Days
US$
Million
s
Merrill Lynch
Goldman, Sachs
Lehman
Figure 7: Cumulative Principal Underwritten, by banks, using SMART Notes(4th generation)
36

i
g
Firm
Security
Banker
Value ofVariety
1 G
1 2 #(G1)... Jj
... ...
ui1 ui2 ui#(G1) uij... uiJ...
Figure 8: The decision tree of an issuer of a corporate security. The issuerchooses a variety, which is given by a pair of a security type and a banker.
37

1
2
3
4
5
6
7
8
9
10
11
0 2 4 6 8 10 12 14 16 18
Years
Adv
anta
ge: s i
nnov
ator /
sim
itat
or
Generation 1
Generation 2Gen.
7
Figure 9: Estimated Advantage to the Innovator over Time and Generations(nested logit demand; t = 8)
1
2
3
4
5
6
7
8
9
10
11
0 2 4 6 8 10 12 14 16 18
Years
Adv
anta
ge: s i
nnov
ator /
sim
itat
or
Generation 1
Generation 2Gen.
7
Figure 10: Estimated Advantage to the Innovator over Time and Generations(nested logit; t = 11)
38

1
3
5
7
9
11
13
0 2 4 6 8 10 12 14 16 18
Years
Adv
anta
ge: s i
nnov
ator /
sim
itat
or
Generation 1
Generation 2Gen.
7
Figure 11: Estimated Advantage of the Innovator over Time and Generations(nested logit; t = 12)
1
2
3
4
5
6
7
8
9
0 2 4 6 8 10 12
Years
Adv
anta
ge: s i
nnov
ator /
sim
itat
or
Generation 1
Generation 2Gen.
7
Figure 12: Estimated Advantage to the Innovator over Time and Generations(nested logit; t = 16)
39

1
2
3
4
5
6
7
8
9
10
11
0 2 4 6 8 10 12 14 16 18
Years
Adv
anta
ge: s i
nnov
ator /
sim
itat
or
Generation 1
Generation 2
Gen.7
Figure 13: Estimated Advantage to the Innovator over Time and Generations(nested logit with issuer heterogeneity; t = 8)
40
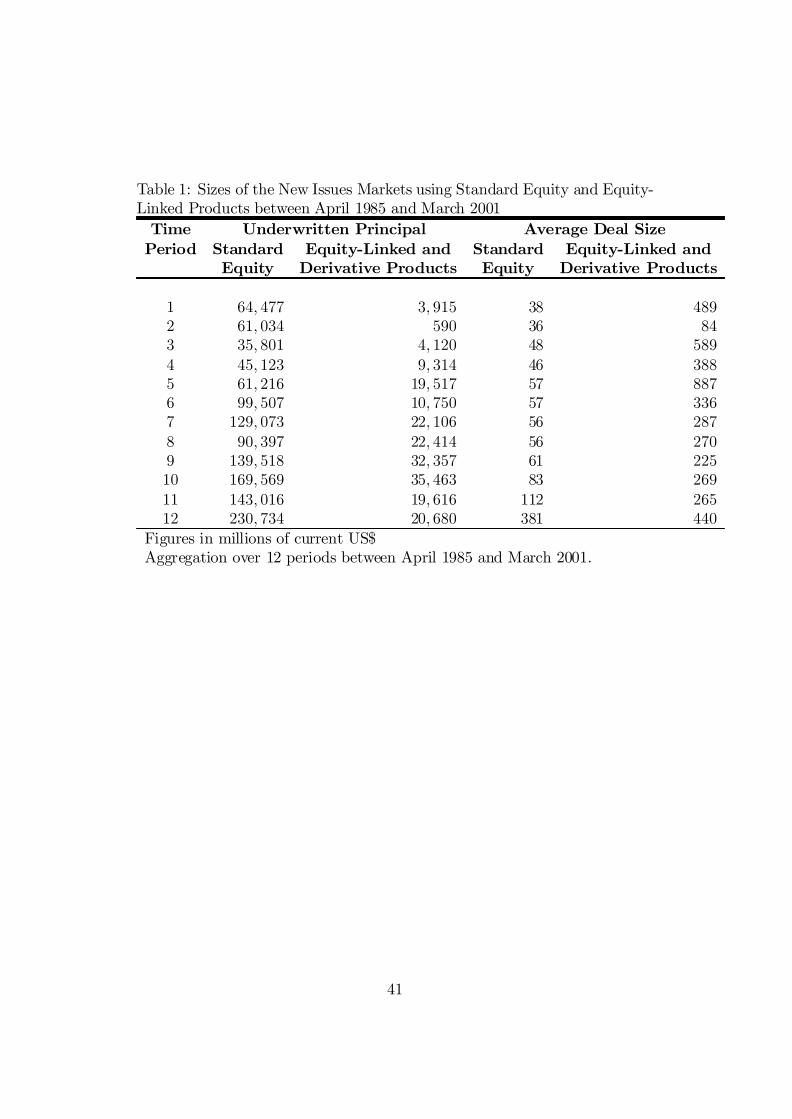
Table 1: Sizes of the New Issues Markets using Standard Equity and Equity-Linked Products between April 1985 and March 2001
Time Underwritten Principal Average Deal SizePeriod Standard Equity-Linked and Standard Equity-Linked and
Equity Derivative Products Equity Derivative Products
1 64; 477 3; 915 38 4892 61; 034 590 36 843 35; 801 4; 120 48 5894 45; 123 9; 314 46 3885 61; 216 19; 517 57 8876 99; 507 10; 750 57 3367 129; 073 22; 106 56 2878 90; 397 22; 414 56 2709 139; 518 32; 357 61 22510 169; 569 35; 463 83 26911 143; 016 19; 616 112 26512 230; 734 20; 680 381 440
Figures in millions of current US$Aggregation over 12 periods between April 1985 and March 2001.
41

Table 2: Classi…cation of Equity Linked and Derivative Corporate Securites
Family Description Securities in the Family
Debt Products RISRS.
Zero Coupon-Convertible Debt LYONS.
Dividend Paying Convertible Debt SIRENS, ICONS.
Convertible Preferred Securities
PERCS, YES Shares, DECS, ACES, X-Caps, PRIDES, PEPS, SAILS, Automatic Common
Exchange Securities, STRYPES, MARCS, PEPS, MEDS, Trust-Originated Convertible Preferreds,
TRACES.
Short Term Tax-Advantage Preferred FRAPS.
Tax-Advantage Preferred or Debt MIPS, EPICS, MIDS, TOPRS, QUIDS, QUIPS, QUICS, Res-Caps, COPRS.
Convertible Tax-AdvantageConvertible MIPS, TECONS, Convertible TOPRS,
QDCs, EPPICS, TRUPS, Convertible QUIPS.
Index-tied Principal PERLS, SIRS, MITTS, SMARTS, Equity Participation Securities, CPNs, SUNS, CUBS.
Stock Appreciation Tied-Principal ELKS, YEELDS, CHIPS, PERQS.
Privatization Exchangeable Debt PENs.
Trust-Originated Pass-Throughs STOPS.
42

Table 3: Innovators’ Market Shares for Imitated Securities
Product Innovator Number of Rivals
Share of Deals (%) Leader
Share of Principal
(%)Leader
RISRS Kemper Securities 1 43 No 50 Yes (Tied)
SIRS Paine Webber 1 67 Yes 90 Yes
DECSSalomon-Smith
Barney 1 94 Yes 79 Yes
Equity Participation Securities Merrill Lynch 1 94 Yes 50 Yes
(Tied)
MIDS Goldman, Sachs 2 29 No (2) 30 No (2)
SMART Notes Merrill Lynch 2 60 Yes 41 Yes
X-CAPs Merrill Lynch 2 67 Yes 92 Yes
ELKS Salomon-Smith Barney 2 82 Yes 90 Yes
PERCS Morgan Stanley 2 82 Yes 88 Yes
QIDS Goldman, Sachs 2 82 Yes 76 Yes
PERLS Morgan Stanley 2 93 Yes 97 Yes
LYONS Merrill Lynch 2 97 Yes 95 Yes
FRAPS Merrill Lynch 3 22 No (2) 23 No (2)
RST-CAPS Lehman Brothers 3 25 Yes (Tied) 22 No (2)
MIPS Goldman, Sachs 3 89 Yes 96 Yes
TOPRS Merrill Lynch 3 95 Yes 92 Yes
TRUPS Salomon Brothers 4 71 Yes 72 Yes
Convertible TOPRS Merrill Lynch 6 47 Yes 33 No (2)
Trust-Originated Convertible Preferreds Robertson 7 6 No (5) 5 No (4)
15 14Total Number of Leads (of 18 cases)
43

Table 4: Ratio of Principal Underwritten by Imitators to InnovatorsImitated Securities (number) Average Ratio
First Generation (7) 0.337All Generations (18) 0.679
Table 5: Paired Di¤erence of Means Tests (Imitator minus Innovator) forSecurity Characteristics
Variable P-value(Mean 6= 0)
O¤er Yield to Maturity 0:052Yield Advantage 0:025Years before Called at Par 0:203Percentage Yield 0:001Years of Call Protection 0:543Initial Call Price 0:001Conversion Shares per Preferred Share 0:943
Table 6: Within-Standard Deviation of Some Security Characteristics forInnovators and Imitators
Variable / Available Observations Imitators Innovators
O¤er Yield to Maturity 0:779 12:949N 46 418Spread over Treasury Bills 25:420 87:528N 10 31Years of Call Protection 4:055 1:772N 31 407Years to Par Call 1:043 2:703N 23 296Yield Advantage 0:840 3:610N 8 167Percentage Yield 0:858 15:569N 35 288
44
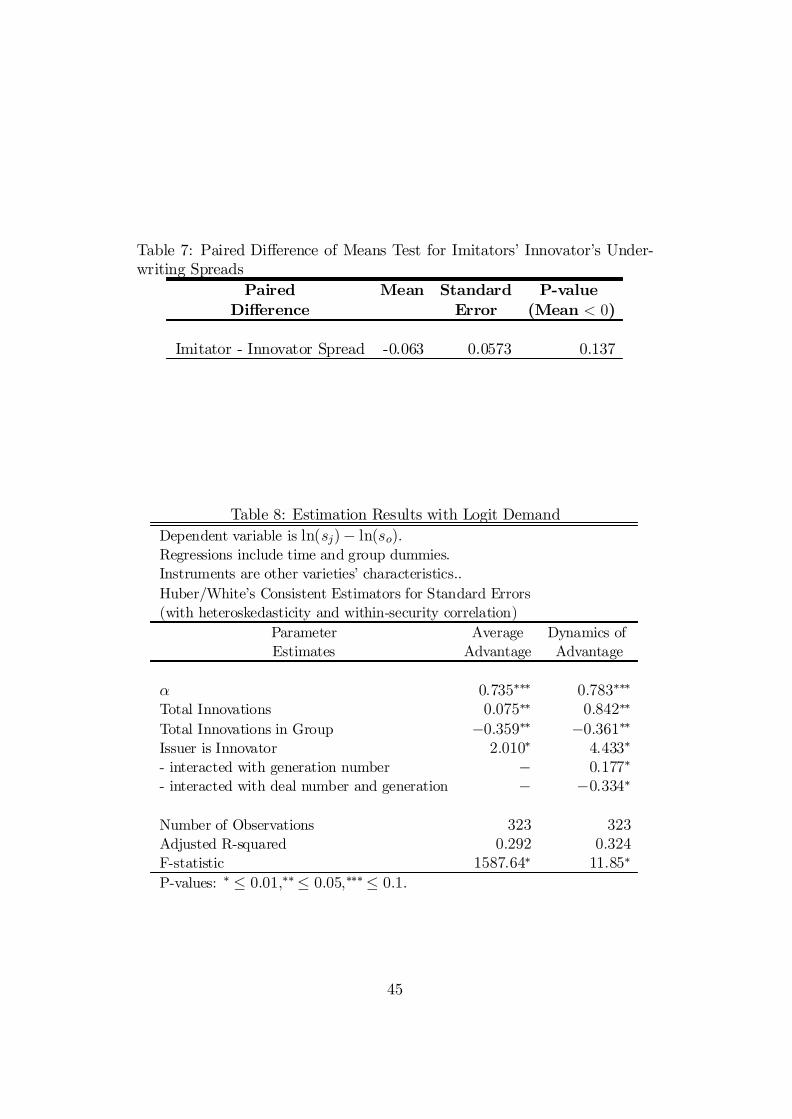
Table 7: Paired Di¤erence of Means Test for Imitators’ Innovator’s Under-writing Spreads
Paired Mean Standard P-valueDi¤erence Error (Mean < 0)
Imitator - Innovator Spread -0.063 0.0573 0.137
Table 8: Estimation Results with Logit DemandDependent variable is ln(sj)¡ ln(so):Regressions include time and group dummies.Instruments are other varieties’ characteristics..Huber/White’s Consistent Estimators for Standard Errors(with heteroskedasticity and within-security correlation)
Parameter Average Dynamics ofEstimates Advantage Advantage
® 0:735¤¤¤ 0:783¤¤¤Total Innovations 0:075¤¤ 0:842¤¤Total Innovations in Group ¡0:359¤¤ ¡0:361¤¤Issuer is Innovator 2:010¤ 4:433¤- interacted with generation number ¡ 0:177¤- interacted with deal number and generation ¡ ¡0:334¤
Number of Observations 323 323Adjusted R-squared 0:292 0:324F-statistic 1587:64¤ 11:85¤P-values: ¤ · 0:01;¤¤· 0:05;¤¤¤· 0:1:
45

Table 9: Own-Price Elasticities in the Logit ModelAverage Dynamics ofAdvantage Advantage
Median 2:018 2:151Mean 1:834 1:955Standard Error 0:797 0:850
Number of Inelastic Demands 50 49
Table 10: IV estimates for the base Nested Logit Demand ModelDependent Variable is ln(sjt)¡ ln(s0t)All regressions include time and group dummies.Instruments are other varieties’ characteristics and other bank’s characteristics.Huber/White’s Consistent Estimators for Standard Errors(with hetersokedasticity and within-security correlation)Parameters t = 16 t = 12 t = 11 t = 8
® 1:598¤¤ 1:025¤¤ 1:025¤¤¤ 1:85¾ 0:631¤ 0:691¤¤ 0:615¤¤¤ 0:729¤
Innovations by Bank 0:250 0:042¤¤¤ 0:045¤¤¤ 0:023Innovator Dummy 2:657¤ 2:824¤ 2:474¤¤¤ 3:068¤¤¤- interacted with:
generation number 0:110¤ 0:160¤ 0:114¤ 0:128¤generation number and time ¡0:192¤¤ ¡0:318¤ ¡0:303¤ ¡0:500¤¤
n 418 323 312 225OIR test 20:399 14:567 28:579 10:801(p-value) (0:007) (0:024) (0:000) (0:303)
Inelastic demands 9 10 10 4Average Elasticity 11:064 8:227 7:503 16:812(standard error) (4:729) (3:596) (2:899) (7:649)
Adjusted R2 0:145 0:290 0:273 0:065F-statistic 330:11¤ 12:30¤ 11:39¤ 248:05¤
P-values: ¤ · 0:01;¤¤· 0:05;¤¤¤· 0:1:
46
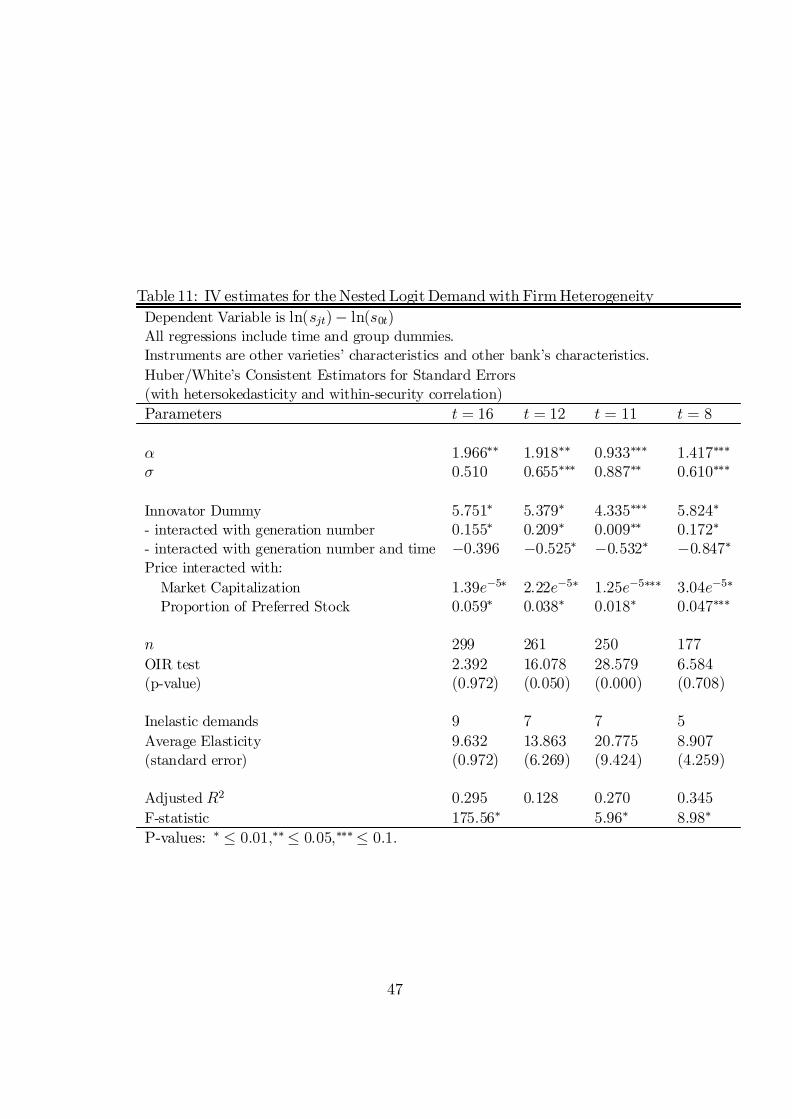
Table 11: IV estimates for the Nested Logit Demand with Firm HeterogeneityDependent Variable is ln(sjt)¡ ln(s0t)All regressions include time and group dummies.Instruments are other varieties’ characteristics and other bank’s characteristics.Huber/White’s Consistent Estimators for Standard Errors(with hetersokedasticity and within-security correlation)Parameters t = 16 t = 12 t = 11 t = 8
® 1:966¤¤ 1:918¤¤ 0:933¤¤¤ 1:417¤¤¤¾ 0:510 0:655¤¤¤ 0:887¤¤ 0:610¤¤¤
Innovator Dummy 5:751¤ 5:379¤ 4:335¤¤¤ 5:824¤- interacted with generation number 0:155¤ 0:209¤ 0:009¤¤ 0:172¤- interacted with generation number and time ¡0:396 ¡0:525¤ ¡0:532¤ ¡0:847¤Price interacted with:
Market Capitalization 1:39e¡5¤ 2:22e¡5¤ 1:25e¡5¤¤¤ 3:04e¡5¤Proportion of Preferred Stock 0:059¤ 0:038¤ 0:018¤ 0:047¤¤¤
n 299 261 250 177OIR test 2:392 16:078 28:579 6:584(p-value) (0:972) (0:050) (0:000) (0:708)
Inelastic demands 9 7 7 5Average Elasticity 9:632 13:863 20:775 8:907(standard error) (0:972) (6:269) (9:424) (4:259)
Adjusted R2 0:295 0:128 0:270 0:345F-statistic 175:56¤ 5:96¤ 8:98¤
P-values: ¤ · 0:01;¤¤· 0:05;¤¤¤· 0:1:
47

COMPLETE LIST OF RESEARCH PAPERS Extra copies of research papers are available to the public upon request. In order to obtain copies of past or future works, please contact our office at the following address: International Center FAME, 40 bd. du Pont d’Arve, Case Postale 3, 1211 Geneva 4. As well, please note that these works are available on our website www.fame.ch, under the heading "Faculty & Research – Research Paper Series" in PDF format for your consultation. We thank you for your continuing support and interest in FAME, and look forward to serving you in the future.
N° 73: On the Consequences of State Dependent Preferences for the Pricing of Financial Assets Jean-Pierre DANTHINE, Université de Lausanne, FAME and CEPR; John B. DONALDSON, Columbia University; Christos GIANNIKOS, Baruch College, City University of New York and Hany GUIRGUIS, Manhattan College; October 2002
N° 72: Are Practitioners Right? On the Relative Importance of Industrial Factors in International Stock Returns Dušan ISAKOV, HEC-University of Geneva and FAME and Frédéric SONNEY, HEC-University of Geneva, University of Neuchâtel and FAME; February 2003
N° 71: The Allocation of Assets Under Higher Moments Eric JONDEAU, Banque de France, DEER and ERUDITE, Université Paris 12 Val-de-Marne and Michael ROCKINGER, HEC Lausanne, CEPR and FAME; December 2002
N° 70: International Evidence on Real Estate as a Portfolio Diversifier Martin HOESLI, HEC-University of Geneva, FAME and University of Aberdeen (Business School); Jon LEKANDER, Aberdeen Property Investors Nordic Region; Witold WITKIEWICZ, Aberdeen Property Investors Nordic Region; February 2003
N° 69: Conditional Dependency of Financial Series: The Copula-GARCH Model Eric JONDEAU, Banque de France, DEER and ERUDITE, Université Paris 12 Val-de-Marne and Michael ROCKINGER, HEC Lausanne, CEPR, and FAME; December 2002
N° 68: The Capital Structure of Swiss Companies: An Empirical Analysis Using Dynamic Panel Data Philippe GAUD, HEC-University of Geneva; Elion JANI, HEC-University of Geneva; Martin HOESLI, HEC-University of Geneva, FAME and University of Aberdeen (Business School) and André BENDER, HEC-University of Geneva and FAME; January 2003
N° 67: Linear-Quadratic Jump-Diffusion Modelling with Application to Stochastic Volatility Peng CHENG, HEC Lausanne and FAME, Université de Lausanne and Olivier SCAILLET, HEC Genève and FAME, Université de Genève; November 2002
N° 66: Optimal Asset Allocation for Pension Funds Under Mortality Risk During the Accumulation and Decumulation Phases Paolo BATTOCCHIO, IRES, Université Catholique de Louvain; Francesco MENONCIN, IRES, Université Catholique de Louvain and Olivier SCAILLET, HEC Genève and FAME, Université de Genève; January 2003
N° 65: Exploring for the Determinants of Credit Risk in Credit Default Swap Transaction Data: Is Fixed-Income Markets’ Information Sufficient to Evaluate Credit Daniel AUNON-NERIN, HEC-University of Lausanne and FAME; Didier COSSIN, HEC-University of Lausanne, FAME and IMD; Tomas HRICKO, HEC-University of Lausanne and FAME and Zhijiang HUANG, HEC-University of Lausanne and FAME; December 2002

N° 64: Dynamic Allocation of Treasury and Corporate Bond Portfolios Roger WALDER, University of Lausanne, International Center FAME and Banque Cantonale Vaudoise; December 2002
N° 63: Understanding the Economic Value of Legal Covenants in Investment Contracts: A Real-Options Approach to Venture Equity Contracts Didier COSSIN, HEC-University of Lausanne, FAME and IMD; Benoît LELEUX, IMD, Entela SALIASI, HEC-University of Lausanne and FAME; October 2002
N° 62: Integrated Market and Credit Risk Management of Fixed Income Portfolios Roger WALDER, University of Lausanne, International Center FAME and Banque Cantonale Vaudoise; November 2002
N° 61: A Framework for Collateral Risk Control Determination Daniel AUNON-NERIN, HEC-University of Lausanne and FAME; Didier COSSIN, HEC-University of Lausanne, FAME and IMD; Fernando GONZÁLEZ, European Central Bank and Zhijiang HUANG, HEC-University of Lausanne and FAME; December 2002
N° 60: Optimal Dynamic Trading Strategies with Risk Limits Domenico CUOCO, The Wharton School, University of Pennsylvania; Hua HE, School of Management, Yale University and Sergei ISSAENKO, The Wharton School, University of Pennsylvania; Winner of the 2002 FAME Research Prize
N° 59: Implicit Forward Rents as Predictors of Future Rents Peter ENGLUND, Stockholm Institute for Financial Research and Stockholm School of Economics; Åke GUNNELIN, Stockholm Institute for Financial Research; Martin HOESLI University of Geneva (HEC and FAME) and University of Aberdeen (Business School) and Bo SÖDERBERG, Royal Institute of Technology; October 2002
N° 58: Do Housing Submarkets Really Matter? Steven C. BOURASSA, School of Urban and Public Affairs, University of Louisville; Martin HOESLI, University of Geneva (HEC and FAME) and University of Aberdeen (Business School) and Vincent S. PENG, AMP Henderson Global Investors; November 2002
N° 57: Nonparametric Estimation of Copulas for Time Series Jean-David FERMANIAN, CDC Ixis Capital Markets and CREST and Olivier SCAILLET, HEC Genève and FAME, Université de Genève; November 2002
N° 56: Interactions Between Market and Credit Risk: Modeling the Joint Dynamics of Default-Free and Defaultable Bond Term Structures Roger WALDER, University of Lausanne, International Center FAME and Banque Cantonale Vaudoise; November 2002
N° 55: Option Pricing With Discrete Rebalancing Jean-Luc PRIGENT, THEMA, Université de Cergy-Pontoise; Olivier RENAULT, Financial Markets Group, London School of Economics and Olivier SCAILLET, HEC Genève and FAME, University of Geneva; July 2002
N° 54: The Determinants of Stock Returns in a Small Open Economy Séverine CAUCHIE, HEC-University of Geneva, Martin HOESLI, University of Geneva (HEC and FAME) and University of Aberdeen (School of Business) and Dušan ISAKOV, HEC-University of Geneva and International Center FAME; September 2002
N° 53: Permanent and Transitory Factors Affecting the Dynamics of the Term Structure of Interest Rates Christophe PÉRIGNON, Anderson School, UCLA and Christophe VILLA, ENSAI, CREST-LSM and CREREG-Axe Finance; June 2002
N° 52: Hedge Fund Diversification: How Much is Enough? François-Serge LHABITANT, Thunderbird University, HEC-University of Lausanne and FAME; Michelle LEARNED, Thunderbird University; July 2002
N° 51: Cannibalization & Incentives in Venture Financing Stefan ARPING, University of Lausanne; May 2002
N° 50: What Factors Determine International Real Estate Security Returns? Foort HAMELINK, Lombard Odier & Cie, Vrije Universiteit and FAME; Martin HOESLI, University of Geneva (HEC and FAME) and University of Aberdeen; July 2002
N° 49: Playing Hardball: Relationship Banking in the Age of Credit Derivatives Stefan ARPING, University of Lausanne; May 2002
N° 48: A Geometric Approach to Multiperiod Mean Variance Optimization of Assets and Liabilities Markus LEIPPOLD, Swiss Banking Institute, University of Zurich; Fabio TROJANI, Institute of Finance, University of Southern Switzerland; Paolo VANINI, Institute of Finance, University of Southern Switzerland; April 2002
N° 47: Why Does Implied Risk Aversion Smile? Alexandre ZIEGLER, University of Lausanne and FAME; May 2002
N° 46: Optimal Investment With Default Risk Yuanfeng HOU, Yale University; Xiangrong JIN, FAME and University of Lausanne; March 2002
N° 45: Market Dynamics Around Public Information Arrivals Angelo RANALDO, UBS Asset Management; February 2002
N° 44: Nonparametric Tests for Positive Quadrant Dependence Michel DENUIT, Université Catholique de Louvain, Olivier SCAILLET, HEC Genève and FAME, University of Geneva; March 2002
N° 43: Valuation of Sovereign Debt with Strategic Defaulting and Rescheduling Michael WESTPHALEN, École des HEC, University of Lausanne and FAME; February 2002
N° 42: Liquidity and Credit Risk Jan ERICSSON, McGill University and Olivier RENAULT, London School of Economics; August 2001
N° 41: Testing for Concordance Ordering Ana C. CEBRIÁN, Universidad de Zaragoza, Michel DENUIT, Université Catholique de Louvain, Olivier SCAILLET, HEC Genève and FAME, University of Geneva; March 2002
N° 40: Immunization of Bond Portfolios: Some New Results Olivier de La GRANDVILLE, University of Geneva; February 2002
N° 39: Weak Convergence of Hedging Strategies of Contingent Claims Jean-Luc PRIGENT, Thema, Université de Cergy-Pontoise; Olivier SCAILLET, HEC Genève and FAME, University of Geneva; January 2002
N° 38: Indirect Estimation of the Parameters of Agent Based Models of Financial Markets Manfred GILLI, University of Geneva; Peter WINKER, International University in Germany; November 2001
N° 37: How To Diversify Internationally? A comparison of conditional and unconditional asset allocation methods. Laurent BARRAS, HEC-University of Geneva, International Center FAME; Dušan ISAKOV, HEC-University of Geneva, International Center FAME; November 2001
N° 36: Coping with Credit Risk Henri LOUBERGÉ, University of Geneva, Harris SCHLESINGER, University of Alabama; October 2001
N° 35: Country, Sector or Style: What matters most when constructing Global Equity Portfolios? An empirical investigation from 1990-2001. Foort HAMELINK, Lombard Odier & Cie and Vrije Universiteit; Hélène HARASTY, Lombard Odier & Cie; Pierre HILLION, Insead (Singapore), Academic Advisor to Lombard Odier & Cie; October 2001
N° 34: Variable Selection for Portfolio Choice Yacine AÏT-SAHALIA, Princeton University & NBER, and Michael W. BRANDT, Wharton School, University of Pennsylvania & NBER; February 2001 (Please note: The complete paper is available from the Journal of Finance 56, 1297-1351.)
N° 33: The Characteristics of Individual Analysts’ Forecast in Europe Guido BOLLIGER, University of Neuchâtel and FAME; July 2001
N° 32: Portfolio Diversification: Alive and Well in Euroland Kpaté ADJAOUTE, HSBC Republic Bank (Suisse), SA and Jean-Pierre DANTHINE, University of Lausanne, CEPR and FAME; July 2001
N° 31: EMU and Portfolio Diversification Opportunities Kpate ADJAOUTÉ, Morgan Stanley Capital International, Geneva and Jean-Pierre DANTHINE, University of Lausanne, CEPR and FAME; April 2000
N° 30: Serial and Parallel Krylov Methods for Implicit Finite Difference Schemes Arising in Multivariate Option Pricing Manfred GILLI, University of Geneva, Evis KËLLEZI, University of Geneva and FAME, Giorgio PAULETTO, University of Geneva; March 2001
N° 29: Liquidation Risk Alexandre ZIEGLER, HEC-University of Lausanne, Darrell DUFFIE, The Graduate School of Business, Stanford University; April 2001
N° 28: Defaultable Security Valuation and Model Risk Aydin AKGUN, University of Lausanne and FAME; March 2001
N° 27: On Swiss Timing and Selectivity: in the Quest of Alpha François-Serge LHABITANT, HEC-University of Lausanne and Thunderbird, The American Graduate School of International Management; March 2001

N° 26: Hedging Housing Risk Peter ENGLUND, Stockholm School of Economics, Min HWANG and John M. QUIGLEY, University of California, Berkeley; December 2000
N° 25: An Incentive Problem in the Dynamic Theory of Banking Ernst-Ludwig VON THADDEN, DEEP, University of Lausanne and CEPR; December 2000
N° 24: Assessing Market Risk for Hedge Funds and Hedge Funds Portfolios François-Serge LHABITANT, Union Bancaire Privée and Thunderbird, the American Graduate School of International Management; March 2001
N° 23: On the Informational Content of Changing Risk for Dynamic Asset Allocation Giovanni BARONE-ADESI, Patrick GAGLIARDINI and Fabio TROJANI, Università della Svizzera Italiana; March 2000
N° 22: The Long-run Performance of Seasoned Equity Offerings with Rights: Evidence From the Swiss Market Michel DUBOIS and Pierre JEANNERET, University of Neuchatel; January 2000
N° 21: Optimal International Diversification: Theory and Practice from a Swiss Investor's Perspective Foort HAMELINK, Tilburg University and Lombard Odier & Cie; December 2000
N° 20: A Heuristic Approach to Portfolio Optimization Evis KËLLEZI; University of Geneva and FAME, Manfred GILLI, University of Geneva; October 2000
N° 19: Banking, Commerce, and Antitrust Stefan Arping; University of Lausanne; August 2000
N° 18: Extreme Value Theory for Tail-Related Risk Measures Evis KËLLEZI; University of Geneva and FAME, Manfred GILLI, University of Geneva; October 2000
N° 17: International CAPM with Regime Switching GARCH Parameters Lorenzo CAPIELLO, The Graduate Institute of International Studies; Tom A. FEARNLEY, The Graduate Institute of International Studies and FAME; July 2000
N° 16: Prospect Theory and Asset Prices Nicholas BARBERIS, University of Chicago; Ming HUANG, Stanford University; Tano SANTOS, University of Chicago; September 2000
N° 15: Evolution of Market Uncertainty around Earnings Announcements Dušan ISAKOV, University of Geneva and FAME; Christophe PÉRIGNON, HEC-University of Geneva and FAME; June 2000
N° 14: Credit Spread Specification and the Pricing of Spread Options Nicolas MOUGEOT, IBFM-University of Lausanne and FAME; May 2000
N° 13: European Financial Markets After EMU: A First Assessment Jean-Pierre DANTHINE, Ernst-Ludwig VON THADDEN, DEEP, Université de Lausanne and CEPR and Francesco GIAVAZZI, Università Bocconi, Milan, and CEPR; March 2000

N° 12: Do fixed income securities also show asymmetric effects in conditional second moments? Lorenzo CAPIELLO, The Graduate Institute of International Studies; January 2000
N° 11: Dynamic Consumption and Portfolio Choice with Stochastic Volatility in Incomplete Markets George CHACKO, Harvard University; Luis VICEIRA, Harvard University; September 1999
N° 10: Assessing Asset Pricing Anomalies Michael J. BRENNAN, University of California, Los Angeles; Yihong XIA, University of Pennsylvania; July 1999
N° 9: Recovery Risk in Stock Returns Aydin AKGUN, University of Lausanne & FAME; Rajna GIBSON, University of Lausanne; July 1999
N° 8: Option pricing and replication with transaction costs and dividends Stylianos PERRAKIS, University of Ottawa; Jean LEFOLL, University of Geneva; July1999
N° 7: Optimal catastrophe insurance with multiple catastrophes Henri LOUBERGÉ, University of Geneva; Harris SCHLESINGER, University of Alabama; September 1999
N° 6: Systematic patterns before and after large price changes: Evidence from high frequency data from the Paris Bourse Foort HAMELINK, Tilburg University; May 1999
N° 5: Who Should Buy Long-Term Bonds? John CAMPBELL, Harvard University; Luis VICEIRA, Harvard Business School; October 1998
N° 4: Capital Asset Pricing Model and Changes in Volatility André Oliveira SANTOS, Graduate Institute of International Studies, Geneva; September 1998
N° 3: Real Options as a Tool in the Decision to Relocate: An Application to the Banking Industry Pascal BOTTERON, HEC-University of Lausanne; January 2000
N° 2: Application of simple technical trading rules to Swiss stock prices: Is it profitable? Dušan ISAKOV, HEC-Université de Genève; Marc HOLLISTEIN, Banque Cantonale de Genève; January 1999
N° 1:
Enhancing portfolio performance using option strategies: why beating the market is easy. François-Serge LHABITANT, HEC-University of Lausanne; December 1998

International Center FAME - Partner Institutions
The University of Geneva The University of Geneva, originally known as the Academy of Geneva, was founded in 1559 by Jean Calvin and Theodore de Beze. In 1873, The Academy of Geneva became the University of Geneva with the creation of a medical school. The Faculty of Economic and Social Sciences was created in 1915. The university is now composed of seven faculties of science; medicine; arts; law; economic and social sciences; psychology; education, and theology. It also includes a school of translation and interpretation; an institute of architecture; seven interdisciplinary centers and six associated institutes.
More than 13’000 students, the majority being foreigners, are enrolled in the various programs from the licence to high-level doctorates. A staff of more than 2’500 persons (professors, lecturers and assistants) is dedicated to the transmission and advancement of scientific knowledge through teaching as well as fundamental and applied research. The University of Geneva has been able to preserve the ancient European tradition of an academic community located in the heart of the city. This favors not only interaction between students, but also their integration in the population and in their participation of the particularly rich artistic and cultural life. http://www.unige.ch The University of Lausanne Founded as an academy in 1537, the University of Lausanne (UNIL) is a modern institution of higher education and advanced research. Together with the neighboring Federal Polytechnic Institute of Lausanne, it comprises vast facilities and extends its influence beyond the city and the canton into regional, national, and international spheres. Lausanne is a comprehensive university composed of seven Schools and Faculties: religious studies; law; arts; social and political sciences; business; science and medicine. With its 9’000 students, it is a medium-sized institution able to foster contact between students and professors as well as to encourage interdisciplinary work. The five humanities faculties and the science faculty are situated on the shores of Lake Leman in the Dorigny plains, a magnificent area of forest and fields that may have inspired the landscape depicted in Brueghel the Elder's masterpiece, the Harvesters. The institutes and various centers of the School of Medicine are grouped around the hospitals in the center of Lausanne. The Institute of Biochemistry is located in Epalinges, in the northern hills overlooking the city. http://www.unil.ch The Graduate Institute of International Studies The Graduate Institute of International Studies is a teaching and research institution devoted to the study of international relations at the graduate level. It was founded in 1927 by Professor William Rappard to contribute through scholarships to the experience of international co-operation which the establishment of the League of Nations in Geneva represented at that time. The Institute is a self-governing foundation closely connected with, but independent of, the University of Geneva. The Institute attempts to be both international and pluridisciplinary. The subjects in its curriculum, the composition of its teaching staff and the diversity of origin of its student body, confer upon it its international character. Professors teaching at the Institute come from all regions of the world, and the approximately 650 students arrive from some 60 different countries. Its international character is further emphasized by the use of both English and French as working languages. Its pluralistic approach - which draws upon the methods of economics, history, law, and political science -reflects its aim to provide a broad approach and in-depth understanding of international relations in general. http://heiwww.unige.ch

Prospect Theoryand Asset PricesNicholas BARBERISUniversity of Chicago
Ming HUANGStanford University
Tano SANTOSUniversity of Chicago
2000 FAME Research PrizeResearch Paper N° 16
FAME - International Center for Financial Asset Management and Engineering
THE GRADUATE INSTITUTE OFINTERNATIONAL STUDIES
40, Bd. du Pont d’ArvePO Box, 1211 Geneva 4
Switzerland Tel (++4122) 312 09 61 Fax (++4122) 312 10 26
http: //www.fame.ch E-mail: [email protected]