Embed Size (px)
Citation preview
Asiamoney’s
2013
Best Domestic
Equity House
Market update
06 June 2014
Disclosure: Bahana Securities does and seeks to do business with companies covered in its research reports. Investors should consider this report as only a single factor
in making their investment decision.
Please see the important disclaimer information on the back of this report
*Based on consensus’ recent changes ↑ (up), ↓ (down), ↔ (unchanged)
THIS RESEARCH REPORT IS NOT TO BE DISTRIBUTED TO ANY INVESTORS OR OTHER PERSONS IN THE UNITED STATES. IF ANY INVESTOR OR OTHER PERSON IN THE UNITED STATES
MISTAKENLY RECEIVES OR OTHERWISE COMES INTO POSSESSION OF THIS RESEARCH REPORT, NONE OF DAIWA SECURITIES CO. LTD., PT. BAHANA SECURIITES OR ANY OF THEIR
AFFIILIATES SHALL HAVE ANY RESPONSIBILITY FOR THE CONTENTS HEREOF OR FOR ANY SUBSEQUENT TRANSACTIONS EXECUTED IN RELIANCE HEREON.
Currency sensitivity analysis
Harry Su E-mail: [email protected] Phone: +6221 250 5735
IDR’s 1M performance: Worst in the region on political concerns
Due to concerns about the upcoming presidential election and the current
account deficit, the IDR was the region’s worst-performing currency in the
past month (exhibit 1), down nearly 3% against the US dollar. This has led
to a widening decoupling between the IDR and the IDX (exhibit 2), despite
continued foreign inflows into the local equity market (exhibit 5)
amounting to IDR40tn, equal to 90% of the total outflows in 2013. With 4
June marking the start of what is likely to be the most closely contested
presidential election post the Soeharto era, we expect increased IDR
volatility. Hence, we have conducted a currency sensitivity analysis to help
investors better manage their stock portfolios.
1% IDR depreciation vs USD = 1.3ppt decline in overall EPS
To help investors gauge the effects on our stocks of a weaker IDR, we
have conducted a sensitivity analysis on all 80 non-financial companies
under our coverage (exhibits 3-4). For the market as a whole, net gearing
reaches 20.2% with our analysis indicating that, for every 1% IDR decline
to our average base-case assumption of IDR11,735 (year-end assumption:
IDR11,300), the overall EPS of the non-financial stocks we cover would
decline by 1.3ppt, reflecting 14.4% y-y growth from 15.7% currently, all
things being equal.
Winners: Dollar earners
Dollar earners generally benefit in an IDR-depreciating environment. Based
on our analysis, metal, plantation and coal-related stocks should benefit
the most (exhibit 3). The top 5 beneficiaries within our coverage are Aneka
Tambang (ANTM IJ-REDUCE-IDR1,180-TP:IDR920), Salim Ivomas (SIMP
IJ-BUY-IDR1,025-TP:IDR1,100), Sampoerna Agro (SGRO IJ-BUY-
IDR2,335), BW Plantations (BWPT IJ-BUY-IDR1,295-TP:IDR1,550) and
Timah (TINS IJ-BUY-IDR1,390). At this stage, apart from positive
sentiment on the strong dollar, we continue to like plantations as we
expect the El Nino weather pattern to materialize next month, resulting in
CPO supply disruption. Our top CPO pick is Astra Agro (AALI IJ-BUY-
IDR26,850-TP:IDR35,000) due to its attractive maturity profile (around 14
years) and additional revenue stemming from CPO refinery expansion. On
metals, our top picks are Vale Indonesia (INCO IJ-BUY-IDR3,905-
TP:IDR4,700), on a higher average nickel price, and TINS, on the one-door
tin export policy (through ICDX) lowering cash cost. However, we do not
like ANTM due to its lack of operating efficiencies and the negative impact
of the government’s ore ban.
Safe havens: 10 US dollar accounting plays and selective sectors
Amid FX movements, we believe investors can find safety in the following
10 stocks due to their US dollar accounting (bottom of exhibit 3): Adaro
Energy (ADRO IJ-HOLD-IDR1,320-TP:IDR1,200), Austindo Nusantara Jaya
(ANJT IJ-HOLD-IDR1,500-TP:IDR1,620), Bumi Resources (BUMI IJ-
Exhibit 1. Currency performance Asia exc. Japan
currencies 1M Ytd Other currencies 1M Ytd
PHP (Philippines) 1.4 1.6 RUB (Russia) 2.0 (5.5)
INR (India) 1.3 4.0 MXN (Mexico) 1.2 1.3
MYR (Malaysia) 1.0 1.6 AUD (Australia) (0.2) 4.4
TWD (Taiwan) 0.5 (0.7) CAD (Canada) (0.2) (2.8)
KRW (Korea) 0.5 2.8 TRY (Turkey) (0.4) 2.3
HKD (Hong Kong) (0.0) 0.0 JPY (Japan) (0.7) 2.8
VND (Vietnam) (0.3) (0.4) GBP (UK) (1.0) 1.5
CNY (China) (0.4) (3.2) BRL (Brazil) (1.5) 4.2
SGD (Singapore) (0.5) 0.8 ARS (Argentina) (1.6) (24.7)
THB (Thailand) (0.6) 0.4 EUR (EU) (1.9) (0.6)
IDR (Indonesia) (2.8) 2.7 NZD (New Zealand) (2.9) 3.3
Source: Bloomberg as of 6 June 2014
Exhibit 2. Decoupling between JCI and IDR
11,200
11,400
11,600
11,800
12,0004,750
4,800
4,850
4,900
4,950
5,000
5,050
2-May-14 9-May-14 16-May-14 23-May-14 30-May-14
(IDR)(JCI)
JCI index USDIDR
Decoupling between
equity and currency
markets
Source: Bloomberg as of 6 June 2014
Exhibit 3. Winners & safe havens USD 1Q14 Net Sensitivity
Sales Costs Cash Debt
gearing to net profit
Ticker on 1% IDR
(%) (USDm) (%)
Depreciation
(%)
ANTM 78 66 114 123 25.1 7.7
SIMP 100 50 68 119 39.7 6.3
SGRO 100 70 2 0 44.8 5.2
BWPT 100 32 0 1 6.7 3.0
TINS 93 76 26 34 15.1 3.0
LSIP 100 51 61 2 nc 2.9
UNTR 100 82 482 194 nc 2.7
CASS 45 15 0 0 11.4 2.5
AALI 100 48 26 222 21.5 2.3
SSIA 51 20 77 10 nc 1.1
ASII 40 30 565 1948 28.8 0.7
BEST 95 15 14 31 0.6 0.7
PTBA 49 63 54 5 nc 0.5
SCMA 0 5 89 0 nc 0.5
BSDE 17 25 50 0 0.0 0.4
CTRP 10 25 19 0 34.5 0.4
LPCK 41 10 0 0 nc 0.4
MYOR 42 60 94 0 11.8 0.4
*ADRO 100 100 799 2169 33.3 n/a
*ANJT 100 60 5 2 nc n/a
*BUMI 100 100 22 4410 n/a** n/a
*HRUM 100 100 136 0 nc n/a
*INCO 100 70 312 201 nc n/a
*ITMG 100 100 354 0 nc n/a
*KRAS 80 75 194 1045 88.0 n/a
*MEDC 100 100 365 1059 113.5 n/a
*PGAS 100 100 804 1404 nc n/a
*WINS 100 100 164 173 44.4 n/a
Source: Bahana estimates, Companies
*USD reporting; **negative equity

06 June 2014
PT Bahana Securities – Equity Research – Market Update 2
Asiamoney’s
2013
Best Domestic
Equity House
REDUCE-IDR194-TP:180), Harum Energy (HRUM IJ-HOLD-IDR2,490-
TP:IDR2,300), Vale Indonesia (INCO), Indo Tambangraya Megah (ITMG IJ-
REDUCE-IDR29,600-TP:IDR23,450), Krakatau Steel (KRAS IJ-REDUCE-
IDR471), Medco Energy (MEDC IJ-REDUCE-IDR3,250-TP:IDR2,200),
Perusahaan Gas Negara (PGAS IJ-BUY-IDR5,400) and Wintermar Offshore
(WINS IJ-BUY-IDR1,150-TP:IDR1,350). Apart from these, we advise
investors to seek shelter in selective consumer, telco and toll-road plays
like Gudang Garam (GGRM IJ-BUY-IDR54,250-TP:IDR62,750), Telkom
(TLKM IJ-BUY-IDR2,530-TP:IDR2,900) and Jasa Marga (JSMR IJ-BUY-
IDR5,975-TP:IDR6,450), which should emerge relatively unscathed amid
IDR fluctuations.
Losers: Stocks with high US dollar borrowings
Our top losers in a weaker IDR setting (bottom of exhibit 4) are mostly
stocks with high US dollar loans, with the exception of Supra Boga Lestari
(RANC IJ-REDUCE-IDR615-TP:IDR500), which is hurt due to its dollar cost
and low margin business. The other losers would be: XL Axiata (EXCL IJ-
HOLD-IDR5,250-TP:IDR5,500), Indosat (ISAT IJ-BUY-IDR3,985), Japfa
Comfeed (JPFA IJ-BUY-IDR1,320-TP:IDR1,710) and AKR Corporindo (AKRA
IJ-REDUCE-IDR4,295-TP:IDR4,150).
Exhibit 4. Losers USD 1Q14 Net Sensitivity
Sales Costs Cash Debt
gearing to net profit
Ticker on 1%
(%) (USDm) (%)
Depreciation
(%)
JSMR 0 8 1 0 97.0 (0.0)
CMNP 0 12 0 0 nc (0.1)
MNCN 0 5 5 19 nc (0.1)
PWON 35 25 19 58 2.7 (0.1)
SMRA 24 25 3 2 7.1 (0.1)
ERAA 0 0 2 10 55.2 (0.2)
SIDO 5 17 1 0 nc (0.2)
APLN 18 30 51 0 40.5 (0.3)
ASSA 0 7 0 0 146.9 (0.3)
CTRA 5 27 24 0 nc (0.5)
LPKR 18 20 32 659 39.1 (0.5)
GGRM 0 10 20 0 35.0 (0.6)
TAXI 0 12 0 0 101.6 (0.7)
SMGR 2 40 13 19 nc (0.8)
TLKM 0 33 410 254 nc (0.9)
INTP 1 77 226 0 nc (0.9)
WIKA 25 40 28 34 21.0 (1.0)
SMBR 0 55 0 0 nc (1.1)
ADHI 20 35 20 0 57.0 (1.1)
TELE 0 5 0 0 80.2 (1.2)
LPPF 0 100 0 0 43.9 (1.3)
UNVR 4 80 18 0 nc (1.5)
WTON 5 25 2 0 30.0 (1.6)
PTPP 20 35 27 0 70.0 (1.7)
KIJA 72 8 15 216 48.2 (1.9)
RALS 0 30 18 0 nc (1.9)
WSKT 20 35 4 0 42.0 (2.0)
KLBF 5 75 36 10 nc (2.0)
TOTL 0 40 2 0 nc (2.2)
MPPA 0 10 1 0 nc (2.2)
INDF 25 55 405 730 26.1 (2.7)
ACES 0 80 0 0 nc (2.8)
MLPL 0 10 101 238 nc (2.8)
ROTI 0 75 0 0 15.5 (3.0)
ASRI 5 25 112 514 75.5 (3.1)
TSPC 5 75 6 2 nc (3.2)
SMCB 0 58 9 159 37.3 (3.4)
TOWR 0 70 87 559 47.0 (3.6)
SRIL 42 95 6 90 100.2 (3.8)
HERO 0 20 1 0 15.6 (4.5)
ICBP 9 80 92 65 nc (4.6)
GIAA 45 40 375 898 94.9 (4.8)
IMAS 10 10 19 301 88.8 (4.8)
GJTL 50 85 62 494 76.6 (4.9)
CPIN 0 89 16 131 20.1 (5.1)
MAIN 0 85 4 45 113.5 (6.9)
MAPI 2 80 1 0 118.0 (9.2)
AKRA 90 85 36 313 75.4 (12.9)
JPFA 0 93 106 256 102.7 (12.9)
ISAT 0 22 19 316 113.6 (14.0)
RANC 0 50 0 0 nc (17.0)
EXCL 0 10 28 935 139.9 (19.4)
JCI 7,358 20,478 20.2 (1.3)
Source: Bahana estimates, Companies
*USD reporting
Exhibit 5. Foreign equity capital flows in JCI
25,665
15,881
19,487
(24,741)
2,330
7,817
13,256
7,273 8,089
1,172
(30,000)
(20,000)
(10,000)
0
10,000
20,000
30,000
2011 2012 4M13 2013 Jan-14 Feb-14 Mar-14 Apr-14 May-14 Jun-14
(IDRb)
IDR44tnnet outflow
Source: Bloomberg as of 6 June 2014

06 June 2014
PT Bahana Securities – Equity Research – Market Update 3
Asiamoney’s
2013
Best Domestic
Equity House
Exhibit 6. Aviation Service sector USD 1Q14 Net % sensitivity gearing to net profit Ticker Sales Costs Cash Debt on 1% (%) (USDm) (%) depreciation
CASS 45 15 0 0 11.4 2.5 GIAA 45 40 375 898 94.9 (4.8)
Exhibit 7. Automotive sector USD 1Q14 Net % sensitivity gearing to net profit Ticker Sales Costs Cash Debt on 1% (%) (USDm) (%) depreciation
ASII 40 30 565 1948 28.8 0.7 IMAS 10 10 19 301 88.8 (4.8) GJTL 50 85 62 494 76.6 (4.9)
Exhibit 8. Cement sector USD 1Q14 Net % sensitivity gearing to net profit Ticker Sales Costs Cash Debt on 1% (%) (USDm) (%) depreciation
SMGR 2 40 13 19 nc (0.8) INTP 1 77 226 0 nc (0.9) SMBR 0 55 0 0 nc (1.1) SMCB 0 58 9 159 37.3 (3.4)
Exhibit 9. Coal sector USD 1Q14 Net % sensitivity gearing to net profit Ticker Sales Costs Cash Debt on 1% (%) (USDm) (%) depreciation
UNTR 100 82 482 194 nc 2.7 PTBA 49 63 54 5 nc 0.5 ADRO 100 100 799 2169 33.3 -* ITMG 100 100 354 0 nc -* HRUM 100 100 136 0 nc -*
Exhibit 10. Construction & toll road sector USD 1Q14 Net % sensitivity gearing to net profit Ticker Sales Costs Cash Debt on 1% (%) (USDm) (%) depreciation
JSMR 0 8 1 0 97.0 (0.0) CMNP 0 12 0 0 nc (0.1) WIKA 25 40 28 34 21.0 (1.0) ADHI 20 35 20 0 5.7 (1.1) WTON 5 25 2 0 30.0 (1.6) PTPP 20 35 27 0 70.0 (1.7) WSKT 20 35 4 0 42.0 (2.0) TOTL 0 40 2 0 nc (2.2)
Exhibit 11. Consumer discretionary sector USD 1Q14 Net % sensitivity gearing to net profit Ticker Sales Costs Cash Debt on 1% (%) (USDm) (%) depreciation
SCMA 0 5 89 0 nc 0.5 MNCN 0 5 5 19 nc (0.1) LPPF 0 50 0 0 43.9 (0.6) RALS 0 30 18 0 nc (1.9) MPPA 0 10 1 0 nc (2.2) ACES 0 80 0 0 nc (2.8) MLPL 0 10 101 238 nc (2.8) SRIL 42 95 6 90 100.2 (3.8) HERO 0 20 1 0 15.6 (4.5) MAPI 2 80 1 0 118.0 (9.2) RANC 0 50 0 0 nc (17.0)
Exhibit 12. Consumer staples sector USD 1Q14 Net % sensitivity gearing to net profit Ticker Sales Costs Cash Debt on 1% (%) (USDm) (%) depreciation
MYOR 42 60 94 0 11.8 0.4 SIDO 5 17 1 0 nc (0.2) GGRM 0 10 20 0 35.0 (0.6) UNVR 4 80 18 0 nc (1.5) KLBF 5 75 36 10 nc (2.0) INDF 25 55 405 730 26.1 (2.7) ROTI 0 75 0 0 15.5 (3.0) TSPC 5 75 6 2 nc (3.2) ICBP 9 80 92 65 nc (4.6)
Exhibit 13. Industrial estate sector USD 1Q14 Net % sensitivity gearing to net profit Ticker Sales Costs Cash Debt on 1% (%) (USDm) (%) depreciation
SSIA 51 20 77 10 nc 1.1 BEST 95 15 14 31 0.6 0.7 LPCK 41 10 0 0 nc 0.4 KIJA 72 8 15 216 48.2 (1.9)
Exhibit 14. Metal mining sector USD 1Q14 Net % sensitivity gearing to net profit Ticker Sales Costs Cash Debt on 1% (%) (USDm) (%) depreciation
ANTM 78 66 114 123 25.1 7.7 TINS
UM
93 76 26 34 15.1 3.0 INCO 100 70 312 201 nc -*
Exhibit 15. Oil & gas sector USD 1Q14 Net % sensitivity gearing to net profit Ticker Sales Costs Cash Debt on 1% (%) (USDm) (%) depreciation
AKRA 89 85 36 313 75.4 (12.9) PGAS 100 100 804 1404 nc -* MEDC 100 100 365 1059 113.5 -* WINS 100 100 164 173 44.4 -*
Exhibit 16. Plantations sector USD 1Q14 Net % sensitivity gearing to net profit Ticker Sales Costs Cash Debt on 1% (%) (USDm) (%) depreciation
SIMP 100 50 68 119 39.7 6.3 SGRO 100 70 2 0 44.8 5.2 LSIP 100 51 61 2 nc 2.9 AALI 100 48 26 222 21.5 2.3 ANJT 100 60 5 2 nc -* BWPT 100 32 0 1 6.7 -*
Exhibit 17. Poultry sector USD 1Q14 Net % sensitivity gearing to net profit Ticker Sales Costs Cash Debt on 1% (%) (USDm) (%) depreciation
CPIN 0 89 16 131 20.1 (5.1) MAIN 0 85 4 45 113.5 (6.9) JPFA 0 93 106 256 102.7 (12.9)
Exhibit 18. Property sector USD 1Q14 Net % sensitivity gearing to net profit Ticker Sales Costs Cash Debt on 1% (%) (USDm) (%) depreciation
CTRP 10 25 19 0 34.5 0.4 BSDE 17 25 50 0 0.0 0.4 PWON 35 25 19 58 2.7 (0.1) SMRA 24 25 3 2 7.1 (0.1) APLN 18 30 51 0 40.5 (0.3) CTRA 5 27 24 0 nc (0.5) LPKR 18 20 32 659 39.1 (0.5) ASRI 5 25 112 514 75.5 (3.1)
Exhibit 19. Steel sector USD 1Q14 Net % sensitivity gearing to net profit Ticker Sales Costs Cash Debt on 1% (%) (USDm) (%) depreciation
KRAS
80 75 194 1045 88.0 -*
Exhibit 20. Telco sector USD 1Q14 Net % sensitivity gearing to net profit Ticker Sales Costs Cash Debt on 1% (%) (USDm) (%) depreciation
ERAA 0 0 2 10 55.2 (0.2) TLKM 0 33 410 254 nc (0.9) TELE 0 5 0 0 80.2 (1.2) TOWR 0 70 87 559 47.0 (3.6) ISAT 0 22 19 316 113.6 (14.0) EXCL 0 10 28 935 139.9 (19.4)
Exhibit 21. Transportation sector USD 1Q14 Net % sensitivity gearing to net profit Ticker Sales Costs Cash Debt on 1% (%) (USDm) (%) depreciation
ASSA 0 7 0 0 146.9 (0.3) TAXI 0 12 0 0 101.6 (0.7)
*USD reporting

06 June 2014
PT Bahana Securities – Equity Research – Market Update 4
Asiamoney’s
2013
Best Domestic
Equity House
Exhibit 22. Coal sector
7.4
11.8
(1.1)
(7.8)
4.4
22.5
(19.7)
(25)
(15)
(5)
5
15
25
(25)
(15)
(5)
5
15
25
1M 3M ytd 6M 9M 12M 2013
(%) (%)
Coal sector relative to JCI
Source: Bloomberg
Exhibit 23. Telco sector
4.7 5.2
2.3
7.4 7.4
15.9
13.0
0
5
10
15
20
0
5
10
15
20
1M 3M ytd 6M 9M 12M 2013
(%) (%)
Telco sector relative to JCI
Source: Bloomberg
Exhibit 24. Cement sector
3.8
(1.6) (2.2)
4.3
(3.7) (4.7)
20.4
(10)
(5)
0
5
10
15
20
25
(10)
(5)
0
5
10
15
20
25
1M 3M ytd 6M 9M 12M 2013
(%) (%)
Cement sector relative to JCI
Source: Bloomberg
Helped by
surprisingly
strong
improvement in
1Q14 results and
IDR depreciation
Supported by the
sector’s
defensive nature
as well as TLKM’s
and EXCL’s
additional MSCI
weightings
Possible recent
benefit from
rotational play
into the sector

06 June 2014
PT Bahana Securities – Equity Research – Market Update 5
Asiamoney’s
2013
Best Domestic
Equity House
Exhibit 25. Property sector
1.6
(1.7)
16.1
9.7
(19.8)(24.3)
(1.2)
(25)
(16)
(7)
2
11
20
(25)
(16)
(7)
2
11
20
1M 3M ytd 6M 9M 12M 2013
(%) (%)
Property/ industrial estates sector relative to JCI
Source: Bloomberg
Exhibit 26. Metals sector
0.6
27.5
21.3 18.4
8.1
47.7
7.1
0
10
20
30
40
50
0
10
20
30
40
50
1M 3M ytd 6M 9M 12M 2013
(%) (%)
Metals sector relative to JCI
Source: Bloomberg
Exhibit 27. Oil-related sector
0.5
2.8
6.5
(5.3)
(3.0)
2.5 2.5
(6)
(4)
(2)
0
2
4
6
8
(6)
(4)
(2)
0
2
4
6
8
1M 3M ytd 6M 9M 12M 2013
(%) (%)
Oil-related sector relative to JCI
Source: Bloomberg
Continued
unexciting recent
performance
Mostly attributed
to INCO’s strong
performance on
rising nickel
prices
PGAS’s defensive
nature and weak
IDR have helped
the sector’s
performance
06 June 2014
PT Bahana Securities – Equity Research – Market Update 6
Asiamoney’s
2013
Best Domestic
Equity House
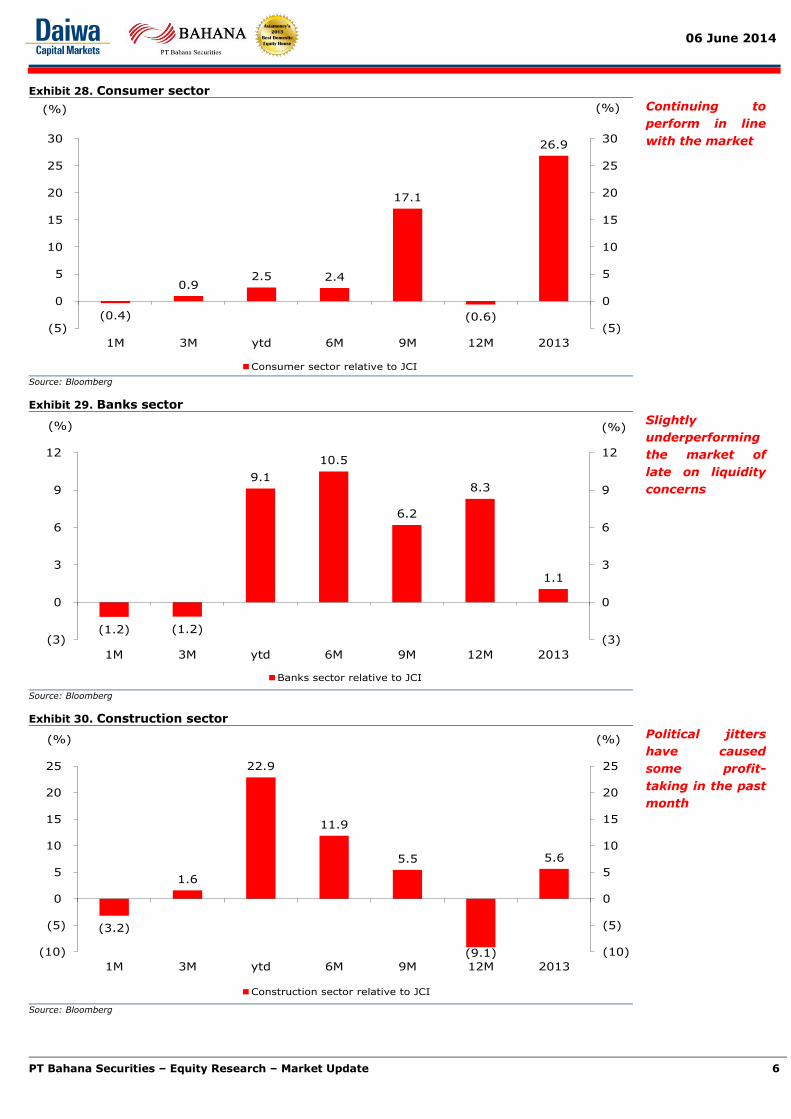
Exhibit 28. Consumer sector
(0.4)
0.9 2.5 2.4
17.1
(0.6)
26.9
(5)
0
5
10
15
20
25
30
(5)
0
5
10
15
20
25
30
1M 3M ytd 6M 9M 12M 2013
(%) (%)
Consumer sector relative to JCI
Source: Bloomberg
Exhibit 29. Banks sector
(1.2) (1.2)
9.1
10.5
6.2
8.3
1.1
(3)
0
3
6
9
12
(3)
0
3
6
9
12
1M 3M ytd 6M 9M 12M 2013
(%) (%)
Banks sector relative to JCI
Source: Bloomberg
Exhibit 30. Construction sector
(3.2)
1.6
22.9
11.9
5.5
(9.1)
5.6
(10)
(5)
0
5
10
15
20
25
(10)
(5)
0
5
10
15
20
25
1M 3M ytd 6M 9M 12M 2013
(%) (%)
Construction sector relative to JCI
Source: Bloomberg
Continuing to
perform in line
with the market
Slightly
underperforming
the market of
late on liquidity
concerns
Political jitters
have caused
some profit-
taking in the past
month

06 June 2014
PT Bahana Securities – Equity Research – Market Update 7
Asiamoney’s
2013
Best Domestic
Equity House
Exhibit 31. Poultry sector
(4.4)
(15.4)
(4.1) (4.6)
(10.0)
(23.5)
(2.8)
(25)
(20)
(15)
(10)
(5)
0
(25)
(20)
(15)
(10)
(5)
0
1M 3M ytd 6M 9M 12M 2013
(%) (%)
Poultry sector relative to JCI
Source: Bloomberg
Exhibit 32. Automotive sector
(4.6)(3.7)
(9.9)
(2.1)
7.8
1.3
(9.7)
(15)
(10)
(5)
0
5
10
(15)
(10)
(5)
0
5
10
1M 3M ytd 6M 9M 12M 2013
(%) (%)
Automotive sector relative to JCI
Source: Bloomberg
Exhibit 33. Plantation sector
(6.3)(4.4)
(2.7)
(7.2)
22.3
29.1
5.5
(10)
(5)
0
5
10
15
20
25
30
(10)
(5)
0
5
10
15
20
25
30
1M 3M ytd 6M 9M 12M 2013
(%) (%)
Plantations sector relative to JCI
Source: Bloomberg
Hurt by DOC
price-capping
and weaker IDR
due to raw-
material imports
Intense
competition is
compressing
margins,
resulting in
market under-
performance
Weak Malaysia
export data has
undermined
recent share-
price
performance

06 June 2014
PT Bahana Securities – Equity Research – Market Update 8
Asiamoney’s
2013
Best Domestic
Equity House
Ticker Rating Price TP Shares Free float Mkt cap 3M avg to
(IDR) (IDR) (m) (%) (IDRb) (IDRb) 2013 2014 2013 2014 2013 2014 2013 2014 2013 2014 2013 2014 2013 2014 2013 2014 2013 2014 2013 2014 2013 2014 2013 2014
AVIATION N 13,309 2 46,544 49,991 403 2,444 244 1,053 (71.9) 214.3 66.2 12.4 8.6 4.3 1.7 1.5 0.3 0.4 40.1 33.4 7.1 11.7 2.3 4.4 13.3 6.1
GIAA IJ* BUY 433 615 25,869 39.5 11,253 2 45,225 48,444 77 2,051 134 916 (87.7) 526.6 74.8 11.9 9.1 4.3 0.8 0.8 0.0 0.0 47.4 39.5 1.0 6.6 0.4 2.7 9.4 0.8
CASS IJ BUY 985 1,170 2,087 36.6 2,056 0 1,319 1,547 326 393 110 137 25.3 25.3 18.7 15.0 5.4 4.3 6.8 5.3 1.9 2.3 nc nc 40.4 39.6 12.8 13.9 34.5 34.9
AUTOMOTIVE N 309,107 369 227,122 254,122 20,137 22,496 20,188 23,832 (2.1) 16.3 15.6 13.2 14.3 12.3 3.3 2.9 2.9 3.3 60.9 50.7 23.9 23.9 9.3 9.6 18.2 14.9
ASII IJ HOLD 7,200 7,300 40,484 49.8 289,457 357 193,880 217,265 18,603 20,882 19,417 22,503 (0.0) 15.9 14.9 12.9 13.6 11.7 3.4 3.0 3.0 3.5 54.8 44.4 25.0 24.8 9.8 10.0 18.6 15.7
IMAS IJ REDUCE 4,685 4,000 2,765 10.5 13,011 1 20,095 22,076 369 506 532 551 (33.5) 3.5 24.4 23.0 34.6 27.5 2.2 2.1 1.0 1.1 194.8 182.5 9.6 9.1 2.8 2.5 7.8 3.6
GJTL IJ HOLD 1,905 2,300 3,485 40.2 6,639 11 13,147 14,781 1,165 1,108 238 778 (79.0) 226.3 27.9 8.5 5.9 6.2 1.2 1.1 0.3 0.8 67.8 68.7 4.4 13.5 1.8 5.5 24.5 2.7
BANKS N 956,021 1,102 219,474 241,708 92,501 101,532 73,722 82,367 17.6 11.6 13.8 12.4 na na 3.1 2.6 2.2 2.3 na na 24.1 22.7 3.0 2.9 na na
BBCA IJ HOLD 11,050 11,500 24,655 50.8 272,438 177 37,422 42,963 17,079 19,245 14,254 16,007 21.6 12.3 19.1 17.0 na na 4.3 3.5 1.1 1.3 na na 24.6 22.8 3.0 3.0 na na
BBRI IJ BUY 10,075 11,100 24,669 43.2 250,392 340 52,661 59,319 26,121 28,525 21,344 24,123 14.3 13.0 11.7 10.4 na na 3.2 2.6 2.5 2.4 na na 29.7 27.6 3.6 3.6 na na
BMRI IJ HOLD 10,200 10,300 23,333 40.0 238,000 317 51,197 56,532 23,552 25,662 18,204 20,283 17.4 11.4 13.1 11.7 na na 2.7 2.3 2.3 2.3 na na 22.5 21.5 2.7 2.6 na na
BBNI IJ BUY 4,830 6,650 18,649 39.8 90,819 143 28,839 32,446 11,219 12,649 9,054 10,171 28.5 12.3 10.0 8.9 na na 1.9 1.6 3.0 3.1 na na 19.9 19.8 2.5 2.5 na na
BDMN IJ REDUCE 4,310 3,400 9,585 32.4 42,172 17 23,155 22,471 5,605 5,695 4,042 4,241 0.7 4.9 10.4 9.9 na na 1.3 1.2 2.4 3.0 na na 13.5 12.9 2.4 2.2 na na
BTPN IJ REDUCE 4,200 3,900 5,840 57.2 24,529 2 7,449 7,734 2,878 2,879 2,131 2,267 6.9 6.4 11.5 10.8 na na 2.5 2.0 0.0 1.8 na na 24.2 20.5 3.3 3.1 na na
BBTN IJ HOLD 1,010 1,270 10,565 34.6 10,829 67 6,437 6,815 2,136 2,262 1,562 1,653 14.5 5.8 6.9 6.6 na na 0.9 0.8 4.3 3.8 na na 14.3 13.6 1.3 1.2 na na
BJBR IJ HOLD 845 1,000 9,696 25.0 8,339 25 5,980 6,483 1,622 1,954 1,376 1,544 15.4 12.2 6.1 5.4 na na 1.2 1.1 9.1 9.8 na na 21.7 21.8 1.9 2.1 na na
BJTM IJ BUY 418 500 14,918 18.0 6,310 9 2,839 3,136 1,116 1,360 824 1,025 2.4 24.3 7.7 6.2 na na 1.1 1.0 9.6 10.6 na na 14.7 17.3 2.7 2.9 na na
BBKP IJ** HOLD 1,275 600 9,525 15.7 12,192 6 3,494 3,810 1,174 1,300 930 1,053 10.6 0.5 11.1 11.0 na na 1.9 1.7 2.0 2.0 na na 16.6 15.9 1.4 1.4 na na
CEMENT UW 199,308 280 53,919 60,279 15,529 16,338 11,695 12,768 4.4 9.3 17.1 15.6 10.5 10.2 3.9 3.3 2.2 2.3 10.2 13.0 24.7 22.9 18.5 17.2 40.1 35.0
SMGR IJ HOLD 15,325 14,300 5,932 49.0 90,159 176.5 24,503 27,003 7,071 7,417 5,427 5,817 12.0 7.2 16.6 15.5 11.0 10.7 4.5 3.8 2.4 2.4 14.2 18.1 28.9 26.5 19.5 18.1 31.0 26.3
INTP IJ HOLD 23,600 20,500 3,681 36.0 85,036 92.1 18,546 21,106 6,085 6,485 5,016 5,371 5.4 7.1 17.0 15.8 10.7 10.0 3.7 3.2 2.1 2.2 nc nc 23.8 21.9 20.4 18.7 52.9 49.6
SMCB IJ REDUCE 2,560 2,050 7,663 19.4 20,000 5.6 9,686 10,751 2,033 2,045 952 1,224 (29.5) 28.5 21.0 16.3 8.7 8.8 2.3 2.1 1.7 2.1 37.1 47.7 11.1 13.3 7.0 7.6 15.5 8.8
SMBR IJ REDUCE 418 410 9,838 23.8 4,112 6.0 1,184 1,420 341 391 300 356 (14.9) 5.6 12.3 11.7 5.8 7.9 1.6 1.5 1.5 1.7 nc nc 17.0 13.1 14.8 11.3 97.6 50.2
COAL & MINING CONTRACTING UW 195,520 209 179,556 184,329 24,058 27,130 10,266 15,118 (28.1) 16.5 15.3 12.4 7.6 6.6 2.3 2.1 3.2 3.8 11.9 10.5 15.6 18.1 9.9 10.9 48.2 21.6
UNTR IJ REDUCE 22,850 18,000 3,730 40.4 84,115 71 51,012 55,826 6,741 8,314 4,825 6,241 (16.5) 29.3 17.4 13.5 7.8 6.1 2.5 2.3 2.3 3.0 nc nc 15.4 18.0 9.0 10.7 20.8 15.6
ADRO IJ* HOLD 1,320 1,200 31,986 40.9 40,942 1 39,980 38,583 6,889 8,577 2,814 4,751 (23.2) 71.2 14.8 8.6 6.2 4.6 1.6 1.2 2.1 3.8 56.9 50.3 8.8 15.0 3.8 6.1 9.3 5.9
ITMG IJ* REDUCE 29,600 23,450 1,130 35.0 33,446 39 26,516 24,801 4,107 4,115 5,560 5,561 (37.4) 0.5 13.2 13.1 6.3 5.6 3.0 2.9 6.4 6.1 nc nc 23.4 25.3 17.9 16.8 88.0 41.8
PTBA IJ REDUCE 11,400 10,000 2,304 29.3 26,267 46 11,209 12,778 1,857 1,749 1,826 1,770 (37.0) (3.1) 14.4 14.8 11.8 12.4 2.8 2.8 4.0 4.2 nc nc 20.5 18.9 15.0 14.7 148.2 42.8
HRUM IJ* HOLD 2,490 2,300 2,704 29.5 6,637 22 10,187 9,076 837 622 509 403 (68.2) (14.8) 16.9 19.9 4.7 5.2 2.0 1.9 3.3 3.1 nc nc 12.6 11.4 9.2 6.9 78.2 29.5
BUMI IJ* REDUCE 194 180 20,773 70.8 4,113 29 40,651 43,265 3,627 3,754 (5,268) (3,608) (28.0) (26.2) (0.9) (1.2) 6.5 5.7 (6.6) (3.2) 0.0 0.0 na na na nm (6.5) (4.0) (16.6) (14.5)
1.0
CONS. & TOLL ROADS N 92,155 392 54,150 62,551 7,485 8,743 3,939 4,587 (4.6) 20.3 24.5 20.8 12.7 11.1 4.3 3.5 1.5 1.7 43.9 58.9 19.4 18.6 5.6 5.6 18.3 21.3
JSMR IJ BUY 5,975 6,450 6,800 30.0 40,290 49 6,380 7,658 2,487 3,063 1,336 1,665 (16.6) 24.6 30.2 24.2 16.3 13.9 4.3 3.9 1.3 1.7 109.7 129.9 14.9 16.9 5.0 5.3 11.9 7.9
WIKA IJ BUY 2,275 2,700 6,144 34.7 14,224 100 11,885 14,393 1,216 1,369 570 691 22.2 21.3 24.9 20.6 11.0 10.4 4.8 4.1 1.2 1.5 nc 34.3 20.6 21.5 4.8 5.0 26.4 22.4
CMNP IJ BUY 3,500 3,600 2,200 65.6 7,623 1 936 1,099 502 583 402 470 (6.3) 16.8 18.9 16.2 10.4 9.1 2.4 2.1 1.2 1.4 nc nc 14.3 14.0 9.4 9.7 17.3 17.8
PTPP IJ HOLD 1,770 1,790 4,842 42.8 8,765 36 10,554 12,325 1,168 1,432 421 488 35.9 15.9 20.8 18.0 5.4 4.9 4.4 3.7 1.4 1.7 (51.8) (16.1) 23.1 22.5 4.0 3.8 17.1 27.1
WSKT IJ HOLD 670 710 9,645 32.1 6,462 50 9,687 10,981 672 761 368 417 0.5 13.3 17.5 15.5 10.1 9.0 2.7 2.4 1.9 1.9 nc nc 16.8 16.4 4.3 4.5 17.0 15.9
WTON IJ BUY 760 970 8,715 100.0 6,624 41 2,621 3,114 321 370 241 283 34.1 (2.3) 21.1 21.6 16.5 13.4 7.0 3.1 1.3 1.3 nc nc 36.1 20.0 8.7 7.4 71.3 49.1
ADHI IJ BUY 2,975 3,300 1,801 49.0 5,422 99 9,800 11,045 864 999 406 430 91.3 5.8 13.3 12.6 6.5 4.5 3.5 2.8 2.2 2.4 15.0 (28.9) 30.0 24.5 4.6 4.3 21.1 27.6
TOTL IJ REDUCE 800 700 3,410 33.8 2,745 16 2,287 1,935 256 168 194 143 10.6 (26.2) 14.1 19.1 8.4 12.8 3.6 3.5 3.5 2.6 nc nc 27.5 18.7 9.1 6.6 (55.1) 138.3
CONSUMER - DISCRETIONARY N 206,009 290 82,403 96,809 9,306 10,281 8,258 8,367 26.4 22.0 30.4 28.0 20.2 17.6 (4.1) 15.6 1.0 1.5 5.0 (5.9) 22.0 18.9 22.7 23.0 (171.3) 26.1
SCMA IJ REDUCE 3,495 1,770 14,622 25.5 49,787 25 3,778 4,102 1,757 1,869 1,320 1,407 12.8 6.6 37.7 35.4 26.4 24.6 15.4 13.1 1.3 1.4 (24.7) (34.4) 47.6 40.6 32.0 29.7 61.8 59.5
LPPF IJ BUY 14,075 14,700 2,918 53.9 41,143 50 6,754 8,348 1,781 2,201 1,150 1,598 49.2 38.9 35.8 25.8 21.1 16.5 (52.7) 50.4 0.0 1.6 nc nc na na 39.2 46.7 (985.3) na
MNCN IJ REDUCE 2,740 2,000 14,180 33.8 40,414 29 6,522 7,071 2,560 2,474 1,691 1,810 2.1 7.1 23.5 22.0 14.8 14.9 4.7 4.2 1.9 2.0 nc nc 21.5 20.1 17.8 17.0 24.3 24.5
MPPA IJ BUY 3,295 3,700 5,378 17.4 17,559 114 11,913 14,612 389 428 445 408 101.7 (8.3) 40.9 44.6 27.9 22.9 8.9 7.6 0.5 0.6 nc nc 12.5 11.9 6.0 6.0 4.0 13.3
ACES IJ REDUCE 860 660 17,150 40.0 15,092 18 3,924 4,745 503 610 423 519 (3.3) 22.7 35.7 29.1 25.2 20.6 7.5 6.4 1.1 1.4 nc nc 23.6 24.1 19.7 20.0 37.0 27.7
HERO IJ REDUCE 2,700 1,470 4,184 16.5 11,212 0 11,900 14,259 424 453 671 366 93.1 (49.0) 15.6 30.7 15.5 12.0 2.0 2.0 0.0 0.0 nc nc 19.1 6.6 10.3 4.4 14.4 20.5
RALS IJ REDUCE 1,245 850 7,096 40.5 9,047 3 7,968 8,566 399 418 434 450 2.4 3.7 20.9 20.1 13.6 11.7 2.8 2.6 2.4 2.7 nc nc 13.9 13.4 10.3 9.9 25.8 23.7
MAPI IJ BUY 5,400 5,750 1,660 44.0 8,840 17 9,734 11,299 751 849 328 429 (24.3) 30.9 27.0 20.6 9.8 7.9 3.6 3.2 1.0 0.8 99.1 54.7 14.3 16.4 4.8 5.4 14.5 7.8
MLPL IJ BUY 845 930 10,065 68.0 8,152 20 14,672 17,219 85 148 1,415 884 4,841.7 (37.5) 5.8 9.2 9.9 6.9 1.2 1.1 0.1 2.6 nc (28.1) 23.5 12.0 8.2 4.2 0.5 27.0
SRIL IJ BUY 202 310 18,593 43.9 3,793 12 3,934 4,816 629 792 346 467 20.5 18.1 9.6 8.1 6.7 6.0 1.1 1.1 0.0 0.0 42.6 59.6 16.1 14.5 8.1 8.3 8.7 9.6
RANC IJ REDUCE 615 500 1,564 20.0 970 1 1,303 1,771 28 40 35 30 (11.8) (14.4) 27.7 32.3 16.8 12.8 2.7 2.4 0.7 0.6 nc 9.2 9.3 7.4 5.5 4.3 13.7 10.1
CONSUMER - STAPLES OW 586,789 366 210,017 240,673 27,853 32,230 18,588 21,829 8.8 12.4 33.8 29.9 22.8 20.2 24.7 19.3 1.9 2.2 22.6 33.8 63.1 60.5 23.5 23.1 58.0 55.4
UNVR IJ BUY 30,475 31,500 7,630 15.0 232,334 55 30,757 35,313 7,122 8,090 5,353 6,045 10.6 12.9 43.4 38.4 30.8 27.9 54.6 42.1 2.2 2.5 16.8 36.5 130.2 123.6 42.3 41.4 109.7 109.8
GGRM IJ BUY 54,250 62,750 1,924 23.5 103,131 76 55,437 60,305 6,650 7,596 4,329 5,022 7.8 16.0 23.8 20.5 14.8 13.0 3.5 3.2 1.8 2.1 39.5 40.9 15.5 16.3 9.4 9.4 12.8 11.7
KLBF IJ BUY 1,605 1,650 46,875 43.3 74,297 83 16,002 18,388 2,549 3,017 1,920 2,227 19.9 16.0 38.7 33.4 26.2 22.1 9.2 7.3 1.4 1.6 nc nc 25.3 24.3 18.5 18.3 38.1 31.4
INDF IJ BUY 6,800 7,950 8,780 49.9 60,146 85 57,732 68,463 6,089 7,531 2,504 3,953 (23.2) 57.9 24.0 15.2 9.3 8.2 2.5 2.4 2.1 3.4 57.7 96.6 11.2 16.1 3.6 4.6 15.1 8.3
ICBP IJ REDUCE 10,100 8,300 5,831 19.5 58,893 45 25,095 30,116 2,734 3,120 2,225 2,420 2.1 8.8 26.5 24.3 18.3 16.2 4.7 4.2 1.8 1.8 nc nc 18.5 18.2 11.4 10.8 31.7 26.5
MYOR IJ REDUCE 28,675 17,000 894 66.9 25,645 3 14,137 15,798 1,348 1,293 1,058 776 41.1 (35.3) 21.4 33.0 16.7 16.9 5.6 4.8 0.9 0.6 53.4 51.5 31.0 18.7 11.2 6.9 14.8 19.4
TSPC IJ BUY 2,950 3,800 4,500 22.7 13,365 3 6,855 7,506 648 745 635 703 1.1 10.7 21.1 19.0 15.8 12.5 3.5 3.1 2.0 2.2 nc nc 17.8 17.4 12.6 12.5 38.0 31.9
SIDO IJ BUY 830 1,050 15,000 10.0 12,525 14 2,497 2,909 503 568 407 500 4.6 11.0 27.8 25.1 22.9 19.5 7.3 7.6 1.3 3.3 (0.0) (24.1) 28.4 31.1 19.5 24.1 48.2 29.6
ROTI IJ REDUCE 1,280 870 5,062 29.3 6,454 3 1,506 1,876 210 270 158 183 5.9 15.9 40.8 35.2 25.7 19.6 8.2 7.0 0.6 0.7 70.6 52.5 21.7 21.4 10.4 9.4 20.4 13.9
INDUSTRIAL ESTATES N 18,832 83 9,974 10,775 3,244 3,171 2,126 2,503 0.0 0.0 18.2 7.8 6.4 6.3 2.0 1.6 0.6 1.6 12.4 9.8 27.7 23.0 14.7 12.4 37.6 33.4
KIJA IJ HOLD 243 280 20,121 80.0 4,950 21 2,740 2,926 855 900 101 652 (73.5) 537.9 48.4 7.6 7.3 6.6 1.2 1.0 0.0 4.0 47.2 37.2 2.5 14.6 1.3 7.4 7.1 1.7
BEST IJ REDUCE 485 465 9,667 38.5 4,699 23 1,324 931 883 551 744 467 58.1 (37.2) 6.3 10.1 5.3 8.3 1.9 1.6 0.5 0.5 (0.2) nc 35.0 17.3 26.3 13.2 37.6 38.3
SSIA IJ HOLD 735 850 4,705 72.2 3,458 25 4,583 5,211 872 906 691 638 (2.3) (7.7) 5.0 5.4 3.1 3.2 1.5 1.2 2.4 2.2 nc nc 35.3 24.6 13.0 10.2 70.5 47.2
LPCK IJ HOLD 8,200 8,700 696 57.8 5,725 14 1,328 1,707 634 814 591 746 45.1 26.4 9.7 7.7 8.4 6.2 3.1 2.2 0.0 0.0 nc nc 38.8 34.0 17.7 17.3 44.2 48.6
METALS N 60,229 154 28,367 28,325 1,770 2,744 1,330 1,721 (54.7) 88.8 66.5 128.2 16.0 24.7 1.8 1.6 1.3 2.2 6.0 10.6 3.9 5.7 2.7 4.1 9.5 3.8
INCO IJ* BUY 3,905 4,700 9,936 20.5 38,255 71 11,216 12,690 734 2,281 405 1,212 (36.5) 209.2 92.6 29.9 18.2 10.2 2.1 1.9 0.8 2.5 0.1 3.7 2.3 6.3 1.7 4.7 4.1 2.3
ANTM IJ REDUCE 1,180 920 9,538 35.0 11,398 53 11,298 9,503 421 (250) 410 20 (86.3) (95.1) 27.8 564.0 13.2 87.4 0.9 0.9 0.5 0.0 31.2 33.7 3.2 0.2 2.0 0.1 27.5 2.7
TINS IJ BUY 1,390 1,216 7,448 35.0 10,576 31 5,852 6,132 615 714 515 489 19.3 (5.0) 13.9 14.6 11.3 9.3 1.5 1.4 4.0 3.4 nc 10.9 10.9 9.8 7.4 6.3 9.9 10.5
OIL & GAS N 161,487 176 71,957 77,715 15,760 16,316 11,603 11,271 24.9 (3.2) 17.9 17.4 9.9 8.6 1.9 1.4 4.4 4.1 16.9 15.8 31.1 33.9 17.2 17.2 47.0 40.8
PGAS IJ* BUY 5,400 5,400 24,242 43.0 129,086 128 36,528 37,850 11,363 12,101 10,473 10,003 26.4 (4.3) 11.9 12.4 9.4 8.2 1.8 1.2 5.0 4.8 nc nc 36.3 39.7 20.8 20.7 56.3 49.3
AKRA IJ REDUCE 4,295 4,150 3,903 41.0 16,960 40 22,338 27,758 837 1,046 648 752 (0.2) 16.0 26.0 22.4 17.4 14.6 3.5 3.2 2.6 1.8 90.0 67.2 14.7 15.0 4.9 5.1 15.7 9.1
MEDC IJ* REDUCE 3,250 2,200 3,332 49.1 10,764 5 10,818.5 10,026.8 2,991 2,577 153 146 1.8 10.5 79.1 71.6 5.0 5.9 1.1 1.1 0.3 0.3 86.1 112.7 1.5 1.5 0.5 0.5 0.8 0.8
WINS IJ* BUY 1,150 1,350 3,997 35.3 4,677 2 2,272 2,080 569 592 329 370 74.0 14.4 13.1 11.4 7.7 6.7 2.0 1.7 1.2 1.4 59.3 44.4 16.1 16.3 2.3 2.3 9.5 11.4
PLANTATIONS N 89,156 167 35,276 46,673 6,135 9,995 3,629 6,715 (26.8) 98.0 25.7 13.4 12.6 8.2 3.0 2.4 1.6 3.1 29.6 23.4 12.9 21.1 8.9 14.2 21.2 12.0
AALI IJ BUY 26,850 35,000 1,575 20.3 42,321 42 12,675 19,760 3,005 4,793 1,801 3,606 (25.3) 100.2 23.5 11.7 12.4 7.9 4.3 3.3 1.9 3.8 20.4 7.4 19.0 31.9 13.2 21.6 28.2 16.6
SIMP IJ BUY 1,025 1,100 15,816 21.6 16,212 15 13,280 15,831 1,586 2,533 524 1,114 (54.7) 112.5 30.9 14.6 8.8 6.2 1.2 1.1 1.3 2.7 42.2 40.4 3.8 7.9 1.9 3.9 7.3 2.9
LSIP IJ BUY 2,270 2,550 6,823 40.5 15,658 78 4,134 4,693 818 1,239 769 1,060 (31.1) 37.9 20.4 14.8 14.4 9.7 2.4 2.1 1.5 2.0 nc nc 11.9 15.1 9.9 12.7 27.0 15.9
BWPT IJ BUY 1,295 1,550 4,471 37.1 5,768 29 1,144 1,700 326 620 182 354 (32.5) 94.9 30.7 15.7 19.4 11.6 2.6 2.2 0.5 1.0 160.2 157.6 9.4 15.1 3.3 5.3 6.9 3.6
ANJT IJ* HOLD 1,500 1,620 3,333 10.0 4,783 0 1,685 1,689 268 413 266 374 (49.9) 57.3 17.5 11.1 9.7 7.9 1.2 1.2 2.9 4.5 nc nc 6.3 8.8 5.5 7.8 14.0 8.4
SGRO IJ BUY 2,335 2,250 1,890 33.0 4,413 2 2,359 2,999 133 397 88 208 (73.4) 137.4 48.0 20.2 15.7 8.8 1.6 1.5 0.6 1.5 37.8 46.4 3.3 7.5 2.1 4.6 11.2 2.5
POULTRY OW 81,888 62 51,268 58,395 6,189 7,066 3,368 4,862 (10.3) 35.8 24.3 17.6 14.0 12.6 5.6 4.5 1.3 1.2 38.8 32.0 25.6 28.3 15.4 17.2 30.7 20.7
CPIN IJ BUY 3,840 4,350 16,398 44.5 62,968 38 25,663 29,454 3,904 4,451 2,531 3,226 (5.7) 27.5 24.9 19.5 15.4 13.9 6.3 5.1 1.3 1.2 17.5 16.0 28.0 28.9 18.0 19.3 34.7 24.3
JPFA IJ BUY 1,320 1,710 10,661 42.5 13,699 11 21,412 24,109 1,803 2,053 595 1,212 (40.0) 103.7 23.0 11.3 9.1 7.9 2.6 2.2 1.4 0.9 111.8 89.6 12.4 20.9 4.6 7.7 14.0 6.2
MAIN IJ BUY 2,900 3,800 1,791 44.1 5,221 13 4,193 4,832 483 562 242 423 (20.2) 75.2 20.4 11.7 10.7 9.3 4.1 3.1 1.0 1.7 103.1 73.2 31.2 41.1 12.0 17.7 25.8 15.2
PROPERTY N 125,940 304 34,509 40,320 12,134 14,225 9,160 10,217 48.1 10.4 14.7 14.0 10.9 9.9 2.8 2.4 1.8 2.0 13.3 14.6 22.2 19.5 8.9 7.8 21.9 23.5
BSDE IJ HOLD 1,600 1,675 18,372 49.6 29,119 48 5,741 5,560 2,910 2,626 2,691 1,997 109.3 (25.8) 10.3 13.9 9.5 9.9 2.7 2.4 1.9 1.4 nc nc 29.7 18.2 13.7 8.6 28.2 35.7
LPKR IJ HOLD 1,045 1,200 23,078 82.1 24,347 95 6,519 7,895 1,504 1,826 1,220 1,324 15.1 8.5 20.0 18.4 16.0 13.8 1.9 1.7 1.3 1.4 26.4 33.8 10.3 9.8 4.3 3.9 8.9 8.2
PWON IJ BUY 391 445 48,160 43.5 18,975 24 3,030 3,669 1,512 1,811 1,133 1,498 51.4 32.3 16.8 12.7 11.0 9.0 4.9 3.7 1.2 1.6 nc nc 33.4 33.2 13.4 14.3 22.2 32.2
SMRA IJ BUY 1,185 1,195 14,427 67.8 17,240 28 4,094 4,423 1,342 1,347 1,102 978 32.9 (11.3) 15.6 17.6 11.5 12.0 3.9 3.4 2.2 2.0 nc nc 27.3 20.7 9.0 6.9 35.9 32.8
CTRA IJ HOLD 1,095 1,130 15,166 61.2 16,607 32 5,077 7,519 1,553 2,176 977 1,194 65.8 22.3 17.0 13.9 9.3 6.5 2.6 2.3 1.8 2.2 nc nc 16.3 17.5 5.6 5.5 14.5 19.5
ASRI IJ BUY 488 760 19,649 49.7 9,648 56 3,684 3,504 1,533 1,654 877 1,401 (27.1) 59.8 11.0 6.9 8.0 7.4 1.9 1.5 2.3 3.7 63.0 50.4 18.0 24.4 6.9 9.6 34.4 13.3
APLN IJ HOLD 269 300 20,501 38.0 5,515 13 4,916 6,078 1,264 2,186 739 1,419 (8.9) 92.0 7.5 3.9 5.7 4.1 1.0 0.8 2.7 5.1 55.2 68.2 13.9 22.7 4.3 7.0 12.3 9.2
CTRP IJ HOLD 720 750 6,150 43.7 4,490 7 1,448 1,671 516 597 422 405 40.5 (3.8) 10.6 11.1 9.6 8.7 1.1 1.0 2.8 2.7 26.7 34.8 10.8 9.7 6.2 5.1 9.2 9.6
STEEL UW 7,414 2 25,368 25,104 (485) 261 (170) 188 13.8 na na 37.8 65.0 17.7 0.6 0.6 0.0 0.0 79.1 106.1 (1.3) 1.6 (0.8) 0.8 (1.2) (0.9)
KRAS IJ* REDUCE 471 400 15,775 20.0 7,414 2 25,368 25,104 (485) 261 (170) 188 13.8 na na 37.8 65.0 17.7 0.6 0.6 0.0 0.0 79.1 106.1 (1.3) 1.6 (0.8) 0.8 (1.2) (0.9)
TELCOS OW 322,697 355 154,496 170,628 32,966 36,970 13,268 18,609 (27.5) 78.3 40.9 20.3 7.5 6.6 4.7 4.0 2.2 2.6 41.1 33.0 20.0 23.1 9.4 10.5 19.6 18.7
TLKM IJ BUY 2,530 2,900 100,800 48.8 254,016 303 82,967 88,882 25,996 29,946 14,205 15,583 10.5 9.7 17.9 16.3 6.2 5.5 4.2 3.6 3.3 3.1 6.4 5.2 25.3 23.9 11.9 11.8 23.4 23.6
EXCL IJ HOLD 5,250 5,500 8,534 33.5 15 21,265 23,901 2,901 1,751 1,033 474 (62.6) (54.1) 42.7 93.0 1.9 2.2 2.9 2.9 1.1 0.5 107.9 136.2 6.7 3.1 2.7 1.1 10.7 3.4
TOWR IJ BUY 3,850 4,400 10,203 60.5 38,261 0 3,197 3,798 1,724 2,084 169 1,258 (51.4) 646.3 227.0 30.4 17.4 14.7 10.5 7.9 0.0 0.0 213.8 164.2 4.8 29.6 1.2 7.9 4.1 1.5
ISAT IJ BUY 3,985 4,800 5,434 20.7 21,627 4 23,855 25,333 1,418 1,976 (2,782) 486 na na (7.8) 52.7 4.2 3.8 1.4 1.4 (6.4) 0.9 136.3 117.6 (16.0) 2.9 (5.1) 0.9 1.0 (7.5)
TELE IJ BUY 815 800 6,232 35.8 5,110 10 10,485 13,781 437 622 295 405 29.2 23.7 16.7 13.5 13.5 9.7 3.2 3.5 1.7 2.3 70.9 74.1 23.6 27.4 12.3 12.0 24.4 18.1
ERAA IJ HOLD 1,275 1,325 2,900 39.7 3,683 22 12,727 14,933 490 591 349 403 (19.5) 15.6 10.6 9.1 9.1 7.5 1.3 1.2 3.8 4.4 39.8 35.1 13.1 14.0 7.8 7.7 15.8 10.3
TRANSPORTATION N 3,940 24 1,681 2,077 439 552 217 260 68.7 20.9 19.7 16.3 7.7 6.5 3.1 2.7 0.9 1.1 92.1 108.8 16.2 16.9 6.3 6.7 6.0 8.3
TAXI IJ BUY 1,385 1,800 2,146 49.0 2,972 23 687 865 221 293 133 161 67.1 21.5 22.4 18.4 8.7 7.2 3.7 3.2 1.2 1.5 74.7 90.5 17.9 18.8 7.0 7.6 7.3 9.5
ASSA IJ BUY 272 330 3,398 40.0 968 1 994 1,213 218 260 85 99 82.1 16.6 11.4 9.8 4.6 4.3 1.2 1.1 0.0 0.0 145.5 165.1 10.9 11.4 3.9 4.0 2.0 4.7
Market N 3,429,801 4,336 1,486,081 1,650,473 275,424 312,494 191,431 226,266 2.7 15.7 22.1 17.6 10.3 9.2 6.5 6.3 2.2 2.5 19.4 19.2 29.1 28.7 11.5 11.7 14.3 21.7
ROAE (%) ROAA (%) ROIC (%)EV/EBITDA (x) P/BV (x) Yield (%) Net gearing (%)Revenue (IDRb) Opt. profit (IDRb) Net profit (IDRb) EPS growth (%) PER (x)
Source: Bloomberg, Bahana estimates

Asiamoney’s
2013
Best Domestic
Equity House
Research: +62 21 250 5081
Teguh Hartanto
[email protected] Director
Deputy Head of Research
Banks, Cement, Aviatonext 3610
Leonardo Henry Gavaza, CFA
[email protected] Research Manager
Auto, Plantations, Heavy equipment, Telco
ext 3608
Arga Samudro
[email protected] 3602
Salman Fajari [email protected]
Research AnalystProperty, Industrial estate, Cement
ext 3605
Jennifer Frederika Yapply
[email protected] Analyst
Coal, Oil and gas, Metals, Poultry, Shippingext 3606
Chandra Widjanarka
[email protected] Analyst, Transportation
ext 3609
Maxi [email protected] Analyst
Construction, Toll Roads, Precast, Steelext 3615
Laurensius Teiseran
[email protected] Associate
ext 3601
Robin Sutanto
[email protected] Associate
ext 3620
Zefanya Angeline Halim
[email protected] Access & Client Relation
ext 3612
William Tong
[email protected] Associate
ext 3604
Michael W Setjoadi [email protected]
Research AnalystConsumer staples and retail, media and
consumer discretionaryext 3613
Yunus Arie Wiratama
[email protected] Associate
ext 3616
Made Ayu Wijayati
[email protected] Executive
ext 3607
Adrian Mahendra Putra
[email protected] Associate
ext 3614
Nuriah Sari
[email protected] Executive
ext 3001
Dealing Room: +62 21 527 0808 (Foreign Institutional) +62 21 250 5508 (Domestic Institutional) +62 31 535 2788 (Surabaya Branch)
Ashish Agrawal
[email protected] President
Institutional Equity Salesext 2550 / 2553
Reynard Poernawan
[email protected] Equity Sales
ext 2528
John M. Dasaad
[email protected] Sales
ext 2549
Yohanes Adhi Handoko
[email protected], Surabaya Branch
ext 7250
Adriana Kosasih
[email protected] Executive
ext 2541
Suwardi Widjaja
[email protected] Sales
ext 2548
Ricardo Silaen, CFA
[email protected] President
Institutional Equity Salesext 2524
Amelia Husada
[email protected] President
Institutional Equity Salesext 2552
Nurul Farida
[email protected] Sales
ext 2543
Hanna Marionda
[email protected] Trader
ext 2525
Harry [email protected]
Senior Associate DirectorHead of Equities & Research
Strategy, Consumer
ext 3600direct: +62 21 250 5735
Head Office Surabaya Branch
Graha Niaga, 19th Floor Wisma BII, Ground Floor
Jl. Jend. Sudirman Kav. 58 Jl. Pemuda 60-70
Jakarta 12190 Surabaya 60271
Indonesia Indonesia
Tel. 62 21 250 5081 Tel. 62 31 535 2788
Fax. 62 21 522 6049 http://www.bahana.co.id Fax. 62 31 546 1157

Disclaimer This publication is prepared by PT.Bahana Securities and reviewed by Daiwa Securities Group Inc. and/or its non-U.S. affiliates, and distributed outside Indonesia by Daiwa Securities Group Inc. and/or its non-U.S. affiliates, except to the extent expressly provided herein. Certain copies of this publication may be distributed inside and outside of Indonesia by PT. Bahana Securities in accordance with relevant laws and regulations. This publication and the contents hereof are intended for information purposes only, and may be subject to change without further notice. Any use, disclosure, distribution, dissemination, copying, printing or reliance on this publication for any other purpose without our prior consent or approval is strictly prohibited. Neither Daiwa Securities Group Inc. nor any of its respective parent, holding, subsidiaries or affiliates, nor any of its respective directors, officers, servants and employees, represent nor warrant the accuracy or completeness of the information contained herein or as to the existence of other facts which might be significant, and will not accept any responsibility or liability whatsoever for any use of or reliance upon this publication or any of the contents hereof. Neither this publication, nor any content hereof, constitute, or are to be construed as, an offer or solicitation of an offer to buy or sell any of the securities or investments mentioned herein in any country or jurisdiction nor, unless expressly provided, any recommendation or investment opinion or advice. Any view, recommendation, opinion or advice expressed in this publication constitutes the views of the analyst(s) named herein and does not necessarily reflect those of Daiwa Securities Group Inc. and/or its affiliates nor any of its respective directors, officers, servants and employees except where the publication states otherwise. This research report is not to be relied upon by any person in making any investment decision or otherwise advising with respect to, or dealing in, the securities mentioned, as it does not take into account the specific investment objectives, financial situation and particular needs of any person.
Neither Daiwa Securities Group Inc. nor any of its affiliates is licensed to undertake any business within the Republic of Indonesia. Any display of any trade name or logo of the Daiwa Securities Group Inc. on this publication shall not be deemed to be an undertaking of any business within the Republic of Indonesia.
Daiwa Securities Group Inc., its subsidiaries or affiliates, or its or their respective directors, officers and employees from time to time have trades as principals, or have positions in, or have other interests in the securities of the company under research including derivatives in respect of such securities or may have also performed investment banking and other services for the issuer of such securities. The following are additional disclosures.
Japan
Daiwa Securities Co. Ltd. and Daiwa Securities Group Inc.
Daiwa Securities Co. Ltd. is a subsidiary of Daiwa Securities Group Inc.
Investment Banking Relationship
Within the preceding 12 months, The subsidiaries and/or affiliates of Daiwa Securities Group Inc. * has lead-managed public offerings and/or secondary offerings (excluding straight bonds) of the securities of the following companies: Blackgold International Holdings Ltd (BGG AU); Tosei Corporation (8923 JP); Modern Land (China) Co. Ltd (1107 HK); China Everbright Bank Company Limited (6818 HK); econtext Asia Ltd (1390 HK); Lotte Shopping Co (023530 KS); Rexlot Holdings Ltd (555 HK).
*Subsidiaries of Daiwa Securities Group Inc. for the purposes of this section shall mean any one or more of:
• Daiwa Capital Markets Hong Kong Limited (大和資本市場香港有限公司)
• Daiwa Capital Markets Singapore Limited
• Daiwa Capital Markets Australia Limited
• Daiwa Capital Markets India Private Limited
• Daiwa-Cathay Capital Markets Co., Ltd.
• Daiwa Securities Capital Markets Korea Co., Ltd
Disclosure of Interest of Bahana Securities
Investment Banking Relationship
Within the preceding 12 months, Bahana Securities has lead-managed public offerings and/or secondary offerings (excluding straight bonds) of the securities of the following companies: Sri Rejeki Isman (SRIL IJ); Semen Baturaja (Persero) (SMBR IJ); Tiphone Mobile Indonesia (TELE IJ); Austindo Nusantara Jaya (ANJT IJ); Telekomunikasi Indonesia (Persero) (TLKM IJ); Garuda Indonesia (Persero) (GIAA IJ); Wijaya Karya Beton Tbk PT (WTON IJ).
Hong Kong
This research is distributed in Hong Kong by Daiwa Capital Markets Hong Kong Limited (大和資本市場香港有限公司) (“DHK”) which is regulated by the Hong Kong Securities and Futures Commission. Recipients of this research in Hong Kong may contact DHK in respect of any matter arising from or in connection with this research.
Ownership of Securities
For “Ownership of Securities” information, please visit BlueMatrix disclosure Link at https://daiwa3.bluematrix.com/sellside/Disclosures.action.
Investment Banking Relationship
For “Investment Banking Relationship”, please visit BlueMatrix disclosure Link at https://daiwa3.bluematrix.com/sellside/Disclosures.action.
Relevant Relationship (DHK)
DHK may from time to time have an individual employed by or associated with it serves as an officer of any of the companies under its research coverage.
DHK market making
DHK may from time to time make a market in the securities covered by this research.
Singapore
This research is distributed in Singapore by Daiwa Capital Markets Singapore Limited and it may only be distributed in Singapore to accredited investors, expert investors and institutional investors as defined in the Financial Advisers Regulations and the Securities and Futures Act (Chapter 289), as amended from time to time. By virtue of distribution to these category of investors, Daiwa Capital Markets Singapore Limited and its representatives are not required to comply with Section 36 of the Financial Advisers Act (Chapter 110) (Section 36 relates to disclosure of Daiwa Capital Markets Singapore Limited’s interest and/or its representative’s interest in securities). Recipients of this research in Singapore may contact Daiwa Capital Markets Singapore Limited in respect of any matter arising from or in connection with the research.
Australia
This research is distributed in Australia by Daiwa Capital Markets Stockbroking Limited and it may only be distributed in Australia to wholesale investors within the meaning of the Corporations Act. Recipients of this research in Australia may contact Daiwa Capital Markets Stockbroking Limited in respect of any matter arising from or in connection with the research.
Ownership of Securities
For “Ownership of Securities” information, please visit BlueMatrix disclosure Link at https://daiwa3.bluematrix.com/sellside/Disclosures.action.
India
This research is distributed by Daiwa Capital Markets India Private Limited (DAIWA) which is an intermediary registered with Securities & Exchange Board of India. This report is not to be considered as an offer or solicitation for any dealings in securities. While the information in this report has been compiled by DAIWA in good faith from sources believed to be reliable, no representation or warranty, express of implied, is made or given as to its accuracy, completeness or correctness. DAIWA its officers, employees, representatives and agents accept no liability whatsoever for any loss or damage whether direct, indirect, consequential or otherwise howsoever arising (whether in negligence or otherwise) out of or in connection with or from any use of or reliance on the contents of and/or omissions from this document. Consequently DAIWA expressly disclaims any and all liability for, or based on or relating to any

such information contained in or errors in or omissions in this report. Accordingly, you are recommended to seek your own legal, tax or other advice and should rely solely on your own judgment, review and analysis, in evaluating the information in this document. The data contained in this document is subject to change without any prior notice DAIWA reserves its right to modify this report as maybe required from time to time. DAIWA is committed to providing independent recommendations to its Clients and would be happy to provide any information in response to any query from its Clients. This report is strictly confidential and is being furnished to you solely for your information. The information contained in this document should not be reproduced (in whole or in part) or redistributed in any form to any other person. We and our group companies, affiliates, officers, directors and employees may from time to time, have long or short positions, in and buy sell the securities thereof, of company(ies) mentioned herein or be engaged in any other transactions involving such securities and earn brokerage or other compensation or act as advisor or have the potential conflict of interest with respect to any recommendation and related information or opinion. DAIWA prohibits its analyst and their family members from maintaining a financial interest in the securities or derivatives of any companies that the analyst cover. This report is not intended or directed for distribution to ,or use by any person, citizen or entity which is resident or located in any state or country or jurisdiction where such publication, distribution or use would be contrary to any statutory legislation, or regulation which would require DAIWA and its affiliates/ group companies to any registration or licensing requirements. The views expressed in the report accurately reflect the analyst’s personal views about the securities and issuers that are subject of the Report, and that no part of the analyst’s compensation was, is or will be directly or indirectly, related to the recommendations or views expressed in the Report. This report does not recommend to US recipients the use of Daiwa Capital Markets India Private Limited or any of its non – US affiliates to effect trades in any securities and is not supplied with any understanding that US recipients will direct commission business to Daiwa Capital Markets India Private Limited.
Taiwan
This research is distributed in Taiwan by Daiwa-Cathay Capital Markets Co., Ltd and it may only be distributed in Taiwan to institutional investors or specific investors who have signed recommendation contracts with Daiwa-Cathay Capital Markets Co., Ltd in accordance with the Operational Regulations Governing Securities Firms Recommending Trades in Securities to Customers. Recipients of this research in Taiwan may contact Daiwa-Cathay Capital Markets Co., Ltd in respect of any matter arising from or in connection with the research.
Philippines
This research is distributed in the Philippines by DBP-Daiwa Capital Markets Philippines, Inc. which is regulated by the Philippines Securities and Exchange Commission and the Philippines Stock Exchange, Inc. Recipients of this research in the Philippines may contact DBP-Daiwa Capital Markets Philippines, Inc.
in respect of any matter arising from or in connection with the research. DBP-Daiwa Capital Markets Philippines, Inc. recommends that investors
independently assess, with a professional advisor, the specific financial risks as well as the legal, regulatory, tax, accounting, and other consequences of a
proposed transaction. DBP-Daiwa Capital Markets Philippines, Inc. may have positions or may be materially interested in the securities in any of the markets
mentioned in the publication or may have performed other services for the issuers of such securities.
For relevant securities and trading rules please visit SEC and PSE Link at http://www.sec.gov.ph/irr/AmendedIRRfinalversion.pdf and http://www.pse.com.ph/ respectively.
United Kingdom
This research report is produced by Daiwa Capital Markets Europe Limited and/or its affiliates and is distributed in the European Union, Iceland, Liechtenstein, Norway and Switzerland. Daiwa Capital Markets Europe Limited is authorised and regulated by The Financial Conduct Authority (“FCA”) and is a member of the London Stock Exchange, Eurex and NYSE Liffe. Daiwa Capital Markets Europe Limited and/or its affiliates may, from time to time, to the extent permitted by law, participate or invest in other financing transactions with the issuers of the securities referred to herein (the “Securities”), perform services for or solicit business from such issuers, and/or have a position or effect transactions in the Securities or options thereof and/or may have acted as an underwriter during the past twelve months for the issuer of such securities. In addition, employees of Daiwa Capital Markets Europe Limited and/or its affiliates may have positions and effect transactions in such securities or options and may serve as Directors of such issuers. Daiwa Capital Markets Europe Limited may, to the extent permitted by applicable UK law and other applicable law or regulation, effect transactions in the Securities before this material is published to recipients.
This publication is intended for investors who are not Retail Clients in the United Kingdom within the meaning of the Rules of the FCA and should not therefore be distributed to such Retail Clients in the United Kingdom. Should you enter into investment business with Daiwa Capital Markets Europe’s affiliates outside the United Kingdom, we are obliged to advise that the protection afforded by the United Kingdom regulatory system may not apply; in particular, the benefits of the Financial Services Compensation Scheme may not be available.
Daiwa Capital Markets Europe Limited has in place organisational arrangements for the prevention and avoidance of conflicts of interest. Our conflict management policy is available at http://www.uk.daiwacm.com/about-us/corporate-governance-regulatory. Regulatory disclosures of investment banking relationships are available at https://daiwa3.bluematrix.com/sellside/Disclosures.action.
Germany
This document has been approved by Daiwa Capital Markets Europe Limited and is distributed in Germany by Daiwa Capital Markets Europe Limited, Niederlassung Frankfurt which is regulated by BaFin (Bundesanstalt fuer Finanzdienstleistungsaufsicht) for the conduct of business in Germany.
Bahrain
This research material is issued/compiled by Daiwa Capital Markets Europe Limited, Bahrain Branch, regulated by The Central Bank of Bahrain and holds Investment Business Firm – Category 2 license and having its official place of business at the Bahrain World Trade Centre, South Tower, 7th floor, P.O. Box 30069, Manama, Kingdom of Bahrain. Tel No. +973 17534452 Fax No. +973 535113
This material is provided as a reference for making investment decisions and is not intended to be a solicitation for investment. Investment decisions should be made at your own discretion and risk. Accordingly, no representation or warranty, express or implied, is made as to and no reliance should be placed on the fairness, accuracy, completeness or correctness of the information and opinions contained in this document, Content herein is based on information available at the time the research material was prepared and may be amended or otherwise changed in the future without notice. All information is intended for the private use of the person to whom it is provided without any liability whatsoever on the part of Daiwa Capital Markets Europe Limited, Bahrain Branch, any associated company or the employees thereof. If you are in doubt about the suitability of the product or the research material itself, please consult your own financial adviser. Daiwa Capital Markets Europe Limited, Bahrain Branch retains all rights related to the content of this material, which may not be redistributed or otherwise transmitted without prior consent.
For stocks and sectors in Indonesia covered by Bahana Securities, the following rating system is in effect:
Stock ratings are based on absolute upside or downside, which is the difference between the target price and the current market price. Unless otherwise specified, these ratings are set with a 12-month horizon. It is possible that future price volatility may cause a temporary mismatch between upside/downside for a stock based on the market price and the formal rating. "Buy": the price of the security is expected to increase by 10% or more. "Hold": the price of the security is expected to range from an increase of less than 10% to a decline of less than 5%. "Reduce": the price of the security is expected to decline by 5% or more.
Sector ratings are based on fundamentals for the sector as a whole. Hence, a sector may be rated “Overweight” even though its constituent stocks are all rated “Reduce”; and a sector may be rated “Underweight” even though its constituent stocks are all rated “Buy”. “Overweight”: positive fundamentals for the sector. “Neutral”: neither positive nor negative fundamentals for the sector. “Underweight”: negative fundamentals for the sector.
Ownership of Securities For “Ownership of Securities” information, please visit BlueMatrix disclosure Link at https://daiwa3.bluematrix.com/sellside/Disclosures.action .
Investment Banking Relationships For “Investment Banking Relationship”, please visit BlueMatrix disclosure Link at https://daiwa3.bluematrix.com/sellside/Disclosures.action .

Relevant Relationships (Bahana Securities) Bahana Securities may from time to time have an individual employed by or associated with it serves as an officer of any of the companies under its research coverage.
Bahana Securities market making Bahana Securities may from time to time make a market in securities covered by this research.
Additional information may be available upon request.
Japan - additional notification items pursuant to Article 37 of the Financial Instruments and Exchange Law
(This Notification is only applicable where report is distributed by Daiwa Securities Co. Ltd.)
If you decide to enter into a business arrangement with us based on the information described in materials presented along with this document, we ask you to pay close attention to the following items.
In addition to the purchase price of a financial instrument, we will collect a trading commission* for each transaction as agreed beforehand with you. Since
commissions may be included in the purchase price or may not be charged for certain transactions, we recommend that you confirm the commission for
each transaction.
In some cases, we may also charge a maximum of ¥ 2 million (including tax) per year as a standing proxy fee for our deposit of your securities, if you are
a non-resident of Japan.
For derivative and margin transactions etc., we may require collateral or margin requirements in accordance with an agreement made beforehand with
you. Ordinarily in such cases, the amount of the transaction will be in excess of the required collateral or margin requirements. There is a risk that you will incur losses on your transactions due to changes in the market price of financial instruments based on fluctuations in interest
rates, exchange rates, stock prices, real estate prices, commodity prices, and others. In addition, depending on the content of the transaction, the loss
could exceed the amount of the collateral or margin requirements.
There may be a difference between bid price etc. and ask price etc. of OTC derivatives handled by us.
Before engaging in any trading, please thoroughly confirm accounting and tax treatments regarding your trading in financial instruments with such experts
as certified public accountants.
*The amount of the trading commission cannot be stated here in advance because it will be determined between our company and you based on current market conditions and the content of each transaction etc.
When making an actual transaction, please be sure to carefully read the materials presented to you prior to the execution of agreement, and to take responsibility for your own decisions regarding the signing of the agreement with us.
Corporate Name: Daiwa Securities Co. Ltd.
Financial instruments firm: chief of Kanto Local Finance Bureau (Kin-sho) No.108
Memberships: Japan Securities Dealers Association, Financial Futures Association of Japan
Japan Securities Investment Advisers Association
Type II Financial Instruments Firms Association