Embed Size (px)
Citation preview

Technical Working Session on Profiling Equity FocusedInformation
Equity Focus in Health and Nutrition
23‐26 June, 2015
Bangkok
26/06/2015 1

26/06/2015 2
Session Objectives
• To provide a global view of how health and nutrition priorities (relating to children and women) are captured in global goals in the post‐2015 development agenda;
• To provide examples of how equity profiles can contribute to improved knowledge around some select regional priorities;
• To begin the process of identifying data sources and indicators to build equity profiles related to health and nutrition
26/06/2015 3
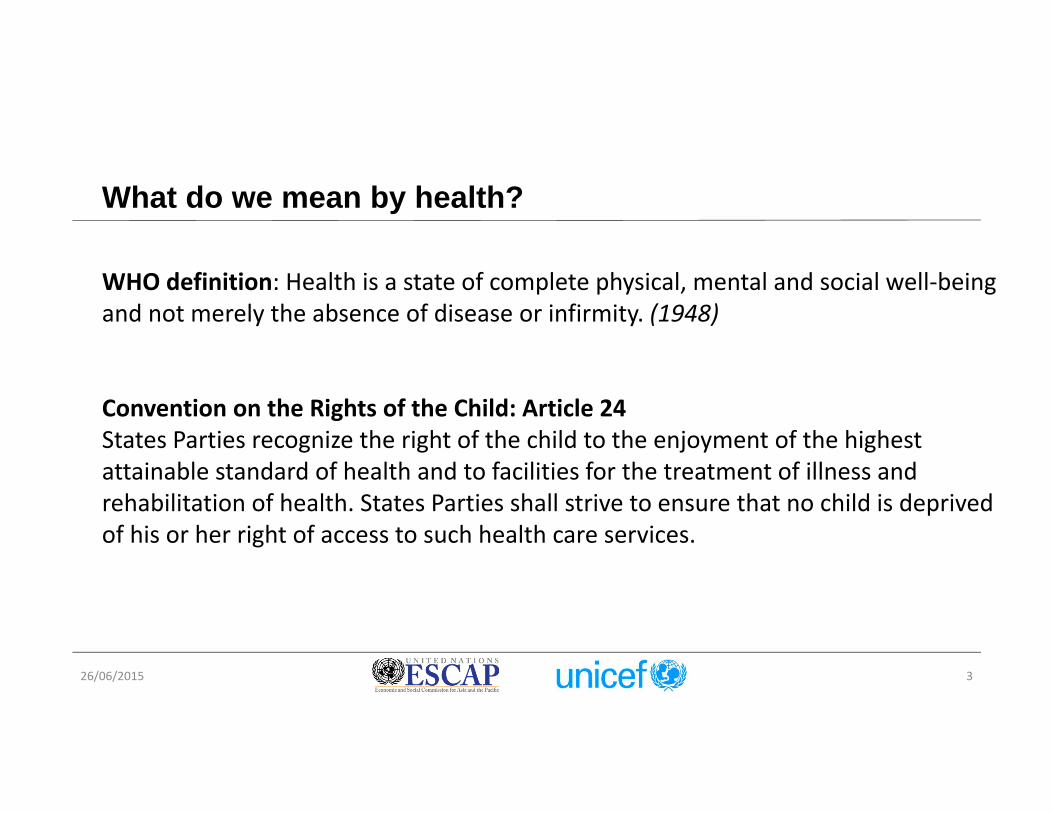
What do we mean by health?
WHO definition: Health is a state of complete physical, mental and social well‐being and not merely the absence of disease or infirmity. (1948)
Convention on the Rights of the Child: Article 24States Parties recognize the right of the child to the enjoyment of the highest attainable standard of health and to facilities for the treatment of illness and rehabilitation of health. States Parties shall strive to ensure that no child is deprived of his or her right of access to such health care services.

26/06/2015 4
How was health and nutrition addressed in the Millennium Development Goals
Goal 1: Eradicate extreme poverty and hungerTarget 2: Halve, between 1990 and 2015, the proportion of people who suffer from hunger• Prevalence of underweight children under five years of age• Proportion of population below minimum level of dietary energy consumption
Goal 4: Reduce child mortalityTarget 5 Reduce by two‐thirds, between 1990 and 2015, the under‐five mortality rate• Under‐five mortality rate• Infant mortality rate• Proportion of one‐year‐old children immunized against measlesGoal 5: Improve maternal healthTarget 6 Reduce by three‐quarters, between 1990 and 2015, the maternal mortality ratio• Maternal mortality ratio• Proportion of births attended by skilled health personnel
Who and where are the most deprived of the right to health were somewhat ‘hidden’ in these indicators

26/06/2015 5
Goal 6: Combat HIV/AIDS, malaria and other diseasesTarget 7 Have halted by 2015 and begun to reverse the spread of HIV/AIDSTarget 8 Have halted by 2015 and begun to reverse the incidence of malaria and other major diseases• HIV prevalence among pregnant women aged 15‐24 years• Condom use rate of the contraceptive prevalence rate• Ratio of school attendance of orphans to school attendance of non‐orphans aged 10‐14 years• Prevalence and death rates associated with malaria• Proportion of population in malaria‐risk areas using effective malaria prevention and treatment measures• Prevalence and death rates associated with tuberculosis• Proportion of tuberculosis cases detected and cured under DOTS (Directly Observed Treatment Short‐course)
Health in the Millennium Development Goals (Cont.)
Goal 8: Develop a global partnership for developmentTarget 17 In cooperation with pharmaceutical companies, provide access to affordable essential drugs in developing countries• Proportion of population with access to affordable essential drugs on a sustainable basis

26/06/2015 6
Health in the Proposed Sustainable Development Goals (SDGs)
Goal 2. End hunger, achieve food security and improved nutrition and promote sustainable agriculture2.1 By 2030, end hunger and ensure access by all people, in particular the poor and people in vulnerable situations, including infants, to safe, nutritious and sufficient food all year round2.2 By 2030, end all forms of malnutrition, including achieving, by 2025, the internationally agreed targets on stunting and wasting in children under 5 years of age, and address the nutritional needs of adolescent girls, pregnant and lactating women and older persons

26/06/2015 7
Health in the Proposed Sustainable Development Goals (SDGs)Goal 3. Ensure healthy lives and promote well‐being for all at all ages3.1 By 2030, reduce the global maternal mortality ratio to less than 70 per 100,000 live births3.2 By 2030, end preventable deaths of newborns and children under 5 years of age3.3 By 2030, end the epidemics of AIDS, tuberculosis, malaria and neglected tropical diseases and combat hepatitis, water‐borne diseases and other communicable diseases3.4 By 2030, reduce by one third premature mortality from non‐communicable diseases through prevention and treatment and promote mental health and well‐being3.5 Strengthen the prevention and treatment of substance abuse, including narcotic drug abuse and harmful use of alcohol3.6 By 2020, halve the number of global deaths and injuries from road traffic accidents3.7 By 2030, ensure universal access to sexual and reproductive health‐care services, including for family planning, information and education, and the integration of reproductive health into national strategies and programmes3.8 Achieve universal health coverage, including financial risk protection, access to quality essential health‐care services and access to safe, effective, quality and affordable essential medicines and vaccines for all3.9 By 2030, substantially reduce the number of deaths and illnesses from hazardous chemicals and air, water and soil pollution and contamination

Health interventions across the continuum of care
8Source: Countdown to 2015 Decade Report (2012 report)

26/06/2015 9
In the post 2015 era what are the issues and deprivations related to health and
nutrition in your country that will need to be addressed to achieve the SDGs ?

26/06/2015 10
Some examples from South Asia
26/06/2015 11
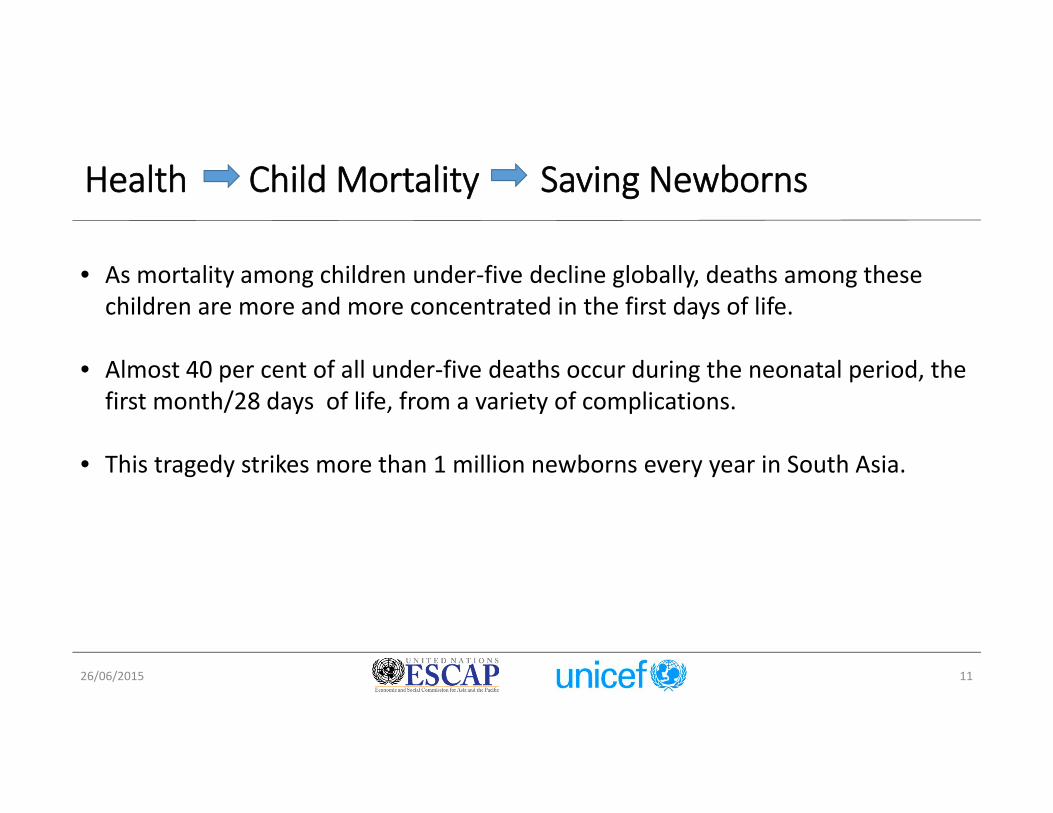
Health Child Mortality Saving Newborns
• As mortality among children under‐five decline globally, deaths among these children are more and more concentrated in the first days of life.
• Almost 40 per cent of all under‐five deaths occur during the neonatal period, the first month/28 days of life, from a variety of complications.
• This tragedy strikes more than 1 million newborns every year in South Asia.

26/06/2015 12
0 10 20 30 40 50 60
Afghanistan
Bangladesh
Bhutan
India
Maldives
Nepal
Pakistan
Sri Lanka
19902013
NEONATAL MORTALITY RATES (DEATHS PER 1,000 LIVE BIRTHS), South Asia, 1990‐2013
Source: The State of the World’s Children, 2015

26/06/2015 13
The good news is that 70% of newborn deaths are preventable even without intensive care facilities. Prevention requires a mix of interventions that need buy‐in and action from families, communities, healthcare workers and governments.

26/06/2015 14
What are some of the key intervention indicators to measure progress towards saving newborns?
Indicators
Antenatal care Skilled attendant at birthInstitutional deliveriesPost‐partum stay in health facilityPost‐natal health check for the childPost‐natal health check for the motherNeonatal tetanus protection Early initiation of breastfeeding Exclusive breastfeeding
Feedback from yesterday:
Why use SBA & INDT delivery? = Highly related.
4 ANC or any ANC? (4 ANC better).
Can we add indicatorIFA SupplementSanitation

26/06/2015 15
Stratifiers
The usual suspects…
Other suggestions:• age of marriage of mother• few process related indicators like institution delivery VS
home delivery.
26/06/2015 16
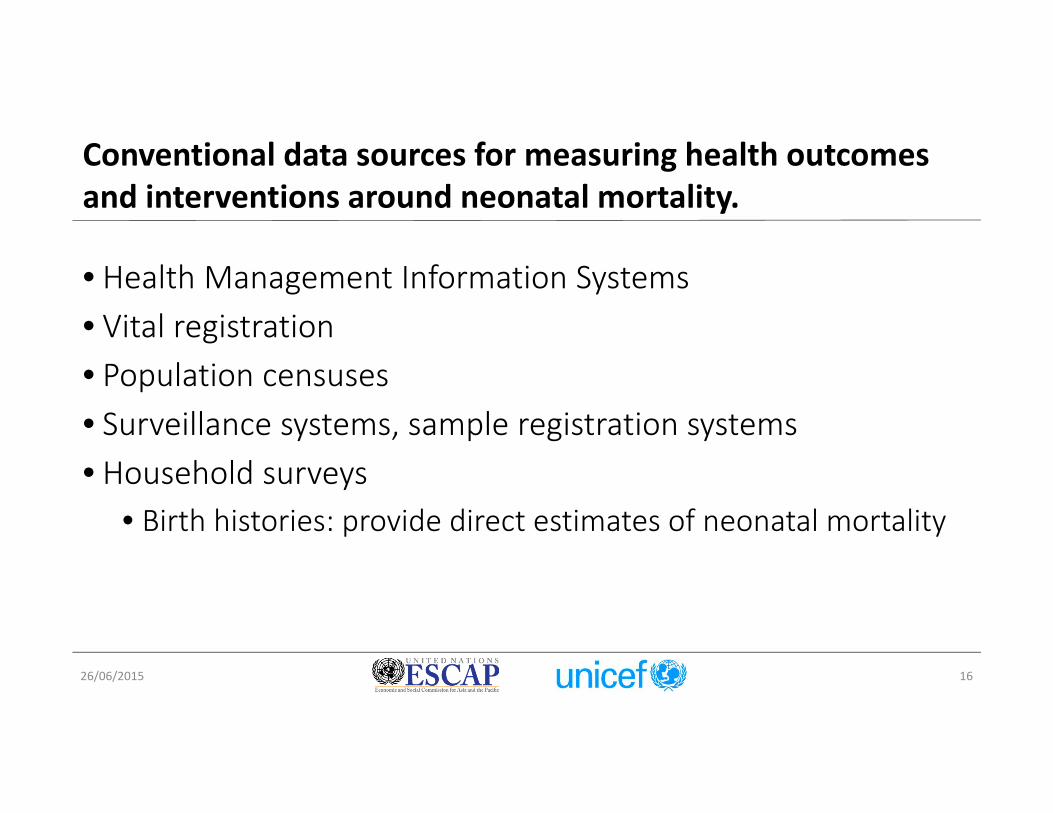
Conventional data sources for measuring health outcomes and interventions around neonatal mortality.
• Health Management Information Systems• Vital registration• Population censuses• Surveillance systems, sample registration systems• Household surveys
• Birth histories: provide direct estimates of neonatal mortality

26/06/2015 17
Combining/comparing data sources
• Are indicators comparable across data sources?• At point of data collection• At point of analysis
• Are survey designs and methodology comparable?• Sample design and coverage• Methodology of data collection
26/06/2015 18
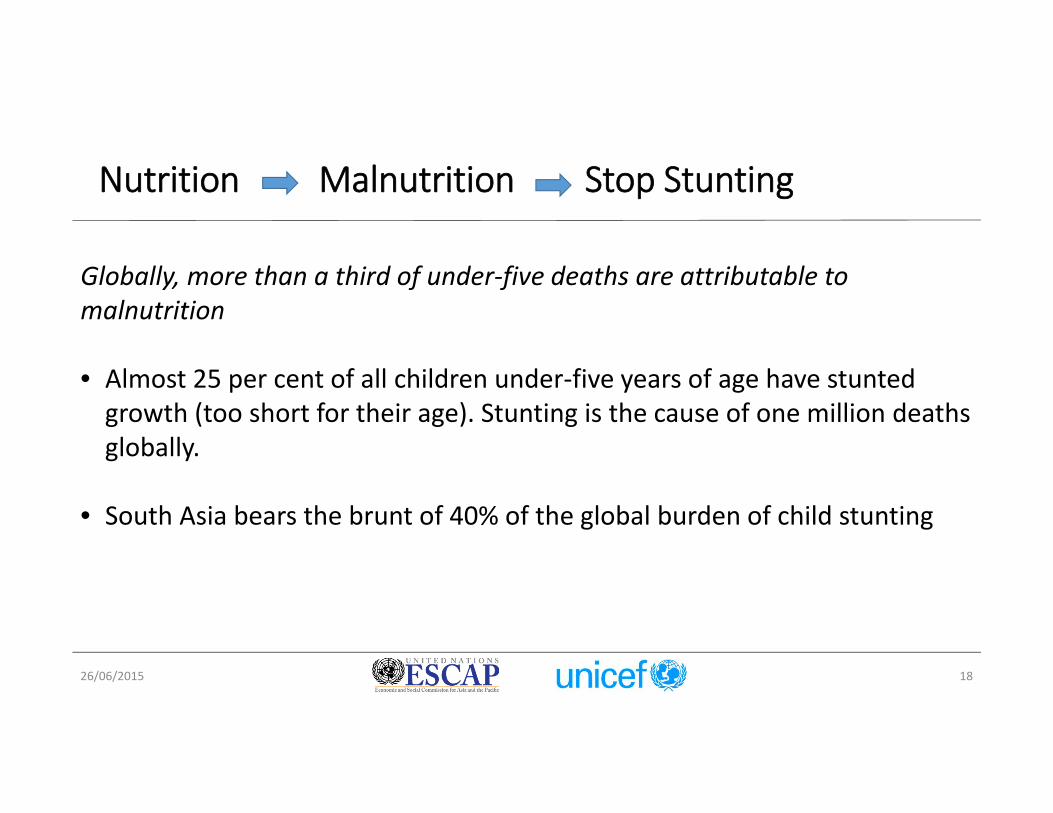
Nutrition Malnutrition Stop Stunting
Globally, more than a third of under‐five deaths are attributable to malnutrition
• Almost 25 per cent of all children under‐five years of age have stunted growth (too short for their age). Stunting is the cause of one million deaths globally.
• South Asia bears the brunt of 40% of the global burden of child stunting

26/06/2015 19
Prevalence of stunting in children under 5 by wealth quintile, different regions, 2006‐2012
26/06/2015 20
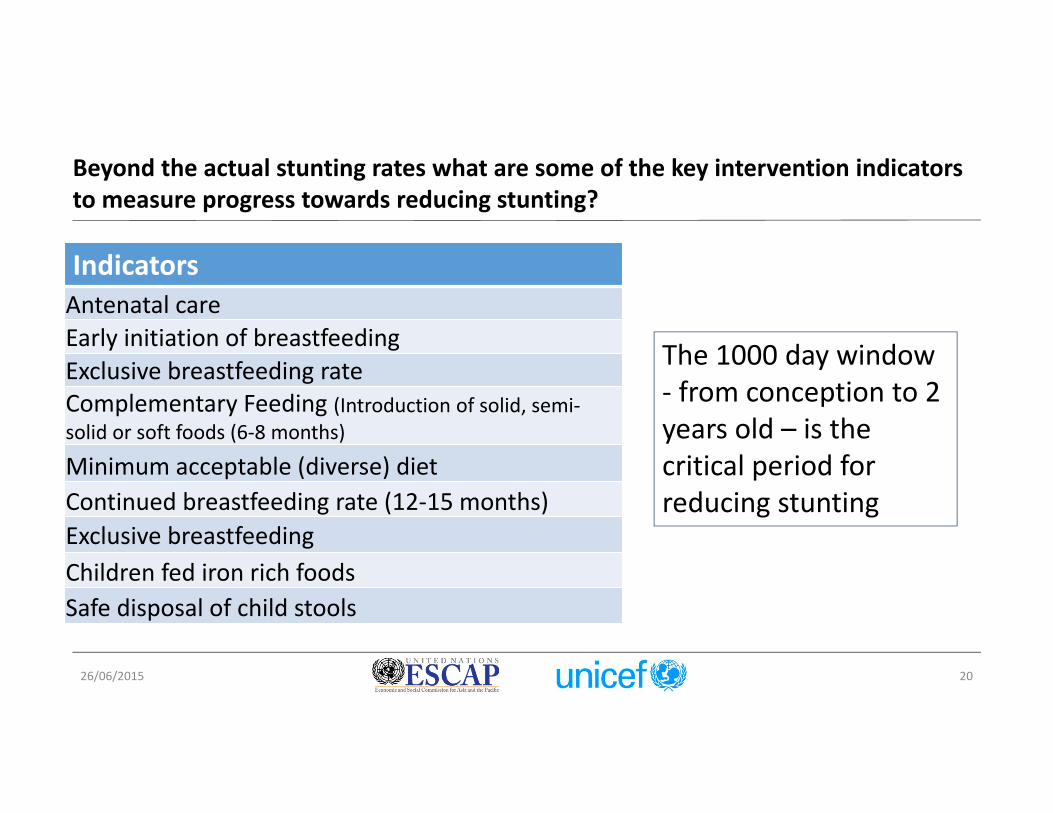
Beyond the actual stunting rates what are some of the key intervention indicators to measure progress towards reducing stunting?
IndicatorsAntenatal careEarly initiation of breastfeedingExclusive breastfeeding rateComplementary Feeding (Introduction of solid, semi‐solid or soft foods (6‐8 months)
Minimum acceptable (diverse) dietContinued breastfeeding rate (12‐15 months)Exclusive breastfeeding Children fed iron rich foods Safe disposal of child stools
The 1000 day window ‐ from conception to 2 years old – is the critical period for reducing stunting

26/06/2015 21
Stratifiers
The usual suspects?
Other suggestions……

26/06/2015 22
Conventional data sources for measuring stuntingoutcomes and interventions around reducing stunting
• Health Management Information Systems• Surveillance systems, sample registration systems• Household surveys• Nutrition Surveys

26/06/2015 23
Table 1. National coverage of key interventions to reduce child malnutrition
Stunted Children
(%)
(STU)
Early breastfeeding (%)
(EIF)
Exclusive breastfeeding (%)
(EBF)
Complementary Foods (%)
(COMP)
Diverse Diet (%)
(DIET)
Diet includes iron‐rich foods (%)(IRON)
Safe Stool
Disposal (%)(SSD)
Antenetalcare (3+ visits) (%)
(ANC)
National values (2011‐12) 39.2 44.7 65.9 67.2 28.6 24.1 41.2 66.5
National values (2006‐07) 47.8 26.6 53.9 72.1 30.4 24.3 26.0 49.3
Nepal: Stunting

26/06/2015 24

1. Identify 2‐3 themes /child health issue or deprivation that is relevant in your country context
2. Identify the indicators related to each of the themes
3. Is data available on these indicators across any of the data sources?
4. What are the gaps in data and metadata?
26/06/2015 25
Steps for the practical session: part 1
1. Establish information
needs
2. Conceptualize information
needs
3. Compile data
4. Data analysis
5. Communicate with users

26/06/2015 26
DATA: TIME POINT 1
Indicator 1
Indicator 2
Indicator 3
Indicator 4
Indicator 5
National
Wealth Quintiles
Q1 (poorest)
Q2
Q3
Q4
Q5 (richest)
Maternal Education
No education
Primary
Middle
Secondary
Higher
Child's Sex
male
female
Area of Residence
urban
rural
Country Region
region 1
region 2
region 3
region 4
region 5
DATA: TIME POINT 2
Indicator 1
Indicator 2
Indicator 3
Indicator 4
Indicator 5
National
Wealth Quintiles
Q1 (poorest)
Q2
Q3
Q4
Q5 (richest)
Maternal Education
No education
Primary
Middle
Secondary
Higher
Child's Sex
male
female
Area of Residence
urban
rural
Country Region
region 1
region 2
region 3
region 4
region 5

1. Prepare the equity profile around the theme selected in part 1, from available and relevant indicators
2. Report back at plenary on selected themes, challenges and progress in developing profiles
3. Present draft equity profile during country presentations on Friday
26/06/2015 27
Steps for the practical session: part 2
1. Establish information
needs
2. Conceptualize information
needs
3. Compile data
4. Data analysis
5. Communicate with users