Embed Size (px)
Citation preview

Perth Melbourne
Equipment Performance Review (EPR) v2.1
User Manual
By
in2Dreging Pty Ltd
8 September, 2017

Prepared by: in2Dredging Pty Ltd
ABN: 92 607 788 689 ACN: 607 788 689
4 Hobart Street, BAYSWATER WA 6053, Australia
www.in2dredging.com
Contact
Simon Burgmans
Email: [email protected]
Mobile: 0408 134 534

In2Dredging Pty Ltd Equipment Performance Review (EPR) v2.1
Perth Melbourne User Manual
8 September, 2017 Page i
Software Program Revision Record
Version Date Description of Modifications Developer Reviewer(s)
1.0 12 February, 2017 Customised software written for Chevron’s Wheatstone Clean-up Dredging Project to perform Quality Assurance tasks on datalogger files by our Client TAMS.
Ralph Brevet Simon Burgmans
1.1 16 February 2017 Included additional requests. Ralph Brevet Simon Burgmans
1.2 9 May 2017 Include Trailer Suction Hopper Dredge with additional graphs and conditions.
Ralph Brevet Simon Burgmans
2.0 28 June, 2017 Rewrote the program in C# using Visual Studio (.NET).
Formalised the functionality of QACheck v1.0, developed generic data input file and enhanced the Graphical User Interface (GUI) to facilitate generic data input and charts setup.
Ralph Brevet Simon Burgmans
2.1 4 September, 2017 Included additional features Ralph Brevet Simon Burgmans

In2Dredging Pty Ltd Equipment Performance Review (EPR) v2.1
Perth Melbourne User Manual
8 September, 2017 Page ii
Document Revision Notice
This is a managed document. All copies of this document preceding this release are obsolete and shall be destroyed.
This Equipment Performance Review (EPR) v2.1 User Manual document is:
• Document Number: i2D-EPR-MAN-001
• Version: 0
• Dated: 8 September, 2017
This document was compiled using Microsoft Word 2016.
Revision History:
Version Number
Date Modification Author Reviewer Approver
A 12 February, 2017 QA Check short user instructions
Ralph Brevet Simon Burgmans
Ralph Brevet
0 8 September, 2017 Release of EPR v2.1 User Manual
Ralph Brevet Grace Dennis, Simon Burgmans
Simon Burgmans

In2Dredging Pty Ltd Equipment Performance Review (EPR) v2.1
Perth Melbourne User Manual
8 September, 2017 Page i
Table of Contents
1 INTRODUCTION ........................................................................................................................ 1
1.1 Background Information................................................................................................................... 1
1.2 Equipment Performance Review (EPR) Overview ............................................................................ 1
1.3 Abbreviations.................................................................................................................................... 2
1.4 About this Manual ............................................................................................................................ 2
2 GETTING STARTED .................................................................................................................... 3
3 PROJECT CUSTOMISATION OF EPR ................................................................................................ 4
3.1 Datafile Specifications ...................................................................................................................... 5
3.2 Optional Data Column Specifications ............................................................................................... 5
4 GRAPHICAL USER INTERFACE (GUI) .............................................................................................. 7
4.1 The Menu Bar ................................................................................................................................... 9
4.1.1 Menu Items .......................................................................................................................... 9
4.2 Tabs ................................................................................................................................................ 11
4.3 Charts .............................................................................................................................................. 11
4.4 Specification Tab ............................................................................................................................ 13
4.4.1 Project and Datafile Section .............................................................................................. 13
4.4.1.1 Contour File Specifications ................................................................................ 14
4.4.1.2 Preview Datafile ................................................................................................ 14
4.4.2 Charts Section .................................................................................................................... 15
4.4.2.1 Chart Options .................................................................................................... 17
4.4.2.2 Conditional Plotting ........................................................................................... 19
5 SOFTWARE LIMITATIONS .......................................................................................................... 20

In2Dredging Pty Ltd Equipment Performance Review (EPR) v2.1
Perth Melbourne User Manual
8 September, 2017 Page 1 of 20
1 Introduction
1.1 Background Information
At its inception, Equipment Performance Review (EPR) was a bespoke software tool developed for the dredging contractor TAMS to be used specifically on Chevron’s Wheatstone project. EPR v2.1 is a spin-off of this customised software developed for the Wheatstone/TAMS project, which was then named QACheck, by in2Dredging in February 2017.
During the above-mentioned project, large volumes of datalogger data were collected onboard all project vessels. QACheck was then used to flag gaps or errors in the data, and to generate graphs showing track plots of vessels with overlaid speed zones, dumping ground contours, etc. These graphs were then used to instantly and reliably perform quality assurance checks to ensure compliance with speed zone restrictions and dumping ground allocations.
This first version of QACheck was tailored to the requirements of the Wheatstone project, and was sufficiently user-friendly to enable non-specialist resources to perform the quality assurance tasks.
EPR v2.0 formalises and completely replaces QACheck version 1. It has all the features of QACheck v1 plus some additional new features. In addition, the user interface has been enhanced to facilitate customisation of the software for any project and for any ASCII datafile formats, as well as facilitating the creation of new charts to meet any new project requirements. This enables in2Dredging to quickly and easily customise EPR for any project.
1.2 Equipment Performance Review (EPR) Overview
EPR v2.1 allows i2D to setup customised templates to quickly check and visualise data stored in ASCII datafiles.
To access the data held in ASCII datafiles, EPR splits the datafile into columns, performs checks on each separate column of data and finally generates user defined charts.
At a minimum, a name and a datatype need to be specified by the user for each column of data. Optionally, several other flags can also be set to highlight, for example, incorrect datatypes and identical values, as well as minimum and maximum values. Two simple data manipulations, i.e. multiplication and offsetting, can also be applied to the data at the project customisation of EPR stage. EPR then generates statistical information showing minimum, maximum and average values for each column of data.
In addition, required charts can be defined for plotting the above-mentioned data. EPR generates charts using the data held within each column. Each line in a chart, called a Series, can be subjected to various plot conditions depending on the value of any other column. Other plot options, such as the use of primary and secondary Y-axes and, manual setting of plot minima and maxima may also be defined.
Once all the data and chart specifications have been set, the settings can be saved to a proprietary EPR file. Each individual EPR file, can then be used as a template to instantly and quickly assess multiple ASCII datafiles with the same format.

In2Dredging Pty Ltd Equipment Performance Review (EPR) v2.1
Perth Melbourne User Manual
8 September, 2017 Page 2 of 20
EPR is a valuable time saving ASCII data viewer, which reduces the number of people required on site. Even a non-specialist team member can instantly and reliably assess project datafiles and share this assessment with the team. Compliancy or production performance can easily be assessed daily to maintain and create a focussed team.
1.3 Abbreviations
ASCII American Standard Code for Information Interchange
EPR Equipment Performance Review
GUI Graphical User Interface
i2D in2Dredging Pty Ltd
TAMS Total AMS Pty Ltd
1.4 About this Manual
This manual describes EPR’s Graphic User Interface (GUI) and explains its features. The chapters in this manual follow the workflow of a typical project application.
The manual’s section, table and figure cross references can be clicked on to navigate to the relevant information.

In2Dredging Pty Ltd Equipment Performance Review (EPR) v2.1
Perth Melbourne User Manual
8 September, 2017 Page 3 of 20
2 Getting Started
You can download a demo version of EPR v1.2 from the EPR web page. The demo version allows for unlimited use of EPR using a sample datafile. This demo version is fully functional except that it is not customised to accept your project specific datafile formats. To use EPR with datafiles specific to your project, you will need a project customisation of EPR, which can be obtained in the following manner:
1. Download and install EPR
2. Pay a fee online to have EPR customised
3. Send your project ASCII datafiles, including the ASCII datafiles’ header descriptions, to [email protected]
4. Send which, if any, optional data column specifications need to be applied to your project ASCII datafiles to [email protected]
See section 3.2: Optional Data Column Specifications for a list of the optional data column specifications that may be applied to your ASCII datafiles.
5. Receive your unique EPR customisation within 24 hours
6. Receive access to a short online training course, if required
Once EPR is customised for your project, you can instantly and reliably review your project datafiles. i2D support will also provide a default proprietary EPR file that acts as a default template containing standard data definitions and charts. You can amend this default template by defining new graphs or new conditions you need to flag.
It is important to note however, that you will not be able to change the datafile format that your unique EPR customisation will accept. Similarly, any optional data column specifications you may have selected to have applied to your project ASCII datafiles will not be able to be amended once set in your unique EPR customisation.

In2Dredging Pty Ltd Equipment Performance Review (EPR) v2.1
Perth Melbourne User Manual
8 September, 2017 Page 4 of 20
3 Project Customisation of EPR
To have EPR customised for your project, please provide [email protected] with your project’s ASCII datafiles and a description of each column in the files, as per the example shown in Table 1 below. i2D Support relies on the column descriptions provided by you to set how your project datafiles will be imported into EPR.
Please flag any datafile columns you do not want uploaded into EPR as “Dummy” and EPR will ignore them.
Column Number Column Description Dummy Column
1 Vessel name yes
2 Date and time no
3 Easting no
4 Northing No
5 Vessel Speed No
6 Vessel Draft Fore No
7 Discharge No
8 Mixture Density No
9 Pump Revolutions No
10 Pump Discharge Pressure No
Table 1: Example Columns specification
Please note that the project datafiles you send to i2D Support must meet the specifications stipulated in Section 3.1 below for them to be able to be uploaded into EPR.
Furthermore, if you wish any of the optional data column specifications listed in Section 3.2 below to be applied to your project ASCII datafiles, please provide i2D Support with a list of the optional specifications you would like set in your unique project customisation of EPR.
Once i2D Support receives your project’s ASCII datafiles and specifications, EPR will be customised within 24 hours to accept your project specific datafiles so as not to adversely impact your project’s start-up phase.

In2Dredging Pty Ltd Equipment Performance Review (EPR) v2.1
Perth Melbourne User Manual
8 September, 2017 Page 5 of 20
3.1 Datafile Specifications
Datafiles needing to be uploaded into EPR must satisfy the following requirements:
• The datafiles’ format must be in ASCII format (text), i.e. not binary;
Please note that the ASCII datafiles’ format must always remain the same for your unique EPR customisation provided by i2D to remain valid;
For example, the ASCII datafiles’ delimiters, e.g. tab delimited or comma delimited, must never change;
• The datafile must have a consistent number of columns;
• The datafile must contain a consistent header row, if any, which EPR can easily identify and ignore;
• There is no preferred or compulsory file extension for the datafile;
• The number of rows or lines within the datafile may vary; and
• There are no set limits to the datafile’s file size or, the number of rows or lines in the datafile
The limits are governed by system hardware restrictions. Successful runs have been performed with files containing 300,000 lines.
3.2 Optional Data Column Specifications
Apart from the mandatory properties of name and datatype needing to be defined for each column, optional data column specifications may also be defined for inclusion into your unique project customisation of EPR.
Table 2 below provides a list of the optional data column specifications you may choose for inclusion into your unique project customisation of EPR and describes their functionality.
Property Name Description Default
Flag incorrect datatype Flag when a column value cannot be converted to the specified datatype.
This option can be switched off when many error messages are reported for a column that is not of interest.
Yes
Flag identical sequential values
Flag when two columns’ values in sequential lines are identical.
No
Flag if the raw data point value is less than or higher than a set value
Flag when a column’s value is under or above a specified value.
A similar option is also available in Chart Options (refer to conditional plotting described in section 4.4.2.2: Conditional Plotting in this manual).
Multiplication and Offset values as described below are not applicable with this flag.
None

In2Dredging Pty Ltd Equipment Performance Review (EPR) v2.1
Perth Melbourne User Manual
8 September, 2017 Page 6 of 20
Property Name Description Default
Flag if the step in raw data point values between two sequential lines is less than or higher than a set value
Flag when the step between two columns’ values is under or above a specified input value.
Please note that the unit for datetime values, in this program version, is seconds.
Multiplication and Offset values as described below are not applicable with this flag.
None
Multiplication value The column value in the datafile is multiplied, e.g. in unit conversions, for display in charts.
This multiplication may not be applied to the above-mentioned flags.
1
Offset value A value with which the value in the datafile will be offset, e.g. for tidal correction, for display in charts.
This offset may not be applied to the above-mentioned flags.
0
Table 2: Data Column Optional Specifications

In2Dredging Pty Ltd Equipment Performance Review (EPR) v2.1
Perth Melbourne User Manual
8 September, 2017 Page 7 of 20
4 Graphical User Interface (GUI)
EPR’s window contains the following Graphical User Interface (GUI) elements.
1. Title bar
2. Menu bar
3. Chart Tabs
The following are example chart tab titles:
a. Tide
b. Drag Head Depth and Pump RPM
c. Hopper Level
d. Dumping Track Plot
4. Specification Tab
The Specification Tab’s screen is divided up into the following sections:
a. Project and Datafile input section
b. Charts input section
c. Output panel
5. Status bar
a. Modified Input flag
Figure 1: EPR’s Graphical User Interface
1 2 3
5
4a
4b
4
4c
5a

In2Dredging Pty Ltd Equipment Performance Review (EPR) v2.1
Perth Melbourne User Manual
8 September, 2017 Page 8 of 20
Table 3 below lists the main GUI elements of the EPR window and provides more detailed information as to their function.
GUI Elements Description
Menu Bar Contains all menu commands.
Where available shortcut keys are also shown (see Table 5: Menu Shortcut Keys for a list of these).
Status Bar Contains the progress bar during processing and displays the word MOD when input data has changed.
If input data has been modified, a dialog box will appear when exiting the program, prompting the user to save the inputted data.
Specification Tab The first tab of the EPR window is called Specification and is used to enter specifications to instruct the program how to import, manipulate and sort the data held in the datafile, and to define for the program the graphs that need to be generated.
The Specification tab’s screen is divided up into two sections. These are the:
• Project and Datafile section
This section is used to input the datafile’s import specifications.
Refer to section 4.4.1: Project and Datafile Section in this manual for information on how this is done.
• Charts section
This section is used to input charting specifications.
Refer to section 4.4.2: Charts Section in this manual for information on how this is done.
The Specification tab’s screen also has an Output panel where feedback information is displayed.
Chart Tabs The remaining tabs display the generated charts, created using the specifications inputted in the various sections of the Specification tab.
Table 3: GUI elements and their functions

In2Dredging Pty Ltd Equipment Performance Review (EPR) v2.1
Perth Melbourne User Manual
8 September, 2017 Page 9 of 20
4.1 The Menu Bar
The Menu bar uses mainly standard Windows Menu items. In Section 4.1.1 below the functionality of all the Menu items are described and a table is provided that summarises the shortcut keys available for some of the Menu items.
4.1.1 Menu Items
Menu Items Submenu Functionality
File New Resets the program, clearing all data previously inputted in the GUI frontend.
Open EPR File Opens the proprietary EPR file containing user inputted data definitions and charts.
EPR users can update the EPR file, but are unable to change the datafile format accepted by EPR.
The default extension for EPR files is “.epr” (optional).
Save EPR File Saves the proprietary EPR file, along with all data inputted in the GUI frontend.
Save EPR File As Saves the EPR file under a new name.
Print Chart Prints the chart that is currently displayed
Exit Exits the EPR program.
If any inputted data has changed, the user will be prompted to save the file.
Process This Menu item reads the datafile, processes the data columns and (re)generates specified charts.
Charts and contents are not automatically updated when inputted data is modified, but are only updated after processing.
Tools Export Current Chart Data to Excel
This Menu item exports the Series, i.e. lines or markers, of the currently displayed chart to an Excel file.
Note that all series are exported as two lists containing both X and Y values. This is done to account for potential differences in the series’ lengths and data points, attributable to EPR’s conditional plotting feature.
Tools Show first 50 Lines of Datafile This menu item opens a text editor window and displays the first 50 lines of the current datafile. A line number and colon are added at the start of each line to assist in identifying the datafile’s line number.
The purpose of this Menu item is to permit a review of the datafile’s data columns by allowing a visual inspection of the datafile’s format.

In2Dredging Pty Ltd Equipment Performance Review (EPR) v2.1
Perth Melbourne User Manual
8 September, 2017 Page 10 of 20
Menu Items Submenu Functionality
Help User’s Manual Opens this User’s Manual in pdf format in a separate window.
The pdf version of this manual can be navigated by clicking on the chapter and section numbers.
About Shows the About box with internet links to in2Dredging’s websites (click on logo).
Table 4: Menu Items
Menu Item Shortcut Key
File/Open Ctrl + o
File/Save Ctrl + s
File/Exit Ctrl + x
Process Ctrl + p
Help/User’s Manual F1
Table 5: Menu Shortcut Keys

In2Dredging Pty Ltd Equipment Performance Review (EPR) v2.1
Perth Melbourne User Manual
8 September, 2017 Page 11 of 20
4.2 Tabs
The first tab of the EPR window is the Specification tab. This tab allows users to input program specifications and is used by the program to provide feedback information to the user via the Output panel.
The remaining tabs on EPR’s window display the predefined charts.
In the Project and Datafile section of the Specification tab’s screen, the user can select whether to remain on the current tab, or to open the selected chart’s tab, after completion of processing by checking the respective radio button. The user may choose to remain on the Specification tab’s screen after completion of processing to inspect set flags or error messages.
TIPS
1. For convenience sake, when in a Chart tab, double clicking on the Chart tab’s title returns the user to the Specification tab with the Series parameters already preselected.
2. When deleting a chart, the corresponding tab will also be deleted.
To recreate the Chart tab, click the Process menu item again.
4.3 Charts
Charts can be zoomed and panned as shown in Figure 2 below. Detailed information on zooming and panning charts is available in Table 6: Zoom and Pan below.
Figure 2: Chart Zooming and Panning example

In2Dredging Pty Ltd Equipment Performance Review (EPR) v2.1
Perth Melbourne User Manual
8 September, 2017 Page 12 of 20
Action Method of Use
Zoom A zoom rectangle can be defined by dragging the mouse over the area requiring zooming while keeping the left mouse button depressed
Pan When the chart is zoomed in, the scrollbars down the right-hand side and below the chart can be used for panning.
Refer to Figure 2 above for an example of this.
Reset Pan and zoom actions can be reset to their defaults by pressing the following small button located at the end of both scrollbars.
Table 6: Zoom and Pan

In2Dredging Pty Ltd Equipment Performance Review (EPR) v2.1
Perth Melbourne User Manual
8 September, 2017 Page 13 of 20
4.4 Specification Tab
4.4.1 Project and Datafile Section
The first section of the Specification tab’s screen is the Project and Datafile section as shown in Figure 3 below. In this section of the screen, the ASCII datafile and optional contour files can be selected for importing by clicking the More button depicted below.
In this section, the user may also specify the default chart that will open once processing has completed.
Figure 3: Datafile Input
Field Name Description Default
Project Name A random identifier for the currently inputted specification data. None
Datafile Name Name of the ASCII datafile that contains the column data to be processed and charted.
Click the More button to open an Open File dialog box, from which the required datafile can be selected.
None
Contour Filenames An optional contour ASCII file, containing points of a polyline that can be overlaid on a chart, may also be selected.
This file can be used to define zone(s) of special significance in a chart.
The display of the file’s contour line is controlled from the Chart Options dialog box.
Click the More button to open an Open File dialog box, from which the required contour file can be selected.
None
Stay on this page When this radio button is selected the Specification tab will stay visible after completion of processing, so that errors and set flags reported in the Output panel may be investigated.
Default
Switch to chart When this radio button is selected, the selected Chart’s tab will be opened immediately after completion of processing.
No
Table 7: Project and Datafile section

In2Dredging Pty Ltd Equipment Performance Review (EPR) v2.1
Perth Melbourne User Manual
8 September, 2017 Page 14 of 20
4.4.1.1 Contour File Specifications
The contour file to be uploaded into EPR must satisfy the following requirements:
• Each line in the contour file must contain a pair of X and Y values separated by a comma;
• The file format must be in ASCII format (text), i.e. not binary;
• There is no preferred or compulsory file extension; and
• There are no set limits to the contour file’s file size or the number of lines in the contour file
• File size limits are governed by system hardware restrictions.
Figure 4 below shows a typical example of a contour file.
Figure 4: Typical Contour File example
4.4.1.2 Preview Datafile
The EPR generated datafile can be previewed by selecting the menu item Tools/Show first 50 Lines of Datafile. This menu item is useful if the datafile is too large to be opened with Notepad or Excel or if a visual interpretation of the file is required.

In2Dredging Pty Ltd Equipment Performance Review (EPR) v2.1
Perth Melbourne User Manual
8 September, 2017 Page 15 of 20
4.4.2 Charts Section
The image below depicts the Charts section of the Specification tab’s screen.
Figure 5: Chart Input
Element Name Functionality Default
Chart Number dropdown list Select the number of the chart you wish to edit N/A
Add button Adds a new chart tab at the end of the chart tabs.
All other chart inputs are disabled when no chart is specified.
N/A
Insert button Inserts a new chart at the current position in the list. N/A
Delete button Deletes the current chart’s specifications.
All other chart controls are disabled when no chart is specified.
When deleting a chart, the corresponding tab will also be deleted. Use the Process menu item to recreate Chart tabs.
N/A
Options button Opens the Options - Chart <number> dialog box where optional chart data may be inputted.
Please refer to section 4.4.2.1: Chart Options in this manual for further information on this dialog box.
N/A
Chart Title field Specifies the title for the current chart.
This title will be displayed as the chart’s tab’s title and as the title on the chart itself.
It is recommended that the chart name field be completed to provide a meaningful title for the chart.
“Chart Name”
X-axis Title field X-axis title to be shown on the chart. None

In2Dredging Pty Ltd Equipment Performance Review (EPR) v2.1
Perth Melbourne User Manual
8 September, 2017 Page 16 of 20
Element Name Functionality Default
Primary Y-axis Title field Y-axis title to be shown on the chart.
This is the title for the primary Y-axis. A title for the secondary Y-axis can be specified with Chart Options. Please refer to section 4.4.2.1 Chart Options in this manual for further information.
None
Clear button Remove column containing X-axis data.
None
X-axis dropdown list Select column for X-axis None
Use Line Number in Data File radio button
Select line number as X-axis None
File Column dropdown list Select the datafile column to be used None
Y-axis dropdown list Select the primary or secondary axis for the data series
Primary
Line Type dropdown list Select the type of line to be used in the chart Line (1pt)
Plot Condition button
Opens the Plot Condition dialog box.
Please refer to section 4.4.2.2: Conditional Plotting in this manual for further information.
None
Table 8: Data Columns Input

In2Dredging Pty Ltd Equipment Performance Review (EPR) v2.1
Perth Melbourne User Manual
8 September, 2017 Page 17 of 20
4.4.2.1 Chart Options
Clicking the Options button located in the Chart section of the Specification tab’s screen, brings up the Options dialog box shown below.
Figure 6: Chart Options
The table below lists the settings available from the Options dialog box for generating charts.
Field Name Functionality Default
X-axis Minimum User override for the automatically determined minimum for the X-axis.
Auto
X-axis Maximum User override for the automatically determined maximum for the X-axis.
Auto
Primary Y-axis Minimum User override for automatically determined
minimum for the primary Y-axis*.
Auto
Primary Y-axis Maximum User override for automatically determined
maximum for the primary Y-axis*.
Auto
Secondary Y-axis Minimum User override for the automatically determined
minimum for the secondary Y-axis*.
Auto
Secondary Y-axis Maximum User override for the automatically determined
maximum for the secondary Y-axis*.
Auto
Clear Deletes axis limits set above N/A
* Adjusting these values can assist in lining up the major and minor gridlines when using both primary and secondary y-axes.

In2Dredging Pty Ltd Equipment Performance Review (EPR) v2.1
Perth Melbourne User Manual
8 September, 2017 Page 18 of 20
Field Name Functionality Default
Show Legend Displays the legend on the chart.
The titles in the legend are taken directly from the datafile’s column names or from the labels specified in the Plot Condition dialog box.
Please refer to section 4.4.2.2: Conditional Plotting in this manual for further information.
Yes
Ignore Zero value Ignores a point when either the X or the Y value equals zero, e.g. used for filtering out spurious points.
Note that this criterion is tested after the multiplication and offset for the column data have been applied, since multiplication and offset are applied when your unique project customisation of EPR is created.
No
Sort X-values Currently not available. No
Show Minor Gridlines Displays minor gridlines No
Show First Date in Title Adds the date of the first data point to the chart title
No
Secondary Y-axis Title Name of the secondary Y-axis to be plotted on the chart
No
Footnote Adds an arbitrary footnote, defined by the user, to the bottom of the chart
No
Show Contour Datafile Plots the contour from a selected contour file onto the graph.
Contour files are selected in the Project and Datafile section of the Specification tab’s screen. Please refer to section 4.4.1.1: Contour File Specifications in this manual for further information.
No
Table 9: Chart Options

In2Dredging Pty Ltd Equipment Performance Review (EPR) v2.1
Perth Melbourne User Manual
8 September, 2017 Page 19 of 20
4.4.2.2 Conditional Plotting
EPR’s Conditional Plotting feature is intended to be used for the following purposes:
• Plot a variable and use a second series that is conditional, such as plot markers, if it’s Y-value is higher than or lower than a specified value
• Plot a variable and use a second series that is conditional on the value of a different column being higher than or lower than a specified value
Figure 7: Plot Conditions of Series
Field Name Functionality Default
Low Value Plots if the data column value is higher than the value specified in the Column Value field.
N/A
Column Value This is the data column against which data column values specified in the Low Value and the High Value fields will be tested.
Note that this column can be any column that contains a numeric datatype.
N/A
High Value Plots if the data column value is lower than the value specified in the Column Value field.
N/A
Legend Text This text is added to the legend of the chart and can be used to describe the condition that has been used in the chart, e.g. “Speed > 10 knots”.
N/A
Clear button Clears all entered content N/A
Table 10: Conditional Plotting
Important Note:
If a multiplication factor or an offset has been specified for the selected column during the creation of your unique project customisation of EPR (refer to section 3: Project Customisation of EPR for further information), these will be applied to the raw data before the conditional plotting criteria are applied.
In2Dredging Pty Ltd Equipment Performance Review (EPR) v2.1
Perth Melbourne User Manual
8 September, 2017 Page 20 of 20
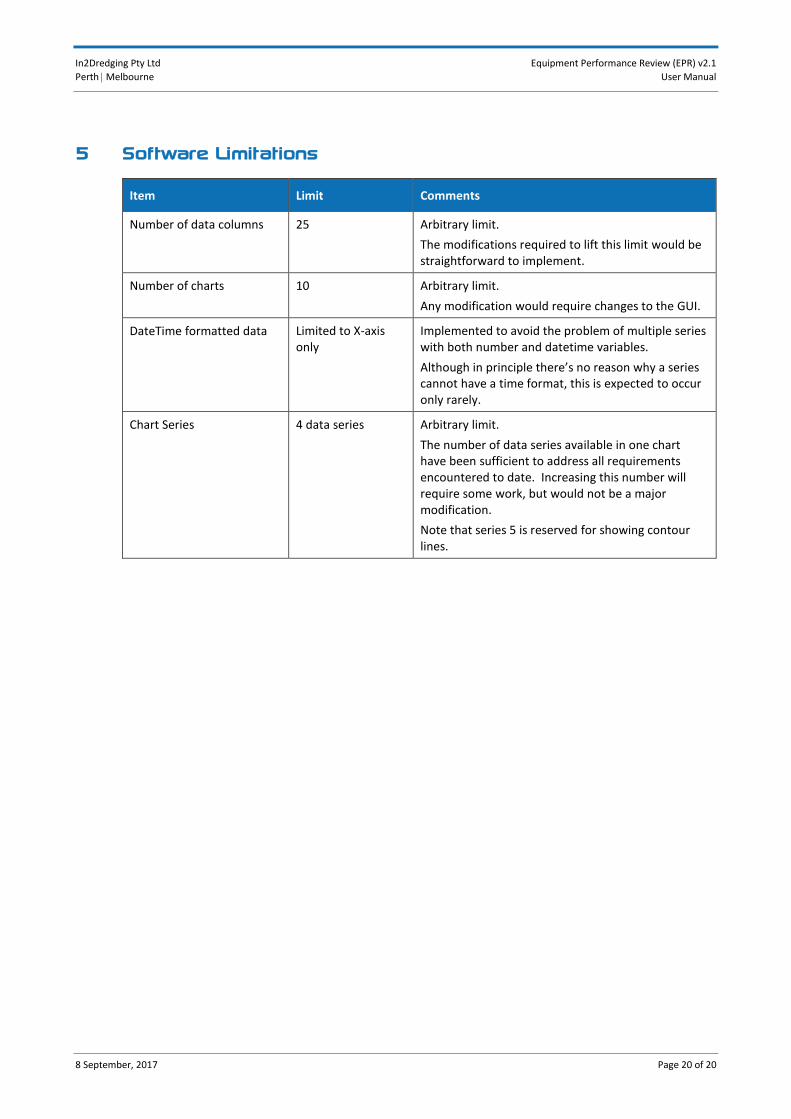
5 Software Limitations
Item Limit Comments
Number of data columns 25 Arbitrary limit.
The modifications required to lift this limit would be straightforward to implement.
Number of charts 10 Arbitrary limit.
Any modification would require changes to the GUI.
DateTime formatted data Limited to X-axis only
Implemented to avoid the problem of multiple series with both number and datetime variables.
Although in principle there’s no reason why a series cannot have a time format, this is expected to occur only rarely.
Chart Series 4 data series Arbitrary limit.
The number of data series available in one chart have been sufficient to address all requirements encountered to date. Increasing this number will require some work, but would not be a major modification.
Note that series 5 is reserved for showing contour lines.