Embed Size (px)
Citation preview

EQ 7: What is a Demographic Transition Model 11/5*
Bell-ringer:Draw the graph in your notes
What information is this graph displaying?
Give one fact that you can determine from this graph?

Demographic Transition Model (DTM)
• Write your definition for these words?• Demographic:• Transition:• Model:

Demographic Transition Model (DTM)
• Demographic: relating to population• Transition: Change• Model: graph• So, a DTM shows:

Demographic Transition Model (DTM)

Stage 1:
High birth rates and high death rates (both about 40)
NIR is ________ (high/low/stable?)
No country is still in Stage One

Stage 2:
High birth rates (over 30) but death rates decline (to about 20)
Growth not from increase in births, but from decline in deaths
NIR is ________ (high, low, stable)

Stage 3:
Birth rates decline sharply (to about 15)
Death rates decline a bit more (to about 10 or less)
Note growth still occurs, but at a reduced rate
NIR is _____ (low, high, stable)
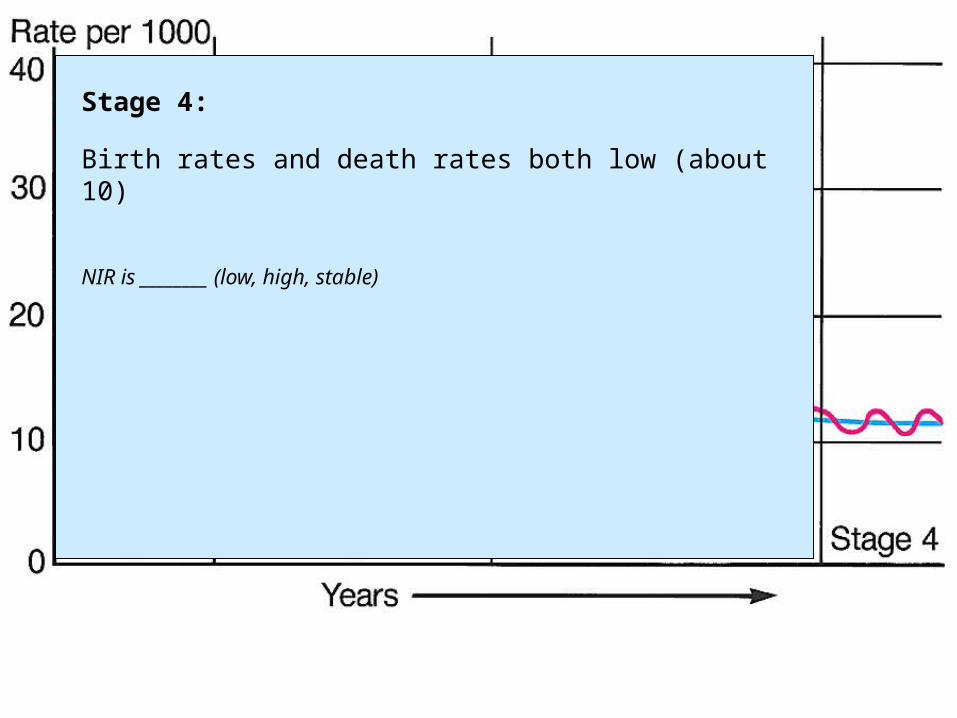
Stage 4:
Birth rates and death rates both low (about 10)
NIR is ________ (low, high, stable)

Possible stage 5:Developed countries
Death rates higher than birth rates
NIR______? (increasing, decreasing, stable?

Draw your own DTM• Create a graph• Title the graph with the name of your country• Years on the x axis (1990-2020-increment of 5
years)• CBR/CDR on the y axis: (5-65 –increments of 5)• PLOT the CBR first – connect every year from
1990 to 2020• PLOT the CDR in a different color • Make a key for CBR and CDR colors

EQ 8: How does a country move stages in the DTM? 11/6
• For the graphs on the next slide. Make 3 connections between the population pyramids and the DTM. Why does the population pyramid match the stage on the DTM?


Individually
• Look at your DTM, what stage do you think your country was in during 1990; 2000 and 2020?
• Explain your answer (use your notes from yesterday)

Compare and contrast
• Look at each person’s DTM and determine the stage for each year (1990, 2000 and 2020)
• In your binder, write the country, stage and year.
Think-pair-share
• Look at what distinguishes each stage of the demographic transition model. For each stage write one reason you think a country would move to that stage.

TRANSITION TO STAGE TWO IN CLASSIC DTM:
Agricultural technology
• Improvements in food supply: higher yields as agricultural practices • improved in “Second Agricultural Revolution” (18th century)
• In Europe, food quality improved as new foods introduced from Americas
Medical technology
• Better medical understanding (causes of diseases; how they spread)
Public sanitation technologies
• Improved water supply (safe drinking water)
• Better sewage treatment, food handling, and general personal hygiene
• Improvements in public health especially reduced childhood mortality

TRANSITION TO STAGE THREE IN CLASSIC DTM
Societies become more urban, less rural
• Declining childhood death in rural areas (fewer kids needed)
• Increasing urbanization changes traditional values about having children
• City living raises cost of having dependents
Family Planning/birth control programs

TRANSITION TO STAGE FOUR IN CLASSIC DTM
Women more influential in society and childbearing decisions
• Increasing female literacy changes value placed on motherhood as sole measure of women’s status
• Women enter work force: life extends beyond family, changes attitude toward childbearing
Improved contraceptive technology, availability of birth control
• But contraceptives not widely avail in 19th century; contributed little to
• fertility decline in Europe … Fertility decline relates more to change in
• values than to availability of any specific technology

Reflection
• Why would different countries be able to transition through the DT at different rates?
In other words, why does population increase (or decrease) at different rates in different countries?

CASE STUDIES
• Individually analyze and annotate the demographic transition map and the population pyramid. Make connections between the 2 graphs
• Read and annotate the description of your country.
• Answer the questions in your notebook.• Get with same groups and discuss questions

Which countries are in which stage? WHAT EVIDENCE DO YOU HAVE?
Tell your group the stage, CBR and CDR and reasons they are in that stage
• Cape Verde• Chile• Denmark


![Querying Graph Databases: What Do Graph Patterns Mean? · over, different kinds of simulation have already been applied in several graph databasetasks[14,16,1]. Since graph databases](https://img.dokumen.tips/doc/110x75/5f8b4e1db98a961eff573d53/querying-graph-databases-what-do-graph-patterns-mean-over-diierent-kinds-of.jpg)


