Embed Size (px)
Citation preview

EPR Oxymetry - Biomedical Applications
Suggested Reading:
G.R. Eaton, S.S.Eaton and K.Ohno, EPR Imaging and In vivo EPR
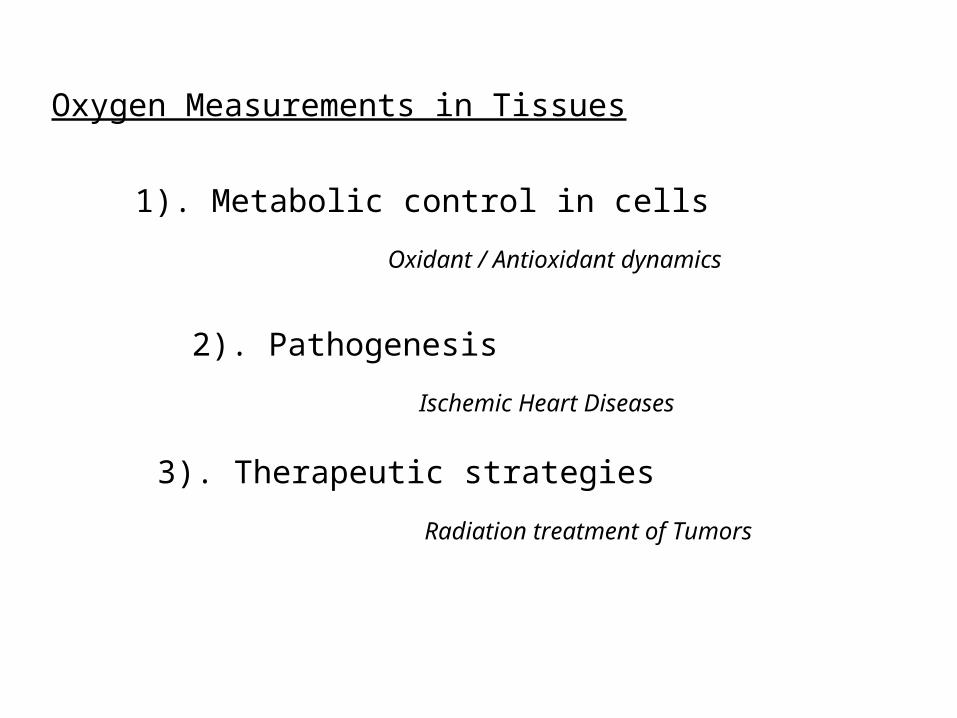
Oxygen Measurements in Tissues
3). Therapeutic strategies
Radiation treatment of Tumors
Ischemic Heart Diseases
2). Pathogenesis
1). Metabolic control in cells
Oxidant / Antioxidant dynamics

Methods for Oxygen Measurements In Tissues
Fluorescent Probes
Ru(bpy)33+
hRu(bpy)3
3+* O2
O2
*
A silicone matrix at the tip of a 230 m fiber contains the oxygen-sensitive fluorescent dye.
Clarks Electrodes
O2 H2O4e
Microelectrode (10-100mic) is inserted into the tissue at the desired location and the oxygen reduction current is measured.

Magnetic Resonance Methods
Nuclear Magnetic Resonance (NMR)
Electron Paramagnetic Resonance (EPR)
1.
2.
Paramagnetic nucleus relaxation is induced by the molecular oxygen
Paramagnetic single electron relaxation is increased by the the molecular oxygen
• BOLD MRI -- T2* effect
• 19F MRS(I) --- T1 effect

Molecular oxygen is paramagnetic Ö2
2p (O) 2p(O)
y*=z*
y=z
x*
x
Molecular oxygen has two unpaired electrons
No EPR spectra have been observed for oxygen dissolved in fluids. (too broad)
Thus, there seems to be no possibility for direct detection of oxygen in biological systems using EPR
However, oxygen can be measured and quantified indirectly using spin-label (EPR) oximetry

±½
En
erg
y
Magnetic Field
Electron Paramagnetic Resonance (EPR)Oxymetry Electron
Spin, S
ms = +½
ms = -½
E=h=gB
OxygenOxygen
Magnetic Field

EPR Oxymetry - ProbesEPR Oxymetry - Probes
Solid state probesSoluble probesLithium Phthalocyanine Sugar charsFusiniteCoalIndia ink
NitroxidesTrityl radicals
Requirement to be a good oxymetry Probe:
• Higher T2 (Sharp EPR spectrum)• Preferably single EPR line (No hyperfine splitting)

LW = e( 1T2
+1
2T1
)
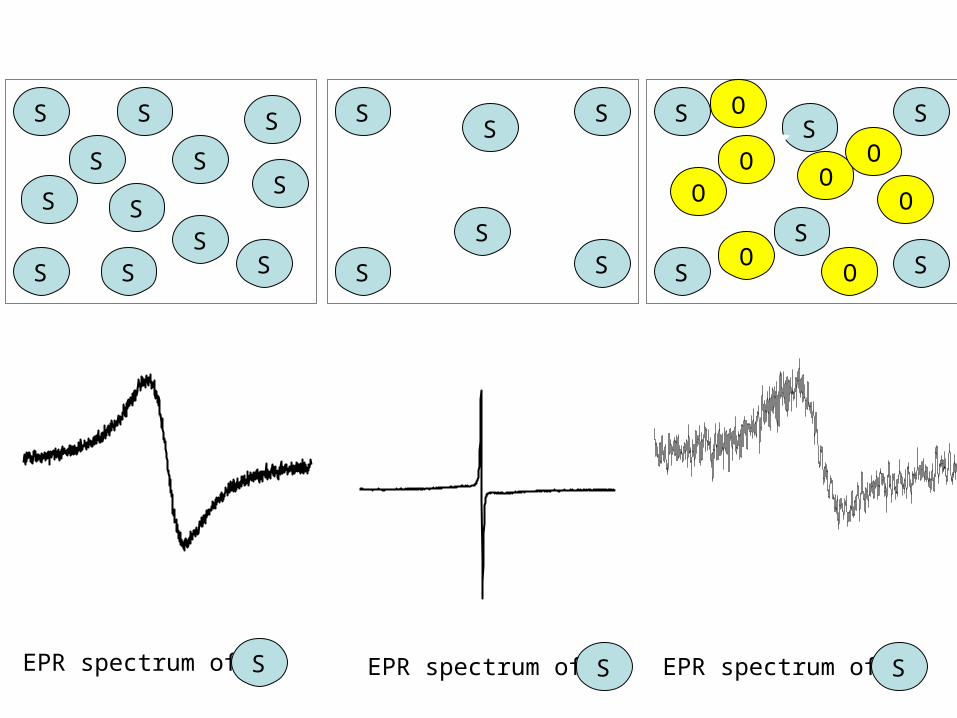
The Principle of EPR oxymetry
T2 – spin-spin relaxation
LW
S
S
S
S
S
S
S
SS
SS
S
EPR spectrum of S
S
S
SS
SS
EPR spectrum of S
S
S
SS
SS
OO
O
O
OO
O
O
EPR spectrum of S
S O
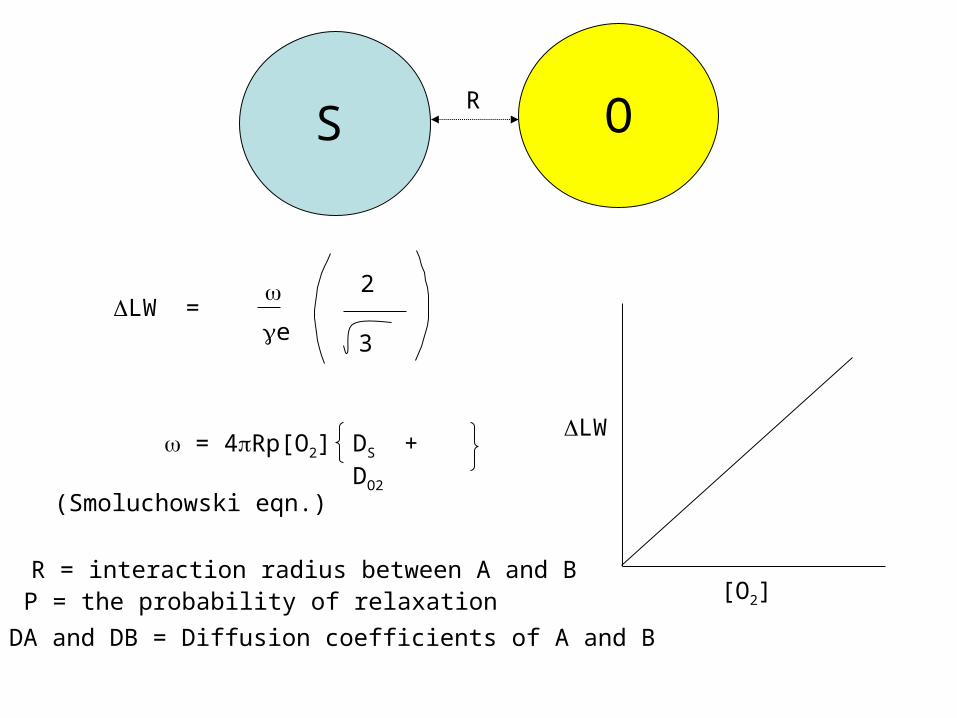
LW =
e
2
3
= 4Rp[O2] DS + DO2
R = interaction radius between A and B
DA and DB = Diffusion coefficients of A and B
P = the probability of relaxation
LW
[O2]
R
(Smoluchowski eqn.)
.
HO
C
SS
OO
OHO
H
CO
O-
S
SO
O
HO
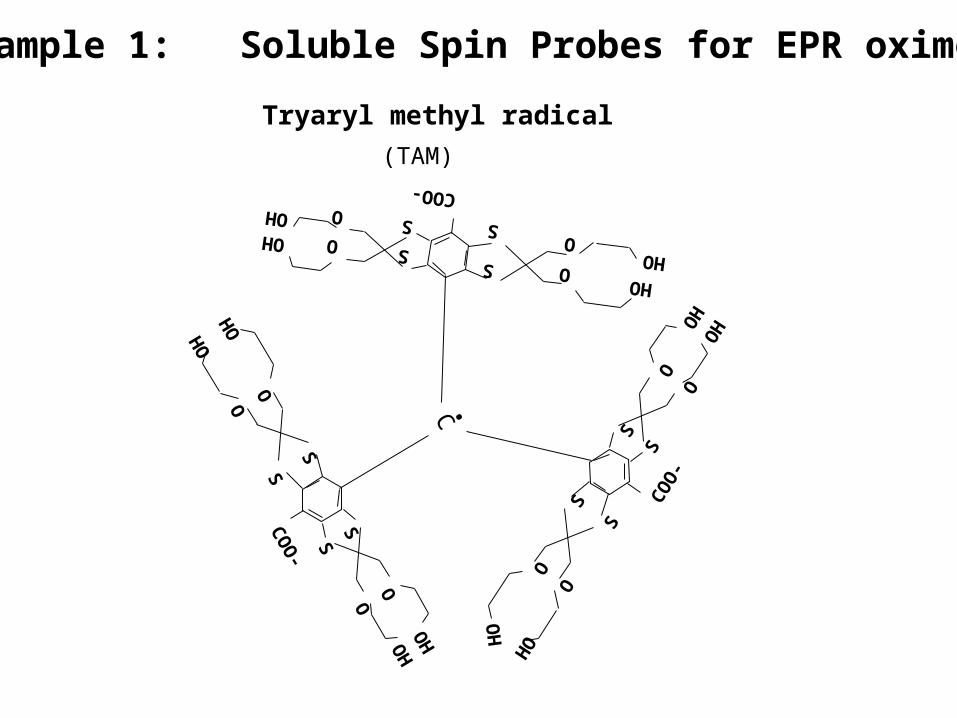
Tryaryl methyl radical
(TAM)
Example 1: Soluble Spin Probes for EPR oximetry
SS
OO
OH
OH
CO
O-
S
S
OO
HO
S
SO
O
OHOH
COO-
S
S
O
OHO
HO
HO

EPR spectrum in the presence of room air (21%O2)
EPR spectrum at anoxic condition (N2)
p O 2 / mmHg
0 20 40 60 80
LW
/ m
G
0
200
400
600
a
Calibration Curve
NN
NN NN
NN
NN
NN
NN
NN
LLii
••NN NN
NNNN
NN
NN NN
NN
LLii
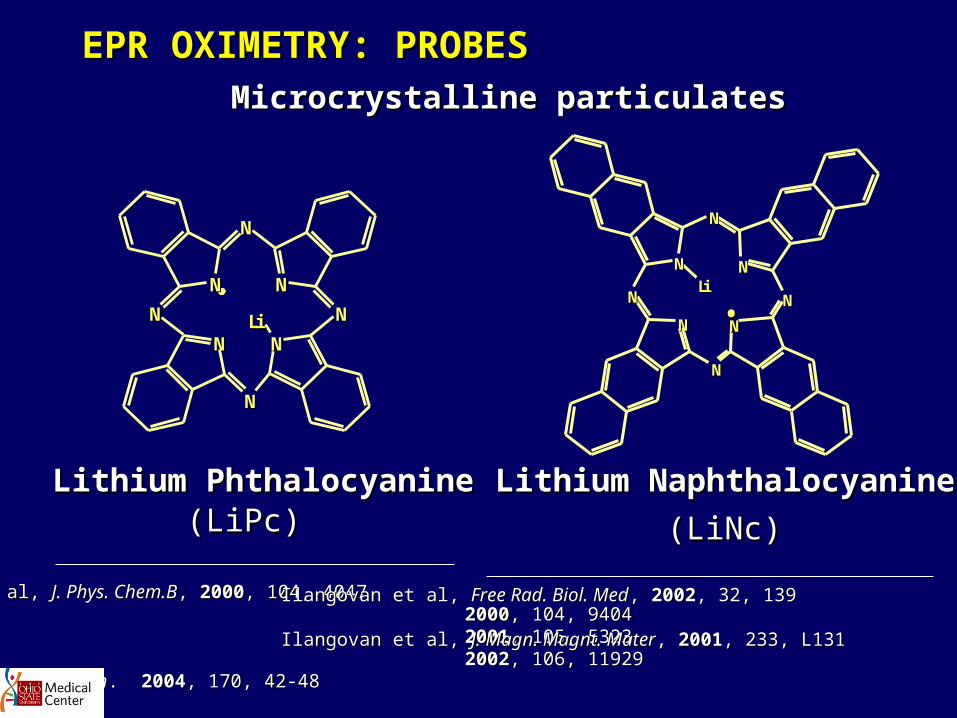
Lithium PhthalocyanineLithium Phthalocyanine Lithium NaphthalocyanineLithium Naphthalocyanine(LiPc)(LiPc) (LiNc)(LiNc)
EPR OXIMETRY: PROBESEPR OXIMETRY: PROBESMicrocrystalline particulatesMicrocrystalline particulates
Ilangovan et al, Ilangovan et al, J. Phys. Chem.BJ. Phys. Chem.B,, 2000 2000, 104, 4047, 104, 4047 20002000, 104, 9404, 104, 9404 20012001, 105, 5323, 105, 5323 20022002, 106, 11929, 106, 11929 J. Magn. ResonJ. Magn. Reson. . 20042004, 170, 42-48, 170, 42-48
Ilangovan et al, Ilangovan et al, Free Rad. Biol. MedFree Rad. Biol. Med, , 20022002, 32, 139, 32, 139 20032003, 35, 1138, 35, 1138Ilangovan et al, Ilangovan et al, J. Magn. Magnt. MaterJ. Magn. Magnt. Mater, , 20012001, 233, L131, 233, L131

Transport of Molecular O2 into the Particulate Spin probes
The Knudson flux Jk is defined as*
Jk = Dk (pO2)
l R Twhere
pO2 = O2 pressure difference between the start and end of pore; [(pO2)start - (pO2)end ]
l = the length of the pore
Dk = Knudson diffusion coefficient
l(pO2)start (pO2)end
Di f
fus i
on
Adsorption
S S
Gas Phase
Schematics of Gas transport
* Frank-Kameneskii, D.A., Diffusion and heat Transfer in Chemical Kinetics, II nd Edition, Plenum, NY, 1969
Knudson Diffusion is dominated since the mean free path of O2 is higher than pores in LiPc

Ilangovan, G. et al Ilangovan, G. et al J. Phys. Chem.,J. Phys. Chem., 20002000, 104, 4047, 104, 4047
Effect of Oxygen on the Effect of Oxygen on the EPR Spectrum of LiPc EPR Spectrum of LiPc
WithWithNitrogenNitrogen
WithWithroom airroom air
Re-saturatedRe-saturatedwith nitrogenwith nitrogen
0.5 G0.5 G
Oxygen Sensing ProbeOxygen Sensing Probe
Lithium Phthalocyanine (LiPc) Lithium Phthalocyanine (LiPc)
Line width Vs. pO2Line width Vs. pO2
pOpO22 (mmHg) (mmHg)00 5050 100100 150150 200200
Lin
e w
idt h
(G
)L
ine
wid
th (
G)
00
0.50.5
1.01.0
1.51.5
2.02.0
2.52.5
5µm

8mm8mm
5050µµL quartz L quartz microtube as microtube as reaction vesselreaction vessel
Magnified view of the micro Magnified view of the micro tube containing the LiPc tube containing the LiPc microcrystals (oxymetry microcrystals (oxymetry probe) probe)
Schematics of EPR oxymetry experimental Schematics of EPR oxymetry experimental set up. The sample tube could be either set up. The sample tube could be either quarts microtube or gas permeable teflon quarts microtube or gas permeable teflon tubetube
LiPcLiPc
OutletOutlet
CottonCottonsupportsupport
Gas mixture Gas mixture inletinlet
MA
GN
ET
MA
GN
ET
MA
GN
ET
MA
GN
ET
TMTM110110CavityCavity
SampleSample
Experimental Set-up Experimental Set-up
Ilangovan et al, Ilangovan et al, Methods In Enzymology, Methods In Enzymology, 2004,381, 7472004,381, 747
An EPR Based method for Simultaneous An EPR Based method for Simultaneous measurements of Omeasurements of O22 and Free radicals and Free radicals
generationgeneration

Effect of NO Addition n on BAEC RespirationEffect of NO Addition n on BAEC Respiration
Complex I Complex I
Co
nC
on
ΔΔ O
.D./
min
O.D
./m
in
0.0000.000
0.0010.001
0.0020.002
0.0030.003
21
%2
1%
21
%2
1%
Co
nC
on
Complex II/III Complex II/III
ΔΔ O
.D./
min
O.D
./m
in
0.0000.000
0.0010.001
0.0020.002
0.0030.003
21
%2
1%
21
%2
1%
NO
NO
Complex IVComplex IV
0.000.00
0.010.01
0.020.02
0.030.03
ΔΔ O
.D./
min
O.D
./m
in
Co
nC
on
21
%2
1%
21
%2
1%
.5%
.5%
.5%
.5%
* P < 0.001* P < 0.001
NO
NO
NO
NO
ETC Complex ActivityETC Complex Activity
NADHNADH
I IIICyt c
II IVUQ Inner membrane
SuccinateSuccinateOO22
Complex INADH:Ubiquinone
Complex II/III Succi-Cyto Reductase
Complex IVCyt c Oxidase
00 2020 4040 6060 808000
2020
4040
6060
8080
100100
120120
140140
160160
Control Control
NO addedNO added
Time (min)Time (min)
pO
pO
22 (m
mH
g)
(m
mH
g)
4x104x1066cellscells21%0.5%
pOpO22 (mmHg) (mmHg)d
pO
dp
O22/
dt(
mm
Hg
/min
)/d
t(m
mH
g/m
in)
00 2020 4040 6060 8080 100100 120120 140140 16016000
11
22
33
55 1010 1515 2020 2525
1.01.0
2.02.0
3.03.0
NO addedNO added
VVO
2max
O2m
ax (
mm
Hg
/min
) (
mm
Hg
/min
)
00
11
22
33
44
55
p50
(m
mH
g)
p50
(m
mH
g)
00
22
44
66
88
Co
nC
on
NO
NO
Co
nC
on
NO
NO
**
**
NO

Mechanism
H2O
I IIIII
IV
NOO2
ONOO-
Reversible inhibitionby NO
Irreversible inhibitionby ONOO-
This inhibition is
pO2 dependent
O2.-
NOS
(Not present at low pO2)(Present irrespective of pO2)
NOS generated NO causes attenuation of respiration via irreversible CuB binding; yet, no competitive binding at the a3 site; p50 remains unchanged

OO22
OO22-.-.
DEPMPODEPMPO DEPMPO-OOHDEPMPO-OOH
SubstrateSubstrateProductProduct
+
Enz
yme
N
O -
CH3
P(O) (OEt )2
H
N
O
H
O2
HOO P(O)(OEt)2
CH3
Free Radicals MeasurementFree Radicals Measurement
Simultaneous measurement approachSimultaneous measurement approach
Oxygen MeasurementOxygen Measurement

Simultaneous measurement of O2-. trapping
using DMPO
30 min30 min 45 min45 min
60 min60 min 90 min90 min
Experimental spectraExperimental spectra Simulated DMPO - OOH SpectraSimulated DMPO - OOH Spectra

Co
nce
ntr
atio
n /
Co
nce
ntr
atio
n /
MM
00
4040
8080
120120
160160
200200
240240
TIME /STIME /S
00 200200 400400 600600 800800 10001000 12001200 14001400 16001600 18001800
A
O2 Concentration
DEPMPO-OOH Concentration
Decomposed product of spin adduct
Kinetic analysis and concentration profiles of Kinetic analysis and concentration profiles of OO22 and DEPMPO-OOH and its decomposed and DEPMPO-OOH and its decomposed product product

5mm
Inserted LiPc in the heart
Micrograph of LiPc microcrystals
10 m14 mm
Cable to Power supply
To Microwave source
PerfusedHeart

Pre-ischemicequilibrium
5 min after ischemia
10 min after ischemia
15 min after ischemia

10m
l/m
in
FL
OW
RA
TE
100m
mH
g
DE
VE
LO
PE
D P
RE
SS
UR
E
60 90 120
150
Time (min)

RPP (bpm. mmHg)
0 10000 20000 30000 40000
Q(n
mol
/g/m
in)
0
2000
4000
6000
8000
10000
Correlation of Heart Injury to Oxygen consumption

Oxygen Measurements in RIF-1 Murine Tumor Model
Biomedical Applications

Implanting the LiPc microcrystals into the Gastrocnemius muscle and Tumor Tissues
Shaft LiPc

EPR imaging instrumentation, consisting of an L-band EPR spectrometer, three sets of water-cooled gradient coils and a bridged-loop surface resonator.
Male C3H anesthetized mouse with Implanted LiPc into the gastrocnemius muscle.
RESONATOR
25 mm
100 mm
MAGNET MAGNET
GRADIENTCOILS
[Z Y X]
GRADIENTCOILS
[X Y Z]
MODULATIONCOILS
HALL PROBES

Number of days0 2 4 6
pO
2 /
mm
Hg
0
5
10
15
20
25
30
Number of days0 2 4 6
pO
2/ m
mH
g
0
5
10
15
20
25
30
Animal 1 Animal 2 Animal 3 Animal 4 Animal 5
TUMOR NORMAL TISSUE
pO2 measurement in RIF-1 Tumor bearing mice
On the day of LiPc was implanted the tumor size was of the size 8 x 8 x 6 mm

Oxygenation of RIF-1 Tumor by breathing Carbogen (95%O2 + 5%CO2)
Time / min0 20 40 60 80 100 120 140
pO
2/ m
mH
g
0
20
40
60
80
100
120
Car
bo
gen
Ro
om
air
1st cycle 2nd cycle 3rd cycle
Initial pO2
<5mmHg
While Carbogen breathing100 mmHg
When switched to room air 20 mmHg
0.5G
CarbogenRoom air
Tumor is oxygenated to the level of normal tissue at least for 2hrs, after termination of carbogen breathing treatment
Ilangovan, G. et al Magn. Reson. Med., 2002, 48, 723

Tumor volume (mm3)0 100 200 300
pO
2 (m
mH
g)
0
4
8
12
16
0 20 40 60 800
4
8
12
16
20
Tumor Growth Vs pO2 relationship
Tu
mo
r V
olu
me
(mm
)3
100
200
0
50
150
250
300
Days post injection0 2 4 6 8 10 12 14
pO
2 (m
mH
g)
0
5
10
15
20
25
30LiPc with RIF-1 Cells
Suspensions of LiPc in Saline or LiPc with RIF-1 cells were injected into the gastrocnemius muscle of right hind leg.
XY
Z
LiPc & RIF cell suspension

Oxymetry in Wound Healing
SKC1 mouse wound with LiPc in the periphery of the wound
Mouse in the EPR machine
EPR image of the LiPc in the wound
2mm
0 7500
2D EPR image

0
5
10
15
20
25
Day 1 Day 2 Day 3 Day 4 Day 5 Day 6 Day7 Day 8
Time Post Wounding
Control
Stress
STRESS AND OXYGEN
* P< 0.05
* **
**
pO
2 (
mm
Hg
)

Hal Swartz works on one of his tattooed volunteers, in an effort to use the carbon particles in tattoo ink to measure the oxygen content of tissues.