Embed Size (px)
Citation preview

Copy N
TEm
No.____
Tailinmergen
_____
gs Stoncy Pr
Septem
orage repare
mber, 2
Faciliednes
2014
ity – ss Plann

Gibraltar Mine Tailings Storage Facility Emergency Preparedness Plan
September 2014
Emergency Preparedness Plan ‐ Revisions
Revision Issued As Date Approved By
Update distribution list, update communication directory Section 10
Gibraltar TSF EPP Sept. 23, 2014
Sept. 23, 2014 Pat Gannon
Emergency Preparedness Plan – Distribution List
Copy No. Name Position Organization
01 Richard Tremblay General Manager Taseko Gibraltar
02 Pat Gannon Manager, Mill Operations Taseko Gibraltar
03 Dale Lawson Loss Prevention Supervisor Taseko Gibraltar
04 Todd Wambolt Sr. Environmental Engineer Taseko Gibraltar
05 John Purdy General Foreman, Mill
Operations Taseko Gibraltar
06 Katherine Gizikoff Director, Government and Environmental Affairs
Taseko
USB Steve Rothman Sr. District Mines Inspector MEM, Kamloops
USB Jack Green Environmental Protection Officer MoE, Williams Lake
USB Rowena Bastien Manager of Protective Services Cariboo Regional District
USB Sylvain Gauthier Fire Chief City of Quesnel
USB On‐call binder Taseko Gibraltar
USB Taseko Head Office Taseko
Gibraltar Intranet ‐ Document
Index Taseko Gibraltar
Gibraltar Mine Tailings Storage Facility Emergency Preparedness Plan
Page i
September 2014
EXECUTIVE SUMMARY
The Executive Summary is provided solely for purposes of overview. Any party who relies on this report must read the full report. The Executive Summary omits a number of details, any one of which could be crucial to the proper application of this report.
This document is the Emergency Preparedness Plan (EPP) for the Gibraltar Tailings Storage Facility (TSF) focusing specifically on incidents that may lead to a breach in the tailings dams, and taking into account the facility’s current configuration, and its projected changes to the end of the mine’s life. In August 2012, Gibraltar Mine completed a long‐term deposition plan for the TSF. Cyclone sand deposition will be restarted in order to maximize the storage capacity of the existing tailings facility.
The TSF is retained by the Main Dam, the North Earthfill Dam, and the East Saddle Dam. The East Cuisson Creek, Cuisson Creek, and Fraser River are located downstream of the Main Dam and the North Earthfill Dam. A release from the Main Dam or the North Earthfill Dam would flow along East Cuisson Creek, Cuisson Creek, and enter the Fraser River. The East Saddle Dam is located on Arbuthnot Creek. A release from the East Saddle Dam would flow along Arbuthnot Creek, Beedy Creek, Beaver Creek, and Quesnel River, and eventually enter the Fraser River at the City of Quesnel.
KCB conducted a dam breach and inundation study in 2012 for the purpose of ascertaining the potential impacts of a dam failure at the TSF. Piping failure of the East Saddle Dam, occurring under ‘sunny day’ conditions would result in worse case incremental impacts, in terms of increase in river level over and above the natural concurrent conditions. Development of a full breach after piping was estimated to take as little as 50 minutes, and the peak flood wave would reach the City of Quesnel approximately 9 hours 50 minutes following the start of the breach. Overtopping of the East Saddle Dam would result in higher breach outflows. This occurrence is extremely unlikely because a precipitation event in excess of the Probable Maximum Precipitation over a period of 30 days would be required for overtopping to occur. Development of a full breach after overtopping was estimated to take as little as 1 hour 50 minutes, and the peak flood wave would reach the City of Quesnel approximately 6 hours 30 minutes following the start of the breach. Overtopping failure is likely to occur when there is major flooding downstream from natural river flows. Therefore, overtopping failure would lead to less incremental impacts, in terms of increase in river level over and above the natural concurrent conditions, compared to a piping failure.
The worst case scenario for the Main Dam is run‐out of the dam and the tailings caused by liquefaction. This is an extremely unlikely scenario because the runout would require an earthquake in excess of the Maximum Credible Earthquake. The Main Dam would slump and extend out by approximately 1,150 ft. The damage caused by the runout would be limited to within the mine property. However, some of the dam fill and tailings would be carried towards the Fraser River by the rainfall and/or streamflow occurring during or after the run‐out event.
Gibraltar Mines is responsible for the co‐ordination of emergency response at the site, issuing alerts to off‐site agencies, and advising disaster service organizations of the actual or expected magnitude and progress of flooding. The Gibraltar Crisis Management Team will set up a Crisis Control Centre to liaise with all outside agencies, and to monitor and assess the emergency and implement any

mitigation works. The British Columbia Provincial Emergency Program (PEP) co‐ordinates emergency operations of the response teams from government agencies, and also provides advice to local municipal emergency response organizations. PEP regional office representatives will travel to the Municipality and the Gibraltar Crisis Control Centre when deemed necessary. Local Emergency Operations Centres of each municipality are responsible for co‐ordinating and activating the emergency response plans for their community. During an emergency, each of these agencies will need to interact, exchange information and co‐ordinate their operations. Gibraltar Mines should discuss the roles and responsibilities presented in this EPP with the provincial, municipal and regional agencies, and all parties must agree to the assigned roles and responsibilities before this plan can be finalized.
Conditions, accidents or events occurring at the Gibraltar TSF which may have implications to dam safety were categorized into potential dam safety problems, and other types of emergency situations which do not threaten the safety of the dam. A list of unusual occurrences include: flooding causing an excessive rise in pond levels; any seismic event; abnormally high piezometric levels in the cyclone sand or earthen dams; settlement, cracks or slumping in any of the dams; sinkholes on any of the dams, tailings beach or Step‐Back Embankment; slope failure of or abnormal seepage flows from any of the dam slopes; increased or contaminated flow from the finger drains or relief wells; sabotage or other criminal activity; and damage to any component of the TSF.
Upon detection of an unusual occurrence, the Gibraltar Crisis Management Team will meet to confirm the occurrence and decide on the alert classification of the situation. If the trigger occurrence is confirmed, then the Gibraltar Crisis Coordinator will assume responsibility for managing the emergency situation, and will oversee the Crisis Control Centre.
Potential danger to the safety of the TSF and/or the downstream infrastructure and population are expressed as three levels of alert:
Yellow Alert indicates that an unusual occurrence has occurred.
This alert level does not pose a hazard to people at the dam or to downstream populations at risk at the time of observation. The occurrence is to be monitored, and mitigation should be done to bring the situation to below trigger levels. Populations at risk and outside agencies will not be notified during a Yellow Alert. As a result, only the Gibraltar Crisis Coordinator and the Crisis Control Centre will be active during a Yellow Alert.
Amber Alert indicates that a dam is unstable but breach is not imminent.
Relevant agencies and populations at risk must be notified and placed on standby status. The populations at risk should be prepared to evacuate areas potentially impacted by flood or tailings runout. The Gibraltar Crisis Coordinator will establish the Crisis Control Centre to manage the emergency situation.
Red Alert indicates that that a dam breach is imminent or has occurred.
Notification for immediate evacuation is to be issued by the Crisis Control Centre. The evacuation notice would include information on what areas could be impacted, the nature of the impact, when the impact will occur, and instructions on what the populations at risk

should and should not do. The responsible agencies need to initiate evacuation of all populations at risk.
Exercises should be developed and conducted in an ascending order of complexity, starting with an Orientation Seminar to familiarize the emergency responders with the EPP and the roles, responsibilities, and procedures of those involved, progressing to a Full Scale exercise. Communications testing should be conducted by Gibraltar Mine staff on an annual basis and operational testing of the EPP should be carried out every 5 years. The EPP should be updated based on results from training and testing. A communications directory is included in Section 10 of this EPP and should be updated on a semi‐annual basis.

Gibraltar Mine Tailings Storage Facility Emergency Preparedness Plan
TABLE OF CONTENTS
Page iv
September 2014
EXECUTIVE SUMMARY ................................................................................................................................ i
1 INTRODUCTION .............................................................................................................................. 1 1.1 General ........................................................................................................................... 1
2 THE TAILINGS STORAGE FACILITY .................................................................................................. 2 2.1 Description of the Tailings Storage Facility .................................................................... 2
2.1.1 General ............................................................................................................ 2
2.1.2 Main Dam ........................................................................................................ 2
2.1.3 North Earthfill Dam .......................................................................................... 3
2.1.4 East Saddle Dam .............................................................................................. 3
2.1.5 Tailings Pond Water Volume and Level ........................................................... 3
2.1.6 Diversion Ditches ............................................................................................. 3
2.1.7 Seepage Collection Pond ................................................................................. 4
2.1.8 Reclaim Water Reservoir ................................................................................. 4
2.2 Operation, Maintenance and Surveillance of the TSF .................................................... 4
3 AREAS DOWNSTREAM OF TAILINGS STORAGE FACILITY ............................................................... 5 3.1 Areas Downstream of East Saddle Dam ......................................................................... 5
3.2 Areas Downstream of the Main Dam ............................................................................. 7
4 EFFECTS OF INUNDATION .............................................................................................................. 9 4.1 The Dam Breach and Inundation Study .......................................................................... 9
4.2 East Saddle Dam Failure ................................................................................................. 9
4.2.1 HEC‐RAS Dam Break and Inundation Model ................................................... 9
4.2.2 Results of HEC‐RAS Model ............................................................................. 10
4.2.3 Likely Inundation Impacts .............................................................................. 10
4.3 Main Dam Failure ......................................................................................................... 14
5 OVERVIEW OF EMERGENCY RESPONSE ....................................................................................... 16 5.1 Overview of Responsibilities ......................................................................................... 16
5.2 Overview of Organizational Structure .......................................................................... 16
5.3 Standards and Conventions .......................................................................................... 18
5.3.1 Communications, Conventions and Procedures ........................................... 18
5.3.2 Media Release Procedures ............................................................................ 18
6 HAZARDOUS CONDITIONS ........................................................................................................... 19 6.1 Unusual Occurrences .................................................................................................... 19
6.2 Actions to Stabilize Dams ............................................................................................. 19
7 EMERGENCY RESPONSE ............................................................................................................... 21 7.1 Initial Response ............................................................................................................. 21

Gibraltar Mine Tailings Storage Facility Emergency Preparedness Plan
TABLE OF CONTENTS (continued)
Page v
September 2014
7.2 Yellow Alert ................................................................................................................... 23
7.2.1 General .......................................................................................................... 23
7.2.2 Gibraltar Crisis Coordinator ........................................................................... 23
7.2.3 Gibraltar Crisis Control Centre ....................................................................... 23
7.3 Amber Alert .................................................................................................................. 23
7.3.1 General .......................................................................................................... 23
7.3.2 Gibraltar Crisis Coordinator ........................................................................... 24
7.3.3 Gibraltar Crisis Control Centre ....................................................................... 24
7.3.4 Provincial Emergency Program (PEP) ............................................................ 25
7.3.5 Ministry of Transportation and Infrastructure (MoT) ................................... 25
7.3.6 CN Rail ............................................................................................................ 25
7.3.7 Local Authorities ............................................................................................ 26
7.3.8 RCMP.............................................................................................................. 26
7.4 Red Alert ....................................................................................................................... 26
7.4.1 General .......................................................................................................... 26
7.4.2 Gibraltar Crisis Coordinator ........................................................................... 26
7.4.3 Gibraltar Crisis Control Centre ....................................................................... 27
7.4.4 Provincial Emergency Program ...................................................................... 28
7.4.5 Ministry of Transportation and Infrastructure (MoT) ................................... 29
7.4.6 CN Rail ............................................................................................................ 29
7.4.7 Local Authorities ............................................................................................ 29
7.4.8 RCMP.............................................................................................................. 30
7.4.9 Media ............................................................................................................. 30
8 CONSTRUCTION MATERIALS, EQUIPMENT, LABOUR AND ENGINEERING RESOURCES .............. 31
9 REVIEW, TESTING, UPDATING OF EPP, AND REPORTING ............................................................ 36
10 COMMUNICATIONS DIRECTORY .................................................................................................. 38
REFERENCES ............................................................................................................................................. 42

Gibraltar Mine Tailings Storage Facility Emergency Preparedness Plan
TABLE OF CONTENTS (continued)
Page vi
September 2014
List of Tables
Table 3.1 Areas Downstream of the Main Dam ............................................................................... 7 Table 4.1 Inundation Characteristics at Selected Locations – Piping ............................................. 13 Table 4.2 Inundation Characteristics at Selected Locations – Overtopping .................................. 13 Table 4.3 Model Rheological Input Parameters and 2‐D Model Analysis Results ......................... 14 Table 8.1 Onsite Equipment List ..................................................................................................... 32 Table 8.2 Offsite Suppliers and Contractors ................................................................................... 35 Table 10.1 Gibraltar Mine Emergency Contact Details .................................................................... 38 Table 10.2 Gibraltar Crisis Management Team (Tailings) ................................................................ 38
List of Figures
Figure 7.1 Alert Notification Flow Chart .......................................................................................... 22

Gibraltar Mine Tailings Storage Facility Emergency Preparedness Plan
Page 1
September 2014
1 INTRODUCTION
1.1 General
This Emergency Preparedness Plan (EPP) has been prepared to assist emergency responders who will jointly manage any emergency situation created by a problem threatening or causing a breach of the Tailings Storage Facility (TSF) dams at the Gibraltar Mine. Gibraltar Mines Ltd. will initiate emergency notification procedures if such an emergency should ever occur.
Gibraltar Mines Ltd. is responsible for providing all administrative support for this plan, including documenting the inputs of other emergency responders, and maintaining, testing and upgrading this plan in accordance with joint arrangements agreed to by the emergency responders.
This plan specifically addresses the following:
what would happen to the stored water and tailings in the TSF if any of the dams were to breach;
how people and property would be affected;
what potential hazards would be created;
procedures to be followed in the event of an emergency situation; and,
agencies involved with the emergency response.
The plan includes information enabling the emergency responders to communicate with each other and to effectively integrate their operations where required during an emergency. A dam breach and inundation assessment was completed by Klohn Crippen Berger Ltd. (KCB) and is included in the Appendix 1 of the report Tailings Storage Facility Emergency Preparedness Plan, February 2013 (Klohn Crippen Berger Ltd., 2013) (as part of preparation of this plan. This is included as Appendix I. Note that the main text of this report references many of the figures included in Appendix I.
Gibraltar Mines Ltd. and each agency involved will base their own emergency operations plans on the roles and protocols described in this plan. The emergency responders can use this EPP document to ensure their staff are familiar with:
conditions under which stakeholders would be notified about problems at the Gibraltar Mine TSF that could lead to a breach;
procedure for notifying stakeholders;
the emergency response issues (affected population centres, affected roads and bridges, location and type of pipeline and power line crossings, affected agricultural areas, flood travel times, emergency notification protocol and responsibilities, etc.); and,
who would address each of these issues during each type of emergency condition.

Gibraltar Mine Tailings Storage Facility Emergency Preparedness Plan
Page 2
September 2014
2 THE TAILINGS STORAGE FACILITY
2.1 Description of the Tailings Storage Facility
2.1.1 General
Gibraltar Mine is located approximately 60 km north of Williams Lake, near McLeese Lake in the southern interior of British Columbia as shown in Appendix I. Access to the mine site is by way of an 18 km paved road that joins Highway 97 near McLeese Lake. The mine produces copper‐molybdenum. The TSF is located immediately north of the mine’s plant site (Figure I‐2), and is retained by the Main Dam, the North Earthfill Dam, and the East Saddle Dam, as shown in Figure I‐3. The Main Dam is also referred to as the Cycloned Sand Dam in this report. The bulk of the tailings are deposited against the Main Dam and the south abutment of the TSF. The supernatant (free) water pond is located at the east end of the tailings impoundment and is retained by the North Earthfill Dam and the East Saddle Dam. Relevant details of the three dams are summarized in the following sections. Further details of the dams may be found in the TSF’s Long Term Deposition Plan (Klohn Crippen Berger Ltd., 2012), and in the Operation, Maintenance and Surveillance Manual – Revision 4 (Klohn Crippen Berger Ltd., 2012).
The Long Term Deposition Plan includes details on how the configuration of the TSF will change from 2012 to 2027. Gibraltar proposes to store an additional 455 million tons of dry tailings by ‘stacking’ tailings on top of the existing tailings beach using cyclone sand deposition. The stack will be built using the cyclone underflow (coarse sand), and the overflow (fine sand) will be discharged into the tailings pond. This minimizes the volume of tailings deposited in the pond, thereby limiting future pond level raises and required dam raises. The proposed re‐design addresses the geotechnical stability and water management of the facility, and follows the Canadian Dam Association Dam Safety Guidelines (2007) and the British Columbia Dam Safety Regulation (2011). Figure I‐4 shows the current configuration and the projected ultimate configuration of the TSF, based on the Long Term Deposition Plan.
2.1.2 Main Dam
The Main Dam is located approximately 3 km from the mine Plantsite, and is reached via a gravel road from the Plantsite. The dam was commissioned in 1972 by construction of a 100 ft high starter dam of compacted glacial till across the outlet of the East Cuisson Creek valley. Subsequent dam raises were performed using the centreline method of construction. Tailings underflow from cyclones located across the crest of the dam was deposited directly onto the centreline and downstream slope of the dam. The cyclone overflow and "bleed" from the end of the tailings pipeline were discharged onto the tailings beach upstream of the dam centreline.
Proposed changes to the Main Dam over the remaining life of the mine are included in the Long Term Deposition Plan. The goal of the tailings deposition plan is to contain the Life‐of‐Mine tailings volumes, to minimize the ultimate pond elevation and to isolate the tailings pond from the Main Dam and North Earthfill Dam to minimize water levels and seepage gradients in the structures.

Gibraltar Mine Tailings Storage Facility Emergency Preparedness Plan
Page 3
September 2014
2.1.3 North Earthfill Dam
The North Earthfill Dam is a compacted till embankment comprising the saddle dams previously referred to as Saddle Dams A and B. Construction of the North Earthfill Dam began in 1990, when the western portion was built to elevations between 3,544 ft and 3,546 ft. The two saddle dams (A and B) were constructed in 1998 to extend the overall dam to the east. The three separate dam segments were joined together with a subsequent raise to elevation 3,561 ft in 2007. In 2011, the upstream toe (centerline raise) and the downstream toe (downstream raise) were extended for a crest elevation of 3,570 ft. Also in 2011, the drainage blanket was re‐constructed and the ditch was extended to connect with the seepage recovery pond west of the Main Dam.
According to the Long Term Deposition Plan, the North Earthfill Dam will continue to be raised using compacted till from 2012 to 2014 to a crest elevation of 3,581 ft.
2.1.4 East Saddle Dam
The East Saddle Dam confines the eastern side of the tailings pond and is located approximately 8.5 km from the mine Plantsite. It is reached via a gravel road from the Plantsite. This dam was initially built in two stages in 1985 and 1986. Figure I‐11 shows the as built plan and section from the initial construction, and also some of the details used in the assessment of a hypothetical breach of the dam (Appendix I). The dam was raised in 2007 and 2008, and has subsequently had annual raises since 2010. The dam was raised in late 2012 to a minimum elevation of 3,572 ft and a height of approximately 90 ft. A plan and cross section of the dam under the current configuration are presented in Figure I‐5.
According to the Long Term Deposition Plan, the dam will be raised annually, to an ultimate crest elevation of El. 3,630 ft (1106.4 m). The ongoing raise of the East Saddle Dam will follow the downstream construction method. Figure I‐6 shows the section of the proposed End of Mine Life (2027) configuration of the East Saddle Dam.
2.1.5 Tailings Pond Water Volume and Level
The tailings pond was at an elevation of approximately 3,559 ft in August 2012. The tailings pond elevation is predicted to rise by 55.9 ft (17.0 m) to the ultimate pond elevation of 3,615 ft (1101.8 m) from 2012 to 2027, while the freewater pond volume is predicted to decrease by 68 Mm3 during the same period. The tailings pond elevation is predicted to increase at an average rate of 4.7 ft (1.4 m) per year from 2013 to 2016, and increase at an average rate of 3.4 ft (1.0 m) per year from 2017 to 2027. Variations in pond water volume and level through the predicted remaining life of the mine are shown on Figure I‐7.
2.1.6 Diversion Ditches
A diversion ditch system is present around the TSF to divert clean surface runoff away from the tailings pond. The diversion ditches are shown on Figure I‐3.
Runoff from the catchment to the north of the TSF is currently intercepted by a diversion ditch and directed towards Cuisson Creek. However, the diversion will be covered by tailings deposition by

Gibraltar Mine Tailings Storage Facility Emergency Preparedness Plan
Page 4
September 2014
2016. After 2016, most of the north catchment will report to the tailings pond. Runoff from the catchment to the south of the TSF is currently intercepted by several diversion ditches and directed away from the tailings facility to Cuisson Creek in the west and Arbuthnot Creek in the east.
2.1.7 Seepage Collection Pond
Seepage flow from the TSF is collected within the seepage return collection pond located to the west and downstream of the Main Dam, as shown on Figure I‐3. The pond is bounded by the walls of the East Cuisson Creek valley and by an earthfill dam originally constructed in 1971. The seepage collection dam was designed and constructed for water retention.
The seepage pond pumphouse is located on the south side of the seepage pond, from where the collected seepage is conveyed to the tailings impoundment by two pipelines. The seepage return pumping system operates automatically throughout the year. Pump control is regulated by pond water levels.
2.1.8 Reclaim Water Reservoir
A Reclaim Water Reservoir was constructed in 2012 to replace the reclaim system. The previous system consisted of an electrical substation, pumphouse barge, return pipeline, and storage tank. The construction program for the new Reclaim Water Reservoir facility involved the excavation and shaping of the reservoir, raising two earthfill dams, placing liner and scour protection layers, building inlet and outlet structures, interceptor ditches, spillway, pipes and auxiliary structures.
The Reclaim Water Reservoir is located south of the TSF, on higher ground.
2.2 Operation, Maintenance and Surveillance of the TSF
The operation, maintenance, and surveillance of the TSF are the responsibility of the Gibraltar Crisis Management Team. This group is comprised of various individuals from the mine site plus the consulting geotechnical engineer. The Manager of Milling acts as the group coordinator and is ultimately responsible to ensure that all aspects of operation, maintenance, and surveillance of the TSF are met.
A table listing members of the Gibraltar Crisis Management Team, their positions, and responsibilities is included under Section 10.
The Operation, Maintenance and Surveillance Manual – Revision 4 (Klohn Crippen Berger Ltd., 2012) details surveillance parameters and schedules for the TSF. The overall objective of surveillance is to identify unusual conditions or deviations from expected performance and to determine appropriate actions for response.

Gibraltar Mine Tailings Storage Facility Emergency Preparedness Plan
Page 5
September 2014
3 AREAS DOWNSTREAM OF TAILINGS STORAGE FACILITY
3.1 Areas Downstream of East Saddle Dam
A plan showing the TSF and downstream areas is presented in Figure I‐9. The East Saddle Dam is located on Arbuthnot Creek. A release from the dam would flow along Arbuthnot Creek, Beedy Creek, Beaver Creek, and Quesnel River, and eventually enter the Fraser River at the City of Quesnel. There is also a low divide along Arbuthnot Creek, approximately 6.5 km downstream of the dam, where water may overflow to the south towards the headwaters of Fredy Creek if the water level rises high enough. This overflow would flow along Fredy Creek, Beedy Creek, and then rejoin the main flow from Arbuthnot Creek and continue onto Beaver Creek and Quesnel River. Quesnel River joins the Fraser River at the City of Quesnel, approximately 91 km downstream from the dam.
KCB has previously carried out a ground and air reconnaissance of the areas downstream of the East Saddle Dam. This was conducted on 12 and 13 October, 2004 as part of the dam break inundation study completed in 2005. The reconnaissance included on the ground examination of the Fraser and Quesnel Rivers in the vicinity of the City of Quesnel, and readily accessible upstream reaches of the Quesnel River up to the confluence of the Quesnel River and Beaver Creek. The air reconnaissance was conducted from a helicopter, which followed a route from the East Saddle Dam down Arbuthnot, Beedy and Beaver Creeks, and then downstream along the Quesnel River to the City of Quesnel. The air reconnaissance also covered the Fraser River for a few kilometres upstream and downstream of the confluence of the Fraser and Quesnel Rivers. Photographs taken during the air reconnaissance are shown in Appendix II.
The area downstream of the East Saddle Dam is mostly unpopulated. The main population centre is at the City of Quesnel, some 90 km downstream of the dam. There are also a number of farm houses and farm buildings in the Sardine Flats (Gravelle Ferry) area along the Quesnel River about 50 km to 55 km downstream of the dam.
TRIM data covering the creek and river system from the TSF to the Fraser River was obtained. The TRIM data was assessed using GIS techniques in combination with observations made in the 2004 ground and air reconnaissance. There are local (small) road crossings on Arbuthnot and Beedy Creeks between the East Saddle Dam and Beaver Creek. These were noted in the 2004 ground and air reconnaissance as consisting of small timber bridges. A typical bridge on local roads is shown in Photo II‐39. The first major road crossing downstream of the dam is on Beaver Creek immediately upstream of the Quesnel River, followed by larger bridges further downstream. The locations of the major river crossings, including road bridges and powerline and pipeline crossings, are shown in Figures I‐9 and I‐10. A brief description of these river crossings is provided below.
Beaver Creek Bridge
The bridge is located on Beaver Creek immediately upstream of the Quesnel River and Beaver Creek confluence. It is a single‐lane steel and concrete structure, approximately 35 m long and 6.5 m high (Photo II‐10). The bridge is supported on two piers in the stream consisting of steel pipes and steel cladding. The bridge abutments consist of bin‐walls.

Gibraltar Mine Tailings Storage Facility Emergency Preparedness Plan
Page 6
September 2014
Gravelle Bridge on Quesnel River
This bridge is located on the Quesnel River in the Sardine Flats area at Gravelle Ferry, about 30 km upstream of the City of Quesnel. This is a single‐lane Bailey bridge with four steel piers in the river (Photos II‐14 to II‐16). The piers have triangular nosings upstream and downstream. The two centre piers also have triangular shaped steel ice breakers on the upstream side. The pier on the left (west) bank has staff gauge markings for measurement of river level at the bridge.
The bridge was being inspected during the October 2004 site visit. According to the inspection crew, the river freezes up almost every year. There had been no discharge problems at the bridge, but the broken ice does tend to jam in the canyon further downstream.
Power Transmission Line Crossing across Quesnel River
A major power transmission line crosses over the Quesnel River approximately 12 km upstream of the Fraser/Quesnel River confluence (Photo II‐20). The towers supporting the line are located on high ground and are not expected to be affected by a flood in the river.
Power Line and Pipeline Crossings across Quesnel River
A power line and a pipeline cross over the Quesnel River near the City of Quesnel’s eastern municipal boundary, approximately 8 km upstream of the Fraser/Quesnel River confluence (Photos II‐21 and II‐22). The footings for the power line and the pipeline support towers appear to be located low enough to be possibly affected by a flood.
Railway Bridge on Quesnel River Upstream of Highway 97
The bridge is located within the City of Quesnel, about 300 m upstream of the Highway 97 crossing. The bridge has four spans supported on single, round concrete piers. The west half of the bridge, which spans the main river channel, has the longest span and consists of a truss section. The bridge also supports a pipeline, about 0.6 m in diameter, strung along the south side of the bridge deck. (Photos II‐25, II‐26 and II‐29).
Highway 97 Bridge on Quesnel River
This is a two‐lane concrete bridge across the Quesnel River. The bridge has four dumb‐bell shaped concrete piers in the river. The bridge deck is relatively high above the river and is not expected to be affected by river flooding (Photos II‐25, II‐30 and II‐32).
Johnston Avenue Bridge on Quesnel River
This is a two‐lane bridge with a steel grating deck. The bridge has three piers in the river with round nosing (Photo II‐33).

Gibraltar Mine Tailings Storage Facility Emergency Preparedness Plan
Page 7
September 2014
Railway Bridge on Quesnel River Upstream of Quesnel/Fraser Confluence
The single‐track bridge is located immediately upstream of the Fraser River / Quesnel River confluence (Photos II‐34 and II‐35). It has two round piers in the river. The road to Johnston Avenue passes under the bridge on the north (right) bank of the Quesnel River.
Carson Avenue Pedestrian Bridge on Fraser River
This is an old truss bridge across the Fraser River, with four 1.5 m wide (approximate) concrete piers in the river. The bridge is currently used as a pedestrian crossing. The bridge deck level is close to the ground level at the left and right abutments. The deck is cambered slightly such that the deck level is higher at mid‐span (Photo II‐36).
Marsh Drive Vehicle Bridge on Fraser River
This is a two‐lane concrete bridge across the Fraser River, with four 1.5 m wide (approximate) piers in the river. It is located upstream of the Fraser/Quesnel confluence. The bridge deck is high above the river and is not expected to be affected by floods. (Photo II‐37).
3.2 Areas Downstream of the Main Dam
The Main Dam is located in the Cuisson Creek catchment which drains towards the west. A description of the areas downstream of the Main Dam is summarized in Table 3.1.
Table 3.1 Areas Downstream of the Main Dam
Location Distance From Dam Crest
(km)
Several access roads <0.5
Seepage collection ditches <0.5
Seepage Recovery Pond, Dam, and Pump House 0.8
Junction of East Cuisson Creek and Cuisson Creek 4.3
Unnamed Lake 4.4
Power Transmission Lines 12.4
BC Railway Line 17.3
Caribou Highway (97) 18.0
Junction of Cuisson Creek and the Fraser River 18.5
The Main Dam and Set‐Back‐Embankment will be maintained at a higher elevation than the East Saddle Dam, so the possibility of overtopping the Main Dam due to flood events is eliminated. With elimination of an overtopping failure mechanism to release the tailings pond (see Appendix I), the downstream influence of a tailings dam flowslide is much more limited. The effects of such a slide would be restricted to the catchment of East Cuisson Creek upstream of its confluence with Cuisson Creek (distance of approximately 4.3 km from the dam toe).
Preliminary review of this downstream area indicates the following infrastructure maybe affected:
seepage collection ditches and pond at the Seepage Collection Dam;

Gibraltar Mine Tailings Storage Facility Emergency Preparedness Plan
Page 8
September 2014
Seepage Pump House No. 6 with associated pipelines and power supply lines; and,
miscellaneous access roads and forestry roads.
Gibraltar Mine reports that there are no permanent inhabitants in this area, but it is used to graze cattle on a semi‐permanent basis.

Gibraltar Mine Tailings Storage Facility Emergency Preparedness Plan
Page 9
September 2014
4 EFFECTS OF INUNDATION
4.1 The Dam Breach and Inundation Study
KCB has completed a dam breach and inundation assessment for the TSF Klohn Crippen Berger 2013). As indicated in Section 2, the Gibraltar tailings impoundment is retained by the East Saddle Dam on the east side and the Main Dam on the west side. Any release from the East Saddle Dam would first flow east into Arbuthnot Creek and then northwards towards Quesnel River, and eventually enter the Fraser River at the City of Quesnel. Any release from the Main Dam would travel west towards East Cuisson Creek. Relevant details of the dam breach and inundation analyses are summarized in the following sub‐sections.
4.2 East Saddle Dam Failure
4.2.1 HEC‐RAS Dam Break and Inundation Model
The dam breach and inundation assessment report (Klohn Crippen 2013) includes a description of the HEC‐RAS modeling undertaken, and the results obtained. In the event of a breach of the East Saddle Dam, the supernatant water, cyclone overflow tailings and some of the cyclone underflow tailings may be released. The HEC‐RAS modeling assumed that all the released material will behave as water.
Two modes of failure were considered for the East Saddle Dam: piping failure and overtopping failure.
A piping failure of a dam is considered to be a “sunny day” failure which is normally assumed to occur when the pond is at its normal operating level. The inundation impacts of a piping failure were estimated assuming a failure would occur concurrent with mean annual flows (MAF) in the downstream river system.
Overtopping of dams typically occurs during large flood inflow conditions, where the pond water level rises high enough to overtop the dam. The TSF is designed to store the 30 day Probable Maximum Flood (PMF). Overtopping is therefore considered unlikely to occur except under extreme flood conditions. Inundation impacts of an overtopping failure were assessed assuming concurrent PMF flows in the downstream river system.
As noted under Section 2.1, the TSF’s long term deposition plan is such that the free water pond size will progressively be reduced, while the height of the East Saddle Dam will increase. To estimate worst case conditions through the remaining life of the TSF, the modeling considered TSF’s current condition, and that at the projected end of the mine’s operational life, in 2027. Figure I‐8 shows the stage‐storage relationships used in the model to represent the current conditions and those at the end of the mine’s life. East Saddle Dam is founded on bedrock, which is expected to limit the breach geometry in the event of a failure. The estimated bedrock location and the assumed breach geometry are shown in Figure I‐11.

Gibraltar Mine Tailings Storage Facility Emergency Preparedness Plan
Page 10
September 2014
4.2.2 Results of HEC‐RAS Model
Figures I‐12 and I‐13 show the estimated breach outflow at the dam and the flood hydrographs at selected points along the flood route for a piping failure; the estimated inundation areas are shown on Figures I‐14, I‐15 and I‐17.
Figures I‐17 and I‐18 show the estimated breach outflow at the dam and the flood hydrographs at selected points along the flood route for an overtopping failure; Figures I‐19, I‐20 and I‐21 show the estimated inundation areas.
Results of the peak breach flow at the dam were compared against empirical relationships. Also, a comparison was made with flood extent mapping produced by the B.C. Ministry of Environment, Lands and Parks (MELP). The comparisons are shown on Figures I‐22 and I‐23, and discussed in more detail in the dam break and inundation report in Appendix I.
4.2.3 Likely Inundation Impacts
GIS assessment of TRIM data was undertaken, to complement information gathered in the 2004 ground and air reconnaissance, and to identify buildings and key infrastructure within the estimated inundation extents. The following is a summary of the likely impacts to key infrastructure and population centres, based on the results of the HEC‐RAS modeling.
The key flood inundation characteristics are presented as Figure I‐24 for piping failure, and Figure I‐25 for overtopping failure. It should be noted that for piping failure, MAF conditions are assumed in the downstream river system at the time of failure, and overtopping failure is assumed to occur with PMF conditions downstream.
Road bridge on Arbuthnot Creek approximately 2.8 km downstream of East Saddle Dam
The bridge deck is quite low and is likely to be washed away. The bridge is near the dam, such that there will be little warning time. A rise in water level of as much as 16.0 m could occur within 1 hour from the start of a breach, and the flood wave is estimated to arrive within about 10 minutes following the start of a breach at the dam. The roads leading to the Arbuthnot Creek crossing will require closing if an advance warning of an impending failure is available.
Buildings on right bank of Fredy Creek downstream of Philemon Lake
Two clusters of buildings, one approximately 2.7 km, and another 6 km downstream of the divide from Arbuthnot Creek fall within the predicted inundation extents. These may include residential properties. There may also be potential flood hazards to recreational users of the lakes along Fredy and Beedy Creeks. The rise in water levels could be as much as 5.6 m, and this would occur in about 1 hour 10 minutes from the start of a breach. It is recommended that these properties immediately downstream receive their warnings directly from Gibraltar Mine as the short travel time will limit effective communication through the local authorities’ emergency responders.

Gibraltar Mine Tailings Storage Facility Emergency Preparedness Plan
Page 11
September 2014
Road crossings along Beedy Creek
Four road crossings along Beedy Creek were identified from available mapping. The roads will likely be impassable following a dam break. Some of the crossings are low level bridges, which are likely to be washed away. As quickly as is practicable, the local road network leading towards Beedy Creek will need to be closed, and motorists in the area warned.
Bridges along lower Arbuthnot Creek
After the flow split with Fredy Creek, there are at least three bridges along Arbuthnot Creek. The first of these is about 9.7 km downstream of the dam. The local road crossings noted during the 2004 site reconnaissance consist of small timber bridges. The bridges are likely to be washed away in the event of flood flows from a dam breach. Flood arrival at the first of the bridges is estimated at about 45 minutes after the start of a breach at the dam. This would give a short warning time. The local road leading to the bridge will need to be closed, and warnings given to motorists in the area.
Beaver Creek Bridge upstream of confluence with Quesnel River
The bridge is a single‐lane steel and concrete structure. At approximately 6.9 m high, the bridge deck is likely to be flooded and be impassable, and it should be closed when a warning of an impending failure is issued.
Buildings on left bank of River Quesnel upstream of Sardine Flats
A set of buildings is located approximately 42.2 km downstream of the dam, and a second set about 3.4 km further downstream. These may include farmhouses. The second set of buildings is located very close to the river and is therefore likely to flood to significant depth, since river water level rises of as much as 5.2 m are expected at this location. There is therefore likely risk to people and extensive damage to property. River water levels would start to rise in about 2 hours 10 minutes, and peak flood levels are expected after approximately 3 hours 15 minutes after the start of a breach. Warning and evacuation from the potentially affected areas should be undertaken.
Sardine Flats area
Sardine Flats is one of the two main population centers along the potential flooding route. Figures I‐15 and I‐20 show estimated inundation extents in the Sardine Flats area. On both the left and right banks, along approximately a 5 km reach, there are a number of buildings within the estimated inundation extent. The majority of these are expected to be residential. The Gravelle Bridge is also likely to be inundated. River water level rises of about 3.3 m, about 4 hours 35 minutes from the start of a breach, and flood arrival within 2 hours 40 minutes after the start of a breach at the dam are estimated. Warning and evacuation from the potentially affected areas should be undertaken.

Gibraltar Mine Tailings Storage Facility Emergency Preparedness Plan
Page 12
September 2014
City of Quesnel
The City of Quesnel is the largest population centre along the river system likely to be impacted by flooding from a breach of the East Saddle Dam. Key infrastructure within the city is discussed under Section 3.1. Figures I‐16 and I‐21 show estimated inundation extents in the City of Quesnel area. Piping failure, assumed to occur under ‘sunny day’ conditions could result in river water level rises of about 2.7 m above the MAF. Flooding along the river is expected to occur. However, from the observations made and photographs taken and in the 2004 reconnaissance (Appendix II), bridge decks appear to be high above the river and the bridges are not expected to be affected by piping failure flood flows.
Overtopping failure is likely to be concurrent with severe flooding conditions, which would affect a considerable part of the city without the impact of a dam breach. A substantial area of the city along the Quesnel River and the Fraser River will be flooded, and will require evacuation. Bridges across the Quesnel and Fraser Rivers will also be flooded in this scenario. Dam breach flows are estimated to cause up to an additional 1.1 m rise in river flood levels over and above the natural PMF. It is estimated that flood levels could start to rise in about 4 hours 50 minutes, and peak flood arrival will be about 8 hours after the start of a breach at the dam.
Table 4.1 and Table 4.2 present inundation characteristics at selected locations downstream of the dam, such as: the estimated peak flood level caused by the release of water at the East Saddle Dam; the estimated water level without a dam breach; the rise in water level resulting from the breach flood flows; the time to reach peak water level from the start of dam breach; and the travel time of the peak from the dam.

Gibraltar Mine Tailings Storage Facility Emergency Preparedness Plan
Page 13
September 2014
Table 4.1 Inundation Characteristics at Selected Locations – Piping
Location
Distance d/s of Dam (km)
Estimated Flood Level for MAF only
without Dam
Breach (m)
Peak Flow following a Breach including the MAF
(m3/s)
Peak Flood Level, Breach plus MAF Flows
(m)
Estimated Rise in Water Level above MAF
(m)
Estimated Time for Arrival of Flood from Start of Breach
(hr min)
Time to Peak Flood Level from Start of Breach
(hr min)
Travel Time of Peak Flood Level from the Dam
(hr min)
Current (2012 ‐ 2013)
End of Mine Life (2027)
Current (2012 ‐ 2013)
End of Mine Life (2027)
Current (2012 ‐ 2013)
End of Mine Life (2027)
Current (2012 ‐ 2013)
End of Mine Life (2027)
Current (2012 ‐ 2013)
End of Mine Life (2027)
Current (2012 ‐ 2013)
End of Mine Life (2027)
East Saddle Dam 0 1062.6 4800 10600 1074.3 1079.1 11.7 16.5 ‐ ‐ 1hr 50min 50min ‐ ‐
Bridge at upper Arbuthnot Creek 4.9 933.6 4700 10100 941.1 944.7 7.5 11.1 35min 25min 2hr 00min 1hr 00min 10min 10min
Buildings immediately downstream of Philemon Lake 9.8 832.5 440 1490 835.1 836.6 2.6 4.2 1hr 40min 1hr 00min 2hr 35min 1hr 15min 45min 20min
First Bridge on lower Arbuthnot Creek 9.7 832.8 3940 6880 840.6 841.9 7.8 9.1 1hr 40min 45min 2hr 20min 1hr 15min 30min 20min
Beaver Creek bridge u/s of confluence with Quesnel River
33.1 579.0 3310 4230 585.3 586.0 6.2 6.9 3hr 10min 2hr 20min 3hr 50min 2hr 40min 2hr 00min 1hr 55min
Buildings upstream of Sardine Flats 42.4 560.9 3080 3130 566.0 566.1 5.2 5.2 3hr 50min 2hr 50min 5hr 05min 3hr 45min 3hr 15min 2hr 55min
Sardine Flats area 51.2 541.4 2740 2400 544.8 544.5 3.3 3.1 4hr 50min 3hr 50min 6hr 30min 5hr 10min 4hr 40min 4hr 20min
Gravelle Bridge at Sardine Flats 52.2 541.3 2740 2400 544.4 544.2 3.1 2.9 4hr 50min 3hr 50min 6hr 30min 5hr 10min 4hr 40min 4hr 20min
Pipeline crossing u/s of City of Quesnel 82.2 484.8 2080 1570 488.9 488.1 4.1 3.3 8hr 40min 7hr 30min 11hr 10min 9hr 50min 9hr 20min 9hr 00min
Railway Bridge u/s of Highway 97 at Quesnel 87.5 476.7 2080 1550 479.5 478.8 2.7 2.1 9hr 10min 8hr 10min 11hr 30min 10hr 20min 9hr 40min 9hr 30min
Quesnel and Fraser River confluence 90.2 473.4 1960 1450 475.4 474.8 2.0 1.4 9hr 40min 8hr 40min 12hr 45min 11hr 20min 10hr 55min 10hr 30min
Fraser River, 4km downstream of confluence 94.7 470.7 3000 2470 472.5 472.1 1.8 1.3 10hr 00min 9hr 00min 13hr 10min 11hr 45min 11hr 20min 10hr 55min
Table 4.2 Inundation Characteristics at Selected Locations – Overtopping
Location
Distance d/s of Dam (km)
Estimated Flood Level for PMF only
without Dam
without Breach (m)
Peak Flow following a Breach including the PMF
(m3/s)
Peak Flood Level, Breach plus PMF Flows
(m)
Estimated Rise in Water Level above PMF
(m)
Estimated Time for Arrival of Flood from Start of Breach
(hr min)
Time to Peak Flood Level from Start of Breach
(hr min)
Travel Time of Peak Flood Level from the Dam
(hr min)
Current (2012 ‐ 2013)
End of Mine Life (2027)
Current (2012 ‐ 2013)
End of Mine Life (2027)
Current (2012 ‐ 2013)
End of Mine Life (2027)
Current (2012 ‐ 2013)
End of Mine Life (2027)
Current (2012 ‐ 2013)
End of Mine Life (2027)
Current (2012 ‐ 2013)
End of Mine Life (2027)
East Saddle Dam 0 1062.6 7900 16200 1077.2 1082.5 14.7 20.0 ‐ ‐ 1hr 50min 50min ‐ ‐
Bridge at upper Arbuthnot Creek 4.9 933.6 7800 16200 943.1 949.6 9.4 16.0 15min 15min 1hr 55min 55min 10min 10min
Buildings immediately downstream of Philemon Lake 9.8 832.5 1200 3700 836.3 838.1 3.8 5.6 1hr 40min 55min 2hr 20 min 1hr 10min 35min 20min
First Bridge on lower Arbuthnot Creek 9.7 832.8 6090 10200 841.6 843.1 8.8 10.3 55min 45min 2hr 15 min 1hr 10min 30min 20min
Beaver Creek bridge u/s of confluence with Quesnel River
33.1 579.0 6000 7240 588.6 589.3 3.7 4.4 2hr 50min 1hr 55min 3hr 40min 2hr 30min 1hr 50min 1hr 40min
Buildings upstream of Sardine Flats 42.4 560.9 12500 12700 573.5 573.6 2.7 2.8 3hr 10min 2hr 10min 4hr 35min 3hr 15min 2hr 50min 2hr 30min
Sardine Flats area 51.2 541.4 11050 10600 550.0 549.7 1.9 1.5 3hr 40min 2hr 40min 6hr 35min 4hr 35min 4hr 50min 3hr 45min
Gravelle Bridge at Sardine Flats 52.2 547.8 11000 10600 549.8 549.5 2.0 1.6 3hr 40min 2hr 40min 6hr 40min 4hr 40min 4hr 55min 3hr 50min
Pipeline crossing u/s of Quesnel 82.2 496.3 10700 10100 497.7 497.3 1.4 1.0 5hr 00min 4hr 00min 9hr 25min 7hr 15min 7hr 40min 6hr 30min
Railway Bridge u/s of Highway 97 at Quesnel 87.5 494.5 10500 9800 495.6 495.2 1.1 0.8 5hr 30min 4hr 50min 10hr 15min 8hr 10min 8hr 25min 7hr 20min
Quesnel and Fraser River confluence 90.2 494.4 10500 9800 495.4 495.1 1.1 0.7 5hr 40min 5hr 00min 10hr 20min 8hr 10min 8hr 35min 7hr 20min
Fraser River, 4km downstream of confluence 94.7 490.4 39950 39300 491.5 491.1 1.1 0.7 5hr 40min 5hr 00min 10hr 25min 8hr 15min 8hr 40min 7hr 30min

Gibraltar Mine Tailings Storage Facility Emergency Preparedness Plan
Page 14
September 2014
4.3 Main Dam Failure
The Main Dam is currently maintained at a higher elevation than the East Saddle Dam. When construction of the Step‐Back Embankment starts, from 2013, its elevation will be maintained higher than the East Saddle Dam. Therefore, the possibility of overtopping the Main Dam due to flood events is eliminated.
In the absence of an overtopping failure mechanism for the Main Dam, a liquefaction flowslide induced by an extreme earthquake is considered to be the worst case scenario for dam stability.
A 2‐D run‐out assessment using DAN‐W was conducted for 3 scenarios and is summarised in Figure 1‐26. Figure I‐27 shows the plan of the Cycloned Sand Dam, and the cross‐section that was used in the DAN‐W analysis. A total of five rheological models were run in order to estimate the debris flow run‐out pattern. These cases are described below, and the model parameters and results are summarized in Table 4.3 and are based on the model parameters utilized in the KCB 2012 Long‐Term Tailings Deposition Plan (KCB, 2012):
Run‐out Scenario 1 – This case represents an upper‐bound liquefied basal strength, based on the estimated Post‐Earthquake strengths presented in the 2005 Inundation Study Report (KCB). In that report, a generalized ratio between residual strength and effective stress was
found to be approximately Sr/vo’ = 0.15, based on correlations to SPT‐blow counts.
Run‐out Scenario 2 – This case represents a lower‐bound liquefied basal strength, based on
the estimated Post‐Earthquake strengths (Sr/vo’ = 0.10) presented in the 2012 Long‐Term Deposition Plan (KCB) for “Existing Tailings – Section B”. Note that this tailings beach value was applied to the entire Cyclone Sand Dam foundation.
Run‐out Scenario 3 – This case represents an extreme lower‐bound liquefied basal strength
(Sr/vo’ = 0.06), based on the weakest tailings area near the North Earthfill Dam presented in the 2012 Long‐Term Deposition Plan (KCB) for “Existing Tailings – Section D”. Note that this strength value was taken from an area located about 6,000 ft away from the dam cross‐section used in the model.
As the latest build of DAN‐W does not allow for the input of strength ratios in this format, the equivalent friction angle was used.
Table 4.3 Model Rheological Input Parameters and 2‐D Model Analysis Results
Run‐out Scenario
Condition Model Strength
Parameters, Equivalent
Sr/vo’
Runout Distance, L
(ft)
Equilibrium Slope
1 “Upper Bound Basal Strength” 8.5o 0.15 90 ft. 2.7H:1V
2 “Lower Bound Basal Strength” 5.7o 0.10 390 ft. 4.0H:1V
3 “Extreme Lower Bound Basal Strength” 3.4o 0.06 1145 ft. 8.0H:1V

Gibraltar Mine Tailings Storage Facility Emergency Preparedness Plan
Page 15
September 2014
For all run‐out scenarios, the assumed unit weight of the slide mass is assumed to be 19.3 kN/m3, as used in previous analysis, and the inter‐slice friction angle used in the analysis is assumed to equal 32o, equal to the static friction angle. This value is slightly below the “default value” as noted in the documentation for DAN‐W (O. Hungr Geotechnical Research, 2003); however, as noted in that text, “generally, the model is not sensitive to [this parameter]”.
The extreme lower bound scenario indicates a run‐out of approximately 1,150 ft. This run‐out would impact the Seepage Recovery Pond located 1,100 ft downstream of the tailings dam toe, but would not reach the Seepage Recovery Dam, which is located 1,600 ft downstream of the tailings dam toe. The back‐scarp would extend approximately 1,150 ft into the tailings beach, but the current tailings pond would still be 1,000 ft away from the back‐scarp. This confirms that the possibility for release of the tailings pond is remote.
The tailings pond would be pushed to approximately 10,000 ft away from Main Dam crest by the end of operations. As a result, the potential for release of the tailings pond reduces further with the development of the tailings facility.

Gibraltar Mine Tailings Storage Facility Emergency Preparedness Plan
Page 16
September 2014
5 OVERVIEW OF EMERGENCY RESPONSE
5.1 Overview of Responsibilities
Gibraltar Mines is responsible for co‐ordination of emergency response at the site, issuing alerts to off‐site agencies, and advising disaster service organizations of the actual or expected magnitude and progress of flooding. For emergencies such as a tailings dam failure, the Provincial Emergency Program (PEP) is notified. PEP and the Cariboo Regional District will take over command of the emergency and will notify residents according to their policies and procedures. Gibraltar Mines will assist as required. This level of emergency will be considered a crisis by the company and any further communications (i.e., media, regulators, residents, public) will be guided by the Taseko Mines Corporate Crisis Communications Team and the Gibraltar Crisis Management Team. Gibraltar Mines will respond to an emergency of the Gibraltar TSF dams using primarily their own or contracted resources. This will involve undertaking preventative and mitigating measures that are feasible.
This plan is based upon discussions with provincial government agencies, local authorities and companies that provide emergency services. It involves informing members of the general public who could be affected by such an emergency and adjusting plans according to the feedback received.
The PEP co‐ordinates emergency operations of the response teams from government agencies, and also provides advice to local municipal emergency response organizations. PEP regional office representatives will travel to municipality and company emergency operations centres when deemed necessary.
Local Emergency Operations Centres of each municipality are responsible for co‐ordinating and activating the emergency response plans for their community.
During an emergency, each of these agencies will need to interact, exchange information and co‐ordinate their operations.
5.2 Overview of Organizational Structure
The major components for an emergency response at the Gibraltar TSF are described below:
Gibraltar Crisis Management Team oversees the operation, maintenance and surveillance of the TSF, and is responsible for identifying a situation as being an emergency. In an emergency, the Gibraltar Crisis Coordinator and Gibraltar Crisis Control Centre will be comprised of members from this group.
Gibraltar Crisis Management Team will establish the Gibraltar Crisis Control Centre to monitor and assess the emergency and implement any mitigation works. Also, the Gibraltar Crisis Control Centre will liaise with outside agencies, where required.
Gibraltar Crisis Coordinator directs communications and all technical activities during an emergency.

Gibraltar Mine Tailings Storage Facility Emergency Preparedness Plan
Page 17
September 2014
Gibraltar Crisis Control Centre is responsible for monitoring, assessments, and mitigation works.
Gibraltar Crisis Control Centre is responsible for communications with populations at risk in the vicinity of the TSF, and with outside agencies. The PEP Emergency Coordination Centre, located in Victoria, will manage the effects of the emergency, at the provincial government level.
PEP Emergency Coordination Centre collects and collates information on the situation at the dam‐site, issues forecasts of how and when the flood wave will impact downstream areas, answers inquiries on the effects of possible inundation and how damage might be mitigated, and gives the PEP’s perspective of the emergency to the media. Depending on the circumstances and if time permits, PEP may open a Provincial Regional Emergency Operations Centre (PREOC) in Prince George to assist with some of the above tasks.
City of Quesnel Emergency Operations Centre manages the effects of the emergency at the local level for its municipality.
Cariboo Regional District manages the effects of the emergency in any areas impacted outside the mine and the City of Quesnel.
Media Rooms set up at the Gibraltar Mine offices in Williams Lake or Vancouver, and at the (PREOC) and the City of Quesnel Emergency Operations Centre will manage the rapid response to public inquiries and the rapid release of accurate information to the public.
Major emergency responders will send representatives to the appropriate operations and public media access rooms to:
Provide their specialized expertise, skills and abilities.
Provide emergency access to their employer's resources (staff, equipment, expertise, information collection capabilities, communications capabilities, search and rescue capabilities, etc.).
Provide emergency operations staff in the field who will:
perform the specific duties assigned to them by this Emergency Preparedness Plan (EPP) or by the more detailed emergency response plan their organization may have prepared in compliance with this EPP; and,
keep the Gibraltar Crisis Control Centre fully informed of the situation downstream of the Gibraltar TSF, the deployment of personnel and equipment, and the actions which were taken or are being taken. Report instances of people or animals in need of rescue to the relevant Municipal EOC.

Gibraltar Mine Tailings Storage Facility Emergency Preparedness Plan
Page 18
September 2014
5.3 Standards and Conventions
5.3.1 Communications, Conventions and Procedures
Key emergency responders should follow the following conventions and standards to ensure that emergency response operations flow smoothly:
Voice Message Backup Procedures:
If contacted by someone not personally known, verify the identity of the contact by returning the call. At the same time verify the content of the message.
Use faxes and/or emails to verify verbal message content where there is time.
Communications Logging Procedures:
Each party will log all communications between agencies and Emergency Operations Centres.
5.3.2 Media Release Procedures
The news media can play a very crucial role in relaying information to the public regarding an emergency situation at the Gibraltar TSF. In general, emergency announcements through the local media will be the responsibility of PEP, the RCMP and/or local officials. Gibraltar’s Crisis Coordinator will be the main Gibraltar Mines contact for the media and public officials.

Gibraltar Mine Tailings Storage Facility Emergency Preparedness Plan
Page 19
September 2014
6 HAZARDOUS CONDITIONS
6.1 Unusual Occurrences
Conditions, accidents or events occurring at the Gibraltar TSF which may have implications to dam safety have been categorized into potential dam safety problems, and other types of emergency situations which do not threaten the safety of the dam.
The Operation, Maintenance and Surveillance (OMS) Manual for the Gibraltar TSF (KCB, 2012) lists occurrences which would trigger an alert. These include:
flooding causing an excessive rise in pond levels;
failure of any of the diversion ditches;
a seismic event;
abnormally high piezometric levels in the dams;
settlement, cracks or slumping in the dams;
sinkholes along any slope of the dams;
sinkholes in the tailings beach or tailings Step‐Back Embankment;
slope failure of any dam slope;
abnormal seepage flows from any dam slope;
increased or contaminated flow from the finger drains or relief wells;
sabotage or other criminal activity; and,
damage to any component of the TSF.
In accordance with the OMS Manual, Gibraltar employees are expected to continually monitor regular operations, dam raising activities, environmental performance, overall structural integrity and site safety. Should any of the above events occur, they should be immediately reported to the mine management and be addressed by the Gibraltar Crisis Management Team.
6.2 Actions to Stabilize Dams
The OMS Manual also presents general approaches for stabilizing the tailings dams during an emergency situation. Specific actions to stabilize the tailings dams during an emergency response will be developed and directed by the Gibraltar Crisis Control Centre.

Gibraltar Mine Tailings Storage Facility Emergency Preparedness Plan
Page 20
September 2014
A dam breach could be triggered by piping or overtopping. It is difficult to predict where a breach would be initiated and precisely what corrective actions would be required. Nevertheless, to assist the mine in dealing with emergency situations threatening the dams at the Gibraltar TSF, this section outlines potential courses of action that could be taken promptly to stabilize the dam. These actions could be summarized as:
stop tailings discharge;
lower the tailings pond level;
place filter sand material that will arrest or retard dam internal erosion;
place sand and gravel material that will arrest or retard dam external erosion; and,
rearrange spigotting locations.

Gibraltar Mine Tailings Storage Facility Emergency Preparedness Plan
Page 21
September 2014
7 EMERGENCY RESPONSE
7.1 Initial Response
The Gibraltar Mine TSF OMS Manual (KCB, 2012) contains procedures on surveillance and the reporting of unusual occurrences. Geotechnical and visual inspections are undertaken to confirm that the construction and performance of the tailings dam meets the design requirements. All Gibraltar tailings and water management personnel are expected to immediately report to mine management, any suspect or unusual conditions at this facility. Upon detection of an unusual occurrence, this should be reported immediately to mine management, and the Gibraltar Crisis Management Team notified. Following notification of an unusual occurrence, the Gibraltar Crisis Management Team will meet to confirm the occurrence and decide on the alert classification of the situation. If the trigger occurrence is confirmed, then the Gibraltar Crisis Coordinator will assume responsibility for managing the emergency situation.
Potential danger to the safety of the TSF, and/or the downstream infrastructure and population are expressed as three levels of alert:
Yellow Alert – an unusual occurrence had occurred.
Amber Alert – a dam is unstable but breach is not imminent.
Red Alert – a dam breach is imminent or has occurred.
Procedural guidelines and notification systems have been established which are dependent on the declared alert level. Notification flow charts for the three alert levels are presented in Figure 7.1.

G
F
F
Gibraltar Mine
For contact info
Figure 7.1 A
ormation see th
Alert Notificatio
he Section 10 ‐ C
on Flow Chart
Communication
ns Directory
Tailinngs Storage Facilitty Emergency Pre
eparedness Plan
Page 22
September 2014

Gibraltar Mine Tailings Storage Facility Emergency Preparedness Plan
Page 23
September 2014
7.2 Yellow Alert
7.2.1 General
Yellow Alert signifies that an unusual occurrence has occurred, but the dam is stable and not at risk of imminent failure. This alert level does not pose a hazard to people at the dam or to downstream populations at risk at the time of observation. The occurrence is to be monitored, and mitigation should be undertaken to bring the situation to below trigger levels. Yellow Alert involves procedures and activities primarily internal to Gibraltar Mine. Any event classified under the Yellow Alert will be considered to be such that it can be managed and controlled by Gibraltar Mine, with no negative impacts downstream.
Populations at risk and outside agencies will not be notified during the Yellow Alert. As a result, only the Gibraltar Crisis Coordinator and the Gibraltar Crisis Control Center will be active during a Yellow Alert.
7.2.2 Gibraltar Crisis Coordinator
The Gibraltar Emergency Coordinator will take the following actions:
decide when to set up and provide staff, security, and logistical support to the Crisis Control Centre;
decide with the Crisis Control Centre when the Yellow Alert could be removed; and,
Summarize and incorporate the Yellow Alert in the annual tailings dam safety report.
7.2.3 Gibraltar Crisis Control Centre
Gibraltar Mine staff assigned to the Crisis Control Centre will be responsible for the following:
Monitor, interpret and report technical data on the problem to the Gibraltar Crisis Coordinator.
Use manpower, equipment and materials where feasible to minimize the likelihood of damage and/or dam failure, and to take measures that would stabilize the dam. Measures to stabilize the dam are outlined in Section 6.2.
Control access to the TSF so that unauthorized visitors do not interfere with emergency operations personnel nor create additional public safety problems.
7.3 Amber Alert
7.3.1 General
Amber Alert signifies that the dam is unstable but failure is not imminent. Dam instability may be identified at the time of the triggering occurrence, or while monitoring during a Yellow Alert.

Gibraltar Mine Tailings Storage Facility Emergency Preparedness Plan
Page 24
September 2014
Declaration of an Amber Alert means that relevant agencies and populations at risk must be notified and placed on standby status. The populations at risk should be prepared to evacuate areas potentially impacted by flood or tailings runout. Amber Alert also means that conditions could worsen leading to an evacuation (Red) alert.
7.3.2 Gibraltar Crisis Coordinator
The Gibraltar Crisis Coordinator, will take the following actions:
Establish the Gibraltar Crisis Control Centre and provide staff, security, and logistical support. Gibraltar Crisis Control Centre to act as a point‐of‐contact to manage the collection, collation and distribution of information at the local level on the potential downstream flooding situation.
Issue Amber Alert warning through the Crisis Control Centre for potential dam breach. Include information on what areas will be impacted, the nature of the impact, when the impact will occur, and instructions on what the populations at risk should and should not do.
Analyze alternative operational strategies to minimize increases in downstream flows (priority #1) and downstream flooding (priority #2).
Decide with the Crisis Control Centre when to issue an "all clear" notification if the risk of dam breach has passed without incident.
Decide when to issue a Red Alert if the emergency situation worsens.
7.3.3 Gibraltar Crisis Control Centre
Gibraltar Mine staff assigned to the Crisis Control Centre will take the following actions:
Assess if a dam breach is likely to occur.
Estimate when the dam breach could occur.
Determine which areas would be impacted by the runout or inundation.
Report all monitoring data, assessments, and technical information to the Crisis Coordinator.
Without comprising safety of staff, assess and implement possible measures to halt or impede the breach. Some measures which could be taken are broadly outlined in Section 6.2.
Provide security and control access to:
the TSF;
instrument reading sites; and,
associated access corridors (roads and footpaths).
In case of exceptional physical circumstances at the damsite(s), Gibraltar Mines will have procedures in place for dealing with darkness during an emergency, and procedures for dealing with adverse weather conditions during an emergency.

Gibraltar Mine Tailings Storage Facility Emergency Preparedness Plan
Page 25
September 2014
Direct a search for any visitors in the vicinity of the TSF who should be escorted to safety.
Collect and collate information received. This will include: summaries and/or interpretations of instrument readings; forecasts of reservoir storage and outflows; and forecasts of the likelihood of dam failure.
Issue a standby for evacuation alert. Include information on what areas may be impacted and the nature of the impact.
The alert should go to the PEP, local municipalities and regional district, Ministry of Transportation and Infrastructure (MoT), CN Rail, RCMP, and nearby populations at risk. Gibraltar Mines keeps an up‐to‐date list of primary contacts that staff would have to notify and alternates who may have to be notified if any primary contacts are missed.
Establish Media Rooms to facilitate the distribution and collection of information.
7.3.4 Provincial Emergency Program (PEP)
The PEP personnel will take the following actions:
notify residents according to their policies and procedures;
assist the Gibraltar Crisis Control Centre with the public communications process during the emergency;
co‐ordinate air‐borne operations through Provincial Emergency Program Air (PEP Air), if required; and,
co‐ordinate the procurement of additional resources to assist and support the emergency response efforts.
7.3.5 Ministry of Transportation and Infrastructure (MoT)
Each District and Area office potentially affected will be on standby to take the following actions:
close, on a priority basis, primary and secondary roads and bridges under their jurisdiction, which are or will be inundated;
re‐route non‐local highway traffic; and,
assess the safety of surviving bridges for relief operations and re‐open where feasible on a priority basis.
7.3.6 CN Rail
CN Rail will be on standby to evacuate and secure its rail yard on the bank of the Quesnel River in the City of Quesnel. CN rail will also be on standby to close the following bridges:
the railway bridge on Quesnel River upstream of Highway 97; and,
the railway bridge on Quesnel River upstream of the Quesnel River and Fraser River confluence.
Gibraltar Mine Tailings Storage Facility Emergency Preparedness Plan
Page 26
September 2014
7.3.7 Local Authorities
Each local authority will be on standby to take the following actions:
set up its Municipal Emergency Operations Centre from which to manage the local municipal response to the emergency;
alert emergency services personnel within its jurisdiction;
evacuate downstream residents, farmers and ranchers close to the dam(s) and along the flood route, if deemed necessary;
make public safety announcements on local radio and television stations;
alert utility companies with facilities that may be disrupted; and,
alert Public Health Officials.
7.3.8 RCMP
Police forces will take the following actions:
visit local residents, business owners, farmers and ranchers within the limited warning area who cannot be contacted by local authorities; and,
if required, provide a RCMP representative to the Gibraltar Crisis Control Centre for facilitating communications with RCMP detachments involved in emergency operations in the vicinity of the TSF.
7.4 Red Alert
7.4.1 General
Red Alert signifies that dam failure is imminent or has occurred. Imminent dam failure may be identified initially, or while monitoring during an Amber or Yellow Alert. For this alert level, major structural damage to one or more of the Gibraltar TSF dams has occurred, or the physical condition of the dam has deteriorated such that stabilization is not possible and the dam will fail.
The responsible agencies need to initiate evacuation of populations at risk.
A Red Alert may develop from such things as an unusually high pond water level; uncontrolled piping through the dam or its foundation; or slumping and continuing deterioration of the scarp of the slump. A declaration of a Red Alert and the implementation of an evacuation plan do not mean that attempts to save the dam should be abandoned. Any emergency repair that has some potential to avert, delay or retard the rate of failure should be undertaken.
7.4.2 Gibraltar Crisis Coordinator
The Gibraltar Crisis Coordinator, will take the following actions:
Verify and initially evaluate reports of problems at the dam(s).

Gibraltar Mine Tailings Storage Facility Emergency Preparedness Plan
Page 27
September 2014
Establish the Gibraltar Crisis Control Centre and provide staff, security, and logistical support.
Gibraltar Crisis Control Centre to act as a point‐of‐contact to manage the collection, collation and distribution of information at the local level on the potential downstream flooding situation.
Issue alert for immediate evacuation through the Crisis Control Centre. Include information on what areas will be impacted, the nature of the impact, when the impact will occur, and instructions on what the populations at risk should and should not do.
Issue updates regarding status of the dam(s) periodically through the Crisis Control Centre.
7.4.3 Gibraltar Crisis Control Centre
Gibraltar Mine staff assigned to the Crisis Control Centre will be responsible for the following:
Estimate when the dam breach would occur.
Determine which areas would be impacted by the runout or inundation.
Estimate when the flood wave would be expected.
Monitor, interpret and report technical data on status of breach.
Report all monitoring data, assessments, and technical information to the Crisis Coordinator.
Without comprising safety of staff, assess and implement possible measures to halt or impede the breach.
Provide security and control access to:
the TSF;
instrument reading sites; and,
associated access corridors (roads and footpaths).
Issue alert for immediate evacuation. Include information on what areas would be impacted, the nature of the impact, and when the impact will occur.
Collect and collate information on the developing emergency. Before the dam breach starts to develop this would include: summaries and/or interpretations of instrument readings; forecasts of reservoir storage and outflows; and forecasts of the time of dam failure. After the dam breach starts to develop this would include: summaries and/or interpretations of changes in reservoir levels; and the magnitude and rate of development of the dam breach.
The alert should go to the PEP, local municipalities and regional district, MoT, CN Rail, RCMP, media, and nearby populations at risk on up‐to‐date information on the situation at the TSF. Gibraltar Mines keeps an up‐to‐date list of primary contacts that staff would have to notify and alternates who may have to be notified if any primary contacts are missed.
At earliest convenience, establish Media Rooms to facilitate the distribution and collecting of information.

Gibraltar Mine Tailings Storage Facility Emergency Preparedness Plan
Page 28
September 2014
Collect and collate information on downstream flooding (rate of rise in water level, time of flood wave arrival and flood wave peak) from local authorities, police, search and rescue aircraft, local residents, and water survey personnel.
Although municipal authorities and the RCMP have primary responsibility for rescue, the Crisis Control Centre may assist in the following ways:
warn isolated local residents, farmers, ranchers and staff close to the dam of the potential breach;
assist with search and rescue;
conduct aerial reconnaissance; and,
obtain and utilize helicopters and fixed‐wing aircraft for both day time and night time flying to monitor the progress of the flood wave.
7.4.4 Provincial Emergency Program
The PEP personnel will take the following actions:
Notify residents according to their policies and procedures.
Co‐ordinate the relief efforts downstream of the dam.
Assist Gibraltar Mines with the public communications process during the emergency.
Co‐ordinate emergency radio communications through Provincial Emergency Radio Communications Service (PERCS), if required.
Co‐ordinate air‐borne operations through PEP Air, if required.
Decide whether to activate the Provincial Regional Emergency Operations Centre (PREOC) in Prince George.
Staff and support the PREOC, if activated, to:
collect, collate and assess the information provided by the Gibraltar Crisis Control Centre;
brief senior government officials on the emergency situation;
co‐ordinate the response of senior government officials;
send senior government policy directives, information requests and unusual authorizations to the other Emergency Control Centres that may have been established by the Local Authorities; and,
facilitate requests from the public and media to have access to senior government officials.
Request the assistance of federal resources, if necessary.
Procure outside resources when requested by Local Authorities.

Gibraltar Mine Tailings Storage Facility Emergency Preparedness Plan
Page 29
September 2014
7.4.5 Ministry of Transportation and Infrastructure (MoT)
Each District and Area office affected will take the following actions:
close, on a priority basis, primary and secondary roads and bridges under their jurisdiction, which are or will be inundated;
re‐route non‐local highway traffic; and,
assess the safety of surviving bridges for relief operations and re‐open where feasible on a priority basis.
7.4.6 CN Rail
CN Rail will evacuate and secure its rail yard on the bank of the Quesnel River in the City of Quesnel. CN Rail will also monitor river flood levels, and close as appropriate, the following bridges:
the railway bridge on Quesnel River upstream of Highway 97; and,
the railway bridge on Quesnel River upstream of the Quesnel River and Fraser River confluence.
7.4.7 Local Authorities
Each local authority will take the following actions:
set up its Municipal Emergency Operations Centre from which to manage the local emergency response;
alert and/or evacuate downstream residents, visitors, businesses, farmers and ranchers based on information provided by the Gibraltar Crisis Control Centre, and inundation maps or predicted flood elevations;
monitor the progress in notifying local residents, visitors, businesses, farmers and ranchers, and clear unsuccessful phone contacts with site visits (by road or air);
alert emergency services personnel under its jurisdiction;
rescue residents, visitors, businesses, farmers and ranchers in conjunction with emergency workers in its jurisdiction;
monitor the evacuation of all downstream residents, visitors, businesses, farmers and ranchers in its jurisdiction;
determine the status and location of downstream residents, visitors, farmers and ranchers in the aftermath;
declare a state of local emergency, if necessary;
make public safety announcements on local radio and television stations;
alert utility companies with facilities that may be disrupted;
alert public health officials;

Gibraltar Mine Tailings Storage Facility Emergency Preparedness Plan
Page 30
September 2014
alert District Agriculturists;
monitor Quesnel River intakes and sewage lagoons that could be affected;
provide emergency social services within its district boundaries; and,
co‐ordinate air‐borne operations over the floodpath, if required.
7.4.8 RCMP
The police force will take the following actions:
assist local authorities in evacuation;
visit local residents, visitors, businesses, farmers and ranchers with whom local authorities cannot communicate;
provide a representative to the Gibraltar Crisis Control Centre for facilitating communications with RCMP detachments and involved in emergency operations below the dam;
provide supplemental radio communications from emergency locations and/or the dam as necessary if the telephones are inoperative or unavailable;
aid in closing roads and bridges. The RCMP shall on their own authority close roads as required; and,
provide security to areas that have been evacuated.
7.4.9 Media
The media will take the following actions:
send reporters and/or news teams to the Media Rooms in the Crisis Control Centre and Municipal Emergency Operations Centres to obtain accurate information about the emergency;
relay information about the nature of the emergency to the general public; and,
rapidly relay, as a public service, public safety and emergency measures announcements on the radio and TV.

Gibraltar Mine Tailings Storage Facility Emergency Preparedness Plan
Page 31
September 2014
8 CONSTRUCTION MATERIALS, EQUIPMENT, LABOUR AND ENGINEERING RESOURCES
Response procedures for this plan involve repairs to the tailings dams, and/or measures to alleviate potential flooding downstream from the TSF. Thus, access to construction materials, equipment, emergency power sources, labour and engineering expertise is required. The Crisis Control Centre will identify equipment requirements for emergency works that need to be undertaken. Gibraltar Mine’s equipment on‐site will be made available to the Crisis Control Centre. The Crisis Control Centre will procure equipment from off‐site suppliers, if required.
A list of equipment available onsite is presented in Table 8.1, and names and contact numbers for off‐site service and equipment suppliers and contractors is presented in Table 8.2. Contact information for engineering resources is presented in the Communications Directory under Gibraltar Crisis Management Team.
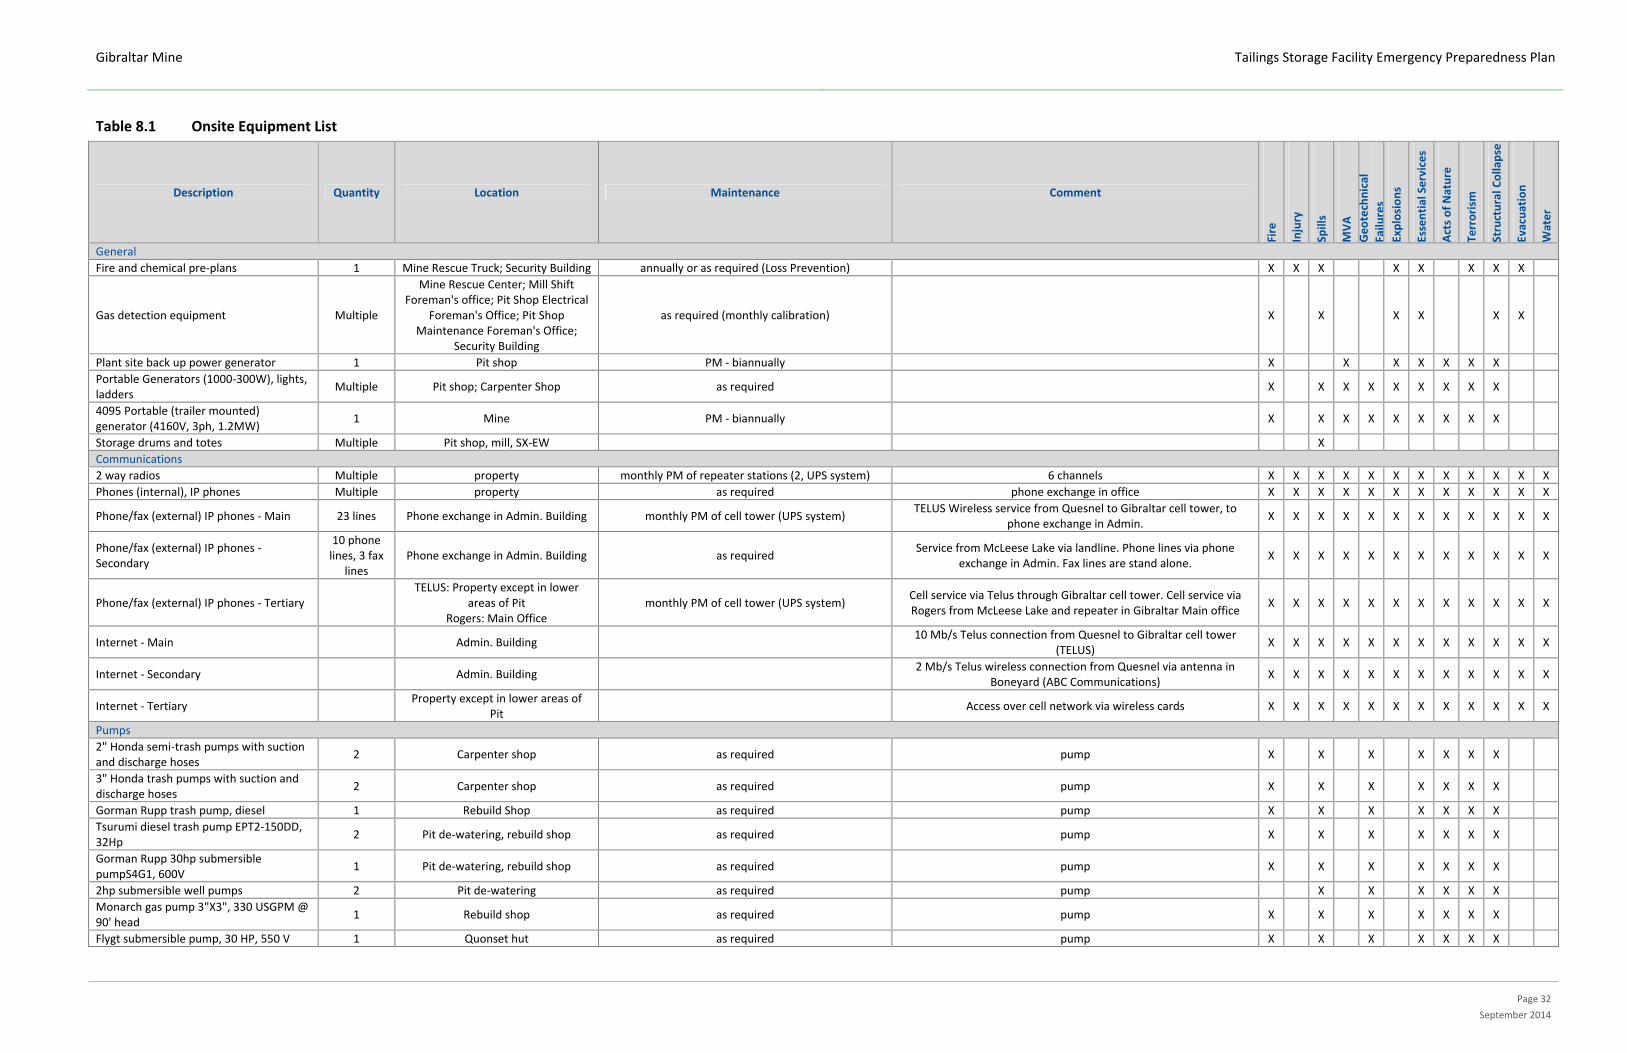
Gibraltar Mine Tailings Storage Facility Emergency Preparedness Plan
Page 32
September 2014
Table 8.1 Onsite Equipment List
Description Quantity Location Maintenance Comment
Fire
Injury
Spills
MVA
Geotechnical
Failu
res
Explosions
Essential Services
Acts of Nature
Terrorism
Structural Collapse
Evacuation
Water
General
Fire and chemical pre‐plans 1 Mine Rescue Truck; Security Building annually or as required (Loss Prevention) X X X X X X X X
Gas detection equipment Multiple
Mine Rescue Center; Mill Shift Foreman's office; Pit Shop Electrical
Foreman's Office; Pit Shop Maintenance Foreman's Office;
Security Building
as required (monthly calibration)
X
X
X X
X X
Plant site back up power generator 1 Pit shop PM ‐ biannually X X X X X X X
Portable Generators (1000‐300W), lights, ladders
Multiple Pit shop; Carpenter Shop as required
X
X X X X X X X X
4095 Portable (trailer mounted) generator (4160V, 3ph, 1.2MW)
1 Mine PM ‐ biannually
X
X X X X X X X X
Storage drums and totes Multiple Pit shop, mill, SX‐EW X
Communications
2 way radios Multiple property monthly PM of repeater stations (2, UPS system) 6 channels X X X X X X X X X X X X
Phones (internal), IP phones Multiple property as required phone exchange in office X X X X X X X X X X X X
Phone/fax (external) IP phones ‐ Main 23 lines Phone exchange in Admin. Building monthly PM of cell tower (UPS system) TELUS Wireless service from Quesnel to Gibraltar cell tower, to
phone exchange in Admin. X X X X X X X X X X X X
Phone/fax (external) IP phones ‐ Secondary
10 phone lines, 3 fax
lines Phone exchange in Admin. Building as required
Service from McLeese Lake via landline. Phone lines via phone exchange in Admin. Fax lines are stand alone.
X X X X X X X X X X X X
Phone/fax (external) IP phones ‐ Tertiary
TELUS: Property except in lower areas of Pit
Rogers: Main Office monthly PM of cell tower (UPS system)
Cell service via Telus through Gibraltar cell tower. Cell service via Rogers from McLeese Lake and repeater in Gibraltar Main office
X X X X X X X X X X X X
Internet ‐ Main
Admin. Building
10 Mb/s Telus connection from Quesnel to Gibraltar cell tower (TELUS)
X X X X X X X X X X X X
Internet ‐ Secondary
Admin. Building
2 Mb/s Telus wireless connection from Quesnel via antenna in Boneyard (ABC Communications)
X X X X X X X X X X X X
Internet ‐ Tertiary
Property except in lower areas of Pit
Access over cell network via wireless cards X X X X X X X X X X X X
Pumps
2" Honda semi‐trash pumps with suction and discharge hoses
2 Carpenter shop as required pump X
X
X
X X X X
3" Honda trash pumps with suction and discharge hoses
2 Carpenter shop as required pump X
X
X
X X X X
Gorman Rupp trash pump, diesel 1 Rebuild Shop as required pump X X X X X X X
Tsurumi diesel trash pump EPT2‐150DD, 32Hp
2 Pit de‐watering, rebuild shop as required pump X
X
X
X X X X
Gorman Rupp 30hp submersible pumpS4G1, 600V
1 Pit de‐watering, rebuild shop as required pump X
X
X
X X X X
2hp submersible well pumps 2 Pit de‐watering as required pump X X X X X X
Monarch gas pump 3"X3", 330 USGPM @ 90' head
1 Rebuild shop as required pump X
X
X
X X X X
Flygt submersible pump, 30 HP, 550 V 1 Quonset hut as required pump X X X X X X X
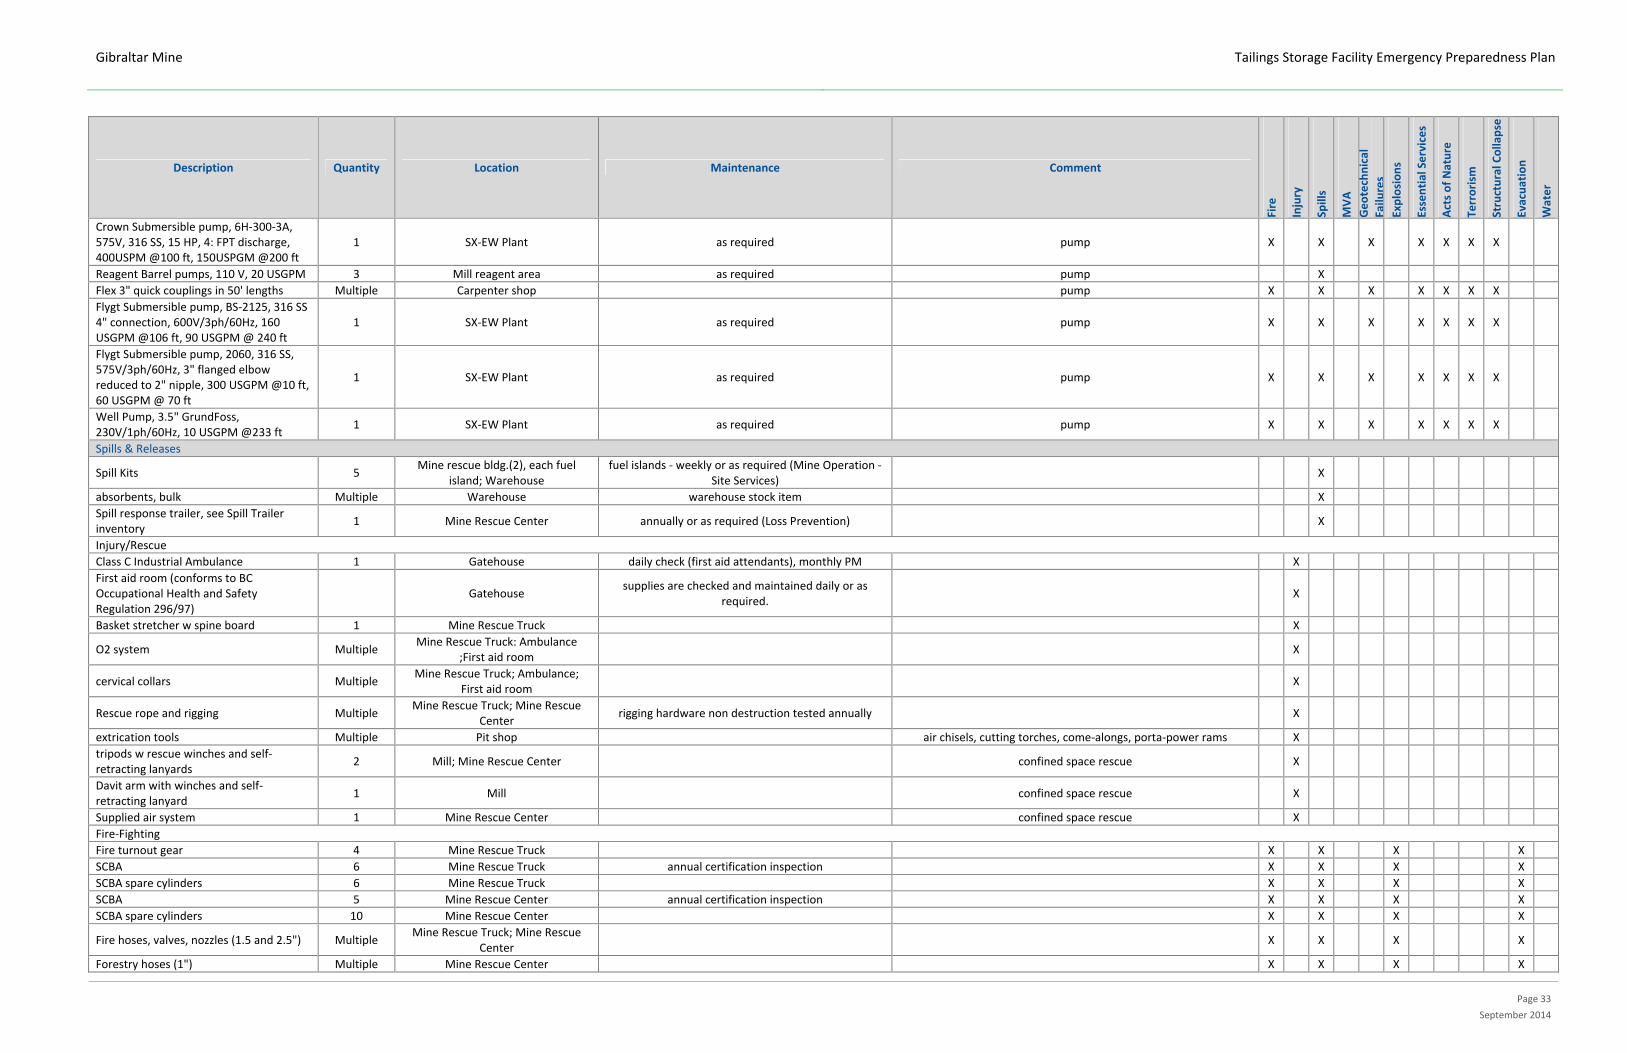
Gibraltar Mine Tailings Storage Facility Emergency Preparedness Plan
Page 33
September 2014
Description Quantity Location Maintenance Comment
Fire
Injury
Spills
MVA
Geotechnical
Failu
res
Explosions
Essential Services
Acts of Nature
Terrorism
Structural Collapse
Evacuation
Water
Crown Submersible pump, 6H‐300‐3A, 575V, 316 SS, 15 HP, 4: FPT discharge, 400USPM @100 ft, 150USPGM @200 ft
1 SX‐EW Plant as required pump X
X
X
X X X X
Reagent Barrel pumps, 110 V, 20 USGPM 3 Mill reagent area as required pump X
Flex 3" quick couplings in 50' lengths Multiple Carpenter shop pump X X X X X X X
Flygt Submersible pump, BS‐2125, 316 SS 4" connection, 600V/3ph/60Hz, 160 USGPM @106 ft, 90 USGPM @ 240 ft
1 SX‐EW Plant as required pump X
X
X
X X X X
Flygt Submersible pump, 2060, 316 SS, 575V/3ph/60Hz, 3" flanged elbow reduced to 2" nipple, 300 USGPM @10 ft, 60 USGPM @ 70 ft
1 SX‐EW Plant as required pump X
X
X
X X X X
Well Pump, 3.5" GrundFoss, 230V/1ph/60Hz, 10 USGPM @233 ft
1 SX‐EW Plant as required pump X
X
X
X X X X
Spills & Releases
Spill Kits 5 Mine rescue bldg.(2), each fuel
island; Warehouse fuel islands ‐ weekly or as required (Mine Operation ‐
Site Services) X
absorbents, bulk Multiple Warehouse warehouse stock item X
Spill response trailer, see Spill Trailer inventory
1 Mine Rescue Center annually or as required (Loss Prevention)
X
Injury/Rescue
Class C Industrial Ambulance 1 Gatehouse daily check (first aid attendants), monthly PM X
First aid room (conforms to BC Occupational Health and Safety Regulation 296/97)
Gatehouse
supplies are checked and maintained daily or as required.
X
Basket stretcher w spine board 1 Mine Rescue Truck X
O2 system Multiple Mine Rescue Truck: Ambulance
;First aid room X
cervical collars Multiple Mine Rescue Truck; Ambulance;
First aid room X
Rescue rope and rigging Multiple Mine Rescue Truck; Mine Rescue
Center rigging hardware non destruction tested annually
X
extrication tools Multiple Pit shop air chisels, cutting torches, come‐alongs, porta‐power rams X
tripods w rescue winches and self‐retracting lanyards
2 Mill; Mine Rescue Center
confined space rescue
X
Davit arm with winches and self‐retracting lanyard
1 Mill
confined space rescue
X
Supplied air system 1 Mine Rescue Center confined space rescue X
Fire‐Fighting
Fire turnout gear 4 Mine Rescue Truck X X X X
SCBA 6 Mine Rescue Truck annual certification inspection X X X X
SCBA spare cylinders 6 Mine Rescue Truck X X X X
SCBA 5 Mine Rescue Center annual certification inspection X X X X
SCBA spare cylinders 10 Mine Rescue Center X X X X
Fire hoses, valves, nozzles (1.5 and 2.5") Multiple Mine Rescue Truck; Mine Rescue
Center X
X
X
X
Forestry hoses (1") Multiple Mine Rescue Center X X X X

Gibraltar Mine Tailings Storage Facility Emergency Preparedness Plan
Page 34
September 2014
Description Quantity Location Maintenance Comment
Fire
Injury
Spills
MVA
Geotechnical
Failu
res
Explosions
Essential Services
Acts of Nature
Terrorism
Structural Collapse
Evacuation
Water
Miscellaneous hand tools Multiple Mine Rescue Truck pry bars, sledge hammers, picket pegs X X X X X X
Miscellaneous hand tools Multiple Warehouse water cans, pry bars, sledge hammers, picket pegs X X X X X X
Hydrant tools Multiple Mine Rescue Truck valves and wrenches X
Fire extinguishers ‐ ABC, CO2 Multiple Warehouse, Mine Rescue Truck.,
site‐wide monthly and annual inspection, 6 yr. service,
12 yr. hydrostatic pressure test X
Fire extinguishing system ‐ AFFF 1 SX‐EW Plant daily check, annual inspection/PM X X
Fire water system ‐ General 1 Plant site hydrants and sprinkler systems ‐ annually Head tank, distribution system, hydrants X X
Fire water system ‐ Fire stations Multiple Site‐wide monthly inspections; annual service Hoses X X
Fire water system ‐ Sprinkler systems Multiple Site‐wide annual service X
Water Rescue
12 ft boat, gas motor, electric motor, heaving ropes, life jackets
1 Landfill building as required
X X X
X
Surface Equipment
4104 – Cat 928HZ 1 Mine / blaster crew PM – 400 hrs Loader X X X X X X X X X
4108 – Michigan L90B 1 Mine PM – 400 hrs Loader X X X X X X X X X
4111 ‐ Volvo L90F 1 Site Services PM – 400 hrs Loader X X X X X X X X X
4137 ‐ Cat 994D 1 Mine PM – 400 hrs Loader X X X X X X X X X
4138 ‐ Komatsu WA700 1 Mine PM – 400 hrs Loader X X X X X X X X X
4141 – Komatsu WA 800 1 Mine PM – 400 hrs Loader X X X X X X X X X
4032 / 4033 / 4034 / 4037 / 4038 ‐ Bobcat Loaders
5 Mill, Mine PM – 12 weeks Loader X
X X X X X X X X
4035 – Bobcat excavator 1 Site Services PM –12 weeks Excavator X X X X X X X X X
4479 / 4480 / 4481 / 4482 / 4483 / 4486 – Cat D10
6 Mine PM – 400 hrs Dozer X
X X X X X X X X
4484 / 4485 – Cat D11T 2 Mine PM – 400 hrs Dozer X X X X X X X X X
4335 – Cat 824C cable reeler 1 Mine operations PM – 400 hrs Cable Reeler X X X X X X X X X
4336 ‐ Cat 992D Rubber Tired Dozer 1 Mine PM – 400 hrs Dozer X X X X X X X X X
4109 ‐ Komatsu PC400LC 1 Site Services PM – 400 hrs Excavator X X X X X X X X X
4112 ‐ Cat 345 1 Site Services PM – 400 hrs Excavator X X X X X X X X X
4110 ‐ Komatsu PC220LC‐7 1 Site Services PM – 400 hrs Excavator X X X X X X X X X
4028 ‐ Lorain 28 Ton 1 Pit shop PM – 400 hrs Crane X X X X X X X X X
Forklifts Multiple SX, Mill, Pit shop PM – 12 weeks Forklift X X X X X X X X X
100 T trucks 7,200 Imp.Gal 1 Pit shop PM – 400 hrs Water truck X X X X X X X X X
4050 ‐ Bucket truck (electrical) 1 Pit shop PM – 12 weeks Bucket Truck X X X X X
4004 Dump truck 1 Site Services PM – 8 weeks Dump Truck X X X X X X X
4009 Service Truck 1 Mechanics PM – 12 weeks Service Truck X X X X X X X
4015 Dump Truck 1 Site Services PM – 8 weeks Dump Truck X X X X X X X
4010 Dump Truck 1 Site Services PM – 8 weeks Dump Truck X X X X X X X
Crew Buses 9 Mine PM – every 6 weeks Pit Crew Bus X X X X X X X X
4099 – Cube Van 1 Mine Rescue PM – every 12 weeks Mine Rescue X X X X X X X
4011 Crane Truck 1 Site Services PM – every 12 weeks Crane Truck X X X X X X X
4012 Lube Truck 1 Mine Ops PM – every 8 weeks Lube Truck X X X X X X X
4014 / 4016 Service Trucks 2 Mechanics PM – every 8 weeks Service Truck X X X X X X X
4017 Hi‐way Tractor / tri‐axle 1 Site Services PM – every 8 weeks Tractor X X X X X X X
4018 Water Truck / 1,000 gallon water tank
1 Mine Ops PM – every 8 weeks Water Truck X X X X X X X

Gibraltar Mine Tailings Storage Facility Emergency Preparedness Plan
Page 35
September 2014
Table 8.2 Offsite Suppliers and Contractors
Service Supplier/Contractor Location Contact Person Phone Numbers
Excavating/Surface Equipment and Operator Paterson Contracting Ltd Williams Lake Wayne Paterson (250) 392‐3292 (250) 392‐6373 (home) (250) 392‐0060 (cell) (250) 398‐1160 (Autotell)
Equipment and Operator Lake Excavating Ltd (250) 392‐6291
Crane Rental and Operator Lucas Cranes Williams Lake (250) 392‐5863
(250) 296‐3248
Municipal Road Service Interior Road Services McLeese Lake (250) 297‐6497
Quesnel (250) 992‐8809
All Terrain Vehicles ‐ Rental 100 Mile Recreational Sales and Service 100 Mile (250) 392‐2550
Helicopters Highland Helicopters Williams Lake (250) 398‐7142
Arduini Helicopters Williams Lake Tom Arduini (250) 398‐5551
Divers R. D. Van Der Maaten Wildwood (250) 989‐5541
Industrial Suppliers Tasco Supplies Ltd (generators, etc.) Williams Lake Rick Weil (250) 392‐6232
(250) 392‐6377 (home)
Acklands Ltd Williams Lake Ian Sopp (250) 392‐7132
(250) 398‐2810 (home)
Highlands Irrigation Ltd Williams Lake Dick Ford (250) 392‐2321
(250) 392‐5223 (home)
Vern Winger (250) 398‐8862 (home)
Portable Generators (Purchase) Williams Lake Honda Williams Lake Ryan Watt (250) 392‐2300
(250) 392‐6536 (home)
Rental/Lease Equipment Broadway Rentals (pumps, generators, etc.) Williams Lake Art Erickson (250) 392‐2662
(250) 392‐0257 (home)
(250) 398‐1202 (Autotel)
Gordon Rent‐All (good selection of pumps and generators
Williams Lake Gordo Rauch (250) 392‐4222
250) 392‐5133 (home)
Towing Companies Bee Jays Auto Towing Williams Lake (250) 398‐9311 (24 hrs)
Downtown Service Williams Lake (250) 392‐7515 (24 hrs)
Hydro Services BC Hydro Williams Lake 1 (888) 769‐3766
Natural Gas services Fortis BC 1 (888) 663‐9911
Gibraltar Mine Tailings Storage Facility Emergency Preparedness Plan
Page 36
September 2014
9 REVIEW, TESTING, UPDATING OF EPP, AND REPORTING
Ongoing training of staff, testing of the communications set up, and operational tests of the plan are required to ensure the effectiveness of the response. The Gibraltar Mine staff should conduct communications testing on an annual basis. An operational test, which will include staff from emergency responders, should be performed every five years. The results from the training and testing will then be used to update the EPP as required.
Gibraltar Mines will be responsible for reporting on the operational tests, and for updating the EPP. The updating of the EPP will be in a written form, and will be forwarded to all plan holders.
FEMA (2004) guidance recommends five types of exercises. The emergency exercises should be developed and conducted in an ascending order of complexity. Brief descriptions of the five exercise types, listed from simplest to most complex, are provided below. Further guidance on conducting the exercises may be found in the FEMA (2004) document, which is available online at http://www.fema.gov/library/viewRecord.do?id=1672.
Orientation Seminar ‐ This exercise would be a seminar that involves bringing together Gibraltar Mine and the emergency responders identified under Section 10, to discuss the EPP and enable each participant to become familiar with the EPP, and the roles, responsibilities, and procedures of those involved. Plans for an annual drill or more in‐depth comprehensive exercise will be agreed at this seminar.
Drill ‐ A drill is the lowest level exercise that involves an actual exercise. It tests, develops, or maintains skills in a single emergency response procedure. An example of a drill is an in‐house exercise performed to verify the validity of telephone numbers and other means of communication along with Gibraltar’s response.
Tabletop Exercise ‐ The tabletop exercise is a higher level exercise than the drill. The tabletop exercise involves a meeting of the dam owner and the provincial and local emergency management officials in a conference room environment. The exercise usually begins with the description of a simulated event and proceeds with discussions by the participants to evaluate the EPP and response procedures and to resolve concerns regarding coordination and responsibilities.
Functional Exercise ‐ The functional exercise is the highest level exercise that does not involve the full activation of the dam owner and provincial and local emergency management agency field personnel and facilities, or test evacuation of residents downstream of the dam. It involves the various levels of the emergency responders and is designed to evaluate both the internal capabilities and responses of the dam owner and the workability of the information in the EPP used by the emergency management officials to carry out their responsibilities. The functional exercise also is designed to evaluate the coordination activities between the dam owner and emergency management personnel.

Gibraltar Mine Tailings Storage Facility Emergency Preparedness Plan
Page 37
September 2014
Full Scale Exercise ‐ The full scale exercise is the most complex level of exercise. It evaluates the operational capability of all facets of the emergency management system interactively in a stressful environment with the actual mobilization of personnel and resources. It includes field movement and deployment to demonstrate coordination and response capability. Actual evacuation of critical residents may be exercised if previously announced to the public.

Gibraltar Mine Tailings Storage Facility Emergency Preparedness Plan
Page 38
September 2014
10 COMMUNICATIONS DIRECTORY
The communications directory, presented in this section, should be reviewed and updated semi‐annually.
Table 10.1 gives the telephone numbers to be used to report an unusual occurrence. The telephone numbers may also be used by other emergency responders to contact the Gibraltar Crisis Coordinator.
Table 10.1 Gibraltar Mine Emergency Contact Details
Gibraltar Mines Contact Office Phone Cell Phone Email
Gibraltar Mine Security (250) 992‐1800
Gibraltar Crisis Coordinator Dale Lawson (250) 992‐1800, local
227 (250) 267‐4034 [email protected]
Crisis Control Centre ‐ (250) 992‐1800
The number of an additional line should be kept confidential so that fast communications can be maintained between key stakeholders. This number could be put only on select copies of the directory, perhaps in hand‐written form, or transmitted to those who require it at the start of the emergency. Consideration should also be made to the use of social media.
Contact details of key individuals or agencies are given in Table 10.2.
Table 10.2 Gibraltar Crisis Management Team (Tailings)
Name Position Responsibility
Pat Gannon Manager, Mill Operations Oversees all aspects of tailings management.
Vacant Superintendent, Mill Operations
Gord Simms Superintendent, Mine Engineering Surveying, mapping.
Kelly Parker Manager, Mine Operations Surface drainage control, mobile equipment.
John Purdy General Foreman, Mill Operations Operation of tailings pumping and deposition systems.
Linda Green General Foreman, Mill Maintenance Planning, implementation and supervision of mechanical maintenance.
Todd Wambolt Senior Environmental Engineer Permitting and regulatory requirements, geotechnical monitoring.
Chris Krystia Sr. Metallurgist Technical support, project scheduling.
Tim Potter Superintendent, Projects Construction management.
Bob Chambers Consulting Geotechnical Engineers Klohn Crippen Berger Ltd.
Dam design annual compliance reporting, geotechnical analysis, and risk assessment.
EMERGENCY MANAGEMENT BC (Formerly PROVINCIAL EMERGENCY PROGRAM) 24‐Hour Emergency Number (Victoria) 1‐800‐663‐3456 North East Region Office (Prince George) phone (250) 612‐4172 Fax (250) 612‐4171 CN RAIL 24‐Hour Emergency Number 1‐800‐465‐9239

Gibraltar Mine Tailings Storage Facility Emergency Preparedness Plan
Page 39
September 2014
MINISTRY OF AGRICULTURE AND LANDS Williams Lake (250) 398‐4500
1 (800) 474‐6133 MINISTRY OF ENERGY, MINES AND NATURAL GAS District Inspector (Kamloops) Steve Rothman (250) 371‐3780 (work) (250) 319‐2054 (cell) (250) 374‐1350 (home) Email: [email protected]
George Warnock, Manager, Geotechnical Engineering (250) 565‐4327 (work) Email: [email protected] MINISTRY OF ENVIRONMENT Jack Green (250) 398‐4544 (work) Email: [email protected] Dam Safety Officer (Williams Lake) Connie Haeussler (250) 398‐4893 (work) (250) 392‐6221 (home) Email: [email protected]
MINISTRY OF TRANSPORTATION AND INFRASTRUCTURE (MoT) Provincial Highway Communications Centre 24‐Hour, Burnaby (604) 660‐9771 Cariboo District Office, Williams Lake Phone: (250) 398‐4519
Fax: (250) 398‐4454 Quesnel Area Office, Quesnel Phone: (250) 992‐4412
Fax: (250) 992‐4436 MEDIA (RADIO AND TELEVISION) Radio ‘The Wolf’ ‐ 100 Mile House (CKBX 840AM), Williams Lake (CKWL 570AM), and Quesnel (CKCQ 100.3FM) ‘The Rush’ ‐ Williams Lake (97.5FM), Quesnel (94.9FM), and 100 Mile House (99.7) Quesnel Station (250) 992‐7046 (phone)
(250) 992‐2354 (fax) After hours Gary Long (Manager) (250) 301‐9944 (cell) Prince George Station (250) 564‐2524 (head office)

Gibraltar Mine Tailings Storage Facility Emergency Preparedness Plan
Page 40
September 2014
Williams Lake Station (250) 392‐6551 (phone) (250) 392‐4142 (fax)
100 Mile House Station (250) 395‐3848 (phone) (250) 392‐4147 (fax)
Television CFJC Television (Kamloops) 1 (888) 522‐2288
MUNICIPALITIES AND REGIONAL DISTRICT City of Quesnel, Williams Lake and the Caribou Regional District have 911 emergency numbers.
City of Quesnel 24 Hour Emergency no. 911 Emergency Program Coordinator (250) 992‐5121 Caribou Regional District 24 Hour Emergency no. 911 Emergency Program Coordinator (250) 392‐3351 City of Williams Lake 24 Hour Emergency no. 911 Emergency Program Coordinator (250) 392‐1794 UTILITIES AND PIPELINES BC Hydro 24‐Hour Emergency Number 1 (888) 769‐3766
Fortis BC 24‐Hour Emergency Number 1 (800) 663‐9911
TELUS Communications Customer Service 310‐3100 Repair Service 1 (800) 663‐0333 RCMP Williams Lake (250) 392‐6211 Quesnel (250) 992‐9211 AMBULANCE Williams Lake (250) 392‐5402 Quesnel (250) 992‐3211

Gibraltar Mine Tailings Storage Facility Emergency Preparedness Plan
Page 41
September 2014
HOSPITALS Williams Lake Cariboo Memorial Hospital (250) 392‐4411 517 North 6th Avenue
Williams Lake, BC V2G 2G8 Quesnel G.R. Baker Memorial Hospital (250) 992‐0600 543 Front Street,
Quesnel, BC V2J 2K7
CONSULTING ENGINEERS Klohn Crippen Berger
Bob Chambers (604) 251‐8435 (office) (604) 669‐3800 (home)
Email: [email protected]

Gibraltar Mine Tailings Storage Facility Emergency Preparedness Plan
Page 42
September 2014
REFERENCES
B.C. Reg. 163/2011. (2011). “British Columbia Dam Safety Regulation”, deposited November 30.
CDA, 2007. “Dam Safety Guidelines”, Canadian Dam Association, January.
FEMA, 2004. “Federal Guidelines for Dam Safety: Emergency Action Planning for Dam Owners”, April.
Klohn Crippen Berger Ltd. (2012). 2012 Long‐Term Tailings Deposition Plan, October 26.
Klohn Crippen Berger Ltd. (2012). “Gibraltar Mine Tailings Storage Facility ‐ Operation, Maintenance and Surveillance Manual. Revision 4”, April 3.
Klohn Crippen Berger Ltd. (2013). “Gibraltar Mine Tailings Storage Facility – Emergency Preparedness Plan. February 5.

130206R‐Emergen
M01527A68.730
ncy Preparedness Plan.docx
Damm Breachh and Inu
A
undation
Fe
APPEN
n Assess
ebruary 2013
DIX I
sment

130206‐AppI‐Dam
M01527A68.730
I‐1 INTR
I‐1.1
I‐1.2
I‐1.3
I‐1.4
I‐1.5
I‐2 THE
I‐2.1
I‐2.2
I‐2.3
I‐3 EAST
I‐3.1
I‐3.2
I‐3.3
I‐3.4
I‐3.5
I‐3.6
I‐4 MAI
I‐4.1
m Break Assess.doc
RODUCTION .
1 General
2 Methodo
3 Organiza
4 Units .....
5 Limitatio
TAILINGS IM
1 The Tailin
I‐2.1.1 T
I‐2.1.2 E
I‐2.1.3 T
I‐2.1.4 T
2 Areas Do
3 Areas Do
T SADDLE DA
1 Dam Fail
2 The HEC‐
I‐3.2.1 To
I‐3.2.2 In
I‐3.2.3 D
3 Dam Bre
I‐3.3.1 P
I‐3.3.2 O
I‐3.3.3 C
I‐3.3.4 C
4 Model Se
I‐3.4.1 Se
I‐3.4.2 Se
5 Model Li
6 Flood Inu
N DAM TAIL
1 General
cx
Dam
....................
...................
ology ..........
ation of Appe
...................
ons of Report
MPOUNDME
ngs Storage
he Impound
ast Saddle D
he Main Tai
ailings Pond
ownstream o
ownstream o
AM BREACH
ure Modes .
‐RAS Model
opography a
nitial and Co
am Breach P
ach and Inun
iping Failure
Overtopping
omparison o
omparison o
ensitivity An
ensitivity Mo
ensitivity Mo
mitations ..
undation Det
LINGS RUNO
...................
Apm Break Inu
TABLE
....................
....................
....................
endix ...........
...................
t ..................
NT AND THE
Facility ........
dment ..........
Dam .............
lings Dam ....
Water Leve
of the East Sa
of the Main T
AND INUND
....................
....................
and Other Ph
ncurrent Flo
Parameters .
ndation Ana
e ..................
Failure .......
of Breach Ou
of Flow Rout
alyses .........
odel Run Sce
odel Run Res
....................
tails Recomm
UT ASSESSM
....................
ppendix Iundation A
OF CONTEN
....................
....................
....................
....................
...................
....................
E STUDY ARE
....................
....................
....................
....................
els and Volum
addle Dam ..
Tailings Dam
DATION ASSE
....................
....................
hysical Featu
ows in Stream
....................
lyses Results
....................
....................
utflow Resul
ting Results w
....................
enarios .......
sults ...........
....................
mended for
MENT ...........
....................
Assessmen
NTS
....................
....................
....................
....................
...................
....................
EA ................
....................
....................
....................
....................
mes .............
....................
m ..................
ESSMENT ....
....................
....................
ures ............
ms and River
....................
s .................
....................
....................
ts to Case H
with City of
....................
....................
....................
....................
EPP ............
....................
....................
nt
....................
....................
....................
....................
....................
....................
....................
....................
....................
....................
....................
....................
....................
....................
....................
....................
....................
....................
rs ................
....................
....................
....................
....................
istory Derive
Quesnel Flo
....................
....................
....................
....................
....................
....................
....................
Fe
....................
....................
....................
....................
...................
....................
....................
....................
....................
....................
....................
....................
....................
....................
....................
....................
....................
....................
....................
....................
....................
....................
....................
ed Relations
od Mapping
....................
....................
....................
....................
....................
....................
....................
Page I‐i
ebruary 2013
............ 1
............ 1
............ 2
............ 3
............ 3
............ 3
............ 4
............ 4
............ 4
............ 4
............ 5
............ 6
............ 7
............ 8
............ 9
............ 9
............ 9
.......... 10
.......... 10
.......... 12
.......... 13
.......... 13
.......... 16
s ........ 18
g ........ 18
.......... 18
.......... 18
.......... 20
.......... 22
.......... 22
.......... 24
.......... 24

130206‐AppI‐Dam
M01527A68.730
I‐4.2
I‐4.3
I‐5 CON
I‐5.1
I‐5.2
I‐5.3
REFERENCE
Table I‐1 Table I‐2 Table I‐3 Table I‐4 Table I‐5 Table I‐6 Table I‐7 Table I‐8
Figure I‐1
Figure I‐2
Figure I‐3
Figure I‐4
Figure I‐5
Figure I‐6
Figure I‐7
Figure I‐8
Figure I‐9
Figure I‐10
m Break Assess.doc
2 Condition
I‐4.2.1 St
I‐4.2.2 20
I‐4.2.3 20
3 Results o
NCLUSIONS A
1 General
2 East Sadd
3 Main Dam
S .................
Pond LevEstimateDam BreInundatioInundatioDam BreSummaryCycloned
Location
Gibraltar
TSF Site P
East Sadd
East Sadd
TSF Plan
Predicted
SupernatLife (202
Plan of St
River Cro
cx
ns and Meth
tability Anal
005 Run‐Ou
012 Run‐Ou
of the 2012 R
AND RECOM
...................
dle Dam Bre
m Tailings Ru
...................
vel vs. Pond d Naturally ach Parameon Characteon Characteach Paramey of Sensitivd Sand Dam
Map
r Mine Site P
Plan – Existin
dle Dam, Cu
dle Dam, End
and Section
d Pond Eleva
tant Pond St7)
tudy Area
ossings in the
hod for the R
yses Accord
t Assessmen
t Assessmen
Run‐Out Asse
MENDATION
....................
ak Study ....
unout Asses
....................
Lis
Water VolumOccurring Flters – Base Cristics at Selristics at Selters – Sensitity Analysis –2‐D Run‐Out
Plan
List
ng Condition
rrent (2012 –
d of Mine Lif
s, Current (2
ation and Fre
tage‐Storage
e City of Que
Run‐Out Asse
ing to CDA G
nt ................
nt ................
essment .....
NS ...............
....................
....................
sment ........
....................
st of Tables
me ...............ows in the RCase ............ected Locatiected Locatitivity Runs, C– Current (2t Analysis Re
t of Figures
ns
– 2013) Plan
fe (2027) Pla
2012 – 2013
eewater Pon
e Relationshi
esnel
essment .....
Guidelines ...
....................
....................
....................
....................
....................
....................
....................
....................
....................Rivers ...............................ions – Pipingions – OvertCurrent (201012 ‐ 2013)esults ..........
n and Section
an and Sectio
) and End of
nd Volume, 2
ip, Current (
....................
....................
....................
....................
....................
....................
....................
....................
....................
....................
............................................................g Failure Bastopping Failu12 ‐ 2013) ....Piping Failu....................
ns
ons
f Mine Life (2
2012 – 2027
2012 – 2013
Fe
....................
....................
....................
....................
....................
....................
....................
....................
....................
....................
.............................................................se Case ........ure Base Cas....................re ...................................
2027)
3) and End of
Page I‐i
ebruary 2013
.......... 24
.......... 24
.......... 24
.......... 25
.......... 25
.......... 28
.......... 28
.......... 28
.......... 29
.......... 30
........... 7
.......... 11 ......... 12 ......... 15 se ...... 17 ......... 19 ......... 21 ......... 26
f Mine

Gibraltar MinGibraltar Min
130206‐AppI‐Dam
M01527A68.730
Figure I‐11
nes Ltd. ne
m Break Assess.doc
East Sadd
cx
dle Dam – As‐Built Plan a
TailingsA
and Sections
s Storage FacAppendix I ‐ D
s (1986)
ility EmergenDam Break In
ncy Preparednundation Ass
Fe
ness Plansessment
Page I‐ii
ebruary 2013

Gibraltar MinGibraltar Min
130206‐AppI‐Dam
M01527A68.730
Figure 1‐12
Figure I‐13
Figure I‐14
Figure I‐15
Figure I‐16
Figure I‐17
Figure I‐18
Figure I‐19
Figure I‐20
Figure 1‐21
Figure I‐22
Figure I‐23
Figure I‐24
Figure I‐25
Figure I‐26
Figure I‐27
nes Ltd. ne
m Break Assess.doc
Flow HydCurrent (
Flow Hydof Mine L
Estimate
Estimate
Estimate
Flow HydCase, Cur
Flow HydCase, End
Estimate
Estimate
Estimate
Comparis
Comparis
East Sadd
East Sadd
Tailings R
Cycloned
cx
drographs Al(2012 – 2013
drographs AlLife (2027)
d Flood Inun
d Flood Inun
d Flood Inun
drographs Alrrent (2012 –
drographs Ald of Mine Lif
d Flood Inun
d Flood Inun
d Flood Inun
son of Peak
son with ME
dle Dam Pipi
dle Dam Ove
Runout Asse
d sand Dam a
long Flood R3)
long Flood R
ndation Exte
ndation Exte
ndation Exte
long Flood R– 2013)
long Flood Rfe (2027)
ndation Exte
ndation Exte
ndation Exte
Breach Flow
ELP 1 in 200 y
ing Failure B
ertopping Fa
ssment Deta
and North Ea
TailingsA
Route – East
Route – East
ents, Piping F
ents, Sardine
ents, City of Q
Route – East
Route – East
ents, Overtop
ents, Sardine
ents, City of Q
w Estimates w
year Flood E
Base Case Inu
ailure Base C
ails
arthfill Dam
s Storage FacAppendix I ‐ D
Saddle Dam
Saddle Dam
Failure Base
e Flats, Piping
Quesnel, Pip
Saddle Dam
Saddle Dam
pping Failure
e Flats, Overt
Quesnel, Ov
with Empiric
Extent
undation De
Case Inundat
Plan and Se
ility EmergenDam Break In
m Piping Failu
m Piping Failu
Case
g Failure Bas
ping Failure B
m Overtoppin
m Overtoppin
e Base Case
topping Failu
vertopping Fa
cal Relations
etails
tion Details
ections
ncy Preparednundation Ass
Fe
ure Base Cas
ure Base Cas
se Case
Base Case
ng Failure Ba
ng Failure Ba
ure Base Cas
ailure Base C
hips
ness Plansessment
Page I‐iii
ebruary 2013
e,
e, End
ase
ase
se
Case

Gibraltar MinGibraltar Min
130206‐AppI‐Dam
M01527A68.730
I‐1 IN
I‐1.1 Ge
The Gibraltasouthern intby way of an(TSF) at the impoundmeEast Saddle
This report pBerger (KCBThe TSF is esSafety Guidecurrent damBritish Colum
The Main Daglacial till acusing the cecrest of the Main Dam is
The East Sad1985 and 192010.
In a previou“Extreme” csubstantial dloss of life. Iof Extreme cThe EPP is typurpose of w
Provchar
Provsecti
Provto idestimto esflow
nes Ltd. ne
m Break Assess.doc
NTRODUCT
eneral
ar Mine is locterior of Britn 18 km pavGibraltar Ment is retaineDam on the
presents theB) in 2012, fossentially imelines publism safety regumbia Dam Sa
am was comcross the outentreline medam was des also referre
ddle Dam co986. The dam
s dam failurconsequencedownstreamn accordancconsequencypically devewhich is to:
vide a quantiracteristics o
vide a quantiion.
vide a flow rodentify changmate water sstimate the t
ws to spill ove
cx
TION
cated approtish Columbied road thatine is locateed by the Mae east side as
e results of aor the Tailingmpounded byshed by the Culations in Caafety Regula
mmissioned itlet of the Eathod of conseposited direed to as the
onsists of a cm was raised
e classificatie facility (KCm economic lce with CDA e dams are reloped based
itative simulof the breach
itative simul
outing simulges to the flosurface elevatime of traveer the banks
ximately 60ia as shown t joins Highwd immediateain Tailings Ds shown in Fi
a dam breachgs Storage Fay two dams:Canadian Daanada. In Bration (B.C. Re
n 1972 by coast Cuisson Cstruction. Taectly onto thCycloned Sa
compacted td in 2007 an
ion assessmeB, 2011), whlosses, signifDam Safetyrequired to hd on the res
ation of theh over time.
ation of the
ation of theow hydrograation (stage)el of the peaat key down
TailingsA
km north ofin Figure I‐1way 97 near ely north of tDam on the wigure I‐3.
h and inundaacility (TSF) athe Main Daam Associatiitish Columbeg. 163/2011
onstruction oCreek valley.ailings undere centrelineand Dam in t
ill embankmd 2008, and
ent, the TSFhere a potenficant enviroGuidelines ahave an Emeults of a dam
dam failure
time history
outflow hydaph due to va) hydrographak flow, andnstream site
s Storage FacAppendix I ‐ D
f Williams La and Figure McLeese Lakthe mine’s pwest side of
ation study,at the Gibralam and the on (CDA, 20bia, dam safe1).
of a 100 ft h. Subsequenrflow from cye and downstthis report.
ment and wad has subseq
at the Gibrantial failure oonmental anand the BC Dergency Prepm breach an
e mode(s), su
y of the outf
drograph thralley storagehs that couldto estimatees. The flow r
ility EmergenDam Break In
ake, near McI‐2. Access tke. The Tailiplant site. Thf the impoun
undertakentar Mine in East Saddle 007) form theety is also re
igh starter dnt dam raisesyclones locatream slope
s initially buuently had a
altar Mine wof the dam(sd cultural loDam Safety Rparedness Pd inundation
uch as chang
flow through
rough the doe and frictiond be expectethe time reqrouting usua
ncy Preparednundation Ass
Fe
cLeese Lake o the mine sngs Storagehe tailings ndment and
n by Klohn CrBritish ColumDam. The De basis for thegulated by t
dam of comps were perfoated across te of the dam
uilt in two staannual raise
was classified) could leadosses, and poRegulation, olan (EPP) in pn study, the
ges in geome
h the breach
ownstream vnal resistanced at key locquired for thally extends
ness Plansessment
Page I‐1
ebruary 2013
in the site is Facility
the
rippen mbia. am he the
pacted ormed he . The
ages in s since
d as an to ossible owners place. main
etrical
ed
valley, ce, to ations, he
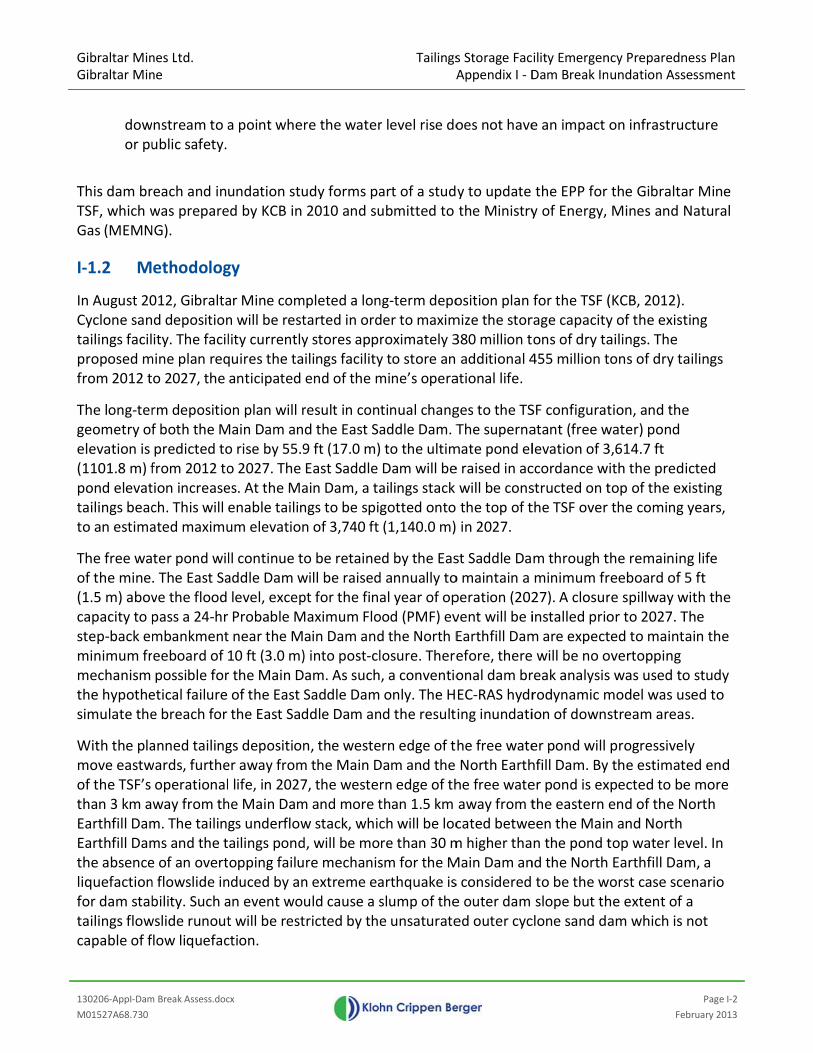
Gibraltar MinGibraltar Min
130206‐AppI‐Dam
M01527A68.730
dowor pu
This dam brTSF, which wGas (MEMN
I‐1.2 M
In August 20Cyclone santailings facilproposed mfrom 2012 t
The long‐tergeometry ofelevation is (1101.8 m) fpond elevattailings beacto an estima
The free waof the mine(1.5 m) abovcapacity to pstep‐back emminimum frmechanism the hypothesimulate the
With the plamove eastwof the TSF’s than 3 km aEarthfill DamEarthfill Damthe absenceliquefactionfor dam stabtailings flowcapable of f
nes Ltd. ne
m Break Assess.doc
wnstream to aublic safety.
reach and inwas prepareNG).
ethodolog
012, Gibraltad depositionity. The facil
mine plan reqo 2027, the
rm depositiof both the Mpredicted tofrom 2012 totion increasech. This will ated maximu
ter pond wil. The East Save the flood pass a 24‐hrmbankmentreeboard of possible foretical failure e breach for
anned tailingwards, furtheoperationalway from thm. The tailinms and the te of an overtn flowslide inbility. Such awslide runoutlow liquefac
cx
a point wher
undation stued by KCB in
gy
ar Mine comn will be restlity currentlyquires the taanticipated
on plan will rMain Dam ano rise by 55.9o 2027. The es. At the Maenable tailinum elevation
ll continue toaddle Dam wlevel, excep Probable Mt near the M10 ft (3.0 m)r the Main Dof the East Sthe East Sad
gs depositioner away from life, in 2027he Main Damgs underflowailings pondopping failunduced by anan event wout will be restction.
re the water
udy forms pa2010 and su
mpleted a lontarted in ordy stores apprilings facilityend of the m
result in cond the East Sa9 ft (17.0 m)East Saddleain Dam, a tangs to be spign of 3,740 ft
o be retainewill be raisedpt for the finaMaximum Floain Dam and) into post‐clam. As suchSaddle Damddle Dam an
n, the westem the Main D7, the westerm and more tw stack, whicd, will be more mechanisn extreme eauld cause a stricted by the
TailingsA
r level rise do
art of a studubmitted to
ng‐term depoder to maximroximately 3y to store an mine’s opera
tinual changaddle Dam. T to the ultimDam will beailings stackgotted onto(1,140.0 m)
ed by the Easd annually toal year of opood (PMF) evd the North Elosure. There, a conventio only. The Hnd the result
ern edge of tDam and thern edge of ththan 1.5 kmch will be locre than 30 msm for the Marthquake isslump of thee unsaturate
s Storage FacAppendix I ‐ D
oes not have
y to updatethe Ministry
osition planmize the stor380 million t additional 4ational life.
ges to the TSThe supernamate pond ele raised in acwill be cons the top of t in 2027.
st Saddle Dao maintain aperation (202vent will be iEarthfill Damefore, thereonal dam brEC‐RAS hydring inundati
he free wateNorth Earthhe free wateaway from tcated betwem higher thaMain Dam ans considerede outer dam ed outer cyc
ility EmergenDam Break In
e an impact
the EPP for y of Energy,
for the TSF (rage capacityons of dry ta455 million t
SF configuratatant (free wlevation of 3ccordance wstructed on tthe TSF over
m through tminimum fr27). A closurinstalled priom are expect will be no oreak analysisrodynamic mion of downs
er pond will hfill Dam. Byer pond is exthe eastern een the Mainn the pond tnd the North to be the wslope but th
clone sand da
ncy Preparednundation Ass
Fe
on infrastru
the GibraltaMines and N
(KCB, 2012).y of the existailings. The tons of dry ta
tion, and thewater) pond 3,614.7 ft ith the predtop of the exthe coming
the remaininreeboard of re spillway wor to 2027. Tted to maintovertopping s was used tomodel was ustream area
progressive the estimatxpected to beend of the Nn and North top water le Earthfill Da
worst case scehe extent ofam which is
ness Plansessment
Page I‐2
ebruary 2013
cture
ar Mine Natural
ting
ailings
e
icted xisting years,
ng life 5 ft with the The ain the
o study sed to s.
ly ted end e more North
vel. In m, a enario a not

Gibraltar MinGibraltar Min
130206‐AppI‐Dam
M01527A68.730
In late 2012that will be taken to repprojected 20are based odam failure
The ultimateliquefaction
According toto store thecombinationvalues abovThis freeboaEast Saddle dam has opinspection a
I‐1.3 Or
Section I‐1 ostudy. SectioThe conventSection I‐3, finally, the c
I‐1.4 Un
Historically,Topographicare used in the East Sad
I‐1.5 Lim
The methodreport, invoBecause it isbecause of tassumptionactual condThe results pplanning.
nes Ltd. ne
m Break Assess.doc
, raises to thmaintained present the c027 configurn the long‐te(i.e., overto
e configuratn of the tailin
o assessmen 30 day PMFn with a 100ve the flood sard accountsDam being oerated at apand monitor
rganization
of the appenon I‐2 descritional dam band the asseconclusions a
nits
the Gibraltac data coverrelation to tddle Dam bre
mitations o
ds of analyselve simplifies not possiblthe uncertais that are beitions and hepresented h
cx
he East Sadduntil Septemcurrent condration takenerm depositpping and p
ion of the Mngs beach an
nts undertakF, which is co year returnstorage leves for wind‐inovertopped pproximatelying of the da
n of Appen
ndix providesbes the tailibreach and iessment of tand recomm
ar Mine has ring the studhe East Saddeach and inu
of Report
es and comped assumptiole to predict nty of the aselieved to beence the suberein are, ne
le Dam andmber 2013. Tditions in thi to represenion plan (KCiping) were
Main Dam wand saturated
en as part ofomprised of snowmelt (l are 5 ft (1.5nduced waveis small. A py the currentam have not
ndix
s introductongs impoundnundation stailings flow
mendations f
employed Imy area is avadle Dam desundation res
uter simulatons in both taccurately tssociated inie conservativbsequent floevertheless,
TailingsA
Main Dam wThe East Sads dam breacnt the end ofCB, 2012). Inconsidered f
as used for a foundation
f the long‐tethe 30 day P294 mm wat5 m) for eartes, and settlepiping failuret full supply indicated an
ry informatidment and ttudy for thefrom the Mafor the study
mperial unitsailable in Meign dimensiosults.
tion modelsthe method othe mode anitial hydrologve. Howeverooding couldconsidered
s Storage FacAppendix I ‐ D
were undertdle Dam 201ch and inundf mine life coboth cases,for the East
a run‐out assof the cyclo
erm depositiProbable Mater equivalethfill dams aement. There of the damlevel for a nny problems
on for the dthe areas do East Saddleain Dam is py are present
s for dimensetric units. Boons, while M
used for theof solution and developmgic conditionr in the unlik differ fromto be adequ
ility EmergenDam Break In
aken, giving12 ‐2013 condation assessondition. Thetwo hypothSaddle Dam
sessment duoned sand M
ion plan, theaximum Rainnt). The desand 10 ft (3.0refore, the lik is also unlikumber of yes to date.
am breach aownstream oe Dam is prespresented in ted in Sectio
sions and eleoth ImperialMetric units a
e study, as dand preparatment of a damns, this studykely event ofthat indicatuate for use
ncy Preparednundation Ass
Fe
a configuratnfiguration wsment, and te configuratetical mode
m.
e to full Main Dam.
e facility is denfall (709 mmign freeboar0 m) for sandkelihood of tkely becauseears and rout
and inundatiof the two dasented in Section I‐4.on I‐5.
evations. l and Metricare used to p
escribed in ttion of inputm breach any is based onf a dam breaed by this stin emergenc
ness Plansessment
Page I‐3
ebruary 2013
tion was the ions s of
esigned m) in rd d dams. the e the tine
ion ams.
And
c units present
this t data. nd n ach, tudy. cy
Gibraltar MinGibraltar Min
130206‐AppI‐Dam
M01527A68.730
This report ithe exclusivFacility. Thepermission owith generano warranty
I‐2 TH
I‐2.1 Th
I‐2.1.1 Th
The locationsite is by waby the Mainside as show
The TSF currterm deposire‐designedand North Eand bulk fill continue to Dam. Additi
I‐2.1.2 Ea
The East Sad2.5H:1V dowriprap layer estimated Ebedrock. Thbeen constrshallow depand at the s
The dam breFigure I‐4 is (2027) confithat will be El. 3,570 ft (2013 configshown on Fi
nes Ltd. ne
m Break Assess.doc
is an instrumve use of Gibe report’s conof Klohn Cripally‐acceptedy, express or
HE TAILING
he Tailings
e Impoundm
n of Gibraltaay of an 18 kn Tailings Damwn in Figure
rently storesition plan is d facility will Earthfill Damusing the dobe located aonal relevan
st Saddle Da
ddle Dam cownstream slounderlain bl. 3,485 ft (1e dam is locructed and rapth (approximouth abutm
eak assessma section thigurations. Ain place at le(1088.1 m) turation was igure I‐5.
cx
ment of serviraltar Minesntents may nppen Bergerd professionar implied.
GS IMPOUN
Storage Fa
ment
r Mine and tm paved roam on the weI‐3.
s approximato store an ainclude a ste
m, using compownstream cat the east ent details of t
am
onsists of a cope. The upsy a granular1062.2 m). Paated at a naaised in stagmately 5 ft (1ent
ent considerough the TSA dam raise ieast up to Seo El. 3,572.2used to rep
ice of Klohn s Ltd (Client)not be reliedr. In this repoal practice c
NDMENT A
acility
the TSF are sad that joinsest side of th
tely 380 miladditional 45ep‐back embpacted wholcenterline mend of the tathe two dam
ompacted tistream slope filter. The dart of the notural saddleges by the do1.5 m)) belo
rs the currenSF showing bs planned toeptember 202 ft (1088.8 mresent the c
TailingsA
Crippen Ber for the specd upon by anort, Klohn Crommon to t
AND THE S
shown in Figs Highway 97he impoundm
lion tons of d55 million tobankment cole tailings. Thmethod. Theilings impoums are prese
ill embankme is protectedam has a loworth abutme at El. 3,490ownstream cw the prepa
nt situation,both the Curowards the e013. This wilm) with till aurrent cond
s Storage FacAppendix I ‐ D
rger Ltd. Thecific applicatny other partrippen Bergehe local area
STUDY ARE
gure I‐1 and 7 near McLeement and th
dry tailings.ons of dry taonstructed ahe East Saddsupernatantundment andnted in the f
ment, with a 3ed against erw point in thnt of the daft (1063.8 mconstructionared dam fou
and the endrrent (2012 ‐end of 2012,l include thend random fitions in this
ility EmergenDam Break In
e report has tion to the Tty without ther has endeaa. Klohn Crip
EA
Figure I‐2. Aese Lake. The East Saddl
The proposeilings from 2along the Cycdle Dam will t (free) wated retained byfollowing se
3H:1V upstrerosion by a 2he foundatiom is foundedm). Over timen method. Beundation sur
d of the mine‐ 2013) and , to give a dae raising the fill. The plans dam break
ncy Preparednundation Ass
Fe
been preparTailings Storahe express wavoured to cppen Berger
Access to thehe TSF is retae Dam on th
ed mine’s lo2012 to 2027clone Sand Dbe raised wer pond will y the East Sactions.
eam slope a2 ft (0.6 m) thon located atd on exposee, the dam hedrock existsrface at mid‐
e’s operatioEnd of Mineam configuradam from nned Septemassessment
ness Plansessment
Page I‐4
ebruary 2013
red for age written omply makes
mine ained he east
ng 7. The Dam with till
addle
nd a hick t an ed has s at ‐valley
nal life. e Life ation
mber t. This is
Gibraltar MinGibraltar Min
130206‐AppI‐Dam
M01527A68.730
Based on thwill be carrieongoing raisFigure I‐6 shDam.
I‐2.1.3 Th
The tailings compacted cycloned saon‐dam cyccentreline aThe cycloneranging betwdeposited owere discha
Dam constrmonths, unctailings dam8 ft/year witrate of pondsand produc
After the misouth abutmcrest. The dlocations to
The configuin July 2008currently at height of th
A network odrains consi
Future deve
Raiseprov
The emband
nes Ltd. ne
m Break Assess.doc
e proposed ed out to raise of the Eashows the sec
e Main Taili
impoundmeglacial till acnd was perfolones locatend downstree underflow cween 7% anon the slope arged onto th
uction was tclassified whm onto the upth the cyclond level rise inction stoppe
ine was re‐oment. For moam was raisewards the so
ration of the and a survean elevatione dam is rou
of finger draiist of coarse
elopment of
e the Cyclonvides security
set‐back embankment arthe set‐back
cx
long term dise the existist Saddle Damction of the p
ings Dam
ent was comcross the outormed usingd across theeam slope oconsisted of d 13%. No mof the dam. he tailings be
typically carrhole tailings pstream tailines making on the 1990’s ed in Decemb
opened in Ocost of 2008, ed using comouth.
e tailings facey done in 20n of 3,575 ftughly 350 ft.
ins was consmine waste
the dam inc
ne Sand Damy during init
mbankment ise the overalk of the tailin
eposition plaing dam cresm will followproposed En
mmissioned intlet of the Eag the centrele crest of thef the dam, urelatively fr
mechanical cThe cycloneeach upstrea
ried out fromwere dischaings beach. Tone completprior to tember 1998.
ctober 2004,tailings werempacted cyc
cility shown i011. The Cyc. At the cent
structed bene rock fill cov
cludes the fo
m to El. 3,587ial developm
s constructel downstreangs pond fro
TailingsA
an (KCB, 201st to an ultimw the existingnd of Mine Li
n 1972 by coast Cuisson Cine methode Cycloned Sup until the tree drainingompaction we overflow anam of the da
m March to Narged from aThe historicate pass alongmporary clos
whole tailine dischargedloned sand b
in Figure I‐3cloned Sand tre of the pre
eath the extvered by grad
llowing:
7 ft and the Nment of the S
ed with undem slope angom the crest
s Storage FacAppendix I ‐ D
12), a numbemate crest Elg downstreaife (2027) co
onstruction oCreek valley.of constructand Dam watemporary msand with fiwas appliednd "bleed" fam centrelin
November ea point near tal rate of riseg the dam crure was 4 ft/
ngs were disd from the nborrowed fr
is based on Dam was rae‐existing cr
terior Cyclonded sand an
North EarthfStep‐Back Em
erflow tailinggle, the freebof the emba
ility EmergenDam Break In
er of subseql. 3,630 ft (1am constructonfiguration
of a 100 ft h. Subsequention. Tailingsas depositedmine closure nes contentto the cyclorom the endne.
ach year. Duthe south abe of the damrest every 4 /year to 5 ft
charged primorthern portom higher c
an aerial phised in 2010reek valley, t
ned Sand Dad gravel filte
fill Dam to Elmbankment
gs. The key eboard for floankment.
ncy Preparednundation Ass
Fe
quent dam ra106.4 m). Thtion methodof the East S
igh starter dt dam raisins underflowd directly ontin Decembes historicallyned sand d of the tailin
uring the winbutment of tm crest was ayears. The at/year. Cyclo
marily from ttion of the drest elevatio
hotography s0 and 2012, athe maximum
m shell. Theer material.
l. 3,581 ft. Th.
elements of tod managem
ness Plansessment
Page I‐5
ebruary 2013
aises he d. Saddle
dam of g with from to the er 1998. y
ngs line
nter the about average oned
the dam on
survey and is m
e finger
his
the ment,

Gibraltar MinGibraltar Min
130206‐AppI‐Dam
M01527A68.730
The emb
The betw
The
The and
I‐2.1.4 Ta
I‐2.1.4.1 Fre
According tothe free watwill advanceelevation anrise by 55.9 while the fretailings ponto 2016, and
I‐2.1.4.2 Po
As shown onSaddle Damrepose follobased on a tvarious typetailings failuTaking into overflow taiminimum likthe bulk of ttailings migh
In the 2027 15 m deep. This is expecthis study, Kwith the fre
In the long testimate the
nes Ltd. ne
m Break Assess.doc
maximum abankment 4%
total storageween 17.4 ft
minimum se
toe of the emminimum 20
ilings Pond W
ee water po
o the long teter pond is pe eastwards nd freewaterft (17.0 m) teewater pond elevation id increase at
tential tailin
n Figure I‐3, m. Figure I‐4 sowing failuretailings dames of tailingsure surface aaccount the ilings deposikely failure sthe underfloht be mobiliz
configuratioThe free wacted to be laKCB has assue water in th
term deposite stage‐stora
cx
llowable dow% along the n
e heights (floto 26.7 ft ov
et‐back of th
mbankment00 ft from th
Water Level
nd levels an
erm depositiprogressivelywith time, tr pond volumto the ultimand volume isis predicted t an average
ngs release w
a plan of theshows the pre of tailings imfailure flowinside and o
at the angle ocurrent assuit to the Eastsurface slopeow tailings wzed and carr
on, it is estimter will be uargely a solidmed that alhe event of a
tion plan (KCage relations
wnstream slnorth portio
ood storagever the life‐o
e pond from
t is located ahe North Ear
ls and Volum
d volumes
on plan, they reduced. Towards the me from 201ate pond eles predicted tto increase e rate of 3.4 f
with dam br
e existing TSrofile of thempoundmen
w study by Luoutside tailinof repose shumed overflt Saddle Damed at 5% fromwould not occried with the
mated the sunderlain by ds‐liquid suspl the overfloa breach of t
CB, 2012), thship for the
TailingsA
opes are 10%n of the emb
above operaof‐mine.
m the emban
minimum 5rthfill Dam cr
mes
e TSF will behe beach froEast Saddle12 to 2027. Tevation of 3,6o decrease bat an averagft (1.0 m) pe
reach flows
SF, the tailingassumed tants is assumecia (1981), wngs impoundould interceow tailings bm, and that tm the East Scur if the Ease water as th
pernatant woverflow taipension withw tailings unthe East Sad
he Muck3D tfree water t
s Storage FacAppendix I ‐ D
% along thebankment.
ating pond l
nkment crest
500 ft from trest.
operated suom the tailinDam. FigureThe tailings p614.7 ft (110by 68 Mm3 dge rate of 4.7er year from
gs beach is ailings beach,ed to be in twhich listeddments. Forept the dambeach slopethe tailings bSaddle Dam,st Saddle Dahe water is re
will form a reilings from thh some varianderneath thdle Dam.
tailings depothrough the
ility EmergenDam Break In
west portio
evel plus fre
t is 1,500 ft.
he Cycloned
uch that the ngs underflowe I‐7 shows tpond elevati01.8 m) fromduring the sa7 ft (1.4 m) p2017 to 202
at least 2.5 k, at a slope othe order of final observrelease of taat above its of 5%, the dbeach surfacit is conside
am failed. Hoeleased from
elatively shalhe cyclone tably consolidhe free wate
osition softwremaining li
ncy Preparednundation Ass
Fe
n of the
eeboard) ran
d Sand Dam c
aerial footpw stack depohe predictedon is predict
m 2012 to 20ame period.per year from27.
km from theof 5%. The a5° (about 9%ed angles foailings to occfailure eleva
distance fromce is lower thered that releowever, somm the pond.
llow pond, aailings depodated tailinger will be rel
ware was usefe of the min
ness Plansessment
Page I‐6
ebruary 2013
nge
crest,
rint of osition d pond ted to 027, The m 2013
East ngle of %), or cur, the ation. m the han the ease of
me
about osition. gs. In eased
d to ne. For

Gibraltar MinGibraltar Min
130206‐AppI‐Dam
M01527A68.730
the 2027 cawill be occu
The estimatbottom elevbottom is inthe event of(2012 ‐ 2013outflow rate
Table I‐1
Wat
ft
3,485
3,560
3,572
3,610
3,630
Notes: End of Mine Li
I‐2.2 Ar
KCB previouthe assessmthe B.C. Minavailable in MELP, and tCity of Ques
For this studpreviously c
A plan showCreek. A releQuesnel Rivalong Arbutthe south towould flow Arbuthnot alakes. The e
East
East
nes Ltd. ne
m Break Assess.doc
se, an additipied by the
ted water stovation of 106ncluded in thf a failure of 3) and End oes and volum
Pond Lev
ter Level
m
1062.2
1085.3
1088.8
1100.3
1106.4
fe (2027) estim
reas Down
usly undertoment, TRIM anistry of Envdigital formthey show thsnel (MELP, 1
dy, carried ocovered by th
wing the studease from thver, and evenhnot Creek, owards the halong Fredy and Beedy Crstimated dis
Saddle Dam
Saddle Dam
cx
ional assessmfree water p
orage volum62.2 m are she table becathe dam. Fig
of Mine Life (mes, as discu
vel vs. Pond
Volum
Ac
2
3 44,
8 59,
3 31,
4 39,
mates include c
nstream of
ok a dam brnd NTS mapironment, Laat for a part he potential 1992).
ut in 2012, The digital TR
dy area is prehe dam wountually enterapproximatheadwaters oCreek, Beedreeks. The flstances alon
m to Arbuthn
m to Beaver C
ment, usingpond and cyc
mes for pondhown in Tabause water sgure I‐8 show(2027) situatussed under
Water Volu
me of Water AbBottom
re‐ft m
0
,895
,700
,690
,090
cyclone overflo
the East S
eak and inunps, as well asands and Paof the studyinundation a
TRIM data inRIM data to c
esented in Fld flow alongr the Fraser tely 6.5 km dof Fredy Credy Creek, andow route alog the main f
not Creek / B
Creek / Ques
TailingsA
Muck3D, waclone overflo
levels aboveble I‐1. Only tstored belowws the stagetions which Section I‐3.2
ume
ove Breach
millionm3
0
55.4
73.6
26.0
39.1
ow tailings.
Saddle Dam
ndation asses floodplain mrks (MELP), wy area. The fareas for the
n digital formcomplement
igure I‐9. Thg ArbuthnotRiver at thedownstreamek if the watd then rejoinong Fredy anflow path fro
Beedy Creek
snel River co
s Storage FacAppendix I ‐ D
as carried ouow tailings.
e the assumethe volume ow the breache‐storage relhave been u2.
at Current
at Curre
at End of M
at End of
m
essment for maps for thewere used. Tfloodplain me 20‐year an
mat was obtat the data ab
e East Saddlt Creek, BeedCity of Quesof the dam,ter level risen the main flnd Beedy Creom the East
confluence
onfluence
ility EmergenDam Break In
ut to estimat
ed East Saddof water aboh level wouldlationships fused in asses
Comments
at breach bott
(2012 ‐ 2013) O
nt (2012 ‐ 2013
ine Life (2027) O
f Mine Life (202
East Saddle e City of QueThe tiles of T
maps were pund the 200‐ye
ained for thobove.
le Dam is locdy Creek, Besnel. There is, where watees high enoulow at the coeeks includeSaddle Dam
18 km
33 km
ncy Preparednundation Ass
Fe
te the volum
dle Dam breove the bread not be relefor the Curressing breach
s
om
Operating Level
3) Dam Crest
Operating Leve
7) Dam Crest
Dam in 2005esnel publishTRIM maps wublished by tear floods in
ose areas no
cated on Arbeaver Creek,s also a low er may overfgh. This oveonfluence ofes several sm are as follow
ness Plansessment
Page I‐7
ebruary 2013
me that
ach ach ased in ent
l
5. In hed by were the B.C. n the
t
buthnot and divide flow to erflow f the mall ws:

Gibraltar MinGibraltar Min
130206‐AppI‐Dam
M01527A68.730
East
KCB has preSaddle Daminundation scombined w
The Arbuthnsmall. The galong ArbutBeaver CreeRiver has a wand SardineThe Fraser Rof sand and
Figure I‐10 s
I‐2.3 Ar
With elimininfluence ofSection I‐4) with Cuisson
Preliminary
seep(1,60
seep
misc
Gibraltar Mcattle on a s
nes Ltd. ne
m Break Assess.doc
Saddle Dam
eviously carrim. This was costudy complwith informat
not Creek anground is heahnot, Beedyek has a wellwide flow che Flats areas,River is the lagravel, and
shows the m
reas Down
ation of an of a tailings dawould be ren Creek (dist
review of th
page collectio00 ft) downs
page Pump H
cellaneous ac
ine reports tsemi‐perman
cx
m to Quesnel
ied out a groonducted oneted in 2005tion from av
nd Beedy Creavily timberey and Fredy C‐defined chahannel, typic the river baargest river iriprap in som
major crossin
nstream of
overtopping am flowslideestricted to ttance of app
his downstre
on ditches astream from
House No. 6
ccess roads a
that there arnent basis.
l River / Fras
ound and airn 12 and 13 O5. The observailable map
eek channelsed along theCreeks is somannel with tically with sananks are genin the studyme sections
g located im
the Main
failure mece is much mohe catchmeproximately 4
eam area ind
nd pond at tthe toe of th
with associa
and forestry
re no perma
TailingsA
ser River con
r reconnaissaOctober, 200rvations madping.
s downstreae first 7 km omewhat swambered bannd and graveerally coverearea. Its ban.
mmediately u
Tailings Da
hanism to reore limited. Tnt of East Cu4.3 km from
dicates the fo
the Seepagehe tailings d
ated pipeline
y roads.
nent inhabit
s Storage FacAppendix I ‐ D
nfluence
ance of the a04, respectivde during the
m of the Easof Arbuthnotmpy with mnks above thel banks. Exced with treenks in the Qu
upstream, an
am
elease the taThe effects ouisson Creek the dam toe
ollowing infr
e Recovery Dam;
es and powe
tants in this
ility EmergenDam Break In
91 km
areas downsvely, as part e reconnaiss
st Saddle Dat Creek. The meandering she bank full lcept for the es above the uesnel area
nd within the
ailings pond,of such a slidk upstream oe).
rastructure m
Dam located
er supply line
area, but it i
ncy Preparednundation Ass
Fe
stream of thof the damsance have b
m are relativremaining tetream channevel. The QuCity of Quesbank‐full levgenerally co
e City of Que
the downstde (confirmeof its conflue
may be affec
about 0.5 km
es; and,
is used to gr
ness Plansessment
Page I‐8
ebruary 2013
e East break been
vely errain nels. uesnel snel vel. onsist
esnel.
tream ed in ence
cted:
m
raze

Gibraltar MinGibraltar Min
130206‐AppI‐Dam
M01527A68.730
I‐3 EA
I‐3.1 Da
The CDA Dawhen detera dambreak
“Sunmay
“Floogrea
Two modes overtoppingnormally assconsidered tlarge flood i
I‐3.2 Th
The HEC‐RAby the US Ainput and prmodel, and maps using
HEC‐RAS haan unsteadythe hydrogr
The HEC‐RArelationshipthe dam theand as showQuesnel Riv
ApprsomCree
Abou
nes Ltd. ne
m Break Assess.doc
AST SADDL
am Failure
m Safety Gumining the pk:
nny day failu be caused b
od induced fter than the
of failure wg failure. A psumed to octo be a “rainnflow condi
he HEC‐RAS
AS hydrodynarmy Corps orocessing of the HEC‐RASGIS software
s a paramety flow simularaph downst
AS model creps for the cure model simuwn on Figurever and Frase
roximately 6e flow contiek to the eas
ut 23 km of
cx
LE DAM BR
e Modes
uidelines (CDpotential ext
re” – These by earthquak
failures” – The dam can sa
ere consideriping failureccur when thny day” or “ftions, where
S Model
amic compuf Engineers wthe results. S results cane.
ric dam breaation. HEC‐Rream, to est
ated for thisrrent situatioulates flow aI‐9. The moer River as fo
6.5 km of Arbnuing along t.
Fredy and Be
REACH AND
DA, 2007) sugtent of the d
are sudden ke, misopera
hese are failfely pass.
red for the Ee of a dam ishe pond is atflood inducee the pond w
ter model anwere used foIt allows imn be exporte
ach routine tRAS can alsotimate the h
s study includon, and the ealong the credel consistsollows:
buthnot Creethe Arbuthn
eedy Creek,
TailingsA
D INUNDA
ggest that thownstream
dam failuresation of the d
ures of the d
East Saddle Dconsideredt its normal od” failure. Owater level ri
nd the HEC‐Gor this studyportation ofd to HEC‐Ge
that can calcbe used to sydraulic con
des the TSF,end of the meek and riverof the Arbut
ek, from thenot Creek to
from the flo
s Storage FacAppendix I ‐ D
ATION ASSE
he followingareas subjec
s that resultdam, or othe
dam coincid
Dam, namelyto be a “sunoperating levOvertoppingises high eno
GeoRAS pre‐y. HEC‐GeoRf topographieoRAS for pr
culate a breasimultaneounditions at cr
representedmine’s operar systems, asthnot Creek
e East Saddlethe west, an
ow split to re
ility EmergenDam Break In
ESSMENT
conditions bct to inunda
during normer event.
ent with a fl
y: piping failnny day” failvel. An overof dams typough to over
‐and post‐prAS simplifiesc data into toduction of
ach outflow usly perform ritical downs
d by stage‐sttional lifetims described u, Fredy Cree
e Dam to a flnd some flow
ejoin with th
ncy Preparednundation Ass
Fe
be consideretion in the e
mal operatio
ood of magn
ure and ure which istopping failuically occursrtop the dam
rocessor devs the modelthe HEC‐RASflood inund
hydrographflood routinstream locat
torage me. Downstrunder Sectioek, Beaver Cr
ow split, witwing onto Fr
e Arbuthnot
ness Plansessment
Page I‐9
ebruary 2013
ed event of
ons and
nitude
ure is s during m.
veloped data S ation
within ng of tions.
ream of on I‐2.2 reek,
th redy
t Creek.

Gibraltar MinGibraltar Min
130206‐AppI‐Dam
M01527A68.730
ApprArbuwith
Apprthe RCree
Abouof th
I‐3.2.1 To
Topographycross‐sectioparameteriz
The TRIM dawas preprocthe model dto obtain m
Bridges andRAS flood robridges on lBridge appeThese bridgare not was
The bridges washed outflows from a
I‐3.2.2 Ini
With the cuArbuthnot Cconstructed
a nominal ladownstreambe high for tthat would bwater levels
The CDA Dadam break ibreach even
nes Ltd. ne
m Break Assess.doc
roximately 1uthnot Creek the Quesne
roximately 5River Quesnek was also in
ut 4 km of thhe Fraser Riv
opography an
y is input to Hns and theirzation of the
ata was usedcessed in thedomain. Numodel numeri
other inlineouting analysocal roads dear to be lowes and the rhed out.
in Quesnel a, particularlya dam failure
itial and Con
rrent TSF opCreek. The TSd. Since the H
ateral inflowm of the damthe stream ibe released s downstream
m Safety Gunundation ant.
cx
15 km consisk, and Beaveel River.
57 km of the el, extendingncluded.
he Fraser Rivver, extendin
nd Other Ph
HEC‐RAS via r spacing aloe numerical m
d to set up the Geo HEC‐Rmerous otheical stability.
e structures dses. Based oownstream
w enough to oad embank
appear to bey as the mode are signific
ncurrent Flow
peration, no SF is designeHEC‐RAS pro
w (i.e., a basem to facilitatemmediatelydue to a damm of the dam
uidelines (CDassessment s
ting of the Ber Creek from
Quesnel Rivg approxima
ver downstreng approxima
hysical Featu
the use of cng the rivermodel.
he HEC‐RASRAS package,r cross sectio.
downstreamon the 2004 gof the East Sbe inundatekments will t
e elevated sudel results dicantly attenu
ws in Stream
flows are dised to store togram canno
e flow) of 20e model sim downstreamm breach anm.
DA, 2007) stashould be th
TailingsA
Beedy Creekm its conflue
ver to its conately 5km up
eam of the cately 6km up
ures
cross‐sectiondetermine t
model for th, and a totalons were int
m of the Eastground and aSaddle Dam,ed by the flootend to retai
uch that it isscussed lateuated when
ms and River
scharged thrhe 30 day PMot simulate a
m3/s was arulations. Altm of the damd would hav
ate that dowose most pr
s Storage FacAppendix I ‐ D
reach downence with Be
nfluence withpstream of th
confluence wpstream of t
ns drawn acrthe geometr
he area dowof 376 crosstroduced thr
Saddle Damair reconnai, the Beaverod resultingin a small am
s less likely ther under Secthey reach t
rs
rough the EaMF, and at c dry flow ch
rtificially prothough this fm, it is very sve negligible
wnstream tribrobable to oc
ility EmergenDam Break In
nstream of theedy Creek to
h the Fraser he confluenc
with the Quethe confluen
ross the riveric and hydra
wnstream of s‐sections wrough interp
m were not inissance, the r Creek Bridgfrom a brea
mount of floo
hey would rection I‐3.3 shthese locatio
ast Saddle Dclosure, a spiannel down
ovided immefictitious flowsmall compae effect on th
butary flow cccur coincid
ncy Preparednundation Ass
Fe
he confluenco the conflue
River. A reace with the B
esnel River. Ance was inclu
r or creek. Taulic
the dam. Thwere sampledpolation, prim
ncluded in thsmall woodege and the Gach at the daod water, if t
etain water,ow that flooons.
am into theillway will bestream of th
ediately w may appeared to the flhe discharge
conditions inent with the
ness Plansessment
Page I‐10
ebruary 2013
ce with ence
ach of Beaver
A reach uded.
hese
he data d across marily
he HEC‐ en ravelle am. they
or be od
e he dam,
ar to ow e and
n a e

Q
Gibraltar MinGibraltar Min
130206‐AppI‐Dam
M01527A68.730
Mean annuadam breach
River are rewhich is the
In the dam f2007), and b“Extreme” c“Extreme” cEast Saddle assessmentFlood (PMF)conditions d
Flows in theRiver near Qconfluence at gauging sconfluence t
Table I‐2 bethe dam brecases.
The 1 in 20 yfollowing a d
Although ththe catchmeat the statioQuesnel is cstation 08KH
Table I‐2
Beaver Creek u
Quesnel River a
Fraser River at S
Notes: Mean annual ahydrometric stThe PMF valueshown are from*Minimum flo
nes Ltd. ne
m Break Assess.doc
al flows (MAh and inunda
latively smae assumed ba
failure classibased on theconsequencecategory, as Dam height. The Inflow ). The “rainydownstream
e Quesnel RivQuesnel), whof the Quesnstation 08KE0the Fraser a
low gives theach model
year and 1 indam break, w
e gauging stent area beton (MELP, 19considered toH006 were u
Estimate
Location
/s of Quesnel R
at Station No. 08
Station No. 08K
and 200‐year ftation nos. 08Kes are based onm the best‐fit cw required to
cx
AF) were assution model r
ll, and concuase flow in t
fication, unde results of te facility (KChigher breac, compared Design Floo
y day” overto.
ver were hishich is locatenel and Fras002 (Fraser nd Quesnel
e flow estimruns. The co
n 200 year flwith the nat
tation on theween the ga992). Therefoo be negligibused without
ed Naturally
n
River
8KH006 near Q
KE002 at Quesn
lows in QuesneKH006 and 08Kn the Probable curve for Zone run model.
umed to be truns. The str
urrent flowshe HEC‐RAS
dertaken in ahe 2005 damB, 2011). It ich flows areto those cond for dams wopping failur
torically meed in the Sarder Rivers (seRiver at QueRivers.
mates used fooincident flo
ood flow estturally occur
e Quesnel Riauging statioore, the locable, and the t further adj
Occurring F
Catc
uesnel
nel
el and Fraser RKE002, respectiMaximum Flo12A as defined
TailingsA
the concurrereams betwe
in those stremodel.
accordance wm break inuns consideredexpected tonsidered in twith Extremere scenarios
asured at strdine Flats aree Figure I‐9)esnel), which
or the analyow was enter
timates werrring flood flo
ver is abouton and the Cial inflow betwflow estimatustment.
lows in the
chment Area (km2)
450
11050
97900
Rivers are basedvely, as assessod Estimator fod in the estima
s Storage FacAppendix I ‐ D
ent flows foeen the East
eams have b
with the CDAndation studd likely the fo result fromthe 2005 dame classificatiwere theref
ream gauginrea approxim). Flows in thh is located a
yses. The MAred into the
re used to coows in the Q
35 km upstrity of Quesnween the gates for the st
Rivers
MAF
20*
250
1090
d on flow recosed in the MELPor British Coluator.
ility EmergenDam Break In
r the “sunnyt Saddle Dam
been assume
A Dam Safetdy, the TSF wfacility will rem the larger wm break inunon is the Profore run coin
ng station 08mately 35 kmhe Fraser Rivabout 0.5 km
AF and PMF f model as co
ompare the pQuesnel and
ream of the nel is only 2%auging statiotream gaugi
Flow (m
20‐Year
‐
1060
5520
rds at Water SP (1992) study.mbia (AAFC, 20
ncy Preparednundation Ass
Fe
y day” pipingm and the Qu
ed to be 20 m
ty Guidelineswas classifiedemain in thewater volumndation obable Maxincident with
8KH006 (Quem upstream over were mem upstream o
flows were uonstant flow
predicted floFraser River
City of Ques% larger thanon and City ong
m3/s)
200‐Year
20*
1300
6100
urvey of Canad. 010). The PMF
ness Plansessment
Page I‐11
ebruary 2013
g failure uesnel
m3/s,
s (CDA, d as an e me, or
mum PMF
esnel of the asured of the
used in ws in all
ows rs.
snel, n that of
PMF
965
7370
29460
da
values
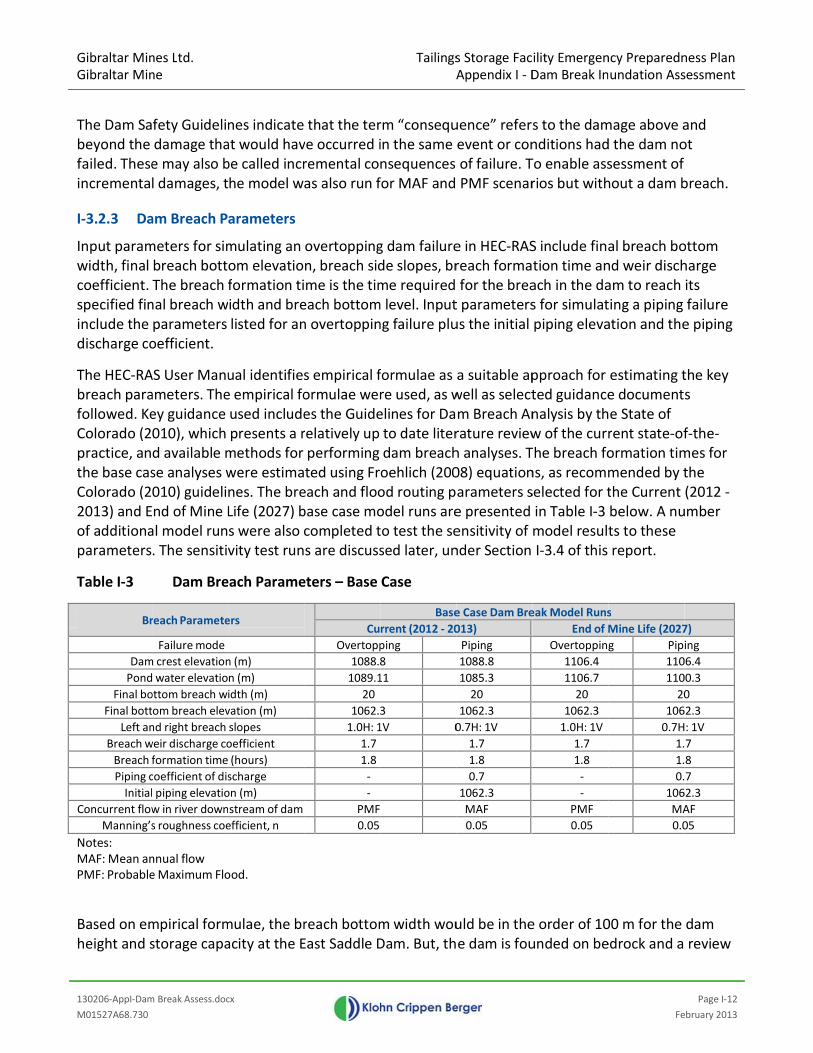
Gibraltar MinGibraltar Min
130206‐AppI‐Dam
M01527A68.730
The Dam Sabeyond the failed. Theseincrementa
I‐3.2.3 Da
Input paramwidth, final coefficient. specified fininclude the discharge co
The HEC‐RAbreach parafollowed. KeColorado (2practice, anthe base casColorado (22013) and Eof additionaparameters
Table I‐3
Br
Dam
Pond
Final bo
Final bott
Left an
Breach w
Breach f
Piping c
Initial
Concurrent flow
Manning’s
Notes: MAF: Mean anPMF: Probable
Based on emheight and s
nes Ltd. ne
m Break Assess.doc
fety Guidelindamage thae may also bl damages, t
am Breach P
meters for simbreach bottThe breach fnal breach wparameters oefficient.
AS User Manuameters. Theey guidance 010), which d available mse analyses w010) guidelind of Mine Lal model run. The sensitiv
Dam Bre
reach Paramete
Failure mode
m crest elevation
water elevatio
ottom breach w
om breach elev
nd right breach
weir discharge co
formation time
coefficient of dis
piping elevatio
w in river down
s roughness coe
nnual flow e Maximum Flo
mpirical formstorage capa
cx
nes indicateat would havbe called incrhe model w
arameters
mulating an om elevatioformation ti
width and brelisted for an
ual identifiese empirical foused includepresents a rmethods for were estimanes. The breLife (2027) bs were also cvity test run
each Parame
ers
n (m)
n (m)
idth (m)
vation (m)
slopes
oefficient
(hours)
scharge
on (m)
stream of dam
efficient, n
ood.
mulae, the bracity at the E
that the terve occurred iremental coas also run f
overtoppingn, breach sidme is the timeach bottomn overtoppin
s empirical formulae weres the Guiderelatively upperformingted using Freach and floobase case mocompleted ts are discuss
eters – Base
Cu
Overtopp
1088.8
1089.1
20
1062.3
1.0H: 1
1.7
1.8
‐
‐
PMF
0.05
reach bottomEast Saddle D
TailingsA
rm “consequin the same nsequencesfor MAF and
g dam failurede slopes, brme requiredm level. Inputng failure plu
formulae as re used, as welines for Dato date literdam breachoehlich (200od routing podel runs areto test the sesed later, un
Case
Base
rrent (2012 ‐ 20
ping
8
11
3
1V 0
m width wouDam. But, th
s Storage FacAppendix I ‐ D
uence” referevent or conof failure. T PMF scenar
e in HEC‐RASreach forma for the breat parametersus the initial
a suitable apwell as selectm Breach Anrature reviewh analyses. T08) equationarameters se presentedensitivity of nder Section
e Case Dam Bre
013)
Piping
1088.8
1085.3
20
1062.3
0.7H: 1V
1.7
1.8
0.7
1062.3
MAF
0.05
uld be in thee dam is fou
ility EmergenDam Break In
s to the damnditions hadTo enable assrios but with
S include fination time anach in the das for simulatpiping eleva
pproach for ted guidancenalysis by thw of the currThe breach fons, as recommselected for tin Table I‐3 model resultI‐3.4 of this
eak Model Runs
End of M
Overtoppin
1106.4
1106.7
20
1062.3
1.0H: 1V
1.7
1.8
‐
‐
PMF
0.05
e order of 10unded on be
ncy Preparednundation Ass
Fe
mage above ad the dam nosessment of hout a dam b
al breach bond weir discham to reachting a pipingation and the
estimating te documente State of rent state‐oformation timmended by tthe Currentbelow. A nuts to these report.
s
Mine Life (2027
g Pip
110
110
20
106
0.7H
1.
1.
0.
106
MA
0.0
00 m for theedrock and a
ness Plansessment
Page I‐12
ebruary 2013
and ot
breach.
ottom harge its failure e piping
the key s
f‐the‐ mes for the (2012 ‐ umber
7)
ing
06.4
00.3
0
62.3
: 1V
7
8
7
62.3
AF
05
dam review

Gibraltar MinGibraltar Min
130206‐AppI‐Dam
M01527A68.730
of drill hole width. The eSince the avwidth of 20 dimensions size would b
I‐3.3 Da
I‐3.3.1 Pip
The results fruns are shodownstreamthe East Sadthe MAF watime of the
Figure I‐12 ashowing howBase Case, tscenario givattenuationHowever, byapproximatLife (2027). indicated on1.5 times thmanagemenpeak flow isincluding evDam.
The combinattenuated about 54% oexpected to
Table I‐4 shomaximum flQuesnel, areflow rates athe Current capable of aof Mine Life
nes Ltd. ne
m Break Assess.doc
data indicatestimated bevailable bream was selec(i.e., breachbe restricted
am Breach
ping Failure
for the Curreown in Tablem flood routeddle Dam; thater level; thpeak from th
and Figure I‐w the breachthe peak outves a lower p in the first sy the time thely 1960 m3/The estimatn Table I‐2. Te river’s natnt measures estimated avacuation, w
ed flow in thdam break fof the river’so have minim
ows that whlood levels toe higher for t the downssituation, coattenuating te (2027) scen
cx
tes that the bedrock locatch bottom wcted for the dh bottom widd by the bedr
h and Inund
ent (2012 ‐ 2e I‐4. The tabe, showing the estimatede time to reahe dam.
‐13 show theh flows are atflow at the dpeak outflowsteep reach he flood reac/s for the Cued flood flowThe peak flowtural flows fr are generalat about 10 twill be require
he Fraser Rivflows dischas 1 in 20 yeamal impact on
ile the End oowards the dthe Current tream extenompared to the lower flonario gives q
bedrock geoion, and thewidth is mucdam breachdth and brearock under t
dation Ana
2013) and Enble gives inunhe estimated MAF waterach peak wa
e flood hydroattenuated adam is estimw, about 4800of Arbuthnoches the mourrent (2012ws in the Quw with damrom a 1 in 20ly designedtimes the 1 ied with an o
ver consistinrging from tr flood flowsn the Fraser
of Mine Lifedownstream(2012 ‐ 2013nt, and is conthe End of Mow volumesuicker peak
TailingsA
ometry woulde assumed brch smaller thanalysis. Noach bottom ehe dam.
alyses Resu
nd of Mine Lndation chard peak floodr level withoater level fro
ographs at salong the flomated at 10,60 m3/s. Resuot Creek up tuth of the Q‐ 2013) scen
uesnel River breach flow00 year evento in Britishn 200 year fonset of flood
g of the assuhe Quesnel s. Therefore,River.
(2027) scenam extent of t3) scenario.nsidered to bMine Life situfrom an Endflood arriva
s Storage FacAppendix I ‐ D
d limit the oreach geomehan the theoo sensitivity aelevation) w
ults
Life (2027) Baracteristics ad level causeut a breach;om the start
elected poinood path. For600 m3/s. Thults indicateto the flow sQuesnel Rivenario, and 14include the
ws in Quesnent, the standColumbia. Inflow. Therefod flows from
umed MAF dRiver, is esti, a breach of
ario gives hihe model, inThis correspbe due to thuation. The Qd of Mine Lifl times. The
ility EmergenDam Break In
opening to onetry, are shoretical widthanalysis for t
was carried o
ase Case pipat selected ped by the rel the rise in wof dam brea
nts along ther the End of he Current (2there is limisplit into Frer, the peak f450 m3/s forestimated Ml is approximdard to whichn the Sardinore, additionm a breach of
during the damated at 30f the East Sa
gher peak bncluding throponds to thee much largQuesnel Rivefe scenario. Hpeak of the
ncy Preparednundation Ass
Fe
nly about 20own in Figureh, a breach bthe breach ut since the
ping failure mpoints alongease of watewater level aach; and the
e flood routeMine Life (22012 ‐ 2013)ited flow dy Creek. flow attenuar the End of MMAF of 250 mmately 1.1 toh flood risk e Flats area,nal measuref the East Sa
am break, an000 m3/s. Thaddle Dam is
reach flow rough the Citye estimated per flow voluer would beHowever, thflood is esti
ness Plansessment
Page I‐13
ebruary 2013
0 m e I‐11. bottom
breach
model the er at above travel
e, 2027)
ates to Mine m3/s, as o
, the s, addle
nd the is is s
rates, y of peak mes in more e End mated

Gibraltar MinGibraltar Min
130206‐AppI‐Dam
M01527A68.730
to reach theoutflow at tscenario, th
Figure I‐14 istudy area. larger scale.
nes Ltd. ne
m Break Assess.doc
e Quesnel anhe dam in the travel time
s map showFigure I‐15 a.
cx
nd Fraser Rivhe Current (2e is 10 hours
wing the estimand Figure I‐
ver confluenc2012 ‐ 2013)s 30 minutes
mated areal16 show the
TailingsA
ce approxim) condition, ws.
flood inundae Sardine Fla
s Storage FacAppendix I ‐ D
mately 10 houwhile for the
ation extentats and Ques
ility EmergenDam Break In
urs 55 minute End of Min
t from a pipisnel areas re
ncy Preparednundation Ass
Fe
tes after thene Life (2027
ng failure foespectively, a
ness Plansessment
Page I‐14
ebruary 2013
e peak 7)
or the at a

Gibraltar Gibraltar
130206‐AppI‐
M01527A68.7
Table I‐4
East Saddle
Arbuthnot C
Fredy Creek
Beedy Cree
Quesnel Riv
Quesnel Riv
Quesnel Riv
City of Ques
Quesnel an
Fraser River
Mines Ltd. Mine
‐Dam Break Assess
730
4 Inund
L
Dam
Creek at divide
k upstream of P
ek, d/s of Arbut
ver at confluenc
ver at Gravelle B
ver at pipeline c
snel (Railway Br
d Fraser River c
r, 4km downstre
s.docx
dation Chara
Location
with Fredy Cree
hilemon Lake
hnot Creek
ce with Beaver C
Bridge, Sardine
crossing u/s of C
ridge u/s of Hig
confluence
eam of confluen
acteristics at
ek
Creek
Flats
City of Quesnel
hway 97)
nce
Selected Lo
Distancd/s of Da
(km)
0
6.9
8.9
18.2
32.3
52.2
82.2
87.5
90.2
94.7
ocations – Pi
ce am
EstimatFlood Lefor MAF owithout DBreach (
1062.6
845.5
833.1
741.4
577.1
541.3
484.8
476.7
473.4
470.7
iping Failure
ted evel only Dam (m)
Peak
Cur(2012
6 48
5 47
1 4
4 35
1 35
3 27
8 20
7 20
4 19
7 30
e Base Case
flow followingincluding the M
(m3/s)
rrent ‐ 2013)
EnL
800
700
440
540
550
740
080
080
960
000
g a Breach MAF
nd of Mine Life (2027)
10600
10100
1510
5340
4450
2380
1570
1550
1450
2470
Peak Flood LeMA
Current (2012 ‐ 2013)
1074.3
849.1
836.5
747.8
581.2
544.4
488.9
479.5
475.4
472.5
evel, Breach pluF Flows (m)
)End of MiLife (202
1079.1
850.6
838.4
749.1
581.9
544.2
488.1
478.8
474.8
472.1
us Estima
ine 7)
Curr(2012 ‐
1 11
3.
3.
6.
4.
3.
4.
2.
2.
1.
ted Rise in Watabove MAF
(m)
rent ‐ 2013)
EndLif
1.7
.6
.4
.4
.0
.1
.1
.7
.0
.8
ter Level
d of Mine fe (2027)
16.5
5.1
5.3
7.7
4.7
2.9
3.3
2.1
1.4
1.3
Time to Peak FStart o
(hr
Current (2012 ‐ 2013)
1hr 50min
2hr 05min
2hr 35min
2hr 55min
3hr 55min
6hr 30min
11hr 10min
11hr 30min
12hr 45min
13hr 10min
Tailings StoApp
Flood Level fromf Breach min)
End of MinLife (2027
50min
1hr 00min
1hr 15min
1hr 45min
2hr 40min
5hr 10min
9hr 50min
10hr 20mi
11hr 20mi
11hr 45mi
orage Facilitypendix I ‐ Dam
m Travel T
ne 7)
Curr(2012 ‐
‐
n 15m
n 45m
n 1hr 05
n 2hr 05
n 4hr 40
n 9hr 20
in 9hr 40
in 10hr 5
in 11hr 2
Emergency Pm Break Inund
Time of Peak Flfrom the Dam
(hr min)
rent ‐ 2013)
EnLif
‐
min
min
5min 1h
5min 1h
0min 4h
0min 9h
0min 9h
55min 10
20min 10
Preparednessation Assessm
Pa
Februar
ood Level m
d of Mine fe (2027)
‐
10min
20min
hr 00min
hr 55min
hr 20min
hr 00min
hr 30min
hr 30min
hr 55min
Planment
ge I‐15
y 2013

Gibraltar MinGibraltar Min
130206‐AppI‐Dam
M01527A68.730
I‐3.3.2 Ov
Table I‐5 shoovertoppingEast Saddle PMF water lof the peak
For the End failure is est7900 m3/s. Froute. For thflows downsColumbia (A(2012 ‐ 2013flows enter peak flow atscenarios artheir own, w
Table I‐4 anovertoppingunder Sectio
Again in thismaximum flQuesnel, are
The peak of35 minutes 15 minutes
The estimatFigure I‐19. presented in
nes Ltd. ne
m Break Assess.doc
vertopping F
ows the resug failure modDam; the eslevel; the timfrom the da
of Mine Lifetimated at 1Figure I‐17 ahe overtoppstream. TheAAFC, 2010).3) and 14,50the Quesnettenuates tore assessed cwithout a da
d Table I‐5 ig case coincion I‐3.3.1 ab
s case, altholood levels toe higher for
the flood is after the pein the End o
ted areal flooInundation n Figures I‐2
cx
Failure
ults for the Cdel runs. Thestimated PMme to reach pm, are given
e (2027) Base6200 m3/s, wand Figure I‐1ing scenarioPMF values As shown o00 m3/s for thl River. By tho approximatconcurrent wm breach.
ndicate thatdent with Pbove.
ugh the Endowards the dthe Current
estimated tak outflow af Mine Life (
od inundatioExtents for t0 and I‐21 re
Current (201e estimated MF water levepeak water ln for selected
e Case, the pwhile for the18 show theos, failure is a are based oon Table I‐5,he End of Mhe time the ftely 10,500 mwith PMF flo
t the incremMF, compar
of Mine Lifedownstream(2012 ‐ 2013
o reach theat the dam in(2027) scena
on extent frothe Sardine espectively.
TailingsA
2 ‐ 2013) anpeak flood leel without alevel from thd points alon
peak outflowe Current (20e flood hydroassumed to on the Probacombined fline Life (202flood reachem3/s and 980ws, which w
ental flood dred to the ‘su
e (2027) scenm extent of t3) scenario.
Quesnel andn the Currenario.
om the damFlats and Cit
s Storage FacAppendix I ‐ D
d End of Minevel causedbreach; thehe start of dang the down
w at the dam012 ‐ 2013) sographs at sebe coincidenable Maximuows as high27) are estimes the mouth00 m3/s, reswould cause
depths are eunny day’ pi
nario gives hhe model, in
d Fraser Rivent (2012 ‐ 20
to the overty of Quesne
ility EmergenDam Break In
ne Life (2027by the relearise in wateam breach; anstream floo
m resulting frscenario, it iselected poinnt with relatum Flood Estas 13,400 m
mated whereh of the Quepectively. Thextensive flo
expected to iping failure
higher peak ncluding thro
er confluenc13) conditio
rtopping failuel areas at a
ncy Preparednundation Ass
Fe
7) Base Casease of waterer level abovand the travod route.
rom an overts estimatednts along thetively large Ptimator for Bm3/s for the Ce the dam brsnel River, the overtoppood damage
be lower in case discus
breach flowough the City
ce about 9 hoon, 7 hours
ure is shownlarger scale
ness Plansessment
Page I‐16
ebruary 2013
e at the e the vel time
topping at e flood PMF British Current each he ing e on
the sed
rates, y of
ours
n on are

Gibraltar Gibraltar
130206‐AppI‐
M01527A68.7
Table I‐5
East Saddle
Arbuthnot C
Fredy Creek
Beedy Cree
Quesnel Riv
Quesnel Riv
Quesnel Riv
City of Ques
Quesnel an
Fraser River
Mines Ltd. Mine
‐Dam Break Assess
730
Inund
L
Dam
Creek at divide
k upstream of P
ek, d/s of Arbut
ver at confluenc
ver at Gravelle B
ver at pipeline c
snel (Railway Br
d Fraser River c
r, 4km downstre
s.docx
dation Chara
Location
with Fredy Cree
hilemon Lake
hnot Creek
ce with Beaver C
Bridge, Sardine
crossing u/s of C
ridge u/s of Hig
confluence
eam of confluen
acteristics at
ek
Creek
Flats
City of Quesnel
hway 97)
nce
Selected Lo
Distancd/s of Da
(km)
0
6.9
8.9
18.2
32.3
52.2
82.2
87.5
90.2
94.7
ocations – Ov
ce am
EstimatFlood Lefor PMF owithout DBreach (
1062.6
845.5
833.1
741.4
584.7
547.8
496.3
494.5
494.4
490.4
vertopping F
ted evel only Dam (m)
Peak
Cur(2012
6 79
5 78
1 11
4 54
7 13
8 11
3 10
5 10
4 10
4 39
Failure Base
Flow followingincluding the P
(m3/s)
rrent ‐ 2013)
EnL
900
800
180
440
3400
1000
0700
0500
0500
9950
e Case
g a Breach PMF
nd of Mine Life (2027)
16200
16200
3770
7700
14500
10600
10100
9800
9800
39300
Peak Flood LePMF
Current (2012 ‐ 2013)
1077.2
850.1
838.0
749.1
587.6
549.8
497.7
495.6
495.4
491.5
evel, Breach pluF Flows (m)
End of MinLife (2027
1082.5
851.9
840.7
750.4
588.2
549.5
497.3
495.2
495.1
491.1
us Estima
ne 7)
Curr(2012 ‐
14
4.
4.
7.
2.
2.
1.
1.
1.
1.
ated Rise in Waabove PMF
(m)
rent ‐ 2013)
EnLi
4.7
.6
.9
.8
.8
.0
.4
.1
.1
.1
ter Level
nd of Mine fe (2027)
20.0
6.4
7.6
9.0
3.5
1.6
1.0
0.8
0.7
0.7
Time to Peak Start of Br
Current (2012 ‐ 2013)
1hr 50min
2hr 00min
2hr 20min
2hr 45min
3hr 45min
5hr 45min
10hr 05min
10hr 50min
11hr 20min
11hr 35min
Tailings StoApp
Flood Level froreach (hr min)
End of MLife (202
50min
55min
1hr 10m
1hr 40m
2hr 30m
4hr 40m
7hr 05m
8hr 00m
8hr 05m
8hr 10m
orage Facilitypendix I ‐ Dam
om Travelfro
ine 27)
Cur(2012
15
min 35
min 1hr 0
min 2hr 0
min 4hr 0
min 8hr 2
min 9hr 0
min 9hr 3
min 9hr 5
Emergency Pm Break Inund
Time of Peak Fom the Dam (h
rrent ‐ 2013)
EnL
‐
5min
5min
00min
00min 1
00min 3
20min 6
05min 7
35min 7
50min 7
Preparednessation Assessm
Pa
Februar
lood Level r min)
nd of Mine Life (2027)
‐
10min
20min
50min
1hr 40min
3hr 50min
6hr 20min
7hr 10min
7hr 15min
7hr 20min
Planment
ge I‐17
y 2013

Gibraltar MinGibraltar Min
130206‐AppI‐Dam
M01527A68.730
I‐3.3.3 Co
A number odeveloped bderived, almthe peak breCosta (1985
As can be seoutflow estithe derived be reasonab
I‐3.3.4 Co
Floodplain mfloods in theand backgro1992) which
KCB has comin the Quesnthe MELP min the MELPincluded baHowever, anshown on Fiwider. Thus,considered trepresentat
I‐3.4 M
I‐3.4.1 Se
The model rwould resuldownstreamwater level Current (201shows the m
nes Ltd. ne
m Break Assess.doc
omparison of
f empirical rby others bamost exclusiveach flow es5) and Froehl
een on Figurimates fromempirical reble, based on
omparison of
maps, showie City of Queound informh originally a
mpared the Mnel and Fras
mapping is larP study have thymetric sun overlay of igure I‐23. Th, although dthat the pretive.
odel Sensi
nsitivity Mo
results, discut in higher flm, comparedrise, would b12 ‐ 2013) pimain breach
cx
f Breach Out
relationshipssed on revievely, from wastimates fromlich (1995).
e I‐22, the ethe HEC RA
elationships.n compariso
f Flow Routi
ng the potenesnel were oation on theccompanied
MELP floodper Rivers, burgely limiteddifferent reurvey data, wthe 2 floodphe flood extetailed calibdicted flood
itivity Ana
odel Run Sce
ussed under lood levels ind to the End be higher wiiping failure and flood flo
tflow Result
s relating daew of failureater retaininm the HEC‐R
mpirical relaS assessmen Accordinglyon with these
ing Results w
ntial inundatobtained. Thee floodplain md the maps.
plain maps wut without ad by the factsolutions. Adwhich was noplain extentsents closelybration of thed extents and
lyses
enarios
Section I‐3.3n the main pof Mine Lifeth a piping fscenario waow routing p
TailingsA
ts to Case Hi
m size, storecase historyng dam failurRAS assessme
ationships shnt lie reasonay, the HEC‐RAe empirically
with City of Q
tion areas foe floodplainmapping ma
with the moddam breachthat the topdditionally, rot be availabs was preparmatch, withe HEC‐RAS md estimated
3, indicate thpopulated are (2027) condfailure compas thereforeparameters u
s Storage FacAppendix I ‐ D
istory Derive
ed volume, ay data. The eres. Figure I‐ent, with the
how significaably close toAS breach oy‐derived rel
Quesnel Flo
or the 1 in 20maps wereay be found
del run for thh. Detailed copographic dariver cross seble for HEC‐Rred, for comh the HEC‐RAmodel couldincremental
hat the Currreas of Sardidition. Increpared to an oselected forused in the s
ility EmergenDam Break In
ed Relations
and breach tempirical rel‐22 presentse empirical r
ant scatter. Ho the trendliutflow estimlationships.
ood Mapping
0 year and thpublished bin the Desig
he scenario womparison oata in this HEections for tRAS model sparison purpAS extent genot be undel flood impa
ent (2012 ‐ 2ne Flats andmental impaovertopping r sensitivity tsensitivity te
ncy Preparednundation Ass
Fe
s
type have beationships ws a comparisorelations from
However, thnes represenmates are jud
g
he 1 in 200 yby the B.C. Mn Brief (MEL
with 1 in 200or calibrationEC‐RAS modhe MELP stustudy reach. poses. This isnerally slighertaken, it is cts are suffic
2013) conditd City of Queact, in termsfailure. Thetesting. Tablest runs.
ness Plansessment
Page I‐18
ebruary 2013
een were on of m
e peak nting dged to
year MELP, LP,
0 flows n with el and udy
s tly
ciently
tion esnel s of
le I‐6

1
M
GG
T
F
D
P
F
F
L
B
B
P
I
CF
M
NMP
130206‐AppI‐Dam Brea
M01527A68.730
Gibraltar Mines LGibraltar Mine
Table I‐6 D
Breach Para
Failure mode
Dam crest elevation
Pond water elevatio
Final bottom breach
Final bottom breach
Left and right breach
Breach weir discharg
Breach formation tim
Piping coefficient of
nitial piping elevatio
Concurrent flow in QFraser River
Manning’s roughnes
Notes: MAF: Mean annualPMF: Probable Max
k Assess.docx
Ltd.
Dam Breach Par
ameters
(m)
n (m)
width (m)
elevation (m)
h slopes
ge coefficient
me (hours)
discharge
on (m)
Quesnel and
ss coefficient, n
flow ximum Flood.
rameters – Sens
Base Case
piping
1088.8
1085.3
20
1062.3
0.7H: 1V
1.7
1.8
0.7
1062.3
MAF
0.05
sitivity Runs, Cu
Shorter Breach Formation Time
piping
1088.8
1085.3
20
1062.3
0.7H: 1V
1.7
1.5
0.7
1062.3
MAF
0.05
urrent (2012 ‐ 20
Longer BreFormation T
piping
1088.8
1085.3
20
1062.3
0.7H: 1V
1.7
2.0
0.7
1062.3
MAF
0.05
Tailing
013)
Sensitivity
each Time
HigManni
pip
8 108
3 108
2
3 106
V 0.7H
1
1
0
3 106
M
0.
gs Storage FacilityAppendix I ‐ Dam
yRuns
gher ing's 'n'
LoMann
ping p
88.8 10
85.3 10
20
62.3 10
H: 1V 0.7
1.7
1.8
0.7
62.3 10
MAF M
.06 0
y Emergency Prem Break Inundati
ower ning's 'n'
Flatt
piping
088.8
085.3
20
062.3
7H: 1V
1.7
1.8
0.7
062.3
MAF
0.04
Page I‐19
February 2013
paredness Plan ion Assessment
ter Breach Side Slopes
piping
1088.8
1085.3
20
1062.3
1.0H: 1V
1.7
1.8
0.7
1062.3
MAF
0.05

130206‐AppI‐Dam
M01527A68.730
Gibraltar MinGibraltar Min
I‐3.4.2 Se
A summary indication owould be hianalysis. Theflood level,
Results fromQuesnel are
As shown insensitive to peak arrivalthe Manninpreviously uArbuthnot Cfull level, angenerally coManning’s ‘
m Break Assess.doc
nes Ltd. ne
nsitivity Mo
of the resultf the sensitivghest in the e table showand peak flo
m the sensitivea. Manning’
n Table I‐7, pthe Mannin times. Howg’s ‘n’ value undertaken bCreek, and thnd except foovered with tn’ value less
cx
odel Run Res
ts from the svity of the pevent of a d
ws the peak bood travel tim
vity tests ind’s ‘n’ variatio
eak flood trag’s ‘n’ roughever, based of 0.05 thatby KCB indicahat further dor the City oftrees above s than the 0.0
sults
sensitivity teredictions atdam failure, breach outflme at the pip
dicate that, oon gives sma
avel time forhness coefficon guidancet was used isated that thdownstreamf Quesnel anthe bank‐fu05 used is un
TailingsA
ests carried ot Quesnel, wa location imow variationpeline crossi
overall, therall correspon
r locations acient, with ae such as thes considerede ground is h, Beaver Cred Sardine Flll level. The nlikely to be
s Storage FacAppendix I ‐ D
out is presenwhere impactmmediately un, and the vaing just upst
re is negligibnding variatio
s far downstlower Manne HEC‐RAS R representatheavily timbeek, has timbats areas, thobserved bae applicable.
ility EmergenDam Break In
nted in Tablet to people aupstream wariation in petream of the
le impact onons in flood
tream as Quning’s ‘n’ giveference Mative. The recbered along tbered banks he Quesnel Rank conditio
Fe
ncy Preparednnundation Ass
e I‐7. To giveand propertyas selected feak flow, pe City of Que
n flood levelslevels.
uesnel couldving quicker fanual Tableconnaissancethe first 7 kmabove the bRiver banks ans indicate a
Page I‐20
ebruary 2013
ness Plan sessment
e an y for ak snel.
s in the
also be flood 3.1, e visit m of bank are a

1
M
GG
T
B
S
L
L
H
F
130206‐AppI‐Dam Brea
M01527A68.730
Gibraltar Mines LGibraltar Mine
Table I‐7 S
Model r
Base Case
Shorter Breach Form
Longer Breach Form
Lower Manning's 'n'
Higher Manning's 'n'
Flatter side slopes
k Assess.docx
Ltd.
Summary of Sen
run
mation Time
ation Time
'
nsitivity Analysi
Peak Breach Flow a
Peak flow
(m3/s)
DifferCompaBase
(m3
4800 ‐
5060 +260
4690 ‐110 (
4740 ‐60 (‐
4770 ‐30 (‐
4320 ‐480 (‐
s – Current (201
at Dam Inund
rence ared to Case 3/s)
Peak Fl(m3/s
‐ 2080
(5%) 2080
(‐2%) 2080
‐1%) 2290
‐1%) 1910
‐10%) 2160
12 ‐ 2013) Pipin
ation Characteristic
ow s)
Peak Flood Level (m)
0 488.9
0 488.9
0 488.9
0 488.6
0 489.1
0 489.0
Tailing
g Failure
cs at Pipeline Crossi
Difference in Estimated PeakWater Level
(m)
0.0
0.0
0.0
‐0.3
0.3
0.1
gs Storage FacilityAppendix I ‐ Dam
ing Approximately a
k Time to PeakLevel from St
Breach(hr min
11hr 10m
11hr 00m
11hr 20m
9hr 45m
12hr 35m
12hr 00m
y Emergency Prem Break Inundati
at the Start of the C
k Flood tart of h n)
DiffeTimeLevel
min
min
min
in ‐
min +
min
Page I‐21
February 2013
paredness Plan ion Assessment
City of Quesnel
erence in Travel e of Peak Flood l from the Dam (hr min)
‐
‐10min
+10min
‐1hr 25min
+1hr 25min
+50min

Gibraltar MinGibraltar Min
130206‐AppI‐Dam
M01527A68.730
I‐3.5 M
There are nucaused by a
Dambreaa fai
TailibreaTailistruc
Lackstatiavailand be ca
Rougrougrougout.
Additionallyaccuracy of levels, and t
Given the abmodelling shdevelopmen
I‐3.6 Flo
To assist in edownstreamovertoppingand air reconoted that o
As shown onbreach flowthrough thequicker for t
nes Ltd. ne
m Break Assess.doc
odel Limit
umerous undam break.
m breach parach depth, wr amount of
ngs dam vs. ached water‐ngs dams, hoctural charac
k of calibratioon is requirelable, the danot the extralibrated for
ghness coeffghness coeffghness coeff
y, the HEC‐RA+/‐ 10m. Ththe mapped
bove uncerthould be regnt and execu
ood Inund
emergency rm of the damg failure. Froonnaissance,other locatio
n Table I‐4 aw rates, maxie City of Quethe End of M
cx
tations
certainties iSome of the
ameters – Thwidth and sidf judgment.
earthfill dam‐retaining daowever, oftecteristics.
on of model ed to calibraata would coreme flood flr extreme flo
ficients – Sinicient cannoicient is used
AS model coere are therinundation
ainties, the fgarded as apution of eme
ation Deta
response plam are also prom assessme buildings anons of prope
nd Table I‐5mum flood lsnel, are hig
Mine Life (20
nherent in dese are:
he dam breae slopes, are
ms – Most mams for whicen exhibit a p
– Measuredate the modeover only thelows expecteood flows.
nce the modeot be determd and a sens
onstructed forefore associextents.
flood inundapproximate aergency plan
ails Recom
anning, key fesented as Fent of TRIM dnd key infrasrty and key i
, while the Eevels towardgher for the C27) scenario
TailingsA
dam break m
ach paramete usually sele
methodologiech the dam gpoorly defin
d water levelel. Such datae range of floed due to a d
el cannot bemined with cesitivity analys
or this studyated limitat
ation limits pand this limitning proced
mmended fo
flood inundaFigure I‐24 fodata and thestructure wainfrastructu
End of Mineds the downCurrent (201o. The details
s Storage FacAppendix I ‐ D
modelling and
ters, such asected based
es were devegeometry coned upstream
l versus discha is often notows recordeddam break. T
e calibrated,ertainty. Ususis with vari
utilized TRIMions in the a
produced frotation shoulures.
or EPP
ation charactor piping faile informatioas identified re may be p
Life (2027) snstream exte12 ‐ 2013) scs on Figure I
ility EmergenDam Break In
d routing of
breach formd on historica
eloped baseould be reasom face with u
harge data ft available ad during theTherefore, t
values of thually a best eous roughne
M data, whiaccuracy of t
om dam bread be kept in
teristics at selure, and Fign gathered iat these locresent, and
scenario giveent of the mocenario. Floo‐24 and Figu
ncy Preparednundation Ass
Fe
extreme floo
mation time,al data and r
d on a samponably definuncertain
from a streamnd, even if ite life of the she model ca
e Manning’sestimate of tess values is
ch has a vertthe predicted
ak and inund mind in the
elected locagure I‐25 forn the 2004 gations. It shoare not show
es higher peodel, includiod arrival timure I‐25 are f
ness Plansessment
Page I‐22
ebruary 2013
ods
and require
ple of ed.
mflow t is station annot
s the carried
tical d flood
dation e
tions
ground ould be wn.
ak ing mes are for the

Gibraltar MinGibraltar Min
130206‐AppI‐Dam
M01527A68.730
larger inundarrival times
nes Ltd. ne
m Break Assess.doc
dation extens, to give the
cx
t at each loce more critic
cation and thcal considera
TailingsA
he quicker Enations for ea
s Storage FacAppendix I ‐ D
nd of Mine Lch of the fai
ility EmergenDam Break In
Life (2027) sclure cases.
ncy Preparednundation Ass
Fe
cenario floo
ness Plansessment
Page I‐23
ebruary 2013
d

Gibraltar MinGibraltar Min
130206‐AppI‐Dam
M01527A68.730
I‐4 M
I‐4.1 Ge
This sectionliquefactionsand dam. Ito be the wthe potentia
At the time of approxim
A run‐out asDam becaus
I‐4.2 Co
I‐4.2.1 Sta
Stability anathe event ofstability anasummarized
The
The
An R
The
I‐4.2.2 20
Since the dathe requirem
Previously, Kempirical mCrippen, 200liquefy and phreatic lev
The Klohn C
The beco
The
nes Ltd. ne
m Break Assess.doc
AIN DAM
eneral
estimates tn of both then the absenorst case sceal consequen
of this analymately 3,577
ssessment isse it is const
onditions a
ability Analy
alyses presenf the Maximalyses were dd in Klohn Cr
base of the
cycloned san
Ru value of 0
tailings beac
05 Run‐Out
am would bements of CDA
KCB estimatethod prese05). The metflow and is svels and no o
Crippen (200
liquefied taiome fully liqu
liquefied tai
cx
TAILINGS
the deformae upstream tce of an oveenario for dances of a ber
ysis, the Gibrft, or a dam
s not neededructed with
and Metho
yses Accordi
nted in KCB um Considedeveloped frrippen (1996
Cycloned Sa
nd has a fric
0.5 was appli
ch had a stre
Assessment
e stable in thA guidelines
ed the run‐oented by Lucthod from Lustrictly applicouter compa
5) assessme
lings beach uefied.
lings had a r
RUNOUT A
tions of theailings beacertopping faiam stability.rm failure in
raltar Main D height of ap
d for the Norcompacted
od for the R
ng to CDA G
(2012) and Kred Earthqurom site inve6) and KCB (2
nd Dam con
tion angle of
ed to the sa
ength of Sr/σ
t
he event of ts are needed
out from theia et al. (198ucia et al. (1cable only tocted shell or
nt assumed
and the satu
residual stre
TailingsA
ASSESSME
Main Tailingh and the zoilure mecha The deform terms of ph
Dam crest, approximately
rth Earthfill Dtill, and not
Run‐Out A
Guidelines
KCB (2008) cake (MCE). Testigation pr2012), and a
nsists of a sat
f 36 degrees
turated cycl
σvo’ = 0.1.
he MCE, hypd to conduct
e Gibraltar M81), and com981) assumeo upstream cr berm.
the followin
urated zone
ngth of Sr/σ
s Storage FacAppendix I ‐ D
ENT
gs Dam in thone of saturanism, a liquemations of thhysical dama
t the area ofy 350 ft.
Dam, locatedsusceptible
Assessment
confirmed thThe geotechrograms andre presented
turated laye
s.
oned sand.
pothetical gethe run‐out
Main Dam thrmpared the rees that all taconstructed
ng condition
at the base
σvo’ = 0.10.
ility EmergenDam Break In
he event of eation at the efaction flowhe dam can bage and envi
f interest, w
d at the nortto liquefact
t
hat this dam nical paramd laboratory d as follows:
er approx. 10
eotechnical ct assessment
rough applicesults to casailings in the impoundme
s:
the Cyclone
ncy Preparednundation Ass
Fe
earthquake ibase of thewslide is conbe used to eronmental i
was at an elev
th end of theion.
would be steters used ftesting :
0 ft thick.
conditions bt.
cation of these histories (impoundmeents with hig
d Sand Dam
ness Plansessment
Page I‐24
ebruary 2013
induced cyclone nsidered evaluate mpact.
vation
e Main
table in or the
beyond
e (Klohn ent gh
m

Gibraltar MinGibraltar Min
130206‐AppI‐Dam
M01527A68.730
The 0.15
The
The results o
The
The
The
I‐4.2.3 20
The softwarassessmentColumbia. Tbeen update
The dam croFigure I‐27).would be detailings stac
For the 2‐D This sliding sSection B, aEarthquake (Geo‐Slope
The geotech
The
The
The the uwhicof DAangl
I‐4.3 Re
The three sc
Scenestim
nes Ltd. ne
m Break Assess.doc
saturated zo.
maximum d
of the analys
equilibrium
runout was
backscarp o
12 Run‐Out
re DAN‐W (O. DAN‐W is aThe theoreticed and refin
oss‐section u. The Cycloneveloped on k on top of t
section, a msurface was s presented Condition. TInternationa
hnical condit
cyclone sand
sliding mass
basal frictionunderlying foch corresponAN‐W does e was used.
esults of th
cenarios asse
nario 1 – Thismated Post‐E
cx
one at the ba
am height w
ses are as fo
slope was 6
calculated to
f the runout
Assessment
O. Hungr Geoa 2‐D analysical basis of ted significan
used in the ae Sand Damthe tailings the tailings b
model sliding based on thin KCB 2012The FS againal, 2012), as
tions used fo
d and tailing
s had a unit w
n angle reproundation. Tnded to Sr/σnot allow fo
he 2012 Ru
essed are as
s case represEarthquake s
ase of the Cy
was 300 ft.
ollows:
.5H:1V.
o be 1,900 ft
t was 630 ft.
t
otechnical Res developedhe softwarently since the
assessment i height woubeach offsebeach would
surface washe minimum2 Long‐Termst failure capresented in
or the assess
gs had an int
weight of 19
esented theThe basal fricσvo’ values ofr the input o
un‐Out Ass
follows:
sents an uppstrengths pr
TailingsA
ycloned Sand
t.
esearch, 201d by Professo was originaen.
s for the ultild be 360 ftt 500 ft fromd have an ult
s input into tfactor‐of‐saTailings Deplculated forn KCB (2012)
sment are as
ernal friction
9.3 kN/m3.
e strength ofction anglesf 0.15, 0.10, aof strength r
sessment
per‐bound liresented in t
s Storage FacAppendix I ‐ D
d Dam had a
10) was usedor O. Hungr oally presente
imate tailinghigh, and a m the Cyclontimate heigh
the DAN‐W mafety (FS) surposition Planthis surface) was 1.2.
s follows:
n angle of 32
the contact consideredand 0.06, reatios in this
quefied basathe 2005 Inu
ility EmergenDam Break In
a residual str
d for the curof the Univeed in Hungr (
gs facility at ystack of undned Sand Damht of 170 ft.
model for rurface calculan (KCB, 2012through use
2 degrees.
t between thwere 8.5°, 5spectively. Aformat, the
al strength, undation Stu
ncy Preparednundation Ass
Fe
rength of Sr/
rent run‐outersity of Briti1995), and h
year 2027 (sderflow tailinm. The unde
un‐out analyated for Dam2) for the Pose of the Slop
he tailings m5.7° and 3.4°As the latestequivalent f
based on thdy Report (K
ness Plansessment
Page I‐25
ebruary 2013
/σvo’ =
t ish has
see ngs erflow
sis. m st‐ pe/W
ass and °, build friction
e KCB). In

Gibraltar MinGibraltar Min
130206‐AppI‐Dam
M01527A68.730
that
appr
Scenestimin thtailin
Scen0.06the 2strenmod
A summary
Table I‐8
Run‐out Scenario
1
2
3
The run‐outthe leading significantly
Similar to rushort, with tangle is obs
The third ruslope, and t
The runout KCB (2012) supper boun90 ft. This w
The lower baccess road
The extremethe Seepage
nes Ltd. ne
m Break Assess.doc
report, a ge
roximately S
nario 2 – Thismated Post‐Ehe 2012 Longngs beach va
nario 3 – This), which was2012 Long‐Tngth value wdel.
of the result
Cycloned
Con
“Uppe
“Lowe
“Extreme L
t of the Mainedge of the y changing fr
un‐out Scenathe leading eerved to flat
n‐out scenahe slope ang
assessment showing thad case, whic
would affect t
ound case ins located do
e lower boue Recovery P
cx
eneralized ra
r/σvo’ = 0.15
s case represEarthquake sg‐Term Depoalue was app
s case repress based on thTerm Depositwas taken fro
ts of the thre
d Sand Dam
ndition
r Bound”
r Bound”
Lower Bound”
n Dam for thdam movingrom the initia
ario 1, the ruedge of the dtten to appro
rio had a leagle is observ
provides sut minimal mch are basedthe access ro
ndicates a ruwnstream o
nd indicatesPond located
tio between
5, based on c
sents a lowestrengths (Sosition Plan (plied to the e
sents an exthe weakest ttion Plan (KCom an area 6
ee scenarios
2‐D Run‐Ou
Model StParame
φ8.5o
5.7o
3.4o
e assumed “g a total of 9al condition,
un‐out distandam movingoximately 4.
ading edge oved to flatten
pport to premovement wo on conditiooad located
un‐out of apof the tailings
s a run‐out od 1,100 ft do
TailingsA
n residual str
correlations
er‐bound liqur/σvo’ = 0.10(KCB) for “Exentire Cyclon
reme lower‐tailings areaCB) for “Exist6,000 ft away
s is presente
ut Analysis R
rength eters
Eq
o
o
o
“Upper Boun90 ft down sl, flattening f
nce for the “g a total of 390H:1V.
of the dam mn to approxim
evious stabiliould occur aons worse that the toe o
proximatelys dam.
f approximawnstream o
s Storage FacAppendix I ‐ D
rength and e
to SPT‐blow
uefied basal0) for the exixisting Tailinne Sand Dam
‐bound liquea near the Noting Tailingsy from the d
d in the follo
Results
quivalent
Sr/σvo’
0.15
0.10
0.06
nd” basal friclope, and thefrom approx
“Lower Boun90 ft down s
moving a totamately 8H:1
ity analyses cas a result ofan the MCE,of the tailings
y 390 ft. This
ately 1,150 ftof the tailings
ility EmergenDam Break In
effective stre
w counts.
strength, basting tailingsngs – Sectionm foundation
efied basal sorth Earthfill– Section D”
dam cross‐se
owing table,
Runout Distance, L
90 ft
390 ft
1,150 ft
ction angle ie equilibriumximately 2.3H
nd” Scenarioslope. The eq
al distance oV.
conducted if a MCE. The, indicate a rs dam.
run‐out wo
t. This run‐os dam toe, b
ncy Preparednundation Ass
Fe
ess was foun
ased on thes beach presn B”. Note thn.
trength (Sr/l Dam prese”. Note thatection used i
and in Figur
Equilibriu
2.7H
4.0H
8H:1
is quite shorm slope anglH:1V to 2.7H
o 2 is relativequilibrium sl
of 1,150 ft do
n KCB (2008e results of thrun‐out of on
uld affect se
ut would imbut would no
ness Plansessment
Page I‐26
ebruary 2013
nd to be
sented hat this
σvo’ = nted in this n the
re I‐26.
m Slope
:1V
:1V
1V
rt, with le not H:1V.
ely lope
own
8) and he nly
everal
pact ot reach

Gibraltar MinGibraltar Min
130206‐AppI‐Dam
M01527A68.730
the Seepagescarp wouldstill be 1,00010,000 ft awof the tailing
nes Ltd. ne
m Break Assess.doc
e Recover Dad extend app0 ft away froway from thegs pond redu
cx
am, which isproximately om the back‐e Cyclone Sauces with th
located 1,601,150 ft into‐scarp. The tnd Dam crese developm
TailingsA
00 ft downsto the tailingstailings pondst by the endent of the ta
s Storage FacAppendix I ‐ D
tream of the beach. Thed would be pd of operatioailings facilit
ility EmergenDam Break In
e tailings damcurrent tailipushed to apons. The poty.
ncy Preparednundation Ass
Fe
m toe. The bings pond wopproximatelyential for re
ness Plansessment
Page I‐27
ebruary 2013
back‐ ould y lease
Gibraltar MinGibraltar Min
130206‐AppI‐Dam
M01527A68.730
I‐5 CO
I‐5.1 Ge
The analysedownstreamRegulationsdams. The rdownstream
I‐5.2 Ea
The East Sadhorizontal areconnaissadistance betresults of thobservationEast Saddle
The levehandbeinPMFcond
Resuleveoverthe Qthe requabridglying
The and brea
The studthe s
The caus
nes Ltd. ne
m Break Assess.doc
ONCLUSION
eneral
s and conclum of the dam requires daesults of thism conditions
ast Saddle
ddle Dam inuand vertical aance previoutween the dhe study are ns, conclusioDam are sum
TSF is designl that accoundle PMF cong overtoppeF flows downditions down
ults of the dal would resurtopping failuQuesnel Riveregion. Sinceal to or largeges downstrg areas along
combined flflows from aach of the Ea
environmenied, but largsmaller strea
Quesnel Rivsed by a brea
cx
NS AND RE
usions presems at the timm owners tos study shous during the a
Dam Brea
undation stuaccuracy of ±sly conducteam and popconsidered tns and recommmarized be
ned to store nts for wind‐ditions will bed is small. Onstream. Pipnstream.
am break moult in higher iure. The flooer, the desige the peak fler than the nream of the dg Sardine Fla
ow in the Fra piping failuast Saddle Da
ntal impacts ge debris flowams upstrea
er usually freach at the Ea
ECOMMEN
nted in thise the analyso conduct anuld be re‐evaannual revie
k Study
udy presente±10 and ±5 med to confirmulated areasto be adeqummendationelow:
the 30 day P‐induced wabe constructOvertoppinging failure co
odeling indicincrementalod flows willgn event genows resultinnatural 200‐ydam are expats and in the
raser River coure is about 5am is expect
resulting frows will likelym of the Qu
eezes duringast Saddle D
TailingsA
NDATIONS
report are bses were comn annual revaluated shouew.
ed in this repm, respectivem relevant tos such as theate for emens for the da
PMF, with deaves, and setted. Therefofailure is conould occur u
cate that pipimpacts, in be larger therally considng from a breyear flood inpected to bee City of Que
onsisting of t54% of the rted to have m
om a breach y be initiatedesnel River.
g the winter.am.
s Storage FacAppendix I ‐ D
S
based on conmpleted. Schview of condiuld a significa
port was largely. Neverthopographic fe Sardine Flargency plannam breach an
esign freebottlement. Atre, the likelinsidered likeunder ‘sunny
ping failure aterms of flohan the natudered for floeach at the En the Quesneaffected byesnel are als
the assumedriver’s 1 in 20minimal imp
at the East Sd particularly
. River ice m
ility EmergenDam Break In
nditions beliehedule I‐2 ofitions downsant change b
gely based oheless, given features andats and the Cning purposend inundatio
oard above tclosure, a sphood of the ely to occur y day’ condit
at the pond ood depth, coural 1 in 200 ood managemEast Saddle Del River, low the dam breso expected
d MAF durin0 year flood pact on the F
Saddle Dam y as the flood
might exacerb
ncy Preparednundation Ass
Fe
eved to existf the BC Damstream of thbe noted in t
on TRIM datathe air and d given the laCity of Quesnes. Our on analyses f
he flood stopillway desigEast Saddlecoincident wtions, with M
operating waompared to year flood flment measuDam are eithlying roads aeach flood. Lto be affecte
ng the dam bflows. There
Fraser River.
have not bed moves thr
bate the floo
ness Plansessment
Page I‐28
ebruary 2013
t m Safety heir the
a with ground arge nel, the
for the
orage gned to Dam with MAF
ater
lows in ures in her and Low ed.
break, efore, a
een ough
oding
Gibraltar MinGibraltar Min
130206‐AppI‐Dam
M01527A68.730
The regaexec
The in thanal
I‐5.3 M
A 2‐D run‐ocase had a ltailings area
The extremeimpact the Snot reach thThe back‐scpond wouldthe tailings
The tailings by the end owith the dev
nes Ltd. ne
m Break Assess.doc
flood inundarded as appcution of em
TSF configurhe Long Termyses and the
ain Dam T
ut assessmeiquefied basa near the No
e lower bouSeepage Reche Seepage Rarp would ed still be 1,00pond is remo
pond wouldof operationvelopment o
cx
ation limits proximate anergency plan
rations and m Tailings Dee results of t
Tailings Run
nt using DANsal strength oorth Earthfil
nd scenario covery Pond Recover Damxtend appro00 ft away frote.
d be pushed s. As a resulof the tailing
produced frond this limitanning proced
East Saddleeposition Plahis study mu
nout Asses
N‐W was conof Sr/σvo’ = 0l Dam locate
indicates a rlocated 1,10
m, which is looximately 1,1om the back
to approximt, the potens facility.
TailingsA
om dam bretion should dures.
Dam geomean (KCB, 201ust be re‐eva
ssment
nducted for0.06. This stred 6,000 ft a
run‐out of ap00 ft downstocated 1,600150 ft into thk‐scarp. This
mately 10,000tial for relea
s Storage FacAppendix I ‐ D
ak and inundbe kept in m
etry used is b12). If there aluated.
3 scenarios.rength valueway from cr
pproximateltream of the0 ft downstrehe tailings be confirms th
0 ft away froase of the ta
ility EmergenDam Break In
dation modemind in the d
based on theare changes
. The extreme was based ross‐section
y 1,150 ft. Te tailings dameam of the teach, but thhat the possi
om the Cycloilings pond r
ncy Preparednundation Ass
Fe
elling shoulddevelopment
e designs prs to the desig
me lower‐bouon the weakused in the
This run‐out wm toe, but wtailings dame current taibility for rele
one Sand Dareduces furt
ness Plansessment
Page I‐29
ebruary 2013
d be t and
esented gns, the
und kest model.
would would toe. ilings ease of
m crest her

Gibraltar MinGibraltar Min
130206‐AppI‐Dam
M01527A68.730
REFERENC
Agriculture Columbi
B.C. Reg. 16
CDA (2007).
Costa JE. (19Departm
Froehlich, DEngineeAugust 1
Froehlich, DHydraul
Klohn Cripp
Klohn CrippJanuary
Klohn Cripp
Lucia P, DunTailings Technol
MacDonald,Hydraul
State of ColoFebruary
US Army Co
US Army CoJanuary.
US Army Co
nes Ltd. ne
m Break Assess.doc
CES
and Agri‐Fooia.
3/2011. (20
. “Dam Safet
985). “Floodment of the I
D.C. (1995). “ring, Proc. o14‐18, pp. 88
D. C. (2008). “ic Engineerin
en Ltd. (200
en Berger Lt17.
en Berger Lt
ncan JM, SeeImpoundmeogy Transfer
, T. C. and Mic Engineerin
orado. (2010y.
rps of Engin
rps of Engin.
rps of Engin
cx
od Canada (A
11). British C
ty Guidelines
s From Damnterior, USG
“Embankmenof 1995 ASCE87‐891.
“Embankmeng, Vol. 134,
5). Gibraltar
td. (2011). G
td. (2012). 20
ed HB. 1981.ents”. Mine Wr Workshop.
Monopolis, J. ng, Vol. 110,
0) “Guideline
eers (USACE
eers (USACE
eers (USACE
AAFC), 2010
Columbia Da
s”, Canadian
Failures”, OGS. Denver, C
nt Dam BreaE Conference
ent Dam Brea No. 12, pp 1
r Tailings Fac
ibraltar Min
012 Long‐Te
“Summary Waste Dispo. Denver, Co
L. (1984). Br No. 5, May.
es for Dam B
E) (2010a). H
E) (2010b). H
E) (2010c). H
TailingsA
. Probable M
am Safety Re
n Dam Assoc
Open‐File ReColorado.
ach Parametee on Water R
ach Paramet1708‐1720.
cility Dam Br
es Tailings F
erm Tailings D
of Researchosal Technollorado. July
reaching Cha.
Breach Analy
HEC‐RAS App
HEC‐RAS Hyd
EC‐RAS User
s Storage FacAppendix I ‐ D
Maximum Flo
egulation, de
iation, Janua
port No. 85‐
ers RevisitedResources En
ters and The
reach and In
Facility ‐ Dam
Deposition P
on Case Hisogy, Proceed16.
aracteristics
ysis”. Divisio
plications Gu
draulic Refer
r’s Manual, V
ility EmergenDam Break In
ood Estimato
eposited Nov
ary.
‐560, United
d”, Water Rengineering, S
eir Uncertain
undation Stu
m Failure Cla
Plan, Octobe
tories of Flodings of the
of Dam Fail
n of Water R
uide, Version
rence Manua
Version 4.1,
ncy Preparednundation Ass
Fe
or for British
vember 30.
d States
esources San Antonio,
nties”. Journa
udy, March 3
ssification,
er 26
ow Failures oBureau of M
ures, Journa
Resources,
n 4.1, January
al, Version 4
January.
ness Plansessment
Page I‐30
ebruary 2013
h
, Texas,
al of
31.
of Mine Mines
al of
y.
.1,

Gibraltar MinGibraltar Min
130206‐AppI‐Dam
M01527A68.730
Figure I‐1
Figure I‐2
Figure I‐3
Figure I‐4
Figure I‐5
Figure I‐6
Figure I‐7
Figure I‐8
Figure I‐9
Figure I‐10
Figure I‐11
Figure 1‐12
Figure I‐13
Figure I‐14
Figure I‐15
Figure I‐16
Figure I‐17
Figure I‐18
Figure I‐19
Figure I‐20
Figure 1‐21
Figure I‐22
Figure I‐23
Figure I‐24
Figure I‐25
Figure I‐26
Figure I‐27
nes Ltd. ne
m Break Assess.doc
Location
Gibraltar
TSF Site P
East Sadd
East Sadd
TSF Plan
Predicted
SupernatLife (202
Plan of St
River Cro
East Sadd
Flow HydCurrent (
Flow Hydof Mine L
Estimate
Estimate
Estimate
Flow HydCase, Cur
Flow HydCase, End
Estimate
Estimate
Estimate
Comparis
Comparis
East Sadd
East Sadd
Tailings R
Cycloned
cx
Map
r Mine Site P
Plan – Existin
dle Dam, Cu
dle Dam, End
and Section
d Pond Eleva
tant Pond St7)
tudy Area
ossings in the
dle Dam – A
drographs Al(2012 – 2013
drographs AlLife (2027)
d Flood Inun
d Flood Inun
d Flood Inun
drographs Alrrent (2012 –
drographs Ald of Mine Lif
d Flood Inun
d Flood Inun
d Flood Inun
son of Peak
son with ME
dle Dam Pipi
dle Dam Ove
Runout Asse
d sand Dam a
Plan
ng Condition
rrent (2012 –
d of Mine Lif
s, Current (2
ation and Fre
tage‐Storage
e City of Que
s‐Built Plan a
long Flood R3)
long Flood R
ndation Exte
ndation Exte
ndation Exte
long Flood R– 2013)
long Flood Rfe (2027)
ndation Exte
ndation Exte
ndation Exte
Breach Flow
ELP 1 in 200 y
ing Failure B
ertopping Fa
ssment Deta
and North Ea
TailingsA
ns
– 2013) Plan
fe (2027) Pla
2012 – 2013
eewater Pon
e Relationshi
esnel
and Sections
Route – East
Route – East
ents, Piping F
ents, Sardine
ents, City of Q
Route – East
Route – East
ents, Overtop
ents, Sardine
ents, City of Q
w Estimates w
year Flood E
Base Case Inu
ailure Base C
ails
arthfill Dam
s Storage FacAppendix I ‐ D
n and Section
an and Sectio
) and End of
nd Volume, 2
ip, Current (
s (1986)
Saddle Dam
Saddle Dam
Failure Base
e Flats, Piping
Quesnel, Pip
Saddle Dam
Saddle Dam
pping Failure
e Flats, Overt
Quesnel, Ov
with Empiric
Extent
undation De
Case Inundat
Plan and Se
ility EmergenDam Break In
ns
ons
f Mine Life (2
2012 – 2027
2012 – 2013
m Piping Failu
m Piping Failu
Case
g Failure Bas
ping Failure B
m Overtoppin
m Overtoppin
e Base Case
topping Failu
vertopping Fa
cal Relations
etails
tion Details
ections
ncy Preparednundation Ass
Fe
FIGU
2027)
3) and End of
ure Base Cas
ure Base Cas
se Case
Base Case
ng Failure Ba
ng Failure Ba
ure Base Cas
ailure Base C
hips
ness Plansessment
ebruary 2013
URES
f Mine
e,
e, End
ase
ase
se
Case


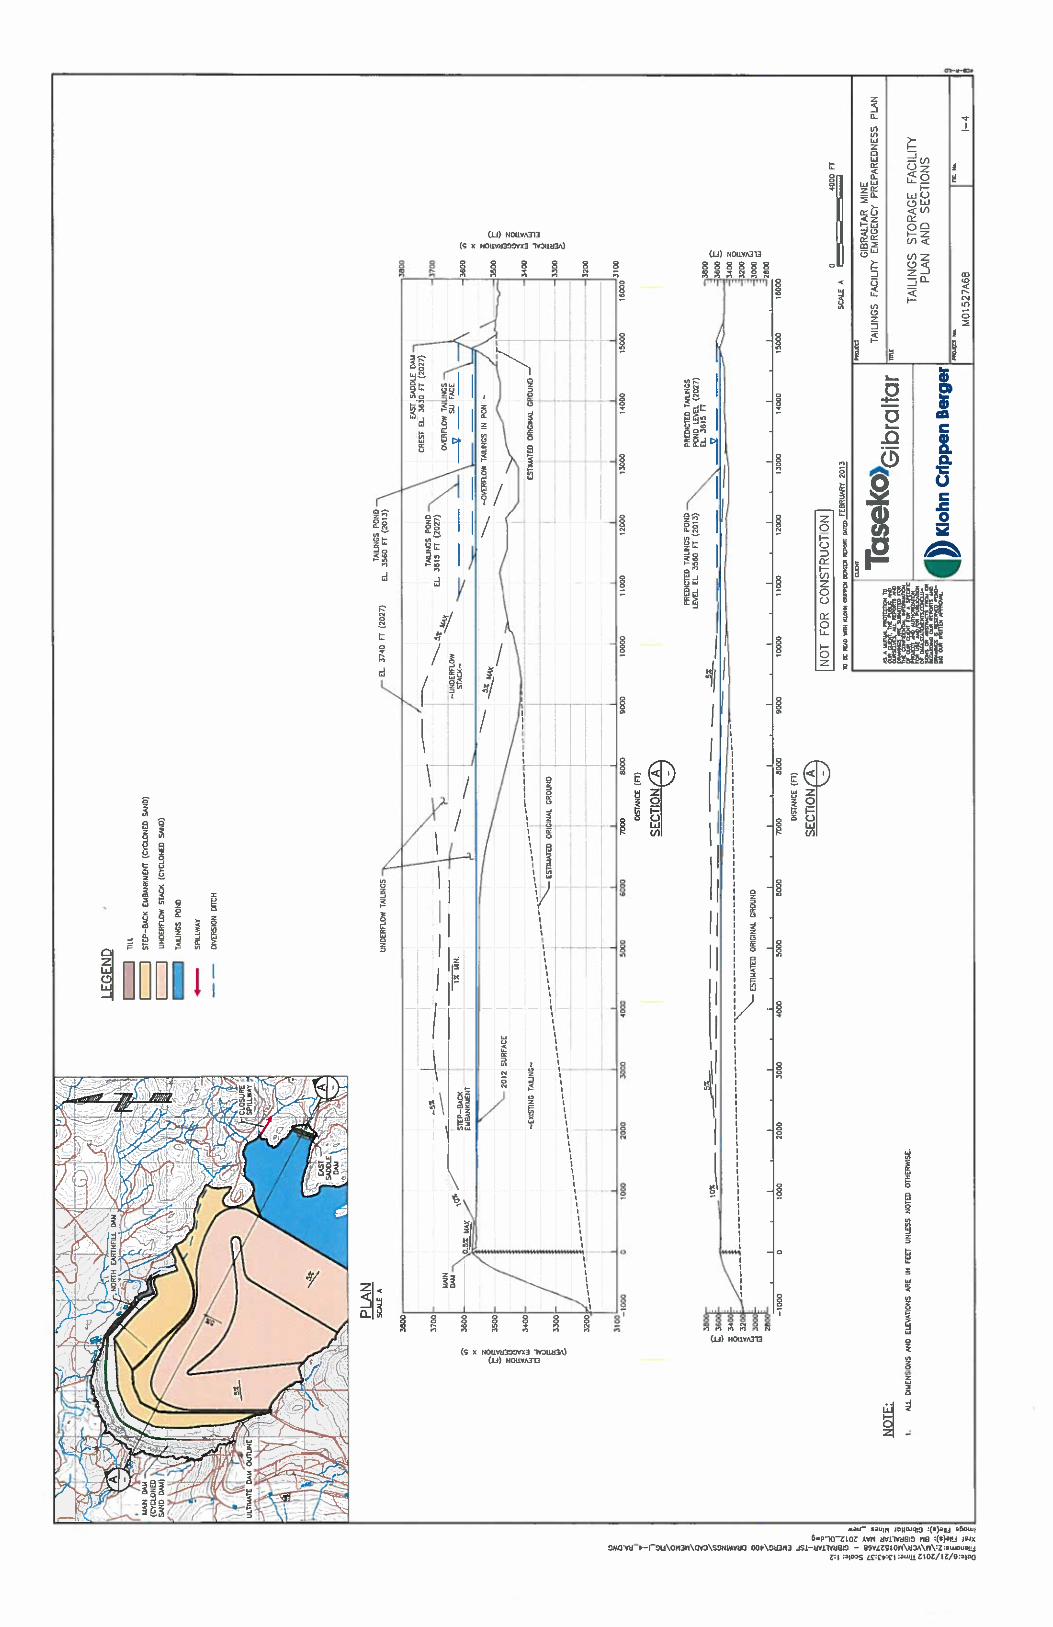
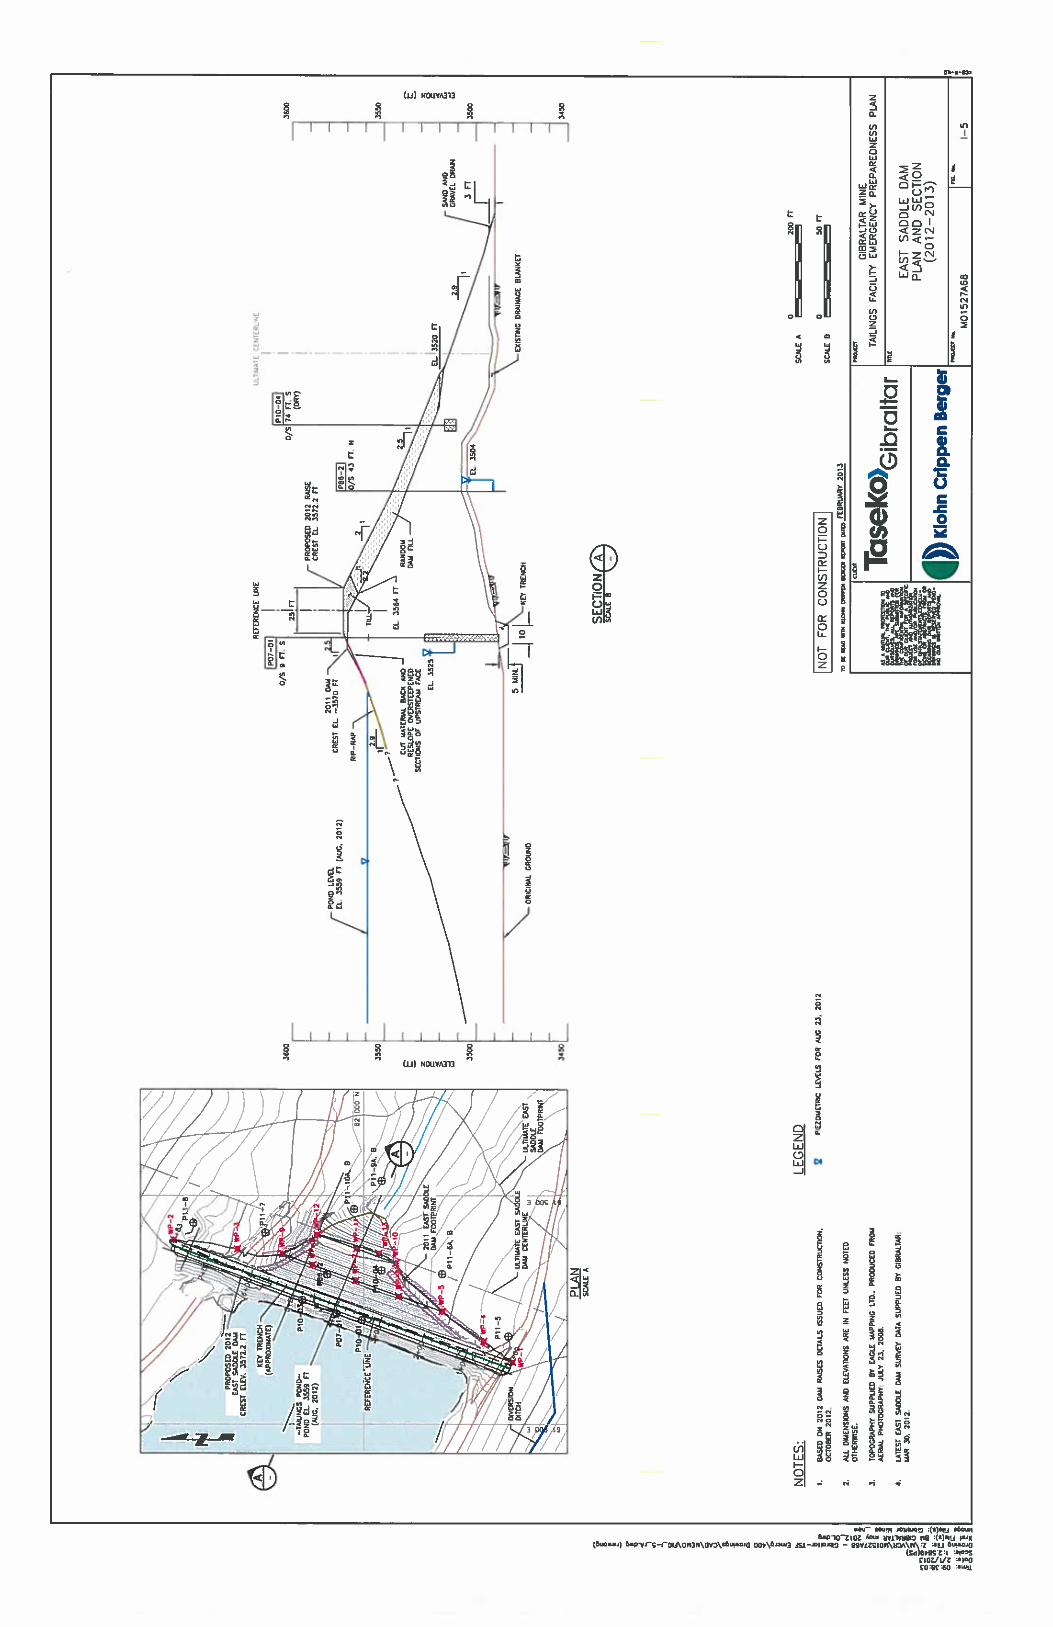


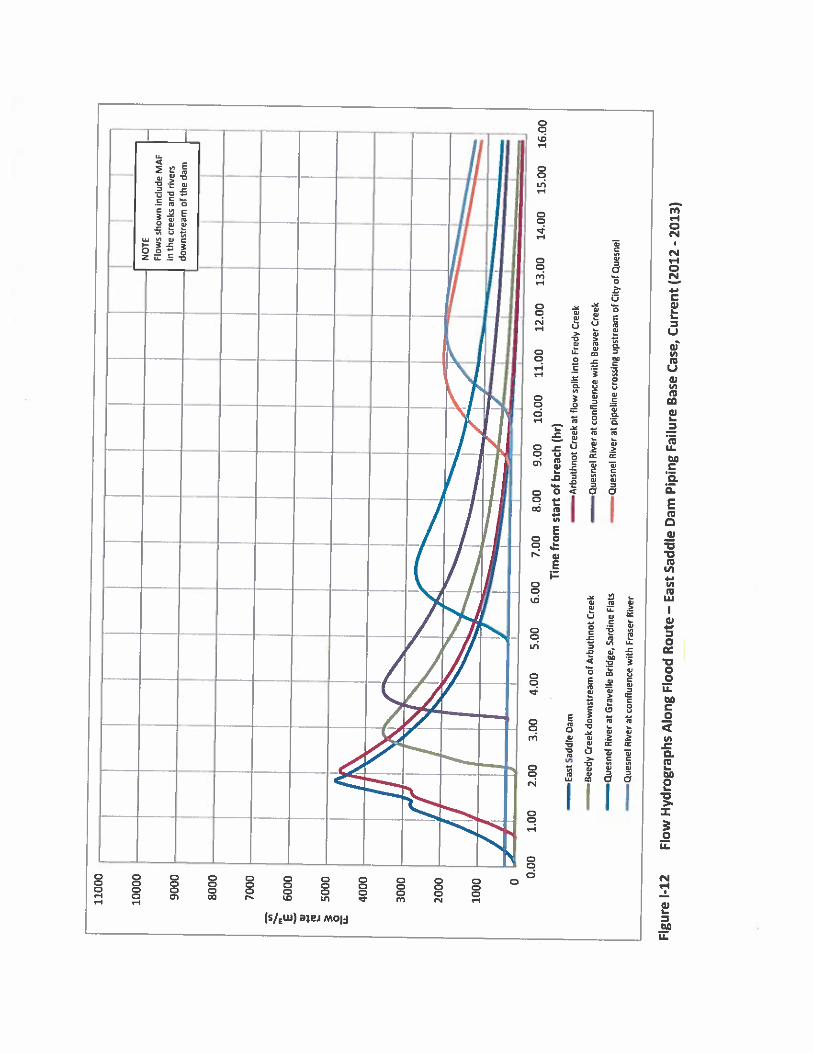
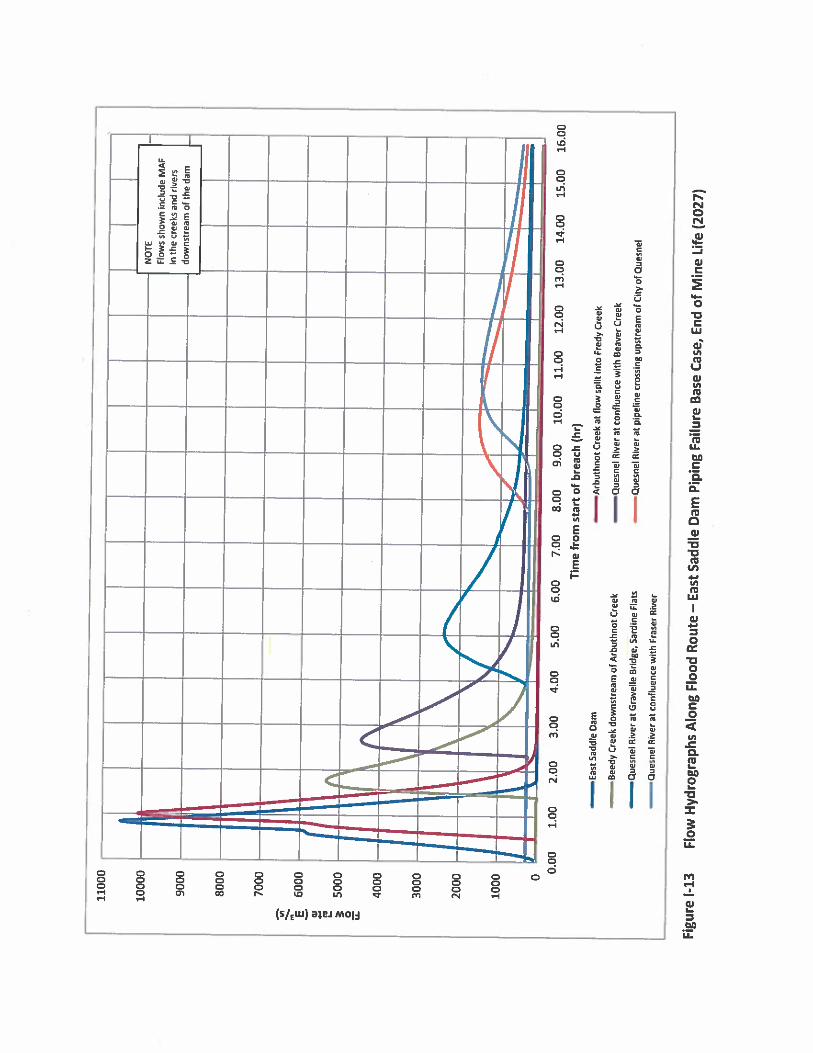


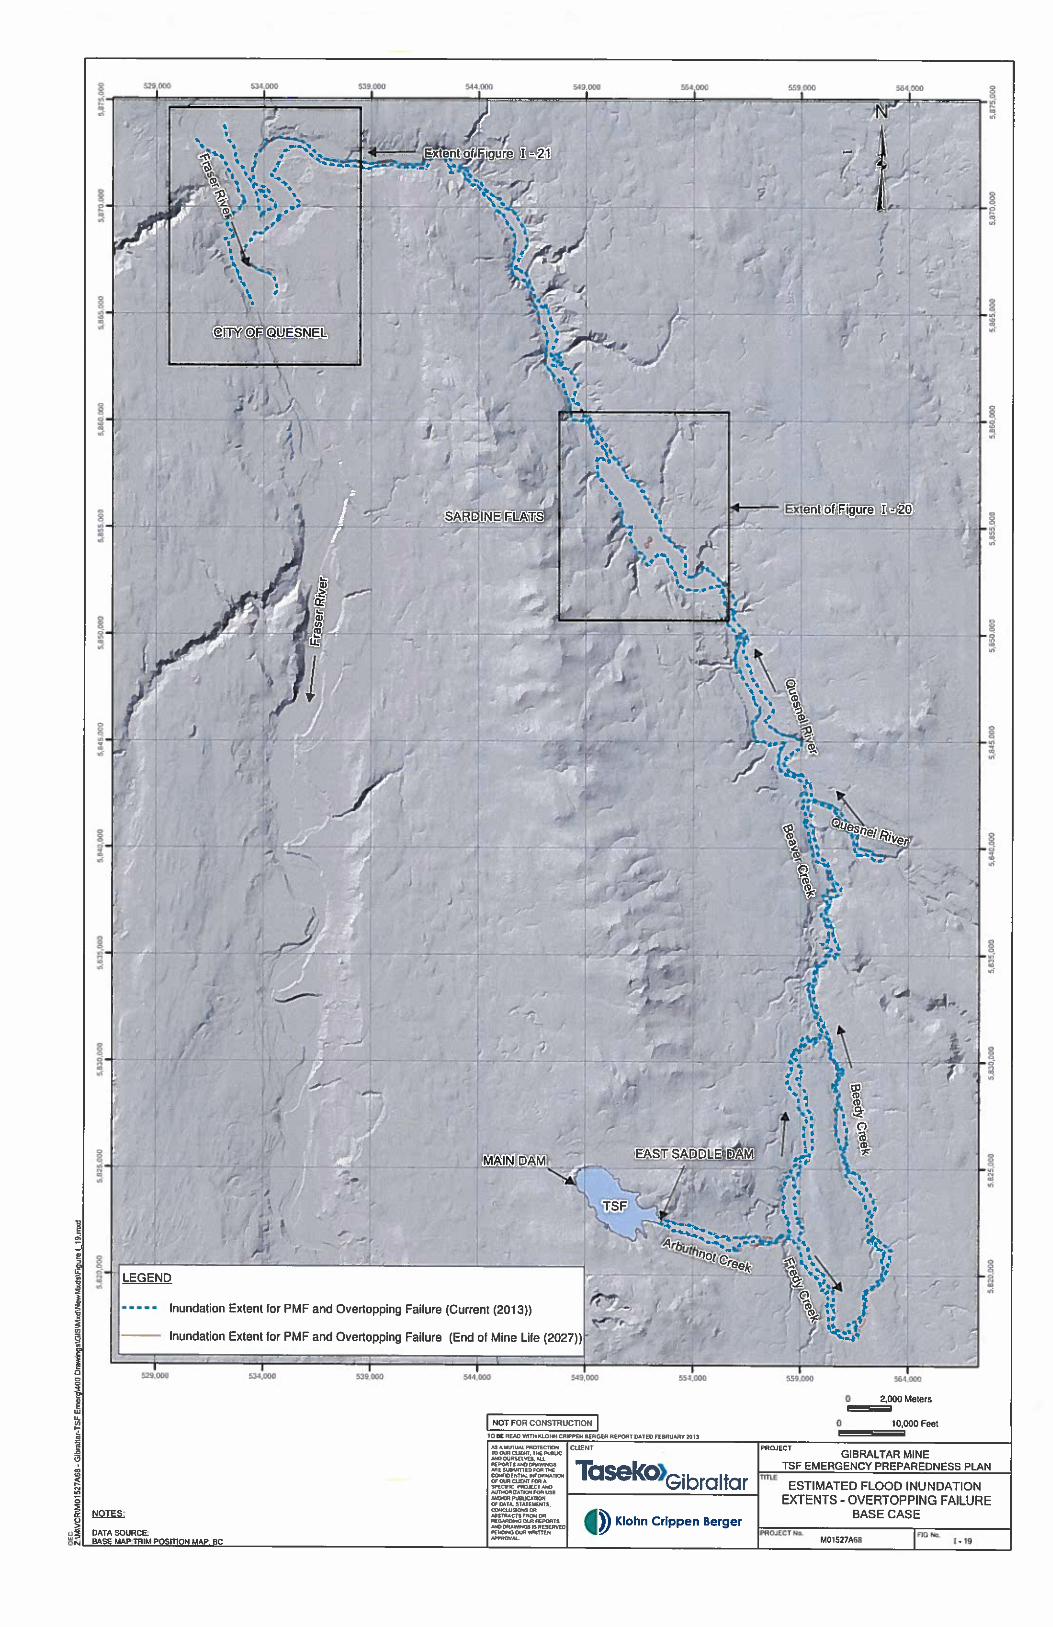
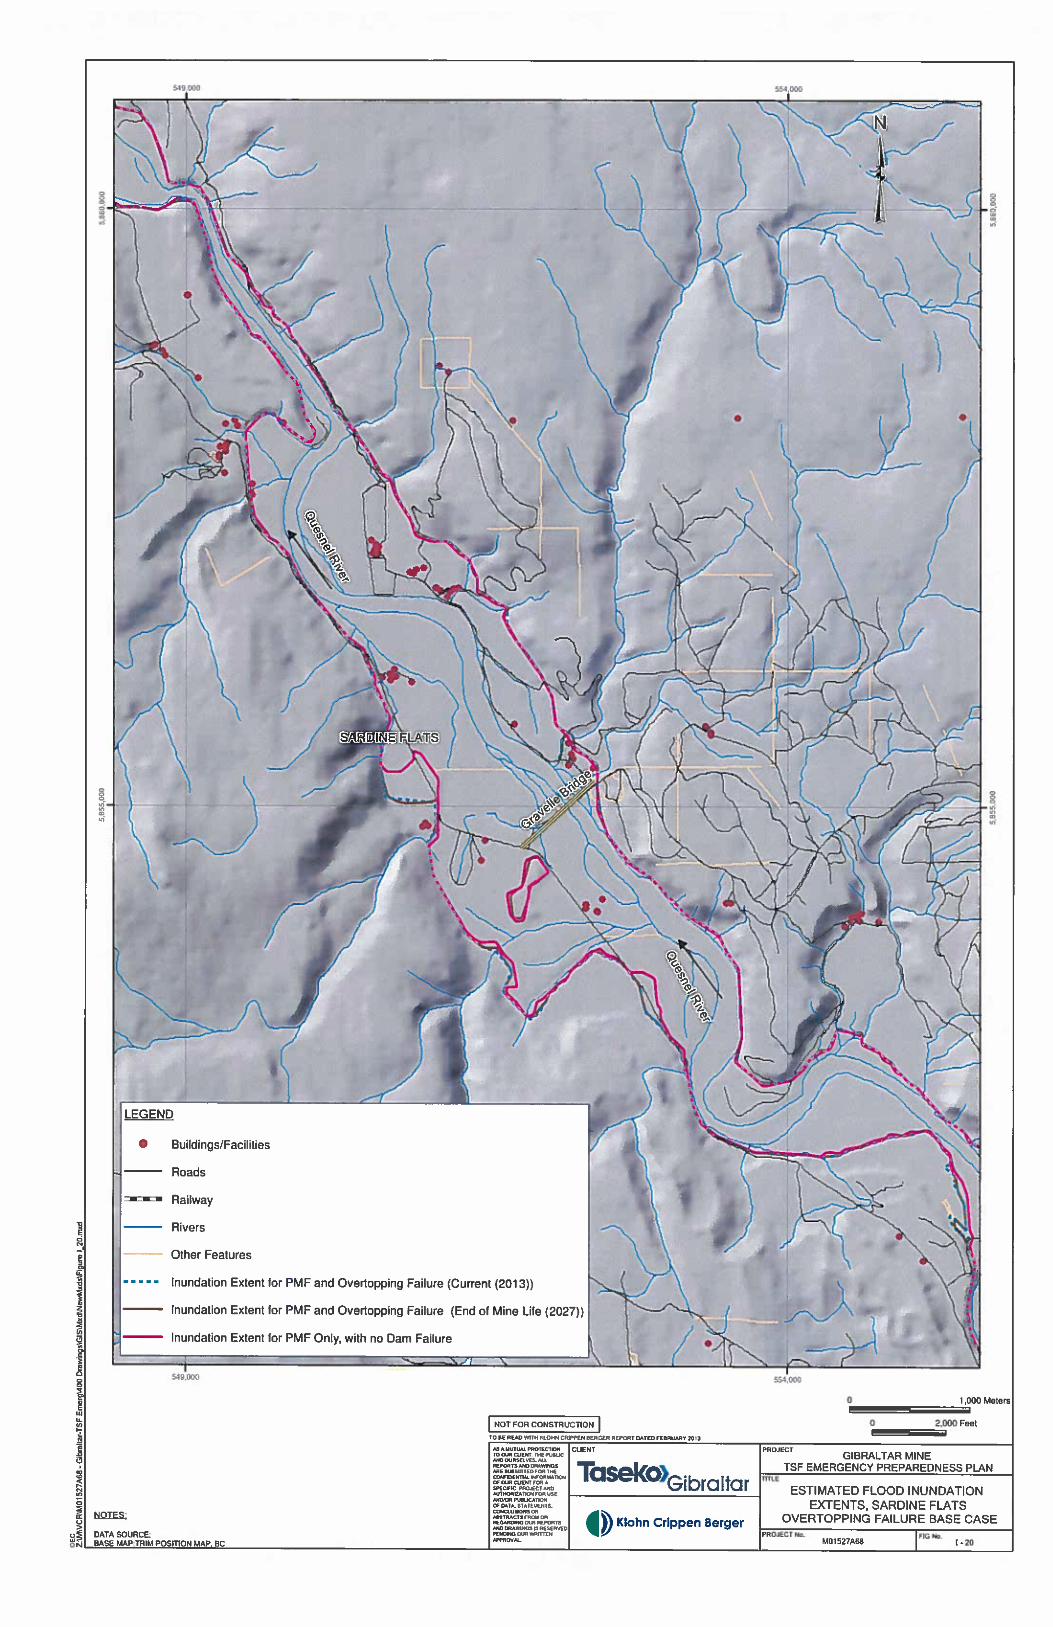

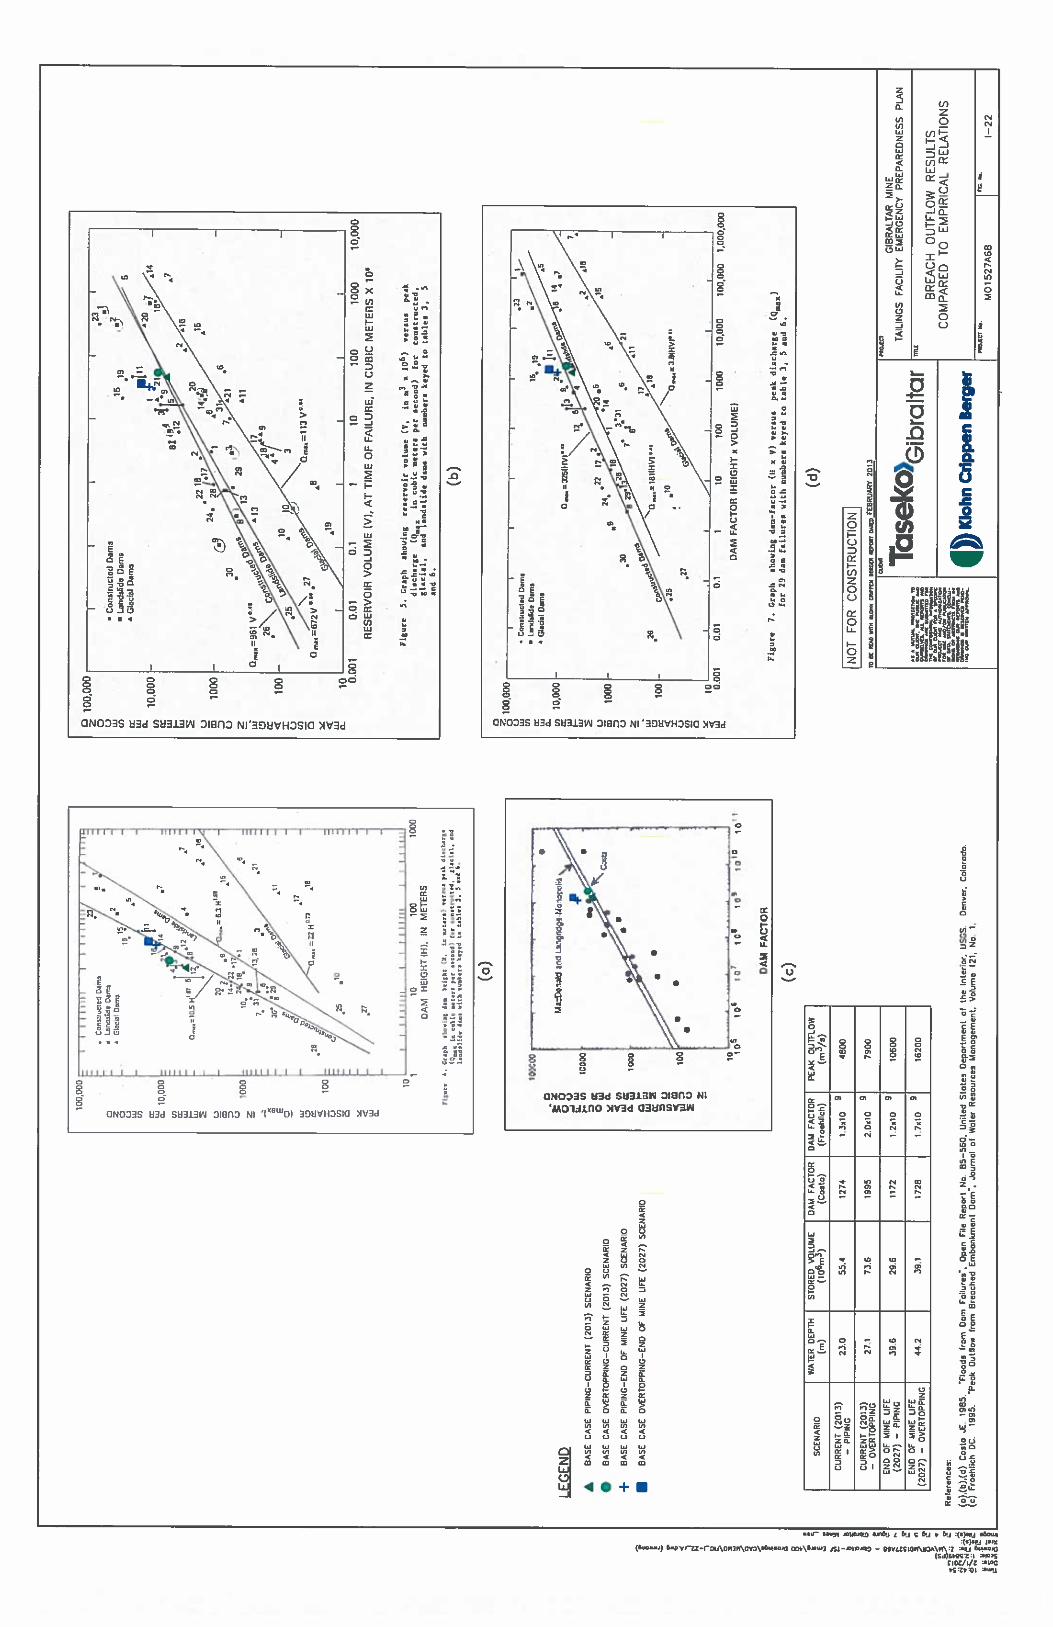


Gibraltar MinGibraltar Min
130206R‐Emergen
M01527A68.730
nes Ltd. ne
ncy Preparedness Plan.docx
Octoober 200
Tailing
04 Site R
gs Storage Fac
Reconna
cility Emergen
A
aissance
ncy Preparedn
Fe
APPEND
Photogr
ness Plan
ebruary 2013
DIX II
raphs

Gibraltar MinGibraltar Min
130206‐AppII‐200
M01527A68.730
Photo II‐1
Photo II‐2
nes Ltd. ne
04 Site Photos.docx
O
Gibraltar
Main Tai
x
October 20
r tailings pon
ilings Dam a
Ap004 Site Re
nd, looking t
s seen from
Tailing
ppendix IIeconnaissa
towards Ma
north side o
gs Storage Fac
ance Photo
ain Tailings D
of tailings po
cility Emergen
ographs
Dam.
ond.
ncy Preparedn
Fe
ness Plan
Page II‐1
ebruary 2013
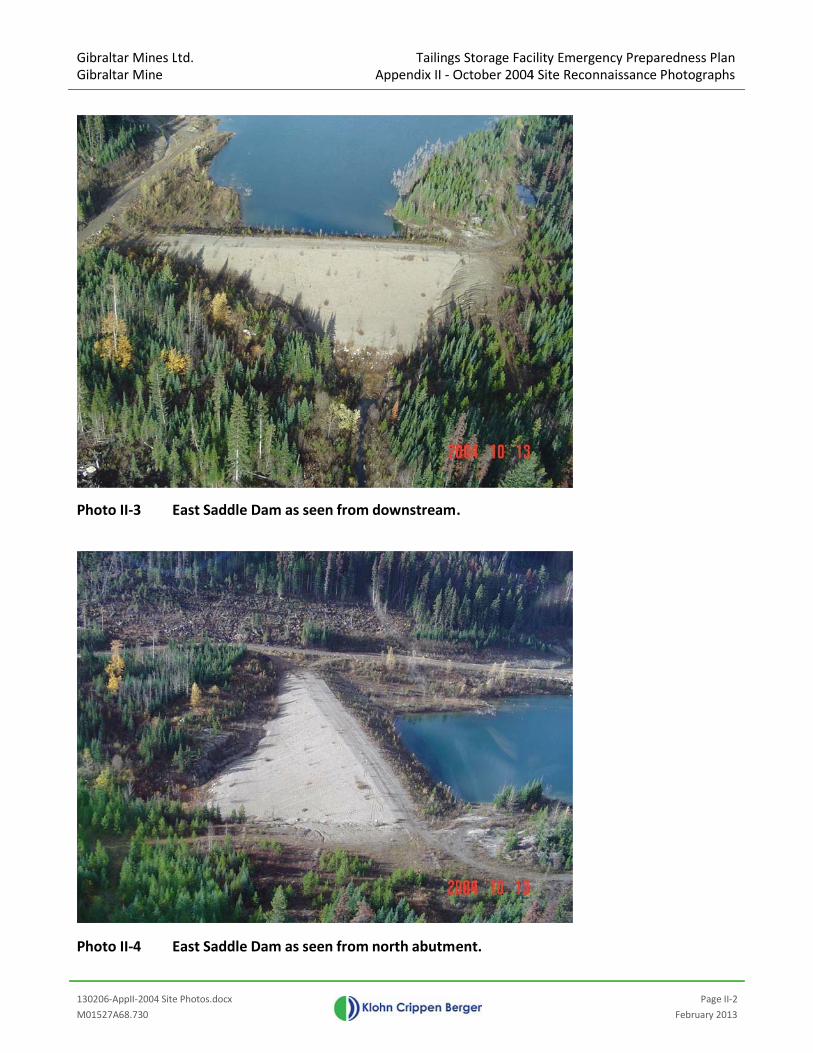
130206‐AppII‐200
M01527A68.730
Gibraltar MinGibraltar Min
Photo II‐3
Photo II‐4
04 Site Photos.docx
nes Ltd. ne
East Sadd
East Sadd
x
dle Dam as s
dle Dam as s
A
seen from d
seen from n
TailingsAppendix II ‐ O
ownstream
orth abutme
s Storage FacOctober 2004
.
ent.
ility Emergen4 Site Reconna
Fe
ncy Preparednaissance Phot
Page II‐2
ebruary 2013
ness Plantographs

130206‐AppII‐200
M01527A68.730
Gibraltar MinGibraltar Min
Photo II‐5
Photo II‐6
04 Site Photos.docx
nes Ltd. ne
Arbuthno
Fredy Cre
x
ot Creek bel
eek, looking
A
low East Sad
g downstrea
TailingsAppendix II ‐ O
ddle Dam, lo
m about 2 k
s Storage FacOctober 2004
ooking down
km southwe
ility Emergen4 Site Reconna
nstream.
st of Philmo
Fe
ncy Preparednaissance Phot
on Lake.
Page II‐3
ebruary 2013
ness Plantographs

130206‐AppII‐200
M01527A68.730
Gibraltar MinGibraltar Min
Photo II‐7
Photo II‐8
04 Site Photos.docx
nes Ltd. ne
Looking d
Beedy Cr
x
downstream
reek downst
A
m at Beedy C
tream of Arb
TailingsAppendix II ‐ O
Creek. Skelto
buthnot Cre
s Storage FacOctober 2004
on Lake in ba
ek.
ility Emergen4 Site Reconna
ackground.
Fe
ncy Preparednaissance Phot
Page II‐4
ebruary 2013
ness Plantographs

130206‐AppII‐200
M01527A68.730
Gibraltar MinGibraltar Min
Photo II‐9
Photo 10
04 Site Photos.docx
nes Ltd. ne
Beaver C
Beaver Cseen from
x
Creek, lookin
Creek bridgem left bank.
A
ng downstre
e upstream o
TailingsAppendix II ‐ O
eam near the
of Beaver Cre
s Storage FacOctober 2004
e falls at the
eek and Que
ility Emergen4 Site Reconna
e old diversio
esnel River c
Fe
ncy Preparednaissance Phot
on weir.
confluence,
Page II‐5
ebruary 2013
ness Plantographs
as

130206‐AppII‐200
M01527A68.730
Gibraltar MinGibraltar Min
Photo II‐11
Photo II‐12
04 Site Photos.docx
nes Ltd. ne
Beaver C
Quesnel
x
Creek lookin
River, looki
A
g downstrea
ng downstre
TailingsAppendix II ‐ O
am from Bea
eam below t
s Storage FacOctober 2004
aver Creek b
the Beaver C
ility Emergen4 Site Reconna
bridge.
Creek conflu
Fe
ncy Preparednaissance Phot
uence.
Page II‐6
ebruary 2013
ness Plantographs
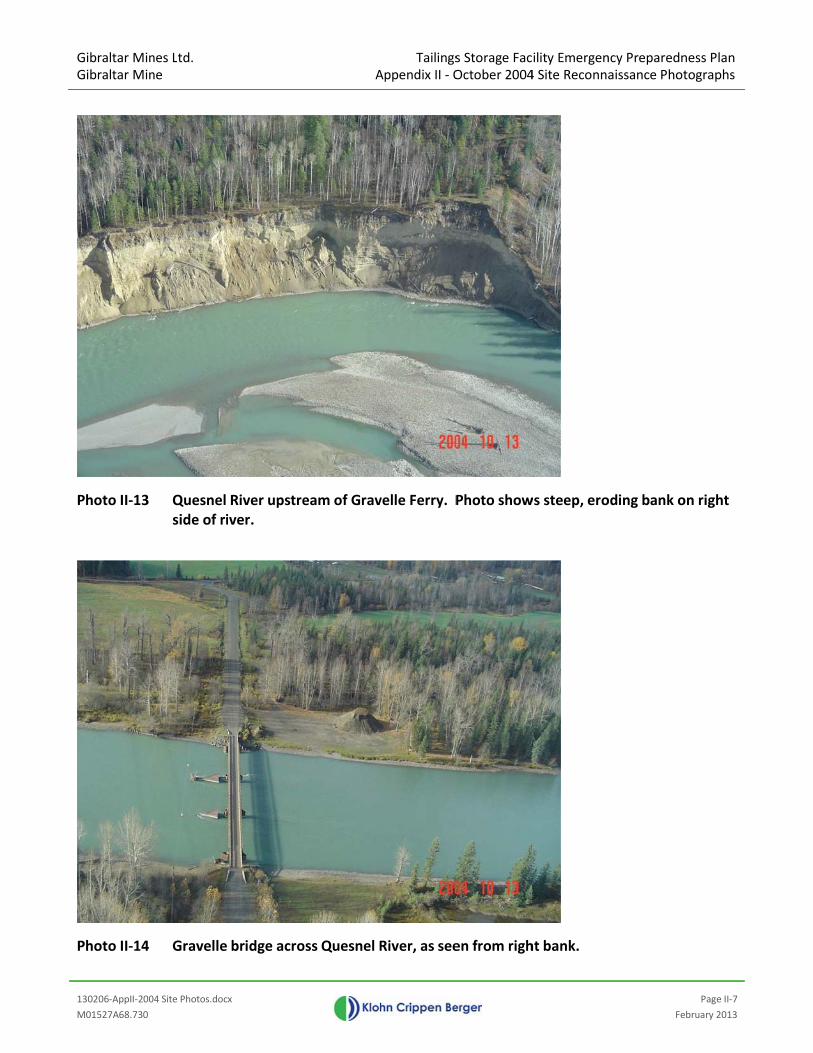
130206‐AppII‐200
M01527A68.730
Gibraltar MinGibraltar Min
Photo II‐13
Photo II‐14
04 Site Photos.docx
nes Ltd. ne
Quesnel side of ri
Gravelle
x
River upstrever.
bridge acro
A
eam of Grav
oss Quesnel R
TailingsAppendix II ‐ O
velle Ferry. P
River, as see
s Storage FacOctober 2004
Photo show
en from righ
ility Emergen4 Site Reconna
ws steep, ero
ht bank.
Fe
ncy Preparednaissance Phot
oding bank o
Page II‐7
ebruary 2013
ness Plantographs
on right

130206‐AppII‐200
M01527A68.730
Gibraltar MinGibraltar Min
Photo II‐15
Photo II‐16
04 Site Photos.docx
nes Ltd. ne
Gravelle
Gravelle of bridge
x
bridge acro
bridge as see.
A
oss Quesnel R
een from lef
TailingsAppendix II ‐ O
River as see
ft bank. Not
s Storage FacOctober 2004
n from left b
te triangular
ility Emergen4 Site Reconna
bank.
r steel ice br
Fe
ncy Preparednaissance Phot
reakers upst
Page II‐8
ebruary 2013
ness Plantographs
tream
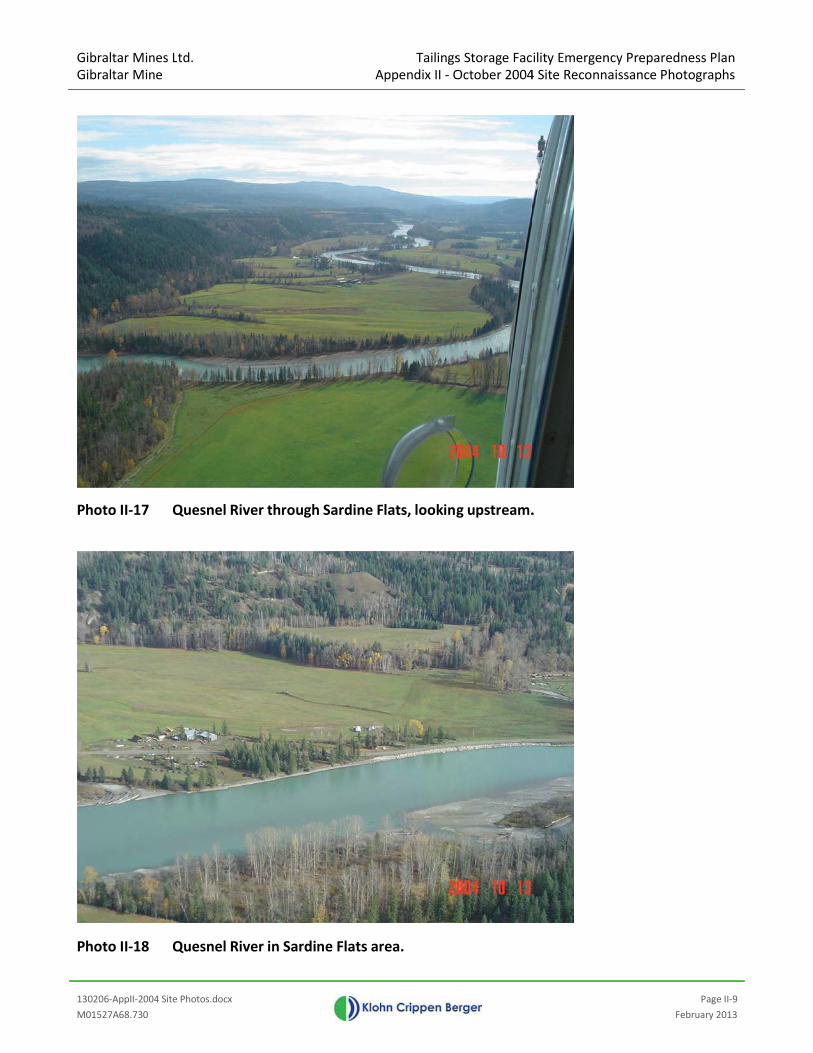
130206‐AppII‐200
M01527A68.730
Gibraltar MinGibraltar Min
Photo II‐17
Photo II‐18
04 Site Photos.docx
nes Ltd. ne
Quesnel
Quesnel
x
River throug
River in Sar
A
gh Sardine F
dine Flats ar
TailingsAppendix II ‐ O
Flats, looking
rea.
s Storage FacOctober 2004
g upstream.
ility Emergen4 Site Reconna
.
Fe
ncy Preparednaissance Phot
Page II‐9
ebruary 2013
ness Plantographs
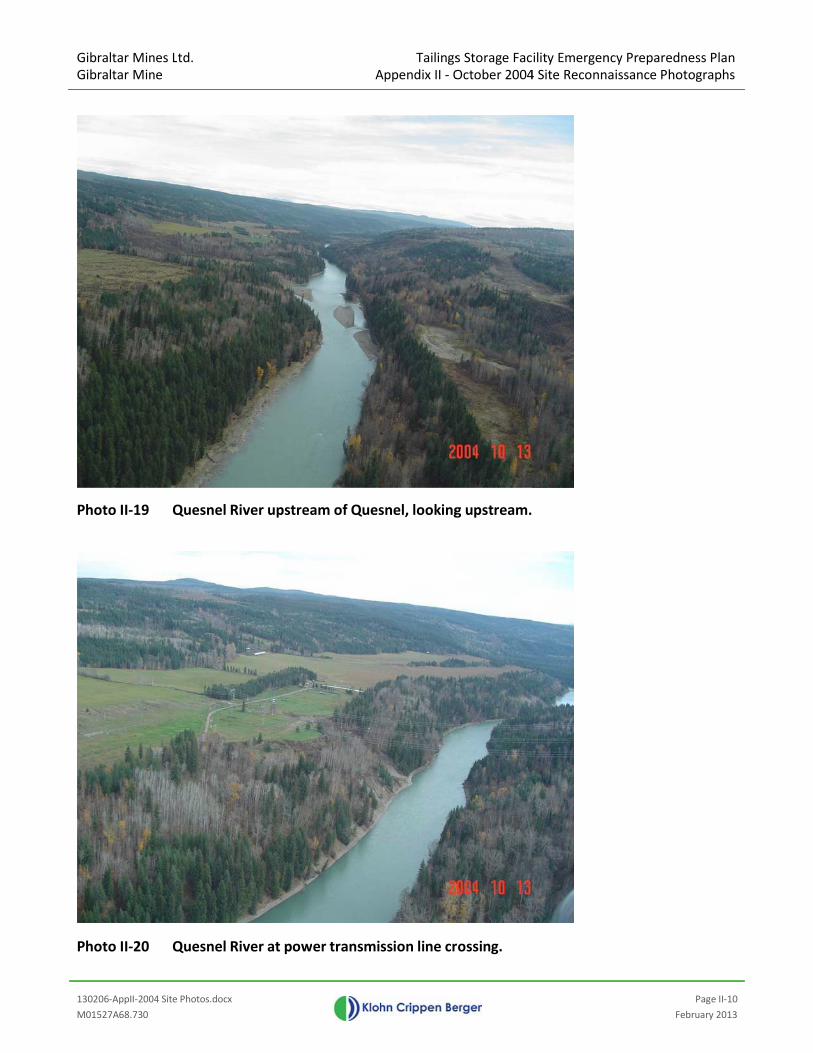
Gibraltar MinGibraltar Min
130206‐AppII‐200
M01527A68.730
Photo II‐19
Photo II‐20
nes Ltd. ne
04 Site Photos.docx
Quesnel
Quesnel
x
River upstre
River at pow
A
eam of Ques
wer transmi
TailingsAppendix II ‐ O
snel, looking
ssion line cr
s Storage FacOctober 2004
g upstream.
rossing.
ility Emergen4 Site Reconna
ncy Preparednaissance Phot
Fe
ness Plantographs
Page II‐10
ebruary 2013

Gibraltar MinGibraltar Min
130206‐AppII‐200
M01527A68.730
Photo II‐21
Photo II‐22
nes Ltd. ne
04 Site Photos.docx
Pipeline
PowerlinCity of Q
x
crossing on
ne and pipelQuesnel.
A
Quesnel Riv
ine crossing
TailingsAppendix II ‐ O
ver at easter
g on Quesnel
s Storage FacOctober 2004
rn municipa
l River at ea
ility Emergen4 Site Reconna
l boundary o
stern munic
ncy Preparednaissance Phot
Fe
of City of Qu
cipal bounda
ness Plantographs
Page II‐11
ebruary 2013
uesnel.
ary of

Gibraltar MinGibraltar Min
130206‐AppII‐200
M01527A68.730
Photo II‐23
Photo II‐24
nes Ltd. ne
04 Site Photos.docx
Quesnel
Right banRiver cha
x
River at City
nk of Quesnannel in fore
A
y of Quesne
nel River appeground and
TailingsAppendix II ‐ O
l downstrea
proximatelyd Fraser Rive
s Storage FacOctober 2004
am of pulp m
0.8 km upster at mid‐ph
ility Emergen4 Site Reconna
mill, looking
tream of Higoto.
ncy Preparednaissance Phot
Fe
downstream
ghway 97. Q
ness Plantographs
Page II‐12
ebruary 2013
m.
Quesnel

Gibraltar MinGibraltar Min
130206‐AppII‐200
M01527A68.730
Photo II‐25
Photo II‐26
nes Ltd. ne
04 Site Photos.docx
Quesnel mid‐pho
City of Q
x
River, lookito.
Quesnel as se
A
ng upstream
een from lef
TailingsAppendix II ‐ O
m. Highway
ft bank of Qu
s Storage FacOctober 2004
97 bridge in
uesnel River
ility Emergen4 Site Reconna
n foreground
r upstream o
ncy Preparednaissance Phot
Fe
d, railway br
of Highway 9
ness Plantographs
Page II‐13
ebruary 2013
ridge at
97.

Gibraltar MinGibraltar Min
130206‐AppII‐200
M01527A68.730
Photo II‐27
Photo 28
nes Ltd. ne
04 Site Photos.docx
Quesnel bridge an
City of Qbridges c
x
River, lookind railway b
Quesnel, lookcan be seen
A
ng downstrebridge upstre
king downstat mid‐phot
TailingsAppendix II ‐ O
eam at confeam of conf
tream at Frato.
s Storage FacOctober 2004
luence withfluence.
ser River. C
ility Emergen4 Site Reconna
Fraser Rive
Carson Ave. a
ncy Preparednaissance Phot
Fe
r. Johnston
and Marsh D
ness Plantographs
Page II‐14
ebruary 2013
Ave.
Dr.

Gibraltar MinGibraltar Min
130206‐AppII‐200
M01527A68.730
Photo II‐29
Photo II‐30
nes Ltd. ne
04 Site Photos.docx
Railway left bank
Highway
x
bridge acrosk. Note pipel
y 97 bridge o
A
ss Quesnel Rline strung a
on Quesnel R
TailingsAppendix II ‐ O
River upstreaalong the sid
River, lookin
s Storage FacOctober 2004
am of Highwde of bridge.
ng upstream
ility Emergen4 Site Reconna
way 97, look.
from left ba
ncy Preparednaissance Phot
Fe
king upstrea
ank.
ness Plantographs
Page II‐15
ebruary 2013
m from

Gibraltar MinGibraltar Min
130206‐AppII‐200
M01527A68.730
Photo II‐31
Photo II‐32
nes Ltd. ne
04 Site Photos.docx
Highway
Looking
x
y 97 bridge o
upstream at
A
on Quesnel R
t Quesnel Ri
TailingsAppendix II ‐ O
River, lookin
ver from Joh
s Storage FacOctober 2004
ng upstream
hnston Ave.
ility Emergen4 Site Reconna
m from left ba
. bridge.
ncy Preparednaissance Phot
Fe
ank.
ness Plantographs
Page II‐16
ebruary 2013

Gibraltar MinGibraltar Min
130206‐AppII‐200
M01527A68.730
Photo II‐33
Photo II‐34
nes Ltd. ne
04 Site Photos.docx
Johnston
Railway Fraser Ri
x
n Ave. bridge
bridge acrosiver.
A
e across the
ss the mouth
TailingsAppendix II ‐ O
Quesnel Riv
h of the Que
s Storage FacOctober 2004
ver, looking
esnel River,
ility Emergen4 Site Reconna
upstream fr
as seen from
ncy Preparednaissance Phot
Fe
rom right ba
m right bank
ness Plantographs
Page II‐17
ebruary 2013
ank.
k of

Gibraltar MinGibraltar Min
130206‐AppII‐200
M01527A68.730
Photo II‐35
Photo II‐36
nes Ltd. ne
04 Site Photos.docx
Railway river. Flo
Carson A
x
bridge at thow is left to r
Ave. pedestr
A
e mouth of tright.
ian bridge a
TailingsAppendix II ‐ O
the Quesne
cross Fraser
s Storage FacOctober 2004
l River, as se
r River, look
ility Emergen4 Site Reconna
een from the
king upstream
ncy Preparednaissance Phot
Fe
e right bank
m from left
ness Plantographs
Page II‐18
ebruary 2013
k of the
bank.

Gibraltar MinGibraltar Min
130206‐AppII‐200
M01527A68.730
Photo II‐37
Photo II‐38
nes Ltd. ne
04 Site Photos.docx
Marsh D
Fraser Ri
x
r. bridge acr
iver looking
A
ross Fraser R
upstream fr
TailingsAppendix II ‐ O
River, as see
rom Carson
s Storage FacOctober 2004
en from left b
Ave. pedest
ility Emergen4 Site Reconna
bank.
trian bridge.
ncy Preparednaissance Phot
Fe
.
ness Plantographs
Page II‐19
ebruary 2013

Gibraltar MinGibraltar Min
130206‐AppII‐200
M01527A68.730
Photo II‐39
nes Ltd. ne
04 Site Photos.docx
Typical w
x
wooden brid
A
dge on local r
TailingsAppendix II ‐ O
roads.
s Storage FacOctober 2004
ility Emergen4 Site Reconna
ncy Preparednaissance Phot
Fe
ness Plantographs
Page II‐20
ebruary 2013