Embed Size (px)
Citation preview
S1
Supporting Information
Epitaxial Transfer through End-Group Coordination
Modulates Odd-Even Effect in Alkanethiol
Monolayer Assembly
Yeneneh Y. Yimer‡a
, Kshitij C. Jha‡a
, and Mesfin Tsige*a
aDepartment of Polymer Science, The University of Akron, Akron, OH 44325
* Corresponding author: [email protected]
‡These authors contributed equally to this work
S1. Models, Parameters and Protocols of MD Simulation
Models and Parameters All-atom molecular dynamic simulations were carried out to study self assembly of n-
alkanethiol monolayers on Au {111} surface. Two systems of hydroxyl and methyl end
terminated n-lkanethiols with different chain lengths (n=11-32) are considered. Accurate
and optimized potential for gold {111}26
were utilized, which have been shown to
reproduce properties for metals at biological and aqueous interafces in good agreement
with experiment, including surface freezing, adsorption energies, specific adsorption on
facets and orientation of water.26,29,31,S1-S3
The force field parameters for n-alkanethiols
were obtained from the optimized potential for liquid simulations-all atom (OPLS-AA)27
that have been optimized for both alkanes and n-alkanethiolsS4
and extensively used for
studying properties of monolayer assembly.S5,S6
The Au {111} surface with a cross sectional area of ~ 6x6 nm2 (60.499x59.856 Å
2) and
vertical thickness of ~ 3 nm (28.256 Å) was constructed using metal unit cell with
parameters obtained from x-ray dataS7
using the graphical interface of Materials Studio
6.0. S8
A total of 6096 atoms were part of the gold {111} surface in the simulation. We
choose 6x6 nm2
as it has been previously reported that 6 nm is the minimum size of the
gold surface for relatively defect free assembly of monolayers.S9
Additionally, systems
with ~12x12 nm2 were also analyzed for all systems, but no appreciable difference in
monolayer assembly characteristics was observed. To retain computational efficiency, ~
6x6 nm2 system sizes were used for all analyses.
The van der Waals interactions for the system are described by the 12-6 Lennard-Jones
potential (LJ). The interaction parameters (σij and εij) for the hetero-atomic (including
between alkanethiol and Au) interactions are specified by the geometric mean of the
homo-atomic parameters for both n-alkanethiols and Au, as is the case with the OPLS-
AA force field. For intra-molecular interactions between atoms separated by three bonds,
Electronic Supplementary Material (ESI) for NanoscaleThis journal is © The Royal Society of Chemistry 2014
S2
the interaction potential is reduced by a factor of 2, following the OPLS-AA force field
paradigm.
Protocols The sulfur atoms of SH-(CH2)n-OH/ SH-(CH2)n-CH3, with n varied from 11-32 were
initially placed at 3 Å above the top Au layer with (√ √ ) R30⁰ triangular lattice as
reported in literature21
with lattice constant a = 4.995 Å. The n-alkanethiols initially
orient normal to the Au surface. The total numbers of alkanethiol chains in the system are
168 with surface coverage of 21.55 Å2 per chain for a coverage density of ~5 chains/nm
2.
All the simulation was carried out in the NVT ensemble. The initial equilibration was
done by heating the system from 20 K to 300 K with discrete steps of 20 K/50 ps. After
the equilibration, the systems were run at a temperature of 300 K for additional 5 ns.
Dynamics of transfer, monolayer stability, and variance in distributions (adatom profile
and tilt angle) were analyzed by heating equilibrated systems from 300 K to 400 K
followed by cooling from 400 K to 300 K in discrete steps of 10 K/ 200 ps. For accurate
analyses at each temperature, the last snapshot from the heating cycles were run for more
than 2 ns and data collected in the equilibrated phase as seen through block averages of
total energy.
All simulations were carried out using the LAMMPS simulation package.S9
The
equations of motion were integrated using the velocity-Verlet algorithm using a time step
of 1 fs. For NVT ensembles, a Nosé-Hoover thermostat with a damping time of 100 fs
was used to maintain the temperature of the system. For the non-bonded interactions, the
cutoff radius was fixed at 12 Å and the long-range Coulomb interactions (beyond the
cutoff radius) were calculated using the particle-particle/particle-mesh(PPPM)
algorithm.S10
S2. Tilt Angle Computation
The tilt angle θ is the angle between the z axis, viz. normal to the gold surface, and a
vector used to describe the orientation of different parts of n-alkanethiols. For hydroxyl
terminated we define two orientation vectors. The first vector (also referred to as S-O tilt
angle) goes from sulfur atom of the thiol group to the oxygen atom on the hydroxyl
group, as shown in Figure 1A. The second vector (also known as the S-C tilt angle) goes
from the sulfur atom of the thiol group to the carbon atom of the methylene group
dierctly bonded to the end terminal hydroxyl group as shown in Figure 1B. For methyl
terminated n-alkanethiols the orientation vector is defined as the vector going from the
sulfur atom of the thiol to the carbon atom in the methyl group as shown in Figure 1C.
Figure S1 shows variation in tilt angle for methyl terminated n-alkanethiols, and the chain
length dependence on peak is similar to that of hydroxyl terminated n-alkanethiols (S-C
tilt angle distribution shown in Figure 3). The temperature dependent S-C tilt angle
profile for hydroxyl terminated n-alkanethiols (Figure S2) also shows a systematic shift
Electronic Supplementary Material (ESI) for NanoscaleThis journal is © The Royal Society of Chemistry 2014

S3
to the left (or lower tilt angle) as observed for S-O tilt angle distribution temperature
dependence in Figure 4B.
Figure S1. Tilt angle distribution at 300 K for three chain lengths (n=14, 26, 30) for
methyl-terminated n-alkanethiols.
Electronic Supplementary Material (ESI) for NanoscaleThis journal is © The Royal Society of Chemistry 2014
S4
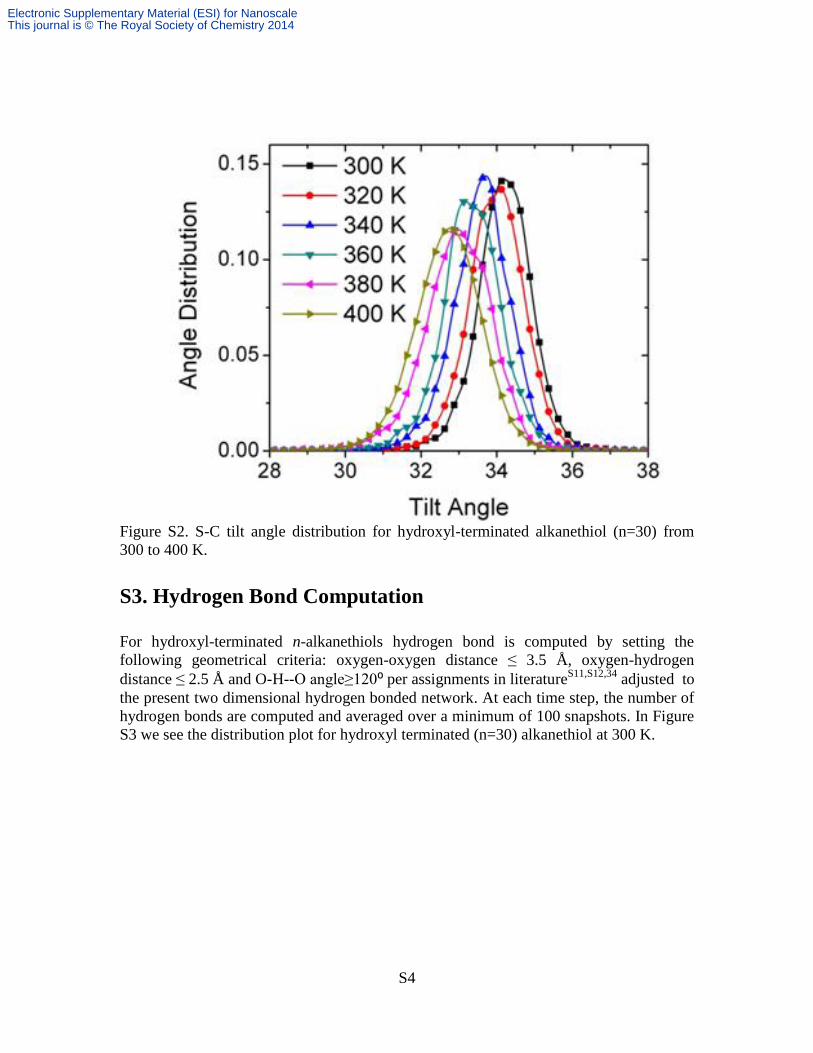
Figure S2. S-C tilt angle distribution for hydroxyl-terminated alkanethiol (n=30) from
300 to 400 K.
S3. Hydrogen Bond Computation
For hydroxyl-terminated n-alkanethiols hydrogen bond is computed by setting the
following geometrical criteria: oxygen-oxygen distance ≤ 3.5 Å, oxygen-hydrogen
distance ≤ 2.5 Å and O-H--O angle≥120⁰ per assignments in literatureS11,S12,34
adjusted to
the present two dimensional hydrogen bonded network. At each time step, the number of
hydrogen bonds are computed and averaged over a minimum of 100 snapshots. In Figure
S3 we see the distribution plot for hydroxyl terminated (n=30) alkanethiol at 300 K.
Electronic Supplementary Material (ESI) for NanoscaleThis journal is © The Royal Society of Chemistry 2014
S5
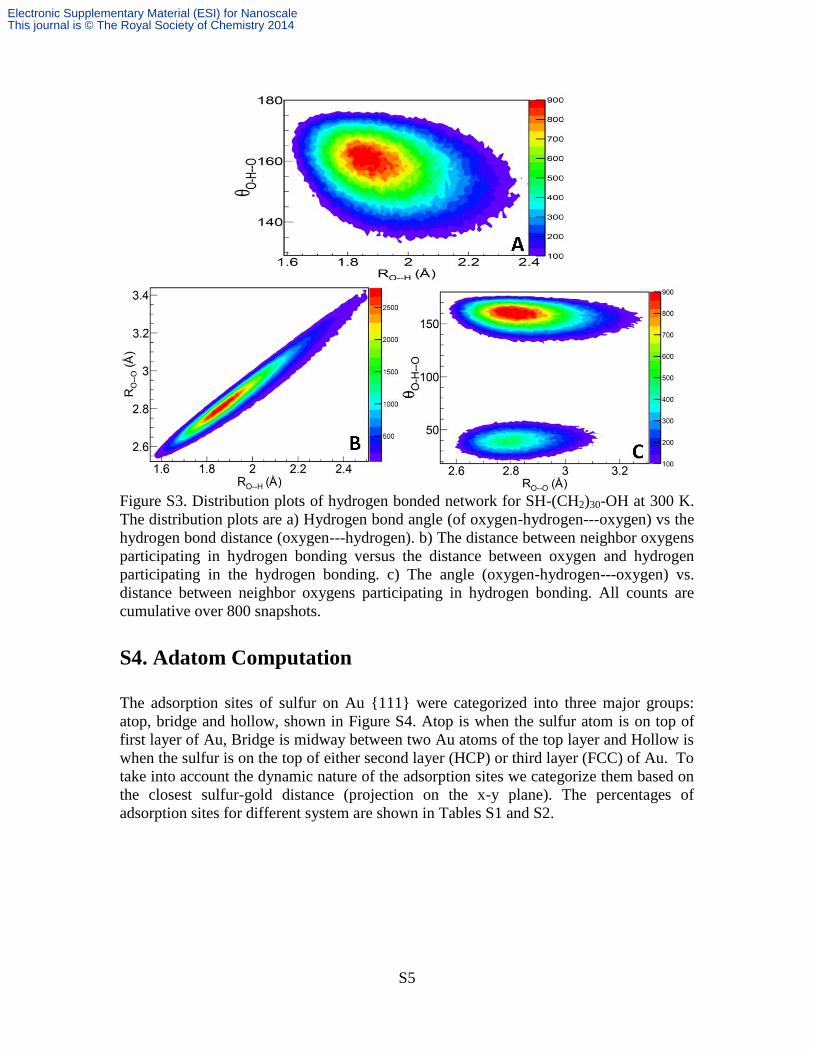
Figure S3. Distribution plots of hydrogen bonded network for SH-(CH2)30-OH at 300 K.
The distribution plots are a) Hydrogen bond angle (of oxygen-hydrogen---oxygen) vs the
hydrogen bond distance (oxygen---hydrogen). b) The distance between neighbor oxygens
participating in hydrogen bonding versus the distance between oxygen and hydrogen
participating in the hydrogen bonding. c) The angle (oxygen-hydrogen---oxygen) vs.
distance between neighbor oxygens participating in hydrogen bonding. All counts are
cumulative over 800 snapshots.
S4. Adatom Computation
The adsorption sites of sulfur on Au {111} were categorized into three major groups:
atop, bridge and hollow, shown in Figure S4. Atop is when the sulfur atom is on top of
first layer of Au, Bridge is midway between two Au atoms of the top layer and Hollow is
when the sulfur is on the top of either second layer (HCP) or third layer (FCC) of Au. To
take into account the dynamic nature of the adsorption sites we categorize them based on
the closest sulfur-gold distance (projection on the x-y plane). The percentages of
adsorption sites for different system are shown in Tables S1 and S2.
Electronic Supplementary Material (ESI) for NanoscaleThis journal is © The Royal Society of Chemistry 2014
S6
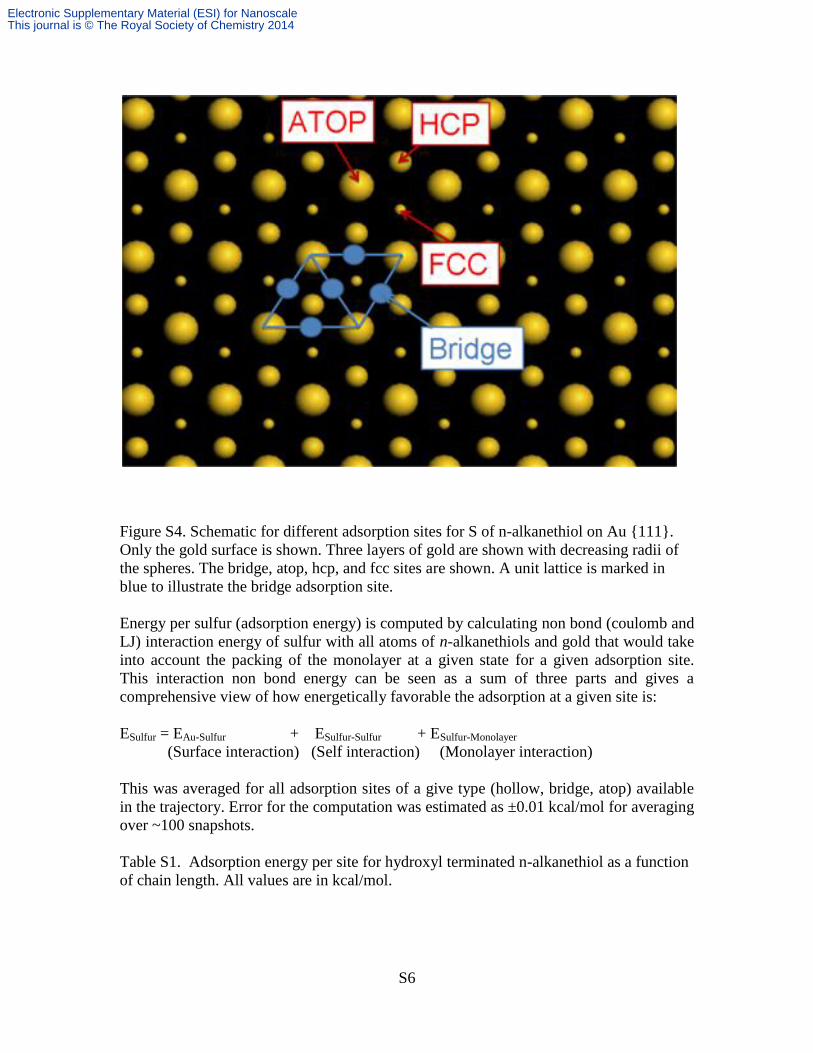
Figure S4. Schematic for different adsorption sites for S of n-alkanethiol on Au {111}.
Only the gold surface is shown. Three layers of gold are shown with decreasing radii of
the spheres. The bridge, atop, hcp, and fcc sites are shown. A unit lattice is marked in
blue to illustrate the bridge adsorption site.
Energy per sulfur (adsorption energy) is computed by calculating non bond (coulomb and
LJ) interaction energy of sulfur with all atoms of n-alkanethiols and gold that would take
into account the packing of the monolayer at a given state for a given adsorption site.
This interaction non bond energy can be seen as a sum of three parts and gives a
comprehensive view of how energetically favorable the adsorption at a given site is:
ESulfur = EAu-Sulfur + ESulfur-Sulfur + ESulfur-Monolayer
(Surface interaction) (Self interaction) (Monolayer interaction)
This was averaged for all adsorption sites of a give type (hollow, bridge, atop) available
in the trajectory. Error for the computation was estimated as ±0.01 kcal/mol for averaging
over ~100 snapshots.
Table S1. Adsorption energy per site for hydroxyl terminated n-alkanethiol as a function
of chain length. All values are in kcal/mol.
Electronic Supplementary Material (ESI) for NanoscaleThis journal is © The Royal Society of Chemistry 2014

S7
Spacer Length Atop Bridge Hollow
14 -3.08 -3.41 -3.48
20 -3.10 -3.41 -3.48
26 -3.09 -3.41 -3.48
30 -3.11 -3.42 -3.47
Table S2. Adsorption energy per site for methyl terminated n-alkanethiol as a function of
chain length. All values are in kcal/mol.
Spacer Length Atop Bridge Hollow
14 -3.12 -3.41 -3.48
20 -3.10 -3.42 -3.48
26 -3.09 -3.40 -3.47
30 -2.31 -3.39 -3.45
Table S3. Adsorption site percentage for hydroxyl terminated n-alkanethiols as a function
of chain length and temperature.
n Temperature(K) System Atop Bridge Hollow
14 300 Initial equilibrated 3.18 ±0.22 50.55 ±0.69 46.27 ±0.73
14 400 Step heated 4.54 ±0.10 52.67 ±0.26 42.79 ±0.26
14 300 Step cooled 3.90 ±0.12 50.94 ±0.38 45.16 ±0.38
20 300 Initial equilibrated 3.42 ±0.08 50.62 ±0.27 45.96 ±0.26
20 400 Step heated 4.70± 0.16 53.74 ±0.35 41.56 ±0.34
20 300 Step cooled 3.47± 0.11 50.97 ±0.35 45.56±0.34
26 300 Initial equilibrated 2.43 ±0.07 52.29 ±0.24 45.28 ±0.23
26 400 Step heated 4.52±0.15 53.74 ±0.38 41.74 ±0.36
26 300 Step cooled 1.83±0.07 51.17 ±0.31 47.00 ±0.32
Table S4. Adsorption site percentage for methyl terminated n-alkanethiols as a function
of chain length and temperature.
n Temperature(K) System Atop Bridge Hollow
14 300 Initial equilibrated 2.29 ± 0.13 46.68± 0.44 51.03± 0.43
14 360 Step heated 4.74± 0.19 51.73 ± 0.44 43.53±0.43
30 300 Initial equilibrated 1.64± 0.07 55.62± 0.27 42.74 ± 0.27
30 400 Step heated 2.53± 0.13 56.43± 0.34 41.04 ±0.35
S5. Epitaxial Transfer Computation
The radial distribution of the sulfur atom of the thiol group for both hydroxyl and methyl
terminated n-alkanethiols (Figures S5B, D and S6B), the oxygen atom of the hydroxyl
group for hydroxyl terminated n-alkanethiols (S5A, C), carbon of the methyl group (S6A)
for methyl terminated n-alkanethiols are computed for different chain lengths and
Electronic Supplementary Material (ESI) for NanoscaleThis journal is © The Royal Society of Chemistry 2014
S8
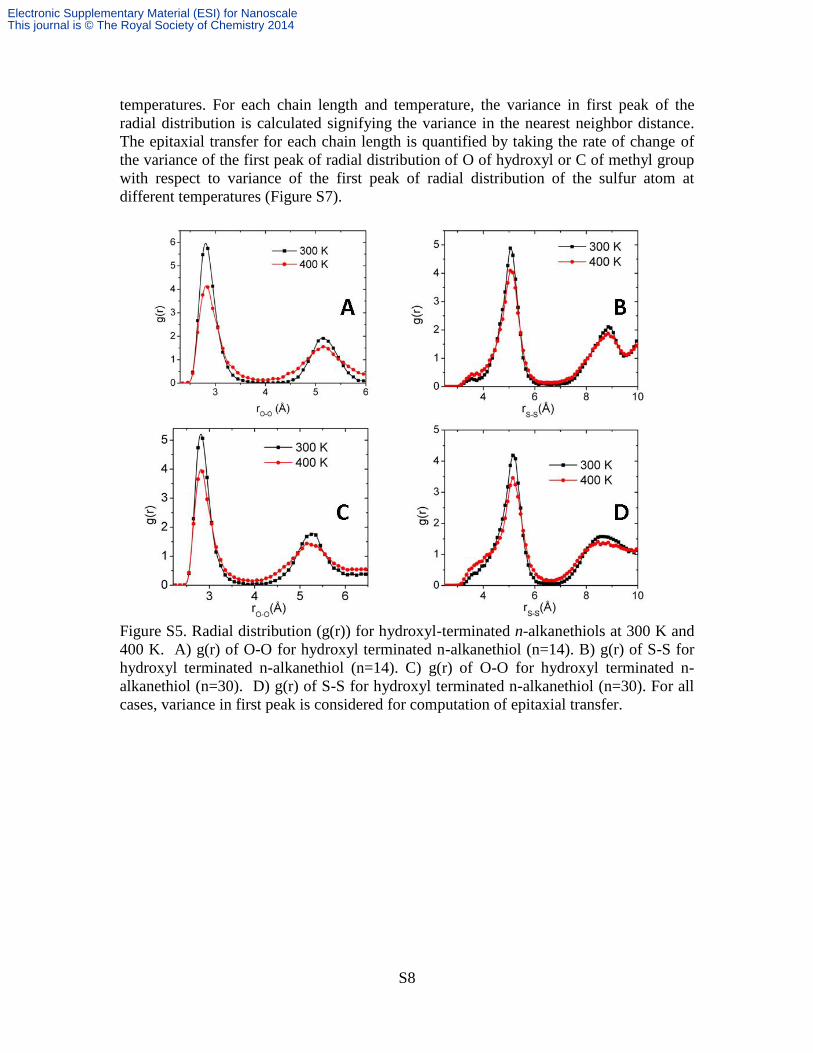
temperatures. For each chain length and temperature, the variance in first peak of the
radial distribution is calculated signifying the variance in the nearest neighbor distance.
The epitaxial transfer for each chain length is quantified by taking the rate of change of
the variance of the first peak of radial distribution of O of hydroxyl or C of methyl group
with respect to variance of the first peak of radial distribution of the sulfur atom at
different temperatures (Figure S7).
Figure S5. Radial distribution (g(r)) for hydroxyl-terminated n-alkanethiols at 300 K and
400 K. A) g(r) of O-O for hydroxyl terminated n-alkanethiol (n=14). B) g(r) of S-S for
hydroxyl terminated n-alkanethiol (n=14). C) g(r) of O-O for hydroxyl terminated n-
alkanethiol (n=30). D) g(r) of S-S for hydroxyl terminated n-alkanethiol (n=30). For all
cases, variance in first peak is considered for computation of epitaxial transfer.
Electronic Supplementary Material (ESI) for NanoscaleThis journal is © The Royal Society of Chemistry 2014
S9
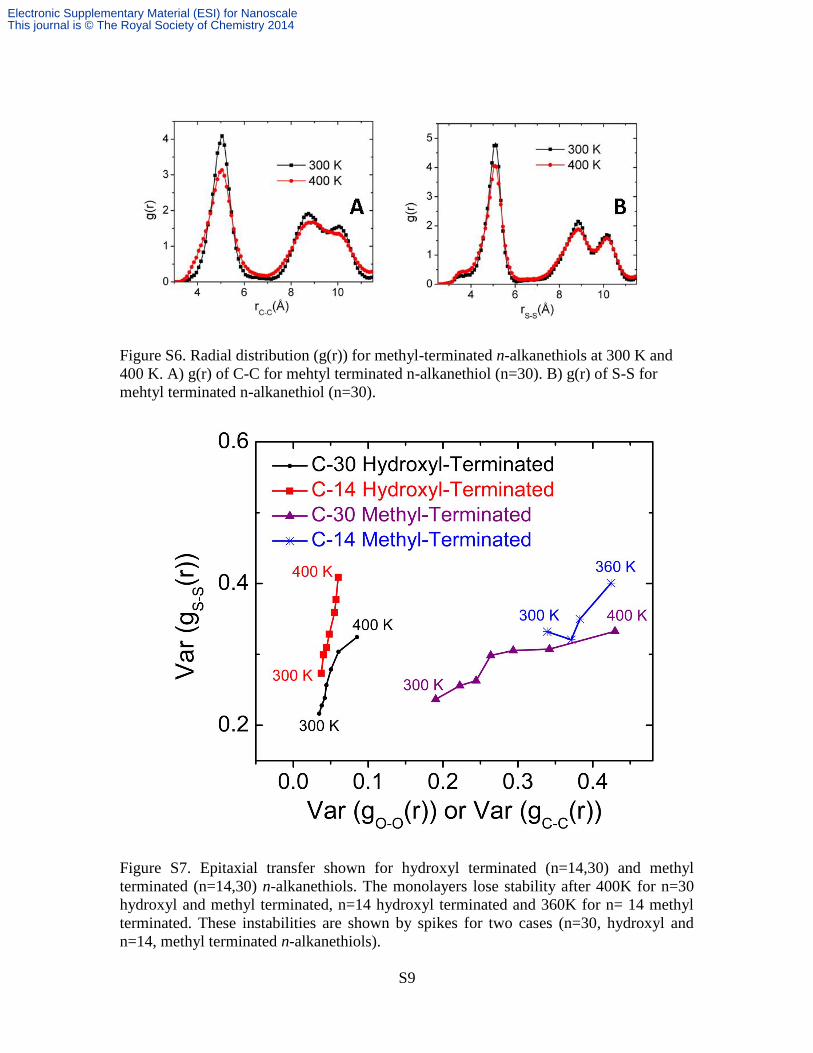
Figure S6. Radial distribution (g(r)) for methyl-terminated n-alkanethiols at 300 K and
400 K. A) g(r) of C-C for mehtyl terminated n-alkanethiol (n=30). B) g(r) of S-S for
mehtyl terminated n-alkanethiol (n=30).
Figure S7. Epitaxial transfer shown for hydroxyl terminated (n=14,30) and methyl
terminated (n=14,30) n-alkanethiols. The monolayers lose stability after 400K for n=30
hydroxyl and methyl terminated, n=14 hydroxyl terminated and 360K for n= 14 methyl
terminated. These instabilities are shown by spikes for two cases (n=30, hydroxyl and
n=14, methyl terminated n-alkanethiols).
Electronic Supplementary Material (ESI) for NanoscaleThis journal is © The Royal Society of Chemistry 2014
S10
S6. Energy per Chain Computation
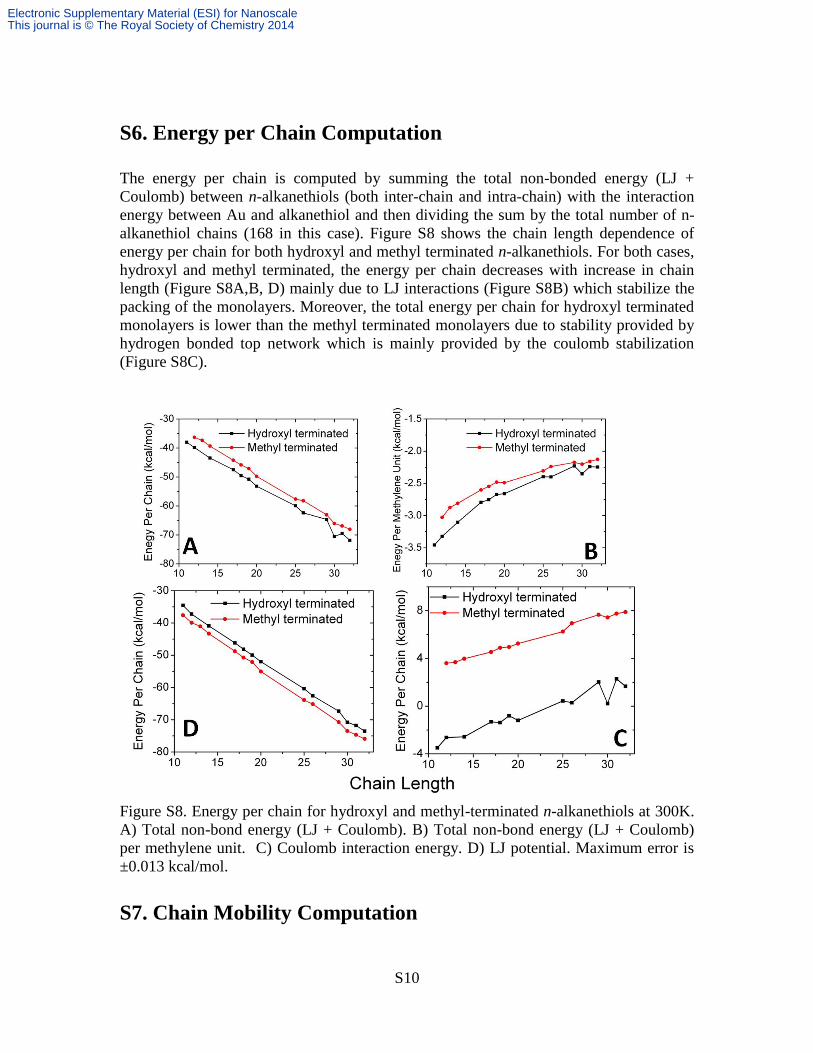
The energy per chain is computed by summing the total non-bonded energy (LJ +
Coulomb) between n-alkanethiols (both inter-chain and intra-chain) with the interaction
energy between Au and alkanethiol and then dividing the sum by the total number of n-
alkanethiol chains (168 in this case). Figure S8 shows the chain length dependence of
energy per chain for both hydroxyl and methyl terminated n-alkanethiols. For both cases,
hydroxyl and methyl terminated, the energy per chain decreases with increase in chain
length (Figure S8A,B, D) mainly due to LJ interactions (Figure S8B) which stabilize the
packing of the monolayers. Moreover, the total energy per chain for hydroxyl terminated
monolayers is lower than the methyl terminated monolayers due to stability provided by
hydrogen bonded top network which is mainly provided by the coulomb stabilization
(Figure S8C).
Figure S8. Energy per chain for hydroxyl and methyl-terminated n-alkanethiols at 300K.
A) Total non-bond energy (LJ + Coulomb). B) Total non-bond energy (LJ + Coulomb)
per methylene unit. C) Coulomb interaction energy. D) LJ potential. Maximum error is
±0.013 kcal/mol.
S7. Chain Mobility Computation
Electronic Supplementary Material (ESI) for NanoscaleThis journal is © The Royal Society of Chemistry 2014
S11
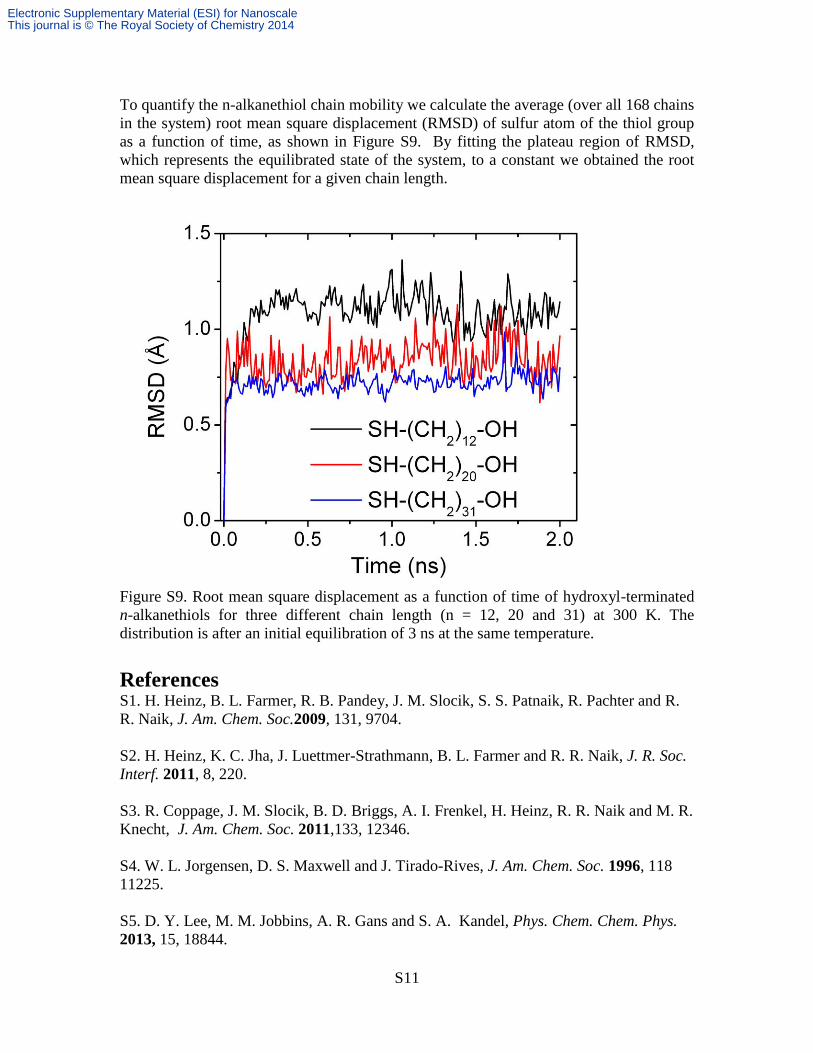
To quantify the n-alkanethiol chain mobility we calculate the average (over all 168 chains
in the system) root mean square displacement (RMSD) of sulfur atom of the thiol group
as a function of time, as shown in Figure S9. By fitting the plateau region of RMSD,
which represents the equilibrated state of the system, to a constant we obtained the root
mean square displacement for a given chain length.
Figure S9. Root mean square displacement as a function of time of hydroxyl-terminated
n-alkanethiols for three different chain length (n = 12, 20 and 31) at 300 K. The
distribution is after an initial equilibration of 3 ns at the same temperature.
References
S1. H. Heinz, B. L. Farmer, R. B. Pandey, J. M. Slocik, S. S. Patnaik, R. Pachter and R.
R. Naik, J. Am. Chem. Soc.2009, 131, 9704.
S2. H. Heinz, K. C. Jha, J. Luettmer-Strathmann, B. L. Farmer and R. R. Naik, J. R. Soc.
Interf. 2011, 8, 220.
S3. R. Coppage, J. M. Slocik, B. D. Briggs, A. I. Frenkel, H. Heinz, R. R. Naik and M. R.
Knecht, J. Am. Chem. Soc. 2011,133, 12346.
S4. W. L. Jorgensen, D. S. Maxwell and J. Tirado-Rives, J. Am. Chem. Soc. 1996, 118
11225.
S5. D. Y. Lee, M. M. Jobbins, A. R. Gans and S. A. Kandel, Phys. Chem. Chem. Phys.
2013, 15, 18844.
Electronic Supplementary Material (ESI) for NanoscaleThis journal is © The Royal Society of Chemistry 2014
S12
S6. J. M. D. Lane, M. Chandross, M. J. Stevens and G. S. Grest, Langmuir 2008, 24,
5209.
S7. CRC Handbook of Chemistry and Physics, 89th
ed.; D. R. Lide, Ed.; CRC press: Boca
Raton, 2008.
S8. Materials Studio 4.0, Cerius2, and Discover programs; Accelrys, Inc., San Diego,
2006
S9. T. Djebaili, J. Richardi, S. Abel and M. Marchi, J. Phys. Chem. C 2013, 117, 17791.
S9. S. Plimpton, J. Comp. Phys. 1995,117, 1.
S10. R. W. Hockney and J. W. Eastwood, Computer Simulation Using Particles Adam
Hilger, Bristol, Philadelphia, 1988
S11. A. Luzar and D. Chandler, Phys. Rev. Lett. 1996, 76, 928.
S12. A Luzar and D. Chandler, Nature 1996, 379, 55.
Electronic Supplementary Material (ESI) for NanoscaleThis journal is © The Royal Society of Chemistry 2014


![Structure and functional properties of epitaxial PbZrxTi O3 films...epitaxial films[11][12]. Once the high quality epitaxial PZT films are made these can be used to better understand](https://img.dokumen.tips/doc/110x75/60df425bb5812e17d635303f/structure-and-functional-properties-of-epitaxial-pbzrxti-o3-films-epitaxial.jpg)