Embed Size (px)
Citation preview

Epidemiology of MDS
Rena Buckstein MDCo-Director MDS Research
ProgramOdette Cancer Center

Definition: Epidemiology
“The study of the distribution of diseases in populations and of factors that influence the occurrence of disease”
• Data sources: death certificates, disease registries, population censuses, surveys– Mortality– Incidence– Prevalence

Objectives• What is the incidence and prevalence of MDS in
general population?• Review known risk factors for MDS• Compare differences in MDS between Caucasian
and Asian populations and in those aged < 50• Discuss the prevalence of unexplained anemia in
the elderly • Present Sunnybrook MDS prevalence data from
investigations of unexplained low blood counts

Epidemiology of MDS: General Comments
• MDS complex and varied group of malignant stem cell disorders
• Until recently, poorly documented incidence and prevalence data
• Estimates ranged from 1500-15,000 new cases per year – increasing????– Aging population– Better diagnostic capabilities– Improved recognition– More therapeutic options– More survivors of cancer

Risk Factors for MDS• 80% Unknown• Age• Gender• DNA damaging drugs
– Chemotherapy– Environmental/occupational– Smoking– Ionizing Radiation
• Rare-Inherited abnormalities– Fanconi’s anemia, congenital MDS
List AF et al. in Lee RG et al. eds. Wintrobes Clinical hematology 2003:2207

Case control diagramMyelodysplasiaSmoking
Yes
No
Yes
No
Time
Research
Sample with
disease (cases)
Sample with
disease (cases)
Sample without disease
(controls)
Population at Risk

Epidemiology of MDS: case control study at MDACC n=354
patientsRisk Factor: Odds Ratio:Smoking 1.65Family history 1.92Agricultural chemicals 4.55Organic solvents 2.05Smoking + chemical 3.22Wine drinkers 0.54
Strom S. et al. Leukemia 2005;19(11):1912-8.

Occupational Groups At risk for MDS
• Painters• Plant and machine operators• Coal miners• Embalmers• Garage and transport workers• Shoe workers• Hair dressers and cosmetologists• Sea men on tankers• Research science technicians• Farmers

Diet and MDS
• Hypothesis:– Dietary intake and secondary production of
phenol (and hydroquinone)– People who eat a high-meat diet have
increased production of phenol– Arbutin rich food (wheat)

Summary: Cause of MDS
• De novo: combination of genetic susceptibility, environment, occupation, smoking, diet?
• Therapy related: DNA damaging chemotherapy or radiation
• A lot more needs to be learned!

Incidence - the number of new occurrences of a condition (or disease) in a population over a period of time
Prevalence - the measure of a condition in a population at a given point in time

MDS Incidence: SEER database 2001-2003
• 7131 cases reported• Incidence: 3.4/100,000
– 4.5/100,00 in men; 2.7/100,000 in women• Risk of MDS increased with age• Median age at diagnosis: 76• Varied by sex and race• Estimated 10,300 cases were
diagnosed in US in 2003Ma X. et al. Cancer 2007;109:1536-42

Age-Specific Incidence Rates of MDS in the US 2001-2003: SEER database
0
10
20
30
40
50
60
20- 25- 30- 35- 40- 45- 50- 55- 60- 65- 70- 75- 80- >85
Age categories
Rat
es p
er 1
00,0
00
AllMenWomen
Ma X. et al. Cancer 2007;109:1536-42

Incidence Rates by Sex and Race
Variable All Men WomenAll racesWhiteBlackAmerican Indian/Alaska NativeAsian or Pacific Islander
3.43.53
1.32.6
4.54.63.51.83.2
2.72.72.71
2.2

Registry Incidence* data by age
Registry 50-69 70-74 75-79
16.6 25.7
23.4
24.5
12.7
80-84
SEER2007
4.1 36.2
31.3
42.5
Dusseldorf2007
4.9
UK1987
4.1
* Denotes per 100,000

SEER Age adjusted incidence rates in hematology 65+
Disease Rate/100,000AML 16.7CLL 22Myeloma 29Hodgkin’s 3.9MDS 16-36

Differences in clinical features between Japanese and German
Patients with RA in MDS• Study compared clinical features and
prognostic factors between 131 Japanese and 597 German patients
• Compared overall and disease related survival between both groups
Matsuda A. et al. Blood 2005;106:2633-2640

Japan(n=131)
Germany(n= 597)
P
Age2-3 reduced countsPlt countAbn. ChromosomesDel 5qLow / Int-1Median SurvivalIPSS prognostic
57 (12-88)68%
38 (4-246)29%8%
20% / 72%175 mos
no
71 (7-93)39%
127(13-390)53%20%
48% / 45%40 mos
yes
<.001<.001.026
<.001
<.001
Matsuda A. et al. Blood 2005;106:2633-2640

Figure 1. Cumulative risk of acute leukemia evolution of patients with FAB-RA
Matsuda, A. et al. Blood 2005;106:2633-2640
Copyright ©2005 American Society of Hematology. Copyright restrictions may apply.

Figure 2. Cumulative survival of patients with FAB-RA
<60 >60all
Matsuda, A. et al. Blood 2005;106:2633-2640
Copyright ©2005 American Society of Hematology. Copyright restrictions may apply.

MDS in young patients2728 MDS patients analyzed (232 age < 50)• 8% aged < 50 at diagnosis• Baseline blood values, classification and
risk scores identical– More common in females – More deaths do to MDS (67 vs 45%)– Overall survival better– 20 year OS 80% in low risk MDS
Kuendgen A. et al. JCO 2006; 24: 5358-65

What is MDS Prevalence?

MDS Prevalence: NHANES survey III
• 39, 695 non-institutionalized US population (1988-1994)
• 4199 interviewed people 65 + yrs had complete blood count
• Results:– Prevalence of anemia 10.6%
Guralnik, J. et al. Blood 2004; 104: 2263-2268
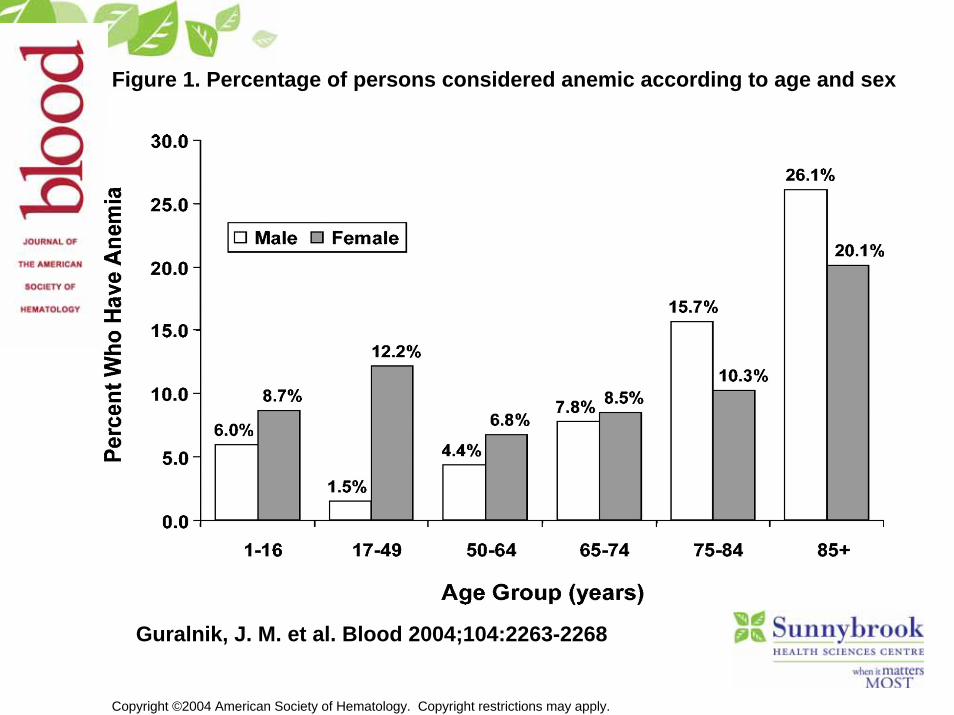
Figure 1. Percentage of persons considered anemic according to age and sex
Guralnik, J. M. et al. Blood 2004;104:2263-2268
Copyright ©2004 American Society of Hematology. Copyright restrictions may apply.

Figure 1. Percentage of persons age 65 and older who are anemic, by race/ethnicity and sex
Guralnik, J. M. et al. Hematology 2005;2005:528-532
Copyright ©2005 American Society of Hematology. Copyright restrictions may apply.

US distribution of types of anemia in persons > 65 in 2002: NHANES III
Type of Anemia % Est. Pop.Blood Loss/NutritionIron deficiency and iron with folate
and/or B12 deficiencyFolate and or B12 deficiencies
Chronic Disease (EPO deficiency)Chronic kidney disease (CKD)Anemia of chronic disease (ACD)CKD and ACD
Unexplained Anemia
3420
15328
204
34
965,544561,936
403,608904,136229,686554,281120,169945,195
Guralnik J. Blood 2004; 104:2263-2268

Unexplained Anemia in NHANES III…….
• Of the 1/3 with unexplained anemia, 17% had associated one or more additional features suspicious for MDS
• Do 5.8% of the 2.8 million anemic adults > 65 in US have MDS (n=160,000)?

Objective• Primary: Better refine the estimate of
MDS prevalence in patients with anemia or reduced blood counts using the gold standard - bone marrow
• Secondary: Identify any pre-test characteristics predictive of MDS

Methods• 4 year retrospective survey of all
bone marrows reviewed at Sunnybrook for the investigation of reduced blood counts
• Excluded outside referrals• Reviewed electronic charts for
potential risk factors that might contribute to the reduced blood counts

Methods Continued…• Characteristics of the peripheral blood
values at time of BM recorded• BM graded as:
– confirmed MDS– suspected MDS – non-diagnostic – normal – other

Methods: Predictors of MDS• Statistical analysis for important
predictors of confirming MDS• A score function (Sf) was derived from
significant predictive factors to estimate the probability for finding MDS

Results

322/2267 (14%) bone marrows met inclusion criteria
28
9417
9
21
7 3
A T L A + T A + N A + T + N T + N Other

BM Diagnosis All patients
# confirmed MDS (%) #suspected MDS (%)
# normal (%)# not diagnostic (%)
# other
73 (23%)32 (10%)54 (17%)78 (24%)85 (26%)

22.6
10
24.5
11.4
31.5
11
34.6
13.5
0
5
10
15
20
25
30
35
40
45
50
Percent
All patients
(n=322)
Patients without
RF (n=167)
Patients >/= 65
(n=209)
Patients >/= 65
without RF (n=104)
Confirmed Suspected

Let’s do the math…..• 2006 Canadian census data• 13.7% aged > 65 = 4,330,996 • If 10.2% anemic and 35% are unexplained
and 32% are MDS by BM then speculated prevalence: 49,476 cases in Canada
• If 2.2% anemic: 10,671 cases in CanadaOr
2/1000 over age 65

Limitations
• Looking back study: not all information was available
• Patient populations different from that in the NHANES US study
• The bone marrows were not reviewed by outside pathologists

Conclusions• 22.6% of patients with undiagnosed
cytopenia(s) had confirmed MDS and 10% had suspected MDS by bone marrow analysis
• In patients >65 the frequency of confirmed MDS increased to 31.5% and suspected 11%
• age > 65, increased red cell size, red cell distribution width, LDH at the time of investigative bone marrow increases the likelihood of diagnosing MDS.
• Given the prevalence of elderly anemia in North America, MDS prevalence is likely higher than initially speculated

Summary• The incidence of MDS increases significantly
with age and is more common in men• The prevalence of MDS may be higher than
we thought….• Efforts to increase diagnosis should be made• The health care burden of MDS will increase
significantly in years to come

Acknowledgements• ASH summer studentship award• Karen Jang• Department of Hematopathology• Crashley Estate Endowment to
MDS Program• Richard Wells
Thank You!