Embed Size (px)
Citation preview

7Epidemiology, disease, and health
assessment
Ailsa J. Hall, Frances M.D. Gulland, John A. Hammond,
and Lori H. Schwacke
7.1 Introduction
Understanding marine mammal health and disease and the related impacts onpopulations is crucial to support effective conservation and management decisions.However, ethical issues involved in conducting experimental studies can limit thescope of marine mammal health research. This forces a focus and reliance onepidemiological studies, similar to those that have been applied to studying factorsaffecting human health. Marine mammal epidemiology is additionally challengingbecause most marine mammals are not easily observed for most of their lives,disease states are generally difficult to detect, and reporting mechanisms for diseaseused in human and veterinary epidemiology (i.e. birth, death, and disease records)are virtually non-existent for marine mammals. Nonetheless, despite these draw-backs, there are many ways in which robust and reliable epidemiological studies canbe applied in the field of marine mammal science.
Marine mammal health and disease issues are gaining global attention and acoordinated approach to their study, such as using standard protocols, will enablemeta-analyses (combining information from multiple studies) to be carried out inthe future. It will then be much more feasible to identify the critical hazards formarine mammals, particularly if the well-defined and accepted epidemiologicalapproaches outlined here are utilized. Advances in capture and sampling methods(see Chapter 2), the expansion of stranding surveillance networks for marinemammals, the centralization of stranding records (Gulland et al. 2001a), andfollow-up monitoring of mortality and morbidity using direct observation (Wellsand Scott 1990; Gulland 1999), all now give us an unprecedented opportunity toadapt methods from human and veterinary medicine. Necropsies of stranded andby-caught animals, as well as visual assessment, remote biopsy, and capture–release
Marine Mammal Ecology and Conservation / 07-Boyd-Ch07 page 144 7:53pm OUP CORRECTED PROOF – Finals, 5/7/2010, SPi
health assessment of free-ranging individuals, provide information on causes ofdeath, endemic diseases, emerging diseases, and toxin exposure. This informationcan then be related to trends in the physical, chemical, and biological environment.
Epidemiology1 is defined as the study of the distribution and determinants ofhealth-related states in populations (Last et al. 2000). As such, it focuses onexamining the occurrence of disease with the premise that disease does not occurrandomly. It is concerned with impacts on populations not individuals. Over thelast 50 years or so epidemiological science has evolved into two distinct disciplinesthat are relevant to wildlife: modern or causational epidemiology (Rothman andGreenland 2005) and infectious disease epidemiology (Hudson et al. 2002).Causational epidemiology is the scientific method for investigating potential causallinks between exposures and responses. Exposures do not become causes untilthere is sufficient evidence for a causal link between the agent and the specificresponse or health state of interest. Additionally, a set of clearly defined studydesigns to test for causal links have been developed and refined since at leastthe 1960s.
By contrast, infectious disease epidemiology is concerned with determining theimpact that an outbreak of infection (i.e. viral, bacterial, parasitic, or fungal) willhave on the dynamics of the host population. Although there is much overlapbetween these two branches of epidemiology, particularly when investigatingthe role of confounding variables on disease occurrence, infectious disease
1 Strictly speaking the term epizootiology should be used to refer to diseases in animal populations.However, the word epidemiology is now widely applied to studies of human, veterinary, and wildlife diseases.
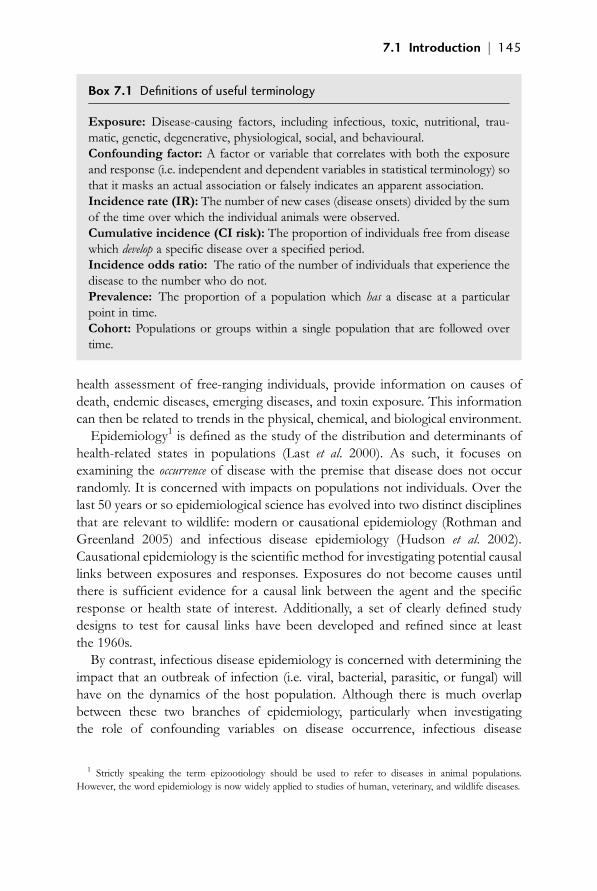
Box 7.1 Definitions of useful terminology
Exposure: Disease-causing factors, including infectious, toxic, nutritional, trau-matic, genetic, degenerative, physiological, social, and behavioural.Confounding factor: A factor or variable that correlates with both the exposureand response (i.e. independent and dependent variables in statistical terminology) sothat it masks an actual association or falsely indicates an apparent association.Incidence rate (IR): The number of new cases (disease onsets) divided by the sumof the time over which the individual animals were observed.Cumulative incidence (CI risk): The proportion of individuals free from diseasewhich develop a specific disease over a specified period.Incidence odds ratio: The ratio of the number of individuals that experience thedisease to the number who do not.Prevalence: The proportion of a population which has a disease at a particularpoint in time.Cohort: Populations or groups within a single population that are followed overtime.
Marine Mammal Ecology and Conservation / 07-Boyd-Ch07 page 145 7:54pm OUP CORRECTED PROOF – Finals, 5/7/2010, SPi
7.1 Introduction j 145
epidemiology has largely evolved as a branch of mathematical and statisticalmodelling (Grenfell and Dobson 1995). Since the causal agent is known, thefocus is then to predict the likely spread of infection during an epidemic outbreak,to estimate the cycle of infection and its inter-epidemic interval, and to investigatethe potential impact of intervention measures such as vaccination.
In this chapter we will be largely concerned with the science of causationalepidemiology. It is our intention to outline the principles and practices of causa-tional epidemiology as it applies to marine mammal science. Additional informa-tion can be found in the extensive medical and veterinary epidemiological literature.
7.1.1 Exposures and responses
Epidemiology is premised on the observation that disease has different causalfactors that can be determined by comparing disease rates in different populations,or groups of individuals, that vary with respect to their exposures. It is theseexposures that are the putative causal factors for a given disease. The termexposure covers a wide range of causal factors: infectious, toxic, nutritional,traumatic, genetic, degenerative, physiological, as well as social and behaviouralcauses. In some cases the agents or exposures responsible for the specific diseaseare fairly obvious, as is often the case where infectious agents or toxins areinvolved. However, for marine mammals the factors involved are not always asapparent as they might be among terrestrial or domestic animals, largely due to therelative inaccessibility of many species.
Although the presence of a particular infectious agent or toxin is ‘necessary’ for aspecific disease to occur, even these diseases are not usually caused by asingle factor and additional causal or risk factors will be involved (Rothman andGreenland 2005). The most widespread causes of disease identified to date inmarine mammals are certainly infectious, resulting from their exposure to arthro-pods, helminths, protozoa, fungi, bacteria, and viruses (Dierauf and Gulland 2001;Gulland and Hall 2007). Typically, epidemics have been associated with viral andbacterial infections, whereas the larger infectious agents (such as the helminths)more commonly cause endemic disease and lower mortality. Detection thereforerelies upon observation of the pathogen: detecting the presence of pathogen-specific antibodies in the blood, direct culture of the pathogen, or detecting thepresence of its genetic material (DNA or RNA). However, the level of antibodies inthe blood (termed serology) cannot usually distinguish between current or previousexposure to the pathogen. Non-infectious agents include both the chemical con-taminants and the biotoxins produced by harmful algal blooms (reviewed inLandsberg 2002; Vos et al. 2003). Detecting exposure to these relies upon meas-uring the level of the compound (or its breakdown products, i.e. the metabolites) inthe animals’ tissues, and new techniques are evolving constantly to improvesensitivity, detect new toxins, and reduce the amount of tissue required for tests.Trauma is also a disease in its broadest sense, and in marine mammals, has long
Marine Mammal Ecology and Conservation / 07-Boyd-Ch07 page 146 7:54pm OUP CORRECTED PROOF – Finals, 5/7/2010, SPi
146 j Epidemiology, disease, and health assessment

been identified as an important cause of death following interaction with fisheries(Read et al. 2006). Although the diagnosis of some traumatic causes can be obvious,such as entanglement in a net (as the exposure), others can be harder to diagnoseand rely upon detailed gross and microscopic examination of fresh tissues, e.g. gasembolism (Fernandez et al. 2005). Finally, other physiological, degenerative, andgenetic exposures as well as causes of disease are currently not well-understood inmarine mammals, and their identification requires careful and detailed sampling ofindividuals.
7.1.2 Confounding factors
Confounding (a term with a specific epidemiological definition, see definitions inBox 7.1 above) occurs when an independent factor is correlated with both anexposure and outcome, making it difficult to tease apart the contribution made byeach to the occurrence of the disease (Rothman and Greenland 2005). A con-founding factor may thus wholly or partially account for the apparent associationbetween an exposure and a response. To cause confounding in the results however,the factors must be associated with both exposure and response. For example,primiparous females may have very high contaminant concentrations in theirblubber compared to females that have already off-loaded some of their contam-inants to their offspring in the milk. A study may find that the females with highcontaminant concentrations have high offspring mortality, and conclude that themortality is related to the maternal contaminant exposure. However, the true causeof increased mortality may be related to maternal inexperience rather than con-taminant exposure per se. Thus reproductive status (primipary vs. multipary) is aconfounding factor in this example. Potential confounding factors should beconsidered prior to data collection so that appropriate study design and analysiscan be employed.
It is important that exposure measurements and disease diagnoses are carriedout in a standardized way both within and between studies. This has certainly beenaddressed for some well-studied exposures such as the persistent organic pollu-tants, but unfortunately, for few others. Indeed, many laboratories analysing marinemammal tissues for contaminant levels are participants of the US National Instituteof Standards and Technology (NIST) (Kucklick et al. 2002) inter-laboratory com-parison and calibration scheme, and this includes some marine mammal labora-tories outside the US. For example, marine mammal tissue samples collected aspart of the NOAA (National Oceanic and Atmospheric Administration) MarineMammal Health and Stranding Response (MMHSRP) biomonitoring programmefor chemical analyses use the NIST protocol. Similar inter-laboratory comparisonexercises were conducted in Europe for environmental samples under theQUASIMEME project (D. E. Wells and De Boer 1994). However, schemes suchas these are being expanded to include infectious agents and biotoxins, but effortsto implement standardization within the marine mammal community needs to be
Marine Mammal Ecology and Conservation / 07-Boyd-Ch07 page 147 7:54pm OUP CORRECTED PROOF – Finals, 5/7/2010, SPi
7.1 Introduction j 147

sustained, especially in the areas of clinical blood chemistry and haematology (Hallet al. 2007; Schwacke et al. 2009).
7.2 Effects, responses, and diagnostic techniques
7.2.1 Measuring disease occurrence
The goal of all causational epidemiological studies is to evaluate hypotheses aboutthe causation of disease, and to relate disease occurrence to the characteristics ofanimals and their environment (i.e. their exposure). This requires consistent andstandardized classification of disease and pathological findings as well as exposures.
Epidemiologists also use the term ‘effect’ in two ways. First, in the general sense,where an instance of disease may be the effect of a certain cause (for example, theeffect of domoic acid causing hippocampal atrophy in California sea lions, Zalophuscalifornianus, Goldstein et al. 2008) and second, in a very particular quantitativesense, an effect is the difference in disease occurrence between two or more groupsthat differ with respect to their exposure (usually termed ‘exposed’ and unex-posed’).
Various standard epidemiological measures are used to describe disease occur-rence:
1 The incidence is the most robust measure of disease occurrence and can alsobe visualized as the ‘flow’ of disease. The incidence rate is the number of new cases(disease onsets) divided by the sum of the time over which the individual animalswere observed, usually measured as ‘animal time’. If 10 animals were observed for1 year each the denominator would be 10 animal years�1. If 5 were observed for 6months and 5 for 1 year the denominator would be 7.5 animal years�1. If in eachcase 5 developed the disease during the study period then the incidence rates wouldbe 5/10 ¼ 0.5 animal years�1 and 5/7.5 ¼ 0.66 animal years�1, respectively.However, measuring new disease onsets over time in marine mammals is notgenerally possible except perhaps in isolated cases involving long-term studies ofknown individuals.
2 The risk of a new disease occurring is quantified using the cumulativeincidence (also called the incidence risk or incidence proportion). It is the propor-tion of individuals free from disease that develop a specific disease over a specifiedperiod, provided they do not die from any other disease during that period. Forexample, if a group of 20 animals that were initially disease-free were examinedagain 12 months later and 4 were found to have developed an infection, anindividual’s chance or risk of becoming infected over the 12-month period wouldbe 20% (4/20).
3 The prevalence of disease is the proportion of a population affected at aparticular point in time, and is interpreted as the probability of an individual fromthe same population having the disease at that particular point in time. Prevalence isoften estimated for infectious diseases from serological data, but this is actually a
Marine Mammal Ecology and Conservation / 07-Boyd-Ch07 page 148 7:54pm OUP CORRECTED PROOF – Finals, 5/7/2010, SPi
148 j Epidemiology, disease, and health assessment

measure of an individual’s encounter with infection rather than a true prevalence ofdisease, as the presence of antibody cannot usually distinguish between recoveredand carrier animals.
The differences (i.e. the occurrence of disease in the exposed population minusthat in the unexposed population) in the incidence rate, the risk (cumulativeincidence), or the prevalence of disease between exposed and reference or unex-posed control populations is then used to describe ‘effects’. Thus the incidencerate (IR) difference is calculated as the incidence rate in the exposed populationminus that in the unexposed and the cumulative incidence or risk difference is thecumulative incidence (CI) in the exposed minus the cumulative incidence in theunexposed.
Relative effect measures (ratios in the exposed compared to the unexposed) arealso commonly used where the relative excess incidence rate is defined as:
IR exposed� IR unexposedIR unexposed
¼ IR unexposed� 1IR exposed
and the relative excess risk (also called the risk ratio) is:
CI exposed� CI unexposedCI unexposed
¼ CI unexposed� 1CI exposed
Another common relative measure is the odds ratio. If the CI is the probabilityof developing a disease over a specified period then the incidence odds is theprobability of not developing the disease (i.e. 1 – CI). The odds ratio is then:
CI exposed=1� CI exposedCI unexposed=1� CI unexposed
These various relative measures can estimate the magnitude of the association ofexposures and responses, whereas absolute measures indicate the potential impact(‘effect’) on the population. More detail about epidemiological effect measures andtheir interpretation can be found in many standard epidemiological text books (e.g.Rothman and Greenland, 2005).
7.2.2 Responses, health panels, and disease classification
Diagnostic indicators
Basic haematology and blood chemistry parameters are used commonly in medicineto define health ‘panels’ to indicate the state of specific organ systems (Table 7.1).This approach assumes that the tests can be validated for the species of interest andthat ranges of normal values for wild populations can be established. This has rarelybeen the case for manymarine mammal species. Many studies on wild-caught or livestranded marine mammals include measuring a variety of haematological andclinical chemistry parameters (Lander et al. 2003; Boily et al. 2006) that might be
Marine Mammal Ecology and Conservation / 07-Boyd-Ch07 page 149 7:54pm OUP CORRECTED PROOF – Finals, 5/7/2010, SPi
7.2 Effects, responses, and diagnostic techniques j 149

Tab
le7.1
Healthpanelsusinghaem
atologyandbloodchem
istryparametersas
indicatorsof
thestatus
ofspecificorgansystem
s.
Renal
function
Hepatic
function
Haemato-
logical
status
1
Nutritional
status
Infection/
inflammation
Immun
e
status
Skin
disease
Endocrine
status
Reproductive
status
Cardio-
pulmonary
status
Neurologicalstatus
Creatinine
Alanine
amino-
transferase
Erythrocytes
Bodymass
index
Leukocytes
Leukocytes
Lesionde-
scription
Thyroid
hor-
mones
Testosterone
Respiratory
questionnaire
Seizures
Thyroid-stimu-
lating
horm
one
response
Phospho
rus
Sorbitold
ehy-
drogenase
Nucleated
erythrocytes
Glucose
Differential
white
cells
Differential
white
cells
Histopatho
-
logicresults
Aldosterone
Oestradiol
Cytology
Behaviour
(atti-
tude,aggression)
Potassium
Aspartate
ami-
notransferase
Haematocrit
Cho
lesterol
Globulins
Neutrophil
phago
cytosis
Cortisol
Progesterone
Oscultation
Cerebralspinalfluid
aspiration,cytology,
culture,serology,
biochem
istry
Bloodurea
nitrogen
Gam
ma-gluta-
myltransferase
Haemoglobin
Alkalinepho
s-
phatase
Erythrocyte
sedimenta-
tionrate
2
B-andT-cell
proliferation
Adenocortico-
trophicho
r-
mone
re-
sponse
Ultrsono
gra-
phy
3ofrepro-
ductive
tract
(uterine
size,
fetusdetec-
tion,follicles,
corpora
lutea,
testissize)
Culture
Computed
tomog-
raphy,M
agnetic
resonanceimaging3
Marine Mammal Ecology and Conservation / 07-Boyd-Ch07 page 150 7:54pm OUP CORRECTED PROOF – Finals, 5/7/2010, SPi

Calcium
Bilirubin(total,
conjugated)
Meanplatelet
volume
Triglycerides
Fibrino
gen
Globulins
Semen
exam
in-
ation
Radiography,
ultrasono
gra-
phy
3
Electroencephalo-
gram
3
Cho
lesterol
Red
celldis-
tribution
width
Bloodurea
nitrogen
C-reactive
protein
Interleukins
Creatinine
kinase
Triglycerides
Album
inBloodgases
Alkalinepho
s-
phatase
Electrolytes
Radiography,
ultrasono
gra-
phy
(Dop-
pler)3
Lactatedehy-
drogenase
%Lipid
in
blubber
Lactatedehy-
drogenase
Bile
acids
1Exclud
esleukocytes;
2ESRisno
tappropriateinlipaemicsamples;
3Other
investigativeprocedures.
Marine Mammal Ecology and Conservation / 07-Boyd-Ch07 page 151 7:54pm OUP CORRECTED PROOF – Finals, 5/7/2010, SPi
used for assessing health status. Some marine mammal species, such as bottlenosedolphins (Tursiops truncatus) and harbour seals (Phoca vitulina), are being extensivelystudied at widely geographically dispersed locations and this has led to a number ofpublications on reference ranges (e.g. Goldstein et al. 2006; Hall et al. 2007; Schwackeet al. 2009). However, once again, it is important that there is appropriate inter-laboratory calibration to eliminate the possibility of artefacts arising because ofvariations in analytical methods and standards. Many of the currently published‘reference ranges’ should also be viewed with caution; these are often from smallsamples and only report the mean and standard deviations for each parameter,rather than the 95% double-sided reference intervals with 90% confidence limits onthe lower and upper bounds as recommended by the International Federation ofClinical Chemistry, Expert Panel on the Theory of Reference Values (Solberg, 1983).
Other diagnostic indicators include: functional immune assays for examiningboth innate and adaptive immunity, physical examinations, and visual assessmentof the skin, looking specifically for infectious agents (arthropods, protozoa, fungi,bacteria, or viruses) as well as neoplastic and traumatic lesions.
Disease classification
Clinical diagnoses can be categorized using disease classification schemes. One suchscheme currently being implemented for marine mammals is an adapted version ofthe WHO International Statistical Classification of Diseases and Related HealthProblems with Clinical Modifications, 10th Revision (ICD10-CM, WHO 1992).The ICD system was designed for the classification of mortality and morbidityinformation for statistical purposes in humans. Each major disease entity is classi-fied in a hierarchical manner. For example, Chapter 1 of the scheme includes ‘certaininfectious and parasitic diseases’ (codes A00–B99): A00–A09 being the intestinalinfectious diseases; A07, protozoal; A07.1, giardiasis; and A07.2, cryptosporidiosis.Therefore retrieving data by code can easily identify, for example, all intestinalinfections or just protozoal infections, and cases coded in this way can be retrievedfor further statistical analysis. In addition, Chapter 18 of the scheme ‘Symptoms,signs and abnormal clinical and laboratory findings, not elsewhere classified’(R00–R99) gives the system sufficient flexibility for the purposes of classifying theresults from health assessment studies in marine mammals, using both live capture–release biochemical and health assessment data as well as post-mortem strandings’diagnoses. While it is often impossible to give a definitive cause of morbidity ordeath, general categories at the three-digit ICD code level can often be assigned (forexample, R74 is abnormal serum enzyme levels and R74.0 is non-specific elevationof levels of transaminase and lactic acid dehydrogenase).
7.2.3 Sample and data collection
The application of epidemiological study designs requires consistency in samplecollection, analysis, and reporting across populations or cohorts. The type of
Marine Mammal Ecology and Conservation / 07-Boyd-Ch07 page 152 7:54pm OUP CORRECTED PROOF – Finals, 5/7/2010, SPi
152 j Epidemiology, disease, and health assessment

epidemiological framework proposed here for marine mammals (Fig. 7.1) includesstandard sample collection and analysis protocols, as well as standard assessmentmethods. There are three primary methods of sample collection that can be appliedto marine mammal health studies, namely the recovery of stranded carcasses, fieldsurveys, and live capture–release.
Stranding recovery
Marine mammal carcasses that wash ashore have long been a principal source ofinformation about marine mammal pathology (Gulland 1999). In many regionsformal stranding response schemes are well established, and these involve theexamination of carcasses using standard procedures (Kuiken and Garcia Hartmann1991; Dierauf and Gulland 2001) that allow comparison among different events tobe made. Information can also be obtained about exposures to pathogens or toxinsby sampling specific tissues that cannot be easily acquired from live animals.Although the interpretation of such data needs to take account of the cause ofdeath, it may then be possible to, for example, estimate the total body burden ofcontaminants or toxins. Polybrominated diphenyl ethers can concentrate in theadrenal glands as well as the adipose tissue (Klasson Wehler et al. 2001), andinorganic compounds are found at higher concentrations in the liver and kidneyswhen compared to the blood or skin (Marcovecchio et al. 1990). This type ofinformation is clearly important when estimating exposure using just a single tissuesample for monitoring.
In addition to the important disease pathogenesis, pathology, histopathology,microbiology, and other disease process information that will be gleaned during anecropsy, it is very valuable to find out why the animal died and, if possible, todetermine both the primary and secondary causes of death. In reality however, thisis often difficult due to decomposition but it should be the ultimate goal when freshcarcasses are examined.
Live capture–release
Very few marine mammal studies are able to live-capture large numbers ofindividuals at any one time. However, with recent advances in techniques andan expansion of the skills base, many pinniped and some small odontocetecetaceans are now routinely and safely captured, assessed for their health status,and then released (Harwood et al. 1989; Wells et al. 2004). The impetus for thesestudies spans all scientific fields and, although some are carried out specifically todetermine the health or disease status of the population, a health assessmentcomponent could be carried out for many at a low additional cost. Particularlywhen combined with strandings and photographic or remote-sensing follow-upof the same population, these types of studies will allow inferences to be madeabout the health status of the population and its potential role in its populationdynamics.
Marine Mammal Ecology and Conservation / 07-Boyd-Ch07 page 153 7:54pm OUP CORRECTED PROOF – Finals, 5/7/2010, SPi
7.2 Effects, responses, and diagnostic techniques j 153

Gen
etic
An
alys
is1,
2,3
Bio
toxi
nA
nal
ysis
1,2
Pat
ho
log
y1,2
Co
nta
min
ant
An
alys
is1,
2,3
Imm
un
olo
gy2
Hem
ato
log
y/E
nzy
mo
log
y2S
ero
log
y2P
aras
ito
log
y1,2
En
do
crin
olo
gy2
Mic
rob
iolo
gy1,
2
Rep
rod
uct
ive
Bio
log
y1
To
oth
Lay
erA
nal
ysis
1,2
(1)
Str
and
ing
(m
ort
alit
y) In
vest
igat
ion
(2)
Liv
e-C
aptu
re R
elea
se(3
) F
ield
Su
rvey
/Rem
ote
Sam
plin
g
Ag
e
Sex
Pre
yP
refe
ren
ces
Ran
ge,
Mo
vem
ents
Sto
ck ID
,R
elat
edn
ess
Sto
ck
Str
uct
ure
,R
elat
edn
ess
Ass
essm
ent
En
dp
oin
ts
(Po
pu
lati
on
)
Ab
un
dan
ce
Epi
dem
iolo
gica
l Stu
dies
Ph
oto
An
alys
is3
Tra
ckin
g2
&3
Sta
nd
ard
L
abo
rato
ry
An
alys
es
Co
mm
on
S
amp
le
Co
llect
ion
P
roto
cols
Sta
nd
ard
A
sses
smen
t E
nd
po
ints
(I
nd
ivid
ual
)
Rad
io/
Sat
ellit
eT
ag2
Gas
tric
Flu
id2
Les
ion
Bio
psy
1,2
Uri
ne2
Sto
mac
h
Co
nte
nts
1M
orp
ho
met
rics
1,2
Blo
od
2P
hys
ical
E
xam
/U
ltra
sou
nd
2
Fae
ces2
Ph
oto
ID1,
2,3
Ski
n/
Blu
bb
er1,
2,3
Org
ans,
Tis
sues
1T
oo
th1,
2B
low
ho
leS
wab
1,2
Bio
log
ical
To
xin
Exp
osu
re
Pat
ho
gen
sC
hem
ical
To
xin
Exp
osu
re
Nu
trit
ion
al
Sta
tus
Res
pir
ato
ryS
tatu
sIn
fect
iou
sD
isea
se
Rep
rodu
ctiv
eS
tatu
sE
nd
ocr
ine
Sta
tus
Neu
rolo
gic
alS
tatu
sR
enal
Sta
tus
Hep
atic
Sta
tus
Neo
pla
sia
Imm
un
eS
tatu
s
Po
pu
lati
on
Exp
osu
res
En
viro
nm
enta
l/Hab
itat
V
aria
ble
s(e
.g. H
2O te
mp,
pol
luta
nts,
prey
, hum
an in
tera
ctio
n)S
urv
ivo
rsh
ip
Dis
ease
Pre
vale
nce
Fec
un
dit
y
Tra
nsi
ent/
Inte
rmit
ten
tV
aria
ble
s(e
.g. o
cean
noi
se)
Fig.7.1
Schematicofepidem
iologicalframew
orkformarinemam
malstud
ies.Typ
esofsam
plesareshownwithsuperscriptsindicatingifthey
are
generally
collected
through:
(1)strand
ing(m
ortality)
investigation;
(2)livecapture–release;and(3)field
surveysandremote
dartsampling.
Light-grey
assessmentendpointboxesindicatean
exposure
endpoint,darkergrey
indicatean
effectendpoint.Dashedboxesrepresent
important
covariates
foranalyses.
Marine Mammal Ecology and Conservation / 07-Boyd-Ch07 page 154 7:54pm OUP CORRECTED PROOF – Finals, 5/7/2010, SPi

Field survey
Visual observation, including photo-identification (see Chapter 2), has been used toa limited extent as a tool to investigate changes in endemic disease in cetaceans(B. Wilson et al. 2000; Pettis et al. 2004; Hamilton and Marx 2005). Many suchphoto-identification monitoring studies are conducted in conjunction with biopsydarting to collect skin and blubber samples (R. S. Wells and Scott 1990). DNAfrom skin samples can provide other fundamental covariate data such as sex orstock identification. In addition, the relationships between sampled animals andgene expression for particular proteins could be used in future functional genomicsapplications (see Section 7.2.4). Certain contaminants (e.g. persistent organochlor-ines, mercury) and other exposure biomarkers (such as the enzymes important inthe breakdown of the contaminants, the cytochrome P450s) can also be measuredfrom biopsy samples (Fossi et al. 1997). However, care must be taken wheninterpreting contaminant measurements in blubber samples if only the superficialblubber layers are sampled.
For some species, additional types of sample collection are also available tocomplement monitoring studies. For example, a visual health assessment modelhas been proposed for use in the endangered North Atlantic right whale (Eubalaenaglacialis) (Pettis et al. 2004), with additional efforts being directed towards acquiringbaseline health information from faecal samples. Faeces can provide supplemen-tary exposure information, such as the prevalence of specific parasites (Hughes-Hanks et al. 2005) as well as reproductive status from hormone metabolites(Rolland et al. 2005).
7.2.4 Disease diagnosis
Diagnosing disease in marine mammals and necropsy sampling can be highlysophisticated. It is beyond the scope of this chapter to give details, but thesesubjects are meticulously covered in the books Marine Mammal Medicine (Dieraufand Gulland 2001) and Marine Mammals Ashore (Geraci and Lounsbury 2005).
Genomics
Rapid advances in genomics have created new opportunities for understanding therole of gene function in the health of marine mammals and in the diagnosis ofdisease. As emerging and resurging diseases become more of an issue for marinemammal conservation and disease outbreaks of unknown aetiology more common(Gulland and Hall 2007), molecular methods are likely to prove to be particularlyimportant.
The increasing number of genome assemblies currently available may make itpossible to interpolate gene function in species that are, as yet, relatively poorlystudied. Functionally homologous genes in other species that are activated inresponse to infection or toxin exposure may be useful for studying marine mammalhealth. Although no complete marine mammal genome has been described, a low
Marine Mammal Ecology and Conservation / 07-Boyd-Ch07 page 155 7:54pm OUP CORRECTED PROOF – Finals, 5/7/2010, SPi
7.2 Effects, responses, and diagnostic techniques j 155

coverage (�2) assembly of the bottlenose dolphin genome is available as part of theBroad Institute’s Mammalian Genome Project (http://www.broad.mit.edu/mam-mals/). While many of the genomic tools that exist for model organisms are alsonot yet available for use in marine mammal species, some of the powerful, now-routine methods for screening tissues for differential transcript expression duringdisease states have enormous potential to identify differences in gene regulation.Some of these may already be applicable to marine mammals. However, knowingabout gene expression does not necessarily lead to a functional understanding.Microarrays are enormously powerful tools that enable the activity of a vastnumber of genes to be determined in a target sample. DNAmicroarrays containingthousands of gene probes can be simultaneously exposed to a target sample. Theprobes, selected from cDNA fragments, are spotted onto a solid support and theexpression of the corresponding messenger RNA molecules in the target sampledetermined. However, interpretation of this vast amount of information requirescareful management and the availability of reference databases to allow properanalysis. Bioinformatic techniques have been developing simultaneously, but care-ful study design and statistical modelling is needed to ensure meaningful results(Kerr and Churchill 2001; Churchill 2002). The one array from a marine mammal,again the bottlenose dolphin, has been produced from lipopolysaccharide (LPS)and human interleukin-2 (IL2) stimulated peripheral blood leucocytes (Mancia et al.2007). Such an array is especially useful for detecting leucocyte stimulation andspecific gene upregulation. However, genes that have been downregulated in theexperimental sample or genes that have been upregulated through other factorsmay not be represented on such an array. Dogs are the closest relatives to thepinnipeds for which an array is available. If used for marine mammals, controllingfor cross-species hybridization would be critical but manageable with thoroughanalysis and follow-up experimentation to validate the results. However, as moremicroarrays from different marine mammal species become accessible this will bean extraordinarily powerful tool.
Whatever the final samples and procedures used it is essential that the collection,methods, and data reporting should be standardized. For microarrays in particular,guidelines have been established by the International Microarray Gene ExpressionData (MGED) group (http://www.mged.org/Workgroups/MIAME/).
One related field that will considerably advance our understanding and iden-tification of marine mammal disease processes is known broadly as pathoge-nomics (Pompe et al. 2005). This is the examination of both the pathogen and thehost and how they interact with each other. The study of pathogens in humansand domestic animals is undergoing major changes, largely due to the availabilityof whole genome sequences, new screening technologies, proteomics, compara-tive genomics, and bioinformatic methods for both the host and pathogen(Lederberg 2000). Molecular fingerprinting, single-nucleotide polymorphism ana-lyses, and molecular epidemiology all allow the study of the molecular processes
Marine Mammal Ecology and Conservation / 07-Boyd-Ch07 page 156 7:54pm OUP CORRECTED PROOF – Finals, 5/7/2010, SPi
156 j Epidemiology, disease, and health assessment

during infection in humans, and these methods could also be applied to the studyof disease processes in marine mammals, particularly during rehabilitation orin vitro. Genetic approaches can also be used to identify novel diseases incombination with pathology and histology. Isolation and characterization of anovel papillomavirus from a bottlenose dolphin has used a pathogenomic ap-proach (Rehtanz et al. 2006). This illustrates the power of isolating genetic materialfrom a particular pathogen and using this to achieve a thorough understanding ofa new pathogen.
These technological advances and their application in marine mammal micro-biology will improve our understanding of host–microbe interactions and immuneresponses. Web-based resources such as the Virulence Factor Database (VFDB,Yang et al. 2008) and the Pathogen–Host Interaction Data Integration and AnalysisSystem (PHIDIAS; Zuoshuang Xiang et al. 2007), coupled with the fact thatcomplete genomic sequences of all the major pathogens from humans, plants,and animals are now available (Pallen and Wren 2007), will increase the potentialfor comparative genomics in marine mammals—including the determinants ofvirulence and other hidden aspects of disease pathogenesis.
Toxicogenomics
Toxicogenomics involves investigating the influence of a chemical compound ongenes and their expression. Genomics has revealed that very few single inheritedhuman alleles are directly associated with a specific disease risk. Over 95% ofdiseases are caused by a repertoire of genes that modify each other and areinfluenced by some kind of environmental exposure. This is a particularly pertinentarea of investigation for marine mammals due to their well-documented exposureto environmental contaminants and the detrimental effects of such contaminantson their health (O’Shea 1999). There is considerable crossover in methodology anddata from pathogenomics, but disease causation cannot be fully understood untilthe contribution of both genetics and the environment are considered.
These studies rely on a detailed understanding of the environment that the studyspecies lives in and how and when it has been exposed to particular toxins. To someextent this can be accomplished by measuring exposure in the individuals them-selves (e.g. lipid-soluble contaminants from blubber biopsy samples), but for a riskassessment approach this will often need to be combined with additional exposureinformation such as prey type, quality, and quantity. The ultimate aim of suchresearch is to discover susceptibility genes and alleles to particular toxins. This willallow the testing of individuals or population screening for additional susceptibilityfrom chemical exposure.
Web-based public databases are also available for data mining and submissionsuch as the Comparative Toxicogenomics Database (http://ctd.mdibl.org/). This isa searchable multispecies database collating toxicogenomic data to discover rela-tionship between chemicals, diseases, and genes.
Marine Mammal Ecology and Conservation / 07-Boyd-Ch07 page 157 7:54pm OUP CORRECTED PROOF – Finals, 5/7/2010, SPi
7.2 Effects, responses, and diagnostic techniques j 157
7.3 Epidemiological study designs
The design of epidemiological studies from which robust effect measures (seeSection 7.2) can be estimated is essential for determining causal links betweenexposures and responses. Examples of the types of study and the issues involved ineach are given in Table 7.2. These approaches have been developed in the fields ofhuman and veterinary epidemiology to test causal hypotheses (including the effectof environmental and nutritional exposures which are highly comparable to theexposure routes for marine species). Despite the extensive application of thesemethods in other fields and knowledge of the specific definitions of the variousepidemiological terms, they have not received the kind of attention they deserve inmarine mammal disease research. Many of the limitations often argued for estab-lishing causality in marine mammal health are also problematic in human epidemi-ology. For example, as with humans, marine mammal health studies usually have touse exposure-response data from surrogate species.
The primary objectives of an epidemiological study are to: (i) investigate thetemporal and spatial distribution of disease within the different groups, and (ii)demonstrate a causal link between one or more specific factors and the frequency ofoccurrence of disease. The first objective is met through the application of descrip-tive studies such as those involving correlation and cross-sectional studies (see Table7.2). Studies involving correlation are aimed at identifying groups that do, or do not,develop a disease, which in turn provide clues that can lead to the formulation ofcausal hypotheses through the identification of differences in exposures.
In a few cases, correlation study designs have already been used to investigateassociations between environmental variables and marine mammal disease. Forexample, B. Wilson et al. (1999b) conducted a correlation analysis to identify factorsassociated with the occurrence of epidermal disease in bottlenose dolphins. Theycompared the prevalence of skin disease among dolphin populations in diversegeographical areas and then attempted to correlate the disease prevalence withanthropogenic factors such as organochlorine and trace-metal contaminant expos-ure, as well as environmental factors such as water temperature, salinity, and UVradiation. Their analysis indicated that lesion prevalence and severity were moststrongly correlated with water temperature and salinity, and were not significantlycorrelated with the contaminants included in the analysis.
More intensive capture–release efforts can also support such correlationalanalyses, but these can also be used to conduct cross-sectional studies in whichexposure and health effects are assessed simultaneously in the same individuals.While these studies still suffer from an inability to distinguish whether the exposureprecedes or results from the observed disease, they enable correlation betweenexposure and effect on an individual level, and as ‘snap-shots’ they provideinformation on the prevalence of disease and the overall health of the populationfor further hypothesis generation.
Marine Mammal Ecology and Conservation / 07-Boyd-Ch07 page 158 7:54pm OUP CORRECTED PROOF – Finals, 5/7/2010, SPi
158 j Epidemiology, disease, and health assessment

Classical cohort or longitudinal studies remain among the basic analytical studydesigns for human and veterinary epidemiologists. Here, the investigator defines twoor more cohorts (populations or groups within a single population) that are free ofdisease but that differ according to their exposure to the potential cause of a disease(Rothman and Greenland 2005). Usually one cohort is defined as the reference orunexposed, while one or more additional cohorts are exposed (see Section 7.2). Thesemay represent a gradation of exposure as might be possible in, for example, the study
Table 7.2 Epidemiological study designs.
Description Issues/disadvantages
Descriptive design Describes general characteristics of
disease distribution; useful for
generating hypotheses
Cannot prove causality
Case series Detailed report on condition of
single individual; can suggest the
emergence of new diseases
No controls, so cannot assess
differences in exposure between
diseased and non-diseased
individuals
Correlational Compares exposure and effect (e.g.
disease frequency) on a population
basis; measures of exposure and
effect are not necessarily on the
same individuals within a population
Does not link exposure to effect
within the same individual;
‘ecologic-fallacy’, i.e. correlations
at the population level may not
hold at the individual level
Cross-sectional Exposure and effect (e.g. presence of
disease) is assessed within the same
individuals at the same point of time
Generally cannot determine if
exposure preceded or resulted
from the observed effect
Analytical design Explicit comparison of exposure and
disease status; can be used to test
epidemiologic hypotheses
Generally requires more effort and
often long follow-up periods
Case-control A group of individuals with disease
and a group of individuals without
disease are chosen and their
exposures are compared
retrospectively
Longitudinal A cohort of individuals is chosen
based on the absence/presence of
exposure and then followed for a
period of time to assess the outcome
(e.g. development of disease) of
interest; may also be conducted
retrospectively
Often requires long periods of
follow-up
Marine Mammal Ecology and Conservation / 07-Boyd-Ch07 page 159 7:54pm OUP CORRECTED PROOF – Finals, 5/7/2010, SPi
7.3 Epidemiological study designs j 159

of the impact of contaminants on animals inhabiting a pollution gradient (Reijnderset al. 1999) or the extremes of exposure. Following individuals is often difficult forfree-ranging marine mammals and it is often impossible to diagnose disease at thetime it occurred. However, for some species it is feasible to estimate the likelihood thatdeath or overt disease has occurred within the follow-up period. For example, weeklyor monthly photo-identification follow-up of live-capture released individual bottle-nose dolphins in a well-characterized population, such as the Sarasota Bay, Floridapopulation (Wells and Scott, 1990), would enable the timing ofmortality or emigrationor skin lesion development to be estimated. Thus, by following the fate of known,marked individuals, it is quite feasible to estimate the relationship between diseaseoccurrence or vital rates and exposure status. Such mark–recapture studies can beused to estimate the effect of individual or group covariates on survival probabilities(Hall et al. 2001), and simple modifications to these designs can be envisaged thatwould allow the assessment of disease occurrence instead of mortality using the sameframework.
A recent study by Hall et al. (2006b) also demonstrated the applicability of case-control studies (in which animals are defined as cases and controls and are thenstratified by their exposure status as exposed or unexposed, see Table 7.2) ofmarine mammal strandings data, allowing estimates of relative risks using oddsratios (see Section 7.2.1) to be determined. As with case-control studies in humanmedicine, careful control selection and accurate retrospective exposure assessmentare required to avoid bias. However, with a sufficiently large sample size it is quitefeasible that case-control studies would be equally applicable to other marinemammal strandings datasets.
7.4 Risk assessment
Once a relationship between an exposure and response has been established, thenext stage is to answer the ‘so what’ question—in other words, what is thebiological significance? How important is the relationship for the population?The key questions are how to set acceptable risks and understand how risks changeunder different management approaches. What is ‘acceptable’ is clearly outside thescope of this chapter and remains an issue that must be directly gauged for eachsituation and species within its context. For example, what is acceptable for a large,exponentially increasing population may be unacceptable for a small, fragmentedpopulation or an endangered species.
Risk assessment, as defined by the US Environmental Protection Agency(EPA) and widely adopted across many different organizations and in variousforms, is ‘the process in which information is analyzed to determine if anenvironmental hazard might cause harm to exposed persons and ecosystems’.And since the early 1990s this process has been formalized into a risk assessmentparadigm (Fig. 7.2), largely developed within the EPA and the National Research
Marine Mammal Ecology and Conservation / 07-Boyd-Ch07 page 160 7:54pm OUP CORRECTED PROOF – Finals, 5/7/2010, SPi
160 j Epidemiology, disease, and health assessment

Council but then taken up by many different groups across a very wide range ofapplications.
The first step in any risk assessment is the hazard identification (or problemformulation) stage. This includes the development of a conceptual model that setsout the impetus for the risk assessment and the description of the problem,including the interactions of a particular pathogen or toxin (exposure), within adefined population and a defined exposure scenario. The conceptual model thushelps to focus the risk assessment, outline its goals, breadth, and often the policycontext in which it is being conducted. The hazard identification process may betriggered by differing types of observations or events, such as: the occurrence ofone (or many) unusual mortality events (Gulland and Hall 2007); information fromdedicated pathogen surveys, such as those carried out by Gaydos et al. (2004) forsouthern resident killer whales (Orcinus orca); information on a chemical spill orpollutant concentrations measured in sediments or biota (Pulster et al. 2005); or theobservation of a harmful algal bloom from remote sensors (Flewelling et al. 2005).
The characterization of exposures and responses make up the analysis phase ofthe disease risk assessment process, for which various factors need to be consid-ered. These include information on the temporal and spatial distribution ofexposure as well as data for disease risk assessment (see Fig. 7.2) about the survival,persistence, and amplification of the agent and its concentration in the environ-mental media or prey. In addition, the routes of exposure and the size, demo-graphics, and behaviour of the exposed population must be considered. Thesecomponents are brought together in an exposure profile, which ideally provides aquantitative evaluation of the magnitude, frequency, and patterns of exposure to atoxin or disease agent for the scenario developed during the problem formulationstage. It should also include an indication of the underlying assumptions that havebeen made (based on scientific judgement) and a quantification of the uncertaintiesassociated with each element (i.e. the errors around each factor). Exposure profilescould also be estimated from modelling the movements of animals in relation topoint sources of exposure. For example, Littnan et al. (2006) evaluated the distri-bution and movements of Hawaiian monk seals (Monachus schauinslandi) in relationto coastal waters and sources of land-based, water run-off and sewage dispersal assources of pathogens.
The second arm of the exposure–response characterization stage (see Fig. 7.2)requires information about toxicity and about the host to enable a disease riskassessment, as this will determine the impact of the agent or organism on theindividual and ultimately the population (for example the age structure, immuneand nutritional status of the population, its social or behavioural traits, and itsforaging behaviour).
While correlational and cross-sectional studies being carried out on marinemammals are helping to identify hazards and provide information on mechanismsof effect, analytical study designs are helping to define quantitative relationships
Marine Mammal Ecology and Conservation / 07-Boyd-Ch07 page 161 7:54pm OUP CORRECTED PROOF – Finals, 5/7/2010, SPi
7.4 Risk assessment j 161

Haz
ard
Iden
tific
atio
n
Exp
osur
e as
sess
men
tE
xpos
ure-
resp
onse
as
sess
men
t
Ris
k C
hara
cter
isat
ion
Ris
k M
anag
emen
tA
gent
Occ
urre
nce
Cha
ract
eris
atio
n of
Exp
osur
eC
hara
cter
isat
ion
of H
ealth
E
ffect
s
Age
nt C
hara
cter
isat
ion
Hos
tC
hara
cter
isat
ion
Exp
osur
eA
naly
sis
Dos
eR
espo
nse
Ana
lysi
s
Hea
lthE
ffect
s
Exp
osur
eP
rofil
e
Hos
t-A
gent
Pro
file
Ana
lysi
s ph
ase
of d
isea
se r
isk
asse
ssm
ent
Fig.7.2
Schematicdiagram
ofstages
inahealth
anddisease
risk-assessm
entprocedure.
Marine Mammal Ecology and Conservation / 07-Boyd-Ch07 page 162 7:54pm OUP CORRECTED PROOF – Finals, 5/7/2010, SPi

between exposure and various ‘endpoints’ (i.e. fecundity and survival) relevant tomanagement, and are therefore supporting exposure–response characterization.
Dose–response relationships, as determined from laboratory studies of experi-mental species and widely applied for human health risk assessment, can alsocontribute. For example, Schwacke et al. (2002) took a novel approach to integratemeasured tissue concentrations of polychlorinated biphenyls (PCBs) from bottle-nose dolphins with a surrogate dose–response relationship (from laboratory studiesin mink) to predict the health risks and associated uncertainties for dolphin popu-lations. The results indicated a high likelihood that reproduction, primarily inprimiparous females, was being severely impaired by chronic exposure to PCBs.Excess risk of reproductive failure, measured in terms of stillbirth or neonatalmortality, for primiparous females was estimated to be between 60 and 80%,whereas females of higher parity, which had previously off-loaded a large proportionof their PCB burden, had a much lower risk. These types of risk measures thenbecome very tangible parameters that can be readily used by conservationists andmanagers. In another study, longitudinal data on maternal PCB tissue burdens andreproductive outcomes from the long-term Sarasota Bay dolphin study (Wells et al.2005) were combined with similar data from a captive dolphin cohort (Reddy et al.2001) to estimate a dose–response function linking maternal PCB burden with calfsurvival (Hall et al. 2006a). The number of individuals included for this analysis waslimited and much more data are needed to increase the confidence in the dose–response model predictions in this study. But, with continued follow-up of individ-ual dolphins as well as longitudinal study of additional populations with potentiallyhigher PCB exposures, the necessary data are gradually becoming available.
These examples highlight one of the most difficult aspects of exposure–re-sponse assessment in marine mammal disease risk assessment. Statistical modelsare needed to quantify exposure–response relationships (ideally in the species ofinterest; but if this is not ethically or logistically possible, in surrogate laboratorymodel species, a situation that is the same for human risk assessments). These dataare often unavailable, as many dosing studies in laboratory species do not report thefinal tissue concentrations that are needed for comparison with tissue concentra-tion information collected from marine mammals. If the agent of interest is apathogen or algal toxin, then data also required are the route of exposure, thesource, and preparation of any challenge material used, as well as the organism,duration, and multiplicity of exposure.
The final phase of the risk assessment procedure then ties all the previous stepstogether to define population level impacts that are important for management(Fig. 7.2). The assessment then starts with a risk description of event or events,followed by a risk characterization that must include the risk magnitude andprobability of potential impacts. Most importantly, the uncertainty in the risk ischaracterized and the confidence limits around the various estimates are reported.Sensitivity analyses can also be carried out to evaluate the most important variables
Marine Mammal Ecology and Conservation / 07-Boyd-Ch07 page 163 7:54pm OUP CORRECTED PROOF – Finals, 5/7/2010, SPi
7.4 Risk assessment j 163

and determine the information needs and control measures. Their effect on riskmagnitude and profile can then be determined. Finally, decision analyses evaluatealternative risk management strategies.
In all likelihood, the health of marine mammal populations is currently beingaffected by an aggregation of stressors. Identification of the most critical factorsand their interactions will require relatively complex analytical approaches. A recentpaper by Plowright et al. (2008) also highlights this issue. In a comprehensivediscussion of the relationship between ecology and epidemiology they explore howcausal inference may be approached by bringing together the tools and techniquesthat have evolved in each of these separate scientific fields. The efforts to acquirethe necessary data to implement such approaches are worthwhile because theypromise an opportunity for us to really understand the impacts of anthropogenicactions, both positive and negative, on marine mammal populations. Much asepidemiological studies currently guide the identification of hazards, recommenda-tions for exposure limits, implementation of preventive measures, and allocation ofresources for disease responses in human populations, they can ultimately do thesame for marine mammals.
Marine Mammal Ecology and Conservation / 07-Boyd-Ch07 page 164 7:54pm OUP CORRECTED PROOF – Finals, 5/7/2010, SPi
164 j Epidemiology, disease, and health assessment