Embed Size (px)
Citation preview

COMMUNITY EPIDEMIOLOGY WORK GROUPNATIONAL INSTITUTE ON DRUG ABUSE
EPIDEMIOLOGIC TRENDSIN DRUG ABUSE
Volume 1:Proceedings of the Community EpidemiologyWork Group
Highlights and Executive SummaryRevised
December 2001

ii
The National Institute on Drug Abuse (NIDA) acknowledges the contributions made bythe members of the Community Epidemiology Work Group (CEWG) who havevoluntarily invested their time and resources in preparing the reports presented at themeetings.
This publication, Volume I, is based primarily on papers presented and data reported byCEWG representatives from 21 areas at the December 2001 CEWG meeting. The fulledited text from those reports appears in Volume II. Volume II also contains the fulledited text of special reports.
All material in this volume is in the public domain any may be reproduced or copiedwithout permission from the Institute or the authors. Citation of the source does notendorse or favor any specific commercial product. Trade or proprietary names appearingin this publication are used only because they are considered essential in the context ofthe studies reported herein.
National Institute on Drug AbuseNIH Publication No. 02-5109
Printed May 2002
For more information about the Community Epidemiology Work Groupand for some past publications, visit the home page through the NIDAWeb site:
http://www.nida.nih.gov
Volume II of this issue is available in limited supply. To order, contactthe National Clearinghouse for Alcohol and Drug Information (NCADI).
Mail: P.O. Box 2345, Rockville, MD 20852-2345Phone: 301-468-2600
800-729-6686Fax: 301-468-6433Online: http://wwwphealth.org
If you make your request by mail, please be sure to send it by airmail ifyou reside outside of the Washington, D.C. metropolitan area to expeditedelivery of the publication.

iii
FOREWORD
The Community Epidemiology Work Group (CEWG) is a drug abuse surveillance networkestablished in 1976 by the National Institute on Drug Abuse (NIDA), National Institutes ofHealth (NIH). It is composed of researchers from 21 sentinel areas of the United States who meetsemiannually to present and discuss quantitative and qualitative data related to drug abuse.Through this program, the CEWG provides current descriptive and analytical informationregarding the nature and patterns of drug abuse, emerging trends, characteristics of vulnerablepopulations, and social and health consequences.
The 51st meeting of the CEWG, held in San Diego, California, on December 11–14, 2001,provided a forum for presentation and discussion of drug abuse data in the United States,Canada, and Mexico. The venue in San Diego afforded the opportunity for presentation anddiscussion of drug abuse-related issues of special concern to the local community. Theseincluded presentations on three local efforts to combat and treat substance abuse; a paneldiscussion by methamphetamine abusers on the problems associated with abuse of this drug; aneffort to reduce teen drinking on both sides of the border (San Diego and Tijuana); and theimpact of California’s Substance Abuse and Crime Prevention Act (Proposition 36) on thetreatment system. An official of the Drug Enforcement Administration described data sourcesused by the agency to track seizures of 3,4-methylenedioxymethamphetamine (MDMA) anddetermine the quality of drugs and an official of the Substance Abuse and Mental HealthServices Administration conducted a workshop on the Drug Abuse Warning Network’sEmergency Department data collection methods, reporting procedures, and the new type ofinformation that will be available in the near future.
Presentations at the meeting focused on unique and local aspects of drug abuse and social healthconsequences that have confronted and continue to concern the city of San Diego. They alsoserved to capture the diversity and community-based nature of drug abuse, its emergence in thecommunity, and its resolution by the community. They underscored, once again, the necessity ofestablishing effective networks of drug abuse surveillance at the local level in communitiesthroughout the world.
Nicholas J. KozelDivision of Epidemiology, Services and Prevention Research


v
CONTENTS
FOREWORD iii
LIST OF PAPERS IN VOLUME II viii
INTRODUCTION 1
CEWG REPORTS—UNITED STATES 5
KEY FINDINGS 5
COCAINE/CRACK 8
Overview 8
DAWN ED Data on Cocaine/Crack 9
Treatment Data on Cocaine/Crack Admissions 12
ADAM Data on Cocaine/Crack 14
Powder Cocaine Availability, Price, and Purity 16
Crack Cocaine Availability, Price, and Purity 17
HEROIN 18
Overview 18
DAWN ED Data on Heroin/Morphine 19
Treatment Data on Primary Heroin Admissions 21
ADAM Data on Opiates 22
Heroin Availability, Price, and Purity 23
OTHER OPIATES 27
Overview 27
Hydrocodone and Oxycodone 28
Codeine 31
MARIJUANA 32
Overview 32
DAWN ED Data on Marijuana 32
Treatment Data on Marijuana Admissions 34
ADAM Data on Marijuana 35
Marijuana Availability, Price, and Purity 36

vi
METHAMPHETAMINE/SPEED 39
Overview 39
DAWN ED Data of Methamphetamine 41
Treatment Data on Methamphetamine Admissions 42
ADAM Data on Methamphetamine 43
Methamphetamine Availability, Price, and Purity 44
3,4-METHYLENEDIOXYMETHAMPHETAMINE (MDMA) 46
Overview 46
DAWN ED Data on MDMA 48
Mortality and MDMA 49
Treatment Data on MDMA Admissions 50
Physical Consequences of MDMA/Ecstasy Use 50
MDMA/Ecstasy and Multiple Drug Use 51
Manufacture and Trafficking of MDMA 52
Seizures of MDMA 52
Availability, Price, and Purity of MDMA 54
GAMMA HYDROXYBUTYRATE (GHB) 56
Overview 56
DAWN ED Data on GHB 59
Treatment Data on GHB Admissions 60
Availability, Price, and Purity of GHB 60
PHENCYCLIDINE (PCP) 61
Overview 61
DAWN ED Data on PCP/PCP Combinations 61
Mortality and PCP 61
Treatment Data on PCP Admissions 62
ADAM and Other Arrestee Data on PCP 62

vii
Patterns of PCP Use and Manufacturing 63
Seizure Data on PCP 63
Price Data on PCP 63
LYSERGIC ACID DIETHYLAMIDE (LSD) 64
Overview 64
DAWN ED Data on LSD 65
Treatment Data on LSD Admissions 65
Availability, Price, and Purity of LSD 66
DEXTROMETHORPHAN (DXM) 67
INFECTIOUS DISEASES RELATED TO DRUG USE 68
HIV and AIDS 68
Hepatitis B and C 69
APPENDICES
APPENDIX A. The Drug Abuse Warning Network (DAWN) Emergency DepartmentData
APPENDIX B. The Arrestee Drug Abuse Monitoring (ADAM) ProgramAPPENDIX C. The Domestic Monitor Program (DMP)APPENDIX D. Total Admissions by Primary Substance of Abuse and CEWG Area: 2000
NIDA publications including Volume I ofthe CEWG proceedings are available onlineat:
http://www.NIDA.NIH.gov.
Volume II of the proceedings is available inlimited supply. Email requests should besent to: [email protected]
All material in this report is in the publicdomain and may be reproduced or copiedwithout permission from the Institute. The U.S.Government does not endorse or favor anyspecific commercial product. Trade orproprietary names appearing in this publicationare used only because they are consideredessential in the context of the studies reportedhere.

viii
LIST OF PAPERS IN VOLUME II
ATLANTA Metropolitan Atlanta Drug Use TrendsKatherine P. Theall, Claire E. Sterk, and Tara McDonald
BALTIMORE Drug Use in the Baltimore Metropolitan Area: Epidemiology andTrends, 1996–2000Leigh A. Henderson
BOSTON Drug Use Trends in Greater Boston and MassachusettsThomas W. Clark and Elsa A. Elliot
CHICAGO Patterns and Trends of Drug Abuse in ChicagoLawrence Ouellet, Kujtim Sadiku, Susan Bailey, and Wayne Wiebel
DENVER Patterns and Trends in Drug Abuse: Denver and ColoradoBruce Mendelson
DETROIT Drug Abuse Trends in Detroit/Wayne County and MichiganRichard F. Calkins
HONOLULU Illicit Drug Use in Honolulu and the State of HawaiiD. William Wood
LOS ANGELES Patterns and Trends in Drug Abuse: Los Angeles County,CaliforniaBeth Finnerty and T. Kiku Annon
MIAMI Drug Abuse in Miami and South FloridaJoe Spillane, Madeline Camejo, and James N. Hall
MINNEAPOLIS Drug Abuse Trends in Minneapolis/St. Paul, MinnesotaCarol Falkowski
NEWARK Patterns of Drug Abuse in NewarkAbate Mammo
NEW ORLEANS Drug Abuse Indicators in New OrleansGail Thornton-Collins
NEW YORK CITY Drug Use Trends in New York CityRozanne Marel, John Galea, Kenneth A. Robertson,and Robinson B. Smith

ix
PHILADELPHIA Drug Use in Philadelphia, PennsylvaniaSamuel J. Cutler, Mark R. Bencivengo, John H. Gossard,and Richard C. Jones
PHOENIX Drug Abuse Trends in Phoenix and ArizonaIlene L. Dode
ST. LOUIS Patterns and Trends in Drug Abuse: St. LouisHeidi Israel Adams and Jim Topolski
SAN DIEGO Indicators of Drug Abuse in San Diego CountyMichael Ann Haight
SAN FRANCISCO Patterns and Trends of Drug Use in the San Francisco Bay AreaJohn A. Newmeyer
SEATTLE Recent Drug Abuse Trends in the Seattle-King County AreaEllen Silverman, Arnold F. Wrede, Caleb Banta-Green,T. Ron Jackson, Kris Nyrop, Steve Freng, Susan Kingston,Michael Hanrahan, Hanne Thiede, Jon NakagawaraRichard Harruff, Nikki Fillipi, Mark McBride, and Ann Forbes
TEXAS Substance Abuse Trends in Texas—December 2001Jane Carlisle Maxwell
WASHINGTON, D.C. Patterns and Trends of Drug Abuse in Washington, D.C.:December 2001Alfred Pach, Jerry Brown, and Marianna Toce
Special Papers
CANADA Highlights from the 2001 Ontario Student Drug Use SurveyEdward M. Adlaf
Drug Use in Edmonton (2000): A CCENDU Fact SheetCameron Wild
MEXICO Update of The Epidemologic Surveillance System of Addictions(SISVEA) Mexico: January–June, 2001Roberto Tapia-Conyer, Patricia Cravioto, Pablo Kuri, FernandoGalvan, and Blanca de la Rosa


1
INTRODUCTION
The 51st meeting of the Community Epidemiology Work Group (CEWG) held in San Diego,California, on December 11–14, 2001. During this meeting, 21 CEWG representatives reportedon current drug trends and patterns in their areas. The key findings and executive summary thatfollow are based on these reports.
Data Sources
To assess drug abuse patterns and trends, city-and State-specific data are gathered and compiledfrom a variety of drug abuse indicator sources. Sources include public health agencies, medicaland treatment facilities, criminal justice and correctional offices, law enforcement agencies,surveys, and other sources unique to local areas, including those described below.
Drug-related emergency department (ED) mentions, as reported by local EDs and poisoncontrol centers, and by the Drug Abuse Warning Network (DAWN), Office of Applied Studies,Substance Abuse and Mental Health Services Administration (SAMHSA). DAWN datarepresent estimated numbers of mentions and rates per 100,00 population. DAWN data areobtained from sampled hospitals in 21 metropolitan areas; 20 are CEWG areas. DAWN collectsinformation on “episodes” and “mentions” of illegal drugs or nonmedical use of legal drugsamong persons seen in sampled EDs. (The number of episodes is not equivalent to the number ofpatients, because one person may make repeated visits to the ED. In each episode, a person maymention more than one drug, and each drug is counted in a discrete drug category). Moredetailed information on the DAWN data is presented in Appendix A.
Drug-related deaths, as reported on death certificates by medical examiner (ME)/local coroneroffices, by State public health agencies, or by SAMHSA in the DAWN medical examiner data.DAWN ME does not report all drug overdose deaths in an area because information is collectedfrom only a selected group of medical examiners in an area. An episode report, includingdemographic information and circumstances of death for each decedent is included in the report.While drug abuse deaths frequently involve overdoses, they also include deaths in which druguse was a contributing factor.
Primary substance of abuse of clients at admission to treatment programs is derived from localtreatment agencies or State substance abuse agencies, most of which report data to the TreatmentEpisode Data Set (TEDS).
Arrestee urinalysis results are based primarily on data collected by the Arrestee Drug AbuseMonitoring (ADAM) program of the National Institute of Justice (NIJ). (Additional informationon ADAM is provided in Appendix B.)
Seizure, price, purity, prescription/distribution, and arrest data are obtained from the DrugEnforcement Administration (DEA) and from State and local law enforcement agencies.Included in some reports are data from DEA’s Domestic Monitor Program (DMP) on drugsources, types, cost, and purity of retail-level heroin, based on undercover heroin purchases by

2
DEA in selected cities (see Appendix C for additional details on the Domestic MonitorProgram).
Other sources of quantitative drug abuse indicator data include surveys (e.g., of the generaland school populations), helplines, and poison control centers.
Quantitative data are enhanced with information obtained through qualitative research—fieldreports, focus groups, key informant interviews, and other methods. Qualitative data areinterspersed throughout this document.
A Note to the Reader
The information in this report is typically organized by specific drug of abuse. Note, however,that multiple-drug abuse is a common pattern among a broad range of substance abusers.Furthermore, most indicators do not differentiate between powder cocaine and crack. Finally,local comparisons are limited, especially for the indicators listed below.
DAWN ED—Because the same individual may be represented in different episodes, and eachepisode may result in a mention of more than one drug, these data cannot be used to estimateprevalence of use for any drug.
Mortality—Definitions associated with drug deaths vary. Common reporting terms include“drug related,” “drug induced,” “drug involved,” and “drug detections.” These terms havedifferent meanings in different areas of the country. In some cases, and some data systems, everydrug detected in a decedent’s body may be reported, so it cannot be assumed that a person diedof an overdose of any particular drug (e.g., a death certificate may show that heroin was found inthe body of a person who died from pneumonia).
Treatment admissions—Many factors affect treatment admission numbers, including programemphasis, slot capacity, data collection methods, and reporting periods. While most CEWG areasreport citywide or county data, Hawaii, Illinois, and Texas report statewide data. Also someCEWG members use total admissions as a denominator in calculating percentages of primaryadmissions for a particular drug, some exclude “alcohol-only” but include “alcohol-in-combination,” while others exclude both alcohol-only and alcohol-in-combination.
Arrests and seizures—The number of arrests, seizures, and quantity of drugs confiscated oftenreflect enforcement policy rather than levels of abuse.
The following methods were used in making area comparisons in this document:
• Most DAWN ED data are based on data files run by SAMHSA in 2001. These data oftenreflect weighted estimates of the number of mentions based on a sample of hospitalemergency departments.

3
• Long-term ED trend data typically cover the period of 1994 through 2000. Most short-termcomparisons are based on data for 1999 versus 2000. Increases or decreases that meetstandards of precision at p <0.05 are reported.
• Unless otherwise specified, all percentages for treatment program admissions exclude alcohol-only and alcohol-in-combination. Available data for 2000 on total admissions, includingalcohol in most areas, are presented by CEWG area in Appendix D.
• ADAM arrestee urinalysis data are based on full-year figures for 2000. Data may not becompared with earlier time periods because of substantial changes in data collection andreporting in 2000. Also, comparisons by gender are not valid because of differences insampling and data collection methods for adult male and female arrestees (see Appendix C).
• Heroin purity levels per milligram were obtained from the DEA Domestic Monitor Program,Intelligence Division, Domestic Unit. Preliminary data are for 2000. More current data arenot available.
• Cumulative totals of acquired immunodeficiency syndrome (AIDS) cases for the total UnitedStates are based on the HIV/AIDS Surveillance Report 12(1):8,9,12, 2000, from the Centers forDisease Control and Prevention (CDC).
Local areas and agencies vary in their reporting periods, e.g., some indicators are based on yearswhile others are based on calendar years.
Some indicator data are unavailable in certain areas. The symbol “NR” in tables refers to datanot reported.
OPENING REMARKS
Nicholas J. Kozel, of the Division of Epidemiology, Services and Prevention Research at NIDAbegan by welcoming participants and reviewing plans for the meeting.
Mr. Kozel provided information about recent personnel changes at NIDA, including theresignation of Dr. Alan I. Leshner as Director of the Institute and the appointment of Dr. Glen R.Hanson as Acting Director. Dr. Hanson is a recognized expert on psychostimulants and hasconducted research on the neurotoxic properties of MDMA and amphetamines. His work hasfocused on brain peptides and psychiatric and neurological functions. Dr. Hanson joined NIDAin September 2000 as the director of the Division of Neuroscience and Behavioral Research.
Dr. Wilson M. Compton has been appointed director of the Division of Epidemiology, Servicesand Prevention Research. Dr. Compton, a psychiatrist, has conducted research on comorbiddisorders, with a focus on personality variance. He also has special interest in cross-culturalresearch. He has worked with the World Health Organization and has conducted research inTaiwan.

4
Mr. Kozel expressed appreciation to the staff of JBS, Inc., for the superb job in planning andmanaging CEWG meetings for the past 14 years. He informed participants that in September2001, MasiMax Resources, Inc., was awarded the NIDA Epidemiology Work Group contract,which includes responsibility for planning and managing the CEWG meetings and editing andpreparing CEWG reports. He introduced Ms. Usha Charya, meeting coordinator, who organizedthe meeting.
Through the MasiMax contract, NIDA will continue to support the Border Epidemiology WorkGroup (BEWG), in collaboration with the Ministry of Health of Mexico. The BEWG, establishedin 1997, has developed as a drug abuse surveillance system capable of assessing drug abusepatterns and trends in cities located on both sides of the border. What makes the BEWG uniqueis the ongoing exchange and review of indicator data collected in “sister cities”—American andMexican cities across the border from each other—and the impact that drug problems on oneside of the border can have on nearby cities located on the other side.
Mr. Kozel pointed out that NIDA will provide technical assistance and support to States that areattempting to establish State epidemiology work groups, particularly those attempting toestablish epidemiologic work groups to assess and address drug abuse patterns and trends in ruralareas. Through the contract, studies will also be conducted to learn more about emerging drugabuse issues and problems.
Mr. Kozel encouraged CEWG members to continue developing and submitting grantapplications based on issues that emerge from their research. He pointed out that CEWGmembers have an excellent opportunity to not only identify emerging drug problems and trends,but also to investigate more thoroughly what has been discovered through the CEWG datasources. About 1 year ago, NIDA issued a Request for Applications (RFA) to conduct researchon emerging drug abuse trends and issues identified by the CEWG. Several CEWG members areworking in grants funded through this RFA.
Mr. Kozel also informed participants that NIDA is providing initial support for an ethnographicproject designed to assess changes in drug availability, attitudes, and patterns of use since theterrorist events on September 11, and the new security measures. He pointed out that Al Pach,CEWG member from Washington, D.C., has begun collecting local data on this issue.

5
CEWG REPORTS—UNITED STATES
KEY FINDINGS
Data from the 51st CEWG meeting portrayed both the similarities and differences in drug abusepatterns within and across CEWG areas, as well as changes in trends over time. The findingspresented in this report are based primarily on comparisons of 1999 and 2000 data. In someinstances, the findings are supplemented by data from earlier periods and data from the first halfof 2001. The major findings are highlighted below.
Cocaine/Crack
Although still at high levels, cocaine/crack indicators decreased in 10 CEWG areas, remainedstable or mixed in 9, and increased in 2 (Atlanta and Seattle). In 2000, rates of DAWN EDcocaine mentions per 100,000 population were higher than those for heroin/morphine in 16 ofthe 20 CEWG sites included in DAWN, and also were higher in all CEWG sites than rates formarijuana and methamphetamine. Primary treatment admissions in 2000 for cocaine/crack(excluding alcohol) were highest in Atlanta (70.3 percent), followed by Philadelphia (48.1percent), and lowest in Newark (9.0 percent). Treatment admissions data for 2000 show thatcrack cocaine accounted for a substantially greater percentage of primary admissions thanpowder cocaine in all CEWG areas. Adult arrestees in all ADAM CEWG sites in 2000 weremore likely to test positive for cocaine than opiates; in all 15 sites where both adult males andfemales were tested, females were more likely to test positive for cocaine than marijuana.Indicators suggest that crack use has decreased as powder cocaine has become more available insome CEWG areas including Denver, Miami/South Florida, Phoenix, the Texas border, andWashington, D.C. Powder cocaine and crack remain widely available in CEWG sites, but pricesvary across areas.
Heroin
Heroin use indicators increased in 15 CEWG areas, remained stable in 2, and decreased in 4.Decreases were reported in Honolulu, Los Angeles, San Francisco, and Seattle, areas whereMexican black tar heroin is the primary type available. On the East Coast, Boston, New York,Newark, and Philadelphia report that heroin is relatively cheap, widely available, and of highpurity. In 2000, rates per 100,000 population of DAWN ED heroin/morphine mentions werehigher than those for cocaine in four CEWG areas (Baltimore, Newark, San Diego, and SanFrancisco), and higher than rates for marijuana and methamphetamine in eight CEWG areas. In2000, primary heroin treatment admissions (excluding alcohol) were especially high in Baltimore(64.3 percent), Boston (69.1 percent), and Newark (83.8 percent), and were approximately 55–57percent of primary illicit drug admissions in Los Angeles and San Francisco. In 13 ADAMCEWG sites in 2000, the percentages of adult male arrestees testing opiate-positive were 10percent or less, as was the case for females in 12 CEWG areas. The percentages testing opiate-positive were particularly high in Chicago, New York, and Philadelphia. DMP data show thatheroin purity levels are highest east of the Mississippi River where South American heroindominates (43.9 percent purity compared with 28.5 percent west of the Mississippi where

6
Mexican heroin dominates). Heroin was available to varying degrees in all CEWG reportingareas but price varied across areas.
Other Opiates
Indicators of the illicit use of prescription semisynthetic narcotic drugs, particularly drugscontaining oxycodone and hydrocodone, increased in the 14 CEWG areas that reported on thesedrugs. The number of DAWN oxycodone/combinations ED mentions in 2000 were highest inPhiladelphia (658), Boston (594), and Phoenix (225). ED mentions for hydrocodone/combinations were highest in Los Angeles (459) and Detroit (369). Deaths involvinghydrocodone, oxycodone, or both were reported from Atlanta, Detroit, Miami (Dade andBroward Counties), Philadelphia, and Texas. Los Angeles reported that there are numerous chatrooms on the Internet devoted to OxyContin and how it can be illegally purchased. Lawenforcement agencies are encountering significant problems with oxycodone in Detroit, LosAngeles, and the Rocky Mountain West. Abuse of codeine (in pill and cough syrup form) wasreported as a problem in six CEWG areas, and remains the most widely abused other opiate inDetroit.
Marijuana
Marijuana use indicators increased in 12 CEWG areas, remained stable or mixed in 8, anddecreased in 1 (Atlanta). Marijuana ED mentions, arrests, and treatment admissions have beenincreasing. There is reportedly less stigma associated with the use of this drug than in prior years,and it is widely available in all CEWG and surrounding areas. In 2000, DAWN ED marijuanamentions increased in the total (coterminus) United States, and did so significantly in sevenCEWG areas. There were no significant decreases in the numbers of marijuana ED mentions inthe other 13 CEWG areas included in DAWN. Excluding primary alcohol treatment admissions,more than 49 percent of admissions in Minneapolis in 2000 were for primary abuse of marijuana,while those in Miami, New Orleans, St. Louis, and Seattle, ranged between 31 and 37 percent. Inthe CEWG sites in the ADAM program in 2000, the percentages of males testing marijuana-positive were higher than those testing cocaine-positive in 13 sites. Marijuana was widelyavailable in all CEWG areas and prices varied by area and the type and quality of the drug.
Methamphetamine
Methamphetamine use indicators increased in six of the seven CEWG areas that typically haverelatively high rates of ED methamphetamine mentions and/or high percentages of primarymethamphetamine treatment admissions. These include Denver, Hawaii, Los Angeles, Phoenix,San Diego, and Seattle. San Francisco was the only area reporting a decrease inmethamphetamine indicators in 2000–2001. Increases in methamphetamine indicators were alsoreported in Atlanta, Minneapolis/St. Paul, St. Louis, and cities in Texas. Chicago, Detroit, NewYork, Philadelphia, and Washington, D.C. reported increases in methamphetamine availabilityand use, but still at low levels. Excluding alcohol, treatment admissions in 2000 for primarymethamphetamine abuse were less than 6.0 percent of such admissions in Denver, Philadelphia,and Washington, D.C., but were especially high in Hawaii (46.6 percent) and San Diego (45.3percent). In the ADAM program in 2000, approximately 36 percent of adult male arrestees and

7
47 percent of females tested methamphetamine-positive in Honolulu, as did 26 percent of malesand 29 percent of females in San Diego, 19 percent of males and 24 percent of females inPhoenix, 12 percent of females in Los Angeles, and 22 percent of adult females in Seattle.Widespread or steady availability of methamphetamine was reported in Denver, Phoenix, SanDiego, and Texas. Availability increased in Atlanta, Detroit, Seattle, and Washington, D.C., butdecreased in Chicago and San Francisco. Purity levels of crystal methamphetamine (“ice”) wereclose to 100 percent in Honolulu and 90–95 percent in Phoenix. The Mexican form ofmethamphetamine is less pure (20–40 percent in Phoenix). Prices were relatively stable in mostareas but increased for some quantities in Denver, Phoenix, and Washington, D.C.
Club Drugs
MDMA (often called ecstasy) indicators increased in 19 CEWG areas and remained stable at lowlevels in 2 (New Orleans and Newark). Although the numbers of DAWN MDMA ED mentionsare still low compared with those for other drugs, they increased significantly in 14 CEWG areasbetween 1999 and 2000. Use of MDMA continues to spread beyond “raves” and nightclubs.Although still small, the numbers of persons being admitted for treatment for MDMA abuse isincreasing in Denver, Minneapolis/St. Paul, and Texas, and deaths associated with MDMA werereported in seven CEWG areas. In recent years, according to the DEA, clandestine laboratoriesin Belgium and the Netherlands and have produced 80 percent of the MDMA consumedworldwide. There have been reports of attempts to establish clandestine MDMA labs in CEWGsites, including Minneapolis, San Diego, and areas of Michigan and South Florida. Pills sold asecstasy were found to contain mixtures of a variety of substances, making them more dangerousto use; some did not contain any of the precursors needed to produce MDMA. Pills sold asecstasy are easily available and typically sell for $20–$30 each.
PCP
PCP indicators, reported in 14 CEWG areas, suggest that abuse of this drug is not widespread.However, there is evidence of increased abuse of this drug in some CEWG areas. Rates ofDAWN PCP mentions per 100,000 population increased significantly between 1999 and 2000 in8 CEWG areas. Areas with the highest number of ED mentions were Chicago, Philadelphia, LosAngeles, Seattle, and Washington, D.C. Rates per 100,000 population in these 5 cities rangedfrom a low of 6 in Seattle to a high of 17 in Chicago in 2000. Los Angeles reported 51 PCP-related deaths in 2000 and Philadelphia reported 22. Treatment admissions for primary PCPabuse remained low, accounting for less than 1 percent of admissions in most CEWG areas. PCPprimary treatment admissions increased in Newark and Los Angeles. Only small percentages ofadult and juvenile arrestees in ADAM CEWG sites in 2000 tested PCP-positive, with the highestpercentage (4.8) being among adult males in Houston. PCP prices remain stable in sevenreporting CEWG areas, with the exception of Los Angeles where the price declined since theJune 2001 reporting period.

8
Overview
In most CEWG areas, cocaine/crack indicators have been stabilizing and trending down for sometime. Between 1999 and 2000, cocaine/crack indicators decreased in 10 areas, were stable ormixed in 9, and increased in only 2. Nevertheless, cocaine/crack continues to be a dominant drugof abuse, as evidenced by the fact that rates of DAWN cocaine ED mentions tended to be muchhigher than the rates for other drugs. In 2000–2001, large proportions of clients entering drugabuse treatment programs were primary cocaine/crack abusers, with smoked cocaine (usuallycrack) accounting for a majority of this admissions group. ADAM data continue to show thathigh percentages of adult arrestees test positive for cocaine.
Crack indicators continued to increase in some CEWG areas despite the fact that abuse levelswere already high, new drugs have emerged in recent years, other drugs have become moreavailable and less expensive, and crack has a bad reputation on the street. As stated in theWashington, D.C., report, “Crack is viewed in a negative light and is not considered popularamong new drug abusers. Crack is associated with violent and desperate behavior indisadvantaged communities in D.C. In other D.C. communities, crack is also eschewed bymiddle-class users of illicit substances.”
Increases from 1999 to 2000–01 in cocaine/crack indicators were reported only in two areas:
Atlanta After a steady decline, increases in cocaine indicators were reported in 2000. Therate of ED mentions increased from 189 in 1999 to 221 in 2000. In 2000, 48.5percent of male and 57.6 percent of female arrestees tested positive for cocaine.Almost one-half (48.6 percent) of all treatment admissions were for cocaine/crackabuse.
Seattle Indicators of cocaine use have shown an increase to higher historical levels afterseveral years of decline. The rate of 2000 cocaine ED mentions increased from130 in 1999 to 169 in 2000. In the past 3 years, 12 percent of all admissions totreatment were for primary cocaine abuse.
The following excerpts are from CEWG areas reporting increased use of powder cocaine:
Denver Cocaine injecting declined from 1995 (12.4 percent) through 1998 (10.6 percent),but increased slightly to 13.7 percent in the first half of 2001. Smokingpercentages, though level at 67.2 percent in 1995 and 1996, have since declinedsteadily to a low of 56.7 percent in the first half of 2001. Conversely, inhalationhas been steadily increasing from 17.6 percent in 1995 to 26.3 percent in the firsthalf of 2001. This is probably related to the increased availability of cocainehydrochloride (HCl).

9
Miami/South FloridaThere were 4,383 cocaine and crack DAWN ED mentions reported in 2000 forMiami-Dade County. Of this number 2,645 (60.3 percent) were for powdercocaine and 1,712 mentions (39.1 percent) were for crack.
Phoenix Cocaine HCl is consistently available throughout the Phoenix, Tucson, andNogales areas of Arizona, according to DEA.
Texas Powder cocaine inhalers tend to be Hispanic and injectors Anglo. Deaths related tococaine continue to increase.
Washington, D.C.Especially in the northwest quadrant of the city, ethnographic respondents report thatcocaine HCl is used by members of Washington’s professional class in straight andgay nightclubs and dance party settings in certain affluent neighborhoods in D.C.Ethnographic data suggest that crack cocaine is used predominantly by African-Americans and other disadvantaged minorities in the District.
DAWN ED Data on Cocaine/Crack
Exhibit 1 shows DAWN ED rates per 100,000 population in 2000 by CEWG area and drug type.As shown, rates for DAWN ED cocaine/crack mentions exceeded those for marijuana/hashishand methamphetamine/speed in all 20 CEWG areas covered in DAWN. Cocaine/crack ratesexceeded those for heroin/morphine in 16 CEWG areas.

10
EEEExxxxhhhhiiiibbbbiiiitttt 1111.... RRRRaaaatttteeeessss ooooffff EEEEDDDD MMMMeeeennnnttttiiiioooonnnnssss PPPPeeeerrrr 111100000000,,,,000000000000 PPPPoooopppuuuullllaaaattttiiiioooonnnn ooooffff CCCCooooccccaaaaiiiinnnneeee////CCCCrrrraaaacccckkkk,,,,HHHHeeeerrrrooooiiiinnnn,,,, MMMMaaaarrrriiiijjjjuuuuaaaannnnaaaa,,,, aaaannnndddd MMMMeeeetttthhhhaaaammmmpppphhhheeeettttaaaammmmiiiinnnneeee bbbbyyyy CCCCEEEEWWWWGGGG AAAArrrreeeeaaaa:::: 2222000000000000
CEWG Area Cocaine/ Crack Heroin Marijuana Methamphetamine
Atlanta 221 18 86 4Baltimore 208 227 68 0Boston 108 103 78 0Chicago 246 208 89 0Dallas 87 20 49 5Denver 83 42 51 7Detroit 179 77 99 …1
Los Angeles/Long Beach 105 37 67 16Miami/Hialeah 225 75 91 1Minneapolis/St. Paul 35 10 33 6New Orleans 162 81 87 2New York 166 128 41 0Newark 147 238 29 0Philadelphia 216 97 101 1Phoenix 85 43 51 29St. Louis 98 46 72 7San Diego 41 44 39 31San Francisco 126 170 38 36Seattle 169 128 72 27Washington, D.C. 72 50 64 2
1 Dots (…) indicate that an estimate with a relative standard error greater than 50 percent has been suppressed.SOURCE: Adapted from DAWN, Office of Applied Studies, SAMHSA
The same pattern appears for DAWN episodes across the coterminous United States sites.Cocaine/crack use was reported in 29 percent of drug episodes, compared with 16 percent forheroin/morphine, 16 percent for marijuana/hashish, and 2 percent for methamphetamine/speed.Mentions of alcohol in combination with other drugs occurred in 34 percent of the ED drugepisodes in 2000.
As noted in exhibit 1, the rates for cocaine/crack ED mentions in 2000 exceeded 200 per 100,000population in 5 CEWG areas: Chicago (246), Miami (225), Atlanta (221), Philadelphia (216),and Baltimore (208).
Exhibit 2 depicts trends in rates of ED cocaine/crack mentions per 100,000 population by CEWGarea for a 7-year period, with peak years depicted in boldface type. There are clearly severaldifferent trend patterns. In the first four CEWG areas shown, rates peaked in 2000, while in thenext five areas the peak occurred in 1998 or 1999. In Chicago and St. Louis, cocaine/crack EDrates peaked earlier (1997 and 1994, respectively), but remained close to the peak level in 2000.In the remaining nine metropolitan areas, the rates of cocaine/crack ED mentions also peaked inthe mid-1990s but declined thereafter.

11
EEEExxxxhhhhiiiibbbbiiiitttt 2222.... RRRRaaaatttteeeessss ooooffff EEEEDDDD CCCCooooccccaaaaiiiinnnneeee MMMMeeeennnnttttiiiioooonnnnssss PPPPeeeerrrr 111100000000,,,,000000000000 PPPPooooppppuuuullllaaaattttiiiioooonnnn bbbbyyyy CCCCEEEEWWWWGGGG AAAArrrreeeeaaaaaaaannnndddd YYYYeeeeaaaarrrr:::: 1111999999994444––––2222000000000000
CEWG Area 1994 1995 1996 1997 1998 1999 2000
Los Angeles 62 61 69 56 58 79 105
Miami 151 168 168 174 187 210 225
Mpls./St. Paul 25 20 29 31 33 34 35
Seattle 157 116 114 150 125 130 169
Dallas 61 62 58 74 106 86 87
Denver 86 75 53 69 73 87 83
Philadelphia 186 208 224 239 275 260 216
Phoenix 55 59 69 66 73 91 85
San Diego 29 28 39 36 41 44 41
Chicago 192 188 220 247 232 225 246
St. Louis 102 80 80 64 87 97 98
Atlanta 234 245 202 151 218 189 221
Baltimore 400 384 376 273 296 296 208
Boston 133 147 114 91 123 96 108
Detroit 195 212 250 192 202 178 179
Newark 246 268 253 201 208 172 147
New Orleans 169 174 203 199 199 176 162
New York 252 244 264 244 233 175 166
San Francisco 205 166 149 126 116 120 126
Wash., D.C. 132 96 104 85 97 81 72
SOURCE: Adapted from DAWN, Office of Applied Studies, SAMHSA
The DAWN data show that the number of cocaine/crack ED mentions increased significantly in6 of the 20 CEWG metropolitan areas from 1999 to 2000: Los Angeles (35 percent from 6,772to 9,111), Seattle (32 percent, from 2,520 to 3,338), Atlanta (19 percent, from 5,236 to 6,229),Boston (15 percent, from 3,560 to 4,101), Chicago (11 percent, from 13,399 to 14,871), andMiami (9 percent, from 4,018 to 4,381). Statistically significant decreases in cocaine/crack EDmentions were reported for Baltimore (29 percent, from 6,921 to 4,943), Newark (13 percent,from 3,124 to 2,726), Washington, D.C. (10 percent, from 3,150 to 2,830), and New Orleans (7percent, from 2,140 to 1,998).
Other trend data for the total coterminus United States show that the number of cocaine/crackmentions increased among Hispanics and Whites, as shown in exhibit 3. The increases amongHispanics were statistically significant between 1999 and 2000. However, African-Americanscontinued to account for the largest number of cocaine/crack ED mentions.

12
* Statistically significant change from 1999 to 2000 at p < 0.5SOURCE: Adapted from DAWN, Office of Applied Studies, SAMHSA
Not shown in exhibit 3 is the fact that cocaine/crack ED mentions among persons age 35 andolder totaled only 46,614 in 1993; by 1996, the total climbed to 68,723, reaching 93,354 in 2000.In the total DAWN 2000 sample, more than one-half of cocaine mentions (53 percent) occurredamong patients age 35 and older. Between 1999 and 2000, cocaine mentions increasedsignificantly by 9 percent in the 35–and-older age category. Clearly, cocaine users who receivemedical treatment in DAWN hospital EDs represent an aging population.
Treatment Data on Primary Cocaine/Crack Admissions
Exhibit 4 displays existing data on primary cocaine/crack admissions to drug treatment facilitiesin 17 CEWG areas and 3 States. Data were not available from Phoenix, Arizona. Typically, dataexclude “alcohol only” and “alcohol-in-combination” with other drugs. Not all sites reportedtreatment data for the first half of 2001 and, for both time periods, some did not report on routeof administration of cocaine. The number of primary cocaine/crack admissions in 2000 is shownin Appendix D.
0
10,000
20,000
30,000
40,000
50,000
60,000
70,000
80,000
90,000
Hispanic 16,760 21,209 20,460 23,727
White 50,871 52,955 56,730 59,831
Black 82,260 84,558 78,018 75,889
1997 1998 1999 2000
EEEExxxxhhhhiiiibbbbiiiitttt 3333.... NNNNuuuummmmbbbbeeeerrrr ooooffff CCCCooooccccaaaaiiiinnnneeee////CCCCrrrraaaacccckkkk EEEEDDDD MMMMeeeennnnttttiiiioooonnnnssss iiiinnnn TTTToooottttaaaallll CCCCooootttteeeerrrrmmmmiiiinnnnuuuussssUUUUnnnniiiitttteeeedddd SSSSttttaaaatttteeeessss bbbbyyyy RRRRaaaacccceeee////EEEEtttthhhhnnnniiiicccciiiittttyyyy:::: 1111999999997777––––2222000000000000
*

13
As shown in exhibit 4, Atlanta (70.3 percent), Philadelphia (48.1 percent), and Washington, D.C.(43.7 percent) had the highest proportion of primary cocaine/crack admissions (excludingalcohol). In nine local sites and two States, cocaine/crack abusers accounted for approximately22–44 percent of primary admissions for illicit drugs. The lowest percentages of primarycocaine/crack admissions in 2000 were in Newark and Hawaii (9.0 and 10.6 percent,respectively). The most striking pattern is the predominance of crack (“smoked cocaine”). In allreporting sites in 2000 and the first half of 2001, the percentages of crack admissions werehigher than those for powder cocaine (non-smoked).
EEEExxxxhhhhiiiibbbbiiiitttt 4444.... PPPPeeeerrrrcccceeeennnnttttaaaaggggeeee ooooffff PPPPrrrriiiimmmmaaaarrrryyyy CCCCooooccccaaaaiiiinnnneeee TTTTrrrreeeeaaaattttmmmmeeeennnntttt AAAAddddmmmmiiiissssssssiiiioooonnnnsss1111 bbbbyyyy CCCCEEEEWWWWGGGG AAAArrrreeeeaaaa::::2222000000000000 aaaannnndddd FFFFiiiirrrrsssstttt HHHHaaaallllffff ooooffff 2222000000001111
2000 2001 (1H)CEWG Area
PowderCocaine
CrackCocaine Total Powder
CocaineCrack
Cocaine Total
Atlanta (metro) 22.5 47.8 70.3 NR NR NRBaltimore 3.9 11.6 15.5 NR NR NRBoston 8.3 10.1 18.4 7.4 8.0 15.4Denver (County) 7.3 20.2 27.5 7.8 19.8 27.6Detroit (Wayne County) 6.4 34.4 40.8 10.9 27.8 38.7Los Angeles (County) 2.4 19.2 21.6 4.1 19.6 23.7Miami (Broward County) NR NR 27.0 NR NR 8.0Mpls./St. Paul 5.0 24.8 29.8 NR NR 31.1Newark 2.9 6.1 9.0 2.5 4.8 7.3New Orleans (Parish) NR NR 33.3 NR NR NRNew York 9.5 19.0 28.5 9.8 18.1 27.9Philadelphia 11.2 36.9 48.1 6.2 30.4 36.5St. Louis 4.9 39.2 44.1 NR NR 45.4San Diego 2.1 11.0 13.1 NR NR NRSan Francisco (Bay Area) NR NR 24.2 NR NR 23.7Seattle (King County) 4.5 16.6 21.1 NR NR NRWashington, D.C. 9.4 34.3 43.7 11.0 30.8 41.8Hawaii NR NR 10.6 NR NR 8.6Illinois 4.6 34.4 39.0 5.3 27.8 33.1Texas 14.7 27.8 42.5 13.3 26.0 39.2
NR = Not reported1 Excludes alcohol only and ”alcohol-in-combination” admissions. Where incomplete data exist (as in Miami), the denominator is
all admissions, thereby underrepresenting cocaine/crack admissions as a percentage of the caseload of primary illicit drugabusers.
SOURCE: CEWG site reports and treatment admissions forms, and for Los Angeles, the California Drug Data System
Comparable data for 1999 and 2000 from 18 CEWG sites (excluding alcohol only), show thatcocaine/crack admissions remained relatively unchanged in 4 areas, decreased in 10, andincreased slightly in 4. The increases were small, ranging from 4 percentage points in New YorkCity to 7 in Philadelphia.

14
This trend for cocaine/crack admissions in CEWG areas has continued for several years andfollows the national trend from TEDS, as shown below:
TEDS ADMISSIONS(Cocaine/Crack) 1994 1995 1996 1997 1998 1999All Admissions (%) 17.9 16.7 16.1 15.1 15.1 14.4Excluding Alcohol Only (%) 37.2 33.7 32.0 31.3 32.0 31.1
SOURCE: Treatment Episode Data Set, SAMHSA
ADAM Data on Cocaine/Crack
The ADAM 2000 data show that high percentages of adult male arrestees (weighted sample) andfemale arrestees (unweighted sample) tested positive for cocaine (exhibits 5a and 5b). Maleswere most likely to test cocaine-positive in New York (48.8 percent), Atlanta (48.5 percent), andMiami (43.5 percent).
EEEExxxxhhhhiiiibbbbiiiitttt 5555aaaa.... PPPPeeeerrrrcccceeeennnnttttaaaaggggeeeessss ooooffff AAAAdddduuuulllltttt MMMMaaaalllleeee AAAArrrrrrrreeeesssstttteeeeeeeessss TTTTeeeessssttttiiiinnnngggg CCCCooooccccaaaaiiiinnnneeee----PPPPoooossssiiiittttiiiivvvveeee aaaannnndddd SSSSeeeellllffff----RRRReeeeppppoooorrrrttttiiiinnnngggg CCCCooooccccaaaaiiiinnnneeee UUUUsssseeee bbbbyyyy CCCCEEEEWWWWGGGG AAAArrrreeeeaaaa aaaannnndddd RRRRaaaacccceeee////EEEEtttthhhhnnnniiiicccciiiittttyyyy:::: AAAADDDDAAAAMMMM 2222000000000000
Percent Tested Cocaine-Positive Percent Self-ReportedUse—Past 30 daysCEWG Area Sample Size
Sample Black White HispanicCrack Powder
Atlanta 1,115 48.5 51.2 28.7 33.0 24.6 8.9Chicago* 37.0Dallas 1,574 27.7 34.4 23.7 16.7 13.2 11.2Denver 1,130 35.4 47.8 25.5 36.8 19.7 12.5Detroit 844 24.4 24.9 23.6 28.0 15.4 3.6Ft. Lauderdale 414 30.9 41.9 21.0 6.5 12.2 13.8Honolulu 1,111 15.8 25.8 37.7 15.1 13.9 5.5Houston 1,330 31.5 41.1 27.6 18.6 11.2 7.0Laredo 374 45.1 59.8 53.6 42.6 9.0 33.9Miami 1,042 43.5 49.3 39.3 20.9 13.6 17.9Minneapolis 1,113 25.7 26.5 26.1 0.0 17.1 8.2New Orleans 884 34.8 36.9 19.9 0.0 14.7 9.2New York 1,534 48.8 49.4 54.9 45.9 21.4 16.7Philadelphia 520 30.9 26.0 48.6 0.0 18.4 7.1Phoenix/Mesa 2,427 31.9 53.7 25.4 38.7 19.5 13.8San Antonio 848 20.4 35.0 12.2 23.1 4.6 12.4San Diego 1,568 14.8 37.7 8.7 7.3 9.8 5.8Seattle 1,858 31.3 44.7 26.1 36.3 19.9 12.1
* Data on positive tests for males were provided by the Chicago CEWG representative.SOURCE: Arrestee Drug Abuse Monitoring Program, NIJ

15
The percentages of female arrestees testing positive for cocaine were especially high in Chicago(59.2 percent), Atlanta (57.6 percent), New York (53.0 percent), Denver (46.9 percent). Ft.Lauderdale (44.8 percent), and Detroit (42.4 percent). The percentages of female arrestees testingpositive for cocaine were relatively low in Honolulu (19.4 percent), Laredo (22.4 percent),Dallas (23.9 percent), and San Diego (26.1 percent).
EEEExxxxhhhhiiiibbbbiiiitttt 5555bbbb.... PPPPeeeerrrrcccceeeennnnttttaaaaggggeeeessss ooooffff AAAAdddduuuulllltttt FFFFeeeemmmmaaaalllleeee AAAArrrrrrrreeeesssstttteeeeeeeessss TTTTeeeessssttttiiiinnnngggg CCCCooooccccaaaaiiiinnnneeee----PPPPoooossssiiiittttiiiivvvveeee aaaannnnddddSSSSeeeellllffff----RRRReeeeppppoooorrrrttttiiiinnnngggg CCCCooooccccaaaaiiiinnnneeee UUUUsssseeee bbbbyyyy CCCCEEEEWWWWGGGG AAAArrrreeeeaaaa aaaannnndddd RRRRaaaacccceeee////EEEEtttthhhhnnnniiiicccciiiittttyyyy:::: AAAADDDDAAAAMMMM 2222000000000000
Percent Tested Cocaine-Positive Percent Self-ReportedUse—Past 30 daysCEWG Area Sample
Size Sample Black White HispanicCrack Powder
Atlanta (379) 57.6 56.3 65.0 0.0 30.8 7.5Chicago (1,301) 59.2 63.1 47.4 33.3 41.5 4.2Dallas (94) 23.9 21.2 27.6 20.0 21.0 11.3Denver (387) 46.9 52.2 52.9 38.3 31.9 13.3Detroit (107) 42.4 36.8 50.0 0.0 31.5 3.7Ft. Lauderdale (242) 44.8 41.4 47.0 0.0 23.3 11.4Honolulu (162) 19.4 50.0 8.3 0.0 11.3 6.4Houston (116) 31.7 34.2 50.0 8.3 17.2 3.5Laredo (77) 22.4 0.0 0.0 19.0 6.6 24.6Los Angeles (300) 31.1 40.6 32.3 20.7 25.6 2.4Minneapolis (40) 33.3 40.0 14.3 0.0 13.0 0.0New Orleans (264) 41.1 40.6 43.8 0.0 28.2 6.0New York (481) 53.0 57.1 41.5 48.8 31.2 11.8Philadelphia (96) 40.7 44.4 35.3 0.0 30.3 9.4Phoenix/Mesa (540) 35.2 48.3 27.9 52.3 28.3 12.7San Diego (554) 26.1 42.4 21.9 14.9 20.9 5.9Seattle (36) 39.1 50.0 35.7 0.0 24.0 12.0
SOURCE: Arrestee Drug Abuse Monitoring Program, NIJ
The percentages of females reporting crack use in the past 30 days were relatively high inChicago (41.5 percent), Denver (31.9 percent), Detroit (31.5 percent), New York (31.2 percent),Atlanta (30.8 percent), and Philadelphia (30.3 percent). Corresponding figures for powdercocaine use in these six cities were much lower, ranging from 3.7 percent in Detroit to 13.3percent in Denver. Self-reported past-30-day use of powder cocaine among females was highestin Laredo (24.6 percent) and Denver (13.3 percent).
Among male arrestees, self-reported past-30-day use of crack was highest in Atlanta (24.6percent), New York (21.4 percent), Seattle (19.9 percent), Denver (19.7 percent), andPhoenix/Mesa (19.5 percent). Corresponding figures for self-reported powder cocaine use amongmales in these five CEWG areas were lower, ranging from 8.9 percent in Atlanta to 16.7 percentin New York. The highest percentages of reported past-30-day use of powder cocaine amongmales were in Laredo (33.9 percent) and Miami (17.9 percent).

16
Powder Cocaine Availability, Price, and Purity
Availability. Powder cocaine is steadily and widely available in most CEWG areas. Some cities,however, felt the impact of the September 11, 2001, events. Boston reported a decline in cocaineavailability following the terrorist attacks, with dealers reluctant to enter New York City, from whichColombian cocaine is shipped to Boston. While street-level and larger quantities of cocaine werereadily available in Texas, drug-related activity on the border decreased after September 11, withtraffickers stockpiling drugs on the Mexican side. Washington, D.C., also reported a decline inavailability of cocaine and other drugs in some communities in the wake of September 11, buttrafficking increased when police were diverted to other activities.
Prices. Prices for powder cocaine varied widely among CEWG sites across the country, with gramsselling for as little as $20–$50 in New York City and as much as $100–$250 in Honolulu (exhibit 6).Ounce prices ranged from $400–$1,200 in Texas and Washington, D.C., and $500–$600 in Phoenix to$1,000–$1,500 in Honolulu and in Chicago instances to $2,800. Compared with the CEWG June 2001reporting period, prices remained relatively steady, except in New York City, where they increased forounces; Chicago, where they decreased for grams and ounces; Washington, D.C., where theydecreased for ounces; and Boston and Phoenix, where the range narrowed for ounces. Among otherretail-level prices for cocaine powder were $25–$35 per paper and $400 per quarter ounce in Honolulu,$250 per “eightball” (one-eighth ounce, 3.5 grams) in Minneapolis/St. Paul, $10–$20 per bag inPhiladelphia, $100–$140 per eightball in Phoenix, $10 per “dime bag” (about one-quarter gram) and$80–$100 per eightball ounce in Seattle, and $90–$335 per eightball in Washington, D.C.
In New York, powder cocaine was packaged in tinfoil, glassine bags, pyramid paper, crisp dollar bills,and plastic wrap with both ends knotted. In Phoenix, street-level amounts of powder were usually soldin folded papers (“bindles”), small vials, or zip-lock plastic bags. The most common packagingmaterials for both powder cocaine and crack in Detroit were small plastic bags or aluminum foil.
EEEExxxxhhhhiiiibbbbiiiitttt 6666.... PPPPoooowwwwddddeeeerrrr CCCCooooccccaaaaiiiinnnneeee PPPPrrrriiiicccceeeessss aaaannnndddd PPPPuuuurrrriiiittttyyyy iiiinnnn 11117777 CCCCEEEEWWWWGGGG AAAArrrreeeeaaaassssArea PPPPuuuurrrriiiittttyyyy ((((%%%%)))) GGGGrrrraaaammmm OOOOuuuunnnncccceeee KKKKiiiillllooooggggrrrraaaammmmAtlanta 50–80 $100 NR NRBoston 40–90 $50–$90 $880–$1,100 $24,000–$32,000Chicago 39 $50–$140 $700–$1,200 $20,000–$24,000Denver 50–90 NR $800–$1,000 $18,000–$20,000Honolulu 20–90 $100–$250 $1,000–$1,500 $26,500–$52,000Los Angeles 80–85 NR NR $16,500 (wholesale)Miami/South Florida 83 NR NR $18,000–$22,000Minneapolis/St. Paul NR $100 $700–$1,200 $24,000New Orleans NR $80–$150 $800–$1,200 $18,000–$25,000New York NR $20–$60 $800–$1,500 $22,000–$30,000Phoenix NR $80 $500–$600 $15,000–$17,000St. Louis 77 $100–$125 NR NRSan Diego 45–85 $75–$100 NR NRSan Francisco 60–90 NR NR $14,000–$22,000Seattle NR $30 NR NRTexas NR $50–$100 $400–$1,200 $10,000–$22,000Washington, D.C. NR $50–$100* NR NR
* Ethnographic dataSOURCE: CEWG city reports, December 2001

17
Purity. The purity of powder cocaine in reporting CEWG areas ranged from 20 to more than 90percent. Purity trends have been stable since the June reporting period, except for slight increasesin Boston and Honolulu. The narrowest range in purity occurred at the high end (80 to 85 percentin Los Angeles); the widest range (20 to less than 90 percent) occurred in Honolulu.
Reports from the following sites suggest that the quality of powder cocaine is often compromisedby adulterants:
Boston
Honolulu
State Police reported that recent cocaine samples have been increasinglyadulterated with caffeine, as well as standard adulterants such as procaine,lidocaine, benzocaine, and boric acid.
Powder cocaine purity levels remain lower for smaller quantities (20 to 50percent per gram) and increase with quantity purchases (less than 90 percentper pound).
Crack Cocaine Availability, Price, and Purity
Availability. Crack cocaine remained available in CEWG areas. It was more readily availablethan powder cocaine in Texas, and substantial amounts could be found in the larger metropolitansections of Denver.
Price. Prices for a rock of crack generally ranged from $5–$30 in CEWG areas, with a smallerrock (3–5 millimeters, a “trey”) selling for $3 in Philadelphia, and a $40 rock (1/5–1/4 gram)available in Seattle (exhibit 7). In Texas, a rock of crack cost as much as $100 in someinstances, but $10 was the most common price. Grams of crack cost as little as $20–$30 in NewYork City, while in Seattle they cost as much as $250 in rural areas and $300–$400 in thecentral city. Ounce prices ranged from a low of $400 to a high of $2,800 depending on locationin Texas, from $485–$600 in Phoenix, from $700–$1,200 in Chicago, from $800–$1,200 inDenver and New Orleans, and from $800–$1,000 in New York City. Among other retail-levelquantities of crack were $3, $5, and $10 bags in New York City and an eightball for $125–$130in Washington, D.C.

18
EEEExxxxhhhhiiiibbbbiiiitttt 7777.... CCCCrrrraaaacccckkkk CCCCooooccccaaaaiiiinnnneeee PPPPrrrriiiicccceeeessss aaaannnndddd PPPPuuuurrrriiiittttyyyy iiiinnnn 11116666 CCCCEEEEWWWWGGGG AAAArrrreeeeaaaassssCCCCEEEEWWWWGGGG AAAArrrreeeeaaaa PPPPrrrriiiicccceeee////UUUUnnnniiiitttt
Atlanta$10–$20/rock$100/gram
Boston $10–$20/rock
Chicago$5, $10, or $20/rock$700–$1,200/ounce
Denver $20–$30/rock
Detroit $10–$20/rock ($10 most common)
Minneapolis/St. Paul $10–$20/rock
Newark $5–$30/bag
New Orleans$5–$25/rock$80–125/gram$800–$1,200/ounce
New York$3, $5, and $10/bag$20–$30/gram$800–$1,000/ounce
Philadelphia$3/”trey” (3–5 millimeter rock)$5/ready rock (6–9 millimeters)
Phoenix$17.50–$20/rock$485–$600/ounce$7,500–$8,500/1/2 kilogram
St. Louis$20/rock (central city)$300–$400/gram (central city)$250/gram (rural areas)
San Diego $10/1/10 gram (one “dime” rock)
Seattle$20/1/10–1/8 gram ($20 rock)$40/1/5–1/4 gram ($40 rock)
Texas$10–$100/rock ($10 most common)$400–$2,800/ounce
Washington, D.C. $10–$20/rock; $125–$130/1/8 ounce (“eightball”)
SOURCE: CEWG city reports, December 2001
Purity. Reported crack purity levels ranged from 35–90 percent in Boston to 40–85 percent inSan Diego to 50–90 percent in Phoenix. Crack packaging continues to change in New York,where small glassine bags and plastic wrap knotted at both ends are replacing plastic vials.
In Texas, street outreach workers in Austin report that the powdered drink mix Kool-Aid is againbeing used to break down crack cocaine for injection and also that crack is being cut with ether,in addition to baking soda, to give a “bell-ringing” effect.
HEROIN
Overview
Heroin indicators increased in 14 CEWG areas, decreased in 4, and remained stable or mixed in 3.
The following excerpts are from CEWG reports where heroin indicators increased from 1999 to2000–01.

19
Boston
Denver
Detroit
Minneapolis
Most heroin indicators continue to rise. The impact of widely available, low-cost and high-purity heroin is reported by treatment providers, who continue tosee more heroin users seeking services. Heroin may have surpassed cocaine asthe drug of choice in Boston and other areas in Massachusetts. Primary heroinadmissions now constitute the largest percent of illicit drug admissions inGreater Boston’s publicly funded treatment programs (42 percent). Thoseadmissions reporting heroin as their primary drug has risen from 31 percent infiscal year (FY) 1996 to 42 percent in FY 2001. The proportion of heroinmentions in Boston ED episodes rose from 20 percent in 1998 to 27 percent inthe second half of 2000. In FY 2000, heroin arrests accounted for 27 percent ofall drug arrests in Boston, up from 24 percent in 1999 and 13 percent in 1992.
Most heroin indicators are increasing. DAWN data show that rate of heroin EDmentions declined from 1994 (31 per 100,000) through 1996 (22 per 100,000).However, from 1996 to 2000, they nearly doubled (41 per 100,000).
Most heroin indicators are increasing. Heroin as the primary drug amongtreatment admissions in FY 2001 accounted for 34 percent of all admissions inDetroit/Wayne County and 13 percent of admissions statewide. The 4,461heroin primary drug admissions in Detroit/Wayne County accounted for 57percent of the statewide total of 7,857 heroin primary drug admissions.
Heroin-related indicators increased again in 2001, and opiate-related deaths,most from accidental heroin overdose, surpassed those from cocaine in bothcities. High-purity heroin at very low prices and in steady supply, fueled thisincrease in mortality.
DAWN ED Data on Heroin/Morphine
From 1999 to 2000, the number of DAWN ED mentions of heroin/morphine increasedsignificantly in seven CEWG areas: Miami (58 percent, from 921 to 1,459), New Orleans (50percent, from 664 to 996), Boston (35 percent, from 2,874 to 3,888), Chicago (29 percent, from9,725 to 12,564), Detroit (26 percent, from 2,678 to 3,369), Atlanta (17 percent, from 432 to507), and Minneapolis/St. Paul (14 percent, from 207 to 237). Heroin/morphine mentionsdecreased significantly in Baltimore (23 percent, from 7,013 to 5,414) and San Francisco (10percent, from 3,074 to 2,773). As shown earlier in exhibit 1, heroin/morphine ED mentions weregreater than mentions for cocaine/crack, marijuana/hashish, and methamphetamine/speed in fourCEWG areas: Baltimore, Newark, San Diego, and San Francisco.
In 10 CEWG areas, rates of ED heroin/morphine mentions per 100,000 population reached ormatched their highest levels in 7 years in 2000 (exhibit 8).

20
EEEExxxxhhhhiiiibbbbiiiitttt 8888.... TTTTeeeennnn CCCCEEEEWWWWGGGG AAAArrrreeeeaaaassss WWWWhhhheeeerrrreeee RRRRaaaatttteeeessss ooooffff HHHHeeeerrrrooooiiiinnnn////MMMMoooorrrrpppphhhhiiiinnnneeee EEEEDDDD MMMMeeeennnnttttiiiioooonnnnssss PPPPeeeerrrr111100000000,,,,000000000000 PPPPooooppppuuuullllaaaattttiiiioooonnnn RRRReeeeaaaacccchhhheeeedddd tttthhhheeee HHHHiiiigggghhhheeeesssstttt LLLLeeeevvvveeeellllssss iiiinnnn 7777 YYYYeeeeaaaarrrrssss:::: 1111999999994444––––2222000000000000
CEWG Area 1994 1995 1996 1997 1998 1999 2000
Atlanta 17 16 15 15 18 16 18
Boston 71 83 76 69 75 77 103
Chicago 85 83 109 148 159 164 208
Denver 33 31 22 31 32 41 42
Detroit 52 58 77 72 68 62 77
Miami 15 18 21 32 41 48 75
Minneapolis 3 5 6 7 8 9 10
New Orleans 17 24 26 36 44 55 81
Philadelphia 54 85 85 82 76 87 97
St. Louis 18 17 22 20 27 37 46
SOURCE: Adapted from DAWN, Office of Applied Studies, SAMHSA
Rates of DAWN heroin/morphine mentions per 100,000 population peaked in earlier years inseveral CEWG areas but were still at relatively high rates in 2000 compared with prior years(exhibit 9).
EEEExxxxhhhhiiiibbbbiiiitttt 9999.... TTTTrrrreeeennnnddddssss aaaannnndddd PPPPeeeeaaaakkkk YYYYeeeeaaaarrrrssss iiiinnnn RRRRaaaatttteeeessss ooooffff DDDDAAAAWWWWNNNN HHHHeeeerrrrooooiiiinnnn////MMMMoooorrrrpppphhhhiiiinnnneeee EEEEDDDD MMMMeeeennnnttttiiiioooonnnnssssPPPPeeeerrrr 111100000000,,,,000000000000 PPPPooooppppuuuullllaaaattttiiiioooonnnn iiiinnnn 11110000 CCCCEEEEWWWWGGGG AAAArrrreeeeaaaassss:::: 1111999999994444––––2222000000000000
CEWG Area 1994 1995 1996 1997 1998 1999 2000
Baltimore 338 367 358 256 290 299 227
Dallas 10 12 15 21 21 18 20
Los Angeles 36 38 40 30 31 35 37
New York 140 133 136 115 110 110 128
Newark 262 328 307 246 282 260 238
Phoenix 25 25 32 41 44 43 43
San Diego 30 30 42 39 42 46 44
San Francisco 233 204 203 175 150 191 170
Seattle 113 109 130 154 127 128 128
Washington, D.C. 34 35 41 45 55 46 50
SOURCE: Adapted from DAWN, Office of Applied Studies, SAMHSA
Comparison of 1999 and 2000 heroin/morphine ED mentions in the coterminus United Statesshows statistically significant increases in mentions among Whites and persons age 18–25 and35 and older (exhibit 10).

21
EEEExxxxhhhhiiiibbbbiiiitttt 11110000.... NNNNuuuummmmbbbbeeeerrrr ooooffff EEEEDDDD HHHHeeeerrrrooooiiiinnnn////MMMMoooorrrrpppphhhhiiiinnnneeee MMMMeeeennnnttttiiiioooonnnnssss bbbbyyyy RRRRaaaacccceeee////EEEEtttthhhhnnnniiiicccciiiittttyyyy aaaannnndddd AAAAggggeeeeGGGGrrrroooouuuupppp:::: 1111999999999999––––2222000000000000
Category 1999 2000 Percent Increase
Race/Ethnicity
White 33,645 40,417* 20
African-American 28,726 31,129 8
Hispanic 11,858 15,029 27
Age
12–17 686 1,067 55
18–25 15,132 18,400* 22
26–34 20,380 24,154 18
35 and older 48,104 53,418* 11
* Statistically significant at p < 0.05SOURCE: Adapted from DAWN, Office of Applied Studies, SAMHSA
Treatment Data on Primary Heroin Admissions
Exhibit 11 shows existing data on primary heroin admissions in 17 CEWG areas and 3 States for2000 and the first half of 2001. The number of primary heroin admissions by site appears inAppendix D.
As shown in exhibit 11, Newark had the highest proportion of primary heroin admissions(excluding alcohol) in 2000–83.8 percent, followed by Boston (69.1 percent), Baltimore (64.3percent), Los Angeles (56.8 percent), and San Francisco (54.8 percent). Primary heroinadmissions accounted for 43–45 percent of illicit drug admissions in Detroit, New York, andWashington, D.C. In Atlanta, Hawaii, Miami, and, Minneapolis/St. Paul, primary heroinadmissions accounted for less than 9 percent of illicit drug admissions.
EEEExxxxhhhhiiiibbbbiiiitttt 11111111.... PPPPrrrriiiimmmmaaaarrrryyyy HHHHeeeerrrrooooiiiinnnn TTTTrrrreeeeaaaattttmmmmeeeennnntttt AAAAddddmmmmiiiissssssssiiiioooonnnnssss1111 bbbbyyyy CCCCEEEEWWWWGGGG AAAArrrreeeeaaaa aaaannnndddd PPPPeeeerrrrcccceeeennnntttt:::: 2222000000000000 aaaannnndddd FFFFiiiirrrrsssstttt HHHHaaaallllffff ooooffff 2222000000001111
Area 2000 2001 (1H)
Atlanta (metro) 6.6 NRBaltimore 64.3 NRBoston 69.1 71.5Denver (County) 22.2 17.0Detroit (Wayne County) 43.4 46.9Los Angeles (County) 56.8 33.5Miami (Broward County) 2.0 1.0Minneapolis/St. Paul 6.9 7.1Newark 83.8 87.2New Orleans (Parish) 15.3 NRNew York 42.9 42.4Philadelphia 24.1 30.0
(Cont’d)

22
St. Louis 16.4 14.5San Diego 14.6 NRSan Francisco (Bay Area) 54.8 NRSeattle (King County) 29.0 NRWashington, D.C. 44.7 46.6Hawaii 8.5 6.7Illinois 22.8 27.8Texas 17.5 16.3
NR = Not reported1 Excludes both alcohol only and alcohol-in-combination admissions. Where incomplete data exist (as in Miami), the denominatoris all admissions, thereby underrepresenting heroin admissions as a percentage of the caseload of illicit drug admissions.SOURCE: CEWG site reports and treatment admissions forms, and for Los Angeles, the California Drug Data System
The 1999 and 2000 data from 18 CEWG areas show that the proportions of primary heroinadmissions were stable in 5, decreased slightly in 6, and increased slightly in 7. The increasesoccurred in Boston, Los Angeles, Minneapolis/St. Paul, New York City, St. Louis, San Diego,and Washington, D.C.
The upward trend in primary heroin abusers reported in some CEWG areas in recent yearsfollows the national trend shown below for TEDS on primary admissions for opiates (includingmethadone):
TEDS ADMISSIONS(Opiates) 1994 1995 1996 1997 1998 1999All Admissions (%) 13.9 14.5 14.5 15.4 15.4 16.2Excluding Alcohol Only (%) 28.9 29.2 28.8 31.9 32.7 34.9
SOURCE: SAMHSA Treatment Episode Data Set
ADAM Data on Opiates
In the CEWG areas participating in the ADAM program in 2000, adult male arrestees (weightedsample) and female arrestees (unweighted sample) were considerably less likely to test positivefor opiates than for cocaine (exhibits 12). Chicago, by far, had the highest number of femalestested (1,301) and the highest percentage of females testing positive for opiates (40.0 percent).More than one-third (33.8 percent) of female arrestees in Chicago reported use of opiates in thepast 30 days. Nearly one-quarter (24.2 percent) of female arrestees in Detroit tested positive foropiates, as did 19.1 percent of those in New York and 17.4 percent of those in Seattle. Onlysmall percentages of female arrestees tested positive for opiates in most ADAM sites in the Westand Southwest including Houston (3.3 percent), Dallas (4.5 percent), Denver (5.8 percent),Phoenix (6.5 percent), Laredo (6.9 percent), San Diego (7.5 percent), and Los Angeles (7.7percent).
The CEWG areas with the highest percentages of male arrestees testing positive for opiates in2000 were Chicago (27.0 percent), New York (20.5 percent), New Orleans (15.5 percent), andPhiladelphia (11.8 percent) (exhibit 12). In the Southwest and West, the percentages of malestesting opiate-positive were much lower, ranging from 3 percent in Dallas to nearly 10 percent in

23
Laredo. Low percentages were also reported in Ft. Lauderdale (2.1 percent), Atlanta (2.8percent), Minneapolis (3.0 percent), Miami (4.0 percent), and Honolulu (6.8 percent).
EEEExxxxhhhhiiiibbbbiiiitttt 11112222.... PPPPeeeerrrrcccceeeennnnttttaaaaggggeeeessss oooofff AAAAdddduuuulllltttt AAAArrrrrrrreeeesssstttteeeeeeeessss TTTTeeeessssttttiiiinnnngggg OOOOppppiiiiaaaatttteeee----PPPPoooossssiiiittttiiiivvvveeee aaaannnndddd SSSSeeeellllffff----RRRReeeeppppoooorrrrttttiiiinnnngggg OOOOppppiiiiaaaatttteeee UUUUsssseeee bbbbyyyy CCCCEEEEWWWWGGGG AAAArrrreeeeaaaa aaaannnndddd GGGGeeeennnnddddeeeerrrr:::: AAAADDDDAAAAMMMM 2222000000000000
Self-Reported Use–Past 30 DaysCity Male Female
Male FemaleAtlanta 2.8 3.4 1.5 2.8Chicago* 27.0 40.0 33.8Dallas 3.0 4.5 2.8 4.8Denver 3.4 5.8 3.0 5.3Detroit 7.8 24.2 6.7 13.0Ft. Lauderdale 2.1 7.2 0.9 3.1Honolulu 6.8 8.3 6.5 3.8Houston 7.4 3.3 0.8 0.0Laredo 9.9 6.9 8.8 3.3Los Angeles NS 7.7 NS 3.0Miami 4.0 NS 4.2 NSMinneapolis 3.0 5.6 2.4 0.0New Orleans 15.5 8.5 13.7 8.0New York 20.5 19.1 18.3 15.6Philadelphia 11.8 11.1 9.5 7.8Phoenix 6.6 6.5 7.4 6.5San Antonio 10.2 NS 6.9 NSSan Diego 6.0 7.5 5.0 8.8Seattle 9.9 17.4 10.1 4.0
NS = Not sampled*Data on positive tests for males were provided by the Chicago CEWG representative.SOURCE: Arrestee Drug Abuse Monitoring Program, NIJ
Heroin Availability, Price, and Purity
Availability and Source. Heroin was available to varying degrees in all reporting CEWG areas.For example, in Denver, grams and ounces were readily available, especially in the downtownarea, while availability varied around the State in Texas, with higher levels in Houston andLaredo. A steady supply was available in St. Louis.
Mexican black tar heroin was available throughout all western CEWG sites, as well as inChicago and St. Louis in the Midwest. In Western and Midwestern sites, including Chicago,Denver, St. Louis, and Texas, Mexican brown heroin was available. South American heroin wasfound in nearly all areas of the country: Atlanta, Boston, Newark, New York, Washington, D.C.,Chicago, Detroit, New Orleans, and Texas. In Chicago, Detroit, New Orleans, and New York,Southeast Asian heroin was available; Southwest Asian heroin was available in Chicago andNew York. In Detroit, where South American heroin was dominant, varieties from SouthwestAsia and the Middle East were identified in the past year.

24
Atlanta
Chicago
New York
South American heroin remains the most dominant and accessible.
DEA laboratory analyses confirmed that recent heroin exhibits in Chicagocame predominantly from South America and Southwest Asia, but SoutheastAsian and Mexican varieties were also available.
The Street Studies Unit (SSU) reports concern by users on the street that heroinwill be in short supply. In fact, certain areas of the city have already reported ashortage of heroin and other drugs. Bags still sell for $10, and the quality isunchanged, but the bags contain less of the drug. SSU also reports that someaddicts fear anthrax will contaminate their drugs.
Price. Exhibit 13 lists price information reported at the local level. Bag, packet, or “hit” pricesranged from $5–$20, grams from $30–$50 in Seattle to $300–$600 in New Orleans, and ouncesfrom $600–$1,400 in Chicago to $4,000–$9,000 in New Orleans. Bag prices were stable fromthe June reporting period, except in Washington, D.C., where they dropped from $40–$10. Gramprices declined in Denver, Honolulu, and New Orleans, and increased in Phoenix; in Chicago,the range widened. Ounce prices remained relatively stable among reporting areas, except forChicago and New Orleans, where they declined, and Texas, where they increased for Mexicanblack tar heroin. According to a recent survey of methadone clinics in Newark, the median pricefor a bag of heroin fell from $15 to $10 between August and October 2001, suggesting a post-September 11 effect, even though about 21 percent of clients reported difficulty in obtainingheroin since the terrorist attacks.
Among prices for other quantities were $50 for a quarter-gram in Minneapolis, $750 for a quarterounce in Honolulu, and $16,000–$18,000 per pound in Phoenix. In Texas, Dallas tended to havehigher prices than other areas of the State. According to outreach workers in Washington, D.C.,street-level heroin is sold primarily in $8, $10, and $20 bags called “joints” or “billies.” Low-level dealers (“jugglers”) purchase 10 packs (“bundles”) for $75–$90. “Bone heroin,” which isreputedly unaltered and favored by intranasal users in the District, cost $30–$70 per bag withpurity levels of 40–80 percent.
In Boston, heroin (“diesel”) is often packaged in small, folded glassine bags. Heroin comes inaluminum foil, packages of plastic wrap and aluminum foil known as “bindles,” and gel caps inSt. Louis.
Detroit
St. Louis
SanFrancisco
After a steady rise in heroin purity and decline in price per pure milligram fromthe early 1990s until 1999, during 2000 purity declined and price almostdoubled. Nevertheless, purity remains far higher than levels in the 1980s, andprice is relatively much cheaper than it was 10 or more years ago.
Heroin in St. Louis is still among the most expensive in the Nation.
Local samples of heroin were generally Mexican and increased in average priceper milligram pure in 2000.

25
EEEExxxxhhhhiiiibbbbiiiitttt 11113333.... HHHHeeeerrrrooooiiiinnnn PPPPrrrriiiicccceeeessss aaaannnndddd PPPPuuuurrrriiiittttyyyy iiiinnnn 11119999 CCCCEEEEWWWWGGGG AAAArrrreeeeaaaassss
CEWG Area Type/Source Price/CommonStreet-Level Unit Gram Ounce Kilogram
Boston South American $6–$20/bag(60% pure) NR $3,100–$5,000
(60% pure)$75,000–$120,000(60% pure)
NR $10–$20/bag(23% pure)
$60–$275(23% pure) NR NR
Southeast Asian NR NR $1,000–$2,500(23% pure)
$21,000–$36,000(23% pure)
Mexican black tar NR NR $600–$1,400(23% pure) NR
Chicago
Mexican brown NR NR $600–$1,400(23% pure) $17,000–$20,000
Mexican black tar NR $50 (10–65 % pure) $1,300–$2,000(36% pure) NR
DenverMexican brown NR NR $1,300–$2,000
(67% pure) NR
South American $10–$15/packet or hit
Southeast Asian $75–$100/bundle(10 hits) (20% pure)
Detroit
Middle East type unspecified
NR NR NR
Honolulu Mexican black tar $50–$75/paper(1_
4 gram) (67% pure)$150–$200(67% pure)
$2,500–$3,500(67% pure) NR
Los Angeles Mexican black tar NR NR NR
$16,000–$17,000(wholesale);$35,000–$50,000(street value)(25% pure)
Miami NR NR NR NR $60,000–$65,000(70% pure)
Minneapolis/St.Paul NR $10/unit of paper NR $900–$2,000 NR
Newark South American $10–$20/bag(72% pure)
$62–$160(72% pure) NR NR
ColumbianSoutheast AsianNew OrleansMexican
NR $300–$600 $4,000–$9,000 $80,000–$100,000
South AmericanSouthwest AsianNew YorkSoutheast Asian
$10/bag (63% pure,type unspecified) NR NR
$60,000–$80,000$65,000–$90,000$90,000–$100,000
Philadelphia NR $5, $10, $20/bag(73% pure) NR NR NR
Phoenix Mexican black tar
$20/”BB”(80–100 milligrams);$20–$30/paper(0.25 grams)
$70–$100$1,000–$5,0001 “piece,”28 grams
$32,000–$40,000
Mexican black tarSt. Louis
Mexican brown tar
$10/cap; $40/ ”bindle”(15% pure)
$250–$600wholesale,$250 street value(15% pure)
NR NR
Mexican black tar $5/ 1_4 gram $50–$120
(27–31% pure) NR NRSan Diego
Powder $10–$15/1/10 gram (27–31% pure) (42–68% pure) (42–68% pure)
San Francisco Mexican black tar NR (16% pure) NR NR $18,000–$80,000(20–60% pure)
Seattle Mexican black tar NR (22% pure) $30–$50 NR NRMexican black tar* $10–$20/capsule $100–$350 $800–$4,800 $35,000–$50,000Mexican brown $10/capsule $110–$300 $600–$3,000 NR
TexasSouth American NR NR
$2,000(74–89%pure/Dallas)
$75,000–$80,000
Washington,D.C.
South American$10/bag(40–90% pure)
$120–$150(40–90% pure)
NR NR
* Purity in the Dallas area is 7–10 percent per capsule, 10–64 percent per ounce, and 16–20 percent per kilogram.SOURCE: CEWG city reports, December 2001

26
Purity. DMP data on heroin in 2000 show a high average purity level (43.9 percent) in areas eastof the Mississippi River, with the prime source of the drug being South America. Purity levelsare especially high in the northeastern cities covered by DMP and two mid-Atlantic cities, withpurity being highest in Philadelphia (73 percent). In cities west of the Mississippi, the primesource of heroin is Mexico and the average purity level is only 28.6 percent. However, in twocities near the Mexican border, purity levels are relatively high—49.0 percent in San Diego and42.3 percent in Phoenix. Exhibit 14 ranks purity levels reported by DMP in 2000 and 1995.
EEEExxxxhhhhiiiibbbbiiiitttt 11114444.... AAAAvvvveeeerrrraaaaggggeeee HHHHeeeerrrrooooiiiinnnn PPPPuuuurrrriiiittttyyyy PPPPeeeerrrr MMMMiiiilllllllliiiiggggrrrraaaammmm iiiinnnn 11115555 SSSSeeeelllleeeecccctttteeeedddd CCCCEEEEWWWWGGGG CCCCiiiittttiiiieeeessss:::: 1111999999995555VVVVeeeerrrrssssuuuussss 2222000000000000 ((((RRRRaaaannnnkkkkeeeedddd bbbbyyyy 2222000000000000 LLLLeeeevvvveeeellllssss****))))
73
72
63
63
49
47
42
24
23
23
23
20
20
17
13
69
51
50
45
26
28
13
16
7
45
65
62
28
29
28
0 10 20 30 40 50 60 70 80
Philadelphia
Newark
Boston
New York
San Diego
Atlanta
Phoenix
Wash., D.C.
Chicago
Dallas
Los Angeles
Denver
Detroit
Miami
Seattle
2000
1995
* Data for 2000 are preliminary; percentages are rounded.SOURCE: DEA Domestic Monitor Program, Intelligence Division, Domestic Unit
These 5-year purity trends show mostly increases in the Northeast, with the exception of NewYork City, where levels declined, and mixed trends in the other regions, with more decreasesthan increases. The most dramatic change occurred in Philadelphia, with an increase of 28percentage points. The next largest increase occurred in Dallas (16 points); the largest decreases

27
were in San Francisco (19 points) and Seattle (15 points). The following excerpts from CEWGreports exemplify relationships between purity and price:
Atlanta
Los Angeles
Newark
The trend since 1998 of heroin purity increases in conjunction with pricedecreases appears to be shifting. The average level of purity in 2000, asreported by the DEA, was 46.7 percent, down from an overall average of almost70 percent in 1999. Since 1999, when the average price per milligram pure was$0.85, the price has jumped $0.30 to $1.15 per milligram pure.
The DEA’s Domestic Monitor Program findings for 2000 indicated that heroinpurchased in Los Angeles had an average purity of 23 percent and an averageprice of $0.93 per milligram pure. The recent trend toward higher purity, lowercost heroin is not as evident in Los Angeles as it is in other parts of the country.
Between 1999 and 2000, heroin purity increased from 67.5 to 72.2 percent,while its price fell from $0.36 to $0.33 per milligram. The latest DMP datamake Newark PMSA the second highest in purity of heroin after Philadelphiaand the second lowest in price after San Diego among the DAWN cities.
OTHER OPIATES/NARCOTICS
Overview
Although indicators for opiates/narcotics other than heroin are limited, most CEWG membersreport problems with these drugs in their areas. Treatment admissions for primary abuse of anopiate/narcotic other than heroin in 2000 were quite low in the 10 sites that reported specificdata, ranging from a low of 0.3 percent in Washington, D.C., to a high of 2.9 percent in Texas.
These prescription drugs are often available on the street for various prices. Among those mostcommonly reported are hydrocodone and oxycodone, and combinations of the two drugs.However, various other controlled substances classified as opiates or opiate-like substances arebeing abused.
Hydrocodone and Oxycodone
DAWN ED data for the coterminus United States provide one indication of the increasing abuseof drugs containing hydrocodone and oxycodone (exhibit 15). Although mentions of drugscontaining hydrocodone (3 percent) and oxycodone (2 percent) represented only smallpercentages of total DAWN ED mentions reported in 2000, the increases in recent years havebeen significant. From 1999 to 2000, total ED mentions of drugs containing oxycodoneincreased 68 percent (from 6,429 to 10,825), and mentions of drugs containing hydrocodoneincreased 31 percent (from 14,639 to 19,221). Differences between 1999 and 2000 werestatistically significant.

28
EEEExxxxhhhhiiiibbbbiiiitttt 11115555.... NNNNuuuummmmbbbbeeeerrrr ooooffff EEEEDDDD MMMMeeeennnnttttiiiioooonnnnssss ooooffff DDDDrrrruuuuggggssss CCCCoooonnnnttttaaaaiiiinnnniiiinnnngggg HHHHyyyyddddrrrrooooccccooooddddoooonnnneeee aaaannnnddddOOOOxxxxyyyyccccooooddddoooonnnneeee iiiinnnn tttthhhheeee TTTToooottttaaaallll CCCCooootttteeeerrrrmmmmiiiinnnnoooouuuussss UUUUnnnniiiitttteeeedddd SSSSttttaaaatttteeeessss:::: 1111999999996666––––2222000000000000
* Statistically significant at p < 0.05SOURCE: Adapted from DAWN, Office of Applied Studies, SAMHSA
In 2000, the number of ED hydrocodone/combination mentions exceeded 100 in 15 CEWGareas, with mentions being highest in Los Angeles (exhibit 16).
EEEExxxxhhhhiiiibbbbiiiitttt 11116666.... CCCCEEEEWWWWGGGG AAAArrrreeeeaaaassss wwwwiiiitttthhhh tttthhhheeee HHHHiiiigggghhhheeeesssstttt NNNNuuuummmmbbbbeeeerrrr ooooffff EEEEDDDD HHHHyyyyddddrrrrooooccccooooddddoooonnnneeee////CCCCoooommmmbbbbiiiinnnnaaaattttiiiioooonnnnssss MMMMeeeennnnttttiiiioooonnnnssss1111:::: 2222000000000000
CEWG Area Number of Mentions
Los Angeles 459
Detroit 369
Dallas 303
Chicago 281
Phoenix 240
San Diego 238
Boston 196
Seattle 195
St. Louis 173
San Francisco 168
Atlanta 159
New Orleans 145
Denver 128
Minneapolis/St. Paul 122
1 Represents only areas where the number of mentions exceeded 100.SOURCE: Adapted from DAWN, Office of Applied Studies, SAMHSA
0
5,000
10,000
15,000
20,000
25,000
Oxycodone 3,190 4,857 5,211 6,429 10,825
Hydrocodone 10,473 10,705 12,568 14,639 19,221
1996 1997 1998 1999 2000
*
*

29
In eight CEWG areas, the number of ED oxycodone/combinations mentions exceeded 100 in2000. The numbers were highest in Philadelphia (658 mentions), Boston (594), Phoenix (225),and Seattle (167). The numbers of ED mentions of drugs containing oxycodone were similar inBaltimore (132) and Washington, D.C. (136), and in Minneapolis/St. Paul (101) and Atlanta(108).
Reports from the following CEWG areas reflect the problems and concerns about these two drugs:
Atlanta
Baltimore
Boston
Denver
Detroit
Los Angeles
Miami
Ethnographic reports suggest that the use of other opiates is prevalent in themetro Atlanta area. There were 62 OxyContin-related deaths in Georgia in 2000and 45 through June 2001.
Youth offenders indicated that Percocet may be crushed or injected. Theyreported taking hydrocodone with beer to enhance its effects.
Of note is the significant rise in oxycodone in Boston ED data. Mentions ofoxycodone (OxyContin and Percocet) rose from 290 in 1999 to 594 in 2000. TheDepartment of Public Health drug lab also reported a doubling of oxycodonesamples from 1999 (178) to 2000 (374) statewide, with 145 samples confirmedfor Greater Boston alone in 2000.
The DEA reports that diversion of OxyContin is a ‘major problem’ in the RockyMountain West, with a $4 prescription dose selling for as much as $40 on thestreet.
There are increases in certain drugs including hydrocodone (Vicodin, Lortab orLorcet) and oxycodone. (OxyContin) Oxycodone has been increasingly reportedby State law enforcement in arrests: 33 over the first 9 months of 2001, withmore than 400 pills involved and was found in 10 decedents in 2000 in WayneCounty and 10 in the first 9 months of 2001.
ED mentions of narcotic analgesics, such as codeine and hydromorphone, haveincreased approximately 25 percent over the past several years, from 988mentions in 1996 to 1,245 mentions in 2000…According to individuals in locallaw enforcement, diverted pharmaceuticals are posing a tremendous lawenforcement challenge. Numerous Internet chat rooms devoted to the drugOxyContin explain how the drug can be illegally purchased.
There has been a flurry of activity associated with OxyContin lately. Drug saleshave skyrocketed from 300,000 in 1996 to 6 million prescriptions in 2000. In thefirst 6 months of 2001, there were 27 deaths in Broward County and 6 inMiami/Dade County where oxycodone was specifically mentioned as a cause ofdeath. In Miami/Dade there were 58 oxycodone overdose cases treated in 1 ED.

30
NewOrleans
Philadelphia
Phoenix
St. Louis
Seattle
Washington,D.C. high as $40 per tablet or $1 per milligram.
Texas Hydrocodone is a much larger problem in Texas than is oxycodone.
Other opiates represent less than 1 percent of treatment admissions in NewOrleans. Oxycodone (Percodan) is one of the most commonly abused opiates, buthydrocodone remains the drug of choice for opiate abusers in New Orleans.Indicators have remained low over the last 5 years.
Diversion and misuse of oxycodone products, including OxyContin, continue toreceive media attention. There were 23 ME toxicology reports positive foroxycodone in the 3 1_2 years from July 1994 through December 1997 and 128 inthe subsequent 3 1_
2 years from December 97 through June 2001. Hydrocodonementions in deaths have also increased dramatically from 17 from July 1994through December 1997 to 77 in the subsequent 3 1_
2 years.
The Phoenix DEA Diversion Group reports that the most commonly abusedpharmaceutical controlled substances include Vicodin, Lortab, and otherhydrocodone products, and Percocet, OxyContin, and other oxycodone products.
Abuse of oxycodone (Percocet and Percodan) is growing in popularity. The DEAreports that injection of a liquid form of oxycodone has been seen in St. Louis.OxyContin abuse remains a concern for drug treatment and law enforcementpersonnel.
Key informant interviews indicate limited sales of OxyContin among street users,as a single tablet costs $20. This relatively high cost for a single tablet hasresulted in street users seeking less expensive drugs such as benzodiazepines.On the street, OxyContin sells for 10 times its pharmacy price, often running asOn the street, OxyContin sells for 10 times its pharmacy price, often running as
Hydrocodone is a much larger problem in Texas than is oxycodone.
Other opiates mentioned in a few CEWG reports include Soma (carisoprodol) and Dilaudid(hydromorphone), as indicated below.
Chicago
Detroit
Phoenix
The use of hydromorphone (Dilaudid), the pharmaceutical opiate preferred bymany Chicago injection drug users, has diminished considerably since 1987because of decreased street availability. When available, most often of the NorthSide, it typically sells for $10 for 4 milligrams.
There are increases in hydrocodone (Vicodin) and carisoprodol (Soma). Somawas identified in 20 Wayne County decedents in 2000 as well as 25 cases in thefirst 9 months of 2000.
According to the DEA, among the popular prescription drugs in Phoenix arebenzodiazepines and Soma in combination with other analgesic controlledsubstances. Ultram (tramacol) and Nubain continue to be highly abusedprescription-only substances.

31
St. Louis The use of hydromorphone (Dilaudid) remains common among a small group ofWhite chronic addicts.
Codeine
Codeine, an alkaloid found in opium, and used as a cough suppressant and to relieve moderatepain, is reportedly being abused in several CEWG areas. Codeine is frequently used incombination with glutethimide (a Schedule II sedative hypnotic) or carisoprodol (a musclerelaxant). Across the six CEWG areas where codeine abuse was reported, the indicators weremixed. ED mentions declined in one area and increased in another. Medical examiner reports,however, increased in three areas, as indicated in the following excerpts from CEWG reports:
Chicago
Detroit
Abuse of codeine, in both pill (Tylenol 3s and 4s) and syrup form, has beendeclining over the past decade. Codeine ED mentions are declining, while in2000, ME mentions increased slightly for codeine-related deaths. On thestreet, codeine pills are available for $1–$3, and some dealers on the SouthSide specialize in their sale. These pills are used primarily by heroin users tomoderate withdrawal symptoms.
Codeine and its prescription compounds (Schedule III and IV drugs) remainthe most widely abused other opiates; codeine indicators are stable.Toxicology findings from the Wayne County Medical Examiner lab show 126cases of codeine positivity during April–September 2001, compared with 106cases in the April–September 2000 period.
Los Angeles
Phoenix
SanFrancisco
Texas
ED mentions of codeine have been increasing, from 41 in 1998 to 63 in 2000.
The Phoenix DEA Diversion Group reports that codeine products are among themost commonly abused pharmaceutical controlled substances.
Codeine ME mentions in the three-county Bay Area increased somewhat from1997 to 1999.
Abuse of codeine cough syrup continues in Texas. Rap songs such as ‘Sippin onSyrup,’ ‘Sippin Codeine,’ ‘Syrup and Soda,’ and ‘Syrup Sippers,’ refer to the useof this substance.

32
MARIJUANA
Overview
From 1990 to 1998, marijuana indicators increased dramatically across all 21 CEWG areas. In1999, indicators appeared to level off. In 2000, marijuana indicators increased in 12 CEWGareas, remained stable or mixed in 8, and decreased in 1 (Atlanta).
DAWN ED Data on Marijuana
In recent years, increasing numbers of patients treated in hospital EDs for drug-induced or drug-related problems have used marijuana. Total coterminous United States DAWNmarijuana/hashish mentions increased steadily from 15,706 in 1990 to 96,446 in 2000, anincrease of 514 percent. In the 12- to 17-year-old category, marijuana/hashish mentionsincreased (622 percent) from 2,170 to 15,683 between 1990 and 2000.
From 1999 to 2000, marijuana/hashish ED mentions increased significantly in seven CEWGmetropolitan areas: Seattle (75 percent, from 808 to 1,414), Boston (50 percent, from 1,961 to2,945), Miami (38 percent, from 1,285 to 1,770), San Francisco (33 percent, from 470 to 627),Minneapolis/St. Paul (28 percent, from 627 to 803), Denver (20 percent, from 681 to 818), andChicago (18 percent, from 4,561 to 5,401). Marijuana/hashish ED mentions did not decreasesignificantly in any CEWG area during this period.
Exhibit 17 ranks the CEWG areas from highest to lowest by rate of marijuana/hashish mentionsper 100,000 population.

33
SOURCE: Adapted from DAWN, Office of Applied Studies, SAMHSA
Although ED marijuana mentions have been trending up in the total coterminus United StatesDAWN for all major racial/ethnic groups, the only significant increase from 1999 to 2000 wasamong Hispanics: from 9,066 to 11,736, a 29 percent increase.
In 2000, rates per 100,000 population of marijuana/hashish mentions reached the highest levelsin more than 10 years in 8 CEWG areas (exhibit 18).
EEEExxxxhhhhiiiibbbbiiiitttt 11117777.... RRRRaaaatttteeeessss ooooffff MMMMaaaarrrriiiijjjjuuuuaaaannnnaaaa////HHHHaaaasssshhhhiiiisssshhhh EEEEDDDD MMMMeeeennnnttttiiiioooonnnnssss PPPPeeeerrrr 111100000000,,,,000000000000PPPPooooppppuuuullllaaaattttiiiioooonnnn bbbbyyyy CCCCEEEEWWWWGGGG AAAArrrreeeeaaaa:::: 2222000000000000
29
33
38
39
41
49
51
51
64
67
68
72
72
78
86
87
89
91
99
101
Newark
Mpls./St. Paul
San Francisco
San Diego
New York
Dallas
Phoenix
Denver
Washington, DC
Los Angeles
Baltimore
Seattle
St. Louis
Boston
Atlanta
New Orleans
Chicago
Miami
Detroit
Philadelphia
34
EEEExxxxhhhhiiiibbbbiiiitttt 11118888.... CCCCEEEEWWWWGGGG AAAArrrreeeeaaaassss WWWWhhhheeeerrrreeee RRRRaaaatttteeeessss ooooffff MMMMaaaarrrriiiijjjjuuuuaaaannnnaaaa////HHHHaaaasssshhhhiiiisssshhhh EEEEDDDD MMMMeeeennnnttttiiiioooonnnnssss PPPPeeeerrrr111100000000,,,,000000000000 PPPPooooppppuuuullllaaaattttiiiioooonnnn PPPPeeeeaaaakkkkeeeedddd iiiinnnn 2222000000000000:::: 1111999999994444––––2222000000000000
CEWG Area 1994 1995 1996 1997 1998 1999 2000
Chicago 39 51 61 76 85 77 89
Denver 27 33 19 32 37 43 51
Los Angeles 20 21 26 25 41 64 67
Miami 39 53 55 55 59 67 91
Mpls./St. Paul 21 20 23 26 21 26 33
Phoenix 23 24 31 37 36 50 51
St. Louis 40 37 40 47 56 68 72
San Francisco 31 33 27 25 25 29 38
SOURCE: Adapted from DAWN, Office of Applied Studies, SAMHSA
In seven other CEWG areas, ED marijuana/hashish rates peaked in 1998 or 1999, and in most,have remained at peak levels (exhibit 19).
EEEExxxxhhhhiiiibbbbiiiitttt 11119999.... CCCCEEEEWWWWGGGG AAAArrrreeeeaaaassss WWWWhhhheeeerrrreeee RRRRaaaatttteeeessss ooooffff MMMMaaaarrrriiiijjjjuuuuaaaannnnaaaa////HHHHaaaasssshhhhiiiisssshhhh EEEEDDDD MMMMeeeennnnttttiiiioooonnnnssss PPPPeeeerrrr111100000000,,,,000000000000 PPPPooooppppuuuullllaaaattttiiiioooonnnn PPPPeeeeaaaakkkkeeeedddd iiiinnnn 1111999999998888 oooorrrr 1111999999999999 aaaannnndddd RRRRaaaatttteeeessss iiiinnnn 2222000000000000
CEWG Area Peak Year Rate in Peak Year Rate in 2000
Atlanta 1998 96 86
Baltimore 1999 72 68
Boston 1998 79 78
Dallas 1998 62 49
Detroit 1998 102 99
Philadelphia 1999 114 101
San Diego 1998 47 39
SOURCE: Adapted from DAWN, Office of Applied Studies, SAMHSA
ED marijuana rates peaked earlier in New Orleans (113 in 1997), Newark (43 in 1995), Seattle(87 in 1997), and Washington, D.C. (74 in 1994).
Treatment Data on Marijuana Admissions
Available data on admissions to drug treatment facilities for primary abuse of marijuana in 17local CEWG areas and 3 States are presented in exhibit 20. Excluding alcohol, primarymarijuana admissions were highest in 2000 in Minneapolis/St. Paul (49.4 percent) followed byMiami (Broward County) and New Orleans Parish (each at around 37.0 percent), and St. Louisand Seattle (approximately 31–32 percent each).
In Philadelphia, San Diego County, and Seattle (King County), primary marijuana abusersaccounted for approximately 20–27 percent of illicit drug admissions in 2000. In Boston, LosAngeles County, Newark, San Francisco, and Washington, D.C., this group represented onlybetween approximately 6 to 10 percent of the admissions shown in exhibit 20.

35
EEEExxxxhhhhiiiibbbbiiiitttt 22220000.... PPPPrrrriiiimmmmaaaarrrryyyy MMMMaaaarrrriiiijjjjuuuuaaaannnnaaaa TTTTrrrreeeeaaaattttmmmmeeeennnntttt AAAAddddmmmmiiiissssssssiiiioooonnnnssss 1111 bbbbyyyy CCCCEEEEWWWWGGGG AAAArrrreeeeaaaa aaaannnnddddPPPPeeeerrrrcccceeeennnntttt:::: 2222000000000000 aaaannnndddd FFFFiiiirrrrsssstttt HHHHaaaallllffff ooooffff 2222000000001111
Area 2000 2001 (1H)Atlanta (metro) 19.4 NRBaltimore 19.0 NRBoston 8.2 7.5Denver (County) 16.5 17.6Detroit (Wayne County) 9.2 10.4Los Angeles (County) 8.8 11.5Miami (Broward County) 37.0 39.0Mpls./St. Paul 49.4 52.7Newark 6.0 4.5New Orleans (Parish) 36.9 NRNew York 24.1 25.4Philadelphia 21.7 17.4St. Louis 32.3 33.2San Diego 20.5 NRSan Francisco (Bay Area) 5.9 NRSeattle (King County) 31.0 NRWashington, D.C. 10.2 8.2Hawaii 27.8 29.2Illinois 25.8 27.8Texas 25.5 26.6
NR = Not reported1 Excludes both “alcohol only” and “alcohol-in-combination” admissions. Where incomplete data exist (as in Miami), thedenominator is all admissions, thereby underrepresenting marijuana admissions as a percentage of primary illicit drug abusers.SOURCE: CEWG site reports and treatment admissions forms, and for Los Angeles, the California Drug Data System
Comparisons of 1999 and 2000 data available from 16 CEWG areas show that the proportion ofprimary marijuana treatment admissions remained relatively unchanged in six, decreased a fewpercentage points in four, and increased in six. In Hawaii, the increase was the highest reportedfor marijuana in 10 years. San Diego reported a substantial increase of 15 percent during this1-year period.
TEDS ADMISSIONS(Marijuana) 1994 1995 1996 1997 1998 1999All admissions (%) 8.7 10.5 12.0 13.0 13.5 14.1Excluding Alcohol only (%) 18.1 21.2 23.9 27.0 28.6 30.4
SOURCE: SAMHSA Treatment Episode Data Set
ADAM Data on Marijuana
According to ADAM data for 2000, Minneapolis had the highest percentages of males andfemales testing positive for marijuana use. In the Minneapolis adult male arrestee sample, 54.2percent tested positive for marijuana; 44.4 percent of the female sample tested positive formarijuana (exhibit 21). More than one-half (53.4 percent) of males and slightly more than one-third (34.8 percent) of females in Minneapolis reported using marijuana in the past 30 days.Other CEWG areas with high percentages of ADAM males testing positive for marijuana were

36
Detroit (49.8 percent), Philadelphia (49.4 percent), New Orleans (46.6 percent), Chicago (45.0percent), Ft. Lauderdale (43.3 percent), Denver (40.9 percent), San Antonio (40.7 percent), andNew York (40.6 percent).
In addition to Minneapolis, the percentages of females testing marijuana-positive were high inSeattle (47.8 percent) and Denver (33.8 percent). The areas with the smallest percentages ofadult females testing marijuana-positive were in Laredo (17.2 percent), Honolulu (19.4 percent),and Dallas (20.9 percent).
EEEExxxxhhhhiiiibbbbiiiitttt 22221111.... PPPPeeeerrrrcccceeeennnnttttaaaaggggeeeessss ooooffff AAAAdddduuuulllltttt AAAArrrrrrrreeeesssstttteeeeeeeessss TTTTeeeessssttttiiiinnnngggg MMMMaaaarrrriiiijjjjuuuuaaaannnnaaaa----PPPPoooossssiiiittttiiiivvvveeee aaaannnnddddRRRReeeeppppoooorrrrttttiiiinnnngggg MMMMaaaarrrriiiijjjjuuuuaaaannnnaaaa UUUUsssseeee bbbbyyyy CCCCEEEEWWWWGGGG AAAArrrreeeeaaaa aaaannnndddd GGGGeeeennnnddddeeeerrrr:::: AAAADDDDAAAAMMMM 2222000000000000
Tested Marijuana-Positive Self-Reported Use—Past 30 DaysCEWG AreaMale Female Male Female
Atlanta 38.2 26.3 36.2 27.3Chicago* 45.0 26.4 30.3Dallas 35.8 20.9 39.6 22.2Denver 40.9 33.8 47.0 52.0Detroit 49.8 24.2 49.0 33.3Ft. Lauderdale 43.3 28.2 38.5 30.4Honolulu 30.4 19.4 39.8 32.9Houston 35.8 26.7 35.1 39.0Laredo 28.6 17.2 29.1 16.4Los Angeles NS 31.5 NS 27.1Miami 38.5 NS 35.3 NSMinneapolis 54.2 44.4 53.4 34.8New Orleans 46.6 28.0 49.0 32.3New York 40.6 28.2 49.4 33.4Philadelphia 49.4 22.2 50.1 31.3Phoenix/Mesa 33.7 23.3 38.7 32.1San Antonio 40.7 NS 34.9 NSSan Diego 38.7 27.2 41.5 36.1Seattle 37.7 47.8 48.0 52.0
NS = Not sampled* Data on positive tests for males was provided by the Chicago CEWG representative.SOURCE: Arrestee Drug Abuse Monitoring Program, NIJ
Based on self-reports of past-30-day drug use, it appears that male and female arrestees weremore likely to admit marijuana use than use of other drugs such as cocaine, heroin, andmethamphetamine. In many CEWG areas, the percentages of arrestees admitting to past-30-daymarijuana use exceeded the percentages testing positive for the drug.
Marijuana Availability, Price, and Purity
Availability. Marijuana was described as widely available or in steady supply in Chicago, LosAngeles, Minneapolis/St. Paul, Phoenix, San Diego, Texas, and Washington, D.C. The drug wasreportedly popular in New York City, where availability continued to increase, and inPhiladelphia, where it appeared to be increasing.
37
Mexican marijuana is available in Atlanta, Boston, Michigan, St. Louis, Denver, and LosAngeles. Canadian marijuana has been reported in Atlanta and in Denver, where the seedless andpotent “BC bud” from British Columbia remains available. The U.S. Southwest is also a sourcefor Washington, D.C., and Boston, which receives a supply from Jamaica and Colombia as well.Locally grown marijuana is available in Atlanta, Boston, Los Angeles, St. Louis, Texas, andWashington, D.C. Excerpts from the following CEWG reports reflect these patterns.
Boston
Detroit
Los Angeles
Texas
Some locally grown marijuana continues to be available, but most marijuanaseems to be shipped overland or via delivery services from Mexico and the U.S.Southwest, as well as from Jamaica and Colombia.
The majority of marijuana seized in Michigan originated in Mexico.
Law enforcement officials report that Canadian ‘BC bud,’ formerly limited tothe Pacific Northwest, is now available in Honolulu, Los Angeles, and Oakland,as well as in some parts of the West Central region of the United States.
Supplies of homegrown marijuana are expected to be more plentiful due to heavyrainfall.
Price. As shown in exhibit 22, marijuana prices ranged from $70–$100 per once for anunspecified type in San Diego to $700–$800 per once for organic (“purple haze”) andhydroponic (“hydro”) in New York City. Pounds cost as little as $180–$200 for commercialgrade in Laredo, and as much as $6,000–$9,000 for an unspecified type in Honolulu. Prices wererelatively stable compared with the June 2001 reporting period, except in Atlanta (where theydecreased for pounds of domestic marijuana); Denver (where they increased for ounces ofdomestic marijuana and “BC bud,” decreased for pounds of the same varieties, and the rangebroadened for pounds of Mexican); Los Angeles (where they decreased for pounds of Mexican);and Texas (where they decreased for pounds of commercial marijuana in Dallas and Houston).
Prices for other retail quantities included $5, $10, and $20 bags in Chicago; $5–$20 per cigaretteor joint, $25 per gram, and $100–$200 per quarter-ounce in Honolulu; $3–$5 per joint, up to $10per joint dipped in formaldehyde or PCP, and $50 per quarter-ounce in Minneapolis/St. Paul;$5–$10 per bag both before and after September 11, 2001, in Newark; and $10–$50 per bag, $10per “hydro” joint, and $15 per cigar or “blunt” in New York City. Also in New York, “hydro”was being sold together with a pellet of dark brown marijuana—known on the street as “beef andbroccoli”—for $20 per bag; in addition, marijuana was dipped in water used to cook crack,creating a mixture called “elo,” which cost $10 per bag. Prices in other cities included $5 perone-half- to 1-gram bag in San Diego; $15–$25 per gram of sinsemilla (“bud”), $40–$50 pereighth-ounce, and $1,200–$1,400 per quarter-pound in Seattle; and $10–$20 per “dime bag” ofkind bud and hydro, $5–$10 per bag of commercial grade, and $10–$20 per commercial gradeblunt in Washington, D.C.

38
EEEExxxxhhhhiiiibbbbiiiitttt 22222222.... MMMMaaaarrrriiiijjjjuuuuaaaannnnaaaa PPPPrrrriiiicccceeeessss aaaannnndddd PPPPooootttteeeennnnccccyyyy iiiinnnn 11115555 CCCCEEEEWWWWGGGG CCCCiiiittttiiiieeeessss aaaannnndddd 3333 TTTTeeeexxxxaaaassss SSSSiiiitttteeeessss
Price/UnitCEWG Area Type/Quality
Ounce PoundDomestic (9.5%) NR $930AtlantaMexican, Canadian Type unspecifiedCommercial $200–$250 $800–$1,500BostonSinsemilla $200–$300 $2,500–$3,000
Chicago Type unspecified $100–$200 $900–$4,000British Columbian (“BC bud,” “triple A”) $600 $3,000–$5,000Domestic $200–$400 $1,000–$1,500
Denver
Mexican NR $500–$1,000Low quality $300–$500 NRHigh quality $400–$800 NR
Honolulu
Type unspecified NR $6,000–$9,000Wholesale NR $350Los AngelesStreet value NR $2,500
Mpls./St. Paul NR $150–$175 $700–$3,000Type unspecified $125–$180 $750–$1,000New OrleansSinsemilla $350–$450 $2,500–$4,000Organic (“purple haze”) and hydroponic(“hydro”)
$700–$800 NR
Wholesale NR $200–$1,700
New York City
High-quality commercial NR $1,000–$5,000Phoenix NR $75–$150 $500–$750
Sinsemilla (20% THC) NR $500–$1,200St. LouisImported NR $2,000–$4,000Unspecified (2–3% THC) $70–$100 NRSan DiegoBritish Columbian (“BC bud”) (<30%THC)
NR $4,000
San Francisco Type unspecified (3–20% THC) NR $2,500Seattle Locally grown $325–$400 $4,200–$5,200
Dallas: commercial grade NR $300–$800Dallas/Ft. Worth: indoor-grown sinsemilla NR $750–$1,200Houston: commercial grade NR $350–$500
Texas
Laredo: commercial grade NR $180–$200Commercial grade $100 $700–$1,400Washington, D.C.Hydroponic (“hydro”) or “kind bud” $480 $1,200–$6,000
SOURCE: CEWG city reports, December 2001
Purity. Marijuana purity, which refers to the drug’s proportion of tetrahydrocannabinol (THC),ranged from 2–3 percent for an unspecified type to 30 percent or less for BC bud in San Diego.Other purities reported in CEWG areas were 3–20 percent (unspecified type) in San Francisco,4–6 percent for Mexican and 25–30 percent for domestic hydroponic in Los Angeles, 9.5 percentfor domestic in Atlanta, and 20 percent for sinsemilla (a potent form of marijuana fromunpollinated female plants) in St. Louis.
The following excerpts on availability, potency, and price of marijuana from three CEWG papersare of interest:
Denver Almost all ethnographic reports indicate availability of very potent marijuana.One drug treatment program in the metro area said that some clients aregetting ‘marijuana cravings’ because of the increased potency.
39
Los Angeles
New York
Mexican marijuana is generally the most inexpensive type found in the LosAngeles area because of its wide availability and lower THC content (4–6percent). Domestically produced marijuana—particularly hydroponic—is of ahigher grade (25–30 percent) and more expensive. The street value of the seizedmarijuana in the first half of 2001 constituted 46 percent of the total streetvalue of all drugs seized.
Many sellers with low-grade marijuana mix it with other substances to enhanceor expand it. With many new users, especially youth, it is easy to sell low-gradeadulterated marijuana as ‘good stuff.’
Methamphetamine use indicators increased in six (Denver, Honolulu, Los Angeles, Phoenix, SanDiego, and Seattle) of the seven CEWG areas that typically have relatively high rates of EDmethamphetamine mentions and/or high percentages of primary methamphetamine treatmentadmissions. The seventh, San Francisco, was the only area reporting a decrease inmethamphetamine indicators in 2000–2001. Increases in methamphetamine indicators were alsoreported in Atlanta, Minneapolis/St. Paul, St. Louis, and cities in Texas. Chicago, Detroit, NewYork, Philadelphia, and Washington, D.C., reported increases in methamphetamine availabilityand use, but still at low levels.
Following are excerpts from CEWG reports from the six areas that have had high levels ofserious problems with methamphetamine and, in 2000, reported increases in the indicators.
Denver
Honolulu
Los Angeles
Methamphetamine indicators, which increased from 1993 through 1997, mostlydeclined in 1998 and 1999, but seem to have started climbing again in 2000and 2001. Methamphetamine treatment admissions have fluctuated over thepast 6 1_
2 years. However, in the first half of 2001, they constituted 14.8 percentof State admissions, the highest proportion since 1997. The DEA describeswidespread methamphetamine availability.
Crystal methamphetamine has increased its impact on the State. Treatmentadmissions, deaths, Honolulu police cases, and neighbor island police casesare all up. Prices of ‘ice’ are down, supply is high and the societal costs, interms of violence and disruption of families and communities have continued.
Methamphetamine indicators are mixed. ED mentions remained relatively lowand stable, but primary treatment admissions increased by approximately 25percent. The Los Angeles High Intensity Drug Trafficking (HIDTA) group andthe DEA Los Angeles Division note a developing but currently limited market

40
Phoenix
San Diego
Seattle
for methamphetamine tablets (known as ‘yaba’) at raves and nightclubs in thearea. In some cases, the tablets are sold as MDMA; in others, the tablets aretaken in addition to MDMA.
The data projected a modest increase of 12 percent for methamphetamine-related deaths for 2001. Currently, the drugs of greatest concern in Arizona aremethamphetamine, MDMA, and other club drugs.
Accidental overdose deaths involving methamphetamine increased 65 percentfrom 1999 to 2000, when 61 decedents were positive for methamphetamine.Methamphetamine accounted for 33 percent of all treatment admissions in2000.
Methamphetamine use is continuing to rise, though at a lower rate than in otherareas of the State. DAWN ED mentions for amphetamine and methamphetaminein Seattle/King County during 2000 continued the upward trend first noted in1999. Ease of access to precursors; the availability of equipment, recipes andlocations; and the purity of methamphetamine produced by local clandestinelabs contribute to their proliferation.
Of the seven CEWG areas that have recently had high levels of methamphetamine use, SanFrancisco is the only area to report a decrease in methamphetamine indicators in 2000–01 asindicated below:
Methamphetamine indicators suggest a decline in prevalence. In SanFrancisco, the number of patients in treatment for primary speed problems inFY 2000 was 1,004. This count was down by about 9 percent from FY 1998 andFY 1999, 2 years that constituted a peak after a sharp rise from FY 1992. In thethree-county Bay Area, ME mentions of methamphetamine/speed rose from 44in 1996 to 58 in 1999. The number of ME mentions in FY 2000 was down byabout 65 percent to 14.
There is growing concern that methamphetamine abuse could spread to CEWG areas whereabuse of the drug has not been widespread. Representatives from the following four CEWGareas are beginning to obtain data about methamphetamine abuse from different sources:
Chicago Methamphetamine indicators suggest continuing low levels of use in Chicago.Nevertheless, a low but stable prevalence of methamphetamine use has beennoted in some areas of the city in the past 2 years. Stimulants represented 2percent of all State treatment admissions (excluding alcohol) in FY 2000, upfrom 1 percent in FY 1999. Total stimulant admissions increased from 913 inFY 1999 to 1,270 in FY 2000. In just the first half of 2001, stimulant admissionsare at 1,701.

41
Minneapolis
St. Louis
Texas
Methamphetamine indicators continued strong upward trends in 2001, exceptfor deaths in Ramsey County, which declined. Methamphetamine addictsaccounted for 0.3 percent of treatment admissions in 1991, 3 percent in 2000,and 3.6 percent in the first half of 2001. Hennepin County reported fiveamphetamine/methamphetamine-related deaths in the first 6 months of 2001,compared with six in 2000 and two in 1999. Methamphetamine seizuresincreased overall from 1999 to 2000.
St. Louis and St. Charles County law enforcement personnel are increasinglyconcerned about methamphetamine use, and methamphetamine labs in ruralareas continue to be a problem. Methamphetamine was found at very low levelsin city indicators in 1995, but has increased significantly in the last 4 years. Inrural areas, methamphetamine appears regularly in the treatment data, whilethere are a limited number of admissions in St. Louis. In rural treatmentprograms, methamphetamine is the drug of choice after alcohol.
Methamphetamine and amphetamine are widely available, particularly in therural areas. Poison control center cases, ED cases, overdose deaths, andtreatment admissions are rising, but levels in Texas are much lower than inother western States. ‘Uppers’ were the third most frequently used illicit drugamong high school students in Texas after marijuana and cocaine.
DAWN ED Data on Methamphetamine
In 2000, methamphetamine/speed was mentioned in only 2 percent of drug-related episodesreported by DAWN across the coterminous United States. Most ED mentions (81 percent) werereported in five metropolitan areas: Los Angeles (1,375), San Diego (747), Phoenix (600), SanFrancisco (591), and Seattle (540). From 1999 to 2000, methamphetamine/speed ED mentionsincreased significantly in Phoenix (76 percent, from 341 to 600), Seattle (53 percent, from 353 to540), Los Angeles (51 percent, from 910 to 1,375), Dallas (35 percent, from 100 to 135), Atlanta(31 percent, from 83 to 109), and San Diego (28 percent, from 584 to 747).
After peaking in 1994 in Los Angeles (17), Phoenix (42), and San Francisco (82), rates ofmethamphetamine/speed ED rates per 100,000 population decreased to lower levels insucceeding years, as shown in exhibit 23. However, in 2000, the Los Angeles rate increased to16 per 100,000 population. In Denver, after increasing in 1997 from 7 to 19, the rate ofmethamphetamine/speed mentions decreased to 8 in 1998 and remained low in 1999 and 2000.In San Diego in 1999, the rate of ED methamphetamine/speed mentions decreased to the lowestlevel since 1994 (24), only to increase again in 2000 (to 31). The rate in Seattle reached itshighest level in 2000 (27) after fluctuating between 16 and 25 from 1994 to 1999.

42
In the prior 7 years, ED rates remained relatively stable at low levels in other CEWG areas. From1999 to 2000 in St. Louis, the methamphetamine/speed rate per 100,000 population increasedfrom 4 to 7.
Between 1999 and 2000, total coterminous United States DAWN methamphetamine/speedmentions increased 39 percent from 6,054 to 8,389 among males, but remained stable amongfemales from 4,312 to 4,841.
Treatment Data on Methamphetamine Admissions
Admissions to treatment for primary abuse of methamphetamine are low in most CEWG areasand tend to be reported in the “stimulants” or “amphetamines” categories. The number ofprimary admissions in these combined categories was typically very small in 2000 (3–13) in 4sites, but were highest in Atlanta (102), Seattle (830), San Francisco (4,615), and the State ofHawaii (2,419). The numbers of primary stimulant admissions by site are shown in Appendix D.
Of the six sites that reported primary methamphetamine admissions separately, these admissions(excluding alcohol) accounted for 0.3 percent of admissions in Washington, D.C., 0.5 percent inPhiladelphia, and 5.9 percent in Denver County. On the West Coast where abuse of this drug hasbeen high for many years, primary methamphetamine abusers accounted for 10.2 percent ofadmissions in Los Angeles, 46.6 percent in Hawaii, and 45.0 percent in San Diego.
0
20
40
60
80
100
Denver 10 12 7 19 8 6 7
Los Angeles 17 16 15 15 9 11 16
Phoenix 42 39 36 40 22 17 29
San Diego 40 30 29 41 30 24 31
San Francisco 82 72 60 64 39 34 36
Seattle 16 14 10 25 14 18 27
1994 1995 1996 1997 1998 1999 2000
EEEExxxxhhhhiiiibbbbiiiitttt 22223333.... RRRRaaaatttteeeessss ooooffff MMMMeeeetttthhhhaaaammmmpppphhhheeeettttaaaammmmiiiinnnneeee////SSSSppppeeeeeeeedddd EEEEDDDD MMMMeeeennnnttttiiioooonnnnssss PPPPeeeerrrr 111100000000,,,,000000000000PPPPooooppppuuuullllaaaattttiiiioooonnnn iiiinnnn SSSSeeeelllleeeecccctttteeeedddd CCCCEEEEWWWWGGGG AAAArrrreeeeaaaassss:::: 1111999999994444–2222000000000000
SOURCE: Adapted from DAWN, Office of Applied Studies, SAMHSA

43
ADAM Data on Methamphetamine
The ADAM CEWG cities with the highest percentages of adult male arrestees testing positivefor methamphetamine were Honolulu (35.9 percent), San Diego (26.3 percent), and Phoenix(19.1 percent) (exhibit 24a). Relatively high percentages of the unweighted adult female samplealso tested methamphetamine-positive in these same cities: Honolulu (47.2 percent), San Diego(28.7 percent), and Phoenix (24.1 percent). A high percentage of adult females also testedpositive in Seattle (21.7 percent), but the sample included only 36 women. Among adult femalestesting methamphetamine-positive in San Diego, 39.7 percent were White, 32.8 percent wereHispanic, and 23.7 percent were African-American. Proportionately, Hispanic females were themost likely to test methamphetamine-positive (35.0 percent), followed by White females (30.2percent). Only 8.4 percent of the African-American female arrestees tested positive formethamphetamine.
EEEExxxxhhhhiiiibbbbiiiitttt 22224444aaaa.... PPPPeeeerrrrcccceeeennnnttttaaaaggggeeeessss ooooffff AAAAdddduuuulllltttt AAAArrrrrrrreeeesssstttteeeeeeeessss TTTTeeeessssttttiiiinnnngggg PPPPoooossssiiiittttiiiivvvveeee ffffoooorrrr MMMMeeeetttthhhhaaaammmm----pppphhhheeeettttaaaammmmiiiinnnneeee iiiinnnn NNNNiiiinnnneeee CCCCEEEEWWWWGGGG AAAArrrreeeeaaaassss aaaannnndddd bbbbyyyy GGGGeeeennnnddddeeeerrrr:::: AAAADDDDAAAAMMMM 2222000000000000
City Males Females
Dallas 2.1 3.0Denver 2.6 5.3Honolulu 35.9 47.2Houston 0.5 1.7Phoenix 19.1 24.1San Antonio 0.2 NSSan Diego 26.3 28.7Seattle 9.2 21.7Los Angeles NS 12.3
NS = Not sampledSOURCE: Arrestee Drug Abuse Monitoring Program, NIJ
The percentages of juvenile arrestees testing positive for methamphetamine in San Diego wererelatively small—3.1 percent for males and 3.4 percent for females (exhibit 24b). Percentageswere higher in Phoenix (12.8 percent males and 10.5 percent females), Denver (11.2 percentmales and 11.5 percent females), Los Angeles (8.5 percent males), and San Antonio (4.7 percentfemales).

44
EEEExxxxhhhhiiiibbbbiiiitttt 22224444bbbb.... PPPPeeeerrrrcccceeeennnnttttaaaaggggeeeessss ooooffff JJJJuuuuvvvveeeennnniiiilllleeee DDDDeeeettttaaaaiiiinnnneeeeeeeessss TTTTeeeessssttttiiiinnnngggg MMMMeeeetttthhhhaaaammmmpppphhhheeeettttaaaammmmiiiinnnneeee----PPPPoooossssiiiittttiiiivvvveeee BBBByyyy CCCCEEEEWWWWGGGG AAAArrrreeeeaaaa,,,, GGGGeeeennnnddddeeeerrrr,,,, aaaannnndddd RRRRaaaacccceeee////EEEEtttthhhhnnnniiiicccciiiittttyyyy:::: AAAADDDDAAAAMMMM 2222000000000000
Total SampleCity/Gender
(Number) PercentBlack White Hispanic
Male (197) 11.2 3.0 10.0 17.0Denver
Female (26) 11.5 NS NS 37.5Male (293) 8.5 1.0 3.0 15.0
Los AngelesFemale (47) 2.1 NS NS 4.5Male (421) 12.8 6.0 9.0 19.0
PhoenixFemale (114) 10.5 7.0 14.0 9.0Male (256) 3.1 4.0 4.0 3.0
San AntonioFemale (86) 4.7 NS 11.0 4.0Male (256) 3.1 4.0 4.0 3.0
San DiegoFemale (58) 3.4 NS 10.0 0.0
NS = Not sampledSOURCE: Arrestee Drug Abuse Monitoring Program, NIJ
Methamphetamine Availability, Price, and Purity
Availability. Widespread or steady availability of methamphetamine was reported in Denver,Honolulu, Phoenix, San Diego, and Texas. Methamphetamine was reportedly available inBoston, Detroit, Los Angeles, Minneapolis/St. Paul, New York City, Phoenix, St. Louis, and SanDiego. Availability of methamphetamine increased in Atlanta, Detroit, Seattle, and Washington,D.C. Decreasing prevalence was reported in Chicago and San Francisco, and the drug wasdifficult to obtain in Philadelphia. Methamphetamine was rarely reported in Baltimore andNewark, and was not mentioned in CEWG reports from Miami or New Orleans.
Among CEWG areas reporting source data, methamphetamine typically came from Mexico orwas manufactured in clandestine domestic labs. Mexican methamphetamine was available inAtlanta, Denver, Honolulu, and Los Angeles. According to the National Drug IntelligenceCenter, Los Angeles, along with central Arizona and San Diego, functioned as transportationhubs for Mexican methamphetamine. Most of the methamphetamine in Boston was shipped fromCalifornia. In Washington State, where most of the methamphetamine was transported fromOregon, California, and Mexico, local labs continued to proliferate. Labs in rural areas remaineda problem in St. Louis and Texas, where the drug was distributed and used mostly in rural areas.
The following excerpts provide additional details on the patterns in three CEWG areas:
Atlanta In Atlanta, many law enforcement agencies directly link the continued rise ofmethamphetamine availability with a rise in the presence of migrant Hispanicworkers. They also partially link the price of methamphetamine to the size of thelocal Mexican population.

45
Los Angeles
Seattle
California has been referred to as a ‘source country’ for methamphetamine.
It is estimated that 65–75 percent of the methamphetamine in Washington Stateis transported from Oregon, California, and Mexico. However, ease of access toprecursors; the availability of equipment, recipes, and locations; and the purityof methamphetamine produced by local clandestine labs contribute to theircontinuing proliferation.
Price. Methamphetamine prices ranged from $20–$60 in Seattle to $100–$200 in Honolulu forgrams, from $300–$600 in Phoenix to $2,200–$3,000 in Honolulu for ounces, and from$3,500–$10,000 in San Francisco to $12,000–$16,000 in New Orleans for pounds (exhibit 25).In Los Angeles, a pound of methamphetamine that cost $4,000–$5,000 wholesale was worth$35,000–$50,000 on the street. Prices were relatively stable compared with the June 2001reporting period, except for increases in Denver for grams and ounces, in Phoenix for pounds,and in Washington, D.C., for grams; and decreases in Honolulu for grams and ounces and inHouston for pounds. In Oahu, “clear” methamphetamine (a cleaner, white form) cost more than“wash” (a brownish, less processed form): $50 (wash) or $75 (clear) per 0.25 gram, and $100(wash) or $200 (clear) per gram. Prices for other quantities included $125 per quarter-ounce and$2,200 per quarter-pound in Phoenix; $10 per 1/10 gram, $30 per quarter-gram, and $100–$125per eightball (3.5 grams) in San Diego; and $60 per quarter-gram and $600 per eightball inWashington, D.C.
EEEExxxxhhhhiiiibbbbiiiitttt 22225555.... MMMMeeeetttthhhhaaaammmmpppphhhheeeettttaaaammmmiiiinnnneeee PPPPrrrriiiicccceeee aaaannnndddd PPPPuuuurrrriiiittttyyyy iiiinnnn 11113333 CCCCEEEEWWWWGGGG CCCCiiiittttiiiieeeessss aaaannnndddd 3333TTTTeeeexxxxaaaassss SSSSiiiitttteeeessss
PriceArea Purity (%)Gram Ounce Pound
Atlanta 11 (Mexican) $100 $1,500 $8,000–$20,000Boston NR $70–$200 $800–$1,900 $8,000–$24,000Denver 10–20 (Mexican) $90–$100 $750–$1,200 NRHonolulu 90–100 (“KC”) $100–$200 $2,200–$3,000 $30,000
Los Angeles 15–20 NR NR
$4,000–$5,000(wholesale)$35,000–$50,000(street value)
Minneapolis/St.Paul
variable $90–$100 $600–$900 $10,000–$12,000
New Orleans NR $100–$150 $900–$1,500 $12,000–$16,000
Phoenix20–40 (Mexican)90–95 (“ice” or“glass”)
$48–$55typeunspecified
$300–$600type unspecified $3,500–$12,000*
St. Louis 70–80 (local)30 (Mexican) $37–$100 $700–$1,300 NR
San Diego 30–40 NR NR NRSan Francisco NR NR $500–$1,000 $3,500–$10,000Seattle NR $20–$60 $350–$650 $4,250–$6,000
(Cont’d)

46
TexasHouston NR NR $500–$800 $6,000–$8,000Laredo NR NR NR $4,500North Texas NR (domestic)
NR (Mexican)$70–$100NR
$400–$1,000NR
$5,000–$10,000$5,800–$9,000
Washington, D.C. NR $100 $2,700 NR
* “Glass” methamphetamineSOURCE: CEWG city reports, December 2001
Purity. In Phoenix, methamphetamine was generally packaged in clear plastic wrap, zip-lockplastic bags, or layers of plastic wrap. Pounds were wrapped in vacuum-sealed cellophane. Thepackages, which were about 8–10 inches long, were shaped like sausages. Levels ranged from10–20 percent for Mexican methamphetamine in Denver to 90–100 percent for crystalmethamphetamine (“ice”) in Honolulu. Ice was also available in Phoenix, with 90–95 percentpurity, as was the crude, brownish, Mexican form with purity of 20–40 percent. Reported puritylevels were relatively stable, except for an increase in Phoenix for the Mexican variety.
Three CEWG representatives provided in-depth information on purity:
Honolulu
Minneapolis
Washington,D.C.
‘Ice’ (crystal methamphetamine) continues to dominate the Hawaiian drugmarket. Prices have decreased throughout the reporting period, indicating thatmore ice is available on the street. Analysis of confiscated methamphetaminecontinues to reveal that the product is still in the 90–100 percent purity range.
Purity levels, while generally higher than in years past, were still quitevariable, making the use of the drug even more unpredictable. Dimethylsulfone(DMSO), the most common cutting agent, is a fluffy, white substance used totreat arthritis in horses.
During summer 2001, ethnographic reports in the District describedmethamphetamine as being of low quality; one informant said that the drug hadbecome as dirty as the Hudson River. Dealers were reportedly cutting the drugwith Epsom salts to simulate the burning sensation of high-qualitymethamphetamine. However, by fall, high-quality methamphetamine was againavailable on the streets in the popular forms known as ‘glass’ and ‘hydro.’
3,4-Methylenedioxymethamphetamine (MDMA)
Overview
Indicators for MDMA (often referred to as “ecstasy”) increased in 16 CEWG areas, andremained stable in 5. MDMA is the most frequently reported “club drug” in most CEWG areas.Use of MDMA continues to spread beyond raves and nightclubs, where it was initially reported,to additional locations and populations.

47
According to the 2000 Monitoring the Future Study, an annual national survey of drug useamong adolescents in the United States, MDMA use has increased for the second consecutiveyear among students in the 8th, 10th, and 12th grades. Among 12th-graders, lifetime useincreased from 8 to 11 percent. Perceived availability of MDMA increased from 40 to 51 percentamong seniors. Both annual and 30-day prevalence of MDMA use were higher among Hispanic(10.6 and 4.5 percent) and White (7.6 and 3.3 percent) than among African-American (1.3 and0.9 percent) seniors.
In recent years, pills and tablets marketed and sold as ecstasy have increasingly includedsubstances in addition to and other than MDMA. The types of drugs and adulterants used in pillsand tablets sold as ecstasy differ by and within CEWG areas. Thirteen CEWG representativeselaborated on increases in MDMA or ecstasy use, in their respective areas, as shown below:
Atlanta
Baltimore
Boston
According to local ethnographic reports, ecstasy use is common among bothmen and women and among persons younger than 35. Local reports indicate anincrease in the use of ecstasy among certain African-American social networks,particularly those connected to a music or club scene. MDMA is being used in awide variety of settings, with people no longer exclusively using in clubs andraves.
The Maryland Drug Early Warning System reported that ecstasy was movingfrom the club scene to the broader population in Baltimore’s suburbancounties, but not in Baltimore City. DAWN ED mentions rose from 35 in 1999to 64 in 2000.
MDMA use was characterized by most contacts as still primarily a White,middle-class phenomenon, partially because of its relatively high cost.However, two sources in Boston reported that its use is increasing among non-White city youth.
Chicago
Detroit
Los Angeles
Once limited to the rave scene, ecstasy can be found in most mainstream danceclubs and many house parties, according to ethnographic reports. It continuesto be used predominantly by White youth.
Users are typically college students or young professionals, who often takeecstasy in dance settings. Urban areas outside Detroit noted significant ecstasyuse, including Kalamazoo, Battle Creek, and Grand Rapids.
According to the Los Angeles Police Department, the use of club drugs such asMDMA has become increasingly popular in venues other than clubs or raves.More and more people are using in their homes or in other social settings. Lawenforcement officials perceive the use of MDMA as an increasing threat to thepublic’s health.

48
Miami
Minneapolis
New Orleans
Philadelphia
St. Louis
San Diego
SanFrancisco
Hospital ED mentions related to MDMA are increasing and continue to involvepredominantly younger White patients. For the first time in 2000, more teensabused ecstasy than cocaine. Hospital data on 49 cases in the first half of 2001show that 92 percent were White non-Hispanics, with 15 percent being in theirteens and 71 percent in their twenties.
MDMA abuse by young people in the metropolitan area continued to escalate,no longer limited to rave or nightclub settings. School-based counselorsreported emergence of MDMA abuse and rave garb among students since thespring of 2000.
It was reported that MDMA use has spread to colleges and nearby parishes.
MDMA has become increasingly acceptable among the mainstream population.
The rave scene has become popular in St. Louis, where ecstasy is freely available.Most users are teenagers or young adults. Ecstasy use appears to be an even greaterproblem in Kansas City, according to the DEA. There appear to be two age groupsof users: 15–19 and 20–25.
Expert focus group members reported that they believed ecstasy would be thenext drug epidemic in San Diego. They see use by adolescents and young adultsincreasing radically.
MDMA abuse continues to increase, according to street-based observers.
DAWN ED Data on MDMA
Total MDMA DAWN ED mentions in the coterminous United States increased 58 percentbetween 1999 and 2000, from 2,850 to 4,511. More than 80 percent of the MDMA ED mentionsin 2000 were among patients younger than 26.
Although small compared to other drugs, ED MDMA mentions rose in 18 of the 20 CEWG areasincluded in DAWN. The increase between 1999 and 2000 was significant in 14 areas.
As shown in exhibit 26, the areas with the highest number of mentions in 2000 were Chicago(215), New York City (200), Los Angeles (177), Philadelphia (141), Seattle (128), andBoston (125).

49
EEEExxxxhhhhiiiibbbbiiiitttt 22226666.... NNNNuuuummmmbbbbeeeerrrr ooooffff MMMMDDDDMMMMAAAA EEEEDDDD MMMMeeeennnnttttiiiioooonnnnssss bbbbyyyy CCCCEEEEWWWWGGGG SSSSiiiitttteeee aaaannnndddd YYYYeeeeaaaarrrr:::: 1111999999994444––––2222000000000000CEWG Site 1994 1995 1996 1997 1998 1999 2000
Atlanta …1 … … 19 33 62 68
Baltimore 0 8 2 2 6 35 64*
Boston 5 7 … 16 39 87 125*
Chicago 10 8 22 33 25 103 215*
Dallas 21 57 20 17 15 24 71*
Denver 2 3 1 11 6 15 57*
Detroit … 0 0 … 6 40 60
Los Angeles 14 37 46 24 30 52 177*
Miami 2 4 9 28 12 59 105*
Mpls./St. Paul 2 … 4 … 2 16 65*
Newark 0 … 4 … 2 38 21*
New Orleans 12 … 12 13 42 51 44
New York 7 14 24 41 31 136 200*
Philadelphia … … 0 19 27 89 141
Phoenix … 1 … 6 2 20 76*
St. Louis 0 1 2 2 15 52*
San Diego 6 6 17 8 14 25 47*
San Francisco 32 29 32 35 38 47 107*
Seattle 2 10 12 20 19 32 128*
Wash., D.C. … … … … 23 … 78
*Statistically significant at p < 0.051 Dots (…) indicate that an estimate with a relative standard error greater than 50 percent has been suppressed.SOURCE: Adapted from DAWN, Office of Applied Studies, SAMHSA
Mortality and MDMA Admissions
Deaths associated with MDMA use were reported by seven CEWG representatives.
Detroit The Wayne County Medical Examiner laboratory identified one MDMA/MDAdeath in 1998, two in 1999, and three in 2000. Two cases were found amongdecedents between April and September 2001. Multiple drugs were found in allthese cases.
Honolulu
Miami
Minneapolis
There are reports of deaths associated with ecstasy.
There were five deaths associated with MDMA in the first half of 2001.
In 2001, there were no MDMA-related deaths in Ramsey County. One deathwas reported in Hennepin County involving a 19-year-old Black male for whomrecent MDMA use was cited as a significant contributing condition. This

50
Phoenix
Philadelphia
Texas
compares with three MDMA-related deaths each in Hennepin and three inRamsey Counties in 2000.
A massive rave, held just inside California over the Arizona border on theChemehuevi Indian Reservation, had an estimated attendance of 30,000. Fivedeaths were reported, as were 61 unconfirmed hospital admissions.
MDMA was present in four mortality cases in 1999, the first time the drug wasdetected. In the first and second halves of 2000, MDMA was detected in threeand five decedents, respectively. There were eight such detections during thefirst half of 2001.
In 1999, two deaths involved MDMA in Texas. There was one death in 2001.
Treatment Data on MDMA Admissions
There is evidence in some CEWG areas that MDMA users are being admitted to treatment ingreater numbers, or that these individuals use MDMA as well as other primary drugs, asindicated in the excerpts below.
Denver
Minneapolis
Texas
Denver-area programs are beginning to see a few young clients coming totreatment for MDMA as a primary drug. A survey of 764 clients showed that 35percent reported lifetime use of ecstasy, with 4.6 percent having used it in thepast 30 days. The average age of these users was 17.3 years.
Addiction treatment programs reported a rising number of patients who wereheavy MDMA abusers.
Adult admissions for a primary, secondary, or tertiary problem with ecstasyincreased from 45 in 1998, to 97 in 1999, to 141 in 2000, to 200 throughOctober 2001. Among adolescents, there were 18 such admissions in 1998, 17in 1999, 58 in 2000, and 75 through October 2001. Among adults in 2001, 53percent were referred by the criminal justice or legal system. Amongadolescents, 81 percent were referred by the juvenile justice system in 2001.
Physical Consequences of MDMA/Ecstasy Use
The rising ED rates, the fact that MDMA is being associated with drug-related deaths, and thepresence of MDMA/ecstasy abusers in drug treatment programs are evidence of the adversephysical consequences of its use. A stimulant and low-level hallucinogen, MDMA is a ScheduleI drug under the Controlled Substances Act. There is no acceptable medical use for it in theUnited States. Adverse short-term effects associated with MDMA include increased heart rateand blood pressure, overheating, dehydration, and even heart or kidney failure. Longer termeffects can include brain damage, depression, acute anxiety, memory loss, learning difficulties,

51
and aggressive and impulsive behavior. However, as with other drugs in pill or tablet form,MDMA is perceived by users as safer than other drugs that must be injected or inhaled.
MDMA/Ecstasy and Multiple Drug Use
The adverse physical consequences attributed to MDMA/ecstasy use are confounded by the factthat these users often use multiple substances. Nine CEWG representatives presented data onpolydrug use involving MDMA/ecstasy.
Atlanta
Chicago
Miami
New York
Philadelphia
Reports suggest variable content of ecstasy pills or tablets, with reports of othersubstances being sold as ecstasy. Ethnographers have come across somedealers and users who have had their MDMA tested to determine the contents.Many contained cocaine while a few had small amounts of heroin in them.Others are reporting that they are locally cutting their own MDMA withOxyContin.
It is not unusual for ecstasy users to use other drugs, including nitrous oxide.Some samples of ecstasy have been found to contain other drugs; PCP is onesuch drug used in combination with MDMA.
The practice of ‘rolling’ has been reported in Miami and Orlando. This is whenindividuals use heroin to counteract the stimulant effect of ecstasy. Of 49hospital cases where ecstasy was felt to be involved in the first half of 2001,many involved a combination of ecstasy and some other drug, including alcohol(n = 21, 43 percent), marijuana (33 percent), cocaine (33 percent), GHB (22percent), benzodiazepines (especially alprazolam [Xanax], 14 percent), andLSD/ecstasy (2 percent).
The SSU reports mixing of MDMA with other substances. It is generally sold inpill form, but in Brooklyn it was supposedly sold in powder form with cocaineHCl and smoked in a blunt. The SSU reports that MDMA was mixed withheroin and sold under the brand names ‘On the Ball’ and ‘Wombstone.’ Thereare also reports that some dealers are selling Excedrin pills as ecstasy becausethey have an E in the center and a split in the back. According to one informant,‘In the nightclubs, people cannot tell the difference, especially after a few drugsin the system with alcohol.’
Spring and autumn 2000 focus groups described MDMA as highly potent andused in combination with heroin, alcohol, and/or cough syrup. Spring andautumn 2001 focus groups reported that MDMA is used in combination withmarijuana and LSD.

52
Phoenix
SanFrancisco
Seattle
Washington,D.C.
PMA continues to show up in pills being sold as ecstasy. Many of these pills arestamped with a three-dimensional Mitsubishi logo. A popular nighttime discjockey died in April from PMA.
Observers report that MDMA is smoked with marijuana or mixed in alcoholicdrinks.
Mixing club drugs together, whether all at once or over several hours, seems tobe gaining popularity.
Polydrug use remains a common feature among club drug users in the District.For example, local users will ingest ecstasy in conjunction with marijuana,LSD, and ketamine.
Manufacture and Trafficking of MDMA
According to the DEA, small clandestine laboratories in rural areas of the Benelux countries (theNetherlands, Belgium, and Luxembourg) now produce approximately 80 percent of the MDMAconsumed worldwide, using precursor chemicals obtained from China, India, Germany, andPoland. The most common MDMA precursor chemicals produced in these countries are safrole,isosafrole, MDP2P, and piperonal. The Netherlands and Belgium, because of their multiple sea,air, and rail connections to other countries throughout Europe and to the United States, haveproved to be ideal locations for trafficking MDMA to multiple markets. Once MDMA isproduced, it is typically pressed into pills and packaged for immediate transfer to a wholesalegroup that will smuggle it to other countries. This smuggling has been dominated by Israeli andRussian drug trafficking organizations since the mid-1990s. These criminal organizationssmuggle MDMA to the United States through express mail services, couriers, and sea containers.Once in the United States, the drug is passed to midlevel wholesalers who pass it on to the retaillevel. Criminal organizations in other countries appear to be developing the capability to produceMDMA. However, MDMA is not easy to manufacture because of the difficulty in obtaining allthe precursor chemicals needed.
Seizures of MDMA
The U.S. Customs Service and other law enforcement agencies continue to seize large amountsof MDMA, which, as noted earlier, now come primarily from the Netherlands, Belgium, andother sites in Europe. In 2000, the U.S. Customs Service seized 9.3 million MDMA tablets beingsmuggled into the United States. This compares to 3.5 million in 1999, 750,000 in 1998, and400,000 in 1997. A total of more than 4 million pills were seized by U.S. Customs in the first 4months of 2001.
Exhibit 27 illustrates the quantities of MDMA seized by U.S. Customs in selected locationsduring 2000–2001, by date, location, and origin. Most seizures occurred at airports, with thelargest seizure being in Los Angeles in September 2000.
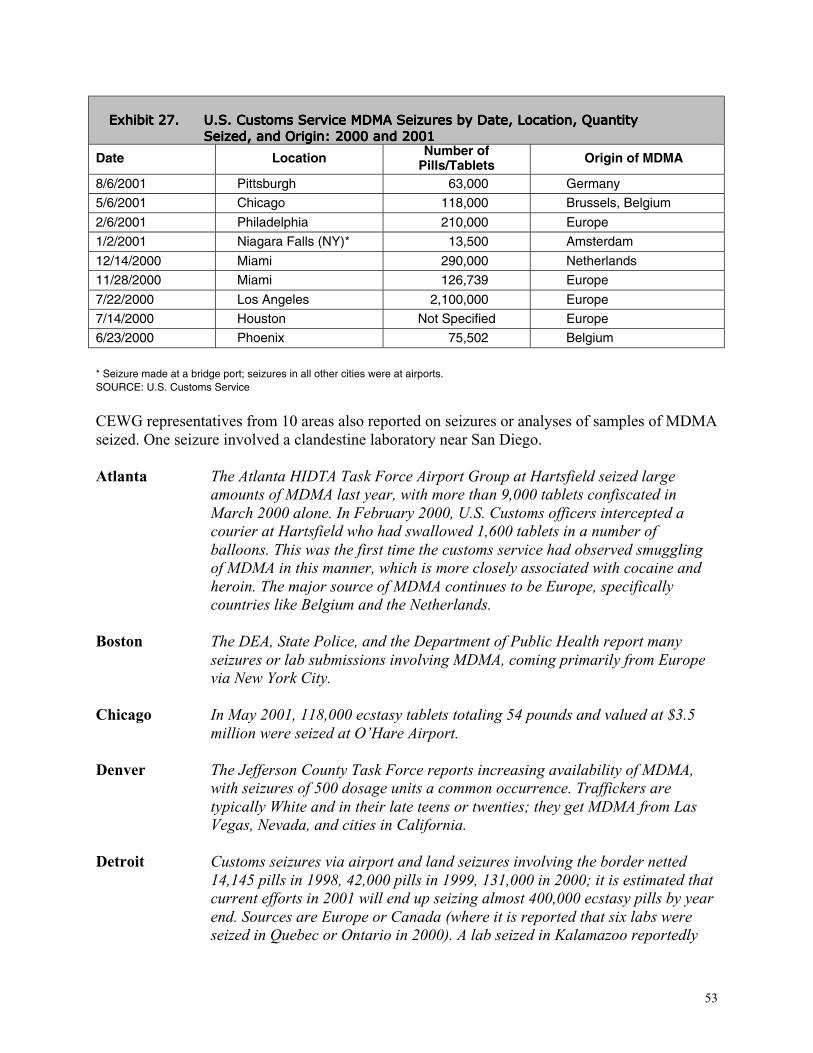
53
EEEExxxxhhhhiiiibbbbiiiitttt 22227777.... UUUU....SSSS.... CCCCuuuussssttttoooommmmssss SSSSeeeerrrrvvvviiiicccceeee MMMMDDDDMMMMAAAA SSSSeeeeiiiizzzzuuuurrrreeeessss bbbbyyyy DDDDaaaatttteeee,,,, LLLLooooccccaaaattttiiiioooonnnn,,,, QQQQuuuuaaaannnnttttiiiittttyyyySSSSeeeeiiiizzzzeeeedddd,,,, aaaannnndddd OOOOrrrriiiiggggiiiinnnn:::: 2222000000000000 aaaannnndddd 2222000000001111
Date Location Number ofPills/Tablets Origin of MDMA
8/6/2001 Pittsburgh 63,000 Germany
5/6/2001 Chicago 118,000 Brussels, Belgium
2/6/2001 Philadelphia 210,000 Europe
1/2/2001 Niagara Falls (NY)* 13,500 Amsterdam
12/14/2000 Miami 290,000 Netherlands
11/28/2000 Miami 126,739 Europe
7/22/2000 Los Angeles 2,100,000 Europe
7/14/2000 Houston Not Specified Europe
6/23/2000 Phoenix 75,502 Belgium
* Seizure made at a bridge port; seizures in all other cities were at airports.SOURCE: U.S. Customs Service
CEWG representatives from 10 areas also reported on seizures or analyses of samples of MDMAseized. One seizure involved a clandestine laboratory near San Diego.
Atlanta
Boston
Chicago
Denver
Detroit
The Atlanta HIDTA Task Force Airport Group at Hartsfield seized largeamounts of MDMA last year, with more than 9,000 tablets confiscated inMarch 2000 alone. In February 2000, U.S. Customs officers intercepted acourier at Hartsfield who had swallowed 1,600 tablets in a number ofballoons. This was the first time the customs service had observed smugglingof MDMA in this manner, which is more closely associated with cocaine andheroin. The major source of MDMA continues to be Europe, specificallycountries like Belgium and the Netherlands.
The DEA, State Police, and the Department of Public Health report manyseizures or lab submissions involving MDMA, coming primarily from Europevia New York City.
In May 2001, 118,000 ecstasy tablets totaling 54 pounds and valued at $3.5million were seized at O’Hare Airport.
The Jefferson County Task Force reports increasing availability of MDMA,with seizures of 500 dosage units a common occurrence. Traffickers aretypically White and in their late teens or twenties; they get MDMA from LasVegas, Nevada, and cities in California.
Customs seizures via airport and land seizures involving the border netted14,145 pills in 1998, 42,000 pills in 1999, 131,000 in 2000; it is estimated thatcurrent efforts in 2001 will end up seizing almost 400,000 ecstasy pills by yearend. Sources are Europe or Canada (where it is reported that six labs wereseized in Quebec or Ontario in 2000). A lab seized in Kalamazoo reportedly

54
Miami
Minneapolis
San Diego
Texas
had the potential to make ecstasy. Terms such as ‘jars’ (quantities between 30and 100 pills) and ‘buckets’ (up to 1,000 pills) have emerged in thedistribution chain.
As of January 1, 2000, the Broward Sheriff’s Office Crime Lab began to reportMDMA cases separately. During 2000, MDMA accounted for 244 cases, morethan heroin (188) or other drugs. In the first 6 months of 2001, there were 132ecstasy cases, more than for heroin and other drugs combined. Although notyet verified, there are rumors of clandestine labs in South Florida beginningMDMA production.
Law enforcement seizures of MDMA submitted to the Minneapolis crime labrose from 2,047 dosage units in 2000 to 7,346 through October 2001. MDMAseizures at the State crime lab increased from 213 tablets in 2000 to 2,892through September 2001. Approximately 3,000 tablets were seized in the Asiancommunity in 2001. The local DEA field office confiscated 1.7 kilograms ofMDMA powder and 1,578 dosage units in 2000.
In mid-October 2001, DEA agents raided and seized a major MDMAlaboratory in Escondida, a city in north San Diego County, the first and onlysuch lab seized in the United States. It was well hidden behind a revolvingbookcase. The highly sophisticated laboratory was capable of producing 1.5million ecstasy tablets a month, with a street value of $20 each.
Department of Public Safety labs identified MDMA as the substance in 102exhibits in 1999, 373 in 2000, and 259 through three quarters in 2001.
Availability, Price, and Purity of MDMA
Availability. MDMA/ecstasy was available in all CEWG areas, except Honolulu, where it wasnot reported, and Newark, where it was rare. It was described as widely or readily available inBoston, New York City (where availability also increased), Detroit (throughout Michigan), St.Louis, Denver, Phoenix (throughout Arizona), and Texas. Increasing availability was also citedin Boston, Miami (where it was thought to be the cause of a possible drop in prices in the firsthalf of 2001), Washington, D.C. (despite disruption of some markets after the terrorist attacks),Chicago (where use expanded from raves to most mainstream dance clubs and many houseparties), Detroit, and Texas.
Europe was cited as the source of MDMA in four of the five cities reporting such data (Atlanta,Boston, Denver, and Miami), with Atlanta and Miami specifically identifying Belgium and theNetherlands. In Detroit, both Europe and Canada were identified as sources. The drug reachedBoston via New York City, and Denver via Las Vegas and various cities in California. LosAngeles was cited as one of several ports of entry for MDMA.

55
Price. The retail price per MDMA/ecstasy pill ranged from $10–$25 in Miami to $20–$40 inChicago (exhibit 28). Prices were relatively stable compared with the June 2001 reportingperiod, except for Miami and San Francisco (where they decreased) and Denver (where the rangebroadened, from $25 to $10–$30). In Washington, D.C., where the range was $20–$35, $20 wasthe most common price.
EEEExxxxhhhhiiiibbbbiiiitttt 22228888.... MMMMDDDDMMMMAAAA PPPPrrrriiiicccceeeessss iiiinnnn 11115555 RRRReeeeppppoooorrrrttttiiiinnnngggg CCCCEEEEWWWWGGGG CCCCiiiittttiiiieeeessss aaaannnndddd 4444 TTTTeeeexxxxaaaassss SSSSiiiitttteeeessss
AAAArrrreeeeaaaa PPPPrrrriiiicccceeee////PPPPiiiillllllll oooorrrr DDDDoooossssaaaaggggeeee UUUUnnnniiiittttAtlanta $20/pill or tabletBoston $20–$30/tabletChicago $20–$40/pillDenver $10–$30/capsuleDetroit $10/pill wholesale for 500 pills
Miami$8/pill (wholesale)$10–$25/pill (retail)
Minneapolis/St. Paul $20/capsuleNew Orleans $15–$25/dose
New York City$5–$13/pill wholesale$25–$38/pill (retail)
Philadelphia $20–$25/dosePhoenix $5.50–$10.50/tablet (wholesale)
$15–$30/tablet (retail)St. Louis $20–$30/doseSan Diego $20/doseSan Francisco $15–$20/pillSeattle $20–$30/150–250 milligramsTexas
DallasHouston, Galveston, and McAllen
$10–$40/dose$25–$30/dose
Washington, D.C.$150–$200/”10 pack”$20–$35/pill (retail)
SOURCE: CEWG city reports, December 2001
Purity. The variable content of MDMA/ecstasy pills was commonly reported in CEWG areas.What was sold as ecstasy often contained one or more alternate or additional substances,including caffeine, cocaine, heroin, ketamine, methylenedioxyamphetamine (MDA), OxyContin,paramethoxyamphetamine, and phencyclidine (PCP). In Texas, the amphetaminebenzylpiperazine and the hallucinogen 3-trifluoromethylphenylpiperazine were combined andsold as ecstasy. According to youth offenders in New York, there was a widespread belief thatecstasy was adulterated with mescaline or methamphetamine, as well as with cocaine or heroin.
Boston
Los Angeles
MDMA purity reported by the State Police lab remained high, with caffeine themost common adulterant.
Los Angeles is one of several ‘principal importation gateways,’ or ports ofentry, for MDMA. The Drug Enforcement Administration warns the public of anemerging concern—‘crystal ecstasy.’ This form of ecstasy has a purity of 96percent. Ecstasy tablets, on the other hand, are approximately 35 percent pure.

56
Minneapolis
New York
Seattle
Although the use of crystal ecstasy has yet to be observed in Los Angeles, it hasrecently been seized in other cities, such as Philadelphia, Tucson, Houston, andBoulder.
More frequently than in the past, alleged MDMA pills contain additional oralternate psychoactive ingredients. MDA, a chemical similar in effect toMDMA, was being sold as MDMA, and pills with butterfly imprints were foundto contain PCP. Other pills sold as ecstasy were found to have a mixture ofMDMA and ketamine, and others a mixture of MDMA, ketamine,methamphetamine, and caffeine.
The SSU has noted two recent changes surrounding MDMA: its move from theclubs to the street, and the mixing of MDMA with other substances.
Quality and consistency have become increasingly unpredictable, with manyusers reporting incidents of unknown or ‘strange’ combinations of drugs beingsold as ‘ecstasy.’ In the local treatment intake survey, a significantly highernumber of respondents reported taking ‘something other than intended orexpected’ compared with the same period the year prior.
GAMMA HYDROXYBUTYRATE (GHB)
Overview
Fifteen CEWG areas experienced increases in GHB indicators. Indicators were stable in fiveother CEWG areas and declined in one. This central nervous system depressant, which can relaxor sedate the body, is classified as a Schedule I drug and can be produced in clear liquid, whitepowder, tablet, and capsule form. The production process is simple, requiring only gammabutyrolactone (GBL) and either sodium hydrochloride or potassium hydrochloride.
GHB indicators increased in the following 15 CEWG areas:
Boston
Chicago
GHB is significant among club drugs; Massachusetts Poison Control Centercontinued to report many calls regarding GHB and its precursor, GBL, involvingmostly adolescent and young adult males.
GHB is used infrequently, mainly by young White males. Recent ED mentions forGHB increased 3 percent from 135 to 139 in 1999 to 2000. ED mentions per100,000 population increased 92 percent between 1998 and 1999, from 1.2 to2.3, but remain unchanged in 2000 (2.3). Compared with other club drugs,overdoses are more frequent with GHB, especially when used in combinationwith alcohol. GHB use is perceived to be low compared with ecstasy.

57
Denver
Los Angeles
Miami
Minneapolis
Newark
GHB is often used in combination with alcohol, making it even more dangerous.During the 1994–98 time period, the Rocky Mountain Poison and Drug Centerreported only one to six calls about GHB. However, in 1999, the number jumpedto 92. GHB ED mentions also increased from 7 in 1997 to 13 in 1998 to 70 in1999. However, such mentions dropped to 43 in 2000. DEA reports GHB isincreasing in popularity in Colorado and is readily available at raves, night-clubs, strip clubs, and private parties. One treatment program stated that some oftheir young clients have said they think GHB is dangerous and can ‘kill them.’
ED mentions of GHB increased 15 percent from 1999 to 2000. According to theLAPD, the use of club drugs has become increasingly popular in venues otherthan clubs or raves. The use of the Internet to purchase precursor chemicals hasincreased. Law enforcement officials perceive the use of MDMA and GHB as anincreasing threat to the public’s health.
GHB is a commonly abused substance in South Florida. This drug has becomepopular at raves and other parties, is commonly mixed with alcohol, has beenimplicated in drug rapes and other crimes, has a short duration of action, and isnot easily detectable on routine hospital toxicology screens. During the first 6months of 2001, Broward General Medical Center ED treated 32 people withGHB or GHB precursor overdose and two GHB withdrawal cases. There were 77cases in all of 2000. In virtually every GHB overdose case during the first half of2001, the reason for the ED visit was decreased responsiveness or coma usuallylasting less than 3 hours. Products containing1,4 butanediol (1,4 BD) are sold inhealth food stores; artfully worded labels often say that this product does notcontain GHB. In addition, these labels may state that this product is a cleanserand that it is harmful if swallowed.
From 1999 to 2000, ED episodes for GHB rose from 33 to 93, accounting formore ED episodes than any other club drug in the metropolitan area. Becausebecoming unarousable is part of the GHB experience, some people mark thepalm of their hand with a large letter ‘G’ to indicate they are using GHB, so thatif they are found unconscious, their friends needn’t call 911. Addiction treatmentprograms reported a growing number of patients presenting with GHB addictionwho exhibited physical dependence, tolerance, and withdrawal. A typicalscenario after several months of use is a compulsion to dose with GHB every 3hours at the risk of experiencing severe withdrawal symptoms. Despite recentState and Federal laws targeting GHB, GBL, and 1,4 BD, it is still possible topurchase products that contain these chemicals on the Internet.
GHB and ketamine are believed to be used at rave parties around collegecampuses. According to DAWN data, there were 7 GHB ED mentions and 14ketamine ED mentions in 1999. In 2000, the corresponding numbers were onlyfive and nine, respectively. Data from the 2001 Middle School Substance UseSurvey show that 2.4 percent of 7th- and 8th-grade students reported lifetime useof club drugs, including ecstasy, GHB, and ketamine.

58
New York
Philadelphia
Phoenix
St. Louis
San Diego
SanFrancisco
Seattle
Texas
Another club drug of concern is GHB, and while DAWN ED mentions for GHB in thecity are very small, there was a marked increase to 31 mentions in 2000, up from 16 in1999 and 5 in 1998.
GHB was mentioned in 53 DAWN ED cases in 1999 and 79 in 2000. Prior to 1999GHB cases were either nonexistent or did not meet DAWN’s standard of precision.
Reported prices for GHB were $5–$10 for one dose (1 teaspoon), $425 for 25 pounds,$3,200 for a 55-gallon drum wholesale, and $4,300 for a 55-gallon drum retail.
GHB use has increased in the St. Louis area. Because it is a depressant, its use withalcohol and its unpredictable purity present users with major health risks. Five deathswere reported in Missouri, and two near-deaths recently in St. Charles County whenGHB was used as a ‘date-rape’ drug.
Other drugs that were frequently in the news in 2000 were ecstasy, GHB, andketamine. These drugs were regularly spotted in raves, and law enforcement wasaware that ecstasy, GHB, and LSD were easily obtained by adolescents and youngadults.
GHB and ketamine each had the highest ED mentions ever in 2000, the most recentperiod of observation. The actual number of club drug mentions remains small,however, compared with cocaine or methamphetamine.
ED mentions of GHB increased by 67.8 percent between 1999 and 2000. However,MDMA and GHB each constitute less than 1 percent of total ED mentions. No deathsinvolving GHB were reported during first half of 2001. Mixing club drugs togethereither all at once or over several hours also seems to be gaining popularity.
Texas Poison Control Centers reported 100 confirmed exposures to GHB, GBL, and1,4 BD in 1998, compared with 166 in 1999, 154 in 2000, and 108 through the thirdquarter of 2001. ED mentions for GHB peaked in 2000, when the rate was 3 per100,000 population. Clients with a primary, secondary, or tertiary problem with GHB,GBL, or 1,4 BD are being seen in treatment. In 1999, 17 adults were admitted; in2000, 12; and in 2001 to date, 15. The DEA reports GHB is becoming more availablebecause of the ease of converting GBL into GHB. More labs are being seized in 2001than in prior years.
GHB indicators remained stable in 5 CEWG areas in 2000.
Atlanta
Baltimore
In Atlanta, it was reported that GHB use remains common, based on ethnographicreports. The GHB ED rates per 100,000 population increased steadily from 1994,but fell slightly from 1999 to 2000.
Only three GHB ED mentions were reported by local hospitals in 2000.

59
New Orleans
Washington,D.C.
GHB ED mentions peaked at 78 in 1999 and declined in 2000.
Limited use of GHB was reported among clubgoers and young professionals in thesecond half of 2001. The drug continues to have an unsafe reputation. According toone local resident, ‘GHB is far too strong and makes one out of control.’
Only one CEWG area reported a decline in GHB indicators.
Detroit Abuse of GHB or GBL appears to be on the decline. Hospital ED mentions andpoison control case reports for GHB and GBL peaked in 1999.
DAWN ED Data on GHB
Total DAWN ED mentions of GHB did not increase significantly from 1999 to 2000. In 2000,there were 4,969 mentions of GHB in the coterminous United States, compared with 3,178 in1999. In 2000, more than 60 percent of the mentions were attributed to ED patients youngerthan 26.
As shown in exhibit 29, the areas with the highest estimated numbers of GHB ED mentions in2000 were in Dallas (169), San Francisco (151), Los Angeles (149), Chicago (139), Atlanta(129), and Minneapolis (93).
EEEExxxxhhhhiiiibbbbiiiitttt 22229999.... NNNNuuuummmmbbbbeeeerrrr ooooffff GGGGHHHHBBBB EEEEDDDD MMMMeeeennnnttttiiiioooonnnnssss bbbbyyyy CCCCEEEEWWWWGGGG SSSSiiiitttteeee:::: 1111999999994444––––2222000000000000CEWG Site 1994 1995 1996 1997 1998 1999 2000Atlanta 1 14 38 54 80 142 129Baltimore 0 0 0 0 0 7 3Boston 0 0 1 2 6 26 26Chicago 0 6 33 55 69 135 139Dallas 11 37 60 72 160 156 169Denver 0 0 0 7 13 71 43Detroit …1 0 … … 11 45 22Los Angeles 27 … 108 … 48 130 149Miami 0 0 … 2 10 29 46Mpls./ St. Paul 1 0 2 1 8 33 93Newark 0 0 0 0 0 7 5New Orleans 0 1 8 27 35 78 69New York 0 0 … 6 5 16 31Philadelphia 0 0 0 … … 53 79Phoenix 0 0 0 3 2 17 16St. Louis 0 1 0 0 … 8 7San Diego 3 22 37 34 34 77 65San Francisco 11 16 78 83 102 138 151Seattle 0 0 3 … 17 34 57Wash., DC 0 1 0 0 4 13 24
1 Dots (…) indicate that an estimate with a relative standard error greater than 50 percent has been suppressed.SOURCE: Adapted from DAWN, Office of Applied Studies, SAMHSA

60
Treatment Data on GHB Admissions
Only Minneapolis/St. Paul and Texas reported increases in treatment admissions for GHB.
Availability, Price, and Purity of GHB
Availability. GHB was available in most CEWG areas, in some cases along with its precursorsGBL and 1,4 BD. GHB was described as readily available at raves, nightclubs, strip clubs, andprivate parties in Colorado, and as easily obtainable by adolescents and young adults in SanDiego. According to the DEA, availability was increasing in Texas because of the ease withwhich GBL can be converted into GHB. GHB was not reported in Honolulu and was rare inNewark, limited in Washington, D.C., and not seen as an emerging drug in the Baltimore area.
Price. Among the dozen CEWG cities for which GHB cost data were reported, dose pricesranged from $5 in New Orleans and St. Louis to $10–$20 in Atlanta. These prices were stablecompared with the previous reporting period, except for Dallas, where the cost per doseincreased. Although specific prices in Seattle were not reported, they were described as stable.Exhibit 30 shows recent GHB prices in 10 CEWG cities and 2 Texas sites.
EEEExxxxhhhhiiiibbbbiiiitttt 33330000.... GGGGHHHHBBBB PPPPrrrriiiicccceeeessss iiiinnnn 11110000 CCCCEEEEWWWWGGGG CCCCiiiittttiiiieeeessss aaaannnndddd 2222 TTTTeeeexxxxaaaassss SSSSiiiitttteeeessssArea Price/QuantityAtlanta $10–$20/doseChicago $5–$10/bottle capfulTexas
DallasHouston
$20/dose, $500–$900/gallon$5–$10/dose, $725–$1,000/gallon
Denver $5–$10/bottle capfulMiami $40–$70/32-ounce bottle of 1,4 BDMinneapolis/St. Paul $10/capful, shot, glassful or swigNew Orleans $5/capsule, $10/ounce GHB and GBL, $5–$10/dose (teaspoon), $425/25 poundsPhoenix $3,200/55-gallon drum wholesale, $4,300/55-gallon drum retailSt. Louis $5/capful, $40/ounceSan Diego $10/liquid ounceWashington, D.C. $10/thimbleful
SOURCE: CEWG City reports December 2001
Purity. Little was reported on purity levels of GHB, but the following excerpts are of interest:
Miami The label for a product containing 1,4 butanediol (1,4 BD) may state that thisproduct is a cleanser and that it is harmful if swallowed. However, it is sold inhealth food stores with dietary supplements, and a 32-ounce bottle typicallysells for $40–$70. This is similar to what GBL- and GHB-containing productswere selling for and far out of proportion with what most reasonable peoplewould pay for a cleanser.

61
Minneapolis Despite recent State and Federal laws and regulatory actions targeting GHB,GBL, and 1,4 BD, it is still possible to purchase products that contain thesechemicals on the Internet, where they are sold as nutritional supplements,muscle-stimulating growth hormones, aphrodisiacs, fish tank cleaners, orhousehold cleaning solvents.
PHENCYCLIDINE (PCP)
Overview
Indicators from 14 CEWG areas suggest that abuse of PCP is not widespread. For example, theDEA reported that PCP use was rare in most of New England, except metropolitan areas inConnecticut. However, there is evidence that PCP abuse is increasing in other areas. The LAPDnoted that PCP’s popularity has recently increased substantially and DEA reports a significantincrease in PCP use in the Dallas area. Washington, D.C., reports increases in arrestees testingpositive for PCP and increases in seizures of the drug. DAWN ED mentions have also increased.
DAWN ED Data on PCP/PCP Combinations
Mentions of PCP/PCP combinations in DAWN for the total coterminus United States increasedsignificantly from 4,696 in 1999 to 6,583 in 2000.
Across the 20 CEWG areas included in DAWN, rates of PCP mentions per 100,000 populationwere highest in Chicago, Philadelphia, Los Angeles, Washington, D.C., and Seattle where, asshown in exhibit 31, they increased from 1999 to 2000.
EEEEXXXXHHHHIIIIBBBBIIIITTTT 33331111.... CCCCEEEEWWWWGGGG AAAArrrreeeeaaaassss wwwwiiiitttthhhh tttthhhheeee HHHHiiiigggghhhheeeesssstttt RRRRaaaatttteeeessss ooooffff PPPPCCCCPPPP EEEEDDDD MMMMeeeennnnttttiiiioooonnnnssss PPPPeeeerrrr111100000000,,,,000000000000 PPPPooooppppuuuullllaaaattttiiiioooonnnn:::: 1111999999999999––––2222000000000000
CEWG Area 1999 2000ChicagoPhiladelphiaLos AngelesWashington, D.C.Seattle
1112
952
1712
986
SOURCE: Adapted from DAWN, Office of Applied Studies, SAMHSA
Mortality and PCP
PCP detections among decedents in Philadelphia declined to 22 in the first half of 2001,following a peak of 34 in the second half of 2000. PCP-related deaths continued to decline in LosAngeles in 2000 to 51, down from the peak of 66 in 1997.

62
Treatment Data on PCP Admissions
Treatment admissions for primary abuse of PCP remained low, accounting for less than 1 percentof admissions in most CEWG sites. The number of primary PCP admissions increased inNewark (from 17 in 1999 to 33 in 2000) and Los Angeles (from 166 in the second half of 2000to 198 in the first half of 2001). In Texas, the number of persons admitted with PCP as a primary,secondary, or tertiary drug of abuse increased also from 102 in 1998 to 174 in the first threequarters of 2001. A slight decrease occurred in Philadelphia where PCP was mentioned as aprimary, secondary, or tertiary drug by 2.6 percent of admissions in the first half of 2001,compared with 3.2 percent in the first half of 2000.
ADAM and Other Arrestee Data on PCP
ADAM report data for 2000 did not include adult males in Chicago. In the 17 sites for whichadult data are available, the results show that no males tested positive for PCP in six sites andless than 1 percent did so in five sites. Among adult females, none tested PCP-positive in sevensites and only 0.4 percent did so in two sites. The pattern was similar among juvenile arrestees.Exhibit 32 shows the sites where at least 0.9 percent of an arrestee group tested positive for PCP.
EEEExxxxhhhhiiiibbbbiiiitttt 33332222.... AAAADDDDAAAAMMMM SSSSiiiitttteeeessss WWWWhhhheeeerrrreeee NNNNeeeeaaaarrrrllllyyyy 1111 PPPPeeeerrrrcccceeeennnntttt oooorrrr MMMMoooorrrreeee ooooffff AAAAdddduuuulllltttt aaaannnnddddJJJJuuuuvvvveeeennnniiiilllleeee AAAArrrrrrrreeeesssstttteeeeeeeessss TTTTeeeesssstttteeeedddd PPPPCCCCPPPP----PPPPoooossssiiiittttiiiivvvveeee:::: 2222000000000000
Adults JuvenilesSiteMale Female Male Female
ChicagoDallasHoustonLos AngelesMinneapolisPhiladelphiaPhoenixSeattle
*3.94.8NS1.82.51.71.4
3.21.51.71.5NS3.71.04.3
NSNSNS1.0NSNS1.2NS
NSNSNS2.1NSNS0.9NS
NS = Not sampled* Not included in ADAM reportSOURCE: Arrestee Drug Abuse Monitoring Program, NIJ
According to the Washington, D.C., December 2001 site report, the Pretrial Services Agency inthe city recorded increases in the percentages of adult arrestees testing PCP-positive. Acomparison of the first quarters of 2000 and 2001 shows the proportion of adult arrestees testingPCP-positive rose from 7 to 10 percent and continued to increase to 13 and 14 percent in thesecond and third quarters of 2001, respectively. A similar trend continued among juvenilearrestees in the Nation’s capital. During the first quarter of 2001, 11 percent of juveniles testedPCP-positive, nearly double the 6 percent recorded in the first quarter of 2000. During thesecond and third quarters of 2001, 15 percent of juveniles tested PCP-positive.
Los Angeles reported a decline in PCP-related arrests from 103 in the first half of 2000 to 64during the same period in 2001.

63
Patterns of PCP Use and Manufacturing
PCP continues to be combined with marijuana or cigarettes in many CEWG areas. In New YorkCity, dipping is a popular form of using PCP—menthol cigarettes are dipped into liquid PCP andmarijuana blunts are laced with powdered PCP. According to reports in Minneapolis/St. Paul,PCP-soaked cigarettes and marijuana joints are easily distinguished by their pungent, unpleasantchemical odor. In Washington, D.C., “dippers,” tobacco cigarettes dipped into liquid PCP, sellon the street for $25 each and are so potent that more than one person can get high from onecigarette. Washington, D.C., also reports that, among juvenile arrestees in the Pretrial ServicesAgency program, PCP is only rarely found without a positive test for marijuana as well.
In Washington, D.C., it was reported that many manufacturers of ecstasy will use PCP as a cheapadulterant or even substitute for MDMA in their tablets, which the user unknowingly ingests.Similarly, in Texas, tablets containing PCP and methamphetamine are reportedly being sold asecstasy.
Seizure Data on PCP
In Washington, D.C., seizures of PCP more than doubled from 31 in 1999 to 74 in the first 10months of 2001. However, Los Angeles reported a decline of 19 percent in PCP seizuresbetween the first halves of 2000 and 2001.
Price Data on PCP
According to CEWG reports, PCP prices appeared to be stable since the June 2001 reportingperiod, with the exception of Los Angeles. There the price of a wholesale gallon of PCP declinedto $7,250 from the $10,000 per gallon reported in June 2001. Likewise, the street value of agallon of PCP in Los Angeles dropped from $150,000 to $30,000. Exhibit 33 shows PCP pricesin seven CEWG areas, as reported in December 2001.
EEEExxxxhhhhiiiibbbbiiiitttt 33333333.... PPPPCCCCPPPP PPPPrrrriiiicccceeeessss iiiinnnn SSSSeeeevvvveeeennnn CCCCEEEEWWWWGGGG AAAArrrreeeeaaaassss
Chicago $10 for 2–3 sticks$20/dipped cigarette
Dallas $10/dose$500/ounce
Los Angeles $7,250/gallon wholesale$30,000/gallon street price
New York City $10/bagPhiladelphia $5/bottleSt. Louis $350/ounce
Washington, D.C.$15–$25/marijuana-PCP combination$50/”lid” (packages of PCP-marijuana)$700–$950/ounce
SOURCE: CEWG reports December 2001
In Philadelphia, where a bottle of PCP sells for $5.00, the drug is reportedly “easier to obtainthan ever.”

64
LYSERGIC ACID DIETHYLAMIDE (LSD)
Overview
While indicators of LSD are low, it continues to be reported in several CEWG areas and thetrends are mixed. According to ethnographic data, the drug’s availability ranges from “readilyavailable” in Phoenix to “not easy to find” in Washington, D.C. Additionally, ethnographic andfocus group reports indicate that LSD remains popular in two areas but is losing popularity inone. However, the number of ED mentions, which have declined in eight areas and remainedstable in two, may point to decreased use. In Washington, D.C., and Baltimore, clubgoersreportedly mix LSD with ecstasy, a practice called “candy-flipping.”
LSD use was mentioned in the following 14 CEWG reports:
Atlanta
Boston
Chicago
Detroit
Los Angeles
Miami
Minneapolis
The rate of LSD ED mentions has declined steadily since 1996, although LSDremains popular according to ethnographic reports. Much of the LSD that comesto Atlanta is mailed in from the western United States.
Despite the low treatment and ED indicators for hallucinogens, use of LSD, PCP,mushrooms, and mescaline among adolescents and young adults is notuncommon, as indicated by focus groups. Seizures of these drugs typicallyincrease around the time of large outdoor rock concerts in the spring andsummer.
Following a 15-percent increase in LSD ED mentions between 1998 and 1999,a 17-percent decrease was seen from 1999 to 2000. It is too soon, however, tointerpret this change as indicating a decrease in LSD use. Recent trends inhallucinogen treatment admissions have been uneven, but overall admissionshave been relatively high compared with trends earlier in the decade. Admis-sions increased steadily from 85 in FY 1992 to 550 in FY 1996. In FY 1997,treatment admissions dropped to 131, but rebounded to 455 in FY 1998 and to401 in FY 1999. For FY 2000, treatment admissions were up again to 517.
LSD continues to be sporadically reported and use remains relatively low. EDmentions for hallucinogens have been declining overall since about 1995.
ED LSD mentions decreased slightly from in 1999 to 217 in 2000. Rates of LSDED mentions per 100,000 population have remained stable at about 3 since 1996.
LSD appears to be losing popularity among young people. There were 55 EDmentions for LSD in 2000. This number has been stable since 1996 but representsa 26-percent decline from the number of LSD cases in 1994. There were 22 LSDcases worked by the Broward Sheriff’s Office Crime Lab in the first 6 months of2001, compared with 52 LSD cases in all of 2000.
Hospital ED episodes of LSD declined from 64 in 1999 to 58 in 2000.

65
Newark
Philadelphia
Phoenix
St. Louis
SanFrancisco
Texas
Washington,D.C.
LSD use remains low in Newark.
Spring and autumn 2001 focus group members reported that ecstasy userssometimes use that drug in combination with LSD.
ED mentions for LSD reflect a 14-percent decrease, from 156 in 1999 to 135 in2000. Various drugs with hallucinogenic properties, including LSD, are readilyavailable throughout the State.
LSD has sporadically reappeared in the local high schools and rural areas.Much of this LSD is imported from the Pacific coast. DAWN data show a steadypresence in ED mentions from 1997 through 2000.
LSD ED mentions showed no particular trend during the 1997–2000 period.
DAWN ED mentions of LSD totaled 64, down from a peak of 133 in 1995.Department of Public Safety (DPS) labs identified 405 substances as LSD in1999, 234 in 2000, and 55 through October 2001.
Ethnographic reports continue to suggest use of LSD within D.C.; informants,however, cite it as ‘not that easy to find.’ Liquid LSD is becoming increasinglyavailable on the retail level, and DEA agents have encountered LSD in crystalform within the past year. DEA investigators also cite accounts of young adultsand clubgoers practicing ‘candy flipping,’ (mixing ecstasy and LSD). LSD EDmentions continue to decline.
DAWN ED Data on LSD
DAWN mentions of PCP In the total coterminus United States totaled only 4,016 in 2000 andshowed no significant change from 1999.
Across the 20 CEWG areas included in DAWN in 2000, the number of LSD mentions was toosmall for estimation in Detroit and totaled only 10 in Newark. In Baltimore, Boston, Miami,Minneapolis/St. Paul, Newark, New Orleans, San Diego, and Washington, D.C., the number ofLSD mentions ranged from a low of 35 in New Orleans to a high of 58 in Minneapolis/St. Paul.LSD mentions in Atlanta, Dallas, Denver, New York, St. Louis, and San Francisco ranged froma low of 64 in Denver and Dallas to a high of 74 in St. Louis. In five other CEWG sites, thenumbers were somewhat larger: Philadelphia, 104; Seattle, 107; Chicago, 115; Phoenix, 135; andLos Angeles, 217.
Treatment Data on LSD Admissions
Across CEWG areas, admissions for primary abuse of LSD were not reported separately fromprimary admissions for “hallucinogens.” However, primary admissions for hallucinogens werevery low, with the highest numbers reported in 2000 being 50 in Los Angeles and 103 in Texas.
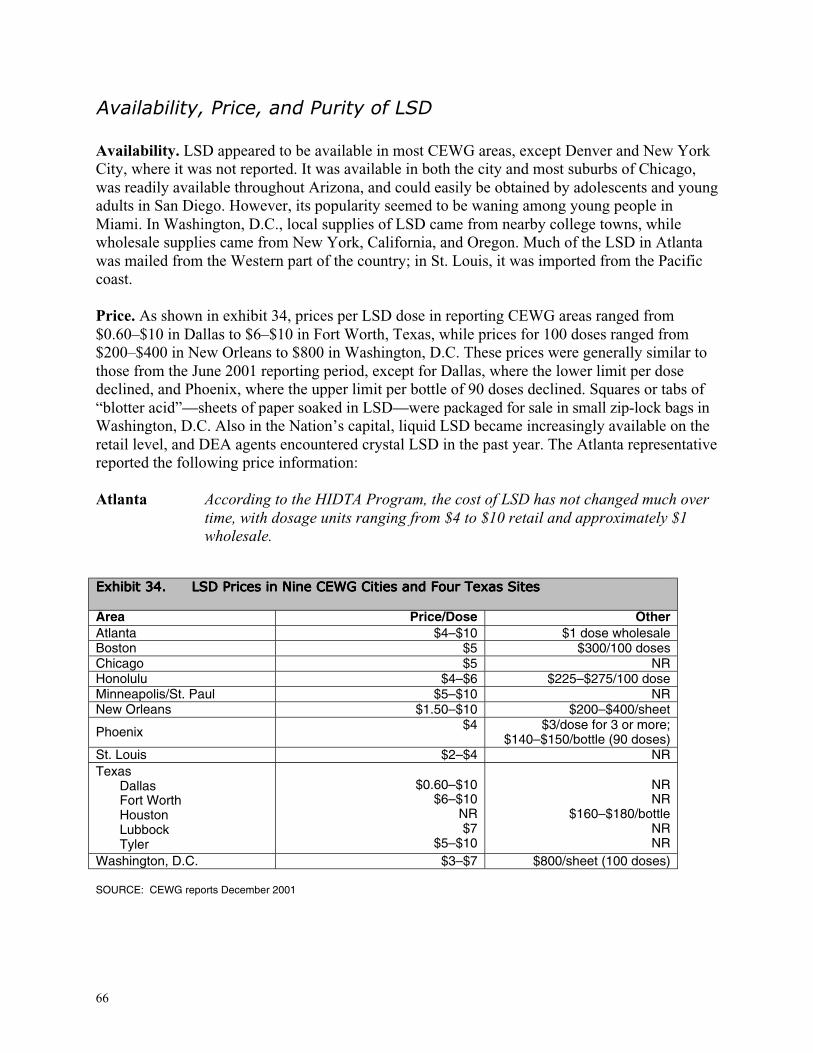
66
Availability, Price, and Purity of LSD
Availability. LSD appeared to be available in most CEWG areas, except Denver and New YorkCity, where it was not reported. It was available in both the city and most suburbs of Chicago,was readily available throughout Arizona, and could easily be obtained by adolescents and youngadults in San Diego. However, its popularity seemed to be waning among young people inMiami. In Washington, D.C., local supplies of LSD came from nearby college towns, whilewholesale supplies came from New York, California, and Oregon. Much of the LSD in Atlantawas mailed from the Western part of the country; in St. Louis, it was imported from the Pacificcoast.
Price. As shown in exhibit 34, prices per LSD dose in reporting CEWG areas ranged from$0.60–$10 in Dallas to $6–$10 in Fort Worth, Texas, while prices for 100 doses ranged from$200–$400 in New Orleans to $800 in Washington, D.C. These prices were generally similar tothose from the June 2001 reporting period, except for Dallas, where the lower limit per dosedeclined, and Phoenix, where the upper limit per bottle of 90 doses declined. Squares or tabs of“blotter acid”—sheets of paper soaked in LSD—were packaged for sale in small zip-lock bags inWashington, D.C. Also in the Nation’s capital, liquid LSD became increasingly available on theretail level, and DEA agents encountered crystal LSD in the past year. The Atlanta representativereported the following price information:
Atlanta According to the HIDTA Program, the cost of LSD has not changed much overtime, with dosage units ranging from $4 to $10 retail and approximately $1wholesale.
EEEExxxxhhhhiiiibbbbiiiitttt 33334444.... LLLLSSSSDDDD PPPPrrrriiiicccceeeessss iiiinnnn NNNNiiiinnnneeee CCCCEEEEWWWWGGGG CCCCiiiittttiiiieeeessss aaaannnndddd FFFFoooouuuurrrr TTTTeeeexxxxaaaassss SSSSiiiitttteeeessss
Area Price/Dose OtherAtlanta $4–$10 $1 dose wholesaleBoston $5 $300/100 dosesChicago $5 NRHonolulu $4–$6 $225–$275/100 doseMinneapolis/St. Paul $5–$10 NRNew Orleans $1.50–$10 $200–$400/sheet
Phoenix $4 $3/dose for 3 or more;$140–$150/bottle (90 doses)
St. Louis $2–$4 NRTexas
DallasFort WorthHoustonLubbockTyler
$0.60–$10$6–$10
NR$7
$5–$10
NRNR
$160–$180/bottleNRNR
Washington, D.C. $3–$7 $800/sheet (100 doses)
SOURCE: CEWG reports December 2001

67
DEXTROMETHORPHAN (DXM)
DXM, a substance found in over-the-counter (OTC) cough and cold medications, was identifiedas an emerging drug of abuse among adolescents in five CEWG areas. DXM is part of themorphine drug group, and DXM capsules have been sold as ecstasy at raves. Chemically, it issimilar to opiates but it does not produce the same effects as opiates. In low doses DXM cancause an intoxicated energetic feeling. School personnel in Minneapolis/St. Paul and Texasreported problems with abuse of DXM. In Seattle, three deaths during the first half of 2001involved the drug. In Denver, adolescents have been reported to steal Coricidin HBP (whichcontains high concentrations of DXM), while case reports regarding DXM are increasing at theChildren’s Hospital of Michigan.
Denver
Detroit
Minneapolis
Seattle
Texas
A Denver area program reported that its younger clients say DXM is verypopular, but it has not yet shown up as a primary drug of abuse. Programpersonnel stated that adolescents steal Coricidin HBP (which contains 30milligrams of DXM), from pharmacies and eat 6–12 pills at a time.
Intentional abuse of Coricidin HBP is increasing in case reports to Children’sHospital of Michigan. These tablets contain DXM. Multiple tablets are takenfor a dissociative effect; use of up to 40 pills at 1 time has been reported.During 2000, 44 cases were reported, while in the first 10 months of 2001there have been at least 52 cases involving this drug.
School-based counselors reported the intermittent abuse of DXM. Thesubstance is found in cough medications and sold as a powder or in clearcapsules for $5. Hennepin Regional Poison Center received 62 calls regardingexposures to products containing DXM in 2001 (through October2001).
During the first half of 2001, three deaths involved DXM, an increasinglypopular club drug with particularly dangerous interactions when used incombination with other drugs, especially alcohol. This new appearance ofDXM in ME reports (substantiated by anecdotal reports) may highlight theincreasing popularity of DXM (especially in cough syrup form) over the pastyear.
School personnel in Texas are reporting problems with the abuse of DXM,especially the use of Robitussin-DM, Tussin, and Coricidin Cough and ColdTablets HBP. These substances can be purchased over the counter, and iftaken in large quantities can produce hallucinogenic effects. Poison controlcenters reported 433 confirmed exposures to Coricidin in 2000, and 188through three quarters of 2001. DPS labs examined 12 substances in 1999 thatwere DXM, 34 in 2000, and 6 through October 2001.

68
INFECTIOUS DISEASES RELATED TO DRUG USE
HIV/AIDS
According to the CDC, injection drug use continues to be a common mode of exposure to HIV,which causes AIDS. As a mode of exposure, injection drug use is second only to male-to-malesex. Cumulatively, through December 2000, 25 percent of adult and adolescent AIDS casesinvolved injection drug use as the sole mode of exposure and another 6 percent involved the dualcategories of injection drug use and male-to-male sex.
Injection drug use continues to be a common mode of exposure among AIDS cases in CEWGareas, although cumulatively cases remained stable or declined in all areas except Illinoisbetween the December 2000 and 2001 reporting periods. Newark reported a decline of 16percentage points from the June 2001 reporting period, although injection drug use as anexposure mode remained high (40 percent of cumulative cases). Other CEWG areas reportinghigh percentages of AIDS cases related to injection drug use were New York City (45.0 percent),Philadelphia (36.8 percent), and Massachusetts (35.0 percent). The proportions in the dualcategory of injection drug use and male-to-male sex remained relatively stable in CEWG areas,at 2–12 percent.
The decline in the proportion of injection drug use exposure among cumulative AIDS patients,however, contrasts with the proportion of injecting drug users (IDUs) among new human HIV orAIDS cases in some CEWG areas. In Philadelphia, for instance, “injecting drug use was theidentified mode of exposure category in over 36 percent of total AIDS cases reported fromNovember 1981 through June 2001, but accounted for over 41 percent of cases identified in thelast 12 months of that period.” Similarly, in Chicago the proportion of new AIDS cases attributedto drug injection continued to increase, especially among women. Among San Franciscansdiagnosed in 1999–2001, heterosexual IDUs accounted for 17 percent, up from 9 percentamong those diagnosed 1993–1995. In Washington, DC, the proportion of cases attributable toinjection drug use is reportedly growing, while preliminary data from Boston show that theproportion of IDUs among new AIDS cases in 2000 (32 percent) decreased from 1999 (38percent).
Non-Whites continue to account for a disproportionately high number of injection-related AIDScases. In Los Angeles, for instance, Blacks continue as the modal group of IDUs (39 percent),followed by Whites (31 percent) and Hispanics (28 percent). The demography of the cumulativeheterosexual IDU caseload in San Francisco has remained relatively unchanged during the past10 years: 50 percent Black, 35 percent White, and 12 percent Hispanic. Similarly, in New YorkCity, Blacks continue to be the modal group among heterosexual IDUs, accounting for 47percent, followed by Hispanics (38 percent) and Whites (14 percent).
As in previous years, males constitute the majority of heterosexual injection-related AIDS casesin CEWG sites.

69
Hepatitis B and C
Hepatitis B. In San Francisco, reported cases of hepatitis B increased in 2001 to about four casesevery 3 weeks, up from approximately one case per week from 1996 to 2000. However, in LosAngeles, hepatitis B cases declined by 29 percent, during the first half of 2001 compared withthe first half of 2000.
Hepatitis C. Because of similar transmission routes, the prevalence of hepatitis C among IDUsin reporting CEWG areas remains high. In Minneapolis/St. Paul, the estimated rate of hepatitis Camong methadone patients runs as high as 90 percent. In Washington, D.C., the incidence of co-infection with hepatitis C is increasing among IDUs who are HIV–positive. Among hepatitis Ccases reported in Washington, D.C. in February–May 2001, the highest numbers were amongIDUs. Similarly, in a survey conducted by the Arizona Department of Health Services in FY2001, a history of injection drug use was the single largest risk factor for hepatitis C, and wasreported by 45 percent of respondents. An infection rate of 50–60 percent for hepatitis C wasreported among San Francisco area IDUs.


APPENDICES


APPENDIX A: Drug Abuse Warning Network (DAWN)Emergency Department Data
This voluntary national data collectionsystem, managed by the Office of AppliedStudies (OAS), Substance Abuse and MentalHealth Services Administration (SAMHSA),provides semiannual and annual estimates ofsubstance use manifested in visits to hospitalemergency departments (EDs) in 21 metro-politan areas, including 20 CEWG areas.
The data are gathered from a representativesample of hospitals in the 21 areas in 48States and the District of Columbia. Alaskaand Hawaii are not included in the sample.With few exceptions, the geographic areaboundaries correspond to the 1983 Office ofManagement and Budget definitions ofMetropolitan Statistical Area and PrimaryMetropolitan Statistical Area. Periodicminor modifications are made to the EDsample to keep it current. Analyses showthat such modifications have little impact ontrends across time. Various statisticalprocedures are used to enhance precision inthe sampling frame. By the end of 2000,685 hospitals were included in the sample.
ED data are reported for each “episode”(case or admission) that meets the criteriafor “drug abuser,” who is taking one or moresubstances without proper medicalsupervision, or for psychic effect,dependence, or suicide attempt or gesture.Each drug reported by a patient may becounted as a “mention.” Up to four drugsfor each episode may be recorded. Somedrugs are classified in a combined category,such as “cocaine/crack,” “heroin/morphine,”“marijuana/hashish,” and “PCP/PCPcombinations.”
ED mention data are converted to rates per100,000 population when sample sizespermit. A probability value of less than 0.5is used to determine statistical significance.
Because an individual may be counted inmore than one episode in a reporting period,and mention more than one drug during thatepisode, the DAWN ED data cannot be usedto estimate prevalence.

APPENDIX B: The Arrestee Drug Abuse Monitoring (ADAM) Program
Managed by the National Institute of Justice(NIJ), the ADAM program is designed togather drug use data quarterly from arresteesin 35 sites in the Unites States; 19 of thesesites provide data relevant to the CEWG.Data are reported annually by NIJ.
Beginning in 2000, the ADAM instrumentfor adult arrestees was revised and the adultmale sample was based on probabilitysampling procedures. For these reasons, the2000 (and beyond) data are not comparablewith data collected prior to 2000. In the2000 analyses, data on adult males, collectedat all 35 sites, were typically weighted.Adult female data, collected at most sites,were unweighted. Data on juvenilearrestees, collected at selected sites,continues to be based on the Drug UseForecasting (DUF) model.
Analyses and reporting of ADAM data focuson urinalysis results. Urinalysis providesconvirmation of use of 10 drugs within a2–3 day period prior to interview usingEnzyme Multiplied Immunoassay
Technology (EMIT). The urinalysis testsfor use of cocaine, opiates (e.g., heroin),marijuana, phencyclidine, methadone,methaqualone (Quaalude), propoxyphene(Darvon), barbiturates (e.g., Seconal,Tuinal), benzodiazepines (e.g., Valium,Ativan), and amphetamines. Gaschromatography mass spectrometry(GC/MS) confirms use of illicitmethamphetamine and amphetamines anddistinguishes them from over-the-countercompounds.
Self-report data on drug use are collected forparticular drugs and time periods (past 30days and past 12 months). Self-report dataalso cover demographic characteristics andinformation related to the need for andutilization of substance abuse treatment.
As in other arrestee data sets, the rate andtype of drug arrest may reflect changing lawenforcement practices (e.g., “crack downs”on specific population groups at specificpoints in time) rather than prevalence ofdrug use among the sampled arrestees.

APPENDIX C: The Domestic Monitor Program (DMP)
Under the jurisdiction of the IntelligenceDivision of the Drug EnforcementAdministration (DEA), the DMP reports onsources, types, cost, and purity of retail-levelheroin. The information is based on actualundercover heroin purchases made by theDEA on streets in 23 cities, 18 of which arein CEWG areas.
The heroin buys provide information on typeof heroin (Asian, Mexican, Columbian, orundetermined) and what diluents andadulterants are present in the drug. DMP
repots indicate where the buy was made, thebrand name (if any), purity level, and priceper milligram pure.
By comparing DMP data over time, it ispossible to assess changes in price permilligram pure and the sources of heroinpurchased in an area. Price and purity forparticular drugs can vary across years ifthere are only small numbers of buys madein a particular area.

APPENDIX D: Total Admission by Primary Substance of Abuseand CEWG Areas: 2000
AreaAlcohol
Only
Alcohol/OtherDrug
Cocaine/Crack
Heroin Marijuana StimulantsOtherDrugs
Total1
Atlanta (metro) NR 1,227 4,077 463 1,121 102 NR 6,990
Baltimore NR 4,842 3,449 14,316 4,240 6 NR 27,104
Boston 6,025 5,405 2,624 9,839 1,162 13 603 25,671
Denver (County) 8,692 889 454 563 419 107 106 11,230
Detroit (Wayne Co.) 4,112 4,308 4,584 975 6 691 14,676
Los Angeles 9,206 unknown 8,951 22,975 3,553 4,288 678 49,651
Miami (Broward Co.) NR NR 1,734 128 2,376 NR NR 6,422
Mpls./St. Paul 9,639 2,390 554 3,994 532 541 17,650
Newark NR 256 390 3,706 272 5 179 4,818
New Orleans (Parish) 689 NR 1,211 453 1,089 3 196 3,641
New York 8,905 13,901 14,708 22,126 12,447 138 2,140 74,365
Philadelphia 1,539 NR 1,914 958 865 24 221 5,521
St. Louis NR 2,096 4,277 1,589 3,131 354 354 11,801
San Diego (County) 1,899 1,974 1,300 1,452 2,447 4,507 232 13,811San Francisco(Bay Area) NR NR 8,727 19,763 2,135 4,505 472 35,130Seattle (King Co.) NR 2,967 1,435 1,974 2,108 830 457 9,771
Washington, D.C. 1,269 582 2,074 2,121 484 14 48 6,592
Hawaii 1,185 1,740 550 441 1,443 2,419 232 8,110
Illinois 44,951 31,468 18,422 20,773 1,270 8,718 125,602
Texas 6,292 6,280 10,988 4,518 6,578 1,878 1,866 38,400
NR = Not reported or represents both alcohol only and alcohol in combination.1 Total numbers shown may underrepresent total admissions because “alcohol only” or “other drugs” were not reported.SOURCE: CEWG 2000 and 2001 reports and treatment admissions forms, and forms, and for Los Angeles, the California Drug DataSystem