Embed Size (px)
DESCRIPTION
Epidemiologic and Research Applications in Community Nursing. Lecture objectives:. After studying this chapter, you should be able to: Interpret and use basic epidemiologic, demographic, and statistical measures of community health. - PowerPoint PPT Presentation
Citation preview

Epidemiologic and Research Applications in Community Nursing
Epidemiologic and Research Applications in Community Nursing
Lecture objectives:Lecture objectives:
After studying this chapter, you should be able to:
Interpret and use basic epidemiologic, demographic, and statistical measures of community health.
Apply principles of epidemiology and demography to the practice of community health.
Discuss priority areas for research in community and public health nursing
Describe the stages of the research process, including methodological considerations
EpidemiologyEpidemiology
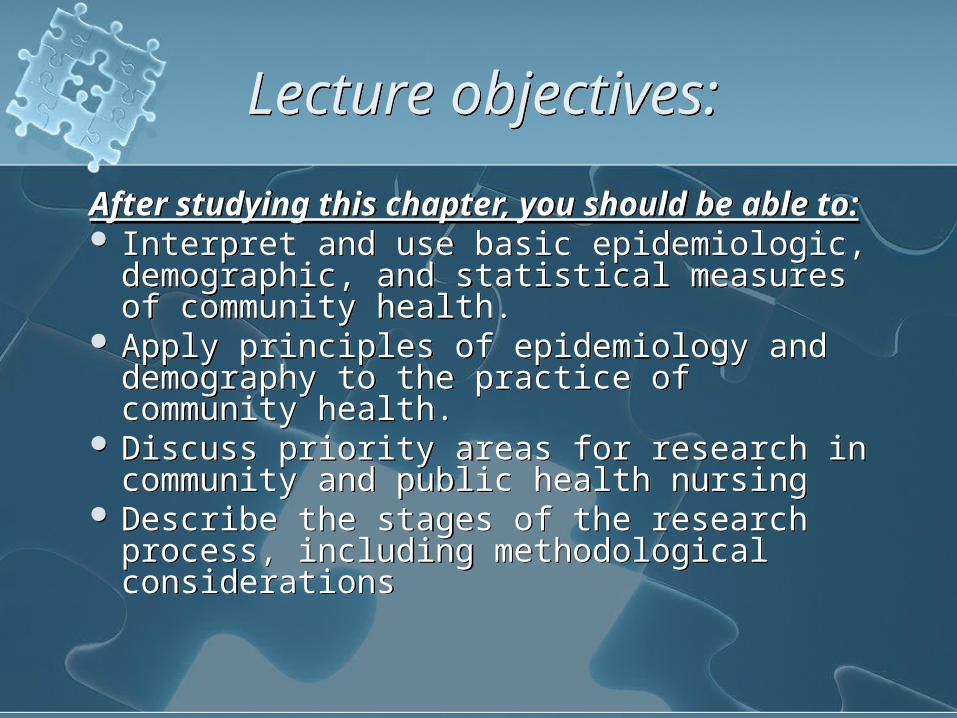
“the study of the distribution and determinants of disease frequency”
MacMahon, B: Epidemiology: Principles and Methods, 1970.
“the study of the distribution and determinants of health-related states or events in specified populations, and the
application of this study to control of health problems”
Last, 1995.
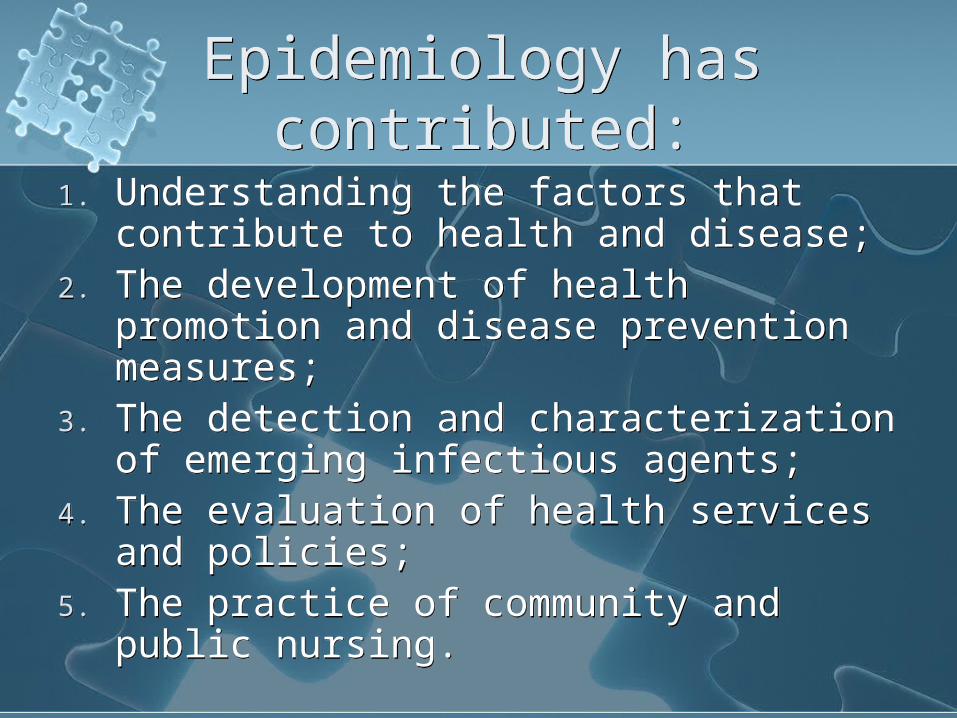
Epidemiology has contributed:
Epidemiology has contributed:
1. Understanding the factors that contribute to health and disease;
2. The development of health promotion and disease prevention measures;
3. The detection and characterization of emerging infectious agents;
4. The evaluation of health services and policies;
5. The practice of community and public nursing.

EpidemiologyEpidemiology
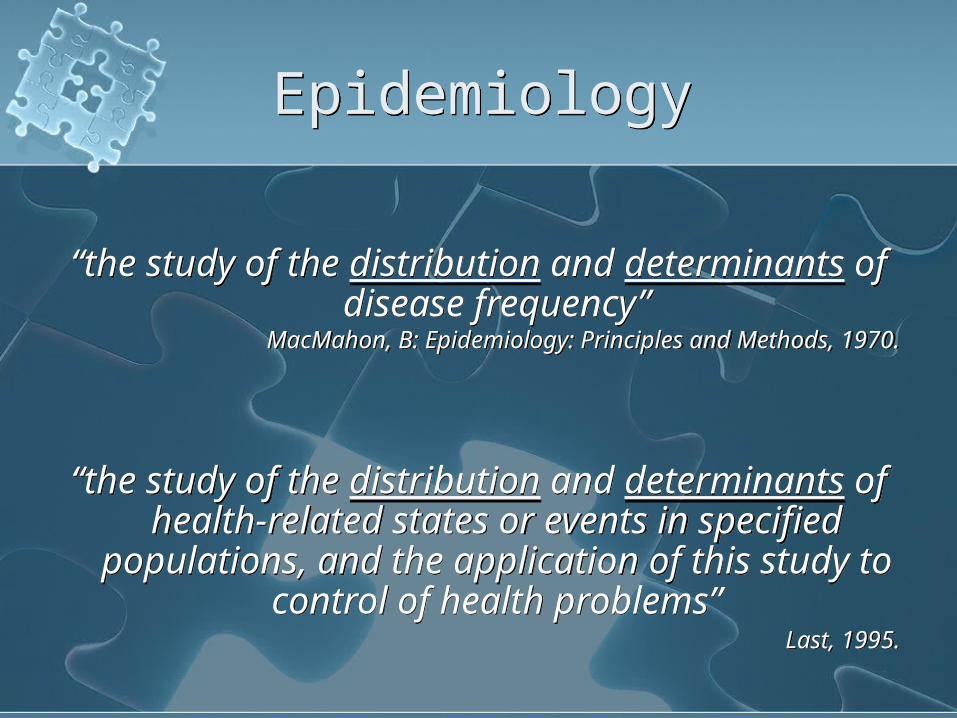
The term epidemiology originates from the Greek terms logos (study), demos (people), and epi (upon) that literally means the study of what is upon the people. The focus of study is disease occurrence among population groups; therefore, epidemiology is referred to as population medicine.population medicine.
The term epidemiology originates from the Greek terms logos (study), demos (people), and epi (upon) that literally means the study of what is upon the people. The focus of study is disease occurrence among population groups; therefore, epidemiology is referred to as population medicine.population medicine.
EpidemiologyEpidemiology
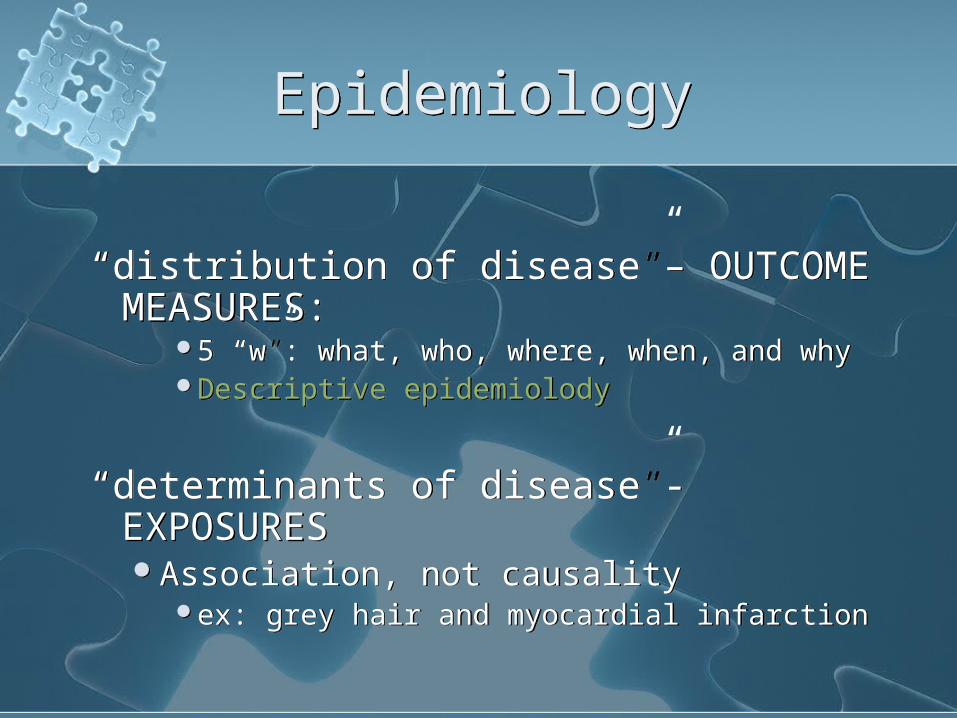
“distribution of disease”– OUTCOME MEASURES:
5 “w”: what, who, where, when, and whyDescriptive epidemiolody
“determinants of disease”- EXPOSURESAssociation, not causality
ex: grey hair and myocardial infarction
“distribution of disease”– OUTCOME MEASURES:
5 “w”: what, who, where, when, and whyDescriptive epidemiolody
“determinants of disease”- EXPOSURESAssociation, not causality
ex: grey hair and myocardial infarction
Epidemiology (cont)Epidemiology (cont)
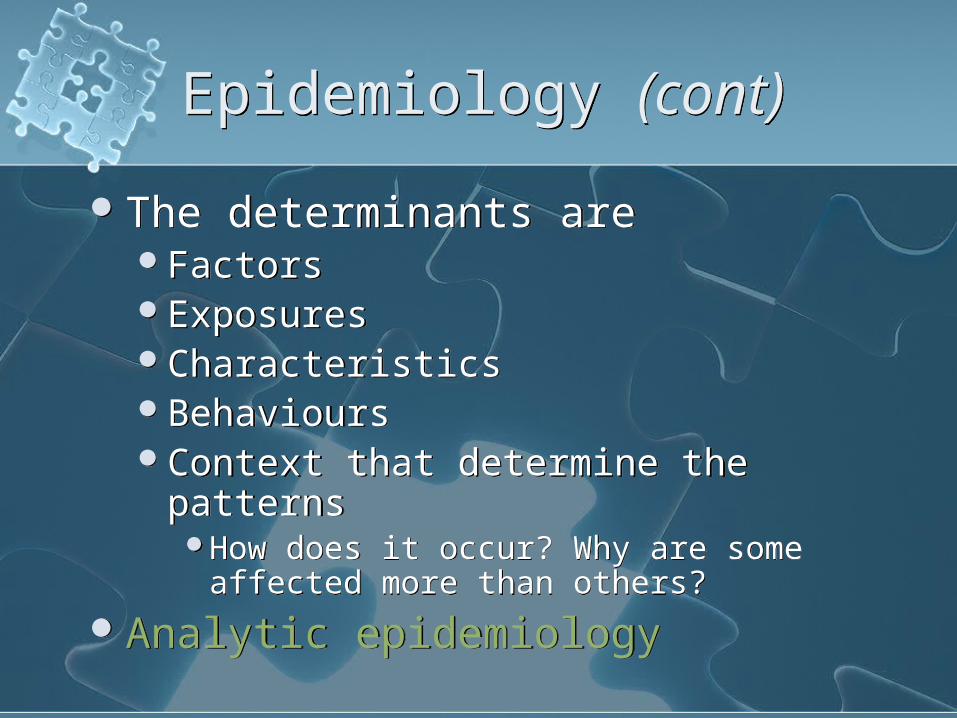
The determinants are FactorsExposuresCharacteristicsBehavioursContext that determine the patterns
How does it occur? Why are some affected more than others?
Analytic epidemiology
The determinants are FactorsExposuresCharacteristicsBehavioursContext that determine the patterns
How does it occur? Why are some affected more than others?
Analytic epidemiology
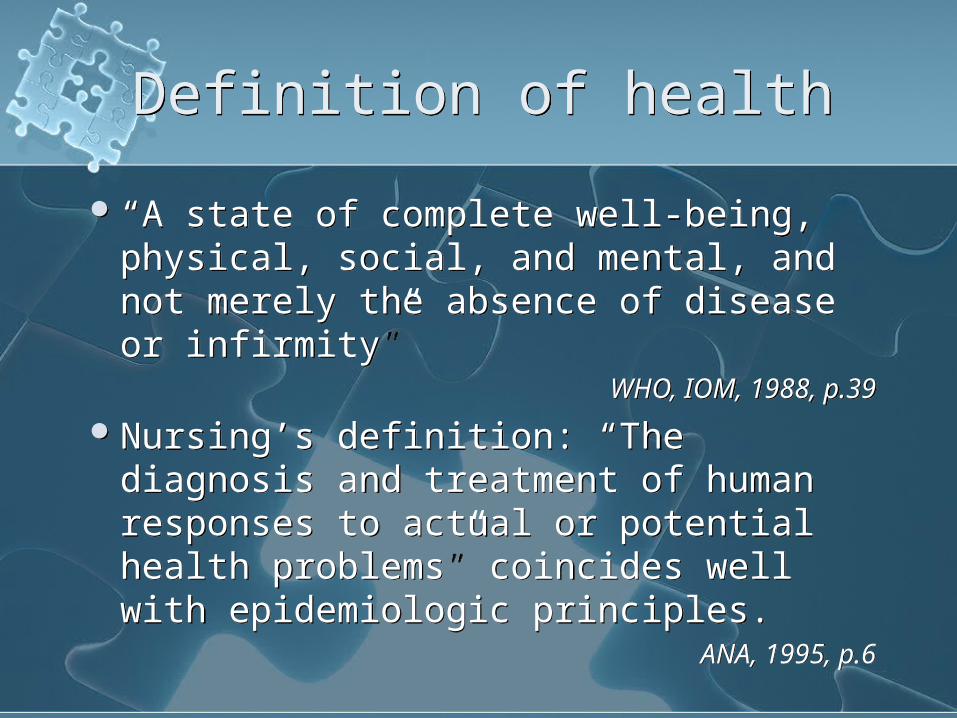
Definition of healthDefinition of health
“A state of complete well-being, physical, social, and mental, and not merely the absence of disease or infirmity”
WHO, IOM, 1988, p.39
Nursing’s definition: “The diagnosis and treatment of human responses to actual or potential health problems” coincides well with epidemiologic principles.
ANA, 1995, p.6
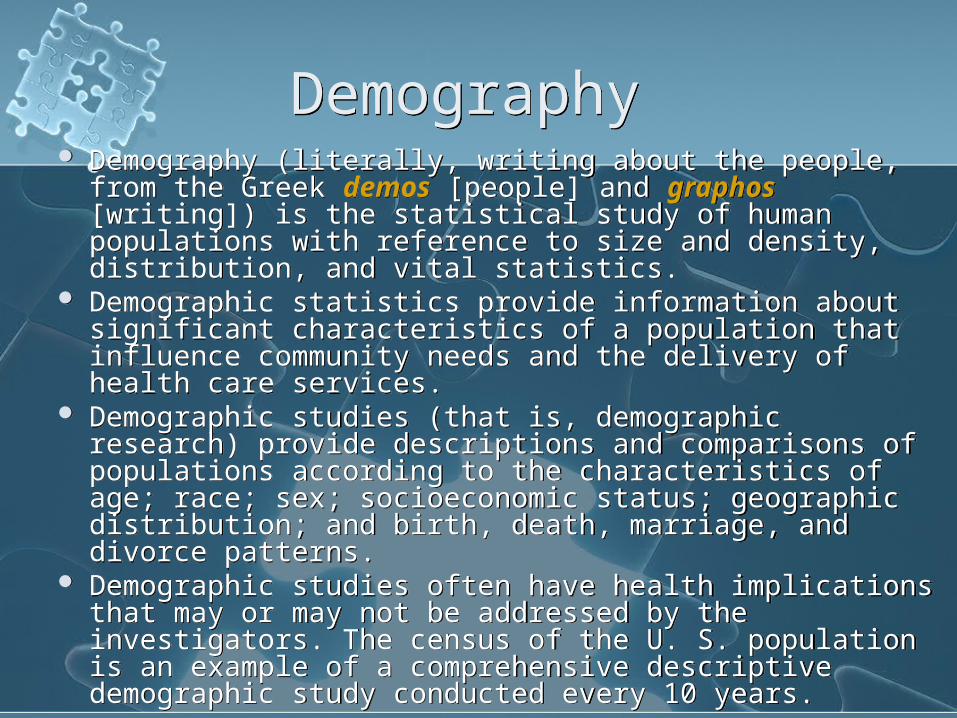
Demography Demography Demography (literally, writing about the people, from
the Greek demos [people] and graphos [writing]) is the statistical study of human populations with reference to size and density, distribution, and vital statistics.
Demographic statistics provide information about significant characteristics of a population that influence community needs and the delivery of health care services.
Demographic studies (that is, demographic research) provide descriptions and comparisons of populations according to the characteristics of age; race; sex; socioeconomic status; geographic distribution; and birth, death, marriage, and divorce patterns.
Demographic studies often have health implications that may or may not be addressed by the investigators. The census of the U. S. population is an example of a comprehensive descriptive demographic study conducted every 10 years.
Demography (literally, writing about the people, from the Greek demos [people] and graphos [writing]) is the statistical study of human populations with reference to size and density, distribution, and vital statistics.
Demographic statistics provide information about significant characteristics of a population that influence community needs and the delivery of health care services.
Demographic studies (that is, demographic research) provide descriptions and comparisons of populations according to the characteristics of age; race; sex; socioeconomic status; geographic distribution; and birth, death, marriage, and divorce patterns.
Demographic studies often have health implications that may or may not be addressed by the investigators. The census of the U. S. population is an example of a comprehensive descriptive demographic study conducted every 10 years.


Changes in one of the elements of the triangle can influence the occurrence of disease by increasing or decreasing a person’s risk for disease.
Risk is understood as the probability an individual will become ill.
Changes in one of the elements of the triangle can influence the occurrence of disease by increasing or decreasing a person’s risk for disease.
Risk is understood as the probability an individual will become ill.
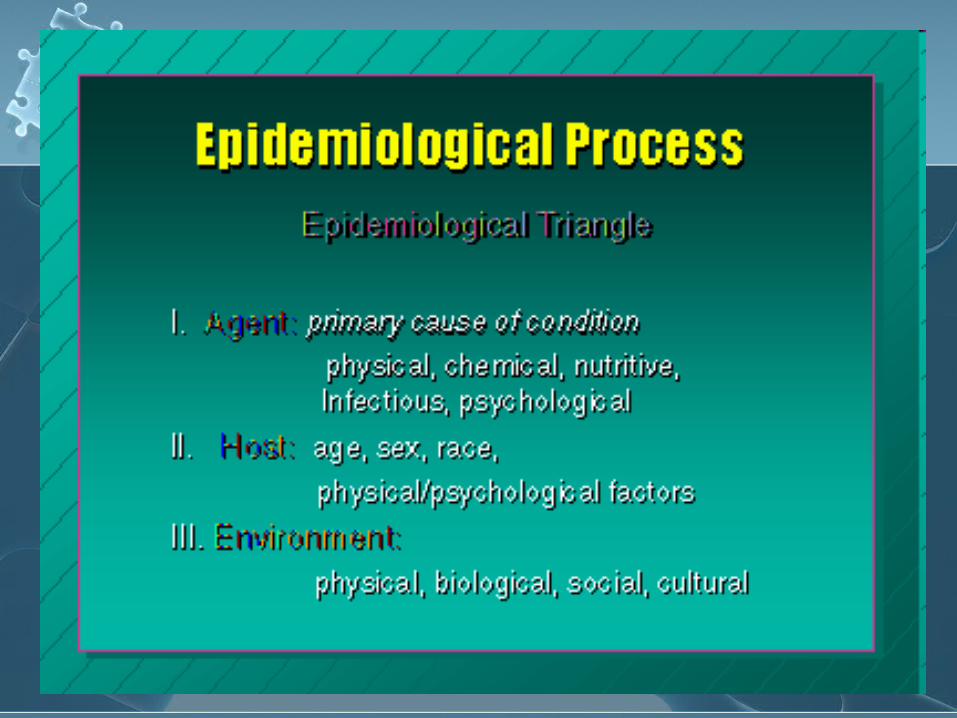
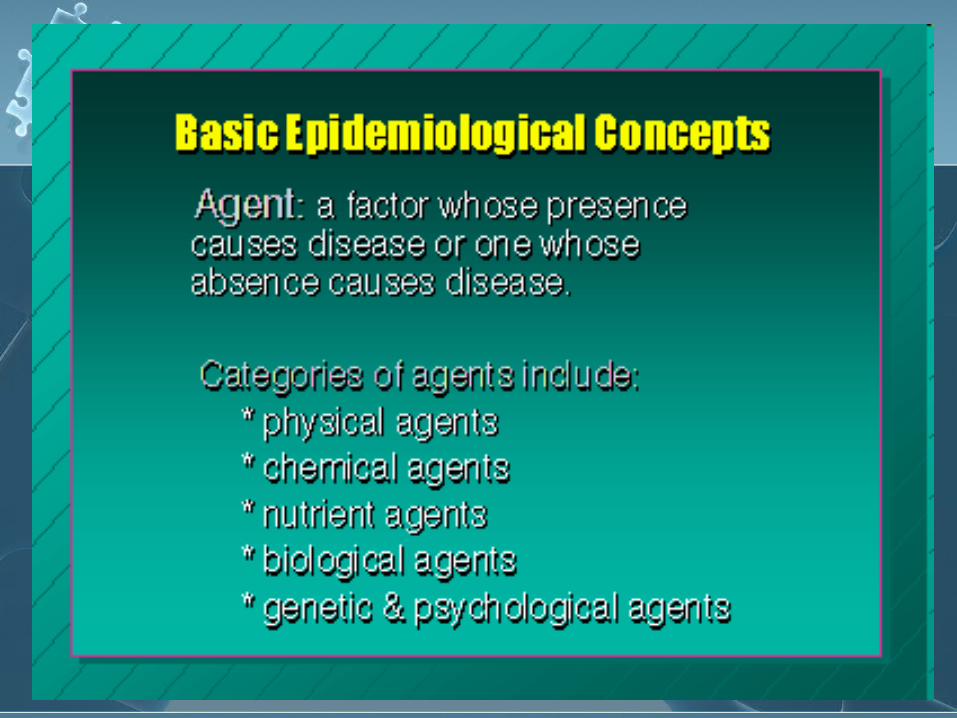
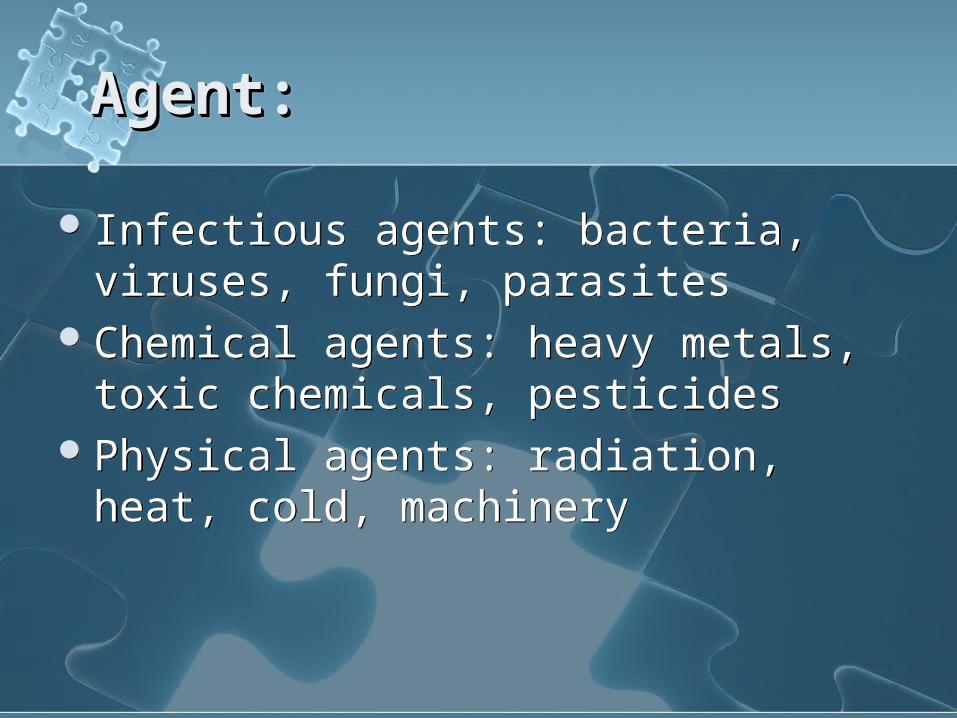
Agent:Agent:Agent:Agent:
Infectious agents: bacteria, viruses, fungi, parasites
Chemical agents: heavy metals, toxic chemicals, pesticides
Physical agents: radiation, heat, cold, machinery
Infectious agents: bacteria, viruses, fungi, parasites
Chemical agents: heavy metals, toxic chemicals, pesticides
Physical agents: radiation, heat, cold, machinery
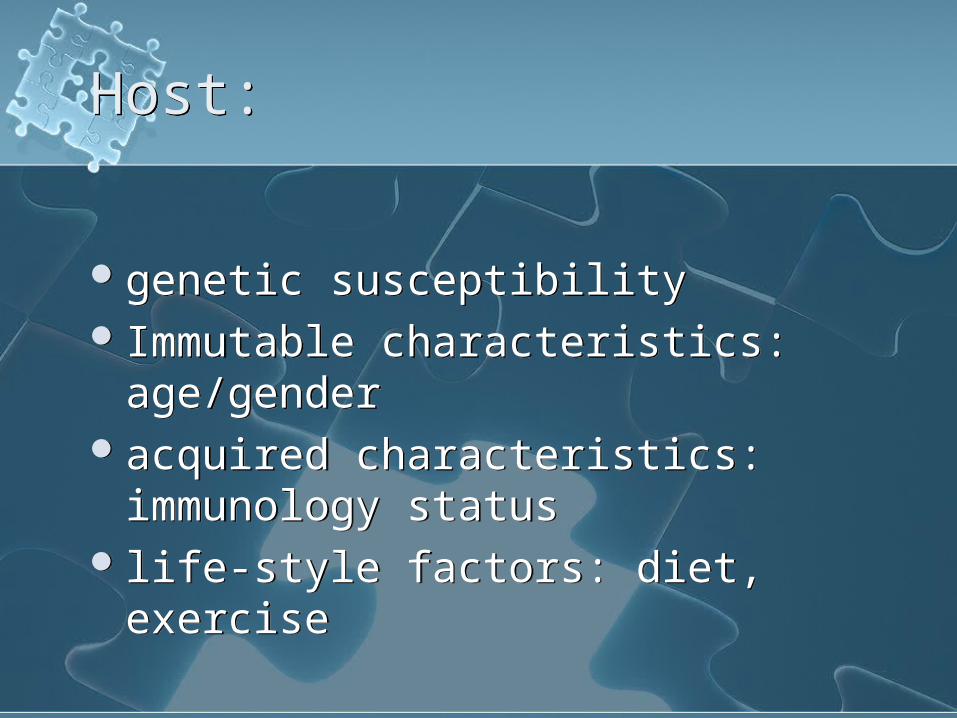
Host:Host:
genetic susceptibility Immutable characteristics:
age/gender acquired characteristics:
immunology status life-style factors: diet, exercise
genetic susceptibility Immutable characteristics:
age/gender acquired characteristics:
immunology status life-style factors: diet, exercise
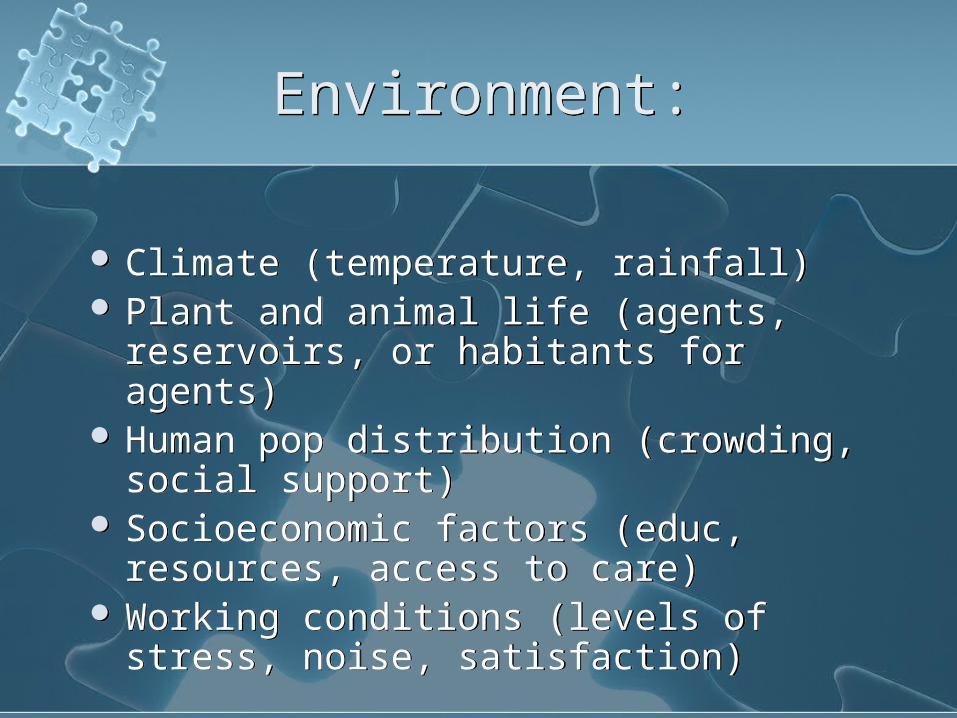
Environment:Environment:
Climate (temperature, rainfall) Plant and animal life (agents,
reservoirs, or habitants for agents) Human pop distribution (crowding,
social support) Socioeconomic factors (educ,
resources, access to care) Working conditions (levels of stress,
noise, satisfaction)
Climate (temperature, rainfall) Plant and animal life (agents,
reservoirs, or habitants for agents) Human pop distribution (crowding,
social support) Socioeconomic factors (educ,
resources, access to care) Working conditions (levels of stress,
noise, satisfaction)

Sources of DataSources of Data
1. Routinely collected data: Census data, vital records (birth and
death certificate), surveillance data (systematic collection of data concerning disease occurrence)
2. Data collected for other purposes: Hospital records, cancer registries,
occupational exposures
3. Epidemiologic data Original data collected for specific
epidemiologic studies
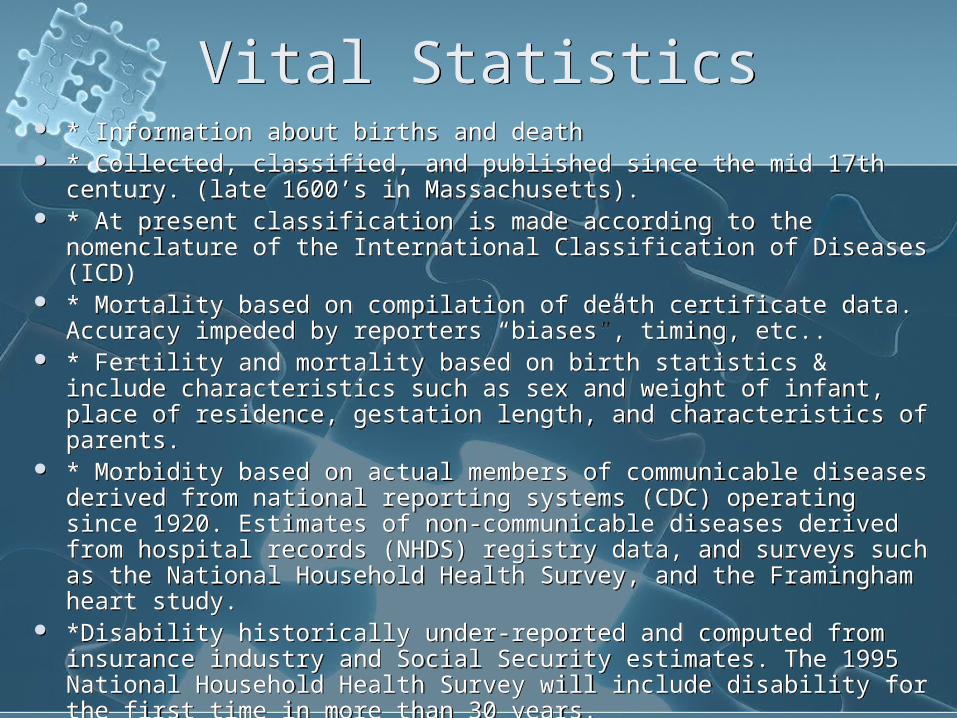
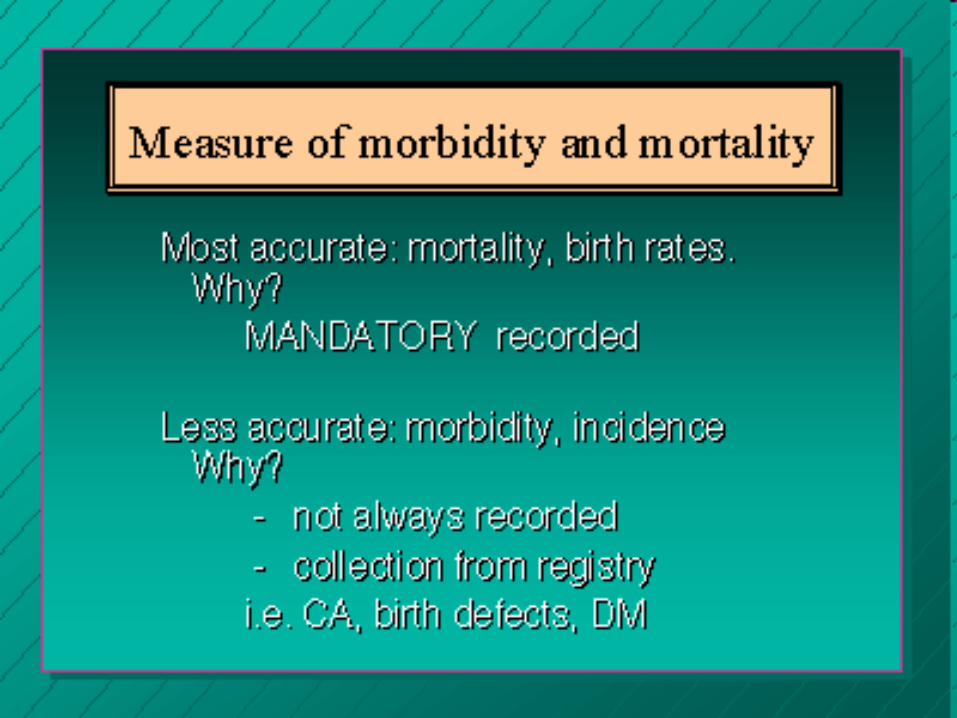
Vital StatisticsVital Statistics * Information about births and death * Collected, classified, and published since the mid 17th century.
(late 1600’s in Massachusetts). * At present classification is made according to the
nomenclature of the International Classification of Diseases (ICD) * Mortality based on compilation of death certificate data.
Accuracy impeded by reporters “biases”, timing, etc.. * Fertility and mortality based on birth statistics & include
characteristics such as sex and weight of infant, place of residence, gestation length, and characteristics of parents.
* Morbidity based on actual members of communicable diseases derived from national reporting systems (CDC) operating since 1920. Estimates of non-communicable diseases derived from hospital records (NHDS) registry data, and surveys such as the National Household Health Survey, and the Framingham heart study.
*Disability historically under-reported and computed from insurance industry and Social Security estimates. The 1995 National Household Health Survey will include disability for the first time in more than 30 years.
* Information about births and death * Collected, classified, and published since the mid 17th century.
(late 1600’s in Massachusetts). * At present classification is made according to the
nomenclature of the International Classification of Diseases (ICD) * Mortality based on compilation of death certificate data.
Accuracy impeded by reporters “biases”, timing, etc.. * Fertility and mortality based on birth statistics & include
characteristics such as sex and weight of infant, place of residence, gestation length, and characteristics of parents.
* Morbidity based on actual members of communicable diseases derived from national reporting systems (CDC) operating since 1920. Estimates of non-communicable diseases derived from hospital records (NHDS) registry data, and surveys such as the National Household Health Survey, and the Framingham heart study.
*Disability historically under-reported and computed from insurance industry and Social Security estimates. The 1995 National Household Health Survey will include disability for the first time in more than 30 years.
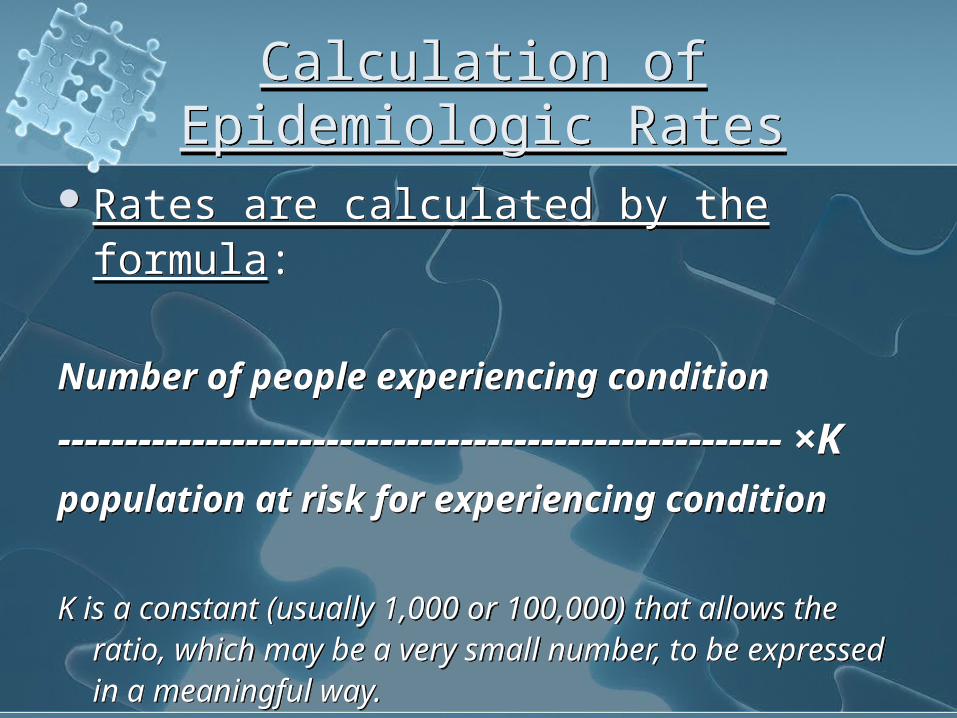
Calculation of Epidemiologic Rates
Calculation of Epidemiologic Rates
Rates are calculated by the formula:
Number of people experiencing condition
------------------------------------------------------ ×Κ
population at risk for experiencing condition
K is a constant (usually 1,000 or 100,000) that allows the ratio, which may be a very small number, to be expressed in a meaningful way.
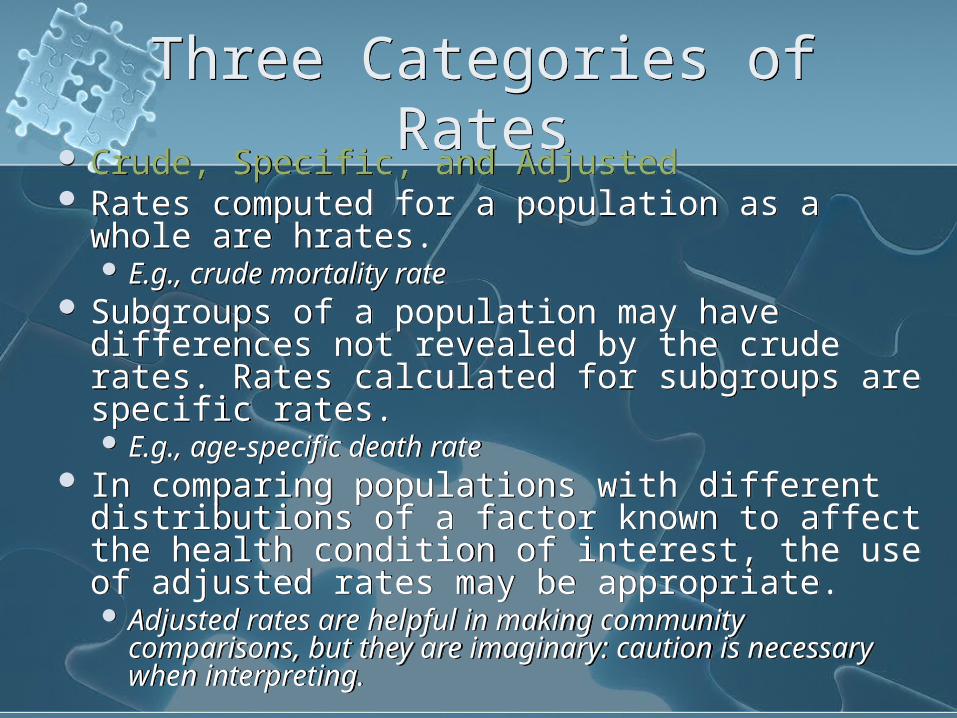
Three Categories of RatesThree Categories of Rates Crude, Specific, and Adjusted Rates computed for a population as a whole
are hrates. E.g., crude mortality rate
Subgroups of a population may have differences not revealed by the crude rates. Rates calculated for subgroups are specific rates. E.g., age-specific death rate
In comparing populations with different distributions of a factor known to affect the health condition of interest, the use of adjusted rates may be appropriate. Adjusted rates are helpful in making community
comparisons, but they are imaginary: caution is necessary when interpreting.
Crude, Specific, and Adjusted Rates computed for a population as a whole
are hrates. E.g., crude mortality rate
Subgroups of a population may have differences not revealed by the crude rates. Rates calculated for subgroups are specific rates. E.g., age-specific death rate
In comparing populations with different distributions of a factor known to affect the health condition of interest, the use of adjusted rates may be appropriate. Adjusted rates are helpful in making community
comparisons, but they are imaginary: caution is necessary when interpreting.

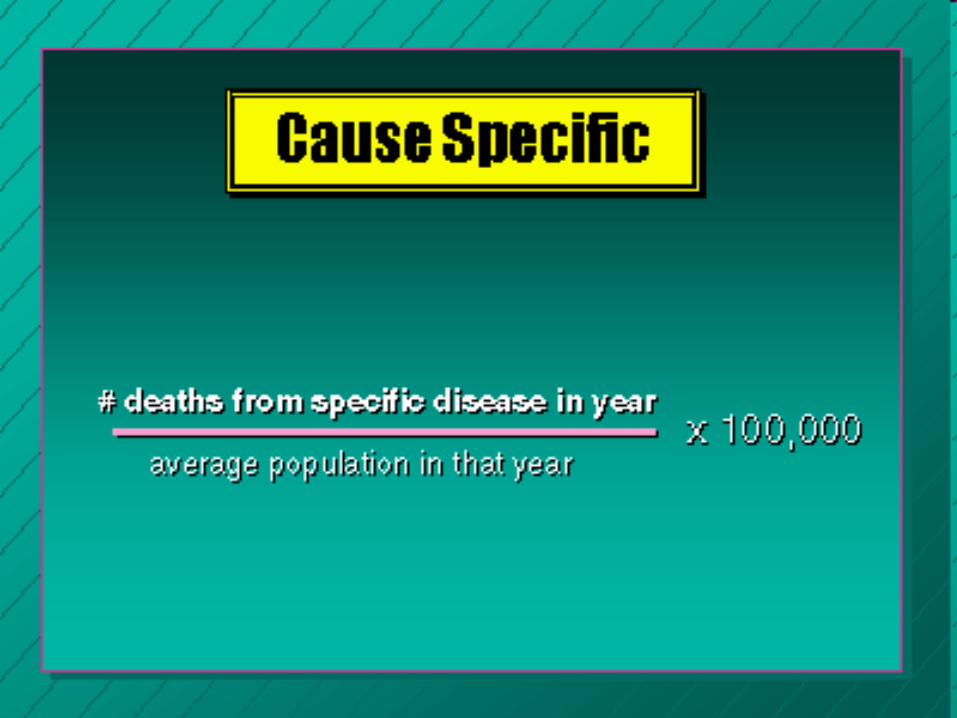
Mortality ratesMortality rates
Crude mortality rate Crude annual mortality rate
Age-specific rate Cause-specific rate Case-fatality rate Proportionate mortality ratio Infant mortality rate Neonatal mortality rate Postneonatal mortality rate
Crude mortality rate Crude annual mortality rate
Age-specific rate Cause-specific rate Case-fatality rate Proportionate mortality ratio Infant mortality rate Neonatal mortality rate Postneonatal mortality rate
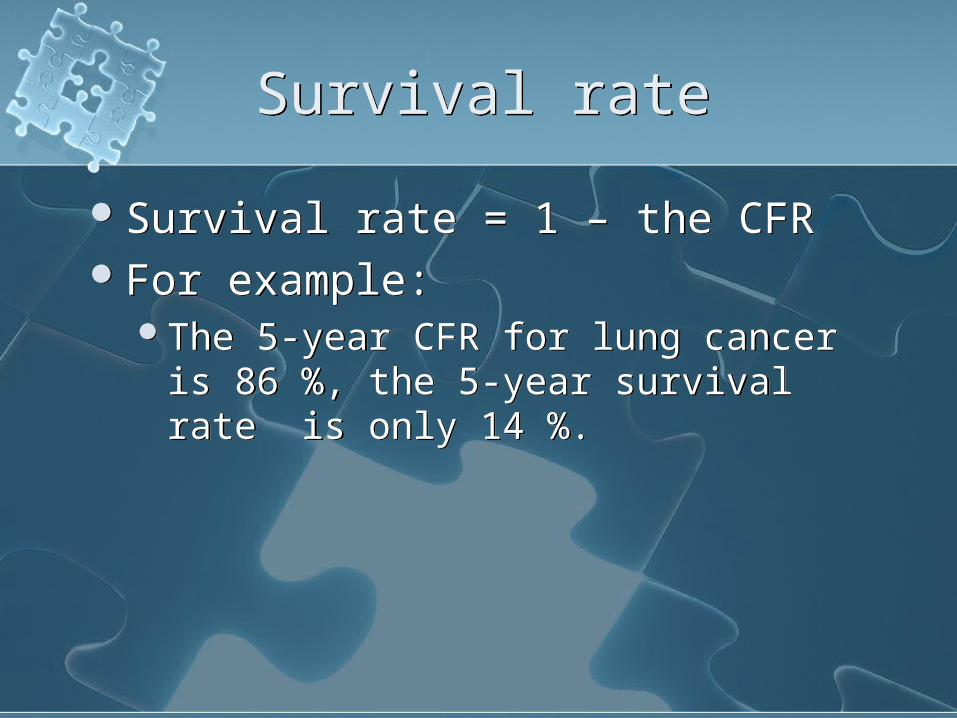
Survival rateSurvival rate
Survival rate = 1 – the CFR For example:
The 5-year CFR for lung cancer is 86 %, the 5-year survival rate is only 14 %.
Survival rate = 1 – the CFR For example:
The 5-year CFR for lung cancer is 86 %, the 5-year survival rate is only 14 %.

Variations in Mortality and Morbidity
Variations in Mortality and Morbidity
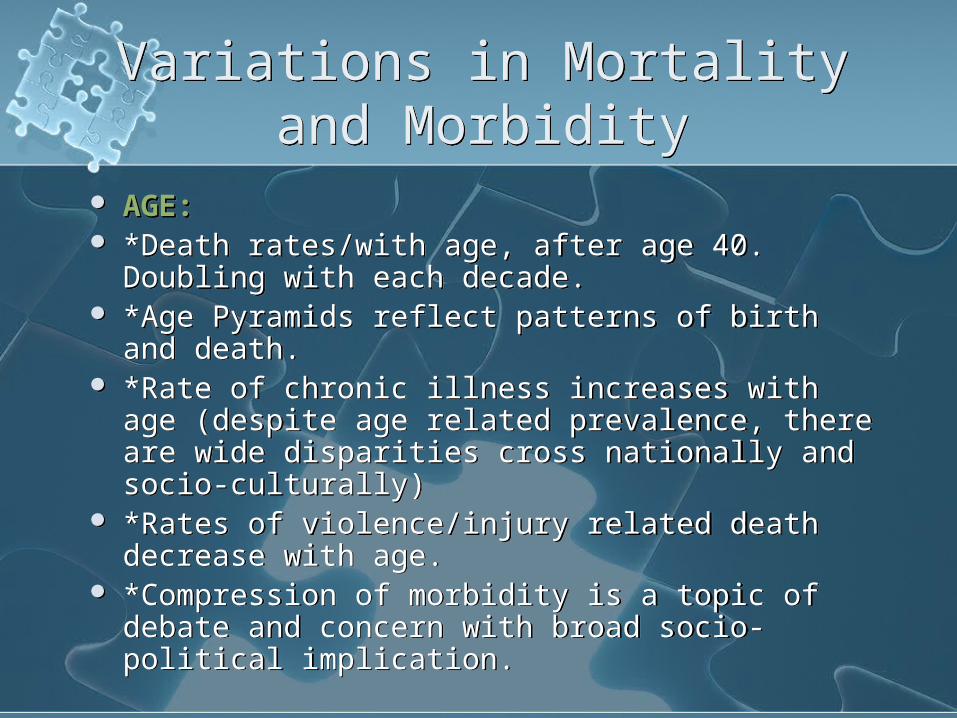
AGE: AGE: *Death rates/with age, after age 40. Doubling
with each decade. *Age Pyramids reflect patterns of birth and
death. *Rate of chronic illness increases with age
(despite age related prevalence, there are wide disparities cross nationally and socio-culturally)
*Rates of violence/injury related death decrease with age.
*Compression of morbidity is a topic of debate and concern with broad socio-political implication.
Variations in Mortality and Morbidity
Variations in Mortality and Morbidity
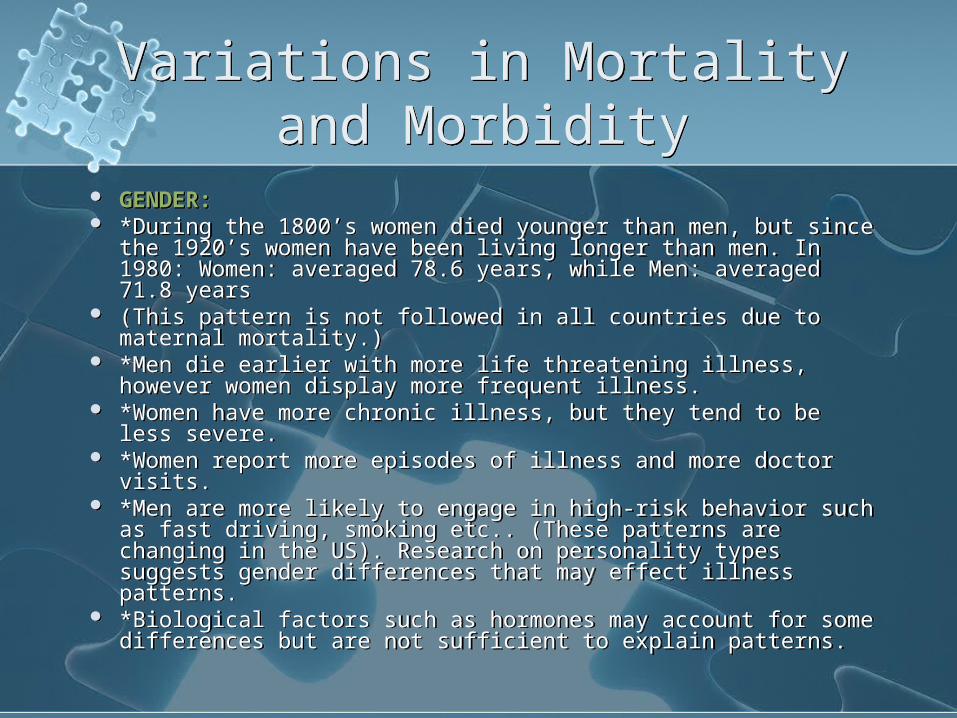
GENDER:GENDER: *During the 1800’s women died younger than men, but since
the 1920’s women have been living longer than men. In 1980: Women: averaged 78.6 years, while Men: averaged 71.8 years
(This pattern is not followed in all countries due to maternal mortality.)
*Men die earlier with more life threatening illness, however women display more frequent illness.
*Women have more chronic illness, but they tend to be less severe.
*Women report more episodes of illness and more doctor visits.
*Men are more likely to engage in high-risk behavior such as fast driving, smoking etc.. (These patterns are changing in the US). Research on personality types suggests gender differences that may effect illness patterns.
*Biological factors such as hormones may account for some differences but are not sufficient to explain patterns.
Variations in Mortality and Morbidity
Variations in Mortality and Morbidity
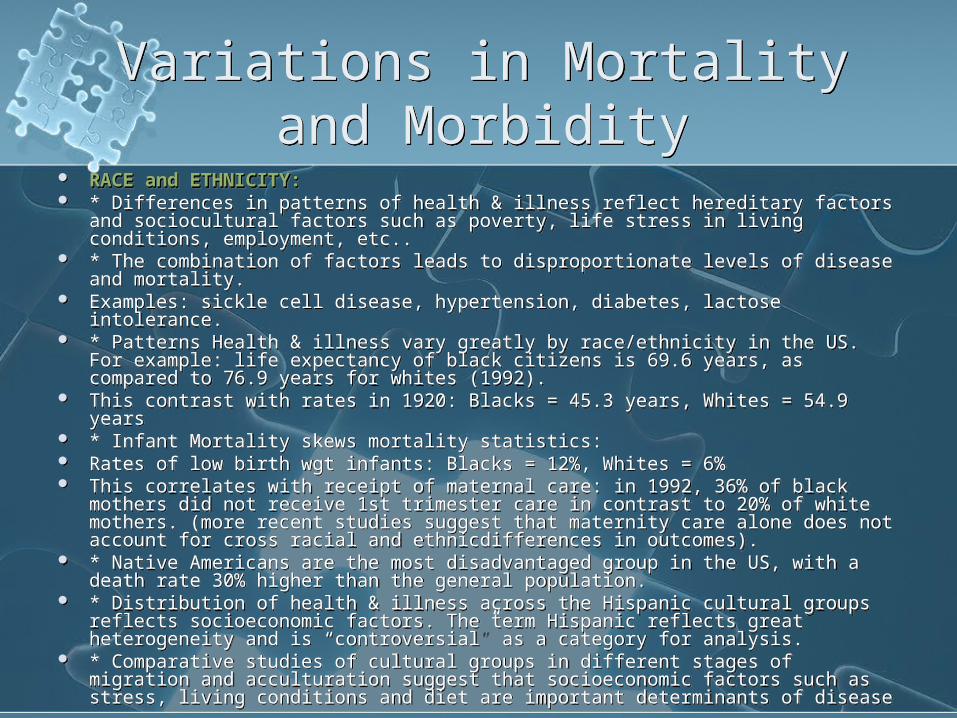
RACE and ETHNICITY:RACE and ETHNICITY: * Differences in patterns of health & illness reflect hereditary factors and
sociocultural factors such as poverty, life stress in living conditions, employment, etc..
* The combination of factors leads to disproportionate levels of disease and mortality.
Examples: sickle cell disease, hypertension, diabetes, lactose intolerance. * Patterns Health & illness vary greatly by race/ethnicity in the US. For
example: life expectancy of black citizens is 69.6 years, as compared to 76.9 years for whites (1992).
This contrast with rates in 1920: Blacks = 45.3 years, Whites = 54.9 years * Infant Mortality skews mortality statistics: Rates of low birth wgt infants: Blacks = 12%, Whites = 6% This correlates with receipt of maternal care: in 1992, 36% of black mothers
did not receive 1st trimester care in contrast to 20% of white mothers. (more recent studies suggest that maternity care alone does not account for cross racial and ethnicdifferences in outcomes).
* Native Americans are the most disadvantaged group in the US, with a death rate 30% higher than the general population.
* Distribution of health & illness across the Hispanic cultural groups reflects socioeconomic factors. The term Hispanic reflects great heterogeneity and is “controversial” as a category for analysis.
* Comparative studies of cultural groups in different stages of migration and acculturation suggest that socioeconomic factors such as stress, living conditions and diet are important determinants of disease
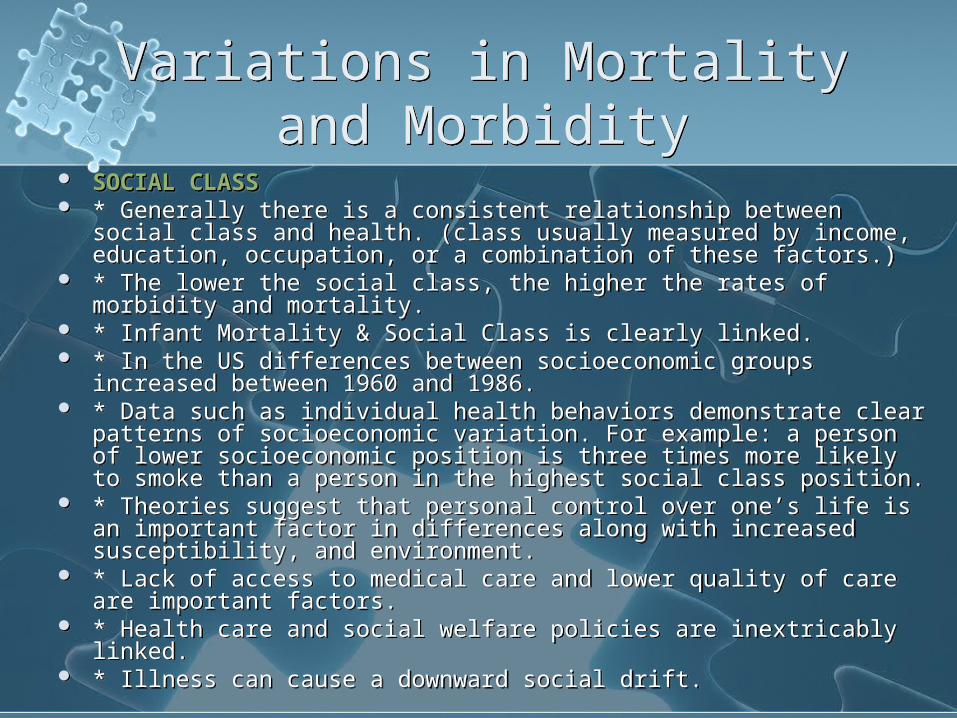
Variations in Mortality and Morbidity
Variations in Mortality and Morbidity
SOCIAL CLASSSOCIAL CLASS * Generally there is a consistent relationship between social class
and health. (class usually measured by income, education, occupation, or a combination of these factors.)
* The lower the social class, the higher the rates of morbidity and mortality.
* Infant Mortality & Social Class is clearly linked. * In the US differences between socioeconomic groups increased
between 1960 and 1986. * Data such as individual health behaviors demonstrate clear
patterns of socioeconomic variation. For example: a person of lower socioeconomic position is three times more likely to smoke than a person in the highest social class position.
* Theories suggest that personal control over one’s life is an important factor in differences along with increased susceptibility, and environment.
* Lack of access to medical care and lower quality of care are important factors.
* Health care and social welfare policies are inextricably linked. * Illness can cause a downward social drift.
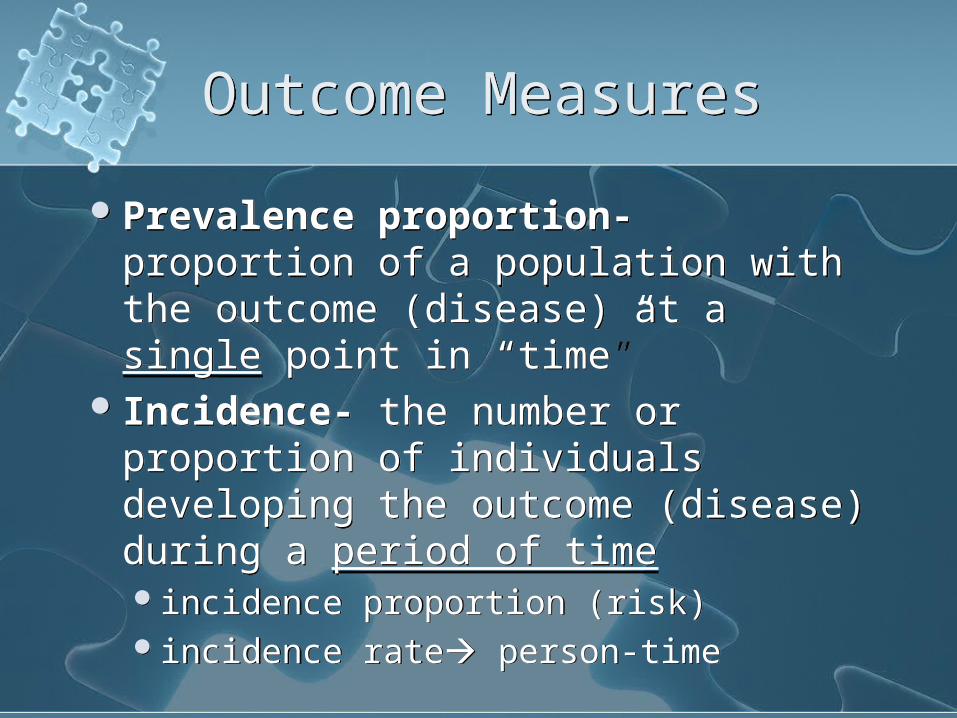
Outcome MeasuresOutcome Measures
Prevalence proportion- proportion of a population with the outcome (disease) at a single point in “time”
Incidence- the number or proportion of individuals developing the outcome (disease) during a period of timeincidence proportion (risk)incidence rate person-time
Prevalence proportion- proportion of a population with the outcome (disease) at a single point in “time”
Incidence- the number or proportion of individuals developing the outcome (disease) during a period of timeincidence proportion (risk)incidence rate person-time
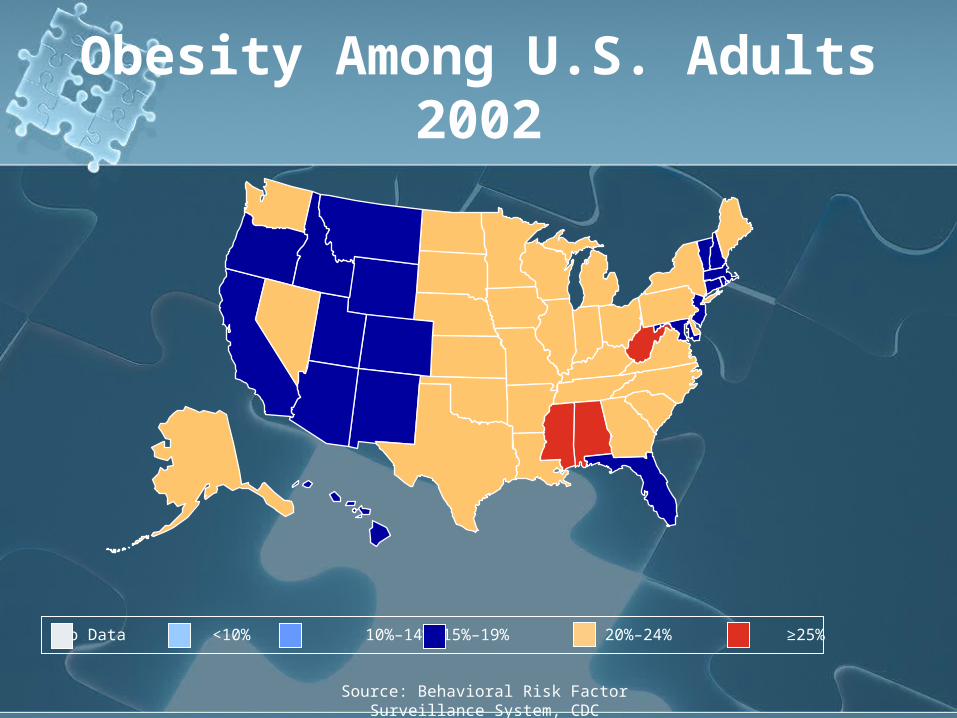
Source: Behavioral Risk Factor Surveillance System, CDC
No Data <10% 10%–14% 15%–19% 20%–24% ≥25%
Obesity Among U.S. Adults2002
Analytic Measures of Health
Analytic Measures of Health
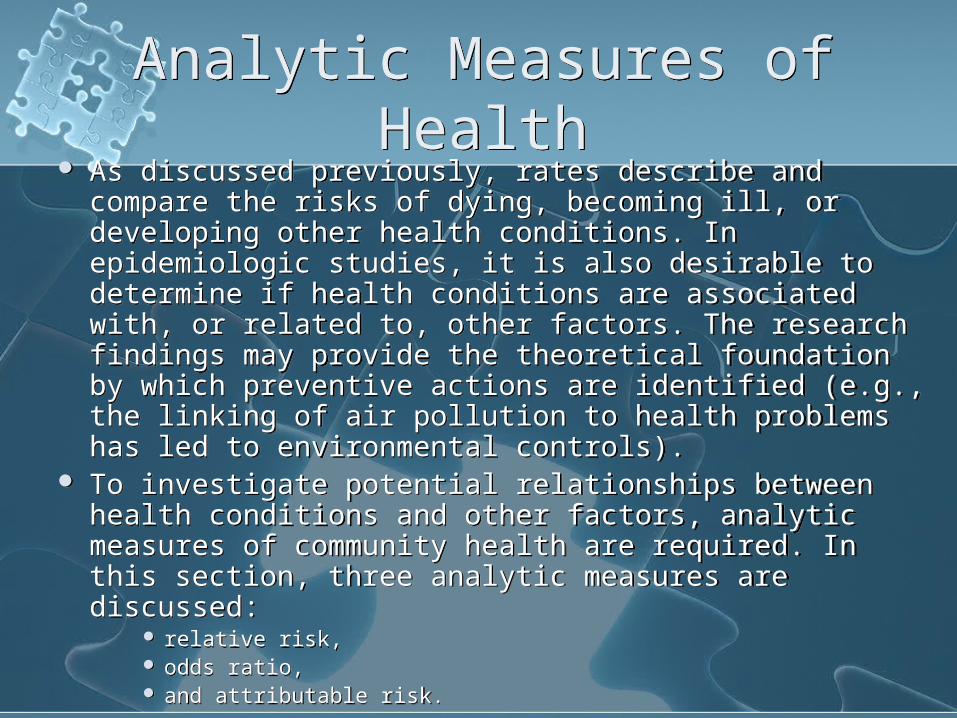
As discussed previously, rates describe and compare the risks of dying, becoming ill, or developing other health conditions. In epidemiologic studies, it is also desirable to determine if health conditions are associated with, or related to, other factors. The research findings may provide the theoretical foundation by which preventive actions are identified (e.g., the linking of air pollution to health problems has led to environmental controls).
To investigate potential relationships between health conditions and other factors, analytic measures of community health are required. In this section, three analytic measures are discussed:
relative risk, odds ratio, and attributable risk.

Measures of AssociationMeasures of Association
Outcome measures are descriptive characteristics about distribution of the outcomeex: what is the prevalence of lung
cancer?
How do we link exposures to outcomes?how do we quantitate this?ex: is smoking related to lung cancer?
Outcome measures are descriptive characteristics about distribution of the outcomeex: what is the prevalence of lung
cancer?
How do we link exposures to outcomes?how do we quantitate this?ex: is smoking related to lung cancer?
Measures of AssociationMeasures of Association
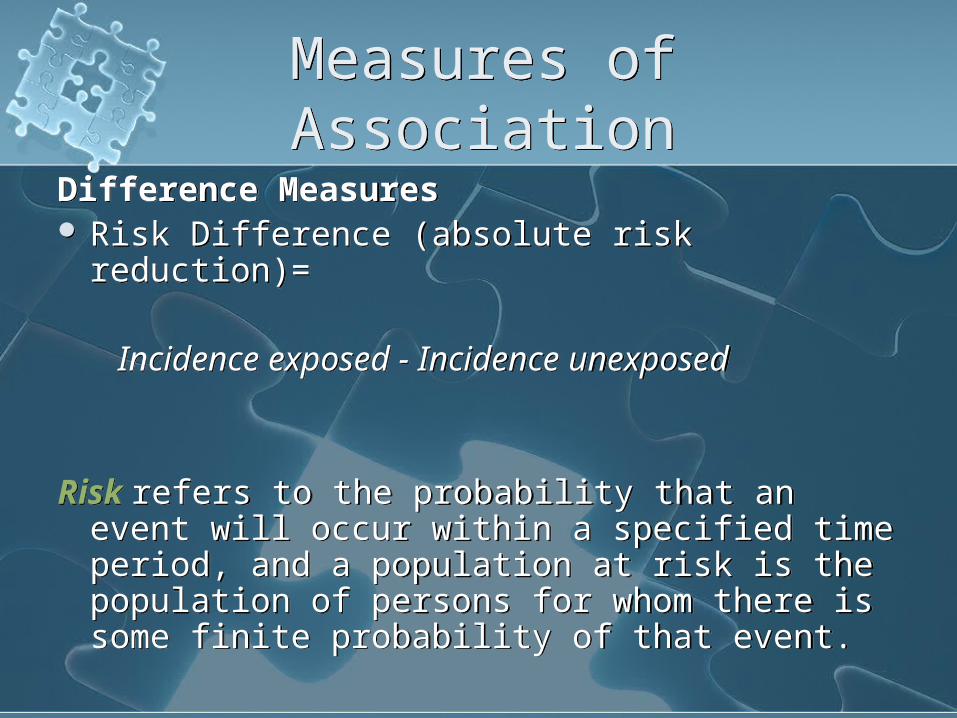
Difference Measures Risk Difference (absolute risk reduction)=
Incidence exposed - Incidence unexposed
Risk refers to the probability that an event will occur within a specified time period, and a population at risk is the population of persons for whom there is some finite probability of that event.
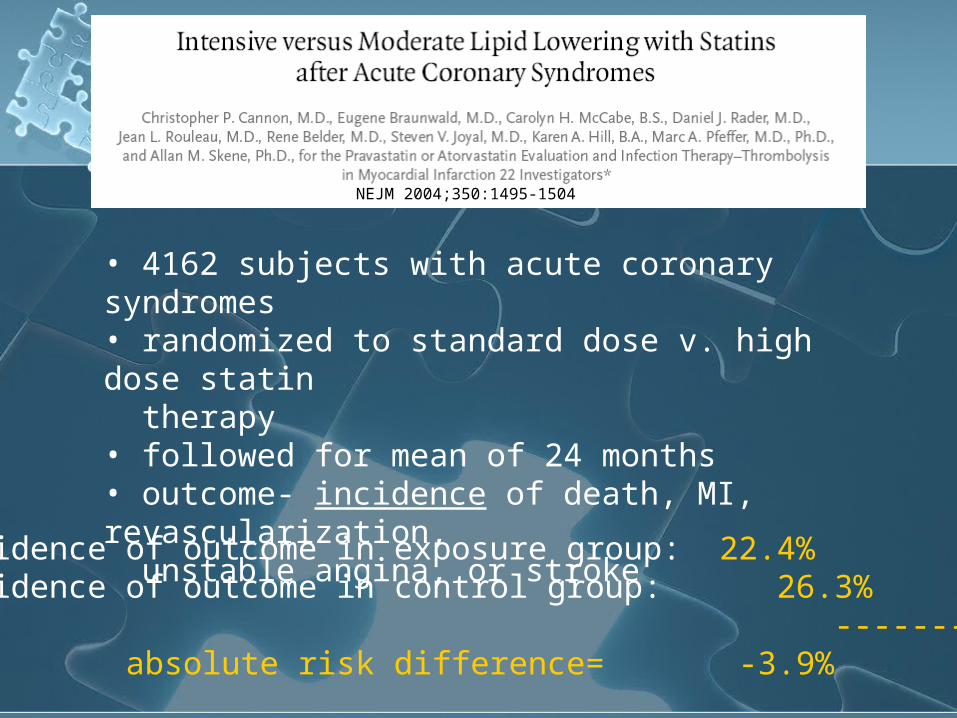
NEJM 2004;350:1495-1504
• 4162 subjects with acute coronary syndromes• randomized to standard dose v. high dose statin therapy• followed for mean of 24 months• outcome- incidence of death, MI, revascularization, unstable angina, or stroke
Incidence of outcome in exposure group: 22.4%Incidence of outcome in control group: 26.3%
---------absolute risk difference= -3.9%
Measures of AssociationMeasures of Association
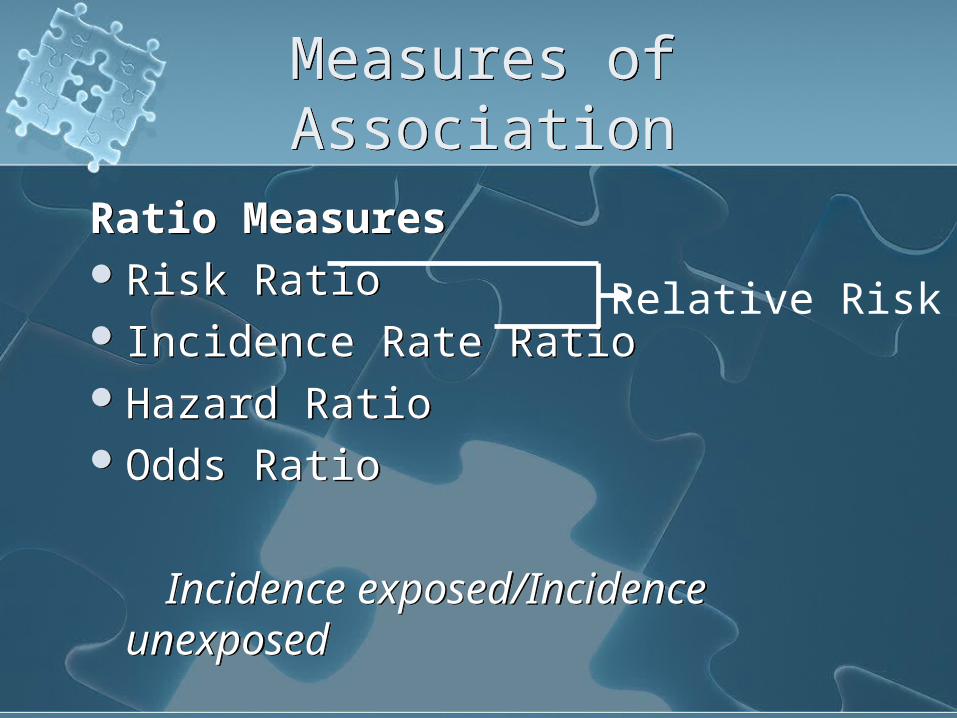
Ratio MeasuresRisk Ratio Incidence Rate RatioHazard RatioOdds Ratio
Incidence exposed/Incidence unexposed
Ratio MeasuresRisk Ratio Incidence Rate RatioHazard RatioOdds Ratio
Incidence exposed/Incidence unexposed
Relative Risk

The relative risk (RR)The relative risk (RR)
RR expresses the risk ratio of the incidence rate of those exposed (e.g., smokers) and those not exposed to the suspected factor (e.g., nonsmokers). The relative risk indicates the benefit that might accrue to the client if the risk factor is removed.
Incidence rate among those exposedRR =
--------------------------------------------------- Incidence rate among those not exposed
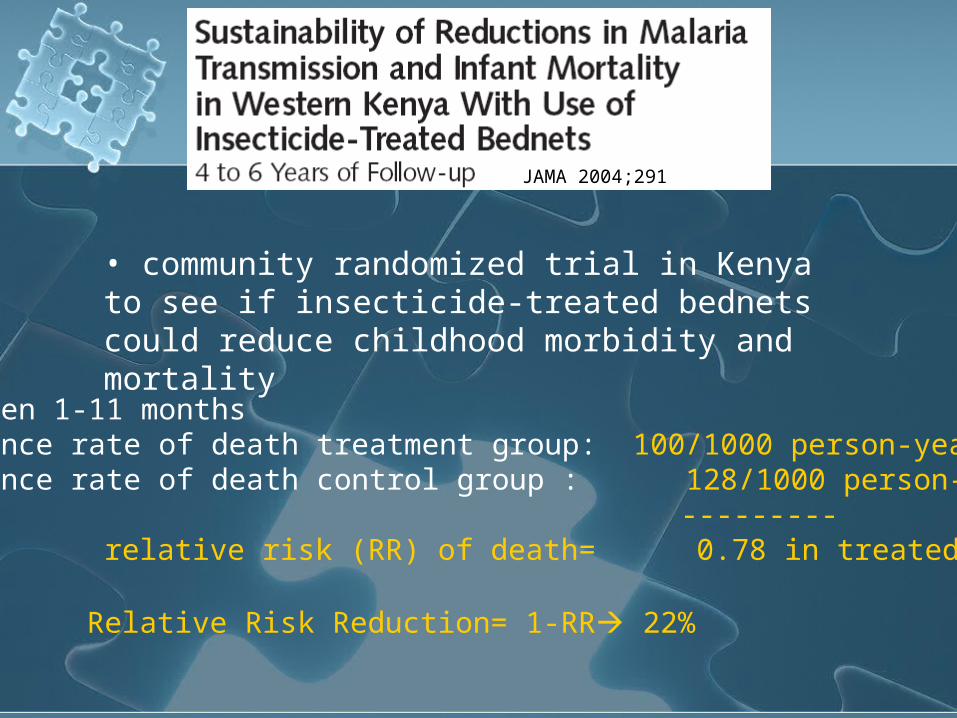
JAMA 2004;291
• community randomized trial in Kenya to see if insecticide-treated bednets could reduce childhood morbidity and mortality
Children 1-11 monthsIncidence rate of death treatment group: 100/1000 person-yearsIncidence rate of death control group : 128/1000 person-years
--------- relative risk (RR) of death= 0.78 in treated group
Relative Risk Reduction= 1-RR 22%
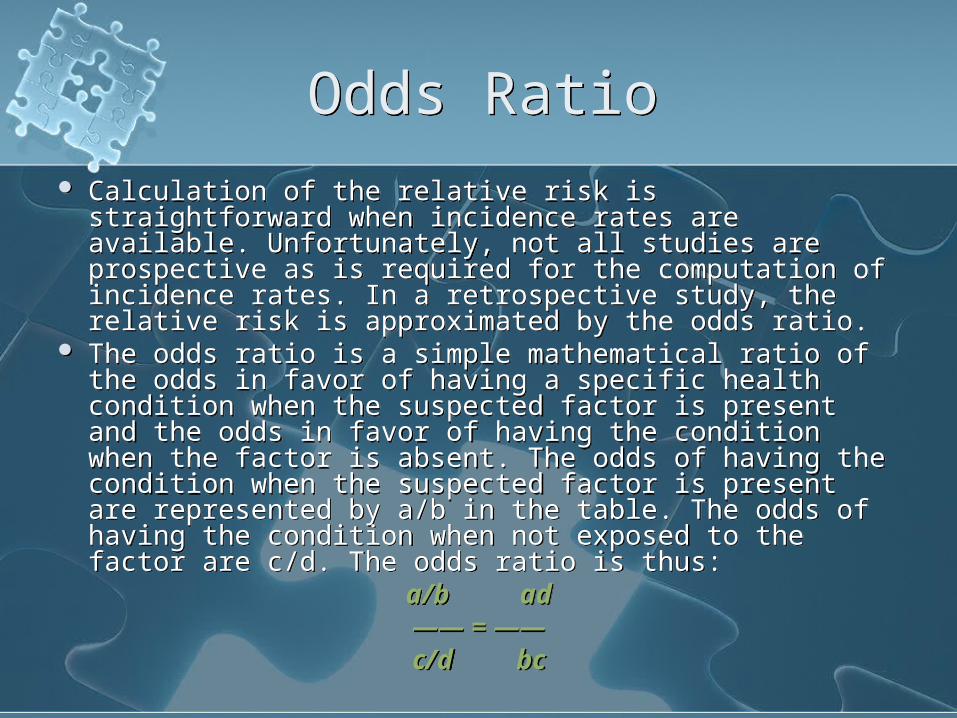
Odds RatioOdds Ratio
Calculation of the relative risk is straightforward when incidence rates are available. Unfortunately, not all studies are prospective as is required for the computation of incidence rates. In a retrospective study, the relative risk is approximated by the odds ratio.
The odds ratio is a simple mathematical ratio of the odds in favor of having a specific health condition when the suspected factor is present and the odds in favor of having the condition when the factor is absent. The odds of having the condition when the suspected factor is present are represented by a/b in the table. The odds of having the condition when not exposed to the factor are c/d. The odds ratio is thus:
a/b ad―― = ――c/d bc

Measures of ValidityMeasures of Validity
Internal ValidityChance- (p-value)BiasConfounding
External ValidityGeneralizability
Internal ValidityChance- (p-value)BiasConfounding
External ValidityGeneralizability
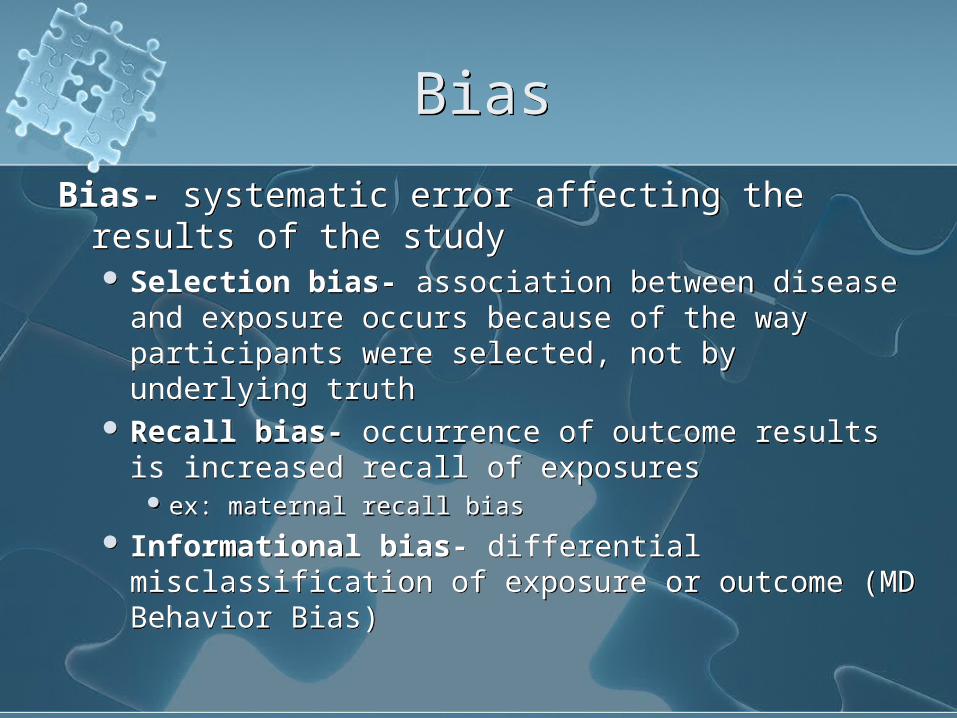
BiasBias
Bias- systematic error affecting the results of the study Selection bias- association between disease and
exposure occurs because of the way participants were selected, not by underlying truth
Recall bias- occurrence of outcome results is increased recall of exposures
ex: maternal recall bias Informational bias- differential misclassification
of exposure or outcome (MD Behavior Bias)
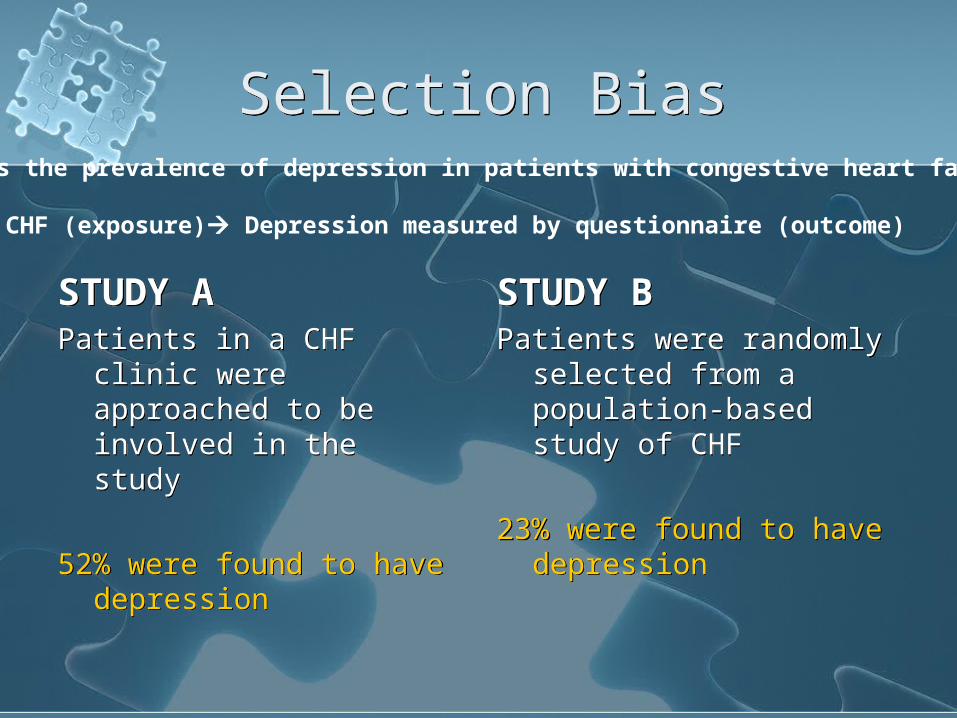
Selection BiasSelection Bias
STUDY APatients in a CHF clinic
were approached to be involved in the study
52% were found to have depression
STUDY APatients in a CHF clinic
were approached to be involved in the study
52% were found to have depression
STUDY BPatients were randomly
selected from a population-based study of CHF
23% were found to have depression
STUDY BPatients were randomly
selected from a population-based study of CHF
23% were found to have depression
What is the prevalence of depression in patients with congestive heart failure?
CHF (exposure) Depression measured by questionnaire (outcome)

ConfoundingConfounding
0
0,2
0,4
0,6
0,8
1
1,2
1,4
1,6
1,8
Aff
ecte
d b
abie
s/10
00
1 2 3 4 5
Birth Order
0
0,2
0,4
0,6
0,8
1
1,2
1,4
1,6
1,8
Aff
ecte
d b
abie
s/10
00
1 2 3 4 5
Birth Order
0
1
2
3
4
5
6
7
8
9
Aff
ecte
d b
abie
s/10
00
<20 20-24 25-29 30-34 35-39 40+
Maternal Age
0
1
2
3
4
5
6
7
8
9
Aff
ecte
d b
abie
s/10
00
<20 20-24 25-29 30-34 35-39 40+
Maternal Age
Confounding- mixing of the effect of an exposure on the outcome with the effect of another exposure Ex: Down’s Syndrome
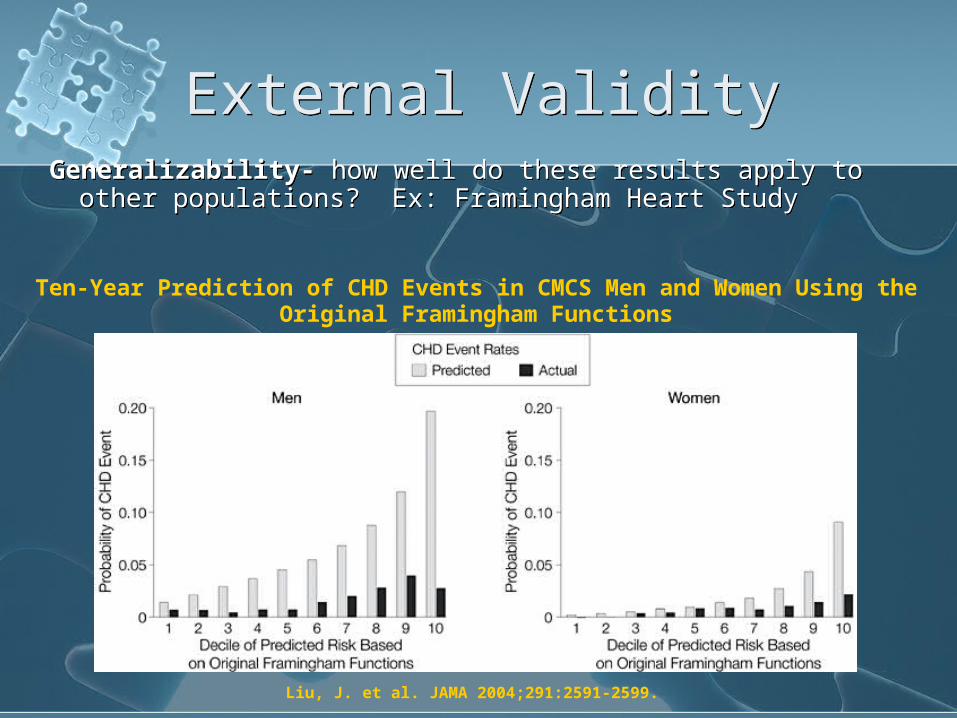
External ValidityExternal ValidityGeneralizability- how well do these results apply to
other populations? Ex: Framingham Heart StudyGeneralizability- how well do these results apply to
other populations? Ex: Framingham Heart Study
Liu, J. et al. JAMA 2004;291:2591-2599.
Ten-Year Prediction of CHD Events in CMCS Men and Women Using the Original Framingham Functions
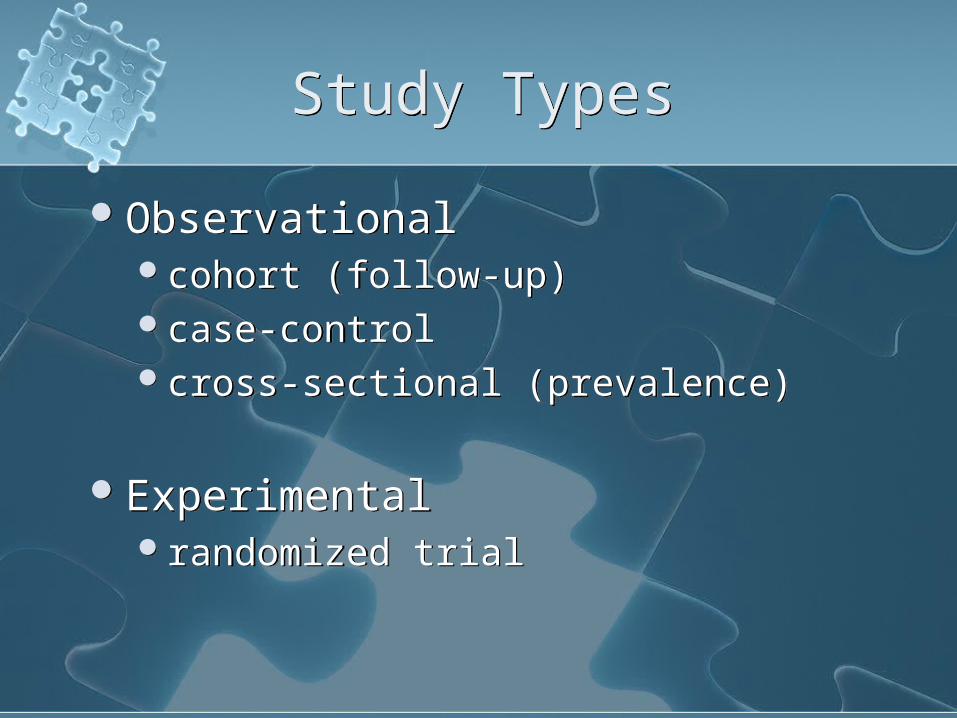
Study TypesStudy Types
Observationalcohort (follow-up)case-controlcross-sectional (prevalence)
Experimentalrandomized trial
Observationalcohort (follow-up)case-controlcross-sectional (prevalence)
Experimentalrandomized trial

Cohort StudyCohort Study Cohort study- study that follows or traces any
designated group over a period of time Cohort study- study that follows or traces any
designated group over a period of time
Classify subjectsby exposure
Follow for outcome
Benefits:-less bias-can estimate population rates of disease or exposure specific riskDrawbacks:-requires large population, especially for rare outcome-can require long follow-up period
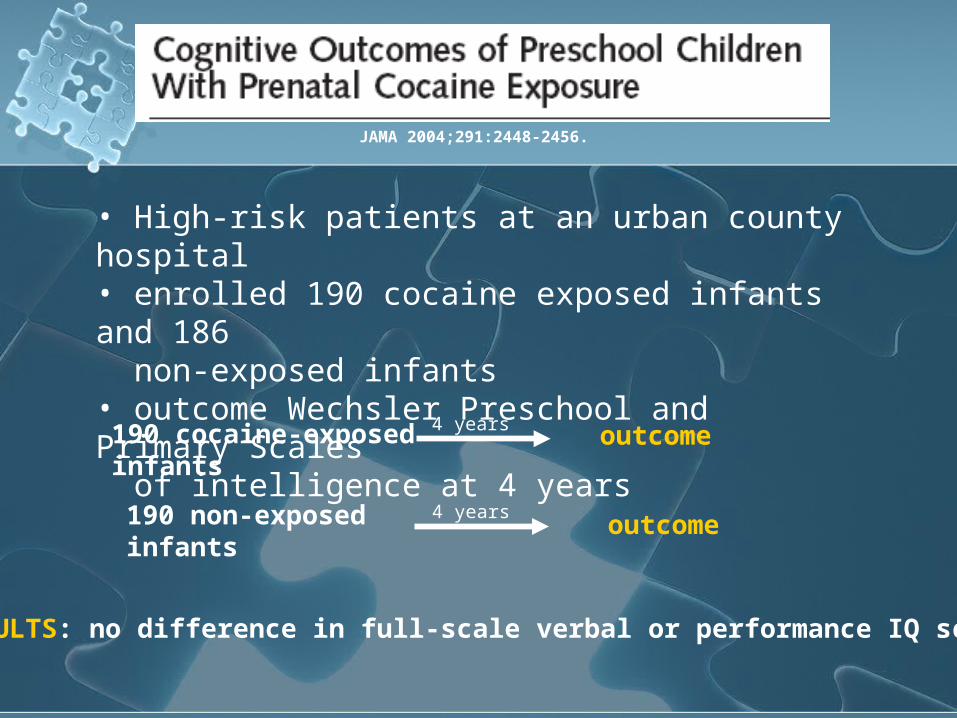
JAMA 2004;291:2448-2456.
• High-risk patients at an urban county hospital• enrolled 190 cocaine exposed infants and 186 non-exposed infants• outcome Wechsler Preschool and Primary Scales of intelligence at 4 years
190 cocaine-exposedinfants
outcome
190 non-exposedinfants
outcome
4 years
4 years
RESULTS: no difference in full-scale verbal or performance IQ scores
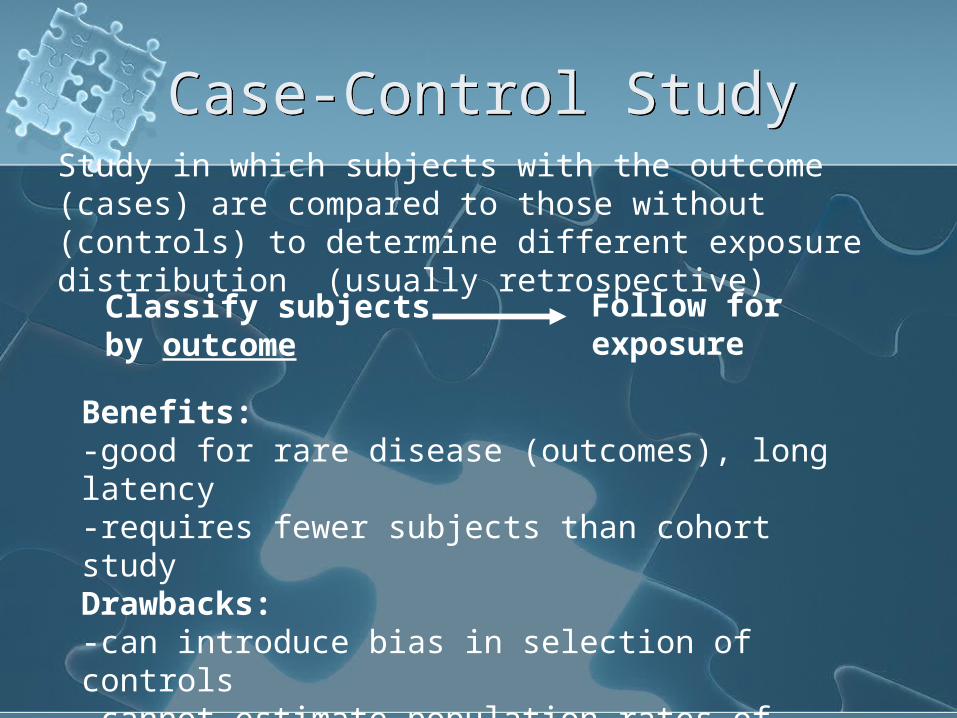
Case-Control StudyCase-Control Study
Classify subjectsby outcome
Follow for exposure
Study in which subjects with the outcome (cases) are compared to those without (controls) to determine different exposure distribution (usually retrospective)
Benefits:-good for rare disease (outcomes), long latency-requires fewer subjects than cohort studyDrawbacks:-can introduce bias in selection of controls-cannot estimate population rates of disease or exposure specific risk
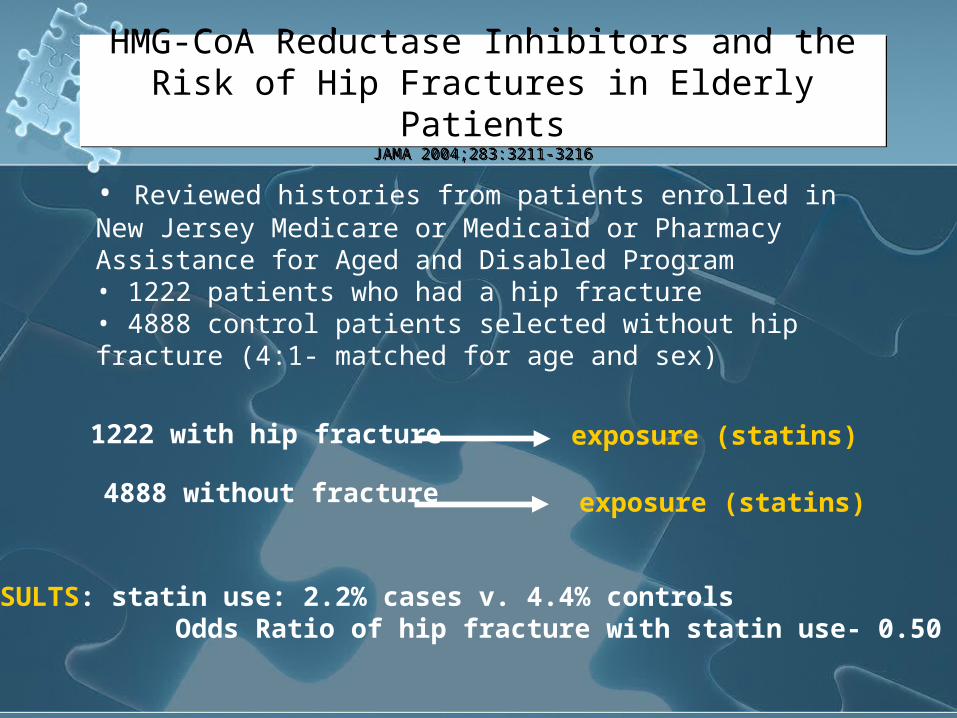
HMG-CoA Reductase Inhibitors and the Risk of Hip Fractures in Elderly Patients
JAMA 2004;283:3211-3216
HMG-CoA Reductase Inhibitors and the Risk of Hip Fractures in Elderly Patients
JAMA 2004;283:3211-3216
• Reviewed histories from patients enrolled in New Jersey Medicare or Medicaid or Pharmacy Assistance for Aged and Disabled Program• 1222 patients who had a hip fracture• 4888 control patients selected without hip fracture (4:1- matched for age and sex)
1222 with hip fracture exposure (statins)
4888 without fracture exposure (statins)
RESULTS: statin use: 2.2% cases v. 4.4% controls Odds Ratio of hip fracture with statin use- 0.50
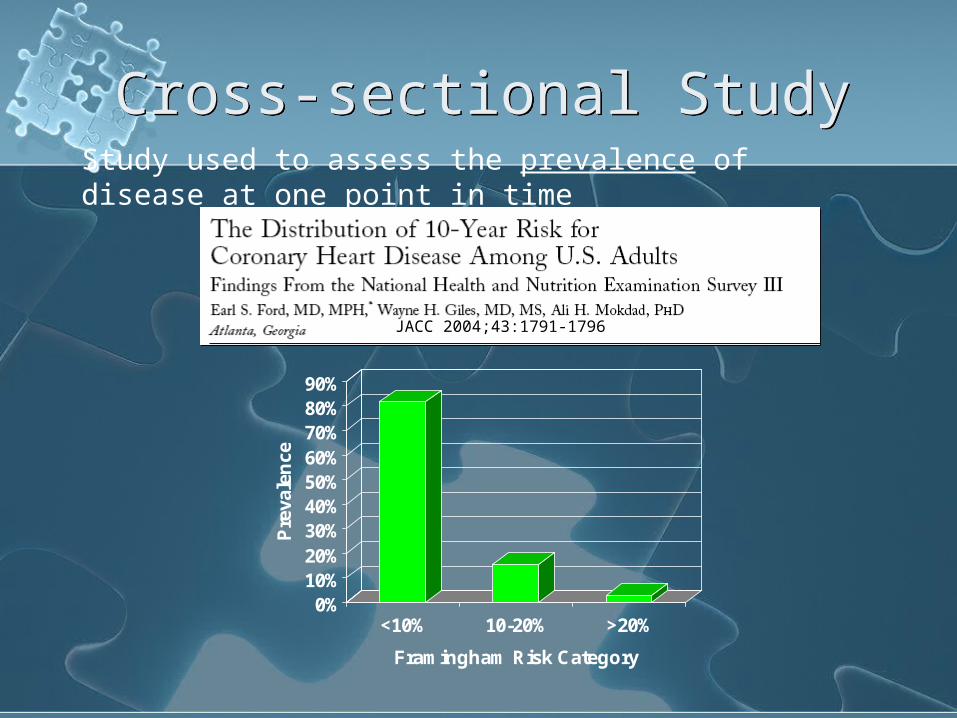
Cross-sectional StudyCross-sectional StudyStudy used to assess the prevalence of disease at one point in time
JACC 2004;43:1791-1796
0%10%20%30%40%50%60%70%80%90%
Pre
vale
nce
<10% 10-20% >20%
Framingham Risk Category
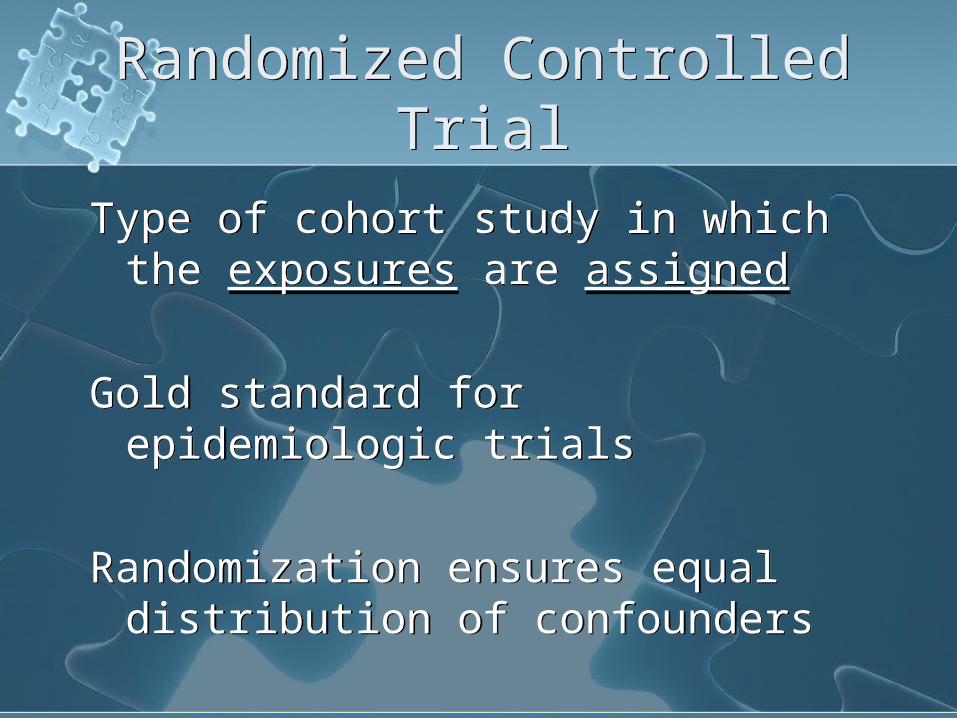
Randomized Controlled Trial
Randomized Controlled Trial
Type of cohort study in which the exposures are assigned
Gold standard for epidemiologic trials
Randomization ensures equal distribution of confounders
Type of cohort study in which the exposures are assigned
Gold standard for epidemiologic trials
Randomization ensures equal distribution of confounders

1. Randomization
2. Assign Exposure
Gender= known confounder=unknown confounder
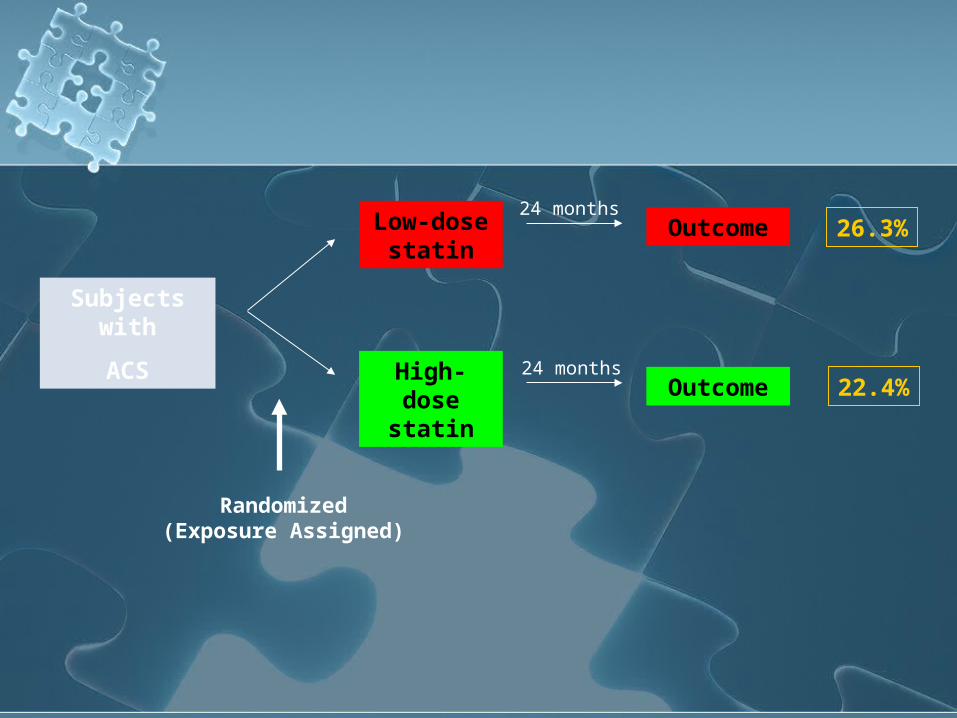
Subjects with
ACS
Low-dose statin
High-dose statin
Randomized(Exposure Assigned)
Outcome
Outcome
24 months
24 months
26.3%
22.4%
Epidemiology, Demography - Applications in Community Health Nursing.
Epidemiology, Demography - Applications in Community Health Nursing.

Lecture objectivesLecture objectivesAfter the lecture, you should be able to: Describe theories of causality in health and
illness. List the major sources of epidemiologic
information. Distinguish between incidence and prevalence
in health and illness states. Use epidemiologic methods to describe an
aggregate’s health. Discuss the types of epidemiologic studies that
are useful for researching aggregate health. Use the seven-step research process when
conducting an epidemiologic study.
After the lecture, you should be able to: Describe theories of causality in health and
illness. List the major sources of epidemiologic
information. Distinguish between incidence and prevalence
in health and illness states. Use epidemiologic methods to describe an
aggregate’s health. Discuss the types of epidemiologic studies that
are useful for researching aggregate health. Use the seven-step research process when
conducting an epidemiologic study.
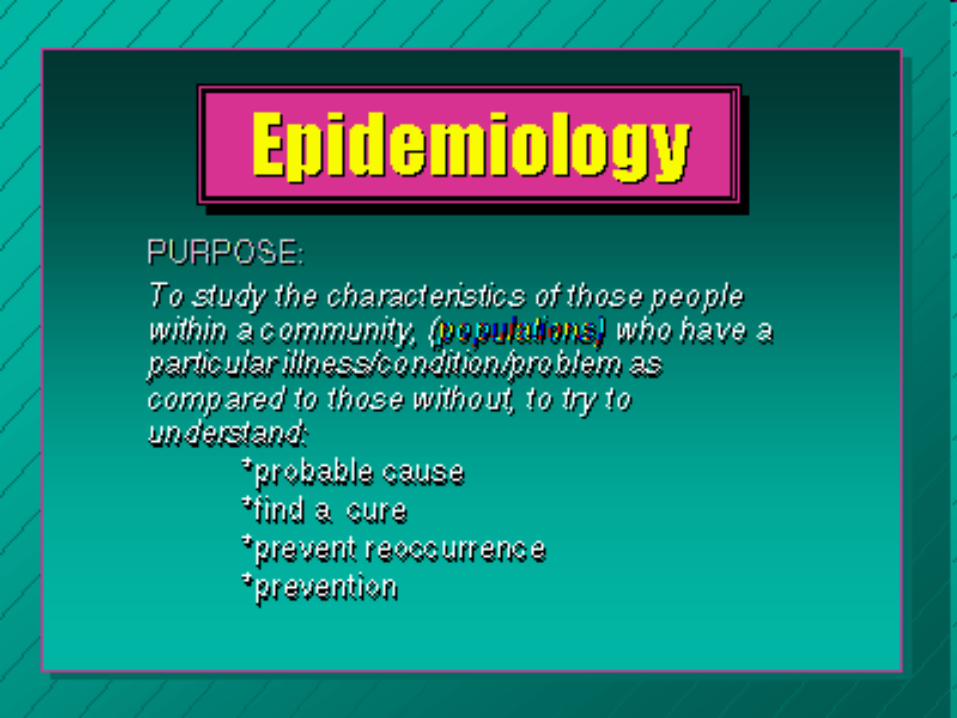
Epidemiology is the study of the determinants and distribution of health, disease, and injuries in human populations.
It is a specialized form of scientific research that can provide health care workers, including community health nurses, with a body of knowledge on which to base their practice and methods for studying new and existing problems.
Eras of Modern Epidemiology
Eras of Modern Epidemiology
Four distinct eras, each based on causal thinking:sanitary statistics (1800–1850),infectious-disease epidemiology (1850–
1950), chronic-disease epidemiology (1950–
2000),eco-epidemiology – emerging now.
Four distinct eras, each based on causal thinking:sanitary statistics (1800–1850),infectious-disease epidemiology (1850–
1950), chronic-disease epidemiology (1950–
2000),eco-epidemiology – emerging now.

Major Uses of EpidemiologyMajor Uses of Epidemiology
1. Historical study: Is community health getting better or worse?
2. Community diagnosis: What actual or potential health problems are there?
3. Working of health services * Efficacy * Effectiveness * Efficiency 4. Individual risks and chances * Actuarial risks * Health hazards/risk appraisal
1. Historical study: Is community health getting better or worse?
2. Community diagnosis: What actual or potential health problems are there?
3. Working of health services * Efficacy * Effectiveness * Efficiency 4. Individual risks and chances * Actuarial risks * Health hazards/risk appraisal
Major Uses of EpidemiologyMajor Uses of Epidemiology
5. Completing the clinical picture: Different presentation of the disease.
6. Identification of syndromes: “lumping and splitting” 7. Search for causes: case control and cohort studies.
Other uses include: Evaluation of presenting signs and symptoms, and clinical decision analysis.
5. Completing the clinical picture: Different presentation of the disease.
6. Identification of syndromes: “lumping and splitting” 7. Search for causes: case control and cohort studies.
Other uses include: Evaluation of presenting signs and symptoms, and clinical decision analysis.

Basic Methods in Epidemiology:
Basic Methods in Epidemiology:
Sources of Data
Data collected for other purposes census, birth & death cert,
surveillance data by CDC Routinely collected data
medical and insurance records Data collected for specific epi
studies original data
Sources of Data
Data collected for other purposes census, birth & death cert,
surveillance data by CDC Routinely collected data
medical and insurance records Data collected for specific epi
studies original data
Vital StatisticsVital Statistics
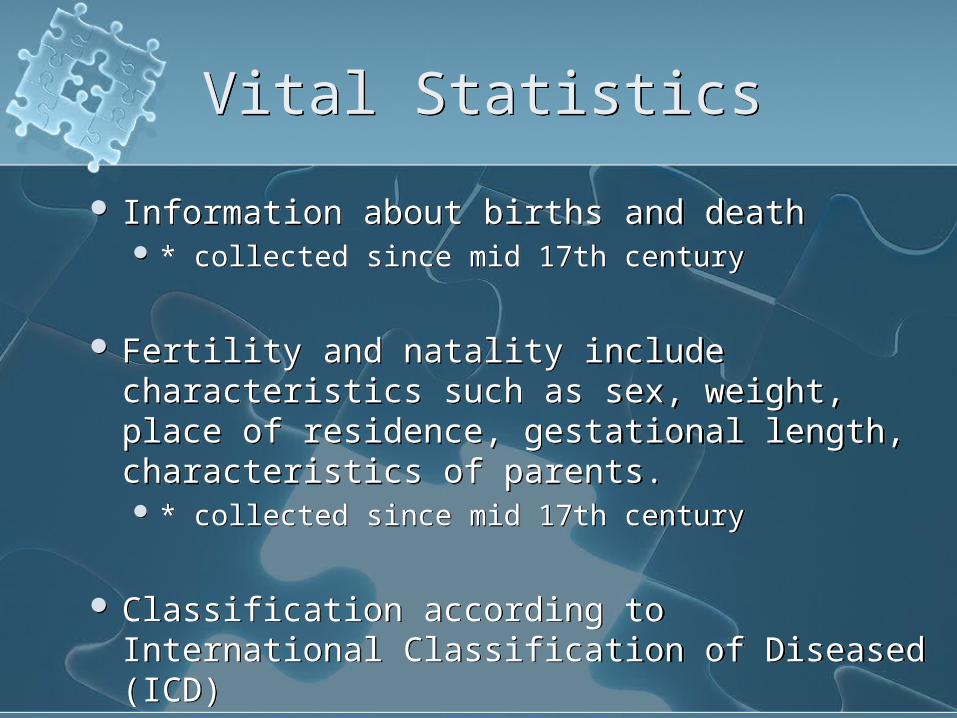
Information about births and death * collected since mid 17th century
Fertility and natality include characteristics such as sex, weight, place of residence, gestational length, characteristics of parents. * collected since mid 17th century
Classification according to International Classification of Diseased (ICD)
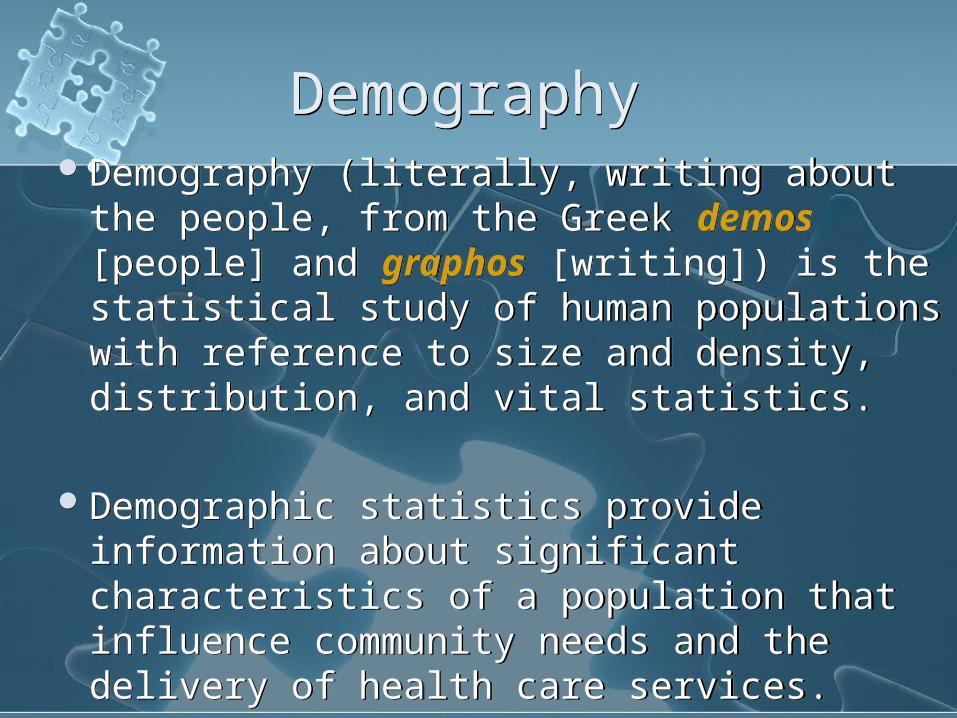
Demography Demography Demography (literally, writing about the
people, from the Greek demos [people] and graphos [writing]) is the statistical study of human populations with reference to size and density, distribution, and vital statistics.
Demographic statistics provide information about significant characteristics of a population that influence community needs and the delivery of health care services.
Demography (literally, writing about the people, from the Greek demos [people] and graphos [writing]) is the statistical study of human populations with reference to size and density, distribution, and vital statistics.
Demographic statistics provide information about significant characteristics of a population that influence community needs and the delivery of health care services.

DemographyDemography
Demographic studies (that is, demographic research) provide descriptions and comparisons of populations according to the characteristics of age; race; sex; socioeconomic status; geographic distribution; and birth, death, marriage, and divorce patterns.
Demographic studies often have health implications that may or may not be addressed by the investigators. The census of the U. S. population is an example of a comprehensive descriptive demographic study conducted every 10 years.
DemographicsDemographics
total # of people, i.e. in the country, state, localities.
These are done q 10 yr. via census.
May be presented as raw data or as in Frequency of Events.
total # of people, i.e. in the country, state, localities.
These are done q 10 yr. via census.
May be presented as raw data or as in Frequency of Events.
Essential Concepts of Epidemiology
Essential Concepts of Epidemiology
Causality
Risk
Rates of Occurrence
Causality
Risk
Rates of Occurrence
Theories of causality in health and illness.
Theories of causality in health and illness.
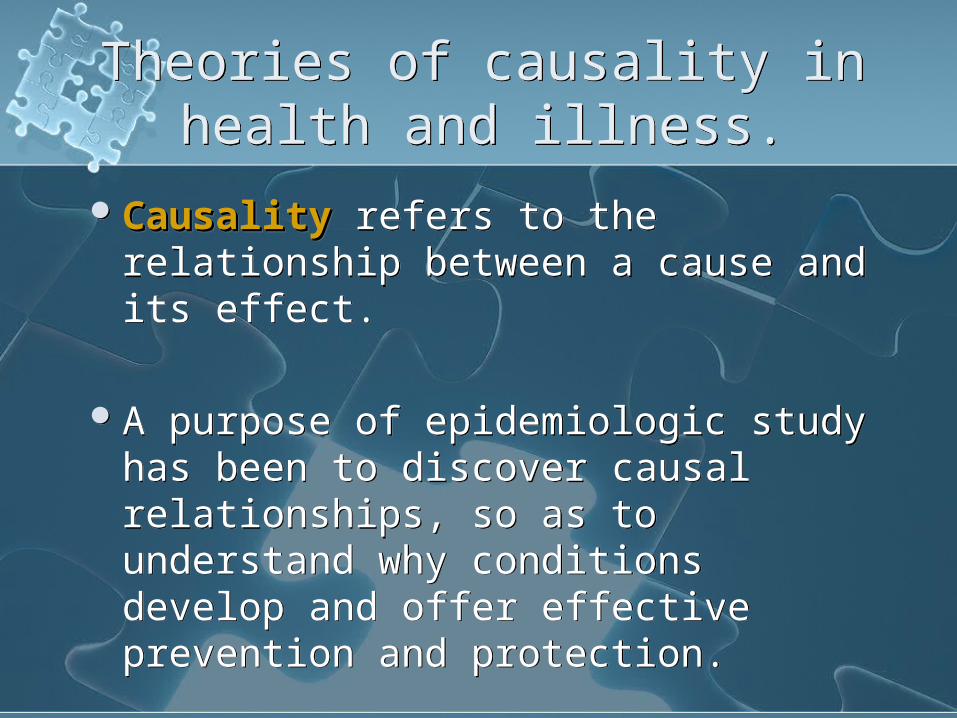
CausalityCausality refers to the relationship between a cause and its effect.
A purpose of epidemiologic study has been to discover causal relationships, so as to understand why conditions develop and offer effective prevention and protection.
CausalityCausality refers to the relationship between a cause and its effect.
A purpose of epidemiologic study has been to discover causal relationships, so as to understand why conditions develop and offer effective prevention and protection.
Criteria for CausalityCriteria for Causality
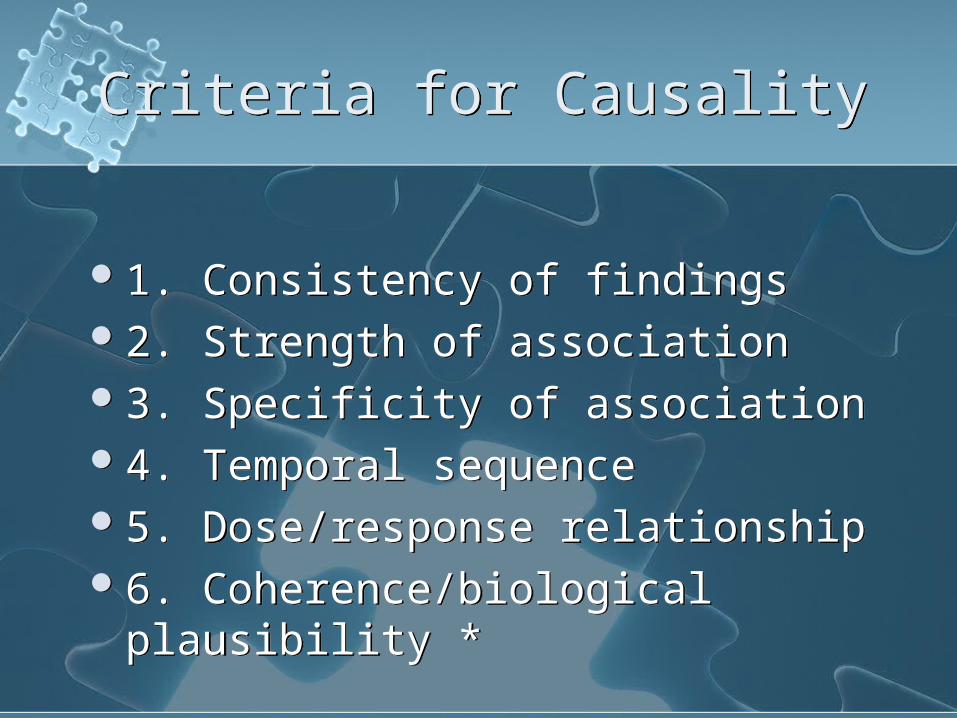
1. Consistency of findings 2. Strength of association 3. Specificity of association 4. Temporal sequence 5. Dose/response relationship 6. Coherence/biological plausibility
*
1. Consistency of findings 2. Strength of association 3. Specificity of association 4. Temporal sequence 5. Dose/response relationship 6. Coherence/biological plausibility
*
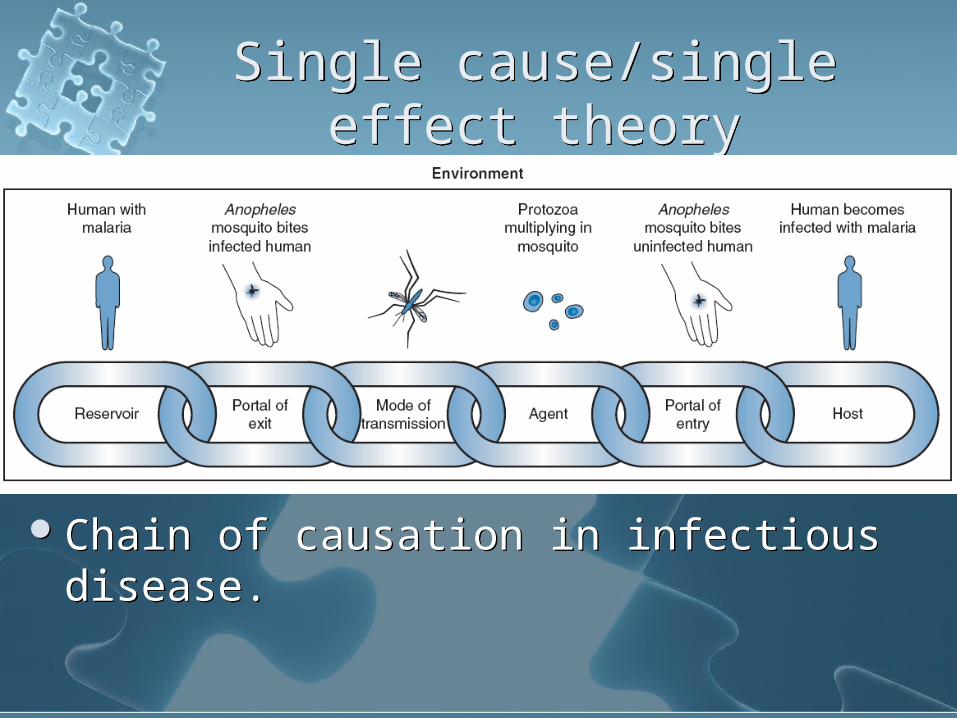
Single cause/single effect theory
Single cause/single effect theory
Chain of causation in infectious disease.Chain of causation in infectious disease.
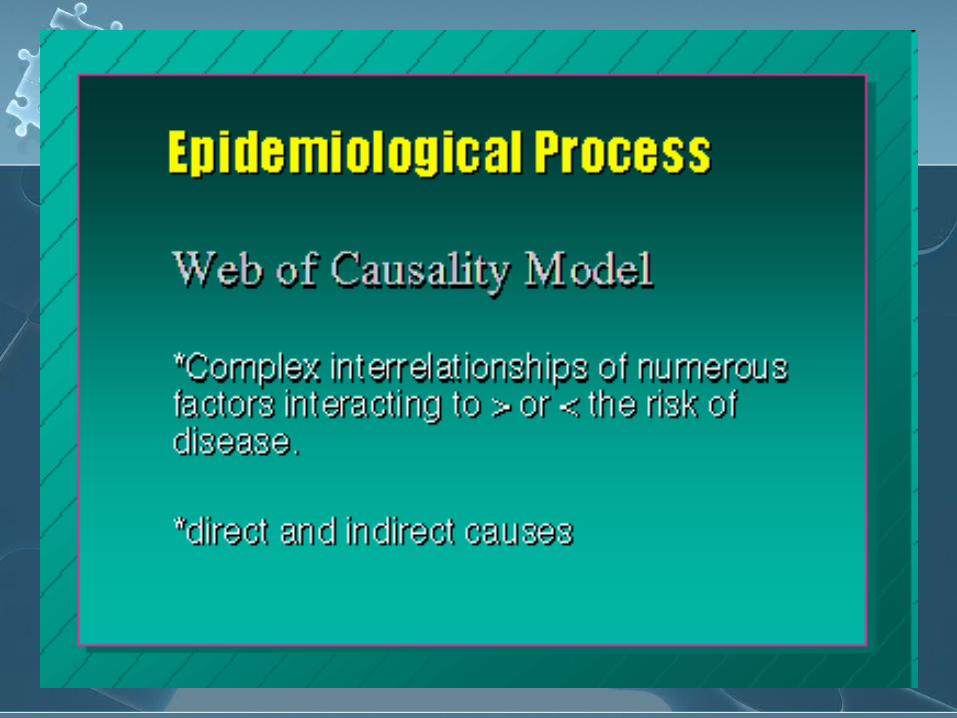
Concept of multiple causation
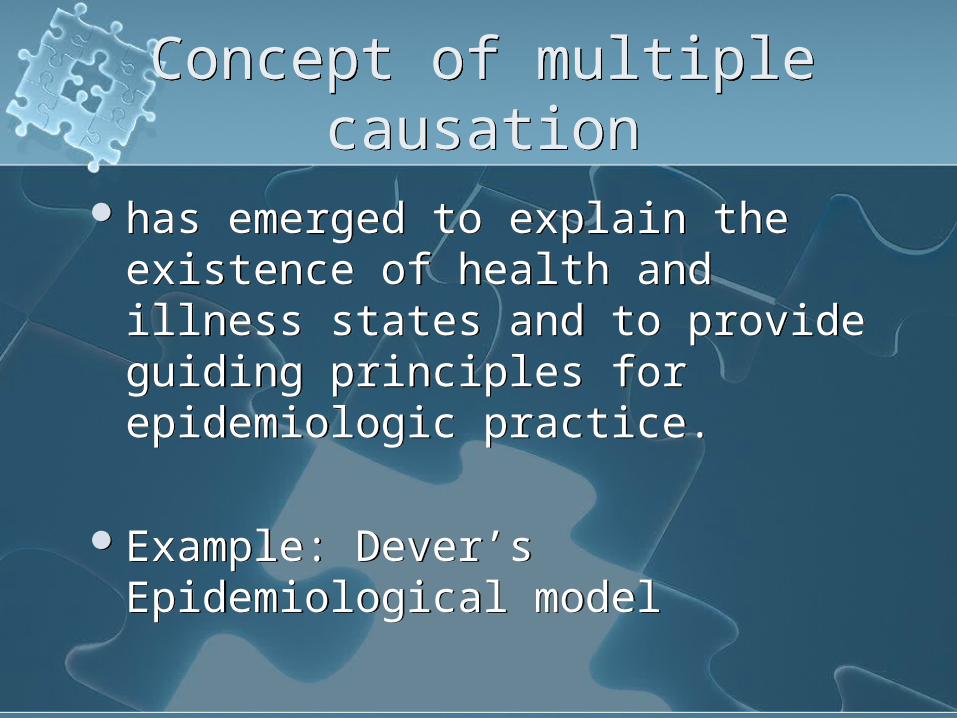
Concept of multiple causation
has emerged to explain the existence of health and illness states and to provide guiding principles for epidemiologic practice.
Example: Dever’s Epidemiological model
has emerged to explain the existence of health and illness states and to provide guiding principles for epidemiologic practice.
Example: Dever’s Epidemiological model
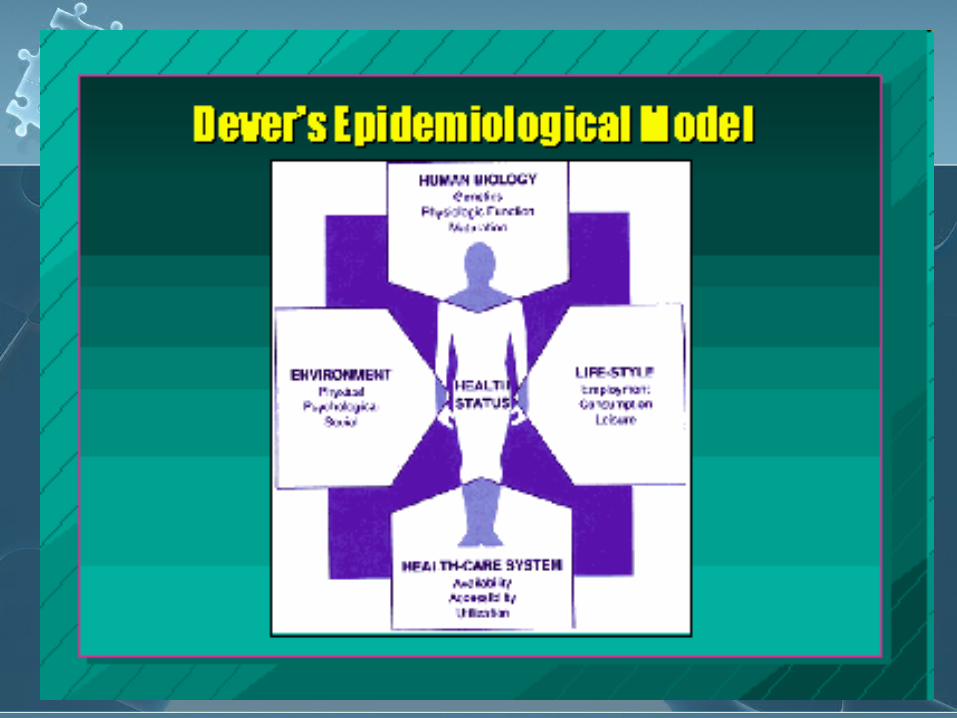
Dever’s Epidemiological Model
Dever’s Epidemiological Model
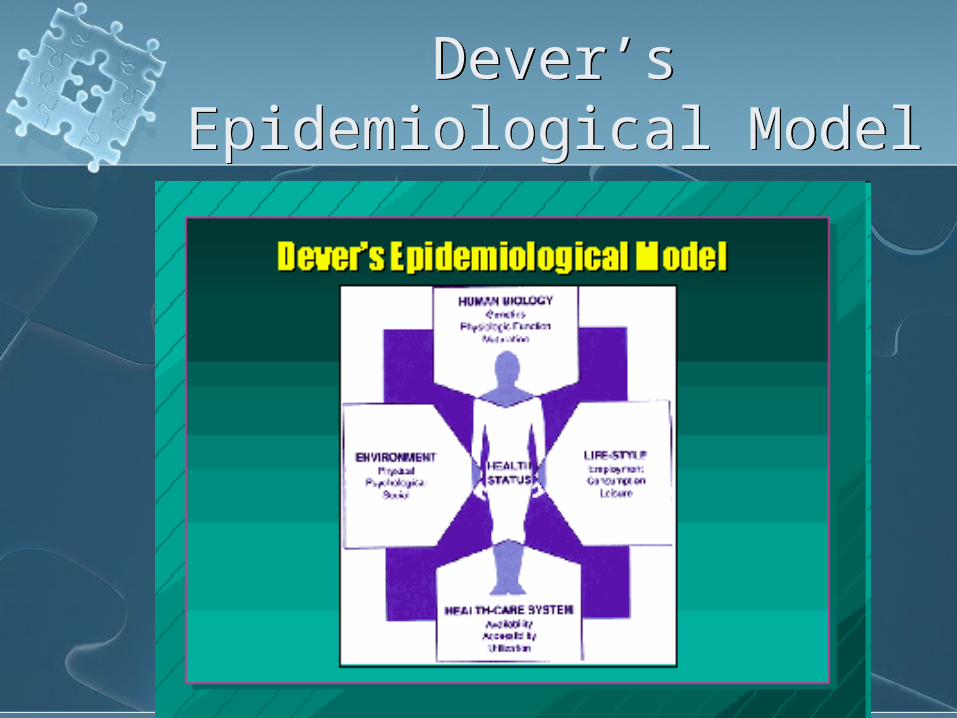
It considers the health status of the host and how it is impacted by human biology, life-style, environment, and the health care system.
Sometimes referred to as a “web of causation,” this model attempts to identify all possible influences on the health and illness processes.
It considers the health status of the host and how it is impacted by human biology, life-style, environment, and the health care system.
Sometimes referred to as a “web of causation,” this model attempts to identify all possible influences on the health and illness processes.
Dever’s Epidemiological Model
Dever’s Epidemiological Model
Dever’s ModelDever’s Model
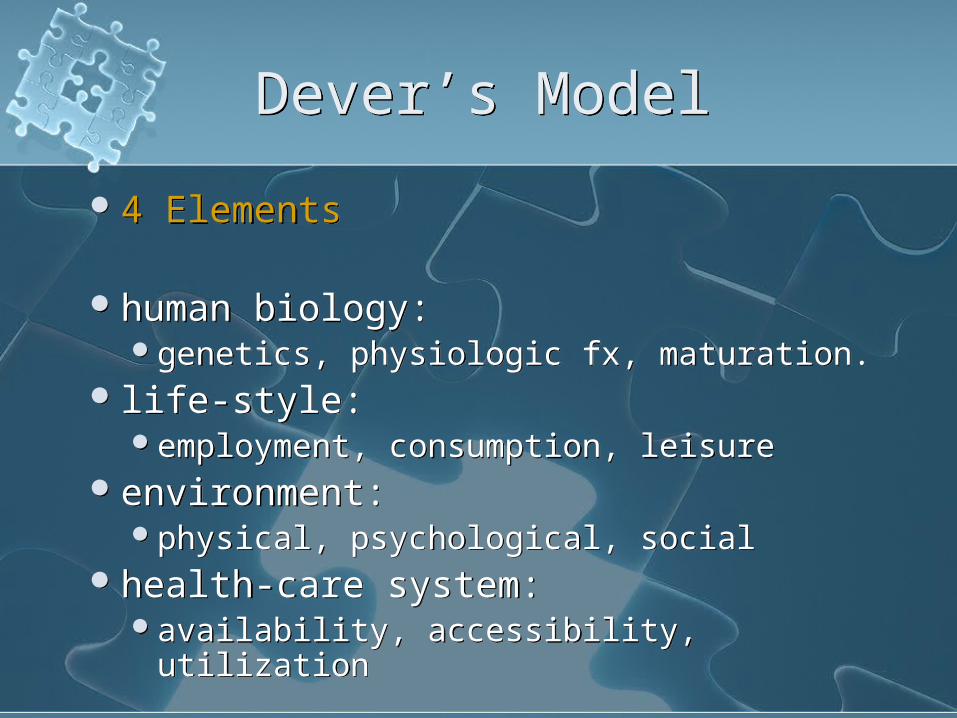
4 Elements
human biology: genetics, physiologic fx, maturation.
life-style: employment, consumption, leisure
environment: physical, psychological, social
health-care system: availability, accessibility, utilization
4 Elements
human biology: genetics, physiologic fx, maturation.
life-style: employment, consumption, leisure
environment: physical, psychological, social
health-care system: availability, accessibility, utilization

Web of causation for myocardial infarction.Web of causation for myocardial infarction.

Recognition of multiple causes provides many points of intervention for prevention, health promotion, and treatment.
For example, previous Figure suggests interventions such as directly attacking significant coronary atherosclerosis (bypass surgery), reducing the incidence of obesity, helping people stop smoking, developing an exercise program, and making dietary modifications.
AssociationAssociation
It is a concept that is helpful in determining multiple causality.
Events are said to be associated if they appear together more often than would be the case by chance alone. Such events may include risk factors or other characteristics affecting disease or health states.
Examples: frequent association of cigarette smoking with
lung cancer, frequent association of obesity with heart
disease.
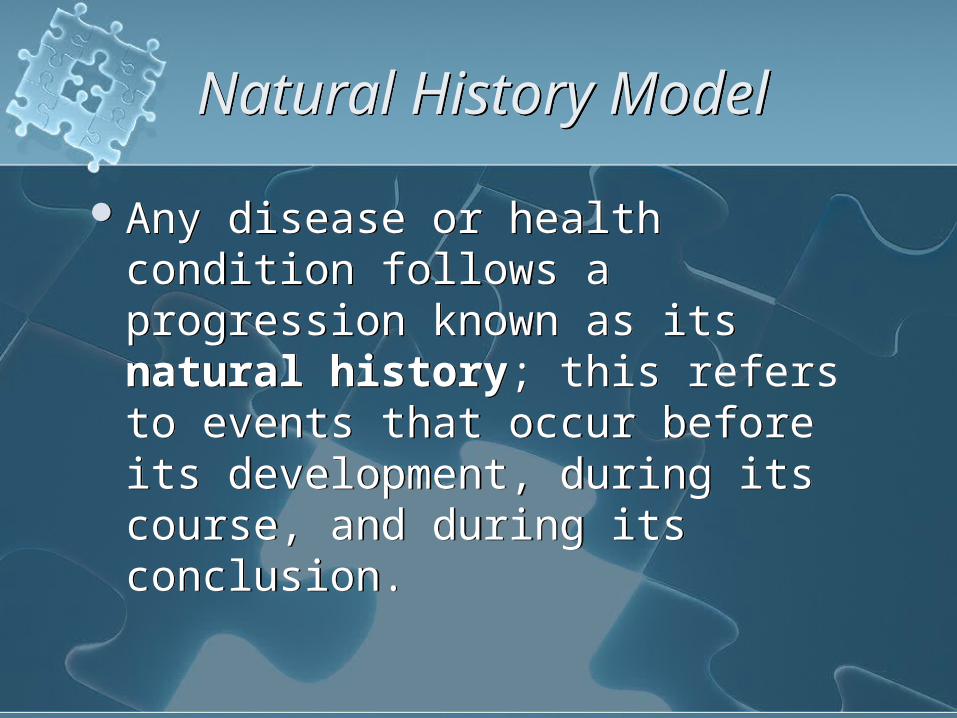
Natural History ModelNatural History Model
Any disease or health condition follows a progression known as its natural history; this refers to events that occur before its development, during its course, and during its conclusion.
Any disease or health condition follows a progression known as its natural history; this refers to events that occur before its development, during its course, and during its conclusion.

Natural History ModelNatural History Model
Course of Disease Process
I. Prepathogenesis State Incubation Period:
time of exposure to an infectious organism, until one develops the symptoms.
Induction or Latency Period: (noninfectious diseases) The time during which agent-host-
environment interact before symptoms appear, (years to decades) i.e.. ca, ulcers, ht dis, etc..
Mode of transmission
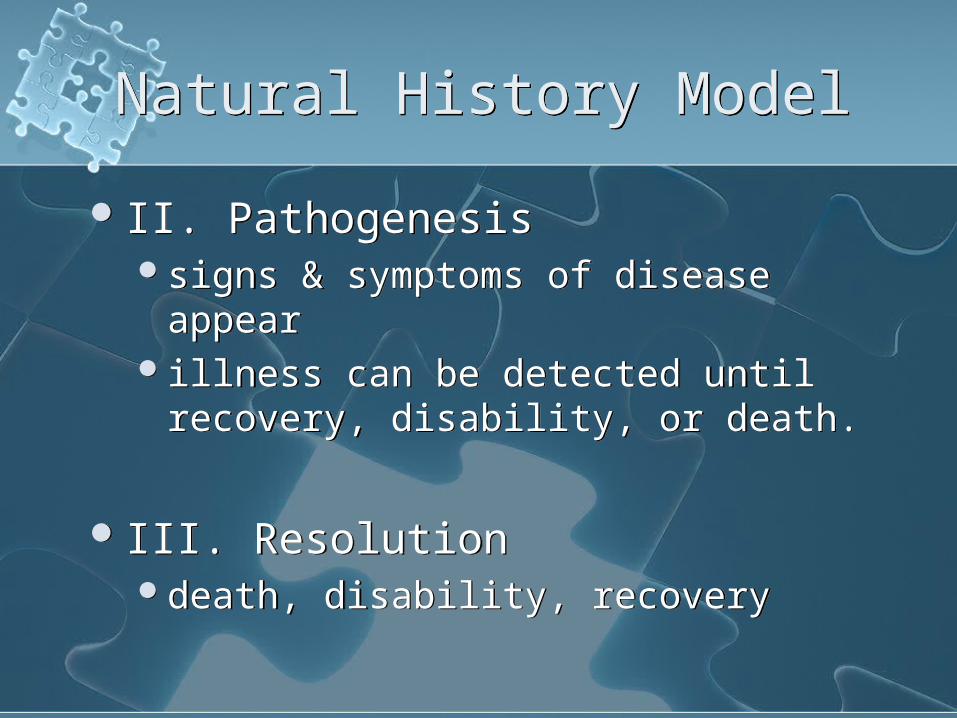
Natural History ModelNatural History Model
II. Pathogenesis signs & symptoms of disease appear illness can be detected until
recovery, disability, or death.
III. Resolution death, disability, recovery
II. Pathogenesis signs & symptoms of disease appear illness can be detected until
recovery, disability, or death.
III. Resolution death, disability, recovery
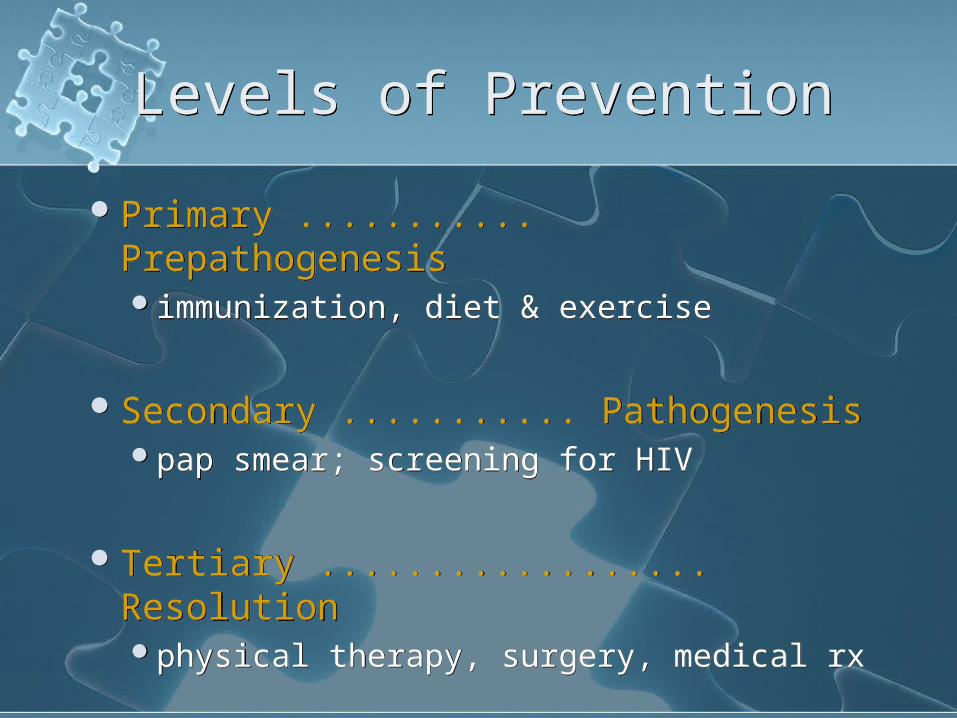
Levels of PreventionLevels of Prevention
Primary ........... Prepathogenesis immunization, diet & exercise
Secondary ........... Pathogenesis pap smear; screening for HIV
Tertiary .................. Resolutionphysical therapy, surgery, medical rx
Primary ........... Prepathogenesis immunization, diet & exercise
Secondary ........... Pathogenesis pap smear; screening for HIV
Tertiary .................. Resolutionphysical therapy, surgery, medical rx
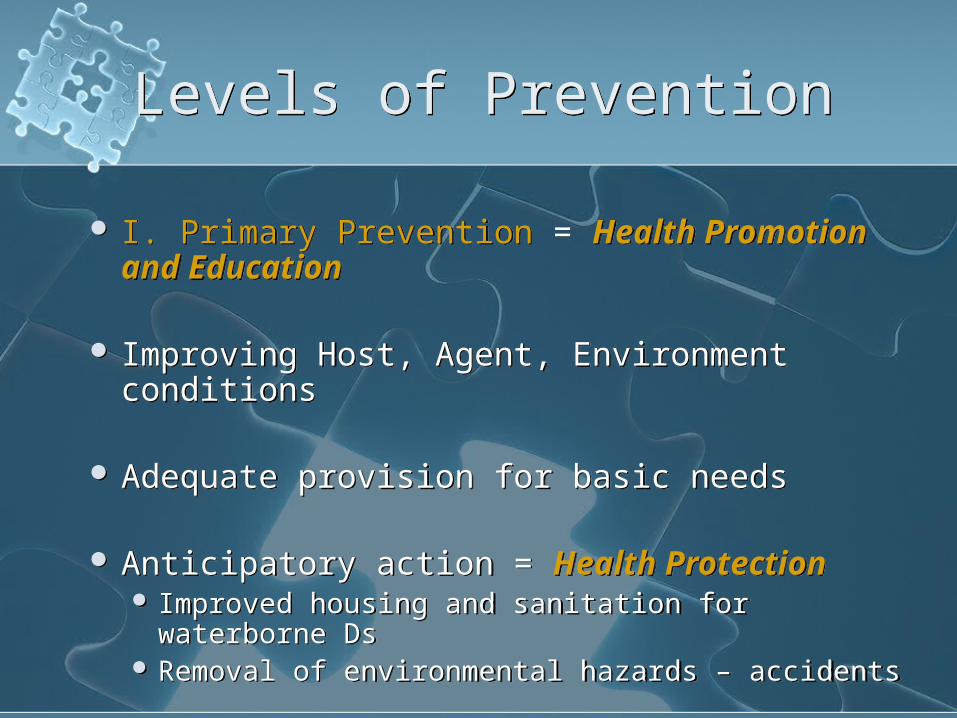
Levels of PreventionLevels of Prevention
I. Primary Prevention = Health Promotion and Education
Improving Host, Agent, Environment conditions
Adequate provision for basic needs
Anticipatory action = Health Protection Improved housing and sanitation for waterborne
Ds Removal of environmental hazards – accidents
I. Primary Prevention = Health Promotion and Education
Improving Host, Agent, Environment conditions
Adequate provision for basic needs
Anticipatory action = Health Protection Improved housing and sanitation for waterborne
Ds Removal of environmental hazards – accidents
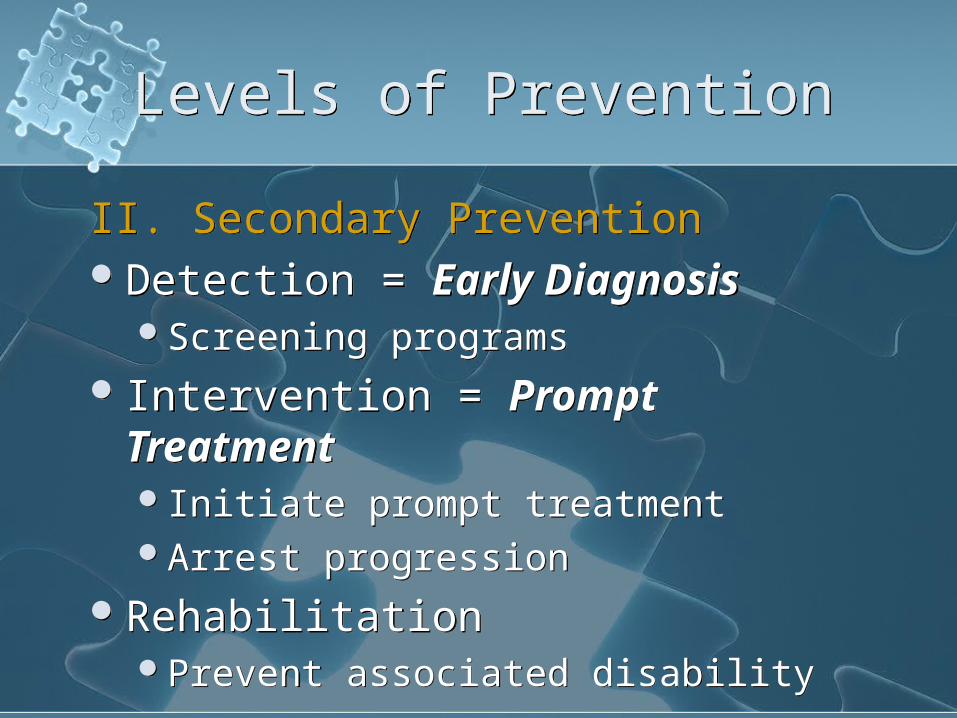
Levels of PreventionLevels of Prevention
II. Secondary Prevention Detection = Early Diagnosis
Screening programs Intervention = Prompt
TreatmentInitiate prompt treatmentArrest progression
RehabilitationPrevent associated disability
II. Secondary Prevention Detection = Early Diagnosis
Screening programs Intervention = Prompt
TreatmentInitiate prompt treatmentArrest progression
RehabilitationPrevent associated disability
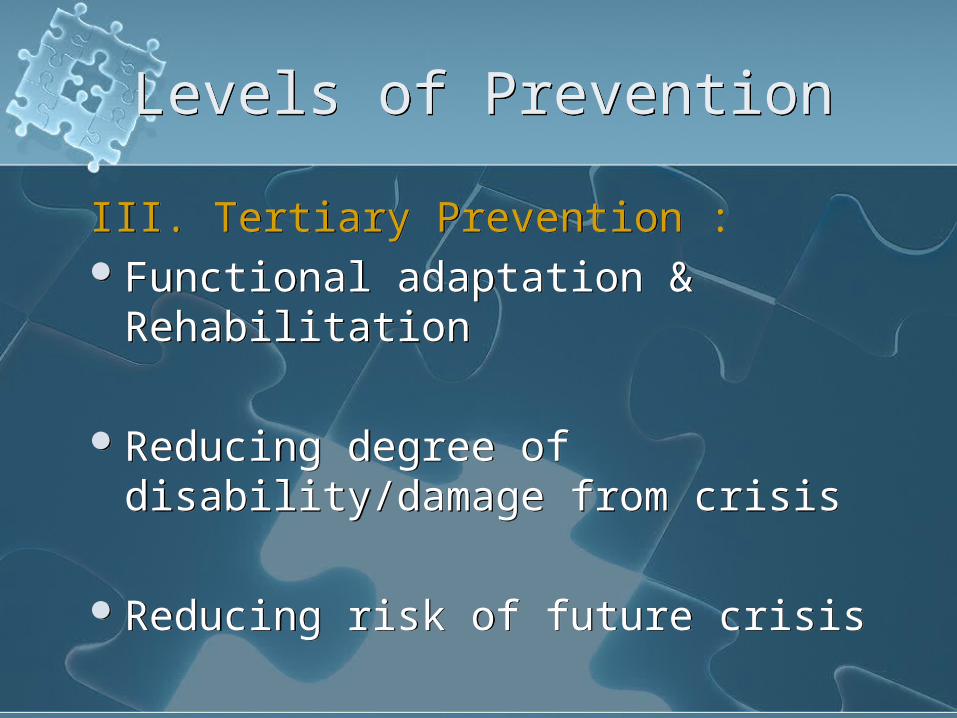
Levels of PreventionLevels of Prevention
III. Tertiary Prevention : Functional adaptation &
Rehabilitation
Reducing degree of disability/damage from crisis
Reducing risk of future crisis
III. Tertiary Prevention : Functional adaptation &
Rehabilitation
Reducing degree of disability/damage from crisis
Reducing risk of future crisis
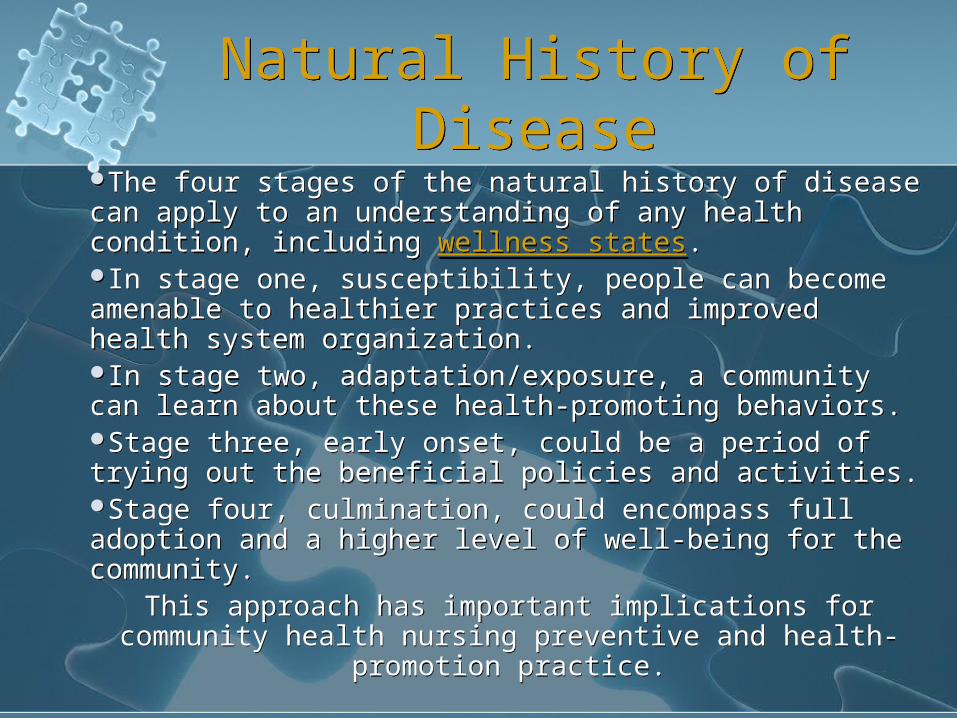
Natural History of DiseaseNatural History of DiseaseThe four stages of the natural history of disease can apply to an understanding of any health condition, including wellness states. In stage one, susceptibility, people can become amenable to healthier practices and improved health system organization. In stage two, adaptation/exposure, a community can learn about these health-promoting behaviors.Stage three, early onset, could be a period of trying out the beneficial policies and activities. Stage four, culmination, could encompass full adoption and a higher level of well-being for the community.
This approach has important implications for community health nursing preventive and health-
promotion practice.
The four stages of the natural history of disease can apply to an understanding of any health condition, including wellness states. In stage one, susceptibility, people can become amenable to healthier practices and improved health system organization. In stage two, adaptation/exposure, a community can learn about these health-promoting behaviors.Stage three, early onset, could be a period of trying out the beneficial policies and activities. Stage four, culmination, could encompass full adoption and a higher level of well-being for the community.
This approach has important implications for community health nursing preventive and health-
promotion practice.

Types Of Epidemiologic Studies
Types Of Epidemiologic Studies
Descriptive epidemiology describes disease according to person,
place, time ..
Analytic epidemiology understand etiology of
disease..........case-control, cross-sectional study, cohort studies (development of disease)
Experimental studiesclinical trials, screening
Descriptive epidemiology describes disease according to person,
place, time ..
Analytic epidemiology understand etiology of
disease..........case-control, cross-sectional study, cohort studies (development of disease)
Experimental studiesclinical trials, screening

Descriptive epidemiologyDescriptive epidemiology
The simplest measure of description is a count. For example, an epidemiologic study
of varicella deaths among all age groups tracked varicella deaths through hospital discharge records and death certificates in New York State
The simplest measure of description is a count. For example, an epidemiologic study
of varicella deaths among all age groups tracked varicella deaths through hospital discharge records and death certificates in New York State

Descriptive epidemiologyDescriptive epidemiology
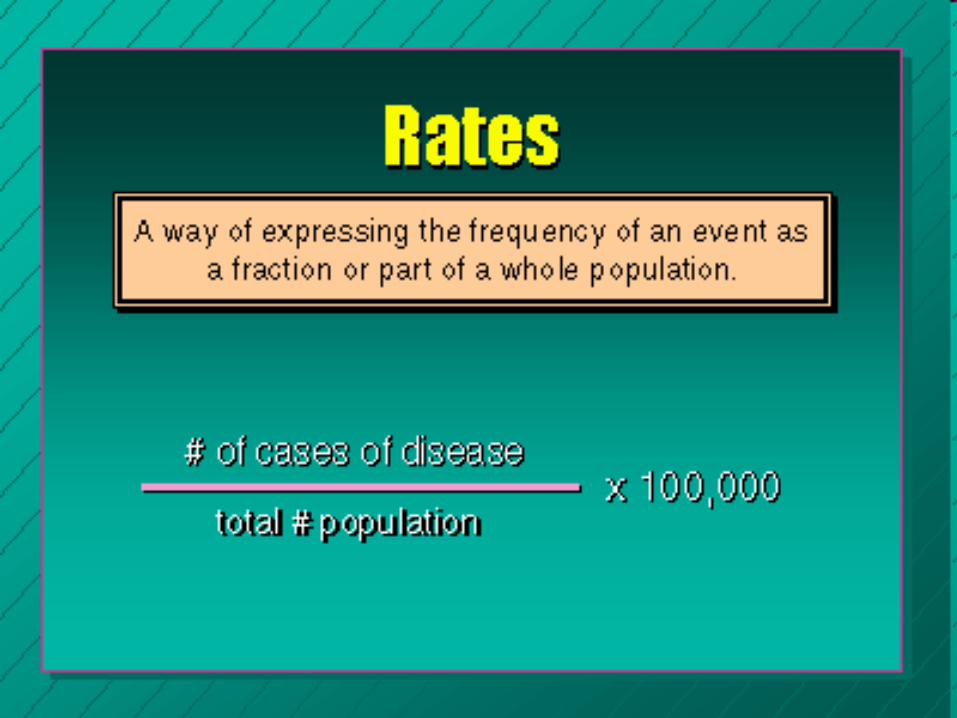
Rates are statistical measures expressing the proportion of people with a given health problem among a population at risk.
Rates: Way of expressing the frequency of an event as a fraction or part of a whole population.
The total number of people in the group serves as the denominator for various types of rates.

RiskRisk
Risk: probability that given individual will develop a specific condition
1. Populations are at risk because they do or do not have
contributing factors.
2. Risk factors predisposing factors that make a
person/population more susceptible to a disease or event.
Risk: probability that given individual will develop a specific condition
1. Populations are at risk because they do or do not have
contributing factors.
2. Risk factors predisposing factors that make a
person/population more susceptible to a disease or event.
Rates In EpidemiologyRates In Epidemiology
the prevalence rate,
the period prevalence rate,
the incidence rate.
the prevalence rate,
the period prevalence rate,
the incidence rate.
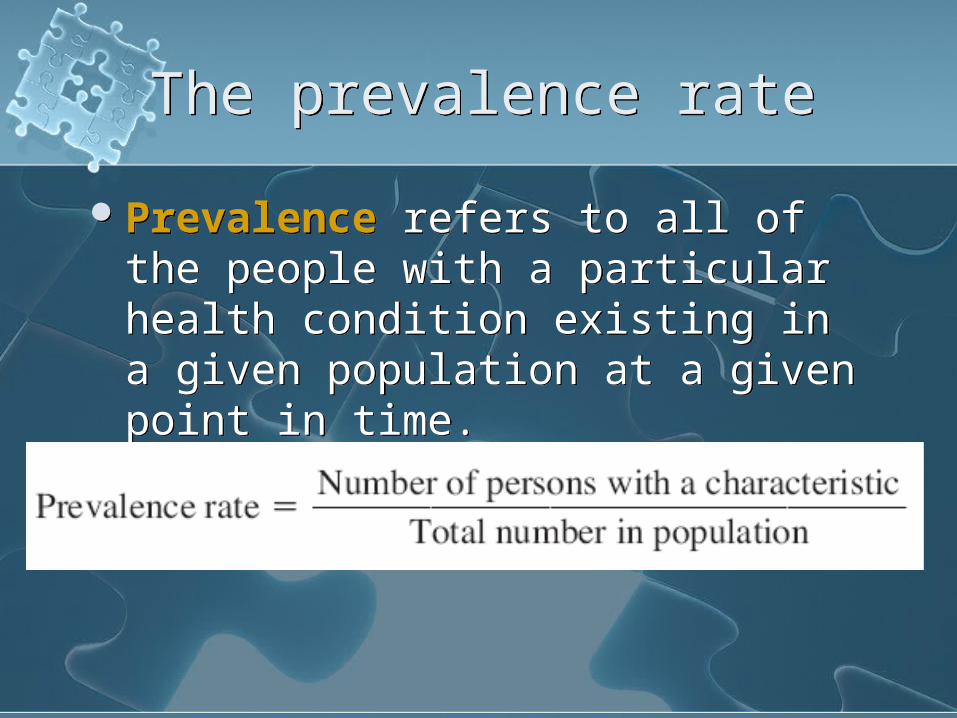
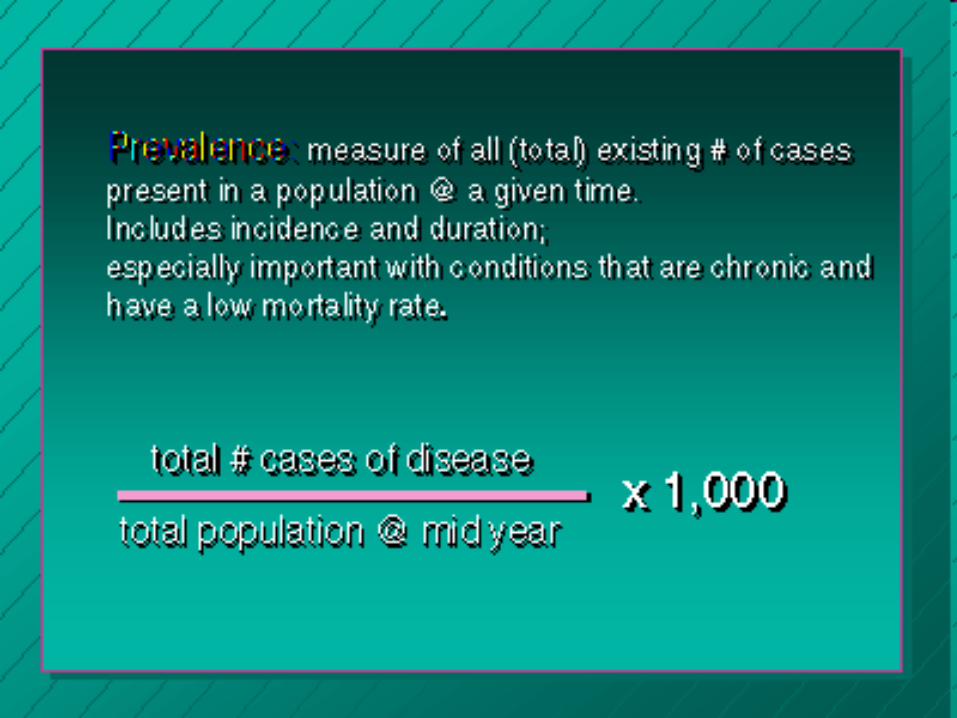
The prevalence rateThe prevalence rate
Prevalence refers to all of the people with a particular health condition existing in a given population at a given point in time.
Prevalence refers to all of the people with a particular health condition existing in a given population at a given point in time.
The prevalence rateThe prevalence rate
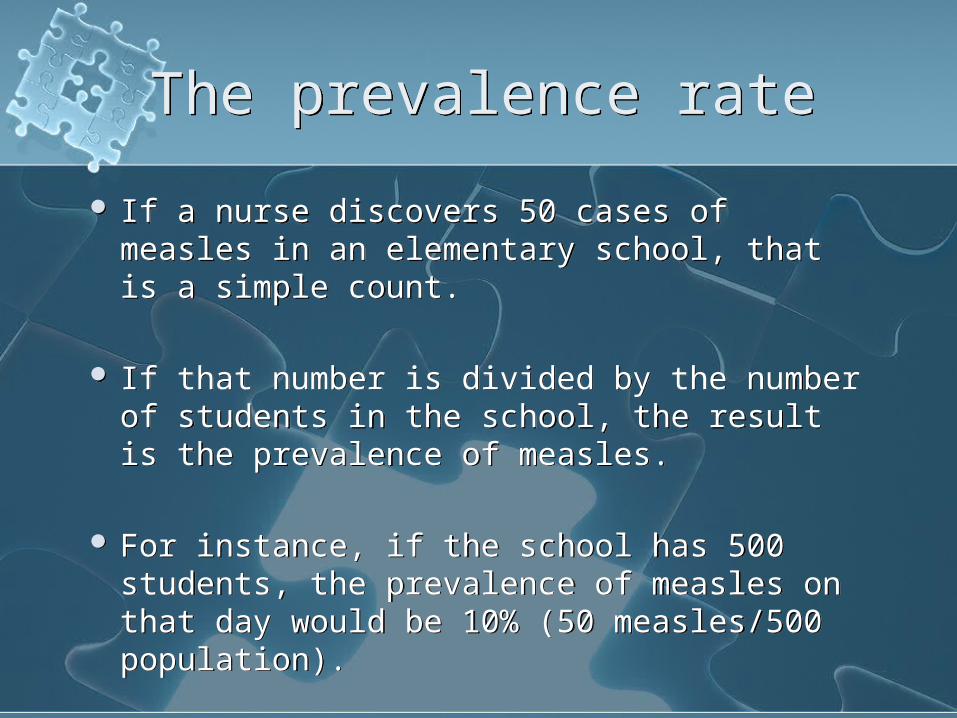
If a nurse discovers 50 cases of measles in an elementary school, that is a simple count.
If that number is divided by the number of students in the school, the result is the prevalence of measles.
For instance, if the school has 500 students, the prevalence of measles on that day would be 10% (50 measles/500 population).

The period prevalence rate
The period prevalence rate
The prevalence rate over a defined period of time is called a period prevalence rate:
The prevalence rate over a defined period of time is called a period prevalence rate:
The incidence rateThe incidence rate
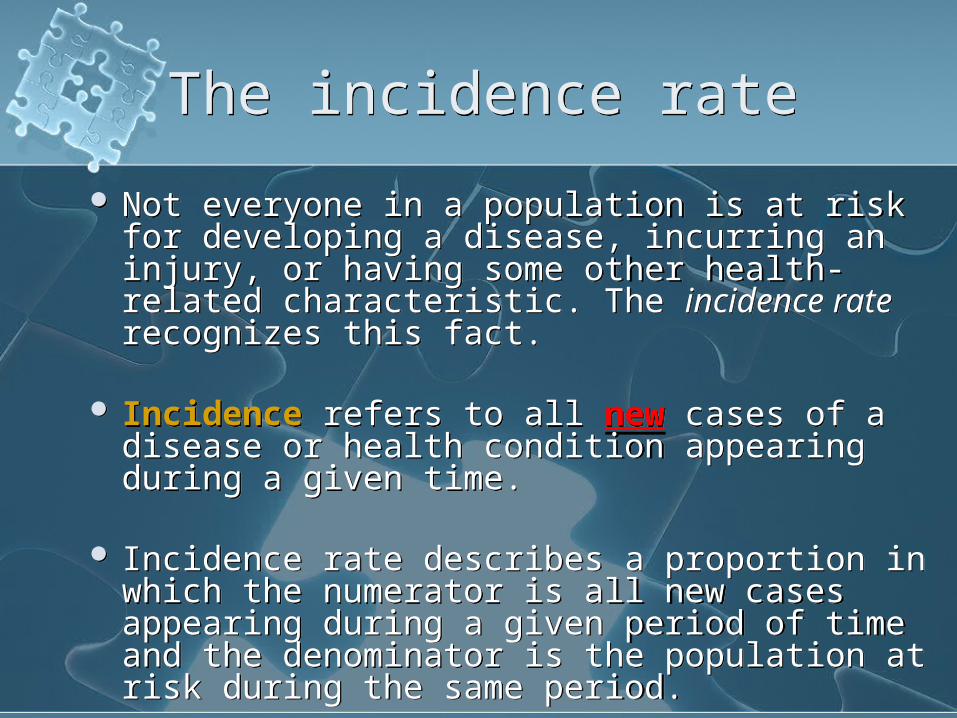
Not everyone in a population is at risk for developing a disease, incurring an injury, or having some other health-related characteristic. The incidence rate recognizes this fact.
Incidence refers to all new cases of a disease or health condition appearing during a given time.
Incidence rate describes a proportion in which the numerator is all new cases appearing during a given period of time and the denominator is the population at risk during the same period.
The incidence rateThe incidence rate
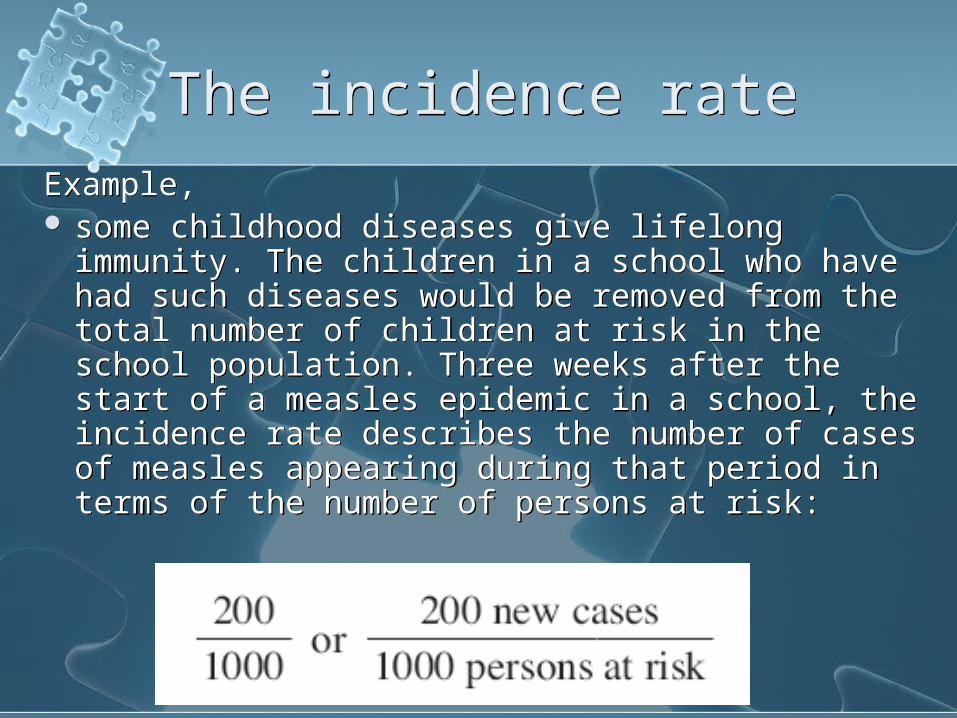
Example, some childhood diseases give lifelong
immunity. The children in a school who have had such diseases would be removed from the total number of children at risk in the school population. Three weeks after the start of a measles epidemic in a school, the incidence rate describes the number of cases of measles appearing during that period in terms of the number of persons at risk:
The incidence rateThe incidence rate
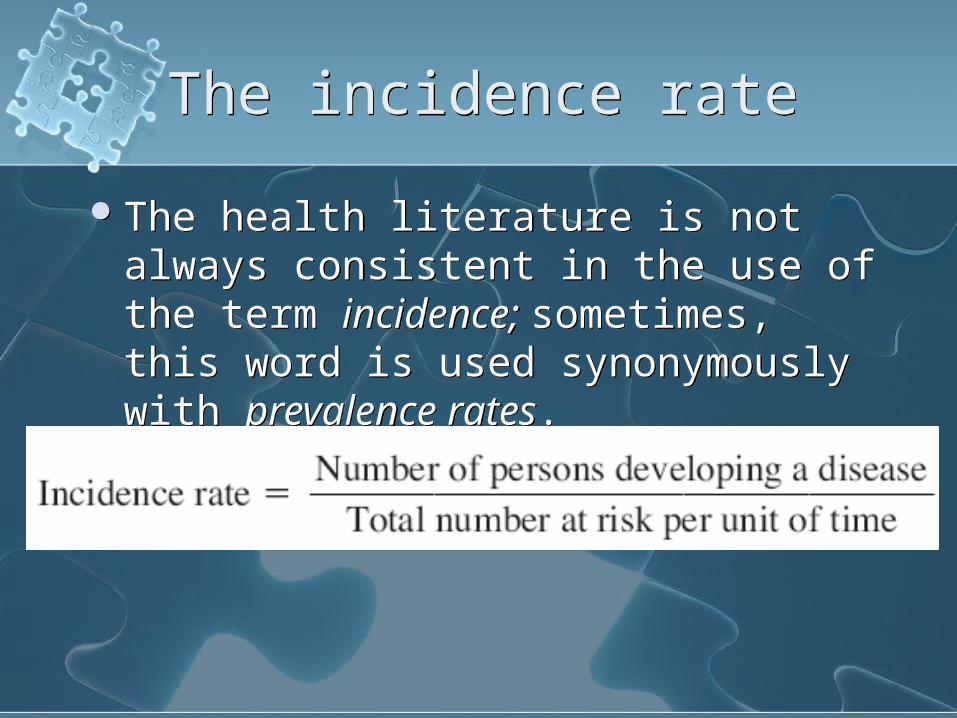
The health literature is not always consistent in the use of the term incidence; sometimes, this word is used synonymously with prevalence rates.
The health literature is not always consistent in the use of the term incidence; sometimes, this word is used synonymously with prevalence rates.
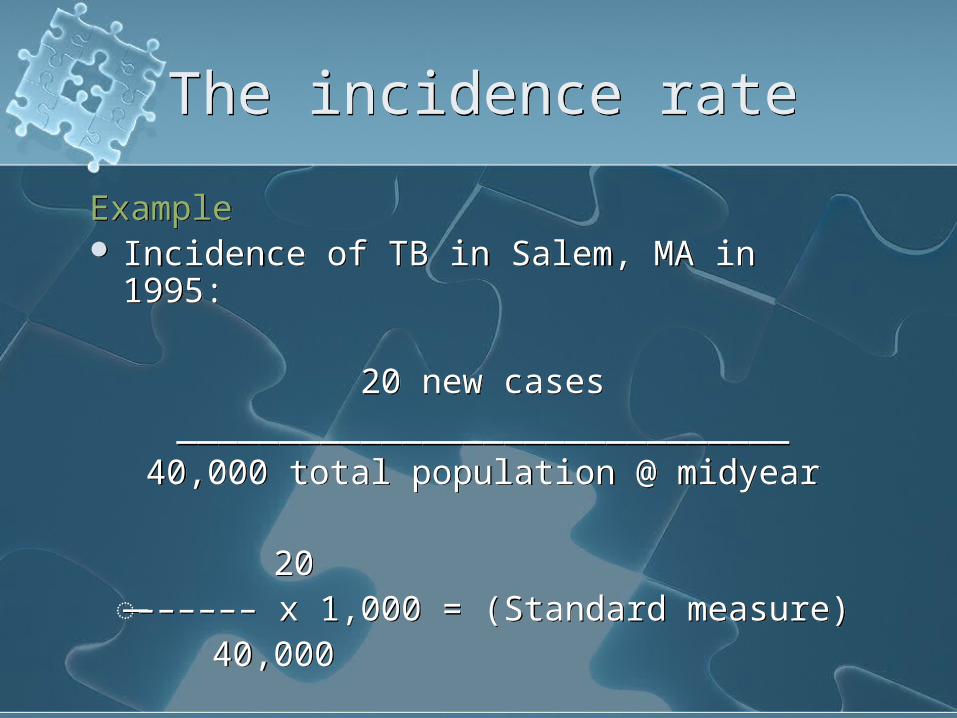
The incidence rateThe incidence rate
Example Incidence of TB in Salem, MA in 1995:
20 new cases______________________________
40,000 total population @ midyear
20̶̶\\–––––– x 1,000 = (Standard measure)
40,000
Example Incidence of TB in Salem, MA in 1995:
20 new cases______________________________
40,000 total population @ midyear
20̶̶\\–––––– x 1,000 = (Standard measure)
40,000
The incidence rateThe incidence rate
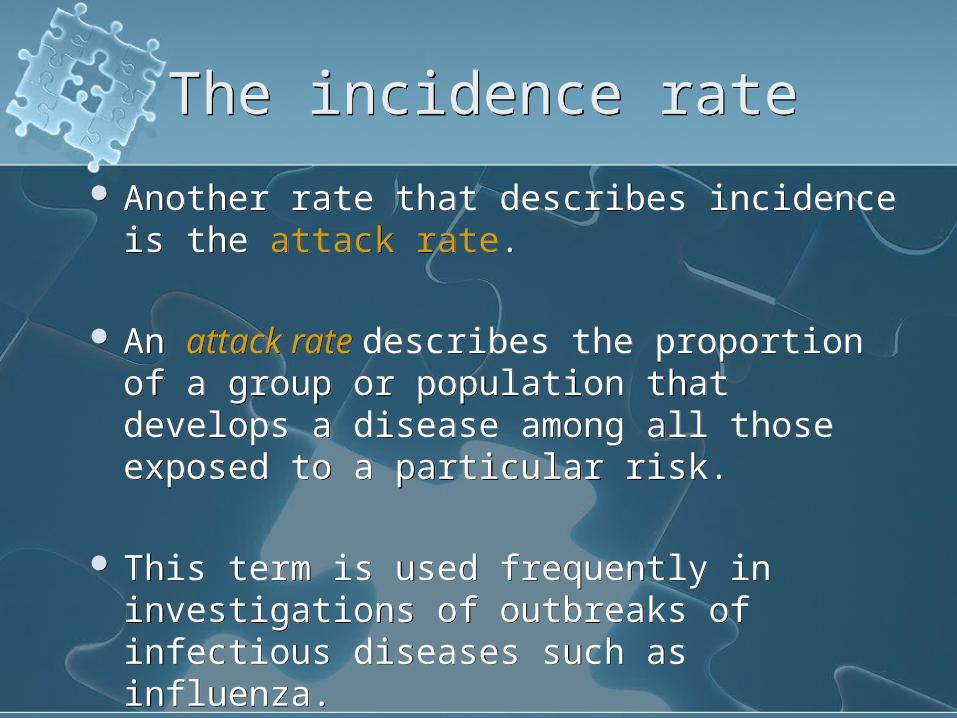
Another rate that describes incidence is the attack rate.
An attack rate describes the proportion of a group or population that develops a disease among all those exposed to a particular risk.
This term is used frequently in investigations of outbreaks of infectious diseases such as influenza.
Another rate that describes incidence is the attack rate.
An attack rate describes the proportion of a group or population that develops a disease among all those exposed to a particular risk.
This term is used frequently in investigations of outbreaks of infectious diseases such as influenza.
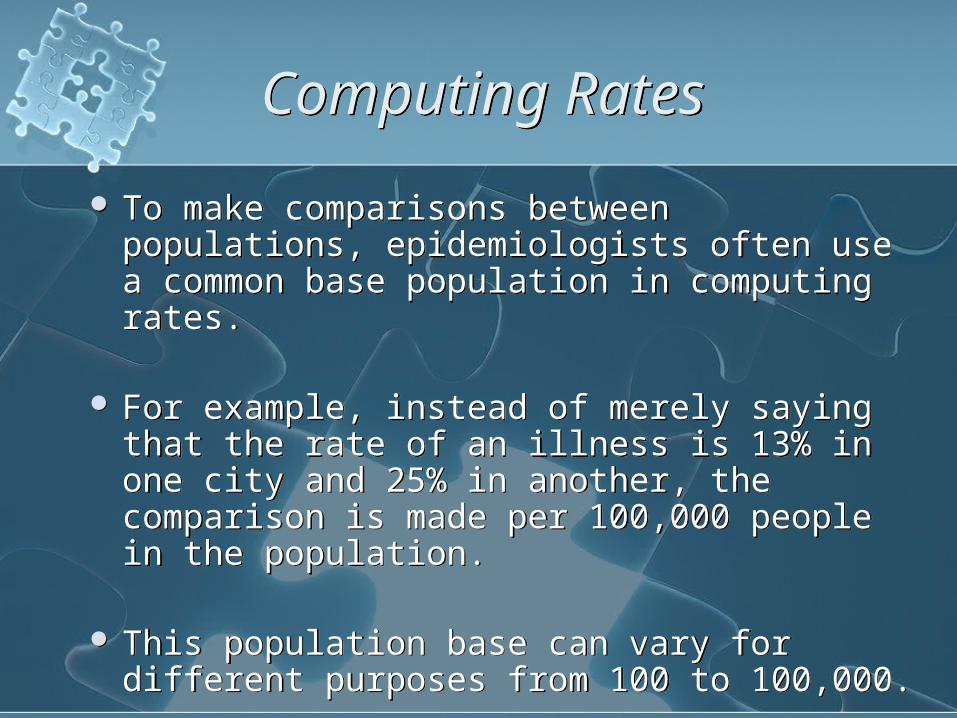
Computing RatesComputing Rates
To make comparisons between populations, epidemiologists often use a common base population in computing rates.
For example, instead of merely saying that the rate of an illness is 13% in one city and 25% in another, the comparison is made per 100,000 people in the population.
This population base can vary for different purposes from 100 to 100,000.
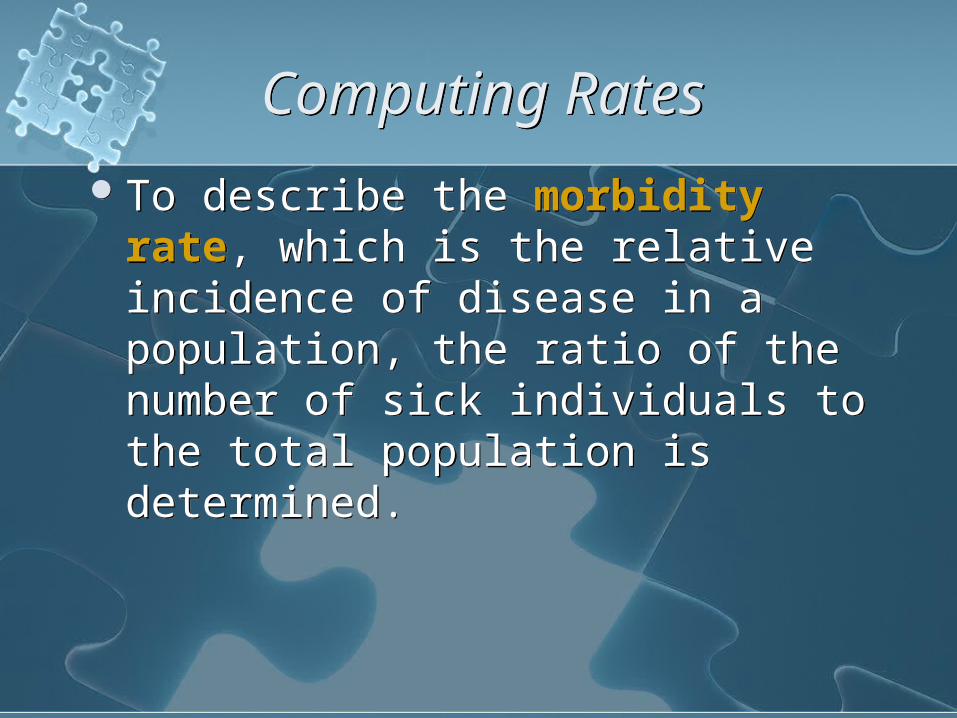
Computing RatesComputing Rates
To describe the morbidity rate, which is the relative incidence of disease in a population, the ratio of the number of sick individuals to the total population is determined.
To describe the morbidity rate, which is the relative incidence of disease in a population, the ratio of the number of sick individuals to the total population is determined.
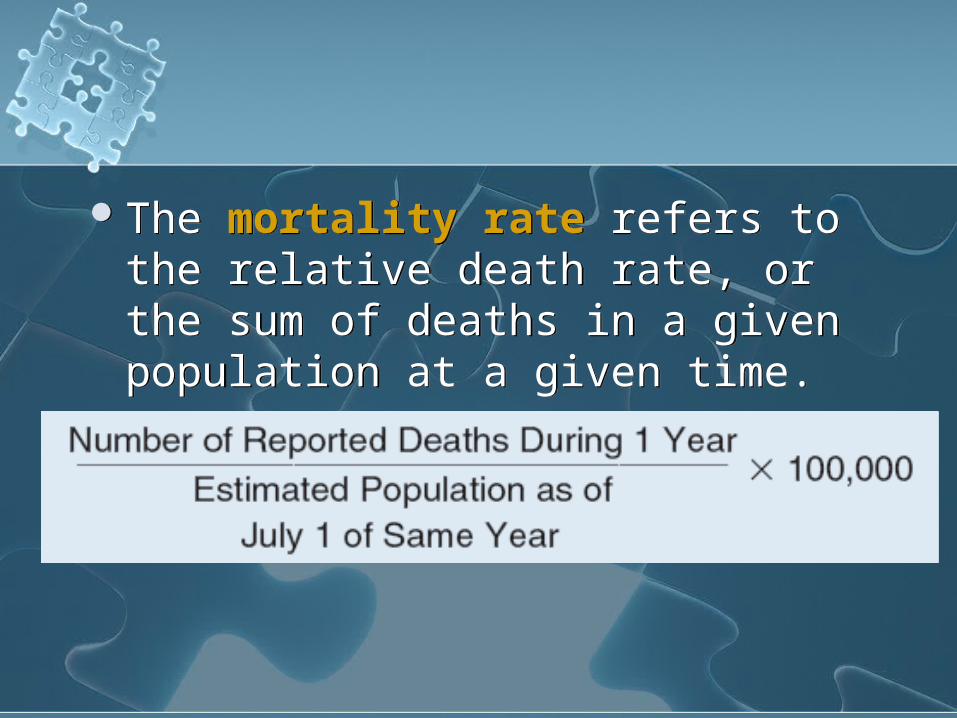
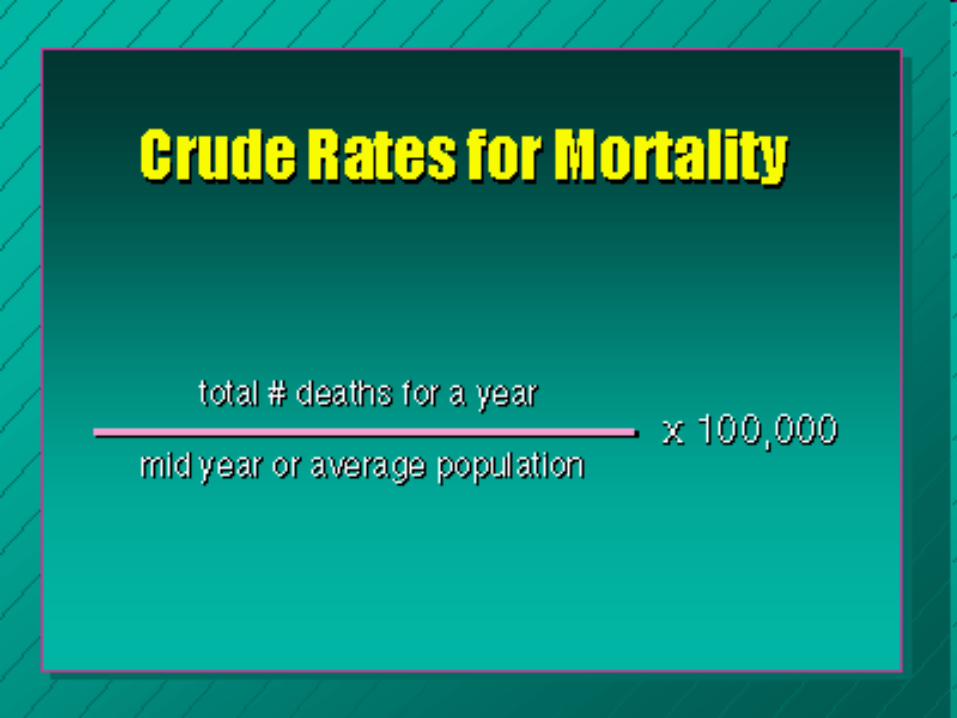
The mortality rate refers to the relative death rate, or the sum of deaths in a given population at a given time.
The mortality rate refers to the relative death rate, or the sum of deaths in a given population at a given time.

Variations in Mortality and Morbidity
Variations in Mortality and Morbidity
AGE: *Death rates/with age, after age 40. Doubling
with each decade. *Age Pyramids reflect patterns of birth and
death. *Rate of chronic illness increases with age
(despite age related prevalence,there are wide disparities cross nationally and socio-culturally)
*Rates of violence/injury related death decrease with age.
*Compression of morbidity is a topic of debate and concern with broad socio-political implication.
Variations in Mortality and Morbidity
Variations in Mortality and Morbidity
GENDER: *During the 1800’s women died younger than men, but since the
1920’s women have been living longer than men. In 1980: Women: averaged 78.6 years, while Men: averaged 71.8 years
(This pattern is not followed in all countries due to maternal mortality.)
*Men die earlier with more life threatening illness, however women display more frequent illness.
*Women have more chronic illness, but they tend to be less severe.
*Women report more episodes of illness and more doctor visits. *Men are more likely to engage in high-risk behavior such as fast
driving, smoking etc.. (These patterns are changing in the US). Research on personality types suggests gender differences that may effect illness patterns.
*Biological factors such as hormones may account for some differences but are not sufficient to explain patterns.

Three Categories of RatesThree Categories of Rates Crude, Specific, and Adjusted Rates computed for a population as a whole
are crude rates. E.g., crude mortality rate
Subgroups of a population may have differences not revealed by the crude rates. Rates calculated for subgroups are specific rates. E.g., age-specific death rate
In comparing populations with different distributions of a factor known to affect the health condition of interest, the use of adjusted rates may be appropriate. Adjusted rates are helpful in making community
comparisons, but they are imaginary: caution is necessary when interpreting.
Crude, Specific, and Adjusted Rates computed for a population as a whole
are crude rates. E.g., crude mortality rate
Subgroups of a population may have differences not revealed by the crude rates. Rates calculated for subgroups are specific rates. E.g., age-specific death rate
In comparing populations with different distributions of a factor known to affect the health condition of interest, the use of adjusted rates may be appropriate. Adjusted rates are helpful in making community
comparisons, but they are imaginary: caution is necessary when interpreting.
CONDUCTING EPIDEMIOLOGIC
RESEARCH
CONDUCTING EPIDEMIOLOGIC
RESEARCH1. Identify the problem.2. Review the literature.3. Design the study.4. Collect the data.5. Analyze the findings.6. Develop conclusions and
applications.7. Disseminate the findings.
1. Identify the problem.2. Review the literature.3. Design the study.4. Collect the data.5. Analyze the findings.6. Develop conclusions and
applications.7. Disseminate the findings.

Thinking epidemiologically can significantly enhance community health nursing practice.
Epidemiology provides both the body of knowledge — information on the distribution and determinants of health conditions — and methods for investigating health problems and evaluating services.
Thinking epidemiologically can significantly enhance community health nursing practice.
Epidemiology provides both the body of knowledge — information on the distribution and determinants of health conditions — and methods for investigating health problems and evaluating services.
The endThe endThe endThe end