Embed Size (px)
Citation preview

World Health Organization• SEARO/FGL/IVD • 31 August 2016World Health Organization• SEARO/FGL/IVD • 31 August 2016 Immunization andVaccine Development
South-East Asia Region
Immunization andVaccine Development
South-East Asia Region
Nepal 2016
Immunization system highlights
� There is a comprehensive multi-year plan (cMYP) for immunization covering 2011-2016.
� A national committee on immunization practice (NCIP) fully functional.
� A national system to monitor adverse events following immunization (AEFI) exists.
� A national policy for health care waste management including waste from immunization activities exists.
� Pandemic influenza vaccine deployment plan exists.
� There is an “Immunization Act – 2012” and “Immunization Trust Fund”.
� 27% spending on vaccines financed by the government.
� 42% spending on routine immunization programme financed by the government.
� All 75 districts had updated micro-plans that included activities to improve immunization coverage.
� All district level vaccine stores are equipped with electronic continuous temperature monitoring system.
� Out of 75 districts, 65 (87%) districts had ³80% coverage for DTP-Hib-HepB3, and 20 (27%) districts had ³90% coverage for MCV1.
� Multiple indicator cluster survey (MICS) was conducted in 2014. Post MR campaign coverage survey and Nepal demography health survey (NDHS) are planned in 2016.
� Mobilization of local community, resources and ownership using appreciative inquiry approach to increase vaccination coverage.
� HPV demonstration project in 2 districts targeting school going girls of grade 6 and out of school girls of the age 11 years.
Source: WHO/UNICEF joint reporting form (JRF) 2015
Disclaimer: The boundaries and names shown and the designations used on all the maps do not imply the expression of any opinion whatsoever on the part of the World Health Organization concerning the legal status of any country, territory, city or area or of its authorities, or concerning the delimitation of its frontiers or boundaries.
Table 1: Basic information1 2015Division/Province/State/Region 5
District 75
Municipality 191
Village development committee 3 639
Ward 35 163
Population density (per sq. km) 181
Population living in urban areas 18%
Population using improved drinking-water sources
88%
Population using improved sanitation 37%
Total expenditure on health as % of GDP 5.5%
Births attended by skilled health personnel 36%
Neonates protected at birth against NT 82%
Total population 27 723 373
Live births (LB) 614 666
Children <1 year 608 802
Children <5 years 2 820 060
Children <15 years 10 174 478
Pregnant women 724 839
Women of child bearing age (15-49 years)
7 812 882
Neonatal mortality rate 23.0 (per 1000 LB)
Infant mortality rate 32.2 (per 1000 LB)
Under-five mortality rate 39.7 (per 1000 LB)
Maternal mortality ratio 190 (per 100000 LB)
1 SEAR annual EPI reporting form, 2015 and WHO, World Health Statistics 2015
Vaccine Age of administration
BCG At birth
DTP-Hib-HepB 6 weeks, 10 weeks, 14 weeks
OPV 6 weeks, 10 weeks, 14 weeks
IPV 14 weeks
PCV 6 weeks, 10 weeks, 9 months
MR 9 months, 15 months
JE 12 months (high-risk districts)
Td During pregnancy
Vitamin A 6-59 months
EPI history � EPI launched in 1979. � HepB vaccine introduced in 2002. � AD syringes introduced in 2003. � MCV SIA started in 2004. � DTP-HepB vaccine introduced in 2005. � JE introduced in 2009. � Hib Pentavalent (DTP-Hib-HepB) vaccine
introduced in 2009. � MR vaccine introduced in 2013. � IPV vaccine introduced in 2014. � MR second dose introduced in 2015. � Pneumococcal conjugate vaccine introduced
in 2015. � Type 2 component of OPV withdrawn on 17
April 2016 by switching from tOPV to bOPV
Table 2: Immunization schedule, 2015
Source: cMYP 2011-2016 and EPI/MOHFW
Source: WHO/UNICEF joint reporting form (JRF) 2015
E P I F a c t S h E E t
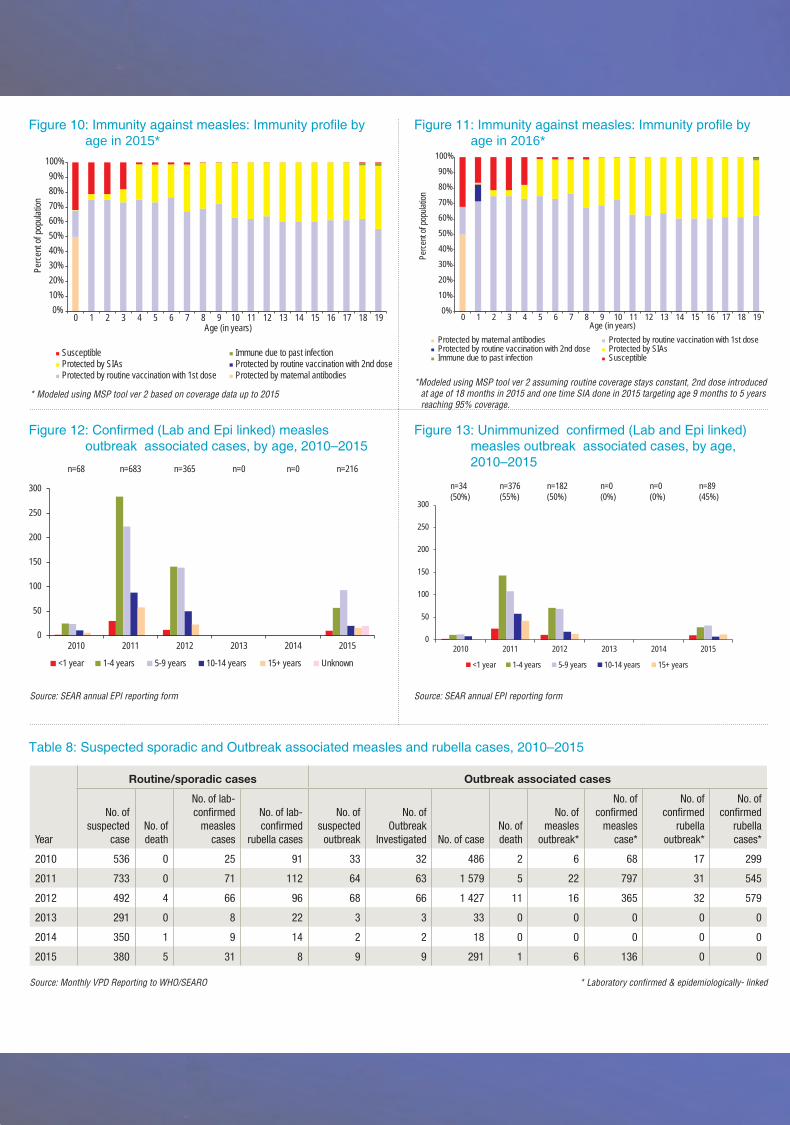
Figure 10: Immunity against measles: Immunity profile by age in 2015*
Figure 12: Confirmed (Lab and Epi linked) measles outbreak associated cases, by age, 2010–2015
Table 8: Suspected sporadic and Outbreak associated measles and rubella cases, 2010–2015
Table 9: Quality of field and laboratory surveillance for measles and rubella, 2012-2015
Table 10: Performance of Laboratory Surveillance, 2012-2015
Figure 14: Laboratory network
Figure 11: Immunity against measles: Immunity profile by age in 2016*
Figure 13: Unimmunized confirmed (Lab and Epi linked) measles outbreak associated cases, by age, 2010–2015
*Modeled using MSP tool ver 2 assuming routine coverage stays constant, 2nd dose introduced at age of 18 months in 2015 and one time SIA done in 2015 targeting age 9 months to 5 years reaching 95% coverage.
* Modeled using MSP tool ver 2 based on coverage data up to 2015
Source: SEAR annual EPI reporting form
Source: Monthly VPD Reporting to WHO/SEARO * Laboratory confirmed & epidemiologically- linked
Source: SEAR Annual EPI Reporting Form ND=No data
Source: SEAR Annual EPI Reporting Form ND=No data
Source: SEAR annual EPI reporting form
Year
Routine/sporadic cases Outbreak associated cases
No. of suspected
case No. of death
No. of lab-confirmed
measles cases
No. of lab-confirmed
rubella cases
No. of suspected
outbreak
No. of Outbreak
Investigated No. of caseNo. of death
No. of measles
outbreak*
No. of confirmed
measles case*
No. of confirmed
rubella outbreak*
No. of confirmed
rubella cases*
2010 536 0 25 91 33 32 486 2 6 68 17 299
2011 733 0 71 112 64 63 1 579 5 22 797 31 545
2012 492 4 66 96 68 66 1 427 11 16 365 32 579
2013 291 0 8 22 3 3 33 0 0 0 0 0
2014 350 1 9 14 2 2 18 0 0 0 0 0
2015 380 5 31 8 9 9 291 1 6 136 0 0
Year
No. o
f Sus
pect
ed M
easl
es
Case classification (number) Indicators
Measles Rubella
Disc
arde
d n
on-m
easl
es n
on-
rube
lla c
ases
Annu
al in
cide
nce
of
confi
rmed
Mea
sles
cas
es p
er
mill
ion
tota
l pop
ulat
ion
Annu
al in
cide
nce
of
confi
rmed
Rub
ella
cas
es p
er
mill
ion
tota
l pop
ulat
ion
Prop
ortio
n of
all
susp
ecte
d m
easl
es a
nd ru
bella
cas
es
that
hav
e ha
d an
ade
quat
e in
vest
igat
ion
initi
ated
with
in
48 h
ours
of n
otifi
catio
n
Disc
arde
d no
n-m
easl
es
non-
rube
lla in
cide
nce
per
100
000
tota
l pop
ulat
ion
Prop
ortio
n of
sub
natio
nal
adm
inis
trativ
e un
its re
porti
ng
at le
ast t
wo
disc
arde
d no
n-m
easl
es n
on-r
ubel
la c
ases
pe
r 100
000
tota
l pop
ulat
ion
Prop
ortio
n of
sub
-nat
iona
l su
rvei
llanc
e un
its re
porti
ng to
th
e na
tiona
l lev
el o
n tim
e
Lab-
confi
rmed
Epi-L
inke
d
Clin
ical
ly-c
onfir
med
Lab-
confi
rmed
Epi-L
inke
d
Target - - 80% 2 80% 80%
2012 3 362 179 485 50 290 382 521 6.28 10.18 ND 1.83 64 91
2013 1 861 10 0 21 25 0 246 0.37 0.92 ND 0.90 55 92
2014 1 279 9 0 16 13 0 274 0.33 0.48 ND 1.00 45 91
2015 1 599 82 182 974 8 0 222 2.59 0.28 ND 0.8 49 89
Year
% Serum specimen collected from
suspected measles cases
Total Serum Specimen
received in Laboratory
% serum specimens
tested
Specimen Positive for
Measles IgM
Specimen Positive for Rubella IgM
% Results within 4 of
receipt
% Outbreak tested
for viral detection
Genotypes detected
No. % No. % Measles Rubella
2012 10 978 100 201 21 310 32 27 5 D8 2B
2013 18 331 99 11 3 30 9 55 0 ND ND
2014 28 330 99 8 2 15 5 78 0 ND ND
2015 30 447 99 87 20 17 4 97 4 D4 & D8 -
For contact or feedback:
Expanded Program on Immunization
National Immunization Program, Child Health Division,
Department of Health Services, Teku, Kathmandu, Nepal
Tel +977-1-4261660, Fax +977-1-4262263
Email: [email protected], [email protected]; www.mohp.gov.np
Immunization and Vaccine Development (IVD)WHO-SEARO, IP Estate, MG Marg, New Delhi 110002, India
Tel: +91 11 23370804, Fax: +91 11 23370251
Email: [email protected], www.searo.who.int/entity/immunization
0%10%20%30%40%50%60%70%80%90%
100%
0 1 2 3 4 5 6 7 8 9 10 11 12 13 14 15 16 17 18 19
Perc
ent o
f pop
ulatio
n
Age (in years)
Susceptible Immune due to past infectionProtected by SIAs Protected by routine vaccination with 2nd doseProtected by routine vaccination with 1st dose Protected by maternal antibodies
0%
10%
20%
30%
40%
50%
60%
70%
80%
90%
100%
0 1 2 3 4 5 6 7 8 9 10 11 12 13 14 15 16 17 18 19
Perce
nt of
popu
lation
Age (in years)Protected by maternal antibodies Protected by routine vaccination with 1st doseProtected by routine vaccination with 2nd dose Protected by SIAsImmune due to past infection Susceptible
n=68 n=683 n=365 n=0 n=0 n=216
0
50
100
150
200
250
300
2010 2011 2012 2013 2014 2015
<1 year 1-4 years 5-9 years 10-14 years 15+ years Unknown
0
50
100
150
200
250
300
2010 2011 2012 2013 2014 2015
<1 year 1-4 years 5-9 years 10-14 years 15+ years
n=34 n=376 n=182 n=0 n=0 n=89(50%) (55%) (50%) (0%) (0%) (45%)
National Public Health Laboratory• National measles/rubella laboratory• National Japanese encephalitis (JE) laboratory
BP Koirala Institute of Health Sciences • JE reference laboratory
Invasive bacterial disease (IBD) laboratories• Patan Hospital
Rotavirus laboratory• Tribhuvan University Teaching Hospital
11 Field Offices (15 SMOs)
Central Office, WHO-IPD

E P I F a c t S h E E t
World Health Organization• SEARO/FGL/IVD • 31 August 2016 Immunization andVaccine Development
South-East Asia Region
Figure 1: National immunization coverage, 1980-2015
Figure 3: DTP-Hib-HepB3 coverage by district, 2015
Figure 5: Non-polio AFP rate by district, 2015
Figure 7: MCV1 coverage1 and measles cases2, 1980-2015
Figure 9: Sporadic and outbreak associated measles cases* and MR SIA coverage, 2010-2015Table 3: OPV supplementary immunization activities (SIA), 2010-2015
Figure 2: DTP3 coverage1, diphtheria and pertussis cases2, 1980–2015
Figure 4: TT2+ coverage1 and NT cases2, 1980–2015
Figure 6: Adequate stool specimen collection percentage by district, 2015
Figure 8: MCV1 coverage by district, 2015
1 WHO and UNICEF estimates of national immunization coverage, July 2016 revision2 WHO vaccine-preventable diseases: monitoring system 2016
Source: WHO and UNICEF estimates of national immunization coverage, July 2016 revision
Source: SEAR annual EPI reporting form, 2015 (administrative data)
Source: SEAR annual EPI reporting form, 2015 (administrative data)
Source: WHO/UNICEF JRF *During MCV campaigns ** with MR campaign as a part of emergency health response in 14 severely affected districts by earthquake.
1 Country official estimates, 1980-20142 WHO vaccine-preventable diseases: monitoring system 2016
• Nepalachievedmaternalneonataltetanus(MNT)eliminationstatusin2005.
Year Activity Target population (<5 years) Date of 1st round Date of 2nd round 1st round coverage (%)
2nd round coverage (%)
2010 NID 4 466 960 10-Apr-10 22-May-10 88 89
2010 Mop-up 2 873 388 19-Jun-10 - 92 -
2010 Mop-up 1 096 948 17-Jul-10 31-Jul-10 98 98
2010 Mop-up 2 015 085 14-Aug-10 - 96 -
2010 Mop-up 1 096 948 18-Sep-10 - 100 -
2010 Mop-up 436 617 2-Oct-10 30-Oct-10 102 104
2010 Mop-up 436 617 20-Nov-10 - 101 -
2011 NID 4 466 960 12-Feb-11 12-Mar-11 91 92
2011 SNID 1 110 222 12-Nov-11 10-Dec-11 98 99
2012 NID 4 226 966 28-Apr-12 - 94 -
2012 SNID*693 843 861 553
2 482 891
14-Feb-12 17-Sep-12 14-Dec-12
-97 91 74
-
2013 NID 4 165 094 20-Dec-13 - 91 -
2014 NID 4 226 966 25-Jan-14 - 91
2015 SNID 2 427 411 06-Jun-15 - 91 -
2015 SNID** 559 511 15-Aug-15 - 90 -
Indicator 2006 2007 2008 2009 2010 2011 2012 2013 2014 2015
AFP cases 364 343 425 451 604 568 640 576 486 394
Wild poliovirus confirmed cases 5 5 6 0 6 0 0 0 0 0
Compatible cases 1 0 0 0 0 0 0 0 0 0
AFP rate 3.57 3.29 3.99 4.14 5.52 5.11 6.12 5.76 4.85 3.87
Non-polio AFP rate1 3.50 3.24 3.93 4.14 5.47 5.11 6.12 5.76 4.85 3.87
Adequate stool specimen collection percentage2 86% 83% 87% 88% 88% 89% 95% 94% 95% 94%
Total stool samples collected 720 658 782 887 1 134 1 102 1 366 1 121 997 791
% NPEV isolation 23 20 18 18 20 17 20 15 15 18
% Timeliness of primary result reported3 98 100 100 100 100 100 100 100 100 100
Table 4: AFP surveillance performance indicators, 2006-2015
• Lastpoliocaseduetoindigenouswildpoliovirustype-2(WPV2)wasreportedfromSaptraidistrictin1999.• Lastpoliocaseduetoindigenouswildpoliovirustype-3(WPV3)wasreportedfromSirahadistrictinNovember2000.• Lastpoliocaseduetoimportedwildpoliovirustype-1(WPV1)wasreportedfromRautahatdistrictinAugust2010.
1 Number of discarded AFP cases per 100,000 children under 15 years of age. 2 Percent with 2 specimens 24 hours apart and within 14 days of paralysis onset.3 2004 to 2007 result reported within 28 days and 2008 onwards result reported within 14 days of sample received at laboratory.
Year Polio Diphtheria Pertussis Neonatal Tetanus (% of all Tetanus)
Measles Rubella Mumps Japanese Encephalitis
Congenital Rubella Syndrome
2006 5 72 1 092 42 (18%) 2 838 ND ND 295 ND
2007 5 44 879 32 (21%) 1 415 227 ND 442 ND
2008 6 149 2 297 53 (17%) 2 089 781 ND 339 ND
2009 0 277 2 357 18 (7%) 189 1 275 27 880 147 ND
2010 6 146 2 293 13 (2%) 190 510 29 022 197 ND
2011 0 94 1 733 95 (49%) 2 359 1 175 39 023 129 ND
2012 0 138 1 595 32 (9%) 3 362 801 35 874 75 ND
2013 0 103 3 431 87 (23%) 1 861 755 29 134 118 ND
2014 0 1 079 6 096 57 (6%) 1 279 704 34 034 1 304 16
2015 0 26 4 416 266 (30%) 1 599 626 38 858 937 50
Year Vaccine, geographic coverage, target group
Target Coverage Achieved
2004-2005 M, nationwide, 9 months to 15 years 9 423 866 104%
2008 M, nationwide, 9 months to 5 years 3 903 515 93%
2012-2013 MR, nationwide, 9 months to 15 years 9 579 306 101%
2015* MR, sub-national, 6 months to 5 years 500 344 91%
Year Number of districts %
2010 23 31
2011 33 44
2012 29 39
2013 33 44
2014 22 29
2015 20 27
Table 5: Reported cases of vaccine preventable diseases, 2006-2015
Table 6: MCV supplementary immunization activities Table 7: Districts with more than 95% MCV1 coverage
Source: WHO/UNICEF JRF ND=No data
1 WHO and UNICEF estimates of national immunization coverage, July 2016 revision2 WHO vaccine-preventable diseases: monitoring system 2016
*As a part of emergency health response in 14 severely affected districts by earthquake.Source: WHO/UNICEF JRF
Source: WHO/UNICEF JRFs
*Includes laboratory confirmed and epidemiologically linked cases
Source: SEAR Monthly VPD reports
1980 1985 1990 1995 2000 2005 2010 2011 2012 2013 2014 2015BCG 22 67 74 76 84 87 94 97 96 97 99 94DTP3 8 32 43 54 74 75 82 92 90 92 92 91OPV3 20 42 50 74 78 83 92 90 92 92 90MCV1 34 57 56 71 74 86 88 86 88 88 85
0
20
40
60
80
100
% C
over
age
0
20
40
60
80
100
0
1000
2000
3000
4000
5000
6000
7000
1980 1985 1990 1995 2000 2005 2010 2011 2012 2013 2014 2015
% C
over
age
No. o
f cas
es
YearDiphtheria Cases Pertussis Cases DTP3 Coverage
12166
<70% 70 % - 79 % 80% - 89% >90%
0
20
40
60
80
100
0
50
100
150
200
250
300
1980 1985 1990 1995 2000 2005 2010 2011 2012 2013 2014 2015
% C
over
age
No. o
f cas
es
YearNT Cases TT2+ Coverage
511
<1 1–1.99 >2 No non-polio AFP case < 60% 60% - 79% > 80% No AFP
0
20
40
60
80
100
0
1000
2000
3000
4000
5000
1980 1985 1990 1995 2000 2005 2010 2011 2012 2013 2014 2015
% C
over
age
No. o
f cas
es
YearMeasles Cases MCV1 Coverage MCV2 Coverage
9397
<70 % 70%–79% 80%–89% > 90%
0
50
100
150
200
MR SIA (100%)
250
300
350
400
450
500
Jan-
10
Mar-1
0
May-1
0
Jul-1
0
Sep-
10
Nov-1
0
Jan-
11
Mar-1
1
May-1
1
Jul-1
1
Sep-
11
Nov-1
1
Jan-
12
Mar-1
2
May-1
2
Jul-1
2
Sep-
12
Nov-1
2
Jan-
13
Mar-1
3
May-1
3
Jul-1
3
Sep-
13
Nov-1
3
Jan-
14
Mar-1
4
May-1
4
Jul-1
4
Sep-
14
Nov-1
4
Jan-
15
Mar-1
5
May-1
5
Jul-1
5
Sep-
15
Nov-1
5
No. o
f cas
es
Sporadic measles Outbreak associated measles
World Health Organization• SEARO/FGL/IVD • 31 August 2016World Health Organization• SEARO/FGL/IVD • 31 August 2016 Immunization andVaccine Development
South-East Asia Region
Immunization andVaccine Development
South-East Asia Region
Nepal 2016
Immunization system highlights
� There is a comprehensive multi-year plan (cMYP) for immunization covering 2011-2016.
� A national committee on immunization practice (NCIP) fully functional.
� A national system to monitor adverse events following immunization (AEFI) exists.
� A national policy for health care waste management including waste from immunization activities exists.
� Pandemic influenza vaccine deployment plan exists.
� There is an “Immunization Act – 2012” and “Immunization Trust Fund”.
� 27% spending on vaccines financed by the government.
� 42% spending on routine immunization programme financed by the government.
� All 75 districts had updated micro-plans that included activities to improve immunization coverage.
� All district level vaccine stores are equipped with electronic continuous temperature monitoring system.
� Out of 75 districts, 65 (87%) districts had ³80% coverage for DTP-Hib-HepB3, and 20 (27%) districts had ³90% coverage for MCV1.
� Multiple indicator cluster survey (MICS) was conducted in 2014. Post MR campaign coverage survey and Nepal demography health survey (NDHS) are planned in 2016.
� Mobilization of local community, resources and ownership using appreciative inquiry approach to increase vaccination coverage.
� HPV demonstration project in 2 districts targeting school going girls of grade 6 and out of school girls of the age 11 years.
Source: WHO/UNICEF joint reporting form (JRF) 2015
Disclaimer: The boundaries and names shown and the designations used on all the maps do not imply the expression of any opinion whatsoever on the part of the World Health Organization concerning the legal status of any country, territory, city or area or of its authorities, or concerning the delimitation of its frontiers or boundaries.
Table 1: Basic information1 2015Division/Province/State/Region 5
District 75
Municipality 191
Village development committee 3 639
Ward 35 163
Population density (per sq. km) 181
Population living in urban areas 18%
Population using improved drinking-water sources
88%
Population using improved sanitation 37%
Total expenditure on health as % of GDP 5.5%
Births attended by skilled health personnel 36%
Neonates protected at birth against NT 82%
Total population 27 723 373
Live births (LB) 614 666
Children <1 year 608 802
Children <5 years 2 820 060
Children <15 years 10 174 478
Pregnant women 724 839
Women of child bearing age (15-49 years)
7 812 882
Neonatal mortality rate 23.0 (per 1000 LB)
Infant mortality rate 32.2 (per 1000 LB)
Under-five mortality rate 39.7 (per 1000 LB)
Maternal mortality ratio 190 (per 100000 LB)
1 SEAR annual EPI reporting form, 2015 and WHO, World Health Statistics 2015
Vaccine Age of administration
BCG At birth
DTP-Hib-HepB 6 weeks, 10 weeks, 14 weeks
OPV 6 weeks, 10 weeks, 14 weeks
IPV 14 weeks
PCV 6 weeks, 10 weeks, 9 months
MR 9 months, 15 months
JE 12 months (high-risk districts)
Td During pregnancy
Vitamin A 6-59 months
EPI history � EPI launched in 1979. � HepB vaccine introduced in 2002. � AD syringes introduced in 2003. � MCV SIA started in 2004. � DTP-HepB vaccine introduced in 2005. � JE introduced in 2009. � Hib Pentavalent (DTP-Hib-HepB) vaccine
introduced in 2009. � MR vaccine introduced in 2013. � IPV vaccine introduced in 2014. � MR second dose introduced in 2015. � Pneumococcal conjugate vaccine introduced
in 2015. � Type 2 component of OPV withdrawn on 17
April 2016 by switching from tOPV to bOPV
Table 2: Immunization schedule, 2015
Source: cMYP 2011-2016 and EPI/MOHFW
Source: WHO/UNICEF joint reporting form (JRF) 2015
E P I F a c t S h E E t
Figure 10: Immunity against measles: Immunity profile by age in 2015*
Figure 12: Confirmed (Lab and Epi linked) measles outbreak associated cases, by age, 2010–2015
Table 8: Suspected sporadic and Outbreak associated measles and rubella cases, 2010–2015
Table 9: Quality of field and laboratory surveillance for measles and rubella, 2012-2015
Table 10: Performance of Laboratory Surveillance, 2012-2015
Figure 14: Laboratory network
Figure 11: Immunity against measles: Immunity profile by age in 2016*
Figure 13: Unimmunized confirmed (Lab and Epi linked) measles outbreak associated cases, by age, 2010–2015
*Modeled using MSP tool ver 2 assuming routine coverage stays constant, 2nd dose introduced at age of 18 months in 2015 and one time SIA done in 2015 targeting age 9 months to 5 years reaching 95% coverage.
* Modeled using MSP tool ver 2 based on coverage data up to 2015
Source: SEAR annual EPI reporting form
Source: Monthly VPD Reporting to WHO/SEARO * Laboratory confirmed & epidemiologically- linked
Source: SEAR Annual EPI Reporting Form ND=No data
Source: SEAR Annual EPI Reporting Form ND=No data
Source: SEAR annual EPI reporting form
Year
Routine/sporadic cases Outbreak associated cases
No. of suspected
case No. of death
No. of lab-confirmed
measles cases
No. of lab-confirmed
rubella cases
No. of suspected
outbreak
No. of Outbreak
Investigated No. of caseNo. of death
No. of measles
outbreak*
No. of confirmed
measles case*
No. of confirmed
rubella outbreak*
No. of confirmed
rubella cases*
2010 536 0 25 91 33 32 486 2 6 68 17 299
2011 733 0 71 112 64 63 1 579 5 22 797 31 545
2012 492 4 66 96 68 66 1 427 11 16 365 32 579
2013 291 0 8 22 3 3 33 0 0 0 0 0
2014 350 1 9 14 2 2 18 0 0 0 0 0
2015 380 5 31 8 9 9 291 1 6 136 0 0
Year
No. o
f Sus
pect
ed M
easl
es
Case classification (number) Indicators
Measles Rubella
Disc
arde
d n
on-m
easl
es n
on-
rube
lla c
ases
Annu
al in
cide
nce
of
confi
rmed
Mea
sles
cas
es p
er
mill
ion
tota
l pop
ulat
ion
Annu
al in
cide
nce
of
confi
rmed
Rub
ella
cas
es p
er
mill
ion
tota
l pop
ulat
ion
Prop
ortio
n of
all
susp
ecte
d m
easl
es a
nd ru
bella
cas
es
that
hav
e ha
d an
ade
quat
e in
vest
igat
ion
initi
ated
with
in
48 h
ours
of n
otifi
catio
n
Disc
arde
d no
n-m
easl
es
non-
rube
lla in
cide
nce
per
100
000
tota
l pop
ulat
ion
Prop
ortio
n of
sub
natio
nal
adm
inis
trativ
e un
its re
porti
ng
at le
ast t
wo
disc
arde
d no
n-m
easl
es n
on-r
ubel
la c
ases
pe
r 100
000
tota
l pop
ulat
ion
Prop
ortio
n of
sub
-nat
iona
l su
rvei
llanc
e un
its re
porti
ng to
th
e na
tiona
l lev
el o
n tim
e
Lab-
confi
rmed
Epi-L
inke
d
Clin
ical
ly-c
onfir
med
Lab-
confi
rmed
Epi-L
inke
d
Target - - 80% 2 80% 80%
2012 3 362 179 485 50 290 382 521 6.28 10.18 ND 1.83 64 91
2013 1 861 10 0 21 25 0 246 0.37 0.92 ND 0.90 55 92
2014 1 279 9 0 16 13 0 274 0.33 0.48 ND 1.00 45 91
2015 1 599 82 182 974 8 0 222 2.59 0.28 ND 0.8 49 89
Year
% Serum specimen collected from
suspected measles cases
Total Serum Specimen
received in Laboratory
% serum specimens
tested
Specimen Positive for
Measles IgM
Specimen Positive for Rubella IgM
% Results within 4 of
receipt
% Outbreak tested
for viral detection
Genotypes detected
No. % No. % Measles Rubella
2012 10 978 100 201 21 310 32 27 5 D8 2B
2013 18 331 99 11 3 30 9 55 0 ND ND
2014 28 330 99 8 2 15 5 78 0 ND ND
2015 30 447 99 87 20 17 4 97 4 D4 & D8 -
For contact or feedback:
Expanded Program on Immunization
National Immunization Program, Child Health Division,
Department of Health Services, Teku, Kathmandu, Nepal
Tel +977-1-4261660, Fax +977-1-4262263
Email: [email protected], [email protected]; www.mohp.gov.np
Immunization and Vaccine Development (IVD)WHO-SEARO, IP Estate, MG Marg, New Delhi 110002, India
Tel: +91 11 23370804, Fax: +91 11 23370251
Email: [email protected], www.searo.who.int/entity/immunization
0%10%20%30%40%50%60%70%80%90%
100%
0 1 2 3 4 5 6 7 8 9 10 11 12 13 14 15 16 17 18 19
Perc
ent o
f pop
ulatio
n
Age (in years)
Susceptible Immune due to past infectionProtected by SIAs Protected by routine vaccination with 2nd doseProtected by routine vaccination with 1st dose Protected by maternal antibodies
0%
10%
20%
30%
40%
50%
60%
70%
80%
90%
100%
0 1 2 3 4 5 6 7 8 9 10 11 12 13 14 15 16 17 18 19
Perce
nt of
popu
lation
Age (in years)Protected by maternal antibodies Protected by routine vaccination with 1st doseProtected by routine vaccination with 2nd dose Protected by SIAsImmune due to past infection Susceptible
n=68 n=683 n=365 n=0 n=0 n=216
0
50
100
150
200
250
300
2010 2011 2012 2013 2014 2015
<1 year 1-4 years 5-9 years 10-14 years 15+ years Unknown
0
50
100
150
200
250
300
2010 2011 2012 2013 2014 2015
<1 year 1-4 years 5-9 years 10-14 years 15+ years
n=34 n=376 n=182 n=0 n=0 n=89(50%) (55%) (50%) (0%) (0%) (45%)
National Public Health Laboratory• National measles/rubella laboratory• National Japanese encephalitis (JE) laboratory
BP Koirala Institute of Health Sciences • JE reference laboratory
Invasive bacterial disease (IBD) laboratories• Patan Hospital
Rotavirus laboratory• Tribhuvan University Teaching Hospital
11 Field Offices (15 SMOs)
Central Office, WHO-IPD

World Health Organization• SEARO/FGL/IVD • 31 August 2016World Health Organization• SEARO/FGL/IVD • 31 August 2016 Immunization andVaccine Development
South-East Asia Region
Immunization andVaccine Development
South-East Asia Region
Nepal 2016
Immunization system highlights
� There is a comprehensive multi-year plan (cMYP) for immunization covering 2011-2016.
� A national committee on immunization practice (NCIP) fully functional.
� A national system to monitor adverse events following immunization (AEFI) exists.
� A national policy for health care waste management including waste from immunization activities exists.
� Pandemic influenza vaccine deployment plan exists.
� There is an “Immunization Act – 2012” and “Immunization Trust Fund”.
� 27% spending on vaccines financed by the government.
� 42% spending on routine immunization programme financed by the government.
� All 75 districts had updated micro-plans that included activities to improve immunization coverage.
� All district level vaccine stores are equipped with electronic continuous temperature monitoring system.
� Out of 75 districts, 65 (87%) districts had ³80% coverage for DTP-Hib-HepB3, and 20 (27%) districts had ³90% coverage for MCV1.
� Multiple indicator cluster survey (MICS) was conducted in 2014. Post MR campaign coverage survey and Nepal demography health survey (NDHS) are planned in 2016.
� Mobilization of local community, resources and ownership using appreciative inquiry approach to increase vaccination coverage.
� HPV demonstration project in 2 districts targeting school going girls of grade 6 and out of school girls of the age 11 years.
Source: WHO/UNICEF joint reporting form (JRF) 2015
Disclaimer: The boundaries and names shown and the designations used on all the maps do not imply the expression of any opinion whatsoever on the part of the World Health Organization concerning the legal status of any country, territory, city or area or of its authorities, or concerning the delimitation of its frontiers or boundaries.
Table 1: Basic information1 2015Division/Province/State/Region 5
District 75
Municipality 191
Village development committee 3 639
Ward 35 163
Population density (per sq. km) 181
Population living in urban areas 18%
Population using improved drinking-water sources
88%
Population using improved sanitation 37%
Total expenditure on health as % of GDP 5.5%
Births attended by skilled health personnel 36%
Neonates protected at birth against NT 82%
Total population 27 723 373
Live births (LB) 614 666
Children <1 year 608 802
Children <5 years 2 820 060
Children <15 years 10 174 478
Pregnant women 724 839
Women of child bearing age (15-49 years)
7 812 882
Neonatal mortality rate 23.0 (per 1000 LB)
Infant mortality rate 32.2 (per 1000 LB)
Under-five mortality rate 39.7 (per 1000 LB)
Maternal mortality ratio 190 (per 100000 LB)
1 SEAR annual EPI reporting form, 2015 and WHO, World Health Statistics 2015
Vaccine Age of administration
BCG At birth
DTP-Hib-HepB 6 weeks, 10 weeks, 14 weeks
OPV 6 weeks, 10 weeks, 14 weeks
IPV 14 weeks
PCV 6 weeks, 10 weeks, 9 months
MR 9 months, 15 months
JE 12 months (high-risk districts)
Td During pregnancy
Vitamin A 6-59 months
EPI history � EPI launched in 1979. � HepB vaccine introduced in 2002. � AD syringes introduced in 2003. � MCV SIA started in 2004. � DTP-HepB vaccine introduced in 2005. � JE introduced in 2009. � Hib Pentavalent (DTP-Hib-HepB) vaccine
introduced in 2009. � MR vaccine introduced in 2013. � IPV vaccine introduced in 2014. � MR second dose introduced in 2015. � Pneumococcal conjugate vaccine introduced
in 2015. � Type 2 component of OPV withdrawn on 17
April 2016 by switching from tOPV to bOPV
Table 2: Immunization schedule, 2015
Source: cMYP 2011-2016 and EPI/MOHFW
Source: WHO/UNICEF joint reporting form (JRF) 2015
E P I F a c t S h E E t
Figure 10: Immunity against measles: Immunity profile by age in 2015*
Figure 12: Confirmed (Lab and Epi linked) measles outbreak associated cases, by age, 2010–2015
Table 8: Suspected sporadic and Outbreak associated measles and rubella cases, 2010–2015
Table 9: Quality of field and laboratory surveillance for measles and rubella, 2012-2015
Table 10: Performance of Laboratory Surveillance, 2012-2015
Figure 14: Laboratory network
Figure 11: Immunity against measles: Immunity profile by age in 2016*
Figure 13: Unimmunized confirmed (Lab and Epi linked) measles outbreak associated cases, by age, 2010–2015
*Modeled using MSP tool ver 2 assuming routine coverage stays constant, 2nd dose introduced at age of 18 months in 2015 and one time SIA done in 2015 targeting age 9 months to 5 years reaching 95% coverage.
* Modeled using MSP tool ver 2 based on coverage data up to 2015
Source: SEAR annual EPI reporting form
Source: Monthly VPD Reporting to WHO/SEARO * Laboratory confirmed & epidemiologically- linked
Source: SEAR Annual EPI Reporting Form ND=No data
Source: SEAR Annual EPI Reporting Form ND=No data
Source: SEAR annual EPI reporting form
Year
Routine/sporadic cases Outbreak associated cases
No. of suspected
case No. of death
No. of lab-confirmed
measles cases
No. of lab-confirmed
rubella cases
No. of suspected
outbreak
No. of Outbreak
Investigated No. of caseNo. of death
No. of measles
outbreak*
No. of confirmed
measles case*
No. of confirmed
rubella outbreak*
No. of confirmed
rubella cases*
2010 536 0 25 91 33 32 486 2 6 68 17 299
2011 733 0 71 112 64 63 1 579 5 22 797 31 545
2012 492 4 66 96 68 66 1 427 11 16 365 32 579
2013 291 0 8 22 3 3 33 0 0 0 0 0
2014 350 1 9 14 2 2 18 0 0 0 0 0
2015 380 5 31 8 9 9 291 1 6 136 0 0
Year
No. o
f Sus
pect
ed M
easl
es
Case classification (number) Indicators
Measles Rubella
Disc
arde
d n
on-m
easl
es n
on-
rube
lla c
ases
Annu
al in
cide
nce
of
confi
rmed
Mea
sles
cas
es p
er
mill
ion
tota
l pop
ulat
ion
Annu
al in
cide
nce
of
confi
rmed
Rub
ella
cas
es p
er
mill
ion
tota
l pop
ulat
ion
Prop
ortio
n of
all
susp
ecte
d m
easl
es a
nd ru
bella
cas
es
that
hav
e ha
d an
ade
quat
e in
vest
igat
ion
initi
ated
with
in
48 h
ours
of n
otifi
catio
n
Disc
arde
d no
n-m
easl
es
non-
rube
lla in
cide
nce
per
100
000
tota
l pop
ulat
ion
Prop
ortio
n of
sub
natio
nal
adm
inis
trativ
e un
its re
porti
ng
at le
ast t
wo
disc
arde
d no
n-m
easl
es n
on-r
ubel
la c
ases
pe
r 100
000
tota
l pop
ulat
ion
Prop
ortio
n of
sub
-nat
iona
l su
rvei
llanc
e un
its re
porti
ng to
th
e na
tiona
l lev
el o
n tim
e
Lab-
confi
rmed
Epi-L
inke
d
Clin
ical
ly-c
onfir
med
Lab-
confi
rmed
Epi-L
inke
dTarget - - 80% 2 80% 80%
2012 3 362 179 485 50 290 382 521 6.28 10.18 ND 1.83 64 91
2013 1 861 10 0 21 25 0 246 0.37 0.92 ND 0.90 55 92
2014 1 279 9 0 16 13 0 274 0.33 0.48 ND 1.00 45 91
2015 1 599 82 182 974 8 0 222 2.59 0.28 ND 0.8 49 89
Year
% Serum specimen collected from
suspected measles cases
Total Serum Specimen
received in Laboratory
% serum specimens
tested
Specimen Positive for
Measles IgM
Specimen Positive for Rubella IgM
% Results within 4 of
receipt
% Outbreak tested
for viral detection
Genotypes detected
No. % No. % Measles Rubella
2012 10 978 100 201 21 310 32 27 5 D8 2B
2013 18 331 99 11 3 30 9 55 0 ND ND
2014 28 330 99 8 2 15 5 78 0 ND ND
2015 30 447 99 87 20 17 4 97 4 D4 & D8 -
For contact or feedback:
Expanded Program on Immunization
National Immunization Program, Child Health Division,
Department of Health Services, Teku, Kathmandu, Nepal
Tel +977-1-4261660, Fax +977-1-4262263
Email: [email protected], [email protected]; www.mohp.gov.np
Immunization and Vaccine Development (IVD)WHO-SEARO, IP Estate, MG Marg, New Delhi 110002, India
Tel: +91 11 23370804, Fax: +91 11 23370251
Email: [email protected], www.searo.who.int/entity/immunization
0%10%20%30%40%50%60%70%80%90%
100%
0 1 2 3 4 5 6 7 8 9 10 11 12 13 14 15 16 17 18 19
Perc
ent o
f pop
ulatio
n
Age (in years)
Susceptible Immune due to past infectionProtected by SIAs Protected by routine vaccination with 2nd doseProtected by routine vaccination with 1st dose Protected by maternal antibodies
0%
10%
20%
30%
40%
50%
60%
70%
80%
90%
100%
0 1 2 3 4 5 6 7 8 9 10 11 12 13 14 15 16 17 18 19
Perce
nt of
popu
lation
Age (in years)Protected by maternal antibodies Protected by routine vaccination with 1st doseProtected by routine vaccination with 2nd dose Protected by SIAsImmune due to past infection Susceptible
n=68 n=683 n=365 n=0 n=0 n=216
0
50
100
150
200
250
300
2010 2011 2012 2013 2014 2015
<1 year 1-4 years 5-9 years 10-14 years 15+ years Unknown
0
50
100
150
200
250
300
2010 2011 2012 2013 2014 2015
<1 year 1-4 years 5-9 years 10-14 years 15+ years
n=34 n=376 n=182 n=0 n=0 n=89(50%) (55%) (50%) (0%) (0%) (45%)
National Public Health Laboratory• National measles/rubella laboratory• National Japanese encephalitis (JE) laboratory
BP Koirala Institute of Health Sciences • JE reference laboratory
Invasive bacterial disease (IBD) laboratories• Patan Hospital
Rotavirus laboratory• Tribhuvan University Teaching Hospital
11 Field Offices (15 SMOs)
Central Office, WHO-IPD