Embed Size (px)
Citation preview

Technical Report GL-93-11
AD- A269 968 August 1993
US Army Corpsof EngineersWaterways ExperimentStation
Investigation of Ephemeral Gulliesin Loessial Soils in Mississippi
by Lawson M. SmithGeotechnical Laboratory
Approved For Public Release; Distribution Is Unlimited
93-22578
Prepared for Soil Conservation Service

The contents of this report are not to be used for advertising,publication, or promotional purposes. Citation of trade namesdoes not constitute an official endorsement or approval of the useof such commercial products.
% PRI NTED ON RYCLED PAPkR

Technical Roport GL-93-11August 1993
Investigation of Ephemeral Gulliesin Loessial Soils in Mississippiby Lawson M. Smith
Geotechnical Laboratory
U.S. Army Corps of Engineers Accesion For
Waterways Experiment Station NTIS CRA&M3909 Halls Ferry Road DTIC TABVicksburg, MS 39180-6199 Unannounced .i
Justification
B y ................. .. . . . . . . . . . . . ..
1;t ibutionj
Availability Coes
Dist SpLcjal
Final report
Approved for public release. distribution is unlimited
Prepared for Soil Conservation Service100 West Caoitol StreetJackson, MS 39269
US Army Corpsof EngineersWaterways Experiment '
WtaterasEprmnitainonlgn-riPblalnDt
Smith Lawon M
1.OUOR SU!~cso issip.2 roo issip. S. ~ loeganMississippi. ~ ~ ~ ~ WTUAY 4.FRIN RieScanls-MsssipiT.InOdNtts.Si
Waterways Experiment Station) CtgL-93-1 nPbicto Dat
22 W4 p o. :il 8c.-(ehia eot;GL-93-1 1)Inldsbbigapia eeecs

Contents
Preface ............................................ v
Conversion Factors, Non-SI to SIUnits of Measurement ................................. vi
I-Introduction ....................................... I
Backgr'-und ........................................ IPurpose and Objectives .. .............................
2-Methodology ....................................... 3
Selection of Sites .. ................................. 3Establishment of Sites .. .............................. 9Development of the Gulliometer .......................... 9Field Measurement of Ephemeral Gullies .................. 10Reduction of Gully Measurement Data ..................... 12Acquisition of Meteorological Data ....................... 18Photography of Field Sites . ........................... 18Photogrammetric Measurement of Site 3 .................... 18
3-Observations ...................................... 32
General Observations ................................. 32Site I Observations .................................. 39Site 2 Observations .................................. 42Site 3 Observations .................................. 42Site 4 Observations .................................. 49
4-Results .. ....................................... 52
Development of Ephemeral Gully Data ..................... 52Magnitude of Soil Loss from Ephemeral Gully Data ........... 52Preliminary Analysis of Data ........................... 53Ephemeral Gully Erosion Equation ....................... 53
5-Conclusions .. .................................... 55
6-Recommendations ................................... 57
References .. ....................................... 58
Plates 1-17
Appendix " Data Analysis Scope of Work .................. Al
- ' ' I I I I I II I

Appendix B: Soil Descriptions ........................... BI
Appendix C: Gulliometer Drawings ........................ Cl
Appendix D: Ephemeral Gully Data ........................ D
Appendix E: Ephemeral Gully Soil Loss Calculations ............. El
Appendix F: Volumetric Growth Ephemeral Gullies Over Time ...... F1
Appendix G: Photogrammetric Measurement of Gullies ........... GI
SF 298
iv

Preface
The U.S. Army Engineer Waterways Experiment Station (WES) wasauthorized to conduct this study by the U.S. Department of Agriculture, SoilConservation Service (SCS), Jackson, Mississippi, during the period January1983 to September 1991. The study was conducted by Dr. Lawson M. Smith,Engineering Geology Branch, Earthquake Engineering and Geosciences Divi-sion, Geotechnical Laboratory (GL), WES. The SCS Technical Monitorswere Mr. Peter Forsythe and Mr. Ross Ulmer.
Dr. Smith was assisted by Mr. Bennie Washington, Mrs. Ruthie Lipscomb;Mr. Peter Church, Engineering Geology Branch, and Mr. Lester Flowers,Rock Mechanics Branch, Soil and Rock Mechanics Division; Ms. BenitaAllen, Rock Mechanics Branch; and Ms. Glenda Morgan, Soil and RockMechanics Division, GL.
Mr. Washington played a substantial role in the investigation of the ephem-eral gullies through his assistance and field studies, reduction of field data,and drafting of all the figures and illustrations in the report. Mr. Flowers alsoplayed a substantial role through the establishment of the gully sites and fre-quent field data acquisition. Ruthie Lipscomb and Peter Church also contrib-uted to field data acquisition and reduction of data. Benita Allen and GlendaMorgan prepared the computer data files for the ephemeral gullies.Mr. Robert F. Anderson, Rock Mechanics Branch, designed and supervisedthe fabrication of the gulliometer.
The project was conducted under the general supervision of Mr. Joe L.Gatz, Chief, Engineering Geology Branch, and Dr. A. G. Franklin, Chief,Earthquake Engineering and Geosciences Division.
General direction was provided by Dr. W. F. Marcuson TI1, Director, GL.
At the time of publication of this report, Director of WES wasDr. Robert W. Whalin. Commander was COL Bruce K. Howard, EN.
V

Conversion Factors,Non-SI to SI Units ofMeasurement
Non-SI units of measurement used in this report can be converted to SI unitsas follows:
Multiply J By To Obtain
acres 4,046.873 square meters
cubic feet 0.02831685 cubic meters
feet 0.3048 meters
inches 2.54 centimeters
square feet 0.09290304 square meters
tons (mass) per square toot 9.764.856 kilogram per square meter
vi

1 Introduction
Background
At the request of the Soil Conservation Service (SCS), Jackson,Mississippi, the U.S. Army Engineer Waterways Experiment Station (WES),in September 1982, submitted a proposal to conduct an investigation ofephemeral gullies in loessial soils in Mississippi. The proposal was submittedto the SCS in December 1982 and approved by the SCS in January 1983. InJune 1983, a contract was awarded to Colorado State University (CSU) toconduct data analysis and development of predictive methods for ephemeralgullies based on the data developed by this study. The scope of work for thiscontract is included in Appendix A. In December 1983, the ephemeral gullystudy was expanded to cover additional periods of field measurement.
Soil erosion is a major problem facing the United States and the world. Asa principal resource base for the production of food, soil is a limited resourcewhich under certain circumstances has been largely eroded. Soil erosion incroplands occurs primarily by three processes: sheet erosion, rill erosion, andthe development of ephemeral gullies. Ephemeral gullies are defined as smalldrainage ways which develop seasonally between cultivation practices, andwhich, if not filled in, would become permanent features of the drainagenetwork. Ephemeral gullies may reach a width of 2 to 3 ft and a depth of 1to 1-1/2 ft. Presently, there are several methods to predict sheet and rill soilerosion on croplands. The accepted procedure is the use of universal soil lossequation. Thorne (1984) developed a procedure for predicting soil loss forephemeral gullies (contract to CSU in June 1983). Thorne's Ephemeral GullyErosion Equation (EGEE) is described later in Chapter 4. However, the totalamount of soil loss from croplands is often significantly underestimated sinceephemeral gully soil erosion is usually not predicted in practice.
Purpose and Objectives
The purpose of this investigation was to obtain detailed data on ephemeralgullies at various sites in Mississippi for use in the development of proceduresto predict the development of ephemeral gullies. The data developed in this
Chapter 1 Introduction

study will be used by several other researchers in their efforts to develop
predictive methods in ephemeral gullies.
There were five specific objectives of this investigation:
a. Establish four gully measurement sites in loessial soils in centralMississippi.
b. Develop an accurate and efficient procedure for measuring ephemeralgullies in the field.
c. Gather gully measurement data for the field sites which accuratelydescribe the development of ephemeral gullies and which quantify theamount of soil loss per year, per acre, due to ephemeral gullies.
d. Provide observations on the development of ephemeral gullies at thefield sites.
e. Make recommendations on the use of the data gathered and proceduresfor acquiring additional data.
2Chapter I Introduction

2 Methodology
Selection of Sites
Site selection was completed by the staff of the Soil Conservation Service,Mississippi State Office, the Waterways Experiment Station, and the SoilSurvey Staff-Yazoo, Hinds, Madison, and Warren Counties. A number ofsites were examined in Yazoo, Hinds, Madison, and Warren Counties to findsites which represented gully erosion and several types of soils developed inloess. These soils included the Memphis, Providence, Grenada, and the Lor-ing soils.
After examination of a number of sites in each of the four counties, foursites were selected in Warren, Hinds, and Madison Counties (Figure 1).Sites I and 2 are both of Memphis soils and occur in Warren County. Site 3is Loring soil and occurs in Hinds County. Sit ; 4 is Providence soil and is inMadison County. The four sites are identified as follows:
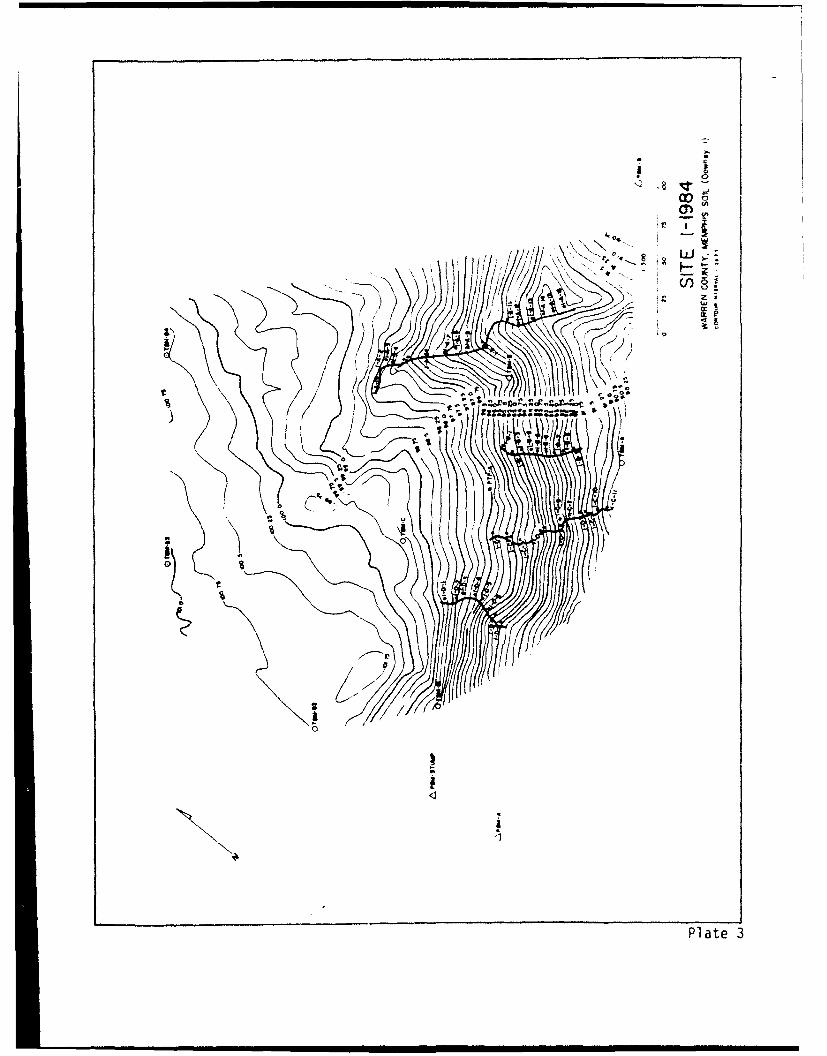
a. Site 1, Memphis soil-Herbert Downey Farm; Warren County; southeast1/4, Section 25, T15N, R4E; Big Black 7.5 min U.S. Geological Sur-vey quadrangle; sheet 68, Warren County Soil Surveys; land use soy-beans (Figure 2).
b. Site 2, Memphis soil-Herbert Downey Farm; Warren County; northeast1/4, Section 36, TI5N, R4E; Big Black 7.5 min U.S. Geological Sur-vey quadrangle; sheet 68, Warren County Soil Survey; land use soy-beans (Figure 3).
c. Site 3 Loring soil-Bobbie Mellon Farm; Hinds County; southeast 1/4,Section 18, T6N, R2W; Raymond 7.5 min U.S. Geological Surveyquadrangle; sheet 14, Hinds County Soil Survey; land use corn(Figure 4).
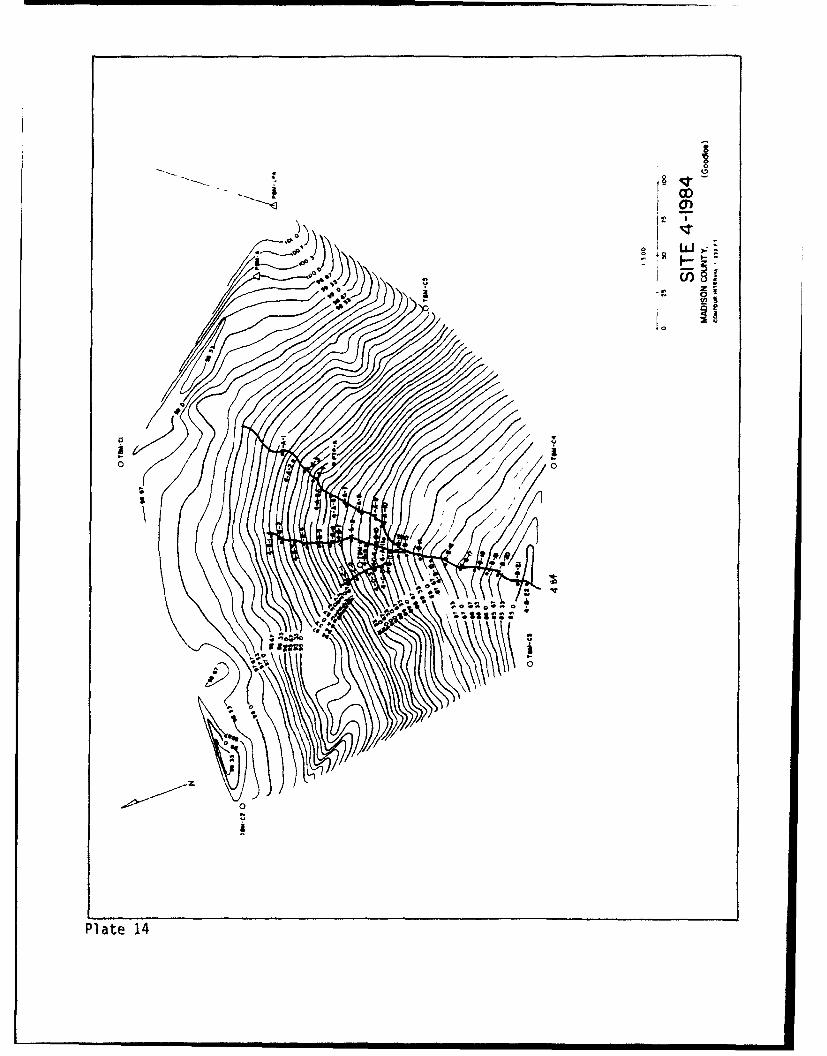
d. Providence soil-James Goodlow Farm; Madison County; northwest1/4, Section 10, T9N, R3E; Sharon 15 min U.S. Geological Surveyquadrangle; (soil survey incomplete for Madison County); land usesoybeans (Figure 5).
Chapter 2 Methodology 3

IcI
10.
400
0 mI
82,
8 E'
4O
Chpe92Mtodlg

39b4
OLc~5
Chaptr 2 ethoolo7

C)V
too
'0 IU
I *'-.
OLD~
I; / a.
~40 ~0
26
Chapter 2 Methodology

42
hLCIP
N~ Cm
0
CVC
00.
-So
U~.
Chepter 2 Methodology7

_T_.
040
IL.
14.Iz
8Chapter 2 Methodoiogy

Establishment of Sites
Upon the selection of the four sites in the three counties, site establishmentproceeded in four steps:
a. The first step was to conduct a survey of the site using electronic dis-tance measuring equipment. During this stage temporary bench markswere established at each site and data points were obtained at sufficientproximity to complete topographic maps of the site of the appropriatescale.
Ir. In the second step topographic maps were drafted for each site at acontour interval of 0.25 ft or 0.33 ft (Plates I through 15).
c. The third step involved the installation of the gully measurement sta-tions. Upon selection of the appropriate gullies to map, that is, thosewhich could be measured using the gulliometer gully measuring device,gully measurement stations were established along each gully. Thegully measurement stations locations were selected to provide the opti-mum measurement of each gully (Figure 6). The gully measurementstations were changed each year because the measurement pins couldnot be left in the field during cultivation and planting with agriculturalequipment. Each measurement cycle required a resurvey of the gullystations as they were changed each year,
d. The fourth step in the establishment of the gites included the installationof weather stations and rain gages to acquire precipitation and othermeteorological data (Figures 7 and 8) and description of the soils (Fig-ure 9). Mr. William A. Cole, SCS, described the soils. Mr. Cole'ssoil descriptions are presented in Appendix B.
Development of the Gulliometer
The measurement of ephemeral gullies on cropland requires the develop-ment of a procedure to accurately reconstruct both the length and cross sec-tional areas of the gullies. Review of developments in gully measurementssuggested that a prototype instrument should be developed to measure gullycross sections. This device should be simple, durable, yet precise in recon-structing cross sections of gullies. A device was designed at WES, referred toas a gulliometer, which accomplished all of the goals of the gully measure-ment device. This gully measurement system consisted of a device which wasset up over each gully measurement station for transferring to graph paper to±1 mm the cross sectional shape to full scale of the gully measurement station(Figures 10, 11, 12). The gulliometer was designed with leveling and regis-tration capabilities to reconstruct the gully cross section at the same positionupon repositioning over the pins at the sites during each measurement period.Drawings of the gulliometer are given in Appendix C. An assumption was
Chapter 2 Methodology 9

Figure 6. Installation of gully measurement stations, technicians using a piston hammerand a stadia rod level to drive the measurement pin into the ground
made that the pins, embedded to a depth of 24 in., did not move during theannual measurement cycle.
Field Measurement of Ephemeral Gullies
Ephemeral gullies were measured during the erosion cycle at all four sites.The first cycling included the spring of 1983 ending on 19 April 1983. Atotal of 14 gullies were measured in all four sites for a maximum of two gullymeasurement periods in the first cycle (Table 1). Cycle 2 extended from2 May 1983 to 3 May 1984. Fourteen gullies were measured at the four sitesover a maximum of six measurement dates (Table 2). Cycle 3 extended from2 June 1984 to 29 April 1985. Ten gullies were measured during cycle 3 atsites 1, 2, and 4 (Table 3). No gully measurements were made at site 3 dur-ing cycle 3 because the site was plowed before the gullies could be measured.Three dates of measurement were included in cycle 3.
Ephemeral gully measurements began after harvest, typically in November,and were measured through the winter and spring period up until just beforeplanting. Gullies were typically measured every 45 days or after a significantprecipitation event. However, due to differences in agricultural practices andprecipitation between the four sites, the number of measurement dates and
10 Chapter 2 Methodology

Figure 7. Installation of meteorological station, site 3
length of measuremient cycles is highly variable between the sites. Using thegulliomneter, the full scale cross sections of each gully station were recordedon a roll of graph paper 36 in. wide by 50 ft. long. After the last reading foreach gully for each cycle the gully length was measured. A total of
Chapter 2 Methodology 1

Figure 8. Installation of rain gage, site 2
1,350 gully cross sections were measured over the three cycles including 281for cycle 1, 716 in cycle 2, and 353 in cycle 3.
At site 3 only, gullies were measured photogrammetrically from aerialphotographs taken on 29 April 1985 and 13 January 1987. The photogram-metric measurement procedure is discussed in Appendix G.
Reduction of Gully Measurement Data
Upon reconstruction of the gully cross sections in the field, the cross sec-tional data were brought to the laboratory and digitized in the Tectronicsmicrocomputer system (Figure 13). Using the digitized cross sections, thearea, the width, the average width, maximum depth, average depth, wettedparameter, and hydraulic radius were calculated for each gully cross section.These data were stored in a computer data file for subsequent reexaminationof the data at a later date. Gully volumes were calculated by integrating gullyareas with gully length. Gully volumes were calculated by multiplying thelength of the gully segment between measurement stations times the averagearea between the two measurement stations. Total gully volume for eachgully is the sum of the volumes for all of the gully segments. Upon calcula-tion of gully volumes, the weight of the soil voided from each gully was thencalculated by multiplying 90 lb/cu ft times the volume in cubic feet of each
12 Chapter 2 Methodology

-~X
Figure 9. Soil description by Mr. William A. Cole, SCS
gully. The amount of soil loss due to ephemeral gullies is reported intons/acre, representing tons of soil voided divided by the drainage area ofeach gully.
Chapter 2 Methodology 13

Figure 10. Gulliometer, site 3
Figure 11. Gulliometer in use, site 3
14 Chapter 2 Methodology

Figure 1 2. Gulliometer in use, site 1
15Chiapter 2 Methodology

Table 1Cycle 1, Gully Measurements
Site-1 Site-2 Site- 3' te-4
Gully Date Gully Date Gully Date Gully Date
A 03/10183 A 03/12/83 A 03/08/83 A 03/21/8304/1 8/'z C4120/83 04/19/83
B 03/10/83 8 03/12/83 B 03/08/83 B 03/21/8304/18/83 04/20/83 04/19/83
C 03/10/83 C 03112183 C 03/08/8304/18/83 04/20/83
P 03/10/83 D 03/09/8304/18/83
E 03/09/83
1 Only one measurement was made at site 3 because the field was plowed on 10 March
1983.
Table 2Cycle 2, Gully Measurements
Site-I Site-2 Slte-3 Site-4
Gully Dat* Gully [Date Gully Dat* "uly Date jA 10/05/83 A 01/20/84 A 02/03[84 A 01105/84
02/02/84 03/23/84 03/21/84 02/03/8403/23/84 04/05/84 03116/8404/05/84 04/06/8404125/84 04/27/8405/03/84 1 05/08/84
B 10/05/83 B 02/02/84 B 02/03/84 B 01/05/8402/02/84 03/23/84 03/21/84 02/03/8403/23/84 04/05/84 03/16/8404/05/84 04/06/8404/25/84 04/27/8405/03/84 05/08/84
C 10/05/83 C 02/03/84 C 01/05/8402/02/84 03/21/84 02/03/8403/23/84 03/16/8404/05/84 04/06/8404/25/84 04/27/8405/03/84 05/08/84
D 10/05/83 D 02/03/8402/02/84 O3(21/8403/23/8404/05/8404/25/8405/03/84
E 02/03/8403/21/84
16 Chapter 2 Methodology

Table 3
Cycle 3. Gully Measurements
Site-1 Site-2 Site-3' Sit-4
Gully Date _Gully Date Gully Date jGully Date
A 02/21/85 A 02/20/85 A 02/22/8503/25/85 03/25/85 03/22/8504/15/85 04/15/85 04/29/85
B 02/21/85 a 02/20/85 B 02/22/8503/25/85 03/25/85 03/22/8504/15/85 04/15/85 04/29/85
C 02/21/85 C 02/20/85 C 02/22/8503/25/85 03/25/85 03/22/8504/15/85 04/15/85 04/29/85
0 02/21/8503/25/8504/15(85
1 No measurements were made at site 3 during cycle 3 because of conflicting agricultural
practices and measurement activities.
Figure 13. Digitizing gully cross sections
Chapter 2 Methodology 17

Acquisition of Meteorological Data
Meteorological data acquisition consisted of measurement of precipitationand several important meteorological parameters. Precipitation was measuredby rain gages at sites 2 and 4. Weather stations were established at sites 1and 3. Since precipitation was aot measured during most of the first erosioncycle (whi-.h began in May or June, 1982) because the sl'Ady had not begun,precipitation values were taken from the nearest official weather station for theperiod prier to precipitation measurement at the site dating back to the begin-ning of cycle-1. At the weather stations the parameters measured includedsoil temperature (degree centigrade) at -5 cm, soil temperature (degree centi-grade) at -10 cm, incoming solar radiation in Langleys, air temperature(degree centigrade), humidity (percent relative), soil moisture (percent) at-5 cm, average wind direction (degrees), average wind speed (miles per hour)and precipitation (millimeters per hour). Due to difficulties in acqkiring datafrom the electronic weather stations, the full meteorological data were onlymeasured for 9 months at sites 1 and 3. Precipitation measurements, how-ever, were taken throughout the entire gully measurement period and aregiven in Tables 4-13. The rainfall erosion index (R) was not calculated foreach site. However, from Figure 1, the R values for each site were estimated(USDA 1978).
Photography of Field Sites
In conjunction with field measurements of gullies, each gully for each sitefor each cycle was also photographed in the field on several dates during eachcycle. During the spring of 1983 and the first field measurement cycle,35 mm color slides were taken for every station, every gully, every site, forevery measurement period. During the subsequent cycles 2 and 3, periodicphotographs were taken of each gully at each site. Aerial oblique photog-raphy was obtained of site 3 in 1983, 1985, 1986, and 1987 (Figure 14).
Photogrammetric Measurement of Site 3
During the initial field measurement of ephemeral gullies, Dr. Smithattended a status meeting of erosion studies conducted by the AgriculturalResearch Service at Oxford, Mississippi, in 1983. At this meeting, Dr. Smithbecame aware of the photogrammetric approach to gully measurement estab-lished by Welch (1983). Dr. Smith subsequently contacted Dr. Welch todiscuss the application of photogrammetric methods to measurement of ephem-eral gullies at the four sites in loessial soils in Mississippi. A contract wasestablished with Dr. Welch in 1985 to conduct photogrammetric measurementsof ephemeral gullies at site 3. In preparation for photogrammetric measure-ments, the size of site 3 was increased to approximately 12-1/2 acres toinclude various slope lengths, degrees, and aspects as well as row directionsacross slopes. Control points were established at site 3 prior to acquisition of
1 8 Chapter 2 Methodology

Table 4Cumulative Precipitation During Cycle 1 at Sites 1 and 2 and Dates of GullyMeasurement
CYCLE 1 SITE 1 & 21 JUNE 1982 -19 APRIL 1983
501
S60_____
I-<5
430 - _ _ _ _ _ __ _ _ _ _ _
JU U~AUG 1 SPjfwwflw OCT NOV' DEC 1ANIEBMa APR
Chopter 2 Methodology 19

Table 5Cumulative Precipitation During Cycle I at Site 3 and Date of GullyMeasurement
CYCLE 1 SITE 3
1 JUNE 1982 - 19 APRIL 1983
100 - -
S_
z R D I -8-83
ý60...
rz-- 50__ _ _ _
S40__ ___ _
30 _ _......
20
0TUN JU OCT NOV I.EC , E ... R
20 Chapter 2 Methodology

Table 6Cumulative Precipitation During Cycle 1 at Site 4 and Dates of GullyMeasurement
CYCLE I SITE 4
1 JUNE 1982 -19 APRIL 1983
100-
,90 _ _-
-I
'0 KEASRED 4f 19-83-
80 - ___ _ _ ______
zL70 ____URED 3-21- 3-
z50
S40__ __ _
20
JUN OCTAU NO1 DEC JAN' FEB iMAR APR
Chapter 2 Methodology 21

Table 7Cumulative Precipitation During Cycle 2 at Sites 1 and 2 and Dates of GullyMeasurement
CYCLE 2 SITE 1 & 21 MAY 1983 - 3 MAY 1984
80 - -i
70 ___ ______ ___ __
,D ASURE 5-3-84
EEAS0 E-4,5-84,
50 ~ ED 1 MDD3-23 -84
5.0
440
HEAýURED 21-2-84
20 ,EASjR'D 10-E-84
110
0
MAY JU JL AUG SEP 0CT NOV DEC JAN FEB MAR APR MAY
22 Chapter 2 Methodology

Table 8Cumulative Precipitation During Cycle 2 at Site 3 and Dates of GullyMeasurement
CYCLE 2 SITE 3
1 MAY 1983 - 3 MAY 1984
60 -
MEAS RED 3-21-84 7
MEAS RED 2- 3-84
120 I__
10- A ___,_
MAYSEP OCT NOV DEC JAN FEB MAR APR MAY
Chapter 2 Methodology 23

Table 9Cumulative Precipitation During Cycle 2 at Site 4 and Dates of GullyMeasurement
CYCLE 2 SITE 4
1 MAY 1983 - 3 MAY 198460... MEASURED -27-84;-•
MEASURED 4-11-84-
50 3-16-84
LA'SU1 D23-B
U 40 _
z -t
( .
20
10 ___ __
i !I I
0MAY SEP OCT NOV DEC AN FEB MAR 1APR MAY
24 Chapter 2 Methodology

Table 10Cumulative Precipitation During Cycle 3 at Sites 1 and 3 and Dates of GullyMeasurement
CYCLE 3 SITE 1 & 21 JUNE 1984 - 29 APRIL 1985
80 a
__A I _ ED 4-15-05 -50 MEA_ ýURED 3 20-85i-\
ci, IRED -21-8'
040 -r.----
z 30____
~20 - _ _ _ _-
10
I0 - -Imp_ _
JUN JUL AUG SEP OCT iNOV 7 'DEC JA FEB MAR APR
Chapter 2 Methodology 25

Table 11Cumulative Precipitation During Cycle 3 Site 3
CYCLE 3 SITE 3
1 JUNE 1984 - 29 APRIL 1985
60-
~40
543
20
JUN JU UG SEP OCT NOV DEC JAN FEB MAR APR
Chapter 2 Methodology

Table 12Cumulative Precipitation During Cycle 3 at Site 4 and Dates of GullyMeasurement
CYCLE 3 SITE 41 JUNE 1984 - 29 APRIL 1985
80
F[
sIoRED 4-29-80
L)0 - --- IE 2-
AURED E-22-8
0 -
JUN JUL AUG 'SEPOC NO DE JA FEBIA AP
Chapter 2 Methodology 27
S• I I I I I | II I I Ir
I 30 _ j

- -- o
4U
oG
28Cape Mtodlg

aerial photography. Photogrammetric quality aerial photography was taken ofsite 3 on 4 May 1985 and 13 January 1987. Photogrammetrically derivedtopographic maps were constructed by Dr. Welch for both periods of aerialphotographs. The volume of the gullies were estimated from the 13 January1987 aerial photographs. Using the difference between the two topographicsurveys, the amount of soil loss during the intervening period was calculated(Table 14) (Appendix G). Detailed topographic maps of site 3 for the twodates of aerial photography are given in Plates 16 and 17.
Chapter 2 Methodology 29

Go
rdI
cvi
SO
0L.
300Chptr2 etoo0 g

Table 14Photogrammetric Measurement of Gullies, Site 3
Gully Length Area Width Mean Depth Volume ChangeSection ft aq ft ft ft cu ft
A 521.0 5.69 10.1 0.58 -2.081
Al 85.0 5.47 6.4 0.82 -3.500
All 55.0 2.18 4.0 0.70 -3.500
A12 53.0 187.00 3.5 0.65 -31.000
A13 48.0 129.00 2.7 0.86 -40.000
A14 80.0 229.00 2.9 0.65 -114.000
A2 165.0 808.00 4.9 0.69 -344.000
A3 322.0 2,078.00 6.5 0.42 -736.000
A4 194.0 1,107.00 5.7 0.53 -330.000
Mean gully width = 6.9 ft.Mean gully depth = 0.66 ft.Total volume change = 4,067 cu ft.Site size = 17.0 acres.
31Chapter 2 Methodology

3 Observations
General Observations
Examination of the development of ephemeral gullies at the four sites overthe three erosion measurement cycles indicated that there were several actualphases in the development of ephemeral gullies during a growing season. Ingeneral terms, these phases included plowing and planting in May, rainfall inJune with the initial erosion of the ephemeral gully before the canopy of thecrop emerges, development of crop canopy in July, and cultivation within thegullies filling them back in during August thru October as the crop matures.Gully erosion was somewhat arrested by the maturation of the crop with theexception of a small amount of soil being voided in the original gully location.After the crop was harvested in November, the gullies reestablished them-selves. During the period of November through April, gully developmentoccurred and maximum extension of the gully occurred by late April, prior toreplowing and planting for the next crop. A good example of this multiplephase development of ephemeral gullies at a site was seen at gully A, atsite 1. A series of photos of seven dates between 15 June 1983 and 26 March1984 shows well the development of ephemeral gullies at site 1. On 15 June1983, the field had just been plowed when a major precipitation eventoccurred, and gully IA was just beginning to form (Figure 15). By 23 June1983, the crop canopy had just begun to come out (Figure 16). Note also thatthe gully had continued to grow. In the intervening period between 23 Juneand 14 July, however, the field was cultivated and the small ephemeral gullyat gully A was filled in by cultivation (Figure 17). On 29 September 1983,the crop had begun to mature (Figure 18). However, the area where theephemeral gully occurred had caused a decrease in soil fertility and poor crop.By 25 November 1983, the crop had been harvested and the gully had beeneradicated by plowing (Figure 19). The last photo of this sequence was taken26 March 1984. The gully had reestablished itself at the same location priorto replanting in April of 1984 (Figure 20).
Examination of the development of the ephemeral gullies at the four sitesover the three erosion cycles indicated that there apparently were critical slopelengths and slope gradients involved in the initial development of theephemeral gullies at each site. These critical slope lengths and gradientsappeared to be a product of not only the slope characteristics including slopeaspect but the row direction of the crop as well. At those sites where the
32 Chapter 3 Observations

le W- , - -
Figure 15, Gully 1 A, 15 June 1983
Chapter 3 Observations 33

Figure 16. Gully 1 A, 23 June 1983
34 Chapter 3 Observations

Figure 17. Gully 1A, 14 July 1983
Figure 18. Gully 1 A, 29 September 1983
Chapter 3 Observations 35

Figure 19. Gully 1A, 25 November 1983
II I,
Figure 20. Gully 1 A, 26 March 1984
36 Chapter 3 Observations

rows ran directly dowaslope, each row became a gully. A good example ofrow-gullies is the western end of site I where the end of the rows had erodedas much as 8 to 10 in. (Figure 21). When the rows ran across the slope,there appeared to be a critical slope angle and slope length where the ephem-eral gullies begin to break over the row tops. These row break-over pointsappeared to occur fairly high on the gully slope, and in no cases greater thanone-third of the way down the slope side (Figure 22). The initiation of theephemeral gullies at each site will be discussed in the paragraphs below onobservations for each site.
Figure 21. Row gullies, site 1, April 1984
Additional site factors also influence the development of the ephemeralgullies. The principal parameter involved in selection of the sites was soiltype. One of the purposes of selecting the ephemeral gully sites on threedifferent types of soils was to investigate the significance of the depth to afragipan actually occurring in the loessial soils on the development of theephemeral gullies. As will be discussed under specific observations undereach site below, the depth of the fragipan had a substantial effect on not onlythe development of the gully, but the resulting shape of the gully as well.Agricultural practices were, as one would expect, very important in the devel-opment of the ephemeral gullies at the sites. The principal agricultural prac-tices of significance were row direction and timing of cultivation or fallplowing. A final site factor of substantial importance in development ofgullies was the timing and total amount precipitation for each site. As will beshown in the paragraphs below, not only the amount of precipitation was
Chapter 3 Observations 37

Figure 22. Row breakover by ephemeral gully, site 3, 8 March 1983
important, but the occurrence of the precipitation events during critical timesin the erosional cycle was significant in determining how much soil loss wouldoccur due to the development of ephemeral gullies at each site.
Observation of the ephemeral gullies developed on the four sites over threeerosion cycles indicated that where the individual gullies reoccurred every
38 Chapter 3 Observations

year in generally the same location, they did not occur in the same exactlocation every year. Their reoccurrence in the same general location was afunction of the development of erosional hollows, large areas of gully devel-opment over many years of agricultural practices at the site. These erosionalhollows are the loci for the development of ephemeral gullies year after year.Measurement of the volume of these erosional hollows would provide anestimate of the total amount of erosion due to ephemeral gullies at that siteduring the full period of agriculture use. Consequently, the significance ofephemeral gully erosion in terms of soil loss at a site may be indicated by themagnitude of the erosional hollows, which may be determined from detailedtopographic maps at each site.
Annual soil loss was determined each site by SCS personnel using theUniversal Soil Loss Equation (USLE). Erosion indices (R values) were alsotaken from Agricultural Handbook 537 (U.S. Department of Agriculture1978). Calculation of EL values from rainfall data for each site were notmade for this study.
Site 1 Observations
Site 1, in Warren County, Mississippi, consists of a shallow highly erodedsoil of the Memphis series. The fragipan is shallow between 10 and 40 cmbeneath the surface. The site sits on a terrace escarpment of the Big BlackRiver. The uppermost part of the site is generally flat as is the lower toe ofthe site. The gullies develop in the erosional escarpment in the terrace (Fig-ures 23-26). During all three gully measurement cycles, soybeans weregrown at the site. Field observations indicate that the gullies begin just belowthe crest of the terrace escarpment and extend erosionally upslope anddownslope during the development of the erosion cycle. As a result, exten-sive gullies erode in the terrace escarpment with depositional fans forming atthe bottom of the slope. Soil loss estimations by the universal soil loss equa-tion give values of 8.2, 13.2, and 13.2 tons/acre/year, respectively for 1983,1984, and 1985. Calculated soil loss from the development of ephemeralgullies was 15.4, 5.9, and 4.3 tons/acre for erosional cycles 1, 2, and 3,respectively. Precipitation during the three erosional cycles were 79.07 in.for cycle 1, 63.48 in. for cycle 2, and 50.99 in. for cycle 3. The estimatederosion index for site I is 320. Consideration of the amount of soil loss dueto sheet rill erosion indicated by the universal soil loss equation and the devel-opment of ephemeral gullies as documented by field measurements withrespect to precipitation during erosional cycles indicates that sheet rill erosiondoes not appear to be related to the total amount of precipitation during thecycle. However, the development of ephemeral gullies is more closely relatedto the amount of precipitation per cycle. Maximum precipitation occurred inthe first cycle which parallels the maximum development of ephemeral gullies.Minimum precipitation occurred during the third cycle as reflected in theminimum amount of ephemeral gully soil loss. The ephemeral gullies reoccurwithin several large hollows on the site. Gully IA reoccurs in a large hollowestablished over many years at site 1.
Chapter 3 Observations 39

Figure 23. Gully A, site 1, 10 March 1983
Figure 24. Gully B, site 1, 10 March 1983
40 Chapter 3 Observations

Figure 25. Gully C, site 1, 10 March 1983
Figure 26. Gully D, site 1, 10 March 1983
41Chapter 3 Observations

Site 2 Observations
Site 2 is a typical Memphis silt loam soil with a fragipan between 30 and50 cm beneath the surface. The site occurs on a long low slope adjacent to aterrace of the Big Black River bottom. Soybeans have been grown at site 2during all three erosional cycles. Field observations indicate that the gulliesbegan approximately one-half of the way down from the top slope and pro-gress downslope as well as upslope during erosional development over thecycle (Figures 27 and 28). The gullies connect at the bottom of the slope andsite to a field drainage ditch. Soil loss calculations by the USLE indicate 4.8,4.0, and 4.0 tons/acre/year for cycles 1, 2, and 3, respectively. Ephemeralgully soil loss was measured at 9.5, 6.7, and 10.8 tons/acre for cycles 1, 2,and 3, respectively. Precipitation estimated or measured at site 2 was79.07 in., 63.48 in., and 50.99 in. for cycles 1, 2, and 3. The estimated Rfactor is 390 for site 2. The relationship between sheet rill erosion aspredicted by the USLE and precipitation is not strong. The relationshipbetween soil loss due to ephemeral gullies and precipitation is also problema-tic. Maximum soil loss measured due to ephemeral gully developmentoccurred during the third cycle which had the minimum precipitation. How-ever, it appears that the development of ephemeral gullies is not directlyrelated to total precipitation at site 2 but rather to the timing of individual pre-cipitation events. Three gullies were measured at site 2 in generally the samelocation. Erosional hollows are generally not well defined at site 2. Duringfield measurement it became apparent that crop residue was very important atsite 2 in clogging the gullies and causing small dams which in turn resulted insedimentation within the gully rather than erosion (Figure 28).
Site 3 Observations
Site 3 is a larger more complex site than the other three sites (Figure 29).The soils at site 3, originally of the Loring series, are highly eroded andmodified. Several old house sites were documented at site 3 during initialestablishment of the site and characterization of the soil. Subsoiling or plow-ing of the fragipan has also been extensive in site 3, as reflected in the geome-try of the gullies. The depth to the fragipan is highly variable. Agriculturalpractices have been highly variable at site 3 as well. In 1983 cotton wasgrown in rows which extended from east to west. Corn was grown in 1984during cycle 2 in rows parallel to the cotton rows of 1983. However, in 1985the field was left fallow.
Site 3 is an upland site consisting of a well developed hill crest, hill side,and dendritic drainage network at the base. The gullies reoccur generally inthe same location, although well developed erosional hollows do not exist forthe smaller gullies. Gully A occurs in a similar position each year, as doesgully B occurring in a large erosional hollow (Figures 30 and 31). Gully Calso occurs in a hollow in the same general position as does gully E (Fig-ures 32 and 33). However, gully D measured in 1984 did not occur in 1983
42 Chapter 3 Observations

Figure 27. Gully A, site 2, 12 March 1983
43Chapter 3 Observations

Figure 28. Gully 8, site 2, 12 March 1983
44 Chapter 3 Observations

Figure 29. Site 3, 8 March 1983
(Figure 34). Field observations indicate that gullies generally began approxi-mately one-third of the way down the slope from the slope top. The gulliesthen extend themselves both upslope and downslope. Fans deposited at thetoe of the gully were observed in the field for each cycle. Soil loss estimatedby USLE was 32 tons/acre/year for 1983 and 45.7 tons/acre/year in 1984, thetwo highest levels of soil loss estimated by the USLE for the four sites. Soilloss due to the development of ephemeral gullies was considerably less, mea-sured at 8.3 tons/acre for cycle 1 and 5.6 tons/acre for cycle 2. Precipitationat site 3 was estimated as 74.84 in. for cycle I in 1982-1983 and measured at57.61 in. for cycle 2 in 1983-1984. The R factor estimated for site 3 is 380.The total amount of soil loss due to the development of sheet and rills (esti-mated by the USLE) does not appear to be related to the total amount of pre-cipitation. However, the development of ephemeral gullies is more closelyrelated to precipitation with maximum soil loss due to ephemeral gulliesoccurring during maximum precipitation. Like site 2, crop residues, spe:ifi-cally cornstalks, are important in clogging and causing sedimentation within agully and decreasing the amount of soil loss due to the development of thegullies. Clogging of gullies with crop residue is particularly important whenthe rows run directly downslope, which occurs on the west end of site 3.Crop residue appears to be very effective in clogging rows which havebecome ephemeral gullies and retaining soil on the field.
Chapter 3 Observations 45

4ý4
Figure 30. Gully A, site 3, 8 March 1983, looking down slope
46 Chapter 3 Observations

Figure 31. Gully B, site 3, 8 March 1983, looking up slope
Chapter 3 Observations

Figure 32. Gully C, site 3, 8 March 1983, looking up slope
-e-
Figure 33. Gully E, site 3, 8 March 1983, looking up slope
48 Chapter 3 Observations

Figure 34. Gully D, site 3, 21 March 1984, looking down slope
Site 4 Observations
Site 4 is a relatively small simple site in an upland position in MadisonCounty (Figures 35 and 36). The surface soil is Providence series with ashallow fragipan varying in depth from 10 to 25 cm. Substantial erosion hasoccurred at the site over the years, as indicated by the general lack of theupper soil horizons. Agricultural practices during the 3 yr of gully erosionmeasurement were all the same and were soybeans drilled with winter ryeestablished. The winter rye grass was periodically grazed by cattle. Thegullies reoccurred every year in a single large hollow. The gullies apparentlybegin approximately one-half of the way downslope and extend both down andupslope. A large fan occurs at the bottom of the major gully at sire 4 (Fig-ure 37). This fan of soil deposition is progressing downslope into a smallfarm pond and rapidly filling the pond with sediment. The headward exten-sion of the gullies at site 3 reflects the headward development of a dendriticdrainage network. Soil loss, as estimated by the USLE, was 23 tons/acre/yearfor each of the three cycles of erosion. Measurement of soil loss due to thedevelopment of ephemeral gullies was 6.7, 5.8, and 3.6 tons/acre for cycles 1through 3, respectively. Precipitation at site 4 was estimated as 82.19 in. in1983, and measured at 59.79 in. in 1984, and 45.69 in. in cycle 3 in 1985.The R factor for site 4 is estimated at 370. Total amount of precipitationappears to be more related to the development of ephemeral gullies rather than
Chapter 3 Observations 4

Figure 35. Site 4, December 1983, looking down slope
Figure 36. Site 4, 21 March 1983, looking up slope
50 Chapter 3 Observations

Fioure 37. Fan at the toe of Gully A, site 4, 16 March 1984
soil loss due to sheet rill erosions. As in sites 2 and 3, the residue of theprevious soybean crop appeared to be important in clogging gullies and caus-ing sedimentation and decreasing the amount of total soil loss from the field.
Chapter 3 Observations 51

4 Results
Development of Ephemeral Gully Data
During the 3 yr of measurement of ephemeral gullies at the four sites, atotal of 38 gullies were measured on 11 different measurement dates. Thisresulted in 281 gully measurements made in cycle 1, 716 gully measurementsmade in cycle 2, and 353 gully measurements made in cycle 3 for a total of1,350 gully measurements made during the entire investigation over 3 yr. Foreach of these gully measurements, seven parameters were calculated includinggully area, average gully width, maximum gully width, average gully depth,maximum gully depth, wetted perimeter, and hydraulic radius. These data arestored in a d-Base-3 file and are presented in Appendix D.
Magnitude of Soil Loss from Ephemeral Gully Data
Measurement of the development of ephemeral gullies at the four sites overthe 3 yr, documents the fact that soil loss from ephemeral gullies is significantin many areas of cropland, certainly in the loessial soils of Mississippi. As amatter of fact, in some sites for some years, soil loss from ephemeral gullieswas greater than soil loss estimated by sheet rill erosion using the USLE. In1983 at site 1, almost twice as much soil was lost off the site from the devel-opment of ephemeral gullies as was loss by sheet rill erosion. However, in1984, as in 1985, the amount of soil loss due to ephemeral gullies was consid-erably less than as was estimated by the USLE.
Comparison of soil loss due to sheet rill erosion and estimated by theUSLE to the amount of soil loss measured by the development of ephemeralgullies suggests that these two types of soil loss are considerably different inoccurrence, both in time and in space. The relative significance of site factorsincluding slope length, slope degree, slope aspect, soil type, precipitation, andagricultural practices in producing soil erosion from sheet rill and ephemeralgullies appears to be highly variable. The variability of soil loss determinedfor each one of these sites for each cycle indicates that a method for predict-ing soil loss due to the development of ephemeral gullies is critical in theestimation of the total amount of soil loss from a site each year due to allprocesses.
52 Chapter 4 Results

Preliminary Analysis of Data
In the previous paragraphs, the development of ephemeral gullies for eachsite was presented. Additionally, an example of the seasonal development ofephemeral gullies was presented for gully A at site 1 for 1983. In examiningthe data for the periodic development of ephemeral gullies during each ero-sional cycle, it becomes apparent that the gullies go through periods of erosionand deposition within one erosional cycle. During cycle 2, from November1983 until May 1984, six measurements were made of the ephemeral gulliesat sites 1 and 4. Examination of the erosional development of the ephemeralgullies during these six dates of measurement shows that the gullies expand tosome level of erosional development and then may experience several periodsof deposition before the end of the erosional cycle in late April. The episodicerosional and depositional development of these ephemeral gullies is illustratedin the statistics on the volume of the gullies for sites 1-4 during cycle 2(Appendix E). Graphs of the volumetric development of the ephemeral gulliesthrough each cycle are given in Appendix F. For instance at site 4, gullydevelopment continued to expand through 6 April 1984 until remeasurementon 27 April 1984 indicated that sedimentation had occurred in gullies A and B(Appendix E, page E-8). Remeasurement of the gullies on 8 May showed thatthe sedimentation that occurred within the ephemeral gullies A and B at site 4had been eroded again and maximum volume of gullies were developed at thattime. In general terms, the gullies increased in size from their initial develop-ment in June to the following May at the end of the erosional cycle. How-ever, as the data show, there were several periods of deposition that mightoccur within the gully during the erosional cycle.
Ephemeral Gully Erosion Equation
Thorne (1984) developed an ephemeral gully erosion equation (EGEE) tobe used in conjunction with the USLE to predict the total amount of soilerosion from arable fields. The EGEE is, like the USLE, an empiricallyderived equation which predicts soil loss as a function of a number of sitevariables. The principal site variable is the "compound topographic index"(CTI) defined as:
C77 a . Planc]
where
a = upslope contributing area
s = local slope gradient
Planc = planform convexity index
Chapter 4 Results 53

The CTI is used as the variable to describe the areas where ephemeral gulliesare likely to form in fields (areas of concentrated runoff). According toThorne (1984):
"The CTI accounts firstly for the contributing area upslope ofthe point in question, which is a good measure of the volumeof runoff. Secondly, it includes the local gradient, s, whichrepresents the intensity of runoff. Thirdly, it includes theplanform concavity of the local contours, which represents thedegree of convergence of the surface runoff. These are thefactors identified as being critical to ephemeral gullying..."
The EGEE is applied by developing a map of CTI values for the field anddelineating those areas of the field that will undergo erosion by ephemeral gul-lies. Soil erosion from the areas of the field outside of the gully-prone areasis estimated by the USLE. The EGEE is stated as:
E = constant [FK,(COT - CMaur)Cpj
where
E = ephemeral gully erosion
K, = soil erodibility for runoff erosion
F, = runoff erosivity
C77cm = function fF,C, = cropping factor for rill erosion
P, = conservation practice for rill erosion
54 Chapter 4 Results

5 Conclusions
"The determination of soil loss due to the erosional development of ephe-meral gullies from crop land requires a number of measurements in order toaccurately estimate the total amount of soil loss. These measurements includeaccurate reconstructions of gully shape, gully volume, and gully length.These measurements should be obtained several times during the erosionalcycle. Data developed in this study show that the gullies not only experienceprogressive erosional development but may also exhibit several periods ofdeposition within the gully cross sections during the erosional cycle. Theseperiods of deposition are probably related to the episodic growth of the gulliesas well as to the contribution of crop residue into the gully and formation ofsmall dams for sedimentation.
In the development of ephemeral gully data in the field, several mea-surement methods exist which give varying degrees of accuracy and value ofdata. This particular investigation involved we development of a device foraccurate measurement of gully cross sectional area and shape. Accurate gullyarea length and gully location measurement were achieved at a high degree ofaccuracy with the gulliometer and surveying equipment. A second method ofmeasurement of gullies is the photogrammetric measurement of gullies usinglow altitude aerial photography. The photogrammetric measurement of gulliesat site 3 cost approximately $25,000. Whereas photogrammetric measurementof gullies provides for the rapid measurement of larger areas, the measure-ment of gullies smaller than approximately 2 ft in width and 1/2 ft in depth ispractically unattainable. A third method, which was not used in this study,would consist of rapid acquisition of ephemeral gully dimensions by measure-ment of length and average width and depth in the field. This rapid estima-tion could be obtained with nothing more than steel tape in the field.However, the degree of accuracy of these measurements is much less than thatof the gulliometer or photogrammetric analyses.
Some consideration of data acquisition should also be given to the nature ofthe site where the gullies are being measured. Research sites require not onlythe measurement of the gullies but the measurement of soil properties andmeteorological conditions. Calibration sites require measurement of gullylength and accurate measurement of gully volume. The normal estimation ofsoil loss due to the development of ephemeral gullies may be typically con-ducted by measuring gully length and estimating average gully depth andwidth in the field with a tape.
Chapters 5 onclusionr 55

In this investigation of the erosional development of ephemeral gullies atfour sites in loessial soils West Central Mississippi, the erosional developmentof 38 gullies was precisely measured over a period of 3 years. Methodsdeveloped in this study to accurately reconstruct the volume as well as thelength of these ephemeral gullies should be applicable to other types of inves-tigations gullies in other areas. Included in this report are all of the measure-ments and calculations of areas, volumes, widths, depths for each of the1,350 measurement stations measured over 3 years.
These data may be used in the development of predictive techniques forephemeral gullies that require gully volume as well as other topographic char-acteristics of the site. Although these data will be valuable to the developmentof predictive techniques for ephemeral gullies, it must be understood that therewas probable soil loss due to the development gullies which was not measuredat each of these sites. This unmeasured soil loss occurred during the growingseason of the crop planted at each site each year. The erosional developmentof ephemeral gullies during the period of initial planting of the crop throughharvesting of the crop was not measured. The amount of soil loss that occursthrough the development of ephemeral gullies during this period is probablysignificant, although probably less than 25 percent of total soil loss due to thedevelopment of ephemeral gullies as measured at the end of the erosionalcycle, typically in April or May. In order to measure total soil loss due thedevelopment of ephemeral gullies, a system would have to be developedwhich measured not only the soil loss indicated by this study but also thedevelopment of ephemeral gullies during the growing season for the crop.
56 Chapter 5 Conclusions

6 Recommendations
Three methods for the measurement of ephemeral gullies in croplands havebeen identified by this study:
a. The use of the gulliometer, as documented by this investigation.
b. The photogrammetric measurement of the gullies also described by thisinvestigation.
c. Rapid measurement of ephemeral gullies may be accomplished throughthe use of a tape to measure gully length and average width and depth.
The three methods of gully measurement should be used in different kinds ofstudies. For the development of calibration sites, detailed gully measurementsare necessary. The use of the gulliometer provides detailed measurement ofephemeral gullies. The gulliometer is available for use upon request for theacquisition of ephemeral gully measurements at any site. Photogrammetricmeasurement of gullies should be completed on those sites which are extensiveand have large gullies developed in them. Photogrammetric measurement ofgullies is not inexpensive, however, this method does provide relatively accu-rate measurement of gullies larger than can be measured with the gulliometer.Rapid estimation of the amount of soil loss due to the development of ephem-eral gullies can be accomplished simply by measuring the major dimensions ofthe gullies in the field with a tape. This rapid method of ephemeral gullyestimation is one that should be used in most rough calculations of soil lossuntil such time that an accurate method of predicting soil loss to ephemeralgullies is developed.
Chapter 6 Recommendations 57

References
Thorne, C. R. (1984). "Prediction of soil loss due to ephemeral gullies inarable fields," Report to the U.S. Department of Agriculture, AgriculturalResearch and Soil Conservation Services, Report No. CER 83-84CRT,Department of Civil Engineering, Colorado State University, Fort Collins,Co.
U.S. Department of Agriculture. (1978). Predicting rainfall erosion losses,Agriculture Handbook No. 537, Science and Education Administration,Washington, DC.
Welch, Roy A. and Jordan, T. R. (1983). "Analytical non-metric close-range photogrammetry for monitoring stream channel erosion," Photo-grammetric Engineering and Remote Sensing, Vol. 49, No. 3,pp. 367-374.
58 References

N 1.7/Plat1: 1

Plate 2
C
K �
I�
/1 -' � � a
N I) ¶I."'�2,) If.yv�if�� ,•1 7I cr�w K -
A (/1/I; Y �
/
/ (; �
) I �
t k�0
t� v-
I0 K I K -
7;'.7 .1 1
''I
I 4). 1�'
0
F
II
Plate 3

-IO
Pl ate 4

S.S,
4.4~~. 6. .,"
0 0 ia&-
gas*--
64
____ ___ ____ ___ ____ 3 So.- ~ 0V-
Plt

I~ am
------ '---"--
0 se-ý
UO .
0 gw,
N --
Plat 6oý

st 16
swc'J
SA z e
Pl at

aC)
4W1
got
got
aa
- ce
paw
Plate 8

% I:
Plae

"~ /*
Plate 10

CO>
m~ g Z'78
w x.
Plate 11

, H
°<I
So
-7
P1 ate71
/, I I I I I I I

400
It r
00
Plte1
Ie~
RUS
PIlate 14

i0
a � IL)
I U)0)
N I
0�>
'� 1� joj Li4�-..
10 �
I*
U C 4
I'- &
0 - / I0
�/1'
Z
1 4r - 4 -
.4 44
� #.
* � 0
C--
0
I
Plate 15

EROSION STUDY SITE #3Bolton, MSNSale 1: 300
C.I.-0 O5 feet
~will wsak rocartsm May 4. HU5.Gdid ticks 125 foot bd'in aw ore d be"
A*A.. GA.
lott ta16 --m ýPOc

-A-5c

EROSION STUDY SITE* 3Boatol, MSNScale 11300
o 50 00"f
C. I folm
rold"Ii ~b 125; Sea ,W'lI V ald a-
P "I %r wet U S Amwy Cogs of 40SExaerimo Sftlwl. Vk d
by "ag ow Agne Gsaqowmordo LbCLofG"
rn-i
l!" In
Anne

-SOW
f-44
Pl ate

Appendix AData Analysis Scope of Work
Appendix A Data Analysis Scope of Work Al

* DEPARTMENT OF THE ARMYWATERWAYS EXPERIMENT STATION CORPS OF ENGINEERS
PO 50X 63'
vICKSOURG MISSISSIPPI 311.
ATEPNTO June 13, 1983
WESGR
Mr. Peter Forsythe, P.E.State Conservation EngineerSoil Conservation ServiceSuite 1321, Federal Building100 West Capitol StreetJackson, Mississippi 39269
Dear Pete:
I am pleased that we will be able to work directly with MikeHarvey at Colorado State University on the analysis of the ephemeralgully data. Mike and I have discussed the ephemeral gully studyat length and I believe we have very similar ideas about thetheoretical found tions, methodology, and objectives of the study.Mike's experience and knowledge will be most beneficial in ourinvestigation of the development of ephemeral gullies.
Enclosed you will find a statement of work for the dataanalysis phase (Enclosure i). Also enclosed are a listing of thecomputer program for gully measurement data reduction (Enclosure 2),an example of the output of the computer program (Enclosure 3).and a copy of the shop drawings for the gully measuring device(Enclosure 4). 1 will make some black and white photographs ofthe gully measuring device and send them to you. I will send acopy of these materials to like Harvey as well.
I spoke with Mike on June 10 and Informed him of our plans.When advised of E. C. Nicholas' visit the week of July 7, he saidhe would try to visit that week as well. Colin Thorne Is tryingto arrange a visit early this summer also to talk about the ephem-eral gully study. I asked Mike to check with Colin to see if hecould accompany him at that time so we could all get together and,talk about ephemeral gullies either here or at Oxford.
I will keep you informed as things progress.
Sincerely,
Lawson 1, SmithSupervisory GeologistRegional Studies UnitEGRMD
Enclosures
A2 Appendix A Data Analysis Scope of Work

Statement of Work
Ephemeral Gully Data Analysis
Background
The Engineering Geology Applications Group (EGAG), Geotechnical Labora-
tory, is conducting a study of soil loss due to the development of ephemeral
gullies for the Mississippi office of the Soil Conservation Service, USDA.
The study will involve five phases: (1) development of a research plan;
(2) establishment of data gathering sites; (3) acquisition of data; (4) date
analysis; and (5) report preparation. EGAG will perform phases I throngh 3
and part of phase 5. Phase 4 and part of phase 5 will be performed by the
contractor. This document outlines the objectives, final product, and scope
of investigations and type of data of the ephemeral gully study.
Objectives
The present accepted method of calculating soil loss from agricultural
fields, the Universal Soil Loss Equation (USLE), predicts annual soil loss due
solely to rill and interrill erosion, and not soil loss due to gully erosion.
Consequently, a substantial proportion of total soil loss from agricultural
fields may be undetermined. The goal of the investigation is to determine a
method to predict the amount of annual soil loss that is due to the development
of ephemeral gullies. (Ephemeral gullies are defined as small drainageways
which develop seasonally between cultivation practices, which, if not filled
in, would become permanent features of the drainage network. Ephemeral gullies
may reach a width of 2-3 ft and a depth of 1-1.5 ft.) The specific objectives
of the work to be performed by the contractor are:
a. Identify the factors which affect the rate and extent of ephemeral
gully development.
b. Evaluate the relationship of these factors (identified in the initial
objective) to the factors used in the USLE.
c. Develop a predictive (numerical) method for determining the amount of
annual soil loss due to the development of epnemeral gullies for the sites
studied. It is highly desirable that the method be the application of a
A3Appendix A Data Analysis Scope of Work

modification factor to the USLE. However, if a similar, easily understood
procedure can be developed and used in conjunction with the USLE, this will be
acceptable.
d. Evaluate the suitability of the method developed in objective c for
extrapolation to areas of similar topography, climate, soils, and agricultural
practices.
e. Prepare a report documenting objectives a through d.
Investigations
The investigation will be conducted at four field sites located in Warren
(sites 1 and 2), Hinds (site 3), and Madison (site 4) counties of west-central
Mississippi. The sites were selected on 'Memphis, Loring, and Providence soils
developed on loess of various thicknesses. At each site, SCS personnel will
compute the estimated annual soil loss using the USLE. This soil loss compu-
tation will provide an estimate for annual rill and interritl erosion to be
compared with soil loss from ephemeral gullies. In this manner, the amount of
underestimation of soil loss by the USLE can be determined, providing an
empirically derived factor for correcting USLE values in other areas not
included in the study.
Four broad areas of investigation will be conducted at each site. The
four areas can be described as follows:
a. Energy available for erosion.
b. Resistance of soil materials.
c. Drainage network development.
d. Volume of sediment production.
There are two components of the total energy in the system. They are the
kinetic energy in the form of rainfall (duration, intensity, and frequency)
and the potential energy in the form of the inherent morphology of the site
(drainage area, slope length, slope angle, slope shape (planar, convex,
concave)). A recording raingage has been installed at each site and detailed
topographic maps have been prepared to determine the topographic variables.
The physical characteristics of the soil materials at each site will he
measured and quantified. This will include the determination of grain-size
distributions, bulk densities, permeability, structure and percentage organic
matter. Soil moisture will be monitored at weather stations on trjo sites.
A4 Appendix A Data Analysis Scope of Work

Current agricultural practices and the cultivation history of each site
will be determined. Farmers will be questioned to ascertain, if possible,
when each ephemeral gully was initiated, thereby providing a time base upon
which to determine the rate of gully development.
The extent of drainage-network development will be determined by accu-
rately surveying the channel network before and after the site is subjected to
cultivation. Cross sections of the various channel reaches will he surveyed
using a device which records the shape of the gully cross section. Longitu-
dinal profiles of the various channels making up the drainage network will
also be constructed from survey data. Resurveying of the sites will be con-
ducted at intervals during the seasonal erosional cycles.
Morphometric analysis of the drainage-network data will be conducted to
relate the network characteristics to drainage area and watershed character-
Istics (Strahler, 1956; Shreve, 1966, 1967). Clock's (1931) qualitative model
of drainage-network development will also be used to determine the degree of
maturity of the ephemeral-gully system. This determination will be required
to assess whether total sediment yield should include a component derived from
extension of the drainage network. If a time base can be established then it
should he possible to predict the r:ate of drainage-network extension and to
relate this to sediment production.
Tle volume of sediment produced annually by the ephemeral-gully system
has three potential contributing sources. T;e first of these is the annual
volume of material used to fill in the gullies prior to or during cultivation
which is subsequently eroded by exhumation of the ephemeral gully system. If
headward extension of the network is continuing, then the volume of sediment
eroded will have to be included. The third component L:3 the amount of sedi-
ment derived from interrill and rill erosion which is delivered to the
ephemeral-gully channel system.
Determination of the volumes of sediment produced by each of the comp--
nents can only be approximate in a study of this nature. The volume of mate-
rial produced by exhumation and drainage-network extension can be determined
from changes in cross section area of the channels throughout the course of
the annual cycle. Soil loss due to rill and interrill erosion will be esti-
mated by the USLE.
3
A5Appendix A Data Analysis Scope of Work

Specific Data
Several types of data are being obtained at the four "ield sites. They
are:
a. Detailed topographic maps of the sites at the scale of 1:300. On
each map are topographic contours (0.25-ft interval), location of temporary
bench marks and gully measuring stations, location of the weather station, and
the location of the soil pit (used in defining the typical soil horizons).
The topographic map was constructed from electronic distance measurements and
the gully measurement stations located by planetable methods.
b. Cross-sectional area for each gully measurement station at various
dates. Prior to cultivation in May 1983, a total of 146 stations were measured
on two occasions (weeks of March 15 and April 20). At site I (Memphis soil),
45 stations on four gullies were measured. At site 2 (also Memphis soil), 36
stations were measured on three gullies. Thirty-six stations were monitored
on five gullies at site 3 (Loring soil). Twenty-nine stations on two gullies
were measured at site 4 (Providence soil). Gully measurement stations will be
reestablished upon harvesting of crops in the fall and measurements will be
made at the frequency of about once per month. Gully measurement data consist
of a full-scale reconstruction of gully cross section on graph paper, which is
digitized and stored on tape for analysis on the Tektronics 4051 minicomputer.
A program written for the 4051 determines the area, top width, mean width,
wetted perimeter (at bankfull), mean depth, maximum depth, and hydraulic
radius of each gully cross section, and plots the cross section at the scale
of 1:5.
c. Meteorological data. At sites I and 3, complete meteorological
stations have been installed which measure soil temperature (*C) at -5 cm and
-10 cm, solar radiation (watts/m'), air temperature (*C), relative humidity
(percent), soil moisture (percent) at -10 cm, wind direction (degrees from
north), wind speed (m/sec), and precipitation (mm/min). All parameters are
measured hourly except precipitation, which is read every minute. Readings
are stored as binary code on cassette tapes which are changed every month. At
sites 2 and 4 only precipitation is recorded. Precipitation is measured by a
tipping bucket rain gauge connected to a rotating drum chart recorder.
Precipitation records are changed weekly at sites 2 and 4.
4
A6 Appendix A Data Analysis Scope of Work

d. Site photography. Each site is photographed periodically using a
35 mm camera. Complete photographic coverage of each gully is acquired coin-
cident with gully measurement to facilitate estimation of gully volume between
measurement stations. At the present, an attempt is being made to establish a
capability for acquiring vertical (aerial) stereoscopic photographic coverage
on a 70 vmm format. This high-quality photography will greatly enhance gully
definition and measurement.
e. Soil properties. At each site, the typical soil horizons have been
defined. Specific properties of the soil horizons for each site will be
determined in the field and the laboratory, including soil texture, hulk
density, permeability, structure, and percentage of organic matter. Soil
density and moisture is being determined gravimetrically at sites 1 and 3 on a
weekly basis for correlation with meteorological parameters.
5
A7Appendix A Data Analysis Scope of Work

June 13, 1983
TESCR
Mr. Peter Forsythe. P.E.State Conservation EngineerSoil Conservation ServiceSuite 1321, Federal Building100 West Capitol StreetJackson, Mississippi 39269
Dear Pete:
I am pleased that %- will be able to work directly with AikeHarvey at Colorado State University on the analysis of the ephermeralgully data. Mike and I have discussed the ephemeral gully studyat length and I believe we have very similar ideas about thetheoretical foundations, methodology, and objectives of the study.Mike's experience and knowledge will be most beneficial in ourinvestigation of the development of ephemeral gullies.
Enclosed you will find a statement of work for the dataanalysis phase (Enclosure I). Also enclosed are a listing of thecomputer program for gully measurement data reduction (Enclosure 2).an example of the output of the computer program (Enclosure 3).and a copy of the shop drawings for the gully measuring device(Enclosure 4). I will wake some black and white photographs ofthe gully measuring device and send them to you. I will send 3copy of these materials to Mike Harvey as well.
I spoke with Mike on June 10 and informed him of our plans.When advised of E. C. Nicholas' visit the week of July 7, he saidhe would try to visit that week as well. Colin Thorne is tryingto arrange a visit early this summer also to talk about the ephem-eral gully study. I asked ýtke to check with Colin to see if hecould accompany him at that time so we could all get together andtalk about ephemeral gullies either here or at Oxford.
I will keep you informed as things progress.
Sincerely,
Lawzson ". SmithSupervisory GeologistRegional Studies UnitEC-24D
"Enclosures
A8 Appendix A Data Analysis Scope of Work

Appendix BSoil Descriptions
Appendix 8 Soil Descriptions BI

Memphis Silt Loam - Site 1
Fine silty mixed thermic Typic Hapludalfs
Location: Warren County Owner: Herbert Downing Crop: Crop: Soybeans 1982.
Winter cover ; grass and wild winter peas.
Ap - 0 to 4 inches; dark yellowish brown (10YR5/4) silt loam; weak medium and
fine granular structure; friable; many fine roots; strongly acid; abrupt smooth
boundary.
Btl - 4 to 16 inches; dark brown (7.5YR4/4) silty clay loam; moderate fine and
medium subangular blocky structure; friable; many fine roots; continuous clay
films on ped; few gray silt coatings between peds; very strongly acid; clear
smooth boundary.
Bt2 - 16 to 33 inches; dark brown (7.5Y TR/4) silt loam; weak medium subangular
blocky structure; friable few fine roots; patchy clay film on peds; few d.ark
coating on faces of peds few gray silt coatings between peds; strongly acid;
gradual smooth boundary.
C - 33 to 72 inches; yellowish brown (IOYR5/4) silt loam; massive; few fine
roots; few gray silt coatings along crevices; neutral to moderately alkaline.
Remarks: This soil is rather shallow over unweathered silt, but within range
of the Memphis series.
B2 Appendix B Soil Descriptions

[Memphis Silt Loam - Site 2
Fine silty mixed thermic Typic Hapludalfs
Location: Warren County Owner: Herbert Downing Crop: Soybeans 1982. Winter
cover grass and wild winter peas.
Ap - 0 to 4 inches; dark yellowish brown (1OYR4/4) silt loam; weak medium and
fine granular structure; friable; many fine roots; strongly acid; abrupt smooth
boundary.
Btl - 4 to 17 inches; dark brown (7.5YR 4 /4) silty clay loam; moderate fine and
medium subangular blocky structure; friable; many fine roots; continuous clay
films on peds; very strongly acid; gradual wvy boundary.
Bt2 - 17 to 37 inches; dark brown (7.5YR4/4) silty clay loam; moderate fine and
medium subangular blocky structure; friable; many fine rcoots; continuous clay
films on peds. Very strongly acid, graduai wavy boundarj.
Bt3 - 37 to 64 inc ; dark brown (7.5YR4/4) silt loam; weak medium su1-ngular
blocky structure; friable; few patchy clay films on some peds; fe-. silt coating
on faces of some peds; strongly acid; gradual smooth boundary.
C - 64 to 72 inches; dark brown (7.5YRA/) silt loam; massive; friable gray
silt coatings in cracks or crevices; medium acid.
Remarks: Typical Memphis Soil
B3Appendix B Soil Descriptions

4/83
Loring Silt Loam: !;fe. 3
Fine-silty mixed thermic Typic Fragiudalf
Location: Hinds County Owner: Bobby Mellon Crop: Cotton 1982
Ap - 0 to 5 inches; Dark yellowish brown (lOYR4/4) silt loam; weak fine and
medium gramular structure; many fine fine roots; medium acid; clear abrupt
boundary.
Bt - 5 to 14 inches; brown (7.5TRA/4) silt loam; moderate fine and medium
subangular blocky structure; few fine roots; patchy clay film on faces of
peds; clay film in pores and root channels; common dark coatings on faces
of peds, few gray coatings between peds; very strongly acid; gradual irregular
boundary.
Bxl - 14 to 42 inches; mottled yellowish brown (1YR5/6) grayish brown (10YR5/2)
and brown (7.5YR4/A) silt loam; coarse weak prismatic parting to moderate medium
subangular blocky structure; firm compact and brittle many fine voids thin patchy
clay films on faces of peds and lining pores; common dark coatings on faces of
peds; common gray coating between peds; very strongly acid gradual wavy boundary.
Bx2 - 42 to 54 inches; mottled brownish yellow (IOYR6/6) grayish brown (lOYR5/2)
and yellowish brown (lIYR5/4) silt loam; weak coarse prismatic parting to fine
and medium subangular blocky structure; firm compact brittle; few fine roots
between prisms; many fine voids; patchy clay films on faces of peds; covmnon
B4 Appendix B Soil Descriptions
ii I I I I I I I I I

dark coatings on faces of peds; common gray coatings between peds; gradual
wavy boundary; very strongly acid.
B3 - 54 to 60 inches mottled yellowish brown (lOYR5/4) brownish yellow
(10YR6/6) and grayish brown (10YR5/2) silt loam, weak medium subangular
blocky structure; friable; strongly acid; clear smooth boundary.
C - 60-72 inches; yellowish brown (lIYR6/6) silt loam many medium distinct
grayish brown mottles (lOYR5/2) massive; friable; medium acid.
Remarks: There is evidence of severe sheet erosion with chiseling or subsoiling
plowing in the upper portion of the fragipan. Depth to the fragipan for a
nonseverly eroded Loring ranges from 20 to 35 inches.
B5Appendix B Soil Descriptions

4/83
Providence Silt Loam: Si4-_ 4
Fine silty mixed thermic Typic Fragiudalf
Location: Madison County Owner: James Goodloe, Sr. Crop; Soybeans 1982
Ap - 0 to 6 inches; brown (lOrR=/3) silt loam; weak fine and medium granular
structure; very friable; many fine roots; neutral; clear abrupt boundary.
Btl - 6 to 9 inches; dark yellowish brown (1OYR4/4) silt loam; weak fine fine
subangular blocky structure friable; common fine roots; common fine and medium
pores; few patchy clay film on ped faces; strongly acid; clear smooth boundary.
Bt2 - 9 to 14 inches; brown (7.,YR4/4) silt loam; moderate fine and medium
subangular blocky structure; few fine roots; patchy clay film on faces of
peds; clay film in pores and root channels; s9rongly acid; clear smooth boundary.
Bt3 - 14 to 19 inches; yellowish brown (IOYR5/ ) silt loam; moderate fine and
medium subangular blocky structure; firm; few fine roots patchy clay films on
faces of peds; clay film in pores and root channels; very strongly acid; clear
irregular boundary.
Bxl - 19 to 33 inches; yellowish brown (10MYR/4) silt loam; many medium distinct
light brownish gray (10YR6/2) and common medium faint strong brown (7.5•Y5/6)
mottles; weak coarse prismatic parting to fine and medium subangular blocky
structure; firm compact and brittle; few fine roots between prisms; many
fine voids; patchy clay films on faces of peds; common fine black and brown
concretions; very strongly acid; gradual wavy boundary.
B6 Appendix B Soil Descriptions

2Bxl - 33 to 43 inches; mottled yellowish brown (10YR5/A) light brownish
gray (lOYR6/5), strong brown (7.5YM5/6) silt loam containing noticeable sand;
moderate coarse prismatic parting to moderate fine and medium subangular and
angular blocky structure; firm; compact and brittle. Many fine pores; light
brownish gray silt between prisms; patchy clay films on faces of peds and
lining pores. Very strongly acid, Clear wavy boundary. (Perch wter in
this horizon).
2Bx2 - 43 to 62 inches; mottled yellowish brown (lOYR5/4) light brownish gray
(lOYR6/2) yellowish red (5YR4/6) clay loam weak coarse prismatic parting to
moderate medium sutan.-ular blncky s+"%ct•ire: fim mrioat and brittle; many
fine voids; thin patchy clay films on faces of peds; few block concretions;
very strongly acid.
Appendix B Soil Descriptions B7

Appendix CGulliometer Drawings
Appendix C Gulliometer Drawings Cl

zzWL
a<:
Li z
Iu
0 I/)IW
Li m0. L
C-
a:L
Q
2ý
3:
-jLi
L"i
-Jz
0 0
0
C2 Appendix C Gulliometer Drawings

suBJECT: .COMPUTEO
BY. TATE FILE NO0.
(9u-ýI ýTZCHECKEO ey:OATE:IT14E0 4OT
+A
26'________
.ES FOR NO 1253
REV OCT196
Appendix C Gulliometer Drawings C

RA/./ IýFV-.Xe U•iA•,,,,,, re CHECKED BY: L.16 DATE: ISHEET No0
IfI
If
r Ho
WES FORM NO.
REV OCT gee1
C4Appendix C Gulliometer Drawings

SUBJECT: COMPUTED BY: FATE: FILE NO.
AM 1/7 rrmme Cc'vei- UI -A t CHECKED By 5 DATE; ISHEET NO.I
I 40 ro z0
i~~IOi
-40.
\ ?,
2,
'ES FORM NO. 1253
ZEV OCT 1g69 2
Appendix C Gulhlometer Drawings C5

IS
I 3
I DtuLL 4
T _ 2-zw
.$
1.,, y*-20
2
WES FORM NO. 1253REV OCT 1968
C6Appendix C Gulliometer Drawings

SUBJECT: COMPUTEOD Y; irA OA T: FILE NO.
BaLL Bushing Kock 1<b-CHECKED eBY: L 6 ioTE, SHEET N.o
rTh
*E FOR t4
-EI_ O 1
Appendix C-J-
),-:.Ie'I-
WEs FORM N, 1253
Appendix C Gulliometer Drawing• C7

SUBJECT, COMPUTED BY: IZPA DATE: FILE NO.
ICHECKED BY: OATEý SNEE- NO.
i 3i
07 v J,
2
P
__ett
Roi L
--- ... ..
ii
-\4
WES Fo.m No. 12
.EV OCT 196 1
C8 Appendix C Gulliometer Drawings

suajEcTc rý dmut9B~~~ COM4PUTEDBY: Z;=A DATE. RIlE NO.
BvALL BUs-SIlnq Block CHECKED By! .- ý DATE SMEE TNO
2 PLaCeg.
Diwn shw 4% NCT4" bvA4ef only
2.
-T-TAP 1,-.2
1/19WES____________________________
__________________1253___REV _ _ _ _ __ _ _ _ _ _ __ _ _ _ _ _ OCT~ I6I
Appendix- C -uloee rwnsC

i~~43 Io/ I
J C H EC K E D B Y, : D ,4A T E : S H E E N O.
- i
1/4 1
4,I
d
~'~T~/-~2i7- -f-
2
Pen /4o1Jen-
WES -ORM No. 1253REV OCT 19*6
dloAppendix C Gulhiometer Drawings

SUBJECT: COMPUTED BY: V=A OATEý FILE NO,
CHECKED BY: LMS DATE: SHEET NO.
j
42
T 6 3?, :
/ 10-32
i~i:-- t--I---
44 4
r I
"\rAp I.... &. ...
ALtvm "nurn•
lUnde k-cu7 Z-xten de i- Po -t-s
WES FORM No. 1253REV OCT f#68
Appendix C Gulliometer Drawings C1

SUBJECTr: COMPUTEDo BY: rZ;--A DA•TE: I•LE No.
CHECK•ED BY: DATt• ,E: SH-EET P4,o
12
A
4
-4
a3,
U
7 -of i w ý7 4 A~ v x . 7_aR e -Fe ve n ce P mn D •,tv e y
wE S FtO RM No. 1 5
IEV OCT 1946125
C12Appendix C Gulliorneter Drawings
S " i II I I

sueec~COPUAB DATE: ~ IL- NO.SUBJECT; ~ T COFUE0BY
CHECKED BY; LMl$ DATEý SHEET NO.
-14-
121
'31
WES bFORM NO,~ A
IE OC 16 15
ApenixC uloetr rains 1

-,
\Z
I . , ,
-jji "
C14 Appendix C Gulliometer Drawings

- L - -,
4-NO
1~
!~L%1
"-CL.
C15Appendix C Gulliometer Drawings
.I I I I I I I I I I I I l l 1

Appendix DEphemeral Gully Data
Appendix D Ephemeral Gully Data D1

EPHEMERAL GULLIESSITE-1, GULLY-A, CYCLE-i
TOP MEAN WETTED MEAN MAX HYDRAULIC CUMMULATIVE CUM4ULATIVE
GULLY AREA WIDTH WIDTH PERIMETER DEPTH DEPTH RADIUS LENGTH VOIUME
STATION DATE (Sq. In.) (in.) (In.) (In.) (In.) (In.) (In.) (Ft.) (Cubic Ft.)----------. ........ ......... ...... ...... .......... ......--- ...... ..........- ........... ...........
1-A-01 03110183 81.49 24.59 25.22 28.34 3.23 6.43 2.88 0,00 0.00I-A-02 03/10/83 107.44 23.35 24.30 29.07 4.42 6.64 3.70 5.10 3.351-A-03 03/10/83 80.40 29.52 29.45 25.78 2.73 4.66 3.12 15.80 10.321-A-04 03/10/83 261.65 29.16 32.10 47.70 8.15 12.57 5.49 42.70 42.271-A-05 03/10/83 263.05 33.95 37.52 47.90 7.01 10.46 5.49 53.40 61.7o1-A-06 03/10/83 175.26 32.71 34.09 39.20 5.14 7.77 4.47 60.90 73.181-A-0? 03110/83 132.46 32.28 32.30 34.50 4.09 9.25 3.84 81.30 94.971-A-08 03/10/83 151.74 33.13 33.87 38.28 4.48 6.83 3.96 89.90 103.46I-A-09 03/10/83 82.44 33.76 34.63 28.23 2.38 5.25 2.92 100,60 112.171-A-10 03/10/83 378.11 30.11 33.31 55.05 11.35 15.69 6.87 124.00 149.591-A-11 03/10/83 272.08 33.16 34.74 47.61 7.83 12.84 5.71 133.00 169.911-A-12 03/10/83 272.87 33.74 35.20 51.87 7.75 14.85 5.26 146.10 194.701-A-13 03/10/83 204.95 32.44 35.15 47.90 5.83 10.80 4.28 154.30 208.301-A-END 03/10/83 204.95 173.10 235.05
1-A-01 04/18/83 82.63 24.84 24.59 29.08 3.36 6.17 2.84 0.Zo 0.001-A-02 04/18/83 110.40 25.73 26.22 28.88 4.21 6.60 3.82 5.10 3.421-A-03 04/18/83 76.32 26.11 26.59 24.30 2.87 4.47 3.14 15.80 10.361-A-04 04/18/83 265.10 31.04 33.26 44.02 7.97 12.17 6.02 42.70 42.251-A-05 04/18/83 227.05 33.07 35.53 42.48 6.39 9.26 5.34 53.40 60.531-A-06 04/18/83 172.53 33.63 35.21 38.51 4.90 7.40 4.48 60.90 70.94I-A-07 04/18/t8 130.io 33.94 32.20 33.31 4.06 9.00 3.93 81.32 92.421-A-08 04/18/83 177.02 35.42 35.83 40.74 4.94 7.57 4.35 89.91 101.611-A-09 04/18/83 95.53 33.88 34.24 26.61 2.79 5.60 3.59 100.60 111.731-A-10 04/18/83 400.43 31.95 36.83 57.44 10.87 17.07 6.97 124.ý0 152.031-A-11 04/18/83 256.84 34.47 34.89 46.62 7.36 11.47 5.51 133.00 172.571-A-12 04/18/83 311.10 35.18 34.86 56.13 8.92 16.15 5.54 146.10 198.401-A-13 04/18/83 197.89 30.51 32.28 43.60 6.13 10.54 4.54 154.30 212.891-A-END 04/18/83 197.89 173.10 238.72
D2 Appendix 0 Ephemeral Gully Data

EPHEMERAL GULLIESSITE-I, GULLY-S, CYCLE-1
TOP NEAN WEETrED MEAN MAX HYDRAULIC CUIM4uLATIVE CU1)ULATIVEGULLY AREA WODTH WIDTH PERIMETER DEPTH DEPTH RADIUS LENGTH VOLUMESTATION DATE (Sq. In.) (In.) (in.) (In.) (In.) (in.) (In.) (Ft.) (Cubic Ft.)----..--.-- ........ . .... ..... . . - - - - - - - - - - - - - . . . . - - - - - - . . . . .1-9-01 03/10/83 91.13 29.83 31.31 31.28 2.91 5.79 2.91 0.00 0.001-8-02 03/10/83 43.48 18.89 20350 22.05 2.12 3.97 1.97 8.80 4.111-5-03 03/10/83 106.83 31.95 34.02 34.90 3.14 5.81 3.06 19.10 9.491-8-04 03/10/83 166.03 24.2? 24.85 36.17 6.68 12.23 4.59 30.10 19.911-8-05 03110/83 313.42 33.45 34.70 56.31 9.03 16.79 5.57 41.10 38.231-8-06 03/10/83 272.92 33.13 35.35 45.43 7.72 12.18 6.01 49.90 56.141-8-07 03/10/83 238.38 30.35 31.99 51.20 7.45 14.58 4.66 57.00 68.751-8-08 03/10/83 251.91 33.40 35.13 47.86 7.17 12.81 5.26 62.10 77.431-8-09 03/10183 114.62 24.93 26.96 31.32 4.25 7.31 3.66 69.70 87.101-B-END 03/10/83 114.62 93.20 105.80
1-B-01 04/18/83 80.14 29.01 30.47 29.35 2.63 4.64 2.73 0.00 0.001-8-02 04/18/83 49.56 23.95 24.41 27.43 2.03 3.96 1.81 8.80 3.961-5-03 04/18/83 94.41 28.53 30.55 28.24 3.09 5.24 3.34 19.10 9.111-8-04 04/18/83 176.62 28.09 28.07 36.89 6.29 12.31 4.79 30.10 19.471-B-05 04/18/83 321.45 32.93 36.48 58.10 8.81 16.04 5.53 41,10 38.501-B-06 04118/83 276.24 32.90 35.96 46.31 7.68 11.60 5.97 49.90 56.761-8-07 04/18/83 262.08 28.13 31.9i 52.0? 8.21 14.68 5.03 57.00 70.031-8-08 04/18/83 257.89 35.03 37.00 49.85 6.97 11.89 5.17 62.10 79.231-8-09 04/18/83 106.70 28.52 28.37 31.77 3.76 6.54 3.36 69.70 88.851-B-END 04/18/83 106.70
93.20 106.27
Appendix D Ephemeral Gully Data D3

EPHEMERAL GULLIESSITE-I, GULLY-C, CYCLE-1
TOP MEAN WETTED MEAN MAX HYDRAULIC CUI4MULATIVE CUM, JLATIVEGULLY AREA WIDTH WIDTH PERIMETER DEPTH DEPTH RADIUS LENGTH VOLUMESTATION DATE (sq. In.) (In.) (in.) (In.) (In.) (In.) (In.) (Ft.) (Cubic ft.)S.......... ........ ......... ...... ...... .......... ...... ......--- .......... ........... ...........-
I-C-01 03/10/83 64.07 20.79 18.15 27.61 3.53 7.45 2.32 0.00 0.001-C-02 03/10/83 96.38 23.74 23.85 31.09 4.04 8.18 3.10 8.10 4.511-C-03 03/10/83 153.75 27.40 27.80 39.24 5.53 9.98 3.92 14.10 9.721-C-04 03/10/83 160.23 28.17 29.78 43.55 5.38 9.06 3.68 24.70 21.281-C-05 03/10/83 170.27 33.09 34.46 47.42 4.94 10.69 3.59 33.50 31.381-C-06 03/10/83 147.98 24.55 26.85 35.52 5.51 9.22 4.17 44.90 43.98t-C-07 03/10/83 122.50 33.76 35.40 38.78 3.46 6.79 3.16 58.50 56.75
1-C-08 03/10/83 184.38 27.54 29.03 41.93 6.35 10.43 4.40 67.10 65.921-C-09 03/10/83 228.13 33.11 36.61 42.18 6.23 9.88 5.41 77.40 80.671-C-10 03/10/83 204.86 33.61 33.86 49.50 6.05 10.88 4.14 85.60 93.001-C-11 03/10/83 201.14 33.71 33.91 41.81 5.93 11.53 4.81 96.00 107.661-C-12 03/10/83 187.73 30.15 29.79 40.67 6.30 10.99 4.62 105.10 119.951-C-13 03/10/83 102.37 28.57 28.51 29.26 3.59 5.67 3.50 111.40 126.301-C-END 03/10/83 102.37 123.50 134.90
1-C-01 04/18/83 63.57 21.80 21.04 27.37 3.02 6.96 2.32 0.00 0.001-C-02 04/18/53 100.52 23.65 24.81 30.28 4.05 7.93 3.32 8.10 4.611-C-03 04/18/83 165.55 27.30 28.59 42.08 5.79 9.70 3.93 14.10 10.161-c-04 04/18/83 156.32 27.90 30.91 39.98 5.38 8.96 4.16 24.70 22.371-C-05 04/18/83 173.62 34.03 34.79 49.25 4.99 10.53 3.53 33.50 32.761-C-06 04/18/83 143.84 25.17 27.13 36.28 5.30 8.79 3.96 44.90 45.331-c-07 04/18/83 158.94 35.07 36.04 42.28 4.41 7.76 3.76 58.50 59.631-C-08 04/18/83 225.69 35.11 35.93 52.52 6.28 11.50 4.30 67.10 71.121-C-09 04/18/83 220.36 34.06 36.72 42.68 6.00 9.66 5.16 77.40 87.071-C-10 04/18/83 208.16 34.03 34.63 50.16 6.01 11.10 4.15 85.60 99.27
1-C-lI 04/18/83 232.90 33.80 35.55 51.63 6.55 11.97 4.51 96.00 115.191-C-12 04/18183 192.67 31.51 31.95 42.19 6.03 10.78 4.57 105.10 128.641-C-13 04/18/83 105.20 30.10 30.94 28.70 3.40 5.59 3.67 111.40 135.161-C-END 04/18/83 105.20 123.50 144.00
D4 Appendix D Ephemeral Gully Data

EPHEMERAL GULLIES
SITE-1, GULLY-D, CYCLE-1
TOP MEAN ,ETTED MEAN MAX HYDRAULIC CUM4ULATIVE CUWMULATIVEGULLY AREA WIDTH WI5VA PERIMETER DEPTH DEPTH RADIUS LENGTH VOLUMESTATION DATE (Sq. In.) (In.) (in.) (In.) (In.) (in.) (In.) (Ft.) (Cubic Ft.)
1-0-01 03/10/83 125.58 24.93 25.16 34.89 4.99 9.48 3.60 0.00 0.00
1-D-02 03/10/83 165.57 30.99 30.94 36.85 5.35 10.09 4.49 7.30 7.381-D-03 03110/83 197.98 30.23 30.98 42.24 6.39 13.26 4,69 14.30 16.221-D-04 03/10/83 223.07 29.02 29.90 45.44 7.46 13.96 4.91 20.80 25.721-D-05 03/10/83 252.42 31.96 32.27 49.20 7.82 14.75 5.13 27.80 37.281-0-06 03/10/83 220.36 33.77 33.43 48.25 6.59 12.15 4.57 33.30 46.311-0-07 03/10/83 322.74 33.43 34."- 50.80 9.37 14.54 6.35 40.80 60.451-D-08 03/10/83 304.03 34.68 37."4 48.93 8.12 12.97 6.21 45.50 70.671-0-09 03/10/83 244.26 32.21 32.91 42.81 7.42 9.41 5.71 50.60 80.381-0-10 03/10/83 209.69 35.24 36.85 44.68 5.69 7.77 4.69 56.90 90.31
1-0-ENO 03/10/83 209.69 67.00 105.02
1-D-01 04/18/83 122.27 26.49 27.05 33.66 4.52 8.91 3.63 0.00 0.001-D-02 04/18/83 166.76 31.36 32.13 36.06 5.16 9.73 4.62 7.30 7.331-D-03 04/18/83 222.74 31.47 30.63 57.45 7.27 13.30 3.88 14.30 16.791-D-04 04/18/83 223.16 28.97 31.16 46.26 7.16 12.96 4.82 20.80 26.861-D-05 04/18/83 250.50 3.84 33.89 50.78 7.39 14.25 4.93 27.80 38.371-0-06 04/18/83 238.55 32.88 35.13 49.75 6.79 11.69 4.79 33.30 47.721-0-07 04/18/83 301.29 33.47 35.07 51.35 8.59 13.84 5.86 40.80 61.771-0-08 04/18/83 341.57 35.52 37.24 52.66 9.17 12.96 6.49 45.50 72.261-0-09 04/18/83 245.02 35.99 26.95 43.08 6.63 8.78 5.69 50.60 82.651-D-10 04/18/83 164.40 35.50 35.45 43.14 4.51 5.92 3.81 56.90 91.611-0-END 04/18/83 164.40 67.00 103.15
Appendix D Ephemeral Gully Data D5

EPHEMERAL GULLIES
SITE-2, GULLY-A, CYCLE-1
TOP MEAN WETTED MEAN MAX HYDRAULIC CUIMMLATIVE CUMMULATIVEGULLY AREA WIDTH WIDTH PERIMETER DEPTH DEPTH RADIUS LENGTH VOLUMESTATION DATE (Sq. In.) (in.) (In.) (In.) (In.) (In.) (in.) (Ft.) (Cubic ft.)
2-A-D1 03/12/83 33.89 14.56 13.61 18.48 2.49 4.66 1.83 0.00 0.002-A-02 03/12/83 164.81 30.73 32.18 "4.80 5.12 10.22 3.68 4.40 3.042-A-03 03/12/83 229.76 33.42 34.19 48.52 6.72 10.39 4.74 8.80 9.072-A-04 03/12/83 111.12 27.45 27.50 32.37 4.04 9.52 3.43 10.80 11.432-A-05 03/12/83 99.09 30.70 32.27 27.37 3.07 6.44 3.62 14.00 13.772-A-06 03/12/83 65.58 21.94 21.29 27.22 3.08 5.95 2.41 16.20 15.032-A-07 03/12/83 29.99 18.91 19.10 20.37 1.57 2.30 1.47 18.90 15.922-A-08 03/12/83 37.02 24.06 24.19 25.41 1.53 3.23 1.46 28.10 18.062-A-09 03/12/83 63.23 30.42 31.30 27.09 2.02 4.40 2.33 45.90 24.262-A-END 03/12/83 63.23 47.20 24.83
2-A-01 04/20183 19.00 34.59 27.94 17.08 0.68 3.78 1.11 0.00 0.002-A-02 04/20/83 175.01 34.57 34.18 40.94 5.12 10.95 4.27 4.40 2.962-A-03 04/20/83 274.26 34.53 37.21 51.73 7.37 13.22 5.30 8.80 9.832-A-04 04/20/83 177.43 34.37 35.27 48.00 5.03 8.83 3.70 10.80 12.962-A-05 04/20/83 111.06 31.89 32.47 28.00 3.42 7.23 3.97 14.00 16.172-A-06 04/20/83 54.12 25.89 25.52 22.11 2.12 5.22 2.45 16.20 17.432-A-07 04/20/83 39.50 20.31 20.89 23.94 1.89 3.13 1.65 18.90 18.312-A-08 04/20/83 30.00 23.25 23.80 24.31 1.26 2.33 1.23 28.10 20.532-A-09 04/20/83 58.23 32.86 33.08 29.62 1.76 4.02 1.97 45.90 25.972-A-END 04/20/83 58.23 47.20 26.50
D6 Appendix D Ephemeral Gully Data

EPHEMERAL GULLIES
SITE-2, GULLY-B, CT-E°-
TOP MEAN WETTED MEAN MAX HYDRAULIC CUMULATIVE CUJ"ULATIVE
GULLY AREA WIDTH WIDTH PERIMETER DEPTH DEPTH RADIUS LENGTH VOLUME
STATION DATE (Sq. In.) (In.) (In.) (In.) (In.) (in.) (In.) (ft.) (Cubic ft.). °...... ..... -- -- - -- - - - - --.. .... ..... ..... . ..... . .....- - - - -- - - --....... . . . . .. . .. . .
2-B-01 03/12183 57.95 26.33 26.U2 30.33 2.16 5.34 1.91 0.00 0.00
2-B-02 03/12/83 96.00 30.73 31.89 33.93 3.01 6.59 2.83 6.20 3.31
2-9-03 03112/83 109.54 28.75 28.01 37.02 3.91 7.04 2.96 10.60 6.46
2-8-04 03/12/83 112.24 29.52 29.61 34.46 3.79 6.80 3.26 16.90 11.31
2-B-05 03/12/83 78.27 32.64 33.02 35.90 2.37 4.'0 2.18 25.30 16.86
2-8-06 03/12/83 57.01 31.05 32.02 33.22 1.78 3.77 1.72 28.30 18.27
2-8-07 03/12/83 57.11 24.05 25.40 24.38 2.4" 5.04 2.31. 48.10 26.12
2-8-08 03/12/83 128.11 22.30 23.29 29.22 5.50 9.15 4.38 52.60 29.02
2-8-09 03/12/83 187.05 34.94 35.83 40.50 5.22 10.64 4.62 59.20 36.24
2-8-10 03/12/83 159.57 33.45 34.S4 34.19 4.58 8.58 4.67 67.80 46.59
2-8-11 03/12/83 287.04 34.87 35.92 50.83 7.99 13.34 5.65 74.00 56.21
2-8-12 03/12/83 201.35 34.84 35.13 42.10 5.73 9.39 4.78 81.30 68.58
2-8-13 03/12/83 127.31 34.71 35.66 39.78 3.57 6.64 3,20 87.80 76.00
2-8-14 03/12/83 86.66 34.93 35.37 38.62 2.45 4.62 2.24 95.40 81.65
2-9-15 03/12/83 71.95 34.49 34.92 38.10 2.06 3.88 1.89 104.70 86.77
2-8-16 03/12/83 202.95 34.12 34.45 44.69 5.89 9.99 4.54 112.00 93.74
2-8-17 03/12/83 77.06 30.56 30.57 25.85 2.52 5.36 2.98 121.80 103.26
2-8-18 03/12/83 46.45 31.14 31.17 20.03 1.49 2.75 2.32 129.30 106.48
2-8-END 03/12/83 46.45 137.80 109.23
2-9-01 04/20/83 70.65 34.23 34.46 38.96 2.05 5.77 1.81 0.00 0.00
2-8-02 04/20/83 89.15 32.25 32.53 Z8.87 2.74 .. 04 3.09 6.20 3.44
2-8-03 04/20/83 112.7n 27.50 27.96 36.19 4.03 6.81 3.11 10.60 6.53
2-8-04 04/20/83 118.03 30.40 30.89 36.60 3.82 7.37 3.22 16.90 11.57
2-8-05 04/20/83 70.48 33.63 34.04 35.95 2.07 3.61 1.96 25.30 17.07
2-8-06 04/20/83 50.24 31.74 32.20 33.16 1.56 3.46 1.52 28.30 18.33
2-8-07 04/20/83 52.72 30.52 29.12 25.39 1.81 4,69 2.08 48.10 25,41
2-8-08 04/20/83 223.28 31.25 31.94 37.74 6.99 11.67 5.92 52.60 29.72
2-8-09 04/20/83 194.09 32.94 32.67 43.78 5.94 10.52 4.43 59.20 39.29
2-8-10 04/20/83 191.23 35.30 36.28 37.94 5.27 9.55 5.04 67.80 50.79
2-B-11 04/20/83 273.43 35.19 35.32 51.08 7.74 11.58 5.35 74.00 60.80
2-B-12 04/20/83 258.17 34.71 36.98 43.64 6.98 11.03 5.92 81.30 74.27
2-8-13 04/20/83 134.58 34.79 35.23 42.32 3.82 6.80 3.18 87.80 83.14
2-9-14 04/20/83 98.30 35.09 35.10 39.77 2.80 5.40 2.47 95.40 89.29
2-9-15 04/20/83 86.53 35.30 35.60 40.00 2.43 4.34 2.16 104.70 95.26
2-B-16 04/20/83 227.79 35.16 36.85 47.53 6.18 10.79 4.79 112.00 103.23
2-8-17 04/20/83 102.10 29.27 29.08 26.78 3.51 6.59 3.81 121.80 114.45
2-B-18 04/20/83 42.82 31.36 31.95 20.21 1.34 2.71 2.12 129.30 118.23
2-B-END 04/20/83 42.82 137.80 120.75
D7Appendix D Ephemeral Gully Data

EPHEMERAL GULLIESSITE-2, GULLY-C, CYCLE-1
TOP MEAN WETTEO MEAN MAX HYDRAULIC '2JMM.LATIVE CUMMULATIVE
GULLY AREA WIOTH UIDTH PERIMETER CEPTH DEPTH RADIUS LENGTH VOLUMESTATION DATE (Sq. In.) (In.) (in.) (In.) (In.) (in.) (In.) (Ft.) (C~kic ft.)
2-C-01 03112183 50.29 27.35 28.41 23.84 1.77 2.80 2.11 0.00 0.002-C-02 03/12/83 57.30 29.61 29.38 31.98 1.95' 4.12 1.79 4.70 1.762-C-03 03/12183 52.75 22.98 22.63 27.33 2.33 4.30 1.93 7.40 2.792-C-04 03/12183 41.06 18.80 18.92 20.95 2.17 3.53 1.96 10.20 3.702-C-05 03/12/83 27.30 16.09 16.54 15.68 1.65 3.10 1.74 13.10 4.392-C-06 03/12/83 46.18 26.07 25.65 19.36 1.80 4.15 2.39 20.10 6.18
2-C-07 03/12/83 29.45 26.71 26.29 19.54 1.12 2.86 1.51 25.70 7.652-C-08 03/12/83 42.00 28.18 27.09 30.75 1.55 3.50 1.37 29.60 8.62
2-C-09 03/12/83 22.76 18.48 18.80 16.12 1.21 2.16 1.41 32.80 9.3',2-C-END 03/12/83 22.76 35.70 9.80
2-C-01 04/20/83 47.61 32.03 32.38 25.48 1.47 2.38 1.87 0.00 0.002-C-02 041/20/83 60.37 34.54 34.89 35.00 1.73 3.48 1.72 4.70 1.76
2-C-03 04/20/83 61.41 28.36 29.10 25.60 2.11 3.98 2.40 7.40 2.902-C-04 04/20/183 26.24 25.16 15.47 17.71 1.03 2.17 1.4.8 10.20 3.752-C-05 04/20/83 28.81 19.73 20.00 22.21 1.44 3.06 1.30 13.10 4.312-C-06 04/20/83 44.50 32.47 32.48 18.96 1.37 3.49 2.35 20.10 6.092-C-07 04/20/83 37.24 27.24 26.98 21.28 1.38 2.61 1.75 25.70 7.682-C-08 04/20/83 47.05 29.36 29.96 29.17 1.57 3.13 1.61 29.60 8.822-C-09 04/20/83 25.31 25.36 25.82 27.02 0.98 1.92 0.94 32.80 9.632-C-ENO 04120/83 25.31 35.70 10.14
D8 Appendix 0 Ephemeral Gully Data
,I

EPMEMERAL GULLIES
SITE-3, GULLY-A. CYCLE-i
TOP MEAN WETTED MEAN MAX HYDRAULIC CUMO4LATIVE CUL*CLATIVE
GULLY AREA WIDTH WIDTH PERIMETER DEPTH DEPTH RADIUS LENGTH VOLUME
STATION DATE (Sq. In.) (In.) (In.) (In.) (In.) (In.) (In.) (Ft.) (Cubic Ft.)
3-A-01 03/08/13 97.30 18.44 19.49 30.45 4.99 9.55 3.20 5.50 1.86
3-A-02 03/08/83 77.86 27.18 27.03 28.55 2.88 5.66 2.73 11.40 5.45
3-A-03 03!08/83 70.78 22.90 23.28 27.24 3.04 5.67 2.60 17.40 8.55
3-A-04 03/08/83 55.31 27.67 27.93 27.83 1.98 4.48 1.99 22.70 10.87
3-A-05 03108/83 86.62 22.36 22.76 31.34 3.63 7.54 2.76 31.20 15.06
3-A-06 03/08/83 67.16 22.56 22.84 27.55 2.94 5.19 2.44 38.00 18.69
3-A-END 03/08/83 67.16 43.20 21.11
D9Appendix D Ephemeral Gully Dala

EPHEMERAL GULLIESSITE-3, GULLY-B, CYCLE-1
TOP MEAN WETTED MEAN MAX HYDRAULIC CUIM1ULATIVE CULMULATIVE
GULLY AREA WIDTH WIDTH PERIMETER DEPTH DEPTH RADIUS LENGTH VOLUMESTATION DATE (Sq. In.) (In.) (In.) (In.) (In.) (In.) (In.) (Ft.) (Ctbic Ft.)S..........-- ........ .. ....... ...... .----.- .---- ..... ...... ...... ..........-- ........... ...........
3-0-01 03/08/83 62.92 18.73 18.45 24.99 3.41 6.03 2.52 4.60 1.01
3-8-02 03/08/83 124.89 30.28 30.76 32.28 4.06 7.34 3.87 10.90 5.11
3-8-03 03/08/83 177.15 28.88 30.17 37.20 5.87 9.96 4.76 19.30 13.923-8-04 03/08/83 146.85 33.77 33.99 42.58 4.32 8.79 3.45 28.30 24.05
3-8-05 03/08/83 102.54 22.12 21.49 33.19 4.77 9.28 3.09 35.40 30.19
3-8-06 03/08/83 144.65 27.00 27.39 38.95 5.28 8.83 3.71 41.60 35.523-B-07 03/08/83 75.16 28.44 28.46 30.47 2.64 4.81 2.47 52.40 43.76
3-6-D8 03/08/83 137.22 31.54 31.69 47.88 4.33 8.90 2.87 65.10 53.13
3-8-09 03/08/83 100.97 26.40 26.71 31.44 3.78 5.86 3.21 74.00 60.493-B-10 03/08/83 69.39 23.32 23.44 23.74 2.96 5.22 2.92 85.90 67.53
3-B-11 03/08/83 50.71 26.52 25.87 32.41 1.96 4.27 1.56 96.00 71.743-8-END 03/08/83 50.71 100.20 73.22
D1O Appendix D Ephemeral Gully Data

EPHEMERAL GULLIES
SITE-3. GULLY-C, CYCLE-1
TOP MEAN WTTED MEAN MAX HYDRAULIC CUOWIULAT I VE CJMMULAT I VE
GULLY AREA WIDTH WIDTH PERIMETER DEPTH DEPTH RADIUS LENGTH VOLUME
STATION DATE (Sq. In.) (In.) (In.) (in.) (In.) (In.) (in.) (ft.) (Cubic ft.)- - -- -. ........ . ........ ...... ... ... ... ...... .° . . ... ... ... .. .. .......... . .......... ...........
3-C-01 03/08/83 106.61 24.06 24.17 35.49 4.41 8.8" 3.00 4.50 1.67
3-C-02 03/08/83 171.64 26.02 27.68 38.50 6.20 11.23 4.46 8.40 5.43
3-C-03 03/08/83 202.48 25.46 26.33 4.17 7.69 15.19 4.58 10.00 7.51
3-C-04 03/08/83 295.49 35.16 36.84 49.51 8.02 13.61 5.97 16.30 18.40
3-C-05 03/08/83 181.79 30.87 30.60 39.26 5.94 10.07 4.63 25.40 33.48
3-C-END 03/08/83 181.79 44.00 56.96
Dl1Appendix D Ephemeral Gully Data

EPHEMERAL GULLIESSITE-3, GULLY-C, CYCLE-I
TOP MEAN WETTED MEAN MAX HYDRAULIC CLOIJMLATIVE CUMIMLATIVEGULLY AREA WIDTH WIDTH PERIMETER DEPTH DEPTH RADIUS LENGTH VOLUMESTATION DATE (Sq. In.) (In.) (In.) (in.) (In.) (In.) (in.) (Ft.) (Cubic Ft.)S. . . ... ........ ------- ... ....... . . . . . . . . . . .-- -- ----- ........ ..-- --......... ...........--- -- --- --
3-0-O1 03/09/83 142.72 24.15 25.99 37.15 S.49 10.28 3.84 3.60 1.783-D-02 03/09/83 92.40 34.99 34.86 38.56 2.65 4.67 2.40 8.30 5.623-0-03 03109/83 157.8W 35.63 36.63 46.16 4.31 8.76 3.42 19.40 15.273-D-04 03/09/83 277.73 35.46 34.75 63.33 7.99 20.14 4.39 23.20 21.013-D-05 03/09/83 320.98 34.01 34.40 60.23 9.33 20.07 5.33 28.80 32.663-D-06 03/09/83 175.23 36.08 37.52 46.24 4.67 9.32 3.79 39.00 50.233-D-END 03/09/83 175.23 60.00 75.79
D12Appendix D Ephemneral Gully Data

EPHEMERAL GULLIES
SITE-3, GULLY-E, CYCLE-1
TOP MEAN WIETTED NEAN MAX HYDRAULIC CUMq1ULAT[VE CUMIULATIVE
GULLY AREA UWIDTH WIDTH PERIMETER DEPTH DEPTH RADIUS LENGTH VOLUME
STATION DATE (Sq. In.) (in.) (in.) (in.) (In.) (In.) (In.) (Ft.) (Cubic Ft.)
3-E-01 03/09/83 63.09 23.47 23.89 25.08 2.64 5.33 2.52 2.90 0.61
3-E-02 03/09/83 69.81 22,58 23.42 23.46 2.98 5.72 2.98 7.30 2.67
3-E-03 03/09/83 141.44 33.70 34.66 40.94 4.08 7.32 3.45 14.70 8.09
3-E-04 03/09/83 165.47 30.92 30.87 35.96 5.36 11.54 4.60 20.40 14.17
3-E-05 03/09/83 194.88 35.81 36.63 43.74 5.32 8.78 4.46 26.20 21.42
3-E-06 03/09/83 116.41 31.99 32.06 39.31 3.63 7.73 2.96 32.20 Z7.91
3-E-07 03/09/83 95.78 33.15 34.57 30.35 2.77 4.53 3.16 37.60 31.88
3-E-08 03/09/83 108.87 34.50 35.00 35.82 3.11 5.15 3.04 41.20 34.44
3-E-09 03/09/83 90.01 32.99 32.97 35.48 2.73 4.71 2.54 47.50 38.79
3-E-10 03/09/83 82.81 31.69 30.78 36.97 2.69 5.81 2.24 53.70 42.51
3-E-END 03/09/83 82.81 59.80 46.02
D13i Appendix D Ephemeral Gully Data

EPHEMERAL GULLIESSITE-4., GULLY-A. CYCLE-i
TOP MEAN WETTED MEAN MAX HYDRAULIC CUMMULATIVE CUMMULATIVE
GULLY AREA WIDTH UIDTH PERIMETER DEPTH DEPTH RADIUS LENGTH VOLUMESTATION DATE (Sq. In.) (in.) (In.) (In.) (In.) (In.) (In.) (Ft.) (Cubic Ft.)S.......... ........ .........-- ...... ...... ..........- ...... ...... .......... ...........--- ...........
4-A-01 03/21/83 43.06 30.18 30.32 31.39 1.42 2.88 1.37 21.20 3.174-A-02 03/21/83 64.57 28.53 28.82 23.98 2.24 4.18 2.69 32.90 7.544-A-03 03/21/83 83.84 34.37 33.67 30.53 2.49 4.24 2.75 43.90 13.204-A-04 03/21/83 63.09 27.94 27.55 31.19 2.29 4.82 2.02 57.20 19.994-A-05 03/21/83 52.67 29.24 28.62 25.00 1.84 3.58 2.11 67.50 24.134-A-06 03/21/83 65.97 30.07 30.26 31.02 2.18 4.70 2.13 88.50 32.784-A-07 03/21/83 59.03 23.41 24.29 26.76 2.43 4.44 2.21 93.70 35.044-A-08 03/21/83 43.16 25.40 24.66 23.19 1.79 3.38 1.86 100.00 37.274-A-09 03/21/83 24.30 14.81 14.63 15.96 1.66 2.75 1.52 140.10 46.684-A-10 03/21/83 33.46 18.19 18.18 19.41 1.84 3.55 1.72 148.50 48.364-A-11 03/21/83 48.14 18.58 19.64 17.80 2.45 4.17 2.70 156.60 50.654-A-12 03/21/83 21.07 16.67 16.59 13.36 1.27 2.62 1.58 167.80 53.344-A-13 03/21/83 36.25 23.45 23.08 23.88 1.57 2.94 1.52 179.60 55.694-A-14 03/21/83 71.69 22.58 23.42 26.31 3.06 4.64 2.72 188.30 58.954-A-15 03/21/83 58.60 26.36 27.12 22.20 2.16 4.06 2.64 197.70 63.214-A-END 03/21/83 58.60 210.00 68.21
4-A-01 04/19/83 34.88 27.02 27.25 28.19 1.28 2.50 1.24 21.20 2.574-A-02 04/19/83 60.17 28.69 28.92 23.68 2.08 3.9Z 2.54 32.90 6.434-A-03 04/19/83 80.78 34.69 34.22 31.13 2.36 4.09 2.59 43.90 11.814-A-04 04/19/83 68.84 27.65 27.75 31.74 2.48 4.79 2.17 57.20 18.724-A-05 04/19/83 64.24 29.64 30.59 20.11 2.10 4.08 3.19 67.50 23.484-A-06 04/19/83 69.98 29.90 29.65 24.65 24.62 2.36 2.84 88.50 33.264-A-07 04/19/83 58.04 27.15 27.12 29.00 2.14 4,35 2.00 93.70 35.584-A-08 04/19/83 62.21 24.66 25.28 24.70 2.46 4.88 2.52 100.00 38.214-A-09 04/19/83 22.58 13.89 14.11 13.98 1.60 2.74 1.62 140.10 50.02
4-A-10 04/19/83 41.03 18.89 19.26 21.20 2.13 4.16 1.94 148.50 51.874-A-11 04/19/83 51.68 16.30 16.35 18.27 3.16 5.39 2.83 156.60 54.484-A-12 04/19/83 26.43 15.76 16.41 13.46 1.61 3.02 1.96 167.80 57.524-A-13 04/19/83 39.81 22.39 23.14 23.42 1.72 3.37 1.70 179.60 60.244-A-14 04/19/83 68.14 23.74 24.68 26.73 2.76 4.42 2.55 188.30 63.494-A-15 04/19/83 63.18 27.74 27.83 24.96 2.27 4.15 2.53 197.70 67.784-A-END 04/19/83 63.18 210.00 73.18
D14 Appendix D Ephemeral Gully Data

EPHEM•RAL GULLIES
SITE-4, GULLY-B, CYCLE-i
TOP MEAN WJETTED MEAN MAX HYDRAULIC CUM4ULATIVE CUMMLATIVE
GULLY AREA UIDTH WIDTH PERIMETER DEPTH DEPTH RADIUS LENGTH VOLUME
STATION DATE (Sq. In.) (in.) (in.) (In.) (In.) (in.) (in.) (Ft.) (cubic Ft.)
------------------------------------------------------------- ------ ------...... .......----------............
4-B-04 03/21/83 57.67 27.44 27.72 27.25 2.08 3.96 2.12 88.50 19.89
4-B-01 03/21/83 25.32 21.89 23.22 10.64 1.09 2.31 2.38 28.40 2.50
4-8-02 03/21/83 69.42 25.71 25.71 20.78 2.70 3.75 3.34 35.60 4.87
4-8-03 03/21/83 86.65 34.05 35.22 23.82 2.46 5.77 3.64 54.40 9.37
4-8-05 03/211/83 64.65 33.06 33.84 34.49 1.91 3.51 1.87 66.60 25,07
4-9-06 03/21/83 62.16 31.21 32.04 33.40 1.94 3.66 1.86 79.60 30.79
4-5-07 03121/83 103.85 35.29 35.32 38.21 2.94 5.09 2.72 92.70 38.35
4-B-08 03/21/83 184.43 35.44 35.88 41.78 5.14 8.13 4.41 102.10 47.75
4-8-09 03/21/83 129.07 34.99 34.78 41.42 3.71 8.33 3.12 112.80 59.40
4-8-10 03/21/83 106.25 33.38 33.30 37.80 3.19 6.51 2.81 122.00 66.92
4-8-11 03/21/83 182.48 34.51 34.62 42.96 5.27 9.18 4.25 133.80 78.75
4-3-12 03/21/83 180.75 35.30 36.51 40.77 4.95 8.43 4.43 146.10 94.26
4-8-13 03/21/83 90.26 34.54 34.45 37.13 2.62 4.16 2.43 153.10 100.84
4-8-14 03/21/83 95.19 35.07 35.12 31.87 2.71 4.76 2.99 162.00 106.58
4-8-END 03/21/83 95.19 205.00 135.00
4-8-01 04/19/83 13.25 12.90 13.25 12.13 1.00 1.47 1.09 28.40 1.31
4-B-02 04/19/83 68.44 27.10 27.93 24.65 2.45 3.64 2.78 35.60 3.35
4-8-03 04/19/83 99.09 34.11 35.38 24.55 2.80 5.83 4.04 46.10 9.45
4-8-04 04/19/83 55.12 28.32 28.55 24.28 1.93 3.79 2.27 54.40 13.90
4-8-05 04/19/83 87.00 32.61 34.52 37.29 2.52 3.79 2.33 66.60 19.92
4-8-06 04/19/83 62.44 34.82 35.07 30.13 1.78 3.46 2.0? 79.60 26.67
4-8-07 04/19/83 114.67 35.34 36.99 40.42 3.10 5.40 2.84 92.70 3472
4-8-08 04/19/83 143.28 35.37 36.45 40.14 3.93 6 41 3.57 102.10 43.14
4-5-09 04/19/83 115.50 35.75 35.75 39.97 3.23 7.15 2.89 112.80 52.75
4-B-10 04/19/83 114.24 29.98 31.47 34.21 3.63 6.33 3.34 122.00 60.09
4-8-11 04119/83 206.13 34.76 36.09 44.24 5.71 9.55 4.66 133.80 73.21
4-8-12 04/19/83 171.65 34.70 36.13 40.18 4.75 7.88 4.27 146.10 89.34
4-8-13 04/19183 81.78 35.38 34.94 37.67 2.34 4.53 Z.17 153.10 95.50
4-8-14 04/19/83 91.28 33.86 34.57 31.04 2.64 5.17 2.94 162.00 100.85
4-B-END 04/19/83 91.28 205.00 128.11
D15Appendix D Ephemeral Gully Da'3

EPHEMERAL GULLIESSITE-1. GULLY-A, CYCLE-2
TOP MEAN WETTED MEAN MAX HYDRAULIC CUIMULATIVE CUWWULATIVEGULLY AREA WIDTH WIDTH PERIMETER DEPTH DEPTH RADIUS LENGTH VOLUM4ESTATION DATE (Sq. In.) (In.) (In.) (In.) (in.) (In.) (In.) (Ft.) (Ctbic Ft.)
-.......-..... . .......... ...... - ..... .......... ...................------------------------1-A-01 10/05/83 21.34 31.77 30.48 33.95 0.70 2.29 0.63 12.40 0.921-A-02 10/05/83 17.90 23.56 19.67 27.22 0.91 3.10 0.66 17.60 1.621-A-03 10/05/83 30.13 30.82 30.12 32.98 1.00 3.03 0.91 23.80 2.661-A-04 10/05/83 50.30 35.26 34.68 26.50 1.45 3.22 1.90 27.90 3.801-A-05 10/05/83 131.84 35.48 36.12 40.93 3.65 6.75 3.22 40.80 11.96I-A-06 10105/83 106.70 34.83 35.44 37.52 3.01 5.28 2.81. 52.40 21.57I-A-07 10/05183 67.40 34.76 35.28 36.19 1.91 3.32 1.86 64.60 28.951-A-08 10/05/83 43.99 35.09 34.91 37.54 1.26 3.12 1.17 73.00 32.191-A-END 10/05/83 43.99 167.80 33.96
1-A-01 02/02/84 59.49 31.27 32.15 33.02 1.85 3.84 1.80 12.40 2.56I-A-02 02/02/84 46.25 16.94 17.12 22.39 2.70 4.61 2.07 17.60 4.471-A-03 02/02/84 93.67 17.82 18.77 30.64 4.99 9.97 3.06 23.80 7.481-A-04 02/02/84 99.21 21.60 23.01 27.83 4.31 6.07 3.56 27.90 10.221-A-05 02/02/84 58.48 20.68 20.59 28.54 2.84 6.04 2.05 40.80 17.291-A-06 02/02/84 69.27 33.91 34.46 39.00 2.01 4.04 1.78 52.40 22.431-A-07 02/02/84 33.20 35.34 34.94 31.55 0.95 2.78 1.05 64.60 26.77I-A-08 02/02/84 13.64 30.10 31.72 39.69 0.43 2.36 0.34 73.00 28.14I-A-09 02/02/84 31.31 17.21 17.39 19.20 1.80 2.78 1.63 81.20 29.421-A-10 02/02/84 173.80 27.72 29.65 41.04 5.86 9.70 4.23 93.30 38.041-A-11 02/02/84 116.23 32.61 32.92 38.00 3.53 7.34 3.06 120.20 65.13I-A-12 02/02/84 98.02 28.37 28.66 32.30 3.42 5.23 3.03 128.70 71.451-A-13 02/02/84 32.64 35.09 35.47 37.00 0.92 1.79 0.88 139.00 76.13I-A-14 02/02/84 41.13 21.12 21.64 24.26 1.90 3.43 1.70 147.10 78.201-A-15 02/02/84 38.64 35.62 35.77 36.91 1.08 2.21 1.05 154.20 80.171-A-16 02/02/84 49.01 32.17 31.41 34.21 1.56 2.89 1.43 162.00 82.541-A-END 02/02/84 49.01 167.80 84.51
1-A-01 03/23/84 52.98 35.53 36.04 30.78 1.47 3.63 1.72 12.40 2.281-A-02 03/23/84 64.42 22.78 23.17 20.82 2.78 4.70 3.09 17.60 4.401-A-03 03/23/84 83.83 17.66 17.53 27.68 4.78 8.69 3.03 23.80 7.591-A-04 03/23/84 75.50 35.91 35.28 27.13 2.14 4.96 2.78 27.90 9.861-A-05 03/23/84 20.27 9.85 10.08 11.47 2.01 2.73 1.77 40.80 14.151-A-06 03/23/84 91.26 35.34 35.50 39.59 2.57 5.36 2.31 52.40 18.641-A-07 03/23/84 36.70 35.03 35.98 36.25 1.02 2.85 1.01 64.60 24.061-A-08 03/23/84 14.28 35.35 35.70 38.35 0.40 1.92 0.37 73.00 25.551-A-09 03/23/84 21.86 35.52 40.48 40.46 0.54 2.96 0.54 81.20 26.581-A-10 03/23/84 196.71 35."4 35.96 37.71 5.47 11.36 5.22 93.30 35.761-A-11 03/23/84 139.09 35.75 34.85 27.42 3.99 7.44 5.07 120.20 67.131-A-12 03/23/84 109.52 35.49 35.21 31.04 3.11 6.21 3.53 128.70 74.47l-A-13 03/23/84 45.36 35.65 36.87 28.13 1.23 2.93 1.61 139.00 80.011-A-14 03/23/84 21.13 35.66 36.43 22.79 0.58 2.41 0.93 147.10 81.881-A-15 03/23/84 44.40 35.56 35.51 31.47 1.25 2.13 1.41 154.20 83.50
D16 Appendix D Ephemeral Gully Data

EPHEMERAL GULLIESSITE-I, GULLY-A, CYCLE-2
TOP MEAN WETTED MEAN MAX HYDRAULIC CUMNULATIVE CUMNJLATIVE
GULLY AREA WIDOTH WIDTH PERIMETER DEPTH DEPTH RADIUS LENGTH VOLUME
STATION DATE (Sq. In.) (In.) (In.) (In.) (In.) (In.) (In.) (Ft.) (Cubic Ft.)
1-A-16 03/23/81. 52.07 35.31 35.91 33.02 1.45 2.98 1.58 162.00 86.111-A-END 03/23/84 52.07 167.80 88.21
1-A-01 04/05/84 57.76 34.71 35.43 33.12 1.63 3.58 1.74 12.40 2.491-A-02 04/05/84 69.78 25.92 26.23 30.00 2.66 5.32 2.33 17.60 4.7191-A-03 04/05/84 87.59 17.54 17.62 27.83 4.97 8.41 3.15 23.80 8.181-A-04 04/05/84 90.63 35.65 36.54 30.61 2.48 5.26 2.96 27.90 10.711-A-05 04/05/84 35.97 35.42 35.61 32.20 1.01 3.13 1.12 40.80 16.381-A-06 04/05/84 90.84 35.25 35.62 39.36 2.55 4.48 2.31 52.40 21.491-A-07 04/05/84 27.75 35.24 37.00 36.66 0.75 2.47 0.76 64.60 26.521-A-08 04/05/84 16.12 35.10 41.33 37.75 0.39 1.59 0.43 73.00 27.801-A-09 04/05/84 28.83 35.58 38.43 40.94 0.75 3.01 0.70 81.20 29.081-A-10 04/05184 199.63 35.74 35.90 37.98 5.56 9.88 5.26 93.30 38.681-A-11 04/05/84 155.31 35.63 35.70 30.65 4.35 8.34 5.07 120.20 71.831-A-12 04/05/84 132.44 35.44 35.98 35.72 3.68 7.47 3.71 128.70 80.331-A-13 04/05/84 41.84 35.39 36.06 18.80 1.16 2.71 2.23 139.00 86.561-A-14 04/05/84 10.76 34.83 38.42 21.03 0.28 2.05 0.51 147.10 88.04
1-A-15 04/05/84 24.22 35.18 35.10 30.01 0.69 1.76 0.81 154.20 88.911-A-16 04105/84 58.74 35.07 35.17 32.14 1.67 3.03 1.83 162.00 91.151-A-END 04/05/84 58.74 167.80 93.52
1-A-01 04/25/84 54.12 35.67 37.06 31.70 1.46 3.54 1.71 12.40 2.331-A-02 04/25/84 67.54 35.19 37.52 33.20 1.80 5.31 2.03 17.60 4.531-A-03 04/25/84 84.25 17.67 17.73 27.53 4.75 8.30 3.06 23.80 7.601-A-04 04/25/84 107.46 24.19 25.04 29.45 4.29 5.54 3.65 27.90 10.521-A-O5 04/2S/84 36.79 34.78 33.75 33.28 1.09 3.35 1.11 40.80 16.98
1-A-06 04/25/84 65.27 35.92 36.66 37.50 1.78 3.38 1.74 52.40 21.091-A-07 04/25/84 43.10 35.63 36.83 37.00 1.17 2.98 1.16 64.60 25.671-A-08 04/25/84 17.37 35.41 32.77 23.05 -0.53 0.97 0.75 73.00 27.44!-A-09 04/25/84 35.85 35.43 38.13 40.82 0.94 3.52 0.88 81.20 28.961-A-10 04/25/84 180.13 36.03 36.91 35.50 4.88 9.45 5.07 93.30 38.031-A-11 04/25/84 129.43 35.98 36.15 28.96 3.58 7.27 4.47 120.20 66.95
1-A-12 04/25184 124.20 35.28 35.48 31.94 3.50 6.83 3.89 128.70 74.441-A-13 04/25/84 43.04 35.67 36.78 17.40 1.17 2.49 2.47 139.00 80.42
1-A-14 04/25/84 17.72 35.74 37.70 21.17 0.47 2.33 0.84 147.10 82.131-A-15 04/25/84 37.87 35.79 36.41 30.58 1.04 2.23 1.24 154.20 83.501-A-16 04/25/84 57.72 35.64 36.76 32.91 1.57 2.92 1.75 162.00 86.091-A-END 04125/84 57.72 167.80 88.42
1-A-01 05/03/84 49.59 35.99 38.14 30.69 1.30 3.16 1.62 12.40 2.13
1-A-02 05/03/84 80.62 35.97 35.35 35.74 2.28 5.26 2.26 17.60 4.481-A-03 05/03/84 94.51 19.08 19.20 28.62 4.92 8.57 3.30 23.80 8.251-A-04 05103/84 75.96 36.23 36.17 30.55 2.10 4.63 2.49 27.90 10.68
D17Appendix D Ephemeral Gully Data

EPHEMERAL GULLIESSITE-I, GULLY-A, CYCLE-2
TOP MEAN WETTED MEAN MAX HYDRAULIC CUW4ULPTIVE CUM94ULATIVEGULLY AREA WIDTH WIDTH PERIMETER DEPTH DEPTH RADIUS LENGTH VOLLUESTATION DATE (Sq. In.) (In.) (In.) (In.) (In.) (In.) (In.) (Ft.) (Cubic Ft.)S---------------------------------------.------------....... .......... -...........------------1-A-05 05/03/84 30.62 35.45 36.02 32.55 0.85 2.90 0.94 40.80 15.451-A-06 05/03/84 47.97 35.61 36.06 33.00 1.33 2.35 1.45 52.40 18.621-A-07 05/03/84 28.23 14.96 15.34 16.65 1.84 2.64 1.70 64.60 21.841-A-08 05/03/84 2.81 35.78 25.54 38.47 0.11 2.01 0.07 73.00 22.751-A-09 05/03/84 31.50 35.92 42.56 37.00 0.74 3.59 0.85 81.20 23.731-A-10 05/03/84 177.77 35.98 36.20 37.17 4.91 10.12 4.78 93.30 3Z.531-A-11 05/03/84 126.22 36.03 35.06 28.95 3.60 7.48 4.36 120.20 60.931-A-12 05/03/84 127.30 35.99 36.89 32.44 3.45 7.43 3.92 128.70 68.421-A-13 05/03/84 37.27 35.53 36.18 27.29 1.03 2.17 1.37 139.00 74.311-A-14 05/03/84 24.74 35.80 36.92 22.91 0.67 2.53 1.08 147.10 76.051-A-15 05/03/84 45.26 35.75 36.49 30.04 1.24 2.44 1.51 154.20 77.781-A-16 05/03/84 47.36 36.02 37.29 32.00 1.27 2.89 1.48 162.00 80.281-A-END 05/03/84 47.36 167.80 82.19
D18 Appendix D Ephemeral Gully Data

EPHEMERAL GULLIES
SITE-I, GULLY-1. CYCLE-2
TOP MEAN WETTED MEAN MAX HYDRAULIC CMI4ULATIVE CUMNJLATIVE
GULLY AREA UIDTH WIDTH PERIMETER DEPTH DEPTH RADIUS LENGTH VOLUME
STATION DATE (Sq. In.) (in.) (in.) (In.) (In.) (In.) (In.) (Ft.) (C•t-"4 Ft.)
1-8-01 10/05/83 27.84 35.23 29.30 37.50 0.95 3.08 0.74 1.70 0.16
1-5-02 10/05/83 46.16 35.23 34.70 37.50 1.33 3.17 1.23 9.40 2.14
1-8-03 10/05/83 62.42 35.47 36.71 39.00 1.70 4.56 1.60 17.10 5.05
1-8-04 10/05/83 78.30 35.51 36.41 32.85 2.15 3.25 2.38 22.90 7.88
1-3-05 10/05/83 74.35 33.98 34.26 30.53 2.17 4.55 2.44 27.50 10.32
1-5-06 10/05/83 67.18 35.33 35.35 38.84 1.90 3.48 1.73 35.30 14.15
1-3-07 10/05/83 79.68 35.43 36.05 34.62 2.21 3.86 2.30 40.80 16.96
1-3-08 10/05/83 52.85 35.49 36."4 36.59 1.45 2.81 1."4 47.60 20.08
1-6-09 10/05/83 41.07 35.47 36.02 26.33 1.14 2.47 1.56 54.00 22.17
1-B-END 10/05/83 41.07 62.00 24.45
1-9-01 02/02/84 152.40 34.71 34.95 41.67 4.36 7.83 3.66 1-70 0.90
1-8-02 02/02/84 111.33 35.43 34.57 41.32 3.22 7.76 2.69 9.40 7.95
1-8-03 02/02/84 113.66 35.79 37.38 "4.38 3.04 8.50 2.56 17.10 13.96
1-9-04 02102/84 127.79 28.60 27.36 36.62 4.67 8.14 3.49 22.90 18.82
1-0-05 02/02/84 80.94 22.89 22.73 30.60 3.56 6.04 2.65 27.50 22.16
1-B-06 02/02/84 28.79 20.48 21.16 21.82 1.36 2.06 1.32 35.30 25.13
1-8-07 02/02/84 23.86 13.77 11.75 20.14 2.03 5.22 1.18 40.80 26.13
1-8-08 02/02/84 48.40 15.17 15.71 34.00 3.08 5.12 1.42 47.60 27.84
1-11-09 02/02/84 96.73 26.89 27.32 27.8,3 3.54 5.58 3.48 54.00 31.07
1-B-END 02/02/84 96.73 62.00 36.44
1-8-01 03/23/84 188.02 35.45 35.81 48.45 5.25 9.79 3.88 1.70 1.11
1-5-02 03/23/84 151.56 35.68 35.24 45.66 4.30 9.30 3.32 9.40 10.19
1-8-03 03/23/84 104.99 24.51 24.87 24.00 4.22 7.46 4.37 17.10 17.05
1-8-04 03/23/84 90.07 18.89 19.36 26.14 4.65 7.51 3.45 22.90 20.97
1-B-OS 03/23/84 105.99 35.50 35.80 40.38 2.96 6.85 2.62 27.50 24.10
1-9-06 03/23/84 0.07 35.54 -7.00 35.95 -0.01 0.73 0.00 35.30 26.97
1-9-07 03/23/84 109,79 28.02 28.15 35.39 3.90 7.88 3.10 40.80 29.07
1-B-08 03/23/84 90.85 21.18 22.59 27.69 4.02 6.28 3.28 47.60 33.80
1-8-09 03/23/84 107.49 35.76 36.43 40.76 2.95 4.65 2.64 54.00 38.21
1-B-END 03/23/84 107.49 62.00 44.18
1-8-01 04/05/84 184.40 25.49 26.72 38.69 6.90 11.60 4.77 1.70 1.09
1-B-02 04/05/84 81.28 18.28 19.63 25.53 4.14 6.60 3.18 9.40 8.19
1-9-03 04/05/84 86.98 19.02 19.24 23.90 4.52 6.17 3.64 17.10 12.69
1-B-04 04/05/84 110.44 19.51 20.48 29.93 5.39 9.06 3.69 22.90 16.66
1-5-05 04/05/84 106.77 34.44 35.00 38.50 3.05 6.23 2.77 27.50 20.13
1-9-06 04/05/84 7.83 35.57 34.04 36.44 0.23 1.47 0.21 35.30 23.23
1-B-07 04/05/84 119.59 23.23 24.35 33.63 4.91 8.59 3.56 40.80 25.66
1-8-08 04/05/84 73.36 16.79 17.46 23.15 4.20 5.54 3.17 47.60 30.22
1-9-09 04/05/84 99.54 35.32 35.42 39.40 2.81 4.47 2.53 54.00 34.06
1-B-END 04/05/84 99.54 62.00 39.59
D19Appendix D Ephemeral Gully Data

EPHEMERAL GULLIES
SITE-i, GULLY-B, CYCLE-2
TOP MEAN WETTED MEAN MAX HYDRAULIC CUM1ULATIVE CUMMULATIVE
GULLY AREA WIDTH WIDTH PERIMETER DEPTH DEPTH RADIUS LENGTH VOLUMESTATION DATE (Sq. In.) (In.) (In.) (In.) (in.) (In.) (In.) (Ft.) (Cubic Ft.)
1-8-01 04/25/84 114.12 21.51 22.94 31.29 6.28 10.55 3.65 1.70 0.67
I-8-02 04/25/84 103.68 20.33 20.57 25.06 5.04 8.94 4.14 9.40 6.491-8-03 04/25/84 102.64 22.18 23.75 29.07 4.32 7.33 3.53 17.10 12.011-8-04 04/25/84 116.30 19.59 20.84 31.01 5.58 9.76 3.75 22.90 16.42
1-8-05 04/25/84 115.60 35.65 35.35 40.98 3.27 6.43 2.82 27.50 20.131-8-06 04/25/84 8.56 35.64 34.23 36.48 0.25 1.19 0.23 35.30 23.491-8-07 04/25/84 118.86 22.47 22.30 33.73 5.33 9.47 3.52 40.80 25.921-3-08 04/25/84 109.55 26.29 26.46 33.42 4.14 6.96 3.28 47.60 31.311-3-09 04/25/84 102.95 27.80 28.43 33.09 3.62 4.95 3.11 54.00 36.041-B-END 04/25/84 102.95 62.00 41.76
1-8-01 05/03/84 256.06 35.50 36.06 48.92 7.10 14.34 5.23 1.70 1.511-8-02 05/03/84 163.21 35.33 36.51 46.32 4.47 8.80 3.52 9.40 12.72
1-8-03 05/03/84 102.85 19.76 21.50 27.29 4.76 7.31 3.77 17.10 19.831-8-04 05/03/84 79.34 16.45 17.32 28.21 4.58 8.53 2.81 22.90 23.501-9-05 05/03/84 106.55 35.41 35.99 41.01 2.96 5.86 2.60 27.50 26.471-8-06 05/03/84 0.59 35.86 59.00 37.25 0.01 1.01 0.02 35.30 29.37
1-8-07 05/03/84 122.13 17.03 18.31 29.46 6.67 9.00 4.15 40.80 31.711-8-08 05/03/84 97.28 21.86 23.05 28.64 4.22 6.57 3.40 47.60 36.891-8-09 05/03/84 114.85 35.37 35.77 42.67 3.21 5.94 2.69 54.00 41.61
1-8-END 05/03/84 114.85 62.00 47.99
D20 Appenaox D Ephemeral Gully Data

EPHEMERAL GULLIESSITE-1, GULLY-C, CYCLE-2
TOP KEAN WETTED MEAN MAX HYDRAULIC CUMMUJLATIVE CUMMIULATIVE
GULLY AREA WIDTH WIDTH PERIMETER DEPTH DEPTH RADIUS LENGTH VOLUME
STATION DATE (Sq. In.) (In.) (In.) (In.) (in.) (In.) (In.) (Ft.) (Cubic Ft.)
--------........-------------------------------------------------------------------------------------
1-C-01 10/05/83 64.36 35.27 35.36 35.08 1.82 2.99 1.83 1.60 0.36
1-C-02 10/05/83 89.04 35.25 34.11 39.00 2.61 5.40 2.28 10.00 4.83
I-C-03 10/05/83 253.44 35.61 34.52 52.72 7.34 13.39 4.81 21.20 18.15
1-C-END 10/05/83 253.44 92.20 26.95
1-C-01 02102/84 20.85 11.13 11.58 14.45 1.80 3.33 1."4 1.60 0.12
1-C-02 02/02/84 34.76 35.36 35.83 36.83 0.97 2.81 0.94 10.00 1.74
1-C-03 02/02/84 60.99 35.40 35.87 25.99 1.70 4.40 2.35 21.20 5.46
1-C-04 02/02/84 91.52 35.53 35.89 46.50 2.55 7.93 1.97 39.20 15.00
1-C-05 02/02/84 131.84 35.72 3,4.51 45.53 3.82 10.15 2.90 E1.30 24.39
1-C-06 02/02/84 162.28 35.37 35.35 43.58 4.59 9.55 3.72 56.80 30.01
1-C-07 02/02/84 115.79 35.56 35.19 41.28 3.29 7.46 2.80 61.90 34.93
1-C-08 02102/84 69.23 35.43 34.44 39.50 2.01 6.89 1.75 69.70 39.94
1-C-09 02/02/84 80.61 35.71 36.64 31.24 2.20 5.30 2.58 72.60 41.45
1-C-10 02/02/84 25.93 35.44 32.82 36.75 0.79 2.35 0.71 82.00 44.93
1-C-11 02/02/84 27.88 35.06 34.84 21.14 0.80 1.96 1.32 87.20 45.90
1-C-END 02102/84 27.88 92.20 46.87
1-C-01 03/23/84 29.69 35.62 36.20 35.84 0.82 2.69 0.83 1.60 0.16
1-C-02 03/23/84 38.78 35.14 34.62 36.30 1.12 3.31 1.07 10.00 2.16
1-C-03 03123184 72.45 35.46 34.33 39.84 2.11 5.57 1.82 21.20 6.48
I-C-04 03123/84 87.02 20.09 19.91 31.70 4.37 7.48 2.75 39.20 16.45
1-C-05 03/23/84 71.50 15.73 15.47 24.41 4.62 7.99 2.93 51.30 23.11
1-C-06 03/23184 97.49 24.41 25.79 35.46 3.78 7.17 2.75 56.80 26.34
1-C-07 03/23/84 108.56 25.63 24.82 33.89 4.05 8.74 3.20 61.90 29.98
1-C-08 03/23/84 123.59 35.27 34.91 41.79 3.54 8.29 2.96 69.70 36.27
1-c-09 03/23/84 88.79 35.58 34.28 42.27 2.59 6.84 2.10 72.60 38.41
1-C-10 03/23/84 33.17 35.42 35.66 36.53 0.93 2.52 0.91 82.00 42.39
1-C-11 03/23/84 45.11 35.50 35.51 36.34 1.27 3.04 1.24 87.20 43.80
1-C-END 03/23/84 45.11 92.20 45.37
1-C-01 04/05/84 34.46 35.34 35.16 34.01 0.98 2.30 1.01 1.60 0.19
1-C-02 04/05/84 37.30 33.84 35.18 34.50 1.06 2.72 1.08 10.00 2.28
I-C-03 04/05/84 60.19 23.41 23.88 27.37 2.52 5.14 2.20 21.20 6.07
1-C-04 04/05/84 122.47 23.32 24.44 34.70 5.01 9.28 3.53 39.20 17.49
1-C-05 04105184 103.26 21.82 22.14 31.50 4.60 9.70 3.28 51.30 26.97
1-C-06 04/05/84 121.65 25.25 26.33 31.57 4.62 7.68 3.85 56.80 31.26
1-C-07
04/05/84 130.93 33.81 32.56 43.50 4.02 9.96 3.01 61.90 35.73
1-C-08 04/05/84 127.42 27.58 27.76 33.17 4.59 8.4, 3.84 69.70 42.73
I-C-09 04/05/84 40.84 15.41 15.52 22.26 2.63 4.74 1.83 72.60 44.43
1-C-10 04105/84 39.00 23.82 23.78 26.12 1.64 3.22 1.49 82.00 47.03
1-C-END 04/05/84 39.00 92.20 48.39
D21Appendix 0 Ephemeral Gully Data

EPHEMERAL GULLIESSITE-l, GULLY-C, CYCLE-2
TOP MEAN WETTED MEAN MAX HYDRAULIC CUlAULATIVE CUMMJLATIVE
GULLY AREA WIDTH WIDTH PERIMETER DEPTH DEPTH RADIUS LENGTH VOLUME
STATION DATE (Sq. In.) (In.) (In.) (In.) (in.) (in.) (in.) (Ft.) (Cubic ft.).. . . . . . . . . . . . . . . . . . ......................---.........--. ......---.... . . ...... .
1-C-01 04/25/84 23.01 35.81 35.39 37.72 0.65 2.45 0.61 1.60 0,1!
1-C-02 01/2S/84 34.93 35.10 34.24 35.56 1.02 3.19 0.98 10.00 1.82
ý-C-03 04/25/84 46.98 14.87 15.35 19.75 3.06 5.15 2.38 21.20 5.01
1-C-04 04/25/84 117.64 19.02 20.63 29.48 5.70 8.96 3.99 39.20 15.29
1-C-05 04/25/84 164.27 3S.68 34.22 39.13 4.80 12.01 4.20 51.30 27.14
1-C-06 04/25/84 188.48 35.78 3:.76 36.67 5.27 10.41 5.14 56.80 33.88
1-C-07 04/25/84 146.92 35.85 35.14 46.05 4.18 10.42 3.19 61.90 39.82
1-C-08 04/25/84 129.61 35.62 35.50 41.41 3.65 7.93 3.13 69.70 47.30
1-C-09 04/25/84 85.48 35.97 34.74 41.29 2.46 6.74 2.07 72.60 49.47
1-C-10 04/25/84 36.30 35.36 34.24 36.50 1.06 3.83 0.99 82.00 53.45
1-C-11 04/25/84 44.56 35.89 35.64 36.50 1.25 2.76 1.22 87.20 54.91
1-C-END '4/25/84 44.56 92.20 56.45
1-C-01 05/03/84 25.10 35.97 37.46 38.50 0.67 1.86 0.65 1.60 0.14
1-C-02 05/03/84 32.39 35.93 3c.39 37.47 0.89 3.12 0.86 10.00 1.82
1-C-03 05/03184 71.33 24.40 23.17 29.78 2.95 5.80 2.40 21.20 5.85
1-C-04 05/03/84 118.97 25.09 26.08 35.02 4.56 7.81 3.40 39.20 17.74
1-C-05 05/03/84 175.98 35.95 33.77 40.09 5.21 12.85 4.39 51.30 30.13
1-C-06 05/03/84 179.81 35.94 35.05 32.24 5.13 10.13 5.58 56.80 36.92
1-C-07 05/03/84 108.94 24.78 24.59 36.08 4.43 9.72 3.02 61.90 42.04
1-C-08 05/03/84 127.89 35.25 36.02 39.50 3.55 8.83 3.24 69.70 48.45
1-C-09 05/03,84 58.41 35.86 34.35 38.61 1.70 4.85 1.51 72.60 50.33
1-C-11 05/03/84 59.28 35.71 35.92 37.01 1.65 3.50 1.60 87.20 52.46
1-C-END 05/03/84 59.28 92.20 54.52
D22 Appendix 0 Ephemeral Gully Data

EPHEMERAL GULLIESSITE-I, GULLY-0, CYCLE-2
lop MEAN WETTED MEAN MAX HYDRAULIC CU1.MULATIVE CUIiULATIVEGULLY ARE', UIDTH WIDTH PERINETER DEPTH DEPTH RADIUS LENGTH VOLUMESTATION DATE (Sq. In.) (in.) (in.) (In.) (In.) (in.) (In.) (Ft.) (Cubic Ft.)- - -- -. . .. . . . . . . .. . . . . ..... ....... . . ... ............... ...--- - - -- - -........- - -- - - - -- - - - - ..... ......
1-D-01 10/05/83 27.11 35.42 33.16 37.41 0.81 2.69 0.72 2.00 0.191-0-02 10/05'3f3 25.02 35.26 34.27 37.17 0.73 2.33 0.67 11.20 1.85
1-0-03 10/05/83 27.78 35.62 32.30 37.50 0.86 3.33 0.74 16.70 2.861-D-04 10/05/83 31.69 35.08 31.06 37.50 1.02 2.70 0.85 24.00 4.371-0-05 10/05/83 50.10 35.54 34.79 28.12 1.44 3.22 1.78 29.30 5.881-D-06 10/05/83 54.28 35.12 35.71 29.80 1.52 2.81 1.82 36.60 8.521-0-07 10/05/83 52.75 35.41 34.03 36.75 1.55 3.29 1.44 41.90 10..91-0-08 10/05/83 65.86 35.27 34.48 28.34 1.91 3.51 2.32 49.00 13.411-D-END 10/05/83 65.86 56.30 16.75
1-0-01 02/02/84 8.43 35.37 38.31 18.83 0.22 1.46 0.45 2.00 0.06
1-D-02 02/02/84 38.16 35.57 34.37 79.36 1.11 3.84 1.30 11.20 1.551-0-03 02/02/84 34.52 35.63 34.86 38.78 0.99 3.24 0.89 16.70 2.94.1-0-04 02/02/84 72.71 35.62 34.95 28.81 2.08 6.06 2.52 24.00 5.661-0-05 02/02/84 84.75 35.28 35.16 39.46 2.41 4.83 2.15 29.30 8.561-D-06 02/02/84 76.27 35.43 35.31 32.02 2.16 4.52 2.38 36.60 12.641-0-07 02/02/84 57.21 35.58 35.31 39.77 1.62 3.70 1.44 41.90 15.10
1-0-08 02/02/84 23.79 35.30 36.04 35.91 0.66 1.39 0.66 49.00 17.091-D-END 02/02/84 23.79 56.30 18.30
1-0-01 03/23/84 26.59 35.59 36.42 36.13 0.73 1.78 0.74 2.00 0.181-0-02 03/23/84 21.74 35.48 37.48 37.19 0.58 1.90 0.58 11.20 1.73
1-D-03 03/23/84 17.46 35.61 35.63 47.15 -0.49 1.15 0.36 16.70 2.481-D-04 03/23/84 71.24 45.05 15.76 23.43 4.52 7.47 3.04 24.00 4.731-0-05 03/23/84 134.70 35.58 36.11 42.07 3.73 6.50 3.20 29.30 8.521-D-06 03/23/84 91.11 35.70 36.29 38.89 2.51 5.60 2.34 36.60 14.241-0-07 03/23/84 49.83 35.47 35.59 39.18 1.40 3.59 1.27 41.90 16.83
1-D-08 03/23184 14.39 35.47 37.86 27.04 0.38 1.9 t 53 49.00 18.421-0-END 03/23/84 71.24 56.30 20M59
1-0-01 04/05/84 26.73 35.24 35.17 35.00 0.76 1.95 0.76 2.00 0.19
1-0-02 04/05/84 43.09 35.59 35.31 40.61 1.22 3.53 1.06 11.20 2.42
1-0-03 04/05/84 0.00 35.64 35.71 2.32 -0.25 1.18 0.00 16.70 3.241-0-04 04/05/84 97.08 35.34 33.24 46.17 2.92 8.97 2.10 24.00 5.701-0-05 04/05/84 129.23 35.26 35.50 39.54 3.64 6.35 3.27 29.30 9.861-0-06 04/05/84 97.39 35.66 36.33 38.30 2.68 !.38 2.54 36.60 15.601-0-07 04/05/84 48.88 35.72 35.94 38.38 1.36 3.36 1.27 41.90 18.29
1-0-08 04/05/84 28.46 9.81 9.95 12.17 2.86 4.29 2.34 49.00 20.20
1-0-END 04105/84 28.46 56.30 21.65
1-0-01 04/25/84 23.66 35.52 35.84 35.86 0.66 1.63 0.66 2.00 0.161-D-02 04/25/84 50.06 34.82 34.76 39.79 1.44 3.47 1.26 11.20 2.521-0-03 04125/814 0.00 35.38 23.35 37.00 -0.14 1.13 0.00 16.70 3.48
D23Appendix D Ephemeral Gully Data

EPHEMERAL GULLIES
SITE-i, GULLY-D. CYCLE-2
TOP NEAN WETTED MEAN MAX HYDRAULIC CUMMULATIVE CUM.ULATIVEGULLY AREA WIDTH WIDTH PERIMETER DEPTH DEPTH RADIUS LENGTH VOLUMESTATION DATE (Sq. In.) (In.) (In.) (In.) (In.) (in.) (in.) (Ft.) (Cubic Ft.)-- -- - -- - - - - - - - - - - -...... - - - - - - --.... ..- - - - --..... .. .. . . . .. . .. .. . .. .. . .. .. .. . .. .. . .. .. . .. .. . .. .. .
1-0-04 04/25/84 70.71 14.73 14.63 26.49 4.83 9.52 2.67 24.00 5.271-0-05 04/25/84 122.88 35.35 35.41 40.66 3.47 5.66 3.02 29.30 8.83I-D-06 04/25/84 101.53 34.96 34.65 37.59 2.93 5.46 2.70 36.60 14.521-D-07 04/25/84 53.25 35.30 35.26 38.34 1.51 3.28 1.39 41.90 17.371-D-08 04/25/84 20.56 35.89 37.38 24.52 0.55 1.63 0.84 49.00 19.191-D-END 04/25/84 20.56 56.30 20.23
I-0-01 05/03/84 40.35 34.88 34.78 35.91 1.16 2.10 1.12 2.00 0.281-0-02 05/03/84 42.78 33.68 33.42 37.86 1.28 3.23 1.13 11.20 2.931-0-03 05/03/84 20.10 10.43 11.10 13.75 1.81 3.00 1.46 16.70 4.141-D-04 05/03/84 77.28 13.77 15.36 28.31 5.03 9.57 2.73 24.00 6.611-0-05 05/03/84 143.12 35.13 35.33 42.13 4.05 6.32 3.40 29.30 10.661-0-06 05/03/84 118.03 23.23 23.79 28.40 4.96 8.01 4.16 36.60 17.291-0-07 05/03/84 43.45 35.58 36.51 37.22 1.19 3.21 1.17 41.90 20.261-0-08 05/03/84 35.46 19.53 19.16 18.97 1.85 2.99 1.87 49.00 22.201-D-END 05/03/84 35.46 56.30 24.00
D24 Appendix D Ephemeral Gully Data

EPHEMERAL GULLIES
SITE-2, GULLY-A, CYCLE-2
TOP MEAN , WETTED MEAR MAX HYDRAULIC C'UMJLATIVE CUMNULATIVE
GULLY AREA WIOTH WIDTH PERIMETER DEPTH DEPTH RADIUS LENGTH VOLUL4E
STATION DATE (Sq. In.) (In.) (In.) (In.) (In.) (In.) (in.) (Ft.) (Cubic Ft.)
..-.........--------- ..........------- -- -------------------..... .....................-..........
2-A-01 01/20184 47.02 34.71 35.89 37.74 1.31 2.60 1.25 0.00 0.00
2-A-02 01/20/84 14.55 6.35 5,36 15.85 2.71 5.40 0.92 7.60 1.63
2-A-03 01/20/84 87.25 19.93 21.70 24.64 4.02 5.92 3.54 24.20 7.49
2-A-04 01/20/84 108.66 26.91 27.57 31.73 3.94 6.43 3.42 30.30 11.65
2-A-05 01/20/84 90.34 31.08 30.72 34.64 2.94 5.95 2.61 37.30 16.48
2-A-06 01/20/84 77.20 26.72 27.18 30.09 2.84 5.05 2.57 44.40 20.61
2-A-07 01/20/84 56.54 29.44 28.99 32.46 1.95 3.50 1.74 50.70 23.54
2-A-08 01/20/84 71.24 35.06 35.79 36.99 1.99 3.01 1.93 57.80 26.69
2-A-09 01/20/84 15.78 35.20 35.86 36.74 0.44 1.10 0.43 64.10 28.60
2-A-10 01/20/84 21.39 8.85 9.02 13.46 2.37 4.16 1.59 89.10 31.83
2-A-11 01/20/84 38.54 20.25 20.50 23.22 1.88 3.93 1.66 93.60 32.77
2-A-12 01/20/84 35.76 17.87 17.96 21.74 1.99 4.67 1.64 97.80 33.86
2-A-13 01/20/84 49.60 29.71 29.34 32.10 1.69 3.01 1.55 104.70 35.90
2-A-14 01/20/84 101.12 31.94 30.36 40.62 3.33 7.67 2.49 112.20 39.82
2-A-15 01/20/84 107.60 33.33 33.62 37.48 3.20 5.38 2.87 120.90 46.12
2-A-16 01/20/84 102.06 35.32 36.06 37.80 2.83 4.41 2.70 126.60 50.27
2-A-17 01/20/84 81.58 31.24 31.49 33.80 2.59 4.03 2.41 131.80 53.59
2-A-18 01/20/84 73.77 25.60 24.92 28.53 2.96 4.89 2.59 139.70 57.85
2-A-END 01/20/84 73.77 141.50 58.77
2-A-01 03/23/84 59.08 35.47 35.80 37.05 1.65 2.64 1.59 0.00 0.00
2-A-02 03/23/84 65.53 35.55 33.77 48.72 1.94 6.11 1.35 7.60 3.29
2-A-03 03/23/84 145.37 35.47 35.62 42.00 4.08 7.96 3.46 24.20 15.45
2-A-04 03/23/84 121.01 35.47 37.11 33.60 3.26 5.98 3.60 30.30 21.09
2-A-05 03/23/84 106.50 35.77 36.59 35.16 2.91 6.03 3.03 37.30 26,62
2-A-06 03/23/84 77.17 24.54 24.81 27.10 3.11 4.55 2.85 44.40 31.15
2-A-07 03/23/84 37.53 35.25 36.79 28.65 1.02 1.97 1.31 50.70 33.66
Z-A-08 03/23/84 32.46 35.26 36.06 35.88 0.90 1.62 0.90 57.80 35.38
2-A-09 03/23/84 0.81 35.50 40.50 14.14 0.02 0.92 0.06 64.10 36.11
2-A-10 03/23/84 58.06 35.57 36.28 38.57 1.60 3.73 1.51 89.10 41.22
2-A-1I 03/23/84 44.03 14.21 14.48 16.60 3.04 4.95 2.65 93.60 42.82
2-A-12 03/23/84 27.65 35.67 34.99 29.18 0.79 3.93 0.95 97.80 43.87
2-A-13 03/23/84 91.02 35.62 36.55 31.03 2.49 5.94 2.93 104.70 46.71
2-A-14 03/23/84 62.01 12.74 14.15 21.89 4.38 5.81 2.83 112.20 50.69
2-A-15 03/23/84 132.03 35.52 35.20 32.99 3.75 6.16 4.00 120.90 56.56
2-A-16 03/23/84 64.02 35.40 35.76 28.45 1.79 3.39 2.25 126.60 60.44
2-A-17 03/23/84 91.39 35.45 35.42 36.98 2.58 4.10 2.47 131.80 63,25
2-A-18 03/23/84 73.76 35.38 35.80 36.07 2.06 4.49 2.04 139.70 67.78
2-A-END 03/23/84 73.76 141.50 68.70
2-A-01 04/05/84 51.78 35.12 35.71 36.55 1.45 2.21 1.42 0.00 0.00
2-A-02 04/05/84 74.78 35.49 37.20 46.98 2.01 5.60 1.59 7.60 3.34
2-A-03 04/05/84 135.81 35.64 36.60 48.50 3.71 7.60 2.80 24.20 15.47
D25Appendix ) Ephemeral Gully Data

EPHEMERAL GULLIES
SITE-2, GULLY-A, CYCLE-2
TOP MEAN WETTED MEAN MAX HYDRAULIC CUMULATIVE CUMMJLATIVEGULLY AREA WIDTH WIDTH PERIMETER DEPTH DEPTH RADIUS LENGTH VOLUMESTATION DATE (Sq. In.) (In.) (In.) (In.) (In.) (in.) (In.) (Ft.) (Cubic Ft.)
2-A-04 04/05/84 102.90 35.77 37.55 30.50 2.74 5.11 3.37 30.30 20.532-A-05 04/05/84 75.90 35.15 36.14 34.46 2.10 4.92 2.20 37.30 24.882-A-06 04/05/84 73.75 35.37 37.06 33.22 1.99 3.63 2.22 "4.40 28.572-A-07 04/05/84 28.60 35.66 36.66 29.23 0.78 1.36 0.98 50.70 30.812-A-08 04/05/84 15.97 35.33 36.29 35.67 0."4 0.86 0.45 57.80 31.912-A-09 04/05/84 7.17 34.82 35.84 34.99 0.20 0.50 0.20 64.10 32.412-A-10 04/05/84 50.59 35.17 36.92 37.71 1.37 3.58 1.34 89.10 37.432-A-11 04/05/84 47.51 16.64 16.49 20.30 2.88 4.59 2.34 93.60 38.962-A-12 04/05/84 45.34 35.48 35.14 30.63 1.29 4.44 1.48 97.80 40.312-A-13 04/05/84 93.56 35.31 35.70 31.32 2.62 5.83 2.99 104.70 43.642-A-14 04/05/84 162.87 35.67 36.19 40.60 4.50 8.53 4.01 112.20 50.322-A-15 04/05/84 106.77 36.21 38.26 31.42 2.79 4.93 3.40 120.90 58.462-A-16 04/05/84 87.28 35.30 35.19 42.20 2.48 4.31 2.07 126.60 62.302-A-17 04/05/84 78.51 35.69 36.34 38.01 2.16 3.82 2.07 131.80 65.302-A-18 04/05/84 90.11 35.73 35.61 39.05 2.53 5.41 2.31 139.70 69.922-A-END 04/05/84 90.11 141.50 71.05
D26 Appendix D Ephemeral Gully Data

EPHEMERAL GULLIES
SITE-2, GULLY-6, CYCLE-2
TOP MEAN WETTED 1lEAR MAX HYDRAULIC CUM.JLATIVE CJMMULATIVE
GULLY AREA WIDTH WIDTH PERIMETER DEPTH DEPTH RADIUS LENGTH VOLUME
STATION DATE (Sq. In.) (In.) (In.) (In.) (In.) (in.) (In.) (Ft.) (Cubic Ft.)
2-9-01 02/02/84 16.67 34.72 36.23 38.12 0.46 1.67 O., 0.00 0.00
2-9-02 02/02/84 32.97 34.38 35.07 27.86 0.94 1.92 1.18 5.00 0.86
2-0-03 02/02/84 9.29 13.61 13.66 12.94 0.68 1.07 0.72 19.50 2.99
2-B-04 02/02/84 42.12 26.32 26.65 27.62 1.58 2.96 1.52 24.70 3.92
2-0-05 02/02/84 16.32 19.16 19.20 19.68 0.85 1.86 0.83 31.20 5.24
2-B-06 02/02/84 41.27 16.01 16.57 21.88 2.49 4.87 1.89 43.40 7.68
2-S-07 02/02/84 47.07 21.43 21.29 24.76 2.21 4.61 1.90 47.70 9.00
2-6-08 02/02/84 21.26 9.82 9.98 10.93 2.13 3.46 1.95 51.60 9.92
2-8-09 02/02/84 81.84 28.93 29.22 28.26 2.80 4.37 2.90 59.00 12.57
2-0-10 02/02/84 36.65 35.40 35.93 36.50 1.02 2.13 1.00 70.50 17.31
2-6-11 02/02/84 52.12 18.92 18.88 22.38 2.76 4.32 2.33 50.80 20.48
2-0-12 02/02/84 57.24 21.86 22.01 25.70 2.60 4.53 2.23 87.40 22.99
2-0-13 02/02/84 89.67 29.09 29.11 35.06 3.08 4.83 2.56 96.00 27.38
2-6-15 02/02/84 34.66 12.10 12.46 15.61 2.78 3.97 2.22 108.40 29.46
2-6-16 02/02/84 125.64 34.76 35.39 39.72 3.55 7.04 3.16 114.90 33.08
2-9-17 02/02/84 77.14 25.58 25.97 30.42 2.97 4.96 2.54 120.90 37.30
2-9-END 02/02/84 77.14 125.10 39.55
2-9-01 03/23/84 20.50 35.50 35.96 37.00 0.57 1.46 0.55 0.00 0.00
2-9-02 03/23/84 33.00 35.50 35.10 48.00 0.94 2.28 0.69 5.00 0.93
2-0-03 03/23/84 25.56 35.18 35.01 23.75 0.73 1.68 1.08 19.50 3.87
2-0-04 03/23/84 41.40 35.31 35.68 35.37 1.16 2.29 1.17 24.70 5.08
2-B-05 03/23/84 19.71 35.28 35.83 36.25 0.55 1.60 0.54 31.20 6.46
2-0-06 03/23/84 90.12 35.61 34.13 40.77 2.64 6.55 2.21 43.40 11.11
2-6-07 03/23/84 80.37 35.51 34.49 42.24 2.33 6.83 1.90 47.70 13.66
2-9-08 03/23/84 94.21 35.27 35.41 33.27 2.66 6.32 2.83 51.60 16.02
2-6-09 03/23/84 96.41 35.41 35.84 38.12 2.69 4.74 2.53 59.00 20.92
2-8-10 03123/84 42.96 35.42 35.79 33.73 1.20 2.16 1.27 70.50 26.48
2-B-1i 03/23/84 61.51 19.00 19.04 20.06 3.17 4.46 3.07 80.80 30.22
2-B-12 03/23/84 65.32 35.32 36.49 38.57 1.79 4.52 1.69 87.40 33.12
2-0-13 03/23/84 115.38 35.34 35.61 36.66 3.24 7.30 3.15 96.00 38.52
2-6-14 03/23/84 3.45 35.85 31.36 30.83 0.11 3.96 0.11 103.60 41.66
2-8-15 03/23/84 136.00 35.54 35.60 41.36 3.82 9.17 3.29 108.40 43.98
2-9-15 03/23/84 136.00 35.54 35.60 41.36 3.82 9.17 3.29 108.40 48.51
2-9-16 03/23/84 151.95 35.69 36.17 42.25 4.20 7,84 3.60 114.90 55.01
2-0-17 03/23/84 90.93 35.36 35.38 37.99 2.57 5.30 2.39 120.90 60.07
2-9-END 03/23/84 90.93 125.10 62.72
2-0-01 04/05/84 22.81 35.35 35.6" 35.50 0.6, 1.52 0.64 0.00 0.00
2-6-02 04/05/84 21.24 33.41 34.25 34.25 0.62 1.64 0.62 5.00 0.76
2-9-03 04/05/84 6.15 35.01 30.74 34.62 0.20 1.36 0.18 19.50 2.14
2-6-04 04/05/84 30.27 34.86 35.61 35.84 0.85 2.09 0.84 24.70 2.80
2-0-05 04/05/84 12.75 34.40 35.41 34.72 0.36 1.21 0.37 31.20 3.77
D27Appendix D Ephemeral Gully Data

EPHEMERAL GULLIES
SITE-2, GULLY-B, CYCLE-2
TOP MEAN WETTED MEAN MAX HYDRAULIC CUIMIULAT;VE CUIMJLATIVEGULLY AREA WIDTH WIDTH PERIMETER DEPTH DEPTH RADIUS LENGTH VOLUMESTATION DATE (Sq. In.) (In.) (In.) (In.) (In.) (In.) (In.) (Ft.) (Cubic Ft.)
2-8-06 04/05/84 81.65 35.52 34.59 40.43 2.36 5.67 2.02 43.40 7.772-8-07 04/05/84 85.71 25.96 26.29 31.70 3.26 6.41 2.70 1,7.70 10.?72-B-08 04/05/84 51.06 18.96 19.63 22.93 2.60 4.00 2.23 51.60 12.122-1-09 04/05/84 81.06 34.79 35.09 37.00 2.31 4.12 2.19 59.00 15.522-3-10 04/05/84 23.17 35.10 35.10 35.61 0.66 1.39 0.65 70.50 19.682-B-11 04/05/84 53.11 18.81 19.10 16.73 2.78 4.36 3.17 80.80 22.412-S-12 04/05/84 56.10 35.63 35.28 38.18 1.59 4.00 1.47 87.40 24.922-8-13 04/05/84 81.86 23.68 24.88 24.84 3.29 5.56 3.30 96.00 29.042-8-14 04/05/84 5.95 36.23 28.33 44.09 0.21 4.01 0.13 103.60 31.352-8-15 04/05/84 109.65 22.91 23.42 27.54 4.68 8.70 3.98 108.40 33.272-8-16 04/05/84 168.62 35.89 36.81 41.57 4.58 8.15 4.06 114.90 39.552-8-17 04/05/84 91.66 35.85 36.08 38.68 2.54 5.48 2.37 120.90 44.982-B-END 04/05/84 91.66 125.10 47.65
D28 Appendix D Ephemeral Gully Data

EPHEMERAL GULLIES
SITE-3, GULLY-A, CYCLE-2
TOP MEAN iWTTED HEAN MAX HYDRAULIC CUIMULATIVE CUARJLATIVE
GULLY AREA WIDTH WIDTH PERIMETER DEPTH DEPTH RADIUS LENGTH VOLUME
STATION DATE (Sq. In.) (in.) (In.) (In.) (in.) (in.) (In.) (ft.) (Cubic Ft.)
-.-.-------........ ..--------- - ........ . ................ . ---------------------------.............
3-A-01 02/03/84 51.34 35.42 36.93 34.84 1.39 2.32 1.47 19.80 3.53
3-A-02 02/03/84 24.27 34.84 33.24 27.61 0.73 4.24 0.88 30.20 6.27
3-A-03 02/03/84 8.40 3.Li 5.02 a.04 1.67 2.59 1.04 39.80 7.
3-A-04 02/03/84 44.4" 35.33 35.56 26.12 1.25 2.51 1.70 55.10 10.17
3-A-05 02/03/84 124.52 35.26 35.47 38.50 3.51 5.41 3.23 68.50 1-0
3-A-06 02/03/84 98.63 35.23 35.60 39.96 2.77 4.62 2.47 78.30 25.63
3-A-07 02103184 50.11 35.11 34.79 35.74 1.44 2.64 1.40 91.70 32.55
3-A-08 02/03/84 42.58 35.27 37.02 31.28 1.15 2.62 1.36 104.50 36.67
3-A-END 02/03/84 42.58 119.00 40.96
3-A-01 03/21/84 35.03 35.87 38.07 33.43 0.92 1.88 1.05 19.80 2.41
3-A-02 03/21184 29.30 11.44 11.62 16.62 2.52 4.91 1.76 30.20 4.72
3-A-03 03/21/84 31.61 9.54 9.60 15.72 3.29 5.12 2.01 39.80 6.76
3-A-04 03/21/84 33.78 34.93 35.18 23.31 0.96 1.85 1.45 55.10 10.24
3-A-05 03/21/84 91.48 33.51 33.75 36.91 2.71 5.08 2.48 68.50 16.07
3-A-06 03121/84 84.39 34.24 34.44 35.81 2.45 3.61 2.36 78.30 22,05
3-A-0? 03/21/84 32.12 34.50 35.29 32.17 0.91 2.26 1.00 91.70 27.47
3-A-08 03/21/84 29.13 34.32 35.52 31.42 0.82 1.74 0.93 104.50 30.19
3-A-END 03/21/84 29.13 119.00 33.12
D29Appendix D Ephemeral Gully Data

EPHEMERAL GULLIESSITE-3, GULLY-B, CYCLE-2
TOP MEAN WETTED MEAN MAX HYDRAULIC CUMMULATIVE CtMMULATIVEGULLY AREA WIDTH WIDTH PERIMETER DEPTH DEPTH RADIUS LENGTH VOLUMESTATION DATE (Sq. In.) (In.) (In.) (In.) (In.) (In.) (In.) (Ft.) (Cubic Ft.)........................................................ ..........-------.......... ------...........3-B-01 02/03/84 36.27 35.41 35.31 37.57 1.03 3.72 0.97 2.90 0.373-8-02 02103/84 39.83 35.43 35.24 37.50 1.13 3.10 1.06 10.60 2.403-0-03 02/03/84 14.70 11.53 12.14 12.88 1.21 1.56 1.1'. 20.20 4.223-8-04 02/03/84 18.59 35.05 35.07 29.98 0.53 1.19 0.62 28.00 5.123-B-05 02/03/84 42.14 35.49 36.01 22.69 1.17 2.92 1.86 41.80 8.033-8-06 02/03/84 23.29 35.57 35.28 37.88 0.66 2.48 0.61 54.00 10.813-9-07 02/03184 47.62 35.21 35.53 32.61 1.34 2.02 1.46 64 .20 13.323-8-08 02/03/84 53.98 34.94 35.05 35.87 1.54 2.33 1.50 72.90 16.39
3-5-09 02/03/84 27.83 35.28 35.67 35.72 0.78 1.53 0.78 82.80 19.213-B-10 02/03/84 75.22 35.30 36.16 37.00 2.08 3.68 2.03 90.20 21.853-B-11 02/03/84 44.50 35.55 36.77 32.88 1.21 2.25 1.35 99.20 25.593-8-12 02/03/84 39.03 35.64 37.52 36.50 1.04 1.97 1.07 105.50 27.423-B-END 02/03/84 39.03 116.50 30.40
3-B-01 03/21/84 39.07 18.12 18.08 20.21 2.16 4.17 1.93 2.9D 0.393-8-02 03/21/84 37.27 17.03 17.74 19.68 2.10 3.23 1.89 10.60 2.433-9-03 03/21/84 71.65 35.22 36.00 37.36 1.99 3.52 1.92 20.20 6.073-9-04 03/21/84 12.91 34.89 36.88 35.40 0.35 0.98 0.36 28.00 8.363-8-05 03/21/84 39.38 35.41 33.94 20.90 1.16 2.80 1.88 41.80 10.863-8-06 03/21/84 13.35 35.24 33.37 37.50 0.40 1.86 0.36 54.00 13.103-8-07 03/21/84 25.97 34.97 35.09 35.64 0.74 1.97 0.73 64.20 14.493-9-08 03/21/84 51.44 35.81 37.27 34.53 1.38 3.14 1.49 72.90 16.833-8-09 03/21/84 35.66 35.61 35.65 36.22 1.00 2.35 0.98 82.80 19.823-8-10 03/21/84 66.26 35.97 36.20 37.00 1.83 3.39 1.79 90.20 22.443-8-11 03/21/84 33.21 35.29 34.95 32.86 0.95 2.16 1.01 99.20 25.553-8-12 03/21/84 34.67 35.62 35.74 36.54 0.97 1.86 0.95 105.50 27.043-B-END 03/21/84 34.67
116.50 29.69
D30Appendix D Ephemeral Gully Data

EPHEMERAL GULLIESSITE-3, GULLY-C, CYCLE-2
TOP MEAN WETTED MEAN MAX HYDRAULIC CLNUJLATIVE CUMUJLATIVE
GULLY AREA WIDTH WIDTH PERIMETER DEPTH DEPTH RADIUS LENGTH VOLUMESTATION DATE (Sq. In.) (In.) (In.) (In.) (In.) (in.) (In.) (Ft.) (Cubic Ft.).. . .. ........ .-- -- - ....... ... -- - -.o ... o.. --- --- --...... -- -- ..... ..... - - - - --............. . . . . . . . . .
3-C-01 02/03/84 18.13 6.13 6.89 11.75 2.63 4.13 1.54 21.50 1.35
3-C-02 02103/84 58.47 13.30 13.79 20.98 4.24 7.10 2.79 32.40 4.253-C-03 02/03/14 265.56 35.57 36.32 48.85 7.31 10.57 5.4" 46.50 20.12
3-C-END 021Mi& 265.S4 126.50 167.64
3-C-01 03/21/84 22.66 7.03 7.65 13.86 2.96 4.55 1.63 21.50 1.69
3-C-02 03/21/84 97.70 19.91 19.93 27.16 4.90 9.11 3.60 32.40 6.243-C-03 03/21/84 224.24 35.42 36.22 47.04 6.19 10.07 4.77 46.50 22ý00
3-C-END 03/21/84 224.24 126.50 146.56
D31Appendix 0 Ephemeral Gully Data

EPHEMERAL GULLIESSITE-3, GULLY-D, CYCLE-2
TOP MEAN WETTED MEAN MAX HYDRAUL I C CUIMULATIVE CUI4MULATIVEGULLY AREA WIDTH WIDTH PERIMETER DEPTH DEPTH RADIUS LENGTH VOLUM4ESTATION DATE (Sq. in.) (in.) (in.) (In.) (in.) (In.) (In.) (Ft.) (Cubic Ft.)
.........-----.---- .-------...................................................................3-0-01 02/03/84 43.27 35.41 35.46 32.02 1.22 3.91 1.35 9.50 1.433-D-02 02/03/84 16.24 7.08 7.88 9.17 2.06 2.98 1.77 18.80 3.353-0-03 02/03/84 36.39 13.39 13.62 17.83 2.67 4.33 2.04 25.90 4.643-0-04 02/03/84 25.04 14.44 14.55 15.74 1.?2 2.52 1.59 32.40 6.033-0-OS 02/03/84 36.52 13.67 14.04 16.56 2.60 4.49 2.17 48.10 9.393-0-06 02/03/84 9.60 10.32 10.78 37.00 0.89 1.25 0.26 57.00 10.823-0-07 02/03/84 13.37 13.43 13.64 11.35 0.98 1.79 1.18 67.30 11.643-0-08 02/03/84 83.32 35.72 36.06 30.27 2.31 4.84 2.75 78.50 15.413-D-10 02/03/84 29.78 35.53 35.45 36.25 0.84 2.54 0.82 93.30 18.713-D-11 02/03184 18.00 35.27 36.00 37.70 0.05 1.30 0.48 100.00 19.823-D-END 02/03/84 18.00 101.00 19.95
3-D-01 03/21/84 28.48 10.40 10.87 14.61 2.62 3.72 1.95 9.50 0.943-0-02 03/21/84 35.22 13.87 13.86 17.93 2.54 5.25 1.96 18.80 3.003-D-03 03/21/84 58.78 19.84 20.62 21.14 2.85 5.02 2.78 25.90 5.323-o-04 03/21/84 31.73 18.13 18.55 19.40 1.71 2.94 1.64 32.40 7.363-0-05 03/21/84 57.60 15.43 16.74 23.07 3.44 6.04 2.50 48.10 12.233-D-06 03/21/84 63.38 34.93 35.80 38.50 1.77 3.20 1.65 57.00 15.963-0-08 03/21/84 83.67 35.78 35.90 38.37 2.33 5.31 2.18 78.50 21.683-0-09 03/21/84 52.44 35.73 37.19 36.66 1.41 2.94 1.43 84.90 24.713-D-10 03/21/84 2.82 35.32 47.00 35.88 0.06 1.06 0.08 93.30 26.323-0-11 03/21/84 1.07 35.53 35.66 36.16 0.03 0.78 0.03 100.00 26.413-0-END 03/21/84 1.07 101.00 26.42
D32 Appendix D Ephemeral Gully Data

EPHEMERAL GULLIES
SITE-3, GULLY-E, CYCLE-2
TOP MEAN WETTED MEAN MAX HYDRAULIC CI'9,ULATIVE CMULN.ATIVE
GULLY AREA WIDTH WIDTH PERIMETER DEPTH DEPTH RADIUS LENGTH VOLUM4E
STATION DATE (Sq. In.) (in.) (In.) (In.) (In.) (In.) (In.) (Ft.) (Cub"ic ft.)--. -- ----.... .... . ... .... . .... .. .... .. -- - -- -... ... - - - - - - --....... .... . . .. . . . .. .. .. .. . .. .. .. .. .
3-E-01 02/03/84 7.16 35.57 35.79 20.77 0.20 1.26 0.34 5.50 0.14
3-E-02 02/03/84 30.95 35.36 34.38 37.50 0.90 3.55 0.83 16.80 1.63
3-E-03 02/03/84 66.02 35.67 35.68 35.14 1.85 3.16 1.88 23.70 3.96
3-E-04 02/03/84 105.89 35.67 35.41 38.21 2.99 4.73 2.77 41.00 14.28
3-E-O5 02/03/84 111.82 35.32 34.83 3Y.31 3.21 6.03 2.84 55.50 25.24
3-E-06 02/03/84 68.50 35.53 35.67 36.79 1.92 3.37 1.86 64.80 31.06
3-E-07 02/03/84 56.02 35.54 35.91 36.31 1.56 2.86 1.54 74.70 35.35
3-E-END 02/03/84 56.02 97.80 39.31
3-E-01 03/21/84 0.00 34.21 34.38 34.59 -0.27 0.30 0.00 5.50 0.00
3-E-02 03/21/84 47.87 18.14 18.13 19.92 2.64 4.24 2.40 16.80 1.88
3-E-03 03/21/84 47.09 34.86 35.14 36.38 1.34 1.84 1.29 23.70 4.15
3-E-01 03/21/84 79.21 35.22 37.36 1.1.99 2.12 4.41 1.89 41.00 11.74
3-E-05 03/21/84 124.24 35.26 34.141 36.86 3.61 6.23 3.37 55.50 21.98
3-E-06 03/21/84 66.85 35.25 35.37 35.83 1.89 3.10 1.87 64.80 28.15
3-E-07 03/21/84 24.25 35.76 35.14 36.50 0.69 2.10 0.66 74.70 31.28
3-E-08 03/21/84 103.71 35.02 35.51 38.65 2.92 5.96 2.68 87.60 37.01
3-E-END 03/21/84 103.71 97.80 44.35
D33Appendix D Ephemeral Gully Data

EPHEMERAL GULLIES
SITE-4, GULLY-A, CYCLE-2
TOP MEAN WETTED MEAR MAX HYDRAULIC CUMMULATIVE CUMULATIVEGULLY AREA WIDTH WIDTH PERIMETER DEPTH DEPTH RADIUS LENGTH VOLUMESTATION DATE (Sq. In.) (in.) (In.) (In.) (In.) (In.) (In.) (Ft.) (Cubic Ft.)
4-A-01 01/05/84 4.99 34.55 35.64 35.50 0.14 1.35 0.14 0.00 0.004-A-02 01/05/84 59.66 18.43 19.00 22.00 3.14 5.19 2.71 8.00 1.804-A-03 01/05/84 66.02 24.92 24.72 27.33 2.67 4.14 2.42 19.00 6.594-A-04 01/05/84 21.36 34.20 36.82 36.99 0.58 2.28 0.58 28.00 9.324-A-OS 01/05/84 66.40 33.93 34.05 33.09 1.95 3.90 2.01 35.00 11.454-A-06 01/05/84 75.08 32.36 31.54 45.83 2.38 7.72 1.64 45.00 16.364-A-07 01/05/84 44.21 33.74 33.49 35.50 1.32 3.29 1.25 58.00 21.744-A-08 01/05/84 71.59 34.49 34.25 36.26 2.09 4.62 1.97 68.00 25.764-A-09 01/05/84 24.13 33.56 33.05 30.84 0.73 2.39 0.78 78.00 29.094-A-10 01/05/84 14.93 33.80 32.45 30.49 0.46 1.15 0.49 89.00 30.584-A-11 01/05/84 4.96 34.85 35.42 35.85 0.14 0.69 0.14 98.00 31.20
4-A-END 01/05/84 4.96 116.00 31.82
4-A-01 02/03/84 8.61 34.93 33.11 35.69 0.26 1.55 0.24 0.00 0.004-A-02 02/03/84 95.58 35.41 35.13 27.69 2.72 7.16 3.45 8.00 2.90
4-A-03 02/03/84 90.49 35.51 35.48 29.69 2.55 5.83 3.05 19.00 10.004-A-04 02/03/84 13.42 34.92 33.54 22.48 0.40 2.32 0.60 28.00 13.25
4-A-05 02/03/84 88.37 35.12 33.72 39.25 2.62 6.11 2.25 35.00 15.724-A-06 02/03/84 78.61 35.36 36.39 31.58 2.16 7.38 2.49 45.00 21.524-A-07 02/03/84 81.37 35.41 33.76 34.94 2.41 5.60 2.33 58.00 28.744-A-08 02/03/84 31.02 35.77 36.92 39.95 0.84 3.78 0.78 68.00 32.644-A-09 02/03/84 16.80 35.31 34.28 35.55 0.49 2.03 0.47 78.00 34.30
4-A-10 02/03/84 7.41 35.35 32.21 38.75 0.23 1.27 0.19 89.00 35.234-A-11 02/03/84 0.00 35.62 36.34 36.50 -0.23 0.76 0.00 98.00 35.464-A-END 02/03/84 0.00 116.00 35.46
4-A-01 03/16/84 27.00 34.69 35.06 35.53 0.77 2.60 0.76 0.00 0.004-A-02 03/16/84 114.58 19.35 20.42 28.76 5.61 0.13 3.98 8.00 3.944-A-03 03/16/84 67.72 22.28 22.40 40.00 3.01 4.04 1.69 19.00 10.904-A-04 03/16/84 20.94 35.36 34.89 23.60 0.60 2.29 0.89 28.00 13.674-A-05 03/16/84 37.01 32.84 32.71 37.50 2.66 6.52 2.32 35.00 16.294-A-06 03/16/84 137.71 21.79 22.53 31.67 6.11 9.35 4.35 45.00 24.094-A-07 03/16/84 96.62 34.86 34.02 39.39 2.84 5.93 2.45 58.00 34.664-A-08 03/16/84 44.97 35.02 35.40 39.00 1.27 3.95 1.15 68.00 39.584-A-09 03/16/84 20.05 34.67 35.17 35.50 0.57 2.17 0.56 78.00 41.834-A-10 03/16/84 28.26 34.54 34.88 35.91 0.81 1.74 0.79 89.00 43.684-A-11 03/16/84 0.00 35.03 34.64 36.13 -0.14 0.84 0.00 98.00 44.564-A-END 03/16/84 0.00 116.00 44.56
4-A-01 04/06/84 25.64 35.09 36.11 35.86 0.71 2.26 0.72 O.nO 0.004-A-02 04/06/84 112.62 20.46 20.66 30.65 5.45 8.66 3.67 8.00 3.844-A-03 04/06/84 105.66 35.35 35.33 31.77 2.99 6.62 3.33 19.00 12.184-A-04 04/06/84 19.10 35.85 36.73 36.90 0.52 2.01 0.52 28.00 16.08
D34 Appendix D Ephemeral Gully Data

EPHEMERAL GULLIESSITE-4, GULLY-A, CYCLE-2
TOP MEAN WETTED MEAN MAX HYDRAULIC CUK14ULATIVE CUIJULATIVEGULLY AREA WIDTH WIDTH PERIMETER DEPTH DEPTH RADIUS LENGTH VOLUMESTATI0 DATE (Sq. In.) (in.) (In.) (in.) (In.) (In.) (In.) (Ft.) (Cubic ft.)
4-A-05 04/06/84 104.58 35.94 36.18 24.00 2.89 6.75 4.36 35.00 19.094-A-06 04/06/84 121.84 35.79 35.11 35.71 3.47 8.28 3.41 45.00 26.954-A-07 04/06/84 123.87 36.04 36.53 38.15 38.15 3.39 3.25 58.00 38.034-A-08 04/06/84 29.23 36.12 39.49 34.61 6.56 3.23 0.84 68.00 43.354-A-09 04/06/84 27.49 35.81 34.79 37.32 0.79 2.76 0.74 78.00 45.324-A-10 04/06/84 20.98 35.69 36.17 35.00 0.58 1.18 0.60 89.00 47.174-A-11 04/06/84 1.19 35.67 39.66 34.00 0.03 0.89 0.03 98.00 47.874-A-ENO 04/06/84 1.19 116.00 48.01
4-A-01 04/27/84 22.42 36.06 36.16 36.99 0.62 2.10 0.61 0.00 0.004-A-02 04/27/84 122.56 22.40 22.82 31.71 5.37 9.81 3.87 8.00 4.034-A-03 04/27/84 98.29 35.88 36.00 30.23 2.73 5.87 3.25 19.00 12.464-A-04 04/27/84 23.03 35.67 35.43 34.93 0.65 2.01 0.66 28.00 16.264-A-05 04/27/84 109.83 35.98 36.00 32.00 3.05 6.80 3.43 35.00 19.494-A-06 04/27/84 103.50 18.73 18.95 23.10 5.46 7.22 4.48 45.00 26.904-A-07 04/27/84 72.14 19.23 19.81 19.98 3.64 5.36 3.61 58.00 34.83
4-A-08 04/27/84 41.97 36.25 36.81 39.35 1.14 3.31 1.07 68.00 38.794-A-09 04/27/84 28.67 35.80 36.29 37.54 0.79 3.07 0.76 78.00 41.244-A-10 04/27/84 23.50 35.97 36.,5 37.10 0.65 1.44 0.63 89.00 43.234-A-11 04/27/94 2.71 36.05 38.71 36.74 0.07 1.00 0.07 98.00 44.05
4-A-END 04/27(84 2.71 116.00 44.39
4-A-01 05/08/84 10.00 11.33 11.76 10.86 0.85 1.30 0.92 0.00 0.004-A-02 05/08/84 103.57 18.01 19.39 26.25 5.34 8.70 3.95 8.00 3.154-A-03 05/08/84 107.34 34.80 35.30 30.83 3.04 6.56 3.48 19.00 11.204-A-04 05/08/84 20.19 35.59 34.81 36.65 0.58 2.07 0.55 28.00 15.194-A-05 05/08/84 102.65 26.58 27.22 32.03 3.77 6.94 3.20 35.00 18.174-A-06 05/08/84 131.23 21.90 22.66 31.96 5.79 8.89 4.11 45.00 26.294-A-07 05/08/84 112.21 35.54 36.91 33.23 3.04 6.68 3.38 58.00 37.284-A-08 05/08/84 58.45 35.32 36.99 39.38 1.58 3.55 1.48 68.00 43.204-A-09 05/08/84 26.21 34.52 33.60 35.94 0.78 2.83 0.73 78.00 46.144-A-10 05/08/84 18.86 35.66 34.92 36.35 0.54 1.14 0.52 89.00 47.864-A-11 05/08/84 4.72 35.85 39.33 36.34 0.12 1.01 0.13 98.00 48.60
4-A-END 05/08/84 4.72 116.00 49.20
Appendix 0 Ephemeral Gully Data D35

EPHEMERfL V'LLIE$SITE-4, GULLV-B, CYCLE-2
TOP MEAN WETTED MEAN MAX HYDRAULIC CUMMOJLATIVE CUMMULATIVE
GULLY AREA WIDTH WIDTH PERIMETER DEPTH DEPTH RADIUS LENGTH VOLUME
STATION DATE (Sq. In.) (In.) (In.) (In.) (In.) (In.) (in.) (Ft.) (Cubic Ft.)
4-8-01 01/05/8 40.01 31.62 31.01 33.63 1.29 2.59 1.19 0.00 0.00
4-B-02 01/05/84 36.01 35.26 34.62 37.45 1.04 3.63 0.96 8.00 2.11
4-9-03 01/05/84 14.26 35.21 37.52 36.80 0.38 1.79 0.39 16.00 3.51
4-9-04 01/05/84 18.92 35.31 34.40 31.09 0.55 1.93 0.61 25.00 4.54
4-9-05 01/05/B4 92.91 35.04 34.79 37.57 2.67 7.04 2.47 33.00 7.65
4-0-06 01/05/84 75.31 35.61 35.35 27.80 2.15 5.88 2.71 40.00 11J74
4-6-07 011/05/BA 64.60 35.27 35.69 37,18 1.81 4.25 1.74 48.00 15.62
4-8-08 01/05/84 70.40 35.60 35.02 26.06 2.01 5.51 2.7C 56.00 19.38
4-8-09 01/05/84 7.44 35.09 37.20 26.57 0.20 0.72 0.28 64.00 21.54
4-8-10 01/05/84 22.08 35.27 33.96 16.87 0.65 2.06 1.31 73.00 22.46
4-9-11 01/05/84 35.34 35.23 37.99 24.22 0.93 2.48 1.46 82.00 24.25
4-B-12 01105/84 72.74 35.55 33.83 35.18 2.15 5.97 2.07 88.00 26.50
4-8-13 01/05184 112.40 34.62 34.06 43.27 3.30 6.91 2.60 94.00 30.36
4-B-14 01/05/84 118.90 35.28 35.49 43.49 3.35 7.85 2.73 105.00 39.20
4-s-15 01/05/B 51.19 35.52 34.82 31.52 1.47 2.93 1.62 114.00 4.4.51
4-9-16 01/05184 152.48 35.37 34.65 44.19 4.40 8.24 3.45 123.00 50.88
4-0-17 01/05/84 111.73 35.86 36.15 41.39 3.09 7.12 2.70 131.00 58.22
4-8-18 01/05/84 70.87 35.44 34.91 25.65 2.03 5.40 2.76 143.00 65.82
4-8-19 01/05/84 56.97 35.59 35.60 37.83 1.60 4.04 1.51 151.00 69.38
6-8-20 01/05/84 53.32 35.29 35.70 36.51 1.49 2.17 1.46 161.00 73.21
4-9-21 01/05/84 50.46 35.61 34.32 38.51 1.47 3.69 1.31 171.00 76.81
4-8-22 01/05;84 57.49 35.25 35.70 37.83 1.61 2.85 1.52 179.00 79.80
4-B-END 01/05/84 57.49 190.00 84.19
4-8-01 02/03/84 33.04 20.84 20.91 20.84 1.58 3.19 1.59 0.00 0.00
4-6-32 02/03/84 47.34 35.50 35.32 36.50 1.34 3.03 1.30 8.00 2.23
4-8-03 MO/03184 12.02 14.22 13.97 11.36 0.86 2.10 1.06 16.0'i 3.88
4-9-04 02/03/84 17.40 13.15 12.98 13.77 1.34 2.14 1.26 25.00 4.80
4-8-05 02/03/B4 57.63 19.74 Z0.43 23.08 2.82 6.25 2.50 33.00 6.88
4-8-06 02/03/BA 94.23 35.47 35.29 39.24 2.67 5.84 2.40 40.00 10.57
4-8-07 02/03/84 78.45 35.65 35.65 29.27 2.20 6.30 2.68 48.00 15.37
4-8-08 02/03/84 49.67 35.66 35.73 24.69 1.39 3.32 2.01 56.00 18.93
4-9-09 02/03/84 0.00 35.43 34.94 45.85 -0.18 0.27 0.00 64.00 20.31
4-9-10 02/03/84 36.89 35.25 34.80 24.48 1.06 3.84 1.51 73.00 21.46
4-9-11 02/03/8 34.60 19.01 18.90 13.91 1.83 3.46 2.49 82.00 23.69
4-9-12 02/03/84 62.76 16.71 16.82 21.78 3.73 6.23 2.-t 88.00 25.72
4-B-13 02/03/8 139.56 35.40 35.33 42.80 3.95 8.10 3.26 94.00 29.93
4-B-14 02/03/8 117.58 24.64 25.61 30.71 4.59 6.35 3.83 105.00 39.76
4-8-15 02/03/8 68.66 35.62 35.57 33.37 1.93 4.37 2.06 114.00 45.58
4-8-16 02/03/8 174.91 75.59 35.84 42.79 4.88 7.73 4.09 123.00 53.19
4-8-17 02/03/84 167.26 35.93 35.96 42.94 4.65 8.92 3.90 131.00 62.70
4-8-18 02/03/84 89.84 35.36 35.50 39.79 2.53 5.03 2.26 143.00 73.42
4-8-19 02/03184 62.32 35.07 35.61 38.18 1.75 3.64 1.63 151.00 77.65
D36 Appendix D Ephemeral Gully Data

EPHEMERAL GULLIESSITE-4, GULLY-B, CYCLE-2
TOP MEAN WETTED MEAN MAX HYDRAUI.IC CUIMULAT IVE CtUMEJLATIVE
GULLY AREA WID"TH WIDTH PERIMETER DEPTH DEPTH RADIUS LENGTH VOLUME
STATION DATE (Sq. in.) (in.) (In.) (In.) (In.) (in.) (In.) (Ft.) (Cubic Ft.)
4-6-20 02/03/84 49.96 35.50 35.68 36.43 1.40 2.59 1.37 161.00 81.554-8-21 02103/84 29.66 35.60 34.89 37.91 0.85 2.89 0.78 171.00 84.31
4-9-22 02/03/84 40.23 35.29 34.98 37.51 1.15 3.44 1.07 179.00 86.25
4-B-END 02/33/84 40.23 190.00 89.32
4-8-01 03/16/84 47.33 35.22 34.05 24.67 1.39 3.45 1.92 0.00 0.004-B-02 03/16/84 41.85 35.38 33.75 36.50 1.24 3.28 1.15 8.00 2.484-B-03 03/16/84 36.90 34.62 36.89 36.70 1.00 3.61 1.01 16.00 4.67
4-8-04 03/16/84 32.66 16.54 17.01 17.35 1.92 2.80 1.88 25.00 6.844-9-05 03/16/84 61.24 15.78 16.07 22.50 3.81 6.23 2.72 33.00 9.454-6-06 03/16/84 123.88 34.95 35.49 42.32 3.49 7.38 2.93 40.00 13.95
4-6-07 03116/84 97.52 34.90 35.46 32.41 2.75 7.21 3.01 48.00 20.09
4-8-08 03/16/84 53.96 33.87 35.26 24.46 1.53 3.71 2.21 56.00 24.304-B-09 03/16/84 4.30 34.45 33.07 27.09 0.13 1.09 0.16 64.00 25.924-5-10 03/16/84 37.92 12.78 13.30 15.30 2.85 4.43 2.48 73.00 27.244-6-11 03/16/84 64.62 22.93 23.49 23.01 2.75 4.73 2.81 82.00 30.45
4-8-12 03/16/84 71.88 35.07 37.24 30.62 1.93 6.40 2.35 88.00 33.294-9-13 03/16/84 158.3i 34.34 35.03 42.90 4.52 8.34 3.69 94.00 38.09
4-8-14 03/16/84 141.68 23.26 25.43 32.95 5.57 6.91 4.30 105.00 49M554-3-15 03116/84 97.9? 34.90 35.65 33.78 2.75 5.57 2.90 114.00 57.044-8-16 03/16/84 215.88 34.75 35.97 44.51 6.00 9.13 4.85 123.00 66.84
4-6-17 03/16/84 169.22 34.76 35.10 43.39 4.52 9.11 3.90 131.00 77.544-6-18 03/16/84 135.31 34.56 35.23 39.80 3.84 6.69 3.40 143.00 90.23
4-8-19 03/16/84 52.42 19.49 20.31 19.22 2.58 4.12 2.73 151.00 95.444-8-20 03/16/84 60.92 33.50 34.41 36.01 1.77 2.75 1.69 161.00 99.38
4-3-21 03/16/84 62.46 34.46 36.31 37.17 1.72 4.,4 1.68 171.00 103.664-3-22 03/16/84 93.53 34.50 34.89 37.86 2.68 3.95 2.47 179.00 108.004-8-END 03/16/84 93.53 190.00 115.15
4-1-01 04/06/84 34.02 35.43 34.71 23.24 0.98 2.99 1.46 0.00 0.004-B-02 04/06/84 37.46 35.26 38.61 36.50 0.97 2.96 1.03 8.00 1.98
4-8-03 04/06/84 23.74 15.52 15.21 14.11 1.56 2.76 1.68 16.00 3.684-8-04 04/06/84 30.18 18.65 18.62 13.73 1.62 2.45 2.20 25.00 5.37
4-S-05 04/06/84 51.28 15.39 15.77 20.19 3.25 5.24 2.51 33.00 7.644-4-06 04/06/84 123.12 36.05 36.64 42.30 3.36 6.77 2.91 40.00 11.874-8-07 04/06/84 113.47 35.51 36.48 32.52 3.11 7.76 3.49 48.00 18.454-6-09 04/06184 19.71 13.36 13.50 14.60 1.46 2.34 1.35 64.00 22.154-6-10 04/06/84 54.33 15.54 16.56 21.21 3.28 5.23 2.56 73.00 24.464-8-11 04/06/84 78.40 35.80 36.12 26.58 2.17 4.84 2.95 82.00 28.60
4-6-13 04/06/84 158.24 27.73 28.51 35.67 5.55 8.46 4.44 94.00 33.53
4-8-14 04106/84 179.89 35.51 36.86 44.98 4.88 8.25 4.00 105.00 46.454-6-15 04/06/84 87.94 28.47 29.31 31.43 3.00 5.16 2.80 114.00 54.824-9-16 04/06/84 213.82 30.63 32.20 39.76 6.64 9.13 5.38 123.00 64.25
Appendix D Ephemeral Gully Data D37

EPHEERAL. GULLI|ES
SITE-'4, GULLY-S, CYCLE-2
TOP MEAN WETTED MEAN MAX HYDRAULIC CUMMILATIVE Ct.IMLATIVEGULLY AREA WIDTH WIOTH PERIMETER DEPTH DEPTH RADIUS LENGTH VOLUMESTATION DATE (Sq. In.) (In.) (in.) (In.) (In.) (In.) (In.) (Fr.) (Ci0'c Ft.)
4-0-17 04/06/84 162.94 35.90 36.12 40.94 4.51 8.15 3.98 131.00 74.72
4-5-18 04/06/84 130.54 35.96 36.26 38.65 3.60 6.53 3.38 143.00 86.954-6-19 04/06/84 65.56 35.14 36.22 30.24 1.81 4.23 2.17 151.00 92.404-0-20 04/06/84 89.65 35.61 36.59 36.00 2.45 3.60 2.49 161.00 97.794-6-21 04/06/84 66.95 36.02 35.99 38.37 1.86 4.57 1.74 171.00 103.234-3-22 04/06/84 86.57 29.39 29.85 31.55 2.90 4.21 2.74 179.00 107.494-B-END 04/06/84 86.57 190.00 114.10
4-8-01 04/27/84 35.13 35.81 34.78 24.08 1.01 2.97 1.46 0.00 0.004-B-02 04127/84 43.25 35.77 35.16 36.74 1.23 2.90 1.18 8.00 2.184-8-03 04/27/84 41.62 35.74 36.19 37.67 1.15 3.47 1.10 16.00 4.534-8-04 04/27/84 0.00 35.69 33.42 36.50 -0.21 1.05 0.00 25.00 5.834-9-05 04/27/84 38.28 12.02 12.71 15.20 3.01 4.50 2.52 33.00 6.904-8-06 04/27/84 114.55 35.76 36.02 41.37 3.18 6.65 2.77 40.00 10.614-3-07 04/27/84 66.97 19.45 19.58 18.40 3.42 5.70 3.64 48.00 15.654-B-08 04/27/84 58.65 25.81 26.53 22.46 2.21 3.59 2.61 56.00 19.144-8-09 04/27/84 9.46 35.72 35.03 36.66 0.27 1.37 0.26 64.00 21.034-9-10 04/27/84 52.24 16.91 17.70 22.42 2.95 5.32 2.33 73.00 22.964-B-11 04/27/84 80.83 35.51 36.24 26.73 2.23 4.90 3.02 82.00 27.124-8-12 04/27/84 87.12 36.05 35.85 29.94 2.43 7.08 2.91 88.00 30.624-9-13 04/27/84 188.43 35.84 36.23 43.16 5.20 8.97 4.37 94.00 36.364-B-14 04/27/84 149.88 24.01 26.02 32.47 5.76 7.93 4.62 105.00 49.284-8-15 04/27/84 89.90 35.62 35.39 32.56 2.54 5.29 2.76 114.00 56.784-8-16 04/27/84 174.95 26.70 28.08 35.97 6.23 8.06 4.86 123.00 65.054-8-17 04/27/84 175.71 36.12 38.61 44.87 4.55 9.73 3.92 131.00 74.794-8-18 04127/84 113.69 35.73 36.55 34.17 3.11 6.26 3.33 143.00 86.854-0-19 04/27/84 62.36 36.07 37.34 29.89 1.67 3.97 2.09 151.00 91.744-B-20 04/27/84 81.93 35.64 35.93 36.99 2.28 3.52 2.21 161.00 96.754-8-21 04/27/84 67.90 35.67 35.73 37.33 1.90 3.62 1.82 171.00 101.964-8-22 04/27/84 83.11 35.66 37.26 34.81 2.23 4.23 2.39 179.00 106.154-B-END 04/27/84 83.11 190.00 112.50
4-8-01 05/08/84 33.72 35.55 34.40 23.12 0.98 3.18 1.46 0.00 0.004-8-02 05/08/84 46.00 35.79 35.38 36.00 1.30 2.98 1.28 8.00 2.214-8-03 05/08/84 34.62 35.42 36.82 37.12 0.94 3.03 0.93 16.00 4.454-9-04 05/08/84 0.00 36.22 36.15 37.00 -0.32 0.90 0.00 25.00 5.534-6-05 05/08/84 53.75 15.41 14.97 20.13 3.59 5.26 2.67 33.00 7.024-1-06 05/08/84 116.12 24.81 25.86 31.29 4.49 7.08 3.71 40.00 11.15
4-8-07 05/08/84 101.06 26.84 27.53 32.30 3.67 7.11 3.13 48.00 17.184-9-08 05/08/84 62.95 24.12 24.30 24.04 2.59 5.38 2.62 56.00 21.734-8-09 05/08/84 6.00 35.80 37.50 36.27 0.16 0.86 0.17 64.00 23.654-8-10 05/08/84 54.94 16.53 17.33 22.07 3.17 4.98 2.49 73.00 25.564-9-11 05/08/84 56.28 22.40 22.60 23.21 2.49 4.16 2.42 82.00 29.04
D38 Appendix D Ephemeral Gully Data

EPHEMERAL GULLIESSITE-4, GULLY-B, CYCLE-2
TOP MEAN WETTED MEAN MAX HYDRAULIC CU04ULATIVE CUMMULATIVEGULLY AREA UIDTH WIDTH PERIMETER DEPTH DEPTH RADIUS LENGTH VOLUMESTATION DATE (Sq. In.) (In.) (In.) (in.) (in.) (In.) (In.) (FT.) (Cubtic Ft.)
4-8-12 05/08184 98.22 28.70 28.58 32.74 3.40 6.86 3.00 88.00 32.264-9-13 05/08/84 178.83 35.71 36.34 43.27 4.92 8.80 4.13 94.00 38.034-6-14 05/06/84 157.29 25.09 27.93 35.51 5.63 7.84 4.43 105.00 50.864-B-15 05/08/84 106.44 35.63 36.32 33.34 2.93 5.83 3.19 114.00 59.104-9-16 05/08/84 232.89 35.81 36.33 " .90 6.41 9.95 5.19 123.00 69.714-9-17 05/08/84 177.20 35.93 36.68 42.77 4.83 9.55 4.14 131.00 81.104-B-18 05/08/84 121.22 35.39 36.07 33.48 3.36 6.73 3.62 143.00 93.544-9-19 05/08/84 69.38 35.67 36.32 29.55 1.91 4.80 2.35 151.00 98.834-B-20 05/08/84 77.44 35.83 36.01 36.97 2.15 3.51 2.09 161.00 105.934-8-21 05/08/84 73.91 35.81 36.58 38.02 2.02 4.80 1.94 171.00 109.194-8-22 05/08/84 $4.69 30.28 31.83 32.25 2.66 4.18 2.63 179.00 113.594-B-END 05/08/84 84.69 190.00 120.06
Appendix D Ephemeral Gully Data D39

EPHEMERAL GULLIESSITE-4, GULLY-C, CYCLE-2
TOP MEAN WdETTED MEAN MAX HYDRAULIC CUMMULATIVE CUMSULATIVE
GULLY AREA WIDTH WIDTH PERIMETER DEPTH DEPTH RADIUS LENGTH VOLUMESTATION DATE (Sq. In.) (In.) (In.) (in.) (In.) (In.) (In.) (Ft.) (Cubic Ft.)-----. ----. -. ------. ......... ... .... ...... .--.------- .-- .--- .---.. .......... ........... ...........-
4-C-01 01/05/84 40.02 35.72 35.73 26.19 1.12 3.41 1.53 0.00 0.00
4-C-02 01/05/84 21.54 35.48 34.74 36.63 0.62 1.82 0.59 7.00 1.504-C-03 01/05/84 13.03 35.53 35.21 21.77 0.37 1.72 0.60 14.00 2.344-C-04 01/05/84 8.34 35.57 36.26 36.33 0.23 1.42 0.23 20.00 2.784-C-05 01/05/84 29.40 35.48 35.85 37.00 0.82 2.26 0.79 29.00 3.964-C-END 01/05/84 29.40 33.00 4.78
4-C-01 02/03/84 44.17 21.54 20.08 21.53 2.00 4.09 2.05 0.00 0.004-C-02 02/03/84 14.44 35.43 37.05 23.58 0.39 1.52 0.61 7.00 1.424-C-03 02/03184 9.61 35.36 34.32 21.07 0.28 1.39 0.46 14.00 2.014-C-04 02/03/84 13.85 35.45 35.51 36.27 0.39 1.24 0.38 20.00 2.504-C-05 02/03/84 44.96 35.41 35.40 34.20 1.27 3.44 1.31 29.00 4.33
4-C-END 02/03/84 44.96 33.00 5.58
4-C-01 03/16/84 41.64 18.81 20.01 20.83 2.08 3.68 2.00 0.00 0.004-C-02 03/16/84 23.87 34.91 32.25 25.50 0.74 3.04 0.94 7.00 1.59
4-C-03 03/16/84 9.51 34.73 35.22 33.26 0.27 1.20 0.29 14.00 2.404-C-04 03116/84 14.22 35.31 35.54 35.87 0.40 1.42 0.40 20.00 2.904-C-05 03/16/84 28.61 34.88 35.32 27.78 0.81 2.32 1.03 29.00 4.244-C-END 03/16/84 28.61 33.00 5.04
4-C-01 04/06/84 42.49 18.96 19.31 22.33 2.20 3.97 1.90 0.00 0.004-C-02 04/06/84 33.94 35.92 36.10 24.39 0.94 3.06 1.39 7.00 1.864-c-03 04/06/84 11.35 13.75 13.84 14.50 0.82 1.95 0.78 14.00 2.964-C-04 04/06/84 14.39 36.16 37.86 36.50 0.38 1.29 0.39 20.00 3.50
4-C-05 04/06/84 32.87 35.68 36.52 18.45 0.90 2.07 1.78 29.00 4.974-C-END 04/06/84 32.87 33.00 5.89
4-C-01 04/27/84 38.86 35.69 35.00 20.21 1.11 3.49 1.92 0.00 0.004-C-02 04/27/84 50.49 35.92 35.30 26.70 1.43 3.30 1.89 7.00 2.174-C-03 04/27/84 16.93 35.43 35.27 36.23 0.48 1.98 0.4? 14.00 3.81
4-C-04 04/27/84 17.50 35.40 36.45 35.98 0.48 1.43 0.49 20.00 4.534-C-05 04/27/84 26.58 35.99 36.41 27.63 0.73 1.68 0.96 29.00 5.924-C-END 04/27/84 26.58 33.00 6.66
4-C-01 05108/84 44.24 19.40 19.92 20.91 2.22 3.66 2.12 0.00 0.004-C-02 05/08/84 38.65 21.67 21.96 23.05 1.76 3.07 1.68 7.00 2.014-C-03 05/08/84 8.35 11.71 11.59 12.27 0.72 1.36 0.68 14.00 3.154-C-04 05/08/84 14.45 16.81 16.80 17.17 0.86 1.45 0.64 20.00 3.63
4-C-05 05/08/84 40.62 35.85 36.59 18.71 1.11 2.03 2.17 29.00 5.354-C-END 05/08/84 40.62 33.00 6.47
D40 Appendix D Ephemeral Gully Data

EPHEMERAL GULLIES
SITE-1, GULLY-A, CYCLE-3
TOP MEAN WETTED EAN MAX HYDRAULIC CUIMULATIVE CLMLATIVE
GULLY AREA WIDTH WIDTH PERIMETER DEPTH DEPTH RADIUS LENGTH VOLUME
STATION DATE (Sq. In.) (In.) (In.) (In.) (in.) (in.) (In.) (Ft.) (CUbic Ft.)
1-A-01 02/21/85 36.18 16.67 16.74 17.78 2.16 4.15 2.03 8.30 1.041-A-02 02/21/85 97.88 23.88 22.92 28.53 4.27 6.96 3.43 19.20 6.121-A-03 02/21/85 83.78 35.22 35.35 34.49 2.37 4.29 2.43 30.90 13.501-A-04 02/21/85 81.04 31.26 31.16 34.77 2.60 3.99 2.33 38.00 17.561-A-05 02/21/85 40.52 18.52 19.66 20.40 2.06 4.40 1.99 48.10 21.83
1-A-06 02/21/85 14.56 16.68 17.12 17.13 0.85 1.65 0.85 57.80 23.681-A-07 02/21/85 5.99 9.97 9.98 10.34 0.60 0.94 0.58 67.00 24.34
1-A-08 02/21/85 90.61 23.87 24.16 29.14 3.75 7.40 3.11 86.30 30.811-A-09 02/21/85 85.06 26.48 26.83 28.55 3.17 6.16 2.98 95.70 36.541-A-10 02/21/85 75.97 32.10 31.78 35.12 2.39 4.44 2.16 109.80 44.431-A-11 02/21/85 74.66 25.48 25.92 27.96 2.88 4.54 2.67 115.00 47.151-A-12 02/21/85 193.09 29.48 30.64 36.45 6.30 11.03 5.30 121.60 53.291-A-13 02/21/85 77.61 35.04 35.60 36.73 2.18 4.27 2.11 130.00 61.181-A-14 02/21/85 74.51 33.17 33.56 34.71 2.22 4.42 2.15 141.20 67.101-A-15 02/21/85 53.11 27.98 28.40 27.60 1.87 3.93 1.92 151.90 71.841-A-END 02/21/85 53.11 163.70 76.19
1-A-01 03/25/85 20.14 11.60 11.70 13.34 1.72 2.92 1.51 8.30 0.581-A-02 03/25/85 103.00 24.51 24.64 29.54 4.18 7.00 3.49 19.20 5.241-A-03 03/25/85 69.44 32.30 32.29 33.63 2.15 3.58 2.06 30.90 12.241-A-04 03/25/85 85.35 35.63 35.86 36.58 2.38 4.25 2.33 38.00 16.061-A-05 03/25/85 43.85 15.90 16.36 19.76 2.68 4.31 2.22 48.10 20.591-A-06 03125/85 44.78 34.77 34.71 36.00 1.29 2.06 1.24 57.80 23.581-A-07 03/25/85 12.60 15.50 15.55 15.94 0.81 1.54 0.79 67.00 25.41
1-A-08 03/25/85 114.50 23.83 23.65 31.21 4.84 8.58 3.67 86.30 33.921-A-09 03/25/85 76.80 23.31 23.48 26.65 3.27 5.77 2.88 95.70 40.171-A-10 03/25/85 23.07 12.45 12.60 14.56 1.83 3.17 1.58 109.80 45.05
1-A-11 03/25/85 106.35 29.13 29.13 40.42 3.65 6.12 2.63 115.00 47.391-A-12 03/25/85 135.31 30.51 31.46 36.43 4.30 6.55 3.71 121.60 52.931-A-13 03/25/85 102.41 35.98 36.05 37.81 2.84 5.16 2.71 130.00 59.861-A-14 03/25/85 78.28 34.84 35.26 36.37 2.22 4.18 2.15 141.20 66.891-A-END 03/25/85 78.28 163.70 73.31
1-A-01 04/15/85 27.82 14.44 14.05 16.94 1.98 3.75 1.64 8.30 0.80I-A-02 04/15/85 92.64 22.39 23.10 25.22 4.01 6.43 3.67 19.20 5.36i-A-03 04/15/85 78.53 33.84 34.14 35.03 2.30 3.76 2.24 30.90 12.311-A-04 04/15/85 76.47 32.93 33.24 35.98 2.30 3.64 2.13 38.00 16.131-A-05 04/15/85 42.96 16.89 17.82 20.45 2.41 4.36 2.10 48.10 20.311-A-06 04/15185 39.06 35.57 36.16 35.87 1.08 1.81 1.09 57.80 23.07I-A-O7 04/15/85 21.10 31.27 31.49 28.47 0.67 1.34 0.74 67.00 25.001-A-08 04/15/85 102.57 21.00 21.36 29.11 4.80 8.23 3.52 86.30 33.291-A-09 04/15/85 84.65 27.86 27.30 32.35 3.10 6.08 2.62 95.70 39.401-A-t0 04/15/85 76.00 28.68 28.46 31.03 2.67 4.94 2.45 109.80 47.26
D41Appendix D Ephemeral Gully Data

EPHEMERAL GULLIES
SITE-1, GULLY-A, CYCLE-3
TOP MEAN IETTED MEAN MAX HYDRAULIC CUI4ULATIVE CIMJLATIVE
GULLY AREA WOTH WIDTH PERIMETER DEPTH DEPTH RADIUS LENGTH VOLUME
STATION DATE (Sq. In.) (In.) (In.) (In.) (In.) (In.) (in.) (Ft.) (Cubic Ft.)S. . . . . ...... ...... --------........ .. ----- ........ . ..... ..... ..... . ...... .... ...... .....-- - - - - - - -
I-A-11 04/15/85 108.27 30.11 29.99 37.45 3.61 6.43 2.89 115.00 50.59I-A-12 04/1S/85 100.68 29.17 29.87 33.34 3.37 4.90 3.02 121.60 55.38
1-A-13 04/15/85 66.14 28.95 29.39 30.78 2.25 3.93 2.15 130.00 60.24
1-A-14 04/15/85 66.14 29.96 29.74 31.81 2.22 3.94 2.08 141.20 65.38
1-A-15 04/15/85 48.96 19.41 20.14 21.23 2.43 4.11 2.31 151.90 69.66
1-A-END 04/15/85 48.96 163.70 73.67
D42 Appendix D Ephemeral Gully Data

EPHEMERAL GULLIESSITE-I, GULLY-8, CYCLE-3
TOP MEAN WETTED MEAN MAX HYDRAULIC CUMMULATIVE CUMMULATIVE
GULLY AREA WIDTH WIDTH PERIMETER DEPTH DEPTH RADIUS LENGTH VOLUMESTATION DATE (Sq. In.) (In.) (In.) (In.) (in.) (in.) (in.) (ft.) (CLbic Ft.)
1-3-01 02/21/85 65.36 15.68 16.42 23.59 3.98 6.54 2.77 7.20 1.63
1-8-02 02/21/85 95.02 32.49 32.11 35.64 2.96 5.19 2.67 15.60 6.311-8-03 02/21/85 29.61 19.20 18.98 20.73 1.56 3.10 1.43 25.80 10.731-8-04 02/21/85 53.50 17.15 17.59 20.96 3.04 4.38 2.55 35.30 13.481-s-05 02/21/85 61.81 19.84 21.38 27.84 2.89 4.40 2.22 41.00 15.761-8-06 02/21/85 53.41 27.87 26.70 32.41 2.00 5.60 1.65 48.80 18.881-9-07 02/21/85 61.84 16.74 17.22 20.74 3.59 5.91 2.98 54.20 21.041-9-08 02121/85 79.66 17.12 17.13 24.55 4.65 7.20 3.24 63.70 25.701-80-09 02/21/85 82.96 25.05 25.21 28.49 3.29 5.16 2.91 68.10 28.191-B-10 02/21/85 16.27 16.18 16.43 17.00 0.99 1.93 0.96 77.80 31.531-B-11 02/21/85 50.60 18.25 18.67 20.98 2.71 4.24 2.41 84.00 32.971-B-END 02/21/85 50.60 97.20 37.60
1-5-01 03/25/85 61.66 14.65 14.71 20.38 4.19 6.48 3.03 7.20 1.541-B-02 03/25/85 70.97 25.75 26.18 27.96 2.71 4.31 ,.S4 15.60 5.411-5-03 03/25/85 36.58 20.62 20.66 20.23 1.77 2.95 1.81 25.80 9.22
1-8-04 03/25/85 48.06 17.72 18.27 19.45 2.63 3.55 2.47 35.30 12.011-8-05 03/25/85 73.41 24.56 25.05 28.04 2.93 4.18 2.62 41.00 14.421-3-06 03/25/85 31.12 13.18 13.07 16.34 2.38 3.80 1.90 48.80 17.251-8-07 03/25/85 60.26 18.22 18.37 22.80 3.28 4.79 2.64 54.20 18.961-8-08 03/25/85 83.02 16.01 17.62 23.46 4.71 7.08 3.54 63.70 23.691-B-09 03/25/85 49.23 21.87 22.37 24.42 2.20 3.87 2.0Z 68.10 25.71
1-8-10 03125/85 23.07 12.45 12.60 14.56 1.83 3.17 1.58 77.80 28.141-9-11 03/25/85 40.36 18.37 18.18 20.37 2.22 3.52 1.98 84.00 29.511-B-END 03/25/85 40.36 97.20 33.20
1-B-01 04/15/85 62.76 16.01 16.13 22.36 3.89 5.99 2.81 7.20 1.571-8-02 04/15/85 96.27 29.92 30.27 32.94 3.18 4.63 2.92 15.60 6.211-8-03 04/15/85 30.74 24.43 24.01 26.50 1.28 2.41 1.16 25.80 10.711-9-04 04/15/85 49.95 19.14 19.36 21.64 2.58 3.78 2.31 35.30 13.371-B-OS 04/15/85 64.45 23.73 23.78 26.15 2.71 4.13 2.46 41.00 15.631-B-06 04/15/85 53.43 18.74 19.01 23.83 2.81 5.35 2.24 48.80 18.831-8-07 04/15/85 61.25 18.41 18.61 23.26 3.29 4.68 2.63 54.20 20.981-8-08 04/15/85 85.81 16.79 18.49 24.82 4.64 6.84 3.46 63.70 25.831-8-09 04/15/85 36.69 15.17 15.54 17.12 2.36 3.23 2.14 68.10 27.701-8-10 04/15/85 13.90 14.33 14.32 15.06 0.97 1.76 0.92 77.80 29.411-8-11 04/15/85 42.07 18.48 18.78 20.66 2.24 3.84 2.04 84.00 30.611-8-ENO 04/15/85 42.07 97.20 34.47
Appendix D Ephemeral Gully Data 043

EPHEMERAL GULLIESS1TE-1, GULLY-C, CYCLE-3
TOP MEAN WETTED MEAN MAX HYDRAULIC CUNMULATIVE CUHJULAT lVEGULLY AREA WIDTH UIDTH PERIMETER DEPTH DEPTH RADIUS LENGTH VOLUMESTATION DATE (Sq. In.) (In.) (In.) (In.) (In.) (In.) (In.) (Ft.) (Cuijc Ft.)-------...----.....------- -------................ .... .------..-------...........--............I-C-01 02/21/85 56.90 19.77 20.24 21.94 2.81 4.86 2.59 1.30 0.26I-C-02 02121/85 51.55 16.82 16.68 21.80 3.09 5.00 2.36 7.50 2.591-C-03 02/21/85 47.77 20.69 21.32 27.01 2.24 3.52 1.77 12.00 4.141-C-04 02/21/85 16.58 35.41 36.04 35.86 0.46 0.97 0.46 21.60 6.291-C-05 02/21/85 30.88 20.53 20.31 21.87 1.52 2.71 1.41 30.00 7.671-C-06 02/21/85 49.13 24.56 25.19 24.44 1.95 3.13 2.01 40.20 10.501-C-07 02/21/85 68.77 16.89 17.45 21.59 3.94 8.07 3.19 53.10 15.781-C-08 02/21/85 79.76 22.18 22.27 26.28 3.58 5.62 3.04 60.70 19.711-C-09 02/21/85 61.47 21.85 22.35 24.55 2.75 4.01 2.50 67.80 23.191-C-10 02/21/85 64.46 18.67 18.57 24.75 3.47 6.59 2.60 77.90 27.611-C-11 02/21/85 71.95 22.59 23.20 26.45 3.10 5.65 2.72 86.10 31.491-C-12 02/21/85 54.66 17.05 16.81 21.84 3.25 5.77 2.50 89.20 32.861-C-ENO 02/21/85 54.66 97.80 36.13
1-C-Ol 03/25/85 58.76 19.60 19.98 20.12 2.94 4.81 2.92 1.30 0.271-C-02 03/25/85 54.85 17.32 17.24 21.71 3.18 4.73 2.53 7.50 2.71I-C-03 03/25/85 38.41 20.17 19.59 20.01 1.96 2.97 1.92 12.00 4.171-C-04 03/25/85 20.07 35.45 35.83 35.82 0.56 1.05 0.56 21.60 6.121-C-04 03/25/85 24.21 35.29 35.60 35.85 0.68 1.25 0.68 21.60 7.591-C-05 03/25/85 22.76 16.85 17.24 17.84 1.32 2.28 1.28 30.00 8.961-C-06 03/25/85 58.49 28.18 28.25 27.29 2.07 3.33 2.14 40.20 11.81.1-C-07 03/25/85 54.22 15.77 15.71 19.09 3.45 6.14 2.84 53.10 16.891-C-08 03/25/85 73.38 22.13 22.30 25.93 3.29 4.92 2.83 60.70 20.261-C-09 03/25/85 41.04 18.6 18.57 20.64 2.21 3.05 1.99 67.80 23.081-C-10 03/25185 57.49 18.17 18.48 23.13 3.11 5.78 2.49 77.90 26.531-C-l 03/25/85 66.90 19.17 19.67 23.83 3.40 6.00 2.81 86.10 30.081-C-END 03/25/85 66.90 97.80 34.08
I-C-01 04/29/85 65.28 18.90 18.75 23.3) 3.48 4.94 2.78 1.30 0.291-C-02 04/29/85 48.18 16.91 16.96 20.88 2.8-4 4.19 2.31 7.50 2.741-C-03 04/29/85 46.67 22.35 23.10 24.26 2.02 3.06 1.92 12.00 4.221-C-05 04/29/85 20.74 20.29 20.33 21.19 1.02 2.14 0.98 30.00 6.191-C-06 04/29/85 55.27 26.35 26.70 26.47 2.07 3.30 2.09 40.20 8.881-C-07 04/29/85 49.33 15.27 14.81 18.67 3.33 6.12 2.64 53.10 13.571-C-08 04/29/85 82.70 25.15 25.68 29.28 3.22 5.56 2.82 60.70 17.051-C-09 04/29/85 67.30 25.01 25.30 27.62 2.66 3.78 2.44 67.80 20.751-c-10 04/29/85 61.59 18.86 19.80 23.66 3.21 5.85 2.60 77.90 25.271-c-il 04/29/85 102.01 26.16 27.34 30.00 3.73 6.24 3.40 86.10 29.931-C-12 04/29/85 78.26 21.25 21.44 27.27 3.65 6.81 2.87 89.20 31.861-C-END 04/29/85 78.26 97.80 36.53
D44Appendix D Ephemeral Gully Data

EPHEMERAL GULLIES
SITE-Io GULLY-0, CYCLE-3
TOP MEAN WETTED MEAN MAX HYDRAULIC JQ.WGLATIVE CU.JLATIVE
GULLY AREA UIDTH WIDTH PERIMETER DEPTH DEPTH RADIUS LENGTH VOLUME
STATiON DATE (Sq. In.) (in.) (in.) (in.) (In.) (In.) (in.) (Ft.) (Cubic Ft.)°. . ..... ...... ..... .... .. . .... ... -- -- ------ ..... ...... .-- -- .... ..- - - - --........ ......... . .... .....
1-0-01 02/21185 48.94 13.78 14.14 22.09 3.46 6.57 2.22 4.10 0.70
1-0-02 02121/85 58.85 10.45 11.49 23.99 5.12 8.37 2.45 9.00 2.53
1-0-03 02/21/85 98.73 20.86 21.18 30.07 4.66 8.54 3.28 14.90 5.76
1-0-04 02/21/85 80.88 21.76 22.21 24.91 3.6'. 4.89 3.25 21.00 9.57
1-0-05 02/21/85 39.89 17.72 17.65 20.46 2.26 4.06 1.95 27.20 12.17
1-0-06 02/21/85 26.71 29.13 29.67 26.00 0.90 1.64 1.03 32.80 13.46
1-0-07 02/21/85 53.11 20.63 20.99 24.36 2.53 5.23 2.18 43.10 16.32
1-0-08 02/21/85 73.60 23.15 23.85 27.18 3.12 5.79 2.71 48.60 18.74
i-D-END 02/21/85 73.60 55.90 22.47
I-0-01 03/25/85 40.10 8.84 10.80 18.06 3.71 5.08 2.22 4.10 0.57
1-D-02 03/25/85 58.17 13.23 14.65 21.82 3.97 6.90 2.67 9.00 2.24
1-0-03 03/25/85 100.16 18.33 18.07 29.26 5.54 8.40 3.42 14.90 5.49
1-0-04 03/25/85 79.93 22.37 22.57 23.94 3.54 4.71 3.34 21.00 9.30
1-0-05 03/25/85 46.63 19.28 19.26 21.36 2.42 3.92 2.18 27.20 12.03
1-D-06 03/25/85 28.25 27.88 27.97 36.40 1.01 1.69 0.78 32.80 13.48
1-D-07 03/25/85 67.53 23.05 23.36 26.99 2.89 5.74 2.50 43.10 16.91
1-D-08 03/25/85 41.43 17.43 18.09 21.61 2.29 4.13 1.92 48.60 18.99
1-D-END 03/25/85 41.43 55.90 21.09
1-0-01 04/29/85 43.37 9.25 10.70 17.38 4.05 5.32 2.50 4.10 0.62
1-D-02 04/29/85 59.12 12.52 13.10 21.41 4.51 7.14 2.76 9.00 2.36
1-0-03 04/29/85 105.54 25.50 25.74. 30.42 4.10 6.41 3.47 14.90 5.74
I-D-04 04/29/85 89.18 24.66 24.16 32.50 3.69 5.89 2.74 21.00 9.86
I-D-05 04/29/85 66.99 26.70 26.90 22.70 2.49 3.79 2.95 27.20 13.22
1-0-06 04129/85 30.77 28.77 29.02 29.24 29.24 1.53 1.05 32.80 15.12
1-D-07 04/29/85 62.02 21.47 22.47 24.47 2.76 5.35 2.53 43.10 18.44
I-0-08 04/29/85 43.64 17.81 17.66 17.28 2.47 4.05 2.53 48.60 20.46
I-D-END 04/29/85 43.64 55.90 22.67
I1
D45Appendix 0 Ephemeral Gully Data

EPHEMERAL GULLIES
SITE-2, GULLY-A, CYCLE-3
TOP MEAN WETTED MEAN MAX HYDRAULIC CUM4MULATIVE CLNMLATIVEGULLY AREA WIDTH WIDTH PERIMETER DEPTH DEPTH RADIUS LENGTH VOLUMESTATION DATE (Sq. In.) (in.) (In.) (In.) (In.) (In.) (In.) (Ft.) (Ctbic Ft.)-................ ........... ........................................................................
2-A-01 02120185 48.85 22.76 23.94 21.58 2.04 4.02 2.26 153.60 1.082-A-02 02/20185 101.24 14.60 16.32 30.61 6.20 10.65 3.31 147.20 4.632-A-03 02/20/85 130.48 24.39 24.07 32.87 5.42 9.95 3.97 140.40 8.492-A-04 02/20/85 151.17 23.01 25.06 33.06 6.03 9.25 4.57 135.60 14.162-A-05 02/20/85 84.23 29.27 28.94 33.59 2.91 5.24 2.51 129.80 20.702-A-06 02/20/85 73.25 19.64 20.34 24.21 3.60 5.19 3.03 121.80 25.952-A-07 02/20/85 ?0.63 21.95 22.63 23.84 3.12 5.26 2.96 112.20 28.852-A-08 02120/85 100.53 28.41 27.61 33.51 3.64 6.54 3.00 106.40 33.362-A-09 02/20/85 78.07 29.69 29.79 31.73 2.62 4.20 2.46 98.80 38.452-A-10 02/20/85 28.36 28.82 29.54 30.10 0.96 2.05 0.94 90.60 43.102-A-11 02/20/85 56.53 26.21 26.17 27.84 2.16 3.39 2.03 78.00 46.352-A-12 02/20/85 52.76 30.17 30.49 28.74 1.73 3.01 1.84 67.00 49.922-A-13 02/20/85 94.62 34.04 33.43 37.19 2.83 5.72 2.54 57.60 55.242-A-14 02/20/85 223.03 32.77 32.32 41.99 6.90 11.70 5.31 47.20 58.542-A-IS 02/20/85 208.63 34.63 35.66 41.52 5.85 9.55 5.02 44.20 77.132-A-16 02/20/85 107.87 29.81 29.23 35.12 3L69 7.87 3.07 31.80 86.802-A-17 02/20/85 112.37 20.38 21.31 29.22 5.27 8.36 3.85 23.00 104.392-A-END 02/20/85 112.37 160.20 109.54
2-A-01 03/25/85 42.76 19.20 19.70 21.33 2.17 3.88 2.00 153.60 0.952-A-02 03/25/85 90.82 11.65 15.03 29.07 6.04 10.01 3.12 147.20 4.112-A-03 03/25/85 155.17 26.85 25.82 38.14 6.03 11.30 4.07 140.40 8.212-A-04 03/25/85 174.60 25.37 27.02 39.50 6.46 9.22 4.42 135.60 14.852-A-05 03/25/85 36.37 20.15 20.09 23.51 1.81 3.40 1.55 129.80 20.712-A-06 03/25/85 101.30 24.67 25.26 28.67 4.01 5.56 3.53 121.80 25.302-A-07 03/25/85 86.63 24.15 24.96 26.98 3.47 5.57 3.21 112.20 29.082-A-07 04/15/85 77.61 22.33 23.16 24.51 3.35 5.28 3.17 112.20 32.392-A-08 03/29/85 49.00 17.71 16.95 21.35 2.89 5.14 2.30 106.40 35.732-A-09 03/25/85 67.34 26.61 26.40 28.78 2.55 390 2.34 98.80 39.042-A-10 03/25/85 3.96 5.53 5.49 36.00 0.72 1.10 0.11 90.60 42.172-A-11 03/25/85 31.09 21.93 21.89 22.64 1.42 2.34 1.37 73.00 43.512-A-12 03/25/85 57.11 28.15 27.85 27.44 2.05 2.98 2.08 67.00 46.392-A-13 03/25/85 87.04 31.87 31.65 34.51 2.75 5.26 2.52 57.60 51.602-A-14 03/25/85 156.64 25.21 26.01 31.81 6.02 9.68 4.92 47.20 54.132-A-15 03/25/85 161.10 30.74 31.96 36.71 5.04 7.87 4.39 44.20 67.822-A-16 03/25/85 70.76 18.63 18.57 23.40 3.81 6.41 3.02 31.80 74.902-A-1? 03/25/85 120.28 22.76 24.29 29.41 4.96 8.74 4.09 23.00 90.152-A-END 03/25/85 120.28 160.20 95.66
2-A-01 04/15/85 50.81 25.53 25.92 26.57 1.96 3.99 1.91 153.60 1.132-A-02 04/15/85 94.47 15.78 16.48 30.31 5.73 10.40 3.12 147.20 4.562-A-03 04/15/85 147.23 25.90 26.33 36.57 5.59 10.63 4.03 140.40 8.592-A-04 04/15/85 172.08 27.85 29.46 55.00 5.84 9.50 3.13 135.60 15.02
D46Appendix D Ephemeral Gully Data

EPHEMERAL GULLIES
SITE-2, GULLY-A, CYCLE-3
TOP MEAN WETTED MEAN MAX HYDRAULIC CUMMULATIVE CUMMULATIVE
GULLY AREA WIDTH WIDTH PERIMETER DEPTH DEPTH RADIUS LENGTH VOLUME
STATION DATE (Sq. In.) (in.) (In.) (In.) (In.) (In.) (In.) (Ft.) (Cubic Ft-)- - - - -........ - - - - - - - - - --.. ........- - --......... .. .. .. .. .. .. .. .. .. .. .. .. .. .. . . .. .. .. .. .. .. --- - -- -
2-A-05 04!15,:85 23.03 29.03 28.86 32.69 2.53 4.38 0.70 129.80 20.442-A-06 04/15/85 103.04 25.23 25.13 29.15 4.10 5.87 3.46 121.80 24.642-A-08 04/15/85 83.58 25.37 25.24 31.17 3.31 6.13 2.68 106.40 29.57
2-A-09 04/15/85 69.50 29.10 29.07 30.87 2.39 3.39 2.25 98.80 33.92
2-A-10 04/15/85 25.74 35.09 35.26 37.53 0.73 2.03 0.69 90.60 38.10
2-A-11 04/15/85 61.45 30.40 30.72 27.00 2.00 3.43 2.28 78.00 41.43
2-A-12 04/15/85 60.39 33.77 34.11 35.53 1.77 3.01 1.70 67.00 45.40
2-A-13 04/15/BS 95.50 30.63 30.31 33.36 3.15 5.91 2.86 57.60 51.03
2-A-14 04/15/85 206.59 30.01 30.11 38.22 6.86 11.17 5.41 47.20 54.182-A-15 04/15/85 174.11 35.54 35.74 40.73 4.87 8.06 4.27 44.20 70.57
2-A-16 04/15/85 107.26 25.02 23.88 32.43 4.49 8.76 3.31 31.80 79.17
2-A-17 04/15/85 136.29 25.86 25.47 36.61 5.35 8.93 3.72 23.00 98.612-A-END 04/15/85 136.29 160.20 104.86
D47Appendix D Ephemeral Gully Data

EPHEMERAL GULLIES
SITE-2, GULLY-U, CYCLE-3
TOP MEAN WETTED MIEAN MAX HYDRAULIC CUN4ULATIVE CUMMULATIVEGULLY AREA WIDTH WIDTH PERIMETER DEPTH DEPTH RADIUS LENGTH VOLUMESTATION DATE (Sq. In.) (In.) (In.) (In.) (In.) (In.) (in.) (Ft.) (Cuic Ft.).. . . . . . . . ........ .. .. ....... .. -- - - - -- - -...... . . ........ .....-- --..... . .......... ...........-- - - - -
2-9-01 02/20/85 73.71 19.10 18.99 24.32 3.88 6.66 3.03 38.40 2.152-8-02 02/20/85 59.02 26.41 25.54 28.72 2.31 4.48 2.06 30.00 4.822-9-03 02/20/85 42.96 22.81 23.09 24.09 1.86 3.39 1.78 24.20 7.802-8-04 02/20/85 42.89 35.71 36.04 38.24 1.19 2.83 1.12 15.80 10.962-8-05 02/20/85 58.89 34.24 34.23 35.80 1.72 3.89 1.64 5.20 12.792-8-END 02/20/85 58.89 49.80 17.46
2-8-01 03/25/85 72.72 20.25 20.95 24.35 3.47 5.02 2.99 38.40 2.122-8-02 03/25/85 23.25 15.62 16.27 16.94 1.55 2.78 1.37 30.00 4.r',2-9-03 03/25/85 25.85 19.36 20.35 20.44 1.27 2.74 1.26 24.20 5.482-8-04 03/25/85 18.50 12.34 12.75 13.61 1.45 2.01 1.36 15.80 7.122-8-05 03/25/85 13.39 13.59 13.52 14.53 0.99 1.90 0.92 5.20 7.692-8-END 03/25/85 13.39 49.80 8.75
2-8-01 04/15/85 94.79 32.09 32.46 37.24 2.92 6.78 2.S5 38.40 2.762-B-02 04/15/85 54.49 35.89 35.84 38.19 1.52 3.90 1.43 30.00 5.772-8-03 04/15/85 37.39 2.20 22.52 23.27 1.66 2.97 1.61 24.20 8.452-8-04 04/15/85 74.93 29.03 29.61 31.28 2.53 3.86 2.40 15.80 12.582-9-05 04/15/85 37.06 27.63 27.86 28.41 1.33 2.70 1.3;w 5.20 14.602-8-END 04/15/85 37.06 49.80 17.53
D48 Appendix D Ephemeral Gully Data

EPHEMERAL GULLIESSITE-2, GULLY-C, CTCLE-3
TOP MEAN WETTED MEAN MAX HYDRAULIC CUMIULATIVE CU.MJLATI VEGULLY AREA WIDTH WIDTH PERIMETER DEPTH DEPTH RADIUS LENGTH VOLUMESTATION DATE (Sq. In.) (In.) (In.) (In.) (In.) (In.) (In.) (Ft.) (CMbic Ft.)
2-C-61 02/20/85 95.86 29.07 30.14 32.47 3.18 5.46 2.95 64.80 2.732-C-02 02/20/85 83.4" 23.38 23.50 34.40 3.55 5.62 2.43 56.60 8.212-C-03 02/20/85 "6.76 35.61 35.42 36.44 1.32 2.46 1.28 47.80 12.192-C-04 02/20/85 149.56 30.70 32.57 31.13 4.59 6.1t 4.80 39.00 18.462-C-05 02/20/85 94.81 35.69 36.46 37.56 2.60 4.59 2.52 29.80 26.952-C-06 02/20/85 97.61 29.11 28.,V 33.60 3.39 6.02 2.91 19.80 32.56
2-C-07 02/20/85 64.38 30.59 30.36 24.00 2.12 3.60 2.68 11.40 38.972-C-END 02/20/85 64.38 84.20 47.64
2-C-01 03/25/85 69.70 25.21 25.16 27.27 2.77 3.88 2.56 64.80 1.98
2-C-02 03/25/85 87.79 27.96 28.50 30.93 3.08 4.93 2.84 56.60 6.802-C-03 03/25/85 26.10 24.77 25.09 25.22 1.04 1.80 1.03 47.80 10.282-C-04 03/25/85 40.95 14.93 15.11 18.99 2.71 4.54 2.16 39.00 12.422-C-05 03/25/85 67.87 27.67 27.81 29.23 2.44 4.25 2.32 29.80 16.192-C-06 03/25/85 71.44 24.27 24.05 27.58 2.97 5.00 2.59 19.80 20.252-C-07 03/25/85 25.96 19.32 19.51 20.36 1.33 1.92 1.28 11.40 24.112-C-END 03/25/85 25.96 84.20 27.60
2-C-02 04115/85 86.43 25.46 25.87 28.47 3.34 5.03 3.04 56.60 2.642-C-03 04/15/85 38.66 35.14 35.46 35.55 1.09 2.00 1.09 47.80 6.462-C-04 04/15/85 93.74 31.43 31.82 36.32 2.94 4.89 2.58 39.00 10.69
2-C-05 04/15/85 83.66 33.48 34.00 35.78 2.46 9.11 2.34 29.80 16.852-C-06 04/15/85 99.05 32.05 31.84 34.89 3.11 5.53 2.84 19.80 22.182-C-07 04/15/85 67.04 30.48 30.47 31.78 2.20 3.43 2.11 11.40 28.75
2-C-END 04/15/85 67.04 84.20 37.79
Appendix D Ephemeral Gully Data D49

EPHEMERAL GULLIESSITE-4, GULLY-A, CYCLE-3
TOP MEAN WETTED MEAN MAX NYORAULIC CLUMIJATIVE CUPMLATIvEGULLY .EA WIDTH WIDTH PERIMETER DEPTH DEPTH RAwfUs LEOTH VOLUMESTATION DATE (Sq. In.) (in.) (In.) (In.) (Zn.) (in.) (in.) (Ft.) (Cubic Ft.,
4-A-01 02/22/85 50.83 24.65 25.03 28.76 2.03 3.98 1.77 21.40 3.784-A-02 02/22/85 48.25 17.85 17.54 20.47 2.75 3.82 P.%. 28.50 6.2?4-A-03 02/22/85 41.78 16.30 16.44 19.02 2.54 3.39 2.20 33.00 7.634-A-04 02/22/85 27.04 15.42 15.72 16.97 1.72 3.08 1.59 42.60 9.9?4-A-05 02/22/85 21.49 14.34 15.13 13.45 1.42 2.79 1.60 50.70 11.294-A-06 02122/85 31.06 20.00 2.03 21.38 1.53 2.47 1.45 59.70 12.934-A-07 02/22/85 26.74 24.97 25.22 25.B0 1.06 2.06 1.04 67.00 14.394-A-08 02/22/85 23.70 15.0' 16.23 17.62 1.46 2.94 1.35 81.70 16.974-A-09 02/22/85 66.72 25.95 25.86 28.20 2.58 3.94 2.37 95.00 21.154-A-10 02/22/85 99.63 26.14 26.63 31.58 3.74 5.99 3.15 105.00 26.934-A-1l 02/22/85 173.11 31.51 32.60 32.31 5.31 7.95 5.36 114.10 35.544-A-12 02/22/85 57.29 26.51 5.92 28,86 2.21 4.66 1.99 124.60 43.944-A-13 02/22/85 110.37 29.81 30.6t 34.21 3.60 5.75 3.23 137.50 51.454-A-14 02/22/85 48.35 15.69 16.38 19.57 2.95 4.65 2.47 146.10 56.194-A-15 02/22/85 51.59 23.45 23.88 20.45 2.16 3.92 2.52 153.20 58.654-A-16 02/22/85 14.99 19.18 18.ý7 14.67 0.79 1.88 1.02 165.00 61.384-A-17 02/22185 21.66 20.CI 19.69 21.20 1.10 1.97 1.02 171.60 62.224-A-' 02/22/85 24.68 20.74 20.91 21.80 1.18 2.08 1.13 178.50 63.334-A-EQ 02/22/85 24.68 185.80 6,4.57
4-A-01 03/22/85 34.09 15.53 15.92 17.94 2.14 3.63 1.90 21.40 2.544-A-02 03122/85 62.53 Z1.43 21.12 24.37 2.96 4.55 2.57 28.50 4.;24-A-03 03/22/85 38.25 19.20 19.22 19.15 1.99 3.30 2.00 33.00 6.494-A-04 03/22/85 30.23 21.15 '0.94 22.19 1.45 2.55 1.36 42.60 8,7e4-A-Dr 03/22/85 50.39 31.63 31.89 34.65 1.58 2.12 1.45 50.70 11.054-A-06 03/22/85 27.56 20.89 21.19 21.53 1.30 2.17 1.28 59.70 13.484-A-07 03122/85 16.65 20.48 20.55 21.15 0.81 1.12 0.79 67.00 14.604-A-08 03/22/85 29 10 19.67 20.06 20.88 1.49 2.55 1.43 81.70 16.984-A-09 03122/85 66.39 25.76 25.83 28.34 2.57 4.41 2.34 95.00 21.434-A-10 13/22/85 878" 31.43 31.47 34.64 2.79 4.78 2.53 105.00 26.79--A-11 03/22/85 133.23 33.93 34.42 33.49 3.87 7.12 3.98 114-10 33.77
L-A-12 03/22/85 78.75 34.03 34.38 36.16 2.29 4.16 2.18 124.60 41.504-A-!7 03/22/85 132.29 34.82 35.18 58.69 3.76 5.98 3.40 137.50 50.954-A-15 03/22/85 73.59 32.80 33.75 25.09 2.18 4.89 2.93 453.20 56.034-A-16 03/22/85 42.66 35.30 34.96 26.94 1.22 2.55 1.58 165.00 60.794-A-I7 03/22/85 8.83 11.99 11.Al 13.05 0.76 0.92 0.68 171.60 61.974-A-18 03/22/85 35.33 23.34 24.53 24.61 1.44 2.76 1.44 178.50 63.034-A-END 03/22/85 35.33 185.80 64.81
4-A-01 04/29/85 37.61 19.23 18.99 21.30 1.98 3.68 1.77 21.40 2.794-A-02 . n;v/85 77.63 25.94 26.13 28.99 2.97 4.64 2.68 28.50 5.634-A-03 04/29/85 67.47 23.93 23.92 26.37 2.82 4.59 2.56 33.00 7.904-A-04 04/29/85 31.16 22.30 21.1) 23.53 1.43 2.84 1.32 42.60 11.19
D50 Appendix D Ephemeral Gully Data

EPHEMERAL GULLIESSITE-4, GULLY-A. CTCLE-3
TOP MEAN I•ETTED MEAN MAX HYDRAULIC CUlPWqLATIVE CUMKULATIVEGULLY AREA WIDTH WIDTH PERIMETER DEPTH DEPTH RADIUS LENGTH VOLUMESTATION DATE (Sq. In.) (In.) (in.) (In.) (In.) (In.) (in.) (Ft.) (Cubic Ft.)-----. --. -. ........ ......... ...... ......-- .......... ...... I ...... .......... ........... ...........
4-A-05 04/29/85 39.59 29.14 28.27 27.59 1.40 2.93 1.43 50.70 13.184-A-06 04129/85 47.59 27.52 27.99 28.87 1.70 2.50 1.65 59.70 15.904-A-07 04/29/85 27.04 27.34 26.77 28.34 1.01 2.06 0.95 67.00 17.794-A-08 04/29/85 42.38 27.73 28.25 27.47 1.50 2.90 1.54 81.70 21.334-A-09 04/29/85 58.84. 24.94 25.36 26.86 2.32 3.41 2.19 95.00 26.014-A-10 04/29/85 125.59 35.34 35.47 38.85 3.54 6.15 3.23 105.00 32.414-A-11 04/29/85 154.55 35.48 35.4/ 29.04 4.36 6.89 5.32 114.10 41.264-A-12 04/29/85 80.46 31.87 32.18 33.77 2.50 4.08 2.38 124.60 49.834-A-13 04/29/85 129.95 29.89 30.57 34.50 4.25 6.43 3.77 137.50 59.254-A-14 04/29/85 59.69 15.59 15.94 21.60 3.68 4.96 2.76 146.10 64.924-A-15 04129/85 73.02 28.24 28.41 26.05 2.57 4.45 2.80 153.20 68.194-A-16 04/29/85 41.69 30.66 30.88 26.26 1.35 2.52 1.59 165.00 72.894-A-17 04/29/85 17.64 19.85 20.04 20.26 0.88 1.62 0.87 171.60 74.254-A-18 04129/85 43.25 Z5.60 26.37 24.57 1.64 2.64 1.76 178.50 75.714-A-END 04/29/85 "3.25 1,5.80 77.90
Appendix D Ephemeral Gully Data D51

EPHEMERAL GULLIES
SITE-4, GULLY-B, CYCLE-3
TOP MEAN WETTED MEAN MAX HYDRAULIC CUMMULATIVE CUAIUATIVE
GULLY AREA UIOTH WIDTH PERIMETER DEPTH DEPTH RADIUS LENGTH 'OLUME
STATION DATE (Sq. In.) (in.) (In.) (In.) (in.) (In.) (in.) (Ft.) (Cubic Fr.)
4-B-01 02122/85 10.88 8.80 8.57 10.00 1.17 2.35 1.09 11.50 0.444-9-02 02/22185 32.29 13.99 15.23 16.70 2.12 3.18 1.93 18.50 1.494-0-03 02/22/85 57.59 20.58 20.71 25.26 2.78 5.68 2.28 28.00 4.45
4-9-04 02/22/85 51.16 21.01 21.86 21.75 2.34 4.59 2.35 33.50 6.534-8-05 02/22/85 44.54 19.18 19.70 19.63 2.63 4.05 2.27 41.50 9.184-0-06 02/22/85 56.03 21.43 24.04 29.92 2.33 5.63 1.87 50.00 12.15
4-9-07 02/22/85 67.03 30.16 30.46 32.57 2.20 4.23 2.06 54.50 13.03
4-6-08 02/22/85 61.34 35.84 37.40 30.58 1.64 4.61 2.01 67.80 15.864-B-09 02/22/85 19.29 35.54 35.72 21.10 0.54 2.35 0.91 75.00 17.874-8-10 02/22/85 44.35 30.32 30.94 24.41 1.43 2.35 1.82 8.,40 19.954-8-11 02/22/85 27.51 23.07 22.73 24.32 1.21 2.42 1.13 91.50 21.724-B-END 02/22/85 27.51 101.80 23.69
4-B-01 03/22/85 10.84 8.89 8.95 10.42 1.21 1.78 1.01 11.50 0.4,34-B-02 03/22/85 27.83 13.94 14.19 14.91 1.96 2.96 1.87 18.50 1.374-3-03 03/22/85 72.24 21.90 22.43 27.49 3.22 6.25 2.63 28.00 4.67
4-8-04 03/22/85 53.90 18.82 19.04 22.13 2.63 4.79 2.44 33.50 7.084-B-05 03/22/85 43.67 18.49 18.50 18.38 2.36 3.55 2.38 41.50 9.794-B-06 03/22/85 47.27 13.65 13.62 20.50 3.47 4.93 2.31 50.00 12.47
4-3-07 03/22/85 67.66 31.28 31.17 33.40 2.17 3.46 2.03 54.50 14.26
4-3-08 03/22/85 104.23 33.41 34.51 37.68 3.02 5.78 2.77 67.80 22.20
4-8-09 03/22/85 30.31 24.93 25.25 23.70 1.20 2.70 1.28 75.00 25.574-8-10 03/22/85 41.97 35.30 35.87 30.08 1.17 2.18 1.40 84.40 27.924-8-11 03/22/85 18.82 19.70 19.40 20.97 0.97 1.68 0.90 91.50 29.42
4-B-END 03/22/85 18.82 101.80 30.77
4-8-01 04/29/85 26.63 17.62 17.79 18.68 1.44 2.56 1.43 17.50 1.064-B-02 04/29/85 39.50 21.76 21.76 21.94 1.80 3.00 1.80 18.50 2.67
4-8-03 04/29/85 79.58 21.47 21.39 27.19 3.72 7.12 2.93 28.00 6.60
4-B-04 04/29/85 94.90 28.45 28.49 29.88 3.33 6.63 3.18 33.50 9.934-8-05 04/29/85 37.85 20.98 21.26 19.99 1.78 2.86 1.89 41.50 13.62
4-8-06 04/29/85 71.81 20.80 21.05 25.76 3.1.1 5.11 2.79 50.00 16.864-B-07 04/29/85 11.95 17.60 17.83 18.05 0.67 1.15 0.66 54.50 18.174-8-08 04/29/85 33.56 19.85 19.97 18.13 1.68 2.71 1.85 67.80 20.274-3-09 04/29/85 31.91 20.80 21.27 21.05 1.50 2.5? 1.52 75.00 21.91
4-3-10 04/29/85 30.54 27.35 28.01 28.00 1.09 1.96 1.09 84.40 23.954-3-11 04/29/85 20.21 26.30 26.24 25.53 0.77 1.17 0.79 91.50 25.20
4-3-END 04/29/85 20.21 101.80 26.64
D52 Appendix ) Ephemeral Gully Data

EPHEMERAL GULLIES
SITE-4, GULLY-C, CYCLE-3
TOP MEAN WETTED MEAN MAX HYDRAULIC CUMMULATIVE CUNIULATIVEGULLY AREA WIdOTH WIDTH PERIMETER DEPTH DEPTH RADIUS LENGTH VOLUMESTATION DATE (Sq. In.) (in.) (In.) (In.) (In.) (In.) (In.) (Ft.) (CLbic ft.)
4-C-01 02/22/85 27.64 15.82 16.35 17.55 1.69 3.13 1.57 2.00 0.194-C-02 02/22/85 24.93 14.05 15.10 14.31 1.65 2.31 1.74 9.50 1.564-C-03 02/22/85 25.80 11.22 11.72 14.04 2.20 3.91 1.8/ 15.00 2.534-C-04 02/22/85 31.44 14.74 15.26 17.59 2.06 3.72 1.79 20.50 3.624-C-05 02/22/85 20.26 14.83 15.58 16.46 1.30 2.02 1.23 27.50 4.884-C-END 02/22/85 20.26 35.00 5.93
4-C-0l 03/22/95 23.30 15.34 15.43 16.42 1.51 2.67 1.42 2.00 0.164-C-02 03/22/85 26.27 18.08 18.24 13.38 1.4" 2.20 1.96 9.50 1.454-c-03 03/22/85 18.79 14.65 15.65 15.59 1.20 2.07 1.21 15.00 2.314-C-04 03/22/85 35.08 15.28 15.31 18.05 2.29 3.23 1.94 20.50 3.344-C-05 03/22/85 11.90 9.55 9.51 9.84 1.25 1.87 1.21 27.50 4.484-C-END 03/22/85 11.90 35.00 5.11
4-C-01 04/29/85 29.27 20.44 20.75 21.29 1.41 2.33 1.37 2.00 0.204-c-02 04/29/85 34.75 21.95 21.99 20.40 1.58 2.66 1.70 9.50 1.874-C-03 04/29/85 22.62 14.24. 14.78 15.64 1.53 2.41 1.45 15.00 2.964-C-04 04/29/85 33.02 16.22 16.84 18.17 1.96 3.04 1.82 20.50 4.024-C-05 04/29/85 23.16 21.58 21.84 22.21 1.06 2.08 1.04 27.50 5.394-C-END 04/29/85 23.16 35.00 6.60
D53Appendix D Ephemeral Gully Data

Appendix EEphemeral Gully Soil LossCalculations
Appendix E Ephemeral Gully Soil Loss Calculations El

SOIL LOST BY EPHEMERAL GULLIESSITE-I, CYCLE-i
LENGTH VOLUME SOIL WEIGHTGULLY DATE Feet Cubic Feet Tons--------- -------- ------ ---------- -----------A 03/10/83 173.10 235.05 10.57
A 04/18/83 173.10 238.72 10.74
B 03/10/83 93.20 105.80 4.76B 04/18/83 93.20 106.27 4.78
C 03/10/83 123.50 134.90 6.07C 04/18/83 123.50 144.00 6.48
D 03/10/83 67.00 105.02 4.72D 04/18/83 67.00 103.15 4.64
TOTALS: 456.80 592.14 26.64
E2 Appendix E Ephemeral Gully Soil Loss Calculations

SOIL LOST BY EPHEMERAL GULLIESSITE-2, CYCLE-i
LENGTH VOLUME SOIL WEIGHTGULLY DATE Feet Cubic Feet Tons
-------------------- ------ ---------- -----------
A 03/12/83 47.20 24.83 1.11A 04/20/83 47.20 26.50 1.19
B 03/12/83 137.80 109.23 4.91B 04/20/83 137.80 120.75 5.43
C 03/12/83 35.70 9.80 0.44C 04/20/83 35.70 10.14 0.45
TOTALS: 220.70 157.39 7.08
E3Appendix E Ephemeral Gully Soil Loss Calculations

SOIL LOST BY EPHEMERAL GULLIESSITE-3, CYCLE-I
LENGTH VOLUME SOIL WEIGHTGULLY DATE Feet Cubic Feet Tons
----------- -------- ------ ---------- -----------A 03/08/83 43.20 21.11 0.94
B 03/08/83 100.20 73.22 3.29
C 03/08/83 44.00 56.96 2.56
D 03/09/83 60.00 75.79 3.41
E 03/09/83 59.80 46.02 2.07
TOTALS: 307.20 273.10 12.28
E4 Appendix E Ephemeral Gully Soil Loss Calculations

SOIL LOST BY EPHEMERAL GULLIESSITE-4, CYCLE-i
LENGTH VOLUME SOIL WEIGHTGULLY DATE Feet Cubic Feet Tons
A 03/21/83 210.00 68.21 3.06A 04/19/83 210.00 73.18 3.29
B 03/21/83 205.00 135.00 6.07B 04/19/83 205.00 128.11 5.76
TOTALS: 415.00 201.29 9.05
E5Appendix E Ephemeral Gully Soil Loss Calculations

SOIL LOST BY EPHEMERAL GULLIESSITE-i, CYCLE-2
LENGTH VOLUME SOIL WEIGHTGULLY DATE Feet Cubic Feet Tons--- ------------------------------- ------A 10/05/83 167.80 33.96 1.52
A 02/02/84 167.80 84.51 3.80A 03/23/84 167.80 88.21 3.96A 04/05/84 167.80 93.52 4.20A 04/25/84 167.80 88.42 3.97A 05/03/84 167.80 82.19 3.69
B 10/05/83 62.00 24.45 1.10B 02/02/84 62.00 36.44 1.63B 03/23/84 62.00 44.18 1.98B 04/05/84 62.00 39.59 1.78B 04/25/84 62.00 41.76 1.87B 05/03/84 62.00 47.99 2.15
C 10/05/83 92.20 26.95 1.21C 02/02/84 92.20 46.87 2.10C 03/23/84 92.20 45.37 2.04C 04/05/84 92.20 48.39 2.17C 04/25/84 92.20 56.45 2.54C 05/03/84 92.20 54.52 2.45
D 10/05/83 56.30 16.75 0.75D 02/02/84 56.30 18.30 0.82D 03/23/84 56.30 20.59 0.92D 04/05/84 56.30 21.65 0.97D 04/25/84 56.30 20.23 0.91D 05/03/84 56.30 24.00 1.08
TOTALS: 378.30 208.70 9.39
E6 Appendix E Ephemeral Gully Soil Loss Calculations

SOIL LOST BY EPHEMERAL GULLIESSITE-2, CYCLE-2
LENGTH VOLUME SOIL WEIGHTGULLY DATE Feet Cubic Feet Tons
--------------- -------- ------ ---------- -----------
A 01/20/84 141.50 58.77 2.64A 03/23/84 141.50 68.70 3.09A 04/05/84 141.50 71.05 3.19
B 02/02/84 125.10 39.55 1.77B 03/23/84 125.10 62.72 2.82B 04/05/84 125.10 47.65 2.14
TOTALS: 266.60 118.70 5.34
E7Appendix E Ephemeral Gully Soil Loss Calculations

SOIL LOST BY EPHEMERAL GULLIESSITE-3, CYCLE-2
LENGTH VOLUME SOIL WEIGHTGULLY DATE Feet Cubic Feet Tons
A 02/03/84 119.00 40.96 1.84A 03/21/84 119.00 33.12 1.49
B 02/03/84 116.50 30.40 1.36B 03/21/84 116.50 29.69 1.33
C 02/03/84 126.50 167.64 7.54C 03/21/84 126.50 146.56 6.59
D 02/03/84 101.00 19.95 0.89D 03/21/84 101.00 26.42 1.18
E 02/03/84 97.80 39.31 1.76E 03/21/84 97.80 44.35 1.99
TOTALS: 560.80 280.14 12.60
E8 Appendix E Ephemeral Gully Soil Loss Calculations

SOIL LOST BY EPHEMERAL GULLIESSITE-4, CYCLE-2
LENGTH VOLUME SOIL WEIGHTGULLY DATE Feet Cubic Feet Tons
A 01/05/84 116.00 31.82 1.43A 02/03/84 116.00 35.46 1.59A 03/16/84 116.00 44.56 2.00A 04/06/84 116.00 48.01 2.16A 04/27/84 116.00 44.39 1.99A 05/08/84 116.00 49.20 2.21
B 01/05/84 190.00 84.19 3.78B 02/03/84 190.00 89.32 4.01B 03/16/84 190.00 115.15 5.18B 04/06/84 190.00 114.10 5.13B 04/27/84 190.00 112.50 5.06B 05/08/84 190.00 120.06 5.40
C 01/05/84 33.00 4.78 0.21C 02/03/84 33.00 5.58 0.25C 03/16/84 33.00 5.04 0.22C 04/06/84 33.00 5.89 0.26C 04/27/84 33.00 6.66 0.29C 05/08/84 33.00 6.47 0.29
TOTALS: 339.00 175.73 7.90
E9Appendix E Ephemeral Gully Soil Loss Calculations

SOIL LOST BY EPHEMERAL GULLIESSITE-l, CYCLE-3
LENGTH VOLUME SOIL WEIGHTGULLY DATE Feet Cubic Feet Tons---------- -------- ------ ---------- -----------A 02/21/85 163.70 76.19 3.42A 03/25/85 163.70 73.31 3.29A 04/15/85 163.70 73.67 3.31
B 02/21/85 97.20 37.60 1.69B 03/25/85 97.20 33.20 1.49B 04/15/85 97.20 34.47 1.55
C 02/21/85 97.80 36.13 1.62C 03/25/85 97.80 34.08 1.53C 04/29/85 97.80 36.53 1.64
D 02/21/85 55.90 22.47 1.01D 03/25/85 55.90 21.09 0.94D 04/29/85 55.90 22.67 1.02
TOTALS: 414.60 167.34 7.53
El0 Appendix E Ephemeral Gully Soil Loss Calculations

SOIL LOST BY EPHEMERAL GULLIESSITE-2, CYCLE-3
LENGTH VOLUME SOIL WEIGHTGULLY DATE Feet Cubic Feet Tons
------------- -------- ------ ---------- -----------
A 02/20/85 160.20 109.54 4.92A 03/25/85 160.20 95.66 4.30S04/15/85 160.20 104.86 4.71
B 02/20/85 49.80 17.46 0.78B 03/25/85 49.80 8.75 0.39B 04/15/85 49.80 17.53 0.78
C 02/20/85 84.20 47.64 2.14C 03/25/85 84.20 27.60 1.24C 04/15/85 84.20 37.79 1.70
TOTALS: 294.20 160.18 7.20
EliAppendix E Ephemeral Gully Sot Loss Calculations
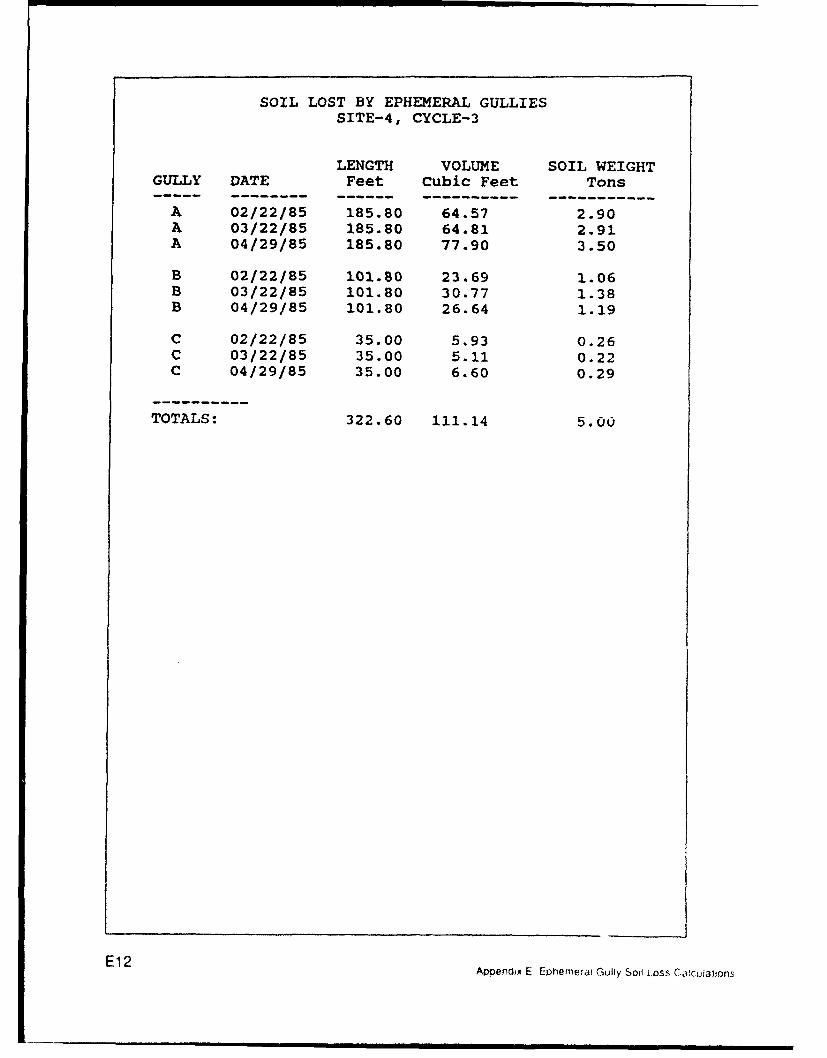
SOIL LOST BY EPHEMERAL GULLIESSITE-4, CYCLE-3
LENGTH VOLUME SOIL WEIGHTGULLY DATE Feet Cubic Feet Tons
------------ -- ----------.-----------A 02/22/85 185.80 64.57 2.90A 03/22/85 185.80 64.81 2.91A 04/29/85 185.80 77.90 3.50
B 02/22/85 101.80 23.69 1.06B 03/22/85 101.80 30.77 1.38B 04/29/85 101.80 26.64 1.19
C 02/22/85 35.00 5.93 0.26C 03/22/85 35.00 5.11 0.22C 04/29/85 35.00 6.60 0.29
TOTALS: 322.60 111.14 5.00
E12 Appendix E Ephemeral GuOly Sodi LOSS Ca•cuiahons

Appendix FVolumetric Growth EphemeralGullies Over Time
Appendix F Volumetric Growth Ephemeral Gulihes F1

00
\\\
-0
IQ))F-
0
-LJ
I I I - I I I I I I I I CD.
o 0 0 0 0 00 0 0 0 0 0
.6 6 65 65 65in0 i 0 Lf0
(;aa_- 9!qn:D) 3'JfFlOA
F2 Appendix F Volumetric Growth Ephemeral Gullies

III0
O N
C.,,) -0;q
F3
A-E(---
z• -o -i
Q5 0 00
Or] •aac a~qo) 3rqqO
9F3
Appndi F oluetrc rowh EhemralGulie
0 0 0 0 0 I=

0
L-,
do
.0)
&4a oo0)ivýniO
F 4 App endix F V olu m etric G owt p e e a ul e

-0(0
00
-LJ
DCD
0 0 0 0 0 00) 0 0 0 0
Ui 6 6 1 0CN 0 CN
(4;j iqno) :iA]OA
Appenidix F Volumetric Growth Ephemeral Gullies F

a) 0
Q.)~ r G --
040
00C.
u-0
•~-J- -CND
S0 0 00 0 0 0 0 0 0
L66 C o C6 ui 6
ApniFV(lueA- oGqno) 'whEeeOA
FIG Appendix F Volumetric Growth Ephemeral Gullies

00
-C4
LL-
I.
F-0 CD
LLJ
CJ
0111 1111 Cj) 0 0 0
0 0 0 0 0 0 0
o 4 o 0" f 0 06 6 6 L 6 uri 6CN O C\J
(IGaaj oiqno) 31NmflOA
F7Appendix F Volumetric Growth Ephemeral Gullies

III
0
00 0 0
c6 (6!
\\-
G~---
DD0__m
I I I "" ' I " I I "' I 'l I I I " t 2
6 cxi 6 /e~
S~~(4;aa- oiqno) i~f-l]OA
F8 Appendix F Volumetric Growth Ephemeral Gullies

LfL
0
C)
T -i I I 1 1 1 1 1 1 -
0 c 0 000 0 0 0 02
L6 6 n C5 U-iwN N v--
(19,9 Q Dqo ] -
F9-Appedix voumetic rowi Ephmerl Gulie

00
-C)
00
ILLJ
•~-J-
--
CD
I I • j I I I I 1 -0
0 0 0 0 0 00 0 0 0 0 06 o 6 6 6 CCF0 0A FO V m cw1
[.Q(;laz-I o iq no) qlAR-OA
F10 Appendix F Volumetric Growth Ephemeral Gullies

fU')
(10
C
0 Ur-
z• °-J
-jr,.5 -J::D
CD
I I I I I 1 " I I I 1 ' " " I " I I' " I ' I I I i r I I -" 0
0 0 0 0 0 0 0o o 0 0 0 0 0
r,.D Ln 1-d rn C4,.-
(9a9j - igqno) qn -wOA
Appendix F Volumetric Growth Ephemeral Gullies F11
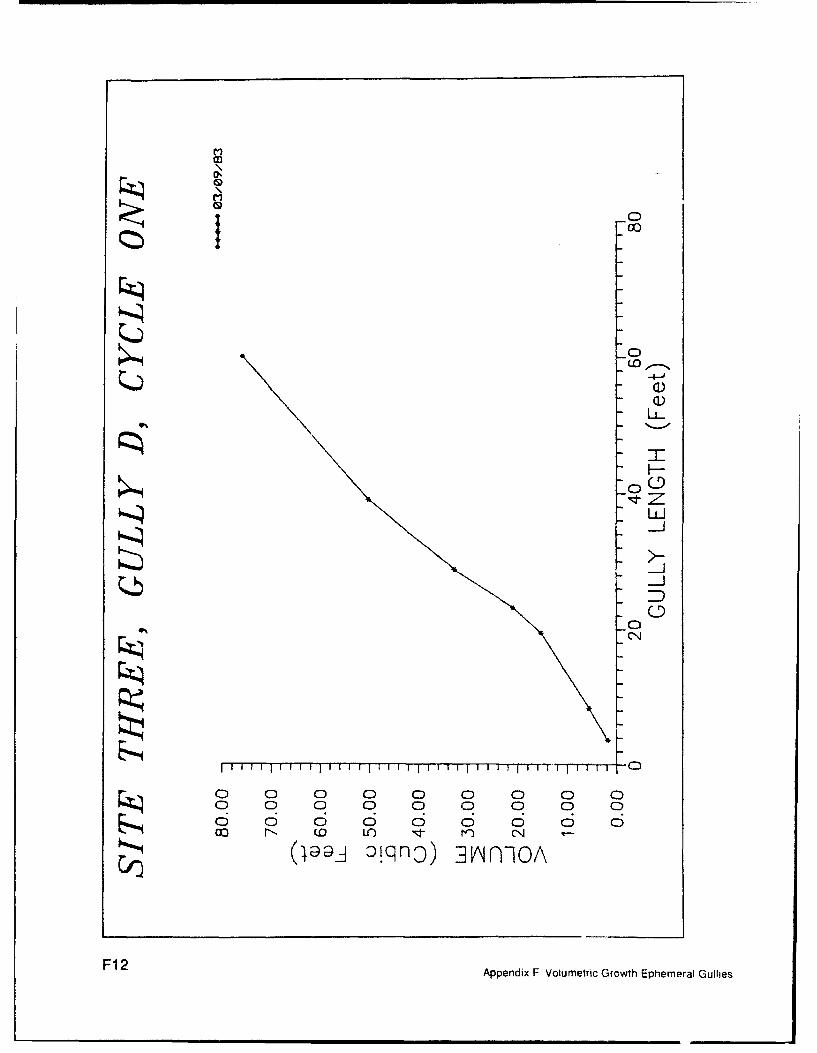
I _
-0-
00
) oDLi
C-
TC-
S--J
I I I' I I I I ' l "
0 0 0 0 0 0 0 0 00 0 0 0 0 0 0 0 C)ko 6 o o 6o o o
013 r-. I.) u3 .- r,)4 -
(199_t oiqno) ilAI-!OA
F12 Appendix F Volumetric Growth Ephemeral Gullies

a)U,,
(1)
to
L_J
L._J_.j
_j::D
-0C%4)
T 0
0 0 0 0 0 0 000 0 0 0 0 0
6 6 o 0 6
(19,g 0iqno) IN-IOA
F13Appendix F Volumetric Growth Ephemeral Gullies
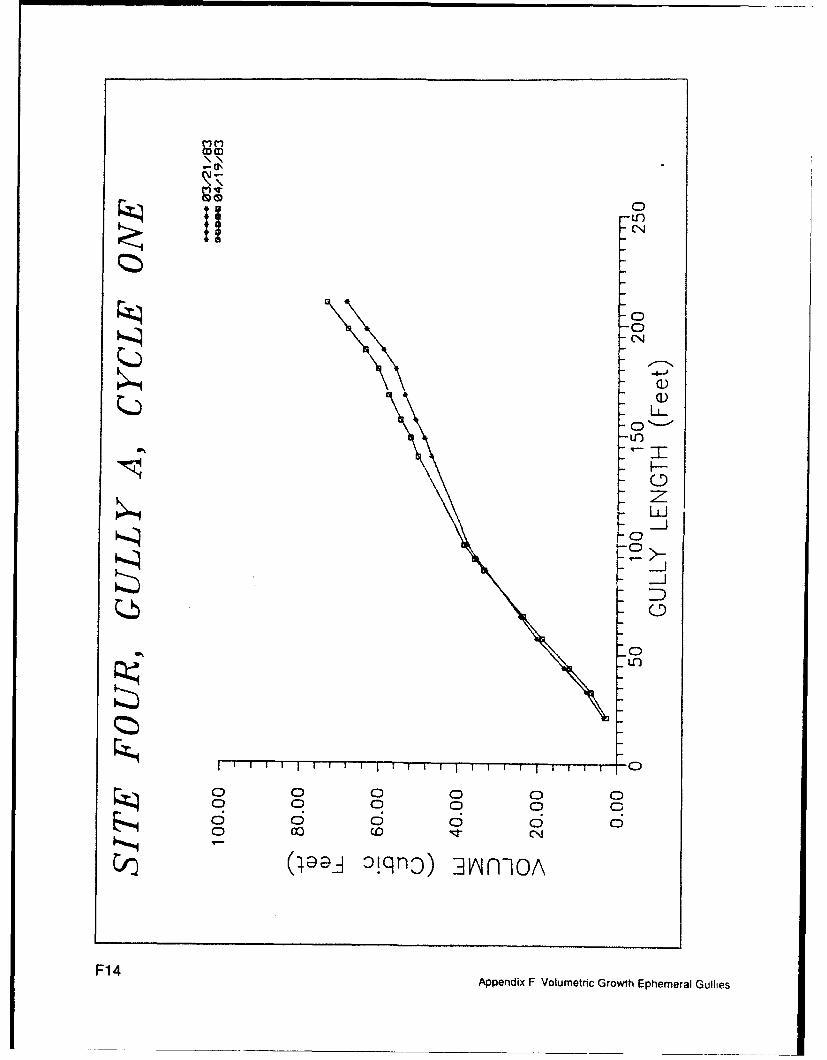
a)
Q.)
-0N-
0'-UO
0
-.J
-00
1>~
-J•
S~0o o o C (
00
O0
•0 0•
0
F1 4Appendix F Volumetric Growth Ephemeral Gullies

CIf)
\N
-00
S64- 4-
U-L
zLiJ
CD
0 0 0 0 0 0 00 0 0 0 0 0 0
6 6 6 Uý 6 aýL CO4 0 r-, u'3 o,
(19@_j cliqno) 31iFin OA
F15Appendix F Volumetric Growth Ephemeral Gullies

Ln MflLn e1
0
0
QI)
LJ
DI-0
o0 0 0 0 C CD0 0 0 0 0 0
0 C5 0
oo QD 11 N
S( ja~j o iq n:) i vN nOA
F16 Appndix F Volumetric Growth Ephemeral Gullies

\ \\\ \\
•\\ N\\\
U) CM (nLI) on(
0
0
-LJ
S0 0 0 0 0 00 0 0 0 0 CD
S(4e a Gj:iqno) 3nmOAA i -
F-7A~e ix Vlumtrc Go~hEpemealGulie

0 0 S)G
0
0
C-
• CD
0
S0 00 0 0 000 0 0 0 0 0 0
0 CD -5
I (iAa aDqno) 3ýnmOA
F18 Appendix F Volumetric Growth Ephemeral Gullies
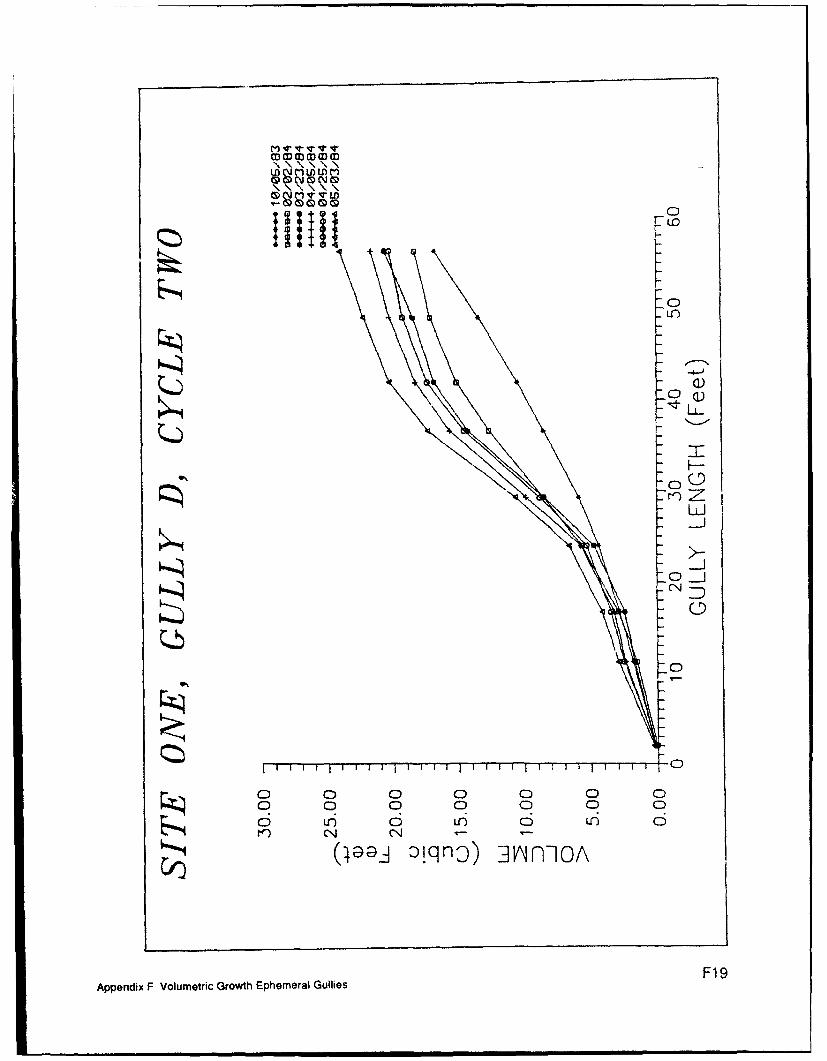
SlI I I III
C-
00
-J
CND
0
+"0
S0 I 0 0 0 0 0
0 0 0 0 0 0 0
t(49G z•)qno) C\J-OA
F19Appendix F Volumetric Growth Ephemeral Gullies

Q~0
m -
0
U-
LIJCJ
CJ
0
I i i I I I I I I i i i I 0 i i
o 0 0 0 0 0o 0: 0 0 0 065 6 o a 6 0
0 (D (0D 'd- o4
S(IGAa 3~qno) IA n-IfOA
F20 Appendix F Volumetric Growth Ephemeral Gullies

I • ON! a-)'
o0
• LL0
-LLJ
r -- -7 - -- -1 1 1-
S000 0 0 0S 0 C) 0 CD
0 00 co It
S~(;gAa.: aqn3) :iAmlOA
F21Appendix F Volumetric Growth Ephemeral Gullies

NC0
_ 0
~L.L
6C%
0 0 (--
_ (-
CNJ
0 o 0 0 0 0o 0 0 0 0 0
(.a-.j zI qno) -I AFYmOA
F22 Appendix F Volumetric Growth Ephemeral Gullies

ClCD
Z(.0
S-o xZC
I--
_0
I 0 I I I I I I I I I I I I I I
o 0 0 0 0 0 0o C0 0 0 0 0
(I .j oiqno) -Vi rfl-OA
F23Appendix F Volumetric Growth Ephemeral Gullies

a) ()a
cli
H- -
0
LiJ
N-J
C-J
i l I I i i i n I n I 1 j i I I I i I I I'' i i ' I I I I i I - 0
0 0 0 0 0 0 0 00 0 0 0 0 0 0 0
S0 Lri 6 6 Ln C;FeWo) N e r o rGwtpm
bQ (;G@H oiqno) 3Im-mOA
F24 Appendix F Volumetric Growlh Ephemeral Gullies
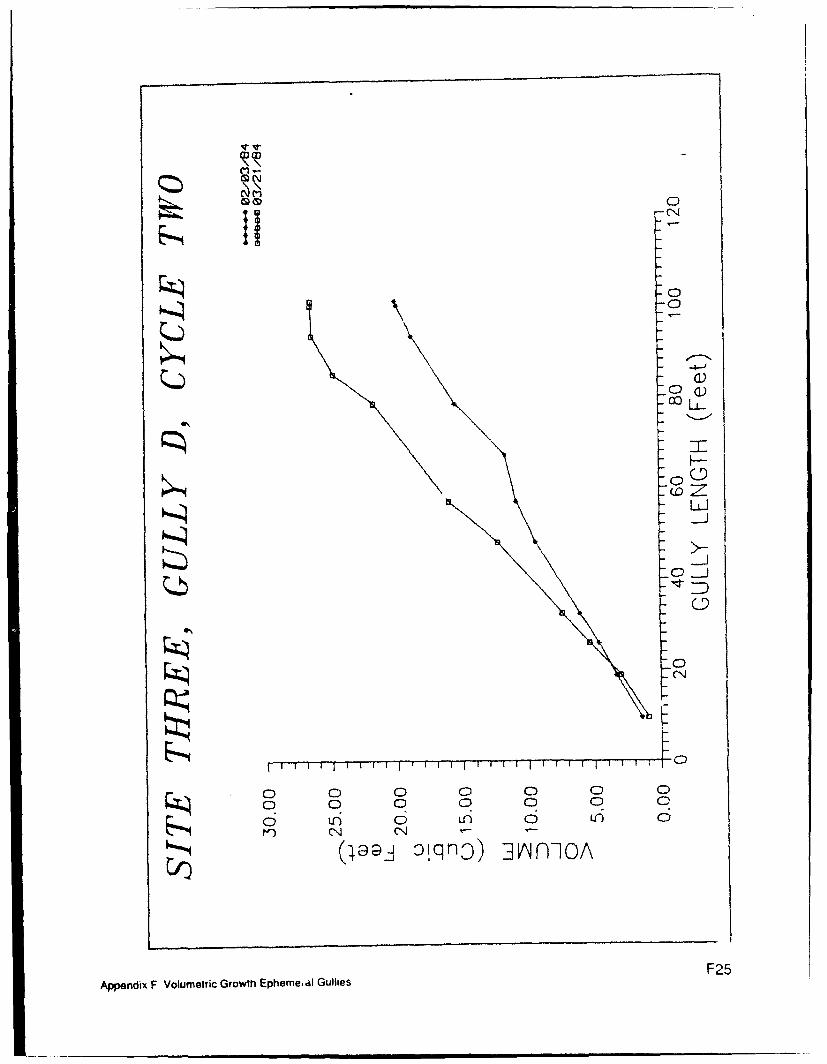
VEl D
0
0
-LJ
-DCtCD
000 0 00 0 0.0L6 0ý 0ý CD0
S(l . q qn:Q) ]n m-OA
F25Appendix F Volumetric Growth Ephemeial Gullies

o a
I Q
TOoLL
-_J
0 0 0 0 0 0
0 0 0 0 0 06 6 6 o 6 6
F26 A Fuiqni) Gtpe us
F26 Appendix F Volumetric Growth Ephemeral Gullies

V U)
0
!0
0 q°S(•a!tlqn ) N(O
o =
F-7
-0
oC0D 0 0 0o 0 0 0 0 0
00
Appendix F Volumetric Growth Ephemeral Gullies

V*ellV1-Ln
0
~wm)U-)
0
Li
-C
00
Si I i i i i i i i i l i .i.- ..1.i if I f i l 1 1 1 T 0
S0 0 0 0 CD 0 00 0 0 0 0 0 0
S(•agA iqno) i•nmOA
F28A
•pndxF olmtrc rwt EhmealGLle

0
Q E )) _ _
C- 4 :7
00
LU
Sz -J
SII I " - Ii I I I i I I' I - I i I - Qi
0 0 0 00 0 0 0 0
6 •
F29Appendix F Volumetric Growth Ephemeral Gullies

a) a) a)ulLn
0
_0
\\\)
Y-
0
S0 0 0 0 0 00 0 0 0 0 0
0 00
S(j.@@. aiqn3) :i NN-IOA
F30 Appendix F Volumetric Growth Ephemeral Gullies

U) UM
C 0
0IOii
00
L_
M-J
M
CDLIJ
0
o 0 0 0 0 0 0 0 06 L 6 u6 6 0i
(19 -JD ýN O
A F31
ApedxFVlmti rot peea ule

S I II _.
Ln LA
"0
LU--z
S-J
S~-J D
S0 0 0: 0 0 0 C:) 0 00 0 0 0 0 0 0 0 0
"10" r3 r) 4 " ,-
S(4G- o:qno) :i1/ OA
F32 Appendix F Volumetric Growth Ephemeral Gullies

!0
,--LO I-•
~III CV
C40
Cm..)
'-"
0-i
.0 _J
I " " " " IT I I • i • ! • , • '
o 0 0 0 0 00 0 0 0 0 0
(@a- ::qno) :i n1n-IOA
F33Appendix F Volumetric Growth Ephemeral Gullies

.oc
LI~J- l-
CD00
0 0 0 0 0 00 0) 0 0 0 0
i C Ui 6 L6 C
C) (:aa- o!qno) 31i n-OA
F34 Appendix F Volumetric Growth Ephemeral Gullies

0
Q4
LL-
1-JC- 0
-0
-N
000 0 0 0
L6 C; Ui 6 L6 C6
(ja@j olqnoD) ]3nn-]OA
Appendix F Volumetric Growth Ephemeral Gullies F35

00)0-
_n
0
L-•-
0c)' rOT
Lb Z.LJ
0S.•-j
• ~--
_0D
0-
-0
0 0 0 0 0 00 0 0 0 0 0
6 65 6 a 6 6Ln 't o C14
S(: - rqno) 3vAmn OA
F36 Appendix F Volumetric Growth Ephemeral Gullies

'-
v °
-0
H- -0
0~~ C 00
2zLUJ
CD
o 0 0 0 0 00 0 0 0 0 0
0 00 0D 00 0
S(1aa- aDlqno) 31iirn mOA
F37Appendix F Volumetric Growth Ephemeral Gullies

Lf Ln LD
N °0
CN
C 0 0 0 0 0 0 0
0: 0 0 0 0 0: 0 0 0
S(4@,g_- oiqno) i1in-mOAFoE
F38 Appenix g Volmetric G owt Zp e ea ule

F-
Co4-LJ
0
SI I 1 t I i I i l l 1 1i " 0
S0 0 0 0 CD 0:
00 0 0 0D 0
(4,G9I oqno) -tANn-OA
F39Appendix F Volumetric Growth Ephemeral Gullies

Appendix GPhotogrammetric Measurementof Gullies
Appendix G Photogrammetric Measurement of Gullies GI

SCOPE OF WORK
PHOTOGRAM-ETRIC MEASUREMENT AND ANALYSIS OF EPHEM2ERAL GULLIES
1. Project Description: The Geotechnical Laboratory (GL), WES is presently
conducting a study of soil loss due to the development of ephemeral gullies
for the Soil Conservation Service (SCS). An ephemeral gully is defined as an
erosional feature resulting from confined surface water runoff, which is larger
than a rill and smaller than a permanent gully. For the purposes of this
project, a rill is defined as having a top-bank width of less than six inches
(15 cm). A permanent gully is an erosional feature which is large enough to
preclude cultivation across it by normal farming operations and, therefore,
becomes a permanent element of the drainage network. Consequently, an ephem-
eral gully is defined as having a width of six inches (15 cm) or more and which
is plowed over (and partially filled) by normal farming operations.
2. The purpose of the study is to provide data on the erosional development of
ephemeral gullies which will be used to derive methods for the prediction of
annual soil loss in agricultural fields due to ephermeral gully growth. Data
developed by photogrammetric analyses will be used in conjunction with soil,
landuse, and meteorological data in the derivation of predictive methods for
estimating soil loss.
3. Documentation of the development of ephemeral gullies will be accomplished
by photogrammetric procedures. Large scaled (1:300) photogrammetrically de-
rived topographic maps of an experimental site will be produced for two dates
(tentatively May 1985 and March 1986) for comparison and volumetric change
analysis. The experimental site is described as follows:
NW, SE, Sec 18, T6N, R2W; 1.5 miles northeast of Bolton, MS in Hinds
County; size, approximately 10 acres; local relief about 11 feet;
current land use, cotton.
Topographic maps constructed of the experimental site will hive contour inter-
vals of sufficient frequency to show all ephemeral gullies within the site
boundaries. Volumetric calculations of the ephemeral gullies will be con-
ducted through the analysis of digital terrain models compiled from photo-
grammetric data.
4. Work to be Performed by Contractor: The contractor will be responsible for
the following:
G2 Appendix G Phologrammetric Measurement of Gullies

a. Development of ground control network accurate to at least 1:10,000.
A local coordinate system may be used which may not be tied to local
permanent geodetic control points. At least five semipermanent
monumented control points will be established on the site. Accuracy
of the ground control network will be subject to independent verification.
b. Specification of flight lines. A sufficient number of flight lines vill
be determined and plotted for the site to insure adequate coverage
by the photogrammetric models.
c. WES will acquire the aerial photographs. High resolution panchromatic
aerial photography (9"X9") will be made using a standard calibrated
metric photogrammetric camera. An uncontrolled mosaic of aerial
photographs and two copies of the individual aerial photoraphs will
be supplied to the contractor for each date of photography. The
aerial photographs will conform to mapping accuracy standards appro-
priate for the accuracy and scale of the photogrammetric products.
d. Production of large scale (1:300) topographic maps. For each date of
photography (two dates), a photogrammetrically derived topographic
map will be produced for the experimental site. The maps will be at
tne scale of 1:300 and be drafted onto translucent (or transparent)
stable base material. All ephemeral gullies, as defined in paragraph i
above, will be shown on the maps by detailed contour lines (contour
interval 0.5 feet).
e. Volumetric analysis of the ephemeral gullies. Computerized photo-
grammetric data will be used to construct digital terrain models for
the site. The digital terrain models will be analyzed to calculate
the volume of each ephemeral gully for each date and to illustrate
graphically the growth of the ephemeral gullies between the two dates
of measurement. After the maps for the second date of photography
have been compiled, changes in the density, length, area, depth, and
volume of the gullies will be analyzed.
f. The topographic maps and volumetric calculations will be supplied to
WES no later than 45 days after the date of the acquisition of the
aerial photography.
5. Assistance Supplied by WES. WES will assist the contractor in locating the
experimental site. WES will also install the monumented control points on the
site to be surveyed by the contractor. WES will also assist the contractor
in other appropriate tasks necessary to the accomplishment of the objectives of
the project as appropriate.
-2-
Appendix G Photogrammetric Measurement of Gullies G3

LRI'SLaboratorv for Remote Sensing and Mapping Science R,. A ei, o Ph I .,
Dr. Lawson SmithU.S. Army Corps of EngineersWaterway- Experiment ýtation3909 Halls Ferry RoadP.O. Box 631Vicksburg, MS 39180 May 19, 1987
Dear Dr. Smith,
With reference to purchase order DACW39-35-M-2368, "PhotograimnetricMeasurement and Analysis of Ephemeral Gullies", please find enclosedone mylar and one paper copy of each of two maps of Gully Erosion Site *3,near Bolton, Mississippi. The maps of 1:300 scale (C.I. = 0.5 foot and1 foot) were prepared by photogrammetric techniques from large scale aerialphotographs (approximately 1:2200 scale) recorded on Oiay 4, 1985 andJanuary 13, 1987.
The total change in volume in the gully area between the two datesis -4067 cubic feet. The total surface area of all of the gully segmentsin the system (delineated as the shaded area on the January 13 map) is0.243 acres, or 10572 square feet. These measurements are summarizedon the attached sheet along with a diagram illustrating which segmentof the gully is represented by each measurement.
These maps and data complete the requirements for this project.If you have any questions, please call me at the number given below.
Sinc ely ycur, /
Roy Welch
Encl: Four (4) map sheets.
Department of Geography University of Georgia Athens, Georgia 30602 1404) 542:--5 Telex 41Q It,1•1
G4 Appendix G Phologrammetric Measurement of Gullies

Laboratory for Remote Sensing and Mapping Science (LRMS)
Department of Geography - University of Georgia
Athens. Georgia 30602 (404) 542-2359
SUMMARY OF RESULTSBolton. MS
Gully Measured Measured Comouted Measured MeasuredSegment Length Surface Area Width Deoth Vol. Change
5/4/615-1i/IS/7
A 521 ft 5269 so ft 10.1 ft 0.58 ft -2081 Cu ftAl 85 547 6.4 0.82 -350
All 55 218 4.0 0.70 -41
A12 53 187 3.5 0.65 -31
A13 48 129 2.7 0.86 -40
A14 80 229 2.9 0.65 -114A2 165 808 4.9 0.69 -344
A3 322 2078 6.5 0.42 -736A4 194 1107 5.7 0.53 -330
Total gully surface area : 10572 sq ft (.243 acres)Avo. gully width : 6.9 ftAvg. gully depth : 0.656 ft (7.9 inches)Total volume chanoe -4067 cu ft
/N
Gully Segment Designation
G5Appendix G Photogrammetric Measurement of Gullies

Form Approved
REPORT DOCUMENTATION PAGE oMmB o 0704-018
Public troo ng bufden for thl collection Of information is estrimate to averae I h0our oer esioone. i•cr dlnui the tim for revie wrnq w•r(O h~nt; *, st,9 d Ala Wo u•¢cngathering Ind ma'frltamrlig the data nee led, a 1,d comaelng and rev.e wng thee colecrton of ,ifOrmation Seen comments regarding thI$s 0o 0en estimate o' anr, 01her 4b .e Orf thi
co9 l|'le oriof Of i nfor ation. including $uggestlOns tor reduc gng th burden to Washington HeodldhArtes "erwies ODrectorate for infoimaiion Ope, at.ons, an RoReprl d• 'S efleisor-
Davis Highway. Suite 1204. ArlingtOn. VA 22Ž024302ý and to the Oftice of Maagenment and Budget PaperworK Reduction Pro et (0704.0188) 1&asn4riMrorr OC 20503
1. AGENCY USE ONLY (Leave blank) 2. REPORT DATE' 3. REPORT TYPE AND DATES COVERED
I August 1993 Final report4. TITLE AND SUBTITLE S. FUNDING NUMBERS
Investigations of Ephemeral Gullies in LoessialSoils in Mississippi
6. AUTHOR(S)
Lawson M. Smith
7. PERFORMING ORGANIZATION NAME(S) AND ADDRESS(ES) 8. PERFORMING ORGANIZATIONREPORT NUMBER
U.S. Army Engineer Waterways Experiment Station Technical ReportGeotechnical Laboratory GL-93-113909 Halls Ferry RoadVicksburg, MS 39180-6199
9. SPONSORING/MONITORING AGENCY NAME(S) AND AODRESS(ES) 10. SPONSORING/ MONITORINGAGENCY REPORT NUMBER
Soil Conservation Service100 West Capitol StreetJackson, Mississippi 39269
11. SUPPLEMENTARY NOTESAvailable from National Technical Information Service, 5285 Port Royal Road, Springfield, VA 22161.
12a. DISTRIBUTION /AVAILABILITY STATEMENT 12b. DISTRIBUTION CODEApproved for public release, distribution is unlimited.
13. ABSTRACT (Maximum 200 words)
Soil loss from agricultural fields due to the development of annual ephemeral gullies may equal or exceed theamount of soil loss from sheet and rill erosion. At the present, there are no widely used procedures for estimatingthe amount of soil loss produced by the annual development of ephemeral gullies. The purpose of this investigationwas to obtain detailed data on the development of ephemeral gullies at four sites in west-central Mississippi overseveral years. The objeciives of the study were to (1) establish four measurement sites in loessial soils, (2) developan accurate and efficient procedure for measuring ephemeral gullies, (3) gather data which describes the develop-ment of the gullies through the cropping cycle, (4) provide additional estimates of the amount of soil loss in tons/acre/year due to ephemeral gullies, and (5) provide recommendations on the use of the data and procedures foracquiring additional data.
Gullies were measured in the field using the "gulliometer" for three cropping cycles during 1983-1985. A totalof 1,350 gully cross-sections were measured in the field. Meteorological stations were also maintained at the sitesduring the period of measurement. Gullies were measured at site three photogrammetrically for the period 3 May1985 to 13 January 1987. Field measurements reveal that although gullies typically go through periods of erosion
(Continued)
14. SUBJECT TERMS 15. NUMBER OF PAGESEphemeral gullies Photogrammetry 224Gulliometer Soil erosion 16. PRICE CODELoessial soil Soil measurement
17. SECURITY CLASSIFICATION 18. SECURITY CLASSIFICATION 19. SECURITY CLASSIFICATION 20. LIMITATION OF ABSTRACTOF REPORT OF THIS PAGE OF ABSTRACT
UNCLASSIFIED UNCLASSIFIEDNSN 7540-01-280-5500 Standard rorm 298 (Rev 2-89)
esc( lt*d by ANSi Sid 1f9-18298 102

13. (Continued).
and deposition during a cropping cycle, much of the linear development of the gully channel occurs within twomonths after planting during normal precipitation. After the crop is harvested, the gullies deepen over the fall andwinter.