Embed Size (px)
Citation preview
Project code: E.PDS.1410 & L.PDS.1803
Prepared by: Ian Gamble – Agriculture Victoria Gervaise Gaunt – Agriculture Victoria
Kirsty Howard – Inspiring Excellence
Date published: July 1 2019
PUBLISHED BY
Meat and Livestock Australia Limited
Locked Bag 1961
NORTH SYDNEY NSW 2059
Finishing systems for growing lambs
Meat & Livestock Australia acknowledges the matching funds provided by the Australian Government to support the research and development detailed in this publication.
This publication is published by Meat & Livestock Australia Limited ABN 39 081 678 364 (MLA). Care is taken to ensure the accuracy of the information contained in this publication. However MLA cannot accept responsibility for the accuracy or completeness of the information or opinions contained in the publication. You should make your own enquiries before making decisions concerning your interests. Reproduction in whole or in part of this publication is prohibited without prior written consent of MLA.
final report
E.PDS.1410 Final Report – Finishing systems for growing lambs
Page 2 of 55
Abstract
The aim of this farming systems demonstration was to explore feeding methods that would enable a higher proportion of lambs to reach sale weights prior to the end of the spring flush and to reduce the number of carry-over lambs. It was conducted over two years using demonstration sites provided by two producer members of the Bullioh Best Wool Best Lamb (BWBL) Group in the Upper Murray region of Victoria.
Lamb growth rates were monitored at two demonstration sites and compared to ewe condition score, feed on offer and pasture quality under normal seasonal conditions. In Year 1 the purpose was to identify feed gaps and how these gaps impacted on lamb growth rates and Year 2 was to implement strategies to increase lamb growth rates.
Results identified that the greatest nutritional limitations occurred in late pregnancy and early lactation which impacted on ewe condition score and early lamb growth rates but were followed by adequate growth rates (300 g/day or more) occurring between marking and first sale of lambs and coinciding with the spring flush.
Time of lambs being sold and its impact on income and the value of joining ewe lambs were also explored.
Group members acknowledged the value of monitoring lamb growth rates, ewe condition and pasture quality and quantity. However, it takes considerable time for producers to gain the confidence to use these skills and to invest in electronic identification equipment when they have small (<1000 ewes) flocks.
An evaluation of group members showed improvements in all parameters measured. These included 57% increase in knowledge (range between 21% increase to 105% increase), 35% for attitude (range between 13%increase to 79% increase), 58% for skills (range between 28% increase to 121% increase), 29% for aspirations (range between 16% increase to 43% increase) and 35% for adoption (range between 2% increase to 106% increase).
The ADOPT model was used to predict the likely adoption profile against the innovation of monitoring to optimise lamb production with prime lamb producers with less than 1000 ewes. Results predicted the peak level of adoption of 83% would take 20 years.
An economic analysis of spreading the sale of lambs produced and the additional costs found a $35/head net gain of selling prime lambs born June/July at the end of the spring flush (1 December), compared to carrying lambs over and selling 8 months later (31 July).
E.PDS.1410 Final Report – Finishing systems for growing lambs
Page 3 of 55
Executive summary One of the issues facing the members of the Bullioh Best Wool Best Lamb (BWBL) group, located in
the Upper Murray region of Victoria, is finishing lambs to sale weights before the end of the spring
flush. Members of the group were interested in exploring what feeding methods would enable a
higher proportion of both the autumn and spring drop lambs to reach sale weights prior to the end
of the spring flush and reduce the number of carry-over lambs. The secondary benefit of having
more lambs sold by the end of December was expected to be a reduction in stocking rate over
summer. The group was also interested in getting ewe lambs to joining weight for early joining.
The aim of this demonstration was to explore feeding methods that would enable a higher
proportion of lambs to reach sale weights prior to the end of the spring flush and to reduce the
number of carry-over lambs.
The demonstration was conducted over two years using two sites. Each site was located on a
different host producer property. The first year of the demonstration was aimed at establishing a
base line for lamb growth rates, pasture quality and quantity, and ewe condition. The purpose was
to identify where feed gaps existed, how those gaps impacted on lamb growth as well as
demonstrating how individual animal monitoring using Electronic Identification (EID) tags coupled
with pasture and ewe condition monitoring could be done on farm. Demonstration site 1 (Producer
A) monitored a mob of 2nd cross twin lambs while demonstration site 2 (Producer B) monitored the
growth of two mobs being single and twin White Suffolk lambs, with maiden and adult ewes run
separately. Lambs were monitored from marking until first sale of lambs. Demonstration site 1
(Producer A) continued monitoring until all lambs were sold.
The second year of the demonstration monitored lambs from only site 2 (Producer B), this time
separated into four mobs of White Suffolk lambs; singles and twins from maiden ewes and singles
and twins from adult ewes. Lamb liveweight, growth rate, ewe condition score, pasture quality and
quantity data were collected for each mob and paddock. Sale data and replacement ewe lamb
weight at joining was also recorded. Lambs were monitored from marking until the end of
December.
The results from Year 1 of the demonstration showed all lambs achieved adequate to high growth
rates from marking until sale of first lambs (345-366 g/day). Monitoring of ewe condition score and
pasture quality and quantity highlighted how differences in observed growth rates of lambs were
related to these measures. In particular, one mob from site 2 had lower growth rates that were
related to lower quality feed early in lactation. The results also highlighted that a feed gap existed in
the period of late pregnancy to marking for all mobs, that led to ewes having lower than desired
condition scores at marking. Continued monitoring of lambs from site 1 over summer showed how
growth rate reduced after the spring flush but could be manipulated with higher quality feed if it
was available. Both sites sold approximately 70% of lambs before the end of December.
At site 2 in the second year of the demonstration the initial aim was to trial creep feeding lambs in
paddocks with lower quality feed (identified in Year 1). However, an unseasonably wet winter meant
conditions were not suitable for installing and servicing feeders in paddocks and it was anticipated
that feed would not be limiting.
E.PDS.1410 Final Report – Finishing systems for growing lambs
Page 4 of 55
The results showed this to be the case for three out of four paddocks, with one having lower feed
quality and quantity in early lactation than the others. Growth rates for all lambs averaged 372
g/day but for one mob (single lambs from maiden ewes), their performance was compromised early
in lactation and this mob never made up the difference in weights compared with the other mobs.
Lambs were sold in November 2016 with 76% of the saleable lambs sold by the end of December.
Of the 24% of lambs carried over, the majority could have been sold by the end of December as they
were nearly all at target weight (only four under 40 kg), however, they were shorn and kept for later
sale. This decision prompted discussion in the group as to the value of keeping carry-over lambs.
Selling lambs earlier in the season was discussed as to the trade-off between falling prices and
increasing carcass weight. As lambs were sold by auction rather than over-the-hooks and not
weighed prior to sale, this question could not be fully answered. It was observed throughout the
demonstration that growth rates dropped dramatically from early November to late December
(from over 300 g/day to less than 100 g/day).
There were 81 ewe lambs kept as replacements which were weighed prior to joining with an average
weight of 53.2 kg and a minimum of 42 kg. The ewe lambs were joined for 6 weeks starting 26th
December and pregnancy scanned in April. Only 2 ewe lambs conceived from the 81 which was a
disappointing result. The reasons for the low conception rates were thought to be related to ewe
lambs being on a falling plain of nutrition prior to and at joining, still being physiologically immature
and due to the genetic influence of seasonal breeding (White Suffolk sheep are known seasonal
breeders).
Nine extension events were conducted throughout the demonstration as group meetings to teach
group members how to monitor lamb growth rates, ewe condition, pasture quality and quantity as
well as share the results and learnings from the demonstration. A field day attracting 25 participants
was held at the completion of the demonstration to share the results and learnings to a broader
audience.
Evaluation data collected on the change in Knowledge, Attitude, Skills, Aspirations and Adoption
(KASAA) of the Bullioh BWBL group members showed a positive shift in all categories reflecting
members’ observations that they had all taken home something of value.
The major outcomes for the Bullioh BWBL group members were:
1. Increased understanding on the impact of ewe condition, feed quality and quantity on lamb
growth rates and overall live weight.
2. The benefits of monitoring growth of individual lambs to predict sale weight and the sale date
for lambs.
3. An understanding of the factors that impact on the ability of ewe weaners to conceive a lamb at
7-8 months of age.
An analysis using the ADOPT process showed that the demonstration outcomes had a predicted
peak level of adoption of 83%. However, this would take 20 years to reach peak adoption for the
target audience of producers with flocks of less than 1000 ewes. These findings were mainly due to
the perception of the high cost of equipment and the time taken to monitor, relative to flock size,
the growth rates of lambs. This has prompted further extension questions in relation to
demonstrating the benefits of monitoring, based on more affordable equipment, and training into

E.PDS.1410 Final Report – Finishing systems for growing lambs
Page 5 of 55
how to monitor. Relating these benefits of monitoring to increasing farmers enjoyment and
satisfaction from farming were suggested.
An economic analysis of spreading the sale of lambs produced and the additional costs found a $35/head net gain of selling prime lambs born June/July at the end of the spring flush (1 December) as compared to carrying lambs over and selling 12 months later (31 July). The analysis considered the benefits, costs and risk of carrying over lambs after 1 December based on a pasture system. The results showed lower returns when lambs are carried over, compared to selling by 1 December and alternative strategies should be considered. Carryover of lambs after 1 December highlights the risk of decreased daily growth rates, additional labour cost and exposure to lamb price risk.
E.PDS.1410 Final Report – Finishing systems for growing lambs
Page 6 of 55
Table of contents
1 Background ........................................................................................... 8
1.1 The Bullioh BESTWOOL/BESTLAMB Group ..................................... 8
1.1.1 Finishing lambs to target weights ......................................................................... 8
2 Project objectives .................................................................................. 9
2.1 Specific Objectives ......................................................................... 9
3 Methodology ......................................................................................... 9
3.1 Year 1 – Collecting base line data ................................................... 9
3.1.1 Monitoring methodology ..................................................................................... 9
3.1.2 Demonstration site 1 – Producer A .................................................................... 10
3.1.3 Demonstration site 2 – Producer B .................................................................... 10
3.2 Year 2 .......................................................................................... 11
3.2.1 Demonstration site 1 – Producer A .................................................................... 11
3.2.2 Demonstration site 2 – Producer B .................................................................... 11
3.3 Extension activities ...................................................................... 11
3.3.1 Year 1 Extension activities .................................................................................. 11
3.3.2 Year 2 Extension activities .................................................................................. 12
3.3.3 Monitoring and Evaluation ................................................................................. 12
4 Results ................................................................................................. 13
4.1 Year 1 .......................................................................................... 13
4.1.1 Demonstration site 1 – Producer A .................................................................... 13
4.1.2 Demonstration site 2 – Producer B .................................................................... 14
4.2 Year 2 .......................................................................................... 15
4.2.1 Demonstration site 1 – Producer A .................................................................... 15
4.2.2 Demonstration site 2 – Producer B .................................................................... 15
4.3 Extension activities ...................................................................... 21
4.3.1 Group attendance/field day attendance ............................................................ 21
4.3.2 KASAA Evaluation Survey Results ....................................................................... 21
4.3.3 ADOPT outcomes ................................................................................................ 23
5 Discussion............................................................................................ 25
5.1 Year 1 – establishing a baseline .................................................... 25
5.1.1 Year 1 data .......................................................................................................... 26

E.PDS.1410 Final Report – Finishing systems for growing lambs
Page 7 of 55
5.1.2 Extension of Year 1 results and data collection skills ......................................... 26
5.2 Year 2 – deepening the understanding ......................................... 28
5.2.1 The need for demonstration re-design .............................................................. 28
5.2.2 Year 2 data .......................................................................................................... 28
5.2.3 Outcomes of Year 2 ............................................................................................ 30
5.3 Extending the results to others ..................................................... 31
5.3.1 Involvement of the Bullioh BWBL group members ............................................ 31
5.3.2 Change in KASAA ................................................................................................ 31
5.3.3 ADOPT ................................................................................................................. 32
6 Conclusions/recommendations ........................................................... 36
6.1 Overall outcomes of the demonstration ....................................... 36
6.1.1 Outcomes for individuals .................................................................................... 36
6.1.2 Outcome for the group ....................................................................................... 37
6.2 Recommendations for improving the outcomes of the demonstration ............................................................................. 37
6.2.1 Challenges to the demonstration ....................................................................... 37
6.2.2 Implications to the Red Meat Industry ............................................................... 38
6.2.3 Achieving full value from the project findings ................................................... 39
7 Economic Analysis ............................................................................... 40
7.1.1 Assumptions ....................................................................................................... 40
7.1.2 Results ................................................................................................................. 41
7.1.3 Breakeven analysis ............................................................................................. 42
7.1.4 Sensitivity Analysis .............................................................................................. 42
7.1.5 Opportunity Cost ................................................................................................ 42
7.1.6 Key Decision Drivers: .......................................................................................... 42
8 Bibliography ........................................................................................ 44
9 Appendix ............................................................................................. 45
9.1 Field day program ........................................................................ 45
9.2 Group evaluation ......................................................................... 46
9.3 ADOPT report............................................................................... 47
E.PDS.1410 Final Report – Finishing systems for growing lambs
Page 8 of 55
1 Background
1.1 The Bullioh BESTWOOL/BESTLAMB Group
The Bullioh Best Wool Best Lamb (BWBL) group was formed in 2011 to provide sheep producers in
the area a forum to discuss ways of improving the management of their sheep enterprises as well as
coordinate efforts to manage wild dogs with the Department of Environment, Land, Water and
Planning (DELWP).
The group is located in the Upper Murray region of North East Victoria. Group meetings have
covered a range of topics including lamb survival, pasture and soil management, wool marketing,
animal health, managing hill country and wild dog control.
In recent years, the membership of the group has declined from 15 businesses to less than 10. This
prompted the remaining group members to review the benefits of being in the group and a decision
was made that demonstrating the value of the group through participation in a farming systems
demonstration (FSD) on a common issue may attract additional members and provide current
members with valuable, targeted information.
Finishing lambs to target weights
One of the issues facing group members is finishing lambs to target sale weights before the spring
flush ends. Members of the group were interested in exploring what feeding methods would enable
a higher proportion of both the autumn and spring drop lambs to reach target sale weights prior to
the end of the spring flush, before pasture quality declines and reduce the number of carry-over
lambs into the following year. The secondary benefit of having more lambs sold by the end of
December is a reduction in stocking rate over summer. This would enable either:
1. The same number of ewes to be carried with reduced supplementary feeding or
2. Increase the number of ewes that can be carried over summer at the same supplementary
feeding levels.
The group members with self-replacing flocks were also interested in joining maiden ewes as lambs
to increase efficiency but currently struggle to have ewe lambs reach target-joining weights. Feeding
strategies that would enable more ewe lambs to reach target-joining weights in their first year
would allow these farms to better manage stocking rates of their breeders due to carrying less
unproductive dry units.
The feeding method the group chose for this Agriculture Victoria and MLA co-funded project was to
trial creep feeding of unweaned young stock, using different forms of supplementary feeding; ie:
pellets/silage/grains (dependent on season and cost). There is limited supplementary feeding using
grain in this region, especially to sheep. Most farms rely on hay, silage and pasture (improved and
native) to meet the nutritional requirements of their stock. Summer pasture and hay are
nutritionally unsuitable for growing lambs to sale weights/joining weights and most do not feed
silage to sheep.
E.PDS.1410 Final Report – Finishing systems for growing lambs
Page 9 of 55
2 Project objectives
To explore feeding methods that would enable a higher proportion of lambs to reach target sale
weights prior to the end of the spring flush;
To reduce the number of carry-over lambs into the following year.
2.1 Specific Objectives
Main objectives
1. Increase the number of lambs that reach target market weight by the end of the spring flush
2. Improve lamb and weaner survival, particularly when grazed on low quality native pasture
3. Increase the reproduction rate of ewes by being in better condition at weaning and subsequent joinings
Secondary Objectives
1. Increase the total number of ewes run by not carrying as many lambs over summer or reduce supplementary feeding rates for the same number of ewes carried over summer.
2. Increase the number of ewe lambs reaching the desired minimum joining weight of 42 kg at 7 months of age (for self-replacing flocks only)
3. Reduce grass seed contamination by having fewer carry-over lambs
3 Methodology
3.1 Year 1 – Collecting base line data
As none of the Bullioh BWBL group members had monitored growth rates in lambs, the first year of
the demonstration was aimed at establishing a base line for growth rates, pasture quality and
quantity and ewe condition. The purpose was to identify where feed gaps existed, how those gaps
impacted on lamb growth and to demonstrate how individual animal monitoring using Electronic
Identification (EID) coupled with pasture and ewe condition monitoring could be done on farm. Two
members of the group volunteered to be part of the demonstration and Agriculture Victoria
provided scales and electronic identification monitoring equipment to enable the data to be
captured.
Two sites were established for year 1 of the demonstration.
Monitoring methodology
The following techniques were used to collect base line data
1. Lamb live weights – lambs were tagged with Shearwell electronic identification tags at
marking or soon after. Where possible their birth type (singles/multiples) and gender
(ewes/wethers/rams) were recorded plus breed and birth date range. TruTest weigh scales
with a Gallagher TSi indicator were used to weigh lambs. Tags were read using a Gallagher
wand (HR5) and/or a Trutest panel reader and data linked using bluetooth to the indicator.
E.PDS.1410 Final Report – Finishing systems for growing lambs
Page 10 of 55
Individual weights were downloaded from the indicator to Excel and analysed. Individual
weights of lambs were compared between weighings to determine individual growth rates
and average growth rates for each mob, birth type and gender expressed as average daily
gain between weighings and over the lamb’s lifetime.
2. Pasture quality and quantity – Pastures were assessed for quality using visual appraisal and
quality analysis. Samples were randomly harvested from paddocks, bulked and sent for
testing of Protein (%), Metabolisable Energy (ME) in MJ/kg DM and Dry Matter (DM) as %.
Quantity was estimated using the MLA pasture stick as well as visually using the Lifetime
Ewe – Feed on Offer (FOO) Photo Gallery for South Eastern Australia and values expressed as
kg DM/ha.
3. Ewe condition score – Ewe condition score was monitored using the method prescribed in
the Lifetime Ewe Management course and averaged for each mob. Condition score (CS) is
expressed as a number between 1 (low) and 5 (high).
Demonstration site 1 – Producer A
Site 1 was on a property at Burrowye owned by a producer referred to in this report as Producer A.
Demonstration lambs (n=376) were 2nd cross twin lambs. These lambs and ewes were run as one
mob rotating between two improved pasture paddocks.
Data was collected from this demonstration site at the following times:
1. Marking: (6th July 2015 – 3 days post marking). Data collected included lamb marking
weight, FOO and pasture quality and quantity.
2. Mid-way: (9th September). Data collected included lamb weight, ewe condition score (CS)
from a sample of ewes, FOO and pasture quality and quantity.
3. Pre-sale: (16th October 2015). Data collected included lambs’ weight and ewe CS from a
sample. A representative sample of 125 lambs from a single bearing ewe mob were
weighed for a comparison of liveweight.
4. Pre-sale: (17th November 2015). Remaining demonstration lambs (n=170) were weighed.
5. Pre-sale: (18th February 2016). Remaining demonstration lambs (n=20) were weighed prior
to sale.
Demonstration site 2 – Producer B
Site 2 was on a property at Cudgewa owned by a producer referred to in this report as Producer B.
Demonstration lambs were White Suffolk lambs (n=241) run in two separate mobs being lambs from
adult ewes (n=116) and lambs from maiden ewes (n=125). Mobs were set stocked on improved
pasture paddocks.
Data was collected from this site at the following times:
1. Marking (20th August 2015 – 2 weeks post marking). Data collected included lamb marking
weight, FOO and pasture quality. Condition score was obtained for a representative sample
of ewes.
2. Pre-sale (15th October 2015). Data collected included lamb weight, ewe CS from a
representative sample, FOO, pasture quality and quantity. The heaviest lambs (over 48kg)
were identified for sale.
E.PDS.1410 Final Report – Finishing systems for growing lambs
Page 11 of 55
3.2 Year 2
Demonstration site 1 – Producer A
This site was withdrawn from the demonstration in 2016 due to unexpected circumstances.
Demonstration site 2 – Producer B
This site continued in the second year based on four White Suffolk lamb mob treatments (n=349).
Each mob was run in a separate paddock from lambing until the first draft of lambs were sold. As
pregnancy scanning was not undertaken, ewes with singles were drifted off to create mobs of singles
and multiples for monitoring. A selection of ram lambs was left unmarked, for use as future
breeding stock.
Four mobs were monitored:
1. Maiden ewes with single lambs – Shed Paddock (n=76, ewes=39, wethers=29, rams=8)
2. Maiden ewes with multiple lambs – Caravan Paddock (n=98, ewes=46, wethers=48, rams=4)
3. Adult ewes with single lambs – Hill Paddock (n=93, ewes=40, wethers=52, rams=1)
4. Adult ewes with multiple lambs – 50 Acres Paddock (n=82, ewes=33, wethers=47, rams=2)
Data was collected from this demonstration site at the following times:
1. Marking: (28th August 2016 – 2 weeks post marking). Data collected included lamb marking
weight, ewe CS, FOO and pasture quality.
2. Mid way: (23rd September 2016) Data collected included lamb weight, ewe CS from a
representative sample, FOO, pasture quality and quantity.
3. Mid way: (13th/23rd October 2016) Data collected included lamb weight, ewe CS from a
representative sample, FOO, pasture quality and quantity.
4. Pre-sale weights: (8th/11th November 2016) Data collected included lamb weight, ewe CS
from a representative sample, FOO, pasture quality and quantity. Lambs at this stage were
unweaned. Lambs were then drafted by weight and three lots of lambs were sold between
10th November and 17th November 2016.
5. Carry-over and replacement ewe lambs: (1st December 2016) The remaining 134 lambs
(carry-over lambs = 62 and replacement ewe lambs = 81) were weaned, shorn and weighed
post-shearing.
6. Pre-joining: (26th December 2016) The replacement ewe weaners were weighed prior to
joining.
These ewe weaners were pregnancy scanned on 3rd April 2017 following a six week joining (26th December 2016 to 6th February 2017).
3.3 Extension activities
Year 1 Extension activities
Bullioh BWBL group meetings
Two group meetings were scheduled to coincide with marking and pre-sale data collection at site 2.
As well as a group discussion about the demonstration, training was incorporated on both days
E.PDS.1410 Final Report – Finishing systems for growing lambs
Page 12 of 55
which included EID tagging and weighing lambs, FOO pasture assessment, pasture sampling for feed
quality and ewe CS. Progressive results were presented at a group meeting in February 2016 and
the final results for Year 1 were presented to the group at their April 2016 meeting for discussion
and planning of Year 2.
Year 2 Extension activities
Bullioh BWBL group meetings
Three Bullioh BWBL group meetings occurred to coincide with the monthly demonstration activities
on 23rd September, 13th October and 1st December 2016. Group members in attendance
participated in tasks of scanning EID tags and weighing lambs, ewe CS, FOO, pasture quality
assessments and collecting pasture samples for nutritive analysis. The group was presented with the
results to date at the October 2016 and December 2016 meetings for discussion and planning of
future activities.
Field day - June 1st 2017
Group members agreed to promote the group and the lamb demonstration to other district sheep
producers for the purpose of sharing the learnings from the demonstration and increasing
membership. The co-ordinator of the Bullioh BWBL Group, Agriculture Victoria’s co-ordinator of this
Farming System Demonstration (FSD) and the regional DELWP Community Wild Dog Control
Coordinators organised and promoted the field day to regional sheep producers in the Upper
Murray and southern NSW. The program for the field day can be found in Appendix 9.1.
Monitoring and Evaluation
KASAA change
Pre and post questionnaires were conducted with the Bullioh BWBL group members to evaluate
their change in Knowledge, Attitude, Skills, Aspirations, Adoption (KASAA).
ADOPT workshop
To gain a better understanding of the impact of the project with the Bullioh BWBL group members, a
workshop was held on the 28th September 2017 to take the group through the Adoption and
Diffusion Outcome Prediction Tool (ADOPT) process (Kuehne et al, 2017). This process is used to
predict the likely extent and speed of adoption of the innovation for this demonstration.
E.PDS.1410 Final Report – Finishing systems for growing lambs
Page 13 of 55
4 Results
4.1 Year 1
Demonstration site 1 – Producer A
1. Growth rates
Twin lamb average weight was 16.2 kg at marking (6/7/15), 33.5 kg mid way (9/9/15) and 46.3 kg pre
sale (16/10/15) (Table 1). Single lambs were not EID tagged but were weighed pre-sale to provide a
benchmark for single lambs and averaged 48.8 kg pre sale weight. The average daily growth (ADG)
rate between marking and mid-way was 267 g/day and between marking and pre-sale was 345
g/day (Table 1).
Table 1: Average liveweights (kg) and ADG rates between consecutive weighings (g/day) for site 1 (Producer A)
July Wt 1 (Marking)
N=376
Sept Wt 2 N=328
Oct WT 3 N=347
Nov Wt 4 N=170
Feb Wt 5 N=120
Female 15.8 32.5 44.8 43.6 44.2
Male 16.5 34.7 48.1 51.5 62.8
ADG g/day 267 345 80 181
Single Wt 48.8
AVG Wt 16.2 33.5 46.4 50.6 53.1
2. Pasture quality and quantity
Table 2 shows pasture feed quality and Feed on Offer (FOO) results of pasture assessed at various times throughout the season and lamb growth cycle. The data indicates although pasture quality is reasonable, FOO is most limiting at the time of lambing and marking when the nutritional requirement of ewes is at a peak.
Table 2: Site 1 (Producer A) pasture feed quality and FOO results
Date Timing DM% CP% ME (MJ/kg
DM) FOO (kg/ha)
14/05/2015 Lambing 34.9 12.1 6.2 NA
6/07/2015 Marking 18.4 25.2 9.1 600
9/09/2015 Mid-way 15.5 27.6 11.7 2300
16/10/2015 Pre-sale 1 25.3 21.5 9.7 1700
17/11/2015 Pre-sale 2 51.9 9.4 8.2 800
18/2/2016 Pre-sale 3 31.6 14.3 10.1 2000
18/2/2016 Lucerne 22.5 28.1 11 3500
E.PDS.1410 Final Report – Finishing systems for growing lambs
Page 14 of 55
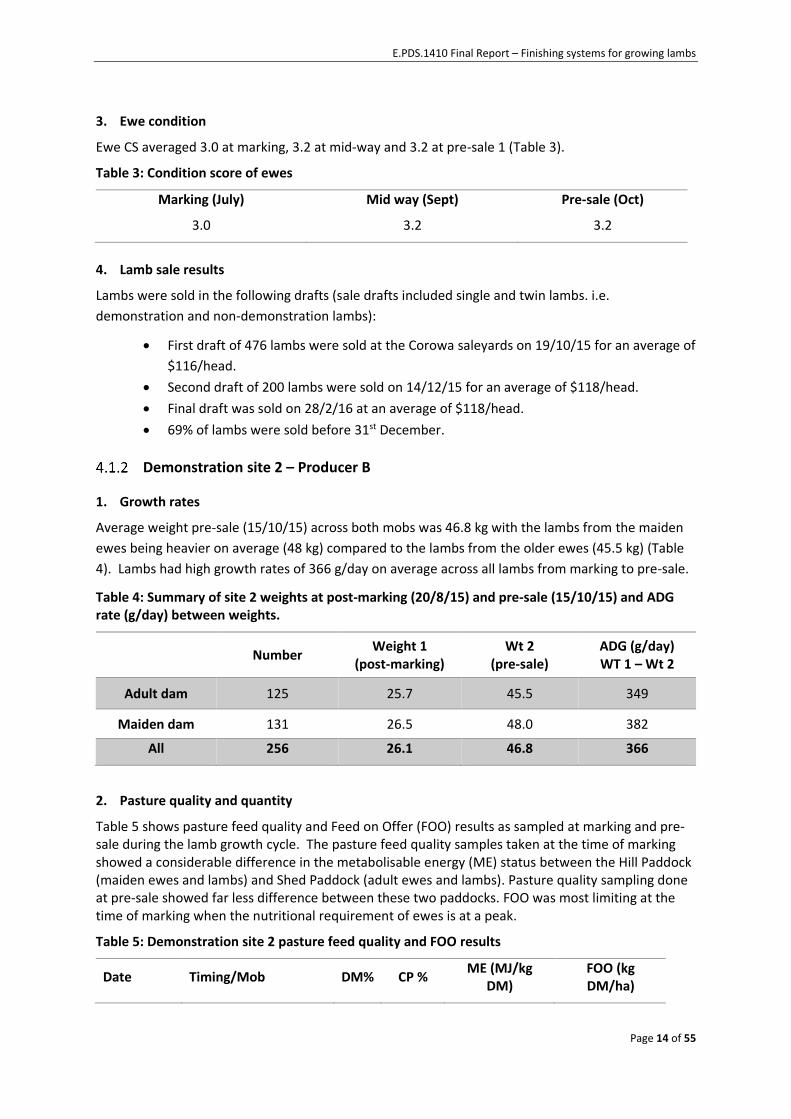
3. Ewe condition
Ewe CS averaged 3.0 at marking, 3.2 at mid-way and 3.2 at pre-sale 1 (Table 3).
Table 3: Condition score of ewes
Marking (July) Mid way (Sept) Pre-sale (Oct)
3.0 3.2 3.2
4. Lamb sale results
Lambs were sold in the following drafts (sale drafts included single and twin lambs. i.e.
demonstration and non-demonstration lambs):
First draft of 476 lambs were sold at the Corowa saleyards on 19/10/15 for an average of
$116/head.
Second draft of 200 lambs were sold on 14/12/15 for an average of $118/head.
Final draft was sold on 28/2/16 at an average of $118/head.
69% of lambs were sold before 31st December.
Demonstration site 2 – Producer B
1. Growth rates
Average weight pre-sale (15/10/15) across both mobs was 46.8 kg with the lambs from the maiden
ewes being heavier on average (48 kg) compared to the lambs from the older ewes (45.5 kg) (Table
4). Lambs had high growth rates of 366 g/day on average across all lambs from marking to pre-sale.
Table 4: Summary of site 2 weights at post-marking (20/8/15) and pre-sale (15/10/15) and ADG rate (g/day) between weights.
Number Weight 1
(post-marking) Wt 2
(pre-sale) ADG (g/day) WT 1 – Wt 2
Adult dam 125 25.7 45.5 349
Maiden dam 131 26.5 48.0 382
All 256 26.1 46.8 366
2. Pasture quality and quantity
Table 5 shows pasture feed quality and Feed on Offer (FOO) results as sampled at marking and pre-sale during the lamb growth cycle. The pasture feed quality samples taken at the time of marking showed a considerable difference in the metabolisable energy (ME) status between the Hill Paddock (maiden ewes and lambs) and Shed Paddock (adult ewes and lambs). Pasture quality sampling done at pre-sale showed far less difference between these two paddocks. FOO was most limiting at the time of marking when the nutritional requirement of ewes is at a peak.
Table 5: Demonstration site 2 pasture feed quality and FOO results
Date Timing/Mob DM% CP % ME (MJ/kg
DM) FOO (kg DM/ha)

E.PDS.1410 Final Report – Finishing systems for growing lambs
Page 15 of 55
20/08/2015 Marking
Maiden - Hill Paddock 15.6 24.9 9.4 550
Adult - Shed Paddock 18 17.8 5.2 533
15/10/2015 Pre-sale
Maiden - Hill Paddock 23.8 15 9.4 2100
Adult - Shed Paddock 18.3 21.5 10 2000
3. Ewe condition
Ewe condition scores averaged 2.7 for maiden ewes and 2.6 for adult ewes at marking and 3.25 for maiden ewes and 3.1 for adult ewes at pre-sale (Table 6).
Table 6: Trail site 2 (Producer B) Ewe condition score
Condition Score 2015 Marking (August) Pre Sale (October)
Maiden 2.7 3.25
Adult 2.6 3.1
4. Sales results
Lambs were sold in the following drafts (mixed in with non-demo lambs)
Heavier lambs (n=264) sold at Corowa saleyards on;
o 19/10/15 (46 at $128 and 40 at $116),
o 19/11/15 (40 at $137 and 45 at $116),
o 26/11/15 (45 at $122 and 50 at $104)
80 lambs sold at Wagga Wagga saleyards in April, 2016 and averaged $124.
30 lambs were carried over summer for sale in autumn/winter (no sale data recorded).
The average price received overall was $120/head and 71% were sold before 31st December.
4.2 Year 2
Demonstration site 1 – Producer A
This site was withdrawn in 2016 due to unexpected circumstances.
Demonstration site 2 – Producer B
1. Growth rates
Average pre-sale weight (8 and 10/11/16) across all mobs (n=349) was 53.5 kg with lambs from the Adult Single mob being on average heavier (56.7 kg) than lambs from all other treatments (Table 7). Lambs maintained high growth rates of 372 g/day from weight 1 to weight 4 (marking to first sale) which was slightly higher than average daily weight gains observed from last season (average 366 g/day from marking to pre-sale).
E.PDS.1410 Final Report – Finishing systems for growing lambs
Page 16 of 55
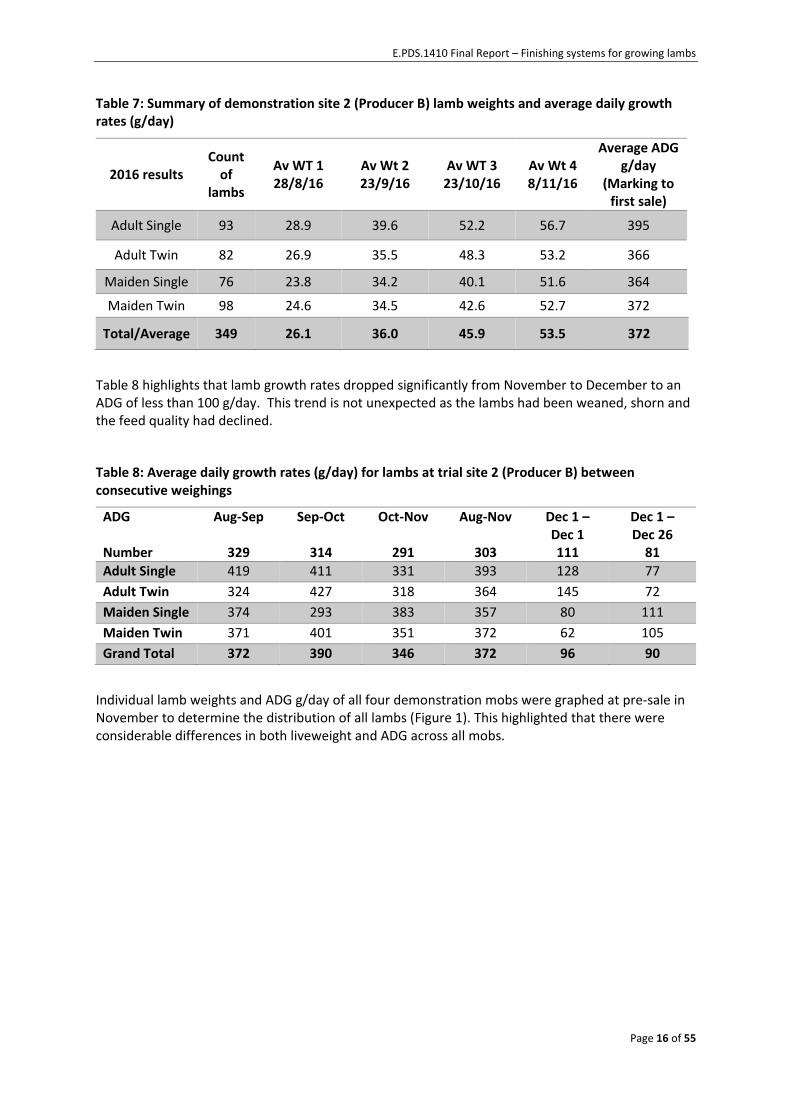
Table 7: Summary of demonstration site 2 (Producer B) lamb weights and average daily growth rates (g/day)
2016 results Count
of lambs
Av WT 1 28/8/16
Av Wt 2 23/9/16
Av WT 3 23/10/16
Av Wt 4 8/11/16
Average ADG g/day
(Marking to first sale)
Adult Single 93 28.9 39.6 52.2 56.7 395
Adult Twin 82 26.9 35.5 48.3 53.2 366
Maiden Single 76 23.8 34.2 40.1 51.6 364
Maiden Twin 98 24.6 34.5 42.6 52.7 372
Total/Average 349 26.1 36.0 45.9 53.5 372
Table 8 highlights that lamb growth rates dropped significantly from November to December to an ADG of less than 100 g/day. This trend is not unexpected as the lambs had been weaned, shorn and the feed quality had declined.
Table 8: Average daily growth rates (g/day) for lambs at trial site 2 (Producer B) between consecutive weighings
ADG Number
Aug-Sep
329
Sep-Oct
314
Oct-Nov
291
Aug-Nov
303
Dec 1 – Dec 1 111
Dec 1 – Dec 26
81
Adult Single 419 411 331 393 128 77
Adult Twin 324 427 318 364 145 72
Maiden Single 374 293 383 357 80 111
Maiden Twin 371 401 351 372 62 105
Grand Total 372 390 346 372 96 90
Individual lamb weights and ADG g/day of all four demonstration mobs were graphed at pre-sale in November to determine the distribution of all lambs (Figure 1). This highlighted that there were considerable differences in both liveweight and ADG across all mobs.
E.PDS.1410 Final Report – Finishing systems for growing lambs
Page 17 of 55
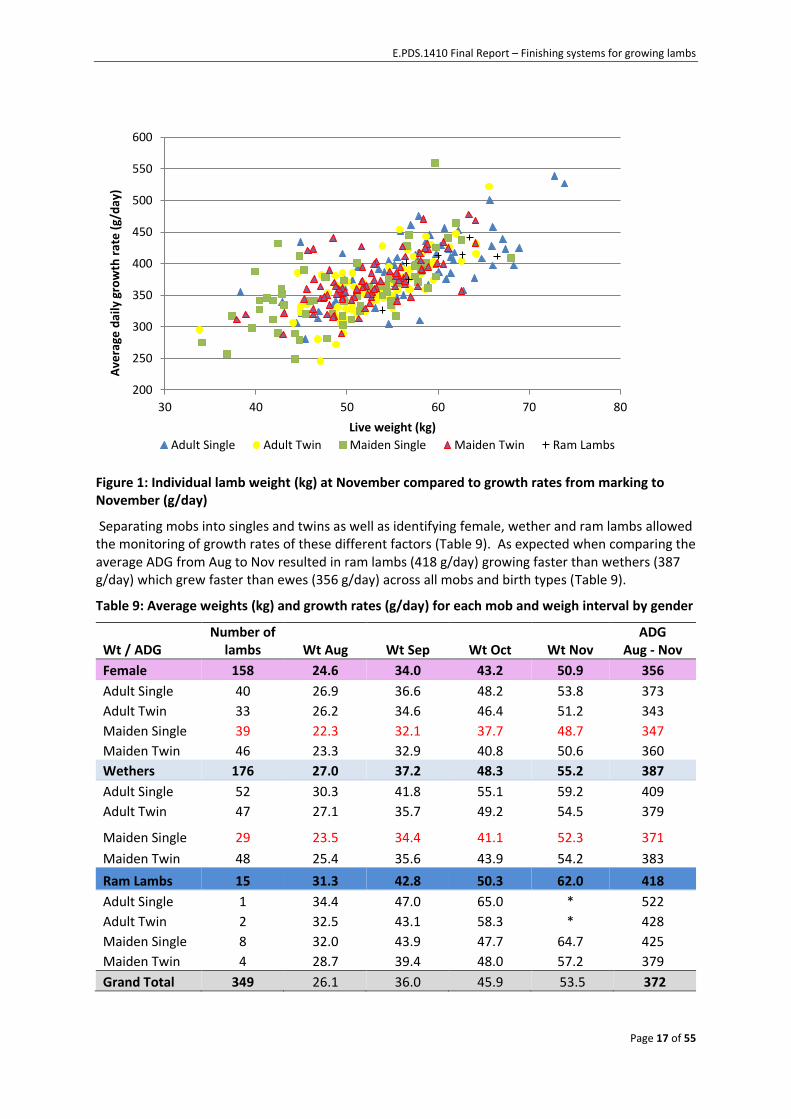
Figure 1: Individual lamb weight (kg) at November compared to growth rates from marking to November (g/day)
Separating mobs into singles and twins as well as identifying female, wether and ram lambs allowed the monitoring of growth rates of these different factors (Table 9). As expected when comparing the average ADG from Aug to Nov resulted in ram lambs (418 g/day) growing faster than wethers (387 g/day) which grew faster than ewes (356 g/day) across all mobs and birth types (Table 9).
Table 9: Average weights (kg) and growth rates (g/day) for each mob and weigh interval by gender
Wt / ADG Number of
lambs Wt Aug Wt Sep Wt Oct Wt Nov ADG
Aug - Nov
Female 158 24.6 34.0 43.2 50.9 356
Adult Single 40 26.9 36.6 48.2 53.8 373
Adult Twin 33 26.2 34.6 46.4 51.2 343
Maiden Single 39 22.3 32.1 37.7 48.7 347
Maiden Twin 46 23.3 32.9 40.8 50.6 360
Wethers 176 27.0 37.2 48.3 55.2 387
Adult Single 52 30.3 41.8 55.1 59.2 409
Adult Twin 47 27.1 35.7 49.2 54.5 379
Maiden Single 29 23.5 34.4 41.1 52.3 371
Maiden Twin 48 25.4 35.6 43.9 54.2 383
Ram Lambs 15 31.3 42.8 50.3 62.0 418
Adult Single 1 34.4 47.0 65.0 * 522
Adult Twin 2 32.5 43.1 58.3 * 428
Maiden Single 8 32.0 43.9 47.7 64.7 425
Maiden Twin 4 28.7 39.4 48.0 57.2 379
Grand Total 349 26.1 36.0 45.9 53.5 372
200
250
300
350
400
450
500
550
600
30 40 50 60 70 80
Ave
rage
dai
ly g
row
th r
ate
(g/
day
)
Live weight (kg)
Adult Single Adult Twin Maiden Single Maiden Twin Ram Lambs

E.PDS.1410 Final Report – Finishing systems for growing lambs
Page 18 of 55
2. Pasture quality and quantity
Table 10 shows the pasture quality and quantity of the paddocks used in Year 2 of the demonstration. Of note is the relative low pasture quality of the Shed Paddock (Table 10) as sampled on the 28/8/16 where the Maiden Single mob was grazing. This low pasture quality was reflected in the relative low weight of the Maiden Singles female and wether lambs at the first weighing as shown in Table 9.
The Caravan paddock feed test for 1/12/2016 also has ME declining to 8.9 MJ/kg DM from 10.9 MJ/kg DM when previously sampled on 13/10/16. This decline in pasture nutritional value has resulted in lower lamb growth rates between November and December, when all weaned lambs were grazing this paddock (Table 8).
Table 10: Pasture quality and quantity data for site 2 (Producer B) in Year 2.
Paddock measure
FOO (kg DM/ha) Digestibility ME (MJ/kg DM) Protein
Hill (Adult singles)
28/08/2016 900 74.4 11.2 20.7
23/09/2016 1700 76 11.4 21.5
13/10/2016 1622 67 9.9 17.6
50 Acres (Adult twins)
28/08/2016 1116 76.9 11.6 21.7
23/09/2016 1400 81 12.4 21.7
13/10/2016 1512 75 11.4 18.0
Shed (Maiden singles)
28/08/2016 883 43.4 5.8 14.3
23/09/2016 1000 74 11.1 19.9
13/10/2016 1408 69 10.2 15.4
Caravan (Maiden twins)
28/08/2016 710 79 12.0 24.0
23/09/2016 1600 77 11.6 23.8
13/10/2016 1862 73 10.9 20.4
Weaned lambs (mainly ewes) In Caravan Paddock
1/12/2016 >2500 61 8.9 11.4
20/12/2016 Not measured 53 7.6 12.6
3. Ewe condition
Ewe condition score for the maiden singles was monitored on the 26/8/16 and averaged 2.85 (Table
11). This had fallen by the 13/10/16 to an average of 2.7. At the same time the condition score for
the maiden twin ewes was 3.4. Averages were calculated based on assessing at least 20 lactating
ewes from each of these mobs.
There was no condition scoring completed on either the adult single or adult twin ewes.

E.PDS.1410 Final Report – Finishing systems for growing lambs
Page 19 of 55
Table 11: Ewe condition score at site 2 (Producer B) for Year 2
Condition Score 2016 Marking (August) Pre Sale (October)
Maiden Single 2.85 2.7
Maiden Twin Not collected 3.4
4. Sales results
Lambs were drafted for sale at 45 kg + liveweight. The following was observed from the sale data
collected:
• 199 (76%) of saleable demonstration lambs were drafted and sold at three different sales at
Wagga Wagga and Corowa saleyards in November 2016 for an average price of $138/head
(Table 12).
• The remaining 58 lambs were sold in February 2017 for an average of $137/head.
• Some carry-over lambs still remained to be sold at February 2017 (n=4).
Lambs were not individually identified at each sale consignment so a comparison of $/kg received
could not be made for individual lambs. However, a rough analysis based on Wt 4 and using a 47%
dressing percentage showed that lambs averaged (skin included) $5.23/kg carcass weight or $4.92/
kg carcass weight with a $8 skin. This price is below the market indicator for this time period and
raises the question of whether lambs should have been sold sooner or over the hooks.
Table 12: Sales data for Producer B lambs 2016
Date Sale location Number sold Drafting weights
Price received ($/hd)
10/11/2016 Wagga Wagga sale yards
25 All >48 kg $166.60
59 All >48 kg $142.00
14/11/2016 Corowa sale yards 48 All >48 kg $154.00
38 All >48 kg $130.00
17/11/2016 Wagga Wagga sale yards
29 All > 45 kg $137.00
59 All > 45 kg $115.00
Average/totals 258* $138.11
* This includes 59 lambs from an un-monitored mob.
E.PDS.1410 Final Report – Finishing systems for growing lambs
Page 20 of 55
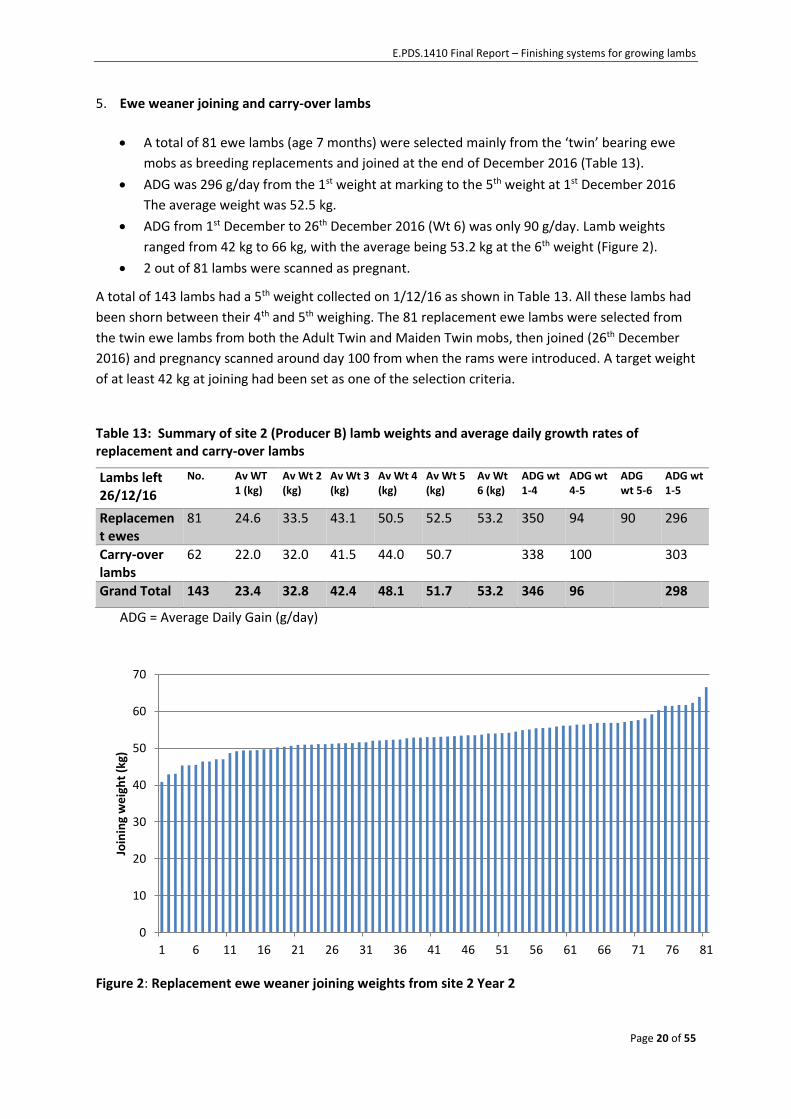
5. Ewe weaner joining and carry-over lambs
A total of 81 ewe lambs (age 7 months) were selected mainly from the ‘twin’ bearing ewe
mobs as breeding replacements and joined at the end of December 2016 (Table 13).
ADG was 296 g/day from the 1st weight at marking to the 5th weight at 1st December 2016
The average weight was 52.5 kg.
ADG from 1st December to 26th December 2016 (Wt 6) was only 90 g/day. Lamb weights
ranged from 42 kg to 66 kg, with the average being 53.2 kg at the 6th weight (Figure 2).
2 out of 81 lambs were scanned as pregnant.
A total of 143 lambs had a 5th weight collected on 1/12/16 as shown in Table 13. All these lambs had
been shorn between their 4th and 5th weighing. The 81 replacement ewe lambs were selected from
the twin ewe lambs from both the Adult Twin and Maiden Twin mobs, then joined (26th December
2016) and pregnancy scanned around day 100 from when the rams were introduced. A target weight
of at least 42 kg at joining had been set as one of the selection criteria.
Table 13: Summary of site 2 (Producer B) lamb weights and average daily growth rates of replacement and carry-over lambs
Lambs left 26/12/16
No. Av WT 1 (kg)
Av Wt 2 (kg)
Av Wt 3 (kg)
Av Wt 4 (kg)
Av Wt 5 (kg)
Av Wt 6 (kg)
ADG wt 1-4
ADG wt 4-5
ADG wt 5-6
ADG wt 1-5
Replacement ewes
81 24.6 33.5 43.1 50.5 52.5 53.2 350 94 90 296
Carry-over lambs
62 22.0 32.0 41.5 44.0 50.7 338 100 303
Grand Total 143 23.4 32.8 42.4 48.1 51.7 53.2 346 96 298
ADG = Average Daily Gain (g/day)
Figure 2: Replacement ewe weaner joining weights from site 2 Year 2
0
10
20
30
40
50
60
70
1 6 11 16 21 26 31 36 41 46 51 56 61 66 71 76 81
Join
ing
wei
ght
(kg)
E.PDS.1410 Final Report – Finishing systems for growing lambs
Page 21 of 55
The remaining shorn mixed sex carry-over lambs ranged in weight from 37.2 kg to 74.2 kg at the 5th
weighing. These lambs at the heavier end missed muster for earlier sales (20 missed being weighed
at the 4th weighing and another 20 missed muster for sale). All these lambs were sold in early 2017.
4.3 Extension activities
Group attendance/field day attendance
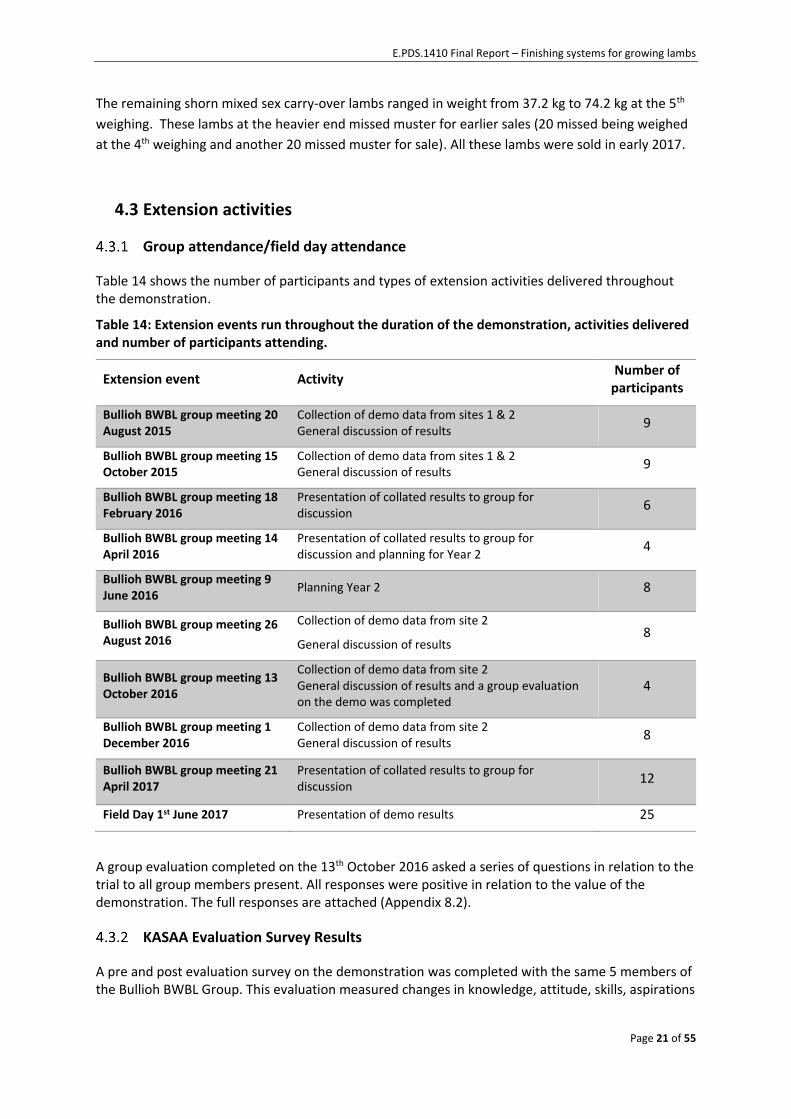
Table 14 shows the number of participants and types of extension activities delivered throughout the demonstration.
Table 14: Extension events run throughout the duration of the demonstration, activities delivered and number of participants attending.
Extension event Activity Number of
participants
Bullioh BWBL group meeting 20 August 2015
Collection of demo data from sites 1 & 2 General discussion of results
9
Bullioh BWBL group meeting 15 October 2015
Collection of demo data from sites 1 & 2 General discussion of results
9
Bullioh BWBL group meeting 18 February 2016
Presentation of collated results to group for discussion
6
Bullioh BWBL group meeting 14 April 2016
Presentation of collated results to group for discussion and planning for Year 2
4
Bullioh BWBL group meeting 9 June 2016
Planning Year 2 8
Bullioh BWBL group meeting 26 August 2016
Collection of demo data from site 2
General discussion of results 8
Bullioh BWBL group meeting 13 October 2016
Collection of demo data from site 2 General discussion of results and a group evaluation on the demo was completed
4
Bullioh BWBL group meeting 1 December 2016
Collection of demo data from site 2 General discussion of results
8
Bullioh BWBL group meeting 21 April 2017
Presentation of collated results to group for discussion
12
Field Day 1st June 2017 Presentation of demo results 25
A group evaluation completed on the 13th October 2016 asked a series of questions in relation to the trial to all group members present. All responses were positive in relation to the value of the demonstration. The full responses are attached (Appendix 8.2).
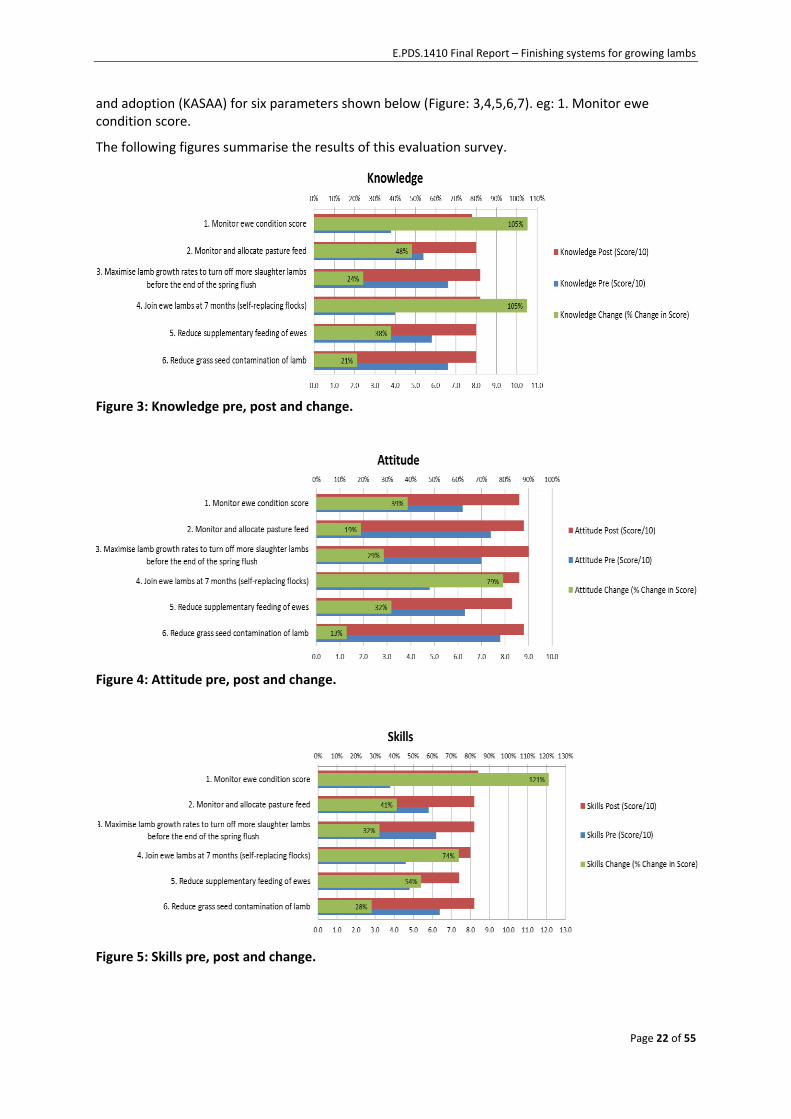
KASAA Evaluation Survey Results
A pre and post evaluation survey on the demonstration was completed with the same 5 members of the Bullioh BWBL Group. This evaluation measured changes in knowledge, attitude, skills, aspirations
E.PDS.1410 Final Report – Finishing systems for growing lambs
Page 22 of 55
and adoption (KASAA) for six parameters shown below (Figure: 3,4,5,6,7). eg: 1. Monitor ewe condition score.
The following figures summarise the results of this evaluation survey.
Figure 3: Knowledge pre, post and change.
Figure 4: Attitude pre, post and change.
Figure 5: Skills pre, post and change.
E.PDS.1410 Final Report – Finishing systems for growing lambs
Page 23 of 55
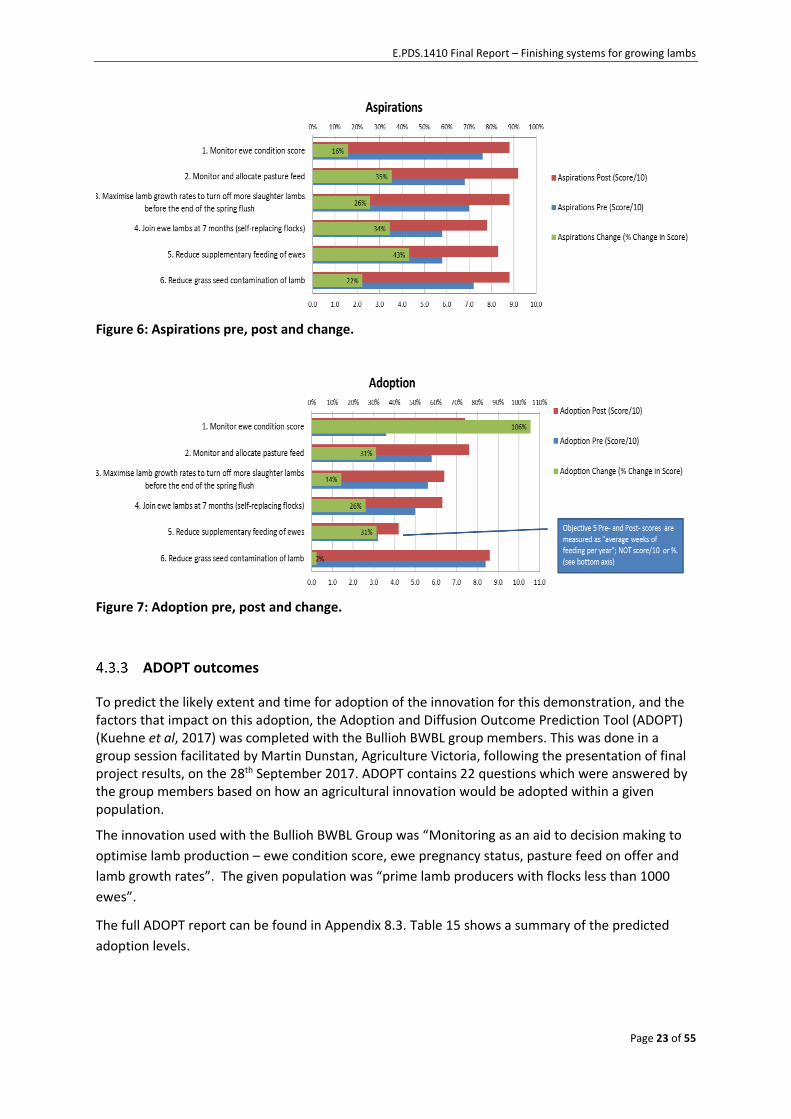
Figure 6: Aspirations pre, post and change.
Figure 7: Adoption pre, post and change.
ADOPT outcomes
To predict the likely extent and time for adoption of the innovation for this demonstration, and the factors that impact on this adoption, the Adoption and Diffusion Outcome Prediction Tool (ADOPT) (Kuehne et al, 2017) was completed with the Bullioh BWBL group members. This was done in a group session facilitated by Martin Dunstan, Agriculture Victoria, following the presentation of final project results, on the 28th September 2017. ADOPT contains 22 questions which were answered by the group members based on how an agricultural innovation would be adopted within a given population.
The innovation used with the Bullioh BWBL Group was “Monitoring as an aid to decision making to
optimise lamb production – ewe condition score, ewe pregnancy status, pasture feed on offer and
lamb growth rates”. The given population was “prime lamb producers with flocks less than 1000
ewes”.
The full ADOPT report can be found in Appendix 8.3. Table 15 shows a summary of the predicted
adoption levels.
E.PDS.1410 Final Report – Finishing systems for growing lambs
Page 24 of 55
Table 15: Predicted adoption levels
Predicted peak level of adoption1 83%
Predicted years to peak adoption2 20
Predicted years to near-peak adoption3 16
Year innovation first adopted or expected to be adopted N/A
Year innovation adoption level measured N/A
Adoption level in that year N/A
Predicted adoption level in 5 years from start 22.4%
Predicted adoption level in 10 years from start 66.4%
PLEASE NOTE:
1. The predictions of ‘Peak Adoption Level’ is a numeric output that is provided to assist with insight and understanding and like any forecasts should be used with caution.
2. The prediction of ‘Time to Peak Adoption Level’ is a numeric output that is provided to assist with insight and understanding and like any forecasts should be used with caution
3. ‘Time to Near Peak Adoption’ represents the time to 95% of the maximum predicted adoption level.
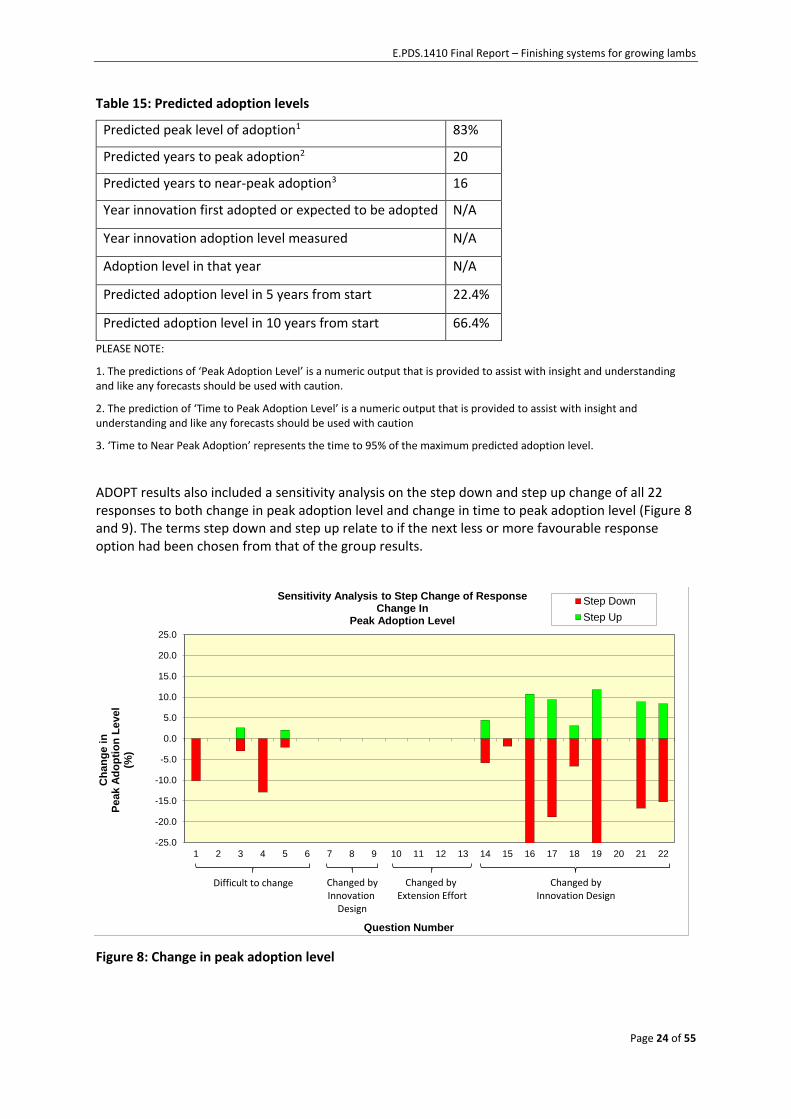
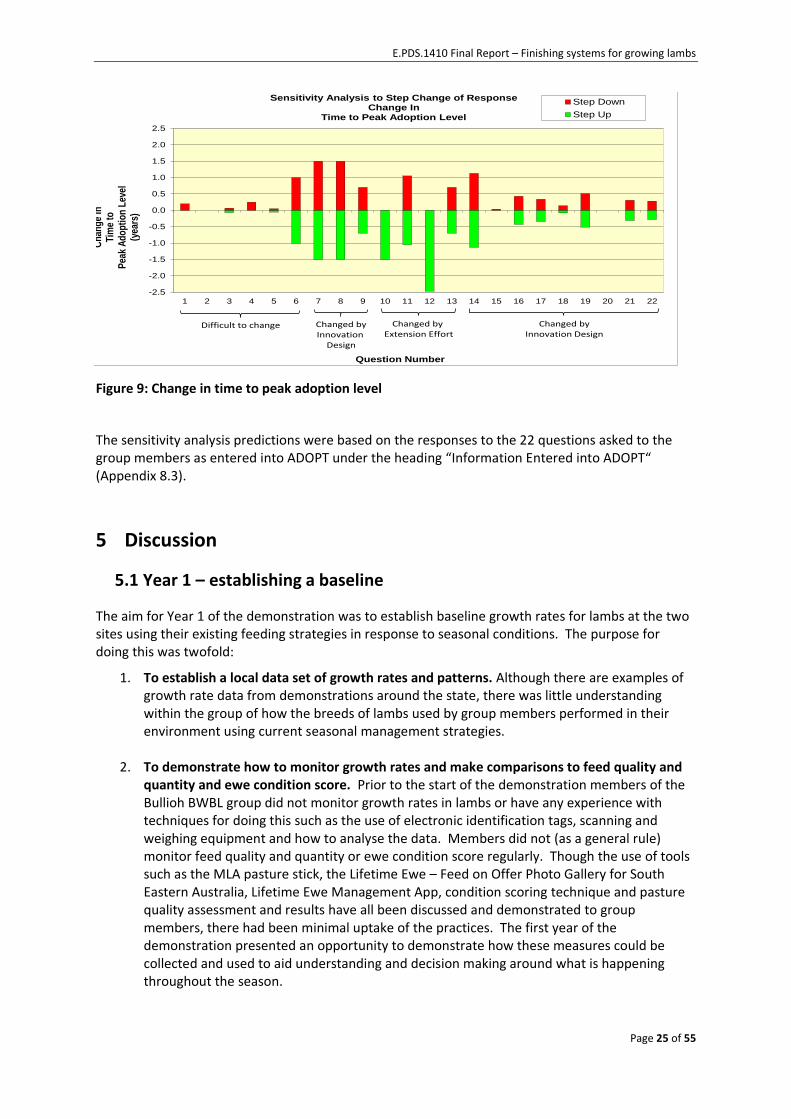
ADOPT results also included a sensitivity analysis on the step down and step up change of all 22 responses to both change in peak adoption level and change in time to peak adoption level (Figure 8 and 9). The terms step down and step up relate to if the next less or more favourable response option had been chosen from that of the group results.
Figure 8: Change in peak adoption level
-25.0
-20.0
-15.0
-10.0
-5.0
0.0
5.0
10.0
15.0
20.0
25.0
1 2 3 4 5 6 7 8 9 10 11 12 13 14 15 16 17 18 19 20 21 22
Ch
an
ge i
n
Pe
ak
Ad
op
tio
n L
eve
l(%
)
Question Number
Sensitivity Analysis to Step Change of ResponseChange In
Peak Adoption Level
Step Down
Step Up
Difficult to change Changed byInnovation
Design
Changed by Extension Effort
Changed byInnovation Design
E.PDS.1410 Final Report – Finishing systems for growing lambs
Page 25 of 55
Figure 9: Change in time to peak adoption level
The sensitivity analysis predictions were based on the responses to the 22 questions asked to the group members as entered into ADOPT under the heading “Information Entered into ADOPT“ (Appendix 8.3).
5 Discussion
5.1 Year 1 – establishing a baseline
The aim for Year 1 of the demonstration was to establish baseline growth rates for lambs at the two sites using their existing feeding strategies in response to seasonal conditions. The purpose for doing this was twofold:
1. To establish a local data set of growth rates and patterns. Although there are examples of growth rate data from demonstrations around the state, there was little understanding within the group of how the breeds of lambs used by group members performed in their environment using current seasonal management strategies.
2. To demonstrate how to monitor growth rates and make comparisons to feed quality and quantity and ewe condition score. Prior to the start of the demonstration members of the Bullioh BWBL group did not monitor growth rates in lambs or have any experience with techniques for doing this such as the use of electronic identification tags, scanning and weighing equipment and how to analyse the data. Members did not (as a general rule) monitor feed quality and quantity or ewe condition score regularly. Though the use of tools such as the MLA pasture stick, the Lifetime Ewe – Feed on Offer Photo Gallery for South Eastern Australia, Lifetime Ewe Management App, condition scoring technique and pasture quality assessment and results have all been discussed and demonstrated to group members, there had been minimal uptake of the practices. The first year of the demonstration presented an opportunity to demonstrate how these measures could be collected and used to aid understanding and decision making around what is happening throughout the season.
-2.5
-2.0
-1.5
-1.0
-0.5
0.0
0.5
1.0
1.5
2.0
2.5
1 2 3 4 5 6 7 8 9 10 11 12 13 14 15 16 17 18 19 20 21 22
Ch
ang
e in
T
ime
to
Pea
k A
do
pti
on
Lev
el(y
ears
)
Question Number
Sensitivity Analysis to Step Change of ResponseChange In
Time to Peak Adoption Level
Step Down
Step Up
Difficult to change Changed byInnovation
Design
Changed by Extension Effort
Changed byInnovation Design
E.PDS.1410 Final Report – Finishing systems for growing lambs
Page 26 of 55
Year 1 data
The data from the first year of the demonstration showed the following:
1. Lamb growth rates in spring are within industry best practice.
The average growth rates (measured from marking to sale of first lambs) of the twin lambs from site 1 (Producer A) were 296 g/day and from site 2 (Producer B) were 366 g/day (349 g/day from lambs from adult ewes and 382 g/day for lambs from maiden ewes). These growth rates are within the range commonly seen for this time of year in other areas and in the case of site 2, are at the high end of the scale (Making More from Sheep Manual, section 3).
2. In general lamb growth rates at site 1 reflected pasture quality and quantity and ewe condition.
Pasture quality and quantity measures reflected well established patterns of lower quality/quantity at late pregnancy/early lactation building to high quality/quantity mid lactation (spring) and quality dropping off later in the season. Ewe condition was on average 3 at marking and increased during lactation/spring. This indicated that in general, there was enough feed of good quality to meet growth requirements for lambs and lactation requirements for ewes with the exception being at the beginning of lambing when quality was low (ME 6.2 MJ/kg DM). This did not appear to adversely affect growth rates but did raise the question about the timing of creep feeding and/or supplementary feeding ewes.
3. Differences in site 2 lamb growth rates can be attributed to pasture quality and quantity and subsequent ewe condition early in lactation (before monitoring started).
It was observed at site 2 that lambs from one mob (from adult ewes) were not as heavy or growing as fast as lambs from the second mob (from maiden ewes). This is unusual as in general, lambs from adult ewes (who had already had a lamb) are generally heavier at birth and are heavier at the same ages than lambs from maiden ewes (ewes having their first lamb). However, in this case, the lambs from the maidens were heavier and grew faster. When the pasture quality and quantity and ewe condition score were compared, it was evident that the feed the adult ewes were offered, was of lower quality (ME 5.2 MJ/ kg DM compared to 9.4 MJ/kg DM) and that according to the Lifetime Ewe Management App – would not have been meeting these ewes’ requirements at late pregnancy/early lactation. This would have impacted on the ewes’ ability to lactate and provide adequate nutrition to their lambs.
Again, the observation was made that it was late autumn/early winter when feed shortages impacted on ewe and lamb performance but that during spring, paddock feed increased enough to easily meet demands and therefore creep feeding would be of little advantage.
4. On average 30% of lambs are carried over for finishing and sale in late summer/autumn/early winter.
At site 1 (Producer A), 68% of twins were heavy enough for sale before the end of December. At site 2 it was more difficult to estimate as demonstration lambs were mixed with other lambs and sold together. The best estimate is that Site 2 sold 71% of their lambs by the end of December. Both producers indicated this was standard practice for their farms.
Extension of Year 1 results and data collection skills
Bullioh BWBL group members were involved in data collection at site 2 (Producer B) on two occasions. This included weighing lambs, ewe condition scoring and pasture assessment. This gave all members an opportunity to practice these skills as well as observe how the equipment worked with regards to capturing individual lamb weights. For this first year of the demonstration, Agriculture Victoria staff provided the equipment and labour for weighing lambs and scanning tags
E.PDS.1410 Final Report – Finishing systems for growing lambs
Page 27 of 55
and the group coordinator instructed the group members in condition scoring and pasture assessment as part of the data collection process.
The data from the demonstration was discussed as lambs were weighed as well as at two group meetings when all the collated data was presented to the group. Group discussion around growth rates highlighted to many the value of the spring feed and how it contributed to observable differences in weights between mobs (at site 2).
At the end of Year 1, the following outcomes were achieved:
1. Bullioh BWBL group members learnt how to measure growth rates in lambs and compare pasture quality and quantity and ewe condition.
All members had the opportunity to observe and participate in the data collection and monitoring of the demonstration site to improve their skills.
2. The demonstration identified where the feed gaps were for developing feeding strategies in Year 2.
Monitoring lambs from marking to sale showed fast lamb growth rates, optimum ewe condition and good quality and quantity of pasture at later stages of the season when creep feeders would normally be introduced. Conversely early in lambing and through to marking, ewe condition was lower and there was less feed available.
For site 1 (Producer A), lamb growth rates decreased after the spring flush. For site 2 (Producer B) ewe condition at marking was lower than desired and there was limited (although higher quality for Maiden ewes) feed available. It was proposed to the group that the creep feeding system may need to be reviewed and that the group should consider if other methods of early lamb management may be a better alternative than a later pre-weaning feeding system when growth rates of lambs and pasture quality and quantity was high.
Systems to boost these early growth rates (which would be expected to be 300-400 g/day average) were discussed with the group. This included building a feed wedge prior to lambing, supplementary feeding of ewes prior to lambing (to enable paddocks to develop a feed wedge) and other tactical grazing strategies.
The concept of a feed wedge was discussed at group meetings in February and April 2016. The producer (site 2) had purchased a creep feeder and indicated he would prefer to continue with the original plan of creep feeding twin lambs to improve pre-weaning growth rates as creating a feed wedge was not a concept he felt he was able to implement on his farm.
The producer at Site 1 provided feedback to the group being that;
He has not previously monitored lamb growth. Involvement in the demonstration has allowed better monitoring and an improved understanding of his lamb growth rates from marking until sale.
Separating twins from singles provided the opportunity to strategically manage nutrition according to birth status.
Obtaining an average weight from a portion of single lambs showed their weight was similar to the twins and therefore confirmed he was managing the twins appropriate to his requirement for turning lambs off earlier.
Lamb growth rates on improved pasture went well. He now has the confidence to utilise the improved pasture for the cattle enterprise and use the creep feeders for sheep on the native grass hill paddocks.
Monitoring and obtaining lamb growth and sale data provided information that supported his decisions to other members in the family business.

E.PDS.1410 Final Report – Finishing systems for growing lambs
Page 28 of 55
His decision following the end of the first year of monitoring was to implement a feeding strategy of grazing the ewes and lambs on hill paddocks (containing native pastures) with creep feeders to supplement the feed gap predicted between native pastures and improved pastures.
5.2 Year 2 – deepening the understanding
The need for demonstration re-design
At the commencement of Year 2 of the demonstration for site 1 was withdrawn due to unexpected circumstances necessitating the re-design of the demonstration for Year 2.
Resources were re-directed to site 2 and the decision was made to monitor four mobs of lambs (instead of two) and monitor lambs more frequently.
Initially it was planned for site 2 to pregnancy scan the demonstration ewes and separate into singles and twins for targeted management and monitoring. Unfortunately, this did not happen. To allow singles and twins to be monitored in the demonstration, singles from each mob were drifted off during lambing to allow twins to be monitored and managed separately. This created four mobs for monitoring as the producer wanted to keep managing the maiden ewes separately from the adult ewes.
The year 2 plan was to install creep feeders in the paddocks measured the previous year which had less feed available (the shed paddock used in year 1). However, an extremely wet winter led to the decision not to install the creep feeders as it was perceived by the producer that there would be adequate feed and that feeders would only create mud and pugging in the waterlogged pastures.
Instead it was agreed by the group that the demonstration would again monitor growth rates with the additional insight of being able to compare twins and singles mobs and the impact of a wet winter/spring on feed quality and quantity. Feeding strategies included allocating 2 paddocks assessed in year 1 with higher quality and quantity of pasture to the two mobs of adult twin and maiden twin ewes due to their higher nutritional demand. An emphasis was placed on selling as many lambs as possible before the end of December and taking replacement ewe lambs to joining weights for early joining (December 2016).
Year 2 data
In general, the trends observed in Year 1 of the demonstration at site 2 were repeated in Year 2. That is paddock differences in feed quality and quantity had an impact on lamb growth in different mobs but that overall, marking to first consignment growth rates were high (372 g/day)(Table 8) and were higher than for the same period in Year 1 (366 g/day) (Table 8).
The data from the demonstration showed the following:
1. Singles grow faster than twins, but not always…
Generally, it would be expected that singles would grow heavier and faster than twins. However, in this demonstration, the singles from the maidens were on low quality pasture at the start of lambing (FOO 883 kg/ha, ME 5.8 MJ/kg DM) (Table 10) and this had an impact on growth rates for the entire season (Table 7), keeping them the lightest mob of lambs. Lambs from the adult ewes were also heavier on average than those from the maidens and this was consistent with expectations based on age of dam and FOO (Table 7). This was the reverse of observations in Year 1 as both mobs were allocated different paddocks for lambing than the previous year i.e. Year 1 had adult ewes and lambs in the shed paddock whereas this paddock was allocated to the maiden ewes in Year 2.

E.PDS.1410 Final Report – Finishing systems for growing lambs
Page 29 of 55
Considering the differences observed in growth rates of the two mobs of lambs, it is not surprising that the maiden single lambs had lower growth rates as their mothers were not in as good condition and below the target average condition score of 3.0 recommended by Lifetime Ewe Management.
2. Ram lambs grow faster than wethers who grow faster than ewe lambs
The effect of sex on growth rates was again demonstrated in Year 2, this time at site 2. As the producer kept some lambs as rams for breeding, it was also possible to demonstrate the effect of castration on growth rate (although this was slightly biased as generally it was the biggest ram lambs at marking that were left entire). Growth rates for male lambs were generally 30-60 g/day more than for ewe lambs from all mobs.
3. Lamb growth rates drop significantly from early November impacting on carry-over lambs
Monitoring the growth rates of carry-over lambs showed that growth rates dropped significantly from an average of 345 g/day during October to 96 and 90 g/day respectively at the following data collections (1st and 26th December, Table 13). This is partly due to selling all the heavier, faster growing lambs (leaving smaller, slower growing lambs plus ewe weaners as carry-over lambs) and mostly to do with the rapid drop in pasture quality from ME of 10.9 MJ/kg DM and protein 20.4% to ME 8.9 and 7.6 MJ/kg DM and protein of 11.4 and 12.6% on 1st December and 20th December 2016 respectively (Table 10).
While it was not possible to obtain the final sale weights, sale date and price of the carryover lambs, (the remaining demonstration lambs were mixed in with other carry-over lambs), the producer estimated that these lambs were kept for an additional 3-5 months longer than the lambs sold in November. Considering the average weight of the carry-over lambs on 1 Dec was 50.7 kg with only 4 lambs less than 40 kg, all lambs could have been sold by the end of December, enabling the pasture to be kept for other classes of stock.
4. Selling lambs earlier in the season – possible but is it profitable?
The timing of the 2016 demonstration lamb sales has been an ongoing discussion within the Bullioh BWBL group. Producer B has traditionally sold lambs at heavier weights (48-60 kg live weight) in early November and continued to do this throughout the demonstration period. However analysis of the data in Year 2 showed that at the 3rd weighing of lambs (13th October), 51% were over 45 kg (heavy enough for sale) and by the 4th weighing (8 November), 89% were over 45 kg and 15% were over 60 kg. The sale data for lambs sold after 8th November showed a decrease in sale price per head, the later the lambs were sold. It is not possible to determine whether this drop in price was due to sale weights being lighter or whether it was due to a decrease in sale price per kg, as final sale weights were not collected. However, an economic analysis was conducted using estimates of lamb growth rates from December 2016 to July 2017 (see Section 7). The analysis showed spreading the sale of lambs and the additional associated costs resulted in a $35/head net gain of selling prime lambs born June/July at the end of the spring flush (1 December) as compared to carrying lambs over and selling 12 months later (31 July).
The group discussed whether in hindsight, there was merit in selling lambs 2 to 3 weeks earlier to avoid the drop in price that normally occurs in spring when large numbers of new season lambs enter the market or whether the subsequent drop in price per kg was off-set by the increase in lamb weight (and presumably value).
There is no easy answer to this question as sale weights were not obtained and lambs were sold on per head basis (not by carcass weight). However comparison of lamb prices as reported by the Eastern Southern Trade Lamb Index (ESTLI) indicates that prices dropped on average 33 c/kg carcass weight during the time frame discussed. Sensitivity of price v weight shows that if lambs continued to grow at average growth rates for another 2-3 weeks after they were weighed in October, that they would have added an extra 5-6 kg in body weight. The market would have needed to fall by 60
E.PDS.1410 Final Report – Finishing systems for growing lambs
Page 30 of 55
c/kg carcass weight for this to cancel out the extra gain in value from increased weight. This would have only happened if the lambs had been sold on a grid that penalized lambs for being over 26 or 28 kg as many lambs were predicted to have gone into this weight category by the time they were sold in November.
Group members were hard pressed to see the benefits of selling early when there was ample paddock feed (even though it was declining in quality) and in their opinion, no risks of reduced income/head by selling later even though it was at a reduced c/kg. The opportunity to receive higher prices for lambs per head overrode any of the benefits of selling earlier discussed such as having ewes in better condition for joining, opportunity to run other classes of stock and having more carry-over feed in summer.
5. Joining weight is not the only determinant of whether ewe lambs conceive
Rather than join maiden ewes at 18 months which is the standard practice at site 2, a total of 81 demonstration ewe lambs from the maiden twin and adult twin mobs were kept and joined early at a younger age to increase ewe lifetime productivity. On the 26th December, prior to joining, ewe lambs were weighed at an average of 53.2 kg with all above 42 kg. These ewe lambs were joined for 6 weeks from 26th December 2016 and pregnancy scanned on 3rd April 2017.
Only 2 out of the 81 joined ewe lambs were pregnant which was a disappointing result and created much discussion within the group as to why this happened considering the live weight guidelines of minimum weight 42kg for successful ewe lamb joining were followed.
The conclusions reached by the group were:
The ewe lambs were barely 7 months in age, some younger when joined so may have been too young and would have been more suited for a later joining i.e. February.
Monitoring liveweights of ewe lambs showed they were on a decreasing plain of nutrition pre joining and may have started to decline in condition during joining as they were dependent on lower quantity and quality of paddock feed. A rising plane of nutrition is recommended prior to joining to increase ovulation.
White Suffolk sheep are highly seasonal breeders and reach their reproductive peak in March/April. The results from the Maternal Progeny Test showed the White Suffolk breed, although they were the heaviest at joining, their reproductive success was lower than other breeds in the experiment (Fogarty et al, 2007). Even though they reached the recommended joining weights, joining the ewe weaners in late December/January was too early in the season for their full reproduction potential to be realised.
The producers’ decision post scanning was not to immediately join these ewes again but to delay for another 12 months and join in late 2017. They aim to join ewe weaners at the next joining and will ensure they are on a rising plane of nutrition and will join one or two months later in January/February. This should increase conception rates due to ewe weaners being heavier and increased daylight which contributes to increased seasonal cycling.
Outcomes of Year 2
The major outcomes for the Bullioh BWBL group from Year 2 of the demonstration were:
1. Increased understanding of the impact of feed quality and quantity on lamb growth rates and implications for grazing management using different feeding strategies and overall live weight.
2. The benefits of monitoring growth of individual lambs to predict sale weight and the sale date for lambs.
3. An understanding of the factors that impact on the ability of ewe weaners to conceive a lamb at 7-8 months of age.
E.PDS.1410 Final Report – Finishing systems for growing lambs
Page 31 of 55
5.3 Extending the results to others
Involvement of the Bullioh BWBL group members
One of the aims of this demonstration was to provide existing members with valuable targeted information about finishing lambs and to build their skills to be able to monitor their own flocks. All group members had the opportunity throughout the project to participate at a number of levels from skill development to interpretation of data and discussion of implications.
Evaluation data obtained during the project showed that group members gained valuable skills and some made changes to their operations either by buying equipment to monitor lamb growth rates or changing practices.
Change in KASAA
The KASAA evaluation consisted of five measures being knowledge, attitude, skills, aspirations and
adoption. In this demonstration these measures were assessed against six parameters relevant to
prime lamb producers which related directly to demonstration activities (Figures 3-7).
These parameters were;
1. Monitor ewe condition score. 2. Monitor and allocate pasture feed. 3. Maximise lamb growth rates to turn off more slaughter lambs before the end of the spring flush. 4. Join ewe lambs at 7 months (self-replacing flocks). 5. Reduce supplementary feeding of ewes. 6. Reduce grass seed contamination of lamb.
The findings of the KASAA evaluation are described below under each of these measures;
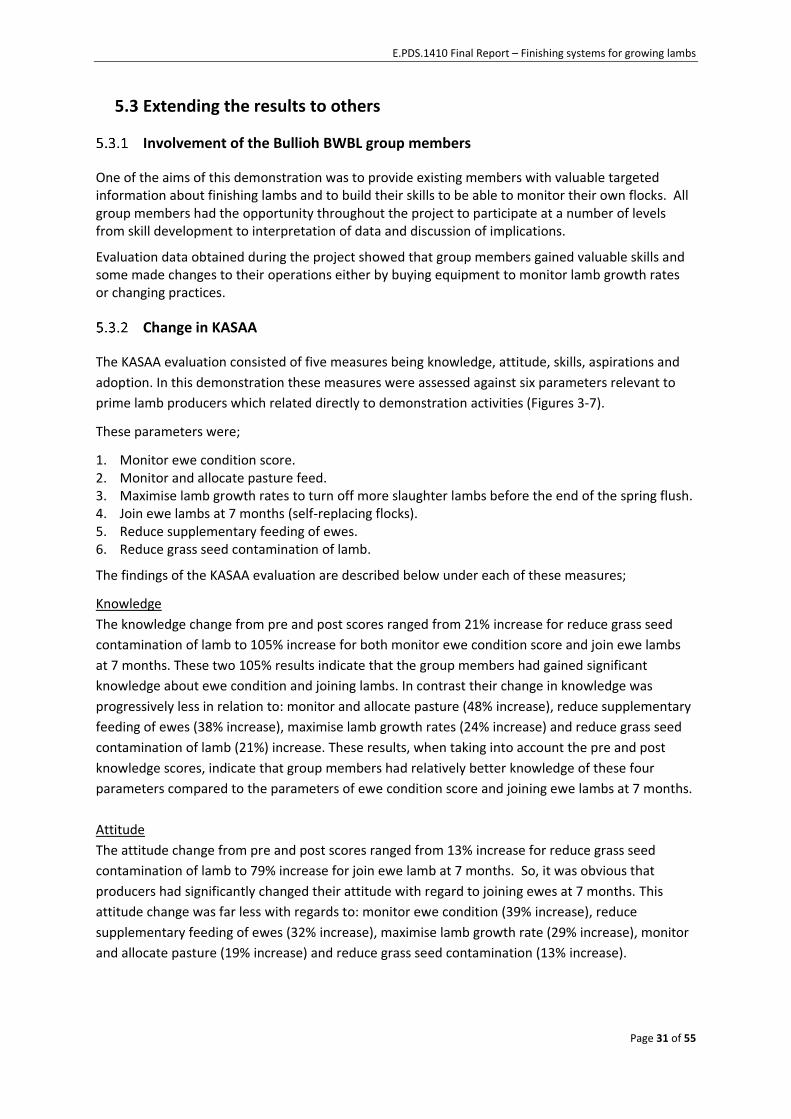
Knowledge
The knowledge change from pre and post scores ranged from 21% increase for reduce grass seed
contamination of lamb to 105% increase for both monitor ewe condition score and join ewe lambs
at 7 months. These two 105% results indicate that the group members had gained significant
knowledge about ewe condition and joining lambs. In contrast their change in knowledge was
progressively less in relation to: monitor and allocate pasture (48% increase), reduce supplementary
feeding of ewes (38% increase), maximise lamb growth rates (24% increase) and reduce grass seed
contamination of lamb (21%) increase. These results, when taking into account the pre and post
knowledge scores, indicate that group members had relatively better knowledge of these four
parameters compared to the parameters of ewe condition score and joining ewe lambs at 7 months.
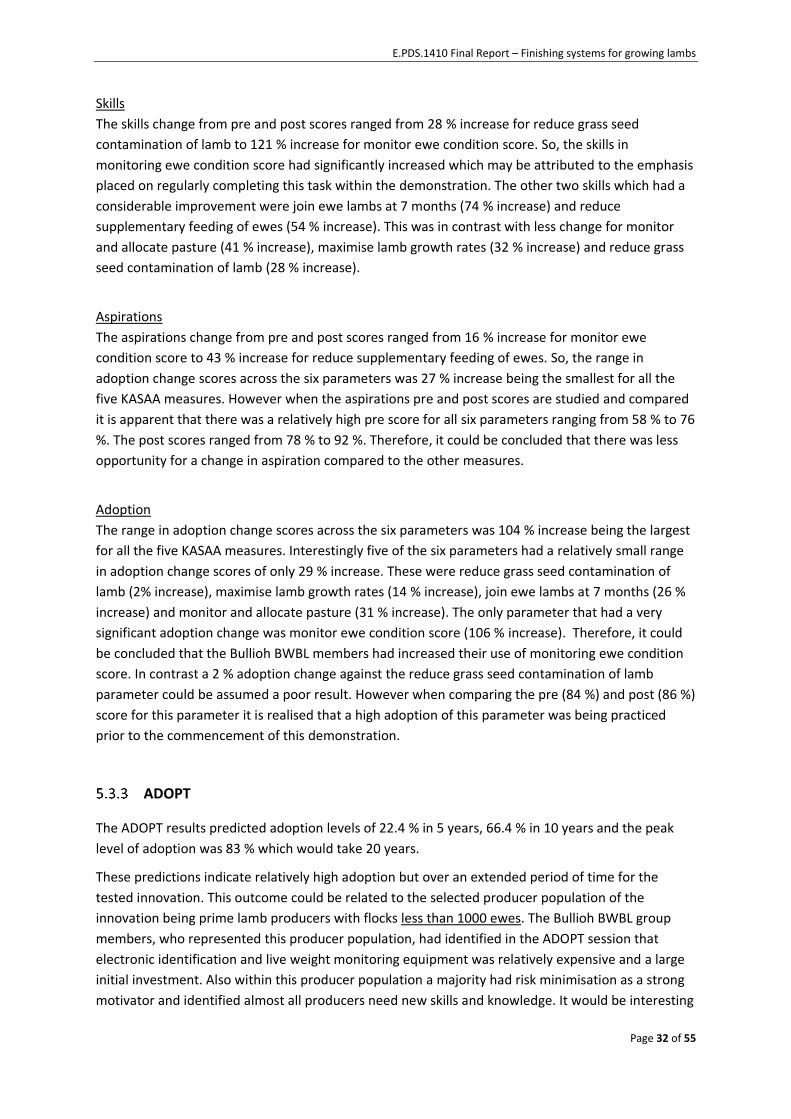
Attitude
The attitude change from pre and post scores ranged from 13% increase for reduce grass seed
contamination of lamb to 79% increase for join ewe lamb at 7 months. So, it was obvious that
producers had significantly changed their attitude with regard to joining ewes at 7 months. This
attitude change was far less with regards to: monitor ewe condition (39% increase), reduce
supplementary feeding of ewes (32% increase), maximise lamb growth rate (29% increase), monitor
and allocate pasture (19% increase) and reduce grass seed contamination (13% increase).
E.PDS.1410 Final Report – Finishing systems for growing lambs
Page 32 of 55
Skills
The skills change from pre and post scores ranged from 28 % increase for reduce grass seed
contamination of lamb to 121 % increase for monitor ewe condition score. So, the skills in
monitoring ewe condition score had significantly increased which may be attributed to the emphasis
placed on regularly completing this task within the demonstration. The other two skills which had a
considerable improvement were join ewe lambs at 7 months (74 % increase) and reduce
supplementary feeding of ewes (54 % increase). This was in contrast with less change for monitor
and allocate pasture (41 % increase), maximise lamb growth rates (32 % increase) and reduce grass
seed contamination of lamb (28 % increase).
Aspirations
The aspirations change from pre and post scores ranged from 16 % increase for monitor ewe
condition score to 43 % increase for reduce supplementary feeding of ewes. So, the range in
adoption change scores across the six parameters was 27 % increase being the smallest for all the
five KASAA measures. However when the aspirations pre and post scores are studied and compared
it is apparent that there was a relatively high pre score for all six parameters ranging from 58 % to 76
%. The post scores ranged from 78 % to 92 %. Therefore, it could be concluded that there was less
opportunity for a change in aspiration compared to the other measures.
Adoption
The range in adoption change scores across the six parameters was 104 % increase being the largest
for all the five KASAA measures. Interestingly five of the six parameters had a relatively small range
in adoption change scores of only 29 % increase. These were reduce grass seed contamination of
lamb (2% increase), maximise lamb growth rates (14 % increase), join ewe lambs at 7 months (26 %
increase) and monitor and allocate pasture (31 % increase). The only parameter that had a very
significant adoption change was monitor ewe condition score (106 % increase). Therefore, it could
be concluded that the Bullioh BWBL members had increased their use of monitoring ewe condition
score. In contrast a 2 % adoption change against the reduce grass seed contamination of lamb
parameter could be assumed a poor result. However when comparing the pre (84 %) and post (86 %)
score for this parameter it is realised that a high adoption of this parameter was being practiced
prior to the commencement of this demonstration.
ADOPT
The ADOPT results predicted adoption levels of 22.4 % in 5 years, 66.4 % in 10 years and the peak
level of adoption was 83 % which would take 20 years.
These predictions indicate relatively high adoption but over an extended period of time for the
tested innovation. This outcome could be related to the selected producer population of the
innovation being prime lamb producers with flocks less than 1000 ewes. The Bullioh BWBL group
members, who represented this producer population, had identified in the ADOPT session that
electronic identification and live weight monitoring equipment was relatively expensive and a large
initial investment. Also within this producer population a majority had risk minimisation as a strong
motivator and identified almost all producers need new skills and knowledge. It would be interesting

E.PDS.1410 Final Report – Finishing systems for growing lambs
Page 33 of 55
to run this ADOPT innovation with a producer population with larger flocks to compare the peak
level of adoption and years to peak adoption.
The ADOPT sensitivity analysis for both change in peak adoption level and change in time to peak
adoption were determined (Figures 8 and 9).
The factors that were found to significantly increase or decrease change in peak adoption level
(Figure 8) related to the following questions that were asked in the sensitivity analysis (Appendix
8.3). Note that all these factors were within the category “Changed by Innovation Design”.
Question 16: Profit benefit in years that it is used.
Response: Moderate profit advantage in years that it is used.
Reasoning: Based on the group's experience of the demo outcomes.
A step down resulted in approx. – 25 % change in peak adoption level whereas a step up produced
approx. 11 % improvement. So the extent of profit benefit is very influential on the change in peak
adoption level. The challenge for the prime lamb industry and its producers is to identify what
specific ways that monitoring innovation can contribute to improving enterprise profit to result in its
improved peak adoption levels.
Question 17: Future profit benefit.
Response: Moderate profit advantage in the future.
Reasoning: Expect to get better at managing the innovation in future years with practice, increasing
the benefit relative to the annual cost over time. Improved ewe management has future benefits
(ewes in lamb).
A step down resulted in approx. -19 % change in peak adoption level whereas a step up produced
approx. 9 % improvement. Based on the reasoning provided it would appear that as producers
became more competent in the innovation it would be used to its full potential. Therefore, it would
be imperative that on-going training is available in monitoring innovation to increase change in peak
adoption level.
Question 19: Environmental costs and benefits.
Response: No net environmental effects.
Reasoning: No environmental focus on this innovation.
A step down resulted in approx. -25 % change in peak adoption level whereas a step up produced
approx. 12 % improvement. It could be concluded that if the monitoring innovation had positive
environmental effects then it would be favoured by this producer group who collectively have
protection of the environment as a strong motivation.

E.PDS.1410 Final Report – Finishing systems for growing lambs
Page 34 of 55
Question 21: Risk exposure.
Response: Moderate reduction in risk.
Reasoning: The innovation provides increased ability to manage and reduce negative outcomes such
as low conception rates, high lamb mortality or poor lamb growth rates - eg: can re-introduce rams
to empty ewes if scanned. Monitoring allows for increased preparedness to respond to unfavourable
seasonal conditions via understanding lamb growth rate and likely production.
A step down resulted in approx. -17 % change in peak adoption level whereas a step up produced
approx. 9 % improvement. With climatic variability and unfavourable seasonal conditions being a
significant risk to prime lamb producers it is important that on-going producer training in the use of
this innovation be available to maximise the change in peak adoption level.
Question 22: Ease and convenience.
Reason: Small decrease in ease and convenience.
Reasoning: Greater management demands lead to decreased convenience, but implementing this
innovation should get easier over time.
A step down resulted in approx. -15 % change in peak adoption level whereas a step up produced
approx. 8 % improvement. Again, it could be concluded that on-going training in monitoring skills
and equipment options would enable producers to incorporate the monitoring innovation into their
sheep handling facilities and management to improve its ease of use and convenience.
The factors that were found to significantly increase or decrease change in time to peak adoption level related to the following questions that were asked in the sensitivity analysis (Appendix 8.3). Note that all these factors were within the categories of “Changed by Innovation Design” or “Changed by Extension Effort.”
Question 7: Trialable.
Response: Easily trialable.
Reasoning: Little cost for much of the monitoring involved, as it is about skills, not equipment. EID equipment represents a significant cost but much of the monitoring can be done without it.
A step down resulted in approx. a 1.5 year increase to the change in time to peak adoption level whereas a step up reduced the time by 1.5 years. This result highlights the importance of training being available to develop and improve relevant skills levels.
Question 8: Innovation complexity.
Response: Slightly difficult to evaluate effects of use due to complexity.
Reasoning: There is a need for increased and ongoing attention to management and some specialised equipment. There is an additional demand on time, and improved expertise to interpret the data collected by monitoring.
A step down resulted in approx. a 1.5 year increase to the change in time to peak adoption level whereas a step up reduced the time by approx. 1.5 years. So due to some difficulty with this

E.PDS.1410 Final Report – Finishing systems for growing lambs
Page 35 of 55
innovation it is important that either training is available for specialised equipment and or commercial businesses are available to analyse and interpret the collected data.
Question 10: Advisory support
Response: Almost none use relevant advisor
Reasoning: Small scale enterprises have little capacity to pay for advice.
A step down resulted in no change in time to peak adoption level whereas a step up reduced the time by approx. 1.5 years. This step down result highlights that there is significant potential opportunity for the selected producer population to utilise commercial advisory support. The recognised barrier to increase the use of these advisory services is the capacity to pay or alternatively that such a service does not result in a financial benefit to the producer population. This situation could represent market failure and indicate the importance of producer-based groups (eg: BWBL) as a method for advisory support to be accessible to the studied producer population.
Question 11: Group involvement
Response: A minority are involved with a group that discusses farming.
Reasoning: Small scale operators are less likely to be members of BWBL or other groups.
A step down resulted in approx. a 1.0 year increase to the change in time to peak adoption level whereas a step up reduced the time by approx. 1.0 year. The reasoning given that small operators are less likely to be group members highlight existing barrier/s. These barriers could include the need for the selected producer population to work off farm for financial imperatives and their perception that they would not be welcome, or have little to offer, to producer groups such as BWBL. These barriers present challenges in trying to attract smaller scale operators to industry groups but also potential opportunities to offer a more flexible delivery approach to these smaller scale operators to access the services of such groups.
Question 12: Relevant existing skills and knowledge
Response: Almost all need new skills and knowledge.
Reasoning: Currently producers have low levels of skill and knowledge with respect to monitoring ewe CS, pasture FOO, understanding impacts of ewe pregnancy status. Lamb growth rate analysis requires additional skills if manipulating EID data.
A step down resulted in no change in time to peak adoption level whereas a step up reduced the time by approx.2.5 years. The step down result of producing no change in time to peak adoption level highlights that there is a significant need for developing new skills and knowledge within this producer population. Also the step up result of reducing the time by approx. 2.5 years, being the greatest change in time for all questions asked, shows that this area could be a high priority for industry investment to provide relevant training.
Question 14: Relative upfront cost of innovation
Response: Large initial investment
Reasoning: EID equipment and live weight monitoring gear is relatively expensive compared to the resulting benefit, but it is possible to make do with more basic equipment which generates
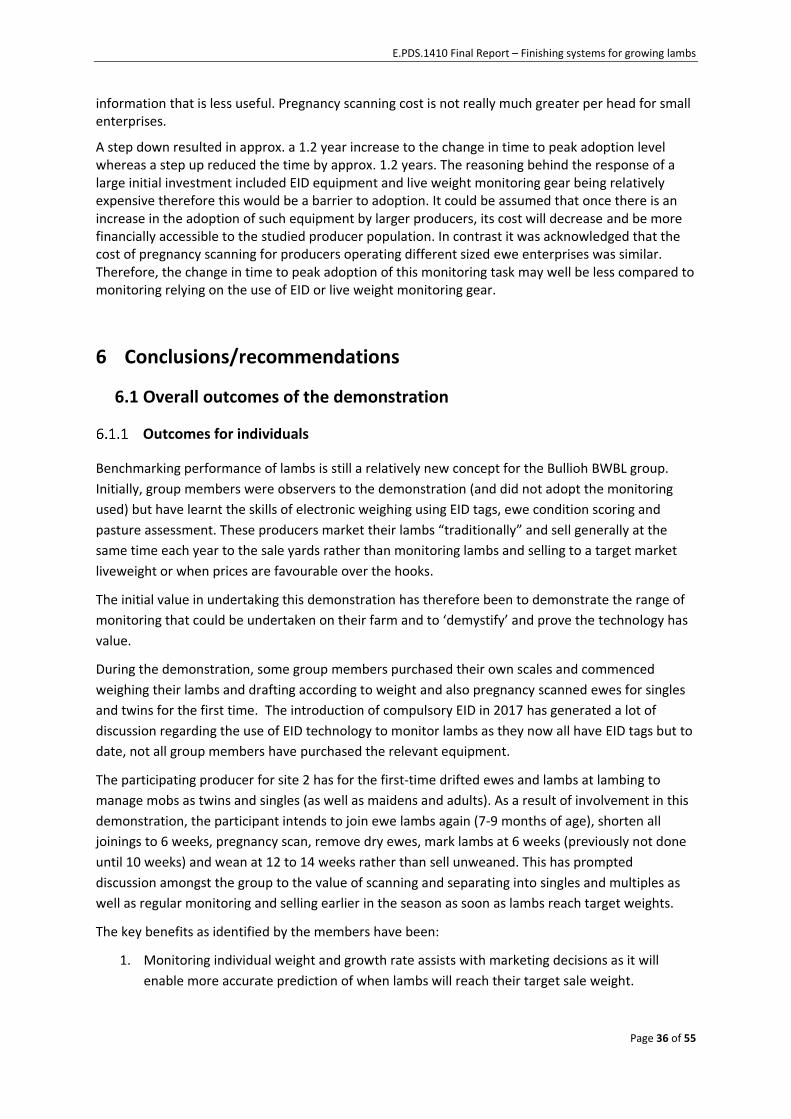
E.PDS.1410 Final Report – Finishing systems for growing lambs
Page 36 of 55
information that is less useful. Pregnancy scanning cost is not really much greater per head for small enterprises.
A step down resulted in approx. a 1.2 year increase to the change in time to peak adoption level whereas a step up reduced the time by approx. 1.2 years. The reasoning behind the response of a large initial investment included EID equipment and live weight monitoring gear being relatively expensive therefore this would be a barrier to adoption. It could be assumed that once there is an increase in the adoption of such equipment by larger producers, its cost will decrease and be more financially accessible to the studied producer population. In contrast it was acknowledged that the cost of pregnancy scanning for producers operating different sized ewe enterprises was similar. Therefore, the change in time to peak adoption of this monitoring task may well be less compared to monitoring relying on the use of EID or live weight monitoring gear.
6 Conclusions/recommendations
6.1 Overall outcomes of the demonstration
Outcomes for individuals
Benchmarking performance of lambs is still a relatively new concept for the Bullioh BWBL group.
Initially, group members were observers to the demonstration (and did not adopt the monitoring
used) but have learnt the skills of electronic weighing using EID tags, ewe condition scoring and
pasture assessment. These producers market their lambs “traditionally” and sell generally at the
same time each year to the sale yards rather than monitoring lambs and selling to a target market
liveweight or when prices are favourable over the hooks.
The initial value in undertaking this demonstration has therefore been to demonstrate the range of
monitoring that could be undertaken on their farm and to ‘demystify’ and prove the technology has
value.
During the demonstration, some group members purchased their own scales and commenced
weighing their lambs and drafting according to weight and also pregnancy scanned ewes for singles
and twins for the first time. The introduction of compulsory EID in 2017 has generated a lot of
discussion regarding the use of EID technology to monitor lambs as they now all have EID tags but to
date, not all group members have purchased the relevant equipment.
The participating producer for site 2 has for the first-time drifted ewes and lambs at lambing to
manage mobs as twins and singles (as well as maidens and adults). As a result of involvement in this
demonstration, the participant intends to join ewe lambs again (7-9 months of age), shorten all
joinings to 6 weeks, pregnancy scan, remove dry ewes, mark lambs at 6 weeks (previously not done
until 10 weeks) and wean at 12 to 14 weeks rather than sell unweaned. This has prompted
discussion amongst the group to the value of scanning and separating into singles and multiples as
well as regular monitoring and selling earlier in the season as soon as lambs reach target weights.
The key benefits as identified by the members have been:
1. Monitoring individual weight and growth rate assists with marketing decisions as it will
enable more accurate prediction of when lambs will reach their target sale weight.
E.PDS.1410 Final Report – Finishing systems for growing lambs
Page 37 of 55
2. Identifying individual lamb growth helps influence the decision to sell earlier rather than
keeping for an extended period for only a small live weight gain.
3. Identifying fast growth lambs and predicting an early turn-off provides the opportunity for
better grazing management.
4. Condition scoring ewes quantifies their condition and determines if nutritional requirements
are being provided.
5. Monitoring pasture quality and quantity assists with optimum nutritional management of
ewes.
6. Feed is not limiting at the time when creep feeders would normally be introduced thus
questioning the value of this strategy.
7. Feed IS limiting at lambing/marking – consider feed wedge or other feeding strategies.
8. Fast growth rate of lambs until Oct/Nov (300 +g/day).
9. Lamb growth slows quickly from December (90 g/day).
10. Pregnancy scanning ewes enables strategic feeding according to pregnancy status.
11. Ewe lambs although heavy enough at joining need to be on a rising plane of nutrition and
joined later when their natural cycling is at an optimum.
Outcome for the group
The key outcome to the Bullioh BWBL group of the demonstration has been to keep the group
motivated and engaged. As this group has the secondary aim of providing a link to the DELWP Wild
Dog Control program, it is considered of value to maintain the group rather than have it adjourn.
This project gave the group a focus and purpose that allowed them to re-group and define their
direction for 2017 and beyond. Recently the group has attracted some new and returning members
that will allow the group to keep functioning. DELWP Community Wild Dog Control Coordinators
continue to have involvement with the group and the group has shifted their focus in 2017-18 to
management of worms in their sheep flocks.
6.2 Recommendations for improving the outcomes of the demonstration
Challenges to the demonstration
One of the key challenges in the demonstration was keeping the two participating farmers engaged
with the monitoring requirements to enable meaningful data to be collected and analysed. This
demonstration was run on two commercial farms and as such, needed to fit into regular farming
operations. Allowances were made to the methodology to allow the demonstration to ‘fit in’ as
much as possible. However, sometimes it was difficult to convince the participating producers to do
the required monitoring (i.e. pregnancy scanning in Year 2, weighing lambs just prior to sale,
condition scoring ewes) and resulted in adjustments being made to the method or critical data not
being collected. This meant that some questions were left unanswered such as:
The cost of carrying over unfinished lambs with low growth rates
Actual opportunity cost of feed consumed by carry-over lambs. However, an estimate of
opportunity costs has been calculated based on estimated lamb growth rates and pasture
consumption of carry over lambs, compared to utilising the pasture for other management
strategies (see Section 7).

E.PDS.1410 Final Report – Finishing systems for growing lambs
Page 38 of 55
The benefits of separating the scanned ewes into singles and twin mobs after scanning (not
at lambing) and whether this can have an impact on early weight gain of lambs.
In consultation with the participants, the co-ordinators of the Farming Systems Demonstration and
BWBL group proactively developed and planned, reminded and encouraged participants to obtain
information at times nominated in the methodology. For various reasons including seasonal
conditions (such as too wet to weigh) and other enterprises taking priority over the demonstration,
not all information required for the demonstration was obtained. There is no easy answer to
engaging producers, as to force these requirements can cause them to drop out of the
demonstration or make them reluctant to fully participate.
One suggestion is to provide more labour support to the producer to ensure the final weights are
collected, the other is to accept the imperfections that arise from conducting demonstrations on
commercial farms. Part of the learning for the Bullioh BWBL group was how to conduct
demonstrations properly and that all the data needs to be collected in order to quantify answers.
Group members did realise after the fact that data was missing that would have helped answer their
questions, but it was difficult to convince them at the time to collect it.
Implications to the Red Meat Industry
The implications from this demonstration to the Red Meat Industry in general are that it is a flawed
assumption to believe that all producers understand the growth rates of their animals in their own
systems and can monitor the factors that contribute to growth rate (individual lamb weight, pasture
quality and quantity and ewe condition).
Establishing baseline data for a specific geographical area was a valuable exercise for the Bullioh
BWBL group and gave them skills and knowledge to do this themselves, if they choose to. Even
though creep feeding (an initial aim of the demonstration) was not undertaken, the demonstration
showed that this would not have necessarily changed the selling patterns for lambs, the numbers of
lambs carried over or fixed the issue of filling the late pregnancy/early lactation feed gap.
Monitoring growth rates did allow growth patterns to be established and has provided valuable
knowledge and skills that group members did not have prior to this demonstration. These skills and
knowledge will assist the group to improve future grazing management and lamb marketing
decisions.
The demonstration also showed that early joining of ewe lambs was more complicated than first
anticipated and that to be successful, needs to be tried again to test the conditions needed to
ensure its success.
The KASAA evaluation showed there was a positive change to some degree in the measures of
knowledge, attitude, skills, aspirations and adoption against all the six parameters for group
members. Across these five measures the change in pre and post scores ranged from 2 % increase to
121 % increase. There could be numerous reasons for this large range which includes; already
practicing this parameter, lack of knowledge, skills, confidence, financial constraints and time. These
positive KASAA changes indicate that there were valuable learnings and outcomes from this
demonstration.
The ADOPT process highlighted that for producers with ewe flocks of less than 1000, although there
are benefits of monitoring, the cost of buying the equipment to monitor is a major barrier as is

E.PDS.1410 Final Report – Finishing systems for growing lambs
Page 39 of 55
developing the skills to use the equipment. To observers the monitoring of liveweight, growth rate,
ewe condition score and pasture quality and quantity are not very ‘visible’ adoptions so it is difficult
to explain their value. Instead monitoring is a management tool to enable better informed decisions.
One Bullioh BWBL group member also observed that the ADOPT model did not take into account his
motivation for wanting to improve and get more enjoyment from farming and that if this can be
demonstrated, he is more likely to make changes to increase both.
Achieving full value from the project findings
To achieve full value from this project’s findings, it is suggested that the following occur in future
producer demonstrations:
1. Instead of demonstrating the value of new practices, emphasis be placed on understanding
the issues associated with existing practices by measuring and obtaining baseline
information to explain what is going on first. In both years, a feed gap during late
pregnancy/early lactation was identified that was never fully addressed and the monitoring
occurred too late to allow adjustments in this management. However, if the emphasis had
been implementing a creep feeding system at the start of the demonstration, the early feed
gap may not have been identified as an existing limitation.
2. After baselines have been established, the subsequent years of the demonstration can be
used to define the practices to be changed/improved so that action learning can be
demonstrated.
3. More time is allocated to training and enabling farmers to undertake monitoring themselves
using electronic identification equipment and conducting valid demonstrations. It was not
until the end of the demonstration that the participants fully understood how data integrity
impacts on the validity of findings.
To achieve full value from the data obtained from this project it is recommended that a plain English
case study be developed that summarises learnings from this demonstration, with emphasis on best
practice guidelines and gaps in knowledge, that can be published in the local rural press.
It is also recommended that further thought be given on how to demonstrate to other producers
with smaller flocks the data that is required to measure lamb performance. Also, how to do this cost
effectively with minimal equipment (low cost) or with shared equipment.
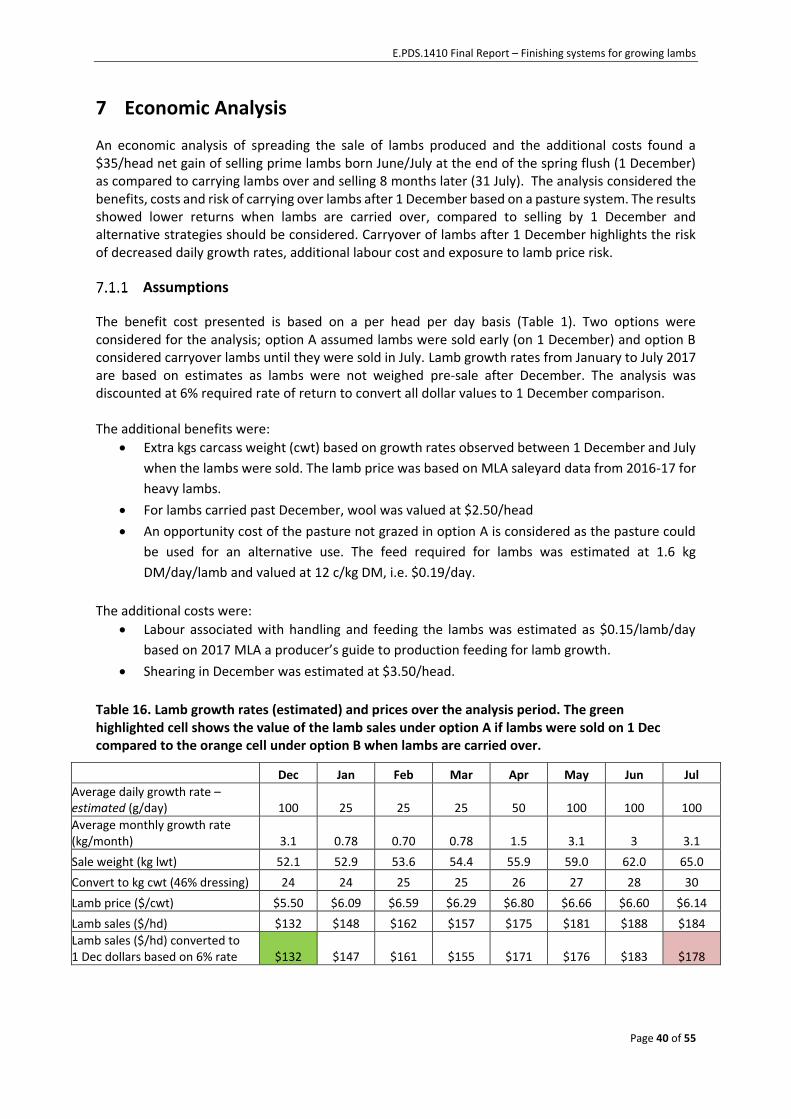
E.PDS.1410 Final Report – Finishing systems for growing lambs
Page 40 of 55
7 Economic Analysis
An economic analysis of spreading the sale of lambs produced and the additional costs found a $35/head net gain of selling prime lambs born June/July at the end of the spring flush (1 December) as compared to carrying lambs over and selling 8 months later (31 July). The analysis considered the benefits, costs and risk of carrying over lambs after 1 December based on a pasture system. The results showed lower returns when lambs are carried over, compared to selling by 1 December and alternative strategies should be considered. Carryover of lambs after 1 December highlights the risk of decreased daily growth rates, additional labour cost and exposure to lamb price risk.
Assumptions
The benefit cost presented is based on a per head per day basis (Table 1). Two options were considered for the analysis; option A assumed lambs were sold early (on 1 December) and option B considered carryover lambs until they were sold in July. Lamb growth rates from January to July 2017 are based on estimates as lambs were not weighed pre-sale after December. The analysis was discounted at 6% required rate of return to convert all dollar values to 1 December comparison. The additional benefits were:
Extra kgs carcass weight (cwt) based on growth rates observed between 1 December and July
when the lambs were sold. The lamb price was based on MLA saleyard data from 2016-17 for
heavy lambs.
For lambs carried past December, wool was valued at $2.50/head
An opportunity cost of the pasture not grazed in option A is considered as the pasture could
be used for an alternative use. The feed required for lambs was estimated at 1.6 kg
DM/day/lamb and valued at 12 c/kg DM, i.e. $0.19/day.
The additional costs were:
Labour associated with handling and feeding the lambs was estimated as $0.15/lamb/day
based on 2017 MLA a producer’s guide to production feeding for lamb growth.
Shearing in December was estimated at $3.50/head.
Table 16. Lamb growth rates (estimated) and prices over the analysis period. The green highlighted cell shows the value of the lamb sales under option A if lambs were sold on 1 Dec compared to the orange cell under option B when lambs are carried over.
Dec Jan Feb Mar Apr May Jun Jul
Average daily growth rate – estimated (g/day) 100 25 25 25 50 100 100 100
Average monthly growth rate (kg/month) 3.1 0.78 0.70 0.78 1.5 3.1 3 3.1
Sale weight (kg lwt) 52.1 52.9 53.6 54.4 55.9 59.0 62.0 65.0
Convert to kg cwt (46% dressing) 24 24 25 25 26 27 28 30
Lamb price ($/cwt) $5.50 $6.09 $6.59 $6.29 $6.80 $6.66 $6.60 $6.14
Lamb sales ($/hd) $132 $148 $162 $157 $175 $181 $188 $184
Lamb sales ($/hd) converted to 1 Dec dollars based on 6% rate $132 $147 $161 $155 $171 $176 $183 $178

E.PDS.1410 Final Report – Finishing systems for growing lambs
Page 41 of 55
Results
The results for the Finishing Systems demonstration are outlined in the table 15. The analysis looked at the carryover of lambs up until end of July the following calendar year.
Table 15. Economic analysis for comparing selling lambs on 1 December (option A) with carrying over lambs until end of July, the following calendar year (option B). All values are converted to 1 December dollars based on a discount rate of 6%.
Option A: sell early (1 Dec) Option B: sell later (July)
INCOME
Lamb sales ($/hd) (see Table 1) $132 $178
Wool ($/hd) $2.5
Opportunity cost of pasture not grazed ($/hd) $45
Total income ($/hd) $177 $180.50
COSTS
Labour ($/hd) $35
Shearing costs ($/hd) $3.5
Total costs ($/hd) $0 $38.5
NET BENEFIT ($/hd) $177 $142
Net gain of option A compared to option B $35
The net benefit of option A (sell now), where lambs are sold on 1 December, was estimated at
$177/hd based on 2016-17 prices. While option B returned a positive net benefit of $142/head, it
was $35/head worse off compared to option A. The additional costs of carrying over lambs, including
labour and shearing were not covered by the additional weight gain and higher lamb price recorded
in July, compared to selling the lambs on 1 December.
Figure 9 shows the net gain for each month by comparing the difference in net benefit of option A
and B. This shows that for every month between December and July, option A: sell now is a better
than selling later.
Figure 9. The net gain (option A: sell now compared to option B: sell later) of carrying over lambs between Dec and Jul. All values are converted to 1 December dollars based on a discount rate of 6%.
$-
$10
$20
$30
$40
$50
$60
Dec Jan Feb Mar Apr May Jun Jul
Net
gai
n (
$ c
on
vert
ed
1 D
ec d
olla
rs)
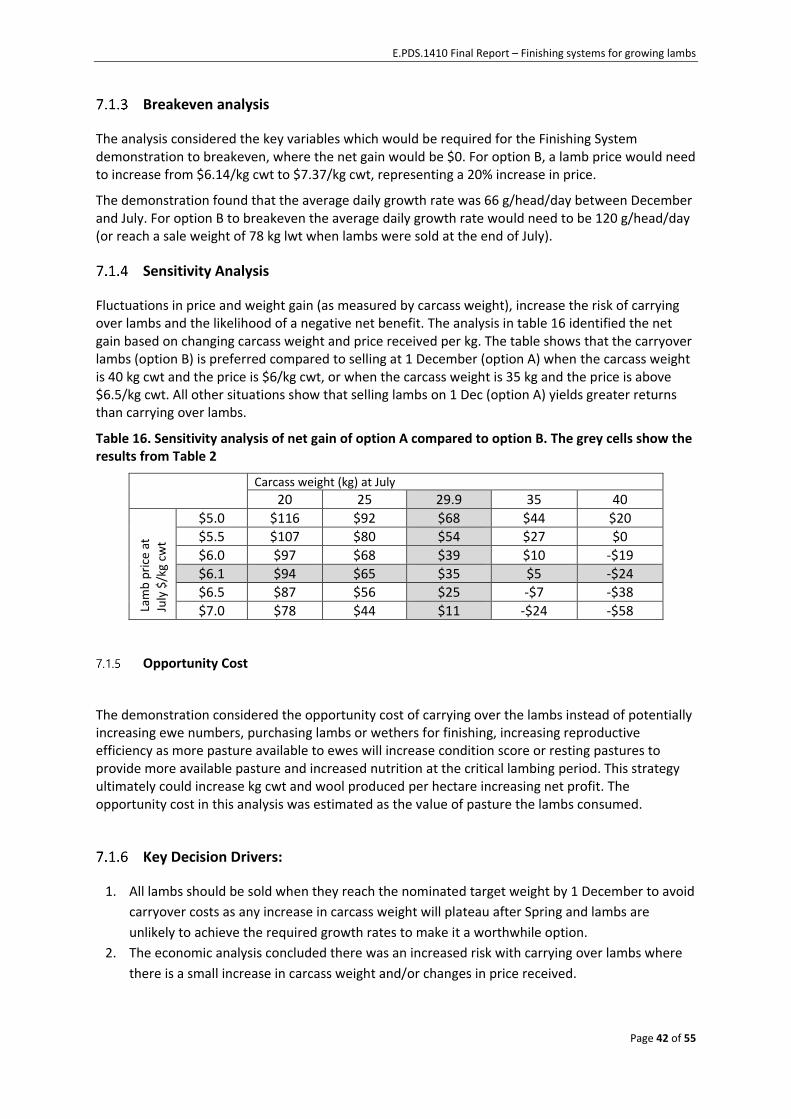
E.PDS.1410 Final Report – Finishing systems for growing lambs
Page 42 of 55
Breakeven analysis
The analysis considered the key variables which would be required for the Finishing System demonstration to breakeven, where the net gain would be $0. For option B, a lamb price would need to increase from $6.14/kg cwt to $7.37/kg cwt, representing a 20% increase in price.
The demonstration found that the average daily growth rate was 66 g/head/day between December and July. For option B to breakeven the average daily growth rate would need to be 120 g/head/day (or reach a sale weight of 78 kg lwt when lambs were sold at the end of July).
Sensitivity Analysis
Fluctuations in price and weight gain (as measured by carcass weight), increase the risk of carrying over lambs and the likelihood of a negative net benefit. The analysis in table 16 identified the net gain based on changing carcass weight and price received per kg. The table shows that the carryover lambs (option B) is preferred compared to selling at 1 December (option A) when the carcass weight is 40 kg cwt and the price is $6/kg cwt, or when the carcass weight is 35 kg and the price is above $6.5/kg cwt. All other situations show that selling lambs on 1 Dec (option A) yields greater returns than carrying over lambs.
Table 16. Sensitivity analysis of net gain of option A compared to option B. The grey cells show the results from Table 2
Carcass weight (kg) at July
20 25 29.9 35 40
Lam
b p
rice
at
July
$/k
g cw
t
$5.0 $116 $92 $68 $44 $20
$5.5 $107 $80 $54 $27 $0
$6.0 $97 $68 $39 $10 -$19
$6.1 $94 $65 $35 $5 -$24
$6.5 $87 $56 $25 -$7 -$38
$7.0 $78 $44 $11 -$24 -$58
Opportunity Cost
The demonstration considered the opportunity cost of carrying over the lambs instead of potentially increasing ewe numbers, purchasing lambs or wethers for finishing, increasing reproductive efficiency as more pasture available to ewes will increase condition score or resting pastures to provide more available pasture and increased nutrition at the critical lambing period. This strategy ultimately could increase kg cwt and wool produced per hectare increasing net profit. The opportunity cost in this analysis was estimated as the value of pasture the lambs consumed.
Key Decision Drivers:
1. All lambs should be sold when they reach the nominated target weight by 1 December to avoid
carryover costs as any increase in carcass weight will plateau after Spring and lambs are
unlikely to achieve the required growth rates to make it a worthwhile option.
2. The economic analysis concluded there was an increased risk with carrying over lambs where
there is a small increase in carcass weight and/or changes in price received.

E.PDS.1410 Final Report – Finishing systems for growing lambs
Page 43 of 55
3. A breakeven analysis concluded that price received would need to be $7.37/kg cwt for the
carryover lamb (option B) to be equivalent to selling lambs on 1 December (option A).
4. Carryover of lambs from 1 December highlights the risk of decreased daily growth rates,
increased labour and shearing costs and exposure to price risk.
5. Carryover of lambs should be considered as part of the overall strategy. Where weight gain due
to seasonal conditions and prices are favourable a proportion of production could be
considered for carryover and/or forward contracts entered to manage price risk.
6. Based on the results an alternative system or strategy should be considered as opposed to the
annual carry over of lambs.
7. So, is keeping lambs on a good bet? Well that will depend on attitude towards risk, and a
subjective view on seasonal markets and weather. This analysis gives some insight into the
decision-making process.
E.PDS.1410 Final Report – Finishing systems for growing lambs
Page 44 of 55
8 Bibliography
Fogarty N. M., Ingham V. M., Gilmour A. R., Afolayan R. A., Cummins L. J., Edwards J. E. Hocking, Gaunt G. M. (2007) Genetic evaluation of crossbred lamb production. 5. Age of puberty and lambing performance of yearling crossbred ewes. Australian Journal of Agricultural Research 58, 928-934.
Kuehne G., Llewellyn R., Pannell D., Wilkinson R., Dolling P., Ouzman J. and Ewinge M. (2017). Predicting farmer uptake of new agricultural practices: A tool for research, extension and policy. Agricultural Systems, 156, pp. 115-125.
Making More from Sheep Manual (MLA) http://www.makingmorefromsheep.com.au/market-focussed-lamb-and-sheepmeat-production/procedure_3.1.htm

E.PDS.1410 Final Report – Finishing systems for growing lambs
Page 45 of 55
9 Appendix
9.1 Field day program
Making Sheep Profitable in the Upper Murray Field Day
when
Thursday 1st June 9:30 am – 3:30 pm
Burrowye Fire Shed, Guys Forest Rd, Burrowye
Morning Tea and BBQ lunch provided ($10 pp)
Program
9:30 Registration, tea and coffee
10:00 Opening Welcome
Introduction to the Bullioh BWBL group and the demonstration
Secrets of making sheep profitable in the Upper Murray Part 1
Dr Kristy Howard
Group Coordinator
Inspiring Excellence
10:45 Finishing ALL lambs before Christmas - Is it possible?
Results from the Bullioh BWBL Enhanced Producer Demonstration
Dr Kristy Howard
Gervaise Gaunt Ag Vic
12:00 Demonstration
Weighing of demonstration lambs with EID
Condition scoring ewes
Matching feed available with animal demand
Gervaise Gaunt and Dr Kristy Howard
12: 30 - Lunch - BBQ
1:15 Where do all the wild dogs go?
Tracking wild dog behaviour using GPS collaring in the Murray
Steve Wilson, Murray LLS (NSW)
2 pm Secrets of making sheep profitable in the Upper Murray part 2
Dr Kristy Howard
3pm Closing address
RSVP to Kristy Howard or Rina Cooper – Inspiring Excellence [email protected]
or Kristy on 0400 282 222 by Monday 29th May

E.PDS.1410 Final Report – Finishing systems for growing lambs
Page 46 of 55
9.2 Group evaluation
The Bullioh BWBL Group members completed an evaluation of this lamb demonstration on 13/10/16.
The following questions and their responses were recorded.
What was the value of this demonstration ?
‘Allowed me to separate mobs into singles and twins and allocate pasture to the nutritional requirements of a specific mob for the first time’
‘It was good to weigh lambs to compare visual estimate with actual weight’
‘I have purchased scales to weigh ewes’
‘I will start weighing lambs to select for market’
‘I am interested in scanning ewes’
What was the value of weighing lambs?
‘It was a terrific aid to match lamb weight to market trends ie: if increased price for heavier lambs then sell lambs later.’
‘I am able to better target my market’
‘I have purchased an immobiliser and scales since the start of the demonstration to make handling and weighing easier’
‘I have drifted mobs into single and twins for demonstration to monitor the different growth rates in each’
What were the positives of being an observer?
‘It was good to observe and compare pasture assessments between participating producers’
‘Pasture quality measurements – value has been to confirm pastures could be improved. Also test results confirmed visual assessments of pasture species difference (eg: native versus introduced) paddocks and the likely nutritional differences.’
Are there any changes you would like to see to the demonstration in the following year?
‘At the next joining will practice lifetime ewe management rules eg: shorter joining, remove dry ewes, follow calendar of events’
‘Will definitely scan ewes from next joining’
‘Mark lambs at 6 weeks old’
‘Wean at 12 to 14 weeks old’
E.PDS.1410 Final Report – Finishing systems for growing lambs
Page 47 of 55
9.3 ADOPT report
A D O P T: the adoption and diffusion
outcome prediction tool
Adoption report for:
Bullioh EPDS Project - Feeding Systems For Growing Lambs
23 October 2017
For more information about ADOPT contact:

E.PDS.1410 Final Report – Finishing systems for growing lambs
Page 48 of 55

E.PDS.1410 Final Report – Finishing systems for growing lambs
Page 49 of 55
Report Authors: Martin Dunstan & Ian Gamble, Agriculture Victoria
Bullioh Best Wool Best Lamb (BWBL) Group
Upper Murray, North East Victoria
Terms of ADOPT User Licence – Australia (Version 2) Commonwealth Scientific and Industrial Research Organisation (“CSIRO”) IMPORTANT NOTICE ADOPT User Licence This is an important notice. Use of the ADOPT file within which this page appears is taken to be your acceptance of the terms below. If you do not agree with the terms set out below you must: 1. not use ADOPT in any way 2. delete ADOPT from your computer 3. notify CSIRO of having deleted ADOPT: ADOPT is provided to you on the following terms. 1. This version of ADOPT is available for learning and decision-support purposes only. You must not use this version of ADOPT for any other purpose. 2. CSIRO appreciates your review of ADOPT, and your willingness to provide feedback and comments. 3. CSIRO grants a non-exclusive licence to you, to use one copy of ADOPT on a stand alone computer. You may install ADOPT on a hard disk on a stand alone computer. You must not install it upon a network server. You must not permit any access to ADOPT on the internet, or via any communications method. 4. ADOPT is licensed to you. It is not sold to you. CSIRO retains ownership of the copyright and all other rights in ADOPT. 5. You may copy ADOPT for backup purposes only. You must not make copies of ADOPT for third parties, nor permit others to do so. You must not rent lease or hire out ADOPT. 6. You must not modify or alter the original text, design or formulae in ADOPT, but you may input data into ADOPT where prompted to do so. 7. You may terminate this licence at any time by deleting all copies of ADOPT. 8. If you breach any of the terms of this licence, CSIRO may terminate this licence. If CSIRO terminates this licence, you must delete all copies of ADOPT. 9. ADOPT is provided "as-is". You accept all risks and responsibility for losses, damages, costs and other consequences resulting directly or indirectly from using ADOPT, or an inability to use ADOPT, including interoperability, and any information or material available from ADOPT, or decisions made based on using ADOPT; and CSIRO excludes all liability to you whether direct, indirect, incidental or consequential, howsoever arising, in respect of these. CSIRO makes no representations, warranties or conditions of any kind, express or implied, including but not limited to in regard to the quality, contents or accuracy of ADOPT, or of title, merchantability, fitness for a particular purpose, non-infringement, the absence of latent or other defects, or the presence or absence of errors or harmful components, whether or not discoverable; and to the full extent permitted by law, all implied conditions, warranties and representations whether arising under statute or by implication of law, custom or usage, shall not apply. 10. This licence will be governed by the laws of South Australia. CSIRO Agriculture Waite Campus Post: PMB 2 Glen Osmond SA 5064, Attention: Dr Rick Llewellyn Phone: 08 8303 8502 Email: [email protected]

E.PDS.1410 Final Report – Finishing systems for growing lambs
Page 50 of 55
Description of the Innovation Monitoring as an aid to decision making to optimise lamb production - ewe condition score, ewe pregnancy status, pasture feed on offer, lamb growth rates
Description of the Population
Prime lamb producers with flocks of less than 1000 ewes.
Predicted Adoption Levels
Predicted peak level of adoption1 83%
Predicted years to peak adoption2 20
Predicted years to near-peak adoption3 16
Year innovation first adopted or expected to be adopted N/A
Year innovation adoption level measured N/A
Adoption level in that year N/A
Predicted adoption level in 5 years from start 22.4%
Predicted adoption level in 10 years from start 66.4%
PLEASE NOTE: 1. The predictions of ‘Peak Adoption Level’ is a numeric output that is provided to assist with insight and understanding and like any forecasts should be used with caution. 2. The prediction of ‘Time to Peak Adoption Level’ is a numeric output that is provided to assist with insight and understanding and like any forecasts should be used with caution 3. ‘Time to Near Peak Adoption’ represents the time to 95% of the maximum predicted adoption level.
Predicted Adoption Curve
0
10
20
30
40
50
60
70
80
90
100
0 10 20 30 40
Adop
tion L
evel (%
)
Time (years)
Adoption Level S-Curve
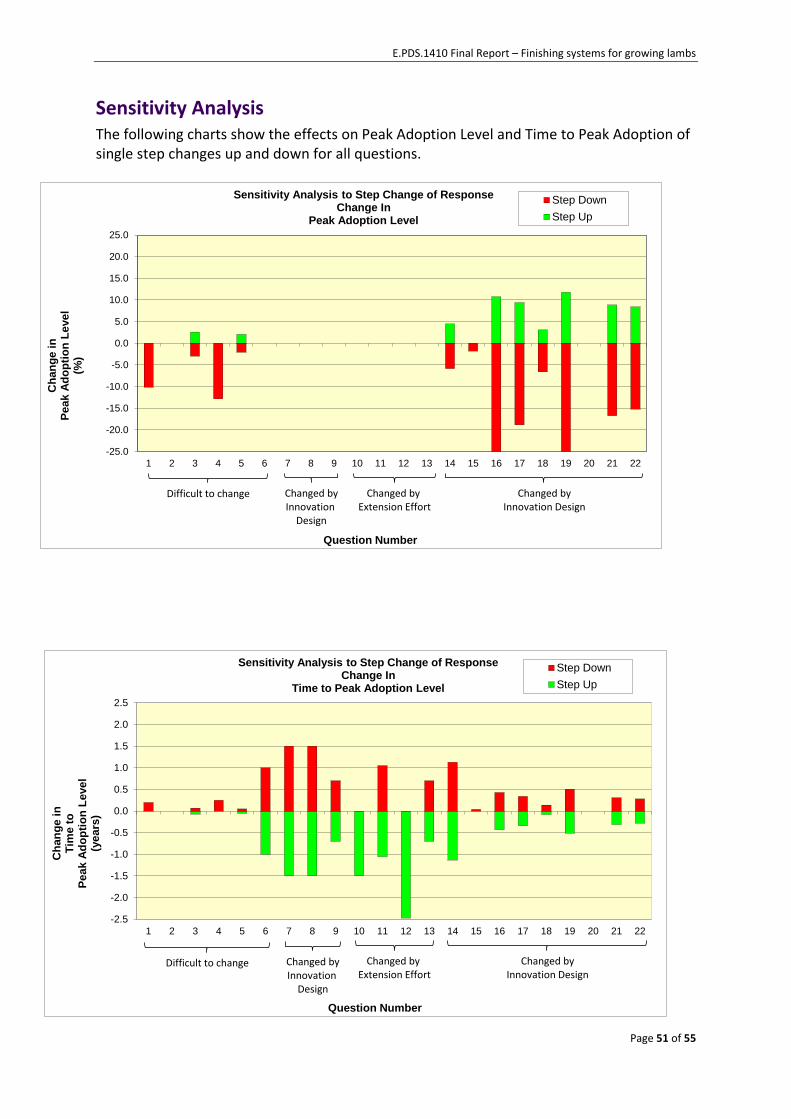
E.PDS.1410 Final Report – Finishing systems for growing lambs
Page 51 of 55
Sensitivity Analysis The following charts show the effects on Peak Adoption Level and Time to Peak Adoption of single step changes up and down for all questions.
1.
-25.0
-20.0
-15.0
-10.0
-5.0
0.0
5.0
10.0
15.0
20.0
25.0
1 2 3 4 5 6 7 8 9 10 11 12 13 14 15 16 17 18 19 20 21 22
Ch
an
ge i
n
Peak A
do
pti
on
Level
(%)
Question Number
Sensitivity Analysis to Step Change of ResponseChange In
Peak Adoption Level
Step Down
Step Up
Difficult to change Changed byInnovation
Design
Changed by Extension Effort
Changed byInnovation Design
-2.5
-2.0
-1.5
-1.0
-0.5
0.0
0.5
1.0
1.5
2.0
2.5
1 2 3 4 5 6 7 8 9 10 11 12 13 14 15 16 17 18 19 20 21 22
Ch
an
ge i
n
Tim
e t
o
Peak A
do
pti
on
Level
(years
)
Question Number
Sensitivity Analysis to Step Change of ResponseChange In
Time to Peak Adoption Level
Step Down
Step Up
Difficult to change Changed byInnovation
Design
Changed by Extension Effort
Changed byInnovation Design

E.PDS.1410 Final Report – Finishing systems for growing lambs
Page 52 of 55
S-Curve Sensitivity The following chart shows how the S-Curve is predicted to change when a single step change is made to the most sensitive question(s) with respect to Peak Adoption Level. The following chart shows how the S-Curve is predicted to change when a single step change is made to the most sensitive question(s) with respect to Time to Near Peak Adoption
0
10
20
30
40
50
60
70
80
90
100
0 10 20 30 40
Ad
op
tio
n L
eve
l (%
)
Time (years)
Adoption Level S-Curve Original Level Step Up Step Down
0
10
20
30
40
50
60
70
80
90
100
0 10 20 30 40
Ad
op
tio
n L
eve
l (%
)
Time (years)
Adoption Level S-Curve Original Level Step Up Step Down
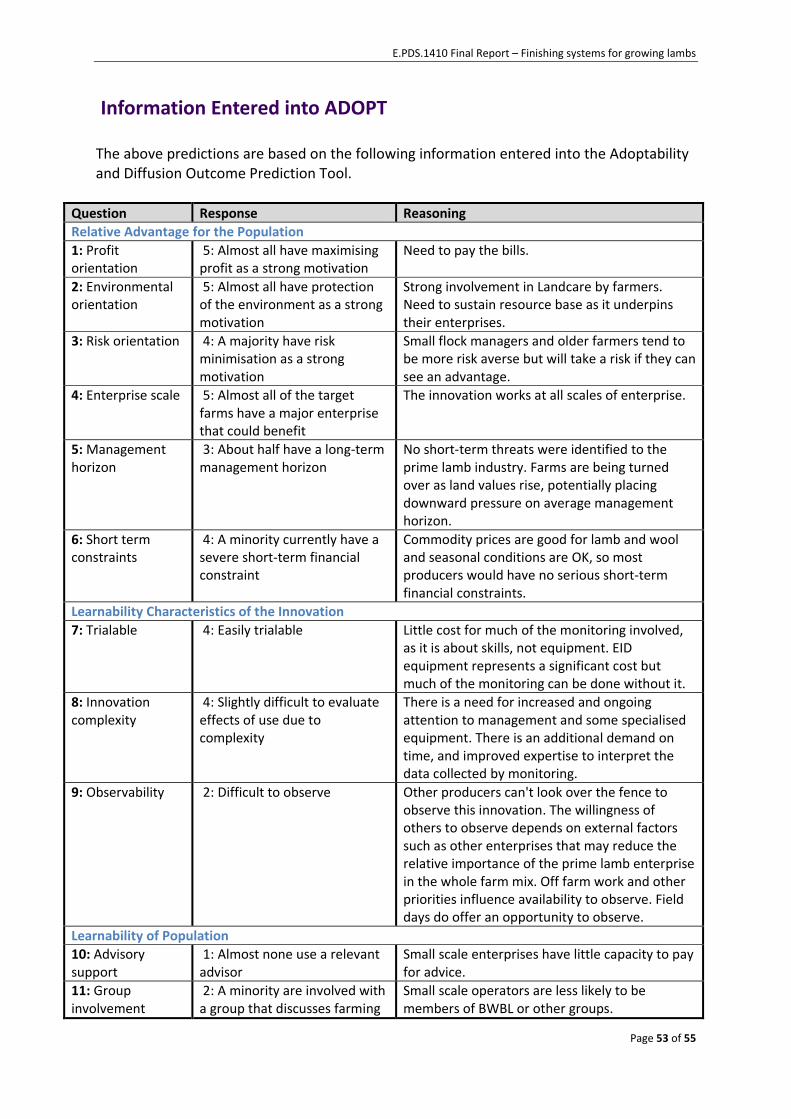
E.PDS.1410 Final Report – Finishing systems for growing lambs
Page 53 of 55
Information Entered into ADOPT The above predictions are based on the following information entered into the Adoptability and Diffusion Outcome Prediction Tool.
Question Response Reasoning
Relative Advantage for the Population
1: Profit orientation
5: Almost all have maximising profit as a strong motivation
Need to pay the bills.
2: Environmental orientation
5: Almost all have protection of the environment as a strong motivation
Strong involvement in Landcare by farmers. Need to sustain resource base as it underpins their enterprises.
3: Risk orientation 4: A majority have risk minimisation as a strong motivation
Small flock managers and older farmers tend to be more risk averse but will take a risk if they can see an advantage.
4: Enterprise scale 5: Almost all of the target farms have a major enterprise that could benefit
The innovation works at all scales of enterprise.
5: Management horizon
3: About half have a long-term management horizon
No short-term threats were identified to the prime lamb industry. Farms are being turned over as land values rise, potentially placing downward pressure on average management horizon.
6: Short term constraints
4: A minority currently have a severe short-term financial constraint
Commodity prices are good for lamb and wool and seasonal conditions are OK, so most producers would have no serious short-term financial constraints.
Learnability Characteristics of the Innovation
7: Trialable 4: Easily trialable Little cost for much of the monitoring involved, as it is about skills, not equipment. EID equipment represents a significant cost but much of the monitoring can be done without it.
8: Innovation complexity
4: Slightly difficult to evaluate effects of use due to complexity
There is a need for increased and ongoing attention to management and some specialised equipment. There is an additional demand on time, and improved expertise to interpret the data collected by monitoring.
9: Observability 2: Difficult to observe Other producers can't look over the fence to observe this innovation. The willingness of others to observe depends on external factors such as other enterprises that may reduce the relative importance of the prime lamb enterprise in the whole farm mix. Off farm work and other priorities influence availability to observe. Field days do offer an opportunity to observe.
Learnability of Population
10: Advisory support
1: Almost none use a relevant advisor
Small scale enterprises have little capacity to pay for advice.
11: Group involvement
2: A minority are involved with a group that discusses farming
Small scale operators are less likely to be members of BWBL or other groups.
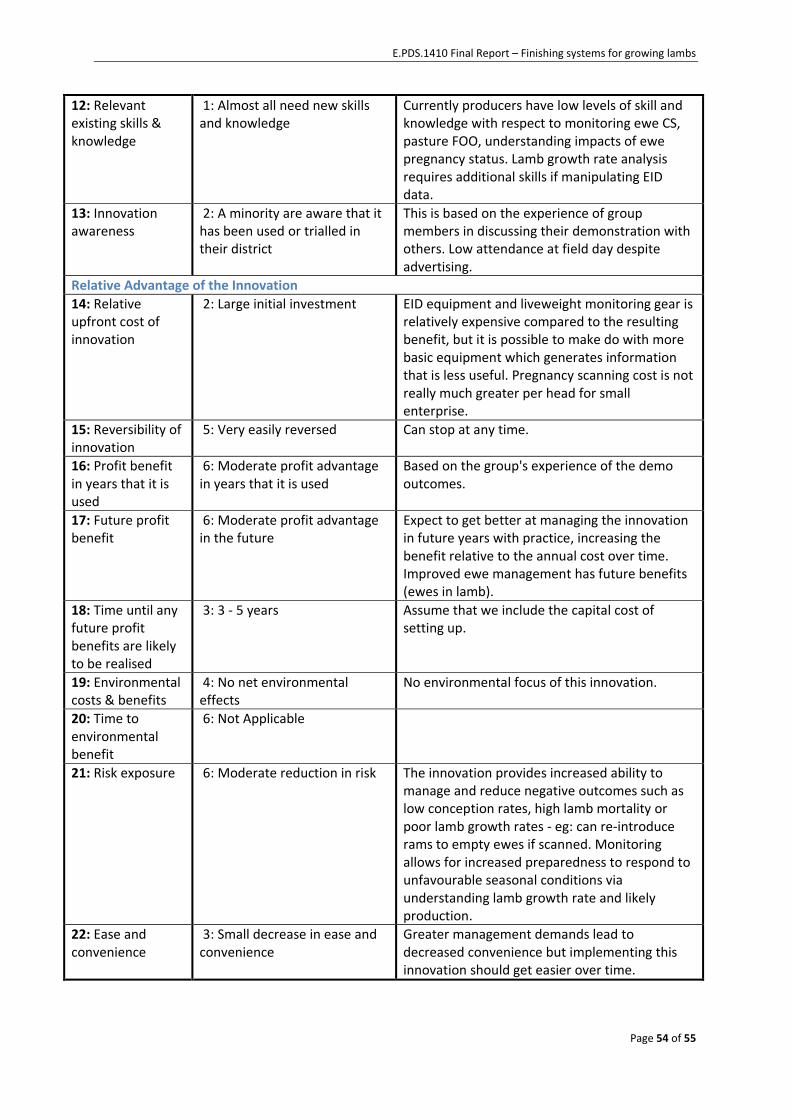
E.PDS.1410 Final Report – Finishing systems for growing lambs
Page 54 of 55
12: Relevant existing skills & knowledge
1: Almost all need new skills and knowledge
Currently producers have low levels of skill and knowledge with respect to monitoring ewe CS, pasture FOO, understanding impacts of ewe pregnancy status. Lamb growth rate analysis requires additional skills if manipulating EID data.
13: Innovation awareness
2: A minority are aware that it has been used or trialled in their district
This is based on the experience of group members in discussing their demonstration with others. Low attendance at field day despite advertising.
Relative Advantage of the Innovation
14: Relative upfront cost of innovation
2: Large initial investment EID equipment and liveweight monitoring gear is relatively expensive compared to the resulting benefit, but it is possible to make do with more basic equipment which generates information that is less useful. Pregnancy scanning cost is not really much greater per head for small enterprise.
15: Reversibility of innovation
5: Very easily reversed Can stop at any time.
16: Profit benefit in years that it is used
6: Moderate profit advantage in years that it is used
Based on the group's experience of the demo outcomes.
17: Future profit benefit
6: Moderate profit advantage in the future
Expect to get better at managing the innovation in future years with practice, increasing the benefit relative to the annual cost over time. Improved ewe management has future benefits (ewes in lamb).
18: Time until any future profit benefits are likely to be realised
3: 3 - 5 years Assume that we include the capital cost of setting up.
19: Environmental costs & benefits
4: No net environmental effects
No environmental focus of this innovation.
20: Time to environmental benefit
6: Not Applicable
21: Risk exposure 6: Moderate reduction in risk The innovation provides increased ability to manage and reduce negative outcomes such as low conception rates, high lamb mortality or poor lamb growth rates - eg: can re-introduce rams to empty ewes if scanned. Monitoring allows for increased preparedness to respond to unfavourable seasonal conditions via understanding lamb growth rate and likely production.
22: Ease and convenience
3: Small decrease in ease and convenience
Greater management demands lead to decreased convenience but implementing this innovation should get easier over time.
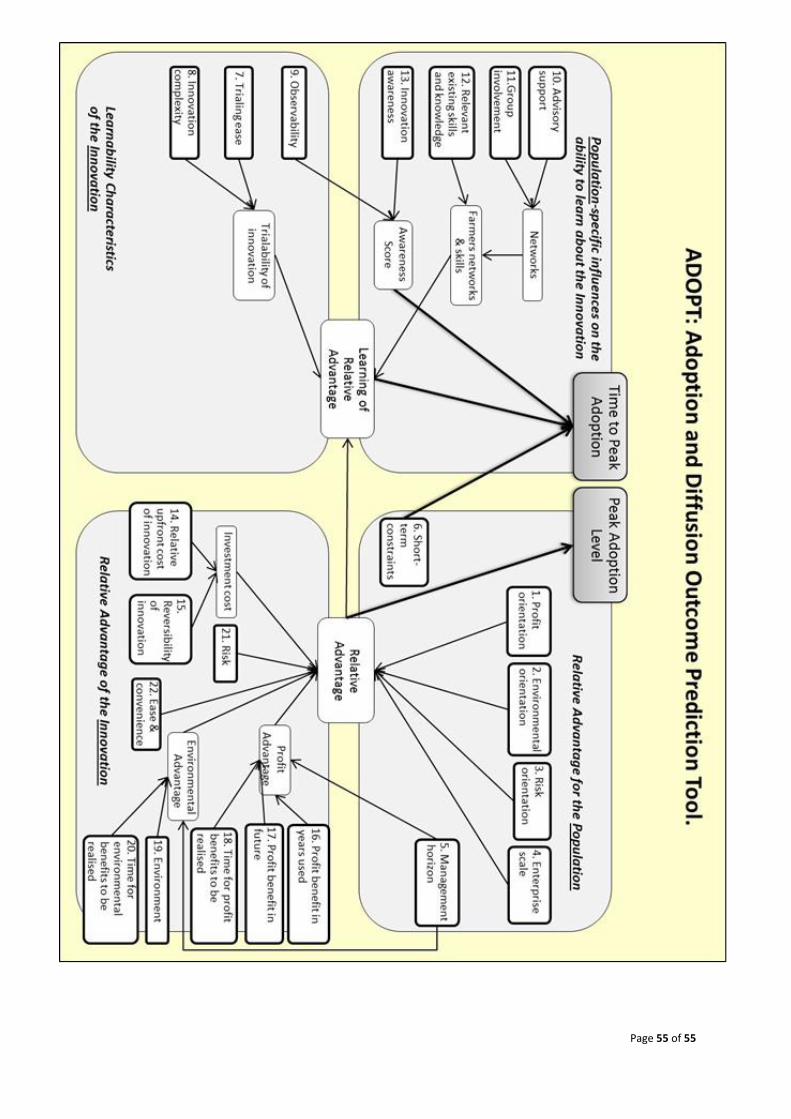
E.PDS.1410 Final Report – Finishing systems for growing lambs
Page 55 of 55