Embed Size (px)
Citation preview
sensors
Article
ePave: A Self-Powered Wireless Sensor for Smart andAutonomous Pavement
Jian Xiao 1,*, Xiang Zou 1 and Wenyao Xu 2 ID
1 Road Traffic Intelligent Detection and Equipment Engineering Technology Research Centre,Chang’an University, Xi’an 710064, China; [email protected]
2 Department of Computer Science and Engineering, University at Buffalo, SUNY, Buffalo, NY 14260, USA;[email protected]
* Correspondence: [email protected]
Received: 8 August 2017; Accepted: 19 September 2017; Published: 26 September 2017
Abstract: “Smart Pavement” is an emerging infrastructure for various on-road applications intransportation and road engineering. However, existing road monitoring solutions demand acertain periodic maintenance effort due to battery life limits in the sensor systems. To this end,we present an end-to-end self-powered wireless sensor—ePave—to facilitate smart and autonomouspavements. The ePave system includes a self-power module, an ultra-low-power sensor system,a wireless transmission module and a built-in power management module. First, we performedan empirical study to characterize the piezoelectric module in order to optimize energy-harvestingefficiency. Second, we developed an integrated sensor system with the optimized energy harvester.An adaptive power knob is designated to adjust the power consumption according to energybudgeting. Finally, we intensively evaluated the ePave system in real-world applications to examinethe system’s performance and explore the trade-off.
Keywords: piezoelectric effect; pavement energy harvesting; adaptive working; wireless sensor
1. Introduction
Many environmental monitoring applications are used in wireless sensor networks [1–5] includingenvironmental monitoring of disasters [6–9]. For such applications, one of the most difficult problemsis the contradiction between the battery life of the wireless sensor network and the need for long-termmonitoring. Harvesting energy from the natural environment to power wireless sensor networks hasreceived much attention, e.g., the use of solar [10,11] or mechanical energy [12–14], or heat [15,16],or radio frequency (RF) [17]. While the acquisition of energy from traditional energy sources, such assolar energy, provides a potential solution the installation costs are high, maintenance is not easy andthey are more affected by the environment. There is a large amount of heat stored in the road [18]but the need for roadbed temperature differences, the design and installation troubles and the effectsof road activities all make energy harvesting from the road difficult. Therefore, it is ideal to usepiezoelectric materials to collect vibration energy from the pavement [19–22] to supply energy to thesystem. Of course, piezoelectric materials have been used to provide energy for many applications,such as bridges [23,24], railways [25], reinforced concrete beam structure health monitoring [26] andso on. In this paper, piezoelectric materials are applied to the highway and used in self-poweredwireless sensing.
The wireless sensor in this paper is used for road data transmission [27]. The road data monitoringsystem is widely applied on the highway and consumes a lot of energy. The purpose of the system is todetect road disasters, find faults ahead of routine maintenance, and to avoid traffic accidents caused byroad damage. There are already some cases of road health testing, for example Mohamed Rhimi et al. [28]propose using wireless sensing technology and RF energy to drive wireless sensors buried under asphalt
Sensors 2017, 17, 2207; doi:10.3390/s17102207 www.mdpi.com/journal/sensors

Sensors 2017, 17, 2207 2 of 24
to transport asphalt data for the diagnosis of road health status. Guo et al. [29] consider applyingsimultaneous wireless information and power transfer techniques to co-operative clustered wirelesssensor networks, where energy-constrained relay nodes harvest the ambient RF signal and use theharvested energy to forward the packets from sources to destinations. However, the use of RF energyrequires on-board RF readers to provide energy for power supply modules and the RF energy-receivingantenna is large in size and inconvenient to bury. Therefore, the use of road piezoelectric energy hasbecome an efficient and convenient energy source. To this end, piezoelectric pavements shouldharvest enough energy to supply data acquisition and wireless transmission. Obviously, road datacollection and other components should be embedded into the road and will be inaccessible forfrequent maintenance. In fact, this sensor system can also access different sensors to apply to otherinformation, e.g., road traffic flow [30] or wheel tracking [31]. Therefore, a wireless sensing applicationfor pavement energy harvesting is proposed in this paper.
This paper presents a pavement self-powered wireless sensing system that integrates a self-powermodule, an ultra-low-power sensor system, a wireless transmission module and a built-in powermanagement module, ePave. The piezoelectric transducers are used to collect energy from thepressurized asphalt pavement and supply power to the sensor nodes. Because vehicle traffic isirregular, the collected energy is not uniform. Based on this feature, we run the system at intervals,depending on how much energy is collected, and the circuit that detects power is self-powered.Note that the energy collected by the vehicle over the road is very small (only a few mJ), so the internalfriction of the circuit and the loss of the storage device should be very small and should be operated atlow power consumption or even zero power. In summary, we make the following major contributions:
• We develop an energy harvesting device based on the vibration of the asphalt pavement at10–20 Hz [32,33]. Our energy harvesting uses piezoelectric bimorph to convert vibrationscaused by vehicle travel. The piezoelectric properties of pavements with different depths areinvestigated. Piezoelectric transducers are encapsulated using different materials to enhance theirpiezoelectric effects.
• We design a universal power management module to receive the energy generated by thepiezoelectric transducer. Note that we designate an adaptive power knob that set the chargevoltage to be higher than 53% of the output voltage to start supplying power to the sensing system.
• We study the internal consumption, output voltage and output energy according to differentstorage devices. Then we select the appropriate energy storage components to collect energyand the energy storage component is calculated according to the power consumption of thesensing system.
• We propose adaptive data acquisition and delivery modes based on the traffic volume. The workingtime ratio according to adaptive power knob is studied to improve the energy efficiency.
• We build a self-sustaining asphalt pavement sensing system prototype and evaluate its performance.
This paper is organized as follows. Section 2 presents some of the most relevant related work thatcan be found in the literature. Section 3 provides a brief introduction to the pavement sensing systemand to its applications and problems. Section 4 describes some of the basic concepts of piezoelectricityand pavement piezoelectric modeling. The capacity of the energy storage element is estimated and thecharging and discharging process of the system is explained. Section 5 deals with the wireless sensing,the adaptive non-timed data acquisition, the delivery scheme, and the on-time ratio for different loadsunder different capacitors. Section 6 presents the performance of the experimental evaluation, which isthe basis for verifying the proposed pavement wireless sensor. Finally, Section 7 concludes the paperand lays out some guidelines for future work.
2. Related Work
It is well known that roads produce pressure, deformation, and vibration when a vehiclepasses [34]. The energy dissipated in the road to mechanical energy and heat not only destroys

Sensors 2017, 17, 2207 3 of 24
the road surface, but also causes problems for road maintenance. Piezoelectric smart materials [34–37]have received much attention in various fields because of the ability to convert mechanical energyinto electrical energy. Smart pavement applications of piezoelectric smart materials on the road totransform mechanical energy into electricity is an emerging infrastructure. With the development ofscience and technology, the power demand for small electronic devices (such as wireless sensors) isdrastically reduced [38], making it possible to collect environmental energy for their power supply [39].Therefore, electrical energy generated by smart pavements could apply to small electronic devices.There have been some studies on road piezoelectric and microelectronics wireless sensing but as faras we know, there are as yet no related articles on pavement piezoelectric, adaptive data acquisition,and wireless sensing.
Nizar Lajnef et al. [40] developed and validated the integrated smart sensing system and datainterpretation techniques for pavement fatigue monitoring, which mainly uses the piezoelectricconversion technology and a new type of self-powered wireless sensor. The system is capableof detecting, storing and transmitting strain history and temperature for long-term monitoring.The ultimate purpose is to incorporate the traffic wander effect in the fatigue prediction algorithms.However, the self-powered wireless sensor mentioned in this paper requires the use of a falling weightdeflectometer or rolling weight deflectometer to non-destructively vibrate the road surface in order topower the sensor.
Guo et al. [41] propose a framework of joint wireless energy replenishment and anchor-pointbased mobile data gathering in WSNs by considering various sources of energy consumption andtime-varying nature of energy replenishment, and verify the impact of utility weight and rechargingrate on network performance in terms of the amount of data gathered, network utility, link flow rateand sojourn time allocation. However, the road information collection system we put forward hasonly the piezoelectric source of the pavement, which cannot guarantee the permanent operation of thewireless sensor, and mainly focuses on the collection of road information.
Erturk and Inman [42] presented the closed-form analytical solution for a unimorph cantileverbased on the Euler–Bernoulli beam assumptions. The analytical solution is extended to bimorphconfigurations with series and parallel connections of piezoceramic layers that are experimentallyvalidated. The outputs of the harvester device (e.g., current, voltage and power) are analyzedextensively for the short circuit and open circuit frequency excitations. The maximum power densityis about 6.8 (mW/g2) cm−3 under a 45.6 Hz and 35 kΩ resistive load. However, the maximum powerdensity is the peak power of unimorph cantilever. And this model only supports unimorph cantileverpiezoelectric transducers and is not suitable for a piezoelectric road.
Lin and Xu [43] analyzed the effect of series matching inductance on the electromechanicalproperties of piezoelectric transducers. When the series matching inductor is increased, the resonancefrequency is decreased, the anti-resonance unchanged, the effective electromechanical couplingcoefficient is increased. The experiment proves its theoretical prediction. However, the vibrationfrequency on the road is very small (about 10 Hz), far less than the piezoelectric transducerresonant frequency.
Cha et al. [44] designed an underwater energy harvester that used the vibrations of a biomimeticfish tail though piezoelectric materials. The possibility of using the underwater vibration of thepiezoelectric tail to power the wireless communication module was evaluated. However, the roadenvironment is very bad and the car load is large, making it easy to crush the piezoelectric ceramics.Therefore, it is necessary to protect the piezoelectric transducer from damage and this requires sufficientpower generation.
Moure et al. [45] conducted a piezoelectric test on asphalt pavement with a cymbal piezoelectrictransducer and evaluated it under similar conditions as the vibrating energy collector that was wastedunder normal traffic conditions. The results show that the piezoelectric cymbals in the asphalt as anenergy collector is feasible and can harvest non-negligible energy. However, it has only evaluated thepiezoelectric power generation by traffic flow, and there is no specific application.

Sensors 2017, 17, 2207 4 of 24
Li et al. [46] designed a self-sustaining system that collects energy from the indoor environment,adapts its duty-cycle to reduce power consumption, synchronize node data transfers, and feed back tothe environment through an inactive flow sensor with no energy consumption. However, due to theuncertainty of road vehicle traffic, the energy collected does not maintain a low power consumption ofthe system. It is necessary to transmit data non-timed based on the collected power.
The above studies have the following restrictions on rechargeable wireless sensing for smartpavement: (a) They studied the influence of the vibration frequency and the external circuit onthe power generation performance of the bimorph. However, due to the influence of the naturalfrequency and energy storage efficiency of the pavement, the storage energy was not as large asthat of the analysis; (b) Due to the impact of the road environment, the traffic load is too large forthe piezoelectric transducer. Therefore, it is necessary to protect the piezoelectric transducer fromthe external environment and seriously reduce its life. Meanwhile, power generation is ensured;(c) Because of the uncertainty of vehicle travel, the system could not be in a state of constant power,so maintaining the low power consumption of the system is not possible. Therefore, the system canrun and send data once when the storage capacity is sufficient.
3. The Pavement Problem and the Pavement Sensing System
We first explain the environment of the pavement problem and then give the general overviewand design fundamentals of our self-powered wireless sensing system.
3.1. Asphalt Pavement Wireless Sensing Information Detection
Asphalt pavement produces mechanical energy and heat when a vehicle passes, and themechanical energy can be used by the piezoelectric transducer to generate electrical energy. Most ofthe current road health testing uses large, cumbersome ultrasonic nondestructive testing [47] orfalling weight deflectometers [48], which can be very costly in terms of both manpower and resources.Most detection instruments can only detect surface damage. It is not possible to detect the followingroadbeds with invisible health hazards. The cost of road health testing often accounts for a large partof the cost of road construction, and the cost of road maintenance is rising as the road base is built.
Therefore, it is necessary to study a road health detection system that does not require man-madereal-time detection and can be remotely detected and controlled, and needs to use wireless sensingto send the road information remotely to judge the road health. The system that makes up this roadinformation is mainly composed of road environment energy harvesting and wireless sensing. Figure 1illustrates the pavement composition and structure of this detection system.
Using a normal battery pack for wireless sensor networks [49,50] is also not possible because asthey are buried in the underground system the battery cannot be replaced. It is more practical to collectthe mechanical energy generated by the vehicle on the road and use it to supply power to the system.Although other environmental energy (e.g., solar, wind and heat) on the road can also be used, it isdifficult to deploy on the road because of difficulties with deployment and the need for buried lines.Therefore, it is imperative to harvest pavement piezoelectric energy and provide ultra-low powerwireless sensor.
In order to solve the above problems, our plan is to develop a pavement self-power wireless sensorsystem. We studied the power generation performance of piezoelectric ceramics based on pavementenergy harvesting and on this basis we improved the energy collection efficiency and calculated thewireless sensing losses. In addition, this system is used not only to measure road information but alsofor other road sensor services (such as traffic flow, etc.).
Sensors 2017, 17, 2207 5 of 24
Sensors 2017, 17, 2207 4 of 23
Li et al. [46] designed a self-sustaining system that collects energy from the indoor environment, adapts its duty-cycle to reduce power consumption, synchronize node data transfers, and feed back to the environment through an inactive flow sensor with no energy consumption. However, due to the uncertainty of road vehicle traffic, the energy collected does not maintain a low power consumption of the system. It is necessary to transmit data non-timed based on the collected power.
The above studies have the following restrictions on rechargeable wireless sensing for smart pavement: (a) They studied the influence of the vibration frequency and the external circuit on the power generation performance of the bimorph. However, due to the influence of the natural frequency and energy storage efficiency of the pavement, the storage energy was not as large as that of the analysis; (b) Due to the impact of the road environment, the traffic load is too large for the piezoelectric transducer. Therefore, it is necessary to protect the piezoelectric transducer from the external environment and seriously reduce its life. Meanwhile, power generation is ensured; (c) Because of the uncertainty of vehicle travel, the system could not be in a state of constant power, so maintaining the low power consumption of the system is not possible. Therefore, the system can run and send data once when the storage capacity is sufficient.
3. The Pavement Problem and the Pavement Sensing System
We first explain the environment of the pavement problem and then give the general overview and design fundamentals of our self-powered wireless sensing system.
3.1. Asphalt Pavement Wireless Sensing Information Detection
Asphalt pavement produces mechanical energy and heat when a vehicle passes, and the mechanical energy can be used by the piezoelectric transducer to generate electrical energy. Most of the current road health testing uses large, cumbersome ultrasonic nondestructive testing [47] or falling weight deflectometers [48], which can be very costly in terms of both manpower and resources. Most detection instruments can only detect surface damage. It is not possible to detect the following roadbeds with invisible health hazards. The cost of road health testing often accounts for a large part of the cost of road construction, and the cost of road maintenance is rising as the road base is built.
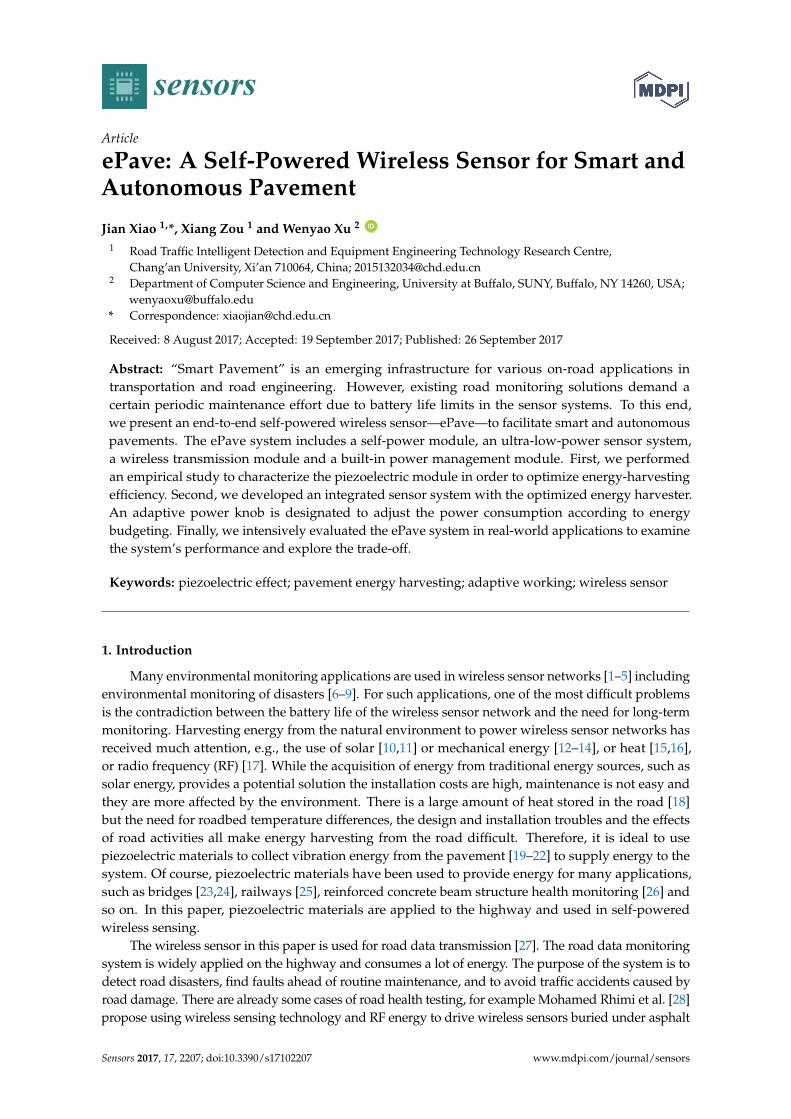
Therefore, it is necessary to study a road health detection system that does not require man-made real-time detection and can be remotely detected and controlled, and needs to use wireless sensing to send the road information remotely to judge the road health. The system that makes up this road information is mainly composed of road environment energy harvesting and wireless sensing. Figure 1 illustrates the pavement composition and structure of this detection system.
Figure 1. A wireless sensing information detection system for pavements. Figure 1. A wireless sensing information detection system for pavements.
3.2. Overview of ePave
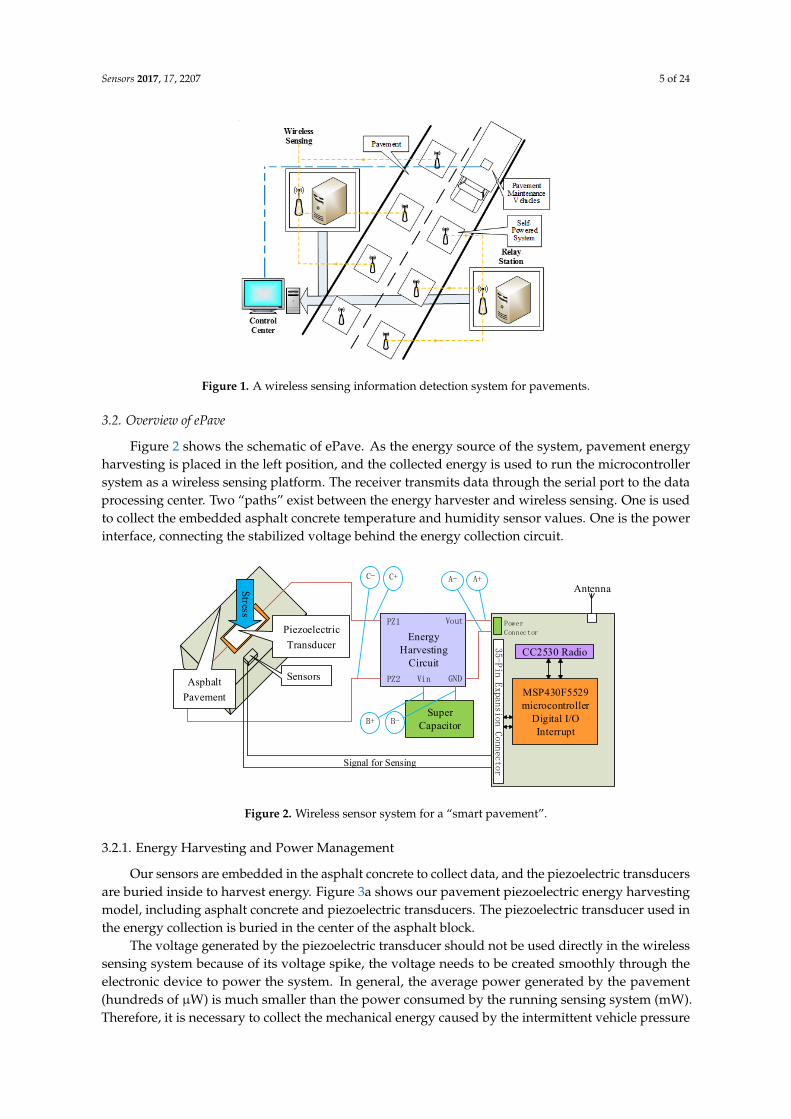
Figure 2 shows the schematic of ePave. As the energy source of the system, pavement energyharvesting is placed in the left position, and the collected energy is used to run the microcontrollersystem as a wireless sensing platform. The receiver transmits data through the serial port to the dataprocessing center. Two “paths” exist between the energy harvester and wireless sensing. One is usedto collect the embedded asphalt concrete temperature and humidity sensor values. One is the powerinterface, connecting the stabilized voltage behind the energy collection circuit.
Sensors 2017, 17, 2207 5 of 23
Using a normal battery pack for wireless sensor networks [49,50] is also not possible because as they are buried in the underground system the battery cannot be replaced. It is more practical to collect the mechanical energy generated by the vehicle on the road and use it to supply power to the system. Although other environmental energy (e.g., solar, wind and heat) on the road can also be used, it is difficult to deploy on the road because of difficulties with deployment and the need for buried lines. Therefore, it is imperative to harvest pavement piezoelectric energy and provide ultra-low power wireless sensor.
In order to solve the above problems, our plan is to develop a pavement self-power wireless sensor system. We studied the power generation performance of piezoelectric ceramics based on pavement energy harvesting and on this basis we improved the energy collection efficiency and calculated the wireless sensing losses. In addition, this system is used not only to measure road information but also for other road sensor services (such as traffic flow, etc.).
3.2. Overview of ePave
Figure 2 shows the schematic of ePave. As the energy source of the system, pavement energy harvesting is placed in the left position, and the collected energy is used to run the microcontroller system as a wireless sensing platform. The receiver transmits data through the serial port to the data processing center. Two “paths” exist between the energy harvester and wireless sensing. One is used to collect the embedded asphalt concrete temperature and humidity sensor values. One is the power interface, connecting the stabilized voltage behind the energy collection circuit.
Figure 2. Wireless sensor system for a “smart pavement.”
3.2.1. Energy Harvesting and Power Management
Our sensors are embedded in the asphalt concrete to collect data, and the piezoelectric transducers are buried inside to harvest energy. Figure 3a shows our pavement piezoelectric energy harvesting model, including asphalt concrete and piezoelectric transducers. The piezoelectric transducer used in the energy collection is buried in the center of the asphalt block.
The voltage generated by the piezoelectric transducer should not be used directly in the wireless sensing system because of its voltage spike, the voltage needs to be created smoothly through the electronic device to power the system. In general, the average power generated by the pavement (hundreds of μW) is much smaller than the power consumed by the running sensing system (mW). Therefore, it is necessary to collect the mechanical energy caused by the intermittent vehicle pressure and to study the pavement structure and how the piezoelectric coupling effect could harvest energy more efficiently. At the same time, the power consumption of the wireless sensing system should be less than or equal to the energy stored. There is the need to determine the storage of the supercapacitor so that it is enough to acquire and deliver the data required for a single chip, and the energy consumed by the wireless transmission is very large (about 120 mW). Therefore, it is necessary to calculate the capacity of the supercapacitor according to the power
Energy Harvesting
Circuit
PZ1
PZ2 Vin GND
Vout
Super Capacitor
Power Connector
MSP430F5529 microcontroller
Digital I/O Interrupt
35-Pin Expansion Connector
CC2530 Radio
Asphalt Pavement
Piezoelectric Transducer
Sensors
Stress
Signal for Sensing
A-
B+ B-
C- C+ A+Antenna
Figure 2. Wireless sensor system for a “smart pavement”.
3.2.1. Energy Harvesting and Power Management
Our sensors are embedded in the asphalt concrete to collect data, and the piezoelectric transducersare buried inside to harvest energy. Figure 3a shows our pavement piezoelectric energy harvestingmodel, including asphalt concrete and piezoelectric transducers. The piezoelectric transducer used inthe energy collection is buried in the center of the asphalt block.
The voltage generated by the piezoelectric transducer should not be used directly in the wirelesssensing system because of its voltage spike, the voltage needs to be created smoothly through theelectronic device to power the system. In general, the average power generated by the pavement(hundreds of µW) is much smaller than the power consumed by the running sensing system (mW).Therefore, it is necessary to collect the mechanical energy caused by the intermittent vehicle pressure

Sensors 2017, 17, 2207 6 of 24
and to study the pavement structure and how the piezoelectric coupling effect could harvest energymore efficiently. At the same time, the power consumption of the wireless sensing system should beless than or equal to the energy stored. There is the need to determine the storage of the supercapacitorso that it is enough to acquire and deliver the data required for a single chip, and the energy consumedby the wireless transmission is very large (about 120 mW). Therefore, it is necessary to calculate thecapacity of the supercapacitor according to the power consumption. The power management moduleis shown in Figure 3b. It has three ports, one end is used to connect the output of the piezoelectrictransducer, one end is used to charge and discharge the super capacitor, and the other is used tooutput the energy supply of the sensing system. Details on the pavement energy harvesting and powermanagement module will be elaborated in Section 4.
Sensors 2017, 17, 2207 6 of 23
consumption. The power management module is shown in Figure 3b. It has three ports, one end is used to connect the output of the piezoelectric transducer, one end is used to charge and discharge the super capacitor, and the other is used to output the energy supply of the sensing system. Details on the pavement energy harvesting and power management module will be elaborated in Section 4.
(a)
(b)
Figure 3. Road energy collection: (a) The harvester; (b) power management.
3.2.2. Adaptive Data Acquisition and Delivery
The situation of the vehicle is random and disorderly and the type of vehicle on the road that determines the mechanical energy that is input to the system is also random, so the use of piezoelectric transducers to convert energy will not be regular, so the charge time required for the super capacitor cannot be predicted. As a result, the wireless sensing system does not have enough energy to run in real time, which also causes the system to shut down and fail to periodically send data based on the timer. Therefore, we had better not need to consume power to achieve the purpose of judging the collection of energy, and to power the data acquisition and wireless transmission module periodically according to the adaptive power knob. We need to calculate the supercapacitor capacity to indirectly match the energy consumed by the wireless sensing system. In Figure 4, we assume that the load is 100 Ω, using two 1F super capacitors in the series to charge and discharge, showing the load power from the adaptive power supply, in which the blue line for the output voltage, the yellow line for the capacitor voltage across. As the capacitor voltage increases, the output voltage would stabilize to 3.3 V. After the capacitor voltage is reduced, the output is stable. After a period of discharge, the output is reduced to zero, and the supercapacitor is automatically charged. After about 58 s, the load would be powered again.
4
3
2
1
0
Out
put V
olta
ge (V
)
8
6
4
2
0 Cap
acita
nce
Vol
tage
(V)
Time (×1s)10 20 30 40 50 60 70 80 90 100
output
charge
0
Figure 4. Adaptive working.
Our pavement energy harvesting depends on the weight and quantity of the vehicle. Therefore, in order to supply the system work, we use the adaptive power knob to let the system acquisition and delivery of data intermittently. Although we would like to let the system work to maintain low power consumption, and according to the power to control the acquisition of data, according to the host computer signal to send data wirelessly. But the irregular nature of the road conditions allows us to collect and transmit data intermittently. The feasibility of the adaptive program is described in detail in Section 5.
Figure 3. Road energy collection: (a) The harvester; (b) power management.
3.2.2. Adaptive Data Acquisition and Delivery
The situation of the vehicle is random and disorderly and the type of vehicle on the road thatdetermines the mechanical energy that is input to the system is also random, so the use of piezoelectrictransducers to convert energy will not be regular, so the charge time required for the super capacitorcannot be predicted. As a result, the wireless sensing system does not have enough energy to run inreal time, which also causes the system to shut down and fail to periodically send data based on thetimer. Therefore, we had better not need to consume power to achieve the purpose of judging thecollection of energy, and to power the data acquisition and wireless transmission module periodicallyaccording to the adaptive power knob. We need to calculate the supercapacitor capacity to indirectlymatch the energy consumed by the wireless sensing system. In Figure 4, we assume that the load is100 Ω, using two 1F super capacitors in the series to charge and discharge, showing the load powerfrom the adaptive power supply, in which the blue line for the output voltage, the yellow line for thecapacitor voltage across. As the capacitor voltage increases, the output voltage would stabilize to 3.3 V.After the capacitor voltage is reduced, the output is stable. After a period of discharge, the output isreduced to zero, and the supercapacitor is automatically charged. After about 58 s, the load would bepowered again.
Sensors 2017, 17, 2207 6 of 23
consumption. The power management module is shown in Figure 3b. It has three ports, one end is used to connect the output of the piezoelectric transducer, one end is used to charge and discharge the super capacitor, and the other is used to output the energy supply of the sensing system. Details on the pavement energy harvesting and power management module will be elaborated in Section 4.
(a)
(b)
Figure 3. Road energy collection: (a) The harvester; (b) power management.
3.2.2. Adaptive Data Acquisition and Delivery
The situation of the vehicle is random and disorderly and the type of vehicle on the road that determines the mechanical energy that is input to the system is also random, so the use of piezoelectric transducers to convert energy will not be regular, so the charge time required for the super capacitor cannot be predicted. As a result, the wireless sensing system does not have enough energy to run in real time, which also causes the system to shut down and fail to periodically send data based on the timer. Therefore, we had better not need to consume power to achieve the purpose of judging the collection of energy, and to power the data acquisition and wireless transmission module periodically according to the adaptive power knob. We need to calculate the supercapacitor capacity to indirectly match the energy consumed by the wireless sensing system. In Figure 4, we assume that the load is 100 Ω, using two 1F super capacitors in the series to charge and discharge, showing the load power from the adaptive power supply, in which the blue line for the output voltage, the yellow line for the capacitor voltage across. As the capacitor voltage increases, the output voltage would stabilize to 3.3 V. After the capacitor voltage is reduced, the output is stable. After a period of discharge, the output is reduced to zero, and the supercapacitor is automatically charged. After about 58 s, the load would be powered again.
4
3
2
1
0
Out
put V
olta
ge (V
)
8
6
4
2
0 Cap
acita
nce
Vol
tage
(V)
Time (×1s)10 20 30 40 50 60 70 80 90 100
output
charge
0
Figure 4. Adaptive working.
Our pavement energy harvesting depends on the weight and quantity of the vehicle. Therefore, in order to supply the system work, we use the adaptive power knob to let the system acquisition and delivery of data intermittently. Although we would like to let the system work to maintain low power consumption, and according to the power to control the acquisition of data, according to the host computer signal to send data wirelessly. But the irregular nature of the road conditions allows us to collect and transmit data intermittently. The feasibility of the adaptive program is described in detail in Section 5.
Figure 4. Adaptive working.
Sensors 2017, 17, 2207 7 of 24
Our pavement energy harvesting depends on the weight and quantity of the vehicle. Therefore, in orderto supply the system work, we use the adaptive power knob to let the system acquisition and delivery ofdata intermittently. Although we would like to let the system work to maintain low power consumption,and according to the power to control the acquisition of data, according to the host computer signal tosend data wirelessly. But the irregular nature of the road conditions allows us to collect and transmit dataintermittently. The feasibility of the adaptive program is described in detail in Section 5.
4. Pavement Energy Harvesting and Management
In this section, we first discuss the theory and experiments of smart pavement energy harvesting,and then tell us about the design of energy management module.
4.1. Piezoelectric Effect
The basic principle of our energy harvest is the piezoelectric effect [51,52]. Specifically, it is asmart material that converts mechanical energy into electrical energy, which changes the electric fieldinside the material according to stress, as shown in Figure 5.
Sensors 2017, 17, 2207 7 of 23
4. Pavement Energy Harvesting and Management
In this section, we first discuss the theory and experiments of smart pavement energy harvesting, and then tell us about the design of energy management module.
4.1. Piezoelectric Effect
The basic principle of our energy harvest is the piezoelectric effect [51,52]. Specifically, it is a smart material that converts mechanical energy into electrical energy, which changes the electric field inside the material according to stress, as shown in Figure 5.
Free Charge
Stress Direction
Polarization Direction
Figure 5. Schematic diagram of the piezoelectric effect.
The pavement would produce stress and vibration when the vehicle passes [33–35]. Piezoelectric ceramic might be a sensor or an actuator due to the positive piezoelectric effect and the inverse piezoelectric effect. The positive piezoelectric effect excites the charge on the surface of the piezoelectric material by mechanical external forces, and the charge could be stored and utilized by the energy storage device. Conventional piezoelectric materials, including piezoelectric single crystals, polycrystals, polymers and composites, have a piezoelectric effect. The piezoelectric transducers prepared in this paper are a piezoelectric polycrystal. When the piezoelectric transducer is deformed by external force, the electric dipole moment inside the material becomes shorter due to compression. At this point the polarization phenomenon causes the piezoelectric material to appear on both surfaces as the same amount of free and negative charge is released and discharge. These charges could be collected and applied. The piezoelectric effect is determined by the constitutive Equation (1) [53].
Ep pq q kp k
Si iq q ik k
T c S e E
D e S E
(1)
where T, S, E, and D represent the stress, strain, potential field and electrical induction of the
piezoelectric transducer, respectively. Epqc is the Young’s modulus, kpe is the piezoelectric
coefficient, Sik is the clamped permittivity. In a more general case, the open circuit voltage of the
piezoelectric device can be expressed in Equation (2) of the mechanical stress in direction p and the induced electric field in direction i:
p ipV T g l . (2)
Assuming that the voltage coefficient ipg is constant with the stress, and where l is the gap between the electrodes. In this paper, the use of piezoelectric transducers from PANT Technology, the specific parameters shown in Table 1.
Figure 5. Schematic diagram of the piezoelectric effect.
The pavement would produce stress and vibration when the vehicle passes [33–35].Piezoelectric ceramic might be a sensor or an actuator due to the positive piezoelectric effect and theinverse piezoelectric effect. The positive piezoelectric effect excites the charge on the surface of thepiezoelectric material by mechanical external forces, and the charge could be stored and utilized by theenergy storage device. Conventional piezoelectric materials, including piezoelectric single crystals,polycrystals, polymers and composites, have a piezoelectric effect. The piezoelectric transducersprepared in this paper are a piezoelectric polycrystal. When the piezoelectric transducer is deformedby external force, the electric dipole moment inside the material becomes shorter due to compression.At this point the polarization phenomenon causes the piezoelectric material to appear on both surfacesas the same amount of free and negative charge is released and discharge. These charges could becollected and applied. The piezoelectric effect is determined by the constitutive Equation (1) [53].
Tp = cEpqSq − ekpEk
Di = eiqSq + εSikEk
(1)
where T, S, E, and D represent the stress, strain, potential field and electrical induction of thepiezoelectric transducer, respectively. cE
pq is the Young’s modulus, ekp is the piezoelectric coefficient, εSik
is the clamped permittivity. In a more general case, the open circuit voltage of the piezoelectric devicecan be expressed in Equation (2) of the mechanical stress in direction p and the induced electric field indirection i:
V = Tpgipl. (2)

Sensors 2017, 17, 2207 8 of 24
Assuming that the voltage coefficient gip is constant with the stress, and where l is the gap betweenthe electrodes. In this paper, the use of piezoelectric transducers from PANT Technology, the specificparameters shown in Table 1.
Table 1. Part parameters of piezoelectric transducers.
d33 g33 Kp Qm εr Tc (C) Size (mm)
720 20 0.62 65 4500 180 79 × 18 × 1.55
4.2. Energy Harvesting
The charge generated by the piezoelectric transducer needs to be collected. The energy harvestingcircuit converts the spike voltage into a stable voltage for system power supply. Specifically, we discussthe voltage under the open-circuit of the piezoelectric transducer and analyze the energy collectioncircuit and the energy storage unit, which is best suited for our pavement micro-energy harvesting.
4.2.1. Energy Collection Interface Circuit
Figure 6 shows the open-circuit voltage waveform of the smart pavement, point C in Figure 2. It ispossible to see that there is no voltage before the wheel runs over piezoelectric transducer, and whenthe wheel is pressed, only a peak voltage of up to 80 V is generated within 200 ms. After the wheelis left, the voltage is 40 V peak voltage on the negative half axis, and the final voltage drops to zero.This spike voltage like the alternating current is not suitable for our energy storage unit and systems,so we need a circuit that allows this voltage to become direct current.
Sensors 2017, 17, 2207 8 of 23
Table 1. Part parameters of piezoelectric transducers.
d33 g33 Kp Qm εr Tc (°C) Size (mm)
720 20 0.62 65 4500 180 79 × 18 × 1.55
4.2. Energy Harvesting
The charge generated by the piezoelectric transducer needs to be collected. The energy harvesting circuit converts the spike voltage into a stable voltage for system power supply. Specifically, we discuss the voltage under the open-circuit of the piezoelectric transducer and analyze the energy collection circuit and the energy storage unit, which is best suited for our pavement micro-energy harvesting.
4.2.1. Energy Collection Interface Circuit
Figure 6 shows the open-circuit voltage waveform of the smart pavement, point C in Figure 2. It is possible to see that there is no voltage before the wheel runs over piezoelectric transducer, and when the wheel is pressed, only a peak voltage of up to 80 V is generated within 200 ms. After the wheel is left, the voltage is 40 V peak voltage on the negative half axis, and the final voltage drops to zero. This spike voltage like the alternating current is not suitable for our energy storage unit and systems, so we need a circuit that allows this voltage to become direct current.
Vol
tage
(V)
0 1 2 3 4 5 6 7 8 9 10 11 12Time (×1s)
-80
-60
-40
-20
0
20
40
60
80
Figure 6. Open-circuit voltage waveform.
Active and passive circuits are studied to increase the charge collection efficiency. Among the mature passive circuits is the full bridge rectifier circuit [54], but its efficiency is low. Active electric charge extraction circuits, such as synchronous electric charge extraction [55], parallel-synchronized switch harvesting inductor [56], series-synchronized switch harvesting inductor [56,57], and double synchronized switch harvesting [58], are efficient. Due to the presence of the switch and the inductance, the output voltage of the piezoelectric device is controlled, the phase difference between the output voltage and the rate is reduced, and the output power is increased. However, energy collection is difficult owing to the need to generate a switching signal and thus drive the synchronous switch. Therefore, this study uses a passive full-bridge rectifier circuit. The LT3588 is used in this study as a charge collection circuit. The LTC3588 comes with a micropower full bridge rectifier and an efficient BUCK circuit with ultra-low quiescent current undervoltage lockout (UVLO) mode allowing charge to accumulate on the input capacitor until the buck converter can effectively transfer a portion of the stored charge to the output.
4.2.2. Charge Storage Unit
The charge storage unit can be a low-cost aluminum electrolytic capacitor (E-CAP) or a super capacitor (SC) with large capacity. The research on SC has been trending in recent years; its capacity
Figure 6. Open-circuit voltage waveform.
Active and passive circuits are studied to increase the charge collection efficiency. Among themature passive circuits is the full bridge rectifier circuit [54], but its efficiency is low. Active electriccharge extraction circuits, such as synchronous electric charge extraction [55], parallel-synchronizedswitch harvesting inductor [56], series-synchronized switch harvesting inductor [56,57], and doublesynchronized switch harvesting [58], are efficient. Due to the presence of the switch and the inductance,the output voltage of the piezoelectric device is controlled, the phase difference between the outputvoltage and the rate is reduced, and the output power is increased. However, energy collection isdifficult owing to the need to generate a switching signal and thus drive the synchronous switch.Therefore, this study uses a passive full-bridge rectifier circuit. The LT3588 is used in this study as acharge collection circuit. The LTC3588 comes with a micropower full bridge rectifier and an efficientBUCK circuit with ultra-low quiescent current undervoltage lockout (UVLO) mode allowing chargeto accumulate on the input capacitor until the buck converter can effectively transfer a portion of thestored charge to the output.

Sensors 2017, 17, 2207 9 of 24
4.2.2. Charge Storage Unit
The charge storage unit can be a low-cost aluminum electrolytic capacitor (E-CAP) or a supercapacitor (SC) with large capacity. The research on SC has been trending in recent years; its capacity islarge, the volume is small, and its service life is up to ten years longer than that of the E-CAP. SC isexpected to become the main power of green energy car in the future. Table 2 presents the relevantparameters of E-CAP and SC.
The energy stored in the one capacitor can be calculated by:
E = CU2/2, (3)
where E is the energy stored in the capacitor, C is the capacity of the capacitor, and U is the voltageacross the capacitor.
Table 2. Basic Information about the electrolytic capacitor (E-CAP) and super capacitor (SC).
Key Characteristics E-CAP SC
Nominal capacitance (F) 33 × 10−6 0.047Maximum operating voltage (V) <50 <5.5
ESR 1 (mΩ) 15 60Leakage current (µA) 16.5 20
Size (mm) φ5 × 11 10.5 × 9.5 × 5Endurance (h) 5000 90,000
1 Equivalent series resistance.
4.3. Harvesting Energy from a Smart Pavement
To estimate the power generation of a smart pavement, we need to produce, simulate andmeasure its storage energy under rutting conditions. We fabricated the experimental asphalt rutboard. Simulation of mechanical and charge density distribution of piezoelectric transducers. And thestorage energy of the piezoelectric transducer under different depth is discussed experimentally.The piezoelectric transducers are encapsulated using different protective materials, and the outputenergy is measured.
4.3.1. Fabrication and Embedment of Piezoelectric Transducer for Asphalt Pavement
Asphalt concrete of 13 and 90 matrices is used to fabricate a rutting board. The production processis as follows.
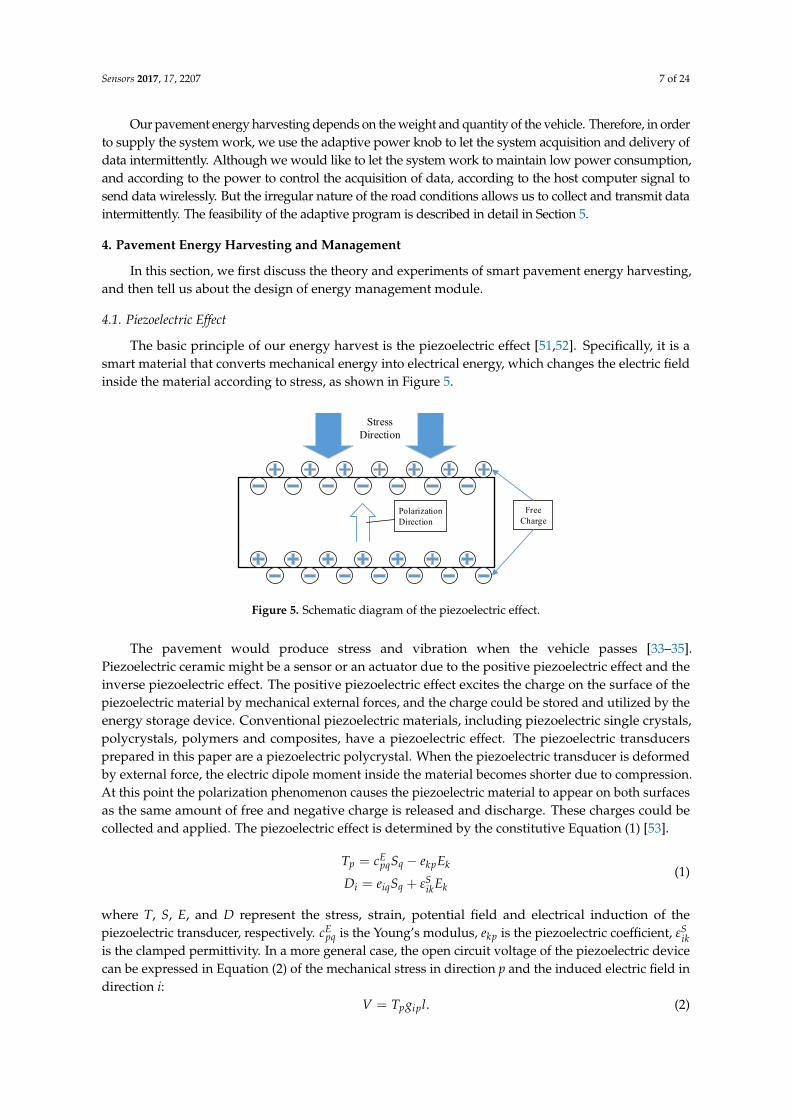
Aggregate, mineral powder, and asphalt are placed into a drought drying cabinet at 170 C fortwo to three hours. Then, they are successively poured into the asphalt-mixing machine, in which theratio of aggregate to asphalt is 4.6 to 5.3. The mixture is stirred at a constant temperature of 170 C for90 s. Next, asphalt concrete is placed into a plate specimen with 10 cm thick. Approximately half ofthe material is filled and flattened by hand. One piezoelectric transducer is placed on it. Fine asphalt isslowly covered in the piezoelectric transducer to avoid the stress concentration caused by large piecesof asphalt concrete. The remaining three-fifths of the material is placed into the rut plate specimen,and a piezoelectric transducer is placed on the top of it. The rest of the asphalt concrete is filled.Finally, the rutting board is placed into the rutting sample-forming machine. After adjusting therutting board in the middle of the pressure bar, it is opened and pressed for 28 times. The pressedrutting board is cooled on the wooden frame for 12 h. The cooled rutting board is equivalent toa piezoelectric pavement. The rutting board is put into an automatic rutting test machine, with arutting frequency of 0.7 Hz, a tire speed of 0.76 km/h, and a wheel pressure of 0.7 MPa. The finishedequipment is shown in Figure 7.
The back of the piezoelectric transducer is connected to a charge-collecting circuit and a capacitor.At this point, we return to the charge-collecting circuit to access the regulator circuit, and a constant
Sensors 2017, 17, 2207 10 of 24
voltage is charged to the capacitor. LTC3588 chip is used to collect energy. The buried piezoelectrictransducer wire is connected to the energy-harvesting circuit, and the oscilloscope probe is connectedto the piezoelectric transducer and capacitor at the back to measure its electrical properties.
Sensors 2017, 17, 2207 9 of 23
is large, the volume is small, and its service life is up to ten years longer than that of the E-CAP. SC is expected to become the main power of green energy car in the future. Table 2 presents the relevant parameters of E-CAP and SC.
The energy stored in the one capacitor can be calculated by: 2 / 2E CU , (3)
where E is the energy stored in the capacitor, C is the capacity of the capacitor, and U is the voltage across the capacitor.
Table 2. Basic Information about the electrolytic capacitor (E-CAP) and super capacitor (SC).
Key Characteristics E-CAP SC Nominal capacitance (F) 33 × 10−6 0.047
Maximum operating voltage (V) <50 <5.5 ESR 1 (mΩ) 15 60
Leakage current (μA) 16.5 20 Size (mm) Ф5 × 11 10.5 × 9.5 × 5
Endurance (h) 5000 90,000 1 Equivalent series resistance.
4.3. Harvesting Energy from a Smart Pavement
To estimate the power generation of a smart pavement, we need to produce, simulate and measure its storage energy under rutting conditions. We fabricated the experimental asphalt rut board. Simulation of mechanical and charge density distribution of piezoelectric transducers. And the storage energy of the piezoelectric transducer under different depth is discussed experimentally. The piezoelectric transducers are encapsulated using different protective materials, and the output energy is measured.
4.3.1. Fabrication and Embedment of Piezoelectric Transducer for Asphalt Pavement
Asphalt concrete of 13 and 90 matrices is used to fabricate a rutting board. The production process is as follows.
Piezoelectric rutting board
Automatic rutting test machine
Wheel
Piezoelectric output
Figure 7. Rutting test equipment.
Aggregate, mineral powder, and asphalt are placed into a drought drying cabinet at 170 °C for two to three hours. Then, they are successively poured into the asphalt-mixing machine, in which the ratio of aggregate to asphalt is 4.6 to 5.3. The mixture is stirred at a constant temperature of
Figure 7. Rutting test equipment.
4.3.2. Simulation Analysis of Piezoelectric Transducer
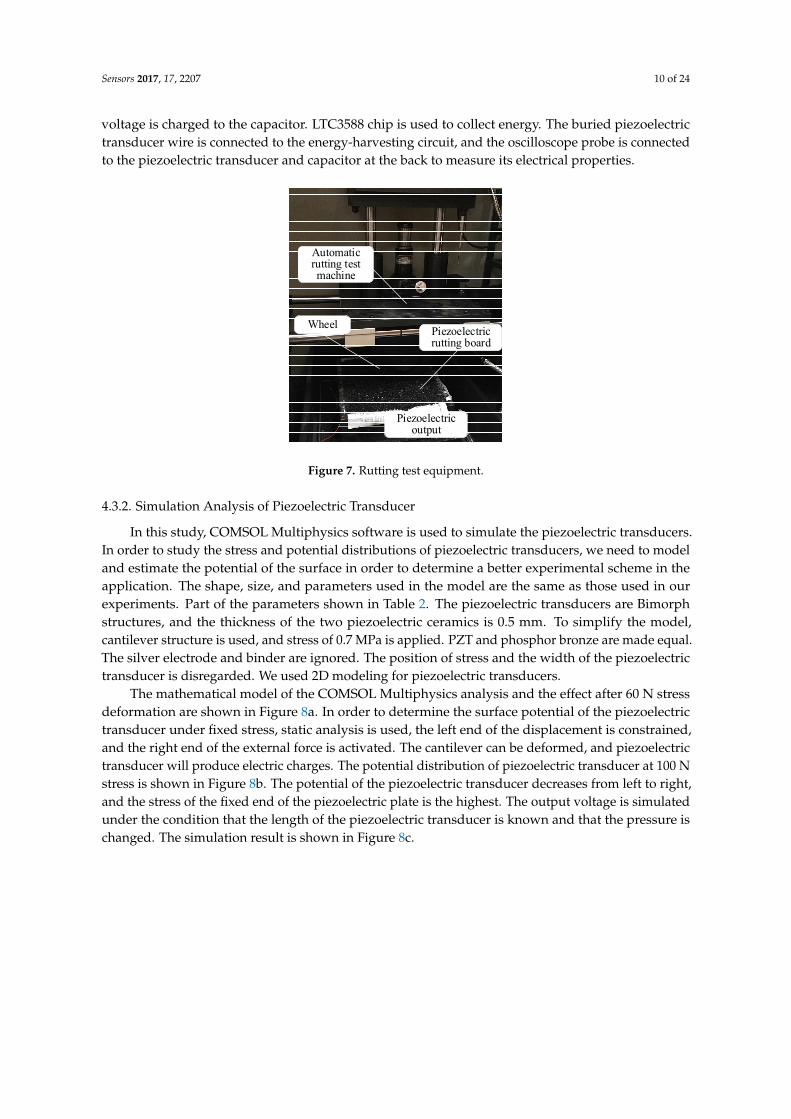
In this study, COMSOL Multiphysics software is used to simulate the piezoelectric transducers.In order to study the stress and potential distributions of piezoelectric transducers, we need to modeland estimate the potential of the surface in order to determine a better experimental scheme in theapplication. The shape, size, and parameters used in the model are the same as those used in ourexperiments. Part of the parameters shown in Table 2. The piezoelectric transducers are Bimorphstructures, and the thickness of the two piezoelectric ceramics is 0.5 mm. To simplify the model,cantilever structure is used, and stress of 0.7 MPa is applied. PZT and phosphor bronze are made equal.The silver electrode and binder are ignored. The position of stress and the width of the piezoelectrictransducer is disregarded. We used 2D modeling for piezoelectric transducers.
The mathematical model of the COMSOL Multiphysics analysis and the effect after 60 N stressdeformation are shown in Figure 8a. In order to determine the surface potential of the piezoelectrictransducer under fixed stress, static analysis is used, the left end of the displacement is constrained,and the right end of the external force is activated. The cantilever can be deformed, and piezoelectrictransducer will produce electric charges. The potential distribution of piezoelectric transducer at 100 Nstress is shown in Figure 8b. The potential of the piezoelectric transducer decreases from left to right,and the stress of the fixed end of the piezoelectric plate is the highest. The output voltage is simulatedunder the condition that the length of the piezoelectric transducer is known and that the pressure ischanged. The simulation result is shown in Figure 8c.

Sensors 2017, 17, 2207 11 of 24
Sensors 2017, 17, 2207 10 of 23
170 °C for 90 s. Next, asphalt concrete is placed into a plate specimen with 10 cm thick. Approximately half of the material is filled and flattened by hand. One piezoelectric transducer is placed on it. Fine asphalt is slowly covered in the piezoelectric transducer to avoid the stress concentration caused by large pieces of asphalt concrete. The remaining three-fifths of the material is placed into the rut plate specimen, and a piezoelectric transducer is placed on the top of it. The rest of the asphalt concrete is filled. Finally, the rutting board is placed into the rutting sample-forming machine. After adjusting the rutting board in the middle of the pressure bar, it is opened and pressed for 28 times. The pressed rutting board is cooled on the wooden frame for 12 h. The cooled rutting board is equivalent to a piezoelectric pavement. The rutting board is put into an automatic rutting test machine, with a rutting frequency of 0.7 Hz, a tire speed of 0.76 km/h, and a wheel pressure of 0.7 MPa. The finished equipment is shown in Figure 7.
The back of the piezoelectric transducer is connected to a charge-collecting circuit and a capacitor. At this point, we return to the charge-collecting circuit to access the regulator circuit, and a constant voltage is charged to the capacitor. LTC3588 chip is used to collect energy. The buried piezoelectric transducer wire is connected to the energy-harvesting circuit, and the oscilloscope probe is connected to the piezoelectric transducer and capacitor at the back to measure its electrical properties.
4.3.2. Simulation Analysis of Piezoelectric Transducer
In this study, COMSOL Multiphysics software is used to simulate the piezoelectric transducers. In order to study the stress and potential distributions of piezoelectric transducers, we need to model and estimate the potential of the surface in order to determine a better experimental scheme in the application. The shape, size, and parameters used in the model are the same as those used in our experiments. Part of the parameters shown in Table 2. The piezoelectric transducers are Bimorph structures, and the thickness of the two piezoelectric ceramics is 0.5 mm. To simplify the model, cantilever structure is used, and stress of 0.7 MPa is applied. PZT and phosphor bronze are made equal. The silver electrode and binder are ignored. The position of stress and the width of the piezoelectric transducer is disregarded. We used 2D modeling for piezoelectric transducers.
The mathematical model of the COMSOL Multiphysics analysis and the effect after 60 N stress deformation are shown in Figure 8a. In order to determine the surface potential of the piezoelectric transducer under fixed stress, static analysis is used, the left end of the displacement is constrained, and the right end of the external force is activated. The cantilever can be deformed, and piezoelectric transducer will produce electric charges. The potential distribution of piezoelectric transducer at 100 N stress is shown in Figure 8b. The potential of the piezoelectric transducer decreases from left to right, and the stress of the fixed end of the piezoelectric plate is the highest. The output voltage is simulated under the condition that the length of the piezoelectric transducer is known and that the pressure is changed. The simulation result is shown in Figure 8c.
(a)
(b)
(c)
Figure 8. Piezoelectric transducer stress and electric potential and their relationship curve. (a) deformation under stress; (b) potential distribution; and (c) relationship between stress and electric potential.
4.3.3. Energy Harvesting at Different Depths
Figure 8. Piezoelectric transducer stress and electric potential and their relationship curve.(a) deformation under stress; (b) potential distribution; and (c) relationship between stress andelectric potential.
4.3.3. Energy Harvesting at Different Depths
In accordance with the piezoelectric transducer being buried at different depths, the piezoelectrictransducer voltage waveforms are measured through the oscilloscope probe. The piezoelectrictransducer presents a peak voltage of less than 5 mV at 5 cm, and the voltage across the capacitor doesnot increase. Therefore, we mainly measure the voltage peak and the amount of capacitance collectedat 2 cm and the surface.
The voltage waveform in Figure 9a indicates that the piezoelectric transducer located at 2 cmproduces a peak voltage of 1.3 V. When the oscilloscope is integrated into the capacitor, the voltagegradually and exponentially increases with time, the SC voltage is very small (less than 1 mV),and E-CAP voltage increases to 0.7 V in 1 h.
Sensors 2017, 17, 2207 11 of 23
In accordance with the piezoelectric transducer being buried at different depths, the piezoelectric transducer voltage waveforms are measured through the oscilloscope probe. The piezoelectric transducer presents a peak voltage of less than 5 mV at 5 cm, and the voltage across the capacitor does not increase. Therefore, we mainly measure the voltage peak and the amount of capacitance collected at 2 cm and the surface.
The voltage waveform in Figure 9a indicates that the piezoelectric transducer located at 2 cm produces a peak voltage of 1.3 V. When the oscilloscope is integrated into the capacitor, the voltage gradually and exponentially increases with time, the SC voltage is very small (less than 1 mV), and E-CAP voltage increases to 0.7 V in 1 h.
The voltage waveform in Figure 9b reveals that the piezoelectric transducer located on the surface produces a peak voltage of 23 V. When the oscilloscope is integrated into the capacitor, the SC voltage increases linearly with time, the voltage increases to 0.28 V in 1 h, and the E-CAP voltage increases to 2.8 V in 80 s.
The energy stored by the capacitor at different depths is calculated using Equation (3). We ignore the 2 cm SC value to avoid errors. Figure 9c shows that the energy collected at 2 cm in 1 h is approximately 8 μJ. The energy harvesting of E-CAP is exponentially growing.
Figure 9d presents that the energy collected by the SC in 1 h is approximately 1.9 mJ and that by E-CAP is approximately 129 μJ. E-CAP no longer stores energy from 80 s, whereas SC energy harvesting presents a linear growth over time.
The calculation indicates that the energy collected on the surface is approximately 241 times that at 2 cm. The capacitor used to collect energy on the surface should be an SC with large capacity. However, the compressive strength of piezoelectric transducer is extremely low [59] compared with asphalt concrete. Therefore, we should protect the piezoelectric transducers from damage.
0.0 1.5 5 10 15 20 25 30 35 40 45 50 55 60 650
100
200
300
400
500
600
700
800
Elec
tric
stora
ge (m
V)
Time (min)
E-CAP SC
(a)
0.0 1.5 5 10 15 20 25 30 35 40 45 50 55 60 650
100
200
300
400
500
600
700
2000
3000
Elec
tric
stora
ge (m
V)
Time (min)
E-CAP SC
(b)
0.0 1.5 5 10 15 20 25 30 35 40 45 50 55 60 650
2000
4000
6000
8000
Ener
gy×1
0-9 (J
)
Time (min)
E-CAP
(c)
0.0 1.5 5 10 15 20 25 30 35 40 45 50 55 60 65
0
500
1000
1500
2000
Ener
gy×1
0-6 (J
)
Time (min)
E-CAP SC
(d)
Figure 9. Voltage output and energy collected at different depths. (a) voltage at 2 cm; (b) voltage at the surface; (c) energy collected at 2 cm of E-CAP; and (d) Energy collected at the surface.
4.3.4. Energy Harvesting under Different Packaging Materials
Figure 9. Voltage output and energy collected at different depths. (a) voltage at 2 cm; (b) voltage at thesurface; (c) energy collected at 2 cm of E-CAP; and (d) Energy collected at the surface.

Sensors 2017, 17, 2207 12 of 24
The voltage waveform in Figure 9b reveals that the piezoelectric transducer located on the surfaceproduces a peak voltage of 23 V. When the oscilloscope is integrated into the capacitor, the SC voltageincreases linearly with time, the voltage increases to 0.28 V in 1 h, and the E-CAP voltage increases to2.8 V in 80 s.
The energy stored by the capacitor at different depths is calculated using Equation (3). We ignorethe 2 cm SC value to avoid errors. Figure 9c shows that the energy collected at 2 cm in 1 h isapproximately 8 µJ. The energy harvesting of E-CAP is exponentially growing.
Figure 9d presents that the energy collected by the SC in 1 h is approximately 1.9 mJ and thatby E-CAP is approximately 129 µJ. E-CAP no longer stores energy from 80 s, whereas SC energyharvesting presents a linear growth over time.
The calculation indicates that the energy collected on the surface is approximately 241 timesthat at 2 cm. The capacitor used to collect energy on the surface should be an SC with large capacity.However, the compressive strength of piezoelectric transducer is extremely low [59] compared withasphalt concrete. Therefore, we should protect the piezoelectric transducers from damage.
4.3.4. Energy Harvesting under Different Packaging Materials
Rubber, phosphor bronze, and epoxy resin are determined as packaging materials in accordancewith the axle load stress of car. Part of the performance parameters of phosphor bronze and rubbermaterial is shown in Table 3. The fabrication process for the epoxy resin packaging material is as follows:epoxy resin and polyamide resin in the ratio of 2:1 are mixed and placed at 80 C for 10 h, and thenplaced at room temperature for condensation for 48 h. Epoxy resin comes from Nantong Xingchensynthetic material technology.
Table 3. Partial Parameters of Packaging Materials.
Key Characteristics Phosphor Bronze Rubber
Elastic modulus (Mpa) 115 × 103 7.8Density (kg/m3) 8800 1800
Poisson ratio 0.35 0.47Tensile strength (Mpa) 315 2Elongation at break (%) 40 250
Hardness 150 68
Fatigue life (year) 5 >10Size (mm) 90 × 32 × 0.5 90 × 32 × 3
Given that rubber and phosphor bronze are difficult to be used to package piezoelectrictransducers, asphalt sand is added. The packaging structure is shown in Figure 10a. The epoxyresin packaging structure has the same size as the rubber and phosphor bronze packages, as shown inFigure 10b.
Sensors 2017, 17, 2207 12 of 23
Rubber, phosphor bronze, and epoxy resin are determined as packaging materials in accordance with the axle load stress of car. Part of the performance parameters of phosphor bronze and rubber material is shown in Table 3. The fabrication process for the epoxy resin packaging material is as follows: epoxy resin and polyamide resin in the ratio of 2:1 are mixed and placed at 80 °C for 10 h, and then placed at room temperature for condensation for 48 h. Epoxy resin comes from Nantong Xingchen synthetic material technology.
Given that rubber and phosphor bronze are difficult to be used to package piezoelectric transducers, asphalt sand is added. The packaging structure is shown in Figure 10a. The epoxy resin packaging structure has the same size as the rubber and phosphor bronze packages, as shown in Figure 10b.
Table 3. Partial Parameters of Packaging Materials.
Key Characteristics Phosphor Bronze Rubber Elastic modulus (Mpa) 115 × 103 7.8
Density (kg/m3) 8800 1800 Poisson ratio 0.35 0.47
Tensile strength (Mpa) 315 2 Elongation at break (%) 40 250
Hardness 150° 68° Fatigue life (year) 5 >10
Size (mm) 90 × 32 × 0.5 90 × 32 × 3
(a) (b)
Figure 10. Packaging structure with different materials. (a) rubber and phosphor bronze; and (b) epoxy resin.
The packaging materials are embedded on the surface of the rutted board, which is softened after heating. The rutting board is taken into an automatic rutting test machine and is connected to the circuit.
Figure 11 shows that the epoxy resin packaging material exhibits higher energy efficiency than rubber and phosphor bronze. Rubber and phosphor bronze present similar voltage output. However, after 45 min, the SC voltage of the rubber package no longer rises, and the output of the phosphor bronze as the packaging material is very stable.
0.0 1.5 5 10 15 20 25 30 35 40 45 50 55 60 650
200
400
600
800
1000
1200
1400
1600
1800
Elec
tric
stora
ge (m
V)
Time (min)
Rubber Phosphor bronze Epoxy resin
Figure 11. Output voltage of the different materials.
Figure 10. Packaging structure with different materials. (a) rubber and phosphor bronze; and(b) epoxy resin.
Sensors 2017, 17, 2207 13 of 24
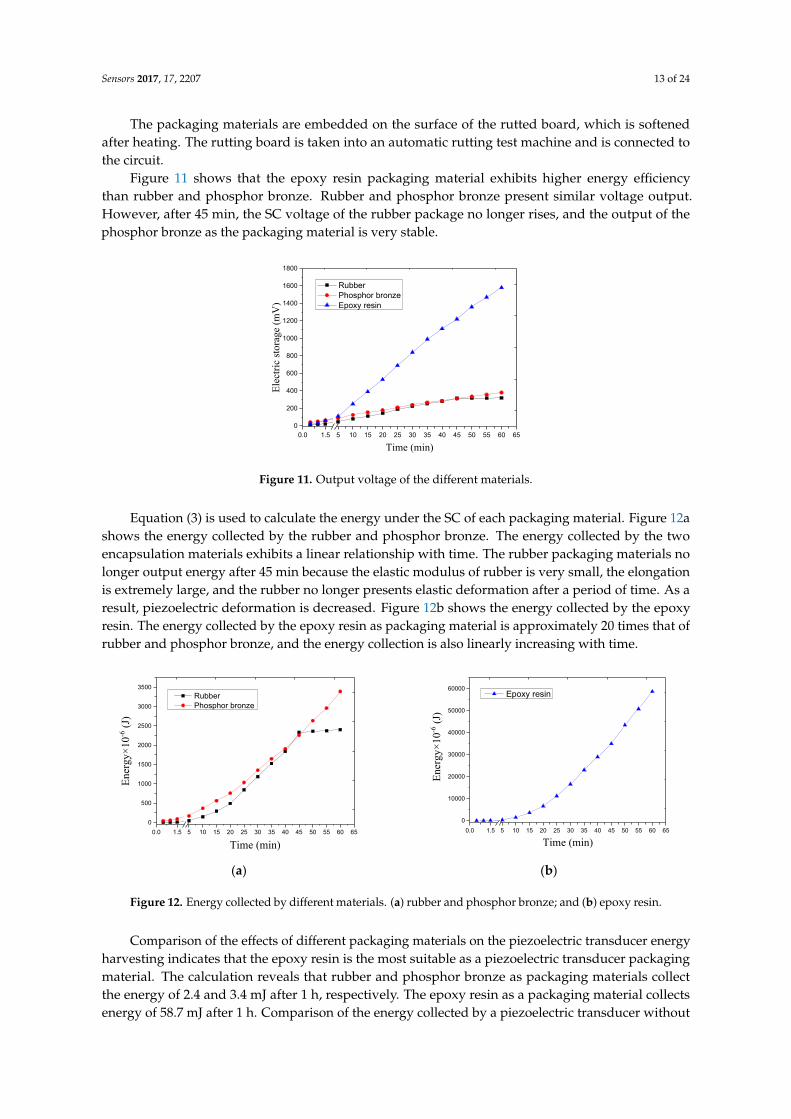
The packaging materials are embedded on the surface of the rutted board, which is softenedafter heating. The rutting board is taken into an automatic rutting test machine and is connected tothe circuit.
Figure 11 shows that the epoxy resin packaging material exhibits higher energy efficiencythan rubber and phosphor bronze. Rubber and phosphor bronze present similar voltage output.However, after 45 min, the SC voltage of the rubber package no longer rises, and the output of thephosphor bronze as the packaging material is very stable.
Sensors 2017, 17, 2207 12 of 23
Rubber, phosphor bronze, and epoxy resin are determined as packaging materials in accordance with the axle load stress of car. Part of the performance parameters of phosphor bronze and rubber material is shown in Table 3. The fabrication process for the epoxy resin packaging material is as follows: epoxy resin and polyamide resin in the ratio of 2:1 are mixed and placed at 80 °C for 10 h, and then placed at room temperature for condensation for 48 h. Epoxy resin comes from Nantong Xingchen synthetic material technology.
Given that rubber and phosphor bronze are difficult to be used to package piezoelectric transducers, asphalt sand is added. The packaging structure is shown in Figure 10a. The epoxy resin packaging structure has the same size as the rubber and phosphor bronze packages, as shown in Figure 10b.
Table 3. Partial Parameters of Packaging Materials.
Key Characteristics Phosphor Bronze Rubber Elastic modulus (Mpa) 115 × 103 7.8
Density (kg/m3) 8800 1800 Poisson ratio 0.35 0.47
Tensile strength (Mpa) 315 2 Elongation at break (%) 40 250
Hardness 150° 68° Fatigue life (year) 5 >10
Size (mm) 90 × 32 × 0.5 90 × 32 × 3
(a) (b)
Figure 10. Packaging structure with different materials. (a) rubber and phosphor bronze; and (b) epoxy resin.
The packaging materials are embedded on the surface of the rutted board, which is softened after heating. The rutting board is taken into an automatic rutting test machine and is connected to the circuit.
Figure 11 shows that the epoxy resin packaging material exhibits higher energy efficiency than rubber and phosphor bronze. Rubber and phosphor bronze present similar voltage output. However, after 45 min, the SC voltage of the rubber package no longer rises, and the output of the phosphor bronze as the packaging material is very stable.
0.0 1.5 5 10 15 20 25 30 35 40 45 50 55 60 650
200
400
600
800
1000
1200
1400
1600
1800El
ectri
c sto
rage
(mV
)
Time (min)
Rubber Phosphor bronze Epoxy resin
Figure 11. Output voltage of the different materials. Figure 11. Output voltage of the different materials.
Equation (3) is used to calculate the energy under the SC of each packaging material. Figure 12ashows the energy collected by the rubber and phosphor bronze. The energy collected by the twoencapsulation materials exhibits a linear relationship with time. The rubber packaging materials nolonger output energy after 45 min because the elastic modulus of rubber is very small, the elongationis extremely large, and the rubber no longer presents elastic deformation after a period of time. As aresult, piezoelectric deformation is decreased. Figure 12b shows the energy collected by the epoxyresin. The energy collected by the epoxy resin as packaging material is approximately 20 times that ofrubber and phosphor bronze, and the energy collection is also linearly increasing with time.
Sensors 2017, 17, 2207 13 of 23
Equation (3) is used to calculate the energy under the SC of each packaging material. Figure 12a shows the energy collected by the rubber and phosphor bronze. The energy collected by the two encapsulation materials exhibits a linear relationship with time. The rubber packaging materials no longer output energy after 45 min because the elastic modulus of rubber is very small, the elongation is extremely large, and the rubber no longer presents elastic deformation after a period of time. As a result, piezoelectric deformation is decreased. Figure 12b shows the energy collected by the epoxy resin. The energy collected by the epoxy resin as packaging material is approximately 20 times that of rubber and phosphor bronze, and the energy collection is also linearly increasing with time.
Comparison of the effects of different packaging materials on the piezoelectric transducer energy harvesting indicates that the epoxy resin is the most suitable as a piezoelectric transducer packaging material. The calculation reveals that rubber and phosphor bronze as packaging materials collect the energy of 2.4 and 3.4 mJ after 1 h, respectively. The epoxy resin as a packaging material collects energy of 58.7 mJ after 1 h. Comparison of the energy collected by a piezoelectric transducer without encapsulating material indicates that the energy collected by the piezoelectric transducer after the addition of the packaging material is significantly increased.
0.0 1.5 5 10 15 20 25 30 35 40 45 50 55 60 650
500
1000
1500
2000
2500
3000
3500
Ener
gy×1
0-6 (J
)
Time (min)
Rubber Phosphor bronze
(a)
0.0 1.5 5 10 15 20 25 30 35 40 45 50 55 60 650
10000
20000
30000
40000
50000
60000
Ener
gy×1
0-6 (J
)
Time (min)
Epoxy resin
(b)
Figure 12. Energy collected by different materials. (a) rubber and phosphor bronze; and (b) epoxy resin.
4.4. Output Power of Smart Pavement
To evaluate the power output of the intelligent pavement, we measured the output voltage of the piezoelectric transducers under open circuit and short circuit conditions and the output power under different loads. We apply the conditions in Section 4.3 to measure the optimal power output, that is, to harvest energy using a piezoelectric transducer encapsulated with epoxy resin on the pavement surface.
4.4.1. Load Power under Open Circuit
In Section 4.2.1, we introduce the voltage characteristics of the smart pavement open circuit. We connect different load resistors to measure the output peak voltage and maximum power. Figure 13 shows the relationship between the peak voltage and the maximum power at different load resistors. With the increase of load resistance, the peak output voltage increases, and the voltage grows at 100 KΩ to 200 KΩ much greater than its growth after 200 KΩ and reaches a maximum of 68 V when the resistance is around 700 KΩ. As the load resistance increases, the output power increases first and then decreases. The output power reaches a maximum of 16.8 mW at 200 KΩ.
4.4.2. Load Power under Full Bridge Rectifier Circuit
The function of the full bridge rectifier circuit is to convert the alternating current into direct current, such as the smart pavement voltage. The full bridge rectifier circuit is connected to different load resistances, measuring its output. As shown in Figure 14a, the voltage waveform after the full-bridge circuit is presented in two stages, and the voltage of the negative axis is reversed
Figure 12. Energy collected by different materials. (a) rubber and phosphor bronze; and (b) epoxy resin.
Comparison of the effects of different packaging materials on the piezoelectric transducer energyharvesting indicates that the epoxy resin is the most suitable as a piezoelectric transducer packagingmaterial. The calculation reveals that rubber and phosphor bronze as packaging materials collectthe energy of 2.4 and 3.4 mJ after 1 h, respectively. The epoxy resin as a packaging material collectsenergy of 58.7 mJ after 1 h. Comparison of the energy collected by a piezoelectric transducer without
Sensors 2017, 17, 2207 14 of 24
encapsulating material indicates that the energy collected by the piezoelectric transducer after theaddition of the packaging material is significantly increased.
4.4. Output Power of Smart Pavement
To evaluate the power output of the intelligent pavement, we measured the output voltage ofthe piezoelectric transducers under open circuit and short circuit conditions and the output powerunder different loads. We apply the conditions in Section 4.3 to measure the optimal power output,that is, to harvest energy using a piezoelectric transducer encapsulated with epoxy resin on thepavement surface.
4.4.1. Load Power under Open Circuit
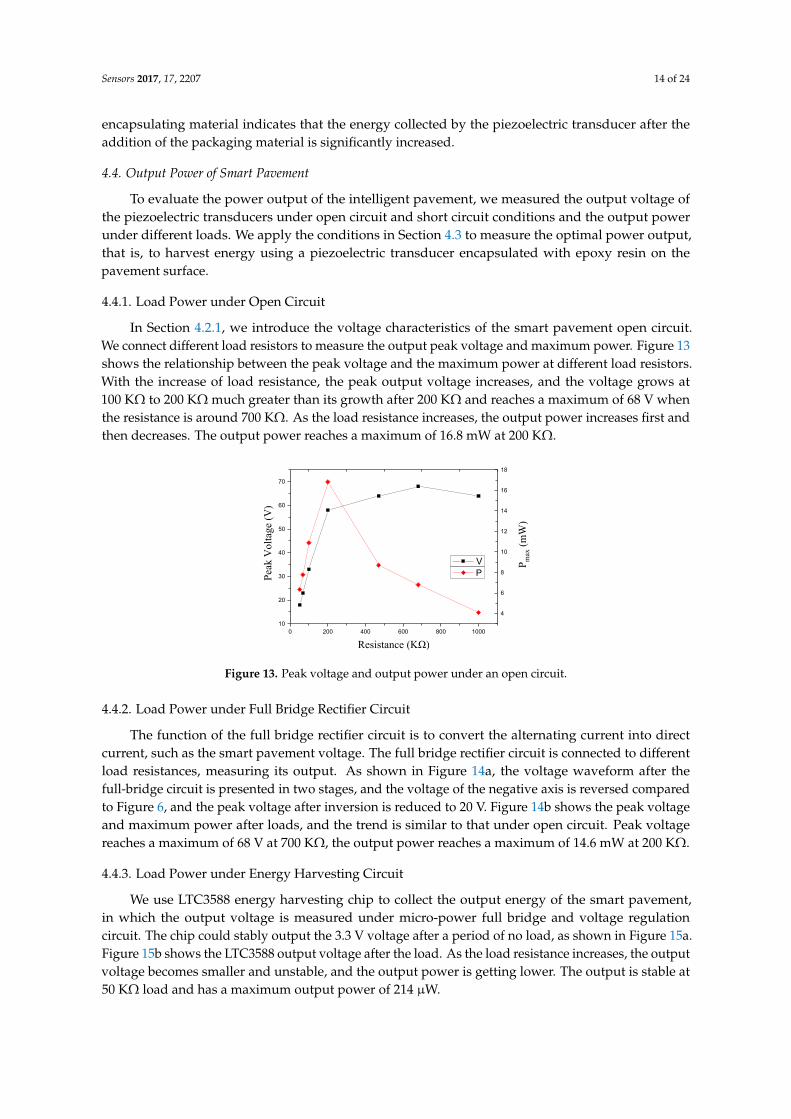
In Section 4.2.1, we introduce the voltage characteristics of the smart pavement open circuit.We connect different load resistors to measure the output peak voltage and maximum power. Figure 13shows the relationship between the peak voltage and the maximum power at different load resistors.With the increase of load resistance, the peak output voltage increases, and the voltage grows at100 KΩ to 200 KΩ much greater than its growth after 200 KΩ and reaches a maximum of 68 V whenthe resistance is around 700 KΩ. As the load resistance increases, the output power increases first andthen decreases. The output power reaches a maximum of 16.8 mW at 200 KΩ.
Sensors 2017, 17, 2207 14 of 23
compared to Figure 6, and the peak voltage after inversion is reduced to 20 V. Figure 14b shows the peak voltage and maximum power after loads, and the trend is similar to that under open circuit. Peak voltage reaches a maximum of 68 V at 700 KΩ, the output power reaches a maximum of 14.6 mW at 200 KΩ.
4
6
8
10
12
14
16
18
0 200 400 600 800 100010
20
30
40
50
60
70
Peak
Vol
tage
(V)
Resistance (KΩ)
V P
P max
(mW
)
Figure 13. Peak voltage and output power under an open circuit.
Vol
tage
(V)
0 1 2 3 4 5 6 7 8 9 10 11 12
Time (×1s)-80
-60
-40
-20
0
20
40
60
80
(a)
4
6
8
10
12
14
16
0 200 400 600 800 100010
20
30
40
50
60
70
Peak
Vol
tage
(V)
Resistance (KΩ)
V P
P max
(mW
)
(b)
Figure 14. Output after full bridge rectifier circuit. (a) voltage waveform; and (b) peak voltage and power.
4.4.3. Load Power under Energy Harvesting Circuit
We use LTC3588 energy harvesting chip to collect the output energy of the smart pavement, in which the output voltage is measured under micro-power full bridge and voltage regulation circuit. The chip could stably output the 3.3 V voltage after a period of no load, as shown in Figure 15a. Figure 15b shows the LTC3588 output voltage after the load. As the load resistance increases, the output voltage becomes smaller and unstable, and the output power is getting lower. The output is stable at 50 KΩ load and has a maximum output power of 214 μW.
Vol
tage
(V)
0 1 2 3 4 5 6 7 8 9 10 11 12
Time (×1s)-4
-3
-2
-1
0
1
2
3
4
(a)
0
50
100
150
200
250
0 200 400 600 800 10000
2
4
Vol
tage
(V)
Resistance (KΩ)
V P
P (μ
W)
(b)
Figure 15. Output after energy harvesting circuit. (a) output voltage; and (b) voltage and power.
Figure 13. Peak voltage and output power under an open circuit.
4.4.2. Load Power under Full Bridge Rectifier Circuit
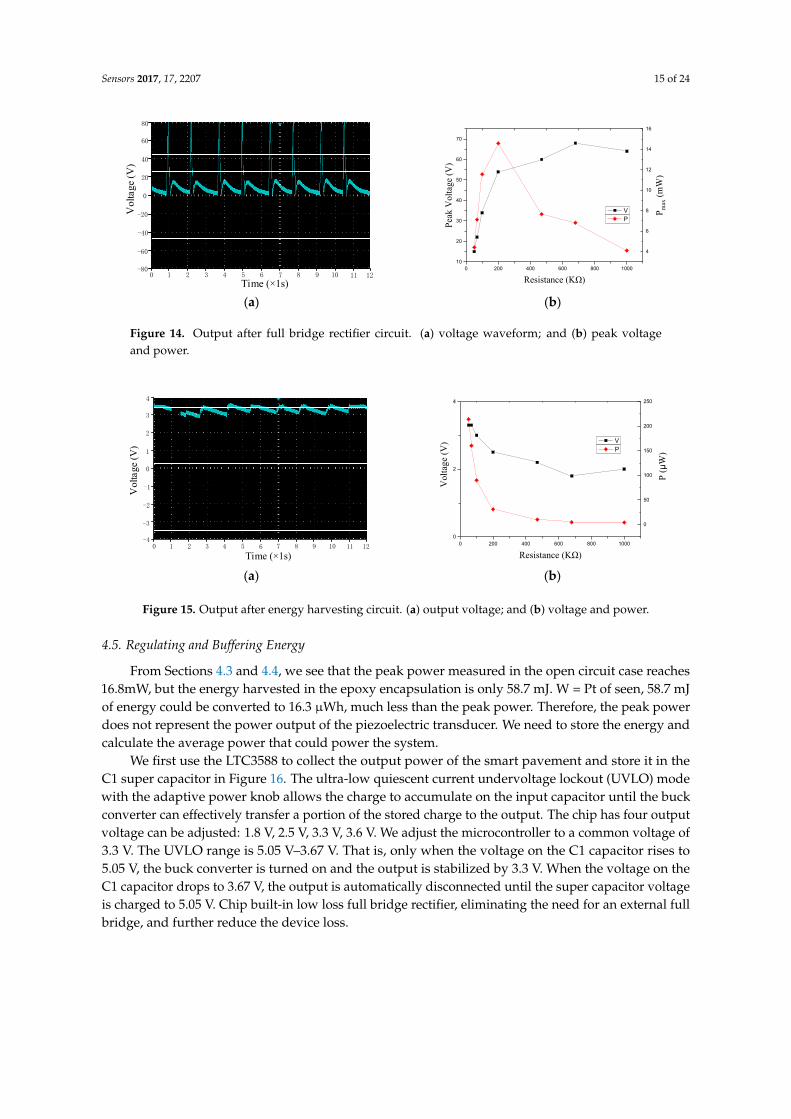
The function of the full bridge rectifier circuit is to convert the alternating current into directcurrent, such as the smart pavement voltage. The full bridge rectifier circuit is connected to differentload resistances, measuring its output. As shown in Figure 14a, the voltage waveform after thefull-bridge circuit is presented in two stages, and the voltage of the negative axis is reversed comparedto Figure 6, and the peak voltage after inversion is reduced to 20 V. Figure 14b shows the peak voltageand maximum power after loads, and the trend is similar to that under open circuit. Peak voltagereaches a maximum of 68 V at 700 KΩ, the output power reaches a maximum of 14.6 mW at 200 KΩ.
4.4.3. Load Power under Energy Harvesting Circuit
We use LTC3588 energy harvesting chip to collect the output energy of the smart pavement,in which the output voltage is measured under micro-power full bridge and voltage regulationcircuit. The chip could stably output the 3.3 V voltage after a period of no load, as shown in Figure 15a.Figure 15b shows the LTC3588 output voltage after the load. As the load resistance increases, the outputvoltage becomes smaller and unstable, and the output power is getting lower. The output is stable at50 KΩ load and has a maximum output power of 214 µW.
Sensors 2017, 17, 2207 15 of 24
Sensors 2017, 17, 2207 14 of 23
compared to Figure 6, and the peak voltage after inversion is reduced to 20 V. Figure 14b shows the peak voltage and maximum power after loads, and the trend is similar to that under open circuit. Peak voltage reaches a maximum of 68 V at 700 KΩ, the output power reaches a maximum of 14.6 mW at 200 KΩ.
4
6
8
10
12
14
16
18
0 200 400 600 800 100010
20
30
40
50
60
70
Peak
Vol
tage
(V)
Resistance (KΩ)
V P
P max
(mW
)
Figure 13. Peak voltage and output power under an open circuit.
Vol
tage
(V)
0 1 2 3 4 5 6 7 8 9 10 11 12
Time (×1s)-80
-60
-40
-20
0
20
40
60
80
(a)
4
6
8
10
12
14
16
0 200 400 600 800 100010
20
30
40
50
60
70
Peak
Vol
tage
(V)
Resistance (KΩ)
V P
P max
(mW
)
(b)
Figure 14. Output after full bridge rectifier circuit. (a) voltage waveform; and (b) peak voltage and power.
4.4.3. Load Power under Energy Harvesting Circuit
We use LTC3588 energy harvesting chip to collect the output energy of the smart pavement, in which the output voltage is measured under micro-power full bridge and voltage regulation circuit. The chip could stably output the 3.3 V voltage after a period of no load, as shown in Figure 15a. Figure 15b shows the LTC3588 output voltage after the load. As the load resistance increases, the output voltage becomes smaller and unstable, and the output power is getting lower. The output is stable at 50 KΩ load and has a maximum output power of 214 μW.
Vol
tage
(V)
0 1 2 3 4 5 6 7 8 9 10 11 12
Time (×1s)-4
-3
-2
-1
0
1
2
3
4
(a)
0
50
100
150
200
250
0 200 400 600 800 10000
2
4
Vol
tage
(V)
Resistance (KΩ)
V P
P (μ
W)
(b)
Figure 15. Output after energy harvesting circuit. (a) output voltage; and (b) voltage and power.
Figure 14. Output after full bridge rectifier circuit. (a) voltage waveform; and (b) peak voltageand power.
Sensors 2017, 17, 2207 14 of 23
compared to Figure 6, and the peak voltage after inversion is reduced to 20 V. Figure 14b shows the peak voltage and maximum power after loads, and the trend is similar to that under open circuit. Peak voltage reaches a maximum of 68 V at 700 KΩ, the output power reaches a maximum of 14.6 mW at 200 KΩ.
4
6
8
10
12
14
16
18
0 200 400 600 800 100010
20
30
40
50
60
70
Peak
Vol
tage
(V)
Resistance (KΩ)
V P
P max
(mW
)
Figure 13. Peak voltage and output power under an open circuit.
Vol
tage
(V)
0 1 2 3 4 5 6 7 8 9 10 11 12
Time (×1s)-80
-60
-40
-20
0
20
40
60
80
(a)
4
6
8
10
12
14
16
0 200 400 600 800 100010
20
30
40
50
60
70
Peak
Vol
tage
(V)
Resistance (KΩ)
V P
P max
(mW
)
(b)
Figure 14. Output after full bridge rectifier circuit. (a) voltage waveform; and (b) peak voltage and power.
4.4.3. Load Power under Energy Harvesting Circuit
We use LTC3588 energy harvesting chip to collect the output energy of the smart pavement, in which the output voltage is measured under micro-power full bridge and voltage regulation circuit. The chip could stably output the 3.3 V voltage after a period of no load, as shown in Figure 15a. Figure 15b shows the LTC3588 output voltage after the load. As the load resistance increases, the output voltage becomes smaller and unstable, and the output power is getting lower. The output is stable at 50 KΩ load and has a maximum output power of 214 μW.
Vol
tage
(V)
0 1 2 3 4 5 6 7 8 9 10 11 12
Time (×1s)-4
-3
-2
-1
0
1
2
3
4
(a)
0
50
100
150
200
250
0 200 400 600 800 10000
2
4
Vol
tage
(V)
Resistance (KΩ)
V P
P (μ
W)
(b)
Figure 15. Output after energy harvesting circuit. (a) output voltage; and (b) voltage and power. Figure 15. Output after energy harvesting circuit. (a) output voltage; and (b) voltage and power.
4.5. Regulating and Buffering Energy
From Sections 4.3 and 4.4, we see that the peak power measured in the open circuit case reaches16.8mW, but the energy harvested in the epoxy encapsulation is only 58.7 mJ. W = Pt of seen, 58.7 mJof energy could be converted to 16.3 µWh, much less than the peak power. Therefore, the peak powerdoes not represent the power output of the piezoelectric transducer. We need to store the energy andcalculate the average power that could power the system.
We first use the LTC3588 to collect the output power of the smart pavement and store it in theC1 super capacitor in Figure 16. The ultra-low quiescent current undervoltage lockout (UVLO) modewith the adaptive power knob allows the charge to accumulate on the input capacitor until the buckconverter can effectively transfer a portion of the stored charge to the output. The chip has four outputvoltage can be adjusted: 1.8 V, 2.5 V, 3.3 V, 3.6 V. We adjust the microcontroller to a common voltage of3.3 V. The UVLO range is 5.05 V–3.67 V. That is, only when the voltage on the C1 capacitor rises to5.05 V, the buck converter is turned on and the output is stabilized by 3.3 V. When the voltage on theC1 capacitor drops to 3.67 V, the output is automatically disconnected until the super capacitor voltageis charged to 5.05 V. Chip built-in low loss full bridge rectifier, eliminating the need for an external fullbridge, and further reduce the device loss.

Sensors 2017, 17, 2207 16 of 24
Sensors 2017, 17, 2207 15 of 23
4.5. Regulating and Buffering Energy
From Sections 4.3 and 4.4, we see that the peak power measured in the open circuit case reaches 16.8mW, but the energy harvested in the epoxy encapsulation is only 58.7 mJ. W = Pt of seen, 58.7 mJ of energy could be converted to 16.3 μWh, much less than the peak power. Therefore, the peak power does not represent the power output of the piezoelectric transducer. We need to store the energy and calculate the average power that could power the system.
We first use the LTC3588 to collect the output power of the smart pavement and store it in the C1 super capacitor in Figure 16. The ultra-low quiescent current undervoltage lockout (UVLO) mode with the adaptive power knob allows the charge to accumulate on the input capacitor until the buck converter can effectively transfer a portion of the stored charge to the output. The chip has four output voltage can be adjusted: 1.8 V, 2.5 V, 3.3 V, 3.6 V. We adjust the microcontroller to a common voltage of 3.3 V. The UVLO range is 5.05 V–3.67 V. That is, only when the voltage on the C1 capacitor rises to 5.05 V, the buck converter is turned on and the output is stabilized by 3.3 V. When the voltage on the C1 capacitor drops to 3.67 V, the output is automatically disconnected until the super capacitor voltage is charged to 5.05 V. Chip built-in low loss full bridge rectifier, eliminating the need for an external full bridge, and further reduce the device loss.
In general, an energy management module that harvests energy from a piezoelectric transducer and supplies power to our system achieves the following three goals:
1. For the microprocessor to provide a stable 3.3 V operating voltage, which drives the acquisition module, microprocessor and wireless transmitter module work.
2. Convert the peak voltage generated by the smart pavement, and charge the direct current to the super capacitor.
3. Use the adaptive power knob to allow the stored power to release energy in stages according the energy budgeting.
C1 C2C3
L1
Pie zoel ect ric Transduc er
LT C3588
Figure 16. Energy harvesting circuit.
5. Adaptive Working
As described in Section 3, the system needs to according to adaptive power knob release the power to supply the wireless sensor system. We measured the power of the ePave in the wireless sensor mode (about 120 mW) and therefore need to calculate the capacitance in the released energy so that it could have enough energy to provide the system to run. We define the concept of opening time ratio and measure the output of different energy storage capacitors and different loads. The ePave works stably according to the opening time ratio and the higher efficiency.
5.1. Non-Timed Work
The key to completing non-timed transmission is the charge-discharge cycle in the energy harvesting circuit. As shown in Figure 17, the non-timing operation is composed of the turn-off time Toff and the on-time Ton, and has a charging and discharging period Tc. In addition, the system
Figure 16. Energy harvesting circuit.
In general, an energy management module that harvests energy from a piezoelectric transducerand supplies power to our system achieves the following three goals:
1. For the microprocessor to provide a stable 3.3 V operating voltage, which drives the acquisitionmodule, microprocessor and wireless transmitter module work.
2. Convert the peak voltage generated by the smart pavement, and charge the direct current to thesuper capacitor.
3. Use the adaptive power knob to allow the stored power to release energy in stages according theenergy budgeting.
5. Adaptive Working
As described in Section 3, the system needs to according to adaptive power knob release thepower to supply the wireless sensor system. We measured the power of the ePave in the wirelesssensor mode (about 120 mW) and therefore need to calculate the capacitance in the released energy sothat it could have enough energy to provide the system to run. We define the concept of opening timeratio and measure the output of different energy storage capacitors and different loads. The ePaveworks stably according to the opening time ratio and the higher efficiency.
5.1. Non-Timed Work
The key to completing non-timed transmission is the charge-discharge cycle in the energyharvesting circuit. As shown in Figure 17, the non-timing operation is composed of the turn-offtime Toff and the on-time Ton, and has a charging and discharging period Tc. In addition, the systemusually needs to turn on Twake time to complete the initialization and power and other operations.Ron = Ton/Tc represents the on-time ratio.
Sensors 2017, 17, 2207 16 of 23
usually needs to turn on Twake time to complete the initialization and power and other operations. Ron = Ton/Tc represents the on-time ratio.
Toffton(i)
TonTC
Twake
toff(i)
Figure 17. The opening and closing cycles of the sensing system.
Due to the serious shortage of energy supply, ePave not only needs to use the collected power to non-timed send data and need to reduce power consumption. In order to transmit data as much as possible under limited energy, we can calculate the maximum value of the Ron based on the charging power and the power consumption of the wireless sensor system. Since the disorder of the vehicle, the value of Ron is not regular, but in the case of stable input, measuring the maximum value of Ron could reduce losses and improve system efficiency.
5.2. Adaptive Analysis and Energy Estimation
We calculate the power consumed by data transmission through Code Composer Studio (CCS) software. As shown in Figure 18, the working power is about 120 mW, the time is 20 ms, and the calculated energy is about 2.4 mJ. The energy stored by the capacitor could be calculated by the formula (1) to obtain a capacitance of at least 2.52 mF at a voltage drop of 5.05 V to 3.67 V. Considering the loss of efficiency and the buck converter circuit, we use the specifications of 47 mF, 0.47 F, 1F super capacitor, the two in series, as the charge storage unit to store energy according to the circuit mentioned in Section 4.5. Equivalent system load is selected for 47 Ω, 100 Ω, 150 Ω, 200 Ω, 270 Ω, 330 Ω, 470 Ω, 510 Ω, 680 Ω resistors. Connect the LTC3588 to detect the output voltage waveform to compare Ron and select the optimum efficiency conditions.
Pow
er (m
W)
Time (s)
System working power
The wasted power which is not enough to work
The simulation circuit consumes power when the system off
Figure 18. System operating power.
Figure 19 shows the output voltage at different capacitors and different loads. In the 47 Ω, 100 Ω, 150 Ω load under the three kinds of charging the capacitor in the energy collection circuit output could not output a stable voltage. In the case where the load is larger or equal to 200 Ω, a stable output at intervals could be used only when supercapacitor with a capacity of 1F is used. We calculated the interval stability of the output of the Ron, the value shown in Table 4.
Table 4. Output power and Ron value under different loads.
Equivalent Load 200 Ω 270 Ω 330 Ω 470 Ω 510 Ω 680 Ω Ron 17.7 24.8 30.9 45.4 48.9 81.1
Figure 17. The opening and closing cycles of the sensing system.
Due to the serious shortage of energy supply, ePave not only needs to use the collected power tonon-timed send data and need to reduce power consumption. In order to transmit data as much aspossible under limited energy, we can calculate the maximum value of the Ron based on the chargingpower and the power consumption of the wireless sensor system. Since the disorder of the vehicle,

Sensors 2017, 17, 2207 17 of 24
the value of Ron is not regular, but in the case of stable input, measuring the maximum value of Roncould reduce losses and improve system efficiency.
5.2. Adaptive Analysis and Energy Estimation
We calculate the power consumed by data transmission through Code Composer Studio (CCS)software. As shown in Figure 18, the working power is about 120 mW, the time is 20 ms, and thecalculated energy is about 2.4 mJ. The energy stored by the capacitor could be calculated by the formula(1) to obtain a capacitance of at least 2.52 mF at a voltage drop of 5.05 V to 3.67 V. Considering theloss of efficiency and the buck converter circuit, we use the specifications of 47 mF, 0.47 F, 1F supercapacitor, the two in series, as the charge storage unit to store energy according to the circuit mentionedin Section 4.5. Equivalent system load is selected for 47 Ω, 100 Ω, 150 Ω, 200 Ω, 270 Ω, 330 Ω, 470 Ω,510 Ω, 680 Ω resistors. Connect the LTC3588 to detect the output voltage waveform to compare Ronand select the optimum efficiency conditions.
Sensors 2017, 17, 2207 16 of 23
usually needs to turn on Twake time to complete the initialization and power and other operations. Ron = Ton/Tc represents the on-time ratio.
Toffton(i)
TonTC
Twake
toff(i)
Figure 17. The opening and closing cycles of the sensing system.
Due to the serious shortage of energy supply, ePave not only needs to use the collected power to non-timed send data and need to reduce power consumption. In order to transmit data as much as possible under limited energy, we can calculate the maximum value of the Ron based on the charging power and the power consumption of the wireless sensor system. Since the disorder of the vehicle, the value of Ron is not regular, but in the case of stable input, measuring the maximum value of Ron could reduce losses and improve system efficiency.
5.2. Adaptive Analysis and Energy Estimation
We calculate the power consumed by data transmission through Code Composer Studio (CCS) software. As shown in Figure 18, the working power is about 120 mW, the time is 20 ms, and the calculated energy is about 2.4 mJ. The energy stored by the capacitor could be calculated by the formula (1) to obtain a capacitance of at least 2.52 mF at a voltage drop of 5.05 V to 3.67 V. Considering the loss of efficiency and the buck converter circuit, we use the specifications of 47 mF, 0.47 F, 1F super capacitor, the two in series, as the charge storage unit to store energy according to the circuit mentioned in Section 4.5. Equivalent system load is selected for 47 Ω, 100 Ω, 150 Ω, 200 Ω, 270 Ω, 330 Ω, 470 Ω, 510 Ω, 680 Ω resistors. Connect the LTC3588 to detect the output voltage waveform to compare Ron and select the optimum efficiency conditions.
Pow
er (m
W)
Time (s)
System working power
The wasted power which is not enough to work
The simulation circuit consumes power when the system off
Figure 18. System operating power.
Figure 19 shows the output voltage at different capacitors and different loads. In the 47 Ω, 100 Ω, 150 Ω load under the three kinds of charging the capacitor in the energy collection circuit output could not output a stable voltage. In the case where the load is larger or equal to 200 Ω, a stable output at intervals could be used only when supercapacitor with a capacity of 1F is used. We calculated the interval stability of the output of the Ron, the value shown in Table 4.
Table 4. Output power and Ron value under different loads.
Equivalent Load 200 Ω 270 Ω 330 Ω 470 Ω 510 Ω 680 Ω Ron 17.7 24.8 30.9 45.4 48.9 81.1
Figure 18. System operating power.
Figure 19 shows the output voltage at different capacitors and different loads. In the 47 Ω, 100 Ω,150 Ω load under the three kinds of charging the capacitor in the energy collection circuit output couldnot output a stable voltage. In the case where the load is larger or equal to 200 Ω, a stable output atintervals could be used only when supercapacitor with a capacity of 1F is used. We calculated theinterval stability of the output of the Ron, the value shown in Table 4.
Table 4. Output power and Ron value under different loads.
Equivalent Load 200 Ω 270 Ω 330 Ω 470 Ω 510 Ω 680 Ω
Ron 17.7 24.8 30.9 45.4 48.9 81.1Output power (mW) 54.5 40.3 33 23.2 21.4 16
From Table 4, as the load increases, Ron also becomes large, because that the greater the resistancein the case of stable output, the smaller the output power. Therefore, reducing the power of the systemcould increase the value of Ron, so that improve the operating efficiency of the system. We can see thatRon has a value of 17.7 at 54.5 mW, but ePave has a running power of 120 mW, and we will evaluatethe feasibility of the system below.
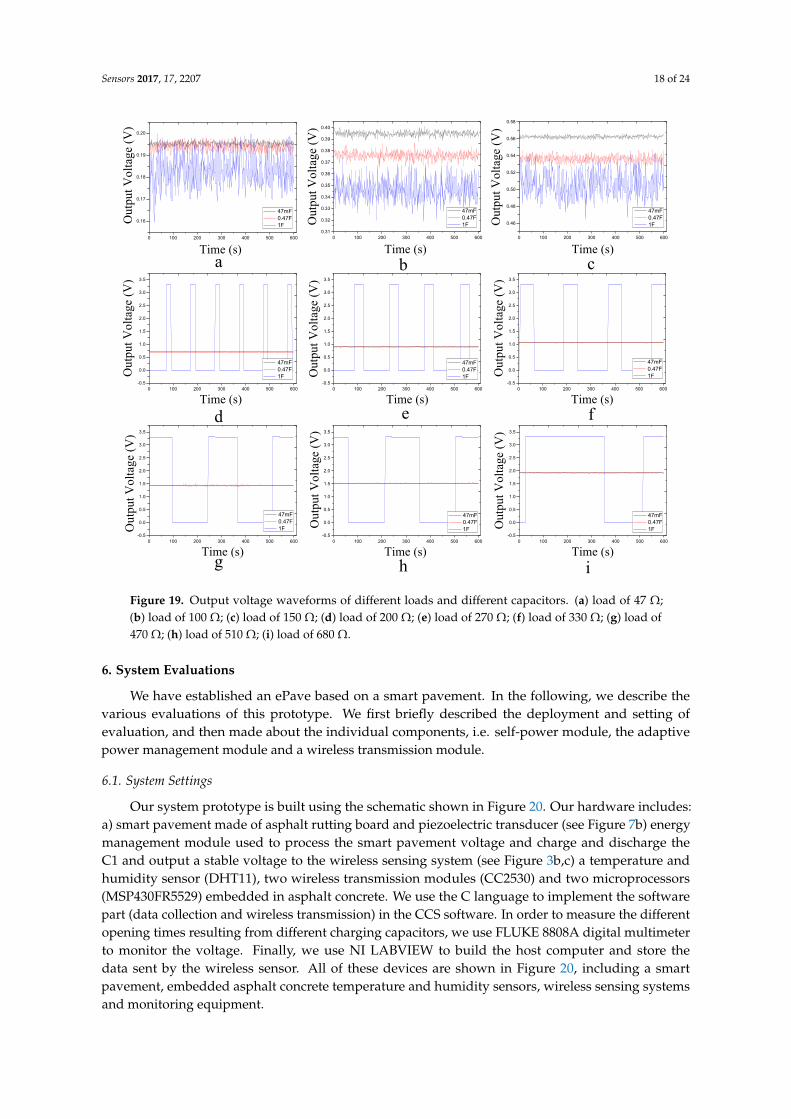
Sensors 2017, 17, 2207 18 of 24
Sensors 2017, 17, 2207 17 of 23
Output power (mW) 54.5 40.3 33 23.2 21.4 16
From Table 4, as the load increases, Ron also becomes large, because that the greater the resistance in the case of stable output, the smaller the output power. Therefore, reducing the power of the system could increase the value of Ron, so that improve the operating efficiency of the system. We can see that Ron has a value of 17.7 at 54.5 mW, but ePave has a running power of 120 mW, and we will evaluate the feasibility of the system below.
0 100 200 300 400 500 600-0.5
0.0
0.5
1.0
1.5
2.0
2.5
3.0
3.5
Out
put V
olta
ge (V
)
Time (s)
47mF 0.47F 1F
0 100 200 300 400 500 600-0.5
0.0
0.5
1.0
1.5
2.0
2.5
3.0
3.5
Out
put V
olta
ge (V
)
Time (s)
47mF 0.47F 1F
0 100 200 300 400 500 600-0.5
0.0
0.5
1.0
1.5
2.0
2.5
3.0
3.5
Out
put V
olta
ge (V
)
Time (s)
47mF 0.47F 1F
0 100 200 300 400 500 600-0.5
0.0
0.5
1.0
1.5
2.0
2.5
3.0
3.5
Out
put V
olta
ge (V
)
Time (s)
47mF 0.47F 1F
0 100 200 300 400 500 600-0.5
0.0
0.5
1.0
1.5
2.0
2.5
3.0
3.5
Out
put V
olta
ge (V
)
Time (s)
47mF 0.47F 1F
0 100 200 300 400 500 600
0.46
0.48
0.50
0.52
0.54
0.56
0.58
Out
put V
olta
ge (V
)
Time (s)
47mF 0.47F 1F
0 100 200 300 400 500 6000.31
0.32
0.33
0.34
0.35
0.36
0.37
0.38
0.39
0.40
Out
put V
olta
ge (V
)
Time (s)
47mF 0.47F 1F
0 100 200 300 400 500 600
0.16
0.17
0.18
0.19
0.20O
utpu
t Vol
tage
(V)
Time (s)
47mF 0.47F 1F
0 100 200 300 400 500 600-0.5
0.0
0.5
1.0
1.5
2.0
2.5
3.0
3.5
Out
put V
olta
ge (V
)
Time (s)
47mF 0.47F 1F
a b c
d e f
g h i Figure 19. Output voltage waveforms of different loads and different capacitors. (a) load of 47 Ω; (b) load of 100 Ω; (c) load of 150 Ω; (d) load of 200 Ω; (e) load of 270 Ω; (f) load of 330 Ω; (g) load of 470 Ω; (h) load of 510 Ω; (i) load of 680 Ω.
6. System Evaluations
We have established an ePave based on a smart pavement. In the following, we describe the various evaluations of this prototype. We first briefly described the deployment and setting of evaluation, and then made about the individual components, i.e. self-power module, the adaptive power management module and a wireless transmission module.
6.1. System Settings
Our system prototype is built using the schematic shown in Figure 20. Our hardware includes: a) smart pavement made of asphalt rutting board and piezoelectric transducer (see Figure 7b) energy management module used to process the smart pavement voltage and charge and discharge the C1 and output a stable voltage to the wireless sensing system (see Figure 3b,c) a temperature and humidity sensor (DHT11), two wireless transmission modules (CC2530) and two microprocessors (MSP430FR5529) embedded in asphalt concrete. We use the C language to implement the software part (data collection and wireless transmission) in the CCS software. In order to measure the
Figure 19. Output voltage waveforms of different loads and different capacitors. (a) load of 47 Ω;(b) load of 100 Ω; (c) load of 150 Ω; (d) load of 200 Ω; (e) load of 270 Ω; (f) load of 330 Ω; (g) load of470 Ω; (h) load of 510 Ω; (i) load of 680 Ω.
6. System Evaluations
We have established an ePave based on a smart pavement. In the following, we describe thevarious evaluations of this prototype. We first briefly described the deployment and setting ofevaluation, and then made about the individual components, i.e. self-power module, the adaptivepower management module and a wireless transmission module.
6.1. System Settings
Our system prototype is built using the schematic shown in Figure 20. Our hardware includes:a) smart pavement made of asphalt rutting board and piezoelectric transducer (see Figure 7b) energymanagement module used to process the smart pavement voltage and charge and discharge theC1 and output a stable voltage to the wireless sensing system (see Figure 3b,c) a temperature andhumidity sensor (DHT11), two wireless transmission modules (CC2530) and two microprocessors(MSP430FR5529) embedded in asphalt concrete. We use the C language to implement the softwarepart (data collection and wireless transmission) in the CCS software. In order to measure the differentopening times resulting from different charging capacitors, we use FLUKE 8808A digital multimeterto monitor the voltage. Finally, we use NI LABVIEW to build the host computer and store thedata sent by the wireless sensor. All of these devices are shown in Figure 20, including a smartpavement, embedded asphalt concrete temperature and humidity sensors, wireless sensing systemsand monitoring equipment.
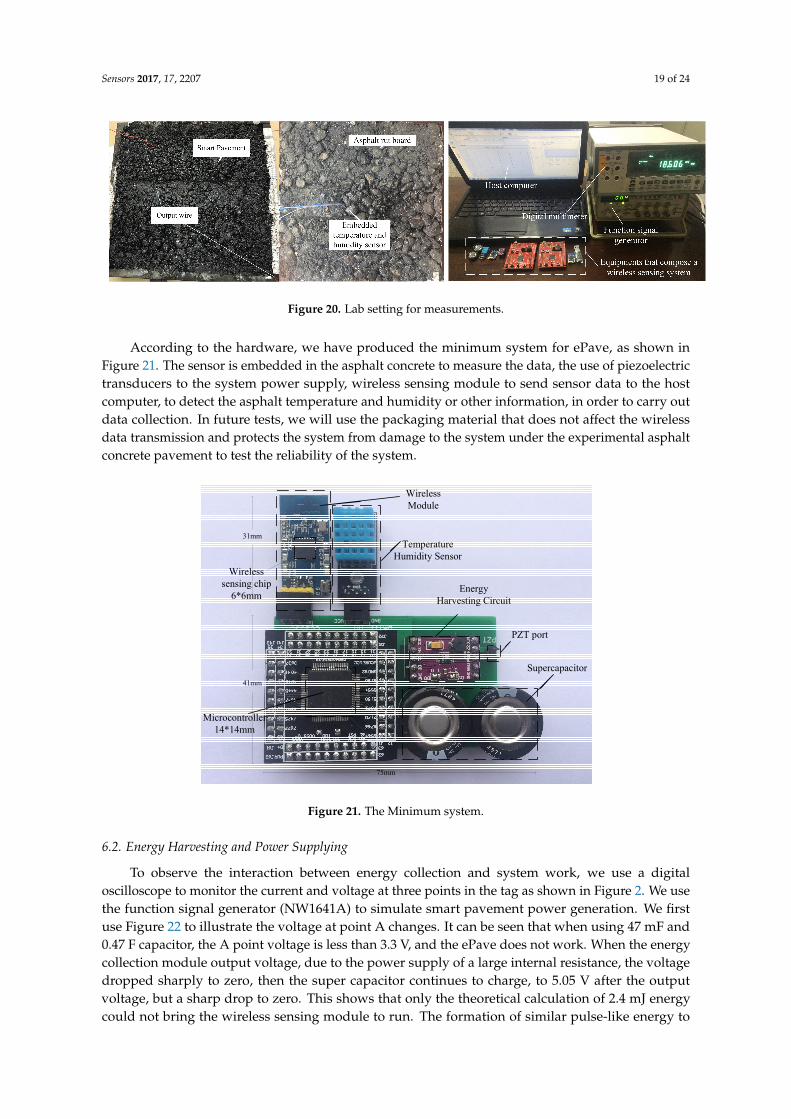
Sensors 2017, 17, 2207 19 of 24
Sensors 2017, 17, 2207 18 of 23
different opening times resulting from different charging capacitors, we use FLUKE 8808A digital multimeter to monitor the voltage. Finally, we use NI LABVIEW to build the host computer and store the data sent by the wireless sensor. All of these devices are shown in Figure 20, including a smart pavement, embedded asphalt concrete temperature and humidity sensors, wireless sensing systems and monitoring equipment.
Figure 20. Lab setting for measurements.
According to the hardware, we have produced the minimum system for ePave, as shown in Figure 21. The sensor is embedded in the asphalt concrete to measure the data, the use of piezoelectric transducers to the system power supply, wireless sensing module to send sensor data to the host computer, to detect the asphalt temperature and humidity or other information, in order to carry out data collection. In future tests, we will use the packaging material that does not affect the wireless data transmission and protects the system from damage to the system under the experimental asphalt concrete pavement to test the reliability of the system.
Wireless Module
Temperature Humidity Sensor
Microcontroller14*14mm
Supercapacitor
Energy Harvesting Circuit
PZT port
75mm
41mm
31mm
Wireless sensing chip
6*6mm
Figure 21. The Minimum system.
6.2. Energy Harvesting and Power Supplying
To observe the interaction between energy collection and system work, we use a digital oscilloscope to monitor the current and voltage at three points in the tag as shown in Figure 2. We use the function signal generator (NW1641A) to simulate smart pavement power generation. We first use Figure 22 to illustrate the voltage at point A changes. It can be seen that when using 47mF and 0.47 F capacitor, the A point voltage is less than 3.3 V, and the ePave does not work. When the energy collection module output voltage, due to the power supply of a large internal resistance, the
Figure 20. Lab setting for measurements.
According to the hardware, we have produced the minimum system for ePave, as shown inFigure 21. The sensor is embedded in the asphalt concrete to measure the data, the use of piezoelectrictransducers to the system power supply, wireless sensing module to send sensor data to the hostcomputer, to detect the asphalt temperature and humidity or other information, in order to carry outdata collection. In future tests, we will use the packaging material that does not affect the wirelessdata transmission and protects the system from damage to the system under the experimental asphaltconcrete pavement to test the reliability of the system.
Sensors 2017, 17, 2207 18 of 23
different opening times resulting from different charging capacitors, we use FLUKE 8808A digital multimeter to monitor the voltage. Finally, we use NI LABVIEW to build the host computer and store the data sent by the wireless sensor. All of these devices are shown in Figure 20, including a smart pavement, embedded asphalt concrete temperature and humidity sensors, wireless sensing systems and monitoring equipment.
Figure 20. Lab setting for measurements.
According to the hardware, we have produced the minimum system for ePave, as shown in Figure 21. The sensor is embedded in the asphalt concrete to measure the data, the use of piezoelectric transducers to the system power supply, wireless sensing module to send sensor data to the host computer, to detect the asphalt temperature and humidity or other information, in order to carry out data collection. In future tests, we will use the packaging material that does not affect the wireless data transmission and protects the system from damage to the system under the experimental asphalt concrete pavement to test the reliability of the system.
Wireless Module
Temperature Humidity Sensor
Microcontroller14*14mm
Supercapacitor
Energy Harvesting Circuit
PZT port
75mm
41mm
31mm
Wireless sensing chip
6*6mm
Figure 21. The Minimum system.
6.2. Energy Harvesting and Power Supplying
To observe the interaction between energy collection and system work, we use a digital oscilloscope to monitor the current and voltage at three points in the tag as shown in Figure 2. We use the function signal generator (NW1641A) to simulate smart pavement power generation. We first use Figure 22 to illustrate the voltage at point A changes. It can be seen that when using 47mF and 0.47 F capacitor, the A point voltage is less than 3.3 V, and the ePave does not work. When the energy collection module output voltage, due to the power supply of a large internal resistance, the
Figure 21. The Minimum system.
6.2. Energy Harvesting and Power Supplying
To observe the interaction between energy collection and system work, we use a digitaloscilloscope to monitor the current and voltage at three points in the tag as shown in Figure 2. We usethe function signal generator (NW1641A) to simulate smart pavement power generation. We firstuse Figure 22 to illustrate the voltage at point A changes. It can be seen that when using 47 mF and0.47 F capacitor, the A point voltage is less than 3.3 V, and the ePave does not work. When the energycollection module output voltage, due to the power supply of a large internal resistance, the voltagedropped sharply to zero, then the super capacitor continues to charge, to 5.05 V after the outputvoltage, but a sharp drop to zero. This shows that only the theoretical calculation of 2.4 mJ energycould not bring the wireless sensing module to run. The formation of similar pulse-like energy to

Sensors 2017, 17, 2207 20 of 24
instantly drive the wireless sensing module, and would not have been consumed without working.When using 1 F charging capacitor, the capacitor after a period of time would be charged at the Apoint output 3.3 V stable voltage to provide system work. After a period of time (about 1 s) the voltagedrops, the super capacitor starts charging again, waiting for the next time the system is powered.
Sensors 2017, 17, x FOR PEER REVIEW 19 of 23
working. When using 1 F charging capacitor, the capacitor after a period of time would be charged at
the A point output 3.3 V stable voltage to provide system work. After a period of time (about 1 s) the
voltage drops, the super capacitor starts charging again, waiting for the next time the system is
powered.
0 10000 20000 30000 40000
0.0
0.5
1.0
1.5
2.0
2.5
3.0
3.5
Outp
ut
Volt
age
(V)
Time (s)
1F
0.47F
47mF
Figure 22. Voltage of test point A.
As shown in Figure 22, the wireless sensing system operates approximately 1055 s and the
opening time is about 0.05%, so we charge according to 1F capacitor and observe the data on the host
computer. To evaluate the performance of the power management module accurately, we measured
the voltage and current of an hour at point A and point B, as shown in Figure 23.
Vo
ltag
e (V
)
Cir
cuit
(A
)
Measure at
point A
Charging time
Measure at
point B
0 500 1000 1500 2000 2500 3000
0.0
0.5
1.0
1.5
2.0
2.5
3.0
3.5
4.0
4.5
5.0
5.5
output voltage
SC voltage
output circuit
Time (s)
0.000
0.005
0.010
0.015
0.020
0.025
0.030
0.035
0.040
0.045
0.050
0.055
0.060
Working time
Figure 23. Monitoring energy harvesting and power supplying at points A and B in Figure 2.
Figure 23 shows that the ePave running current is about 35 mA, the charging capacitor voltage
drop when the energy harvesting module stable output, the peak power running about 116 mW.
Our system still works after 24 h of continuous operation (in fact, ePave has been working for more
than a month), but the opening time is still small, which requires us to further reduce power
consumption in future work to improve the operational effectiveness.
6.3. Data Detection in Operation
Our ePave enables self-powered detection of road information. Therefore, we collected asphalt
concrete temperature and humidity information through the wireless sensing system sent to the host
computer, do not need to go to the field of artificial measurements, which provides a big power to
the road information detecting. Figure 24 shows the change in temperature and humidity of asphalt
Figure 22. Voltage of test point A.
As shown in Figure 22, the wireless sensing system operates approximately 1055 s and the openingtime is about 0.05%, so we charge according to 1F capacitor and observe the data on the host computer.To evaluate the performance of the power management module accurately, we measured the voltageand current of an hour at point A and point B, as shown in Figure 23.
Sensors 2017, 17, 2207 19 of 23
voltage dropped sharply to zero, then the super capacitor continues to charge, to 5.05 V after the output voltage, but a sharp drop to zero. This shows that only the theoretical calculation of 2.4 mJ energy could not bring the wireless sensing module to run. The formation of similar pulse-like energy to instantly drive the wireless sensing module, and would not have been consumed without working. When using 1 F charging capacitor, the capacitor after a period of time would be charged at the A point output 3.3 V stable voltage to provide system work. After a period of time (about 1 s) the voltage drops, the super capacitor starts charging again, waiting for the next time the system is powered.
0 10000 20000 30000 40000
0.0
0.5
1.0
1.5
2.0
2.5
3.0
3.5O
utpu
t Vol
tage
(V)
Time (s)
1F 0.47F 47mF
Figure 22. Voltage of test point A.
As shown in Figure 22, the wireless sensing system operates approximately 1055 s and the opening time is about 0.05%, so we charge according to 1F capacitor and observe the data on the host computer. To evaluate the performance of the power management module accurately, we measured the voltage and current of an hour at point A and point B, as shown in Figure 23.
Vol
tage
(V)
Circ
uit (
A)
Measure at point A
Charging time
Measure at point B
0 500 1000 1500 2000 2500 30000.0
0.5
1.0
1.5
2.0
2.5
3.0
3.5
4.0
4.5
5.0
5.5
output voltage SC voltage output circuit
Time (s)
0.000
0.005
0.010
0.015
0.020
0.025
0.030
0.035
0.040
0.045
0.050
0.055
0.060
Working time
Figure 23. Monitoring energy harvesting and power supplying at points A and B in Figure 2.
Figure 23 shows that the ePave running current is about 35 mA, the charging capacitor voltage drop when the energy harvesting module stable output, the peak power running about 116 mW. Our system still works after 24 h of continuous operation (in fact, ePave has been working for more than a month), but the opening time is still small, which requires us to further reduce power consumption in future work to improve the operational effectiveness.
6.3. Data Detection in Operation
Figure 23. Monitoring energy harvesting and power supplying at points A and B in Figure 2.
Figure 23 shows that the ePave running current is about 35 mA, the charging capacitor voltagedrop when the energy harvesting module stable output, the peak power running about 116 mW.Our system still works after 24 h of continuous operation (in fact, ePave has been working formore than a month), but the opening time is still small, which requires us to further reduce powerconsumption in future work to improve the operational effectiveness.
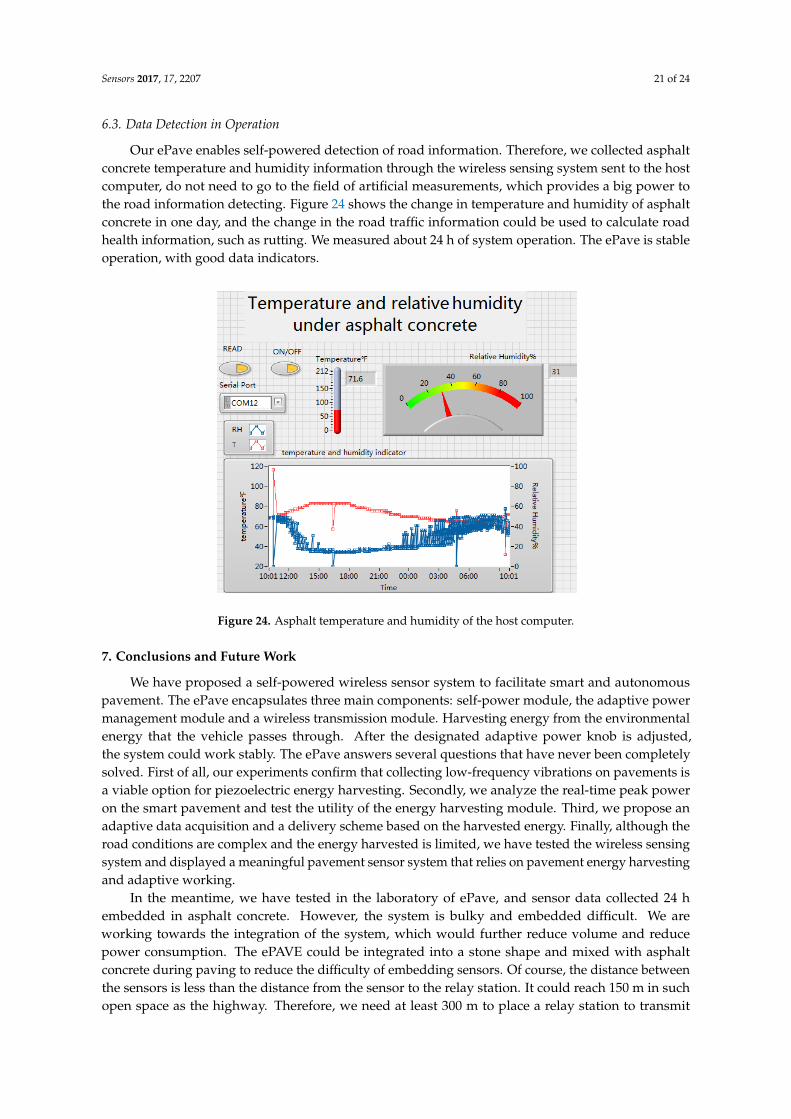
Sensors 2017, 17, 2207 21 of 24
6.3. Data Detection in Operation
Our ePave enables self-powered detection of road information. Therefore, we collected asphaltconcrete temperature and humidity information through the wireless sensing system sent to the hostcomputer, do not need to go to the field of artificial measurements, which provides a big power tothe road information detecting. Figure 24 shows the change in temperature and humidity of asphaltconcrete in one day, and the change in the road traffic information could be used to calculate roadhealth information, such as rutting. We measured about 24 h of system operation. The ePave is stableoperation, with good data indicators.
Sensors 2017, 17, 2207 20 of 23
Our ePave enables self-powered detection of road information. Therefore, we collected asphalt concrete temperature and humidity information through the wireless sensing system sent to the host computer, do not need to go to the field of artificial measurements, which provides a big power to the road information detecting. Figure 24 shows the change in temperature and humidity of asphalt concrete in one day, and the change in the road traffic information could be used to calculate road health information, such as rutting. We measured about 24 h of system operation. The ePave is stable operation, with good data indicators.
Figure 24. Asphalt temperature and humidity of the host computer.
7. Conclusions and Future Work
We have proposed a self-powered wireless sensor system to facilitate smart and autonomous pavement. The ePave encapsulates three main components: self-power module, the adaptive power management module and a wireless transmission module. Harvesting energy from the environmental energy that the vehicle passes through. After the designated adaptive power knob is adjusted, the system could work stably. The ePave answers several questions that have never been completely solved. First of all, our experiments confirm that collecting low-frequency vibrations on pavements is a viable option for piezoelectric energy harvesting. Secondly, we analyze the real-time peak power on the smart pavement and test the utility of the energy harvesting module. Third, we propose an adaptive data acquisition and a delivery scheme based on the harvested energy. Finally, although the road conditions are complex and the energy harvested is limited, we have tested the wireless sensing system and displayed a meaningful pavement sensor system that relies on pavement energy harvesting and adaptive working.
In the meantime, we have tested in the laboratory of ePave, and sensor data collected 24h embedded in asphalt concrete. However, the system is bulky and embedded difficult. We are working towards the integration of the system, which would further reduce volume and reduce power consumption. The ePAVE could be integrated into a stone shape and mixed with asphalt concrete during paving to reduce the difficulty of embedding sensors. Of course, the distance between the sensors is less than the distance from the sensor to the relay station. It could reach 150 m in such open space as the highway. Therefore, we need at least 300 m to place a relay station to transmit data. The relay station could be built into the street lights, and the received data is transmitted to the network through the cable under the street light. The control center can make decisions based on the data stored by the server. In addition, asphalt concrete sensor pavement health inspection is being studied. Different from existing pavement testing, our smart pavement
Figure 24. Asphalt temperature and humidity of the host computer.
7. Conclusions and Future Work
We have proposed a self-powered wireless sensor system to facilitate smart and autonomouspavement. The ePave encapsulates three main components: self-power module, the adaptive powermanagement module and a wireless transmission module. Harvesting energy from the environmentalenergy that the vehicle passes through. After the designated adaptive power knob is adjusted,the system could work stably. The ePave answers several questions that have never been completelysolved. First of all, our experiments confirm that collecting low-frequency vibrations on pavements isa viable option for piezoelectric energy harvesting. Secondly, we analyze the real-time peak poweron the smart pavement and test the utility of the energy harvesting module. Third, we propose anadaptive data acquisition and a delivery scheme based on the harvested energy. Finally, although theroad conditions are complex and the energy harvested is limited, we have tested the wireless sensingsystem and displayed a meaningful pavement sensor system that relies on pavement energy harvestingand adaptive working.
In the meantime, we have tested in the laboratory of ePave, and sensor data collected 24 hembedded in asphalt concrete. However, the system is bulky and embedded difficult. We areworking towards the integration of the system, which would further reduce volume and reducepower consumption. The ePAVE could be integrated into a stone shape and mixed with asphaltconcrete during paving to reduce the difficulty of embedding sensors. Of course, the distance betweenthe sensors is less than the distance from the sensor to the relay station. It could reach 150 m in suchopen space as the highway. Therefore, we need at least 300 m to place a relay station to transmit

Sensors 2017, 17, 2207 22 of 24
data. The relay station could be built into the street lights, and the received data is transmitted to thenetwork through the cable under the street light. The control center can make decisions based on thedata stored by the server. In addition, asphalt concrete sensor pavement health inspection is beingstudied. Different from existing pavement testing, our smart pavement wireless sensor system will bededicated to transmitting pavement sensor information and remotely testing pavement applications.
The application of this technology in the actual pavement will be very extensive. For example,it is able to achieve remote road temperature and humidity monitoring, or realize the constructionof intelligent highway by combining with the vehicle network. The monitored data can indicate orforecast potential road disasters according to the fatigue damage algorithm. Nevertheless, there are stillsome issues with this technology, such as the life of piezoelectric transducers, embedding orientationof sensors, transmission distance, cost, and the like. Since these issues are challenging yet solvable,in general the system could improve the pavement preservation, management and maintenance,while ultimately reducing the traffic accidents caused by road disasters.
Acknowledgments: This research is supported by the International Cooperation and Exchange Plan ofShaaxi Science Foundation of China (no. 2016KW-044) and Science and Technology Program of Xi’an, China(no. CXY1705(3)).
Author Contributions: Jian Xiao performed the theoretical analysis, and conceived the question; Xiang Zoudesigned and performed the experiments, and analyzed the data, and wrote the paper; Wenyao Xu providedguidance for writing and revised the paper.
Conflicts of Interest: The authors declare no conflict of interest.
References
1. Corke, P.; Wark, T.; Jurdak, R.; Hu, W.; Valencia, P.; Moore, D. Environmental wireless sensor networks.Proc. IEEE 2010, 98, 1903–1917. [CrossRef]
2. Cao, X.; Chen, J.; Zhang, Y.; Sun, Y. Development of an integrated wireless sensor networkmicro-environmental monitoring system. ISA Trans. 2008, 47, 247–255. [CrossRef] [PubMed]
3. Agarwal, Y.; Balaji, B.; Gupta, R.; Lyles, J.; Wei, M.; Weng, T. Occupancy-driven energy management forsmart building automation. In Proceedings of the 2nd ACM Workshop on Embedded Sensing Systems forEnergy-Efficiency in Building, Zurich, Switzerland, 3–5 November 2010; pp. 1–6.
4. Dong, Q.; Yu, L.; Lu, H.; Hong, Z.; Chen, Y. Design of building monitoring systems based on wireless sensornetworks. Wirel. Sens. Netw. 2010, 2, 703–709. [CrossRef]
5. Lazarescu, M.T. Design and field test of a wsn platform prototype for long-term environmental monitoring.Sensors 2015, 15, 9481–9518. [CrossRef] [PubMed]
6. Chang, D.T.T.; Tsai, Y.S.; Lee, H.C.; Guo, L.L.; Yang, K.C. Wireless sensor network (WSN) using in tunnelenvironmental monitoring for disaster prevention. Adv. Mater. Res. 2011, 291–294, 3401–3404. [CrossRef]
7. Wu, W.J.; Lee, C.K. Design and implementation of smart sensor nodes for wireless disaster monitoringsystems. Proc. SPIE Int. Soc. Opt. Eng. 2004, 5391, 610–614.
8. Aliyu, M.S.; Chizari, H.; Abdullah, A.H. Integrated sensor and RFID network node placement in disastermonitoring applications. In Proceedings of the IEEE International Conference on Rfid-Technologies andApplications, Johor Bahru, Malaysia, 4–5 September 2013; pp. 1–5.
9. Wang, W.; Guo, L. The Application of Wireless Sensor Network Technology in Earthquake Disaster.In Proceedings of the International Conference on Industrial Control and Electronics Engineering, Xi’an,China, 23–25 August 2012; pp. 52–55.
10. Corke, P.; Valencia, P.; Sikka, P.; Wark, T.; Overs, L. Long-duration solar-powered wireless sensor networks.In Proceedings of the 4th Workshop on Embedded Networked Sensors, New York, NY, USA, 25–26 June2007; pp. 33–37.
11. Lin, K.; Yu, J.; Hsu, J.; Zahedi, S.; Lee, D.; Friedman, J.; Kansal, A.; Raghunathan, V.; Srivastava, M. Heliomote:Enabling long-lived sensor networks through solar energy harvesting. In Proceedings of the 3rd InternationalConference on Embedded Networked Sensor Systems, New York, NY, USA, 2–4 November 2005; p. 309.
12. Xie, X.D.; Wang, Q.; Wang, S.J.; Lund, H.; Kaiser, M.J. Energy harvesting from high-rise buildings by apiezoelectric harvester device. Energy 2015, 93, 1345–1352. [CrossRef]

Sensors 2017, 17, 2207 23 of 24
13. Howells, C.A. Piezoelectric energy harvesting. Energy Convers. Manag. 2009, 50, 1847–1850. [CrossRef]14. Ilyas, M.A.; Swingler, J. Piezoelectric energy harvesting from raindrop impacts. Energy 2015, 90, 796–806.
[CrossRef]15. Martin, P.; Charbiwala, Z.; Srivastava, M. DoubleDip: Leveraging thermoelectric harvesting for low power
monitoring of sporadic water use. In Proceedings of the 10th ACM Conference on Embedded NetworkSensor Systems, New York, NY, USA, 6–9 November 2012; pp. 225–238.
16. Zhang, C.; Syed, A.; Cho, Y.; Heidemann, J. Steam-powered sensing. In Proceedings of the 9th ACMConference on Embedded Networked Sensor Systems, New York, NY, USA, 1–4 November 2011; pp. 204–217.
17. Nishimoto, H.; Kawahara, Y.; Asami, T. Prototype implementation of ambient RF energy harvesting wirelesssensor networks. IEEE Sens. 2010, 143, 1282–1287.
18. Sarhadi, A.; Bjørk, R.; Lindeburg, N.; Viereck, P.; Pryds, N. A thermoelectric power generating heat exchanger:Part I – Experimental realization. Energy Convers. Manag. 2016, 119, 473–480.
19. Cookchennault, K.A.; Thambi, N.; Bitetto, M.A.; Hameyie, E.B. Piezoelectric energy harvesting: A green andclean alternative for sustained power production. Bull. Sci. Technol. Soc. 2008, 28, 496–509. [CrossRef]
20. Abbasi, A. Application of Piezoelectric Materials and Piezoelectric Network for Smart Roads. Int. J. Electr.Comput. Eng. 2013, 3, 857. [CrossRef]
21. Cafiso, S.; Cuomo, M.; Di Graziano, A.; Vecchio, C. Experimental Analysis for Piezoelectric TransducersApplications into Roads Pavements. Adv. Mater. Res. 2013, 684, 253–257.
22. Zhao, H.; Qin, L.; Tao, Y.; Ling, J. Study on Structure of PZT piles Based Transducer for Harvesting Energyfrom Asphalt Pavement. In Proceedings of the 2013 IJPC-International Journal of Pavements Conference,São Paulo, Brazil, 9–10 December 2013; pp. 1–9.
23. Peigney, M.; Siegert, D. Piezoelectric energy harvesting from traffic-induced bridge vibrations.Smart Mater. Struct. 2013, 22, 095019. [CrossRef]
24. Cahill, P.; Nuallain, N.A.; Jackson, N.; Mathewson, A.; Karoumi, R.; Pakrashi, V. Energy Harvesting fromTrain-Induced Response in Bridges. J. Bridge Eng. 2014, 19, doi:10.1061/(ASCE)BE.1943-5592.0000608.[CrossRef]
25. Wang, J.; Shi, Z.; Xiang, H.; Song, G. Modeling on energy harvesting from a railway system using piezoelectrictransducers. Smart Mater. Struct. 2015, 24, 105017. [CrossRef]
26. Cahill, P.; O’Keeffe, R.; Jackson, N.; Mathewson, A.; Pakrashi, V. Structural Health Monitoring of ReinforcedConcrete Beam Using Piezoelectric Energy Harvesting System. In Proceedings of the 7th European Workshopon Structural Health Monitoring, La Cité Nantes, France, 8–11 July 2014; pp. 8–11.
27. Zhao, Z.; Yang, C. Master-slave multi-machine data transmission scheduling in city road managementsystem. In Proceedings of the International Conference on Advanced Computer Theory and Engineering,Chengdu, China, 20–22 August 2010; pp. 446–449.
28. Rhimi, M.; Lajnef, N.; Chatti, K.; Faridazar, F. A self-powered sensing system for continuous fatiguemonitoring of in-service pavements. Int. J. Pavement Res. Technol. 2012, 5, 303–310.
29. Guo, S.; Wang, F.; Yang, Y.; Xiao, B. Energy-Efficient Cooperative Transmission for Simultaneous WirelessInformation and Power Transfer in Clustered Wireless Sensor Networks. IEEE Trans. Commun. 2015,63, 4405–4417. [CrossRef]
30. Song, Z.; Ye, Q. Research and design of road traffic flow detection system. Adv. Mater. Res. 2014,945–949, 3291–3295. [CrossRef]
31. Izzo, R.; Tahmoressi, M. Use of the hamburg wheel-tracking device for evaluating moisture susceptibility ofhot-mix asphalt. Transp. Res. Rec. J. Transp. Res. Board. 1999, 1681, 76–85. [CrossRef]
32. Zhao, H. Natural frequency of asphalt pavement via finite element analysis. J. Transp. Inf. Saf. 2012, 30, 10–15.33. Denneman, E. Improved design procedures for asphalt pavements: Pavement temperature and load
frequency estimation. Climate 2013. No. AP-T248/13.34. Li, C. Road performance of common piezoelectric transducer for asphalt pavement energy harvesting.
Appl. Mech. Mater. 2015, 744–746, 1491–1494. [CrossRef]35. Mossi, K.M.; Selby, G.V.; Bryant, R.G. Thin-layer composite unimorph ferroelectric driver and sensor
properties. Mater. Lett. 1998, 35, 39–49. [CrossRef]36. Sodano, H.A.; Inman, D.J. A review of power harvesting from vibration using piezoelectric materials.
Shock Vibr. Dig. 2004, 36, 197–205. [CrossRef]

Sensors 2017, 17, 2207 24 of 24
37. Zhao, H.; Ling, J.; Yu, J. A comparative analysis of piezoelectric transducers for harvesting energy fromasphalt pavement. J. Ceram. Soc. Jpn. 2012, 120, 317–323. [CrossRef]
38. Zhao, H.; Yu, J.; Ling, J. Finite element analysis of cymbal piezoelectric transducers for harvesting energyfrom asphalt pavement. J. Ceram. Soc. Jpn. 2010, 118, 909–915. [CrossRef]
39. Meindl, J.D. Low power microelectronics: Retrospect and prospect. Proc. IEEE 1995, 83, 619–635. [CrossRef]40. Lajnef, N.; Rhimi, M.; Chatti, K.; Mhamdi, L.; Faridazar, F. Toward an Integrated Smart Sensing System and
Data Interpretation Techniques for Pavement Fatigue Monitoring. Comput.-Aided Civ. Infrastruct. Eng. 2011,26, 513–523. [CrossRef]
41. Guo, S.; Wang, C.; Yang, Y. Joint Mobile Data Gathering and Energy Provisioning in Wireless RechargeableSensor Networks. IEEE Trans. Mob. Comput. 2014, 13, 2836–2852. [CrossRef]
42. Erturk, A.; Inman, D.J. An experimentally validated bimorph cantilever model for piezoelectric energyharvesting from base excitations. Smart Mater. Struct. 2009, 18, 25009–25018. [CrossRef]
43. Lin, S.; Xu, J. Effect of the matching circuit on the electromechanical characteristics of sandwichedpiezoelectric transducers. Sensors 2017, 17, 329. [CrossRef] [PubMed]
44. Cha, Y.; Chae, W.; Kim, H.; Walcott, H.; Peterson, S.D.; Porfiri, M. Energy harvesting from a piezoelectricbiomimetic fish tail. Renew. Energy 2016, 86, 449–458. [CrossRef]
45. Moure, A.; Rodríguez, M.I.; Rueda, S.H.; Gonzalo, A.; Rubio-Marcos, F.; Cuadros, D.U.; Pérez-Lepe, A.;Fernández, J.F. Feasible integration in asphalt of piezoelectric cymbals for vibration energy harvesting.Energy Convers. Manag. 2016, 112, 246–253. [CrossRef]
46. Li, F.; Xiang, T.; Chi, Z.; Luo, J.; Tang, L.; Zhao, L.; Yang, Y. Powering indoor sensing with airflows: A trinityof energy harvesting, synchronous duty-cycling, and sensing. In Proceedings of the 11th ACM Conferenceon Embedded Networked Sensor Systems, New York, NY, USA, 11–15 November 2013; p. 73.
47. Khazanovich, L.; Velasquez, R.; Nesvijski, E. Evaluation of top-down cracks in asphalt pavements by using aself-calibrating ultrasonic technique. Transp. Res. Rec. J. Transp. Res. Board 2005, 1940, 63–68. [CrossRef]
48. Zaghloul, S.; He, Z.; Vitillo, N.; Kerr, J. Project Scoping Using Falling Weight Deflectometer Testing:New Jersey Experience. Transp. Res. Rec. J. Transp. Res. Board 1998, 1643, 34–43. [CrossRef]
49. Long, H.; Liu, Y.; Wang, Y.; Dick, R.P.; Yang, H. Battery allocation for wireless sensor networklifetime maximization under cost constraints. In Proceedings of the 2009 International Conference onComputer-Aided Design, San Jose, CA, USA, 2–5 November 2009; pp. 705–712.
50. Nataf, E.; Festor, O. Online estimation of battery lifetime for wireless sensors network. Comput. Sci. Netw.Internet Archit. 2012.
51. Damjanovic, D. Stress and frequency dependence of the direct piezoelectric effect in ferroelectric ceramics.J. Appl. Phys. 1997, 82, 1788–1797. [CrossRef]
52. Cochran, W. Cochran. Crystal stability and the theory of ferroelectricity part II. Piezoelectric crystals.Adv. Phys. 1961, 3, 412.
53. Caliò, R.; Rongala, U.B.; Camboni, D.; Milazzo, M.; Stefanini, C.; De Petris, G.; Oddo, C.M. Piezoelectricenergy harvesting solutions. Sensors 2014, 14, 4755–4790. [CrossRef] [PubMed]
54. Shu, Y.C.; Lien, I.C. Analysis of power output for piezoelectric energy harvesting systems.Smart Mater. Struct. 2006, 15, 1499. [CrossRef]
55. Badel, A.; Guyomar, D.; Lefeuvre, E.; Richard, C. Piezoelectric energy harvesting using a synchronizedswitch technique. J. Intell. Mater. Syst. Struct. 2006, 17, 831–839. [CrossRef]
56. Lefeuvre, E.; Badel, A.; Richard, C.; Petit, L.; Guyomar, D. A comparison between several vibration-poweredpiezoelectric generators for standalone systems. Sens. Actuators A 2006, 126, 405–416. [CrossRef]
57. Lien, I.C.; Shu, Y.C.; Wu, W.J.; Shiu, S.M.; Lin, H.C. Revisit of series-SSHI with comparisons to otherinterfacing circuits in piezoelectric energy harvesting. Smart Mater. Struct. 2010, 19, 125009. [CrossRef]
58. Lallart, M.; Garbuio, L.; Petit, L.; Richard, C.; Guyomar, D. Double synchronized switch harvesting (DSSH):A new energy harvesting scheme for efficient energy extraction. IEEE Trans. Ultrason. Ferroelectr. Freq. Control.2008, 55, 2119. [CrossRef] [PubMed]
59. Wang, T.C.; Han, X.L. Fracture mechanics of piezoelectric materials. Int. J. Fract. 1999, 98, 15–35. [CrossRef]
© 2017 by the authors. Licensee MDPI, Basel, Switzerland. This article is an open accessarticle distributed under the terms and conditions of the Creative Commons Attribution(CC BY) license (http://creativecommons.org/licenses/by/4.0/).