Embed Size (px)
DESCRIPTION
EPA Sector Notebook
Citation preview
Sector Notebook Data Refresh - 1997 Sector Notebook Project
EPA/310-R-97-010
EPA Office of Compliance Sector Notebook Project:
Sector Notebook Data Refresh - 1997Most current data available through 8/97
May 1998
Office of ComplianceOffice of Enforcement and Compliance Assurance
U.S. Environmental Protection Agency401 M St., SW
Washington, DC 20460

Sector Notebook Data Refresh - 1997 Sector Notebook Project
Sector Notebook Project May 1998ii
This report is an auxiliary part of the Sector Notebook Series, which is being published by the U.S.Environmental Protection Agency (EPA). The Notebook Series provides information of generalinterest regarding environmental issues associated with specific industrial sectors. The documentswere developed under contract by Abt Associates (Cambridge, MA), Science ApplicationsInternational Corporation (McLean, VA), and Booz-Allen & Hamilton, Inc. (McLean, VA). Thispublication may be purchased from the Superintendent of Documents, U.S. Government PrintingOffice. A listing of available Sector Notebooks and document numbers is included on the followingpage. For the most up to date list and contact person visit the notebook website mentioned below.
All telephone orders should be directed to:
Superintendent of DocumentsU.S. Government Printing OfficeWashington, DC 20402(202) 512-1800FAX (202) 512-22508:00 a.m. to 4:30 p.m., EST, M-F
Using the form provided at the end of this document, all mail orders should be directed to:
U.S. Government Printing OfficeP.O. Box 371954Pittsburgh, PA 15250-7954
Complimentary volumes are available to certain groups or subscribers, such as public and academiclibraries, Federal, State, and local governments, and the media from EPA’s National Center forEnvironmental Publications and Information at (800) 490-9198. When ordering, use the documentpublication numbers on page iv. For further information, and for answers to questions pertaining tothese documents, please refer to the contact names and numbers provided within this volume.
Electronic versions of all Sector Notebooks are available via Internet on the Enviro$en$e WorldWide Web at http://www.epa.gov/oeca/sector/index.html. Enviro$ense is a free, public,environmental exchange system operated by EPA's Office of Enforcement and Compliance Assuranceand Office of Research and Development. The Network allows regulators, the regulated community,technical experts, and the general public to share information regarding: pollution prevention andinnovative technologies; environmental enforcement and compliance assistance; laws, executiveorders, regulations, and policies; points of contact for services and equipment; and other relatedtopics. The Network welcomes receipt of environmental messages, information, and data from anypublic or private person or organization. To access this Notebook through the Web, set your webbrowser to the aforementioned web address, and select the desired Notebook; or point and click yourway there as follows:

Sector Notebook Data Refresh - 1997 Sector Notebook Project
Sector Notebook Project May 1998iii
1) set your browser to our primary web address: http://www.epa.gov/oeca;2) select “Industry and Govt. Sectors”;3) select “EPA Sector Notebooks”; and4) select the desired sector and file format.
Direct technical questions to the “Feedback” button on the bottom of the web page.
Cover photographs courtesy of: top: Saturn Motors, Springfield, TN (special thanks to Jennifer Graham)middle left: Vista Chemicals, Baltimore, MD (special thanks to Dave Mahler). Photograph by
Steve Delaney, EPAmiddle: Gates Rubber Company, Denver, COmiddle right: Mid-Atlantic Finishing, Capital Heights, MD. Photograph by Steve Delaney, EPAbottom left: US Government Printing Office (special thanks to Barbara Shaw). Photograph by
Steve Delaney, EPAbottom right: Photograph by Steve Delaney, EPA
Sector Notebook Data Refresh - 1997 Sector Notebook Project
Sector Notebook Project May 1998iv
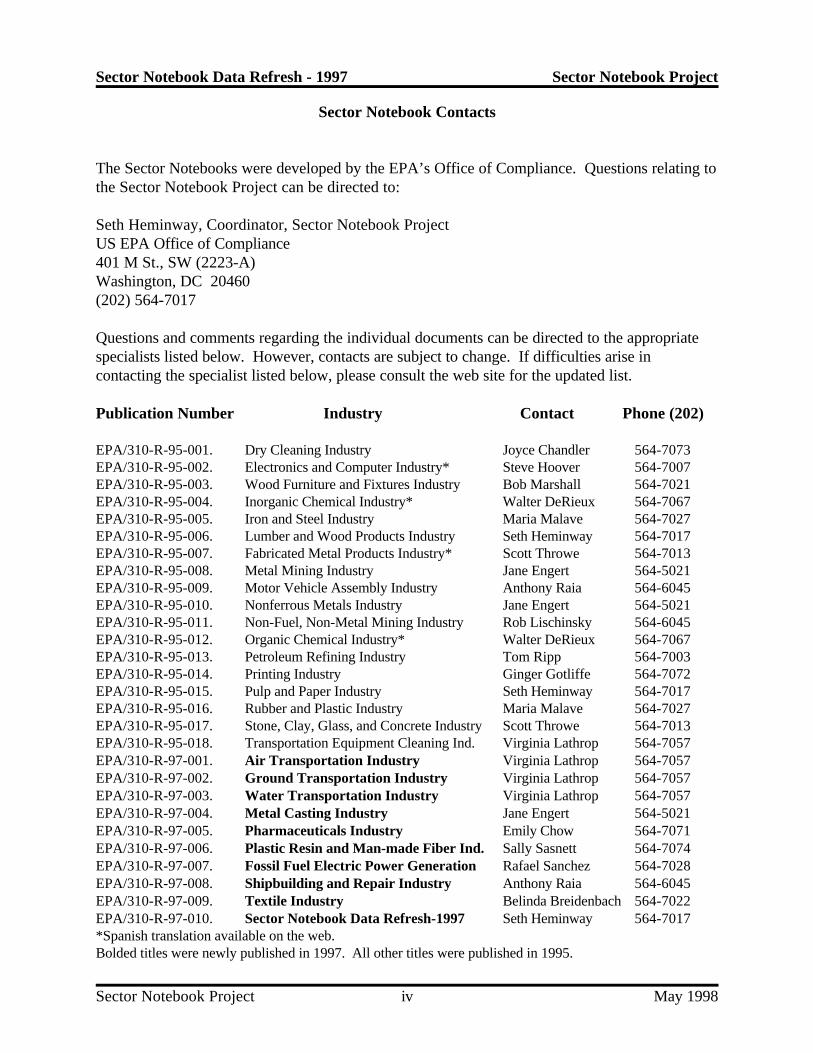
Sector Notebook Contacts
The Sector Notebooks were developed by the EPA’s Office of Compliance. Questions relating tothe Sector Notebook Project can be directed to:
Seth Heminway, Coordinator, Sector Notebook ProjectUS EPA Office of Compliance401 M St., SW (2223-A)Washington, DC 20460(202) 564-7017
Questions and comments regarding the individual documents can be directed to the appropriatespecialists listed below. However, contacts are subject to change. If difficulties arise incontacting the specialist listed below, please consult the web site for the updated list.
Publication Number Industry Contact Phone (202)
EPA/310-R-95-001. Dry Cleaning Industry Joyce Chandler 564-7073EPA/310-R-95-002. Electronics and Computer Industry* Steve Hoover 564-7007EPA/310-R-95-003. Wood Furniture and Fixtures Industry Bob Marshall 564-7021EPA/310-R-95-004. Inorganic Chemical Industry* Walter DeRieux 564-7067EPA/310-R-95-005. Iron and Steel Industry Maria Malave 564-7027EPA/310-R-95-006. Lumber and Wood Products Industry Seth Heminway 564-7017EPA/310-R-95-007. Fabricated Metal Products Industry* Scott Throwe 564-7013EPA/310-R-95-008. Metal Mining Industry Jane Engert 564-5021EPA/310-R-95-009. Motor Vehicle Assembly Industry Anthony Raia 564-6045EPA/310-R-95-010. Nonferrous Metals Industry Jane Engert 564-5021EPA/310-R-95-011. Non-Fuel, Non-Metal Mining Industry Rob Lischinsky 564-6045EPA/310-R-95-012. Organic Chemical Industry* Walter DeRieux 564-7067EPA/310-R-95-013. Petroleum Refining Industry Tom Ripp 564-7003EPA/310-R-95-014. Printing Industry Ginger Gotliffe 564-7072EPA/310-R-95-015. Pulp and Paper Industry Seth Heminway 564-7017EPA/310-R-95-016. Rubber and Plastic Industry Maria Malave 564-7027EPA/310-R-95-017. Stone, Clay, Glass, and Concrete Industry Scott Throwe 564-7013EPA/310-R-95-018. Transportation Equipment Cleaning Ind. Virginia Lathrop 564-7057EPA/310-R-97-001. Air Transportation Industry Virginia Lathrop 564-7057EPA/310-R-97-002. Ground Transportation Industry Virginia Lathrop 564-7057EPA/310-R-97-003. Water Transportation Industry Virginia Lathrop 564-7057EPA/310-R-97-004. Metal Casting Industry Jane Engert 564-5021EPA/310-R-97-005. Pharmaceuticals Industry Emily Chow 564-7071EPA/310-R-97-006. Plastic Resin and Man-made Fiber Ind. Sally Sasnett 564-7074EPA/310-R-97-007. Fossil Fuel Electric Power Generation Rafael Sanchez 564-7028EPA/310-R-97-008. Shipbuilding and Repair Industry Anthony Raia 564-6045EPA/310-R-97-009. Textile Industry Belinda Breidenbach 564-7022EPA/310-R-97-010. Sector Notebook Data Refresh-1997 Seth Heminway 564-7017*Spanish translation available on the web.Bolded titles were newly published in 1997. All other titles were published in 1995.

Sector Notebook Data Refresh - 1997 Sector Notebook Project
Sector Notebook Project May 1998v
TABLE OF CONTENTS
LIST OF ACRONYMS . . . . . . . . . . . . . . . . . . . . . . . . . . . . . . . . . . . . . . . . . . . . . . . . . . . . . . vii
I. INTRODUCTION TO THE SECTOR NOTEBOOK PROJECT . . . . . . . . . . . . . . . . . . . . . 1
II. CROSS-SECTOR COMPARISONS . . . . . . . . . . . . . . . . . . . . . . . . . . . . . . . . . . . . . . . . . . 5II.A. Toxics Release Inventory (TRI) . . . . . . . . . . . . . . . . . . . . . . . . . . . . . . . . . . . . . . 5II.B. Aerometric Information Retrieval System (AIRS) . . . . . . . . . . . . . . . . . . . . . . . . . 9II.C. Integrated Data for Enforcement Analysis (IDEA) System . . . . . . . . . . . . . . . . . 13
III. INDUSTRY SECTOR-SPECIFIC DATA . . . . . . . . . . . . . . . . . . . . . . . . . . . . . . . . . . . . 23Metal Mining . . . . . . . . . . . . . . . . . . . . . . . . . . . . . . . . . . . . . . . . . . . . . . . . . . . . . . . A-1Non-Fuel, Non-Metal Mining . . . . . . . . . . . . . . . . . . . . . . . . . . . . . . . . . . . . . . . . . . . B-1Textiles . . . . . . . . . . . . . . . . . . . . . . . . . . . . . . . . . . . . . . . . . . . . . . . . . . . . . . . . . . . C-1Lumber and Wood Products . . . . . . . . . . . . . . . . . . . . . . . . . . . . . . . . . . . . . . . . . . . . D-1Wood Furniture and Fixtures . . . . . . . . . . . . . . . . . . . . . . . . . . . . . . . . . . . . . . . . . . . E-1Pulp and Paper . . . . . . . . . . . . . . . . . . . . . . . . . . . . . . . . . . . . . . . . . . . . . . . . . . . . . . F-1Printing . . . . . . . . . . . . . . . . . . . . . . . . . . . . . . . . . . . . . . . . . . . . . . . . . . . . . . . . . . . G-1Inorganic Chemicals . . . . . . . . . . . . . . . . . . . . . . . . . . . . . . . . . . . . . . . . . . . . . . . . . . H-1Plastic Resin and Man-made Fiber . . . . . . . . . . . . . . . . . . . . . . . . . . . . . . . . . . . . . . . I-1Pharmaceuticals . . . . . . . . . . . . . . . . . . . . . . . . . . . . . . . . . . . . . . . . . . . . . . . . . . . . . J-1Organic Chemicals . . . . . . . . . . . . . . . . . . . . . . . . . . . . . . . . . . . . . . . . . . . . . . . . . . . K-1Petroleum Refining . . . . . . . . . . . . . . . . . . . . . . . . . . . . . . . . . . . . . . . . . . . . . . . . . . L-1Rubber and Plastic . . . . . . . . . . . . . . . . . . . . . . . . . . . . . . . . . . . . . . . . . . . . . . . . . . M-1Stone, Clay, Glass and Concrete . . . . . . . . . . . . . . . . . . . . . . . . . . . . . . . . . . . . . . . . . N-1Iron and Steel . . . . . . . . . . . . . . . . . . . . . . . . . . . . . . . . . . . . . . . . . . . . . . . . . . . . . . O-1Metal Castings . . . . . . . . . . . . . . . . . . . . . . . . . . . . . . . . . . . . . . . . . . . . . . . . . . . . . . P-1Nonferrous Metals . . . . . . . . . . . . . . . . . . . . . . . . . . . . . . . . . . . . . . . . . . . . . . . . . . . Q-1Fabricated Metal Products . . . . . . . . . . . . . . . . . . . . . . . . . . . . . . . . . . . . . . . . . . . . . R-1Electronics and Computers . . . . . . . . . . . . . . . . . . . . . . . . . . . . . . . . . . . . . . . . . . . . . S-1Motor Vehicle Assembly . . . . . . . . . . . . . . . . . . . . . . . . . . . . . . . . . . . . . . . . . . . . . . T-1Shipbuilding and Repair . . . . . . . . . . . . . . . . . . . . . . . . . . . . . . . . . . . . . . . . . . . . . . . U-1Ground Transportation . . . . . . . . . . . . . . . . . . . . . . . . . . . . . . . . . . . . . . . . . . . . . . . . V-1Water Transportation . . . . . . . . . . . . . . . . . . . . . . . . . . . . . . . . . . . . . . . . . . . . . . . . W-1Air Transportation . . . . . . . . . . . . . . . . . . . . . . . . . . . . . . . . . . . . . . . . . . . . . . . . . . . X-1Fossil Fuel Electric Power . . . . . . . . . . . . . . . . . . . . . . . . . . . . . . . . . . . . . . . . . . . . . Y-1Dry Cleaning . . . . . . . . . . . . . . . . . . . . . . . . . . . . . . . . . . . . . . . . . . . . . . . . . . . . . . . Z-1
Sector Notebook Data Refresh - 1997 Sector Notebook Project
Sector Notebook Project May 1998vi
Page vi intentionally left blank.

Sector Notebook Data Refresh - 1997 Sector Notebook Project
Sector Notebook Project May 1998vii
LIST OF ACRONYMS
AFS - AIRS Facility Subsystem (CAA database)AIRS - Aerometric Information Retrieval System (CAA database)CAA - Clean Air ActCERCLA - Comprehensive Environmental Response, Compensation and Liability Act
(Superfund)CERCLIS - CERCLA Information SystemCFCs - ChlorofluorocarbonsCO - Carbon Monoxide CWA - Clean Water ActD&B - Dun and Bradstreet Marketing IndexEPA - United States Environmental Protection AgencyEPCRA - Emergency Planning and Community Right-to-Know Act FIFRA - Federal Insecticide, Fungicide, and Rodenticide ActFINDS - Facility Indexing SystemHAPs - Hazardous Air Pollutants (CAA)HSDB - Hazardous Substances Data Bank IDEA - Integrated Data for Enforcement AnalysisNAAQS - National Ambient Air Quality Standards (CAA)NCDB - National Compliance Database (for TSCA, FIFRA, EPCRA)NESHAP - National Emission Standards for Hazardous Air PollutantsNOV - Notice of Violation NO - Nitrogen Oxide X
NPDES - National Pollution Discharge Elimination System (CWA)NPL - National Priorities List (CERCLA)NSPS - New Source Performance Standards (CAA)OAR - Office of Air and RadiationOECA - Office of Enforcement and Compliance AssuranceOPA - Oil Pollution ActOPPTS - Office of Prevention, Pesticides, and Toxic SubstancesOSHA - Occupational Safety and Health Administration OSW - Office of Solid WasteOSWER - Office of Solid Waste and Emergency ResponseOW - Office of WaterP2 - Pollution PreventionPCS - Permit Compliance System (CWA Database)POTW - Publicly Owned Treatments Works PPA - Pollution Prevention ActRCRA - Resource Conservation and Recovery ActRCRIS - RCRA Information SystemSARA - Superfund Amendments and Reauthorization Act SDWA - Safe Drinking Water ActSEPs - Supplemental Environmental Projects

Sector Notebook Data Refresh - 1997 Sector Notebook Project
Sector Notebook Project May 1998viii
SIC - Standard Industrial Classification SO - Sulfur OxidesX
TRI - Toxics Release InventoryTRIS - Toxics Release Inventory System TCRIS - Toxic Chemical Release Inventory SystemTSCA - Toxic Substances Control ActUIC - Underground Injection Control (SDWA)UST - Underground Storage Tanks (RCRA)VOCs - Volatile Organic Compounds

Sector Notebook Data Refresh - 1997 Sector Notebook Project
Sector Notebook Project May 19981
SECTOR NOTEBOOK DATA REFRESH - 1997
I. INTRODUCTION TO THE SECTOR NOTEBOOK PROJECT
Environmental policies based upon comprehensive analysis of air, water andland pollution (such as economic sector, and community-based approaches)are becoming an important supplement to traditional single-media approachesto environmental protection. Environmental regulatory agencies are beginningto embrace comprehensive, multi-statute solutions to facility permitting,compliance assurance, education/outreach, research, and regulatorydevelopment issues. The central concepts driving the new policy direction arethat pollutant releases to each environmental medium (air, water and land)affect each other, and that environmental strategies must actively identify andaddress these interrelationships by designing policies for the "whole" facility.One way to achieve a whole facility focus is to design environmental policiesfor similar industrial facilities. By doing so, environmental concerns that arecommon to the manufacturing of similar products can be addressed in acomprehensive manner. Recognition of the need to develop the industrial?sector-based” approach within the EPA Office of Compliance led to thecreation of the Sector Notebook Series.
The Sector Notebook Project was initiated by the Office of Compliance withinthe Office of Enforcement and Compliance Assurance (OECA) to provide itsstaff and managers with summary information on specific industrial sectors.As other EPA offices, states, the regulated community, environmental groups,and the public became interested in this project, the scope of the originalproject was expanded. The ability to design comprehensive, common senseenvironmental protection measures for specific industries is dependent onknowledge of several interrelated topics. For the purposes of this project, thekey elements chosen for inclusion are: general industry information (economicand geographic); a description of industrial processes; pollution outputs;pollution prevention opportunities; Federal statutory and regulatoryframework; compliance history; and a description of partnerships that havebeen formed between regulatory agencies, the regulated community and thepublic.
Industry sectors profiled in the Sector Notebook Project are defined in termsof the Standard Industrial Classification (SIC) System codes (as revised in1987) which were established by the Office of Management and Budget(OMB) to track the flow of goods and services within the economy. SICcodes associated with each of the sectors included in this document can befound in the key at the bottom of page 5. More detailed descriptions of thescope of each industry sector can be found in Section II.A. of each SectorNotebook. OMB is in the process of changing the SIC code system to asystem based on similar production processes called the North American

Sector Notebook Data Refresh - 1997 Sector Notebook Project
One Sector Notebook published in 1995, Profile of the Transportation Equipment Cleaning Industry, did not contain1
pollutant release and compliance and enforcement data. Therefore, this sector is not included in this document.
Sector Notebook Project May 19982
Industrial Classification System (NAICS). The 1987 SIC codes and the newNAICS codes can be accessed and cross-referenced at www.census.gov/naics.
Purpose of the Data Refresh
The first set of 18 Sector Notebooks were published in 1995. Within a yearover 45,000 copies were distributed and significant interest was expressed fornotebooks covering additional industry sectors. To meet this demand, asecond set of Sector Notebooks was published in 1997 profiling additionalindustry sectors. More sector notebooks are also under development and willbe available by early 1999. Check the Notebook website for the most up todate material (see p.ii for web address).
Much of the Toxic Release Inventory (TRI) and compliance and enforcementdata presented in the first set of Sector Notebooks is two years older than thatpresented in the second set of documents published in 1997. Due to constantlychanging economic, technological, and regulatory factors, pollutant releaseand compliance and enforcement data for an industry sector can changesignificantly from year-to-year. This refresh document was primarilydeveloped to update the time sensitive data presented in the original set ofSector Notebooks.
In addition, the TRI and compliance and enforcement data included with theSector Notebooks published in 1997 are presented in this document. Aparticular strength of the Sector Notebooks has been the consistentorganization and presentation of data in each document, allowing comparisonsbetween industry sectors based on the same criteria. Therefore, the datapresented in this document cover both the original set of 17 sectors and the1
second set of nine sectors published in 1997. The same methods were used tocollect the data for all sectors presented here.
Readers of the Sector Notebook Series may also be interested in EPA’sSector Facility Indexing Project (SFIP) which is available through EPA’swebsite at www.epa.gov/oeca/sfi. The SFIP is a compilation of individualfacility environmental release and compliance data for five key industries: ironand steel, primary non-ferrous metals, petroleum refining, pulp manufacturing,automobile assembly. Although similar types of data may be presented, theSFIP and the Sector Notebook Project are separate projects. Much of the datacollected for this Data Refresh were collected prior to the completion of SFIP.Some data definitions and collection methods presented in SFIP may not bereflected in this document.
Sector Notebook Data Refresh - 1997 Sector Notebook Project
Sector Notebook Project May 19983
Providing Comments
If you have any comments on the existing notebooks, or if you would like toprovide additional information, please send a hard copy and computer disk tothe EPA Office of Compliance, Sector Notebook Project, 401 M St., SW(2223-A), Washington, DC 20460. Comments can also be sent via the webpage or to [email protected].

Sector Notebook Data Refresh - 1997 Sector Notebook Project
Sector Notebook Project May 19984
Page 4 intentionally left blank.

Sector Notebook Data Refresh - 1997 Sector Notebook Project
TRI data is only presented for those industry sectors covered by the Sector Notebook Project and which were required2
to report to TRI in the 1995 reporting year.
Sector Notebook Project May 19985
II. CROSS-SECTOR COMPARISONS
This section contains TRI, AIRS, and IDEA data presentations comparing thesectors covered by the Sector Notebook Project . The graph and tables2
update those presented in the original set of 17 Sector Notebooks with themost recent available data and the additional industry sectors covered in theSector Notebooks published in 1997.
II.A. Toxics Release Inventory (TRI)
The following information is presented as a comparison of pollutant releaseand transfer data across industrial categories. It is provided to give a generalsense of the relative scale of TRI releases and transfers within each sectorrequired to report to TRI and profiled under this project. Please note that thefollowing figures and table do not contain releases and transfers for industrialcategories that are not included in this project, and thus cannot be used todraw conclusions regarding the total release and transfer amounts that arereported to TRI. Similar information is available within the annual TRI PublicData Release Book. (See directions for obtaining this on page 20.)
Figure 1 is a graphical representation of a summary of the 1995 TRI data forsectors profiled by the Sector Notebook Project and which were required toreport to TRI in the 1995 reporting year. The bar graph presents the totalTRI releases and total transfers on the vertical axis. Figure 2 presents therelative percentage of total TRI chemicals (releaseses and transfers)contributed by each of these sectors. The graphs are based on the data shownin Table 1 and are meant to facilitate comparisons between the relativeamounts of releases, transfers, and releases per facility both within andbetween these sectors. The reader should note that differences in theproportion of facilities captured by TRI exist between industry sectors. Thiscan be a factor of poor SIC code matching and relative differences in thenumber of facilities reporting to TRI from the various sectors. Within somesectors, the majority of facilities are not subject to TRI reporting because theyare not considered manufacturing facilities, they have fewer than 10employees, or because they are below TRI reporting thresholds. For example,many facilities in the printing industry have fewer than 10 employees andtherefore are not required to report to TRI. The 1995 TRI data for theprinting industry presented in this document is based on reports from 262facilities, yet the printing industry universe has been put at approximately70,000 facilities by industry sources; the TRI data covers less than onepercent of the industry. As a result, a significant portion of printing industrychemical releases and transfers are not captured by TRI.

0
100
200
300
400
500
60022 24 25
2611
-263
1
2711
-278
9
2812
-281
9
2821
, 282
3, 2
824
2833
, 283
4
2861
-286
9
2911 30 32 331
332,
336
333,
334 34 36 371
3731
SIC Range
To
tal P
ou
nd
s (m
illio
ns)
Total Releases Total Transfers
Sector Notebook Data Refresh - 1997 Sector Notebook Project
Sector Notebook Project May 19986
Figure 1: Summary of TRI Releases and Transfers by Industry
Source: USEPA 1995 Toxics Release Inventory Database.
Key to Standard Industrial Classification (SIC) CodesSIC Range Industry Sector SIC Range Industry Sector SIC Range Industry Sector
22 Textiles 2833, 2834 Pharmaceuticals 332, 336 Metal Casting
24 Lumber and Wood 2861-2869 Organic Chem. Mfg. 333, 334 Nonferrous MetalsProducts
25 Furniture and Fixtures 2911 Petroleum Refining 34 Fabricated Metals
2611-2631 Pulp and Paper 30 Rubber and Misc. Plastics 36 Electronic Equip. and Comp.
2711-2789 Printing 32 Stone, Clay, and Concrete 371 Motor Vehicles, Bodies,Parts, and Accessories
2812-2819 Inorganic Chemical 331 Iron and Steel 3731 Shipbuilding and RepairManufacturing
2821, 2823, Plastic Resins and 2824 Man-made Fibers

Pulp and PaperInorganic Chem.
Mfg.
Pharmaceuticals
Organic Chemical Mfg.
Rubber and Misc. Plastics
Iron and Steel
Nonferrous Metals
Fabricated Metals
Other
Petroleum Refining
Motor Vehicles, Bodies, Parts, and
Accessories
Metal Castings
Plastic Resins and Man-made Fibers
Sector Notebook Data Refresh - 1997 Sector Notebook Project
Sector Notebook Project May 19987
Figure 2: 1995 TRI Total Releases and Transfers by Industry Sector
Source: USEPA 1995 Toxics Release Inventory Database.
Other (Industries with releases less than 100 million pounds):
Textiles Stone, Clay, and ConcreteLumber and Wood Products Electronic Equipment and ComputersFurniture and Fixtures Shipbuilding and RepairPrinting

Sector Notebook Data Refresh - 1997 Sector Notebook Project
Sector Notebook Project May 19988
Tab
le 1
: T
oxic
s R
elea
se I
nven
tory
Dat
a fo
r Se
lect
ed I
ndus
trie
sT
RI
Rel
ease
sT
RI
Tra
nsfe
rs
Indu
stry
Sec
tor
SIC
Ran
ge
# T
RI
Fac
iliti
esT
otal
Rel
ease
s(m
illio
n lb
s.)
Ave
. Rel
ease
spe
r F
acili
ty(p
ound
s)
Tot
alT
rans
fers
(mill
ion
lbs.
)
Ave
. Tra
ns.
per
Fac
ility
(pou
nds)
Tot
al R
elea
ses
+Tra
nsfe
rs(m
illio
n lb
s.)
Ave
rage
Rel
ease
s +
Tra
nsfe
rs p
er F
acili
ty(p
ound
s)
Tex
tiles
2233
917
.853
,000
7.0
21,
000
24.8
74,0
00
Lum
ber
and
Woo
d Pr
oduc
ts24
397
30.0
76,0
004.
110
,000
34.1
86,0
00
Furn
iture
and
Fix
ture
s25
336
37.6
112,
000
9.9
29,0
0047
.514
1,00
0
Pulp
and
Pap
er26
11-2
631
305
232.
676
3,00
056
.518
5,00
028
9.1
948,
000
Prin
ting
2711
-278
926
233
.912
9,00
010
.440
,000
44.3
169,
000
Inor
gani
c C
hem
. Mfg
.28
12-2
819
413
60.7
468,
000
21.7
191,
000
438.
565
9,00
0
Plas
tic R
esin
s an
d M
an-m
ade
Fibe
rs28
21,2
823,
2824
410
64.1
156,
000
192.
446
9,00
025
6.5
625,
000
Phar
mac
eutic
als
2833
, 283
420
029
.915
0,00
014
7.2
736,
000
177.
188
6,00
0
Org
anic
Che
mic
al M
fg.
2861
-286
940
214
8.3
598,
000
208.
663
1,00
094
6.8
1,22
9,00
0
Petr
oleu
m R
efin
ing
2911
180
73.8
410,
000
29.2
162,
000
103.
057
2,00
0
Rub
ber
and
Mis
c. P
last
ics
301,
947
143.
173
,000
102.
653
,000
245.
712
6,00
0
Ston
e, C
lay,
and
Con
cret
e32
623
43.9
70,0
0031
.851
,000
75.7
121,
000
Iron
and
Ste
el33
142
390
.721
4,00
051
3.9
1,21
5,00
060
4.6
1,42
9,00
0
Met
al C
astin
g33
2, 3
3665
436
.055
,000
73.9
113,
000
109.
916
8,00
0
Non
ferr
ous
Met
als
333,
334
282
201.
771
5,00
016
458
2,00
036
5.7
1,29
7,00
0
Fabr
icat
ed M
etal
s34
2,67
683
.531
,000
350.
513
1,00
043
4.0
162,
000
Ele
ctro
nic
Equ
ip. a
nd C
omp.
3640
74.
311
,000
68.8
169,
000
73.1
180,
000
Mot
or V
ehic
les,
Bod
ies,
Par
ts,
and
Acc
esso
ries
371
754
79.3
105,
000
194
257,
000
273.
336
2,00
0
Ship
build
ing
3731
432.
456
,000
4.1
95,0
006.
515
1,00
0
Sect
or N
oteb
ook
Tot
alN
A11
,053
1,41
3.6
128,
000
2,19
0.6
198,
000
4,55
0.2
412,
000
1995
TR
I T
otal
NA
21,9
512,
208.
710
1,00
03,
534.
816
1,00
05,
743.
526
2,00
0
Sour
ce: U
S E
PA
Tox
ics
Rel
ease
Inv
ento
ry D
atab
ase,
199
5.
Sector Notebook Data Refresh - 1997 Sector Notebook Project
Sector Notebook Project May 19989
II.B. Aerometric Information Retrieval System (AIRS)
The toxic chemical release data obtained from TRI allows comparisons acrossyears and industry sectors. However, reported chemicals are limited to theapproximately 600 TRI chemicals. A large portion of the emissions frommanufacturing facilities, therefore, are not captured by TRI. The EPA Officeof Air Quality Planning and Standards has compiled air pollutant emissionfactors for determining the total air emissions of priority pollutants (e.g.,VOCs, SOx, NOx, CO, particulates, etc.) from many sources. However,AIRS data, like TRI data, are affected by threshold quantities that limit thenumber of sources captured. The pollutant contribution from minor sourcesis not captured.
AIRS contains a wide range of information related to stationary sources of airpollution, including the emissions of a number of air pollutants which may beof concern within a particular industry. With the exception of volatile organiccompounds (VOCs), there is little overlap with the TRI chemicals reportedabove. Table 2 summarizes annual releases (from the industries for which aSector Profile was prepared) of carbon monoxide (CO), nitrogen dioxide(NO ), total particulate matter (PT), particulate matter of 10 microns or less,2
a subset of PT, (PM10), sulfur dioxide (SO ), and volatile organic compounds2
(VOCs).
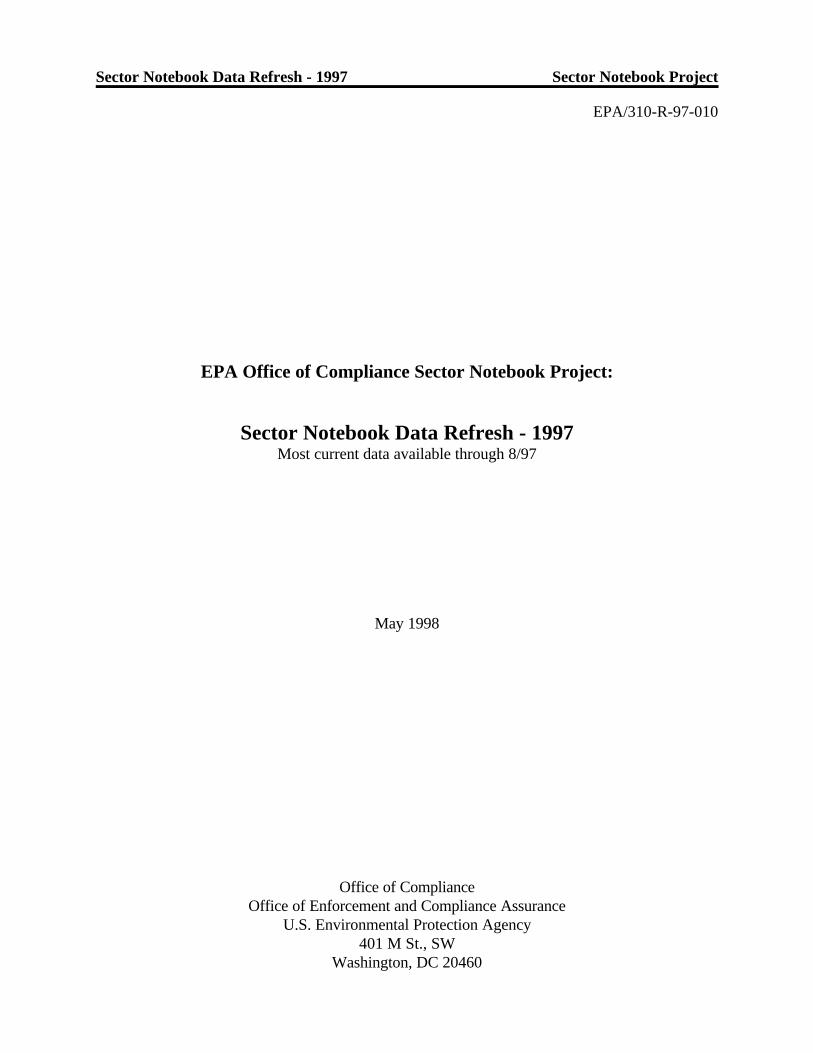
Figure 3 is a graphical representation of a summary of AIRS data for selectedsectors profiled by the Sector Notebook Project. AIRS data are collectedonly for stationary sources; thus, the emissions reported by the AirTransportation, Water Transportation, and Ground Transportation industriesare limited to the facilities supporting those industries and do not includeemissions from their respective mobile sources. The bar graph presents thereleases of five pollutants (not including PM10) on the vertical axis. Thegraph is based on the data shown in Table 2 and is meant to facilitatecomparisons between the relative amounts of releases of the pollutants bothwithin and between these sectors.

0 5 0 1 0 0 1 5 0 2 0 0 2 5 0 3 0 0 3 5 0 4 0 0 4 5 0
1 0
1 4
2 2
2 4
2 5
2 6 1 1 - 2 6 3 1
2 7 1 1 - 2 7 8 9
2 8 1 2 - 2 8 1 9
2 8 2 1 , 2 8 2 3 , 2 8 2 4
2 8 3 3 , 2 8 3 4
2 8 6 1 - 2 8 6 9
2 9 1 1
3 0
3 2
3 3 1
3 3 2 , 336
3 3 3 , 334
3 4
3 6
3 7 1
3 7 3 1
4 0 ,42 ,46 ,49
4 4
4 5
4 9 1 1
7 2 1
SIC
Ran
ge
Total Releases (billions of pounds)
V O C
SO2
PT
N O 2
CO
5 8 4
5 3 5
5 9 2
9 8 2
5 9 4
5 , 6 6 1
7 1 91 3 ,477
Sector Notebook Data Refresh - 1997 Sector Notebook Project
Sector Notebook Project May 199810
Figure 3: Summary of AIRS Releases by Industry*
*Arrows indicate values which overshadow the majority of industry releases. Actual release quantities (in billions ofpounds) for each shortened bar are adjacent to their corresponding arrows. Thus, the bars with arrows are not to scale.

Sector Notebook Data Refresh - 1997 Sector Notebook Project
Sector Notebook Project May 199811
Key to Standard Industrial Classification (SIC) Codes SIC Range Industry Sector SIC Range Industry Sector SIC Range Industry Sector
10 Metal Mining 2833, 2834 Pharmaceuticals 34 Fabricated Metals
14 Non-Fuel, Non-Metal 2861-2869 Organic Chem. Mfg. 36 Electronic Equip. and Comp.Mining
22 Textiles 2911 Petroleum Refining 371 Motor Vehicles, Bodies,Parts, and Accessories
24 Lumber and Wood 30 Rubber and Misc. Plastics 3731 Shipbuilding and RepairProducts
25 Furniture and Fixtures 32 Stone, Clay, and Concrete 40,42,46,49 Ground Transportation
2611-2631 Pulp and Paper 331 Iron and Steel 44 Water Transportation
2711-2789 Printing 332, 336 Metal Casting 45 Air Transportation
2812-2819 Inorganic Chemical 333, 334 Nonferrous Metals 721 Dry CleaningManufacturing
2821, 2823, Plastic Resins and2824 Manmade Fibers

Sector Notebook Data Refresh - 1997 Sector Notebook Project
Sector Notebook Project May 199812
Table 2: Air Pollutant Releases by Industry Sector (tons/year)
Industry Sector CO NO PM10 PT SO VOC2 2
Metal Mining 4,951 49,252 21,732 9,478 1,202 119,761
Non-Fuel, Non-Metal Mining 31,008 21,660 44,305 16,433 9,183 138,684
Textiles 8,164 33,053 1,819 38,505 26,326 7,113
Lumber and Wood Products 139,175 45,533 30,818 18,461 95,228 74,028
Wood Furniture and Fixtures 3,659 3,267 2,950 3,042 84,036 5,895
Pulp and Paper 584,817 365,901 37,869 535,712 177,937 107,676
Printing 8,847 3,629 539 1,772 88,788 1,291
Inorganic Chemicals 242,834 93,763 6,984 150,971 52,973 34,885
Plastic Resins and Man-made Fibers 15,022 36,424 2,027 65,875 71,416 7,580
Pharmaceuticals 6,389 17,091 1,623 24,506 31,645 4,733
Organic Chemicals 112,999 177,094 13,245 129,144 162,488 17,765
Petroleum Refining 299,546 334,795 25,271 592,117 292,167 36,421
Rubber and Plastic 2,463 10,977 3,391 24,366 110,739 6,302
Stone, Clay, Glass and Concrete 92,463 335,290 58,398 290,017 21,092 198,404
Iron and Steel 982,410 158,020 36,973 241,436 67,682 85,608
Metal Castings 115,269 10,435 14,667 4,881 17,301 21,554
Nonferrous Metals 311,733 31,121 12,545 303,599 7,882 23,811
Fabricated Metal Products 7,135 11,729 2,811 17,535 108,228 5,043
Electronics and Computers 27,702 7,223 1,230 8,568 46,444 3,464
Motor Vehicle Assembly 19,700 31,127 3,900 29,766 125,755 6,212
Shipbuilding and Repair 109 866 762 2,862 4,345 707
Ground Transportation 153,631 594,672 2,338 9,555 101,775 5,542
Water Transportation 179 476 676 712 3,514 3,775
Air Transportation 1,244 960 133 147 1,815 144
Fossil Fuel Electric Power 399,585 5,661,468 221,787 13,477,367 42,726 719,644
Dry Cleaning 145 781 10 725 7,920 40
Source: U.S. EPA Office of Air and Radiation, AIRS Database, 1997.
Sector Notebook Data Refresh - 1997 Sector Notebook Project
Sector Notebook Project May 199813
II.C. Integrated Data for Enforcement Analysis (IDEA) System
Until recently, EPA has focused much of its attention on measuringcompliance with specific environmental statutes. This approach allows theAgency to track compliance with the Clean Air Act (CAA), the ResourceConservation and Recovery Act (RCRA), the Clean Water Act (CWA), andother environmental statutes. Within the last several years, the Agency hasbegun to supplement single-statute compliance indicators with facility-specific, multimedia indicators of compliance. In doing so, EPA is in a betterposition to track compliance with all statutes at the facility level, and withinspecific industrial sectors.
A major step in building the capacity to compile multimedia/multistatute datafor industrial sectors was the creation of EPA's Integrated Data forEnforcement Analysis (IDEA) system. IDEA has the capacity to "read into"the Agency's single-statute databases, extract compliance records, and matchthe records to individual facilities. The IDEA system can match Air, Water,Waste, Toxics/Pesticides/EPCRA, TRI, and Enforcement Docket records fora given facility, and generate a list of historical permit, inspection, andenforcement activity. IDEA also has the capability to analyze data bygeographic area and corporate entity. As the capacity to generate multimediacompliance data improves, EPA will make available more in-depth complianceand enforcement information.
Compliance and Enforcement Profile Description
Using inspection, violation and enforcement data from the IDEA system, thissection provides information regarding the historical compliance andenforcement activity of sectors. For each of these sectors, the IDEA systemwas used to obtain facility compliance and enforcement data from the varioussingle-media databases. The data obtained covers facilities that are regulatedunder one or more of the following environmental statutes: CWA, CAA,RCRA, Federal Insecticide, Fungicide, and Rodenticide Act (FIFRA), ToxicSubstances Control Act (TSCA), and Emergency Planning and CommunityRight-to-Know Act (EPCRA). There are a number of other federal statutoryrequirements that are not included in the sector notebook project complianceand enforcement profiles. These include, for example, requirements underSuperfund and the Safe Drinking Water Act. The analysis in this reportsummarizes inspection and enforcement actions, retrospectively, and reflectsonly those EPA, State, and local activities that have been entered into EPA’sdatabases.
Within the IDEA system, one can design compliance history queries to obtainfacility-level data for specific industry sectors, environmental statutes,geographic regions, time periods, or other characteristics. The “facility
Sector Notebook Data Refresh - 1997 Sector Notebook Project
Sector Notebook Project May 199814
universe” obtained from an IDEA search depends on how the selection criteriaare specified. Each program office database retains sector-identifying SICinformation that are often reported inconsistently by facilities. Therefore,depending on the search criteria specified, many different universes of facilitiesare possible, even within a single industry sector.
In the search criteria used in this section, a facility must have a TRI reportingnumber and must report only SIC codes within that industry sector’s definedrange. This selection criteria allows the compliance and enforcement data andchemical release data to be compiled using a consistent method. The selectioncriteria in this document are consistent across sectors with a few exceptions.For sectors that were not required to file 1995 TRI reports (e.g., Non-Fuel,Non-Metal Mining; Metal Mining) and those that do not normally report tothe TRI program because of size (Printing and Dry Cleaning), data have beenprovided from all facilities in EPA's Facility Indexing System (FINDS) that fallwithin the defined sector SIC code range. FINDS assigns a common facilitynumber to EPA single-statute permit records. Please note, in this document,EPA does not attempt to define the precise number of facilities that fall withineach sector. Rather, this section portrays the records of the facilities withinthe sector that are included in the EPA databases, which is the most accuratedata available. For data that includes a more precise count of facilities in anindividual sector see the Sector Facility Indexing Project, which is describedon page 2.
Following this discussion is a list of definitions for each data column of thetables presented at the end of this section. The values in the tables summarizeinspections and enforcement actions for each sector, and reflect solely EPA,State, and local compliance assurance activities that have been entered intoEPA databases. To identify any changes in trends, this section shows theresults of data queries for two different time periods, one for the past fivecalendar years (April 1, 1992 to March 31, 1997) and the other for the mostrecent twelve-month period (April 1, 1996 to March 31, 1997). The five-yearanalysis gives an average level of activity for that period for comparison to themore recent compliance and enforcement activity.
Because most inspections focus on single-media requirements, the dataqueries presented in this section are taken from single media databases. Thisdocument does not provide data on whether inspections are state/local orEPA-led. However, the table breaking down the universe of violations doesgive the reader a crude measurement of the EPA's and states' efforts withineach media program. The data presented in the industry-specific tables

Sector Notebook Data Refresh - 1997 Sector Notebook Project
EPA Regions include the following states: I (CT, MA, ME, RI, NH, VT); II (NJ, NY, PR, VI); III (DC, DE, MD, PA,3
VA, WV); IV (AL, FL, GA, KY, MS, NC, SC, TN); V (IL, IN, MI, MN, OH, WI); VI (AR, LA, NM, OK, TX); VII(IA, KS, MO, NE); VIII (CO, MT, ND, SD, UT, WY); IX (AZ, CA, HI, NV, Pacific Trust Territories); X (AK, ID, OR,WA).
Sector Notebook Project May 199815
illustrate the variations across EPA Regions for certain sectors. This3
variation may be attributable to state/local data entry variations, specificgeographic concentrations, proximity to population centers, sensitiveecosystems, highly toxic chemicals used in production, or historicalnoncompliance. Hence, the exhibited data do not rank regional performanceor necessarily reflect which regions may have the most compliance problems.
Compliance and Enforcement Data Definitions
General Definitions
Facility Indexing System (FINDS) -- assigns a common facility number toEPA single-media permit records. The FINDS identification number allowsEPA to compile and review all permit, compliance, enforcement and pollutantrelease data for any given regulated facility.
Integrated Data for Enforcement Analysis (IDEA) -- is a data integrationsystem that can retrieve information from the major EPA program officedatabases. IDEA uses the FINDS identification number to link separate datarecords from EPA’s databases. This allows retrieval of records from acrossmedia or statutes for any given facility, thus creating a ?master list” of recordsfor that facility. Some of the data systems accessible through IDEA are: AFS(AIRS Facility Subsystem, Office of Air and Radiation), PCS (PermitCompliance System, Office of Water), RCRIS (Resource Conservation andRecovery Information System, Office of Solid Waste), NCDB (NationalCompliance Data Base, Office of Prevention, Pesticides, and ToxicSubstances), CERCLIS (Comprehensive Environmental and LiabilityInformation System, Superfund), and TRIS (Toxic Release InventorySystem). IDEA also contains information from outside sources such as Dunand Bradstreet and the Occupational Safety and Health Administration(OSHA). Most data queries displayed in notebook sections IV, ChemicalReleases and Transfers, and VII, Compliance and Enforcement History, wereconducted using IDEA.
Data Table Column Heading Definitions
Facilities in Search -- are based on the universe of TRI reporters within thelisted SIC code range. For industries not covered under TRI reportingrequirements (metal mining; non-fuel; non-metal mining; electric powergeneration; ground transportation; water transportation; and dry cleaning), or

Sector Notebook Data Refresh - 1997 Sector Notebook Project
Sector Notebook Project May 199816
industries in which only a very small fraction of facilities report to TRI (e.g.,printing), the notebook uses the FINDS universe for executing data queries.The SIC code range selected for each search is defined by each notebook'sselected SIC code coverage.
Facilities Inspected -- indicates the level of EPA and state agency inspectionsfor the facilities in this data search. These values show what percentage of thefacility universe is inspected in a one-year or five-year period.
Number of Inspections -- measures the total number of inspectionsconducted in this sector. An inspection event is counted each time it isentered into a single media database.
Average Time Between Inspections -- provides an average length of time,expressed in months, between compliance inspections at a facility within thedefined universe.
Facilities with One or More Enforcement Actions -- expresses the numberof facilities that were the subject of at least one enforcement action within thedefined time period. This category is broken down further into federal andstate actions. Data are obtained for administrative, civil/judicial, and criminalenforcement actions. Readers should note that, historically, criminalenforcement actions have not been fully reflected in the EPA databases. Afacility with multiple enforcement actions is only counted once in this column,e.g., a facility with 3 enforcement actions counts as 1 facility.
Total Closed Enforcement Actions -- describes the total number ofenforcement actions identified for an industrial sector across all environmentalstatutes. A facility with multiple enforcement actions is counted multipletimes, e.g., a facility with 3 enforcement actions counts as 3.
State Lead Actions -- shows what percentage of the total enforcementactions are taken by state and local environmental agencies. Varying levelsof use by states of EPA data systems may limit the volume of actions recordedas state enforcement activity. Some states extensively report enforcementactivities into EPA data systems, while other states may use their own datasystems.
Federal Lead Actions -- shows what percentage of the total enforcementactions are taken by the United States Environmental Protection Agency.This value includes referrals from state agencies. Many of these actions resultfrom coordinated or joint state/federal efforts.
Enforcement to Inspection Rate -- is a ratio of enforcement actions toinspections, and is presented for comparative purposes only. This ratio is a

Sector Notebook Data Refresh - 1997 Sector Notebook Project
Sector Notebook Project May 199817
rough indicator of the relationship between inspections and enforcement. Itrelates the number of enforcement actions and the number of inspections thatoccurred within the one-year or five-year period. This ratio includes theinspections and enforcement actions reported under the CWA, CAA andRCRA. Inspections and actions from the TSCA/FIFRA/ EPCRA database arenot factored into this ratio because most of the actions taken under theseprograms are not the result of facility inspections. Also, this ratio does notaccount for enforcement actions arising from non-inspection compliancemonitoring activities (e.g., self-reported water discharges) that can result inenforcement action within the CAA, CWA, and RCRA.
Facilities with One or More Violations Identified -- indicates thepercentage of inspected facilities having a violation identified in one of thefollowing data categories: In Violation or Significant Violation Status (CAA);Reportable Noncompliance, Current Year Noncompliance, SignificantNoncompliance (CWA); Noncompliance and Significant Noncompliance(FIFRA, TSCA, and EPCRA); Unresolved Violation and Unresolved HighPriority Violation (RCRA). The values presented for this column reflect theextent of noncompliance within the measured time frame, but do notdistinguish between the severity of the noncompliance. Violation status maybe a precursor to an enforcement action, but does not necessarily indicate thatan enforcement action will occur.
Media Breakdown of Enforcement Actions and Inspections -- fourcolumns identify the proportion of total inspections and enforcement actionswithin EPA Air, Water, Waste, and FIFRA/TSCA/EPCRA databases. Eachcolumn is a percentage of either the ?Total Inspections,” or the ?TotalActions” column.
Tables 3 and 4 allow comparisons between the compliance histories of theindustries covered by the Sector Notebooks. Comparisons between Tables3 and 4 permit the identification of trends in compliance and enforcementrecords of the various industries by comparing data covering the last fiveyears (April 1992 to April 1997) to that of the past year (April 1996 to April1997).
Tables 5 and 6 provide a more in-depth comparison between the sectors bybreaking out the compliance and enforcement data by environmental statute.As in the previous Tables (Tables 3 and 4), the data cover the last five years(Table 5) and the last one year (Table 6) to facilitate the identification ofrecent trends.

Sector Notebook Data Refresh - 1997 Sector Notebook Project
Sector Notebook Project May 199818
Tab
le 3
: F
ive-
Yea
r E
nfor
cem
ent
and
Com
plia
nce
Sum
mar
y fo
r Se
lect
ed I
ndus
trie
s
AB
CD
EF
GH
IJ
Indu
stry
Sec
tor
Fac
iliti
esin
Sea
rch
Fac
iliti
esIn
spec
ted
Num
ber
ofIn
spec
tion
sA
vera
geM
onth
sB
etw
een
Insp
ecti
ons
Fac
iliti
es w
ith
1 or
Mor
eE
nfor
cem
ent
Act
ions
Tot
alC
lose
dE
nfor
cem
ent
Act
ions
Per
cent
Stat
eL
ead
Act
ions
Per
cent
Fed
eral
Lea
dA
ctio
ns
Enf
orce
men
tto
Insp
ecti
onR
ate
Met
al M
inin
g1,
232
378
1,60
046
6311
153
%47
%0.
07
Non
-Fue
l, N
on-M
etal
Min
ing
5,25
62,
803
12,8
2625
385
622
77%
23%
0.05
Tex
tiles
355
267
1,46
515
5383
90%
10%
0.06
Lum
ber
and
Woo
d71
247
32,
767
1513
426
570
%30
%0.
10
Furn
iture
499
386
2,37
913
6591
81%
19%
0.04
Pulp
and
Pap
er48
443
04,
630
615
047
880
%20
%0.
10
Prin
ting
5,86
22,
092
7,69
146
238
428
88%
12%
0.06
Inor
gani
c C
hem
ical
s44
128
63,
087
989
235
74%
26%
0.08
Res
ins
and
Man
mad
e Fi
bers
329
263
2,43
08
9321
976
%24
%0.
09
Phar
mac
eutic
als
164
129
1,20
18
3512
280
%20
%0.
10
Org
anic
Che
mic
als
425
355
4,29
46
153
468
65%
35%
0.11
Petr
oleu
m R
efin
ing
156
148
3,08
13
124
763
68%
32%
0.25
Rub
ber
and
Plas
tic1,
818
981
4,38
325
178
276
82%
18%
0.06
Ston
e, C
lay,
Gla
ss a
nd C
oncr
ete
615
388
3,47
411
9727
775
%25
%0.
08
Iron
and
Ste
el34
927
54,
476
512
130
571
%29
%0.
07
Met
al C
astin
gs66
942
42,
535
1611
319
171
%29
%0.
08
Non
ferr
ous
Met
als
203
161
1,64
07
6817
478
%22
%0.
11
Fabr
icat
ed M
etal
Pro
duct
s2,
906
1,85
87,
914
2236
560
075
%25
%0.
08
Ele
ctro
nics
1,25
086
34,
500
1715
025
180
%20
%0.
06
Aut
omob
ile A
ssem
bly
1,26
092
75,
912
1325
341
382
%18
%0.
07
Ship
build
ing
and
Rep
air
4437
243
920
3284
%16
%0.
13
Gro
und
Tra
nspo
rtat
ion
7,78
63,
263
12,9
0436
375
774
84%
16%
0.06
Wat
er T
rans
port
atio
n51
419
281
638
3670
61%
39%
0.09
Air
Tra
nspo
rtat
ion
444
231
973
2748
9788
%12
%0.
10
Foss
il Fu
el E
lect
ric
Pow
er3,
270
2,16
614
,210
1440
378
976
%24
%0.
06
Dry
Cle
anin
g6,
063
2,36
03,
813
9555
6695
%5%
0.02

Sector Notebook Data Refresh - 1997 Sector Notebook Project
Sector Notebook Project May 199819
Tab
le 4
: O
ne-Y
ear
Enf
orce
men
t an
d C
ompl
ianc
e Su
mm
ary
for
Sele
cted
Ind
ustr
ies
AB
CD
EF
GH
Fac
iliti
es w
ith
1 or
Mor
eV
iola
tion
sF
acili
ties
wit
h 1
or m
ore
Enf
orce
men
t A
ctio
nsT
otal
Clo
sed
Enf
orce
men
tA
ctio
nsIn
dust
ry S
ecto
rF
acili
ties
inSe
arch
Fac
iliti
esIn
spec
ted
Num
ber
ofIn
spec
tion
sN
umbe
rP
erce
nt*
Num
ber
Per
cent
*E
nfor
cem
ent
toIn
spec
tion
Rat
eM
etal
Min
ing
1,23
214
221
110
272
%9
6%10
0.05
Non
-Fue
l, N
on-M
etal
Min
ing
5,25
61,
481
2,45
138
426
%73
5%91
0.04
Tex
tiles
355
172
295
9656
%10
6%12
0.04
Lum
ber
and
Woo
d71
227
950
719
269
%44
16%
520.
10
Furn
iture
499
254
459
136
54%
94%
110.
02
Pulp
and
Pap
er48
431
778
824
878
%43
14%
740.
09
Prin
ting
5,86
289
21,
363
577
65%
283%
530.
04
Inor
gani
c C
hem
ical
s44
120
054
815
578
%19
10%
310.
06
Res
ins
and
Man
mad
e Fi
bers
329
173
419
152
88%
2615
%36
0.09
Phar
mac
eutic
als
164
8020
984
105%
810
%14
0.07
Org
anic
Che
mic
als
425
259
837
243
94%
4216
%56
0.07
Petr
oleu
m R
efin
ing
156
132
565
129
98%
5844
%13
20.
23
Rub
ber
and
Plas
tic1,
818
466
791
389
83%
337%
410.
05
Ston
e, C
lay,
Gla
ss a
nd C
oncr
ete
615
255
678
151
59%
197%
270.
04
Iron
and
Ste
el34
919
786
617
488
%22
11%
340.
04
Met
al C
astin
gs66
923
443
324
010
3%24
10%
260.
06
Non
ferr
ous
Met
als
203
108
310
9891
%17
16%
280.
09
Fabr
icat
ed M
etal
2,90
684
91,
377
796
94%
637%
830.
06
Ele
ctro
nics
1,25
042
078
040
296
%27
6%43
0.06
Aut
omob
ile A
ssem
bly
1,26
050
71,
058
431
85%
357%
470.
04
Ship
build
ing
and
Rep
air
4422
5119
86%
314
%4
0.08
Gro
und
Tra
nspo
rtat
ion
7,78
61,
585
2,49
968
143
%85
5%10
30.
04
Wat
er T
rans
port
atio
n51
484
141
5363
%10
12%
110.
08
Air
Tra
nspo
rtat
ion
444
9615
169
72%
88%
120.
08
Foss
il Fu
el E
lect
ric
Pow
er3,
270
1,31
82,
430
804
61%
100
8%13
50.
06
Dry
Cle
anin
g6,
063
1,23
41,
436
314
25%
121%
160.
01
*Per
cent
ages
in C
olum
ns E
and
F a
re b
ased
on
the
num
ber
of fa
cili
ties
insp
ecte
d (C
olum
n C
). P
erce
ntag
es c
an e
xcee
d 10
0% b
ecau
se v
iola
tion
s an
d ac
tion
s ca
noc
cur
wit
hout
a fa
cili
ty in
spec
tion
.

Sector Notebook Data Refresh - 1997 Sector Notebook Project
Sector Notebook Project May 199820
Tab
le 5
: F
ive-
Yea
r In
spec
tion
and
Enf
orce
men
t Su
mm
ary
by S
tatu
te f
or S
elec
ted
Indu
stri
es
Indu
stry
Sec
tor
Fac
iliti
esIn
spec
ted
Tot
alIn
spec
tion
s
Tot
alC
lose
dE
nfor
cem
ent
Act
ions
Cle
an A
ir A
ctC
lean
Wat
er A
ctR
CR
AF
IFR
A/T
SCA
/E
PC
RA
/Oth
er
% o
f T
otal
Insp
ecti
ons
% o
fT
otal
Act
ions
% o
f T
otal
Insp
ecti
ons
% o
fT
otal
Act
ions
% o
f T
otal
Insp
ecti
ons
% o
fT
otal
Act
ions
% o
f T
otal
Insp
ecti
ons
% o
fT
otal
Act
ions
Met
al M
inin
g37
81,
600
111
39%
19%
52%
52%
8%12
%1%
17%
Non
-Fue
l, N
on-M
etal
Min
ing
2,80
312
,826
622
83%
81%
14%
13%
3%4%
0%3%
Tex
tiles
267
1,46
583
58%
54%
22%
25%
18%
14%
2%6%
Lum
ber
and
Woo
d47
32,
767
265
49%
47%
6%6%
44%
31%
1%16
%
Furn
iture
386
2,37
991
62%
42%
3%0%
34%
43%
1%14
%
Pulp
and
Pap
er43
04,
630
478
51%
59%
32%
28%
15%
10%
2%4%
Prin
ting
2,09
27,
691
428
60%
64%
5%3%
35%
29%
1%4%
Inor
gani
c C
hem
ical
s28
63,
087
235
38%
44%
27%
21%
34%
30%
1%5%
Res
ins
and
Man
mad
e Fi
bers
263
2,43
021
935
%43
%23
%28
%38
%23
%4%
6%
Phar
mac
eutic
als
129
1,20
112
235
%49
%15
%25
%45
%20
%5%
5%
Org
anic
Che
mic
als
355
4,29
446
837
%42
%16
%25
%44
%28
%4%
6%
Petr
oleu
m R
efin
ing
148
3,08
176
342
%59
%20
%13
%36
%21
%2%
7%
Rub
ber
and
Plas
tic98
14,
383
276
51%
44%
12%
11%
35%
34%
2%11
%
Ston
e, C
lay,
Gla
ss a
nd C
oncr
ete
388
3,47
427
756
%57
%13
%9%
31%
30%
1%4%
Iron
and
Ste
el27
54,
476
305
45%
35%
26%
26%
28%
31%
1%8%
Met
al C
astin
gs42
42,
535
191
55%
44%
11%
10%
32%
31%
2%14
%
Non
ferr
ous
Met
als
161
1,64
017
448
%43
%18
%17
%33
%31
%1%
10%
Fabr
icat
ed M
etal
1,85
87,
914
600
40%
33%
12%
11%
45%
43%
2%13
%
Ele
ctro
nics
863
4,50
025
138
%32
%13
%11
%47
%50
%2%
7%
Aut
omob
ile A
ssem
bly
927
5,91
241
347
%39
%8%
9%43
%43
%2%
9%
Ship
build
ing
and
Rep
air
3724
332
39%
25%
14%
25%
42%
47%
5%3%
Gro
und
Tra
nspo
rtat
ion
3,26
312
,904
774
59%
41%
12%
11%
29%
45%
1%3%
Wat
er T
rans
port
atio
n19
281
670
39%
29%
23%
34%
37%
33%
1%4%
Air
Tra
nspo
rtat
ion
231
973
9725
%32
%27
%20
%48
%48
%0%
0%
Foss
il Fu
el E
lect
ric
Pow
er2,
166
14,2
1078
957
%59
%32
%26
%11
%10
%1%
5%
Dry
Cle
anin
g2,
360
3,81
366
56%
23%
3%6%
41%
71%
0%0%

Sector Notebook Data Refresh - 1997 Sector Notebook Project
Sector Notebook Project May 199821
Tab
le 6
: O
ne-Y
ear
Insp
ecti
on a
nd E
nfor
cem
ent
Sum
mar
y by
Sta
tute
for
Sel
ecte
d In
dust
ries
Fac
iliti
esIn
spec
ted
Tot
alIn
spec
tion
s
Tot
al
Clo
sed
Enf
orce
men
tA
ctio
ns
Cle
an A
ir A
ctC
lean
Wat
er A
ctR
CR
AF
IFR
A/T
SCA
/E
PC
RA
/Oth
er
Indu
stry
Sec
tor
% o
f T
otal
Insp
ecti
ons
% o
fT
otal
Act
ions
% o
f T
otal
Insp
ecti
ons
% o
fT
otal
Act
ions
% o
f T
otal
Insp
ecti
ons
% o
fT
otal
Act
ions
% o
f T
otal
Insp
ecti
ons
% o
fT
otal
Act
ions
Met
al M
inin
g14
221
110
52%
0%40
%40
%8%
30%
0%30
%
Non
-Fue
l, N
on-M
etal
Min
ing
1,48
12,
451
9187
%89
%10
%9%
3%2%
0%0%
Tex
tiles
172
295
1266
%75
%17
%17
%17
%8%
0%0%
Lum
ber
and
Woo
d27
950
752
51%
30%
6%5%
44%
25%
0%40
%
Furn
iture
254
459
1166
%45
%2%
0%32
%45
%0%
9%
Pulp
and
Pap
er31
778
874
54%
73%
32%
19%
14%
7%0%
1%
Prin
ting
892
1,36
353
63%
77%
4%0%
33%
23%
0%0%
Inor
gani
c C
hem
ical
s20
054
831
35%
59%
26%
9%39
%25
%0%
6%
Res
ins
and
Man
mad
e Fi
bers
173
419
3638
%51
%24
%38
%38
%5%
0%5%
Phar
mac
eutic
als
8020
914
43%
71%
11%
14%
45%
14%
0%0%
Org
anic
Che
mic
als
259
837
5640
%54
%13
%13
%47
%34
%0%
0%
Petr
oleu
m R
efin
ing
132
565
132
49%
67%
17%
8%34
%15
%0%
10%
Rub
ber
and
Plas
tic46
679
141
55%
64%
10%
13%
35%
23%
0%0%
Ston
e, C
lay,
Gla
ss a
nd C
oncr
ete
255
678
2762
%63
%10
%7%
28%
30%
0%0%
Iron
and
Ste
el19
786
634
52%
47%
23%
29%
26%
24%
0%0%
Met
al C
astin
gs23
443
326
60%
58%
10%
8%30
%35
%0%
0%
Non
ferr
ous
Met
als
108
310
2844
%43
%15
%20
%41
%30
%0%
7%
Fabr
icat
ed M
etal
849
1,37
783
46%
41%
11%
2%43
%57
%0%
0%
Ele
ctro
nics
420
780
4344
%37
%14
%5%
43%
53%
0%5%
Aut
omob
ile A
ssem
bly
507
1,05
847
53%
47%
7%6%
41%
47%
0%0%
Ship
build
ing
and
Rep
air
2251
454
%0%
11%
50%
35%
50%
0%0%
Gro
und
Tra
nspo
rtat
ion
1,58
52,
499
103
64%
46%
11%
10%
26%
44%
0%1%
Wat
er T
rans
port
atio
n84
141
1138
%9%
24%
36%
38%
45%
0%9%
Air
Tra
nspo
rtat
ion
9615
112
28%
33%
15%
42%
57%
25%
0%0%
Foss
il Fu
el E
lect
ric
Pow
er1,
318
2,43
013
559
%73
%32
%21
%9%
5%0%
0%
Dry
Cle
anin
g1,
234
1,43
616
69%
56%
1%6%
30%
38%
0%0%

Sector Notebook Data Refresh - 1997 Sector Notebook Project
Sector Notebook Project May 199822
Page 22 intentionally left blank.

Sector Notebook Data Refresh - 1997 Sector Notebook Project
Sector Notebook Project May 199823
III. INDUSTRY SECTOR-SPECIFIC DATA
This section contains industry-specific TRI and compliance and enforcementdata for the Sector Notebook Project industry sectors. For those sectors notrequired to report to TRI, only the table of five-year compliance andenforcement data by EPA Region is included. All other sector sectionscontain this table as well as tables listing TRI releases and transfers, largestvolume TRI releasing facilities, and TRI source reduction and recyclingactivities.
1995 TRI Releases and Transfers by Number of Facilities Reporting
This section is designed to provide background information on the pollutantreleases that are reported by this industry. For industries that are required toreport, the best source of comparative pollutant release information is TRIPursuant to EPCRA, TRI includes self-reported facility release and transferdata for over 600 toxic chemicals. Facilities within SIC Codes 20 through 39(manufacturing industries) that have more than 10 employees, and that areabove weight-based reporting thresholds are required to report TRI on-sitereleases and off-site transfers. The information presented within the sectornotebooks is derived from the most recently available (1995) TRI reportingyear (which includes over 600 chemicals), and focuses primarily on the on-sitereleases reported by each sector. Because TRI requires consistent reportingregardless of sector, it is an excellent tool for drawing comparisons acrossindustries. TRI data provide the type, amount, and media receptor of eachchemical released or transferred.
Although this document does not present historical information regarding TRIchemical releases over time, please note that, in general, toxic chemicalreleases have been declining. In fact, according to the 1995 TRI Public DataRelease, reported on-site releases of toxic chemicals to the environmentdecreased by 5 percent (85.4 million pounds) between 1994 and 1995 (notincluding chemicals added and removed from the TRI chemical list during thisperiod). Reported releases dropped by 46 percent between 1988 and 1995.Reported transfers of TRI chemicals to off-site locations increased by 0.4percent (11.6 million pounds) between 1994 and 1995. More detailedinformation can be obtained from EPA's annual TRI Public Data Release book(which is available through the EPCRA Hotline at 800-535-0202), or directlyfrom the TRIS database (for user support call 202-260-1531).
TRI Data Limitations
Certain limitations exist regarding TRI data. Within some sectors, (e.g. drycleaning and printing) the majority of facilities are not subject to TRIreporting because they are not considered manufacturing industries, or

Sector Notebook Data Refresh - 1997 Sector Notebook Project
Sector Notebook Project May 199824
because they are below TRI reporting thresholds. For these sectors, releaseinformation from other data sources has been included. In addition, manyfacilities report more than one SIC code reflecting the multiple operationscarried out on-site. Therefore, reported releases and transfers may or may notall be associated with the industrial operations described in a notebook.
The reader should also be aware that TRI "pounds released" data presentedis not equivalent to a "risk" ranking for each industry. Weighting each poundof release equally does not factor in the relative toxicity of each chemical thatis released. The Agency is in the process of developing an approach to assigntoxicological weightings to each chemical released so that one candifferentiate between pollutants with significant differences in toxicity.
Definitions Associated With TRI Data Tables
General Definitions
SIC Code -- is the Standard Industrial Classification (SIC) code, a statisticalclassification standard used for all establishment-based Federal economicstatistics. The SIC codes facilitate comparisons between facility and industrydata.
TRI Facilities -- are manufacturing facilities that have 10 or more full-timeemployees and are above established chemical throughput thresholds.Manufacturing facilities are defined as facilities in SIC primary codes 20-39.Facilities must submit estimates for all chemicals that are on the EPA's definedlist and are above throughput thresholds.
Data Table Column Heading Definitions
The following definitions are based upon standard definitions developed byEPA’s TRI Program. The categories below represent the possible pollutantdestinations that can be reported.
RELEASES -- are on-site discharges of a toxic chemical to the environment.This includes emissions to the air, discharges to bodies of water, releases atthe facility to land, as well as contained disposal into underground injectionwells.
Releases to Air (Point and Fugitive Air Emissions) -- include all airemissions from industry activity. Point emissions occur through confined airstreams as found in stacks, vents, ducts, or pipes. Fugitive emissions includeequipment leaks, evaporative losses from surface impoundments and spills,and releases from building ventilation systems.

Sector Notebook Data Refresh - 1997 Sector Notebook Project
Sector Notebook Project May 199825
Releases to Water (Surface Water Discharges) -- encompass any releasesgoing directly to streams, rivers, lakes, oceans, or other bodies of water.Releases due to runoff, including storm water runoff, are also reportable toTRI.
Releases to Land -- occur within the boundaries of the reporting facility.Releases to land include disposal of toxic chemicals in landfills, landtreatment/application farming, surface impoundments, and other disposal onland (such as spills, leaks, or waste piles).
Underground Injection -- is a contained release of a fluid into a subsurfacewell for the purpose of waste disposal. Wastes containing TRI chemicals areinjected into either Class I wells or Class V wells. Class I wells are used toinject liquid hazardous wastes or dispose of industrial and municipalwastewaters beneath the lowermost underground source of drinking water.Class V wells are generally used to inject non-hazardous fluid into or abovean underground source of drinking water. TRI reporting does not currentlydistinguish between these two types of wells, although there are importantdifferences in environmental impact between these two methods of injection.
TRANSFERS -- are transfers of toxic chemicals in wastes to a facility thatis geographically or physically separate from the facility reporting under TRI.Chemicals reported to TRI as transferred are sent to off-site facilities for thepurpose of recycling, energy recovery, treatment, or disposal. The quantitiesreported represent a movement of the chemical away from the reportingfacility. Except for off-site transfers for disposal, the reported quantities donot necessarily represent entry of the chemical into the environment.
Transfers to POTWs -- are wastewater transferred through pipes or sewersto a publicly owned treatments works (POTW). Treatment or removal of achemical from the wastewater depends on the nature of the chemical, as wellas the treatment methods present at the POTW. Not all TRI chemicals canbe treated or removed by a POTW. Some chemicals, such as metals, may beremoved but not destroyed and may be disposed of in landfills or dischargedto receiving waters.
Transfers to Recycling -- are wastes sent off-site for the purposes ofregenerating or recovery by a variety of recycling methods, including solventrecovery, metals recovery, and acid regeneration. Once these chemicals havebeen recycled, they may be returned to the originating facility or soldcommercially.
Transfers to Energy Recovery -- are wastes combusted off-site in industrialfurnaces for energy recovery. Treatment of a chemical by incineration is notconsidered to be energy recovery.

Sector Notebook Data Refresh - 1997 Sector Notebook Project
Sector Notebook Project May 199826
Transfers to Treatment -- are wastes moved off-site to be treated througha variety of methods, including neutralization, incineration, biologicaldestruction, or physical separation. In some cases, the chemicals are notdestroyed but prepared for further waste management.
Transfers to Disposal -- are wastes taken to another facility for disposal,generally as a release to land or as an injection underground.
Carcinogens, Metals, and Ozone Depleters
Users of TRI information should be aware that the TRI data reflect releasesand transfers of chemicals, not exposures and risks to the public of thosechemicals. The determination of potential risk depends upon many factors,including the toxicity of the chemical, the fate of the chemical after it isreleased, and the human or other populations which are exposed to thechemical after its release. The TRI list consists of chemicals that vary widelyin their toxic effects, degradation or persistence in the environment, andbioconcentration in the food chain.
A number of TRI chemicals can be classified into groups that may be ofparticular concern to human health and the environment. In the SectorNotebook Data Refresh - 1997, those TRI chemicals that can be classified aseither carcinogens, metals, or ozone depleters, have been identified andlabeled.
Carcinogens
Some chemicals on the TRI are listed because they are either known humancarcinogens or suspect carcinogens. Known human carcinogens are those thathave been shown to cause cancer in humans. Suspect carcinogens are thosechemicals that have been shown to cause cancer in animals. Under EPCRASection 313, a chemical does not have to be counted towards threshold andrelease calculations if it is present in a mixture below the de minimisconcentration. The de minimis limitation is 0.1 percent if the chemical is aknown or suspect carcinogen by virtue of appearing in one of three sources:National Toxicology Program (NTP), “Annual Report on Carcinogens”;International Agency for Research on Cancer (IARC) “Monographs”; or 29CFR 1910, Subpart Z, Toxic and Hazardous Substances, Occupational Safetyand Health Administration (OSHA).The de minimis limitation is 1.0 percentfor chemicals that do not meet the above OSHA carcinogen criteria. Thecarcinogen designation in this document relates to any chemical that theAgency determined met the above OSHA criteria and therefore has the 0.1percent de minimis limitation. More information on the specific bases forwhich individual chemicals were designated as a known or suspectcarcinogens can be obtained from the “Toxic Release Inventory Public Data

Sector Notebook Data Refresh - 1997 Sector Notebook Project
Sector Notebook Project May 199827
Release” (Latest Edition). (To obtain a copy of the TRI Public Data Release,call the EPCRA Hotline at (800) 535-0202.)
Metals
Metals (including the metal portion of metal compounds) are different fromother TRI chemicals because they do not degrade in the environment and arenot destroyed. Other TRI-listed chemicals can be destroyed by sunlight, heat,microorganisms, or other chemicals. Although metals cannot be destroyed,they may be converted to a less toxic form. For example, many facilitiesconvert hexavalent chromium (a known carcinogen) to the less toxic trivalentform before releasing or transferring it to off-site locations. Other metalwaste may be treated before disposal so that the metal will be less likely to betransported through soils. Although such treatment may limit the availabilityof the metal to the environment, it does not destroy the metal.
Ozone Depleters
Ozone depleters, such as chlorofluorocarbons (CFCs), halons,1,1,1-trichloroethane (methyl chloroform), carbon tetrachloride, andbromomethane (methyl bromide), are known to release chlorine or brominein the stratosphere (earth’s upper atmosphere). Chlorine and bromine act ascatalysts in the conversion of ozone to oxygen, thus reducing the amount ofstratospheric ozone. Stratospheric ozone is important because it shields theearth from ultraviolet-B radiation, which has been shown to cause variousadverse human health and environmental effects such as skin cancer, cataracts,and possibly suppressed immune systems. As the ozone layer diminishes, theamount of this harmful radiation reaching the earth’s surface increases. Theseozone depleters remain in the stratosphere for many decades; thus, emissionstoday will influence ozone levels far into the future.
Key
In the TRI chemical release and transfer tables in this document, chemicalsthat have been identified as known or suspect carcinogens are designated with“[C]” following the chemical name. Metals and metal compounds aredesignated with “[M]” following the chemical name. Ozone depletingchemicals are designated with “[O]” following the chemical name.
Sector Notebook Data Refresh - 1997 Sector Notebook Project
Sector Notebook Project May 199828
Ten Largest Volume TRI Releasing Facilities
The TRI database contains a detailed compilation of self-reported, facility-specific chemical releases. Facilities that have reported the primary SICcodes covered under a Sector Notebook appear on the first list. The nexttable contains additional facilities that have reported the SIC codes coveredwithin that report, and one or more SIC codes that are not within the scopeof that notebook. Therefore, the second list includes facilities that conductmultiple operations -- some that are under the scope of the notebook, andsome that are not. Currently, the facility-level data do not allow pollutantreleases to be broken apart by industrial process.
Source Reduction and Recycling Activity
The Pollution Prevention Act of 1990 (PPA) requires facilities to reportinformation about the management of TRI chemicals in waste and effortsmade to eliminate or reduce those quantities. These data have been collectedannually in Section 8 of the TRI reporting Form R beginning with the 1991reporting year. The data summarized below cover the years 1994-1997 andare meant to provide a basic understanding of the quantities of waste handledby the industry, the methods typically used to manage this waste, and recenttrends in these methods. TRI waste management data can be used to assesstrends in source reduction within individual industries and facilities and forspecific TRI chemicals. This information could then be used as a tool inidentifying opportunities for pollution prevention and compliance assistanceactivities.
While the quantities reported for 1994 and 1995 are estimates of quantitiesalready managed, the quantities listed by facilities for 1996 and 1997 areprojections only. The PPA requires these projections to encourage facilitiesto consider future source reduction, not to establish any mandatory limits.Future-year estimates are not commitments that facilities reporting under TRIare required to meet.
Column B contains the total quantity of TRI chemicals in the waste fromroutine production operations in 1995. Values in Column C are intended toreveal the percent of production-related waste either transferred off-site orreleased to the environment. Column C is calculated by dividing the total TRItransfers and releases by the total quantity of production related waste.Columns D, E, and F show the percent of industry TRI wastes that weremanaged on-site through recycling, energy recovery, or treatment,respectively. Columns G, H, and I contain the percent of industry TRI wastesthat were transferred off-site for recycling, energy recovery, or treatment,respectively. The remaining portion of production related wastes, shown incolumn J, is either released to the environment through direct discharges to

Sector Notebook Data Refresh - 1997 Sector Notebook Project
Sector Notebook Project May 199829
air, land, water, and underground injection, or is transferred off-site fordisposal.
Five-Year Enforcement and Compliance Summary
This table provides an overview of the reported compliance and enforcementdata for an industry over the past five years (April 1992 to April 1997). Thesedata are also broken out by EPA Regions thereby permitting geographicalcomparisons. See Section II.C. for a detailed description of the enforcementand compliance data contained in this document.
Sector Notebook Data Refresh - 1997 Metal Mining
Sector Notebook Project May 1998A-1
Metal Mining

Sector Notebook Data Refresh - 1997 Metal Mining
Sector Notebook Project May 1998A-2
Five-Year Enforcement and Compliance Summary for the Metal Mining Industry*
A B C D E F G H I J
Region Facilities Facilities Number of Average Facilities with Total Percent Percent Enforcementin Search Inspected Inspections Months 1 or More Enforcement State Federal to Inspection
Between Enforcement Actions Lead Lead RateInspections Actions Actions Actions
I 4 2 2 120 1 1 100% 0% --
II 20 12 76 16 2 7 100% 0% 0.09
III 19 9 34 34 0 0 0% 0% --
IV 39 24 266 9 6 6 83% 17% 0.02
V 44 29 164 16 6 14 64% 36% 0.09
VI 56 22 110 31 6 9 22% 78% 0.08
VII 20 9 96 13 3 4 50% 50% 0.04
VIII 329 78 287 69 14 30 83% 17% 0.10
IX 75 50 315 14 10 14 36% 64% 0.04
X 626 143 250 150 15 26 12% 88% 0.10
TOTAL 1,232 378 1,600 46 63 111 53% 47% 0.07
*Data obtained from EPA’s Integrated Data for Enforcement Analysis (IDEA) System. For a description of IDEA andthe methods used to obtain this data, refer to Section II.C. A discussion of this table can be found under the heading,Five-Year Enforcement and Compliance Summary, in Section III.

Sector Notebook Data Refresh - 1997 Non-Fuel, Non-Metal Mining
Sector Notebook Project May 1998B-1
Non-Fuel, Non-Metal Mining

Sector Notebook Data Refresh - 1997 Non-Fuel, Non-Metal Mining
Sector Notebook Project May 1998B-2
Five-Year Enforcement and Compliance Summary for the Non-Fuel, Non-Metal Mining Industry*
A B C D E F G H I JRegion Facilities Facilities Number of Average Facilities with Total Percent Percent Enforcement
in Search Inspected Inspections Months 1 or More Enforcement State Federal to InspectionBetween Enforcement Actions Lead Lead Rate
Inspections Actions Actions Actions
I 157 84 243 39 11 11 82% 18% 0.05
II 202 105 641 19 32 55 93% 7% 0.09
III 528 334 2,367 13 37 54 85% 15% 0.02
IV 1,333 726 3,760 21 99 175 88% 12% 0.05
V 748 457 1,902 24 35 39 85% 15% 0.02
VI 408 207 677 36 46 84 90% 10% 0.12
VII 599 330 1,308 27 76 127 30% 70% 0.10
VIII 927 320 982 57 36 61 97% 3% 0.06
IX 222 184 770 17 8 9 56% 44% 0.01
X 132 56 176 45 5 7 71% 29% 0.04
TOTAL 5,256 2,803 12,826 25 385 622 77% 23% 0.05
*Data obtained from EPA’s Integrated Data for Enforcement Analysis (IDEA) System. For a description of IDEA andthe methods used to obtain this data, refer to Section II.C. A discussion of this table can be found under the heading,Five-Year Enforcement and Compliance Summary, in Section III.

Sector Notebook Data Refresh - 1997 Textiles
Sector Notebook Project May 1998C-1
Textiles

Sector Notebook Data Refresh - 1997 Textiles
Sector Notebook Project May 1998C-2
1995 TRI Releases for Textile Manufacturing Facilities (SIC 22)by Number of Facilities Reporting (pounds/year)*
Chemical Name Chemical Air Air Discharges Injection Disposal Releases Per Facility# Reporting Fugitive Point Water Underground Land Total Avg. Releases
Methanol 64 212,358 2,717,312 1,764 0 0 2,931,434 45,804Ammonia 51 137,047 1,201,243 6,911 0 0 1,345,201 26,376Methyl Ethyl Ketone 37 1,469,884 3,450,185 250 0 1 4,920,320 132,982Toluene 33 588,915 2,918,775 5 0 1 3,507,696 106,294Phosphoric Acid 32 2,503 48,496 250 0 0 51,249 1,602Chlorine 31 13,885 20,523 11,908 0 0 46,316 1,494Antimony Compounds[M] 30 322 1,065 1,067 0 250 2,704 90Decabromodiphenyl Oxide 26 206 1,075 1,860 0 1,754 4,895 188Ethylene Glycol 23 5,705 131,720 9,102 0 286 146,813 6,383Certain Glycol Ethers 21 20,329 166,765 18,651 0 0 205,745 9,797Chromium Compounds[C, M] 20 15 18 2,712 0 1,811 4,556 228Zinc Compounds[M] 20 2,645 6,196 480 0 5 9,326 4661,1,1-Trichloroethane[O] 19 324,499 11,580 0 0 0 336,079 17,688Copper Compounds[M] 18 2,199 181 10,908 0 2,789 16,077 893Formaldehyde[C] 18 2,110 66,144 92 0 0 68,346 3,797Xylene (Mixed Isomers) 18 103,961 740,907 750 0 0 845,618 46,979Hydrochloric Acid (1995 and after "Acid Aerosols" Only) 17 4,451 171,436 250 0 5 176,142 10,361Sulfuric Acid 15 250 250 0 0 0 500 33Diisocyanates 11 1,818 1,676 0 0 0 3,494 318n,n-dimethylformamide[C] 11 60,816 56,263 0 0 0 117,079 10,644Biphenyl 11 6,935 147,813 762 0 0 155,510 14,137N-methyl-2-pyrrolidone 10 65,640 324,632 34 0 0 390,306 39,031Sodium Nitrite 9 19,033 18,005 0 0 0 37,038 4,115Barium Compounds[M] 8 10 10 5 0 0 25 3Trichloroethylene[C] 8 40,980 241,477 0 0 0 282,457 35,3071,2,4-trimethylbenzene 8 6,704 44,108 3,005 0 0 53,817 6,727Nitrate Compounds 7 0 0 187,450 0 0 187,450 26,779Formic Acid 7 15,113 4,178 0 0 0 19,291 2,756Dichloromethane[C] 7 79,576 434,986 0 0 1 514,563 73,509Methyl Isobutyl Ketone 7 84,572 331,139 0 0 0 415,711 59,387Phenol 6 6,189 86,482 0 0 0 92,671 15,4451,2,4-trichlorobenzene 6 7,416 38,623 189 0 0 46,228 7,705Antimony[M] 6 50 34 0 0 0 84 14Lead Compounds[C, M] 4 5 5 5 0 0 15 4Tetrachloroethylene[C] 4 5,818 58,166 0 0 0 63,984 15,996Copper[M] 4 0 0 0 0 0 0 0Cobalt Compounds[C, M] 3 0 10 590 0 0 600 200Styrene[C] 3 63,553 47,181 0 0 0 110,734 36,911Diethanolamine 3 0 5,696 150 0 0 5,846 1,949Di(2-ethylhexyl) Phthalate[C] 3 0 799 0 0 0 799 266Arsenic Compounds[C, M] 2 0 0 0 0 0 0 0Nickel Compounds[C, M] 2 0 0 0 0 0 0 0Isopropyl Alcohol (Manufacturing, Strong-acid Process Only) 2 12,129 13,155 0 0 0 25,284 12,642Naphthalene 2 173 8,600 7,800 0 0 16,573 8,287Propylene 2 0 0 0 0 0 0 0Dimethyl Phthalate 2 0 2,708 0 0 0 2,708 1,354Lead[C, M] 2 5 5 0 0 0 10 5Chlorine Dioxide 2 5,141 0 0 0 0 5,141 2,571Cadmium Compounds[C, M] 1 0 0 0 0 0 0 0Thiourea[C] 1 0 0 0 0 0 0 0N-butyl Alcohol 1 0 50 1,900 0 0 1,950 1,950Hydrogen Cyanide 1 250 2,566 0 0 0 2,816 2,816Vinyl Chloride[C] 1 5 5 0 0 0 10 10Acetaldehyde[C] 1 0 13,400 0 0 0 13,400 13,400Trichlorofluoromethane[O] 1 250 0 0 0 0 250 250Freon 113[O] 1 18,507 0 0 0 0 18,507 18,507Methyl Methacrylate 1 454 1,816 0 0 0 2,270 2,270Dibutyl Phthalate 1 40 46 0 0 0 86 862-phenylphenol 1 0 26,240 0 0 0 26,240 26,240

Sector Notebook Data Refresh - 1997 Textiles
1995 TRI Releases for Textile Manufacturing Facilities (SIC 22)by Number of Facilities Reporting (pounds/year)*
Chemical Name Chemical Air Air Discharges Injection Disposal Releases Per Facility# Reporting Fugitive Point Water Underground Land Total Avg. Releases
Sector Notebook Project May 1998C-3
Acetophenone 1 0 0 0 0 0 0 01,4-Dichlorobenzene[C] 1 14,665 0 0 0 0 14,665 14,6651,2-Dichloroethane[C] 1 0 8,935 0 0 0 8,935 8,935Maleic Anhydride 1 0 0 0 0 0 0 02-methoxyethanol 1 3,200 750 0 0 0 3,950 3,950N-hexane 1 130,000 658 0 0 0 130,658 130,6582-ethoxyethanol 1 4,800 900 0 0 0 5,700 5,700Folpet 1 0 0 0 0 0 0 0C.I. Basic Green 4 1 0 0 0 0 0 0 0Toluene-2,4-diisocyanate[C] 1 0 0 0 0 0 0 0Molybdenum Trioxide 1 750 250 0 0 0 1,000 1,000Polychlorinated Biphenyls[C] 1 0 0 0 0 0 0 01,1-dichloro-1-fluoroethane[O] 1 367,120 0 0 0 0 367,120 367,120C.I. Disperse Yellow 3 1 349 0 0 0 0 349 349Nickel[C, M] 1 18 0 0 0 0 18 18Barium[M] 1 0 0 0 0 0 0 0Chromium[M] 1 0 0 0 0 0 0 0
___ _________ _________ _______ ___ ______ _________ __________339** 3,913,368 13,575,488 268,850 0 6,903 17,764,609 52,403
[C] Known or suspect carcinogens [M] Metals and metal compounds [O] Ozone depleters* Refer to Section III for a discussion of the TRI data and its limitations, methodology used to obtain this data, definitions of the column headings, and the definitions of carcinogens, metals, and ozone depleters.**Total number of facilities (not chemical reports) reporting to TRI in this industry sector.

Sector Notebook Data Refresh - 1997 Textiles
Sector Notebook Project May 1998C-4
1995 TRI Transfers for Textile Manufacturing Facilities (SIC 22) by Number of Facilities Reporting (pounds/year)*
Chemical Name Chemical Transfers Transfers Transfers Transfers Transfers Transfers Per Facility# Reporting POTW Disposal Recycling Treatment Recovery Total Avg Transfer
Energy
Methanol 64 110,082 0 18,123 6,111 135,698 270,014 4,219Ammonia 51 517,662 3,849 . 1,548 2,780 525,839 10,311Methyl Ethyl Ketone 37 4,550 27,000 280,256 324,111 775,448 1,411,365 38,145Toluene 33 505 32,650 250 52,351 646,897 732,653 22,202Phosphoric Acid 32 184,990 . . 25,329 . 210,319 6,572Chlorine 31 27,891 0 . . . 27,891 900Antimony Compounds[M] 30 72,575 120,995 750 26,401 5,761 226,482 7,549Decabromodiphenyl Oxide 26 243,056 55,546 1,993 5,434 3,300 309,329 11,897Ethylene Glycol 23 428,068 38,000 . . . 466,068 20,264Certain Glycol Ethers 21 192,060 14 . . 9,890 201,964 9,617Chromium Compounds[C, M] 20 52,996 3,828 750 4,615 . 62,189 3,109Zinc Compounds[M] 20 60,950 91,231 6,830 7,787 1,213 168,011 8,4011,1,1-Trichloroethane[O] 19 0 . 614 . 3,922 4,536 239Copper Compounds[M] 18 18,683 9,482 2,376 1,421 . 31,962 1,776Formaldehyde[C] 18 5,947 251 . 5,797 121 12,116 673Xylene (Mixed Isomers) 18 58,600 . 4,800 40,755 43,330 147,485 8,194Hydrochloric Acid (1995 and after "Acid Aerosols" Only) 17 66,613 50,920 . 129,493 . 247,026 14,531Sulfuric Acid 15 1,585 . . 29,994 . 31,579 2,105Diisocyanates 11 0 1,300 3 386 . 1,689 154n,n-dimethylformamide[C] 11 11,123 291 . 3,403 100,913 115,730 10,521Biphenyl 11 239,361 . . . . 239,361 21,760N-methyl-2-pyrrolidone 10 250 1,300 72,767 13,140 94,915 182,372 18,237Sodium Nitrite 9 128,764 . . . . 128,764 14,307Barium Compounds[M] 8 10 36,652 . 500 2,403 39,565 4,946Trichloroethylene[C] 8 10 2,910 326,000 3,000 49,934 381,854 47,7321,2,4-trimethylbenzene 8 44,335 1,274 . . . 45,609 5,701Nitrate Compounds 7 59,671 9,332 . . . 69,003 9,858Formic Acid 7 593 . . . . 593 85Dichloromethane[C] 7 5 . 240 5 18,849 19,099 2,728Methyl Isobutyl Ketone 7 500 3,600 250 1,359 128,668 134,377 19,197Phenol 6 0 1,566 . 459 21,841 23,866 3,9781,2,4-trichlorobenzene 6 80,552 31,898 . . . 112,450 18,742Antimony[M] 6 20,627 18,162 1,489 1,258 230 41,766 6,961Lead Compounds[C, M] 4 257 12,450 79,500 1,010 . 93,217 23,304Tetrachloroethylene[C] 4 10,928 2,340 . 45,327 . 58,595 14,649Copper[M] 4 1,735 . . . . 1,735 434Cobalt Compounds[C, M] 3 858 907 . . . 1,765 588Styrene[C] 3 0 . . 177 . 177 59Diethanolamine 3 39,979 . . 133 . 40,112 13,371Di(2-ethylhexyl) Phthalate[C] 3 4,500 . . . 19,200 23,700 7,900Arsenic Compounds[C, M] 2 0 216 . 5 . 221 111Nickel Compounds[C, M] 2 508 . . . . 508 254Isopropyl Alcohol (Manufacturing, Strong-acid Process Only) 2 1,916 . . . . 1,916 958Naphthalene 2 0 . . . . 0 0Propylene 2 0 . . . . 0 0Dimethyl Phthalate 2 51,441 . . . . 51,441 25,721Lead[C, M] 2 5 2,758 . . 458 3,221 1,611Chlorine Dioxide 2 0 . . . . 0 0Cadmium Compounds[C, M] 1 0 250 . . . 250 250Thiourea[C] 1 0 . . . . 0 0N-butyl Alcohol 1 0 . . . . 0 0Hydrogen Cyanide 1 0 . . . . 0 0Vinyl Chloride[C] 1 0 15,167 . . 2,518 17,685 17,685Acetaldehyde[C] 1 30,600 . . . . 30,600 30,600Trichlorofluoromethane[O] 1 0 . . . . 0 0Freon 113[O] 1 0 . . . . 0 0Methyl Methacrylate 1 0 . . . . 0 0Dibutyl Phthalate 1 0 1,875 . . 3,020 4,895 4,895

Sector Notebook Data Refresh - 1997 Textiles
1995 TRI Transfers for Textile Manufacturing Facilities (SIC 22) by Number of Facilities Reporting (pounds/year)*
Chemical Name Chemical Transfers Transfers Transfers Transfers Transfers Transfers Per Facility# Reporting POTW Disposal Recycling Treatment Recovery Total Avg Transfer
Energy
Sector Notebook Project May 1998C-5
2-phenylphenol 1 0 . . . . 0 0Acetophenone 1 18,233 . . . . 18,233 18,2331,4-Dichlorobenzene[C] 1 0 . . . . 0 01,2-Dichloroethane[C] 1 7,659 . . . . 7,659 7,659Maleic Anhydride 1 7,530 . . . . 7,530 7,5302-methoxyethanol 1 0 . . . . 0 0N-hexane 1 0 . . . . 0 02-ethoxyethanol 1 0 . . . . 0 0Folpet 1 0 1,300 . . . 1,300 1,300C.I. Basic Green 4 1 0 . . . . 0 0Toluene-2,4-diisocyanate[C] 1 0 . . 5 . 5 5Molybdenum Trioxide 1 0 2,300 . . . 2,300 2,300Polychlorinated Biphenyls[C] 1 0 . . . . 0 01,1-dichloro-1-fluoroethane[O] 1 0 . . . . 0 0C.I. Disperse Yellow 3 1 5,189 . . . . 5,189 5,189Nickel[C, M] 1 0 120 . . . 120 120Barium[M] 1 5 . 750 10 . 765 765Chromium[M] 1 1,602 . . . . 1,602 1,602
___ _________ _______ _______ _______ _________ __________ _________339** 2,815,559 581,734 797,741 731,324 2,071,309 6,997,667 20,642
[C] Known or suspect carcinogens [M] Metals and metal compounds [O] Ozone depleters* Refer to Section III for a discussion of the TRI data and its limitations, methodology used to obtain this data, definitions of the column headings, and the definitions of carcinogens, metals, and ozone depleters.**Total number of facilities (not chemical reports) reporting to TRI in this industry sector.

Sector Notebook Data Refresh - 1997 Textiles
Being included on this list does not mean that the release is associated with non-compliance with environmental laws.1
Sector Notebook Project May 1998C-6
Ten Largest Volume TRI Releasing Textile Manufacturing Facilities ReportingOnly SIC 22*
Rank Facility Total Releases in Pounds1
1 Gencorp, Columbus, MS** 2,761,015
2 Holliston Mills Inc., Church Hill, TN 1,755,090
3 Avondale Mills, Inc., Graniteville, SC 1,260,050
4 American & Efird Inc., Mount Holly, NC 1,070,442
5 Uniroyal Engineered Products, Stoughton, WI** 758,023
6 Textileather Corporation, Toledo, OH** 520,890
7 Athol Corporation, Butner, NC** 421,229
8 Excello Fabric Finishers Inc., Coshocton, OH 414,000
9 Shaw Ind. Inc., Dalton, GA 412,873
10 Collins & Aikman Products Company, Farmville, NC 367,120
Source: US Toxics Release Inventory Database, 1995.*Refer to Section III for a general discussion of TRI data and its limitations. A discussion of the methodology used todevelop this table can be found under the heading Ten Largest Volume TRI Releasing Facilities.**This facility manufactures coated fabrics and is classified as SIC Code 2295, Miscellaneous Textiles, Coated Fabrics-- Not Rubberized.
Ten Largest Volume TRI Releasing Facilities Reporting Only SIC 22 or SIC 22 andOther SIC Codes*
Rank Facility Total Releases in Pounds1
1 Gencorp, Columbus, MS** 2,761,015
2 Holliston Mills Inc., Church Hill, TN** 1,755,090
3 Du Pont, Old Hickory, TN 1,737,853
4 IPC Corinth Div. Inc., Corinth, MS 1,479,471
5 Avondale Mills, Inc., Graniteville, SC 1,260,050
6 American & Efird Inc., Mount Holly, NC 1,070,442
7 E.R. Carpenter Co. Inc., Riverside, CA 896,755
8 Carpenter Co., Russellville, KY 877,660
9 Reeves Intl., Spartanburg, SC 855,355
10 Carpenter Co., Richmond, VA 799,567
Source: US Toxics Release Inventory Database, 1995.*Refer to Section III for a general discussion of TRI data and its limitations. A discussion of the methodology used todevelop this table can be found under the heading Ten Largest Volume TRI Releasing Facilities.**This facility manufactures coated fabrics and is classified as SIC Code 2295, Miscellaneous Textiles, Coated Fabrics -- Not Rubberized.

Sector Notebook Data Refresh - 1997 Textiles
Sector Notebook Project May 1998C-7
Source Reduction and Recycling Activity for the Textile Industry (SIC 22)as Reported within TRI*
A B C JOn-Site Off-Site
Year (10 lbs.) Transferred Off-SiteRecycled Recovery % Treated Recycled Recovery % Treated
Quantity ofProduction- % Released
Related % Released andWaste and Disposed% % Energy % % Energy
6 a b c
D E F G H I
1994 57.1 7.7 23.6% 7.2% 24.0% 1.4% 3.1% 6.0% 34.9%
1995 57.6 43.0 18.6% 8.6% 30.0% 1.4% 3.6% 6.2% 33.0%
1996 55.2 N/A 21.6% 9.0% 31.2% 1.8% 2.6% 5.4% 28.3%
1997 54.5 N/A 22.3% 9.6% 30.8% 2.9% 2.3% 5.4% 26.9%
Source: Toxics Release Inventory Database, 1995.* Refer to Section III for a general discussion of TRI data and its limitations. A discussion of the methodology used todevelop this table can be found under the heading Source Reduction and Recycling Activity. Within this industry sector, non-production related waste was < 1% of production related wastes for 1995.a
Total TRI transfers and releases as reported in Section 5 and 6 of Form R as a percentage of production related wastes.b
Percentage of production related waste released to the environment and transferred off-site for disposal.c

Sector Notebook Data Refresh - 1997 Textiles
Sector Notebook Project May 1998C-8
Five-Year Enforcement and Compliance Summary for the Textile Industry*
A B C D E F G H I JRegion Facilities Facilities Number of Average Facilities with Total Percent Percent Enforcement
in Search Inspected Inspections Months 1 or More Enforcement State Federal to InspectionBetween Enforcement Actions Lead Lead Rate
Inspections Actions Actions Actions
I 43 40 143 18 11 14 79% 21% 0.10
II 24 15 74 19 6 11 82% 18% 0.15
III 31 24 168 11 6 6 100% 0% 0.04
IV 217 160 976 13 25 46 98% 2% 0.05
V 20 15 49 24 3 4 100% 0% 0.08
VI 7 4 22 19 1 1 0% 100% 0.05
VII 1 1 4 15 0 0 0% 0% --
VIII 0 0 0 -- 0 0 0% 0% --
IX 9 6 17 32 0 0 0% 0% --
X 3 2 12 15 1 1 0% 100% 0.08
TOTAL 355 267 1,465 15 53 83 90% 10% 0.06
*Data obtained from EPA’s Integrated Data for Enforcement Analysis (IDEA) System. For a description of IDEA andthe methods used to obtain this data, refer to Section II.C. A discussion of this table can be found under the heading,Five-Year Enforcement and Compliance Summary, in Section III.
Sector Notebook Data Refresh - 1997 Lumber and Wood Products
Sector Notebook Project May 1998D-1
Lumber and Wood Products

Sector Notebook Data Refresh - 1997 Lumber and Wood Products
Sector Notebook Project May 1998D-2
1995 TRI Releases for Lumber and Wood Products Facilities (SIC 24) by Number of Facilities Reporting (pounds/year)*
Chemical Name Chemical Air Air Discharges Injection Disposal Releases Per Facility# Reporting Fugitive Point Water Underground Land Total Avg. Releases
Arsenic Compounds[C, M] 116 77 332 1,828 0 5 2,242 19Copper Compounds[M] 116 87 346 2,024 0 5 2,462 21Chromium Compounds[C, M] 111 78 334 1,886 0 0 2,298 21Formaldehyde[C] 80 298,356 3,475,428 52,440 0 1,794 3,828,018 47,850Methanol 68 867,604 13,231,711 527,768 0 19,400 14,646,483 215,389Creosote[C] 62 332,409 428,173 8,289 0 250 769,121 12,405Chromium[M] 61 240 485 424 0 0 1,149 19Arsenic[C, M] 60 240 235 126 0 0 601 10Copper[M] 59 235 235 207 0 0 677 11Phenol 31 60,667 565,728 846 0 355 627,596 20,245Diisocyanates 26 1,215 8,840 0 0 1,218 11,273 434Pentachlorophenol[C] 25 1,814 4,423 2,069 0 250 8,556 342Ammonia 23 420,258 787,438 133,155 0 2,300 1,343,151 58,398Toluene 18 206,372 1,162,736 1,776 0 0 1,370,884 76,160Xylene (Mixed Isomers) 18 40,413 1,033,568 0 0 0 1,073,981 59,666Acetaldehyde[C] 15 13,233 1,693,747 5,399 0 2,066 1,714,445 114,296Hydrochloric Acid (1995 and after 13 250 849,094 0 0 5 849,349 65,335"Acid Aerosols" Only)Methyl Ethyl Ketone 12 8,586 713,870 678 0 0 723,134 60,261Sulfuric Acid 11 0 587,384 0 0 5 587,389 53,399Zinc Compounds[M] 7 0 2,011 29,405 0 473,005 504,421 72,060Phosphoric Acid 7 245 2,385 0 0 0 2,630 376Ethylbenzene 6 3,800 147,699 0 0 0 151,499 25,250Methyl Isobutyl Ketone 6 31,619 90,179 0 0 0 121,798 20,300Chlorine 6 2,036 43,153 16,293 0 0 61,482 10,247Certain Glycol Ethers 5 51,906 44,800 0 0 0 96,706 19,341Nitrate Compounds 5 0 0 114,665 0 50 114,715 22,943N-butyl Alcohol 5 2,709 308,128 0 0 0 310,837 62,167Catechol 5 0 0 1,323 0 255 1,578 316Cresol (Mixed Isomers) 4 31 76,005 795 0 10 76,841 19,210Formic Acid 3 0 0 0 0 0 0 0Chloroform[C] 3 252,193 202,638 102,623 0 250 557,704 185,901Naphthalene 3 1,165 327 0 0 0 1,492 497Styrene[C] 3 7,413 60,897 285 0 0 68,595 22,865Anthracene 3 2,268 317 0 0 0 2,585 862Dibenzofuran 3 1,198 268 0 0 0 1,466 489Chlorine Dioxide 3 80 90,231 0 0 0 90,311 30,104Dichloromethane[C] 2 87,981 42,805 1 0 0 130,787 65,394Methyl Methacrylate 2 25,632 2,279 0 0 0 27,911 13,9561,2,4-trimethylbenzene 2 800 25,500 0 0 0 26,300 13,150Ethylene Glycol 2 832 30,489 2,800 0 0 34,121 17,061Tetrachloroethylene[C] 2 368 2,686 0 0 0 3,054 1,527Nitric Acid 2 0 1,080 0 0 0 1,080 5401,1,1-Trichloroethane[O] 1 250 750 0 0 0 1,000 1,000Chloromethane 1 3 27,000 1 0 0 27,004 27,004Dibutyl Phthalate 1 0 19,858 0 0 0 19,858 19,858Quinoline 1 . . 0 0 0 0 01,2,4-trichlorobenzene 1 0 17,833 0 0 0 17,833 17,833Triethylamine 1 5 5 0 0 0 10 10Asbestos (Friable)[C] 1 1 1 1 0 0 3 31,1-dichloro-1-fluoroethane[O] 1 4,970 15,066 0 0 0 20,036 20,036Ozone 1 0 0 0 0 0 0 0
________ _________ _________ ________ __ _______ __________ ________397** 2,729,639 25,798,497 1,007,107 0 501,223 30,036,466 75,659
[C] Known or suspect carcinogens [M] Metals and metal compounds [O] Ozone depleters* Refer to Section III for a discussion of the TRI data and its limitations, methodology used to obtain this data, definitions of the column headings, and the definitions of carcinogens, metals, and ozone depleters.**Total number of facilities (not chemical reports) reporting to TRI in this industry sector.

Sector Notebook Data Refresh - 1997 Lumber and Wood Products
Sector Notebook Project May 1998D-3
1995 TRI Transfers For Lumber and Wood Products Facilities (SIC 24)by Number of Facilities Reporting (pounds/year)*
Chemical Name Chemical Transfers Transfers Transfers Transfers Transfers Transfers Per Facility# Reporting Potw Disposal Recycling Treatment Recovery Total Avg Transfer
Energy
Arsenic Compounds[C, M] 116 5 58,192 . 12,011 750 70,958 612Copper Compounds[M] 116 5 57,697 . 7,215 750 65,667 566Chromium Compounds[C, M] 111 0 67,720 . 8,023 . 75,743 682Formaldehyde[C] 80 520 1,722 . 1,234 2,084 5,560 70Methanol 68 205 5,945 8,775 250 22,358 37,533 552Creosote[C] 62 10,051 2,554,752 2,250 236,703 94,255 2,898,011 46,742Chromium[M] 61 17 29,960 47,220 12,338 . 89,535 1,468Arsenic[C, M] 60 4 27,670 . 8,888 . 36,562 609Copper[M] 59 18 21,459 . 4,932 . 26,409 448Phenol 31 1,112 282 255 . . 1,649 53Diisocyanates 26 5 718 . 7,725 . 8,448 325Pentachlorophenol[C] 25 900 23,938 360 47,141 14,352 86,691 3,468Ammonia 23 13,086 1,760 . 25 15 14,886 647Toluene 18 0 2,403 11,363 11,900 75,717 101,383 5,632Xylene (Mixed Isomers) 18 5 830 18,002 650 97,846 117,333 6,519Acetaldehyde[C] 15 0 286 5 . . 291 19Hydrochloric Acid (1995 and after 13 0 . 101,200 . . 101,200 7,785"Acid Aerosols" Only)Methyl Ethyl Ketone 12 0 617 4,495 . 29,036 34,148 2,846Sulfuric Acid 11 0 . . . . 0 0Zinc Compounds[M] 7 5 82,250 . 1,250 750 84,255 12,036Phosphoric Acid 7 0 . . . . 0 0Ethylbenzene 6 0 . 2,883 250 11,533 14,666 2,444Methyl Isobutyl Ketone 6 0 . 8,671 . 72,732 81,403 13,567Chlorine 6 0 . . . . 0 0Certain Glycol Ethers 5 0 . 250 5 4,545 4,800 960Nitrate Compounds 5 0 260 . . . 260 52N-butyl Alcohol 5 0 . 5,082 250 18,308 23,640 4,728Catechol 5 0 22 . . . 22 4Cresol (Mixed Isomers) 4 0 252 . . . 252 63Formic Acid 3 0 . . . . 0 0Chloroform[C] 3 0 10 . . . 10 3Naphthalene 3 2,840 250 56,532 . 250 59,872 19,957Styrene[C] 3 5 2,931 . 255 . 3,191 1,064Anthracene 3 256 250 16,420 . 750 17,676 5,892Dibenzofuran 3 253 250 25,306 . 250 26,059 8,686Chlorine Dioxide 3 0 . . . . 0 0Dichloromethane[C] 2 5 15 . 5,425 . 5,445 2,723Methyl Methacrylate 2 296 . . . . 296 1481,2,4-trimethylbenzene 2 0 . . . 2,370 2,370 1,185Ethylene Glycol 2 0 . . . . 0 0Tetrachloroethylene[C] 2 5 5 5 5,425 . 5,440 2,720Nitric Acid 2 0 . . . . 0 01,1,1-Trichloroethane[O] 1 0 . . . . 0 0Chloromethane 1 0 . . . . 0 0Dibutyl Phthalate 1 0 . 504 . 1,465 1,969 1,969Quinoline 1 0 . . . 250 250 2501,2,4-trichlorobenzene 1 0 . . . . 0 0Triethylamine 1 0 . . . . 0 0Asbestos (Friable)[C] 1 0 10,478 . . . 10,478 10,4781,1-dichloro-1-fluoroethane[O] 1 0 . . 1,278 . 1,278 1,278Ozone 1 0 . . . . 0 0
______ _______ _________ _______ _______ _______ _________ ________397** 29,598 2,952,924 309,578 373,173 450,366 4,115,639 10,367
[C] Known or suspect carcinogens [M]Metals and metal compounds [O] Ozone depleters* Refer to Section III for a discussion of the TRI data and its limitations, methodology used to obtain this data, definitions of the column headings, and the definitions of carcinogens, metals, and ozone depleters.**Total number of facilities (not chemical reports) reporting to TRI in this industry sector.

Sector Notebook Data Refresh - 1997 Lumber and Wood Products
Being included on this list does not mean that the release is associated with non-compliance with environmental laws.1
Sector Notebook Project May 1998D-4
Ten Largest Volume TRI Releasing Lumber and Wood Facilities Reporting Only SIC 24*
Rank Facility Pounds1Total TRI Releases in
1 Fiber Prods. Ops., Diboll, Texas 490,005
2 Roseburg Forest Prods., Dillard, Oregon 468,890
3 Afco Ind. Inc., Holland, Michigan 438,160
4 International Paper, Nacogdoches,Texas 384,322
5 Potlatch Corp., Bemidji, Minnesota 367,194
6 Willamette Ind. Inc., Bennettsville, South Carolina 326,760
7 Plum Creek Mfg. L.p., Columbia Falls, Montana 315,250
8 Georgia-Pacific Corp., Catawba, South Carolina 289,563
9 ABT Co. Inc., Roaring River, North Carolina 278,015
10 Potlatch Corp., Cook, Minnesota 239,022
Source: US EPA 1995 Toxics Release Inventory Database.*Refer to Section III for a general discussion of TRI data and its limitations. A discussion of the methodology used to develop this table can be found under the heading Ten Largest Volume TRI Releasing Facilities.
Ten Largest Volume TRI Releasing Facilities Reporting Only SIC 24 or SIC 24 andOther SIC Codes*
Rank Facility Releases in1SIC Codes Reported in TRI Total TRI
Pounds
1 Weyerhaeuser Co., Longview, Washington 2421, 2429, 2493, 2611, 2621, 5,705,7462812
2 Union Camp Corp., Franklin, Virginia 2493, 2611, 2621, 2631, 2679 3,109,682
3 Weyerhaeuser Co., Springfield, Oregon 2436, 2499, 2631 2,436,284
4 Potlatch Corp., Lewiston, Idaho 2421, 2429, 2611, 2621, 2631 1,850,510
5 Macmillan Bloedel Packaging, Pine Hill, Alabama 2421, 2436, 2621 1,377,468
6 Broyhill Furniture Ind. Inc., Lenoir, North Carolina 2493, 2511 1,227,679
7 Broyhill Furniture Ind. Inc., Lenoir, North Carolina 2435, 2436, 2511 597,794
8 Fiber Prods. Ops., Diboll, Texas 2493 490,005
9 Roseburg Forest Prods., Dillard, Oregon 2435, 2436 468,890
10 Afco Ind. Inc., Holland, Michigan 2493 438,160
Source: US EPA Toxics Release Inventory Database, 1995.*Refer to Section III for a general discussion of TRI data and its limitations. A discussion of the methodology used to develop this table can be found under the heading Ten Largest Volume TRI Releasing Facilities.

Sector Notebook Data Refresh - 1997 Lumber and Wood Products
Sector Notebook Project May 1998D-5
Source Reduction and Recycling Activity for Lumber and Wood Products Facilities (SIC 24) as Reported within TRI*
A B C JOn-Site Off-Site
Year (10 lbs.) Transferred Off-siteRecycled Recovery % Treated Recycled Recovery % Treated
Quantity of %Production- Released
Related % Released andWaste and Disposed% % Energy % % Energy
6 a b
c
D E F G H I
1994 156 105% 9% 4% 64% 0% 0% 0% 23%
1995 137 25% 22% 5% 48% 0% 0% 0% 26%
1996 133 --- 18% 6% 51% 0% 0% 0% 25%
1997 132 --- 18% 6% 52% 0% 0% 0% 23%
Source: 1995 Toxics Release Inventory Database. * Refer to Section III for a general discussion of TRI data and its limitations. A discussion of the methodology used todevelop this table can be found under the heading Source Reduction and Recycling Activity. Within this industry sector, non-production related waste < 1% of production related wastes for 1995.a
Total TRI transfers and releases as reported in Section 5 and 6 of Form R as a percentage of production related wastes.b
Percentage of production related waste released to the environment and transferred off-site for disposal.c

Sector Notebook Data Refresh - 1997 Lumber and Wood Products
Sector Notebook Project May 1998D-6
Five-Year Enforcement and Compliance Summary for the Lumber and Wood Industry*
A B C D E F G H I JRegion Facilities Facilities Number of Average Facilities with Total Percent Percent Enforcement
in Search Inspected Inspections Months 1 or More Enforcement State Federal to InspectionBetween Enforcement Actions Lead Lead Rate
Inspections Actions Actions Actions
I 14 9 21 40 4 4 75% 25% 0.19
II 19 10 37 31 2 3 67% 33% 0.08
III 82 57 406 12 14 47 87% 13% 0.12
IV 238 154 1,106 13 45 67 75% 25% 0.06
V 134 85 399 20 26 52 62% 38% 0.13
VI 82 51 292 17 16 48 56% 44% 0.16
VII 24 20 87 17 3 3 67% 33% 0.03
VIII 23 17 69 20 5 10 80% 20% 0.14
IX 32 21 105 18 6 9 67% 33% 0.09
X 64 49 245 16 13 22 64% 36% 0.09
TOTAL 712 473 2,767 15 134 265 70% 30% 0.10
*Data obtained from EPA’s Integrated Data for Enforcement Analysis (IDEA) System. For a description of IDEA and the methods used to obtain this data, refer to Section II.C. A discussion of this table can be found under the heading, Five-Year Enforcement and Compliance Summary, in Section III.

Sector Notebook Data Refresh - 1997 Wood Furniture and Fixtures
Sector Notebook Project May 1998E-1
Wood Furniture and Fixtures

Sector Notebook Data Refresh - 1997 Wood Furniture and Fixtures
Sector Notebook Project May 1998E-2
1995 TRI Releases for Wood Furniture and Fixtures Facilities (SIC 25) by Number of Facilities Reporting (pounds/year)*
Chemical Name Chemical Air Air Discharges Injection Disposal Releases Per Facility# Reporting Fugitive Point Water Underground Land Total Avg. Releases
Toluene 266 1,479,594 10,234,554 755 0 589 11,715,492 44,043Xylene (Mixed Isomers) 196 1,124,999 6,136,999 7 0 743 7,262,748 37,055Methanol 168 618,719 7,267,279 5 0 300 7,886,303 46,942Methyl Ethyl Ketone 155 423,104 3,796,245 5 0 196 4,219,550 27,223N-butyl Alcohol 88 102,744 1,960,001 5 0 0 2,062,750 23,440Methyl Isobutyl Ketone 65 147,567 1,156,207 5 0 304 1,304,083 20,063Certain Glycol Ethers 40 128,099 676,581 0 0 0 804,680 20,117Ethylbenzene 34 173,918 608,582 0 0 250 782,750 23,022Dichloromethane[C] 14 289,120 117,566 0 0 0 406,686 29,0491,1,1-Trichloroethane[O] 13 71,483 283,845 0 0 0 355,328 27,3331,2,4-trimethylbenzene 9 50,890 251,112 0 0 0 302,002 33,556Isopropyl Alcohol (Manufacturing, 8 16,132 215,177 0 0 0 231,309 28,914Strong-acid Process Only)Phosphoric Acid 8 1,083 10 0 0 0 1,093 137Formaldehyde[C] 7 39,365 1,536 0 0 0 40,901 5,843Styrene[C] 7 18,422 38,184 0 0 0 56,606 8,087Diisocyanates 3 170 0 0 0 0 170 57Trichloroethylene[C] 3 1,470 62,133 0 0 0 63,603 21,201Cumene 3 2,102 14,186 0 0 0 16,288 5,429N-hexane 3 32,152 22,486 0 0 0 54,638 18,213Barium Compounds[M] 2 250 0 0 0 0 250 125Naphthalene 2 10 200 0 0 0 210 105Nickel[C, M] 2 0 0 0 0 0 0 0Hydrochloric Acid (1995 and after 2 0 0 0 0 0 0 0"Acid Aerosols" Only)Chromium Compounds[C, M] 1 0 0 0 0 0 0 0Chlorodifluoromethane[O] 1 5,483 0 0 0 0 5,483 5,483Dibutyl Phthalate 1 0 19,858 0 0 0 19,858 19,858Toluene-2,6-diisocyanate[C] 1 0 0 0 0 0 0 0Ethylene Glycol 1 3 57 0 0 0 60 60Maleic Anhydride 1 0 11 0 0 0 11 11Phenol 1 0 3 0 0 0 3 3Cyclohexane 1 1 24 0 0 0 25 251,2,4-trichlorobenzene 1 10 190 0 0 0 200 200Tetrachloroethylene[C] 1 16,236 0 0 0 0 16,236 16,236Dimethyl Phthalate 1 5,300 5,300 0 0 0 10,600 10,600Toluene-2,4-diisocyanate[C] 1 0 0 0 0 0 0 0Manganese[M] 1 250 0 0 0 0 250 250Chromium[M] 1 5 0 0 0 0 5 5Sulfuric Acid 1 0 0 0 0 0 0 0
_______ ________ _________ ___ _ _____ _________ ________336** 4,748,681 32,868,326 782 0 2,382 37,620,171 111,965
[C] Known or suspect carcinogens [M] Metals and metal compounds [O] Ozone depleters* Refer to Section III for a discussion of the TRI data and its limitations, methodology used to obtain this data, definitions of the column headings, and the definitions of carcinogens, metals, and ozone depleters.**Total number of facilities (not chemical reports) reporting to TRI in this industry sector.

Sector Notebook Data Refresh - 1997 Wood Furniture and Fixtures
Sector Notebook Project May 1998E-3
1995 TRI Transfers for Wood Furniture and Fixtures Facilities (SIC 25) by Number and Facilities Reporting (pounds/year)*
Chemical Name Chemical Transfers Transfers Transfers Transfers Transfers Transfers Per Facility# Reporting Potw Disposal Recycling Treatment Recovery Total Avg Transfer
Energy
Toluene 266 3,825 16,916 634,154 152,451 1,460,126 2,267,472 8,524Xylene (Mixed Isomers) 196 2,071 14,540 1,273,598 74,288 2,324,632 3,689,129 18,822Methanol 168 1,749 15,480 705,472 30,860 498,109 1,251,920 7,452Methyl Ethyl Ketone 155 30,229 15,403 322,439 75,831 402,507 846,409 5,461N-butyl Alcohol 88 25 5 21,996 14,196 79,812 116,034 1,319Methyl Isobutyl Ketone 65 461 14,502 78,922 40,750 181,165 315,800 4,858Certain Glycol Ethers 40 12,510 750 23,646 8,541 67,251 112,698 2,817Ethylbenzene 34 750 13,702 373,132 250 351,736 739,570 21,752Dichloromethane[C] 14 0 . 23,600 19,700 18,697 61,997 4,4281,1,1-Trichloroethane[O] 13 0 . 10,185 . 2,434 12,619 9711,2,4-trimethylbenzene 9 255 . 123,211 . 220,906 344,372 38,264Isopropyl Alcohol (Manufacturing, 8 0 . 8,039 . 16,182 24,221 3,028Strong-acid Process Only)Phosphoric Acid 8 29,823 . . 8,800 0 38,623 4,828Formaldehyde[C] 7 250 . . 250 5 505 72Styrene[C] 7 0 . . 250 . 250 36Diisocyanates 3 0 . . . . 0 0Trichloroethylene[C] 3 0 . 666 . . 666 222Cumene 3 0 . . 250 8,740 8,990 2,997N-hexane 3 0 . . . 36,184 36,184 12,061Barium Compounds[M] 2 0 750 1,406 . . 2,156 1,078Naphthalene 2 0 . . 250 . 250 125Nickel[C, M] 2 308 900 6,200 696 . 8,104 4,052Hydrochloric Acid (1995 and after 2 0 . . . 0 0 0"Acid Aerosols" Only)Chromium Compounds[C, M] 1 20 . 1,400 . . 1,420 1,420Chlorodifluoromethane[O] 1 0 . . . . 0 0Dibutyl Phthalate 1 0 . 504 . 1,465 1,969 1,969Toluene-2,6-diisocyanate[C] 1 0 . . . . 0 0Ethylene Glycol 1 0 . . . . 0 0Maleic Anhydride 1 1,173 . . 996 . 2,169 2,169Phenol 1 0 . . 5 . 5 5Cyclohexane 1 0 . . 250 . 250 2501,2,4-trichlorobenzene 1 0 . . 250 . 250 250Tetrachloroethylene[C] 1 0 . . . . 0 0Dimethyl Phthalate 1 0 . . . . 0 0Toluene-2,4-diisocyanate[C] 1 0 . . . . 0 0Manganese[M] 1 0 . 5,800 . . 5,800 5,800Chromium[M] 1 0 . 12,000 . . 12,000 12,000Sulfuric Acid 1 0 . . . . 0 0
______ ______ ______ ________ _______ ________ ________ _______336** 83,449 92,948 3,626,370 428,864 5,669,951 9,901,832 29,470
[C] Known or suspect carcinogens [M] Metals and metal compounds [O] Ozone depleters* Refer to Section III for a discussion of the TRI data and its limitations, methodology used to obtain this data, definitions of the column headings, and the definitions of carcinogens, metals, and ozone depleters.**Total number of facilities (not chemical reports) reporting to TRI in this industry sector.

Sector Notebook Data Refresh - 1997 Wood Furniture and Fixtures
Being included on this list does not mean that the release is associated with non-compliance with environmental laws.1
Sector Notebook Project May 1998E-4
Ten Largest Volume TRI Releasing Furniture and Fixtures Facilities Reporting OnlySIC 25*
Rank Facility Pounds1Total TRI Releases in
1 Peters-Revington Furniture, Delphi, Indiana 746,952
2 J. D. Bassett Mfg. Co., Bassett, Virginia 617,062
3 Singer Furniture Co., Lenoir, North Carolina 615,871
4 Lane Co. Inc., Altavista,Virginia 530,931
5 Stanley Furniture Co., Stanleytown,Virginia 504,289
6 Florida Furniture Ind. Inc., Palatka, Florida 481,000
7 Johnston-Tombigbee Furniture, Columbus, Mississippi 433,086
8 Florida Furniture Ind. Inc., Palatka, Florida 419,000
9 Pulaski Furniture Corp., Dublin,Virginia 410,513
10 Bassett Furniture Ind., Dublin, Georgia 402,762
Source: US EPA 1995 Toxics Release Inventory Database.*Refer to Section III for a general discussion of TRI data and its limitations. A discussion of the methodology used to develop this table can be found under the heading Ten Largest Volume TRI Releasing Facilities.
Ten Largest Volume TRI Releasing Facilities Reporting Only SIC 25 or SIC 25 andOther SIC Codes*
Rank Facility Releases in1SIC Codes Reported in TRI Total TRI
Pounds
1 Broyhill Furniture Ind. Inc., Lenoir, North Carolina 2493, 2511 1,227,679
2 Steelcase Inc., Grand Rapids, Michigan 2521, 2522, 2542 1,133,192
3 Peters-Revington Furniture, Delphi, Indiana 2511 746,952
4 J. D. Bassett Mfg. Co., Bassett, Virginia 2511 617,062
5 Singer Furniture Co., Lenoir, North Carolina 2511 615,871
6 Broyhill Furniture Ind. Inc., Lenoir, North Carolina 2511, 2435, 2436 597,794
7 Lane Co. Inc., Altavista, Virginia 2511 530,931
8 Stanley Furniture Co., Stanleytown, Virginia 2511 504,289
9 Florida Furniture Ind. Inc., Palatka, Florida 2511 481,000
10 Aristokraft Inc., Jasper, Indiana 2434, 2517 452,800
Source: US EPA Toxics Release Inventory Database, 1995.*Refer to Section III for a general discussion of TRI data and its limitations. A discussion of the methodology used to develop this table can be found under the heading Ten Largest Volume TRI Releasing Facilities.
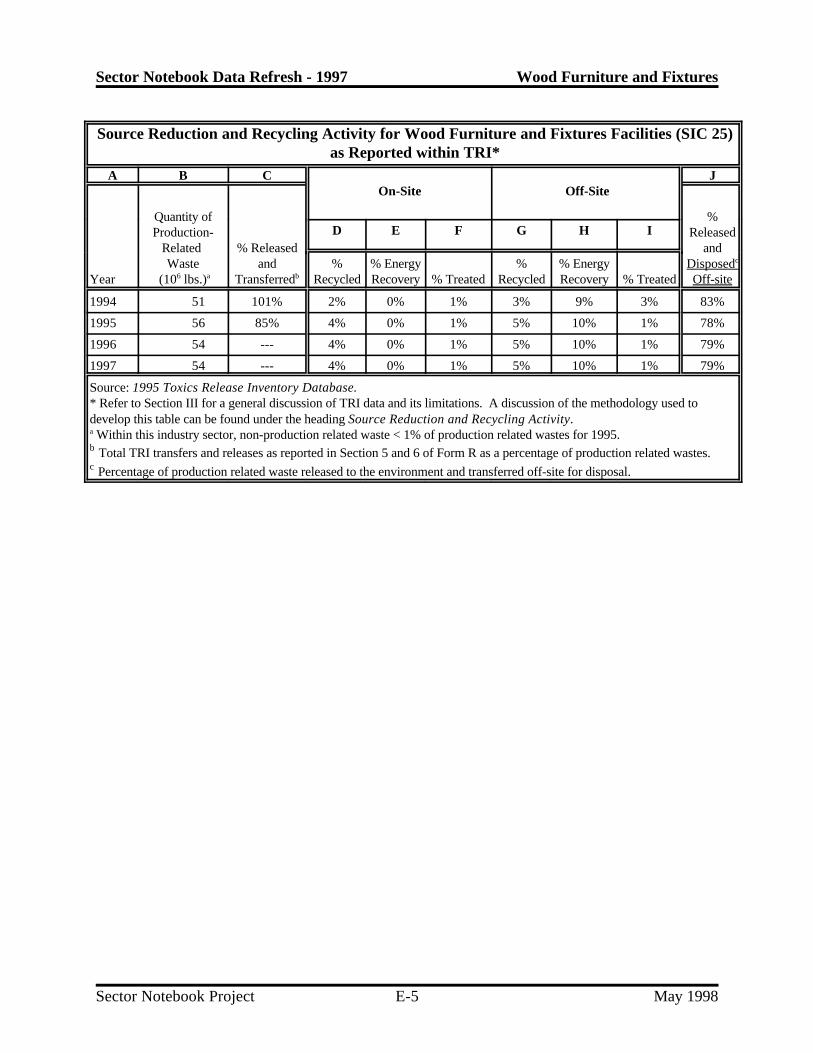
Sector Notebook Data Refresh - 1997 Wood Furniture and Fixtures
Sector Notebook Project May 1998E-5
Source Reduction and Recycling Activity for Wood Furniture and Fixtures Facilities (SIC 25)as Reported within TRI*
A B C JOn-Site Off-Site
Year (10 lbs.) Transferred Off-siteRecycled Recovery % Treated Recycled Recovery % Treated
Quantity of %Production- Released
Related % Released andWaste and Disposed% % Energy % % Energy
6 a b
c
D E F G H I
1994 51 101% 2% 0% 1% 3% 9% 3% 83%
1995 56 85% 4% 0% 1% 5% 10% 1% 78%
1996 54 --- 4% 0% 1% 5% 10% 1% 79%
1997 54 --- 4% 0% 1% 5% 10% 1% 79%
Source: 1995 Toxics Release Inventory Database. * Refer to Section III for a general discussion of TRI data and its limitations. A discussion of the methodology used todevelop this table can be found under the heading Source Reduction and Recycling Activity. Within this industry sector, non-production related waste < 1% of production related wastes for 1995.a
Total TRI transfers and releases as reported in Section 5 and 6 of Form R as a percentage of production related wastes.b
Percentage of production related waste released to the environment and transferred off-site for disposal.c

Sector Notebook Data Refresh - 1997 Wood Furniture and Fixtures
Sector Notebook Project May 1998E-6
Five-Year Enforcement and Compliance Summary for the Wood Furniture and Fixtures Industry*
A B C D E F G H I JRegion Facilities Facilities Number of Average Facilities with Total Percent Percent Enforcement
in Search Inspected Inspections Months 1 or More Enforcement State Federal to InspectionBetween Enforcement Actions Lead Lead Rate
Inspections Actions Actions Actions
I 16 14 64 15 2 1 100% 0% 0.02
II 21 15 52 24 2 1 100% 0% 0.02
III 61 51 356 10 10 18 83% 17% 0.05
IV 186 162 1,305 9 25 35 86% 14% 0.03
V 108 78 337 19 15 23 87% 13% 0.07
VI 30 22 96 19 1 2 100% 0% 0.02
VII 21 17 85 15 5 6 67% 33% 0.07
VIII 13 9 30 26 2 2 50% 50% 0.07
IX 33 10 33 60 0 0 0% 0% --
X 10 8 21 29 3 3 100% 100% 0.14
TOTAL 499 386 2,379 13 65 91 19% 19% 0.04
*Data obtained from EPA’s Integrated Data for Enforcement Analysis (IDEA) System. For a description of IDEA and the methods used toobtain this data, refer to Section II.C. A discussion of this table can be found under the heading, Five-Year Enforcement and ComplianceSummary, in Section III.
Sector Notebook Data Refresh - 1997 Pulp and Paper
Sector Notebook Project May 1998F-1
Pulp and Paper

Sector Notebook Data Refresh - 1997 Pulp and Paper
Sector Notebook Project May 1998F-2
1995 TRI Releases for Pulp and Paper Facilities (SICS 2611 - 2631) by Number of Facilities Reporting (pounds/year)*
Chemical Name Chemical Air Air Discharges Injection Disposal Releases Per Facility# Reporting Fugitive Point Water Underground Land Total Avg. Releases
Ammonia 197 458,947 11,480,155 2,662,738 0 29,451 14,631,291 74,271Methanol 175 8,832,019 121,189,529 6,698,626 0 1,289,953 138,010,127 788,629Hydrochloric Acid 161 14,270 24,262,290 630 0 0 24,277,190 150,790Chlorine 154 109,835 1,291,237 79,852 0 5 1,480,929 9,616Sulfuric Acid 148 893 12,913,084 1,161 0 250 12,915,388 87,266Acetaldehyde[C] 124 540,470 8,250,267 204,670 0 17,385 9,012,792 72,684Phosphoric Acid 123 578 29 7,917 220 370 9,114 74Catechol 106 579 505 24,545 0 3,729 29,358 277Phenol 99 14,209 935,873 15,124 0 8,025 973,231 9,831Chlorine Dioxide 95 8,666 1,271,494 0 0 0 1,280,160 13,475Chloroform[C] 81 3,079,137 6,434,460 315,561 0 4,297 9,833,455 121,401Formic Acid 72 1,958 9,761 0 0 0 11,719 163Formaldehyde[C] 60 57,371 1,678,059 82,435 0 7,306 1,825,171 30,420Methyl Ethyl Ketone 58 67,233 1,452,974 41,796 0 4,981 1,566,984 27,017Nitrate Compounds 54 0 0 7,950,016 0 2,601 7,952,617 147,271Zinc Compounds[M] 49 31 238,241 347,553 0 2,171,080 2,756,905 56,263Cresol (Mixed Isomers) 40 4,111 888,000 10,176 0 1,208 903,495 22,587Nitric Acid 22 32 1,322 0 0 0 1,354 62Certain Glycol Ethers 19 22,219 110,141 27,394 0 603 160,357 8,440Chloromethane 16 76 563,300 14 0 5 563,395 35,212Ethylene Glycol 16 6,699 36,045 36,832 0 1,449 81,025 5,064Toluene 14 287,724 984,541 2,420 0 2 1,274,687 91,049Copper Compounds[M] 7 0 261 1,370 0 1,800 3,431 490Chromium Compounds[C, M] 6 270 1,170 54,100 0 39,505 95,045 15,841Xylene (Mixed Isomers) 6 3,980 103,325 337 0 0 107,642 17,940Benzene[C] 5 18 693,800 6 0 2 693,826 138,765Naphthalene 5 11,788 78,310 965 0 33 91,096 18,219N-butyl Alcohol 4 32,760 64,511 5,234 0 0 102,505 25,626Dichloromethane[C] 4 163,019 54,491 172 0 5 217,687 54,422Styrene[C] 4 11,890 101,796 285 0 0 113,971 28,493Dazomet 4 630 370 230 0 0 1,230 308Antimony Compounds[M] 3 0 0 0 0 250 250 83Barium Compounds[M] 3 0 500 8,930 0 35,265 44,695 14,8981,2,4-trimethylbenzene 3 28,500 8,050 500 0 750 37,800 12,600Diethanolamine 3 540 2,060 700 0 0 3,300 1,100Decabromodiphenyl Oxide 3 0 0 0 0 500 500 167Manganese Compounds[M] 2 8 6 470 0 0 484 242Nickel Compounds[C, M] 2 0 750 250 0 90,000 91,000 45,500Acrylic Acid 2 1 300 36 0 0 337 169Methyl Isobutyl Ketone 2 50 23,520 0 0 1 23,571 11,786N-hexane 2 166,918 160,588 0 0 0 327,506 163,753Propylene 2 0 36,000 0 0 0 36,000 18,000Potassium Dimethyldithiocarbamate 2 0 0 5 0 0 5 3Sodium Dimethyldithiocarbamate 2 0 0 0 0 0 0 0Manganese[M] 2 5 1,175 69,431 0 0 70,611 35,306Copper[M] 2 0 1,900 298 0 1,810 4,008 2,004Sodium Nitrite 2 0 45,000 0 0 0 45,000 22,500Hydrogen Fluoride 2 0 86,896 0 0 0 86,896 43,448Ozone 2 5 0 0 0 0 5 3C.I. Direct Blue 218 2 0 0 6 0 0 6 3Mercury Compounds[M] 1 1,000 450 110 0 0 1,560 1,560Nicotine and Salts 1 4,823 3,029 750 0 0 8,602 8,602Polychlorinated Alkanes 1 0 0 0 0 0 0 0Chlorodifluoromethane[O] 1 14,000 0 0 0 0 14,000 14,000Dichlorodifluoromethane[O] 1 10,000 0 0 0 0 10,000 10,000Dibutyl Phthalate 1 0 0 0 0 0 0 0Biphenyl 1 5,000 0 80 0 0 5,080 5,080O-xylene 1 3 48,000 0 0 1 48,004 48,004Ethylbenzene 1 510 70 0 0 0 580 580

Sector Notebook Data Refresh - 1997 Pulp and Paper
1995 TRI Releases for Pulp and Paper Facilities (SICS 2611 - 2631) by Number of Facilities Reporting (pounds/year)*
Chemical Name Chemical Air Air Discharges Injection Disposal Releases Per Facility# Reporting Fugitive Point Water Underground Land Total Avg. Releases
Sector Notebook Project May 1998F-3
Acrolein 1 0 54,000 0 0 0 54,000 54,000Maleic Anhydride 1 210 230 0 0 0 440 440Nabam 1 0 0 0 0 0 0 0Asbestos (Friable)[C] 1 1 1 1 0 0 3 3Mercury[M] 1 0 0 0 0 0 0 0Silver[M] 1 0 0 0 0 0 0 0Antimony[M] 1 0 0 0 0 250 250 250Zinc (Fume or Dust)[M] 1 0 367,965 1,309 0 240,950 610,224 610,224
_______ _________ __________ _________ ____ ________ __________ ______305** 13,962,986 195,929,831 18,735,235 220 3,953,822 232,582,094 762,564
[C] Known or suspect carcinogens [M] Metals and metal compounds [O] Ozone depleters* Refer to Section III for a discussion of the TRI data and its limitations, methodology used to obtain this data, definitions of the column headings, and the definitions of carcinogens, metals, and ozone depleters.**Total number of facilities (not chemical reports) reporting to TRI in this industry sector.

Sector Notebook Data Refresh - 1997 Pulp and Paper
Sector Notebook Project May 1998F-4
1995 TRI Transfers For Pulp and Paper Facilities (SICS 2611 - 2631)by Number of Facilities Reporting (pounds/year)*
Chemical Name Chemical Transfers Transfers Transfers Transfers Recovery Transfers Per Facility# Reporting Potw Disposal Recycling Treatment Energy Total Avg. Transfer
Ammonia 197 706,520 26,692 . 7,092 . 740,304 3,758Methanol 175 39,983,720 144,339 3,436,333 7,454,726 98,735 51,118,103 292,103Hydrochloric Acid(Acid ” Aerosols" Only) 161 250 255 . 12,500 . 13,005 81Chlorine 154 14,261 0 . 0 . 14,261 93Sulfuric Acid 148 10 5 200 300 . 515 3Acetaldehyde[C] 124 82,996 601 5 26,384 14,870 124,856 1,007Phosphoric Acid 123 1,392 0 . 573 . 1,965 16Catechol 106 76,104 443 . 774 90,363 167,684 1,582Phenol 99 204,490 3,116 5 6,265 14,005 227,881 2,302Chlorine Dioxide 95 0 0 . 0 . 0 0Chloroform[C] 81 306,379 3,159 250 12,165 . 321,953 3,975Formic Acid 72 253,432 90 . 0 . 253,522 3,521Formaldehyde[C] 60 39,773 17,306 . 45,310 3,147 105,536 1,759Methyl Ethyl Ketone 58 23,600 965 23,962 16,505 15,500 80,532 1,388Nitrate Compounds 54 8,559 13,065 . . . 21,624 400Zinc Compounds[M] 49 35,930 1,726,814 14,000 249,352 . 2,026,096 41,349Cresol (Mixed Isomers) 40 2,419 541 . 1,800 3,150 7,910 198Nitric Acid 22 0 . . 660 . 660 30Certain Glycol Ethers 19 20,042 575 . 45,301 . 65,918 3,469Chloromethane 16 250 0 . 5 . 255 16Ethylene Glycol 16 21,885 230 . 11 . 22,126 1,383Toluene 14 0 10 9,726 8,034 394,852 412,622 29,473Copper Compounds[M] 7 1,897 40,980 6,522 . . 49,649 7,093Chromium Compounds[C, M] 6 950 19,775 . . . 20,725 3,454Xylene (Mixed Isomers) 6 0 . 391 420 7,765 8,576 1,429Benzene[C] 5 0 . . . . 0 0Naphthalene 5 0 . 53,000 . . 53,000 10,600N-butyl Alcohol 4 0 . . 35,342 . 35,342 8,836Dichloromethane[C] 4 0 10 . . . 10 3Styrene[C] 4 0 10 . . . 10 3Dazomet 4 0 . . 0 . 0 0Antimony Compounds[M] 3 250 12,800 . . . 13,050 4,350Barium Compounds[M] 3 0 41,015 2,500 . . 43,515 14,5051,2,4-trimethylbenzene 3 250 255 250 2,100 . 2,855 952Diethanolamine 3 51,000 61 . 17 . 51,078 17,026Decabromodiphenyl Oxide 3 750 28,029 . . . 28,779 9,593Manganese Compounds[M] 2 0 16,557 . . . 16,557 8,279Nickel Compounds[C, M] 2 0 94,000 . . . 94,000 47,000Acrylic Acid 2 0 . . . . 0 0Methyl Isobutyl Ketone 2 0 . . . . 0 0N-hexane 2 0 . . 287 18,528 18,815 9,408Propylene 2 0 . . . . 0 0Potassium Dimethyldithiocarbamate 2 0 . . . . 0 0Sodium Dimethyldithiocarbamate 2 0 . . . . 0 0Manganese[M] 2 0 27,412 . . . 27,412 13,706Copper[M] 2 0 . . . . 0 0Sodium Nitrite 2 0 . . . . 0 0Hydrogen Fluoride 2 0 . . . . 0 0Ozone 2 0 . . . . 0 0C.I. Direct Blue 218 2 73 1,400 . . . 1,473 737Mercury Compounds[M] 1 0 1,511 . . . 1,511 1,511Nicotine and Salts 1 0 6,043 . . . 6,043 6,043Polychlorinated Alkanes 1 0 231,700 . . . 231,700 231,700Chlorodifluoromethane[O] 1 0 . . . . 0 0Dichlorodifluoromethane[O] 1 0 . . . . 0 0Dibutyl Phthalate 1 0 . . . 2,082 2,082 2,082Biphenyl 1 0 560 . . . 560 560O-xylene 1 0 . . . . 0 0Ethylbenzene 1 0 . . 100 850 950 950

Sector Notebook Data Refresh - 1997 Pulp and Paper
1995 TRI Transfers For Pulp and Paper Facilities (SICS 2611 - 2631)by Number of Facilities Reporting (pounds/year)*
Chemical Name Chemical Transfers Transfers Transfers Transfers Recovery Transfers Per Facility# Reporting Potw Disposal Recycling Treatment Energy Total Avg. Transfer
Sector Notebook Project May 1998F-5
Acrolein 1 0 . . . . 0 0Maleic Anhydride 1 0 . . . . 0 0Nabam 1 0 . . . . 0 0Asbestos (Friable)[C] 1 0 10,478 . . . 10,478 10,478Mercury[M] 1 0 . . 4 . 4 4Silver[M] 1 0 . . 2 . 2 2Antimony[M] 1 250 . . . . 250 250Zinc (Fume or Dust)[M] 1 0 . . . . 0 0
________ __________ ________ _________ ________ _______ __________ _______305** 41,865,048 2,470,802 3,547,144 7,926,029 663,847 56,473,370 185,159
[C] Known or suspect carcinogens [M] Metals and metal compounds [O] Ozone depleters* Refer to Section III for a discussion of the TRI data and its limitations, methodology used to obtain this data, definitions of the column headings, and the definitions of carcinogens, metals, and ozone depleters.**Total number of facilities (not chemical reports) reporting to TRI in this industry sector.

Sector Notebook Data Refresh - 1997 Pulp and Paper
Being included on this list does not mean that the release is associated with non-compliance with environmental laws.1
Sector Notebook Project May 1998F-6
Ten Largest Volume TRI Releasing Pulp and Paper Facilities Reporting Only SICS 2611 - 2631*
Rank Facility Pounds1Total TRI Releases in
1 Westvaco Corp., Covington, Virginia 4,753,321
2 Finch Pruyn & Co. Inc., Glens Falls, New York 4,561,665
3 Champion Intl. Corp., Canton, North Carolina 4,404,470
4 Westvaco Corp., North Charleston, South Carolina 3,834,983
5 Federal Paper Board Co. Inc., Riegelwood, North Carolina 3,714,811
6 International Paper, Georgetown, South Carolina 3,361,778
7 Mead Coated Board Inc., Cottonton, Alabama 3,356,653
8 International Paper, Mansfield, Louisiana 3,191,457
9 Great Southern Paper, Cedar Springs, Georgia 3,156,127
10 Inland Container Corp., Rome, Georgia 3,082,005
Source: US EPA 1995 Toxics Release Inventory Database.*Refer to Section III for a general discussion of TRI data and its limitations. A discussion of the methodology used to develop this table can be found under the heading Ten Largest Volume TRI Releasing Facilities.
Ten Largest Volume TRI Releasing Facilities Reporting Only SICS 2611 - 2631or SICS 2611 - 2631 and Other SIC Codes*
Rank Facility SIC Codes Reported in TRI Releases1Total TRI
in Pounds
1 Weyerhaeuser Co., Longview, Washington 2421, 2429, 2493, 2611, 2621, 5,705,7462812
2 Westvaco Corp., Covington, Virginia 2631 4,753,321
3 Finch Pruyn & Co. Inc., Glens Falls, New York 2611, 2621 4,561,665
4 Champion Intl. Corp., Canton, North Carolina 2621 4,404,470
5 Westvaco Corp., North Charleston, South Carolina 2611, 2631 3,834,983
6 Federal Paper Board Co. Inc., Riegelwood, North 2611, 2621, 2631 3,714,811Carolina
7 International Paper, Georgetown, South Carolina 2611, 2621 3,361,778
8 Mead Coated Board Inc., Cottonton, Alabama 2631 3,356,653
9 International Paper, Mansfield, Louisiana 2631 3,191,457
10 Great Southern Paper, Cedar Springs, Georgia 2631 3,156,127
Source: US EPA Toxics Release Inventory Database, 1995.*Refer to Section III for a general discussion of TRI data and its limitations. A discussion of the methodology used to develop this table can be found under the heading Ten Largest Volume TRI Releasing Facilities.

Sector Notebook Data Refresh - 1997 Pulp and Paper
Sector Notebook Project May 1998F-7
Source Reduction and Recycling Activity for Pulp and Paper Facilities (SICs 2611-2631)as Reported within TRI*
A B C JOn-Site Off-Site
Year (10 lbs.) Transferred Off-siteRecycled Recovery % Treated Recycled Recovery % Treated
Quantity ofProduction- % Released
Related % Released andWaste and Disposed% % Energy % % Energy
6 a b
c
D E F G H I
1994 1,930 15% 3% 10% 72% 0% 0% 3% 12%
1995 1,744 17% 2% 11% 71% 0% 0% 3% 14%
1996 1,818 --- 2% 10% 72% 0% 0% 3% 13%
1997 1,764 --- 2% 11% 71% 0% 0% 3% 14%
Source: 1995 Toxics Release Inventory Database. * Refer to Section III for a general discussion of TRI data and its limitations. A discussion of the methodology used to developthis table can be found under the heading Source Reduction and Recycling Activity. Within this industry sector, non-production related waste < 1% of production related wastes for 1995.a
Total TRI transfers and releases as reported in Section 5 and 6 of Form R as a percentage of production related wastes.b
Percentage of production related waste released to the environment and transferred off-site for disposal.c

Sector Notebook Data Refresh - 1997 Pulp and Paper
Sector Notebook Project May 1998F-8
Five-Year Enforcement and Compliance Summary for the Pulp and Paper Industry*
A B C D E F G H I JRegion Facilities Facilities Number of Average Facilities with Total Percent Percent Enforcement
in Search Inspected Inspections Months 1 or More Enforcement State Federal to InspectionBetween Enforcement Actions Lead Lead Rate
Inspections Actions Actions Actions
I 54 52 433 7 16 32 50% 50% 0.07
II 32 28 291 7 14 52 88% 12% 0.18
III 44 41 606 4 11 46 98% 2% 0.08
IV 113 99 1,382 5 31 138 88% 12% 0.10
V 147 122 948 9 30 54 48% 52% 0.06
VI 32 31 386 5 24 47 77% 23% 0.12
VII 10 9 54 11 1 1 100% 0% 0.02
VIII 2 2 32 4 1 4 0% 100% 0.13
IX 22 18 135 10 5 13 92% 8% 0.10
X 28 28 363 5 17 91 85% 15% 0.25
TOTAL 484 430 4,630 6 150 478 80% 20% 0.10
*Data obtained from EPA’s Integrated Data for Enforcement Analysis (IDEA) System. For a description of IDEA and the methods used toobtain this data, refer to Section II.C. A discussion of this table can be found under the heading, Five-Year Enforcement and ComplianceSummary, in Section III.

Sector Notebook Data Refresh - 1997 Printing
Sector Notebook Project May 1998G-1
Printing

Sector Notebook Data Refresh - 1997 Printing
Sector Notebook Project May 1998G-2
1995 TRI Releases for Printing Facilities (2711 - 2789) by Number of Facilities Reporting (pounds/year)*
Chemical Name Chemical Air Air Discharges Injection Disposal Releases Per Facility# Reporting Fugitive Point Water Underground Land Total Avg. Releases
Toluene 106 15,454,685 11,321,925 58 0 172 26,776,840 252,612Certain Glycol Ethers 82 535,072 649,284 260 0 0 1,184,616 14,447Methyl Ethyl Ketone 63 652,508 1,462,006 0 0 379 2,114,893 33,570Xylene (Mixed Isomers) 47 733,336 748,137 271 0 1,167 1,482,911 31,551Zinc Compounds[M] 28 5 122 306 0 1,800 2,233 80Copper[M] 23 0 34,144 45 0 0 34,189 1,486Methanol 21 292,262 79,455 0 0 0 371,717 17,701Methyl Isobutyl Ketone 18 87,271 291,732 0 0 189 379,192 21,066Barium Compounds[M] 14 755 190 0 0 0 945 68N-hexane 12 60,722 48,339 0 0 0 109,061 9,088Copper Compounds[M] 11 0 0 37 0 0 37 31,2,4-trimethylbenzene 10 76,540 3,399 0 0 0 79,939 7,994Ethylene Glycol 10 57,129 40,305 0 0 4,240 101,674 10,1671,1,1-Trichloroethane[O] 9 191,203 207,530 0 0 0 398,733 44,304N-butyl Alcohol 8 46,066 46,949 0 0 0 93,015 11,627Dibutyl Phthalate 7 0 13,602 0 0 0 13,602 1,943Ethylbenzene 7 17,848 32,582 0 0 0 50,430 7,204Nitric Acid 7 255 1,054 13,401 0 0 14,710 2,101Ammonia 6 10 38,537 0 0 0 38,547 6,425Tetrachloroethylene[C] 4 64,500 10,874 0 0 0 75,374 18,844N-methyl-2-pyrrolidone 4 46,369 22,374 0 0 0 68,743 17,186Isopropyl Alcohol (Manufacturing, 3 38,210 21,053 0 0 0 59,263 19,754Strong-acid Process Only)Dichloromethane[C] 3 24,700 105,788 0 0 0 130,488 43,496Trichloroethylene[C] 3 9,500 19,578 0 0 0 29,078 9,693Nickel[C, M] 3 5 0 0 0 0 5 2Ozone 3 8,260 112,416 0 0 0 120,676 40,225Diisocyanates 2 0 755 0 0 0 755 378Formaldehyde[C] 2 606 906 0 0 0 1,512 756Phenol 2 2,190 2,690 0 0 0 4,880 2,4402-ethoxyethanol 2 23,345 0 0 0 0 23,345 11,6731,4-Dioxane[C] 2 3,000 14,016 0 0 0 17,016 8,508Barium[M] 2 0 28,600 0 0 0 28,600 14,300Chromium[M] 2 5 0 0 0 0 5 3Antimony Compounds[M] 1 0 429 0 0 0 429 429Cadmium Compounds[C, M] 1 0 60 0 0 0 60 60Cyanide Compounds 1 97 0 0 0 0 97 97Manganese Compounds[M] 1 5 0 . 0 0 5 5Diethyl Sulfate[C] 1 597 5 0 0 0 602 602Dimethyl Sulfate[C] 1 31 7 0 0 0 38 38Phthalic Anhydride 1 0 58 0 0 0 58 58Naphthalene 1 22,070 2,728 0 0 0 24,798 24,798M-cresol 1 11 2 0 0 0 13 13Di(2-ethylhexyl) Phthalate[C] 1 0 5 0 0 0 5 5Triethylamine 1 250 16,800 0 0 0 17,050 17,050Hydroquinone 1 0 5 0 0 0 5 5Ethyl Acrylate[C] 1 1,328 158 0 0 0 1,486 1,486Lead[C, M] 1 0 0 0 0 250 250 250Hydrochloric Acid (1995 and after "Acid 1 0 30,131 0 0 0 30,131 30,131Aerosols" Only)Sulfuric Acid 1 0 250 0 0 0 250 250Chlorine 1 0 23,863 0 0 0 23,863 23,863
________ _________ _________ ______ __ _____ __________ _______262** 18,450,746 15,432,923 14,378 0 8,197 33,906,244 129,413
[C] Known or suspect carcinogens [M] Metals and metal compounds [O] Ozone depleters* Refer to Section III for a discussion of the TRI data and its limitations, methodology used to obtain this data, definitions of the column headings, and the definitions of carcinogens, metals, and ozone depleters.**Total number of facilities (not chemical reports) reporting to TRI in this industry sector.

Sector Notebook Data Refresh - 1997 Printing
Sector Notebook Project May 1998G-3
1995 TRI Transfers for Printing Facilities (SICS 2711 - 2789)by Number of Facilities Reporting (pounds/year)*
Chemical Name Chemical Transfers Transfers Transfers Transfers Transfers Transfers Per Facility# Reporting Potw Disposal Recycling Treatment Recovery Total Avg Transfer
Energy
Toluene 106 6,147 15,440 4,050,982 160,932 1,923,151 6,156,652 58,082Certain Glycol Ethers 82 117,549 97,360 30,904 56,609 667,830 970,252 11,832Methyl Ethyl Ketone 63 17 1,000 219,801 204,375 1,107,789 1,532,982 24,333Xylene (Mixed Isomers) 47 190 250 227,276 26,322 279,100 533,138 11,343Zinc Compounds[M] 28 688 3,393 21,275 10,344 16,932 52,632 1,880Copper[M] 23 808 1,002 330,668 37,377 31,785 401,640 17,463Methanol 21 10,005 3,964 5,128 . 17,322 36,419 1,734Methyl Isobutyl Ketone 18 0 1,250 27,951 42,459 62,989 138,515 7,695Barium Compounds[M] 14 27 531 7,176 1,040 750 9,524 680N-hexane 12 0 . 3,643 . 21,646 25,289 2,107Copper Compounds[M] 11 643 2,600 26,714 139 500 30,596 2,7811,2,4-trimethylbenzene 10 0 1,140 15,894 10,129 44,394 71,557 7,156Ethylene Glycol 10 12,568 3,150 . 18,746 . 34,464 3,4461,1,1-Trichloroethane[O] 9 255 . 10,018 . 75,275 85,548 9,505N-butyl Alcohol 8 0 . 2,157 1,848 10,887 14,892 1,862Dibutyl Phthalate 7 0 400 3,064 2,250 11,237 16,951 2,422Ethylbenzene 7 170 . . 514 19,567 20,251 2,893Nitric Acid 7 25,051 . . 255 . 25,306 3,615Ammonia 6 0 . 500 143 . 643 107Tetrachloroethylene[C] 4 0 18 20,448 10,062 29,187 59,715 14,929N-methyl-2-pyrrolidone 4 0 . 13,243 . 49,192 62,435 15,609Isopropyl Alcohol (Manufacturing, 3 0 1,134 12,076 . 14,046 27,256 9,085Strong-acid Process Only)Dichloromethane[C] 3 0 . . 9,091 379 9,470 3,157Trichloroethylene[C] 3 0 0 8,116 . . 8,116 2,705Nickel[C, M] 3 5 . 22,504 1,200 . 23,709 7,903Ozone 3 0 . . . . 0 0Diisocyanates 2 0 . . . . 0 0Formaldehyde[C] 2 0 . . . . 0 0Phenol 2 0 . . . . 0 02-ethoxyethanol 2 0 12,345 . . 6,000 18,345 9,1731,4-Dioxane[C] 2 0 5 . 250 500 755 378Barium[M] 2 0 . . . . 0 0Chromium[M] 2 0 5 . 5 . 10 5Antimony Compounds[M] 1 0 . 3,468 406 557 4,431 4,431Cadmium Compounds[C, M] 1 0 . 2,273 . . 2,273 2,273Cyanide Compounds 1 9 . . 226 . 235 235Lead Compounds[C, M] 1 18 . 5,268 76 426 5,788 5,788Manganese Compounds[M] 1 0 250 . . . 250 250Diethyl Sulfate[C] 1 0 . . . . 0 0Dimethyl Sulfate[C] 1 0 . . . . 0 0Phthalic Anhydride 1 0 . . . . 0 0Naphthalene 1 0 . 9,557 . . 9,557 9,557M-cresol 1 0 19 . . . 19 19Di(2-ethylhexyl) Phthalate[C] 1 0 6,400 . . . 6,400 6,400Triethylamine 1 0 . . . 250 250 250Hydroquinone 1 1,638 . . . . 1,638 1,638Ethyl Acrylate[C] 1 0 . . . . 0 0Lead[C, M] 1 0 . 40,433 . . 40,433 40,433Hydrochloric Acid (1995 and after "Acid 1 0 . . . . 0 0Aerosols" Only)Sulfuric Acid 1 0 . . . . 0 0Chlorine 1 0 . . . . 0 0
_____ _______ _______ _________ _______ _________ __________ _______262** 175,788 151,656 5,120,537 594,798 4,391,691 10,438,336 39,841
[C] Known or suspect carcinogens [M] Metals and metal compounds [O] Ozone depleters* Refer to Section III for a discussion of the TRI data and its limitations, methodology used to obtain this data, definitions of the column headings, and the definitions of carcinogens, metals, and ozone depleters.**Total number of facilities (not chemical reports) reporting to TRI in this industry sector.

Sector Notebook Data Refresh - 1997 Printing
Being included on this list does not mean that the release is associated with non-compliance with environmental laws.1
Sector Notebook Project May 1998G-4
Ten Largest Volume TRI Releasing Printing Facilities Reporting Only SIC 2711-2789*
Rank Facility Pounds1Total TRI Releases in
1 Quebecor Printing Inc., Dickson, Tenness 2,470,345
2 R. R. Donnelley & Sons Co., Warsaw, Indiana 2,109,441
3 World Color, Corinth, Mississippi 1,633,920
4 Quebecor Printing, Richmond, Virginia 1,390,514
5 R. R. Donnelley & Sons Co., Gallatin, Tennessee 1,371,130
6 World Color Press Inc., Dyersburg, Tennessee 1,363,008
7 R. R. Donnelley Printing Co., Lynchburg, Virginia 1,290,000
8 World Color Press Inc., Salem, Illinois 1,200,800
9 Brown Printing Co., Franklin, Kentucky 1,124,838
10 Quebecor Printing Memphis Inc., Memphis, Tennessee 1,116,925
Source: US EPA 1995 Toxics Release Inventory Database.*Refer to Section III for a general discussion of TRI data and its limitations. A discussion of the methodology used to develop this table can be found under the heading Ten Largest Volume TRI Releasing Facilities.
Ten Largest Volume TRI Releasing Facilities Reporting Only SICS 2711 - 2789or SICS 2711 - 2789 and Other SIC Codes*
Rank Facility SIC Codes Reported in TRI Pounds1
Total TRIReleases in
1 Quebecor Printing Inc., Dickson, Tennessee 2754 2,470,345
2 R. R. Donnelley & Sons Co., Warsaw, Indiana 2754 2,109,441
3 World Color, Corinth, Mississippi 2752, 2754 1,633,920
4 Quebecor Printing, Richmond, Virginia 2754 1,390,514
5 R. R. Donnelley & Sons Co., Gallatin, Tennessee 2754 1,371,130
6 World Color Press Inc., Dyersburg, Tennessee 2752, 2754 1,363,008
7 R. R. Donnelley Printing Co., Lynchburg, Virginia 2754 1,290,000
8 World Color Press Inc., Salem, Illinois 2752, 2754 1,200,800
9 Brown Printing Co., Franklin, Kentucky 2754 1,124,838
10 Quebecor Printing Memphis Inc., Memphis, Tennessee 2754 1,116,925
Source: US EPA Toxics Release Inventory Database, 1995.*Refer to Section III for a general discussion of TRI data and its limitations. A discussion of the methodology used to develop this table can be found under the heading Ten Largest Volume TRI Releasing Facilities.
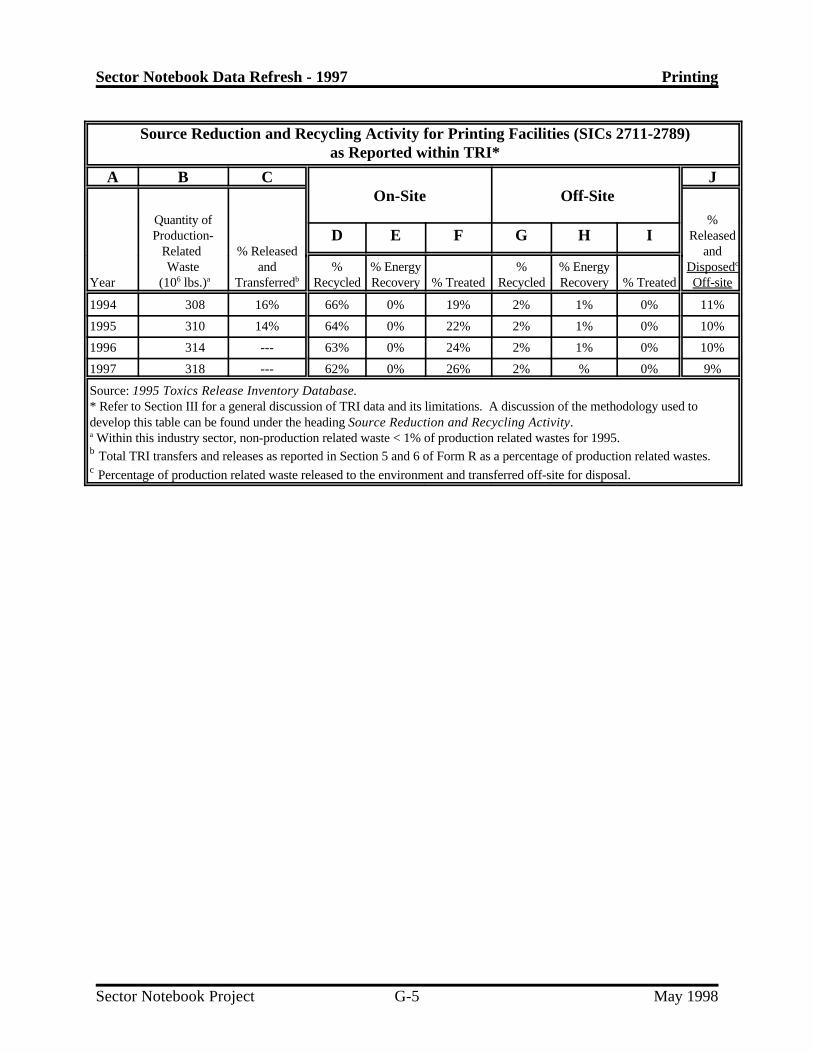
Sector Notebook Data Refresh - 1997 Printing
Sector Notebook Project May 1998G-5
Source Reduction and Recycling Activity for Printing Facilities (SICs 2711-2789)as Reported within TRI*
A B C JOn-Site Off-Site
Year (10 lbs.) Transferred Off-siteRecycled Recovery % Treated Recycled Recovery % Treated
Quantity of %Production- Released
Related % Released andWaste and Disposed% % Energy % % Energy
6 a b
c
D E F G H I
1994 308 16% 66% 0% 19% 2% 1% 0% 11%
1995 310 14% 64% 0% 22% 2% 1% 0% 10%
1996 314 --- 63% 0% 24% 2% 1% 0% 10%
1997 318 --- 62% 0% 26% 2% % 0% 9%
Source: 1995 Toxics Release Inventory Database. * Refer to Section III for a general discussion of TRI data and its limitations. A discussion of the methodology used todevelop this table can be found under the heading Source Reduction and Recycling Activity. Within this industry sector, non-production related waste < 1% of production related wastes for 1995.a
Total TRI transfers and releases as reported in Section 5 and 6 of Form R as a percentage of production related wastes.b
Percentage of production related waste released to the environment and transferred off-site for disposal.c

Sector Notebook Data Refresh - 1997 Printing
Sector Notebook Project May 1998G-6
Five-Year Enforcement and Compliance Summary for the Printing Industry*
A B C D E F G H I JRegion Facilities Facilities Number of Average Facilities with Total Percent Percent Enforcement
in Search Inspected Inspections Months 1 or More Enforcement State Federal to InspectionBetween Enforcement Actions Lead Lead Rate
Inspections Actions Actions Actions
I 500 168 392 77 21 27 85% 15% 0.07
II 438 220 707 37 35 93 96% 4% 0.13
III 1,137 359 1,534 44 31 44 91% 9% 0.03
IV 1,308 442 2,142 37 56 129 94% 6% 0.06
V 675 402 1,416 29 40 51 63% 37% 0.04
VI 535 99 282 114 24 44 84% 16% 0.16
VII 558 178 702 48 16 21 81% 19% 0.03
VIII 224 104 184 73 3 3 67% 33% 0.02
IX 239 67 247 58 7 10 100% 0% 0.04
X 248 53 85 175 5 6 67% 33% 0.07
TOTAL 5,862 2,092 7,691 46 238 428 88% 12% 0.06
*Data obtained from EPA’s Integrated Data for Enforcement Analysis (IDEA) System. For a description of IDEA and the methods used toobtain this data, refer to Section II.C. A discussion of this table can be found under the heading, Five-Year Enforcement and ComplianceSummary, in Section III.

Sector Notebook Data Refresh - 1997 Inorganic Chemicals
Sector Notebook Project May 1998H-1
Inorganic Chemicals

Sector Notebook Data Refresh - 1997 Inorganic Chemicals
Sector Notebook Project May 1998H-2
1995 TRI Releases for Inorganic Chemicals Facilities (SIC 281) by Number of Facilities Reporting (pounds/year)*
Chemical Name Chemical Air Air Discharges Injection Disposal Releases Per Facility# Reporting Fugitive Point Water Underground Land Total Avg. Releases
Ammonia 123 1,597,708 1,605,480 213,435 110,000 1,060,206 4,586,829 37,291Hydrochloric Acid (1995 and after "Acid 109 56,554 1,295,978 723 6,594,743 84 7,948,082 72,918Aerosols" Only)Chlorine 107 44,872 2,621,681 20,363 0 5,637 2,692,553 25,164Sulfuric Acid 91 52,538 462,167 500 0 4,138 519,343 5,707Phosphoric Acid 59 4,560 384,125 10 0 30 388,725 6,589Nitric Acid 51 8,901 90,632 0 0 1,500 101,033 1,981Zinc Compounds[M] 49 39,765 75,039 99,795 0 155,229 369,828 7,548Chromium Compounds[C, M] 32 2,065 15,680 14,390 0 17,010,946 17,043,081 532,596Copper Compounds[M] 30 1,869 12,773 303 0 89 15,034 501Manganese Compounds[M] 28 161,433 115,867 176,398 0 7,630,441 8,084,139 288,719Nickel Compounds[C, M] 28 1,807 15,087 7,396 0 35,365 59,655 2,131Methanol 27 188,354 1,070,201 3,838 0 13 1,262,406 46,756Lead Compounds[C, M] 25 33,198 10,721 94 0 6 44,019 1,761Hydrogen Fluoride 23 81,736 71,241 37 0 5,310 158,324 6,884Ethylene Glycol 20 540 1,460 1,688 0 185 3,873 194Barium Compounds[M] 19 2,086 8,625 7,424 0 116,000 134,135 7,060Nitrate Compounds 18 2 5 1,570,573 0 1,142,964 2,713,544 150,752Antimony Compounds[M] 17 1,391 11,981 29 0 1 13,402 788Toluene 17 14,176 11,423 0 0 0 25,599 1,506Cobalt Compounds[C, M] 15 518 1,714 150 0 56,000 58,382 3,892Dichlorodifluoromethane[O] 15 336,838 21,167 0 0 0 358,005 23,867Propylene 13 4,308 1,957 0 0 0 6,265 482Phosphorus (Yellow or White) 13 1,200 4,256 5 0 1 5,462 420Molybdenum Trioxide 12 1,408 13,618 3,753 0 52 18,831 1,569Xylene (Mixed Isomers) 12 1,183 2,158 0 0 0 3,341 278Carbonyl Sulfide 11 500 8,772,850 0 0 0 8,773,350 797,577Titanium Tetrachloride 11 5,784 3,182 0 0 0 8,966 815Mercury[M] 9 5,962 2,775 136 0 1,014 9,887 1,099Arsenic Compounds[C, M] 8 44 217 18 0 14,015 14,294 1,787Ethylene 8 211,816 9,383 0 0 0 221,199 27,650Ethylene Oxide[C] 8 5,175 15,355 0 0 0 20,530 2,566Cadmium Compounds[C, M] 7 1,160 9,243 15 0 0 10,418 1,488Certain Glycol Ethers 7 7,920 47,882 0 0 0 55,802 7,972Formaldehyde[C] 7 262 11,305 0 0 0 11,567 1,652Naphthalene 7 320 9,250 48 0 5 9,623 1,375Copper[M] 7 270 1,000 5 0 0 1,275 182Zinc (Fume or Dust)[M] 7 5,874 26,895 911 0 0 33,680 4,811Sodium Nitrite 7 6,405 14,856 145,322 0 0 166,583 23,798Carbon Tetrachloride[C, O] 6 4,286 2,279 0 0 0 6,565 1,094Formic Acid 6 45 128,249 0 0 0 128,294 21,382Carbon Disulfide 6 111,461 3,741 250 0 0 115,452 19,242Asbestos (Friable)[C] 6 0 1 0 0 0 1 0Chlorodifluoromethane[O] 5 368,505 271,174 0 0 0 639,679 127,936Nickel[C, M] 5 38 755 10 0 0 803 161Cyanide Compounds 4 0 0 0 0 0 0 0Selenium Compounds[M] 4 40 10,065 2 0 0 10,107 2,527Benzene[C] 4 701 71,280 0 0 0 71,981 17,995Chloromethane 4 527 5,269 0 0 0 5,796 1,449Dichloromethane[C] 4 14,205 13,317 0 0 0 27,522 6,881N-hexane 4 117 4,627 0 0 0 4,744 1,186Diethanolamine 4 271 750 700 0 0 1,721 430Lithium Carbonate 4 1,006 5,839 0 0 0 6,845 1,711Aluminum (Fume or Dust)[M] 4 42 3,530 5 0 0 3,577 894Manganese[M] 4 295 274 1,252 0 2,196,245 2,198,066 549,517Chromium[M] 4 5 8 27 0 290,600 290,640 72,660Bromine 4 63 8,213 0 0 0 8,276 2,069Fluorine 4 0 14,200 0 0 0 14,200 3,550Chloroform[C] 3 8,752 2,818 970 0 0 12,540 4,180Acetonitrile 3 756 846 0 0 0 1,602 534Trichlorofluoromethane[O] 3 87,000 17,789 0 0 0 104,789 34,930Dichlorotetrafluoroethane (CFC-114)[O] 3 640,000 44,000 0 0 0 684,000 228,000Methyl Ethyl Ketone 3 815 203 0 0 0 1,018 339Phenol 3 19 251 0 0 0 270 90Hydrazine[C] 3 318 0 0 0 0 318 106N-methyl-2-pyrrolidone 3 3 387 0 0 0 390 130

Sector Notebook Data Refresh - 1997 Inorganic Chemicals
1995 TRI Releases for Inorganic Chemicals Facilities (SIC 281) by Number of Facilities Reporting (pounds/year)*
Chemical Name Chemical Air Air Discharges Injection Disposal Releases Per Facility# Reporting Fugitive Point Water Underground Land Total Avg. Releases
Sector Notebook Project May 1998H-3
Lead[C, M] 3 1 5 273 0 490 769 256Cobalt[C, M] 3 263 42 0 0 33,900 34,205 11,402Silver Compounds[M] 2 0 5 0 0 0 5 3N-butyl Alcohol 2 6 0 0 0 0 6 3Hydrogen Cyanide 2 0 258 0 0 0 258 129Acetaldehyde[C] 2 2 2,200 0 0 0 2,202 1,101Monochloropentafluoroethane[O] 2 33,000 250 0 0 0 33,250 16,6251,2,4-trimethylbenzene 2 610 258 0 0 5 873 437Ethylbenzene 2 5 240 0 0 0 245 1231,3-butadiene[C] 2 1 0 0 0 0 1 1Hydroquinone 2 0 0 0 0 0 0 02,2-dichloro-1,1,1-trifluoroethane[O] 2 46,460 0 0 0 0 46,460 23,2302-chloro-1,1,1,2-tetrafluoroethane[O] 2 66,005 7,168 0 0 0 73,173 36,587Boron Trifluoride 2 325 1,600 0 0 0 1,925 963Mercury Compounds[M] 1 0 0 0 0 0 0 0Aniline 1 1 0 0 0 0 1 1Chloroethane 1 425 1,200 0 0 0 1,625 1,625Vinyl Chloride[C] 1 0 0 0 0 0 0 0Dichlorofluoromethane 1 8,600 130,000 0 0 0 138,600 138,600Propylene Oxide[C] 1 0 0 0 0 0 0 0Tert-butyl Alcohol 1 5 0 0 0 0 5 51-chloro-1,1-difluoroethane[O] 1 1,100 250 0 0 0 1,350 1,350Chloropicrin 1 250 250 0 0 0 500 500Freon 113[O] 1 25,000 0 . 0 0 25,000 25,000Dimethyl Sulfate[C] 1 0 0 0 0 0 0 0Isobutyraldehyde 1 1 0 0 0 0 1 1Trichloroethylene[C] 1 0 0 0 0 0 0 0Acrylamide[C] 1 1 0 0 0 0 1 1Peracetic Acid 1 0 2,500 0 0 0 2,500 2,500Phthalic Anhydride 1 0 1 0 0 0 1 1Biphenyl 1 0 1 0 0 0 1 1Cumene 1 3 3 0 0 0 6 6Styrene[C] 1 1 0 0 0 0 1 1Acrylonitrile[C] 1 1 0 0 0 0 1 1Vinyl Acetate[C] 1 1 1 0 0 0 2 2Chlorobenzene 1 1 0 0 0 0 1 1Cyclohexane 1 1 0 0 0 0 1 1Catechol 1 0 0 0 0 0 0 01,2,4-trichlorobenzene 1 1 1 0 0 0 2 2Triethylamine 1 0 250 0 0 0 250 2501,4-Dioxane[C] 1 5 0 0 0 0 5 5Dimethylamine 1 250 5 0 0 0 255 255Sodium Dimethyldithiocarbamate 1 0 0 0 0 0 0 0Dimethyl Phthalate 1 1,250 0 . 0 0 1,250 1,250Captan 1 5 0 0 0 0 5 51-chloro-1,1,2,2-tetrafluoroethane[O] 1 1,800 250 0 0 0 2,050 2,050Thorium Dioxide 1 0 1 0 0 0 1 1Cresol (Mixed Isomers) 1 33 330 0 0 0 363 363Silver[M] 1 2 3 0 0 0 5 5Antimony[M] 1 0 13,000 0 0 0 13,000 13,000Arsenic[C, M] 1 0 0 0 0 0 0 0Beryllium[C, M] 1 0 0 0 0 0 0 0Selenium[M] 1 0 0 0 0 0 0 0Phosphine 1 0 1,239 0 0 0 1,239 1,239Boron Trichloride 1 0 5 0 0 0 5 5Sodium Azide 1 250 5 0 0 0 255 255
_______ ________ _________ _________ ________ _________ _________ _______413** 4,315,437 17,620,415 2,270,848 6,704,743 29,760,471 60,671,914 146,905
[C] Known or suspect carcinogens [M] Metals and metal compounds [O] Ozone depleters* Refer to Section III for a discussion of the TRI data and its limitations, methodology used to obtain this data, definitions of the column headings, and the definitions of carcinogens, metals, and ozone depleters.**Total number of facilities (not chemical reports) reporting to TRI in this industry sector.

Sector Notebook Data Refresh - 1997 Inorganic Chemicals
Sector Notebook Project May 1998H-4
1995 TRI Transfers for Inorganic Chemicals Facilities (SIC 281)by Number of Facilities Reporting (pounds/year)*
Chemical Name Chemical Transfers Transfers Transfers Transfers Recovery Transfers Per Facility# Reporting Potw Disposal Recycling Treatment Energy Total Avg Transfer
Ammonia 123 2,571,517 41,878 1,057,480 94,326 . 3,765,201 30,611Hydrochloric Acid (1995 and after "Acid 109 658 0 . 2,070 . 2,728 25Aerosols" Only)Chlorine 107 35,401 . . 309 . 35,710 334Sulfuric Acid 91 0 12 . 191,050 . 191,062 2,100Phosphoric Acid 59 345 1,129 159,712 242,396 . 403,582 6,840Nitric Acid 51 255 0 5,800 291,969 . 298,024 5,844Zinc Compounds[M] 49 4,902 993,281 44,708 848,975 . 1,891,866 38,610Chromium Compounds[C, M] 32 5,759 134,876 20,696 172,306 . 333,637 10,426Copper Compounds[M] 30 9,827 312,352 1,192,110 208,175 5 1,722,469 57,416Manganese Compounds[M] 28 3,199 3,715,804 5 2,027,491 . 5,746,499 205,232Nickel Compounds[C, M] 28 13,674 119,152 274,406 9,753 . 416,985 14,892Methanol 27 156,152 836 7,926 109,297 25,067 394,972 14,629Lead Compounds[C, M] 25 1,845 12,736 1,355,392 341,114 . 1,711,087 68,443Hydrogen Fluoride 23 255 20 31,500 32,482 . 64,257 2,794Ethylene Glycol 20 5,441 6 5,116 461 15,497 26,521 1,326Barium Compounds[M] 19 6,385 292,652 270 20,503 250 320,060 16,845Nitrate Compounds 18 1,527,332 3,010 425,929 317,294 . 2,273,565 126,309Antimony Compounds[M] 17 5,207 64,230 45,900 11,860 . 138,027 8,119Toluene 17 255 . 225 1,067 12,100 13,647 803Cobalt Compounds[C, M] 15 482 19,196 6,697 12,134 . 38,509 2,567Dichlorodifluoromethane[O] 15 0 . 1,700 4,055 . 5,755 384Propylene 13 0 . . . . 0 0Phosphorus (Yellow or White) 13 0 1 . 14 . 15 1Molybdenum Trioxide 12 20,146 221,500 145,814 . . 387,460 32,288Xylene (Mixed Isomers) 12 0 . 445 8,919 202,409 211,773 17,648Carbonyl Sulfide 11 0 . . . . 0 0Titanium Tetrachloride 11 0 . . 2,854 . 2,854 259Mercury[M] 9 0 415 7,752 11,580 . 20,618 2,291Arsenic Compounds[C, M] 8 9 3,697 . 37,924 . 41,630 5,204Ethylene 8 0 . . . . 0 0Ethylene Oxide[C] 8 0 . . . . 0 0Cadmium Compounds[C, M] 7 34 10,664 255 2,081 . 13,034 1,862Certain Glycol Ethers 7 5 . . 20,269 7,011 27,285 3,898Formaldehyde[C] 7 5 . . 0 . 5 1Naphthalene 7 124 260 . 1,394 5 1,783 255Copper[M] 7 111 216,632 . 23,158 . 239,901 34,272Zinc (Fume or Dust)[M] 7 46 6,163 250 48,002 . 54,461 7,780Sodium Nitrite 7 223,262 . 4,350 11,000 . 238,612 34,087Carbon Tetrachloride[C, O] 6 0 700 500 12,844 . 14,044 2,341Formic Acid 6 255 . . 5 . 260 43Carbon Disulfide 6 0 500 . 500 5,105 6,105 1,018Asbestos (Friable)[C] 6 0 51,743 . . . 51,743 8,624Chlorodifluoromethane[O] 5 0 13,000 . 470 . 13,470 2,694Nickel[C, M] 5 54 302 24,170 . . 24,526 4,905Cyanide Compounds 4 1 . . 5 . 6 2Selenium Compounds[M] 4 12 1,248 . 250 . 1,510 378Benzene[C] 4 0 4 . 1,720 . 1,724 431Chloromethane 4 0 . . 3 . 3 1Dichloromethane[C] 4 0 . 11,000 2 5 11,007 2,752N-hexane 4 0 . . . . 0 0Diethanolamine 4 650 . . . . 650 163Lithium Carbonate 4 0 3,400 . . . 3,400 850Aluminum (Fume or Dust)[M] 4 5 . . . . 5 1Manganese[M] 4 0 2,261 . . . 2,261 565Chromium[M] 4 0 637 . 6,276 . 6,913 1,728Bromine 4 0 . . . . 0 0Fluorine 4 0 . . . . 0 0Chloroform[C] 3 0 2,200 . 130,705 . 132,905 44,302Acetonitrile 3 0 . . . 100,000 100,000 33,333Trichlorofluoromethane[O] 3 0 . 51,590 37,500 . 89,090 29,697Dichlorotetrafluoroethane (CFC-114)[O] 3 0 . . . . 0 0Methyl Ethyl Ketone 3 0 . . 20,115 189 20,304 6,768Phenol 3 0 . . . . 0 0Hydrazine[C] 3 0 . . . . 0 0N-methyl-2-pyrrolidone 3 0 . 471 142 18,563 19,176 6,392
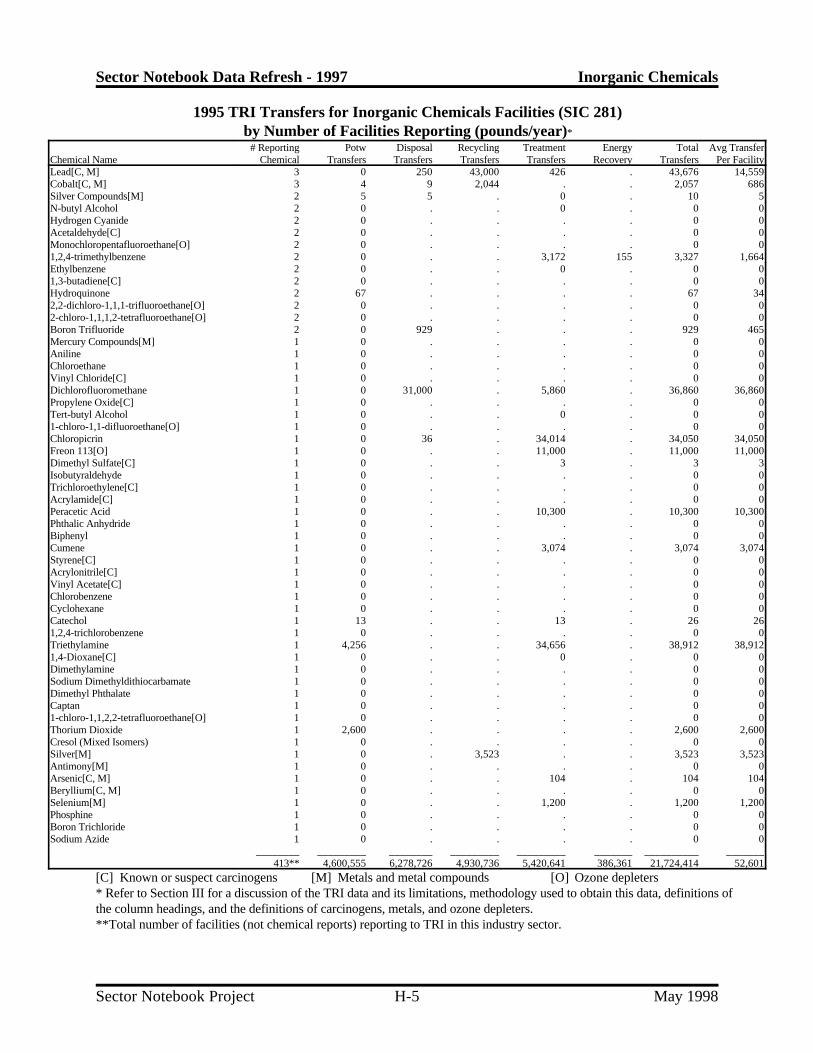
Sector Notebook Data Refresh - 1997 Inorganic Chemicals
1995 TRI Transfers for Inorganic Chemicals Facilities (SIC 281)by Number of Facilities Reporting (pounds/year)*
Chemical Name Chemical Transfers Transfers Transfers Transfers Recovery Transfers Per Facility# Reporting Potw Disposal Recycling Treatment Energy Total Avg Transfer
Sector Notebook Project May 1998H-5
Lead[C, M] 3 0 250 43,000 426 . 43,676 14,559Cobalt[C, M] 3 4 9 2,044 . . 2,057 686Silver Compounds[M] 2 5 5 . 0 . 10 5N-butyl Alcohol 2 0 . . 0 . 0 0Hydrogen Cyanide 2 0 . . . . 0 0Acetaldehyde[C] 2 0 . . . . 0 0Monochloropentafluoroethane[O] 2 0 . . . . 0 01,2,4-trimethylbenzene 2 0 . . 3,172 155 3,327 1,664Ethylbenzene 2 0 . . 0 . 0 01,3-butadiene[C] 2 0 . . . . 0 0Hydroquinone 2 67 . . . . 67 342,2-dichloro-1,1,1-trifluoroethane[O] 2 0 . . . . 0 02-chloro-1,1,1,2-tetrafluoroethane[O] 2 0 . . . . 0 0Boron Trifluoride 2 0 929 . . . 929 465Mercury Compounds[M] 1 0 . . . . 0 0Aniline 1 0 . . . . 0 0Chloroethane 1 0 . . . . 0 0Vinyl Chloride[C] 1 0 . . . . 0 0Dichlorofluoromethane 1 0 31,000 . 5,860 . 36,860 36,860Propylene Oxide[C] 1 0 . . . . 0 0Tert-butyl Alcohol 1 0 . . 0 . 0 01-chloro-1,1-difluoroethane[O] 1 0 . . . . 0 0Chloropicrin 1 0 36 . 34,014 . 34,050 34,050Freon 113[O] 1 0 . . 11,000 . 11,000 11,000Dimethyl Sulfate[C] 1 0 . . 3 . 3 3Isobutyraldehyde 1 0 . . . . 0 0Trichloroethylene[C] 1 0 . . . . 0 0Acrylamide[C] 1 0 . . . . 0 0Peracetic Acid 1 0 . . 10,300 . 10,300 10,300Phthalic Anhydride 1 0 . . . . 0 0Biphenyl 1 0 . . . . 0 0Cumene 1 0 . . 3,074 . 3,074 3,074Styrene[C] 1 0 . . . . 0 0Acrylonitrile[C] 1 0 . . . . 0 0Vinyl Acetate[C] 1 0 . . . . 0 0Chlorobenzene 1 0 . . . . 0 0Cyclohexane 1 0 . . . . 0 0Catechol 1 13 . . 13 . 26 261,2,4-trichlorobenzene 1 0 . . . . 0 0Triethylamine 1 4,256 . . 34,656 . 38,912 38,9121,4-Dioxane[C] 1 0 . . 0 . 0 0Dimethylamine 1 0 . . . . 0 0Sodium Dimethyldithiocarbamate 1 0 . . . . 0 0Dimethyl Phthalate 1 0 . . . . 0 0Captan 1 0 . . . . 0 01-chloro-1,1,2,2-tetrafluoroethane[O] 1 0 . . . . 0 0Thorium Dioxide 1 2,600 . . . . 2,600 2,600Cresol (Mixed Isomers) 1 0 . . . . 0 0Silver[M] 1 0 . 3,523 . . 3,523 3,523Antimony[M] 1 0 . . . . 0 0Arsenic[C, M] 1 0 . . 104 . 104 104Beryllium[C, M] 1 0 . . . . 0 0Selenium[M] 1 0 . . 1,200 . 1,200 1,200Phosphine 1 0 . . . . 0 0Boron Trichloride 1 0 . . . . 0 0Sodium Azide 1 0 . . . . 0 0
________ _________ ________ _________ _________ _______ __________ _______413** 4,600,555 6,278,726 4,930,736 5,420,641 386,361 21,724,414 52,601
[C] Known or suspect carcinogens [M] Metals and metal compounds [O] Ozone depleters* Refer to Section III for a discussion of the TRI data and its limitations, methodology used to obtain this data, definitions of the column headings, and the definitions of carcinogens, metals, and ozone depleters.**Total number of facilities (not chemical reports) reporting to TRI in this industry sector.

Sector Notebook Data Refresh - 1997 Inorganic Chemicals
Being included on this list does not mean that the release is associated with non-compliance with environmental laws.1
Sector Notebook Project May 1998H-6
Ten Largest Volume TRI Releasing Inorganic Chemicals Facilities Reporting Only SIC 281*
Rank Facility Pounds1Total TRI Releases in
1 American Chrome & Chemicals, Corpus Christi, Texas 9,494,650
2 Occidental Chemical Corp., Castle Hayne, North Carolina 7,305,995
3 Kaiser Aluminum & Chemical, Mulberry, Florida 6,594,743
4 Chemetals Inc., New Johnsonville, Tennessee 4,806,414
5 SCM Chemicals Americas, Ashtabula, Ohio 2,932,564
6 SCM Chemicals, Baltimore, Maryland 2,690,044
7 Cabot Corp., Tuscola, Illinois 2,472,742
8 Louisiana Pigment Co. L.P., Westlake, Louisiana 2,217,049
9 Mountain Pass Operation, Mountain Pass, California 2,082,112
10 Kerr-McGee Chemical Corp., Henderson, Nevada 1,979,601
Source: US EPA 1995 Toxics Release Inventory Database.*Refer to Section III for a general discussion of TRI data and its limitations. A discussion of the methodology used to develop this table can be found under the heading Ten Largest Volume TRI Releasing Facilities.
Ten Largest Volume TRI Releasing Facilities Reporting Only SIC 281 or SIC 281 andOther SIC Codes*
Rank Facility SIC Codes Reported in TRI Pounds1
Total TRIReleases in
1 Courtaulds Fibers Inc., Axis, Alabama 2819, 2823 34,018,200
2 Cytec Ind. Inc., Westwego, Louisiana 2819, 2869 27,034,568
3 Arcadian Fertilizer L.P., Geismar, Louisiana 2819, 2873, 2874 16,780,139
4 Sterling Chemicals Inc., Texas City, Texas 2819, 2865, 2869 15,720,998
5 IMC-Agrico Co., St. James, Louisiana 2819, 2873, 2874 11,712,893
6 American Chrome & Chemicals, Corpus Christi, 2816, 2819 9,494,650Texas
7 Coastal Chem Inc., Cheyenne, Wyoming 2813, 2819, 2869, 2873, 2899 9,283,450
8 Bayer Corp., New Martinsville, West Virginia 2800, 2816, 2869 8,593,758
9 Monsanto, Alvin, Texas 2819, 2841, 2869, 2879 8,390,911
10 Vicksburg Chemical Co., Vicksburg, Mississippi 2819, 2873, 2812 7,341,133
Source: US EPA Toxics Release Inventory Database, 1995.*Refer to Section III for a general discussion of TRI data and its limitations. A discussion of the methodology used to develop this table can be found under the heading Ten Largest Volume TRI Releasing Facilities.
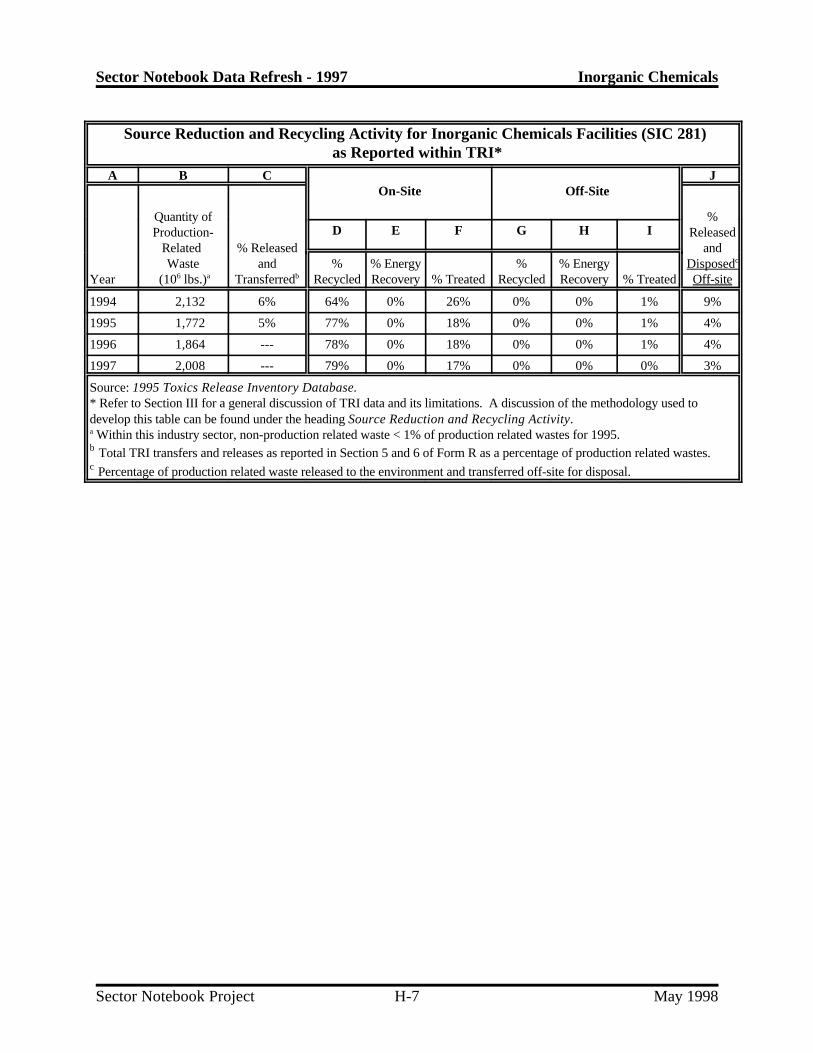
Sector Notebook Data Refresh - 1997 Inorganic Chemicals
Sector Notebook Project May 1998H-7
Source Reduction and Recycling Activity for Inorganic Chemicals Facilities (SIC 281) as Reported within TRI*
A B C JOn-Site Off-Site
Year (10 lbs.) Transferred Off-siteRecycled Recovery % Treated Recycled Recovery % Treated
Quantity of %Production- Released
Related % Released andWaste and Disposed% % Energy % % Energy
6 a b
c
D E F G H I
1994 2,132 6% 64% 0% 26% 0% 0% 1% 9%
1995 1,772 5% 77% 0% 18% 0% 0% 1% 4%
1996 1,864 --- 78% 0% 18% 0% 0% 1% 4%
1997 2,008 --- 79% 0% 17% 0% 0% 0% 3%
Source: 1995 Toxics Release Inventory Database. * Refer to Section III for a general discussion of TRI data and its limitations. A discussion of the methodology used todevelop this table can be found under the heading Source Reduction and Recycling Activity. Within this industry sector, non-production related waste < 1% of production related wastes for 1995.a
Total TRI transfers and releases as reported in Section 5 and 6 of Form R as a percentage of production related wastes.b
Percentage of production related waste released to the environment and transferred off-site for disposal.c

Sector Notebook Data Refresh - 1997 Inorganic Chemicals
Sector Notebook Project May 1998H-8
Five-Year Enforcement and Compliance Summary for the Inorganic Chemicals Industry*
A B C D E F G H I JRegion Facilities Facilities Number of Average Facilities with Total Percent Percent Enforcement
in Search Inspected Inspections Months 1 or More Enforcement State Federal to InspectionBetween Enforcement Actions Lead Lead Rate
Inspections Actions Actions Actions
I 9 5 8 68 0 0 0% 0% --
II 31 23 268 7 9 23 100% 0% 0.09
III 54 42 660 5 9 21 76% 24% 0.03
IV 89 61 783 7 22 73 90% 10% 0.09
V 87 54 618 8 10 17 59% 41% 0.03
VI 65 38 359 11 16 57 39% 61% 0.16
VII 17 11 66 15 2 3 33% 67% 0.05
VIII 15 9 64 14 6 12 92% 8% 0.19
IX 59 32 195 18 12 25 96% 4% 0.13
X 15 11 66 14 3 4 50% 50% 0.06
TOTAL 441 286 3,087 9 89 235 74% 26% 0.08
*Data obtained from EPA’s Integrated Data for Enforcement Analysis (IDEA) System. For a description of IDEA and the methods used toobtain this data, refer to Section II.C. A discussion of this table can be found under the heading, Five-Year Enforcement and ComplianceSummary, in Section III.

Sector Notebook Data Refresh - 1997 Plastic Resin and Man-made Fiber
Sector Notebook Project May 1998I-1
Plastic Resin and Man-made Fiber

Sector Notebook Data Refresh - 1997 Plastic Resin and Man-made Fiber
Sector Notebook Project May 1998I-2
1995 TRI Releases for Man-made Fiber Manufacturing Facilities (SIC 2823 & 2824) By Number of Facilities Reporting (pounds/year)*
Chemical Name Chemical Air Air Discharges Injection Disposal Releases Per Facility# Reporting Fugitive Point Water Underground Land Total Avg. Releases
Ethylene Glycol 13 479,311 558,748 218,523 3,500 1,655 1,261,737 97,057Biphenyl 12 246,298 52,811 298 5,500 277 305,184 25,432Ammonia 11 78,827 107,090 284,152 230,695 26,095 726,859 66,078Chlorine 10 511 62,250 110 0 0 62,871 6,287Antimony Compounds[M] 9 940 2,303 688 6 18,005 21,942 2,438Methanol 9 665,183 1,592,326 5,198 370,250 0 2,632,957 292,551Acetaldehyde[C] 9 400,610 799,922 3,990 120,000 0 1,324,522 147,169Phosphoric Acid 9 5 6 0 0 0 11 1Hydrochloric Acid (1995 and after "Acid Aerosols" Only) 8 240 6,034,881 0 0 0 6,035,121 754,3901,4-Dioxane[C] 7 13,339 48,658 125,342 0 10 187,349 26,764Nitrate Compounds 6 0 0 856,584 11,000,000 0 11,856,584 1,976,097Zinc Compounds[M] 6 250 2,653 63,900 2 533,600 600,405 100,068Toluene 6 310,790 616,243 266 0 0 927,299 154,550Sulfuric Acid 6 0 2,907 0 0 0 2,907 485Manganese Compounds[M] 5 0 2,500 2,000 340 19,000 23,840 4,768Formaldehyde[C] 5 3,914 40,678 12,724 28,000 0 85,316 17,063Methyl Ethyl Ketone 5 96,416 87,991 424 88,000 0 272,831 54,566Nitric Acid 5 2,400 4,900 0 200,000 0 207,300 41,460Chromium Compounds[C, M] 4 0 533 1,510 0 8,400 10,443 2,611Carbon Disulfide 4 2,697,000 56,760,000 39,110 0 265 59,496,375 14,874,094Formic Acid 3 1,602 17,908 52 3,400,000 0 3,419,562 1,139,854N-butyl Alcohol 3 35,011 3,838 18,000 830,000 0 886,849 295,616Trichlorofluoromethane[O] 3 219,927 4,400 75 0 0 224,402 74,801Acrylonitrile[C] 3 36,836 222,786 0 8,760 0 268,382 89,461Vinyl Acetate[C] 3 9,909 125,510 1 750 0 136,170 45,390Hydroquinone 3 12,000 1,039 3,400 0 0 16,439 5,480Butyraldehyde 3 17,330 53,300 110 84,000 0 154,740 51,580Dimethylamine 3 18,312 261,417 20,500 0 0 300,229 100,076Nickel[C, M] 3 0 110 341 6,100 1,340 7,891 2,630Copper Compounds[M] 2 0 270 690 170 6,100 7,230 3,615Diisocyanates 2 142 0 0 0 0 142 71Certain Glycol Ethers 2 98,400 7,100 408 0 0 105,908 52,954Benzene[C] 2 0 8,100 0 0 0 8,100 4,0501,1,1-Trichloroethane[O] 2 6,394 227,694 0 0 0 234,088 117,044Ethylene 2 3,400 110,000 0 0 0 113,400 56,700Acetonitrile 2 39,536 44,719 497 0 0 84,752 42,376Dichloromethane[C] 2 125,694 291,436 0 0 0 417,130 208,565Ethylene Oxide[C] 2 250 23,005 0 0 0 23,255 11,628Tert-butyl Alcohol 2 0 65 0 750 0 815 408Dichlorodifluoromethane[O] 2 23,581 0 0 0 0 23,581 11,791Styrene[C] 2 1,500 2,100 190 0 0 3,790 1,8951,3-butadiene[C] 2 380 18,400 0 0 0 18,780 9,390Phenol 2 191 1,171 626 0 0 1,988 9942-methoxyethanol 2 24 63 2,800 0 0 2,887 1,444N-hexane 2 188,179 4,672 0 0 0 192,851 96,426Cyclohexane 2 10,900 150,980 9 20,000 0 181,889 90,945Diethanolamine 2 270 1,483 0 0 0 1,753 877Propionaldehyde 2 14,000 100,000 7 80,000 0 194,007 97,004Dimethyl Phthalate 2 6 275 230 750 0 1,261 631Butyl Acrylate 2 36 513 5 0 0 554 277Sodium Nitrite 2 0 0 0 6,500 0 6,500 3,250Toluene Diisocyanate[C](Mixed Isomers) 2 10 5 0 0 0 15 8Cadmium Compounds[C, M] 1 0 0 0 0 0 0 0Cobalt Compounds[C, M] 1 0 280 0 0 14,000 14,280 14,280Cyanide Compounds 1 0 0 0 0 0 0 0Lead Compounds[C, M] 1 0 13 0 0 0 13 13Nickel Compounds[C, M] 1 0 1 0 0 0 1 12,4-Dinitrophenol 1 110 0 2,000 0 0 2,110 2,110Aniline 1 40 120 4,300 0 0 4,460 4,460Diethyl Sulfate[C] 1 230 0 0 0 0 230 230Chloroform[C] 1 7,000 17,000 72 0 0 24,072 24,072n,n-dimethylformamide[C] 1 460 4,100 410 0 0 4,970 4,970Bromomethane[O] 1 720 210,000 11 0 0 210,731 210,731Methyl Iodide 1 4,000 16 0 0 0 4,016 4,016

Sector Notebook Data Refresh - 1997 Plastic Resin and Man-made Fiber
1995 TRI Releases for Man-made Fiber Manufacturing Facilities (SIC 2823 & 2824) By Number of Facilities Reporting (pounds/year)*
Chemical Name Chemical Air Air Discharges Injection Disposal Releases Per Facility# Reporting Fugitive Point Water Underground Land Total Avg. Releases
Sector Notebook Project May 1998I-3
Hydrogen Cyanide 1 27,200 44,410 0 0 0 71,610 71,610Vinylidene Chloride 1 190 5,900 0 0 0 6,090 6,090Chlorodifluoromethane[O] 1 5,790 0 0 0 0 5,790 5,790Freon 113[O] 1 167,230 30,375 0 0 0 197,605 197,605Dichlorotetrafluoroethane(CFC-114)[O] 1 8,244 0 0 0 0 8,244 8,244Dimethyl Sulfate[C] 1 0 0 0 0 0 0 0Isobutyraldehyde 1 20,000 7,300 0 0 0 27,300 27,300Sec-butyl Alcohol 1 0 0 0 48,000 0 48,000 48,000Acrylic Acid 1 3 1,087 20 0 0 1,110 1,1101,1,2,2-tetrachloroethane 1 160 250 0 0 0 410 4104,4'-isopropylidenediphenol 1 0 0 0 0 0 0 0Methyl Methacrylate 1 750 750 0 0 0 1,500 1,500Dibutyl Phthalate 1 7,000 190 85 0 0 7,275 7,275Phthalic Anhydride 1 3,900 1,100 0 0 0 5,000 5,000Picric Acid 1 0 0 0 25,000 0 25,000 25,000O-anisidine[C] 1 460 10 0 0 0 470 4702-phenylphenol 1 0 59 0 0 0 59 59O-xylene 1 17,000 35,000 2 0 0 52,002 52,002O-Toluidine[C] 1 460 0 0 0 0 460 460Methyl Acrylate 1 3 817 0 0 0 820 820Dichloran 1 0 0 0 0 0 0 0p-nitroaniline 1 3 0 2 0 0 5 5Benzyl Chloride 1 0 0 0 0 0 0 0p-xylene 1 6,400 63,000 0 0 0 69,400 69,400p-phenylenediamine 1 0 0 . 0 0 0 0Quinone 1 3,800 3,300 1,500 0 0 8,600 8,600Methyl Isobutyl Ketone 1 44,000 100,000 4,000 0 0 148,000 148,000Maleic Anhydride 1 0 0 0 0 0 0 0M-xylene 1 1,000 1,000 0 0 0 2,000 2,0001,3-phenylenediamine 1 0 0 . 0 0 0 0Chlorobenzene 1 290 1,500 1 0 0 1,791 1,791Cyclohexanol 1 92 3,600 0 1,300,000 0 1,303,692 1,303,692Pyridine 1 41 2 190 0 0 233 233Propylene 1 540 14,000 0 0 0 14,540 14,540Di(2-ethylhexyl) Phthalate[C] 1 8,300 2 230 0 0 8,532 8,532Triethylamine 1 280 12,000 13 0 0 12,293 12,293n,n-dimethylaniline 1 0 0 0 0 0 0 0Tetrachloroethylene[C] 1 420 3,280 . 0 0 3,700 3,700Ethyl Acrylate[C] 1 2 844 0 0 0 846 846p-nitrosodiphenylamine 1 24 0 0 0 0 24 24Bis(chloromethyl) Ether[C] 1 0 0 0 0 0 0 0Vinyl Bromide[C] 1 220 8,000 0 0 0 8,220 8,220N-methyl-2-pyrrolidone 1 84 1 8,000 0 0 8,085 8,085Decabromodiphenyl Oxide 1 0 1 0 11 0 12 12Xylene (Mixed Isomers) 1 30,000 33,000 270 0 0 63,270 63,270Crotonaldehyde 1 35,000 55,000 680 0 0 90,680 90,680Antimony[M] 1 0 5 250 0 250 505 505Cadmium[C, M] 1 0 0 71 0 71 142 142Copper[M] 1 0 0 620 29,000 0 29,620 29,620Boron Trifluoride 1 0 0 0 0 0 0 0Hydrogen Fluoride 1 0 340,000 0 0 0 340,000 340,000Chlorine Dioxide 1 0 0 0 0 0 0 0
___ _________ _________ __________ __________ _______ _________ __________34** 6,261,300 69,457,072 1,685,487 17,886,084 629,068 95,919,011 2,821,147
[C] Known or suspect carcinogens [M] Metals and metal compounds [O] Ozone depleters* Refer to Section III for a discussion of the TRI data and its limitations, methodology used to obtain this data, definitions of the column headings, and the definitions of carcinogens, metals, and ozone depleters.**Total number of facilities (not chemical reports) reporting to TRI in this industry sector.

Sector Notebook Data Refresh - 1997 Plastic Resin and Man-made Fiber
Sector Notebook Project May 1998I-4
1995 TRI Transfers for Man-made Fiber Manufacturing Facilities (SIC 2823 & 2824) By Number of Facilities Reporting (Pounds/year)*
Chemical Name # Reporting POTW Disposal Recycling Treatment Recovery Total Avg TransferChemical Transfers Transfers Transfers Transfers Transfers Transfers Per Facility
Energy
Ethylene Glycol 13 81,958 333,823 40,865,058 67,979 1,186,722 42,535,540 3,271,965Biphenyl 12 0 19,777 46,500 5,197 5,400 76,874 6,406Ammonia 11 752 . . . . 752 68Chlorine 10 0 . . . . 0 0Antimony Compounds[M] 9 194 6,843 12,799 10,922 . 30,758 3,418Methanol 9 15,565 580 1,180,100 12,273 241,958 1,450,476 161,164Acetaldehyde[C] 9 0 250 27,000 8,920 500 36,670 4,074Phosphoric Acid 9 1,600 . . . . 1,600 178Hydrochloric Acid (1995 and after "Acid Aerosols" Only) 8 0 . . . . 0 01,4-Dioxane[C] 7 140 13,557 . 1,190 1,182 16,069 2,296Nitrate Compounds 6 0 . . 467 . 467 78Zinc Compounds[M] 6 901 868,900 . . . 869,801 144,967Toluene 6 923 3,619 1,000 12,065 58,369 75,976 12,663Sulfuric Acid 6 0 . . . . 0 0Manganese Compounds[M] 5 305 501 . 2 . 808 162Formaldehyde[C] 5 2,060 . . 37 . 2,097 419Methyl Ethyl Ketone 5 0 . . 700 79,951 80,651 16,130Nitric Acid 5 0 . . . . 0 0Chromium Compounds[C, M] 4 0 5 24,000 . . 24,005 6,001Carbon Disulfide 4 0 . . 2,900 . 2,900 725Formic Acid 3 0 . . 208 . 208 69N-butyl Alcohol 3 0 . . 181 58 239 80Trichlorofluoromethane[O] 3 0 . 3,850 . . 3,850 1,283Acrylonitrile[C] 3 200 120 . 250 . 570 190Vinyl Acetate[C] 3 0 . . 557 1,290 1,847 616Hydroquinone 3 150 43 . . . 193 64Butyraldehyde 3 0 . . . . 0 0Dimethylamine 3 0 . . . . 0 0Nickel[C, M] 3 0 13 185,000 . . 185,013 61,671Copper Compounds[M] 2 0 1,686 30,000 . . 31,686 15,843Diisocyanates 2 0 . . 17,258 . 17,258 8,629Certain Glycol Ethers 2 430 . 43,000 240 . 43,670 21,835Benzene[C] 2 0 . . . . 0 01,1,1-Trichloroethane[O] 2 0 . 17,443 320 . 17,763 8,882Ethylene 2 0 . . . . 0 0Acetonitrile 2 0 . . 350,340 . 350,340 175,170Dichloromethane[C] 2 0 . 47,125 2,999 . 50,124 25,062Ethylene Oxide[C] 2 0 . . . . 0 0Tert-butyl Alcohol 2 0 . . . . 0 0Dichlorodifluoromethane[O] 2 0 . . . . 0 0Styrene[C] 2 0 . . . . 0 01,3-butadiene[C] 2 0 . . . . 0 0Phenol 2 0 2,881 . 1 . 2,882 1,4412-methoxyethanol 2 0 . . . . 0 0N-hexane 2 0 . . 508 . 508 254Cyclohexane 2 0 . . . . 0 0Diethanolamine 2 0 . . . . 0 0Propionaldehyde 2 0 . . . . 0 0Dimethyl Phthalate 2 0 . . . . 0 0Butyl Acrylate 2 0 15 . 337 . 352 176Sodium Nitrite 2 0 . . . . 0 0Toluene Diisocyanate (Mixed 2 0 . . . 450 450 225Cadmium Compounds[C, M] 1 0 9,000 . . . 9,000 9,000Cobalt Compounds[C, M] 1 0 4,000 9,500 . . 13,500 13,500Cyanide Compounds 1 0 . . . . 0 0Lead Compounds[C, M] 1 0 0 . . . 0 0Nickel Compounds[C, M] 1 0 0 . . . 0 02,4-Dinitrophenol 1 0 . . . . 0 0Aniline 1 0 . . . . 0 0Diethyl Sulfate[C] 1 0 . . . . 0 0Chloroform[C] 1 0 . . . . 0 0n,n-dimethylformamide[C] 1 0 . . 1,300 . 1,300 1,300Bromomethane[O] 1 0 . . . . 0 0Methyl Iodide 1 0 . . . . 0 0

Sector Notebook Data Refresh - 1997 Plastic Resin and Man-made Fiber
1995 TRI Transfers for Man-made Fiber Manufacturing Facilities (SIC 2823 & 2824) By Number of Facilities Reporting (Pounds/year)*
Chemical Name # Reporting POTW Disposal Recycling Treatment Recovery Total Avg TransferChemical Transfers Transfers Transfers Transfers Transfers Transfers Per Facility
Energy
Sector Notebook Project May 1998I-5
Hydrogen Cyanide 1 0 . . . . 0 0Vinylidene Chloride 1 0 . . . . 0 0Chlorodifluoromethane[O] 1 0 . . . . 0 0Freon 113[O] 1 250 . . 500 . 750 750Dichlorotetrafluoroethane (CFC-114)[O] 1 0 . . . . 0 0Dimethyl Sulfate[C] 1 0 . . . . 0 0Isobutyraldehyde 1 0 . . . . 0 0Sec-butyl Alcohol 1 0 . . . . 0 0Acrylic Acid 1 0 . . 287 . 287 2871,1,2,2-tetrachloroethane 1 0 . . . . 0 04,4'-isopropylidenediphenol 1 0 . . . . 0 0Methyl Methacrylate 1 0 . . . . 0 0Dibutyl Phthalate 1 0 . . . . 0 0Phthalic Anhydride 1 0 . . 1,000 . 1,000 1,000Picric Acid 1 0 . . . . 0 0O-anisidine[C] 1 0 . . . . 0 02-phenylphenol 1 0 . . . . 0 0O-xylene 1 0 . . . . 0 0O-Toluidine[C] 1 0 . . . . 0 0Methyl Acrylate 1 0 . . 78 . 78 78Dichloran 1 0 . . . . 0 0p-nitroaniline 1 0 . . . . 0 0Benzyl Chloride 1 0 . . . . 0 0P-xylene 1 0 . . . . 0 0P-phenylenediamine 1 0 . . 3,200 . 3,200 3,200Quinone 1 0 . . . . 0 0Methyl Isobutyl Ketone 1 0 . . . . 0 0Maleic Anhydride 1 0 . . . . 0 0M-xylene 1 0 . . . . 0 01,3-phenylenediamine 1 0 . . 104,000 . 104,000 104,000Chlorobenzene 1 0 . . . . 0 0Cyclohexanol 1 0 . . . . 0 0Pyridine 1 0 . . . . 0 0Propylene 1 0 . . . . 0 0Di(2-ethylhexyl) Phthalate[C] 1 0 . . 8,500 . 8,500 8,500Triethylamine 1 0 . . 600 . 600 600N,N-dimethylaniline 1 0 . . . . 0 0Tetrachloroethylene[C] 1 0 . . 2,400 . 2,400 2,400Ethyl Acrylate[C] 1 0 . . 354 . 354 354p-nitrosodiphenylamine 1 0 . . . 15,000 15,000 15,000Bis(chloromethyl) Ether[C] 1 0 . . . . 0 0Vinyl Bromide[C] 1 0 . . . . 0 0N-methyl-2-pyrrolidone 1 0 . . 398,000 . 398,000 398,000Decabromodiphenyl Oxide 1 0 3,700 . . . 3,700 3,700Xylene (Mixed Isomers) 1 0 370 . 800,029 13,000 813,399 813,399Crotonaldehyde 1 0 . . . . 0 0Antimony[M] 1 0 500 . 12,150 . 12,650 12,650Cadmium[C, M] 1 0 8,400 11,000 . . 19,400 19,400Copper[M] 1 0 . . . . 0 0Boron Trifluoride 1 0 . . . . 0 0Hydrogen Fluoride 1 0 . . . . 0 0Chlorine Dioxide 1 0 . . . . 0 0
___ ________ __________ ___________ _________ _________ __________ ________34** 105,428 1,278,583 42,503,375 1,828,249 1,603,880 47,319,515 1,391,750
[C] Known or suspect carcinogens [M] Metals and metal compounds [O] Ozone depleters* Refer to Section III for a discussion of the TRI data and its limitations, methodology used to obtain this data, definitions of the column headings, and the definitions of carcinogens, metals, and ozone depleters.**Total number of facilities (not chemical reports) reporting to TRI in this industry sector.

Sector Notebook Data Refresh - 1997 Plastic Resin and Man-made Fiber
Being included on this list does not mean that the release is associated with non-compliance with environmental laws.1
Sector Notebook Project May 1998I-6
Ten Largest Volume TRI Releasing Plastic Resin Manufacturing Facilities ReportingOnly SIC 2821*
Rank Facility1 Total Releases in Pounds
1 BP Chemicals Inc. - Lima, OH 13,566,795
2 GE Plastics Co. - Mount Vernon, IN 3,446,425
3 Rexene Corp. - Odessa, TX 2,558,214
4 Quantum Chemical Corp. - Clinton, IA 2,508,685
5 Du Pont - Washington, WV 2,281,027
6 Quantum Chemical Corp. - La Porte, TX 2,225,186
7 GE Co. - Waterford, NY 2,219,600
8 Shell Chemical Co. - Apple Grove, WV 1,529,579
9 Carolina Eastman Div. - Columbia, SC 1,487,312
10 Exxon Chemical Co. - Baton Rouge, LA 1,088,290
Source: USEPA 1995 Toxics Release Inventory Database.*Refer to Section III for a general discussion of TRI data and its limitations. A discussion of the methodology used to develop this table can be found under the heading Ten Largest Volume TRI Releasing Facilities.
Ten Largest Volume TRI Releasing Facilities Reporting Only SIC 2821 (Plastic ResinManufacturing) or SIC 2821 and Other SIC Codes*
Rank Facility SIC Codes Reported in TRI Pounds1
TotalReleases in
1 Monsanto Co. - Cantonment, FL 2821, 2824, 2824, 2869, 2865 18,058,737
2 BP Chemicals Inc. - Lima, OH 2821, 2869 13,566,795
3 Tennessee Eastman Div. - Kingsport, TN 2821, 2823, 2869, 2865, 2893 7,341,378
4 Dow Chemical Co. - Freeport, TX 2821, 2812, 2813, 2819, 2822, 2865 5,593,977
5 Shell Oil Co. - Deer Park, TX 2821, 2911, 2869, 2865 4,513,517
6 Eastman Chemical Co. - Longview, TX 2821, 2869 3,908,702
7 Du Pont - Leland, NC 2821, 2865, 2824 3,653,612
8 GE Plastics Co. - Mount Vernon, IN 2821 3,446,425
9 Union Camp Corp. - Savannah, GA 2821, 2611, 2631 2653 3,121,612
10 ELF Atochem N.A. Inc. - Calvert City, KY 2821, 2869, 2819 3,082,676
Source: USEPA 1995 Toxics Release Inventory Database.*Refer to Section III for a general discussion of TRI data and its limitations. A discussion of the methodology used to develop this table can be found under the heading Ten Largest Volume TRI Releasing Facilities.
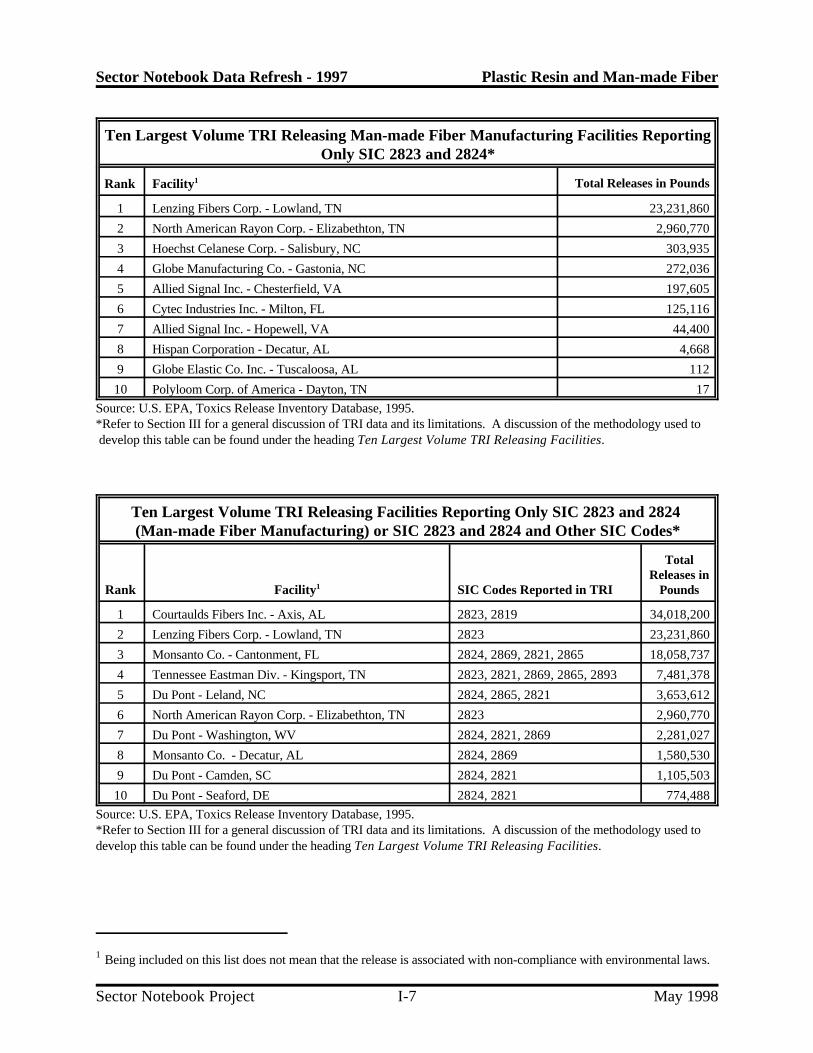
Sector Notebook Data Refresh - 1997 Plastic Resin and Man-made Fiber
Being included on this list does not mean that the release is associated with non-compliance with environmental laws.1
Sector Notebook Project May 1998I-7
Ten Largest Volume TRI Releasing Man-made Fiber Manufacturing Facilities ReportingOnly SIC 2823 and 2824*
Rank Facility1 Total Releases in Pounds
1 Lenzing Fibers Corp. - Lowland, TN 23,231,860
2 North American Rayon Corp. - Elizabethton, TN 2,960,770
3 Hoechst Celanese Corp. - Salisbury, NC 303,935
4 Globe Manufacturing Co. - Gastonia, NC 272,036
5 Allied Signal Inc. - Chesterfield, VA 197,605
6 Cytec Industries Inc. - Milton, FL 125,116
7 Allied Signal Inc. - Hopewell, VA 44,400
8 Hispan Corporation - Decatur, AL 4,668
9 Globe Elastic Co. Inc. - Tuscaloosa, AL 112
10 Polyloom Corp. of America - Dayton, TN 17
Source: U.S. EPA, Toxics Release Inventory Database, 1995.*Refer to Section III for a general discussion of TRI data and its limitations. A discussion of the methodology used to develop this table can be found under the heading Ten Largest Volume TRI Releasing Facilities.
Ten Largest Volume TRI Releasing Facilities Reporting Only SIC 2823 and 2824 (Man-made Fiber Manufacturing) or SIC 2823 and 2824 and Other SIC Codes*
Rank Facility SIC Codes Reported in TRI Pounds1
TotalReleases in
1 Courtaulds Fibers Inc. - Axis, AL 2823, 2819 34,018,200
2 Lenzing Fibers Corp. - Lowland, TN 2823 23,231,860
3 Monsanto Co. - Cantonment, FL 2824, 2869, 2821, 2865 18,058,737
4 Tennessee Eastman Div. - Kingsport, TN 2823, 2821, 2869, 2865, 2893 7,481,378
5 Du Pont - Leland, NC 2824, 2865, 2821 3,653,612
6 North American Rayon Corp. - Elizabethton, TN 2823 2,960,770
7 Du Pont - Washington, WV 2824, 2821, 2869 2,281,027
8 Monsanto Co. - Decatur, AL 2824, 2869 1,580,530
9 Du Pont - Camden, SC 2824, 2821 1,105,503
10 Du Pont - Seaford, DE 2824, 2821 774,488
Source: U.S. EPA, Toxics Release Inventory Database, 1995.*Refer to Section III for a general discussion of TRI data and its limitations. A discussion of the methodology used to develop this table can be found under the heading Ten Largest Volume TRI Releasing Facilities.

Sector Notebook Data Refresh - 1997 Plastic Resin and Man-made Fiber
Sector Notebook Project May 1998I-8
Source Reduction and Recycling Activity for the Plastic Resin Industry (SIC 2821)as Reported Within TRI*
A B C JOn-Site Off-Site
Year (10 lbs.) Transferred Off-SiteRecycled Recovery % Treated Recycled Recovery % Treated
Quantity ofProduction-
Related % Released % ReleasedWaste and and Disposed% % Energy % % Energy
6 a b c
D E F G H I
1994 4,116 5% 24% 12% 43% 2% 7% 4% 9%
1995 1,363 19% 39% 12% 31% 6% 4% 3% 5%
1996 1,448 --- 36% 16% 28% 7% 4% 2% 7%
1997 1,432 --- 37% 15% 28% 7% 4% 2% 7%
Source: U.S. EPA, Toxic Release Inventory Database, 1995.* Refer to Section III for a general discussion of TRI data and its limitations. A discussion of the methodology used todevelop this table can be found under the heading Source Reduction and Recycling Activity. Within this industry sector, non-production related waste < 1% of production related wastes for 1995.a
Total TRI transfers and releases as reported in Section 5 and 6 of Form R as a percentage of production related wastes.b
Percentage of production related waste released to the environment and transferred off-site for disposal.c
Source Reduction and Recycling Activity for the Man-made Fiber Industry (SIC 2823, 2824) as Reported Within TRI*
A B C JOn-Site Off-Site
Year (10 lbs.) Transferred Off-SiteRecycled Recovery % Treated Recycled Recovery % Treated
Quantity ofProduction- % Released
Related % Released and Waste and Disposed% % Energy % % Energy
6 a b c
D E F G H I
1994 634 21% 23% 1% 56% 8% 1% 0% 13%
1995 689 21% 31% 1% 48% 6% 0% 0% 14%
1996 814 --- 44% 1% 40% 5% 0% 0% 11%
1997 908 --- 50% 1% 36% 4% 0% 0% 9%Source: U.S. EPA, Toxic Release Inventory Database, 1995.
* Refer to Section III for a general discussion of TRI data and its limitations. A discussion of the methodology used todevelop this table can be found under the heading Source Reduction and Recycling Activity. Within this industry sector, non-production related waste < 1% of production related wastes for 1995.a
Total TRI transfers and releases as reported in Section 5 and 6 of Form R as a percentage of production related wastes.b
Percentage of production related waste released to the environment and transferred off-site for disposal.c

Sector Notebook Data Refresh - 1997 Plastic Resin and Man-made Fiber
Sector Notebook Project May 1998I-9
Five-Year Enforcement and Compliance Summary for the Plastic Resinand Man-made Fiber Industry*
A B C D E F G H I JRegion Facilities Facilities Number of Average Facilities with Total Percent Percent Enforcement
in Search Inspected Inspections Months 1 or More Enforcement State Federal to InspectionBetween Enforcement Actions Lead Lead Rate
Inspections Actions Actions Actions
I 24 16 73 20 4 8 50% 50% 0.11
II 31 30 366 5 17 52 81% 19% 0.14
III 38 36 418 5 10 21 90% 10% 0.05
IV 90 78 864 6 22 46 78% 22% 0.05
V 55 40 311 11 5 9 67% 33% 0.03
VI 51 43 309 10 28 76 71% 29% 0.25
VII 6 5 20 18 1 1 0% 100% 0.05
VIII 4 1 11 22 1 1 100% 0% 0.09
IX 25 10 41 37 4 3 100% 0% 0.07
X 5 4 17 18 1 2 100% 0% 0.12
TOTAL 329 263 2,430 8 93 219 76% 24% 0.09
*Data obtained from EPA’s Integrated Data for Enforcement Analysis (IDEA) System. For a description of IDEA and the methods used toobtain this data, refer to Section II.C. A discussion of this table can be found under the heading, Five-Year Enforcement and ComplianceSummary, in Section III.

Sector Notebook Data Refresh - 1997 Pharmaceuticals
Sector Notebook Project May 1998J-1
Pharmaceuticals

Sector Notebook Data Refresh - 1997 Pharmaceuticals
Sector Notebook Project May 1998J-2
1995 TRI Releases for Pharmaceutical Facilities (SIC 2833 and 2834) by Number of Facilities Reporting (pounds/year)*
Chemical Name Chemical Air Air Discharges Injection Disposal Releases Per Facility# Reporting Fugitive Point Water Underground Land Total Avg. Releases
Methanol 104 1,396,868 2,100,445 841,250 5,820,000 1,370 10,159,933 97,692Dichloromethane[C] 63 2,386,889 4,611,794 21,635 83,000 5 7,103,323 112,751Hydrochloric Acid (1995 and after "Acid Aerosols" Only) 62 68,269 532,143 10 0 5 600,427 9,684Toluene 54 498,932 593,839 10,025 9,100 0 1,111,896 20,591Ammonia 42 772,824 380,822 1,665,336 0 232,413 3,051,395 72,652Phosphoric Acid 31 5,194 5,160 20 0 5 10,379 335Ethylene Glycol 30 21,721 2,638 20,200 0 500 45,059 1,502Acetonitrile 25 206,608 106,670 1,405 219,000 5 533,688 21,348N,N-dimethylformamide[C] 20 63,972 10,598 69,005 1,000,000 1,700 1,145,275 57,264Chlorine 19 4,315 9,036 16,633 0 5 29,989 1,578N-hexane 18 201,267 258,124 2,384 5,300 5 467,080 25,949Triethylamine 17 22,262 15,957 10,030 5,900 5 54,154 3,186Zinc Compounds[M] 16 765 11,169 73,686 100,000 121,500 307,120 19,195Chloroform[C] 14 55,536 88,826 3,105 0 0 147,467 10,533N-butyl Alcohol 14 145,024 476,734 255 6,600 0 628,613 44,901Methyl Isobutyl Ketone 14 273,952 109,175 15,000 6,500 0 404,627 28,902Xylene (Mixed Isomers) 14 10,712 107,105 0 0 0 117,817 8,416Formic Acid 13 21,550 3,173 5,160 1,400 5 31,288 2,407Nitric Acid 13 8,029 12,928 10 0 0 20,967 1,613Methyl Tert-butyl Ether 11 4,061 18,449 0 12,000 0 34,510 3,137Sulfuric Acid 11 22,283 3,091 0 0 0 25,374 2,307Nitrate Compounds 10 0 0 2,082,243 0 16,875 2,099,118 209,912Formaldehyde[C] 9 2,662 3,772 2,000 0 0 8,434 937Cyclohexane 9 47,574 147,052 700 33,000 0 228,326 25,370Dichlorodifluoromethane[O] 8 22,610 195,178 0 0 0 217,788 27,224Certain Glycol Ethers 7 1,310 27,944 5 0 0 29,259 4,180Tert-butyl Alcohol 7 26,713 19,473 2,400 36,000 0 84,586 12,084Methyl Ethyl Ketone 7 20,624 51,120 50 31,000 0 102,794 14,685Naphthalene 7 515 1,014 0 0 0 1,529 218Pyridine 7 2,820 3,093 5 13,000 0 18,918 2,703Copper Compounds[M] 6 6 67 0 0 0 73 12Cyanide Compounds 6 425 868 5,810 2,800 0 9,903 1,651Manganese Compounds[M] 6 260 1,005 26,905 0 505 28,675 4,779Chloromethane 6 28,840 97,844 44,000 0 0 170,684 28,447Trichlorofluoromethane[O] 6 59,306 61,801 0 0 0 121,107 20,185Di(2-ethylhexyl) Phthalate[C] 6 255 292 0 0 0 547 91Ethylbenzene 5 789 977 0 0 0 1,766 3531,2-Dichloroethane[C] 5 928 1,313 269 10,000 0 12,510 2,5022-methoxyethanol 5 9,130 9,455 0 0 0 18,585 3,717Bromine 5 780 389 10 0 5 1,184 237Arsenic Compounds[C, M] 4 5 10 0 0 0 15 4Nickel Compounds[C, M] 4 0 75 434 0 96 605 151Chlorodifluoromethane[O] 4 31,484 30,009 0 0 0 61,493 15,373Chloroacetic Acid 4 24 5 16 0 0 45 11Benzoyl Peroxide 4 0 0 0 0 0 0 0Sodium Nitrite 4 0 0 15,000 0 0 15,000 3,750Barium Compounds[M] 3 10 5 250 0 0 265 88Aniline 3 3,896 1,173 0 0 0 5,069 1,690Benzene[C] 3 2,970 582 0 760 0 4,312 1,437Ethylene Oxide[C] 3 12,143 9,550 0 0 0 21,693 7,231Dichlorotetrafluoroethane 3 4,978 2,260 0 0 0 7,238 2,413Peracetic Acid 3 255 5 5 0 5 270 90Hydrazine[C] 3 285 50 3 0 0 338 113Ozone 3 250 522 0 0 0 772 257Tetracycline Hydrochloride 2 0 754 0 0 0 754 377Isopropyl Alcohol (Manufacturing, Strong-acid Process Only) 2 61,250 140,250 0 0 0 201,500 100,750Methyl Iodide 2 1,100 850 0 0 0 1,950 975Propylene Oxide[C] 2 500 1,330 5 0 0 1,835 918Freon 113[O] 2 3,500 38,119 0 0 0 41,619 20,810Acrylic Acid 2 33 22 0 0 0 55 28Phthalic Anhydride 2 1 0 0 0 0 1 1Benzoyl Chloride 2 0 2 0 0 0 2 1Benzyl Chloride 2 5 5 0 0 0 10 5Epichlorohydrin[C] 2 290 50 0 0 0 340 170
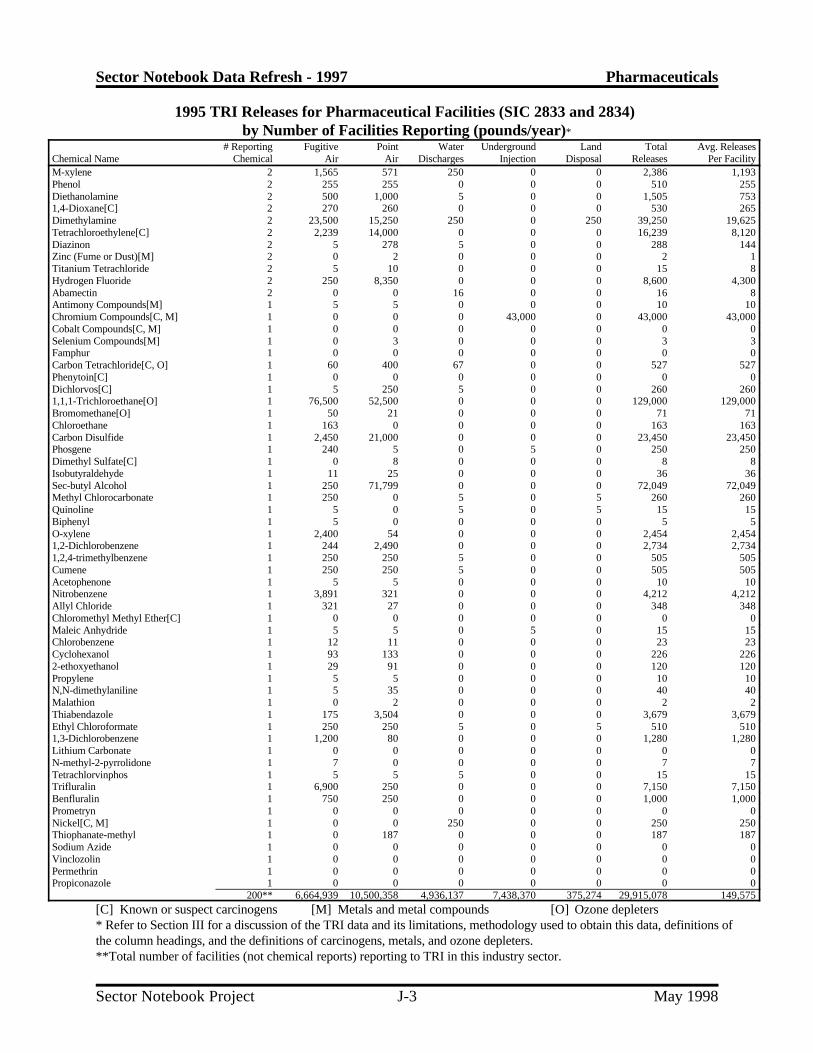
Sector Notebook Data Refresh - 1997 Pharmaceuticals
1995 TRI Releases for Pharmaceutical Facilities (SIC 2833 and 2834) by Number of Facilities Reporting (pounds/year)*
Chemical Name Chemical Air Air Discharges Injection Disposal Releases Per Facility# Reporting Fugitive Point Water Underground Land Total Avg. Releases
Sector Notebook Project May 1998J-3
M-xylene 2 1,565 571 250 0 0 2,386 1,193Phenol 2 255 255 0 0 0 510 255Diethanolamine 2 500 1,000 5 0 0 1,505 7531,4-Dioxane[C] 2 270 260 0 0 0 530 265Dimethylamine 2 23,500 15,250 250 0 250 39,250 19,625Tetrachloroethylene[C] 2 2,239 14,000 0 0 0 16,239 8,120Diazinon 2 5 278 5 0 0 288 144Zinc (Fume or Dust)[M] 2 0 2 0 0 0 2 1Titanium Tetrachloride 2 5 10 0 0 0 15 8Hydrogen Fluoride 2 250 8,350 0 0 0 8,600 4,300Abamectin 2 0 0 16 0 0 16 8Antimony Compounds[M] 1 5 5 0 0 0 10 10Chromium Compounds[C, M] 1 0 0 0 43,000 0 43,000 43,000Cobalt Compounds[C, M] 1 0 0 0 0 0 0 0Selenium Compounds[M] 1 0 3 0 0 0 3 3Famphur 1 0 0 0 0 0 0 0Carbon Tetrachloride[C, O] 1 60 400 67 0 0 527 527Phenytoin[C] 1 0 0 0 0 0 0 0Dichlorvos[C] 1 5 250 5 0 0 260 2601,1,1-Trichloroethane[O] 1 76,500 52,500 0 0 0 129,000 129,000Bromomethane[O] 1 50 21 0 0 0 71 71Chloroethane 1 163 0 0 0 0 163 163Carbon Disulfide 1 2,450 21,000 0 0 0 23,450 23,450Phosgene 1 240 5 0 5 0 250 250Dimethyl Sulfate[C] 1 0 8 0 0 0 8 8Isobutyraldehyde 1 11 25 0 0 0 36 36Sec-butyl Alcohol 1 250 71,799 0 0 0 72,049 72,049Methyl Chlorocarbonate 1 250 0 5 0 5 260 260Quinoline 1 5 0 5 0 5 15 15Biphenyl 1 5 0 0 0 0 5 5O-xylene 1 2,400 54 0 0 0 2,454 2,4541,2-Dichlorobenzene 1 244 2,490 0 0 0 2,734 2,7341,2,4-trimethylbenzene 1 250 250 5 0 0 505 505Cumene 1 250 250 5 0 0 505 505Acetophenone 1 5 5 0 0 0 10 10Nitrobenzene 1 3,891 321 0 0 0 4,212 4,212Allyl Chloride 1 321 27 0 0 0 348 348Chloromethyl Methyl Ether[C] 1 0 0 0 0 0 0 0Maleic Anhydride 1 5 5 0 5 0 15 15Chlorobenzene 1 12 11 0 0 0 23 23Cyclohexanol 1 93 133 0 0 0 226 2262-ethoxyethanol 1 29 91 0 0 0 120 120Propylene 1 5 5 0 0 0 10 10N,N-dimethylaniline 1 5 35 0 0 0 40 40Malathion 1 0 2 0 0 0 2 2Thiabendazole 1 175 3,504 0 0 0 3,679 3,679Ethyl Chloroformate 1 250 250 5 0 5 510 5101,3-Dichlorobenzene 1 1,200 80 0 0 0 1,280 1,280Lithium Carbonate 1 0 0 0 0 0 0 0N-methyl-2-pyrrolidone 1 7 0 0 0 0 7 7Tetrachlorvinphos 1 5 5 5 0 0 15 15Trifluralin 1 6,900 250 0 0 0 7,150 7,150Benfluralin 1 750 250 0 0 0 1,000 1,000Prometryn 1 0 0 0 0 0 0 0Nickel[C, M] 1 0 0 250 0 0 250 250Thiophanate-methyl 1 0 187 0 0 0 187 187Sodium Azide 1 0 0 0 0 0 0 0Vinclozolin 1 0 0 0 0 0 0 0Permethrin 1 0 0 0 0 0 0 0Propiconazole 1 0 0 0 0 0 0 0
200** 6,664,939 10,500,358 4,936,137 7,438,370 375,274 29,915,078 149,575
[C] Known or suspect carcinogens [M] Metals and metal compounds [O] Ozone depleters* Refer to Section III for a discussion of the TRI data and its limitations, methodology used to obtain this data, definitions of the column headings, and the definitions of carcinogens, metals, and ozone depleters.**Total number of facilities (not chemical reports) reporting to TRI in this industry sector.
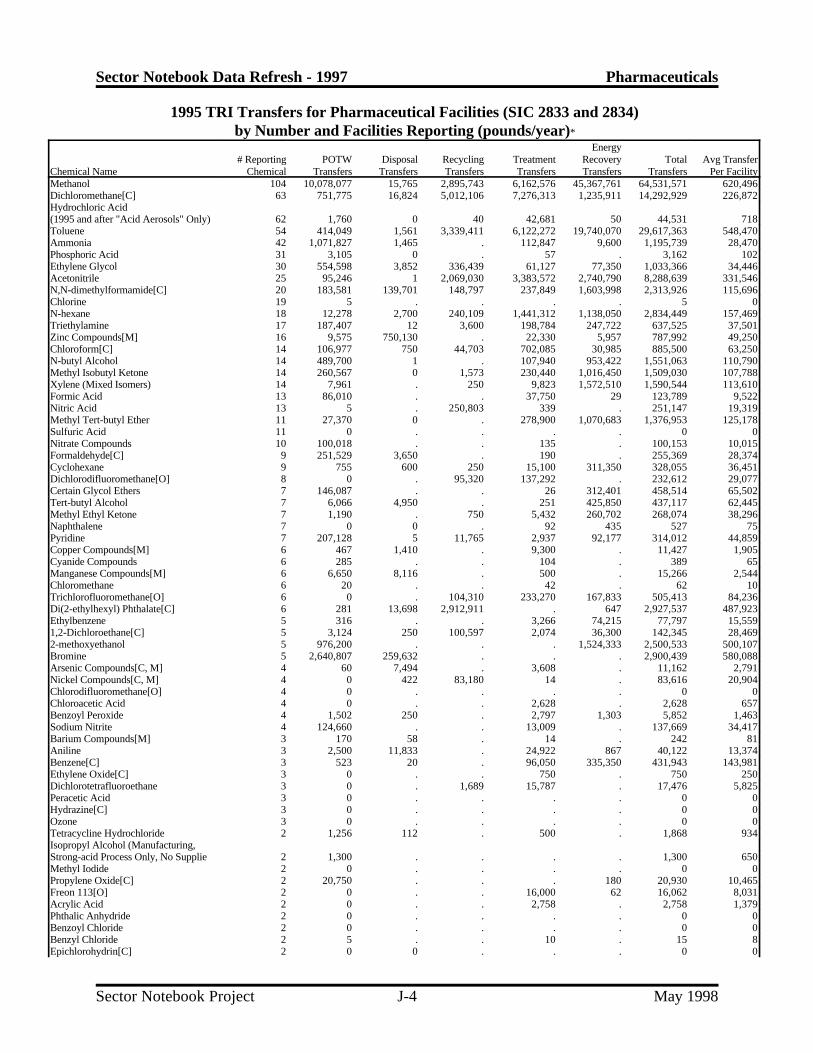
Sector Notebook Data Refresh - 1997 Pharmaceuticals
Sector Notebook Project May 1998J-4
1995 TRI Transfers for Pharmaceutical Facilities (SIC 2833 and 2834)by Number and Facilities Reporting (pounds/year)*
Chemical Name Chemical Transfers Transfers Transfers Transfers Transfers Transfers Per Facility# Reporting POTW Disposal Recycling Treatment Recovery Total Avg Transfer
Energy
Methanol 104 10,078,077 15,765 2,895,743 6,162,576 45,367,761 64,531,571 620,496Dichloromethane[C] 63 751,775 16,824 5,012,106 7,276,313 1,235,911 14,292,929 226,872Hydrochloric Acid (1995 and after "Acid Aerosols" Only) 62 1,760 0 40 42,681 50 44,531 718Toluene 54 414,049 1,561 3,339,411 6,122,272 19,740,070 29,617,363 548,470Ammonia 42 1,071,827 1,465 . 112,847 9,600 1,195,739 28,470Phosphoric Acid 31 3,105 0 . 57 . 3,162 102Ethylene Glycol 30 554,598 3,852 336,439 61,127 77,350 1,033,366 34,446Acetonitrile 25 95,246 1 2,069,030 3,383,572 2,740,790 8,288,639 331,546N,N-dimethylformamide[C] 20 183,581 139,701 148,797 237,849 1,603,998 2,313,926 115,696Chlorine 19 5 . . . . 5 0N-hexane 18 12,278 2,700 240,109 1,441,312 1,138,050 2,834,449 157,469Triethylamine 17 187,407 12 3,600 198,784 247,722 637,525 37,501Zinc Compounds[M] 16 9,575 750,130 . 22,330 5,957 787,992 49,250Chloroform[C] 14 106,977 750 44,703 702,085 30,985 885,500 63,250N-butyl Alcohol 14 489,700 1 . 107,940 953,422 1,551,063 110,790Methyl Isobutyl Ketone 14 260,567 0 1,573 230,440 1,016,450 1,509,030 107,788Xylene (Mixed Isomers) 14 7,961 . 250 9,823 1,572,510 1,590,544 113,610Formic Acid 13 86,010 . . 37,750 29 123,789 9,522Nitric Acid 13 5 . 250,803 339 . 251,147 19,319Methyl Tert-butyl Ether 11 27,370 0 . 278,900 1,070,683 1,376,953 125,178Sulfuric Acid 11 0 . . . . 0 0Nitrate Compounds 10 100,018 . . 135 . 100,153 10,015Formaldehyde[C] 9 251,529 3,650 . 190 . 255,369 28,374Cyclohexane 9 755 600 250 15,100 311,350 328,055 36,451Dichlorodifluoromethane[O] 8 0 . 95,320 137,292 . 232,612 29,077Certain Glycol Ethers 7 146,087 . . 26 312,401 458,514 65,502Tert-butyl Alcohol 7 6,066 4,950 . 251 425,850 437,117 62,445Methyl Ethyl Ketone 7 1,190 . 750 5,432 260,702 268,074 38,296Naphthalene 7 0 0 . 92 435 527 75Pyridine 7 207,128 5 11,765 2,937 92,177 314,012 44,859Copper Compounds[M] 6 467 1,410 . 9,300 . 11,427 1,905Cyanide Compounds 6 285 . . 104 . 389 65Manganese Compounds[M] 6 6,650 8,116 . 500 . 15,266 2,544Chloromethane 6 20 . . 42 . 62 10Trichlorofluoromethane[O] 6 0 . 104,310 233,270 167,833 505,413 84,236Di(2-ethylhexyl) Phthalate[C] 6 281 13,698 2,912,911 . 647 2,927,537 487,923Ethylbenzene 5 316 . . 3,266 74,215 77,797 15,5591,2-Dichloroethane[C] 5 3,124 250 100,597 2,074 36,300 142,345 28,4692-methoxyethanol 5 976,200 . . . 1,524,333 2,500,533 500,107Bromine 5 2,640,807 259,632 . . . 2,900,439 580,088Arsenic Compounds[C, M] 4 60 7,494 . 3,608 . 11,162 2,791Nickel Compounds[C, M] 4 0 422 83,180 14 . 83,616 20,904Chlorodifluoromethane[O] 4 0 . . . . 0 0Chloroacetic Acid 4 0 . . 2,628 . 2,628 657Benzoyl Peroxide 4 1,502 250 . 2,797 1,303 5,852 1,463Sodium Nitrite 4 124,660 . . 13,009 . 137,669 34,417Barium Compounds[M] 3 170 58 . 14 . 242 81Aniline 3 2,500 11,833 . 24,922 867 40,122 13,374Benzene[C] 3 523 20 . 96,050 335,350 431,943 143,981Ethylene Oxide[C] 3 0 . . 750 . 750 250Dichlorotetrafluoroethane 3 0 . 1,689 15,787 . 17,476 5,825Peracetic Acid 3 0 . . . . 0 0Hydrazine[C] 3 0 . . . . 0 0Ozone 3 0 . . . . 0 0Tetracycline Hydrochloride 2 1,256 112 . 500 . 1,868 934Isopropyl Alcohol (Manufacturing, Strong-acid Process Only, No Supplie 2 1,300 . . . . 1,300 650Methyl Iodide 2 0 . . . . 0 0Propylene Oxide[C] 2 20,750 . . . 180 20,930 10,465Freon 113[O] 2 0 . . 16,000 62 16,062 8,031Acrylic Acid 2 0 . . 2,758 . 2,758 1,379Phthalic Anhydride 2 0 . . . . 0 0Benzoyl Chloride 2 0 . . . . 0 0Benzyl Chloride 2 5 . . 10 . 15 8Epichlorohydrin[C] 2 0 0 . . . 0 0

Sector Notebook Data Refresh - 1997 Pharmaceuticals
1995 TRI Transfers for Pharmaceutical Facilities (SIC 2833 and 2834)by Number and Facilities Reporting (pounds/year)*
Chemical Name Chemical Transfers Transfers Transfers Transfers Transfers Transfers Per Facility# Reporting POTW Disposal Recycling Treatment Recovery Total Avg Transfer
Energy
Sector Notebook Project May 1998J-5
M-xylene 2 20 . . 87,148 78,059 165,227 82,614Phenol 2 250 . . 548 . 798 399Diethanolamine 2 1,500 . . . 47,916 49,416 24,7081,4-Dioxane[C] 2 4,170 2 . 300 8,960 13,432 6,716Dimethylamine 2 0 38,000 . 2,100 . 40,100 20,050Tetrachloroethylene[C] 2 0 . 510 . 49,005 49,515 24,758Diazinon 2 0 1,060 . 1,609 . 2,669 1,335Zinc (Fume or Dust)[M] 2 0 1,223 . . . 1,223 612Titanium Tetrachloride 2 0 . . . . 0 0Hydrogen Fluoride 2 0 . . . . 0 0Abamectin 2 0 . . 5,582 . 5,582 2,791Antimony Compounds[M] 1 0 53,200 . . . 53,200 53,200Chromium Compounds[C, M] 1 250 260 . 5 . 515 515Cobalt Compounds[C, M] 1 2,920 . . . . 2,920 2,920Selenium Compounds[M] 1 260 . . 13,641 . 13,901 13,901Famphur 1 0 . . 1,540 . 1,540 1,540Carbon Tetrachloride[C, O] 1 40 . . 45,782 . 45,822 45,822Phenytoin[C] 1 0 19,300 . . . 19,300 19,300Dichlorvos[C] 1 0 250 . 250 . 500 5001,1,1-Trichloroethane[O] 1 0 . 106,250 . . 106,250 106,250Bromomethane[O] 1 0 . . . . 0 0Chloroethane 1 0 . . 2,489 . 2,489 2,489Carbon Disulfide 1 1,120 . . 18 11,390 12,528 12,528Phosgene 1 0 . . . . 0 0Dimethyl Sulfate[C] 1 0 . . . . 0 0Isobutyraldehyde 1 0 . 8,647 640 . 9,287 9,287Sec-butyl Alcohol 1 0 . . . . 0 0Methyl Chlorocarbonate 1 0 . . . . 0 0Quinoline 1 0 . . 250 . 250 250Biphenyl 1 0 . . . . 0 0O-xylene 1 0 . . 100,000 61,800 161,800 161,8001,2-Dichlorobenzene 1 6,480 . . 14,000 91,891 112,371 112,3711,2,4-trimethylbenzene 1 4,800 . . . . 4,800 4,800Cumene 1 1,167 . . . . 1,167 1,167Acetophenone 1 0 . . . . 0 0Nitrobenzene 1 5 . . 5,914 . 5,919 5,919Allyl Chloride 1 0 . . . . 0 0Chloromethyl Methyl Ether[C] 1 0 . . . . 0 0Maleic Anhydride 1 0 . . . . 0 0Chlorobenzene 1 0 . . . 179,228 179,228 179,228Cyclohexanol 1 0 . . . . 0 02-ethoxyethanol 1 4 . . 25,004 . 25,008 25,008Propylene 1 0 . . . . 0 0N,N-dimethylaniline 1 10,000 . . . 328,000 338,000 338,000Malathion 1 0 26 . 273 . 299 299Thiabendazole 1 271 . . . 2,160 2,431 2,431Ethyl Chloroformate 1 0 . . . . 0 01,3-Dichlorobenzene 1 1,400 . . . . 1,400 1,400Lithium Carbonate 1 0 . . 750 . 750 750N-methyl-2-pyrrolidone 1 249,000 . . . . 249,000 249,000Tetrachlorvinphos 1 0 4,200 . . . 4,200 4,200Trifluralin 1 0 18,000 . . . 18,000 18,000Benfluralin 1 0 14,000 . . . 14,000 14,000Prometryn 1 0 . . 203 . 203 203Nickel[C, M] 1 0 18 400,000 . . 400,018 400,018Thiophanate-methyl 1 0 . . 2,677 . 2,677 2,677Sodium Azide 1 0 . . . . 0 0Vinclozolin 1 0 . . 1,030 . 1,030 1,030Permethrin 1 0 . . . . 0 0Propiconazole 1 0 . . 1,025 . 1,025 1,025
200** 19,119,179 1,394,801 18,168,783 27,330,633 81,213,752 147,239,047 736,195
[C] Known or suspect carcinogens [M] Metals and metal compounds [O] Ozone depleters* Refer to Section III for a discussion of the TRI data and its limitations, methodology used to obtain this data, definitions of the column headings, and the definitions of carcinogens, metals, and ozone depleters.**Total number of facilities (not chemical reports) reporting to TRI in this industry sector.

Sector Notebook Data Refresh - 1997 Pharmaceuticals
Being included on this list does not mean that the release is associated with non-compliance with environmental laws.1
Sector Notebook Project May 1998J-6
Ten Largest Volume TRI Releasing Pharmaceutical Manufacturing Facilities ReportingOnly SIC 2833 and 2834*
Rank Facility Pounds1Total TRI Releases in
1 Pharmacia & Upjohn Co., Portage, Michigan 8,307,190
2 Eli Lilly & Co. - Tippecanoe Labs, Shadeland, Indiana 2,504,810
3 Warner-Lambert Co., Holland, Michigan 2,295,005
4 Upjohn Mfg., Co., Barceloneta, Puerto Rico 2,001,450
5 Pfizer Inc., Groton, Connecticut. 1,761,385
6 Eli Lilly & Co - Clinton Laboratories, Clinton, Indiana 1,282,605
7 Abbott Chemicals, Inc., Barceloneta, Puerto Rico 1,193,707
8 Pfizer Inc., Southport, North Carolina 1,164,350
9 Schering-Plough Products, Inc., Las Piedras, Puerto Rico 756,089
10 Biokyowa Inc., Cape Girardeau, Missouri 669,869
Source: US EPA 1995 Toxics Release Inventory Database.*Refer to Section III for a general discussion of TRI data and its limitations. A discussion of the methodology used to develop this table can be found under the heading Ten Largest Volume TRI Releasing Facilities.
Ten Largest Volume TRI Releasing Facilities Reporting Only SIC 2833 and 2834or SIC 2833 and 2834 and Other SIC Codes*
Rank Facility SIC Codes Reported in TRI Pounds1
Total TRIReleases in
1 Pharmacia & Upjohn Co., Portage, Michigan 2834 8,307,190
2 Monsanto Co., Luling, Louisiana 2819, 2834, 2842, 2865, 2869, 5,698,0312873, 2879
3 Eli Lilly & Co. - Tippecanoe Labs, Shadeland, Indiana 2834 2,504,810
4 Warner-Lambert Co., Holland, Michigan 2834 2,295,005
5 Upjohn Mfg., Co., Barceloneta, Puerto Rico 2834 2,001,450
6 Pfizer Inc., Groton, Connecticut. 2833 1,761,385
7 Ethyl Corp., Orangeburg, South Carolina 2834, 2869, 2969 1,284,456
8 Eli Lilly & Co - Clinton Laboratories, Clinton, Indiana 2833, 2834 1,282,605
9 Dow Chemical Co., Midland, Michigan 2819, 2821, 2824, 2834, 2865, 1,228,6292869, 2879, 2979
10 Abbott Chemicals, Inc., Barceloneta, Puerto Rico 2833, 2834 1,193,707
Source: US EPA Toxics Release Inventory Database, 1995.*Refer to Section III for a general discussion of TRI data and its limitations. A discussion of the methodology used to develop this table can be found under the heading Ten Largest Volume TRI Releasing Facilities.

Sector Notebook Data Refresh - 1997 Pharmaceuticals
Sector Notebook Project May 1998J-7
Source Reduction and Recycling Activity for the Pharmaceuticals Industry (SIC 2833 and2834) as Reported within TRI*
A B C JOn-Site Off-Site
Year (10 lbs.) Transferred Off-siteRecycled Recovery % Treated Recycled Recovery % Treated
Quantity of %Production- Released
Related % Released andWaste and Disposed% % Energy % % Energy
6 a b
c
D E F G H I
1994 324 50% 14% 2% 34% 5% 22% 13% 11%
1995 382 46% 17% 2% 34% 5% 22% 12% 10%
1996 404 --- 19% 2% 37% 5% 19% 10% 8%
1997 414 --- 20% 2% 36% 6% 18% 10% 8%
Source: Toxics Release Inventory Database, 1995. * Refer to Section III for a general discussion of TRI data and its limitations. A discussion of the methodology used todevelop this table can be found under the heading Source Reduction and Recycling Activity. Within this industry sector, non-production related waste < 1% of production related wastes for 1995.a
Total TRI transfers and releases as reported in Section 5 and 6 of Form R as a percentage of production related wastes.b
Percentage of production related waste released to the environment and transferred off-site for disposal.c

Sector Notebook Data Refresh - 1997 Pharmaceuticals
Sector Notebook Project May 1998J-8
Five-Year Enforcement and Compliance Summary for the Pharmaceutical Industry*A B C D E F G H I J
Region Facilities Facilities Number of Average Facilities with Total Percent Percent Enforcementin Search Inspected Inspections Months 1 or More Enforcement State Federal to Inspection
Between Enforcement Actions Lead Lead RateInspections Actions Actions Actions
I 8 5 11 44 0 0 0% 0% --
II 60 53 624 6 21 95 84% 16% 0.15
III 18 16 111 10 3 3 100% 0% 0.03
IV 24 17 227 6 4 12 83% 17% 0.05
V 22 16 143 9 4 5 60% 40% 0.03
VI 5 5 17 18 1 4 0% 100% 0.24
VII 12 8 37 19 1 1 100% 0% 0.03
VIII 6 5 22 16 0 0 0% 0% --
IX 8 3 7 69 0 0 0% 0% --
X 1 1 2 30 1 2 50% 50% 1.00
TOTAL 164 129 1,201 8 35 122 80% 20% 0.10
*Data obtained from EPA’s Integrated Data for Enforcement Analysis (IDEA) System. For a description of IDEA and the methods used toobtain this data, refer to Section II.C. A discussion of this table can be found under the heading, Five-Year Enforcement and ComplianceSummary, in Section III.

Sector Notebook Data Refresh - 1997 Organic Chemicals
Sector Notebook Project May 1998K-1
Organic Chemicals

Sector Notebook Data Refresh - 1997 Organic Chemicals
Sector Notebook Project May 1998K-2
1995 TRI Releases for Organic Chemicals Facilities (SIC 286)by Number of Facilities Reporting (pounds/year)*
Chemical Name Chemical Air Air Discharges Injection Disposal Releases Per Facility# Reporting Fugitive Point Water Underground Land Total Avg. Releases
Methanol 188 3,556,022 5,942,568 27,804 9,533,100 195,159 19,254,653 102,418Ammonia 116 800,537 2,880,564 187,315 4,606,974 57,711 8,533,101 73,561Toluene 112 911,733 1,311,526 3,068 53,999 1,806 2,282,132 20,376Xylene (Mixed Isomers) 87 612,152 158,183 2,496 5,077 204 778,112 8,944Benzene[C] 75 520,357 896,812 1,174 91,235 3,212 1,512,790 20,171Hydrochloric Acid (1995 and after "Acid 72 205,548 1,082,423 5 0 581 1,288,557 17,897Ethylene Glycol 67 623,106 85,828 34,800 12,506,710 52,311 13,302,755 198,549Chlorine 67 70,266 190,621 1,589 0 0 262,476 3,918Formaldehyde[C] 65 128,698 345,089 7,818 60,420 1,540 543,565 8,363N-butyl Alcohol 56 303,277 152,807 12,045 1,411,757 6 1,879,892 33,570Phenol 55 328,964 197,844 3,232 1,207,866 316 1,738,222 31,604Certain Glycol Ethers 52 136,192 24,684 16,270 0 611 177,757 3,418Styrene[C] 49 164,873 413,087 438 209,945 520 788,863 16,099Ethylbenzene 48 150,556 195,678 581 473,272 52 820,139 17,086Naphthalene 47 283,622 335,179 23,108 15,000 9,252 666,161 14,174Phosphoric Acid 47 15,428 386 0 0 32,935 48,749 1,037Ethylene 43 3,184,844 4,900,224 5 0 0 8,085,073 188,025Zinc Compounds[M] 41 7,418 10,799 8,133 15,132 102,310 143,792 3,507Propylene 40 1,858,547 2,609,425 0 0 0 4,467,972 111,699Maleic Anhydride 39 35,316 33,885 1 0 0 69,202 1,774Sulfuric Acid 39 20,228 68,898 0 0 944 90,070 2,309N-hexane 38 551,821 775,199 5 0 4 1,327,029 34,922Copper Compounds[M] 35 1,175 1,575 4,034 150,811 43,423 201,018 5,743Cyclohexane 33 306,553 494,620 9,743 185,143 210 996,269 30,190Dichloromethane[C] 29 84,840 398,816 384 200,000 0 684,040 23,588Methyl Ethyl Ketone 28 100,790 95,962 45 374,894 0 571,691 20,418Nitrate Compounds 27 10 1,260 17,994,769 2,805,000 1 20,801,040 770,409Formic Acid 26 85,167 29,930 10,400 5,225,000 3,200 5,353,697 205,911Acetaldehyde[C] 26 205,219 272,511 1,526 288,301 470 768,027 29,540Acrylic Acid 26 202,740 52,774 5 430,000 0 685,519 26,366Cumene 26 174,942 461,932 132 9,403 0 646,409 24,862Nitric Acid 25 10,516 2,115 0 15,797,900 224 15,810,755 632,430Barium Compounds[M] 24 6,944 2,109 4,982 0 0 14,035 585Biphenyl 24 29,944 10,835 3,520 24,837 2,811 71,947 2,9981,3-butadiene[C] 24 319,052 276,491 528 0 224 596,295 24,846Chloromethane 23 130,989 928,953 924 0 0 1,060,866 46,125Phthalic Anhydride 23 22,816 18,422 0 0 0 41,238 1,7931,2,4-trimethylbenzene 23 7,218 12,336 187 179 192 20,112 874Ethylene Oxide[C] 22 193,094 96,860 4,828 130,000 2,200 426,982 19,408Propylene Oxide[C] 22 167,253 210,667 8,400 22,577 4,000 412,897 18,768Chromium Compounds[C, M] 20 67 1,979 963 10,540 1,233 14,782 739Aniline 20 71,960 27,913 320 367,740 5 467,938 23,397Diethanolamine 20 37,610 1,266 11,585 0 39,978 90,439 4,522Sodium Nitrite 20 1,105 277 3,290 412,000 2 416,674 20,834Methyl Isobutyl Ketone 19 888,818 259,655 1,058 2,100 5 1,151,636 60,612Nickel Compounds[C, M] 18 766 1,172 1,542 64,483 311 68,274 3,793Chloroethane 18 39,533 245,268 1,918 0 5 286,724 15,929Anthracene 18 6,033 4,120 4,304 0 1,641 16,098 894Tert-butyl Alcohol 16 386,200 19,662 3,821 545,321 0 955,004 59,688Tetrachloroethylene[C] 16 27,765 16,549 88 0 0 44,402 2,775Polycyclic Aromatic Compounds[C] 15 30,209 31,721 85 0 370 62,385 4,159N,N-dimethylformamide[C] 15 52,011 3,718 278 0 5 56,012 3,734Acrylonitrile[C] 15 22,724 41,616 0 991,043 1 1,055,384 70,3591,2-Dichloroethane[C] 14 236,632 36,472 21 0 0 273,125 19,509Methyl Tert-butyl Ether 14 47,300 90,275 549 2,644 0 140,768 10,055Acetonitrile 13 78,054 70,892 503 4,860,695 7 5,010,151 385,396Dichlorodifluoromethane[O] 13 263,980 160,603 2 26 0 424,611 32,662O-xylene 13 49,177 25,458 10 0 0 74,645 5,742Methyl Acrylate 13 29,310 88,107 250 159 0 117,826 9,064Chlorobenzene 13 32,791 18,090 39 8,405 5 59,330 4,564N-methyl-2-pyrrolidone 13 1,200 951 0 768,287 570 771,008 59,308Creosote[C] 13 77,601 66,084 5 0 0 143,690 11,053Chlorodifluoromethane[O] 12 313,060 162,552 24 22 0 475,658 39,638Dimethyl Sulfate[C] 12 2,146 731 0 0 0 2,877 240

Sector Notebook Data Refresh - 1997 Organic Chemicals
1995 TRI Releases for Organic Chemicals Facilities (SIC 286)by Number of Facilities Reporting (pounds/year)*
Chemical Name Chemical Air Air Discharges Injection Disposal Releases Per Facility# Reporting Fugitive Point Water Underground Land Total Avg. Releases
Sector Notebook Project May 1998K-3
Trichloroethylene[C] 12 36,879 2,446 10 0 0 39,335 3,278Vinyl Acetate[C] 12 395,964 643,869 140 701,078 0 1,741,051 145,088Cresol (Mixed Isomers) 12 50,646 23,313 15 545,146 85 619,205 51,600Chloroform[C] 11 2,877 13,200 10 0 0 16,087 1,4621,1,1-Trichloroethane[O] 11 31,822 261,153 0 0 0 292,975 26,634Carbon Disulfide 11 32,793 31,820 13 3,980 0 68,606 6,237Allyl Alcohol 11 30,939 9,102 2,700 143,801 0 186,542 16,958Triethylamine 11 13,260 10,307 464 27,470 0 51,501 4,682Dimethylamine 11 22,139 23,334 0 45,000 0 90,473 8,225Cobalt Compounds[C, M] 10 52 5,208 62,699 0 22,202 90,161 9,016Hydrogen Cyanide 10 18,440 215,446 0 343,154 3 577,043 57,704Dicyclopentadiene 10 80,593 14,249 1,442 0 331 96,615 9,662Pyridine 10 13,912 2,526 0 248,000 0 264,438 26,444Dibenzofuran 10 8,601 5,995 2,838 0 220 17,654 1,765Ethyl Acrylate[C] 10 30,882 3,803 0 0 0 34,685 3,469Nickel[C, M] 10 256 3,418 5 35 62 3,776 378Bromine 10 4,856 5,425 0 0 0 10,281 1,028Freon 113[O] 9 15,093 11,146 27 6 0 26,272 2,919Sec-butyl Alcohol 9 6,890 38,673 4,956 88,172 0 138,691 15,410Acrylamide[C] 9 2,076 546 0 2,000,000 69 2,002,691 222,521Methyl Methacrylate 9 34,655 140,844 750 0 0 176,249 19,583Acetophenone 9 10,090 33,231 0 629,201 0 672,522 74,725Benzyl Chloride 9 6,197 112 13 0 240 6,562 729Epichlorohydrin[C] 9 8,641 1,778 255 0 17,889 28,563 3,174M-cresol 9 9,067 6,026 1,600 680,000 0 696,693 77,410Hydroquinone 9 284 5 0 68,000 43 68,332 7,592Butyl Acrylate 9 50,819 35,571 2,700 0 0 89,090 9,899Cumene Hydroperoxide 8 24,433 1,070 68 280,000 0 305,571 38,196Phenanthrene 8 7,392 13,171 15 0 250 20,828 2,604Benzoyl Chloride 8 8,788 1,290 0 0 0 10,078 1,260P-cresol 8 7,091 8,815 801 340,000 0 356,707 44,588Diphenylamine 8 26,959 10,489 200 260 0 37,908 4,739Butyraldehyde 8 56,990 19,787 5 65,783 10 142,575 17,8223,3'-dichlorobenzidine Dihydrochloride[C] 8 0 0 0 0 0 0 0Hydrogen Fluoride 8 5,214 7,688 0 0 0 12,902 1,613Antimony Compounds[M] 7 21 257 52 0 0 330 47Lead Compounds[C, M] 7 5,023 500 253 0 0 5,776 825Manganese Compounds[M] 7 1,206 33,760 131,000 0 74,000 239,966 34,281Diethyl Sulfate[C] 7 12 12 0 0 0 24 3Trichlorofluoromethane[O] 7 25,220 57,261 10 22 0 82,513 11,788Isobutyraldehyde 7 34,151 6,401 250 44,075 47 84,924 12,132Quinoline 7 2,796 3,577 15 13,000 150 19,538 2,791O-Toluidine[C] 7 1,194 139 0 10,140 7 11,480 1,640M-xylene 7 68,284 62,210 5 0 0 130,499 18,643Propionaldehyde 7 31,271 8,197 5 21,432 0 60,905 8,701Dimethyl Phthalate 7 4,183 1,258 14 250 5 5,710 816Molybdenum Trioxide 7 100 1,700 0 75,000 20,595 97,395 13,914Cyanide Compounds 6 24,012 1,155 15,647 1,338,824 808 1,380,446 230,074Carbon Tetrachloride[C, O] 6 16,878 5,233 2 0 0 22,113 3,686Chloroacetic Acid 6 3,751 344 0 0 0 4,095 6834,4'-isopropylidenediphenol 6 67,876 15,015 250 82,000 0 165,141 27,524P-xylene 6 126,406 1,329,212 19 0 2 1,455,639 242,607Acrolein 6 681 1,092 0 505 0 2,278 380Cyclohexanol 6 10,872 76,473 0 2,323,000 0 2,410,345 401,7241,2,4-trichlorobenzene 6 8,856 61,707 0 0 0 70,563 11,761N,N-dimethylaniline 6 2,452 2,541 250 0 0 5,243 8741,1-dichloro-1-fluoroethane[O] 6 78,224 84,208 0 26 0 162,458 27,076Boron Trifluoride 6 2,268 1,040 0 0 0 3,308 551Diisocyanates 5 3,133 281 0 0 0 3,414 683Vinyl Chloride[C] 5 65,197 3,647 0 0 0 68,844 13,769Hydrazine[C] 5 5,774 1,312 0 0 0 7,086 1,417Cadmium Compounds[C, M] 4 261 656 0 0 0 917 229Dichlorotetrafluoroethane (CFC-114)[O] 4 1,776 1,363 0 0 0 3,139 785Monochloropentafluoroethane[O] 4 11,692 10,072 0 3 0 21,767 5,442

Sector Notebook Data Refresh - 1997 Organic Chemicals
1995 TRI Releases for Organic Chemicals Facilities (SIC 286)by Number of Facilities Reporting (pounds/year)*
Chemical Name Chemical Air Air Discharges Injection Disposal Releases Per Facility# Reporting Fugitive Point Water Underground Land Total Avg. Releases
Sector Notebook Project May 1998K-4
1,1,2-trichloroethane 4 2,301 84 0 0 0 2,385 5961,1,2,2-tetrachloroethane 4 121 15 0 0 0 136 34Dibutyl Phthalate 4 551 810 0 390,000 0 391,361 97,840Benzoyl Peroxide 4 250 796 0 0 0 1,046 262O-cresol 4 2,139 4,336 47 590,000 0 596,522 149,131Allyl Chloride 4 3,610 2,024 0 0 0 5,634 1,4092-ethoxyethanol 4 23,631 19,331 890 0 0 43,852 10,963Di(2-ethylhexyl) Phthalate[C] 4 2,845 5 0 0 0 2,850 7131,4-Dioxane[C] 4 12,802 230 8,699 0 5,700 27,431 6,858Copper[M] 4 0 170 292 0 0 462 116Vinylidene Chloride 3 316 345 0 0 0 661 220Phosgene 3 5 5 0 0 0 10 3O-anisidine[C] 3 506 55 74 0 0 635 2124,4'-methylenedianiline[C] 3 2,150 260 0 110 0 2,520 840P-phenylenediamine 3 250 250 0 0 0 500 1671,2-butylene Oxide 3 225 1,606 0 0 0 1,831 6102-methoxyethanol 3 14,017 600 3,130 0 0 17,747 5,9162,2-dichloro-1,1,1-trifluoroethane[O] 3 3,155 7,100 1 0 0 10,256 3,4194,6-dinitro-o-cresol 3 20 54 0 0 0 74 251,2-dichloroethylene 3 113 46 0 0 0 159 53Asbestos (Friable)[C] 3 0 0 0 0 0 0 02-chloro-1,1,1,2-tetrafluoroethane[O] 3 17,024 876 0 0 0 17,900 5,967Crotonaldehyde 3 3,259 3,100 0 390,000 0 396,359 132,120Silver[M] 3 0 9 140 0 0 149 50Silver Compounds[M] 2 88 0 0 0 1,700 1,788 894Isopropyl Alcohol (Manufacturing, 2 78 262 0 0 0 340 170Bromomethane[O] 2 6,200 717,200 0 0 0 723,400 361,7001-chloro-1,1-difluoroethane[O] 2 14,038 17,371 0 6 0 31,415 15,7082-nitrophenol 2 5 2 0 0 0 7 4Dinitrobutyl Phenol 2 5 5 0 0 0 10 5Picric Acid 2 0 0 0 24,256 0 24,256 12,1281,2-Dichlorobenzene 2 5 8,529 1 0 0 8,535 4,2681,2-phenylenediamine 2 41 8 0 0 0 49 25Benzoic trichloride[C] 2 3,526 4 0 0 0 3,530 1,765Nitrobenzene 2 255 42 0 0 0 297 1495-nitro-o-toluidine 2 0 5 0 0 0 5 32,4-Dimethylphenol 2 460 803 26 79,000 0 80,289 40,145P-Chloroaniline[C] 2 6 251 0 0 0 257 129Quinone 2 0 1 0 0 0 1 11,2-Dibromoethane[C] 2 2,174 1,351 0 0 0 3,525 1,763Propargyl Alcohol 2 33 1,987 0 290,680 0 292,700 146,3501,3-phenylenediamine 2 0 5 0 0 0 5 32-methylpyridine 2 68,000 31 0 41,720 0 109,751 54,876Hexachlorobenzene[C] 2 15 0 0 0 0 15 8P-Cresidine[C] 2 1,706 2,900 0 0 0 4,606 2,303Chloroprene 2 11 13 0 0 0 24 12Sodium Dimethyldithiocarbamate 2 0 0 0 0 0 0 01-chloro-1,1,2,2-tetrafluoroethane[O] 2 253 250 0 0 0 503 252Antimony[M] 2 250 0 0 0 0 250 125Cobalt[C, M] 2 0 2,800 13,672 0 530 17,002 8,501Ethylenebisdithiocarbamic Acid, Salts and 1 0 0 0 0 0 0 0Polychlorinated Alkanes 1 250 250 0 0 0 500 500Acetamide[C] 1 2 1 0 430,000 0 430,003 430,003Hexachloroethane 1 1 0 0 0 0 1 1Methyl Iodide 1 3,300 5 0 10,000 0 13,305 13,305Methylene Bromide 1 287 2,830 0 0 0 3,117 3,117Dichlorofluoromethane 1 3 0 2 0 0 5 5Bromotrifluoromethane[O] 1 250 0 0 0 0 250 2502-methyllactonitrile 1 0 430 0 0 0 430 4302-chloro-1,1,1-trifluoroethane[O] 1 2,608 0 0 0 0 2,608 2,608Hexachlorocyclopentadiene 1 7,450 72 0 0 0 7,522 7,5221,2-Dichloropropane 1 143 0 0 0 0 143 1432,3-dichloropropene 1 0 0 0 0 0 0 0Peracetic Acid 1 10 828 0 0 0 838 838

Sector Notebook Data Refresh - 1997 Organic Chemicals
1995 TRI Releases for Organic Chemicals Facilities (SIC 286)by Number of Facilities Reporting (pounds/year)*
Chemical Name Chemical Air Air Discharges Injection Disposal Releases Per Facility# Reporting Fugitive Point Water Underground Land Total Avg. Releases
Sector Notebook Project May 1998K-5
Methyl Chlorocarbonate 1 750 5 0 0 0 755 755Saccharin (Manufacturing, No Supplier 1 90 9 0 0 0 99 992,6-xylidine[C] 1 1 16 0 0 0 17 17Hexachloro-1,3-butadiene[C] 1 1 0 0 0 0 1 1Dihydrosafrole[C] 1 250 5 0 0 0 255 255Safrole[C] 1 250 5 0 0 0 255 2552,4-Diaminotoluene[C] 1 0 0 0 0 0 0 0Styrene Oxide[C] 1 1 3 0 0 0 4 4Ethylene Thiourea[C] 1 5 5 0 0 0 10 105-Nitro-o-Anisidine 1 5 5 0 0 0 10 10p-Nitroaniline 1 0 2 0 0 0 2 24-Nitrophenol 1 290 11 0 0 0 301 301P-anisidine 1 0 5 0 0 0 5 5Bis(2-chloroethyl) Ether 1 8 0 0 0 0 8 8Catechol 1 0 0 0 0 0 0 02,4-Dichlorophenol 1 5 5 0 0 0 10 10Ethyleneimine[C] 1 0 3 0 0 0 3 3Bromochlorodifluoromethane[O] 1 0 1 0 0 0 1 13,3-dichloro-1,1,1,2,2-pentafluoro-propane 1 250 5 0 0 0 255 2551,3-dichloro-1,1,2,2,3-pentafluoro-propane 1 250 5 0 0 0 255 255Dazomet 1 0 0 0 0 0 0 01,3-Dichlorobenzene 1 0 0 0 0 0 0 02,6-dimethylphenol 1 100 200 7 33,000 0 33,307 33,307Methyl Isocyanate 1 0 0 0 0 0 0 01,1,1,2-tetrachloroethane 1 5 5 0 0 0 10 10Carbofuran 1 0 0 0 0 0 0 0Dimethyl Chlorothiophosphate 1 5 5 0 51,677 0 51,687 51,687C.I. Disperse Yellow 3 1 101 0 27 0 0 128 128Aluminum (Fume or Dust)[M] 1 292 105 0 0 0 397 397Manganese[M] 1 0 0 0 0 0 0 0Cadmium[C, M] 1 0 0 0 0 0 0 0Chromium[M] 1 0 0 250 0 0 250 250Zinc (Fume or Dust)[M] 1 5 0 0 0 0 5 5Titanium Tetrachloride 1 0 0 . 0 0 0 0Phosphorus (Yellow or White) 1 0 0 0 0 0 0 0Ozone 1 750 5 0 0 0 755 755Hydrazine Sulfate[C] 1 0 0 0 0 0 0 03,3'-dimethoxybenzidine 1 0 0 0 0 0 0 0Dichlorobenzene (Mixed Isomers)[C] 1 200 10 0 0 0 210 210Diaminotoluene (Mixed Isomers)[C] 1 1,300 3 0 0 0 1,303 1,303Toluene Diisocyanate (Mixed Isomers)[C] 1 0 8 0 0 0 8 8Norflurazon 1 0 0 0 0 0 0 0C.I. Direct Blue 218 1 5 5 0 0 0 10 10Dichlorotrifluoroethane[O] 1 750 250 0 0 0 1,000 1,000
_________ _________ _________ _________ _________ _______ __________ ________402** 21,080,391 31,531,516 18,661,705 76,315,809 705,515 148,294,936 368,893
[C] Known or suspect carcinogens [M] Metals and metal compounds [O] Ozone depleters* Refer to Section III for a discussion of the TRI data and its limitations, methodology used to obtain this data, definitions of the column headings, and the definitions of carcinogens, metals, and ozone depleters.**Total number of facilities (not chemical reports) reporting to TRI in this industry sector.

Sector Notebook Data Refresh - 1997 Organic Chemicals
Sector Notebook Project May 1998K-6
1995 TRI Transfers for Organic Chemicals Facilities (SIC 286)by Number of Facilities Reporting (pounds/year)*
Chemical Name Chemical Transfers Transfers Transfers Transfers Recovery Transfers Per Facility# Reporting Potw Disposal Recycling Treatment Energy Total Avg Transfer
Methanol 188 15,677,637 510,796 6,082,219 5,474,463 22,794,521 50,539,636 268,828Ammonia 116 1,399,983 205,248 3,762,150 230,440 4,470 5,602,291 48,296Toluene 112 17,426 79,131 239,287 3,112,917 6,294,423 9,743,184 86,993Xylene (Mixed Isomers) 87 53,628 209,798 268,948 596,258 7,844,111 8,972,743 103,135Benzene[C] 75 1,092 24,716 265,392 308,713 332,785 932,698 12,436Hydrochloric Acid (1995 and after "Acid 72 17,277 10,677 . 300,404 . 328,358 4,561Ethylene Glycol 67 5,073,331 69,849 789,522 3,446,170 5,539,172 14,918,044 222,657Chlorine 67 31,620 2,845 . 214,026 820 249,311 3,721Formaldehyde[C] 65 114,303 9,046 259 174,409 1,283 299,300 4,605N-butyl Alcohol 56 303,571 163,207 844 218,412 2,696,887 3,382,921 60,409Phenol 55 773,525 141,728 281,746 407,138 701,209 2,305,346 41,915Certain Glycol Ethers 52 2,490,787 137,992 0 165,676 879,735 3,674,190 70,658Styrene[C] 49 34,861 88,327 7,153 620,708 1,690,228 2,441,277 49,822Ethylbenzene 48 8,134 119,270 6,756 40,657 1,984,858 2,159,675 44,993Naphthalene 47 3,397 200,472 37,775 828,814 1,141,890 2,212,348 47,071Phosphoric Acid 47 26,031 13,200 . 1,610 12 40,853 869Ethylene 43 250 . . 1,800 . 2,050 48Zinc Compounds[M] 41 9,022 732,877 154,221 140,200 28,656 1,064,976 25,975Propylene 40 0 . . 59,000 . 59,000 1,475Maleic Anhydride 39 306 211 . 938,514 19,081 958,112 24,567Sulfuric Acid 39 350 19,999 1,469,690 111,938 . 1,601,977 41,076N-hexane 38 2,851 194 . 1,293,686 403,575 1,700,306 44,745Copper Compounds[M] 35 23,980 298,016 2,169,104 24,864 1 2,515,965 71,885Cyclohexane 33 38 1,526 1,121,461 312,172 562,385 1,997,582 60,533Dichloromethane[C] 29 50 410 603,889 862,867 455,032 1,922,248 66,284Methyl Ethyl Ketone 28 93,077 9,752 3,255 287,389 1,370,503 1,763,976 62,999Nitrate Compounds 27 5,512,576 2,801,184 . 1,759,900 . 10,073,660 373,099Formic Acid 26 813 14,950 18 120 153,130 169,031 6,501Acetaldehyde[C] 26 43,271 46 18 936,878 119,919 1,100,132 42,313Acrylic Acid 26 44,356 25,083 . 215,105 4,722,570 5,007,114 192,581Cumene 26 15,911 273 2,793 13,796 968,482 1,001,255 38,510Nitric Acid 25 350 238,131 . 66,500 . 304,981 12,199Barium Compounds[M] 24 64,996 602,384 5,981 13,695 12,267 699,323 29,138Biphenyl 24 130,650 9,478 12,317 53,239 136,156 341,840 14,2431,3-butadiene[C] 24 250 138 . 88 82 558 23Chloromethane 23 932 8 . 160,682 500 162,122 7,049Phthalic Anhydride 23 45,843 10,157 . 56,842 2,887,497 3,000,339 130,4501,2,4-trimethylbenzene 23 56,014 643 3,031 622 112,950 173,260 7,533Ethylene Oxide[C] 22 38,524 8,501 . . . 47,025 2,138Propylene Oxide[C] 22 142,316 8,445 . 4,974 280,534 436,269 19,830Chromium Compounds[C, M] 20 5,738 40,080 41,359 46,513 12 133,702 6,685Aniline 20 825,971 3,253 . 31,922 133,486 994,632 49,732Diethanolamine 20 155,009 71,607 . 1,273 28,294 256,183 12,809Sodium Nitrite 20 146,130 1,841 . 257,800 . 405,771 20,289Methyl Isobutyl Ketone 19 68,153 116 827 182,018 616,860 867,974 45,683Nickel Compounds[C, M] 18 2,217 19,081 498,730 200,469 33 720,530 40,029Chloroethane 18 10 . 154,000 472,918 12,350 639,278 35,515Anthracene 18 260 33,490 0 1,131 37,616 72,497 4,028Tert-butyl Alcohol 16 538,689 19,504 . 833,819 26,225,663 27,617,675 1,726,105Tetrachloroethylene[C] 16 8 . 35,063 191,220 76,969 303,260 18,954Polycyclic Aromatic Compounds[C] 15 48 27,368 3,677 611 1 31,705 2,114N,N-dimethylformamide[C] 15 794 250 . 409,505 406,711 817,260 54,484Acrylonitrile[C] 15 14,718 13 . 397,239 552,140 964,110 64,2741,2-Dichloroethane[C] 14 282 505 178,600 241,228 72,368 492,983 35,213Methyl Tert-butyl Ether 14 505 47,345 . 139,661 272,996 460,507 32,893Acetonitrile 13 259 1,286 . 45,263 208,706 255,514 19,655Dichlorodifluoromethane[O] 13 1 . . . . 1 0O-xylene 13 30,134 331 38,470 113,451 822,151 1,004,537 77,272Methyl Acrylate 13 739 . . 69,950 11,070 81,759 6,289Chlorobenzene 13 1,874 860 23,160 261,641 1,666 289,201 22,246N-methyl-2-pyrrolidone 13 104,853 15,302 104,076 6,090 7,210 237,531 18,272Creosote[C] 13 0 39,005 0 1,881 . 40,886 3,145Chlorodifluoromethane[O] 12 0 14,000 122 193,700 . 207,822 17,319Dimethyl Sulfate[C] 12 0 . 171,230 . . 171,230 14,269

Sector Notebook Data Refresh - 1997 Organic Chemicals
1995 TRI Transfers for Organic Chemicals Facilities (SIC 286)by Number of Facilities Reporting (pounds/year)*
Chemical Name Chemical Transfers Transfers Transfers Transfers Recovery Transfers Per Facility# Reporting Potw Disposal Recycling Treatment Energy Total Avg Transfer
Sector Notebook Project May 1998K-7
Trichloroethylene[C] 12 18 . 6,895 55,894 30,614 93,421 7,785Vinyl Acetate[C] 12 75,231 9,600 . 63,682 440,039 588,552 49,046Cresol (Mixed Isomers) 12 4,026 3,957 0 948,529 . 956,512 79,709Chloroform[C] 11 260 . 3,170 184,193 15,182 202,805 18,4371,1,1-Trichloroethane[O] 11 1 . 12,943 406,184 213,946 633,074 57,552Carbon Disulfide 11 6,290 21 . 303 204,600 211,214 19,201Allyl Alcohol 11 5,282 8,395 . 80,761 362,951 457,389 41,581Triethylamine 11 67,498 . . 55,999 28,784 152,281 13,844Dimethylamine 11 96,495 . . 115,208 . 211,703 19,246Cobalt Compounds[C, M] 10 14 18,767 49,516 91 1 68,389 6,839Hydrogen Cyanide 10 9,108 326 . 97 250 9,781 978Dicyclopentadiene 10 5 20 500 18,300 217,414 236,239 23,624Pyridine 10 32,435 17 2,243 33,335 5,087 73,117 7,312Dibenzofuran 10 250 17,974 2,429 2 20 20,675 2,068Ethyl Acrylate[C] 10 500 8,800 . 6,203 1,332,449 1,347,952 134,795Nickel[C, M] 10 805 26,760 521,930 43,204 . 592,699 59,270Bromine 10 997 . . 283,212 . 284,209 28,421Freon 113[O] 9 0 136 44,467 369,897 91,994 506,494 56,277Sec-butyl Alcohol 9 263 6,977 . 15,902 3,793,211 3,816,353 424,039Acrylamide[C] 9 170,931 640 . 19,609 42,556 233,736 25,971Methyl Methacrylate 9 262 36 . 102,625 1,583 104,506 11,612Acetophenone 9 3,506 6,235 . 6,669 299,760 316,170 35,130Benzyl Chloride 9 292 3,003 . . . 3,295 366Epichlorohydrin[C] 9 250 . . 17,889 . 18,139 2,015M-cresol 9 7,726 2,699 1,503,812 67,501 230 1,581,968 175,774Hydroquinone 9 3,714 1,700 . 5,506 . 10,920 1,213Butyl Acrylate 9 250 32,300 . 5,764 28,935 67,249 7,472Cumene Hydroperoxide 8 0 2,360 . 3,684 6 6,050 756Phenanthrene 8 2,979 41,971 1,190 95 1 46,236 5,780Benzoyl Chloride 8 0 1,460 . 900 80 2,440 305P-cresol 8 918,994 2,168 900,000 49,934 34,133 1,905,229 238,154Diphenylamine 8 0 18,289 2,200 4 312 20,805 2,601Butyraldehyde 8 250 . . 256 . 506 633,3'-dichlorobenzidine Dihydrochloride[C] 8 14 0 . . . 14 2Hydrogen Fluoride 8 0 110 . 70,110 . 70,220 8,778Antimony Compounds[M] 7 251 834 3,340 44,800 18,705 67,930 9,704Lead Compounds[C, M] 7 3 70,613 . 809 2 71,427 10,204Manganese Compounds[M] 7 110,906 1,823,098 8,400 . . 1,942,404 277,486Diethyl Sulfate[C] 7 11 250 6,420,000 . . 6,420,261 917,180Trichlorofluoromethane[O] 7 18 . . 7,106 . 7,124 1,018Isobutyraldehyde 7 0 . . 77,716 567,584 645,300 92,186Quinoline 7 250 3,579 2,243 16,107 1 22,180 3,169O-Toluidine[C] 7 6,940 46 . 8 12 7,006 1,001M-xylene 7 437 1,511 10,832 6,598 92,018 111,396 15,914Propionaldehyde 7 0 . . . . 0 0Dimethyl Phthalate 7 116,235 . . 31,265 . 147,500 21,071Molybdenum Trioxide 7 0 17,788 71,000 50,000 . 138,788 19,827Cyanide Compounds 6 8,200 4,125 . 5,821 . 18,146 3,024Carbon Tetrachloride[C, O] 6 266 . 1,796 23,612 . 25,674 4,279Chloroacetic Acid 6 0 . . . . 0 04,4'-isopropylidenediphenol 6 250 25,898 . 440 6,800 33,388 5,565P-xylene 6 0 673 . 2,020 990 3,683 614Acrolein 6 0 . . 7,026 8,010 15,036 2,506Cyclohexanol 6 2,800 70 . . 5,200 8,070 1,3451,2,4-trichlorobenzene 6 500 3,050 5,030 8,511 . 17,091 2,849N,N-dimethylaniline 6 60,829 . . 10,497 72,643 143,969 23,9951,1-dichloro-1-fluoroethane[O] 6 5 . 2,393 297,000 . 299,398 49,900Boron Trifluoride 6 5 . . 250 . 255 43Diisocyanates 5 0 . . 3,290 5 3,295 659Vinyl Chloride[C] 5 0 . 54,370 609 . 54,979 10,996Hydrazine[C] 5 6,200 23,499 . . . 29,699 5,940Cadmium Compounds[C, M] 4 21 144 . 1,359 2,233 3,757 939Dichlorotetrafluoroethane (CFC-114)[O] 4 0 136 . 11,332 . 11,468 2,867Monochloropentafluoroethane[O] 4 0 7 . 14,069 . 14,076 3,519

Sector Notebook Data Refresh - 1997 Organic Chemicals
1995 TRI Transfers for Organic Chemicals Facilities (SIC 286)by Number of Facilities Reporting (pounds/year)*
Chemical Name Chemical Transfers Transfers Transfers Transfers Recovery Transfers Per Facility# Reporting Potw Disposal Recycling Treatment Energy Total Avg Transfer
Sector Notebook Project May 1998K-8
1,1,2-trichloroethane 4 0 . 58,600 19,591 . 78,191 19,5481,1,2,2-tetrachloroethane 4 0 . 1 51 . 52 13Dibutyl Phthalate 4 762 . . 1,171 7,792 9,725 2,431Benzoyl Peroxide 4 26,619 . . 5,507 . 32,126 8,032O-cresol 4 85,097 1,532 3,812 34,308 230 124,979 31,245Allyl Chloride 4 0 . . . 750 750 1882-ethoxyethanol 4 388,197 . . . 63,122 451,319 112,830Di(2-ethylhexyl) Phthalate[C] 4 22 . . . 5,602 5,624 1,4061,4-Dioxane[C] 4 0 . 2 . . 2 1Copper[M] 4 0 822 59,640 28,884 . 89,346 22,337Vinylidene Chloride 3 270 . . 51,000 101,000 152,270 50,757Phosgene 3 0 . . . . 0 0O-anisidine[C] 3 5,100 3 . . . 5,103 1,7014,4'-methylenedianiline[C] 3 1,285 8,600 . . 53 9,938 3,313P-phenylenediamine 3 500 . . 9,395 . 9,895 3,2981,2-butylene Oxide 3 0 . . . 326,446 326,446 108,8152-methoxyethanol 3 4,721 . . . 132,503 137,224 45,7412,2-dichloro-1,1,1-trifluoroethane[O] 3 0 . . 14,675 . 14,675 4,8924,6-dinitro-o-cresol 3 0 7,220 . 3,951 410 11,581 3,8601,2-dichloroethylene 3 0 . 2,200 10 . 2,210 737Asbestos (Friable)[C] 3 0 136,832 . . . 136,832 45,6112-chloro-1,1,1,2-tetrafluoroethane[O] 3 0 . . 8,835 . 8,835 2,945Crotonaldehyde 3 0 . . . . 0 0Silver[M] 3 0 610 78,811 124 . 79,545 26,515Silver Compounds[M] 2 0 . 44,783 . . 44,783 22,392Isopropyl Alcohol (Manufacturing, 2 0 . 1,295 599 184,273 186,167 93,084Bromomethane[O] 2 0 . . . . 0 01-chloro-1,1-difluoroethane[O] 2 0 . . 4,220 . 4,220 2,1102-nitrophenol 2 0 . . 1 6 7 4Dinitrobutyl Phenol 2 0 . . . . 0 0Picric Acid 2 0 . . . . 0 01,2-Dichlorobenzene 2 0 . 880 590 13,446 14,916 7,4581,2-phenylenediamine 2 360 31 . . . 391 196Benzoic Trichloride[C] 2 0 250 . 3,018 . 3,268 1,634Nitrobenzene 2 1 . . 454 4,471 4,926 2,4635-nitro-o-toluidine 2 0 30 . . . 30 152,4-Dimethylphenol 2 0 6 2,713 53,300 . 56,019 28,010P-Chloroaniline[C] 2 5,801 . . 5,600 540 11,941 5,971Quinone 2 0 . . 1,462 1,328 2,790 1,3951,2-Dibromoethane[C] 2 5 . . 32,063 . 32,068 16,034Propargyl Alcohol 2 0 935 . . . 935 4681,3-phenylenediamine 2 2,000 . . . . 2,000 1,0002-methylpyridine 2 0 6 . 28 41 75 38Hexachlorobenzene[C] 2 0 . 1 3,345 . 3,346 1,673P-Cresidine[C] 2 41,611 2,200 . 13,000 . 56,811 28,406Chloroprene 2 0 . 138,000 580 . 138,580 69,290Sodium Dimethyldithiocarbamate 2 3,528 . . . . 3,528 1,7641-chloro-1,1,2,2-tetrafluoroethane[O] 2 0 . . . . 0 0Antimony[M] 2 5,413 . . 6,797 . 12,210 6,105Cobalt[C, M] 2 0 13,000 5,400 . . 18,400 9,200Ethylenebisdithiocarbamic Acid, Salts and 1 1,200 . . . . 1,200 1,200Polychlorinated Alkanes 1 5 . . . . 5 5Acetamide[C] 1 0 . . 73 . 73 73Hexachloroethane 1 0 . . 350 . 350 350Methyl Iodide 1 0 8,600 . 760 . 9,360 9,360Methylene Bromide 1 0 . . . . 0 0Dichlorofluoromethane 1 0 . . 18,000 . 18,000 18,000Bromotrifluoromethane[O] 1 0 . . . . 0 02-methyllactonitrile 1 0 . . 0 . 0 02-chloro-1,1,1-trifluoroethane[O] 1 0 . . . . 0 0Hexachlorocyclopentadiene 1 709 . . 21,836 . 22,545 22,5451,2-Dichloropropane 1 0 . . 0 . 0 02,3-dichloropropene 1 0 . . 0 . 0 0Peracetic Acid 1 0 . . . . 0 0

Sector Notebook Data Refresh - 1997 Organic Chemicals
1995 TRI Transfers for Organic Chemicals Facilities (SIC 286)by Number of Facilities Reporting (pounds/year)*
Chemical Name Chemical Transfers Transfers Transfers Transfers Recovery Transfers Per Facility# Reporting Potw Disposal Recycling Treatment Energy Total Avg Transfer
Sector Notebook Project May 1998K-9
Methyl Chlorocarbonate 1 0 . . . . 0 0Saccharin (Manufacturing, No Supplier 1 10 1,500 . . . 1,510 1,5102,6-xylidine[C] 1 236 . . . . 236 236Hexachloro-1,3-butadiene[C] 1 0 . . . . 0 0Dihydrosafrole[C] 1 999 . . . . 999 999Safrole[C] 1 5 . . . . 5 52,4-Diaminotoluene[C] 1 0 . . . . 0 0Styrene Oxide[C] 1 0 . . . . 0 0Ethylene Thiourea[C] 1 0 . . . . 0 05-nitro-o-anisidine 1 5 . . . . 5 5p-Nitroaniline 1 7 . . . . 7 74-nitrophenol 1 0 0 . . . 0 0P-anisidine 1 5 . . . . 5 5Bis(2-chloroethyl) Ether 1 0 . . . . 0 0Catechol 1 0 . . . . 0 02,4-Dichlorophenol 1 0 . . . . 0 0Ethyleneimine[C] 1 0 . . . . 0 0Bromochlorodifluoromethane[O] 1 0 . . . . 0 03,3-dichloro-1,1,1,2,2-pentafluoro-propane 1 0 . . . . 0 01,3-dichloro-1,1,2,2,3-pentafluoro-propane 1 0 . . . . 0 0Dazomet 1 0 . . . . 0 01,3-Dichlorobenzene 1 0 . 880 590 . 1,470 1,4702,6-dimethylphenol 1 0 2 . 8,380 . 8,382 8,382Methyl Isocyanate 1 0 . . . . 0 01,1,1,2-tetrachloroethane 1 0 . . . . 0 0Carbofuran 1 0 . . 1,169 . 1,169 1,169Dimethyl Chlorothiophosphate 1 0 . . . . 0 0C.I. Disperse Yellow 3 1 0 1,061 . . . 1,061 1,061Aluminum (Fume or Dust)[M] 1 0 . . . . 0 0Manganese[M] 1 750 32,725 . . . 33,475 33,475Cadmium[C, M] 1 0 . . . . 0 0Chromium[M] 1 0 . . 5 . 5 5Zinc (Fume or Dust)[M] 1 0 . . 20,125 . 20,125 20,125Titanium Tetrachloride 1 0 . . . . 0 0Phosphorus (Yellow or White) 1 0 . . . . 0 0Ozone 1 0 . . . . 0 0Hydrazine Sulfate[C] 1 1,900 . . . . 1,900 1,9003,3'-dimethoxybenzidine 1 0 . . . . 0 0Dichlorobenzene (Mixed Isomers)[C] 1 0 . . 50 . 50 50Diaminotoluene (Mixed Isomers)[C] 1 770 . . 1,000 . 1,770 1,770Toluene Diisocyanate (Mixed Isomers)[C] 1 0 . . . . 0 0Norflurazon 1 0 54,000 . 1,000 . 55,000 55,000C.I. Direct Blue 218 1 22,434 . . . . 22,434 22,434Dichlorotrifluoroethane[O] 1 0 . . . . 0 0
________ _________ ________ _________ _________ __________ __________ ______402** 36,472,821 9,563,952 28,564,860 31,582,673 102,386,380 208,570,686 518,833
[C] Known or suspect carcinogens [M] Metals and metal compounds [O] Ozone depleters* Refer to Section III for a discussion of the TRI data and its limitations, methodology used to obtain this data, definitions of the column headings, and the definitions of carcinogens, metals, and ozone depleters.**Total number of facilities (not chemical reports) reporting to TRI in this industry sector.

Sector Notebook Data Refresh - 1997 Organic Chemicals
Being included on this list does not mean that the release is associated with non-compliance with environmental laws.1
Sector Notebook Project May 1998K-10
Ten Largest Volume TRI Releasing Organic Chemicals Facilities Reporting Only SIC 286*
Rank Facility Total TRI Releases in Pounds1
1 Du Pont , Victoria, Texas 25,488,181
2 BASF Corp., Freeport, Texas 19,324,697
3 Hoechst-Celanese Chemical, Pasadena, Texas 13,660,060
4 BP Chemicals Inc., Port Lavaca, Texas 13,105,950
5 Witco Corp., Harvey, Louisiana 3,888,100
6 Du Pont, Orange, Texas 3,819,536
7 Arco Chemical Co., Channelview, Texas 3,665,030
8 Merichem Co., Houston, Texas 3,129,499
9 ISP Techs. Inc., Texas City, Texas 3,037,645
10 Air Products & Chemicals Inc., Calvert City, Kentucky 3,024,442
Source: US EPA Toxics Release Inventory Database, 1995.*Refer to Section III for a general discussion of TRI data and its limitations. A discussion of the methodology used to develop this table can be found under the heading Ten Largest Volume TRI Releasing Facilities.
Ten Largest Volume TRI Releasing Facilities Reporting Only SIC 286 or SIC 286 and Other SIC Codes*
Rank Facility SIC Codes Reported in TRI Pounds1
Total TRIReleases in
1 Cytec Ind. Inc., Westwego, Louisiana 2819, 2869 27,034,568
2 Du Pont, Victoria, Texas 2869 25,488,181
3 Du Pont, Beaumont, Texas 2822, 2865, 2869, 2873 21,763,329
4 BASF Corp., Freeport, Texas 2869 19,324,697
5 Monsanto Co., Cantonment, Florida 2821, 2824, 2865, 2869 18,058,737
6 Sterling Chemicals Inc., Texas City, Texas 2819, 2865, 2869 15,720,998
7 Hoechst-Celanese Chemical, Pasadena, Texas 2869 13,660,060
8 BP Chemicals Inc., Lima, Ohio 2821, 2869 13,566,795
9 BP Chemicals Inc., Port Lavaca, Texas 2869 13,105,950
10 Exxon Chemical, Baton Rouge, Louisiana 2865, 2869, 2822 8,768,672
Source: US EPA Toxics Release Inventory Database, 1995.*Refer to Section III for a general discussion of TRI data and its limitations. A discussion of the methodology used to develop this table can be found under the heading Ten Largest Volume TRI Releasing Facilities.

Sector Notebook Data Refresh - 1997 Organic Chemicals
Sector Notebook Project May 1998K-11
Source Reduction and Recycling Activity for Organic Chemicals Facilities (SIC 286)as Reported within TRI*
A B C JOn-Site Off-Site
Year (10 lbs.) Transferred Off-siteRecycled Recovery % Treated Recycled Recovery % Treated
Quantity of %Production- Released
Related % Released andWaste and Disposed% % Energy % % Energy
6 a b
c
D E F G H I
1994 2,100 2% 25% 23% 37% 2% 5% 3% 6%
1995 2,386 15% 22% 27% 36% 1% 4% 3% 7%
1996 2,369 --- 24% 27% 35% 2% 4% 3% 6%
1997 2,342 --- 24% 27% 35% 1% 4% 3% 6%
Source: 1995 Toxics Release Inventory Database. * Refer to Section III for a general discussion of TRI data and its limitations. A discussion of the methodology used todevelop this table can be found under the heading Source Reduction and Recycling Activity. Within this industry sector, non-production related waste < 1% of production related wastes for 1995.a
Total TRI transfers and releases as reported in Section 5 and 6 of Form R as a percentage of production related wastes. b
Percentage of production related waste released to the environment and transferred off-site for disposal.c

Sector Notebook Data Refresh - 1997 Organic Chemicals
Sector Notebook Project May 1998K-12
Five-Year Enforcement and Compliance Summary for the Organic Chemicals Industry*
A B C D E F G H I JRegion Facilities Facilities Number of Average Facilities with Total Percent Percent Enforcement
in Search Inspected Inspections Months 1 or More Enforcement State Federal to InspectionBetween Enforcement Actions Lead Lead Rate
Inspections Actions Actions Actions
I 15 11 34 26 2 3 33% 67% 0.09
II 63 53 646 6 24 100 79% 21% 0.15
III 35 34 382 5 13 26 92% 8% 0.07
IV 86 66 967 5 21 58 79% 21% 0.06
V 80 66 648 7 22 46 57% 43% 0.07
VI 112 98 1,416 5 67 228 55% 45% 0.16
VII 18 16 108 10 2 3 100% 0% 0.03
VIII 2 2 21 6 0 0 0% 0% --
IX 11 6 19 35 1 2 0% 100% 0.11
X 3 3 53 3 1 2 0% 100% 0.04
TOTAL 425 355 4,294 6 153 468 65% 35% 0.11
*Data obtained from EPA’s Integrated Data for Enforcement Analysis (IDEA) System. For a description of IDEA and the methods used toobtain this data, refer to Section II.C. A discussion of this table can be found under the heading, Five-Year Enforcement and ComplianceSummary, in Section III.

Sector Notebook Data Refresh - 1997 Petroleum Refining
Sector Notebook Project May 1998L-1
Petroleum Refining

Sector Notebook Data Refresh - 1997 Petroleum Refining
Sector Notebook Project May 1998L-2
1995 TRI Releases for Petroleum Refining Facilities (SIC 2911)by Number of Facilities Reporting (pounds/year)*
Chemical Name Chemical Air Air Discharges Injection Disposal Releases Per Facility# Reporting Fugitive Point Water Underground Land Total Avg. Releases
Benzene[C] 168 2,377,768 1,283,986 13,332 172,244 11,626 3,858,956 22,970Toluene 165 6,662,301 2,722,039 17,441 162,200 29,226 9,593,207 58,141Ethylbenzene 157 998,716 308,074 5,189 1,938 7,037 1,320,954 8,414Xylene (Mixed Isomers) 156 3,763,426 1,316,901 15,568 130 39,109 5,135,134 32,918Cyclohexane 146 1,331,517 769,508 4,956 57 6,930 2,112,968 14,4721,2,4-trimethylbenzene 135 695,602 207,857 3,702 863 9,196 917,220 6,794N-hexane 132 3,597,851 2,951,792 1,919 0 8,929 6,560,491 49,701Propylene 123 5,234,486 2,801,285 3,925 0 42 8,039,738 65,364Ammonia 116 1,685,970 6,273,572 648,618 1,361,275 33,437 10,002,872 86,232Ethylene 113 2,301,716 844,858 4,551 0 0 3,151,125 27,886Naphthalene 102 260,098 52,322 6,883 569 5,599 325,471 3,191Methyl Tert-butyl Ether 87 896,363 2,056,208 69,461 594 3,319 3,025,945 34,7811,3-butadiene[C] 75 129,590 55,748 3,663 0 0 189,001 2,520Methanol 74 733,938 152,256 60,274 236,238 2,907 1,185,613 16,022Chlorine 72 125,415 152,315 24,910 0 106 302,746 4,205Cumene 59 278,122 291,651 837 0 198 570,808 9,675Phenol 57 155,881 381,223 17,451 1,940,000 147 2,494,702 43,767Hydrogen Fluoride 55 180,997 279,565 0 0 250 460,812 8,378Diethanolamine 54 187,112 2,371 279,738 14,902 166 484,289 8,968Molybdenum Trioxide 52 658 352 1,058 0 36,000 38,068 732Phosphoric Acid 50 1,157 5 0 0 260 1,422 28Nickel Compounds[C, M] 49 3,605 41,441 7,595 0 59,220 111,861 2,283Sulfuric Acid 49 9,183 404,134 365 0 2,530 416,212 8,494Polycyclic Aromatic Compounds[C] 40 19,549 10,307 2,095 0 3,312 35,263 882Zinc Compounds[M] 40 13,166 30,175 41,862 0 14,500 99,703 2,493Tetrachloroethylene[C] 38 42,370 4,204 115 0 1 46,690 1,229Nitrate Compounds 34 0 0 3,720,099 0 14 3,720,113 109,415Lead Compounds[C, M] 27 2,048 1,089 5,917 0 2,351 11,405 4221,1,1-Trichloroethane[O] 27 96,630 11,194 188 0 0 108,012 4,000Hydrochloric Acid (1995 and after "Acid 27 8,236 287,216 0 0 4,506 299,958 11,110Cresol (Mixed Isomers) 25 55,078 1,168 3,819 103,736 39 163,840 6,554Ethylene Glycol 24 64,022 21,716 15,047 0 250 101,035 4,210Methyl Ethyl Ketone 23 4,285,050 291,337 8,193 19,000 4,705 4,608,285 200,360Chromium Compounds[C, M] 22 16,940 12,000 9,469 0 6,348 44,757 2,034Cobalt Compounds[C, M] 21 8 92 224 0 1,478 1,802 86Copper Compounds[M] 17 250 820 2,708 0 2,600 6,378 375Styrene[C] 15 6,353 67,544 204 0 25 74,126 4,942O-xylene 14 245,825 87,343 490 569 234 334,461 23,890P-xylene 14 813,065 190,570 486 569 249 1,004,939 71,7811,2-Dichloroethane[C] 13 10,085 16,135 0 0 0 26,220 2,017M-xylene 13 271,802 108,446 637 569 428 381,882 29,376Antimony Compounds[M] 12 500 6,319 9,719 0 11,490 28,028 2,336Tert-butyl Alcohol 12 37,577 12,166 12,027 0 1 61,771 5,148Certain Glycol Ethers 10 5,676 46 4,320 0 135 10,177 1,018Carbon Tetrachloride[C, O] 10 36,573 957 92 0 0 37,622 3,762Anthracene 10 4,466 1,008 13 0 1 5,488 549Nickel[C, M] 10 0 3,102 724 0 18 3,844 384Biphenyl 9 7,676 2,989 174 0 0 10,839 1,204N-methyl-2-pyrrolidone 9 253,184 51,586 190,000 0 120,458 615,228 68,359Lead[C, M] 9 0 254 191 0 327 772 86Manganese Compounds[M] 8 0 1,019 3,368 0 11,597 15,984 1,998Dichlorodifluoromethane[O] 8 87,550 280 0 0 0 87,830 10,979Phenanthrene 8 1,570 406 3 0 5 1,984 248Asbestos (Friable)[C] 7 0 0 0 0 0 0 0N-butyl Alcohol 6 21,505 28,375 0 0 0 49,880 8,3131,2-Dibromoethane[C] 6 4,164 36 47 0 6 4,253 709Methyl Isobutyl Ketone 6 212,740 21,615 15 0 466 234,836 39,139Carbonyl Sulfide 6 493 146,000 0 0 0 146,493 24,416Copper[M] 6 0 1,643 258 0 190 2,091 349Barium Compounds[M] 5 0 240 4,579 0 7,015 11,834 2,367Formaldehyde[C] 5 104 34,244 108 0 0 34,456 6,891Carbon Disulfide 5 66 1,600 0 0 0 1,666 333Chlorodifluoromethane[O] 5 381,678 0 0 0 0 381,678 76,336Dicyclopentadiene 5 4,005 1,306 310 0 0 5,621 1,124Barium[M] 5 0 50 1,992 0 1,552 3,594 719Chromium[M] 5 0 1,515 375 0 692 2,582 516Cobalt[C, M] 5 5 0 465 0 2 472 94Hydrogen Cyanide 4 0 61,562 620 0 0 62,182 15,546Cyanide Compounds 3 0 75,821 190 0 0 76,011 25,337

Sector Notebook Data Refresh - 1997 Petroleum Refining
1995 TRI Releases for Petroleum Refining Facilities (SIC 2911)by Number of Facilities Reporting (pounds/year)*
Chemical Name Chemical Air Air Discharges Injection Disposal Releases Per Facility# Reporting Fugitive Point Water Underground Land Total Avg. Releases
Sector Notebook Project May 1998L-3
2-methoxyethanol 3 3,011 193 0 0 0 3,204 1,068Arsenic Compounds[C, M] 2 0 1 160 0 0 161 81Cadmium Compounds[C, M] 2 0 0 16 0 0 16 8Acetonitrile 2 14,830 2,300 0 0 0 17,130 8,565Dichloromethane[C] 2 10,945 6,500 71 0 0 17,516 8,758Sec-butyl Alcohol 2 3,400 390 0 0 0 3,790 1,895Cumene Hydroperoxide 2 8,660 4,000 0 0 0 12,660 6,330O-cresol 2 0 1 0 0 0 1 1Vinyl Acetate[C] 2 3,306 289 0 0 0 3,595 1,798Manganese[M] 2 0 2,000 15,000 0 0 17,000 8,500Mercury[M] 2 0 0 2 0 1 3 2Silver[M] 2 3,800 49 8 0 0 3,857 1,929Antimony[M] 2 0 0 13 0 2 15 8Arsenic[C, M] 2 0 0 101 0 244 345 173Vanadium (Fume or Dust)[M] 2 0 393 0 0 0 393 197Zinc (Fume or Dust)[M] 2 19 2,605 1,200 0 0 3,824 1,912Nitric Acid 2 250 250 0 0 0 500 250Selenium[M] 2 0 0 87 0 23 110 55Beryllium Compounds[C, M] 1 0 0 0 0 0 0 0Diisocyanates 1 0 0 0 0 0 0 0Mercury Compounds[M] 1 4 32 0 0 0 36 36Selenium Compounds[M] 1 0 6 1,900 0 0 1,906 1,906Silver Compounds[M] 1 0 0 0 0 0 0 0Chloroform[C] 1 0 0 0 0 0 0 0Acetaldehyde[C] 1 0 0 115 0 0 115 115Ethylene Oxide[C] 1 6,500 2,700 0 0 0 9,200 9,200Ethylidene Dichloride 1 0 0 0 0 0 0 0Propylene Oxide[C] 1 72 0 0 0 0 72 72Trichlorofluoromethane[O] 1 750 0 0 0 0 750 750Chlorotrifluoromethane 1 250 0 . 0 0 250 250Isobutyraldehyde 1 40 160 0 0 0 200 2001,2-dichloropropane 1 800 0 0 0 0 800 8002,3-dichloropropene 1 0 0 0 0 0 0 0Trichloroethylene[C] 1 1,600 0 0 0 0 1,600 1,600Peracetic Acid 1 12 0 0 0 0 12 124,4'-isopropylidenediphenol 1 5,000 0 0 0 330,000 335,000 335,000Quinoline 1 4,200 250 0 0 250 4,700 4,7001,2,3-trichloropropane[C] 1 6,300 320 0 0 0 6,620 6,620Acetophenone 1 700 10 2 0 0 712 7122,4-Dimethylphenol 1 47 0 2 0 0 49 49P-cresol 1 0 1 0 0 0 1 1Epichlorohydrin[C] 1 12,000 24,000 0 0 1 36,001 36,001Allyl Chloride 1 440 0 0 0 0 440 440Allyl Alcohol 1 3,500 5 0 0 0 3,505 3,505M-cresol 1 0 1 0 0 0 1 11,3-phenylenediamine 1 750 300 0 0 0 1,050 1,050Chlorobenzene 1 0 8 0 0 0 8 82-ethoxyethanol 1 0 0 0 0 0 0 0Pyridine 1 11,000 0 9 0 0 11,009 11,009Butyraldehyde 1 6,800 3,600 0 0 0 10,400 10,400Ethyl Acrylate[C] 1 0 0 0 0 0 0 0Hydrazine[C] 1 130 1 0 0 0 131 131Polychlorinated Biphenyls[C] 1 0 0 0 0 0 0 0Beryllium[C, M] 1 0 0 2 0 0 2 2Cadmium[C, M] 1 0 0 3 0 1 4 4Sodium Nitrite 1 0 0 21,652 0 0 21,652 21,652Fluorine 1 0 0 15,000 0 0 15,000 15,000
_________ _________ _________ _________ _________ _______ __________ ________180** 38,741,597 24,995,323 5,287,922 4,015,453 781,751 73,822,046 410,122
[C] Known or suspect carcinogens [M] Metals and metal compounds [O] Ozone depleters* Refer to Section III for a discussion of the TRI data and its limitations, methodology used to obtain this data, definitions of the column headings, and the definitions of carcinogens, metals, and ozone depleters.**Total number of facilities (not chemical reports) reporting to TRI in this industry sector.

Sector Notebook Data Refresh - 1997 Petroleum Refining
Sector Notebook Project May 1998L-4
1995 TRI Transfers for Petroleum Refining Facilities (SIC 2911)by Number and Facilities Reporting (pounds/year)*
Chemical Name Chemical Transfers Transfers Transfers Transfers Recovery Transfers Per Facility# Reporting Potw Disposal Recycling Treatment Energy Total Avg Transfer
Benzene[C] 168 211,008 14,130 56,197 48,579 16,902 346,816 2,064Toluene 165 300,865 41,261 41,068 74,334 139,942 597,470 3,621Ethylbenzene 157 38,203 9,664 16,148 17,768 52,082 133,866 853Xylene (Mixed Isomers) 156 322,154 41,030 39,540 66,939 272,700 742,363 4,759Cyclohexane 146 2,141 9,011 4,929 3,558 3,349 22,988 1571,2,4-trimethylbenzene 135 13,084 5,327 2,204 5,135 42,643 68,393 507N-hexane 132 2,362 10,701 3,865 8,800 2,015 27,743 210Propylene 123 0 79 . 18 64 161 1Ammonia 116 937,695 4,598 261 298,741 773 1,242,068 10,707Ethylene 113 0 11 3 93 7 114 1Naphthalene 102 3,089 11,892 622 6,300 13,550 35,453 348Methyl Tert-butyl Ether 87 73,644 471 . 617 196 74,928 8611,3-butadiene[C] 75 0 . 2 544 121 667 9Methanol 74 384,200 2,440 . 906 6,076 393,622 5,319Chlorine 72 5,748 3 . 18 258 6,027 84Cumene 59 622 740 118 1,445 176 3,101 53Phenol 57 968,049 30,276 20,576 420,847 668,477 2,108,225 36,986Hydrogen Fluoride 55 0 14 . 167 . 181 3Diethanolamine 54 1,348,360 363,856 390 8,235 . 1,720,841 31,867Molybdenum Trioxide 52 0 624,988 1,812,236 162,803 2 2,600,029 50,001Phosphoric Acid 50 0 451,169 1,209,400 78,458 . 1,739,027 34,781Nickel Compounds[C, M] 49 3,266 453,321 1,278,771 17,824 116 1,753,298 35,782Sulfuric Acid 49 0 . . 0 . 0 0Polycyclic Aromatic Compounds[C] 40 0 40,841 . 1,664 4,639 47,144 1,179Zinc Compounds[M] 40 21,484 138,351 222,051 36,572 3,332 421,790 10,545Tetrachloroethylene[C] 38 0 4 1,966 7 12 1,989 52Nitrate Compounds 34 1,400 . . . . 1,400 41Lead Compounds[C, M] 27 0 47,350 7,696 10,476 700 66,222 2,4531,1,1-Trichloroethane[O] 27 0 494 12,295 1,540 . 14,329 531Hydrochloric Acid (1995 and after "Acid 27 0 . . 24 . 24 1Cresol (Mixed Isomers) 25 71,806 31,540 187,142 115 107 290,710 11,628Ethylene Glycol 24 45,843 0 . 81,671 . 127,514 5,313Methyl Ethyl Ketone 23 35,000 10,839 1,259 10,798 7,429 65,325 2,840Chromium Compounds[C, M] 22 3,318 38,125 62,797 5,791 2,697 112,728 5,124Cobalt Compounds[C, M] 21 0 75,702 176,323 34,850 . 286,875 13,661Copper Compounds[M] 17 1,000 119,280 148,442 1,540 437 270,699 15,923Styrene[C] 15 5 1,199 1,086 522 27,577 30,389 2,026O-xylene 14 58,137 821 5,488 1,329 788 66,563 4,755P-xylene 14 5,106 588 8,595 1,116 554 15,959 1,1401,2-Dichloroethane[C] 13 0 . 0 . 22 22 2M-xylene 13 13,130 833 8,889 1,352 705 24,909 1,916Antimony Compounds[M] 12 750 24,170 50,914 19,973 . 95,807 7,984Tert-butyl Alcohol 12 0 774 . 988 197 1,959 163Certain Glycol Ethers 10 0 3 1,083 18 8 1,112 111Carbon Tetrachloride[C, O] 10 0 . 0 2,201 8 2,209 221Anthracene 10 0 0 517 20 . 537 54Nickel[C, M] 10 46 72,244 132,962 8,673 . 213,925 21,393Biphenyl 9 0 30 0 3 3 36 4N-methyl-2-pyrrolidone 9 0 7,800 . 1,700 . 9,500 1,056Lead[C, M] 9 1,387 2,686 364 5,533 . 9,970 1,108Manganese Compounds[M] 8 1,900 . 59,000 . 0 60,900 7,613Dichlorodifluoromethane[O] 8 0 . 141,000 250 . 141,250 17,656Phenanthrene 8 0 972 . 1 16 989 124Asbestos (Friable)[C] 7 0 440,082 . . . 440,082 62,869N-butyl Alcohol 6 0 . . . . 0 01,2-Dibromoethane[C] 6 0 3 . 18 18 39 7Methyl Isobutyl Ketone 6 0 1,079 24 20 6,500 7,623 1,271Carbonyl Sulfide 6 0 . . . . 0 0Copper[M] 6 991 2,959 1,056 236 . 5,242 874Barium Compounds[M] 5 0 395 85 112 1,310 1,902 380Formaldehyde[C] 5 0 . . . 110 110 22Carbon Disulfide 5 0 . . . . 0 0Chlorodifluoromethane[O] 5 0 . 60,000 . . 60,000 12,000Dicyclopentadiene 5 250 153 . 11 . 414 83Barium[M] 5 2,600 9,568 192 2,882 . 15,242 3,048Chromium[M] 5 10 13,404 15,318 4 . 28,736 5,747Cobalt[C, M] 5 0 166 36,397 . . 36,563 7,313Hydrogen Cyanide 4 927 . . . . 927 232Cyanide Compounds 3 42,000 35 . 6 . 42,041 14,014
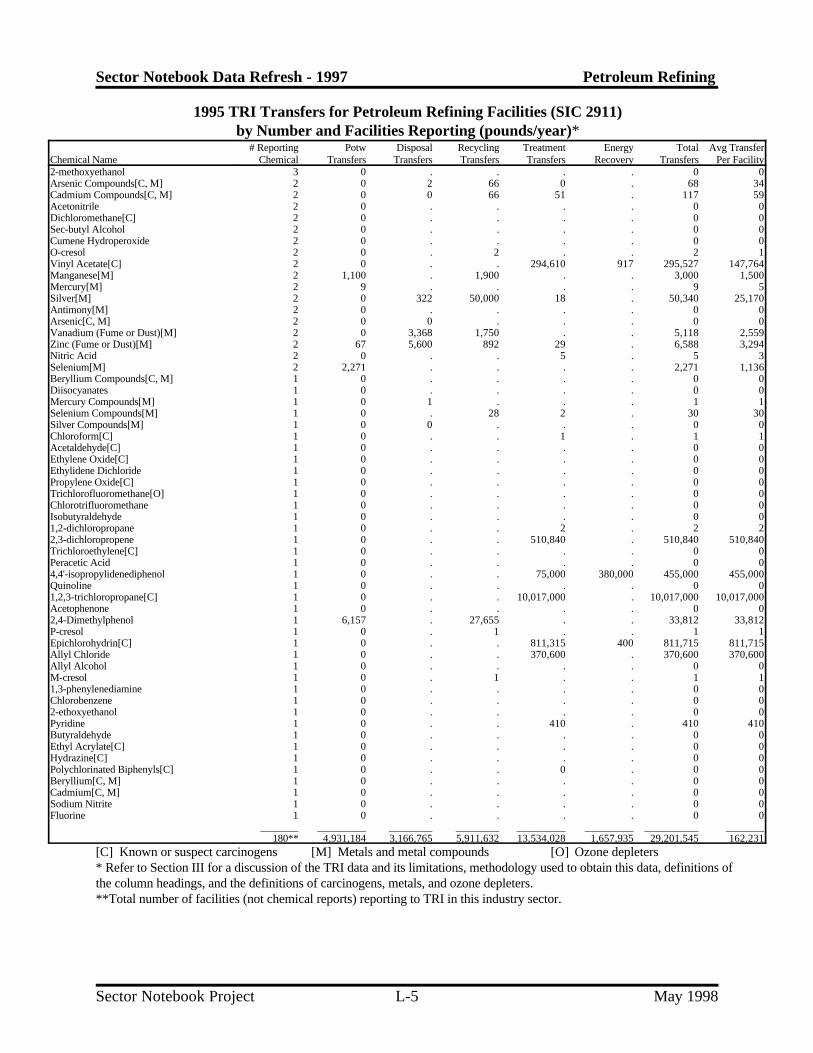
Sector Notebook Data Refresh - 1997 Petroleum Refining
1995 TRI Transfers for Petroleum Refining Facilities (SIC 2911)by Number and Facilities Reporting (pounds/year)*
Chemical Name Chemical Transfers Transfers Transfers Transfers Recovery Transfers Per Facility# Reporting Potw Disposal Recycling Treatment Energy Total Avg Transfer
Sector Notebook Project May 1998L-5
2-methoxyethanol 3 0 . . . . 0 0Arsenic Compounds[C, M] 2 0 2 66 0 . 68 34Cadmium Compounds[C, M] 2 0 0 66 51 . 117 59Acetonitrile 2 0 . . . . 0 0Dichloromethane[C] 2 0 . . . . 0 0Sec-butyl Alcohol 2 0 . . . . 0 0Cumene Hydroperoxide 2 0 . . . . 0 0O-cresol 2 0 . 2 . . 2 1Vinyl Acetate[C] 2 0 . . 294,610 917 295,527 147,764Manganese[M] 2 1,100 . 1,900 . . 3,000 1,500Mercury[M] 2 9 . . . . 9 5Silver[M] 2 0 322 50,000 18 . 50,340 25,170Antimony[M] 2 0 . . . . 0 0Arsenic[C, M] 2 0 0 . . . 0 0Vanadium (Fume or Dust)[M] 2 0 3,368 1,750 . . 5,118 2,559Zinc (Fume or Dust)[M] 2 67 5,600 892 29 . 6,588 3,294Nitric Acid 2 0 . . 5 . 5 3Selenium[M] 2 2,271 . . . . 2,271 1,136Beryllium Compounds[C, M] 1 0 . . . . 0 0Diisocyanates 1 0 . . . . 0 0Mercury Compounds[M] 1 0 1 . . . 1 1Selenium Compounds[M] 1 0 . 28 2 . 30 30Silver Compounds[M] 1 0 0 . . . 0 0Chloroform[C] 1 0 . . 1 . 1 1Acetaldehyde[C] 1 0 . . . . 0 0Ethylene Oxide[C] 1 0 . . . . 0 0Ethylidene Dichloride 1 0 . . . . 0 0Propylene Oxide[C] 1 0 . . . . 0 0Trichlorofluoromethane[O] 1 0 . . . . 0 0Chlorotrifluoromethane 1 0 . . . . 0 0Isobutyraldehyde 1 0 . . . . 0 01,2-dichloropropane 1 0 . . 2 . 2 22,3-dichloropropene 1 0 . . 510,840 . 510,840 510,840Trichloroethylene[C] 1 0 . . . . 0 0Peracetic Acid 1 0 . . . . 0 04,4'-isopropylidenediphenol 1 0 . . 75,000 380,000 455,000 455,000Quinoline 1 0 . . . . 0 01,2,3-trichloropropane[C] 1 0 . . 10,017,000 . 10,017,000 10,017,000Acetophenone 1 0 . . . . 0 02,4-Dimethylphenol 1 6,157 . 27,655 . . 33,812 33,812P-cresol 1 0 . 1 . . 1 1Epichlorohydrin[C] 1 0 . . 811,315 400 811,715 811,715Allyl Chloride 1 0 . . 370,600 . 370,600 370,600Allyl Alcohol 1 0 . . . . 0 0M-cresol 1 0 . 1 . . 1 11,3-phenylenediamine 1 0 . . . . 0 0Chlorobenzene 1 0 . . . . 0 02-ethoxyethanol 1 0 . . . . 0 0Pyridine 1 0 . . 410 . 410 410Butyraldehyde 1 0 . . . . 0 0Ethyl Acrylate[C] 1 0 . . . . 0 0Hydrazine[C] 1 0 . . . . 0 0Polychlorinated Biphenyls[C] 1 0 . . 0 . 0 0Beryllium[C, M] 1 0 . . . . 0 0Cadmium[C, M] 1 0 . . . . 0 0Sodium Nitrite 1 0 . . . . 0 0Fluorine 1 0 . . . . 0 0
_______ _________ ________ ________ _________ _________ __________ _______180** 4,931,184 3,166,765 5,911,632 13,534,028 1,657,935 29,201,545 162,231
[C] Known or suspect carcinogens [M] Metals and metal compounds [O] Ozone depleters* Refer to Section III for a discussion of the TRI data and its limitations, methodology used to obtain this data, definitions of the column headings, and the definitions of carcinogens, metals, and ozone depleters.**Total number of facilities (not chemical reports) reporting to TRI in this industry sector.

Sector Notebook Data Refresh - 1997 Petroleum Refining
Being included on this list does not mean that the release is associated with non-compliance with environmental laws.1
Sector Notebook Project May 1998L-6
Ten Largest Volume TRI Releasing Petroleum Refining Facilities ReportingOnly SIC 2911*
Rank Facility in Pounds1Total TRI Releases
1 Mobil Oil Beaumont Refinery, Beaumont, Texas 3,339,526
2 Amoco Petroleum Prods., Texas City, Texas 2,668,452
3 Farmland Ind. Inc., Coffeyville, Kansas 2,303,176
4 Fina Oil & Chemical, Big Spring, Texas 2,056,685
5 Lion Oil Co., El Dorado, Arkansas 1,595,262
6 Basis Petroleum Inc., Houston, Texas 886,324
7 Hess Oil Virgin Islands Corp., Kingshill, Virgin Islands 169,071
8 Lyondell-citgo Refining Co., Houston, Texas 1,394,202
9 Diamond Shamrock Inc., Sunray, Texas 1,138,037
10 Coastal Refining & Marketing, Corpus Christi, Texas 1,035,339
Source: US EPA 1995 Toxics Release Inventory Database.*Refer to Section III for a general discussion of TRI data and its limitations. A discussion of the methodology used to develop this table can be found under the heading Ten Largest Volume TRI Releasing Facilities.
Ten Largest Volume TRI Releasing Facilities Reporting Only SIC 2911 or SIC 2911 and Other SIC Codes*
Rank Facility SIC Codes Reported in TRI in Pounds1
Total TRIReleases
1 Shell Oil Co., Deer Park, Texas 2821, 2865, 2869, 2911, 2992 4,513,517
2 Mobil Oil Beaumont Refinery, Beaumont, Texas 2911 3,339,526
3 Exxon Co. USA, Baton Rouge, Louisiana 2911, 5171 2,995,273
4 Amoco Petroleum Prods., Texas City, Texas 2911 2,668,452
5 Citgo Petroleum Corp., Lake Charles, Louisiana 2819, 2869, 2911 2,552,445
6 Shell Norco Refining Co., Norco, Louisiana 2869, 2911 2,422,358
7 Phillips 66 Co., Borger, Texas 2819, 2911 2,405,278
8 Farmland Ind. Inc., Coffeyville, Kansas 2911 2,303,176
9 Chevron Prods. Co., Pasagoula, Mississippi 2869, 2873, 2911 2,235,259
10 Fina Oil & Chemical, Big Spring, Texas 2911 2,056,685
Source: US EPA Toxics Release Inventory Database, 1995.*Refer to Section III for a general discussion of TRI data and its limitations. A discussion of the methodology used to develop this table can be found under the heading Ten Largest Volume TRI Releasing Facilities.
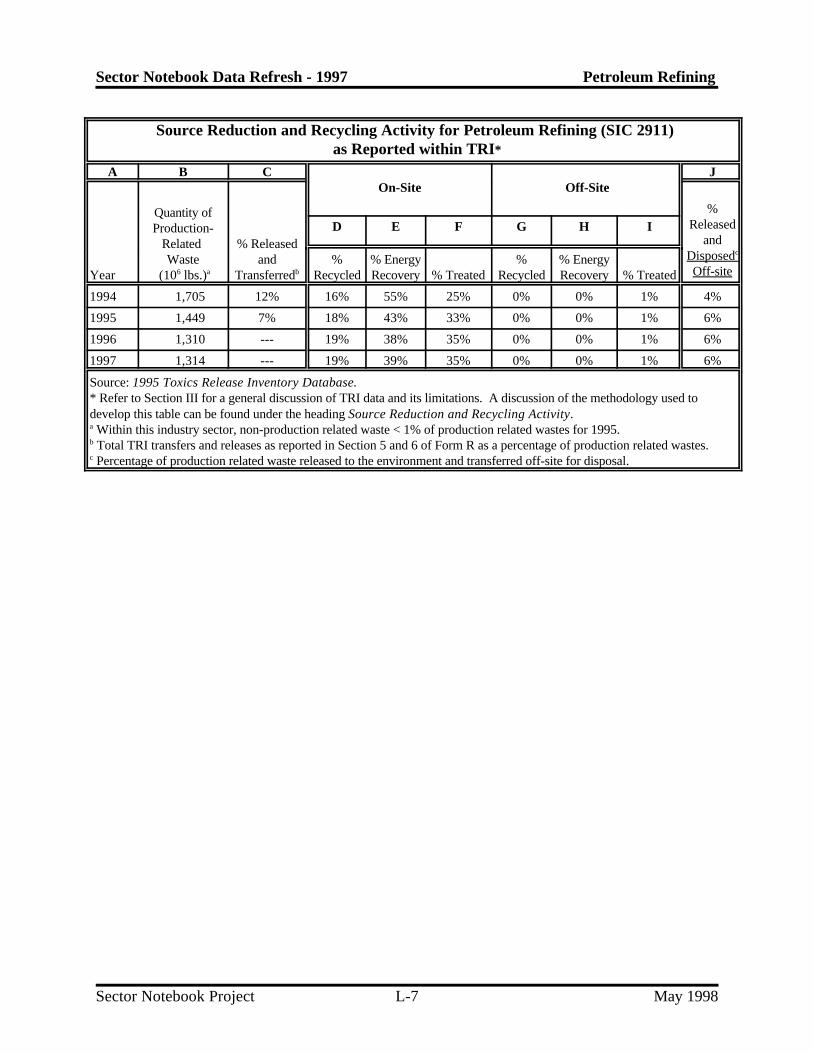
Sector Notebook Data Refresh - 1997 Petroleum Refining
Sector Notebook Project May 1998L-7
Source Reduction and Recycling Activity for Petroleum Refining (SIC 2911) as Reported within TRI*
A B C JOn-Site Off-Site
Year (10 lbs.) Transferred Recycled Recovery % Treated Recycled Recovery % Treated
Quantity ofProduction-
Related % ReleasedWaste and % % Energy % % Energy
6 a b
%Released
andDisposedc
Off-site
D E F G H I
1994 1,705 12% 16% 55% 25% 0% 0% 1% 4%
1995 1,449 7% 18% 43% 33% 0% 0% 1% 6%
1996 1,310 --- 19% 38% 35% 0% 0% 1% 6%
1997 1,314 --- 19% 39% 35% 0% 0% 1% 6%
Source: 1995 Toxics Release Inventory Database.* Refer to Section III for a general discussion of TRI data and its limitations. A discussion of the methodology used todevelop this table can be found under the heading Source Reduction and Recycling Activity. Within this industry sector, non-production related waste < 1% of production related wastes for 1995.a
Total TRI transfers and releases as reported in Section 5 and 6 of Form R as a percentage of production related wastes.b
Percentage of production related waste released to the environment and transferred off-site for disposal.c

Sector Notebook Data Refresh - 1997 Petroleum Refining
Sector Notebook Project May 1998L-8
Five-Year Enforcement and Compliance Summary for the Petroleum Refining Industry*
A B C D E F G H I JRegion Facilities Facilities Number of Average Facilities with Total Percent Percent Enforcement
in Search Inspected Inspections Months 1 or More Enforcement State Federal to InspectionBetween Enforcement Actions Lead Lead Rate
Inspections Actions Actions Actions
I 0 0 0 -- 0 0 0% 0% --
II 10 10 289 2 10 103 62% 38% 0.36
III 10 10 344 2 8 64 67% 33% 0.19
IV 13 12 181 4 7 19 42% 58% 0.10
V 16 16 402 2 13 59 56% 44% 0.15
VI 53 48 943 3 44 216 66% 34% 0.23
VII 5 5 140 2 4 19 5% 95% 0.14
VIII 15 14 371 2 12 62 76% 24% 0.17
IX 25 24 282 5 20 201 84% 16% 0.71
X 9 9 129 4 6 20 55% 45% 0.16
TOTAL 156 148 3,081 3 124 763 68% 32% 0.25
*Data obtained from EPA’s Integrated Data for Enforcement Analysis (IDEA) System. For a description of IDEA and the methods used toobtain this data, refer to Section II.C. A discussion of this table can be found under the heading, Five-Year Enforcement and ComplianceSummary, in Section III.

Sector Notebook Data Refresh - 1997 Rubber and Plastic
Sector Notebook Project May 1998M-1
Rubber and Plastic

Sector Notebook Data Refresh - 1997 Rubber and Plastic
Sector Notebook Project May 1998M-2
1995 TRI Releases for Rubber and Miscellaneous Plastics Facilities (SIC 30)by Number of Facilities Reporting (pounds/year)*
Chemical Name Chemical Air Air Discharges Injection Disposal Releases Per Facility# Reporting Fugitive Point Water Underground Land Total Avg. Releases
Styrene[C] 581 4,871,703 13,953,846 508 0 26,247 18,852,304 32,448Zinc Compounds[M] 387 77,764 83,627 16,514 0 80,681 258,586 668Toluene 274 5,020,268 11,770,610 913 1 18,500 16,810,292 61,351Methyl Ethyl Ketone 244 4,096,697 8,045,051 36 5 52,793 12,194,582 49,978Dichloromethane[C] 199 9,632,532 16,045,951 353 0 6 25,678,842 129,039Diisocyanates 176 18,180 16,745 0 0 12,338 47,263 269Di(2-ethylhexyl) Phthalate[C] 155 126,752 195,528 95 0 122,416 444,791 2,870Xylene (Mixed Isomers) 136 454,814 4,382,364 45 0 0 4,837,223 35,568Antimony Compounds[M] 126 8,694 10,074 515 0 752 20,035 159Methanol 94 690,624 8,173,824 10,725 0 1,233 8,876,406 94,430Methyl Isobutyl Ketone 90 454,757 1,901,515 7 0 189 2,356,468 26,1831,1,1-Trichloroethane[O] 86 2,689,175 3,888,260 1 0 35,965 6,613,401 76,900Lead Compounds[C, M] 80 7,230 6,785 567 0 765 15,347 192Toluene Diisocyanate (Mixed Isomers)[C] 79 7,150 19,184 100 0 250 26,684 338Certain Glycol Ethers 76 98,739 1,634,664 37 0 750 1,734,190 22,818Chromium Compounds[C, M] 61 2,516 3,293 286 0 510 6,605 1081,1-dichloro-1-fluoroethane[O] 60 1,321,709 893,596 0 0 35,762 2,251,067 37,518Barium Compounds[M] 45 1,958 4,352 56 0 8,355 14,721 327Thiram 45 887 864 50 0 0 1,801 40N-hexane 43 1,658,596 2,057,021 544 0 0 3,716,161 86,422Methyl Methacrylate 41 119,507 618,752 155 0 0 738,414 18,010Phenol 40 64,743 861,047 634 0 0 926,424 23,161Formaldehyde[C] 39 28,638 137,409 364 0 0 166,411 4,267N-butyl Alcohol 39 63,469 765,734 280 0 0 829,483 21,269Trichloroethylene[C] 39 969,194 484,465 5 0 0 1,453,664 37,273Decabromodiphenyl Oxide 39 1,799 3,066 273 0 3,405 8,543 219Ethylene Glycol 38 153,510 100,794 5,119 0 0 259,423 6,827Ethylbenzene 37 14,546 453,549 266 0 0 468,361 12,658Hydrochloric Acid (1995 and after "Acid 35 125,227 210,112 5 0 0 335,344 9,581Aerosols" Only)Phosphoric Acid 33 1,543 6,140 0 4 0 7,687 233Chlorodifluoromethane[O] 32 260,465 25,705 0 0 0 286,170 8,943Ammonia 31 273,173 516,460 19,114 0 116 808,863 26,092Cobalt Compounds[C, M] 28 290 624 1,030 0 0 1,944 69Sulfuric Acid 27 4,555 7,003,799 5 5 0 7,008,364 259,569Nitric Acid 27 6,933 17,868 0 0 0 24,801 919Chlorine 27 13,497 13,273 503 0 0 27,273 1,010Toluene-2,4-Diisocyanate[C] 26 1,661 2,368 0 0 0 4,029 155Diethanolamine 24 2,531 3,880 0 0 0 6,411 267Copper[M] 24 282 1,198 0 0 5 1,485 62Nickel Compounds[C, M] 22 600 1,757 1,568 0 250 4,175 190Lead[C, M] 22 1,065 9,418 85 0 0 10,568 480Copper Compounds[M] 20 525 41 685 0 0 1,251 63Manganese Compounds[M] 20 543 1,752 61 0 255 2,611 131N,N-dimethylformamide[C] 19 131,726 636,427 358 0 5 768,516 40,448Toluene-2,6-diisocyanate[C] 19 676 1,915 0 0 0 2,591 136Dimethyl Phthalate 19 1,484 7,504 2 0 0 8,990 473Chromium[M] 19 25 146 0 0 2,111 2,282 120Dibutyl Phthalate 18 343 18,365 146 0 0 18,854 1,047Tetrachloroethylene[C] 18 53,253 307,771 0 0 0 361,024 20,0572-mercaptobenzothiazole 16 186 4,816 5 0 260 5,267 329N-methyl-2-pyrrolidone 16 16,395 53,758 0 0 5 70,158 4,385Nickel[C, M] 16 375 330 6 0 250 961 60Zinc (Fume or Dust)[M] 15 815 3,444 755 0 38,459 43,473 2,8981-chloro-1,1-difluoroethane[O] 14 407,466 4,557,307 1 0 0 4,964,774 354,627Cyclohexane 14 522,147 529,647 178 0 0 1,051,972 75,141Antimony[M] 14 1,110 91 110 0 9,144 10,455 747Phthalic Anhydride 13 604 2,753 0 0 0 3,357 2581,2,4-trimethylbenzene 12 32,945 532,152 0 0 0 565,097 47,091Nitrate Compounds 11 250 19,330 148,638 0 0 168,218 15,293Vinyl Acetate[C] 11 17,676 87,885 0 0 0 105,561 9,596

Sector Notebook Data Refresh - 1997 Rubber and Plastic
1995 TRI Releases for Rubber and Miscellaneous Plastics Facilities (SIC 30)by Number of Facilities Reporting (pounds/year)*
Chemical Name Chemical Air Air Discharges Injection Disposal Releases Per Facility# Reporting Fugitive Point Water Underground Land Total Avg. Releases
Sector Notebook Project May 1998M-3
Cadmium Compounds[C, M] 10 765 1,160 3 0 0 1,928 193Polycyclic Aromatic Compounds[C] 10 250 250 0 0 250 750 75Propylene Oxide[C] 10 27,946 61,248 250 0 250 89,694 8,969Ethylene Thiourea[C] 9 0 515 0 0 0 515 57Chloroethane 8 1,138,860 1,002,810 1 0 0 2,141,671 267,709Carbon Disulfide 8 354,483 11,718,082 263 0 0 12,072,828 1,509,104Freon 113[O] 8 78,932 66,703 2,914 0 0 148,549 18,569Acrylic Acid 8 1,784 1,188 0 0 0 2,972 372Benzoyl Peroxide 8 0 623 0 0 0 623 78Cumene 8 261 20,263 0 0 0 20,524 2,5664,4'-methylenebis(2-chloroaniline)[C] 8 250 10 0 0 0 260 33Isopropyl Alcohol (Manufacturing, 7 25,915 35,282 0 0 0 61,197 8,742Strong-acid Process Only)4,4'-isopropylidenediphenol 7 231 732 0 0 0 963 138Acetaldehyde[C] 6 80,138 128,511 916 0 0 209,565 34,928Maleic Anhydride 6 250 875 0 0 0 1,125 188Ethyl Acrylate[C] 6 4,900 1,856 15 0 0 6,771 1,129Barium[M] 6 10 1,425 0 0 0 1,435 239Ethylene Oxide[C] 5 35,270 10,794 250 0 5 46,319 9,264Trichlorofluoromethane[O] 5 39,271 48,565 0 0 0 87,836 17,5671,3-butadiene[C] 5 10,972 1,635 0 0 0 12,607 2,521Acrylonitrile[C] 5 451 599 7 0 5 1,062 212Chloroprene 5 5 5 0 0 5,104 5,114 1,023Manganese[M] 5 31 48 0 0 0 79 16Sodium Nitrite 5 250 22,600 250 0 35,000 58,100 11,620Ozone 5 39,860 186,417 0 0 0 226,277 45,255Vinyl Chloride[C] 4 12,900 76,951 1 0 0 89,852 22,463Dichlorodifluoromethane[O] 4 11,078 6 0 0 0 11,084 2,771Sec-butyl Alcohol 4 2,662 35,168 5 0 5 37,840 9,460Cumene Hydroperoxide 4 12,194 1,289 0 0 0 13,483 3,3714,4'-methylenedianiline[C] 4 500 146 0 0 0 646 1621,4-Dioxane[C] 4 689 2,072 2,896 0 22 5,679 1,420Butyl Acrylate 4 5,940 1,152 0 0 0 7,092 1,773Cobalt[C, M] 4 0 16 0 0 0 16 4Formic Acid 3 1,513 96 8 0 0 1,617 539Vinylidene Chloride 3 305 5,424 1 0 0 5,730 1,910Naphthalene 3 3,562 109,331 0 0 0 112,893 37,631Methyl Acrylate 3 3,100 1,484 0 0 0 4,584 1,5282-methoxyethanol 3 204 300,664 0 0 0 300,868 100,289Propylene 3 13,650 3,536 0 0 0 17,186 5,729Butyraldehyde 3 14,000 20,200 437 0 0 34,637 11,546Aluminum (Fume or Dust)[M] 3 0 15 0 0 0 15 5Hydrogen Fluoride 3 4,880 29,220 0 0 0 34,100 11,367Arsenic Compounds[C, M] 2 0 0 0 0 0 0 0Cyanide Compounds 2 5 0 0 0 0 5 3Chloroform[C] 2 21,818 40,908 5 0 0 62,731 31,366Ethylene 2 60,935 40,021 0 0 0 100,956 50,478Chloromethane 2 89,686 15,000 0 0 0 104,686 52,343Acetonitrile 2 6,243 430 0 0 0 6,673 3,337Tert-butyl Alcohol 2 255 263 0 0 0 518 259Dicyclopentadiene 2 29 111 0 0 0 140 70Epichlorohydrin[C] 2 931 316 2 0 3 1,252 626M-xylene 2 0 700 0 0 12,500 13,200 6,6002-ethoxyethanol 2 3,680 12,400 1 0 0 16,081 8,041Triethylamine 2 860 14,586 0 0 0 15,446 7,723Diphenylamine 2 250 395 0 0 0 645 323Hydroquinone 2 6 0 0 0 0 6 3Methyl Isocyanate 2 0 0 0 0 0 0 0Cresol (Mixed Isomers) 2 5,200 15,004 0 0 0 20,204 10,102Aluminum Oxide (Fibrous Forms)[M] 2 115 184 0 0 0 299 150Cadmium[C, M] 2 5 0 0 0 250 255 128

Sector Notebook Data Refresh - 1997 Rubber and Plastic
1995 TRI Releases for Rubber and Miscellaneous Plastics Facilities (SIC 30)by Number of Facilities Reporting (pounds/year)*
Chemical Name Chemical Air Air Discharges Injection Disposal Releases Per Facility# Reporting Fugitive Point Water Underground Land Total Avg. Releases
Sector Notebook Project May 1998M-4
Polychlorinated Alkanes 1 0 0 0 0 0 0 0Selenium Compounds[M] 1 0 0 0 0 0 0 0Piperonyl Butoxide 1 0 0 0 0 0 0 0Nitroglycerin 1 9 0 0 0 0 9 9N-nitrosomorpholine[C] 1 0 0 0 0 0 0 0Benzene[C] 1 12,896 0 0 0 0 12,896 12,896Hydrogen Cyanide 1 890 74,000 0 0 0 74,890 74,890Phosgene 1 3 15 0 0 0 18 18Acrylamide[C] 1 0 399 0 0 0 399 3992-nitropropane 1 12,000 0 0 0 0 12,000 12,000Michler's Ketone[C] 1 0 1,577 0 0 0 1,577 1,577Biphenyl 1 10,900 2,500 13 0 0 13,413 13,413O-Toluidine[C] 1 5 5 5 0 5 20 204,4'-methylenebis(N,N-dimethyl) 1 0 5 0 0 0 5 5benzenamine[C]1,4-Dichlorobenzene[C] 1 358 57 0 0 0 415 4151,2-butylene Oxide 1 0 5 0 0 0 5 51,2-Dibromoethane[C] 1 230 3 9 0 0 242 242Allyl Chloride 1 45 230 49 0 0 324 324Allyl Alcohol 1 266 7,301 0 0 0 7,567 7,567Chlorobenzene 1 1,120 10,076 0 0 0 11,196 11,196Propoxur 1 0 5 0 0 0 5 5Catechol 1 5 250 0 0 0 255 255Dimethylamine 1 970 0 0 0 0 970 9702,2-dichloro-1,1,1-trifluoroethane[O] 1 14 34,800 0 0 0 34,814 34,814Asbestos (Friable)[C] 1 0 0 0 0 0 0 0Polychlorinated Biphenyls[C] 1 0 0 0 0 0 0 0Sulfuryl Fluoride 1 0 355,000 0 0 0 355,000 355,000Silver[M] 1 0 5 0 0 0 5 5Arsenic[C, M] 1 0 0 0 0 0 0 0Tetramethrin 1 0 0 0 0 0 0 0Phosphorus (Yellow or White) 1 0 0 0 0 0 0 0Diaminotoluene (Mixed Isomers)[C] 1 5 5 250 0 5 265 265Sodium Azide 1 0 0 0 0 0 0 0Permethrin 1 0 0 0 0 0 0 0Trade Secret Chemical 1 250 5 0 0 0 255 255
__________ _________ __________ _______ ___ _______ __________ _______1,947** 36,780,783 105,628,293 220,254 15 505,181 143,134,526 73,515
[C] Known or suspect carcinogens [M] Metals and metal compounds [O] Ozone depleters* Refer to Section III for a discussion of the TRI data and its limitations, methodology used to obtain this data, definitions of the column headings, and the definitions of carcinogens, metals, and ozone depleters.**Total number of facilities (not chemical reports) reporting to TRI in this industry sector.

Sector Notebook Data Refresh - 1997 Rubber and Plastic
Sector Notebook Project May 1998M-5
1995 TRI Transfers for Rubber and Miscellaneous Plastics Facilities (SIC 30)by Number of Facilities Reporting (pounds/year)*
Chemical Name Chemical Transfers Transfers Transfers Transfers Transfers Transfers Per Facility# Reporting Potw Disposal Recycling Treatment Recovery Total Avg Transfer
Energy
Styrene[C] 581 878 2,656,160 361,306 1,952,309 886,520 5,857,923 10,082Zinc Compounds[M] 387 85,823 5,668,386 1,880,509 349,907 62,110 8,049,555 20,800Toluene 274 3,788 53,374 624,063 607,463 3,450,271 4,741,459 17,305Methyl Ethyl Ketone 244 17,517 17,042 2,775,910 902,542 3,961,166 7,676,677 31,462Dichloromethane[C] 199 255 11,635 1,423,390 269,846 278,002 1,983,128 9,965Diisocyanates 176 265 192,912 92,133 71,802 39,760 396,872 2,255Di(2-ethylhexyl) Phthalate[C] 155 9,795 1,534,989 2,540,542 75,925 161,628 4,322,879 27,890Xylene (Mixed Isomers) 136 37 35 494,245 369,392 1,204,574 2,068,533 15,210Antimony Compounds[M] 126 1,831 409,643 85,247 22,847 2,597 522,165 4,144Methanol 94 936,389 2,030 437,747 293,135 1,334,750 3,005,806 31,977Methyl Isobutyl Ketone 90 109 2,093 155,322 54,606 819,743 1,031,873 11,4651,1,1-Trichloroethane[O] 86 5 1,971 212,703 24,139 103,996 342,814 3,986Lead Compounds[C, M] 80 1,863 103,348 1,290,190 28,415 681 1,424,497 17,806Toluene Diisocyanate (Mixed Isomers)[C] 79 0 8,014 12,480 123,070 25,380 168,944 2,139Certain Glycol Ethers 76 74,932 108,328 111,634 317,460 628,095 1,240,449 16,322Chromium Compounds[C, M] 61 1,145 147,551 340,797 57,329 0 546,822 8,9641,1-dichloro-1-fluoroethane[O] 60 250 94,782 9,402 6,820 2,703 113,957 1,899Barium Compounds[M] 45 536 98,968 15,984 6,573 40,206 162,267 3,606Thiram 45 632 90,455 30,543 4,780 5 126,415 2,809N-hexane 43 5 14,900 . 37,300 59,272 111,477 2,592Methyl Methacrylate 41 4,916 194,145 . 150,938 348,247 698,246 17,030Phenol 40 661 187,520 . 61,818 45,793 298,292 7,457Formaldehyde[C] 39 1,266,552 11,790 181 18,323 27,265 1,324,111 33,952N-butyl Alcohol 39 650,000 250 33,257 28,103 95,485 807,850 20,714Trichloroethylene[C] 39 514 . 238,388 68,137 74,891 381,930 9,793Decabromodiphenyl Oxide 39 607 311,538 32,216 43,495 5,973 393,829 10,098Ethylene Glycol 38 57,501 9,642 33,417,361 54,281 167,958 33,706,743 887,020Ethylbenzene 37 259 . 82,550 542,286 147,361 772,456 20,877Hydrochloric Acid (1995 and after "Acid 35 450 6 . 865 . 1,321 38Aerosols" Only)Phosphoric Acid 33 10,060 30,554 . 42,138 3,792 119,544 3,623Chlorodifluoromethane[O] 32 0 7,087 . . . 7,087 221Ammonia 31 78,050 2,955 20,181 2,640 5,270 109,096 3,519Cobalt Compounds[C, M] 28 22 51,159 4,878 2,805 . 58,864 2,102Sulfuric Acid 27 250 . 77,800 . . 78,050 2,891Nitric Acid 27 518 . 50,773 1,052 . 52,343 1,939Chlorine 27 6,080 . . . . 6,080 225Toluene-2,4-Diisocyanate[C] 26 0 611 1,400 7,620 10,183 19,814 762Diethanolamine 24 4,894 409 . 10,276 360 15,939 664Copper[M] 24 327 7,580 7,085,987 280 1 7,094,175 295,591Nickel Compounds[C, M] 22 1,690 20,288 388,488 80,318 0 490,784 22,308Lead[C, M] 22 335 114,003 1,664,211 38,713 1,600 1,818,862 82,676Copper Compounds[M] 20 1,431 81,873 1,249,771 96,378 . 1,429,458 71,473Manganese Compounds[M] 20 510 4,538 28,674 . . 33,722 1,686N,N-dimethylformamide[C] 19 869,076 336 46,786 38,127 290,578 1,245,403 65,548Toluene-2,6-diisocyanate[C] 19 0 153 . 1,135 745 2,033 107Dimethyl Phthalate 19 270 2,369 800 . 2,695 6,134 323Chromium[M] 19 23 103,986 400,721 111 . 504,841 26,571Dibutyl Phthalate 18 99 19,267 22,049 19,032 5,192 65,639 3,647Tetrachloroethylene[C] 18 5 5 64,838 35,902 3,230 103,980 5,7772-mercaptobenzothiazole 16 7,855 213,423 104,825 0 . 326,103 20,381N-methyl-2-pyrrolidone 16 153,439 255 29,469 59,693 29,203 272,059 17,004Nickel[C, M] 16 317 9,652 172,161 255 600 182,985 11,437Zinc (Fume or Dust)[M] 15 827 148,472 5,160 44,159 . 198,618 13,2411-chloro-1,1-difluoroethane[O] 14 0 . . . . 0 0Cyclohexane 14 1,500 89,706 311,070 280,720 79,074 762,070 54,434Antimony[M] 14 22 14,522 13,550 1,622 1,500 31,216 2,230Phthalic Anhydride 13 5 15,331 1,009 8,503 1,463 26,311 2,0241,2,4-trimethylbenzene 12 250 . 15,911 1,390 14,190 31,741 2,645Nitrate Compounds 11 2,277,082 . 3 752 . 2,277,837 207,076

Sector Notebook Data Refresh - 1997 Rubber and Plastic
1995 TRI Transfers for Rubber and Miscellaneous Plastics Facilities (SIC 30)by Number of Facilities Reporting (pounds/year)*
Chemical Name Chemical Transfers Transfers Transfers Transfers Transfers Transfers Per Facility# Reporting Potw Disposal Recycling Treatment Recovery Total Avg Transfer
Energy
Sector Notebook Project May 1998M-6
Vinyl Acetate[C] 11 10,500 2,425 8,456 70,212 1,577 93,170 8,470Cadmium Compounds[C, M] 10 765 1,988 3,025 257 . 6,035 604Polycyclic Aromatic Compounds[C] 10 1,700 134,824 80,850 . 1,420 218,794 21,879Propylene Oxide[C] 10 5,800 160 . 28,565 415 34,940 3,494Ethylene Thiourea[C] 9 5 16,165 840 6,280 . 23,290 2,588Chloroethane 8 0 . . . . 0 0Carbon Disulfide 8 325,362 . . . . 325,362 40,670Freon 113[O] 8 0 . 5,165 12,719 . 17,884 2,236Acrylic Acid 8 980 . . 79,746 168,555 249,281 31,160Benzoyl Peroxide 8 0 3,150 . . 250 3,400 425Cumene 8 5 5,637 . 62,825 18,059 86,526 10,8164,4'-methylenebis(2-chloroaniline)[C] 8 5 5 . 6,724 1,783 8,517 1,065Isopropyl Alcohol (Manufacturing, 7 0 . . . 29,813 29,813 4,259Strong-acid Process Only)4,4'-isopropylidenediphenol 7 0 614 . 950 . 1,564 223Acetaldehyde[C] 6 3,300 . . 83,471 106 86,877 14,480Maleic Anhydride 6 0 2,074 . 5,938 . 8,012 1,335Ethyl Acrylate[C] 6 3,680 . . 1,543 14,435 19,658 3,276Barium[M] 6 5 3,674 3,550 . 3 7,232 1,205Ethylene Oxide[C] 5 250 160 . . . 410 82Trichlorofluoromethane[O] 5 0 . . . . 0 01,3-butadiene[C] 5 0 2,857 . 85,867 420 89,144 17,829Acrylonitrile[C] 5 24 250 . 36,980 11,500 48,754 9,751Chloroprene 5 0 7,102 . . . 7,102 1,420Manganese[M] 5 0 7,470 23,195 . . 30,665 6,133Sodium Nitrite 5 27,510 750 . 2,005 . 30,265 6,053Ozone 5 0 . . . . 0 0Vinyl Chloride[C] 4 226 16 . 2,200 . 2,442 611Dichlorodifluoromethane[O] 4 0 . . . . 0 0Sec-butyl Alcohol 4 63 . . . 2,448 2,511 628Cumene Hydroperoxide 4 0 59,003 . . . 59,003 14,7514,4'-methylenedianiline[C] 4 0 . . 3,400 1,800 5,200 1,3001,4-Dioxane[C] 4 78,935 1,583 . 12,655 13,969 107,142 26,786Butyl Acrylate 4 94,000 200 . 11,216 15,622 121,038 30,260Cobalt[C, M] 4 0 2,312 9,398 . . 11,710 2,928Formic Acid 3 410 . . . . 410 137Vinylidene Chloride 3 0 1 . 29,500 . 29,501 9,834Naphthalene 3 0 . . . 13,234 13,234 4,411Methyl Acrylate 3 4,000 . . 1,331 3,675 9,006 3,0022-methoxyethanol 3 48,389 35 . 1,819 4,143 54,386 18,129Propylene 3 0 . . . . 0 0Butyraldehyde 3 150,440 41 . 12,200 . 162,681 54,227Aluminum (Fume or Dust)[M] 3 0 . 250 . . 250 83Hydrogen Fluoride 3 0 . . 9,740 . 9,740 3,247Arsenic Compounds[C, M] 2 0 . 6,174 15 . 6,189 3,095Cyanide Compounds 2 5 . . 3,061 . 3,066 1,533Chloroform[C] 2 0 . . 2,536 . 2,536 1,268Ethylene 2 0 . . . . 0 0Chloromethane 2 250 . . 486 . 736 368Acetonitrile 2 0 . 1,080 27,900 42,600 71,580 35,790Tert-butyl Alcohol 2 0 . . 59,849 128,558 188,407 94,204Dicyclopentadiene 2 0 . . 1,700 18,700 20,400 10,200Epichlorohydrin[C] 2 0 . . 42 . 42 21M-xylene 2 0 . . 12,500 . 12,500 6,2502-ethoxyethanol 2 0 . . . 4,790 4,790 2,395Triethylamine 2 0 . . 18 . 18 9Diphenylamine 2 750 10,560 9,600 . 250 21,160 10,580Hydroquinone 2 0 . . . . 0 0Methyl Isocyanate 2 0 . . . . 0 0Cresol (Mixed Isomers) 2 1 . . 1,831 4,300 6,132 3,066

Sector Notebook Data Refresh - 1997 Rubber and Plastic
1995 TRI Transfers for Rubber and Miscellaneous Plastics Facilities (SIC 30)by Number of Facilities Reporting (pounds/year)*
Chemical Name Chemical Transfers Transfers Transfers Transfers Transfers Transfers Per Facility# Reporting Potw Disposal Recycling Treatment Recovery Total Avg Transfer
Energy
Sector Notebook Project May 1998M-7
Aluminum Oxide (Fibrous Forms)[M] 2 0 . . . 4,596 4,596 2,298Cadmium[C, M] 2 0 . 250 3,911 . 4,161 2,081Polychlorinated Alkanes 1 0 . 11,128 . . 11,128 11,128Selenium Compounds[M] 1 0 . 11,765 10 . 11,775 11,775Piperonyl Butoxide 1 250 . . 15,148 . 15,398 15,398Nitroglycerin 1 203 . . 3 . 206 206N-nitrosomorpholine[C] 1 0 . . . . 0 0Benzene[C] 1 0 . . 3,535 30,234 33,769 33,769Hydrogen Cyanide 1 0 . . . . 0 0Phosgene 1 0 . . . . 0 0Acrylamide[C] 1 0 . . . 55 55 552-nitropropane 1 0 . . . 59 59 59Michler's Ketone[C] 1 0 . . . 436 436 436Biphenyl 1 0 . . 1,360 . 1,360 1,360O-Toluidine[C] 1 120 . . . 200 320 3204,4'-methylenebis(N,N-dimethyl) 1 0 . . . . 0 0benzenamine[C]1,4-Dichlorobenzene[C] 1 0 . . . . 0 01,2-butylene Oxide 1 0 . . . 27 27 271,2-Dibromoethane[C] 1 0 . . 50 0 50 50Allyl Chloride 1 0 . . . . 0 0Allyl Alcohol 1 191,310 . . 68,967 . 260,277 260,277Chlorobenzene 1 0 . . . . 0 0Propoxur 1 250 . . 750 . 1,000 1,000Catechol 1 15,000 . . . . 15,000 15,000Dimethylamine 1 0 . . . . 0 02,2-dichloro-1,1,1-trifluoroethane[O] 1 0 . . 1,196 . 1,196 1,196Asbestos (Friable)[C] 1 0 223,376 . . . 223,376 223,376Polychlorinated Biphenyls[C] 1 0 . . 250 . 250 250Sulfuryl Fluoride 1 0 . . . . 0 0Silver[M] 1 0 . . . 1 1 1Arsenic[C, M] 1 0 712 . . . 712 712Tetramethrin 1 0 . . 750 . 750 750Phosphorus (Yellow or White) 1 0 . . . . 0 0Diaminotoluene (Mixed Isomers)[C] 1 250 . . 110 990 1,350 1,350Sodium Azide 1 0 . . . . 0 0Permethrin 1 0 . . 505 . 505 505Trade Secret Chemical 1 0 . . . . 0 0
_______ ________ _________ __________ _________ _________ __________ ________1,947** 7,497,195 13,357,185 58,633,341 8,092,153 14,963,131 102,590,340 52,691
[C] Known or suspect carcinogens [M] Metals and metal compounds [O] Ozone depleters* Refer to Section III for a discussion of the TRI data and its limitations, methodology used to obtain this data, definitions of the column headings, and the definitions of carcinogens, metals, and ozone depleters.**Total number of facilities (not chemical reports) reporting to TRI in this industry sector.

Sector Notebook Data Refresh - 1997 Rubber and Plastic
Being included on this list does not mean that the release is associated with non-compliance with environmental laws.1
Sector Notebook Project May 1998M-8
Ten Largest Volume TRI Releasing Rubber and Plastic Facilities ReportingOnly SIC 30*
Rank Facility Total TRI Releases in Pounds1
1 Westinghouse Electric Corp., Hampton, South Carolina 5,172,390
2 Devro-Teepak Inc., Danville, Illinois 3,876,076
3 3M, Guin, Alabama 2,471,008
4 Goodyear Tire & Rubber Co., Lincoln, Nebraska 2,327,372
5 Viskase Corp., Loudon, Tennessee 2,278,000
6 O'Sullivan Corp., Winchester, Virginia 2,133,232
7 Flexel Indiana Inc., Covington, Indina 1,900,265
8 Foamex Intl. Inc., Orange, California 1,628,510
9 Texas Recreation Corp., Wichita Falls, Texas 1,592,500
10 Viskase Corp., Bedford Park, Illinois 1,551,050
Source: US EPA 1995 Toxics Release Inventory Database.*Refer to Section III for a general discussion of TRI data and its limitations. A discussion of the methodology used todevelop this table can be found under the heading Ten Largest Volume TRI Releasing Facilities.
Ten Largest Volume TRI Releasing Facilities Reporting Only SIC 30 or SIC 30 andOther SIC Codes*
Rank Facility SIC Codes Reported in TRI in Pounds1
Total TRIReleases
1 Westinghouse Electric Corp., Hampton, South Carolina 3083 5,172,390
2 Devro-Teepak Inc., Danville, Illinois 3089 3,876,076
3 3M, Guin, Alabama 3081 2,471,008
4 Goodyear Tire & Rubber Co., Lincoln, Nebraska 3052 2,327,372
5 Viskase Corp., Loudon, Tennessee 3089 2,278,000
6 O'Sullivan Corp., Winchester, Virginia 3081, 3083 2,133,232
7 Flexel Indiana Inc., Covington, Indiana 3089 1,900,265
8 Dow Chemical Co., Pevely, Missouri 2821, 3086 1,769,591
9 Foamex Intl. Inc., Orange, California 3086 1,628,510
10 Texas Recreation Corp., Wichita Falls, Texas 3086 1,592,500
Source: US EPA Toxics Release Inventory Database, 1995.*Refer to Section III for a general discussion of TRI data and its limitations. A discussion of the methodology used todevelop this table can be found under the heading Ten Largest Volume TRI Releasing Facilities.

Sector Notebook Data Refresh - 1997 Rubber and Plastic
Sector Notebook Project May 1998M-9
Source Reduction and Recycling Activity for Rubber and Miscellaneous Plastic Facilities (SICs 30) as Reported within TRI*
A B C JOn-Site Off-Site
Year (10 lbs.) Transferred Off-siteRecycled Recovery % Treated Recycled Recovery % Treated
Quantity of %Production- Released
Related % Released andWaste and Disposed% % Energy % % Energy
6 a b
c
D E F G H I
1994 778 29% 50% 6% 11% 8% 2% 2% 22%
1995 864 28% 54% 7% 10% 7% 2% 2% 19%
1996 773 --- 51% 8% 11% 8% 2% 2% 18%
1997 657 --- 43% 9% 12% 10% 2% 2% 21%
Source: 1995 Toxics Release Inventory Database. * Refer to Section III for a general discussion of TRI data and its limitations. A discussion of the methodology used todevelop this table can be found under the heading Source Reduction and Recycling Activity. Within this industry sector, non-production related waste < 1% of production related wastes for 1995.a
Total TRI transfers and releases as reported in Section 5 and 6 of Form R as a percentage of production related wastes.b
Percentage of production related waste released to the environment and transferred off-site for disposal.c

Sector Notebook Data Refresh - 1997 Rubber and Plastic
Sector Notebook Project May 1998M-10
Five-Year Enforcement and Compliance Summary for the Rubber and Plastic Industry*A B C D E F G H I J
Region Facilities Facilities Number of Average Facilities with Total Percent Percent Enforcementin Search Inspected Inspections Months 1 or More Enforcement State Federal to Inspection
Between Enforcement Actions Lead Lead RateInspections Actions Actions Actions
I 91 55 188 29 15 26 65% 35% 0.14
II 87 60 333 16 20 52 88% 12% 0.16
III 162 103 616 16 15 25 65% 35% 0.04
IV 424 243 1,377 18 43 63 94% 6% 0.05
V 585 298 1,072 33 45 54 80% 20% 0.05
VI 179 62 244 44 10 17 94% 6% 0.07
VII 109 79 300 22 18 24 75% 25% 0.08
VIII 27 19 56 29 3 5 100% 0% 0.09
IX 116 39 122 57 2 3 67% 33% 0.02
X 38 23 75 30 7 7 71% 29% 0.09
TOTAL 1,818 981 4,383 25 178 276 82% 18% 0.06
*Data obtained from EPA’s Integrated Data for Enforcement Analysis (IDEA) System. For a description of IDEA andthe methods used to obtain this data, refer to Section II.C. A discussion of this table can be found under the heading,Five-Year Enforcement and Compliance Summary, in Section III.

Sector Notebook Data Refresh - 1997 Stone, Clay, Glass and Concrete
Sector Notebook Project May 1998N-1
Stone, Clay, Glass and Concrete

Sector Notebook Data Refresh - 1997 Stone, Clay, Glass and Concrete
Sector Notebook Project May 1998N-2
1995 TRI Releases for Stone, Clay, Glass and Concrete Facilities (SIC 32)by Number of Facilities Reporting (pounds/year)*
Chemical Name Chemical Air Air Discharges Injection Disposal Releases Per Facility# Reporting Fugitive Point Water Underground Land Total Avg. Releases
Chromium Compounds[C, M] 106 19,122 18,989 1,333 0 146,319 185,763 1,752Ammonia 71 387,911 7,309,839 364,164 0 106,027 8,167,941 115,041Barium Compounds[M] 70 5,181 21,124 768 0 32,130 59,203 846Manganese Compounds[M] 70 19,963 27,640 2,183 0 95,773 145,559 2,079Zinc Compounds[M] 69 39,375 61,179 39,804 0 207,993 348,351 5,049Toluene 61 342,617 1,605,339 291 0 3,970 1,952,217 32,004Lead Compounds[C, M] 59 24,784 114,044 4,297 0 123,025 266,150 4,511Formaldehyde[C] 59 175,581 2,015,608 946 0 73,410 2,265,545 38,399Hydrogen Fluoride 55 4,838 3,352,577 255 0 0 3,357,670 61,049Phenol 54 72,954 1,117,625 3,092 0 8,936 1,202,607 22,271Methyl Ethyl Ketone 52 707,624 819,576 284 0 0 1,527,484 29,375Xylene (Mixed Isomers) 51 339,585 789,797 798 0 0 1,130,180 22,160Methanol 49 121,852 1,078,655 7,434 0 34,800 1,242,741 25,362Styrene[C] 48 168,571 757,168 59 0 0 925,798 19,287Hydrochloric Acid (1995 and after "Acid 48 23,629 15,581,651 470 102,063 17,000 15,724,813 327,600Chromium[M] 45 85,081 2,881 74 0 31,501 119,537 2,656Manganese[M] 44 18,956 4,144 16 0 192,692 215,808 4,905Ethylene Glycol 40 1,851 31,907 20,229 0 38,317 92,304 2,308Phosphoric Acid 37 20,619 6,838 3,348 0 30,888 61,693 1,667Ethylbenzene 28 43,869 87,090 761 0 0 131,720 4,704Lead[C, M] 27 2,540 41,798 496 0 122,884 167,718 6,212Methyl Isobutyl Ketone 26 5,810 49,946 0 0 0 55,756 2,144Antimony Compounds[M] 24 2,818 9,077 1,175 0 1,483 14,553 606Dichloromethane[C] 24 179,872 74,529 330 0 0 254,731 10,614Nickel[C, M] 24 1,729 1,021 52 0 4,015 6,817 284Sulfuric Acid 24 2,335 446,493 0 0 0 448,828 18,701Copper[M] 19 46,914 10,718 786 0 80 58,498 3,079Nickel Compounds[C, M] 18 2,073 2,525 3,261 0 1,950 9,809 545Tetrachloroethylene[C] 18 39,485 57,628 1 0 0 97,114 5,395Certain Glycol Ethers 17 5,430 155,127 0 0 0 160,557 9,4451,1,1-Trichloroethane[O] 17 221,841 497,143 0 0 0 718,984 42,293N-butyl Alcohol 16 20,306 142,709 530 0 0 163,545 10,222Aluminum (Fume or Dust)[M] 15 3,692 1,002 0 0 500 5,194 346Barium[M] 15 10 19,917 260 0 0 20,187 1,346Nitric Acid 15 37,496 27,261 0 0 0 64,757 4,317Copper Compounds[M] 13 6,223 1,305 1,325 0 3,701 12,554 966Trichloroethylene[C] 11 79,231 170,050 0 0 0 249,281 22,662Benzene[C] 10 1,158 8,436 0 0 0 9,594 9591,2,4-trimethylbenzene 10 10,177 92,570 250 0 0 102,997 10,300Zinc (Fume or Dust)[M] 10 3,274 9,189 10 0 250 12,723 1,272Chlorine 10 668 195,390 441 190 0 196,689 19,669Cobalt Compounds[C, M] 9 59 4,194 1,892 0 0 6,145 683Diisocyanates 9 0 14 0 0 0 14 2Cadmium Compounds[C, M] 8 19 260 73 0 1,020 1,372 172Naphthalene 8 307 75,975 0 0 5 76,287 9,536Di(2-ethylhexyl) Phthalate[C] 8 20 30,170 0 0 0 30,190 3,774Cyclohexane 7 19,848 150,691 170 0 0 170,709 24,387Chloroform[C] 6 298 30,997 5 0 0 31,300 5,217Dibutyl Phthalate 6 47 20,094 0 0 1,402 21,543 3,591N-hexane 6 14,276 11,900 544 0 0 26,720 4,453Cobalt[C, M] 6 0 250 0 0 0 250 42Nitrate Compounds 5 1 8 471,636 0 3,018 474,663 94,933Methyl Methacrylate 5 2,784 8,045 150 0 0 10,979 2,1962-ethoxyethanol 5 13,293 34,602 1 0 0 47,896 9,579Diethanolamine 5 1,000 13,002 0 0 0 14,002 2,800Triethylamine 5 33,030 109,991 0 0 0 143,021 28,604Aluminum Oxide (Fibrous Forms)[M] 5 750 250 2,280 0 250 3,530 706Arsenic Compounds[C, M] 4 265 9,843 62 0 0 10,170 2,543N,N-dimethylformamide[C] 4 557 39,025 108 0 0 39,690 9,923Cumene 4 266 300 0 0 0 566 142Chlorobenzene 4 12 19 0 0 0 31 8Pyridine 4 51 321 0 0 0 372 93Decabromodiphenyl Oxide 4 0 250 1,463 0 1,639 3,352 838Cresol (Mixed Isomers) 4 511 829 0 0 0 1,340 335

Sector Notebook Data Refresh - 1997 Stone, Clay, Glass and Concrete
1995 TRI Releases for Stone, Clay, Glass and Concrete Facilities (SIC 32)by Number of Facilities Reporting (pounds/year)*
Chemical Name Chemical Air Air Discharges Injection Disposal Releases Per Facility# Reporting Fugitive Point Water Underground Land Total Avg. Releases
Sector Notebook Project May 1998N-3
Antimony[M] 4 6 4,277 8 0 0 4,291 1,073Carbon Tetrachloride[C, O] 3 7 23 0 0 0 30 10Tert-butyl Alcohol 3 761 8,545 0 0 0 9,306 3,102Phenanthrene 3 255 163 0 0 0 418 139Phthalic Anhydride 3 500 570 0 0 0 1,070 357Nitrobenzene 3 14 73 0 0 0 87 291,4-Dichlorobenzene[C] 3 500 29,744 0 0 0 30,244 10,0811,2-Dichloroethane[C] 3 12 26 0 0 0 38 13Carbonyl Sulfide 3 0 383,163 0 0 0 383,163 127,721Asbestos (Friable)[C] 3 1 616 0 0 0 617 206Creosote[C] 3 16 18 0 0 0 34 11Toluene Diisocyanate (Mixed Isomers)[C] 3 469 8 0 0 0 477 159Cyanide Compounds 2 5 0 2,821 0 10,257 13,083 6,542Polycyclic Aromatic Compounds[C] 2 0 5 0 0 1,700 1,705 853Selenium Compounds[M] 2 998 19,965 15 0 0 20,978 10,489Formic Acid 2 313 96 8 0 0 417 209Isopropyl Alcohol (Manufacturing, 2 404 254 0 0 0 658 329Sec-butyl Alcohol 2 2,600 1,170 0 0 0 3,770 1,885O-xylene 2 426 761 0 0 0 1,187 5941,2-Dichlorobenzene 2 5 5 0 0 0 10 5Acetophenone 2 10 255 0 0 0 265 133P-cresol 2 10 10 0 0 0 20 10Vinyl Acetate[C] 2 250 250 0 0 0 500 250Maleic Anhydride 2 250 287 0 0 0 537 269M-xylene 2 0 1,000 0 0 0 1,000 500Anthracene 2 250 5 0 0 0 255 128Dimethyl Phthalate 2 5 0 0 0 0 5 3Molybdenum Trioxide 2 990 12 36,000 0 0 37,002 18,501Dichlorobenzene (Mixed Isomers)[C] 2 10 22 0 0 0 32 16Polychlorinated Alkanes 1 0 0 0 0 0 0 0Silver Compounds[M] 1 0 160 0 0 0 160 160Vinyl Chloride[C] 1 0 4 0 0 0 4 4Acetonitrile 1 250 250 0 0 0 500 500Carbon Disulfide 1 5 5 0 0 0 10 10Chlorodifluoromethane[O] 1 5 5 0 0 0 10 10Trichlorofluoromethane[O] 1 36 237 0 0 0 273 273Dichlorodifluoromethane[O] 1 5 3 0 0 0 8 8Freon 113[O] 1 5 5 0 0 0 10 10Dicyclopentadiene 1 250 250 0 0 0 500 5001,1,2-trichloroethane 1 2 14 0 0 0 16 16Acrylamide[C] 1 5 250 0 0 0 255 255Acrylic Acid 1 126 471 0 0 0 597 5971,1,2,2-tetrachloroethane 1 2 14 0 0 0 16 162-nitropropane 1 250 5 0 0 0 255 2554,4'-isopropylidenediphenol 1 0 270 0 0 0 270 2702-phenylphenol 1 0 0 0 0 0 0 0Biphenyl 1 5 5 0 0 0 10 10Methyl Acrylate 1 2,090 850 0 0 0 2,940 2,9404,4'-methylenedianiline[C] 1 0 5 0 0 0 5 52,4-Dimethylphenol 1 1 1 0 0 0 2 2P-xylene 1 0 250 0 0 0 250 2501,3-butadiene[C] 1 0 2,185 0 0 0 2,185 2,185Acrolein 1 5 1 0 0 0 6 6Allyl Chloride 1 45 230 49 0 0 324 324Propargyl Alcohol 1 471 482 0 0 0 953 953M-cresol 1 5 5 0 0 0 10 102-methoxyethanol 1 5,100 249,900 0 0 5 255,005 255,005Propylene 1 5 0 0 0 0 5 51,4-Dioxane[C] 1 250 250 0 0 0 500 500Dibenzofuran 1 0 0 0 0 0 0 0Ethyl Acrylate[C] 1 3,530 558 10 0 0 4,098 4,098Butyl Acrylate 1 0 250 0 0 0 250 250Calcium Cyanamide 1 0 5 0 0 0 5 52,2-dichloro-1,1,1-trifluoroethane[O] 1 14 34,800 0 0 0 34,814 34,814

Sector Notebook Data Refresh - 1997 Stone, Clay, Glass and Concrete
1995 TRI Releases for Stone, Clay, Glass and Concrete Facilities (SIC 32)by Number of Facilities Reporting (pounds/year)*
Chemical Name Chemical Air Air Discharges Injection Disposal Releases Per Facility# Reporting Fugitive Point Water Underground Land Total Avg. Releases
Sector Notebook Project May 1998N-4
Lithium Carbonate 1 0 1 0 0 0 1 1Polychlorinated Biphenyls[C] 1 0 0 0 0 0 0 0Methyl Tert-butyl Ether 1 5 5 0 0 0 10 101,1-dichloro-1-fluoroethane[O] 1 250 750 0 0 0 1,000 1,000Fluometuron 1 5 5 0 0 0 10 10Arsenic[C, M] 1 750 250 0 0 2,600 3,600 3,600Cadmium[C, M] 1 0 3 0 0 0 3 3Selenium[M] 1 0 1,430 5 0 0 1,435 1,435
________ _________ _________ ________ _______ ________ __________ _______623** 3,440,830 38,111,712 976,823 102,253 1,299,540 43,931,158 70,516
[C] Known or suspect carcinogens [M] Metals and metal compounds [O] Ozone depleters* Refer to Section III for a discussion of the TRI data and its limitations, methodology used to obtain this data,definitions of the column headings, and the definitions of carcinogens, metals, and ozone depleters.**Total number of facilities (not chemical reports) reporting to TRI in this industry sector.

Sector Notebook Data Refresh - 1997 Stone, Clay, Glass and Concrete
Sector Notebook Project May 1998N-5
1995 TRI Transfers for Stone,Clay, Glass and Concrete Facilities (SIC 32)by Number of Facilities Reporting (pounds/year)*
Chemical Name Chemical Transfers Transfers Transfers Transfers Recovery Transfers Per Facility# Reporting Potw Disposal Recycling Treatment Energy Total Avg Transfer
Chromium Compounds[C, M] 106 2,352 938,214 960,168 13,434 1,125 1,915,293 18,069Ammonia 71 145,620 32,764 2,500 419 150 181,453 2,556Barium Compounds[M] 70 154,444 895,163 290,271 175,074 . 1,514,952 21,642Manganese Compounds[M] 70 23,870 649,677 725,013 2,360 250 1,401,420 20,020Zinc Compounds[M] 69 34,139 870,758 1,268,718 26,977 177 2,200,769 31,895Toluene 61 0 3,625 268,368 229,818 1,261,271 1,763,082 28,903Lead Compounds[C, M] 59 2,163 2,454,121 1,025,209 160,582 10,207 3,652,282 61,903Formaldehyde[C] 59 92,448 33,186 498 36,783 15,077 177,992 3,017Hydrogen Fluoride 55 329,152 10 47,746 163,902 . 540,810 9,833Phenol 54 17,837 70,644 772 70,629 34,972 194,854 3,608Methyl Ethyl Ketone 52 2,808 . 217,317 113,293 1,344,319 1,677,737 32,264Xylene (Mixed Isomers) 51 8,400 392 241,016 170,151 617,521 1,037,480 20,343Methanol 49 37,928 12,594 105,275 66,145 446,571 668,513 13,643Styrene[C] 48 0 501 2,316 26,053 24,125 52,995 1,104Hydrochloric Acid (1995 and after "Acid 48 2,415 . . 41,761 . 44,176 920Chromium[M] 45 0 85,233 165,413 101,971 45,500 398,117 8,847Manganese[M] 44 16 266,065 54,109 603,494 . 923,684 20,993Ethylene Glycol 40 504 9,784 7,654 36,602 10,105 64,649 1,616Phosphoric Acid 37 155 38,917 . . . 39,072 1,056Ethylbenzene 28 0 . 30,975 40,249 77,565 148,789 5,314Lead[C, M] 27 284 34,155 434,891 533,186 1,332 1,003,848 37,180Methyl Isobutyl Ketone 26 0 . 1,728 31,634 170,364 203,726 7,836Antimony Compounds[M] 24 1,031 118,707 6,969 572 . 127,279 5,303Dichloromethane[C] 24 5 . 250 35,437 7,616 43,308 1,805Nickel[C, M] 24 605 42,635 218,769 9,478 500 271,987 11,333Sulfuric Acid 24 25,816 . . . . 25,816 1,076Copper[M] 19 121 22,656 1,926,528 33,755 . 1,983,060 104,372Nickel Compounds[C, M] 18 515 42,622 54,117 1,955 . 99,209 5,512Tetrachloroethylene[C] 18 0 . 21,190 12,774 23,285 57,249 3,181Certain Glycol Ethers 17 917 40 1,555 18,890 98,967 120,369 7,0811,1,1-Trichloroethane[O] 17 5 860 107,270 11,073 12,473 131,681 7,746N-butyl Alcohol 16 0 . 12,488 20,738 63,295 96,521 6,033Aluminum (Fume or Dust)[M] 15 0 2,615 6,332 103,142 . 112,089 7,473Barium[M] 15 505 13,332 46,991 31,316 . 92,144 6,143Nitric Acid 15 500 7,345 127,388 314,010 . 449,243 29,950Copper Compounds[M] 13 255 17,385 1,308,584 1,450 750 1,328,424 102,186Trichloroethylene[C] 11 0 . 96,059 11,611 10,861 118,531 10,776Benzene[C] 10 0 . . 609 13,588 14,197 1,4201,2,4-trimethylbenzene 10 0 . 350 11,721 9,293 21,364 2,136Zinc (Fume or Dust)[M] 10 1,539 73,366 224,598 3,010,158 . 3,309,661 330,966Chlorine 10 7,300 . . . . 7,300 730Cobalt Compounds[C, M] 9 277 33,907 41,273 2,688 . 78,145 8,683Diisocyanates 9 0 . 3,450 20,519 500 24,469 2,719Cadmium Compounds[C, M] 8 274 71,555 973 4,530 . 77,332 9,667Naphthalene 8 5 1,500 . 18,673 5,966 26,144 3,268Di(2-ethylhexyl) Phthalate[C] 8 256 5 2,400 9,300 . 11,961 1,495Cyclohexane 7 0 . 230 8,427 17,427 26,084 3,726Chloroform[C] 6 0 . . 8,955 36,992 45,947 7,658Dibutyl Phthalate 6 0 1,402 . 15,023 4,726 21,151 3,525N-hexane 6 0 . 25 19,103 14,809 33,937 5,656Cobalt[C, M] 6 5 270 79,474 8,041 . 87,790 14,632Nitrate Compounds 5 1,874,818 . 3 2 . 1,874,823 374,965Methyl Methacrylate 5 0 . . . 1,148 1,148 2302-ethoxyethanol 5 1,055 . 1,715 18,778 70,914 92,462 18,492Diethanolamine 5 312 . . . 269 581 116Triethylamine 5 8,700 . . . . 8,700 1,740Aluminum Oxide (Fibrous Forms)[M] 5 500 22,234 . . . 22,734 4,547Arsenic Compounds[C, M] 4 21 189,837 1,984 1 . 191,843 47,961N,N-dimethylformamide[C] 4 250 . 250 978 8,845 10,323 2,581Cumene 4 0 . . 1,444 477 1,921 480Chlorobenzene 4 0 . . 2,245 6,953 9,198 2,300Pyridine 4 0 . . 15,950 11,476 27,426 6,857Decabromodiphenyl Oxide 4 0 250 . 2,350 4,390 6,990 1,748Cresol (Mixed Isomers) 4 0 675 . 6,914 7,570 15,159 3,790

Sector Notebook Data Refresh - 1997 Stone, Clay, Glass and Concrete
1995 TRI Transfers for Stone,Clay, Glass and Concrete Facilities (SIC 32)by Number of Facilities Reporting (pounds/year)*
Chemical Name Chemical Transfers Transfers Transfers Transfers Recovery Transfers Per Facility# Reporting Potw Disposal Recycling Treatment Energy Total Avg Transfer
Sector Notebook Project May 1998N-6
Antimony[M] 4 0 . 975 . . 975 244Carbon Tetrachloride[C, O] 3 0 . . 2,800 7,223 10,023 3,341Tert-butyl Alcohol 3 0 . 2,000 1,444 727 4,171 1,390Phenanthrene 3 0 . . . . 0 0Phthalic Anhydride 3 0 . 250 . 1,000 1,250 417Nitrobenzene 3 0 . . 10,000 9,443 19,443 6,4811,4-Dichlorobenzene[C] 3 0 . . . 6,333 6,333 2,1111,2-Dichloroethane[C] 3 0 . . 777 6,600 7,377 2,459Carbonyl Sulfide 3 0 . . . . 0 0Asbestos (Friable)[C] 3 2 274,300 . . . 274,302 91,434Creosote[C] 3 0 250 . . . 250 83Toluene Diisocyanate (Mixed Isomers)[C] 3 0 . . . . 0 0Cyanide Compounds 2 250 250 . 13,000 . 13,500 6,750Polycyclic Aromatic Compounds[C] 2 0 250 . . . 250 125Selenium Compounds[M] 2 3 79 77 7,793 14 7,966 3,983Formic Acid 2 0 . . . . 0 0Isopropyl Alcohol (Manufacturing, 2 0 . . 178 5,400 5,578 2,789Sec-butyl Alcohol 2 0 . . 1,400 . 1,400 700O-xylene 2 0 . 250 493 1,925 2,668 1,3341,2-Dichlorobenzene 2 0 . . . . 0 0Acetophenone 2 0 . . . 10 10 5P-cresol 2 0 . . . . 0 0Vinyl Acetate[C] 2 0 . . . 5,893 5,893 2,947Maleic Anhydride 2 0 38 . 500 . 538 269M-xylene 2 0 . 250 . 1,000 1,250 625Anthracene 2 0 . . . . 0 0Dimethyl Phthalate 2 0 . . . . 0 0Molybdenum Trioxide 2 0 68,896 . . . 68,896 34,448Dichlorobenzene (Mixed Isomers)[C] 2 0 . . 2,984 5,175 8,159 4,080Polychlorinated Alkanes 1 9,892 . . . . 9,892 9,892Silver Compounds[M] 1 0 . 42,600 . . 42,600 42,600Vinyl Chloride[C] 1 0 . . . 6,333 6,333 6,333Acetonitrile 1 0 . . . . 0 0Carbon Disulfide 1 0 . . . 10 10 10Chlorodifluoromethane[O] 1 0 . . . 10 10 10Trichlorofluoromethane[O] 1 0 . . 8,673 2,866 11,539 11,539Dichlorodifluoromethane[O] 1 0 . . 1,304 . 1,304 1,304Freon 113[O] 1 0 . . . 10 10 10Dicyclopentadiene 1 0 . . . . 0 01,1,2-trichloroethane 1 0 . . 2,500 800 3,300 3,300Acrylamide[C] 1 0 . . . . 0 0Acrylic Acid 1 0 . . . 2,800 2,800 2,8001,1,2,2-tetrachloroethane 1 0 . . 2,800 880 3,680 3,6802-Nitropropane[C] 1 0 . . . 255 255 2554,4'-isopropylidenediphenol 1 0 . . . . 0 02-phenylphenol 1 745 . . . . 745 745Biphenyl 1 0 . . . . 0 0Methyl Acrylate 1 0 . . . 295 295 2954,4'-methylenedianiline[C] 1 0 . . 18,000 . 18,000 18,0002,4-Dimethylphenol 1 0 . . 980 5,133 6,113 6,113P-xylene 1 0 . 250 . 500 750 7501,3-butadiene[C] 1 0 . . . . 0 0Acrolein 1 0 . . 258 . 258 258Allyl Chloride 1 0 . . . . 0 0Propargyl Alcohol 1 0 . . 746 3,633 4,379 4,379M-cresol 1 0 . . . . 0 02-methoxyethanol 1 0 . . . . 0 0Propylene 1 0 . . . . 0 01,4-Dioxane[C] 1 0 . . . . 0 0Dibenzofuran 1 0 . . . . 0 0Ethyl Acrylate[C] 1 0 . . . 295 295 295Butyl Acrylate 1 0 . . . . 0 0Calcium Cyanamide 1 0 . . . . 0 02,2-dichloro-1,1,1-trifluoroethane[O] 1 0 . . 1,196 . 1,196 1,196

Sector Notebook Data Refresh - 1997 Stone, Clay, Glass and Concrete
1995 TRI Transfers for Stone,Clay, Glass and Concrete Facilities (SIC 32)by Number of Facilities Reporting (pounds/year)*
Chemical Name Chemical Transfers Transfers Transfers Transfers Recovery Transfers Per Facility# Reporting Potw Disposal Recycling Treatment Energy Total Avg Transfer
Sector Notebook Project May 1998N-7
Lithium Carbonate 1 0 76 . . . 76 76Polychlorinated Biphenyls[C] 1 0 . . 27,271 . 27,271 27,271Methyl Tert-butyl Ether 1 0 . . . . 0 01,1-dichloro-1-fluoroethane[O] 1 0 2,915 . . . 2,915 2,915Fluometuron 1 0 . . . . 0 0Arsenic[C, M] 1 0 . . . 2,650 2,650 2,650Cadmium[C, M] 1 0 . . . 633 633 633Selenium[M] 1 0 5 4,604 . . 4,609 4,609
_______ _________ _________ _________ _________ _________ __________ _______623** 2,791,014 7,406,060 10,192,428 6,821,220 4,571,567 31,782,539 51,015
[C] Known or suspect carcinogens [M] Metals and metal compounds [O] Ozone depleters* Refer to Section III for a discussion of the TRI data and its limitations, methodology used to obtain this data,definitions of the column headings, and the definitions of carcinogens, metals, and ozone depleters.**Total number of facilities (not chemical reports) reporting to TRI in this industry sector.

Sector Notebook Data Refresh - 1997 Stone, Clay, Glass and Concrete
Being included on this list does not mean that the release is associated with non-compliance with environmental laws.1
Sector Notebook Project May 1998N-8
Ten Largest Volume TRI Releasing Stone, Clay, Glass and Concrete Facilities ReportingOnly SIC 32*
Rank Facility Total TRI Releases in Pounds1
1 Owens-Corning, Newark, Ohio 1,894,747
2 Corning Inc., Canton, New York 1,198,250
3 Owens Corning, Aiken, South Carolina 634,250
4 Owens Corning, Amarillo, Texas 603,380
5 Certainteed Corp., Mountain Top, Pennsylvania 587,062
6 Schuller Intl. Inc., Winder, Georgia 583,048
7 Schuller Intl. Inc., Defiance, Ohio 560,334
8 Owens-corning, Waxahachie, Texas 532,661
9 Schuller Intl. Inc., Mc Pherson, Kansas 495,305
10 Owens-Corning, Fairburn, Georgia 484,752
Source: US EPA 1995 Toxics Release Inventory Database.*Refer to Section III for a general discussion of TRI data and its limitations. A discussion of the methodology used todevelop this table can be found under the heading Ten Largest Volume TRI Releasing Facilities.
Ten Largest Volume TRI Releasing Facilities Reporting Only SIC 32 or SIC 32 and Other SIC Codes*
Rank Facility SIC Codes Reported in TRI Pounds1
Total TRIReleases in
1 Lafarge Corp., Alpena, Michigan 3241, 4953 2,676,262
2 Owens-Corning, Newark, Ohio 3296 1,894,747
3 Corning Inc., Canton, New York 3229 1,198,250
4 Harman Automotive Inc., Bolivar, Tennessee 3714, 3231 1,100,391
5 3M, White City, Oregon 3861, 3291, 2672 751,400
6 Owens Corning, Aiken, South Carolina 3229 634,250
7 Owens Corning, Amarillo, Texas 3229 603,380
8 Osram Sylvania Inc., Towanda, Pennsylvania 3339, 3341, 2819, 2816, 3496, 593,6563297
9 Ferodo America, Smithville, Tenessee 3292, 3714 591,085
10 Engelhard Corp., Savannah, Georgia 3295, 2819 588,841
Source: US EPA Toxics Release Inventory Database, 1995.*Refer to Section III for a general discussion of TRI data and its limitations. A discussion of the methodology used todevelop this table can be found under the heading Ten Largest Volume TRI Releasing Facilities.

Sector Notebook Data Refresh - 1997 Stone, Clay, Glass and Concrete
Sector Notebook Project May 1998N-9
Source Reduction and Recycling Activity for Stone,Clay,Glass and Concrete Products Facilities(SIC 32) as Reported within TRI*
A B C JOn-Site Off-Site
Year (10 lbs.) Transferred Off-siteRecycled Recovery % Treated Recycled Recovery % Treated
Quantity of %Production- Released
Related % Released andWaste and Disposed% % Energy % % Energy
6 a b
c
D E F G H I
1994 1,018 6% 11% 68% 16% 1% 1% 0% 4%
1995 988 8% 15% 62% 15% 1% 0% 1% 6%
1996 1,012 --- 15% 61% 16% 1% 0% 1% 5%
1997 1,054 --- 15% 63% 15% 1% 0% 1% 5%
Source: 1995 Toxics Release Inventory Database. * Refer to Section III for a general discussion of TRI data and its limitations. A discussion of the methodology used todevelop this table can be found under the heading Source Reduction and Recycling Activity. Within this industry sector, non-production related waste < 1% of production related wastes for 1995.a
Total TRI transfers and releases as reported in Section 5 and 6 of Form R as a percentage of production related wastes.b
Percentage of production related waste released to the environment and transferred off-site for disposal.c

Sector Notebook Data Refresh - 1997 Stone, Clay, Glass and Concrete
Sector Notebook Project May 1998N-10
Five-Year Enforcement and Compliance Summary for the Stone, Clay, Glass and ConcreteIndustry*
A B C D E F G H I JRegion Facilities Facilities Number of Average Facilities with Total Percent Percent Enforcement
in Search Inspected Inspections Months 1 or More Enforcement State Federal to InspectionBetween Enforcement Actions Lead Lead Rate
Inspections Actions Actions Actions
I 14 9 23 37 2 5 40% 60% 0.22
II 40 26 350 7 11 35 94% 6% 0.10
III 83 59 661 8 18 64 92% 8% 0.10
IV 136 100 889 9 25 57 70% 30% 0.06
V 151 88 749 12 12 36 50% 50% 0.05
VI 76 42 243 19 6 15 87% 13% 0.06
VII 33 25 288 7 13 33 39% 61% 0.11
VIII 22 13 76 17 4 5 100% 0% 0.07
IX 47 21 164 17 6 27 96% 4% 0.16
X 13 5 31 25 0 0 0% 0% --
TOTAL 615 388 3,474 11 97 277 75% 25% 0.08
*Data obtained from EPA’s Integrated Data for Enforcement Analysis (IDEA) System. For a description of IDEA andthe methods used to obtain this data, refer to Section II.C. A discussion of this table can be found under the heading,Five-Year Enforcement and Compliance Summary, in Section III.

Sector Notebook Data Refresh - 1997 Iron and Steel
Sector Notebook Project May 1998O-1
Iron and Steel

Sector Notebook Data Refresh - 1997 Iron and Steel
Sector Notebook Project May 1998O-2
1995 TRI Releases for Iron and Steel Facilities (SIC 331)by Number of Facilities Reporting (pounds/year)*
Chemical Name Chemical Air Air Discharges Injection Disposal Releases Per Facility# Reporting Fugitive Point Water Underground Land Total Avg. Releases
Zinc Compounds[M] 124 815,939 1,040,835 234,021 250 20,582,148 22,673,193 182,848Chromium Compounds[C, M] 122 46,814 196,927 37,954 0 2,233,111 2,514,806 20,613Manganese Compounds[M] 119 374,353 1,803,613 392,851 3,000 27,900,531 30,474,348 256,087Chromium[M] 119 25,381 55,931 6,666 0 508,968 596,946 5,016Nickel[C, M] 104 20,036 68,611 7,523 0 156,482 252,652 2,429Manganese[M] 101 36,050 40,086 11,814 0 790,523 878,473 8,698Nickel Compounds[C, M] 91 10,117 25,156 17,457 0 262,937 315,667 3,469Hydrochloric Acid (1995 and after "Acid 90 481,418 1,656,840 5 0 5 2,138,268 23,759Aerosols" Only)Nitric Acid 72 34,536 512,142 32 0 29,000 575,710 7,996Lead Compounds[C, M] 69 70,337 180,618 26,175 0 1,207,312 1,484,442 21,514Lead[C, M] 64 17,378 50,723 3,593 0 89,000 160,694 2,511Copper[M] 60 4,663 5,655 5,797 0 53,800 69,915 1,165Ammonia 60 8,596,982 1,276,314 818,748 0 152,984 10,845,028 180,750Phosphoric Acid 55 27,127 8,502 3,105 0 82,433 121,167 2,203Copper Compounds[M] 54 19,465 259,792 12,867 0 334,654 626,778 11,607Sulfuric Acid 52 204,099 104,260 0 0 0 308,359 5,930Hydrogen Fluoride 45 82,447 424,848 29 0 14,000 521,324 11,585Zinc (Fume or Dust)[M] 39 246,418 199,446 7,304 0 2,100 455,268 11,674Toluene 32 205,742 367,514 670 0 712 574,638 17,957Xylene (Mixed Isomers) 30 141,018 226,862 1,805 0 7 369,692 12,323Ethylene 25 322,401 1,118,097 0 0 0 1,440,498 57,620Molybdenum Trioxide 25 9,454 4,092 8,322 0 23,748 45,616 1,825Benzene[C] 24 379,176 322,248 3,138 0 557 705,119 29,380Naphthalene 24 250,536 12,088 1,883 0 403 264,910 11,038Aluminum (Fume or Dust)[M] 24 18,093 33,639 18,308 0 2,094 72,134 3,006Cyanide Compounds 23 130,941 151,159 61,124 0 13,527 356,751 15,511Barium Compounds[M] 18 1,206 1,459 11,030 0 49,094 62,789 3,488Trichloroethylene[C] 18 784,808 575,836 260 0 0 1,360,904 75,606Ethylene Glycol 17 30,968 255 103,463 0 4,401 139,087 8,182Phenol 17 674,060 12,136 20,018 0 6,555 712,769 41,928Chlorine 17 16,169 21,024 1,190 190 0 38,573 2,269Polycyclic Aromatic Compounds[C] 16 4,085 642 43 0 2 4,772 298Cobalt[C, M] 15 2,177 2,102 326 0 9,967 14,572 971Methanol 13 524,568 5,958 0 0 111 530,637 40,818Propylene 13 21,511 105,650 0 0 0 127,161 9,782Anthracene 13 10,364 42,786 505 0 0 53,655 4,127Nitrate Compounds 12 0 0 5,706,855 0 48,000 5,754,855 479,5711,1,1-Trichloroethane[O] 12 291,754 142,510 0 0 0 434,264 36,189Ethylbenzene 11 6,706 3,425 750 0 0 10,881 989Dibenzofuran 11 2,230 27 5 0 0 2,262 206Cadmium Compounds[C, M] 10 679 517 4 0 0 1,200 120Styrene[C] 10 2,533 150 0 0 0 2,683 268Certain Glycol Ethers 9 105,031 302,153 18,000 0 0 425,184 47,243Methyl Ethyl Ketone 9 523,394 264,237 0 0 0 787,631 87,515Antimony Compounds[M] 7 606 2,217 6,197 0 3,671 12,691 1,8131,2,4-trimethylbenzene 7 26,678 11,521 0 0 1 38,200 5,457Sodium Nitrite 7 16,960 250 45,400 0 0 62,610 8,944Biphenyl 6 540 0 0 0 0 540 90Cresol (Mixed Isomers) 6 2,831 597 10 0 0 3,438 573Dichloromethane[C] 5 276,496 424,193 0 0 0 700,689 140,138Vanadium (Fume or Dust)[M] 5 355 2,924 0 0 30,632 33,911 6,782Hydrogen Cyanide 4 2,055 430 0 0 0 2,485 621Sec-butyl Alcohol 4 18,187 62,503 0 0 0 80,690 20,173Quinoline 4 280 0 0 0 0 280 70Tetrachloroethylene[C] 4 134,305 65,866 0 0 0 200,171 50,043Cadmium[C, M] 4 8 250 0 0 170 428 107Cobalt Compounds[C, M] 3 75 388 9 0 2,250 2,722 907N-butyl Alcohol 3 2,657 55,179 0 0 0 57,836 19,279Carbon Disulfide 3 2,650 1,410 0 0 0 4,060 1,353Phenanthrene 3 18,000 0 0 0 200 18,200 6,067

Sector Notebook Data Refresh - 1997 Iron and Steel
1995 TRI Releases for Iron and Steel Facilities (SIC 331)by Number of Facilities Reporting (pounds/year)*
Chemical Name Chemical Air Air Discharges Injection Disposal Releases Per Facility# Reporting Fugitive Point Water Underground Land Total Avg. Releases
Sector Notebook Project May 1998O-3
Calcium Cyanamide 3 0 5 0 0 0 5 2Pyridine 2 4,030 0 0 0 0 4,030 2,015Diethanolamine 2 730 0 57,000 0 0 57,730 28,865Barium[M] 2 382 638 3,637 0 77,121 81,778 40,889Arsenic Compounds[C, M] 1 6 3,800 0 0 3,200 7,006 7,006Thiourea[C] 1 250 0 340 0 0 590 590Acetonitrile 1 0 0 0 0 0 0 0Methyl Isobutyl Ketone 1 160 0 0 0 0 160 1602-methylpyridine 1 600 0 0 0 0 600 600N-methyl-2-pyrrolidone 1 0 7,913 0 0 0 7,913 7,913Asbestos (Friable)[C] 1 0 0 0 0 0 0 0Polychlorinated Biphenyls[C] 1 0 0 0 0 0 0 0Aluminum Oxide (Fibrous Forms)[M] 1 250 0 0 0 0 250 250Antimony[M] 1 20 616 425 0 1,500 2,561 2,561Arsenic[C, M] 1 40 40 0 0 0 80 80Beryllium[C, M] 1 2 1 0 0 940 943 943Phosphorus (Yellow or White) 1 5 15 0 0 3,900 3,920 3,920Chlorine Dioxide 1 5 0 5 0 0 10 10
________ _________ _________ ________ _____ _________ __________ ________423** 16,082,327 12,267,621 7,656,663 3,440 54,682,751 90,692,802 214,404
[C] Known or suspect carcinogens [M] Metals and metal compounds [O] Ozone depleters* Refer to Section III for a discussion of the TRI data and its limitations, methodology used to obtain this data, definitions of the column headings, and the definitions of carcinogens, metals, and ozone depleters.**Total number of facilities (not chemical reports) reporting to TRI in this industry sector.

Sector Notebook Data Refresh - 1997 Iron and Steel
Sector Notebook Project May 1998O-4
1995 TRI Transfers for Iron and Steel Facilities (SIC 331)by Number of Facilities Reporting (pounds/year)*
Chemical Name Chemical Transfers Transfers Transfers Transfers Transfers Transfers Per Facility# Reporting Potw Disposal Recycling Treatment Recovery Total Avg Transfer
Energy
Zinc Compounds[M] 124 22,768 45,043,648 161,076,355 1,947,577 . 208,090,348 1,678,148Chromium Compounds[C, M] 122 2,844 5,264,939 12,648,224 1,711,870 4,593 19,665,420 161,192Manganese Compounds[M] 119 8,836 5,013,032 35,123,503 1,520,361 . 42,185,802 354,503Chromium[M] 119 3,597 1,111,505 26,689,081 1,887,120 0 29,691,303 249,507Nickel[C, M] 104 3,610 600,523 14,674,853 58,207 . 15,337,193 147,473Manganese[M] 101 3,340 1,268,224 17,562,708 1,061,194 . 19,896,216 196,992Nickel Compounds[C, M] 91 3,514 2,618,530 4,637,685 157,595 . 7,417,324 81,509Hydrochloric Acid (1995 and after "Acid 90 1,358,466 2,397,609 20,556,576 2,918,806 . 27,231,457 302,572Aerosols" Only)Nitric Acid 72 561 3,936,995 11,608 5,389,291 . 9,338,455 129,701Lead Compounds[C, M] 69 2,005 1,746,567 19,811,212 228,350 . 23,045,894 333,998Lead[C, M] 64 1,913 326,517 7,319,609 1,074,945 . 8,722,989 136,297Copper[M] 60 1,494 132,762 2,885,947 116,973 . 3,137,176 52,286Ammonia 60 153,290 286,013 17,600 34,505 2,400 493,808 8,230Phosphoric Acid 55 29,335 69,240 138,584 64,424 . 301,583 5,483Copper Compounds[M] 54 4,080 823,011 1,298,746 142,009 . 2,267,846 41,997Sulfuric Acid 52 1,760 559,017 649,631 3,357,561 . 4,728,252 90,928Hydrogen Fluoride 45 5,854 965,246 7,452 1,185,884 . 2,164,436 48,099Zinc (Fume or Dust)[M] 39 3,017 810,586 66,851,862 5,411,809 5,594 73,082,868 1,873,920Toluene 32 373 507 324 1,041 23,007 25,252 789Xylene (Mixed Isomers) 30 312 470 9,112 8,506 11,787 30,187 1,006Ethylene 25 0 . . 2,100,000 . 2,100,000 84,000Molybdenum Trioxide 25 805 4,724 170,785 2,200 . 178,514 7,141Benzene[C] 24 1,251 961 8 3,304 1,400 6,924 289Naphthalene 24 386 16,880 4 39,478 620 57,368 2,390Aluminum (Fume or Dust)[M] 24 5 81,840 761,149 253,742 1,000 1,097,736 45,739Cyanide Compounds 23 103,053 1,927 . 102,696 . 207,676 9,029Barium Compounds[M] 18 0 356,518 23,564 1,350 . 381,432 21,191Trichloroethylene[C] 18 2 10,343 302,113 37,934 13,110 363,502 20,195Ethylene Glycol 17 1,850 9,455 371,538 46,690 4,800 434,333 25,549Phenol 17 506,661 4,948 1 81,070 . 592,680 34,864Chlorine 17 1,905 . 183,693 . . 185,598 10,918Polycyclic Aromatic Compounds[C] 16 0 2,900 8,400,000 268 . 8,403,168 525,198Cobalt[C, M] 15 10 43,355 882,284 10 . 925,659 61,711Methanol 13 0 . 55 . . 55 4Propylene 13 0 . . 21,000 . 21,000 1,615Anthracene 13 0 1,500 . 26 . 1,526 117Nitrate Compounds 12 1,105,156 18,953 . 171,000 . 1,295,109 107,9261,1,1-Trichloroethane[O] 12 1,871 . 104,674 . 8,072 114,617 9,551Ethylbenzene 11 2 297 220 51 1,200 1,770 161Dibenzofuran 11 0 1,100 . 40 . 1,140 104Cadmium Compounds[C, M] 10 5 2,152 281,182 3,361 . 328,625 32,863Styrene[C] 10 0 44 . 4 . 48 5Certain Glycol Ethers 9 0 1,790 . 2,500 250 4,540 504Methyl Ethyl Ketone 9 9 . 115,458 4,051 26,534 146,052 16,228Antimony Compounds[M] 7 0 15,365 1 250 . 15,616 2,2311,2,4-trimethylbenzene 7 0 83 . . 7,822 7,905 1,129Sodium Nitrite 7 0 148 53 . . 201 29Biphenyl 6 0 194 . 19 . 213 36Cresol (Mixed Isomers) 6 5 . . 22 . 27 5Dichloromethane[C] 5 0 . 1,897 . 30,096 31,993 6,399Vanadium (Fume or Dust)[M] 5 0 5 2,466 . . 2,471 494Hydrogen Cyanide 4 0 . . . . 0 0Sec-butyl Alcohol 4 0 500 . . 750 1,250 313Quinoline 4 0 165 . 8 . 173 43Tetrachloroethylene[C] 4 0 . 38,339 . 6,160 44,499 11,125Cadmium[C, M] 4 5 5,315 2,526 3,000 . 10,846 2,712Cobalt Compounds[C, M] 3 0 4 57 1,390 . 1,451 484N-butyl Alcohol 3 0 . . . 3,015 3,015 1,005Carbon Disulfide 3 0 . . . . 0 0

Sector Notebook Data Refresh - 1997 Iron and Steel
1995 TRI Transfers for Iron and Steel Facilities (SIC 331)by Number of Facilities Reporting (pounds/year)*
Chemical Name Chemical Transfers Transfers Transfers Transfers Transfers Transfers Per Facility# Reporting Potw Disposal Recycling Treatment Recovery Total Avg Transfer
Energy
Sector Notebook Project May 1998O-5
Phenanthrene 3 0 . . 56 . 56 19Calcium Cyanamide 3 0 . . . . 0 0Pyridine 2 0 . . . . 0 0Diethanolamine 2 0 . . . . 0 0Barium[M] 2 0 . . . . 0 0Arsenic Compounds[C, M] 1 0 . 9 1 . 10 10Thiourea[C] 1 0 . . . . 0 0Acetonitrile 1 0 . . . . 0 0Methyl Isobutyl Ketone 1 0 . . . . 0 02-methylpyridine 1 0 . . . . 0 0N-methyl-2-pyrrolidone 1 0 . . 4,074 . 4,074 4,074Asbestos (Friable)[C] 1 0 25,100 . . . 25,100 25,100Polychlorinated Biphenyls[C] 1 0 8,238 . 33,313 . 41,551 41,551Aluminum Oxide (Fibrous Forms)[M] 1 0 . . 52,369 . 52,369 52,369Antimony[M] 1 0 . . . . 0 0Arsenic[C, M] 1 0 . . . . 0 0Beryllium[C, M] 1 0 . . . . 0 0Phosphorus (Yellow or White) 1 0 . . . . 0 0Chlorine Dioxide 1 0 . . . . 0 0
_______ _________ _________ __________ __________ _______ __________ ________423** 3,333,950 73,589,745 403,612,748 31,243,305 152,210 513,945,701 1,215,002
[C] Known or suspect carcinogens [M] Metals and metal compounds [O] Ozone depleters* Refer to Section III for a discussion of the TRI data and its limitations, methodology used to obtain this data, definitions of the column headings, and the definitions of carcinogens, metals, and ozone depleters.**Total number of facilities (not chemical reports) reporting to TRI in this industry sector.

Sector Notebook Data Refresh - 1997 Iron and Steel
Being included on this list does not mean that the release is associated with non-compliance with environmental laws.1
Sector Notebook Project May 1998O-6
Ten Largest Volume TRI Releasing Iron and Steel Facilities ReportingOnly SIC 331*
Rank Facility Total TRI Releases in Pounds1
1 Northwestern Steel & Wire Co., Sterling, Illinois 15,759,052
2 Elkem Metals Co., Marietta, Ohio 15,632,648
3 U.S. Steel, Gary, Indiana 11,675,262
4 Granite City Steel, Granite City, Illinois 5,381,750
5 USS Fairfield Works, Fairfield, Alabama 4,070,669
6 Armco Inc., Butler, Pennsylvania 2,886,971
7 LTV Steel Co. Inc., Cleveland, Ohio 2,594,790
8 Wheeling-Pittsburgh Steel Corp, Follansbee, Wyoming 1,718,575
9 J & L Specialty Steel Inc., Louisville, Ohio 1,420,979
10 Gulf States Steel Inc., Gadsen, Alabama 1,325,385
Source: US EPA 1995 Toxics Release Inventory Database.*Refer to Section III for a general discussion of TRI data and its limitations. A discussion of the methodology used to develop this table can be found under the heading Ten Largest Volume TRI Releasing Facilities.
Ten Largest Volume TRI Releasing Facilities Reporting SIC 331 and Other SICCodes*
Rank Facility TRI Pounds1SIC Codes Reported in Releases in
Total TRI
1 Northwestern Steel & Wire Co., Sterling, IL 3312, 3315 15,759,052
2 Elkem Metals Co., Marietta, OH 3313 15,632,648
3 U.S. Steel, Gary, IN 3312 11,675,262
4 Granite City Steel, Granite City, IL 3,312 5,381,750
5 Kerr-McGee Chemical Corp., Hamilton, MS 2819, 3313 4,279,236
6 USS Fairfield Works, Fairfield, AL 3312 4,070,669
7 Armco Inc., Butler, PA 3312 2,886,971
8 LTV Steel Co. Inc., Cleveland, OH 3312, 3313, 3316 2,594,790
9 Wheeling-Pittsburgh Steel Corp, Follansbee, WV 3312 1,718,575
10 J & L Specialty Steel Inc., Louisville, OH 3312 1,420,979
Source: US EPA Toxics Release Inventory Database, 1995.*Refer to Section III for a general discussion of TRI data and its limitations. A discussion of the methodology used to develop this table can be found under the heading Ten Largest Volume TRI Releasing Facilities.

Sector Notebook Data Refresh - 1997 Iron and Steel
Sector Notebook Project May 1998O-7
Source Reduction and Recycling Activity for Iron and Steel Facilities (SIC 331)as Reported within TRI*
A B C JOn-Site Off-Site
Year (10 lbs.) Transferred Recycled Recovery % Treated Recycled Recovery % Treated
Quantity ofProduction-
Related % ReleasedWaste and % % Energy % % Energy
6 a b
%Released
andDisposedc
Off-site
D E F G H I
1994 1,188 19% 33% 0% 18% 34% 0% 4% 12%
1995 1,239 49% 32% 0% 15% 35% 0% 6% 18%
1996 1,274 --- 32% 0% 15% 36% 0% 5% 12%
1997 1,317 --- 31% 0% 16% 35% 0% 6% 12%
Source: 1995 Toxics Release Inventory Database. * Refer to Section III for a general discussion of TRI data and its limitations. A discussion of the methodology used todevelop this table can be found under the heading Source Reduction and Recycling Activity. Within this industry sector, non-production related waste < 1% of production related wastes for 1995.a
Total TRI transfers and releases as reported in Section 5 and 6 of Form R as a percentage of production related wastes.b
Percentage of production related waste released to the environment and transferred off-site for disposal.c
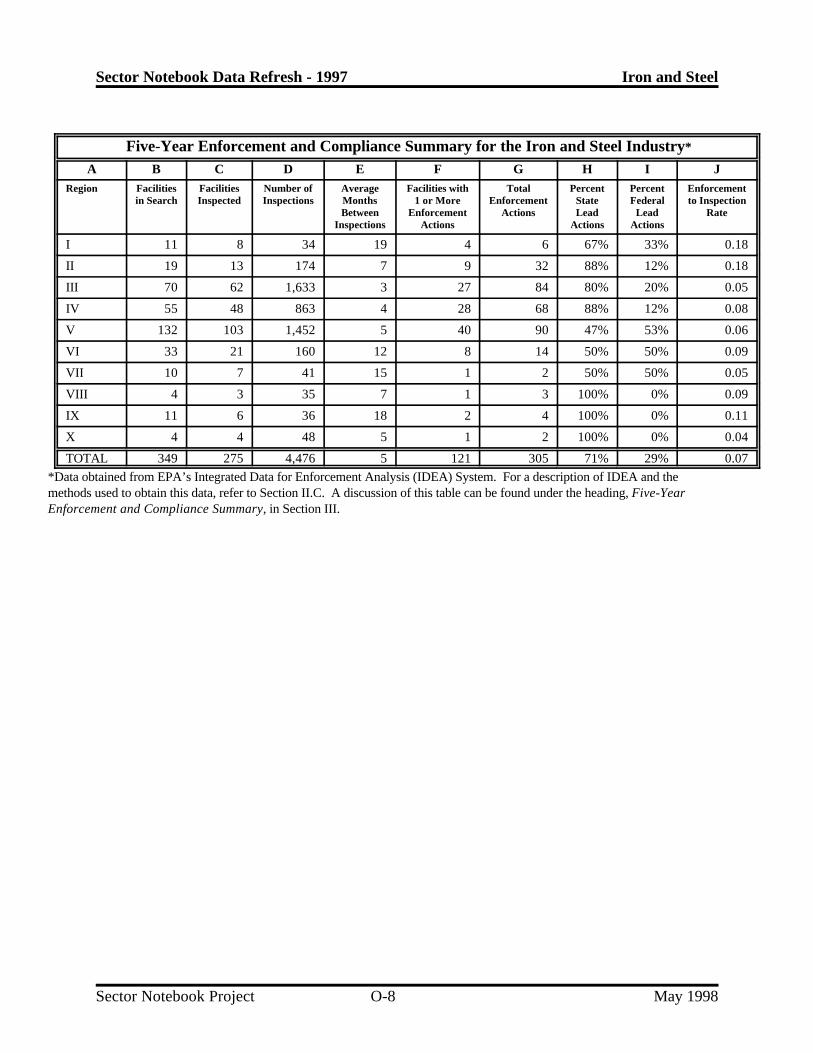
Sector Notebook Data Refresh - 1997 Iron and Steel
Sector Notebook Project May 1998O-8
Five-Year Enforcement and Compliance Summary for the Iron and Steel Industry*
A B C D E F G H I JRegion Facilities Facilities Number of Average Facilities with Total Percent Percent Enforcement
in Search Inspected Inspections Months 1 or More Enforcement State Federal to InspectionBetween Enforcement Actions Lead Lead Rate
Inspections Actions Actions Actions
I 11 8 34 19 4 6 67% 33% 0.18
II 19 13 174 7 9 32 88% 12% 0.18
III 70 62 1,633 3 27 84 80% 20% 0.05
IV 55 48 863 4 28 68 88% 12% 0.08
V 132 103 1,452 5 40 90 47% 53% 0.06
VI 33 21 160 12 8 14 50% 50% 0.09
VII 10 7 41 15 1 2 50% 50% 0.05
VIII 4 3 35 7 1 3 100% 0% 0.09
IX 11 6 36 18 2 4 100% 0% 0.11
X 4 4 48 5 1 2 100% 0% 0.04
TOTAL 349 275 4,476 5 121 305 71% 29% 0.07
*Data obtained from EPA’s Integrated Data for Enforcement Analysis (IDEA) System. For a description of IDEA and themethods used to obtain this data, refer to Section II.C. A discussion of this table can be found under the heading, Five-YearEnforcement and Compliance Summary, in Section III.

Sector Notebook Data Refresh - 1997 Metal Castings
Sector Notebook Project May 1998P-1
Metal Castings

Sector Notebook Data Refresh - 1997 Metal Castings
Sector Notebook Project May 1998P-2
TRI Releases for Foundries (SIC 332, 3365, 3366 and 3369)by Number of Facilities Reporting (pounds/year)*
Chemical Name Chemical Air Air Discharges Injection Disposal Releases Per Facility# Reporting Fugitive Point Water Underground Land Total Avg Releases
Copper[M] 249 78,577 100,548 4,554 0 349,835 533,514 2,143 Nickel[C, M] 182 23,309 31,804 1,471 0 122,406 178,990 983 Chromium[M] 182 47,389 33,191 1,653 0 162,923 245,156 1,347 Manganese[M] 179 163,447 84,164 3,258 0 4,891,621 5,142,490 28,729 Phenol 89 219,560 421,803 4,490 0 53,891 699,744 51,996 Lead[C, M] 76 9,671 24,366 230 0 352,489 386,756 5,089 Diisocyanates 65 12,035 13,152 260 0 9,022 34,469 530 Manganese Compounds[M] 50 37,530 63,037 3,020 0 2,496,212 2,599,799 Chromium Compounds[C, M] 45 41,903 70,489 1,529 0 779,154 893,075 19,846 Copper Compounds[M] 36 14,953 9,020 517 0 65,500 89,990 2,500 Zinc (Fume or Dust)[M] 35 71,228 144,470 2,104 0 1,696,554 1,914,356 54,696 Nickel Compounds[C, M] 32 12,241 7,188 512 0 724 20,665 646 Methanol 32 1,952,231 451,245 7 0 0 2,403,483 75,109 Zinc Compounds[M] 31 40,379 121,541 2,956 0 12,733,217 12,898,093 416,068 Aluminum (Fume or Dust)[M] 31 40,491 186,471 259 0 792,270 1,019,491 32,887 Triethylamine 30 235,144 1,143,297 5 0 5 1,378,451 45,948 Phosphoric Acid 26 157,071 578 10 0 86,093 243,752 9,375 Xylene (Mixed Isomers) 24 568,145 284,447 4 0 0 852,596 35,525 Cobalt[C, M] 24 1,450 1,832 501 0 5 3,788 158 Naphthalene 22 201,461 104,137 263 0 9,481 315,342 14,334 Molybdenum Trioxide 22 2,260 1,755 275 0 2,547 6,837 311 1,2,4-trimethylbenzene 18 188,854 54,393 1 0 32,850 276,098 15,339 Lead Compounds[C, M] 16 5,638 13,160 579 0 221,774 241,151 15,072 Formaldehyde[C] 16 75,414 78,441 245 0 11,436 165,536 10,346 Toluene 13 334,212 179,171 20 0 14 513,417 39,494 Barium[M] 13 34,486 3,691 135 0 141,150 179,462 13,805 Aluminum Oxide (Fibrous Forms)[M] 11 82,060 18,828 250 0 592,750 693,888 63,081 Certain Glycol Ethers 10 119,511 85,824 0 0 0 205,335 20,534 Sulfuric Acid 10 25,739 510 5 0 0 26,254 2,625 Nitric Acid 10 2,685 7,640 0 0 0 10,325 1,033 Ethylene Glycol 9 48,835 14,045 3 0 68,000 130,883 14,543 Hydrochloric Acid (1995 and after "Acid Aerosols" Only) 9 6 1,604 0 0 0 1,610 179 N-methyl-2-pyrrolidone 8 86,624 3,520 5 0 482 90,631 11,329 Ammonia 8 92,708 325,575 3,002 0 0 421,285 52,6611,1,1-Trichloroethane[O] 7 182,997 61,382 0 0 0 244,379 34,911 Barium Compounds[M] 6 23,455 5 201 0 43,465 67,126 11,188 Cumene Hydroperoxide 6 2,000 1,300 0 0 3,400 6,700 1,117 Hydrogen Fluoride 6 1,250 1,130 0 0 0 2,380 397 Benzene[C] 5 3,150 239,000 7 0 36 242,193 48,439 Chlorine 5 8 5 615 0 0 628 126 Cobalt Compounds[C, M] 4 15 505 0 0 0 520 130 N-butyl Alcohol 4 33,272 250 0 0 0 33,522 8,381 4,4'-isopropylidenediphenol 4 750 0 0 0 0 750 188 Antimony[M] 4 260 260 0 0 0 520 130 Dichloromethane[C] 3 110,912 0 0 0 0 110,912 36,971 Methyl Ethyl Ketone 3 39,851 7,820 0 0 0 47,671 15,890 Trichloroethylene[C] 3 30,426 46,996 0 0 0 77,422 25,807 Styrene[C] 3 33,421 75,457 0 0 0 108,878 36,293 Tetrachloroethylene[C] 3 34,450 16,000 0 0 0 50,450 16,817 Cadmium[C, M] 3 5 6 0 0 0 11 4 Nitrate Compounds 2 1,700 0 23,000 0 0 24,700 12,350 Cumene 2 340 150 0 0 0 490 245 Ethylbenzene 2 4,610 18,439 0 0 0 23,049 11,525 Methyl Isobutyl Ketone 2 41,284 6,367 0 0 0 47,651 23,826 Arsenic[C, M] 2 250 250 0 0 0 500 250 Phosphorus (Yellow or White) 2 10 255 750 0 0 1,015 508 Antimony Compounds[M] 1 5 5 0 0 0 10 10 Beryllium Compounds[C, M] 1 0 0 0 0 0 0 0 Urethane[C] 1 0 0 0 0 0 0 0 Hexachloroethane 1 5 250 0 0 0 255 255 Diethanolamine 1 0 0 0 0 0 0 0 Propylene 1 0 0 0 0 0 0 0 Cresol (Mixed Isomers) 1 0 44,000 20 0 0 44,020 44,020 Polychlorinated Biphenyls[C] 1 0 0 0 0 0 0 0 1,1-dichloro-1-fluoroethane[O] 1 49,416 0 0 0 0 49,416 49,416 Selenium[M] 1 0 5 0 0 0 5 5
___ _________ _________ _______ ___ _________ _________ __________554** 5,621,089 4,604,774 56,716 0 25,719,306 36,001,885 55,048
[C] Known or suspect carcinogens [M] Metals and metal compounds [O] Ozone depleters* Refer to Section III for a discussion of the TRI data and its limitations, methodology used to obtain this data, definitions of the column headings, and the definitions of carcinogens, metals, and ozone depleters.**Total number of facilities (not chemical reports) reporting to TRI in this industry sector.
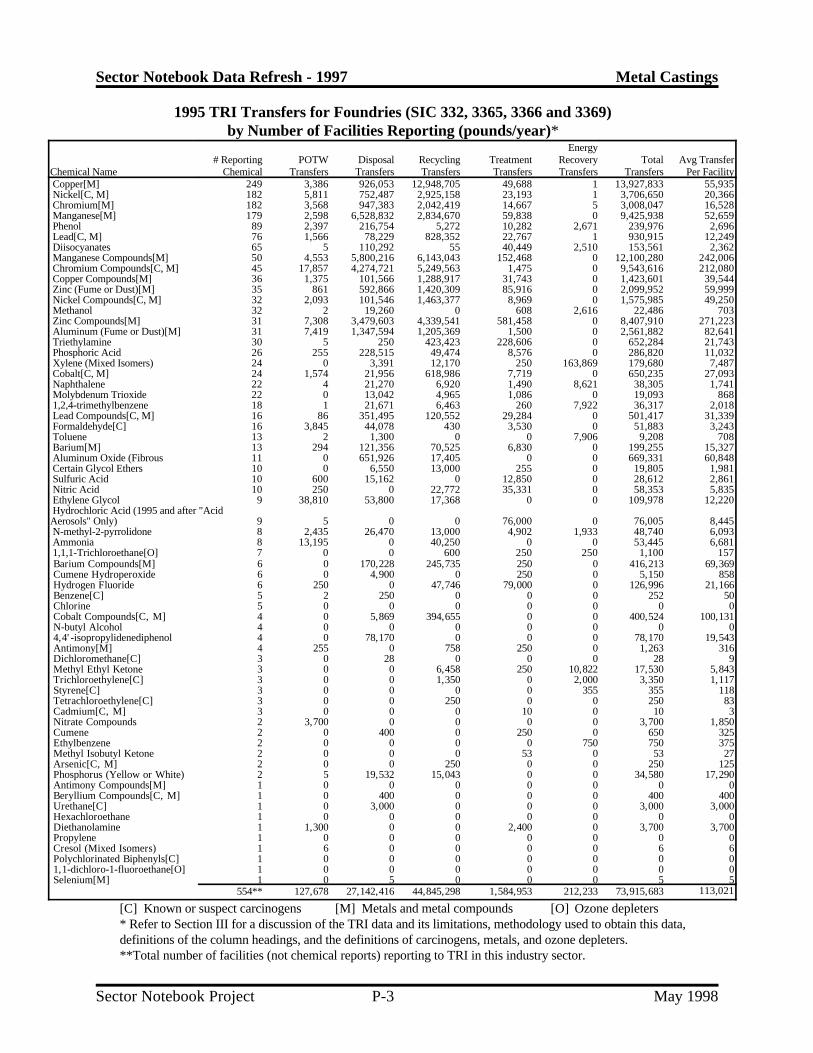
Sector Notebook Data Refresh - 1997 Metal Castings
Sector Notebook Project May 1998P-3
1995 TRI Transfers for Foundries (SIC 332, 3365, 3366 and 3369)by Number of Facilities Reporting (pounds/year)*
Chemical Name Chemical Transfers Transfers Transfers Transfers Transfers Transfers Per Facility# Reporting POTW Disposal Recycling Treatment Recovery Total Avg Transfer
Energy
Copper[M] 249 3,386 926,053 12,948,705 49,688 1 13,927,833 55,935 Nickel[C, M] 182 5,811 752,487 2,925,158 23,193 1 3,706,650 20,366 Chromium[M] 182 3,568 947,383 2,042,419 14,667 5 3,008,047 16,528 Manganese[M] 179 2,598 6,528,832 2,834,670 59,838 0 9,425,938 52,659 Phenol 89 2,397 216,754 5,272 10,282 2,671 239,976 2,696 Lead[C, M] 76 1,566 78,229 828,352 22,767 1 930,915 12,249 Diisocyanates 65 5 110,292 55 40,449 2,510 153,561 2,362 Manganese Compounds[M] 50 4,553 5,800,216 6,143,043 152,468 0 12,100,280 242,006 Chromium Compounds[C, M] 45 17,857 4,274,721 5,249,563 1,475 0 9,543,616 212,080 Copper Compounds[M] 36 1,375 101,566 1,288,917 31,743 0 1,423,601 39,544 Zinc (Fume or Dust)[M] 35 861 592,866 1,420,309 85,916 0 2,099,952 59,999 Nickel Compounds[C, M] 32 2,093 101,546 1,463,377 8,969 0 1,575,985 49,250 Methanol 32 2 19,260 0 608 2,616 22,486 703 Zinc Compounds[M] 31 7,308 3,479,603 4,339,541 581,458 0 8,407,910 271,223 Aluminum (Fume or Dust)[M] 31 7,419 1,347,594 1,205,369 1,500 0 2,561,882 82,641 Triethylamine 30 5 250 423,423 228,606 0 652,284 21,743 Phosphoric Acid 26 255 228,515 49,474 8,576 0 286,820 11,032 Xylene (Mixed Isomers) 24 0 3,391 12,170 250 163,869 179,680 7,487 Cobalt[C, M] 24 1,574 21,956 618,986 7,719 0 650,235 27,093 Naphthalene 22 4 21,270 6,920 1,490 8,621 38,305 1,741 Molybdenum Trioxide 22 0 13,042 4,965 1,086 0 19,093 868 1,2,4-trimethylbenzene 18 1 21,671 6,463 260 7,922 36,317 2,018 Lead Compounds[C, M] 16 86 351,495 120,552 29,284 0 501,417 31,339 Formaldehyde[C] 16 3,845 44,078 430 3,530 0 51,883 3,243 Toluene 13 2 1,300 0 0 7,906 9,208 708 Barium[M] 13 294 121,356 70,525 6,830 0 199,255 15,327 Aluminum Oxide (Fibrous 11 0 651,926 17,405 0 0 669,331 60,848 Certain Glycol Ethers 10 0 6,550 13,000 255 0 19,805 1,981 Sulfuric Acid 10 600 15,162 0 12,850 0 28,612 2,861 Nitric Acid 10 250 0 22,772 35,331 0 58,353 5,835 Ethylene Glycol 9 38,810 53,800 17,368 0 0 109,978 12,220 Hydrochloric Acid (1995 and after "AcidAerosols" Only) 9 5 0 0 76,000 0 76,005 8,445 N-methyl-2-pyrrolidone 8 2,435 26,470 13,000 4,902 1,933 48,740 6,093 Ammonia 8 13,195 0 40,250 0 0 53,445 6,681 1,1,1-Trichloroethane[O] 7 0 0 600 250 250 1,100 157 Barium Compounds[M] 6 0 170,228 245,735 250 0 416,213 69,369 Cumene Hydroperoxide 6 0 4,900 0 250 0 5,150 858 Hydrogen Fluoride 6 250 0 47,746 79,000 0 126,996 21,166 Benzene[C] 5 2 250 0 0 0 252 50 Chlorine 5 0 0 0 0 0 0 0 Cobalt Compounds[C, M] 4 0 5,869 394,655 0 0 400,524 100,131 N-butyl Alcohol 4 0 0 0 0 0 0 0 4,4'-isopropylidenediphenol 4 0 78,170 0 0 0 78,170 19,543 Antimony[M] 4 255 0 758 250 0 1,263 316 Dichloromethane[C] 3 0 28 0 0 0 28 9 Methyl Ethyl Ketone 3 0 0 6,458 250 10,822 17,530 5,843 Trichloroethylene[C] 3 0 0 1,350 0 2,000 3,350 1,117 Styrene[C] 3 0 0 0 0 355 355 118 Tetrachloroethylene[C] 3 0 0 250 0 0 250 83 Cadmium[C, M] 3 0 0 0 10 0 10 3 Nitrate Compounds 2 3,700 0 0 0 0 3,700 1,850 Cumene 2 0 400 0 250 0 650 325 Ethylbenzene 2 0 0 0 0 750 750 375 Methyl Isobutyl Ketone 2 0 0 0 53 0 53 27 Arsenic[C, M] 2 0 0 250 0 0 250 125 Phosphorus (Yellow or White) 2 5 19,532 15,043 0 0 34,580 17,290 Antimony Compounds[M] 1 0 0 0 0 0 0 0 Beryllium Compounds[C, M] 1 0 400 0 0 0 400 400 Urethane[C] 1 0 3,000 0 0 0 3,000 3,000 Hexachloroethane 1 0 0 0 0 0 0 0 Diethanolamine 1 1,300 0 0 2,400 0 3,700 3,700 Propylene 1 0 0 0 0 0 0 0 Cresol (Mixed Isomers) 1 6 0 0 0 0 6 6 Polychlorinated Biphenyls[C] 1 0 0 0 0 0 0 0 1,1-dichloro-1-fluoroethane[O] 1 0 0 0 0 0 0 0 Selenium[M] 1 0 5 0 0 0 5 5
554** 127,678 27,142,416 44,845,298 1,584,953 212,233 73,915,683 113,021
[C] Known or suspect carcinogens [M] Metals and metal compounds [O] Ozone depleters* Refer to Section III for a discussion of the TRI data and its limitations, methodology used to obtain this data, definitions of the column headings, and the definitions of carcinogens, metals, and ozone depleters.**Total number of facilities (not chemical reports) reporting to TRI in this industry sector.

Sector Notebook Data Refresh - 1997 Metal Castings
Sector Notebook Project May 1998P-4
1995 TRI Releases for Die Casting Facilities (SIC 3363 and 3364)by Number of Facilities Reporting (pounds/year)*
Chemical Name Chemical Air Air Discharges Injection Disposal Releases Releases# Reporting Fugitive Point Water Underground Land Total Avg.
Per Facility Copper[M] 79 7,319 17,283 1,006 0 250 25,858 327 Nickel[C, M] 24 835 3,028 0 0 0 3,863 161 Aluminum (Fume or Dust)[M] 21 17,663 257,448 22 0 0 275,133 13,102 Zinc (Fume or Dust)[M] 10 6,747 19,842 0 0 0 26,589 2,659 Lead[C, M] 9 34 59 0 0 0 93 10 Manganese[M] 9 552 824 0 0 0 1,376 153 Zinc Compounds[M] 7 992 6,610 321 0 2,959 10,882 1,555 Chromium[M] 6 39 1,069 5 0 0 1,113 186 Copper Compounds[M] 3 84 1,853 0 0 0 1,937 646 Manganese Compounds[M] 3 0 0 250 0 0 250 83 Trichloroethylene[C] 3 12,689 101,545 0 0 0 114,234 38,078 Nitric Acid 3 250 1,000 0 0 0 1,250 417 Chlorine 3 255 1,705 0 0 0 1,960 653 Certain Glycol Ethers 2 4,800 5,600 0 0 0 10,400 5,200 Ethylene Glycol 2 0 0 0 0 0 0 0 Hydrochloric Acid (1995 and after "Acid Aerosols" Only) 2 500 0 0 0 0 500 250 Sulfuric Acid 2 250 750 0 0 0 1,000 500 Lead Compounds[C, M] 1 0 111 0 0 0 111 111 Nickel Compounds[C, M] 1 12 240 0 0 0 252 252 Hexachloroethane 1 1,146 10,316 0 0 0 11,462 11,462 Styrene[C] 1 1,450 0 0 0 0 1,450 1,450 Propylene 1 0 0 0 0 0 0 0 Triethylamine 1 250 5 0 0 0 255 255 Tetrachloroethylene[C] 1 5,800 23,200 . 0 0 29,000 29,000 Beryllium[C, M] 1 0 0 0 0 5 5 5
___ _________ ________ _______ ___ ______ _______ ______100** 61,667 452,488 1,604 0 3,214 518,973 5,189
[C] Known or suspect carcinogens [M] Metals and metal compounds [O] Ozone depleters*Refer to Section III for a discussion of the column headings, and the definitions of carcinogens, metals, and ozone depleters.**Total number of facilities (not chemical reports) reporting to TRI in this industry sector.

Sector Notebook Data Refresh - 1997 Metal Castings
Sector Notebook Project May 1998P-5
1995 TRI Transfers for Die Casting Facilities (SIC 3363 and 3364)by Number of Facilities Reporting (pounds/year)*
Chemical Name# Reporting POTW Disposal Recycling Treatment Recovery Total Avg Transfer
Chemical Transfers Transfers Transfers Transfers Transfers Transfers Per Facility
Energy
Copper[M] 79 363 34,284 4,683,629 851 . 4,719,127 59,736 Nickel[C, M] 24 45 2,623 166,911 35 . 169,614 7,067 Aluminum (Fume or Dust)[M] 21 265 233,319 4,852,664 5 . 5,086,253 242,203 Zinc (Fume or Dust)[M] 10 11 20,810 258,685 5 . 279,511 27,951 Lead[C, M] 9 20 515 10,443 10 . 10,988 1,221 Manganese[M] 9 10 776 5,997 . . 6,783 754 Zinc Compounds[M] 7 303 5,259 488,477 6,955 . 500,994 71,571 Chromium[M] 6 15 760 750 15 . 1,540 257 Copper Compounds[M] 3 1 502 64,928 . . 65,431 21,810 Manganese Compounds[M] 3 5 16,400 . 4,752 . 21,157 7,052 Trichloroethylene[C] 3 0 1,836 66,330 800 . 68,966 22,989 Nitric Acid 3 98 . . 24,324 . 24,422 8,141 Chlorine 3 0 . . . . 0 0 Certain Glycol Ethers 2 0 . 50,000 . . 50,000 25,000 Ethylene Glycol 2 4 70 . . . 74 37 Hydrochloric Acid (1995 and after "Acid Aerosols" Only) 2 0 . . . . 0 0 Sulfuric Acid 2 0 . . . . 0 0 Lead Compounds[C, M] 1 0 360 1,500,000 . . 1,500,360 1,500,360 Nickel Compounds[C, M] 1 0 54 7,767 . . 7,821 7,821 Hexachloroethane 1 0 . . . . 0 0 Styrene[C] 1 0 . . . . 0 0 Propylene 1 0 . . . . 0 0 Triethylamine 1 0 . . . . 0 0 Tetrachloroethylene[C] 1 . . 2,009 . . 2,009 2,009 Beryllium[C, M] 1 0 . 750 . . 750 750
___ _________ _______ _______ _______ _________ ________ _________100** 1,140 317,568 12,159,340 37,752 0 12,515,800 125,158
[C] Known or suspect carcinogens [M] Metals and metal compounds [O] Ozone depleters* Refer to Section III for a discussion of the TRI data and its limitations, methodology used to obtain this data, definitions of the column headings, and the definitions of carcinogens, metals, and ozone depleters.**Total number of facilities (not chemical reports) reporting to TRI in this industry sector.

Sector Notebook Data Refresh - 1997 Metal Castings
Being included on this list does not mean that the release is associated with non-compliance with environmental laws.1
Sector Notebook Project May 1998P-6
Ten Largest Volume TRI Releasing Metal Casting Facilities Reporting Only FoundrySIC Codes (332, 3365, 3366, 3369)*
Rank Facility Total TRI Releases in Pounds1
1 GM Powertrain Defiance - Defiance, OH 14,730,020
2 GMC Powertrain - Saginaw, MI 2,709,764
3 American Steel Foundries - Granite City, IL 1,245,343
4 Griffin Wheel Co. - Keokuk, IA 1,065,104
5 Griffin Wheel Co. - Groveport, OH 1,042,040
6 Griffin Wheel Co. - Bessemer, AL 742,135
7 U.S. Pipe & Foundry Co. - Birmingham, AL 738,200
8 American Steel Foundries - East Chicago, IN 625,191
9 Griffin Wheel Co. - Kansas City, KS 607,266
10 CMI - Cast Parts, Inc. - Cadillac, MI 604,100
Source: US Toxics Release Inventory Database, 1995.*Refer to Section III for a general discussion of TRI data and its limitations. A discussion of the methodology used to develop this table can be found under the heading Ten Largest Volume TRI Releasing Facilities.
Ten Largest Volume TRI Releasing Metal Casting Facilities Reporting Only DieCasting SIC Codes (3363, 3364)*
Rank Facility Total TRI Releases in Pounds1
1 Water Gremlin Co. - White Bear Lake, MN 97,111
2 BTR Precision Die Casting - Russelville, KY 93,903
3 QX Inc. - Hamel, MN 67,772
4 AAP St. Marys Corp. - Saint Marys, OH 55,582
5 Impact Industries Inc. - Sandwich, IL 45,175
6 Tool-Die Eng. Co. - Solon, OH 29,005
7 Chrysler Corp. - Kokomo, IN 20,652
8 Metalloy Corp. - Freemont, IN 13,350
9 Tool Products. Inc. - New Hope, MN 12,194
10 Travis Pattern & Foundry, Inc. - Spokane, WA 11,614
Source: US Toxics Release Inventory Database, 1995.*Refer to Section III for a general discussion of TRI data and its limitations. A discussion of the methodology used to develop this table can be found under the heading Ten Largest Volume TRI Releasing Facilities.

Sector Notebook Data Refresh - 1997 Metal Castings
Being included on this list does not mean that the release is associated with non-compliance with environmental laws.1
Sector Notebook Project May 1998P-7
Ten Largest Volume TRI Releasing Facilities Reporting Foundry and Other SICCodes (332, 3365, 3366, 3369)*
Rank Facility SIC Codes Reported in TRI Pounds1Total TRI Releases in
1 GM Powertrain Defiance - Defiance, OH 3321 14,730,020
2 GMC Powertrain - Saginaw, MI 3321, 3365 2,709,764
3 Heatcraft Inc. - Grenada, MS 3585, 3351, 3366 1,369,306
4 American Steel Foundries - Granite City, IL 3325 1,245,343
5 Griffin Wheel Co. - Keokuk, IA 3325 1,065,104
6 Griffin Wheel Co. - Groveport, OH 3325 1,042,040
7 Geneva Steel - Vineyard, UT 3312, 3317, 3325 918,478
8 Griffin Wheel Co. - Bessemer, AL 3325 742,135
9 U.S. Pipe & Foundry Co. - Birmingham, AL 3321 738,200
10 American Steel Foundries - East Chicago, IN 3325 625,191
Source: US Toxics Release Inventory Database, 1995.*Refer to Section III for a general discussion of TRI data and its limitations. A discussion of the methodology used to develop this table can be found under the heading Ten Largest Volume TRI Releasing Facilities.
Ten Largest Volume TRI Releasing Facilities Reporting Die Casting and Other SICCodes (3363, 3364)*
Rank Facility SIC Codes Reported in TRI Pounds1
Total TRIReleases in
1 Water Gremlin Co. - White Bear Lake, MN 3364, 3949 97,111
2 BTR Precision Die Casting - Russelville, KY 3363 93,903
3 Honeywell Inc. Home & Building - Golden Valley, 3822, 3363, 3900 87,937MN
4 QX Inc. - Hamel, MN 3363 67,772
5 AAP St. Marys Corp. - Saint Marys, OH 3363 55,582
6 Impact Industries Inc. - Sandwich, IL 3363 45,175
7 Tool-Die Eng. Co. - Solon, OH 3363 29,005
8 TAC Manufacturing - Jackson, MI 3086, 3363, 3714 25,684
9 Superior Ind. Intl., Inc. - Johnson City, TN 3714, 3363, 3398 25,250
10 General Electric Co. - Hendersonville, NC 3646, 3363 20,780
Source: US Toxics Release Inventory Database, 1995.*Refer to Section III for a general discussion of TRI data and its limitations. A discussion of the methodology used to develop this table can be found under the heading Ten Largest Volume TRI Releasing Facilities.

Sector Notebook Data Refresh - 1997 Metal Castings
Sector Notebook Project May 1998P-8
Source Reduction and Recycling Activity for Foundries (SIC 332, 3365, 3366, and 3369)as Reported within TRI*
A B C JOn-Site Off-Site
Year (10 lbs.) Transferred Off-siteRecycled Recovery % Treated Recycled Recovery % Treated
Quantity ofProduction- % Released
Related % Released andWaste and Disposed% % Energy % % Energy
6 a b
c
D E F G H I
1994 232 43% 58% 0% 1% 18% 0% 0% 32%
1995 272 40% 58% 0% 2% 16% 0% 1% 32%
1996 264 --- 54% 0% 2% 20% 0% 1% 24%
1997 261 --- 53% 0% 2% 21% 0% 1% 24%
Source: 1995 Toxics Release Inventory Database.* Refer to Section III for a general discussion of TRI data and its limitations. A discussion of the methodology used todevelop this table can be found under the heading Source Reduction and Recycling Activity. Within this industry sector, non-production related waste < 1% of production related wastes for 1995.a
Total TRI transfers and releases as reported in Section 5 and 6 of Form R as a percentage of production related wastes.b
Percentage of production related waste released to the environment and transferred off-site for disposal.c
Source Reduction and Recycling Activity for Die Casting Facilities (SIC 3363 and 3364)as Reported within TRI*
A B C JOn-Site Off-Site
Year (10 lbs.) Transferred Off-site
Quantity ofProduction- % Released
Related % Released andWaste and Disposed
6 a b
c
D E F G H I
% % Energy % % EnergyRecycled Recovery % Treated Recycled Recovery % Treated
1994 60 23% 69% 0% 3% 27% 0% 0% 2%
1995 63 21% 75% 0% 3% 21% 0% 0% 2%
1996 64 --- 75% 0% 3% 21% 0% 0% 1%
1997 64 --- 76% 0% 2% 21% 0% 0% 1%
Source: 1995 Toxics Release Inventory Database. * Refer to Section III for a general discussion of TRI data and its limitations. A discussion of the methodology used todevelop this table can be found under the heading Source Reduction and Recycling Activity. Within this industry sector, non-production related waste < 1% of production related wastes for 1995.a
Total TRI transfers and releases as reported in Section 5 and 6 of Form R as a percentage of production related wastes.b
Percentage of production related waste released to the environment and transferred off-site for disposal.c
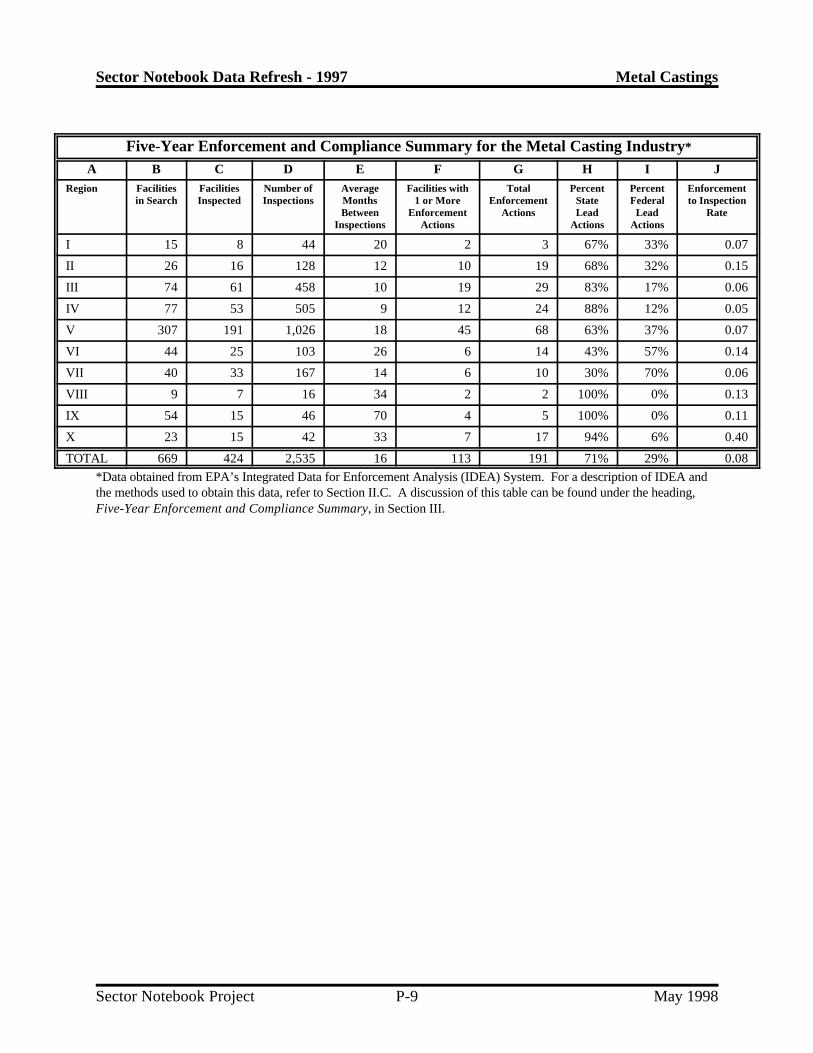
Sector Notebook Data Refresh - 1997 Metal Castings
Sector Notebook Project May 1998P-9
Five-Year Enforcement and Compliance Summary for the Metal Casting Industry*
A B C D E F G H I JRegion Facilities Facilities Number of Average Facilities with Total Percent Percent Enforcement
in Search Inspected Inspections Months 1 or More Enforcement State Federal to InspectionBetween Enforcement Actions Lead Lead Rate
Inspections Actions Actions Actions
I 15 8 44 20 2 3 67% 33% 0.07
II 26 16 128 12 10 19 68% 32% 0.15
III 74 61 458 10 19 29 83% 17% 0.06
IV 77 53 505 9 12 24 88% 12% 0.05
V 307 191 1,026 18 45 68 63% 37% 0.07
VI 44 25 103 26 6 14 43% 57% 0.14
VII 40 33 167 14 6 10 30% 70% 0.06
VIII 9 7 16 34 2 2 100% 0% 0.13
IX 54 15 46 70 4 5 100% 0% 0.11
X 23 15 42 33 7 17 94% 6% 0.40
TOTAL 669 424 2,535 16 113 191 71% 29% 0.08
*Data obtained from EPA’s Integrated Data for Enforcement Analysis (IDEA) System. For a description of IDEA andthe methods used to obtain this data, refer to Section II.C. A discussion of this table can be found under the heading,Five-Year Enforcement and Compliance Summary, in Section III.
Sector Notebook Data Refresh - 1997 Nonferrous Metals
Sector Notebook Project May 1998Q-1
Nonferrous Metals

Sector Notebook Data Refresh - 1997 Nonferrous Metals
Sector Notebook Project May 1998Q-2
1995 TRI Releases for Nonferrous Metals Facilities (SICS 333 and 334)by Number of Facilities Reporting (pounds/year)*
Chemical Name Chemical Air Air Discharges Injection Disposal Releases Per Facility# Reporting Fugitive Point Water Underground Land Total Avg. Releases
Copper[M] 124 167,125 260,728 4,403 0 946,646 1,378,902 11,120Chlorine 72 169,360 58,326,712 3,865 0 5 58,499,942 812,499Nickel[C, M] 52 1,981 6,236 1,558 0 31,976 41,751 803Copper Compounds[M] 51 811,158 419,775 5,906 92,497 38,636,759 39,966,095 783,649Manganese[M] 47 11,969 8,983 7,641 0 49,401 77,994 1,659Zinc Compounds[M] 46 318,405 732,115 16,347 963 44,567,486 45,635,316 992,072Lead Compounds[C, M] 45 226,135 450,896 8,154 912 10,575,038 11,261,135 250,247Aluminum (Fume or Dust)[M] 44 18,879 268,106 1,722 250 1,041,968 1,330,925 30,248Lead[C, M] 43 287,346 172,345 939 0 1,730,105 2,190,735 50,947Chromium[M] 41 1,003 2,819 870 0 4,105 8,797 215Hydrochloric Acid (1995 and after "Acid 41 183,993 7,888,871 0 0 0 8,072,864 196,899Aerosols" Only)Sulfuric Acid 35 71,900 1,087,252 171 0 5 1,159,328 33,124Nitric Acid 31 64,941 47,962 0 5 0 112,908 3,642Hydrogen Fluoride 27 2,578,811 2,121,089 0 0 0 4,699,900 174,070Nickel Compounds[C, M] 25 5,949 18,121 3,366 10,690 1,795,198 1,833,324 73,333Zinc (Fume or Dust)[M] 25 95,834 196,081 9,810 0 4,259,544 4,561,269 182,451Ammonia 24 2,552,896 3,759,481 390,337 750 53,500 6,756,964 281,540Chromium Compounds[C, M] 23 1,280 4,120 719 0 260,520 266,639 11,593Antimony Compounds[M] 21 12,623 10,836 2,534 8,430 1,063,654 1,098,077 52,289Arsenic Compounds[C, M] 19 68,319 35,448 2,071 54,800 1,303,367 1,464,005 77,053Manganese Compounds[M] 16 1,135 3,282 2,001 0 2,017,021 2,023,439 126,465Silver[M] 16 563 1,541 11 0 0 2,115 132Antimony[M] 14 955 4,597 16 0 7,640 13,208 943Polycyclic Aromatic Compounds[C] 13 20,913 545,736 72 0 800 567,521 43,655Silver Compounds[M] 13 1,915 2,791 307 380 26,542 31,935 2,457Carbonyl Sulfide 13 75,993 5,130,558 0 0 0 5,206,551 400,504Barium Compounds[M] 12 2,023 1,119 882 0 0 4,024 335Cadmium Compounds[C, M] 12 4,240 19,997 498 109 48,099 72,943 6,079Cobalt[C, M] 12 292 521 284 0 0 1,097 91Arsenic[C, M] 11 1,149 3,518 5 0 24,507 29,179 2,653Phosphoric Acid 9 20,696 19,690 0 0 0 40,386 4,487Nitrate Compounds 8 0 0 352 0 17,000 17,352 2,169Cadmium[C, M] 8 2,392 2,007 253 0 19,196 23,848 2,981Cyanide Compounds 6 1 516 1,814 0 0 2,331 389Selenium Compounds[M] 6 559 38,248 251 3,640 110,250 152,948 25,491Ethylene Glycol 6 40 1,900 0 0 0 1,940 323Molybdenum Trioxide 6 116,920 5,460 46,863 0 0 169,243 28,207Xylene (Mixed Isomers) 6 22,345 57,030 0 0 0 79,375 13,229Cobalt Compounds[C, M] 5 253 1,013 1,275 0 250 2,791 558Methanol 5 217,938 34,362 13,260 0 0 265,560 53,112Certain Glycol Ethers 4 13,366 66,208 315 0 0 79,889 19,972Thiourea[C] 4 60 0 0 5,000 250 5,310 1,3281,1,1-Trichloroethane[O] 4 88,262 0 0 0 0 88,262 22,066Toluene 4 34,251 58,137 0 0 0 92,388 23,097Beryllium[C, M] 4 1 831 17 0 21,244 22,093 5,523Methyl Ethyl Ketone 3 90,005 46,829 12 0 0 136,846 45,615Trichloroethylene[C] 3 115,473 269,000 10 0 0 384,483 128,161Naphthalene 3 6,900 10,454 0 0 0 17,354 5,7851,2,4-trimethylbenzene 3 23,550 9,750 0 0 0 33,300 11,100Methyl Isobutyl Ketone 3 506,646 758,346 16,629 0 0 1,281,621 427,207M-xylene 3 13,050 6,233 0 0 0 19,283 6,428Mercury Compounds[M] 2 5 390 5 0 0 400 200Formic Acid 2 11 121 0 0 0 132 66Hexachloroethane 2 5 250 0 0 0 255 128N-butyl Alcohol 2 1,700 19,374 3 0 0 21,077 10,539Chlorodifluoromethane[O] 2 47,300 0 0 0 0 47,300 23,650Styrene[C] 2 830 5 0 0 0 835 418Phenol 2 3,015 5 0 0 0 3,020 1,510Hydrazine[C] 2 5 785 0 0 0 790 395Lithium Carbonate 2 505 267 0 0 0 772 386

Sector Notebook Data Refresh - 1997 Nonferrous Metals
1995 TRI Releases for Nonferrous Metals Facilities (SICS 333 and 334)by Number of Facilities Reporting (pounds/year)*
Chemical Name Chemical Air Air Discharges Injection Disposal Releases Per Facility# Reporting Fugitive Point Water Underground Land Total Avg. Releases
Sector Notebook Project May 1998Q-3
Aluminum Oxide (Fibrous Forms)[M] 2 0 138 0 0 0 138 69Titanium Tetrachloride 2 3,250 250 0 0 0 3,500 1,750Phosphorus (Yellow or White) 2 0 0 250 0 0 250 125Formaldehyde[C] 1 7,000 140 0 0 0 7,140 7,140Dichloromethane[C] 1 4,265 2,768 0 0 0 7,033 7,033Dichlorodifluoromethane[O] 1 22,000 0 0 0 0 22,000 22,000Dibutyl Phthalate 1 0 1 0 0 0 1 1Phenanthrene 1 0 24,296 1 0 0 24,297 24,297Cumene 1 840 970 0 0 0 1,810 1,810Acetophenone 1 500 15,000 13 0 0 15,513 15,513Ethylbenzene 1 590 520 0 0 0 1,110 1,110Anthracene 1 0 3,612 0 0 0 3,612 3,612Triethylamine 1 0 41,000 29 0 0 41,029 41,029Tetrachloroethylene[C] 1 891 183,000 0 0 0 183,891 183,891Sodium Dimethyldithiocarbamate 1 250 250 0 0 0 500 500Calcium Cyanamide 1 0 0 0 0 0 0 0Decabromodiphenyl Oxide 1 0 250 0 0 0 250 250Cresol (Mixed Isomers) 1 250 0 250 0 750 1,250 1,250Asbestos (Friable)[C] 1 0 0 0 0 0 0 0Thallium[M] 1 5 250 0 0 755 1,010 1,010Barium[M] 1 84 24 0 0 0 108 108Vanadium (Fume or Dust)[M] 1 0 0 0 0 0 0 0Sodium Nitrite 1 0 0 0 0 0 0 0Selenium[M] 1 0 0 0 0 0 0 0
________ _________ _________ _______ _______ __________ __________ _______282** 9,125,094 83,211,316 546,091 178,426 108,613,581 201,674,508 715,158
[C] Known or suspect carcinogens [M] Metals and metal compounds [O] Ozone depleters* Refer to Section III for a discussion of the TRI data and its limitations, methodology used to obtain this data, definitions of the column headings, and the definitions of carcinogens, metals, and ozone depleters.**Total number of facilities (not chemical reports) reporting to TRI in this industry sector.

Sector Notebook Data Refresh - 1997 Nonferrous Metals
Sector Notebook Project May 1998Q-4
1995 TRI Transfers for Nonferrous Metals Facilities (SICs 333 and 334)by Number of Facilities Reporting (pounds/year)
Chemical Name Chemical Transfers Transfers Transfers Transfers Transfers Transfers Per Facility# Reporting Potw Disposal Recycling Treatment Recovery Total Avg Transfer
Energy
Copper[M] 124 4,449 1,063,810 17,930,376 142,772 1,445 19,142,852 154,378Chlorine 72 19 46 17,623 . . 17,688 246Nickel[C, M] 52 541 237,646 887,140 22,664 . 1,147,991 22,077Copper Compounds[M] 51 2,654 3,546,621 25,112,251 109,601 . 28,771,127 564,140Manganese[M] 47 258 170,868 413,064 1,519 . 585,709 12,462Zinc Compounds[M] 46 26,827 27,129,255 8,359,752 1,822,798 . 37,338,632 811,709Lead Compounds[C, M] 45 2,499 9,897,630 16,612,431 3,791,330 . 30,303,890 673,420Aluminum (Fume or Dust)[M] 44 1,255 3,034,888 2,914,423 760 . 5,951,326 135,257Lead[C, M] 43 1,593 515,174 2,970,376 90,493 250 3,577,891 83,207Chromium[M] 41 34 64,984 314,078 47,226 . 426,322 10,398Hydrochloric Acid (1995 and after "Acid 41 184 21,385 37,996 30,453 . 90,018 2,196Aerosols" Only)Sulfuric Acid 35 5 3,000,500 319,044 35,250 . 3,354,799 95,851Nitric Acid 31 255 280 63,036 153,833 . 217,404 7,013Hydrogen Fluoride 27 0 . . 84,442 . 84,442 3,127Nickel Compounds[C, M] 25 306 954,973 2,388,518 64,221 . 3,408,018 136,321Zinc (Fume or Dust)[M] 25 250 134,258 2,472,155 372,821 . 2,979,484 119,179Ammonia 24 52,200 153,161 . 440 . 205,801 8,575Chromium Compounds[C, M] 23 54 917,451 520,450 9,325 . 1,447,280 62,925Antimony Compounds[M] 21 1,291 1,704,673 1,677,611 254,782 . 3,638,357 173,255Arsenic Compounds[C, M] 19 117 403,626 352,573 1,169,665 . 1,925,981 101,367Manganese Compounds[M] 16 7 3,790,791 670,953 751 . 4,462,502 278,906Silver[M] 16 84 5,705 286,155 . . 291,944 18,247Antimony[M] 14 687 31,730 4,064,663 . . 4,097,085 292,649Polycyclic Aromatic Compounds[C] 13 0 945,420 . 22 . 945,442 72,726Silver Compounds[M] 13 48 2,289 212,919 14,217 . 229,473 17,652Carbonyl Sulfide 13 0 . . . . 0 0Barium Compounds[M] 12 10 223,455 214,595 224,535 . 662,595 55,216Cadmium Compounds[C, M] 12 560 1,424,643 692,581 70,410 . 2,188,194 182,350Cobalt[C, M] 12 10 28,594 96,856 0 . 125,460 10,455Arsenic[C, M] 11 54 15,163 149,760 37,422 . 202,399 18,400Phosphoric Acid 9 112 . . . . 112 12Nitrate Compounds 8 1,582,229 0 . . . 1,582,229 197,779Cadmium[C, M] 8 15 11,667 138,215 12,259 . 162,156 20,270Cyanide Compounds 6 2 84,054 . 3,791 . 87,847 14,641Selenium Compounds[M] 6 1 52,297 38 6,478 . 58,814 9,802Ethylene Glycol 6 15,000 . 4,595 5,647 2,270 27,512 4,585Molybdenum Trioxide 6 0 68,896 174,275 . . 243,171 40,529Xylene (Mixed Isomers) 6 0 . 152,904 1,703 161,440 316,047 52,675Cobalt Compounds[C, M] 5 250 17,739 36,798 . . 54,787 10,957Methanol 5 2,270,000 848 . 26,860 31,315 2,329,023 465,805Certain Glycol Ethers 4 7,386 . . 1,272 4,223 12,881 3,220Thiourea[C] 4 0 . . . . 0 01,1,1-Trichloroethane[O] 4 0 . . 160 . 160 40Toluene 4 0 . 9,618 7,617 50,334 67,569 16,892Beryllium[C, M] 4 0 6,943 7,977 377 . 15,297 3,824Methyl Ethyl Ketone 3 10 . 51,234 6,800 234,070 292,114 97,371Trichloroethylene[C] 3 82 . 256,000 1,246 17,491 274,819 91,606Naphthalene 3 0 . . 150 5,476 5,626 1,8751,2,4-trimethylbenzene 3 0 . . 300 5,750 6,050 2,017Methyl Isobutyl Ketone 3 0 4,779 . 690 15,000 20,469 6,823M-xylene 3 0 . 22 . 9,502 9,524 3,175Mercury Compounds[M] 2 0 187,000 . 1,340 . 188,340 94,170Formic Acid 2 0 0 . . . 0 0Hexachloroethane 2 0 . . . . 0 0N-butyl Alcohol 2 0 . . 60 7,785 7,845 3,923Chlorodifluoromethane[O] 2 0 . . . . 0 0Styrene[C] 2 0 80 . . . 80 40Phenol 2 5 0 . . . 5 3Hydrazine[C] 2 0 . . . . 0 0

Sector Notebook Data Refresh - 1997 Nonferrous Metals
1995 TRI Transfers for Nonferrous Metals Facilities (SICs 333 and 334)by Number of Facilities Reporting (pounds/year)
Chemical Name Chemical Transfers Transfers Transfers Transfers Transfers Transfers Per Facility# Reporting Potw Disposal Recycling Treatment Recovery Total Avg Transfer
Energy
Sector Notebook Project May 1998Q-5
Lithium Carbonate 2 0 . . . . 0 0Aluminum Oxide (Fibrous Forms)[M] 2 0 . . . . 0 0Titanium Tetrachloride 2 0 . . . . 0 0Phosphorus (Yellow or White) 2 250 . 620 . . 870 435Formaldehyde[C] 1 33,700 . . . . 33,700 33,700Dichloromethane[C] 1 763 . 159,388 19 . 160,170 160,170Dichlorodifluoromethane[O] 1 0 . . . . 0 0Dibutyl Phthalate 1 0 . 643 . 169 812 812Phenanthrene 1 0 26,743 . 2 . 26,745 26,745Cumene 1 0 . . 30 510 540 540Acetophenone 1 180 2,474 . . . 2,654 2,654Ethylbenzene 1 0 . . 21 350 371 371Anthracene 1 0 11,542 . 1 . 11,543 11,543Triethylamine 1 0 . . . . 0 0Tetrachloroethylene[C] 1 0 . . 84,411 . 84,411 84,411Sodium Dimethyldithiocarbamate 1 0 . . . . 0 0Calcium Cyanamide 1 0 . . . . 0 0Decabromodiphenyl Oxide 1 0 2,409 . . . 2,409 2,409Cresol (Mixed Isomers) 1 0 . . . . 0 0Asbestos (Friable)[C] 1 0 18,000 . . . 18,000 18,000Thallium[M] 1 5 . 3,852 190 . 4,047 4,047Barium[M] 1 250 31,000 . . . 31,250 31,250Vanadium (Fume or Dust)[M] 1 0 . . . . 0 0Sodium Nitrite 1 0 . . . . 0 0Selenium[M] 1 0 . . . . 0 0
________ _________ _________ __________ _________ _______ __________ ______282** 4,006,491 59,945,490 90,747,558 8,713,176 547,380 163,960,105 581,419
[C] Known or suspect carcinogens [M] Metals and metal compounds [O] Ozone depleters* Refer to Section III for a discussion of the TRI data and its limitations, methodology used to obtain this data, definitions of the column headings, and the definitions of carcinogens, metals, and ozone depleters.**Total number of facilities (not chemical reports) reporting to TRI in this industry sector.

Sector Notebook Data Refresh - 1997 Nonferrous Metals
Being included on this list does not mean that the release is associated with non-compliance with environmental laws.1
Sector Notebook Project May 1998Q-6
Ten Largest Volume TRI Releasing Nonferrous Metals Facilities Reporting Only SIC333 and 334*
Rank Facility Total TRI Releases in Pounds1
1 Magnesium Corp. Of America, Rowley, Utah 64,339,080
2 Asarco Inc., East Helena, Montana 39,517,514
3 Asarco Inc., Hayden, Arizona 18,310,475
4 Phelps Dodge Hidalgo Inc., Playas, New Mexico 10,346,210
5 Doe Run Co., Herculaneum, Missouri 8,106,633
6 Chino Mines Co., Hurley, New Mexico 7,094,737
7 Asarco Inc., Annapolis, Missouri 6,525,797
8 Kennecott Utah Copper, Magna, Utah 5,990,210
9 Climax Molybdenum Co., Fort Madison, Iowa 3,354,639
10 U.S. Vanadium Corp., Hot Springs, Arkansas 1,537,510
Source: US EPA 1995 Toxics Release Inventory Database.*Refer to Section III for a general discussion of TRI data and its limitations. A discussion of the methodology used todevelop this table can be found under the heading Ten Largest Volume TRI Releasing Facilities.
Ten Largest Volume TRI Releasing Facilities Reporting Only SIC 333 and 334 or SIC333 and 334 and Other SIC Codes*
Rank Facility SIC Codes Reported in TRI Pounds1
Total TRIReleases in
1 Magnesium Corp. Of America, Rowley, Utah 3339 64,339,080
2 Asarco Inc., East Helena, Montana 3339 39,517,514
3 Asarco Inc., Hayden, Arizona 3331 18,310,475
4 Cyprus Miami Mining Corp., Claypool, Arizona 1021, 3331, 3351 10,857,552
5 Phelps Dodge Hidalgo Inc., Playas, New Mexico 3331 10,346,210
6 Doe Run Co., Herculaneum, Missouri 3339 8,106,633
7 Chino Mines Co., Hurley, New Mexico 3331 7,094,737
8 Asarco Inc., Annapolis, Missouri 3339 6,525,797
9 Kennecott Utah Copper, Magna, Utah 3331 5,990,210
10 Climax Molybdenum Co., Fort Madison, Iowa 2819, 3339 3,495,280
Source: US EPA Toxics Release Inventory Database, 1995.*Refer to Section III for a general discussion of TRI data and its limitations. A discussion of the methodology used todevelop this table can be found under the heading Ten Largest Volume TRI Releasing Facilities.
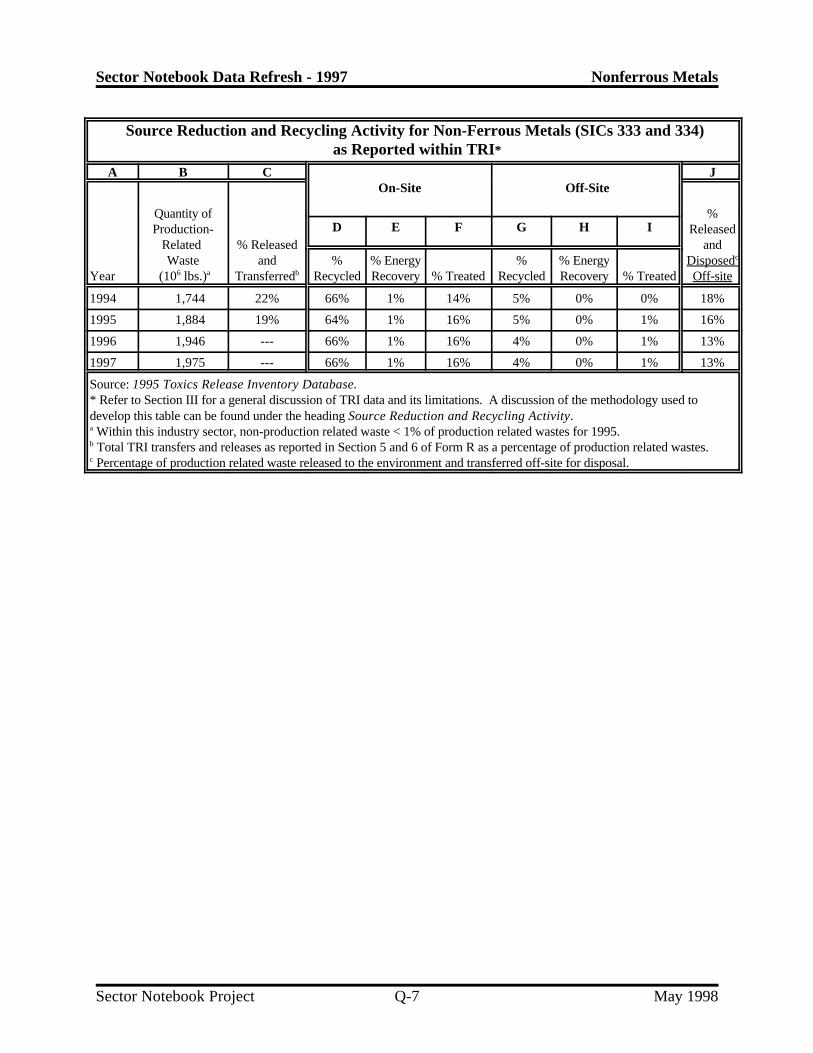
Sector Notebook Data Refresh - 1997 Nonferrous Metals
Sector Notebook Project May 1998Q-7
Source Reduction and Recycling Activity for Non-Ferrous Metals (SICs 333 and 334) as Reported within TRI*
A B C JOn-Site Off-Site
Year (10 lbs.) Transferred Off-siteRecycled Recovery % Treated Recycled Recovery % Treated
Quantity of %Production- Released
Related % Released andWaste and Disposed% % Energy % % Energy
6 a b
c
D E F G H I
1994 1,744 22% 66% 1% 14% 5% 0% 0% 18%
1995 1,884 19% 64% 1% 16% 5% 0% 1% 16%
1996 1,946 --- 66% 1% 16% 4% 0% 1% 13%
1997 1,975 --- 66% 1% 16% 4% 0% 1% 13%
Source: 1995 Toxics Release Inventory Database. * Refer to Section III for a general discussion of TRI data and its limitations. A discussion of the methodology used todevelop this table can be found under the heading Source Reduction and Recycling Activity. Within this industry sector, non-production related waste < 1% of production related wastes for 1995.a
Total TRI transfers and releases as reported in Section 5 and 6 of Form R as a percentage of production related wastes.b
Percentage of production related waste released to the environment and transferred off-site for disposal.c

Sector Notebook Data Refresh - 1997 Nonferrous Metals
Sector Notebook Project May 1998Q-8
Five-Year Enforcement and Compliance Summary for the Nonferrous Metals Industry*
A B C D E F G H I JRegion Facilities Facilities Number of Average Facilities with Total Percent Percent Enforcement
in Search Inspected Inspections Months 1 or More Enforcement State Federal to InspectionBetween Enforcement Actions Lead Lead Rate
Inspections Actions Actions Actions
I 10 7 17 35 3 5 40% 60% 0.29
II 14 11 99 8 6 10 90% 10% 0.10
III 21 18 249 5 7 15 69% 31% 0.06
IV 30 24 377 5 10 23 87% 13% 0.06
V 61 47 346 11 13 23 83% 17% 0.07
VI 19 15 177 6 7 27 56% 44% 0.15
VII 11 10 118 6 5 11 82% 18% 0.09
VIII 7 6 42 10 4 10 70% 30% 0.24
IX 16 12 72 13 5 11 100% 0% 0.15
X 14 11 143 6 8 39 85% 15% 0.27
TOTAL 203 161 1,640 7 68 174 78% 22% 0.11
*Data obtained from EPA’s Integrated Data for Enforcement Analysis (IDEA) System. For a description of IDEA andthe methods used to obtain this data, refer to Section II.C. A discussion of this table can be found under the heading,Five-Year Enforcement and Compliance Summary, in Section III.

Sector Notebook Data Refresh - 1997 Fabricated Metal Products
Sector Notebook Project May 1998R-1
Fabricated Metal Products

Sector Notebook Data Refresh - 1997 Fabricated Metal Products
Sector Notebook Project May 1998R-2
1995 TRI Releases for Fabricated Metals Facilities (SIC 34)by Number of Facilities Reporting (pounds/year)*
Chemical Name Chemical Air Air Discharges Injection Disposal Releases Per Facility# Reporting Fugitive Point Water Underground Land Total Avg. Releases
Nitric Acid 451 193,971 226,243 1,515 92 5 421,826 935Xylene (Mixed Isomers) 435 3,886,930 8,218,870 15 0 13,178 12,118,993 27,860Nickel[C, M] 408 26,576 13,962 3,606 0 8,526 52,670 129Copper[M] 406 26,779 50,800 2,763 0 3,818 84,160 207Hydrochloric Acid (1995 and after "Acid 386 175,106 696,995 512 250 255 873,118 2,262Aerosols" Only)Chromium[M] 369 37,206 13,288 3,074 0 36,568 90,136 244Certain Glycol Ethers 366 5,036,567 14,694,162 2,625 0 5 19,733,359 53,916Manganese[M] 316 70,399 15,583 1,574 9 48,180 135,745 430Methyl Ethyl Ketone 297 2,355,296 5,993,426 505 0 16,326 8,365,553 28,167Zinc Compounds[M] 282 277,935 236,219 39,625 0 64,676 618,455 2,193Sulfuric Acid 280 326,477 76,481 1,500 0 10 404,468 1,445Toluene 251 1,632,125 4,045,078 5 0 620 5,677,828 22,621N-butyl Alcohol 245 3,061,391 8,220,818 0 0 0 11,282,209 46,050Phosphoric Acid 225 94,496 77,190 0 526 0 172,212 765Chromium Compounds[C, M] 218 12,239 20,451 2,036 49 5,133 39,908 183Nickel Compounds[C, M] 208 12,772 8,466 2,479 0 6,678 30,395 146Trichloroethylene[C] 205 2,714,967 3,945,968 275 0 2,705 6,663,915 32,507Methyl Isobutyl Ketone 145 603,414 1,262,764 5 0 0 1,866,183 12,870Lead[C, M] 141 6,841 8,393 1,281 0 751 17,266 122Copper Compounds[M] 126 7,680 16,491 3,661 0 433 28,265 224Cyanide Compounds 115 9,273 12,713 539 0 540 23,065 201Ammonia 91 199,549 612,182 19,450 0 33,167 864,348 9,4981,1,1-Trichloroethane[O] 89 1,037,499 639,877 20 0 2,500 1,679,896 18,875Ethylbenzene 87 204,171 414,111 5 0 0 618,287 7,107Zinc (Fume or Dust)[M] 87 80,883 96,542 1,593 0 153,814 332,832 3,8261,2,4-trimethylbenzene 83 380,756 654,961 5 0 0 1,035,722 12,479Manganese Compounds[M] 80 11,128 4,221 2,043 0 1,323 18,715 234Hydrogen Fluoride 79 22,492 37,301 0 0 0 59,793 757Methanol 75 159,065 341,513 0 0 0 500,578 6,674Dichloromethane[C] 69 894,051 1,261,305 10 0 5 2,155,371 31,237Nitrate Compounds 63 561 5,845 214,935 0 18,196 239,537 3,802Tetrachloroethylene[C] 59 948,304 811,482 6 0 0 1,759,792 29,827Diisocyanates 54 3,773 1,583 0 0 10 5,366 99Chlorine 51 14,239 201,196 2,260 0 250 217,945 4,273Lead Compounds[C, M] 43 3,343 8,092 1,228 0 5 12,668 295Naphthalene 41 41,689 157,078 10 0 0 198,777 4,848N-hexane 37 1,584,356 476,052 0 0 0 2,060,408 55,687Styrene[C] 31 177,344 115,686 0 0 250 293,280 9,4611,1-dichloro-1-fluoroethane[O] 30 337,012 315,046 0 0 5 652,063 21,735Cobalt[C, M] 28 1,136 998 1,005 0 750 3,889 139Ethylene Glycol 25 19,049 80,942 0 0 0 99,991 4,000Formaldehyde[C] 21 6,755 40,198 204 0 0 47,157 2,246Aluminum (Fume or Dust)[M] 21 15,043 16,260 505 0 250 32,058 1,527Barium Compounds[M] 16 20,015 516 10 0 10 20,551 1,284Sodium Nitrite 16 2,011 18,103 37 0 2,136 22,287 1,393Chlorodifluoromethane[O] 12 360,633 3,570 0 0 0 364,203 30,350Cadmium Compounds[C, M] 11 275 265 0 0 0 540 49Propylene 11 25,436 18,275 0 0 0 43,711 3,974Sec-butyl Alcohol 10 77,897 78,170 0 0 0 156,067 15,607Cadmium[C, M] 10 10 0 0 0 250 260 26Cobalt Compounds[C, M] 9 40 183 59 0 10 292 32Antimony Compounds[M] 8 3,610 885 0 0 0 4,495 562Isopropyl Alcohol (Manufacturing, 8 30,957 69,160 0 0 0 100,117 12,515Strong-acid Process Only)Dimethyl Phthalate 8 13,801 40,137 0 0 0 53,938 6,742N-methyl-2-pyrrolidone 8 16,535 31,417 0 0 5 47,957 5,995Polychlorinated Alkanes 6 15,179 5 6,146 0 0 21,330 3,555M-xylene 6 1,060 16,510 0 0 0 17,570 2,928Phenol 6 1,074 54 0 0 0 1,128 188Cyclohexane 6 679,524 55,647 0 0 0 735,171 122,529

Sector Notebook Data Refresh - 1997 Fabricated Metal Products
1995 TRI Releases for Fabricated Metals Facilities (SIC 34)by Number of Facilities Reporting (pounds/year)*
Chemical Name Chemical Air Air Discharges Injection Disposal Releases Per Facility# Reporting Fugitive Point Water Underground Land Total Avg. Releases
Sector Notebook Project May 1998R-3
Silver Compounds[M] 5 256 326 9 0 0 591 118Freon 113[O] 5 27,751 36,603 0 0 0 64,354 12,871Cumene 5 4,364 60,070 0 0 0 64,434 12,8872-ethoxyethanol 5 2,876 3,402 0 0 0 6,278 1,256Di(2-ethylhexyl) Phthalate[C] 5 505 2,900 0 0 5 3,410 682Aluminum Oxide (Fibrous Forms)[M] 5 250 250 0 0 67,700 68,200 13,640Silver[M] 5 15 255 0 0 0 270 54Molybdenum Trioxide 3 250 5 0 0 2,500 2,755 918Antimony[M] 3 0 82 0 0 0 82 27N,N-dimethylformamide[C] 2 500 553 0 0 0 1,053 527Benzene[C] 2 2,395 0 0 0 0 2,395 1,1984,4'-isopropylidenediphenol 2 0 0 0 0 0 0 0Toluene-2,6-diisocyanate[C] 2 250 0 0 0 0 250 125Benzoyl Peroxide 2 0 0 0 0 45 45 23O-xylene 2 253 758 0 0 0 1,011 5062-methoxyethanol 2 500 2,907 0 0 0 3,407 1,704Sodium Dimethyldithiocarbamate 2 0 0 0 0 0 0 0Asbestos (Friable)[C] 2 5 0 0 0 4,294 4,299 2,150Beryllium Compounds[C, M] 1 0 0 0 0 0 0 0Formic Acid 1 5 0 0 0 0 5 5Chloroform[C] 1 5 0 0 0 0 5 5Hexachloroethane 1 0 250 0 0 0 250 250Trichlorofluoromethane[O] 1 6,501 700 0 0 0 7,201 7,201Dichlorodifluoromethane[O] 1 0 0 17,000 0 0 17,000 17,000Methyl Methacrylate 1 1,300 0 0 0 0 1,300 1,300Phthalic Anhydride 1 5 0 0 0 0 5 5Vinyl Acetate[C] 1 23 26,267 0 0 0 26,290 26,290Cyclohexanol 1 1,320 801 0 0 0 2,121 2,121Diethanolamine 1 5 0 0 0 0 5 5Catechol 1 5 250 0 0 0 255 2551,2,4-trichlorobenzene 1 0 3,545 0 0 0 3,545 3,545Triethylamine 1 0 190 0 0 0 190 190Nitrilotriacetic Acid[C] 1 0 0 0 0 0 0 0Ethyl Acrylate[C] 1 0 4,653 0 0 0 4,653 4,653Butyl Acrylate 1 148 39 0 0 0 187 187Lithium Carbonate 1 0 0 0 0 0 0 0Toluene-2,4-Diisocyanate[C] 1 0 0 0 0 0 0 0Decabromodiphenyl Oxide 1 5 1,260 0 0 0 1,265 1,265Polychlorinated Biphenyls[C] 1 0 0 0 0 0 0 0Mercury[M] 1 5 0 0 0 0 5 5Arsenic[C, M] 1 5 0 0 0 0 5 5Barium[M] 1 0 0 0 0 0 0 0Vanadium (Fume or Dust)[M] 1 42 110 0 0 0 152 152Phosphorus (Yellow or White) 1 0 0 . 0 0 0 0Selenium[M] 1 5 0 0 0 0 5 5Ozone 1 0 8,200 0 0 0 8,200 8,200
_____ _________ _________ _______ ___ _______ __________ _______2,676** 28,059,902 54,646,194 334,135 926 495,887 83,537,044 31,217
[C] Known or suspect carcinogens [M] Metals and metal compounds [O] Ozone depleters* Refer to Section III for a discussion of the TRI data and its limitations, methodology used to obtain this data, definitions of the column headings, and the definitions of carcinogens, metals, and ozone depleters.**Total number of facilities (not chemical reports) reporting to TRI in this industry sector.

Sector Notebook Data Refresh - 1997 Fabricated Metal Products
Sector Notebook Project May 1998R-4
1995 TRI Transfers for Fabricated Metals Facilities (SIC 34)by Number of Facilities Reporting (pounds/year)*
Chemical Name Chemical Transfers Transfers Transfers Transfers Transfers Transfers Per Facility# Reporting Potw Disposal Recycling Treatment Recovery Total Avg Transfer
Energy
Nitric Acid 451 32,778 275,482 2,510,922 1,954,110 . 4,787,092 10,614Xylene (Mixed Isomers) 435 5,705 10,101 2,760,891 403,473 3,260,166 6,440,336 14,805Nickel[C, M] 408 21,589 349,229 16,197,080 481,846 531 17,050,275 41,790Copper[M] 406 26,061 435,531 121,633,161 203,706 3,627 122,302,336 301,237Hydrochloric Acid (1995 and after "Acid 386 202,798 303,105 6,627,710 770,677 . 7,940,670 20,572Aerosols" Only)Chromium[M] 369 13,736 648,969 19,976,984 175,910 6,831 20,822,430 56,429Certain Glycol Ethers 366 1,355,817 102,893 839,448 355,686 2,686,344 5,340,188 14,591Manganese[M] 316 14,518 622,842 23,888,449 83,513 5 24,609,327 77,878Methyl Ethyl Ketone 297 639 15,546 3,305,853 292,793 4,406,641 8,024,302 27,018Zinc Compounds[M] 282 47,968 4,951,031 34,993,795 1,876,113 169,570 42,039,227 149,075Sulfuric Acid 280 433,094 181,094 1,030,413 2,140,335 5,598 3,790,534 13,538Toluene 251 744 26,212 988,103 306,805 1,869,916 3,191,780 12,716N-butyl Alcohol 245 37,011 1,177 137,306 38,676 566,946 781,116 3,188Phosphoric Acid 225 162,797 626,158 8,082,493 333,294 . 9,204,742 40,910Chromium Compounds[C, M] 218 22,083 1,071,542 4,365,994 629,705 6,567 6,095,891 27,963Nickel Compounds[C, M] 208 27,944 448,841 5,658,782 451,065 688 6,587,320 31,670Trichloroethylene[C] 205 6,306 4,030 1,808,701 256,300 260,131 2,335,468 11,393Methyl Isobutyl Ketone 145 1,785 27,177 847,087 71,510 580,942 1,528,501 10,541Lead[C, M] 141 3,466 146,626 5,569,956 48,294 551 5,768,893 40,914Copper Compounds[M] 126 17,932 614,447 33,657,388 405,592 8,241 34,703,600 275,425Cyanide Compounds 115 12,127 10,576 21,621 154,845 . 199,669 1,736Ammonia 91 234,366 1,655 74,531 27,731 . 338,283 3,7171,1,1-Trichloroethane[O] 89 133 2,500 508,083 23,204 48,689 582,609 6,546Ethylbenzene 87 870 8 150,447 12,060 186,616 350,001 4,023Zinc (Fume or Dust)[M] 87 8,839 768,697 4,592,285 149,326 13,443 5,532,590 63,5931,2,4-trimethylbenzene 83 5 444 29,213 12,579 162,578 204,819 2,468Manganese Compounds[M] 80 2,117 638,453 2,698,534 5,278 270 3,344,652 41,808Hydrogen Fluoride 79 568 7,300 86,807 106,386 . 201,061 2,545Methanol 75 18,601 0 31,456 21,855 262,312 334,224 4,456Dichloromethane[C] 69 30,312 375 231,727 103,583 40,440 406,437 5,890Nitrate Compounds 63 2,595,236 114,841 . 38,491 . 2,748,568 43,628Tetrachloroethylene[C] 59 271 4,667 504,431 99,374 69,123 677,866 11,489Diisocyanates 54 5 8,642 74,425 11,075 3,700 97,847 1,812Chlorine 51 13,118 3,092 1,042,709 1,390 . 1,060,309 20,790Lead Compounds[C, M] 43 1,664 64,880 1,867,802 88,248 497 2,023,091 47,049Naphthalene 41 3,321 94 45,808 10,787 68,735 128,745 3,140N-hexane 37 0 . 21,352 1,771 16,698 45,409 1,227Styrene[C] 31 500 9,900 . 2,697 11,412 24,509 7911,1-dichloro-1-fluoroethane[O] 30 0 4,200 51,001 15,612 13,295 84,108 2,804Cobalt[C, M] 28 351 7,716 1,156,756 880 10 1,165,713 41,633Ethylene Glycol 25 75,173 51,819 3,176 28,307 17,284 175,759 7,030Formaldehyde[C] 21 159,661 5 . 207 3,109 162,982 7,761Aluminum (Fume or Dust)[M] 21 1,260 280,114 607,236 12,813 . 901,423 42,925Barium Compounds[M] 16 258 331,542 1,750 7,637 16,493 357,680 22,355Sodium Nitrite 16 702,018 4,814 230 74,910 . 781,972 48,873Chlorodifluoromethane[O] 12 0 450 250 455 . 1,155 96Cadmium Compounds[C, M] 11 1,049 87,422 36,040 11,218 . 135,729 12,339Propylene 11 0 . . . . 0 0Sec-butyl Alcohol 10 0 . . 2,501 1,224 3,725 373Cadmium[C, M] 10 793 28,610 10,521 . . 44,534 4,453Cobalt Compounds[C, M] 9 5 30,388 213,173 292 95 243,953 27,106Antimony Compounds[M] 8 250 29,907 1,200 38,728 . 70,085 8,761Isopropyl Alcohol (Manufacturing, 8 0 . . 11,000 2,000 13,000 1,625Strong-acid Process Only)Dimethyl Phthalate 8 0 . . 318 26,134 26,452 3,307N-methyl-2-pyrrolidone 8 20,345 907 189,421 4,842 9,600 225,115 28,139Polychlorinated Alkanes 6 5 3,300 42,585 . 93,657 139,547 23,258M-xylene 6 0 . 7,504 . 27,974 35,478 5,913Phenol 6 0 2,434 . . . 2,434 406

Sector Notebook Data Refresh - 1997 Fabricated Metal Products
1995 TRI Transfers for Fabricated Metals Facilities (SIC 34)by Number of Facilities Reporting (pounds/year)*
Chemical Name Chemical Transfers Transfers Transfers Transfers Transfers Transfers Per Facility# Reporting Potw Disposal Recycling Treatment Recovery Total Avg Transfer
Energy
Sector Notebook Project May 1998R-5
Cyclohexane 6 0 . . 1,117 1,200 2,317 386Silver Compounds[M] 5 517 . 112,473 4,209 . 117,199 23,440Freon 113[O] 5 0 . 6,214 1,549 4,139 11,902 2,380Cumene 5 0 . 832 94 8,381 9,307 1,8612-ethoxyethanol 5 10 . . . 23,107 23,117 4,623Di(2-ethylhexyl) Phthalate[C] 5 5 4,292 . 5,200 10,600 20,097 4,019Aluminum Oxide (Fibrous Forms)[M] 5 0 1,444,850 14,325 . . 1,459,175 291,835Silver[M] 5 15 1,755 268,142 . . 269,912 53,982Molybdenum Trioxide 3 0 1,005 5,550 . . 6,555 2,185Antimony[M] 3 0 5,200 88,120 85 . 93,405 31,135N,N-dimethylformamide[C] 2 10 . . . 11,565 11,575 5,788Benzene[C] 2 0 . . . . 0 04,4'-isopropylidenediphenol 2 0 250 . . . 250 125Toluene-2,6-diisocyanate[C] 2 0 . . . . 0 0Benzoyl Peroxide 2 0 250 . . . 250 125O-xylene 2 5 . . . . 5 32-methoxyethanol 2 10 . . . 72,457 72,467 36,234Sodium Dimethyldithiocarbamate 2 8,205 . . 5 . 8,210 4,105Asbestos (Friable)[C] 2 0 33,688 . . . 33,688 16,844Beryllium Compounds[C, M] 1 0 . 1,005 . . 1,005 1,005Formic Acid 1 5 5 . . . 10 10Chloroform[C] 1 5 5 . . . 10 10Hexachloroethane 1 0 250 . . . 250 250Trichlorofluoromethane[O] 1 0 3,877 16,912 2,283 . 23,072 23,072Dichlorodifluoromethane[O] 1 0 . . . . 0 0Methyl Methacrylate 1 0 . . . 300 300 300Phthalic Anhydride 1 0 250 . . . 250 250Vinyl Acetate[C] 1 0 . . . 750 750 750Cyclohexanol 1 0 . . . 1,500 1,500 1,500Diethanolamine 1 750 . 14,000 . . 14,750 14,750Catechol 1 15,000 . . . . 15,000 15,0001,2,4-trichlorobenzene 1 5 . . . 5,348 5,353 5,353Triethylamine 1 0 . . . . 0 0Nitrilotriacetic Acid[C] 1 0 . . . . 0 0Ethyl Acrylate[C] 1 0 . . . . 0 0Butyl Acrylate 1 0 . . . 750 750 750Lithium Carbonate 1 0 . . . . 0 0Toluene-2,4-Diisocyanate[C] 1 0 . . . . 0 0Decabromodiphenyl Oxide 1 0 10,000 . . . 10,000 10,000Polychlorinated Biphenyls[C] 1 0 . . 0 . 0 0Mercury[M] 1 5 5 . . . 10 10Barium[M] 1 5 5 . . . 10 10Vanadium (Fume or Dust)[M] 1 60 13,000 820 . . 13,880 13,880Phosphorus (Yellow or White) 1 0 . . . . 0 0Selenium[M] 1 5 5 . . . 10 10Ozone 1 0 . . . . 0 0
_____ ________ _________ __________ __________ __________ ___________ _________2676** 6,342,614 14,880,482 309,710,983 12,374,345 15,093,131 358,466,263 133,956
[C] Known or suspect carcinogens [M] Metals and metal compounds [O] Ozone depleters* Refer to Section III for a discussion of the TRI data and its limitations, methodology used to obtain this data, definitions of the column headings, and the definitions of carcinogens, metals, and ozone depleters.**Total number of facilities (not chemical reports) reporting to TRI in this industry sector.

Sector Notebook Data Refresh - 1997 Fabricated Metal Products
Being included on this list does not mean that the release is associated with non-compliance with environmental laws.1
Sector Notebook Project May 1998R-6
Ten Largest Volume TRI Releasing Fabricated Metals Facilities Reporting Only SIC 34*
Rank Facility Total TRI Releases in Pounds1
1 Reynolds Metals Co., Sheffield, Alabama 2,886,960
2 Metal Container Corp., New Windsor, New York 852,250
3 U.S. Can Co., Weirton, Wvoming 824,344
4 Piper Impact Inc., New Albany, Misssissippi 791,750
5 American National Can Co., Saint Louis, Missouri 666,500
6 Metal Container Corp., Fort Atkinson, Wisconsin 650,250
7 American Natl. Can Co., Winston-Salem, North Carolina 647,499
8 Plastene Supply Co., Portageville, Missouri 620,564
9 Ken-koat Inc., Huntington, Indiana 600,526
10 American Safety Razor Inc., Verona, Virginia 585,290
Source: US EPA 1995 Toxics Release Inventory Database.*Refer to Section III for a general discussion of TRI data and its limitations. A discussion of the methodology used todevelop this table can be found under the heading Ten Largest Volume TRI Releasing Facilities.
Ten Largest Volume TRI Releasing Facilities Reporting Only SIC 34 or SIC 34 andOther SIC Codes*
Rank Facility SIC Codes Reported in TRI in Pounds1
Total TRIReleases
1 Reynolds Metals Co., Sheffield, Alabama 3479 2,886,960
2 Metal Container Corp., New Windsor, New York 3411 852,250
3 U.S. Can Co., Weirton, West Virginia 3411 824,344
4 Piper Impact Inc., New Albany, Mississippi 3482, 3489 791,750
5 GMC, Flint, Michigan 3465, 3710, 3714 742,779
6 Ingalls Shipbuilding Inc., Pascagoula, Mississippi 3441, 3443, 3731 723,560
7 American National Can Co., Saint Louis, Missouri 3411 666,500
8 Metal Container Corp., Fort Atkinson, Wisconsin 3411 650,250
9 American Natl. Can Co., Winston-salem, North 3411 647,499Carolina
10 Plastene Supply Co., Portageville, Missouri 3471 620,564
Source: US EPA Toxics Release Inventory Database, 1995.*Refer to Section III for a general discussion of TRI data and its limitations. A discussion of the methodology used todevelop this table can be found under the heading Ten Largest Volume TRI Releasing Facilities.

Sector Notebook Data Refresh - 1997 Fabricated Metal Products
Sector Notebook Project May 1998R-7
Source Reduction and Recycling Activity for Fabricated Metals Facilities (SIC 34)as Reported within TRI*
A B C JOn-Site Off-Site
Year (10 lbs.) Transferred Off-siteRecycled Recovery % Treated Recycled Recovery % Treated
Quantity of %Production- Released
Related % Released andWaste and Disposed% % Energy % % Energy
6 a b
c
D E F G H I
1994 1,148 39% 21% 2% 42% 24% 1% 1% 11%
1995 1,037 43% 21% 2% 34% 30% 1% 2% 11%
1996 962 --- 17% 2% 37% 32% 1% 2% 9%
1997 985 --- 18% 2% 36% 32% 1% 2% 9%
Source: 1995 Toxics Release Inventory Database. * Refer to Section III for a general discussion of TRI data and its limitations. A discussion of the methodology used todevelop this table can be found under the heading Source Reduction and Recycling Activity. Within this industry sector, non-production related waste < 1% of production related wastes for 1995.a
Total TRI transfers and releases as reported in Section 5 and 6 of Form R as a percentage of production related wastes.b
Percentage of production related waste released to the environment and transferred off-site for disposal.c

Sector Notebook Data Refresh - 1997 Fabricated Metal Products
Sector Notebook Project May 1998R-8
Five-Year Enforcement and Compliance Summary for the Fabricated Metal Products Industry*
A B C D E F G H I JRegion Facilities Facilities Number of Average Facilities with Total Percent Percent Enforcement
in Search Inspected Inspections Months 1 or More Enforcement State Federal to InspectionBetween Enforcement Actions Lead Lead Rate
Inspections Actions Actions Actions
I 222 158 608 22 53 84 73% 27% 0.14
II 185 144 716 16 43 97 86% 14% 0.14
III 248 187 1,071 14 45 76 87% 13% 0.07
IV 403 296 1,765 14 50 83 89% 11% 0.05
V 1,082 646 2,358 28 99 148 57% 43% 0.06
VI 242 140 435 33 30 50 70% 30% 0.11
VII 163 113 498 20 25 36 81% 19% 0.07
VIII 60 36 111 32 9 11 55% 45% 0.10
IX 238 101 233 61 5 7 71% 29% 0.03
X 63 37 119 32 6 8 63% 37% 0.07
TOTAL 2,906 1,858 7,914 22 365 600 75% 25% 0.08
*Data obtained from EPA’s Integrated Data for Enforcement Analysis (IDEA) System. For a description of IDEA andthe methods used to obtain this data, refer to Section II.C. A discussion of this table can be found under the heading,Five-Year Enforcement and Compliance Summary, in Section III.

Sector Notebook Data Refresh - 1997 Electronics and Computers
Sector Notebook Project May 1998S-1
Electronics and Computers

Sector Notebook Data Refresh - 1997 Electronics and Computers
Sector Notebook Project May 1998S-2
1995 TRI Releases for Electronics and Computers Manufacturing Facilities (SIC 367)by Number of Facilities Reporting (pounds/year)*
Chemical Name Chemical Air Air Discharges Injection Disposal Releases Per Facility# Reporting Fugitive Point Water Underground Land Total Avg. Releases
Nitric Acid 155 16,577 86,676 0 0 10 103,263 666Ammonia 148 77,545 641,703 15,660 0 750 735,658 4,971Copper[M] 118 1,810 3,998 548 0 11,165 17,521 148Hydrochloric Acid (1995 and after "Acid 105 8,759 141,819 0 0 255 150,833 1,437Hydrogen Fluoride 97 6,989 85,136 7,801 0 10 99,936 1,030Phosphoric Acid 93 4,813 27,326 0 5 5 32,149 346Sulfuric Acid 93 13,289 54,455 0 0 0 67,744 728Copper Compounds[M] 84 3,571 10,947 2,035 0 2,441 18,994 226Certain Glycol Ethers 41 49,989 259,575 12,373 0 12,000 333,937 8,145Nitrate Compounds 39 62 1,634 212,913 0 4,510 219,119 5,618Methanol 35 76,379 295,749 2,363 0 0 374,491 10,700N-methyl-2-pyrrolidone 35 4,340 142,062 1,500 0 13,250 161,152 4,604Formaldehyde[C] 31 6,990 36,018 250 0 0 43,258 1,395Xylene (Mixed Isomers) 28 13,150 189,741 0 0 0 202,891 7,246Ethylene Glycol 26 8,277 20,149 870 0 0 29,296 1,127Sodium Dimethyldithiocarbamate 25 422 255 0 0 0 677 27Lead Compounds[C, M] 23 1,289 3,159 530 0 0 4,978 216Lead[C, M] 21 515 1,294 53 0 2,100 3,962 189Methyl Ethyl Ketone 19 81,036 107,646 9 0 0 188,691 9,931Toluene 17 43,159 416,403 59 0 250 459,871 27,051Chlorine 15 2,047 2,825 0 0 0 4,872 325Trichloroethylene[C] 14 102,201 366,797 0 0 0 468,998 33,500N,N-dimethylformamide[C] 10 28,226 73,356 0 0 0 101,582 10,158Nickel Compounds[C, M] 9 261 459 69 0 0 789 88Zinc Compounds[M] 8 1,067 4,281 276 0 0 5,624 7031,1,1-Trichloroethane[O] 7 21,755 69,787 0 0 0 91,542 13,077Barium Compounds[M] 5 5 5 86 0 0 96 191,1-dichloro-1-fluoroethane[O] 5 58,850 33,274 0 0 0 92,124 18,425Chromium Compounds[C, M] 4 10 5 182 0 0 197 49Dichloromethane[C] 4 5,455 22,558 0 0 0 28,013 7,0032-methoxyethanol 4 4,905 38,030 0 0 0 42,935 10,734Tetrachloroethylene[C] 4 5,790 100,876 0 0 0 106,666 26,667Antimony Compounds[M] 3 23 32 3 0 0 58 191,2-Dichlorobenzene 3 3,200 39,842 0 0 0 43,042 14,347Methyl Isobutyl Ketone 3 561 39,763 0 0 0 40,324 13,441Phenol 3 1,550 3,980 250 0 0 5,780 1,927Arsenic Compounds[C, M] 2 0 0 3 0 0 3 2Diisocyanates 2 0 0 0 0 0 0 0Ethylbenzene 2 3,150 3,400 0 0 0 6,550 3,2751,2,4-trichlorobenzene 2 0 9,305 0 0 0 9,305 4,653Chromium[M] 2 0 0 0 0 0 0 0Cobalt Compounds[C, M] 1 6 3 1 0 0 10 10Formic Acid 1 250 750 0 0 0 1,000 1,000Isopropyl Alcohol (Manufacturing, 1 625 0 0 0 0 625 625N-butyl Alcohol 1 13 25 0 0 0 38 38Naphthalene 1 0 400 0 0 0 400 400N-hexane 1 251 803 0 0 0 1,054 1,054Catechol 1 5 250 0 0 0 255 255Manganese[M] 1 0 0 0 0 0 0 0Nickel[C, M] 1 0 0 0 0 0 0 0Cobalt[C, M] 1 0 0 0 0 0 0 0Bromine 1 250 250 0 0 5 505 505Ozone 1 0 45 0 0 0 45 45
_______ _______ _________ _______ __ ______ _________ _______407** 659,417 3,336,846 257,834 5 46,751 4,300,853 10,567
[C] Known or suspect carcinogens [M] Metals and metal compounds [O] Ozone depleters* Refer to Section III for a discussion of the TRI data and its limitations, methodology used to obtain this data, definitions of the column headings, and the definitions of carcinogens, metals, and ozone depleters.**Total number of facilities (not chemical reports) reporting to TRI in this industry sector.

Sector Notebook Data Refresh - 1997 Electronics and Computers
Sector Notebook Project May 1998S-3
1995 TRI Transfers for Electronics and Computers Manufacturing Facilities (SIC 367)by Number of Facilities Reporting (pounds/year)*
Chemical Name Chemical Transfers Transfers Transfers Transfers Transfers Transfers Per Facility# Reporting Potw Disposal Recycling Treatment Recovery Total Avg Transfer
Energy
Nitric Acid 155 18,808 12,408 120,884 369,329 249 531,686 3,430Ammonia 148 922,789 3,366 6,450,618 359,677 249 7,736,699 52,275Copper[M] 118 34,570 107,982 10,452,486 173,157 1 10,790,121 91,442Hydrochloric Acid (1995 and after "Acid 105 31,997 1,011 1,139,645 716,546 1,496 1,892,347 18,022Hydrogen Fluoride 97 31,912 39,548 30,143 451,171 336 553,110 5,702Phosphoric Acid 93 50,574 48,183 244,006 54,046 249 397,058 4,269Sulfuric Acid 93 486,605 0 22,340 184,738 . 693,683 7,459Copper Compounds[M] 84 24,909 143,008 14,549,667 290,760 19 15,008,363 178,671Certain Glycol Ethers 41 518,096 3,144 162,174 265,871 748,650 1,697,935 41,413Nitrate Compounds 39 4,997,357 93,290 . 109,564 . 5,200,211 133,339Methanol 35 185,734 900 76,920 80,957 1,311,953 1,656,464 47,328N-methyl-2-pyrrolidone 35 361,962 41,362 2,015,615 592,498 934,312 3,945,749 112,736Formaldehyde[C] 31 161,952 120 37,000 4,678 . 203,750 6,573Xylene (Mixed Isomers) 28 541 13,053 40,600 243,216 2,506,507 2,803,917 100,140Ethylene Glycol 26 1,023,761 581 . 96,655 319,452 1,440,449 55,402Sodium Dimethyldithiocarbamate 25 19,981 100,935 196,347 263,811 . 581,074 23,243Lead Compounds[C, M] 23 2,061 1,059,069 3,738,859 139,378 100 4,939,467 214,759Lead[C, M] 21 4,064 28,738 981,129 3,735 19 1,017,685 48,461Methyl Ethyl Ketone 19 0 250 1,955 32,182 507,364 541,751 28,513Toluene 17 516 22,200 506,303 26,184 246,895 802,098 47,182Chlorine 15 1,065 . 1,614,373 1,028 . 1,616,466 107,764Trichloroethylene[C] 14 2,730 . 314,644 27,769 40,800 385,943 27,567N,N-dimethylformamide[C] 10 0 . . 13,397 41,242 54,639 5,464Nickel Compounds[C, M] 9 2,561 4,545 74,694 30,751 700 113,251 12,583Zinc Compounds[M] 8 2,020 417,475 397,857 95,561 . 912,913 114,1141,1,1-Trichloroethane[O] 7 255 . 57,993 13,451 20,400 92,099 13,157Barium Compounds[M] 5 505 145,401 522,726 65 . 668,697 133,7391,1-dichloro-1-fluoroethane[O] 5 0 . 30,055 . 9,600 39,655 7,931Chromium Compounds[C, M] 4 0 7,973 159 250 . 8,382 2,096Dichloromethane[C] 4 772 50 165,888 269 30,860 197,839 49,4602-methoxyethanol 4 1,800 . . 550 2,700 5,050 1,263Tetrachloroethylene[C] 4 0 27 241,053 577,822 314,000 1,132,902 283,226Antimony Compounds[M] 3 0 24,447 26,707 . . 51,154 17,0511,2-Dichlorobenzene 3 0 71 . 6,241 380,900 387,212 129,071Methyl Isobutyl Ketone 3 0 . . . 26,484 26,484 8,828Phenol 3 2,380 . . 2,710 228,820 233,910 77,970Arsenic Compounds[C, M] 2 0 2,782 18,881 . . 21,663 10,832Diisocyanates 2 0 13,300 . 19,110 . 32,410 16,205Ethylbenzene 2 0 5 . 700 227,750 228,455 114,2281,2,4-trichlorobenzene 2 1,445 . . 32,840 5,348 39,633 19,817Chromium[M] 2 408 15,940 3,641 410 . 20,399 10,200Cobalt Compounds[C, M] 1 0 4,276 . . . 4,276 4,276Formic Acid 1 19,000 . . . . 19,000 19,000Isopropyl Alcohol (Manufacturing, 1 0 . 1,506 . . 1,506 1,506N-butyl Alcohol 1 0 . . . 4,999 4,999 4,999Naphthalene 1 0 . . . . 0 0N-hexane 1 0 . . . 7,435 7,435 7,435Catechol 1 15,000 . . . . 15,000 15,000Manganese[M] 1 0 266 4,075 160 . 4,501 4,501Nickel[C, M] 1 5 4,003 4,265 7 . 8,280 8,280Cobalt[C, M] 1 0 266 1,069 . . 1,335 1,335Bromine 1 5 250 . . . 255 255Ozone 1 0 . . . . 0 0
______ _________ _________ __________ _________ _________ __________ ________407** 8,928,140 2,360,225 44,246,277 5,281,244 7,919,889 68,769,360 168,966
[C] Known or suspect carcinogens [M] Metals and metal compounds [O] Ozone depleters* Refer to Section III for a discussion of the TRI data and its limitations, methodology used to obtain this data, definitions of the column headings, and the definitions of carcinogens, metals, and ozone depleters.**Total number of facilities (not chemical reports) reporting to TRI in this industry sector.

Sector Notebook Data Refresh - 1997 Electronics and Computers
Being included on this list does not mean that the release is associated with non-compliance with environmental laws.1
Sector Notebook Project May 1998S-4
Ten Largest Volume TRI Releasing Electronics Manufacturing Facilities Reporting OnlySIC 367*
Rank Facility Total TRI Releases in Pounds1
1 Zenith Electronics Corp., Melrose Park, Illinois 428,005
2 Toshiba Display Devices Inc., Horseheads, New York 280,598
3 IBM Corp., Hopewell Junction, New York 214,751
4 IBM Corp., Endicott, New York 113,500
5 Texas Instruments Inc., Dallas, Texas 76,185
6 Parker-Comerics Inc., Hudson, New Hampshire 71,000
7 Micron Tech. Inc., Boise, Idaho 67,955
8 NEC Electronics, Roseville, California 60,850
9 VLSI Tech. Inc., San Antonio, Texas 49,800
10 AT&T, Reading, Pennsylvania 46,855
Source: US EPA 1995 Toxics Release Inventory Database.*Refer to Section III for a general discussion of TRI data and its limitations. A discussion of the methodology used todevelop this table can be found under the heading Ten Largest Volume TRI Releasing Facilities.
Ten Largest Volume TRI Releasing Facilities Reporting Only SIC 367 or SIC 367 and Other SIC Codes*
Rank Facility SIC Codes Reported in TRI Pounds1
Total TRIReleases in
1 Zenith Electronics Corp., Melrose Park, Illinois 3674 428,005
2 Toshiba Display Devices Inc., Horseheads, New York 3674 280,598
3 IBM Corp., Hopewell Junction, New York 3674 214,751
4 Delco Electronics Corp., Kokomo, Indiana 3089, 3469, 3471, 3674, 161,1053679, 3694
5 IBM Corp., Endicott, New York 3672, 3674, 3679 113,500
6 Texas Instruments Inc., Dallas, Texas 3674 76,185
7 Parker-Comerics Inc., Hudson, New Hampshire 3674 71,000
8 Micron Tech. Inc., Boise, Idaho 3674 67,955
9 NEC Electronics, Roseville, California 3674 60,850
10 VLSI Tech. Inc., San Antonio, Texas 3674 49,800
Source: US EPA Toxics Release Inventory Database, 1995.*Refer to Section III for a general discussion of TRI data and its limitations. A discussion of the methodology used todevelop this table can be found under the heading Ten Largest Volume TRI Releasing Facilities.

Sector Notebook Data Refresh - 1997 Electronics and Computers
Sector Notebook Project May 1998S-5
Source Reduction and Recycling Activity for Electronics and Computers (SICs 367) as Reported within TRI*
A B C JOn-Site Off-Site
Year (10 lbs.) Transferred Off-siteRecycled Recovery % Treated Recycled Recovery % Treated
Quantity of %Production- Released
Related % Released andWaste and Disposed% % Energy % % Energy
6 a b
c
D E F G H I
1994 130 55% 4% 1% 47% 29% 5% 8% 8%
1995 156 47% 6% 2% 44% 30% 5% 8% 6%
1996 160 --- 6% 2% 46% 28% 5% 9% 4%
1997 170 --- 7% 2% 46% 28% 4% 9% 4%
Source: 1995 Toxics Release Inventory Database. * Refer to Section III for a general discussion of TRI data and its limitations. A discussion of the methodology used todevelop this table can be found under the heading Source Reduction and Recycling Activity. Within this industry sector, non-production related waste < 1% of production related wastes for 1995.a
Total TRI transfers and releases as reported in Section 5 and 6 of Form R as a percentage of production related wastes.b
Percentage of production related waste released to the environment and transferred off-site for disposal.c

Sector Notebook Data Refresh - 1997 Electronics and Computers
Sector Notebook Project May 1998S-6
Five-Year Enforcement and Compliance Summary for the Electronics and Computers Industry*A B C D E F G H I J
Region Facilities Facilities Number of Average Facilities with Total Percent Percent Enforcementin Search Inspected Inspections Months 1 or More Enforcement State Federal to Inspection
Between Enforcement Actions Lead Lead RateInspections Actions Actions Actions
I 104 73 312 20 16 22 77% 23% 0.07
II 90 61 316 17 13 19 42% 58% 0.06
III 99 76 556 11 9 14 100% 0% 0.03
IV 235 200 1,414 10 45 93 95% 5% 0.07
V 296 189 837 21 25 39 74% 26% 0.05
VI 96 54 232 25 13 26 77% 23% 0.11
VII 81 67 399 12 6 7 29% 71% 0.02
VIII 29 20 106 16 6 9 67% 33% 0.08
IX 190 105 266 43 14 18 67% 33% 0.07
X 30 18 62 29 3 4 100% 0% 0.06
TOTAL 1,250 863 4,500 17 150 251 80% 20% 0.06
*Data obtained from EPA’s Integrated Data for Enforcement Analysis (IDEA) System. For a description of IDEA andthe methods used to obtain this data, refer to Section II.C. A discussion of this table can be found under the heading,Five-Year Enforcement and Compliance Summary, in Section III.

Sector Notebook Data Refresh - 1997 Motor Vehicle Assembly
Sector Notebook Project May 1998T-1
Motor Vehicle Assembly

Sector Notebook Data Refresh - 1997 Motor Vehicle Assembly
Sector Notebook Project May 1998T-2
1995 TRI Releases for Motor Vehicle Facilities (SIC 371) by Number of Facilities Reporting (pounds/year)*
Chemical Name Chemical Air Air Discharges Injection Disposal Releases Per Facility# Reporting Fugitive Point Water Underground Land Total Avg. Releases
Xylene (Mixed Isomers) 197 2,280,326 21,483,874 761 0 0 23,764,961 120,634Copper[M] 182 11,429 24,486 1,082 0 63,783 100,780 554Toluene 180 1,332,844 4,405,560 1,000 0 0 5,739,404 31,886Methyl Ethyl Ketone 156 1,527,741 3,567,338 260 0 0 5,095,339 32,662Certain Glycol Ethers 137 1,421,172 8,522,207 2,910 0 0 9,946,289 72,601Chromium[M] 135 22,674 195,066 664 0 8,307 226,711 1,679Manganese[M] 123 15,345 30,711 1,432 0 755 48,243 392Nickel[C, M] 123 12,494 15,321 578 0 7,108 35,501 289Zinc Compounds[M] 122 83,412 11,958 3,682 0 24,525 123,577 1,013Methanol 121 416,529 2,996,154 5 0 1,000 3,413,688 28,212Phosphoric Acid 108 4,413 54,332 0 0 15,815 74,560 690Ethylene Glycol 104 45,575 331,228 4,950 0 7,150 388,903 3,739Methyl Isobutyl Ketone 93 653,579 6,071,907 5 0 0 6,725,491 72,317N-butyl Alcohol 86 240,177 4,734,103 255 0 0 4,974,535 57,843Ethylbenzene 77 284,165 2,738,099 755 0 0 3,023,019 39,260Nickel Compounds[C, M] 65 2,296 1,542 294 0 260 4,392 68Nitric Acid 64 11,082 30,622 120 0 0 41,824 654Manganese Compounds[M] 63 8,918 3,134 351 0 250 12,653 201Diisocyanates 62 15,407 53,889 0 0 0 69,296 1,118Lead[C, M] 61 1,593 11,252 731 0 0 13,576 2231,2,4-trimethylbenzene 60 446,894 2,021,989 255 0 0 2,469,138 41,152Styrene[C] 60 840,901 1,567,292 5 0 53,608 2,461,806 41,030Chromium Compounds[C, M] 56 5,240 14,404 856 0 781 21,281 380Sodium Nitrite 55 18,854 18,222 304 0 0 37,380 680Benzene[C] 46 9,722 18,330 0 0 0 28,052 610Hydrochloric Acid (1995 and after "Acid 45 25,073 917,866 0 0 0 942,939 20,954Aerosols" Only)Lead Compounds[C, M] 41 692 2,030 526 0 0 3,248 79Nitrate Compounds 37 305 11,469 134,600 0 5 146,379 3,956Trichloroethylene[C] 33 1,017,704 1,785,014 5 0 0 2,802,723 84,931Methyl Tert-butyl Ether 31 44,074 26,353 0 0 0 70,427 2,272Ammonia 30 58,961 256,172 30 0 0 315,163 10,505N-hexane 29 115,502 92,999 0 0 0 208,501 7,190Cyclohexane 28 18,288 59,077 0 0 0 77,365 2,763Copper Compounds[M] 26 773 2,769 518 0 0 4,060 1561,1,1-Trichloroethane[O] 25 676,197 923,051 0 0 0 1,599,248 63,970Dichloromethane[C] 25 101,880 738,947 0 0 0 840,827 33,633Sulfuric Acid 24 1,120 11,415 0 0 0 12,535 522Phenol 22 28,105 245,531 5 0 63,418 337,059 15,321Formaldehyde[C] 21 19,923 184,269 0 0 0 204,192 9,723Barium Compounds[M] 19 220 695 66 0 50,989 51,970 2,735N-methyl-2-pyrrolidone 19 57,870 366,531 0 0 0 424,401 22,337Aluminum (Fume or Dust)[M] 17 37,326 420,653 5 0 250 458,234 26,955Asbestos (Friable)[C] 16 262 2,192 0 0 0 2,454 1531,1-dichloro-1-fluoroethane[O] 16 654,250 29,600 0 0 0 683,850 42,741Di(2-ethylhexyl) Phthalate[C] 11 550 50,891 0 0 0 51,441 4,676Cobalt[C, M] 11 1,014 274 250 0 0 1,538 140Sodium Azide 10 755 34,065 200 0 255 35,275 3,528Sec-butyl Alcohol 9 35,516 153,164 1,106 0 0 189,786 21,087Diethanolamine 9 403 2,183 0 0 0 2,586 287Tetrachloroethylene[C] 9 66,096 243,313 0 0 0 309,409 34,379Zinc (Fume or Dust)[M] 9 4,472 7,722 250 0 0 12,444 1,383Cyanide Compounds 6 11 515 9 0 0 535 89Polychlorinated Alkanes 6 148 5 6,146 0 0 6,299 1,050Cumene 6 9,513 37,104 0 0 0 46,617 7,770Propylene 6 270 35 0 0 0 305 51Chlorodifluoromethane[O] 5 4,699 157,000 0 0 0 161,699 32,340Methyl Methacrylate 5 28,782 11,800 0 0 0 40,582 8,116Chlorine 5 2,301 7 0 0 0 2,308 462Antimony Compounds[M] 4 0 3 5 0 0 8 2Antimony[M] 4 138 190 0 0 0 328 82

Sector Notebook Data Refresh - 1997 Motor Vehicle Assembly
1995 TRI Releases for Motor Vehicle Facilities (SIC 371) by Number of Facilities Reporting (pounds/year)*
Chemical Name Chemical Air Air Discharges Injection Disposal Releases Per Facility# Reporting Fugitive Point Water Underground Land Total Avg. Releases
Sector Notebook Project May 1998T-3
Hydrogen Fluoride 4 260 56,706 0 0 0 56,966 14,242Toluene Diisocyanate (Mixed Isomers)[C] 4 6 280 0 0 0 286 72Silver Compounds[M] 3 11 326 14 0 0 351 117Freon 113[O] 3 27,060 7,400 0 0 0 34,460 11,487Naphthalene 3 324 5,424 0 0 0 5,748 1,916Triethylamine 3 18,529 14,250 0 0 0 32,779 10,926Sodium Dimethyldithiocarbamate 3 5 0 0 0 0 5 2Aluminum Oxide (Fibrous Forms)[M] 3 34 0 0 0 0 34 11Dimethyl Phthalate 2 640 2,559 0 0 0 3,199 1,600Toluene-2,4-Diisocyanate[C] 2 225 5 0 0 0 230 115Barium[M] 2 250 14,478 255 0 0 14,983 7,492Cadmium Compounds[C, M] 1 0 3 0 0 0 3 3Urethane[C] 1 0 0 0 0 0 0 0Formic Acid 1 0 0 0 0 0 0 0Isopropyl Alcohol (Manufacturing, 1 1,632 18,775 0 0 0 20,407 20,407Strong-acid Process Only)Chloromethane 1 14,520 0 0 0 0 14,520 14,520Vinyl Chloride[C] 1 250 24,000 0 0 0 24,250 24,250Tert-butyl Alcohol 1 750 8,500 0 0 0 9,250 9,250Dichlorodifluoromethane[O] 1 6,358 0 0 0 0 6,358 6,358Dicyclopentadiene 1 0 31,000 0 0 0 31,000 31,0004,4'-isopropylidenediphenol 1 0 5 0 0 0 5 5Cumene Hydroperoxide 1 5 690 0 0 0 695 695Toluene-2,6-diisocyanate[C] 1 0 1 0 0 0 1 1M-xylene 1 0 54,400 0 0 0 54,400 54,400Chlorobenzene 1 33,847 22,565 0 0 0 56,412 56,4122-ethoxyethanol 1 7,500 1,400 0 0 0 8,900 8,900Thiram 1 80 0 0 0 0 80 80Butyl Acrylate 1 0 0 0 0 0 0 0Vanadium (Fume or Dust)[M] 1 250 0 5 0 0 255 255Phosphorus (Yellow or White) 1 250 0 5 0 0 255 255
________ _________ _________ _______ __ _______ __________ _______754** 12,838,766 65,979,747 165,255 0 298,259 79,282,027 105,149
[C] Known or suspect carcinogens [M] Metals and metal compounds [O] Ozone depleters* Refer to Section III for a discussion of the TRI data and its limitations, methodology used to obtain this data, definitions of the column headings, and the definitions of carcinogens, metals, and ozone depleters.**Total number of facilities (not chemical reports) reporting to TRI in this industry sector.

Sector Notebook Data Refresh - 1997 Motor Vehicle Assembly
Sector Notebook Project May 1998T-4
1995 TRI Transfers for Motor Vehicle Facilities (SIC 371)by Number of Facilities Reporting (pounds/year)*
Chemical Name Chemical Transfers Transfers Transfers Transfers Transfers Transfers Per Facility# Reporting Potw Disposal Recycling Treatment Recovery Total Avg Transfer
Energy
Xylene (Mixed Isomers) 197 25,310 357,302 14,883,252 772,870 4,191,627 20,230,361 102,692Copper[M] 182 4,575 331,571 33,676,995 27,692 2,275 34,072,074 187,209Toluene 180 3,780 11,933 2,793,394 126,046 1,517,676 4,452,829 24,738Methyl Ethyl Ketone 156 945 1,081 2,681,876 119,690 1,840,656 4,644,248 29,771Certain Glycol Ethers 137 2,284,337 50,451 789,895 264,106 697,045 4,086,084 29,825Chromium[M] 135 2,829 335,751 15,282,853 30,201 618 15,652,252 115,943Manganese[M] 123 4,058 661,808 10,950,734 2,902 94 11,619,596 94,468Nickel[C, M] 123 8,728 148,122 8,659,470 6,464 727 8,823,511 71,736Zinc Compounds[M] 122 55,023 2,011,519 5,527,984 380,909 5,084 7,980,519 65,414Methanol 121 18,352 24,069 1,163,706 190,851 280,283 1,677,261 13,862Phosphoric Acid 108 106,649 78,959 170,590 334,599 16 690,813 6,396Ethylene Glycol 104 262,157 48,053 491,562 217,248 312,567 1,331,587 12,804Methyl Isobutyl Ketone 93 10,356 13,643 9,303,182 116,465 955,733 10,399,379 111,821N-butyl Alcohol 86 29,148 171,220 1,341,630 208,364 525,127 2,275,489 26,459Ethylbenzene 77 1,936 9,035 2,770,686 196,660 858,495 3,836,812 49,829Nickel Compounds[C, M] 65 18,040 207,340 1,548,767 127,570 11 1,901,728 29,257Nitric Acid 64 64,265 340 575,900 248,650 . 889,155 13,893Manganese Compounds[M] 63 31,587 283,517 2,393,275 22,637 276 2,731,292 43,354Diisocyanates 62 0 36,043 34,050 289,961 17,426 377,480 6,088Lead[C, M] 61 2,114 62,913 2,653,143 38,626 128 2,756,924 45,1951,2,4-trimethylbenzene 60 260 2,421 493,624 15,075 222,251 733,631 12,227Styrene[C] 60 0 842,620 5,193 4,392 56,611 908,816 15,147Chromium Compounds[C, M] 56 5,607 328,359 1,102,558 109,989 2,627 1,549,140 27,663Sodium Nitrite 55 734,616 119,541 254 294 . 854,705 15,540Benzene[C] 46 162 260 599 756 5,758 7,535 164Hydrochloric Acid (1995 and after "Acid 45 33,150 7,060 . 5,050 . 45,260 1,006Aerosols" Only)Lead Compounds[C, M] 41 5,960 56,802 876,695 39,427 5,470 984,354 24,009Nitrate Compounds 37 1,894,865 10,277 . 53,182 . 1,958,324 52,928Trichloroethylene[C] 33 987 2,609 858,714 81,842 118,713 1,062,865 32,208Methyl Tert-butyl Ether 31 0 . . 1,022 4,173 5,195 168Ammonia 30 80,500 . . 1,771 . 82,271 2,742N-hexane 29 0 . 3,880 1,900 48,296 54,076 1,865Cyclohexane 28 0 . 250 500 725 1,475 53Copper Compounds[M] 26 4,760 395,898 28,032,967 162,232 768 28,596,625 1,099,8701,1,1-Trichloroethane[O] 25 11 30,100 272,002 2 14,465 316,580 12,663Dichloromethane[C] 25 5 150 649,278 80,076 267,318 996,827 39,873Sulfuric Acid 24 15,000 1,460 . 47,587 . 64,047 2,669Phenol 22 14,213 93,469 . 1,868 11,711 121,261 5,512Formaldehyde[C] 21 1,693 17,560 4,355 81 7,989 31,678 1,508Barium Compounds[M] 19 1,109 128,570 16,374 16,949 3,664 166,666 8,772N-methyl-2-pyrrolidone 19 1,485 2,451 408,867 5,998 313,237 732,038 38,528Aluminum (Fume or Dust)[M] 17 255 64,455 4,908,592 250 . 4,973,552 292,562Asbestos (Friable)[C] 16 0 2,083,200 . 5 . 2,083,205 130,2001,1-dichloro-1-fluoroethane[O] 16 0 5 52,412 43,539 47,600 143,556 8,972Di(2-ethylhexyl) Phthalate[C] 11 46 411 2,600 3,250 1,802 8,109 737Cobalt[C, M] 11 0 2,310 1,541,899 5 . 1,544,214 140,383Sodium Azide 10 980 133,587 522,915 3,911,454 1 4,568,937 456,894Sec-butyl Alcohol 9 755 10,106 . 4,688 3,570 19,119 2,124Diethanolamine 9 82,987 . 14,400 3,317 . 100,704 11,189Tetrachloroethylene[C] 9 0 . 74,599 15,478 17,000 107,077 11,897Zinc (Fume or Dust)[M] 9 505 15,160 520,763 256 . 536,684 59,632Cyanide Compounds 6 42 70 1,802 19,102 . 21,016 3,503Polychlorinated Alkanes 6 1,820 4,731 68,591 123,226 . 198,368 33,061Cumene 6 0 0 910 10 15,757 16,677 2,780Propylene 6 0 . . . . 0 0Chlorodifluoromethane[O] 5 0 . . . 421 421 84Methyl Methacrylate 5 0 . 2,100 80 11 2,191 438Chlorine 5 17,000 . . . . 17,000 3,400Antimony Compounds[M] 4 253 19,978 . 250 . 20,481 5,120

Sector Notebook Data Refresh - 1997 Motor Vehicle Assembly
1995 TRI Transfers for Motor Vehicle Facilities (SIC 371)by Number of Facilities Reporting (pounds/year)*
Chemical Name Chemical Transfers Transfers Transfers Transfers Transfers Transfers Per Facility# Reporting Potw Disposal Recycling Treatment Recovery Total Avg Transfer
Energy
Sector Notebook Project May 1998T-5
Antimony[M] 4 5 10 35,000 251 . 35,266 8,817Hydrogen Fluoride 4 15,756 . . . . 15,756 3,939Toluene Diisocyanate (Mixed Isomers)[C] 4 0 255 . 562 . 817 204Silver Compounds[M] 3 17 . 154,635 9,109 . 163,761 54,587Freon 113[O] 3 0 . 1,667 400 . 2,067 689Naphthalene 3 12 . . . 59 71 24Triethylamine 3 0 16,000 . 9,000 . 25,000 8,333Sodium Dimethyldithiocarbamate 3 250 24,000 . . . 24,250 8,083Aluminum Oxide (Fibrous Forms)[M] 3 181 19,930 . 32,000 . 52,111 17,370Dimethyl Phthalate 2 0 . . . . 0 0Toluene-2,4-Diisocyanate[C] 2 0 . . . . 0 0Barium[M] 2 250 . . 2,571 . 2,821 1,411Cadmium Compounds[C, M] 1 4 . 6,942 3 . 6,949 6,949Urethane[C] 1 1,165 . . . . 1,165 1,165Formic Acid 1 0 . . . . 0 0Isopropyl Alcohol (Manufacturing, 1 0 . . 3,722 663 4,385 4,385Strong-acid Process Only)Chloromethane 1 0 . . . . 0 0Vinyl Chloride[C] 1 0 . . . . 0 0Tert-butyl Alcohol 1 0 . 2,000 . 250 2,250 2,250Dichlorodifluoromethane[O] 1 0 . . . . 0 0Dicyclopentadiene 1 0 . . 2,160 . 2,160 2,1604,4'-isopropylidenediphenol 1 0 . . 9,120 . 9,120 9,120Cumene Hydroperoxide 1 0 . . . . 0 0Toluene-2,6-diisocyanate[C] 1 0 . . . . 0 0M-xylene 1 0 . . 4,600 . 4,600 4,600Chlorobenzene 1 0 . . . . 0 02-ethoxyethanol 1 250 250 . . 250 750 750Thiram 1 0 6,220 . . . 6,220 6,220Butyl Acrylate 1 904 . . . . 904 904Vanadium (Fume or Dust)[M] 1 250 250 . . . 500 500Phosphorus (Yellow or White) 1 250 250 . . . 500 500
________ _________ ________ ___________ _________ __________ ___________ ________754** 5,852,509 9,285,455 158,330,381 8,550,912 12,377,024 194,425,497 257,859
[C] Known or suspect carcinogens [M] Metals and metal compounds [O] Ozone depleters* Refer to Section III for a discussion of the TRI data and its limitations, methodology used to obtain this data, definitions of the column headings, and the definitions of carcinogens, metals, and ozone depleters.**Total number of facilities (not chemical reports) reporting to TRI in this industry sector.

Sector Notebook Data Refresh - 1997 Motor Vehicle Assembly
Being included on this list does not mean that the release is associated with non-compliance with environmental laws.1
Sector Notebook Project May 1998T-6
Ten Largest Volume TRI Releasing Motor Vehicle Facilities Reporting Only SIC 371*
Rank Facility Total TRI Releases in Pounds1
1 Nissan Motor Mfg. Corp. USA, Smyrna, Tennessee 2,579,468
2 Ford Motor Co., Claycomo, Missouri 2,160,536
3 Ford Motor Co., Hazelwood,Missouri 2,056,688
4 Toyota Motor Mfg. Usa Inc., Georgetown, Kentucky 2,027,860
5 Ford Motor Co., Wayne, Michigan 1,904,922
6 MLCG Detroit/hamtramck, Detroit, Michigan 1,621,201
7 Honda of America Mfg. Inc., Marysville, Ohio 1,479,365
8 North American Truck Platforms, Roanoke, Indiana 1,399,561
9 Ford Motor Co., Louisville, Kentucky 1,338,189
10 Subaru-Isuzu Automotive Inc., Lafayette, Indiana 1,256,760
Source: US EPA 1995 Toxics Release Inventory Database.*Refer to Section III for a general discussion of TRI data and its limitations. A discussion of the methodology used todevelop this table can be found under the heading Ten Largest Volume TRI Releasing Facilities.
Ten Largest Volume TRI Releasing Facilities Reporting Only SIC 371 or SIC 371 andOther SIC Codes*
Rank Facility SIC Codes Reported in TRI Pounds1
Total TRIReleases in
1 Nissan Motor Mfg. Corp. Usa, Smyrna, Tennessee 3711 2,579,468
2 Ford Motor Co., Claycomo, Missouri 3711 2,160,536
3 Ford Motor Co., Hazelwood, Missouri 3711 2,056,688
4 Toyota Motor Mfg. USA Inc., Georgetown, Kentucky 3711, 3714 2,027,860
5 Ford Motor Co., Wayne, Michigan 3711 1,904,922
6 MLCG Detroit/Hamtrack, Detroit, Michigan 3711 1,621,201
7 Honda of America Mfg. Inc., Marysville, Ohio 3711 1,479,365
8 North American Truck Platforms, Roanoke, Indiana 3711 1,399,561
9 Ford Motor Co., Louisville,Kentucky 3711 1,338,189
10 Subaru-Isuzu Automotive Inc., Lafayette, Indiana 3711 1,256,760
Source: US EPA Toxics Release Inventory Database, 1995.*Refer to Section III for a general discussion of TRI data and its limitations. A discussion of the methodology used todevelop this table can be found under the heading Ten Largest Volume TRI Releasing Facilities.

Sector Notebook Data Refresh - 1997 Motor Vehicle Assembly
Sector Notebook Project May 1998T-7
Source Reduction and Recycling Activity for Motor Vehicle Assembly (SIC 371) as Reported within TRI*
A B C JOn-Site Off-Site
Year (10 lbs.) Transferred Off-siteRecycled Recovery % Treated Recycled Recovery % Treated
Quantity of %Production- Released
Related % Released andWaste and Disposed% % Energy % % Energy
6 a b
c
D E F G H I
1994 340 80% 13% 1% 9% 43% 4% 3% 30%
1995 349 79% 13% 1% 9% 46% 4% 4% 28%
1996 324 --- 7% 1% 9% 50% 4% 5% 25%
1997 325 --- 7% 1% 9% 50% 4% 4% 25%
Source: 1995 Toxics Release Inventory Database. * Refer to Section III for a general discussion of TRI data and its limitations. A discussion of the methodology used todevelop this table can be found under the heading Source Reduction and Recycling Activity. Within this industry sector, non-production related waste < 1% of production related wastes for 1995.a
Total TRI transfers and releases as reported in Section 5 and 6 of Form R as a percentage of production related wastes.b
Percentage of production related waste released to the environment and transferred off-site for disposal.c

Sector Notebook Data Refresh - 1997 Motor Vehicle Assembly
Sector Notebook Project May 1998T-8
Five-Year Enforcement and Compliance Summary for the Motor Vehicle Assembly Industry*A B C D E F G H I J
Region Facilities Facilities Number of Average Facilities with Total Percent Percent Enforcementin Search Inspected Inspections Months 1 or More Enforcement State Federal to Inspection
Between Enforcement Actions Lead Lead RateInspections Actions Actions Actions
I 58 45 254 14 22 45 53% 47% 0.18
II 32 27 139 14 11 30 83% 17% 0.22
III 73 60 1,252 3 19 30 93% 7% 0.02
IV 297 225 1,528 12 58 91 97% 3% 0.06
V 429 317 1,558 17 60 78 78% 22% 0.05
VI 103 74 337 18 23 41 83% 17% 0.12
VII 96 73 374 15 17 18 50% 50% 0.05
VIII 32 19 85 23 8 10 70% 30% 0.12
IX 90 49 219 25 25 58 93% 7% 0.26
X 50 38 166 18 10 12 67% 33% 0.07
TOTAL 1,260 927 5,912 13 253 413 82% 18% 0.07
*Data obtained from EPA’s Integrated Data for Enforcement Analysis (IDEA) System. For a description of IDEA andthe methods used to obtain this data, refer to Section II.C. A discussion of this table can be found under the heading,Five-Year Enforcement and Compliance Summary, in Section III.

Sector Notebook Data Refresh - 1997 Shipbuilding and Repair
Sector Notebook Project May 1998U-1
Shipbuilding and Repair

Sector Notebook Data Refresh - 1997 Shipbuilding and Repair
Sector Notebook Project May 1998U-2
1995 TRI Releases for Shipbuilding and Repair Facilities (SIC 3731) by Number of Facilities Reporting (pounds/year)*
Chemical Name Chemical Air Air Discharges Injection Disposal Releases Per Facility# Reporting Fugitive Point Water Underground Land Total Avg. Releases
Xylene (Mixed Isomers) 30 853,863 99,379 9,292 0 0 962,534 32,084N-butyl Alcohol 15 278,218 60,802 2,691 0 0 341,711 22,781Copper Compounds[M] 8 91,410 0 3,968 0 250 95,628 11,954Styrene[C] 8 7,209 87,069 250 0 0 94,528 11,816Zinc Compounds[M] 6 75,417 27,278 2,920 0 250 105,865 17,644Zinc (Fume or Dust)[M] 5 81,088 0 8,260 0 0 89,348 17,870Chromium Compounds[C, M] 4 631 7,250 256 0 0 8,137 2,034Methyl Ethyl Ketone 4 77,928 0 0 0 0 77,928 19,482Toluene 4 25,806 30,239 0 0 0 56,045 14,011Propylene 4 755 250 0 0 0 1,005 251Nickel[C, M] 4 20 0 16 0 0 36 9Copper[M] 4 20 0 261 0 0 281 70Nickel Compounds[C, M] 3 30,592 0 294 0 250 31,136 10,379Methanol 3 2,172 13,222 250 0 0 15,644 5,2151,2,4-trimethylbenzene 3 42,399 18,100 0 0 0 60,499 20,166Methyl Isobutyl Ketone 3 55,979 0 0 0 0 55,979 18,660Manganese[M] 3 3,884 0 0 0 0 3,884 1,295Chromium[M] 3 260 0 10 0 0 270 90Lead Compounds[C, M] 2 546 0 261 0 250 1,057 529Manganese Compounds[M] 2 620 0 250 0 250 1,120 560Freon 113[O] 2 14,672 0 0 0 0 14,672 7,336Ethylbenzene 2 16,993 1,159 0 0 0 18,152 9,076Ethylene Glycol 2 256 26 0 0 0 282 141Methyl Tert-butyl Ether 2 425 99,555 250 0 0 100,230 50,115Barium Compounds[M] 1 3,600 0 0 0 0 3,600 3,600Certain Glycol Ethers 1 22,000 5,000 0 0 0 27,000 27,000Benzene[C] 1 426 84,999 0 0 0 85,425 85,4251,1,1-Trichloroethane[O] 1 67,000 0 0 0 0 67,000 67,000Dichloromethane[C] 1 8,400 0 0 0 0 8,400 8,400Dichlorotetrafluoroethane (CFC-114)[O] 1 250 0 0 0 0 250 250Dicyclopentadiene 1 18 6,072 0 0 0 6,090 6,090Trichloroethylene[C] 1 15,600 0 0 0 0 15,600 15,600Cumene 1 7 2,611 0 0 0 2,618 2,6181,2-Dichloroethane[C] 1 31 2,634 0 0 0 2,665 2,665Acrylonitrile[C] 1 250 5 250 0 0 505 505N-hexane 1 57 11,608 0 0 0 11,665 11,6652-ethoxyethanol 1 0 12,975 0 0 0 12,975 12,975Cyclohexane 1 16 3,864 0 0 0 3,880 3,880Lead[C, M] 1 0 0 0 0 0 0 0
___ _________ _______ ______ __ _____ ________ _______43** 1,778,818 574,097 29,479 0 1,250 2,383,644 55,434
[C] Known or suspect carcinogens [M] Metals and metal compounds [O] Ozone depleters* Refer to Section III for a discussion of the TRI data and its limitations, methodology used to obtain this data, definitions of the column headings, and the definitions of carcinogens, metals, and ozone depleters.**Total number of facilities (not chemical reports) reporting to TRI in this industry sector.

Sector Notebook Data Refresh - 1997 Shipbuilding and Repair
Sector Notebook Project May 1998U-3
1995 TRI Transfers for Shipbuilding and Repair Facilities (SIC 3731) by Number of Facilities Reporting (pounds/year)*
Chemical Name # Reporting Potw Disposal Recycling Treatment Recovery Total Avg TransferChemical Transfers Transfers Transfers Transfers Transfers Transfers Per Facility
Energy
Xylene (Mixed Isomers) 30 250 35 223,254 14,020 407,986 645,545 21,518N-butyl Alcohol 15 250 255 24,500 3,620 116,929 145,554 9,704Copper Compounds[M] 8 1,525 3,878 647,200 44,700 . 697,303 87,163Styrene[C] 8 0 2,835 118,127 2,420 30,837 154,219 19,277Zinc Compounds[M] 6 1,950 2,828 . 36,028 . 40,806 6,801Zinc (Fume or Dust)[M] 5 14 229,950 12,240 28,382 1,837 272,423 54,485Chromium Compounds[C, M] 4 261 250 647,200 2,650 . 650,361 162,590Methyl Ethyl Ketone 4 0 . . . 45,705 45,705 11,426Toluene 4 0 15 . 20 15,745 15,780 3,945Propylene 4 0 . . . . 0 0Nickel[C, M] 4 5 2,286 232,848 . . 235,139 58,785Copper[M] 4 5 3,678 251,005 . . 254,688 63,672Nickel Compounds[C, M] 3 251 . . 7,000 . 7,251 2,417Methanol 3 0 5 73,286 20 2,045 75,356 25,1191,2,4-trimethylbenzene 3 0 . . . 33,883 33,883 11,294Methyl Isobutyl Ketone 3 0 . . . 3,615 3,615 1,205Manganese[M] 3 0 . 431,480 . . 431,480 143,827Chromium[M] 3 5 1,000 126,008 . . 127,013 42,338Lead Compounds[C, M] 2 251 900 1,064 3,244 . 5,459 2,730Manganese Compounds[M] 2 0 . . . . 0 0Freon 113[O] 2 0 . 55,438 . . 55,438 27,719Ethylbenzene 2 0 15 . 20 7,214 7,249 3,625Ethylene Glycol 2 250 5 . 20 . 275 138Methyl Tert-butyl Ether 2 0 15 32,736 20 . 32,771 16,386Barium Compounds[M] 1 0 . . 100 . 100 100Certain Glycol Ethers 1 0 . . . 22,000 22,000 22,000Benzene[C] 1 0 15 . 20 . 35 351,1,1-Trichloroethane[O] 1 250 . . . . 250 250Dichloromethane[C] 1 0 . . . 21,500 21,500 21,500Dichlorotetrafluoroethane[O] 1 0 . . . . 0 0Dicyclopentadiene 1 0 15 . 20 . 35 35Trichloroethylene[C] 1 250 . 1,200 250 . 1,700 1,700Cumene 1 0 5 . 20 . 25 251,2-Dichloroethane[C] 1 0 5 . 20 . 25 25Acrylonitrile[C] 1 0 . 69,716 . . 69,716 69,716N-hexane 1 0 15 . 20 . 35 352-ethoxyethanol 1 0 . . . 200 200 200Cyclohexane 1 0 5 . 20 . 25 25Lead[C, M] 1 0 250 . . . 250 250
___ ______ _______ _________ _______ ________ _________ _______43** 5,517 248,260 2,947,302 142,634 709,496 4,053,209 94,261
[C] Known or suspect carcinogens [M] Metals and metal compounds [O] Ozone depleters* Refer to Section III for a discussion of the TRI data and its limitations, methodology used to obtain this data, definitions of the column headings, and the definitions of carcinogens, metals, and ozone depleters.

Sector Notebook Data Refresh - 1997 Shipbuilding and Repair
Being included on this list does not mean that the release is associated with non-compliance with environmental laws.1
Sector Notebook Project May 1998U-4
Ten Largest Volume TRI Releasing Shipbuilding and Repair Facilities Reporting OnlySIC 3731*
Rank Facility Total TRI Releases in Pounds1
1 Newport News Shipbuilding - Newport News, VA 309,000
2 Atlantic Marine Inc. - Mobile, AL 268,670
3 Platzer Shipyard Inc. - Houston, TX 268,442
4 Norshipco - Norfolk, VA 229,000
5 Bethlehem Steel Corp.-Port Arthur, TX 133,020
6 Cascade General, Inc. - Portland, OR 116,929
7 Trinity Industries-Gulfport, MS 90,983
8 Todd Pacific Shipyards - Seattle, WA 85,081
9 Avondale Industries Inc. - Avondale, LA 84,650
10 Jeffboat - Jeffersonville, IN 82,108
Source: US Toxics Release Inventory Database, 1995.*Refer to Section III for a general discussion of TRI data and its limitations. A discussion of the methodology used todevelop this table can be found under the heading Ten Largest Volume TRI Releasing Facilities.
Ten Largest Volume TRI Releasing Facilities Reporting Only SIC 3731 or SIC 3731 andOther SIC Codes*
Rank Facility SIC Codes Reported in TRI Pounds1
Total TRIReleases in
1 Ingalls Shipbuilding Inc. - Pascagoula, MS 3,731, 3441 723,560
2 Newport News Shipbuilding - Newport News, VA 3731 309,000
3 Atlantic Marine Inc. - Mobile, AL 3731 268,670
4 Platzer Shipyard Inc. - Houston, TX 3731 268,442
5 Norshipco - Norfolk, VA 3731 229,000
6 Gunderson Inc. - Portland, OR 3743, 3731 133,020
7 Bethlethem Steel Corp. - Port Arthur, TX 3731 116,929
8 Cascade General Inc. - Portland, OR 3731 90,983
9 Trinity Ind. - Gulfport, MS 3731 85,081
10 Todd Pacific Shipyards - Seattle, WA 3731 84,650
Source: US Toxics Release Inventory Database, 1995.*Refer to Section III for a general discussion of TRI data and its limitations. A discussion of the methodology used todevelop this table can be found under the heading Ten Largest Volume TRI Releasing Facilities.

Sector Notebook Data Refresh - 1997 Shipbuilding and Repair
Sector Notebook Project May 1998U-5
Source Reduction and Recycling Activity for Shipbuilding and Repair Facilities (SIC 3731)as Reported within TRI*
A B C JOn-Site Off-Site
Year (10 lbs.) Transferred Off-siteRecycled Recovery % Treated Recycled Recovery % Treated
Quantity of %Production- Released
Related % Released andWaste and Disposed% % Energy % % Energy
6 a b
c
D E F G H I
1994 5.32 113% 1.1% 0.0% 0.7% 36.1% 12.6% 3.6% 46%
1995 6.45 100% 0.5% 0.0% 0.7% 45.7% 11.2% 2.2% 44%
1996 5.62 --- 0.7% 0.0% 0.7% 40.1% 11.3% 3.1% 44%
1997 5.59 --- 0.8% 0.0% 0.7% 40.6% 11.1% 3.1% 44%
Source: 1995 Toxics Release Inventory Database. * Refer to Section III for a general discussion of TRI data and its limitations. A discussion of the methodology used todevelop this table can be found under the heading Source Reduction and Recycling Activity. Within this industry sector, non-production related waste < 1% of production related wastes for 1995.a
Total TRI transfers and releases as reported in Section 5 and 6 of Form R as a percentage of production related wastes.b
Percentage of production related waste released to the environment and transferred off-site for disposal.c

Sector Notebook Data Refresh - 1997 Shipbuilding and Repair
Sector Notebook Project May 1998U-6
Five-Year Enforcement and Compliance Summary for the Shipbuilding and Repair Industry*
A B C D E F G H I JRegion Facilities Facilities Number of Average Facilities with Total Percent Percent Enforcement
in Search Inspected Inspections Months 1 or More Enforcement State Federal to InspectionBetween Enforcement Actions Lead Lead Rate
Inspections Actions Actions Actions
I 6 6 34 11 4 6 83% 17% 0.18
II 0 0 0 -- 0 0 0% 0% --
III 6 5 66 5 1 1 100% 0% 0.02
IV 13 9 49 16 5 8 100% 0% 0.16
V 1 1 8 8 0 0 0% 0% --
VI 13 12 72 11 8 14 79% 21% 0.19
VII 0 0 0 -- 0 0 0% 0% --
VIII 0 0 0 -- 0 0 0% 0% --
IX 2 1 6 20 0 0 0% 0% --
X 3 3 8 23 2 3 67% 33% 0.38
TOTAL 44 37 243 9 20 32 84% 16% 0.13
*Data obtained from EPA’s Integrated Data for Enforcement Analysis (IDEA) System. For a description of IDEA andthe methods used to obtain this data, refer to Section II.C. A discussion of this table can be found under the heading,Five-Year Enforcement and Compliance Summary, in Section III.

Sector Notebook Data Refresh - 1997 Ground Transportation
Sector Notebook Project May 1998V-1
Ground Transportation

Sector Notebook Data Refresh - 1997 Ground Transportation
Sector Notebook Project May 1998V-2
Five-Year Enforcement and Compliance Summary for the Ground Transportation Industry*A B C D E F G H I J
Region Facilities Facilities Number of Average Facilities with Total Percent Percent Enforcementin Search Inspected Inspections Months 1 or More Enforcement State Federal to Inspection
Between Enforcement Actions Lead Lead RateInspections Actions Actions Actions
I 280 72 274 61 13 19 84% 16% 0.07
II 314 130 918 21 40 103 84% 16% 0.11
III 623 296 1,737 22 51 85 96% 4% 0.05
IV 1,268 602 2,464 31 63 110 89% 11% 0.04
V 673 317 1,416 29 26 43 47% 53% 0.03
VI 2,180 892 2,889 45 93 200 85% 15% 0.07
VII 880 453 1,661 32 28 46 76% 24% 0.03
VIII 642 201 518 74 11 48 90% 10% 0.09
IX 317 165 748 25 31 93 94% 6% 0.12
X 609 135 279 131 19 27 48% 52% 0.10
TOTAL 7,786 3,263 12,904 36 375 774 84% 16% 0.06
*Data obtained from EPA’s Integrated Data for Enforcement Analysis (IDEA) System. For a description of IDEA andthe methods used to obtain this data, refer to Section II.C. A discussion of this table can be found under the heading,Five-Year Enforcement and Compliance Summary, in Section III.

Sector Notebook Data Refresh - 1997 Water Transportation
Sector Notebook Project May 1998W-1
Water Transportation

Sector Notebook Data Refresh - 1997 Water Transportation
Sector Notebook Project May 1998W-2
Five-Year Enforcement and Compliance Summary for the Water Transportation Industry*A B C D E F G H I J
Region Facilities Facilities Number of Average Facilities with Total Percent Percent Enforcementin Search Inspected Inspections Months 1 or More Enforcement State Federal to Inspection
Between Enforcement Actions Lead Lead RateInspections Actions Actions Actions
I 26 2 8 195 1 1 100% 0% 0.13
II 51 12 201 15 5 20 45% 55% 0.10
III 54 12 61 53 1 1 100% 0% 0.02
IV 77 47 167 28 6 9 100% 0% 0.05
V 51 35 153 20 2 4 75% 25% 0.03
VI 94 34 118 48 14 22 73% 27% 0.19
VII 15 10 24 38 1 1 0% 100% 0.04
VIII 3 2 2 90 0 0 0% 0% --
IX 9 6 22 25 0 0 0% 0% --
X 134 32 60 134 6 12 33% 67% 0.20
TOTAL 514 192 816 38 36 70 61% 39% 0.09
*Data obtained from EPA’s Integrated Data for Enforcement Analysis (IDEA) System. For a description of IDEA andthe methods used to obtain this data, refer to Section II.C. A discussion of this table can be found under the heading,Five-Year Enforcement and Compliance Summary, in Section III.

Sector Notebook Data Refresh - 1997 Air Transportation
Sector Notebook Project May 1998X-1
Air Transportation

Sector Notebook Data Refresh - 1997 Air Transportation
Sector Notebook Project May 1998X-2
Five-Year Enforcement and Compliance Summary for the Air Transportation Industry*A B C D E F G H I J
Region Facilities Facilities Number of Average Facilities with Total Percent Percent Enforcementin Search Inspected Inspections Months 1 or More Enforcement State Federal to Inspection
Between Enforcement Actions Lead Lead RateInspections Actions Actions Actions
I 23 4 18 77 3 4 50% 50% 0.22
II 19 13 56 20 5 17 88% 12% 0.30
III 46 25 137 20 3 4 100% 0% 0.03
IV 132 95 402 20 16 37 100% 0% 0.09
V 23 15 89 16 4 8 50% 50% 0.09
VI 37 17 53 42 5 6 100% 0% 0.11
VII 31 13 58 32 1 2 0% 100% 0.03
VIII 21 9 14 90 2 4 100% 0% 0.29
IX 27 14 82 20 5 8 100% 0% 0.10
X 85 26 64 80 4 7 71% 29% 0.11
TOTAL 444 231 973 27 48 97 88% 12% 0.10
*Data obtained from EPA’s Integrated Data for Enforcement Analysis (IDEA) System. For a description of IDEA andthe methods used to obtain this data, refer to Section II.C. A discussion of this table can be found under the heading,Five-Year Enforcement and Compliance Summary, in Section III.

Sector Notebook Data Refresh - 1997 Fossil Fuel Electric Power
Sector Notebook Project May 1998Y-1
Fossil Fuel Electric Power

Sector Notebook Data Refresh - 1997 Fossil Fuel Electric Power
Sector Notebook Project May 1998Y-2
Five-Year Enforcement and Compliance Summary for the Fossil Fuel Electric Power Industry*A B C D E F G H I J
Region Facilities Facilities Number of Average Facilities with Total Percent Percent Enforcementin Search Inspected Inspections Months 1 or More Enforcement State Federal to Inspection
Between Enforcement Actions Lead Lead RateInspections Actions Actions Actions
I 250 140 664 23 36 55 84% 16% 0.08
II 269 199 1,455 11 75 187 84% 16% 0.13
III 305 221 1,997 9 57 130 87% 13% 0.07
IV 559 353 3,039 11 45 84 82% 18% 0.03
V 552 344 2,287 14 76 134 69% 31% 0.06
VI 315 222 1,079 18 30 61 54% 46% 0.06
VII 409 259 1,170 21 22 28 36% 64% 0.02
VIII 134 91 643 13 15 35 60% 40% 0.05
IX 273 251 1622 10 38 57 84% 16% 0.04
X 204 86 254 48 9 18 61% 39% 0.07
TOTAL 3,270 2,166 14,210 14 403 789 76% 24% 0.06
*Data obtained from EPA’s Integrated Data for Enforcement Analysis (IDEA) System. For a description of IDEA andthe methods used to obtain this data, refer to Section II.C. A discussion of this table can be found under the heading,Five-Year Enforcement and Compliance Summary, in Section III.
Sector Notebook Data Refresh - 1997 Dry Cleaning
Sector Notebook Project May 1998Z-1
Dry Cleaning

Sector Notebook Data Refresh - 1997 Dry Cleaning
Sector Notebook Project May 1998Z-2
Five-Year Enforcement and Compliance Summary for the Dry Cleaning Industry*
A B C D E F G H I JRegion Facilities Facilities Number of Average Facilities with Total Percent Percent Enforcement
in Search Inspected Inspections Months 1 or More Enforcement State Federal to InspectionBetween Enforcement Actions Lead Lead Rate
Inspections Actions Actions Actions
I 306 104 155 118 4 4 100% 0% 0.03
II 331 245 319 62 2 2 100% 0% 0.01
III 3,006 783 1,089 166 14 17 94% 6% 0.02
IV 724 355 851 51 27 34 100% 0% 0.04
V 239 101 217 66 3 3 100% 0% 0.01
VI 452 348 365 74 1 1 100% 0% 0
VII 235 77 237 59 2 3 33% 67% 0.01
VIII 438 271 437 60 2 2 100% 0% 0.00
IX 40 19 83 29 0 0 0% 0% --
X 292 57 60 292 0 0 0% 0% --
TOTAL 6,063 2,360 3,813 95 55 66 95% 5% 0.02
*Data obtained from EPA’s Integrated Data for Enforcement Analysis (IDEA) System. For a description of IDEA andthe methods used to obtain this data, refer to Section II.C. A discussion of this table can be found under the heading,Five-Year Enforcement and Compliance Summary, in Section III.