Embed Size (px)
Citation preview

EPA/540/AR-93/508August 1993
EPA RREL’sMobile Volume Reduction Unit
Applications Analysis Report
Risk Reduction Engineering LaboratoryOffice of Research and Development
U.S. Environmental Protection AgencyCincinnati, Ohio 45268
@ Printed on Recycled Paper

Notice
The information in this document has been funded by the U.S. Environmental Protection Agency (EPA) under theauspices of the Superfund Innovative Technology Evaluation (SITE) Program under Contract No. 68-C0- 0048 to ScienceApplications International Corporation (SAIC). It has been subjected to the Agency’s peer and administrative review,and it has been approved for publications as an EPA document. Mention of trade names or commercial products doesnot constitute an endorsement or recommendation for use.
1 1

Foreword
The Superfund Innovative Technology Evaluation (SITE) Program was authorized in the 1986 Superfund Amendments.The Program is a joint effort between the U.S. Environmental Protection Agency’s (EPA) Offrce of Research andDevelopment and Office of Solid Waste and Emergency Response. The purpose of the program is to enhance thedevelopment of hazardous waste treatment technologies necessary for implementing new cleanup standards that requiregreater reliance on permanent remedies. This is accomplished by performing technology demonstrations designed toprovide engineering and economic data on selected technologies.
This project consists of an analysis of the EPA Risk Reduction Engineering Laboratory’s mobile Volume Reduction Unit.The Demonstration Test took place at the Escambia Treating Company Superfund Site in Pensacola, Florida. The goalsof the study, summarized in this Applications Analysis Report, are: 1) to evaluate the technical effectiveness andeconomics of this technology relative to its ability to treat soils contaminated with organics; and 2) to establish thepotential applicabilty of the process to other wastes and Superfund sites. The primary technical objective of this projectis to determine the abiity of the process to reduce the concentration of organic contaminants in contaminated soilthrough particle size separation and solubilization.
Additional copies of this report may be obtained at no charge from the EPA’s Center for Environmental ResearchInformation, 26 West Martin Luther King Drive, Cincinnati, Ohio 45268, using the EPA document number found on thereport’s front cover. Once this supply is exhausted, copies can be purchased from the National Technical InformationService, Ravensworth Building, Springfield, Virginia 22161, (800) 553-6847. Reference copies will be available in theHazardous Waste Collection at EPA libraries. Information regarding the availablity of other reports can be obtainedby calling the Offrce of Research and Development Publications at (513) 569-7562. To obtain further informationregarding the SITE Program and other projects within SITE, telephone (513) 569-7696.
E. Timothy Oppelt, DirectorRisk Reduction Engineering Laboratory
. . .m
Abstract
This document is an evaluation of the performance of the U.S. Environmental Protection Agency (EPA) Risk ReductionEngineering Laboratory’s (RREL’s) mobile Volume Reduction Unit (VRU) and its applicability as a treatment techniquefor soils contaminated with organics. Both the technical and economic aspects of the technology were examined.
A demonstration of the VRU was conducted in the fall of 1992 using RREL’s pilot-scale unit at the Escambia TreatingCompany Superfund Site in Pensacola, Florida. Operational data and sampling and analysis information were carefullycompiled to establish a database against which other available data, as well as the project objectives for thedemonstration, could be compared and evaluated. Conclusions concerning the technology’s suitability for use in treatingcontaminated soils with organic compounds through particle size separation and solubiition were reached.Extrapolations regarding applications to different contaminants and soil types were made.
Under optimal conditions, when surfactant was added and pH and temperature of the wash water were increased, theVRU achieved average removal efficiencies of 97 percent for pentachlorophenol (PCP) and 95 percent for polynucleararomatic hydrocarbon (PAH) contaminants. In addition, 86 percent of the solids in the feed soil were returned as washedsoil (on a normalized basis).
iv
Contents
Section
Notice ...........................................................................Foreword .........................................................................Abstract . . . . . . . . . . . . . . . . . . . . . . . . . . . . . . . . . . . . . . . . . . . . . . . . . . . . . . . . . . . . . . . . . . . . . . . . . .Contents . . . . . . . . . . . . . . . . . . . . . . . . . . . . . . . . . . . . . . . . . . . . . . . . . . . . . . . . . . . . . . . . . . . . . . . . .Tables ...........................................................................Figure ...........................................................................Abbreviations . . . . . . . . . . . . . . . . . . . . . . . . . . . . . . . . . . . . . . . . . . . . . . . . . . . . . . . . . . . . . . . . . . . . . .Acknowledgments ...................................................................
1.
2.
3.
Executive Summary ...............................................................
1.1 Introduction ................................................................1.2 Conclusions ................................................................1.3 Results . . . . . . . . . . . . . . . . . . . . . . . . . . . . . . . . . . . . . . . . . . . . . . . . . . . . . . . . . . . . . . . . . . . .
Introduction . . . . . . . . . . . . . . . . . . . . . . . . . . . . . . . . . . . . . . . . . . . . . . . . . . . . . . . . . . . . . . . . . . . .
1
112
3
2.1 The SITE Program ........................................................... 32.2 SITE Program Reports . . . . . . . . . . . . . . . . . . . . . . . . . . . . . . . . . . . . . . . . . . . . . . . . . . . . . . . . 32.3 Key Contacts ............................................................... 4
Technology Applications Analysis ..................................................... 5
3.1 Introduction ................................................................ 53.2 Conclusions . . . . . . . . . . . . . . . . . . . . . . . . . . . . . . . . . . . . . . . . . . . . . . . . . . . . . . . . . . . . . . . . 53.3 Technology Evaluation ........................................................ 6
3.3.1 VRU Operating Conditions ............................................... 63.3.2 Contaminant Removal Efficiencies .......................................... 73.3.3 Washed Soils Recovery .................................................. 83.3.4 MassBalancess . . . . . . . . . . . . . . . . . . . . . . . . . . . . . . . . . . . . . . . . . . . . . . . . . . . . . . . . 93.3.5 Particle Size and Fines Distribution ......................................... 93.3.6 Water Treatment Effectiveness ............................................ 10
3.4 Ranges of Site Characteristics Suitable for the Technology .............................. 113.4.1 Site Selection ......................................................... 113.4.2 Load, Surface, and Subsurface Requirements .................................. 113.4.3 Clearance and Site Area Requirements ...................................... 113.4.4 Climate Characteristics .................................................. 11
Page
iiiiiivV
Viii
X
Xi
xiii
V

Contents (Continued)
Section Page
3.45 Geological and Topographical Characteristics .................................. 12
3.4.6 Utility Requirements . . . . . . . . . . . . . . . . . . . . . . . . . . . . . . . . . . . . . . . . . . . . . . . . . . . . 12
3.4.7 Size of Operation ...................................................... 12
3.5 Applicable Wastes ........................................................... 12
3.6 Regulatory Requirements ...................................................... 12
3.6.1 Federal Regulations .................................................... 133.6.1.1 Clean Air Act (CAA) . . . . . . . . . . . . . . . . . . . . . . . . . . . . . . . . . . . . . . . . . . . . . 133.6.1.2 CERCLA . . . . . . . . . . . . . . . . . . . . . . . . . . . . . . . . . . . . . . . . . . . . . . . . . . . . . . 133.6.1.3 RCRA ........................................................ 143.6.1.4 CWA ......................................................... 143.6.1.5 Safe Drinking Water Act (SDWA) . . . . . . . . . . . . . . . . . . . . . . . . . . . . . . . . . . . . 143.6.1.6 Toxic Substances Control Act (TSCA)) . . . . . . . . . . . . . . . . . . . . . . . . . . . . . . . . . 14
3.6.2 State and Local Regulations .............................................. 153.7 Personnel Issues ............................................................. 15
3.7.1 Training ............................................................. I53.7.2 Health and Safety ...................................................... 153.73 Emergency Response ................................................... 15
3.8 References ................................................................. 15
4. Economic Analysis . . . . . . . . . . . . . . . . . . . . . . . . . . . . . . . . . . . . . . . . . . . . . . . . . . . . . . . . . . . . . . . 16
4.1 Introduction ................................................................ 164.2 Conclusions ................................................................ 164.3 Issues and Assumptions ........................................................ 16
4.3.1 Costs Excluded from Estimate . . . . . . . . . . . . . . . . . . . . . . . . . . . . . . . . . . . . . . . . . . . . . 164.3.2 Utilities ............................................................. 164.3.3 Operating Times ....................................................... 174.3.4 Labor Requirements .................................................... 174.3.5 Capital Costs ......................................................... 174.3.6 Equipment and Fixed Costs . . . . . . . . . . . . . . . . . . . . . . . . . . . . . . . . . . . . . . . . . . . . . . . 18
4.4 Basis of Economic Analysis ..................................................... 184.4.1 Site Preparation Costs ................................................... 184.4.2 Permitting and Regulatory Costs . . . . . . . . . . . . . . . . . . . . . . . . . . . . . . . . . . . . . . . . . . . 184.4.3 Equipment Costs ...................................................... 184.4.4 Startup and Fixed Costs . . . . . . . . . . . . . . . . . . . . . . . . . . . . . . . . . . . . . . . . . . . . . . . . . 194.4.5 Labor Costs .......................................................... 204.4.6 Supplies Costs ........................................................ 204.4.7 Consumables Costs ..................................................... 204.4.8 Effluent Treatment and Disposal Costs . . . . . . . . . . . . . . . . . . . . . . . . . . . . . . . . . . . . . . 204.4.9 Residuals and Waste Shipping, Handling, and Transport Costs ..................... 214.4.10 Analytical Costs ....................................................... 214.4.11 Facility Modification, Repair, and Replacement Costs . . . . . . . . . . . . . . . . . . . . . . . . . . . 214.4.12 Site Demobilization Costs ................................................ 21
4.5 Results of Economic Analysis ................................................... 214.6 References ................................................................. 24
vi

Contents (Continued)
Section Page
Appendix A - Process Description . . . . . . . . . . . . . . . . . . . . . . . . . . . . . . . . . . . . . . . . . . . . . . . . . . . . . . . 25
A.1 Introduction ............................................................. 25A.2 Process Description . . . . . . . . . . . . . . . . . . . . . . . . . . . . . . . . . . . . . . . . . . . . . . . . . . . . . . . . . . 25A.3 References ............................................................... 27
Appendix B - Developer Claims . . . . . . . . . . . . . . . . . . . . . . . . . . . . . . . . . . . . . . . . . . . . . . . . . . . . . . . . 29
B.l Introduction . . . . . . . . . . . . . . . . . . . . . . . . . . . . . . . . . . . . . . . . . . . . . . . . . . . . . . . . . . . . . . . . 29B.2 SITE Demonstration Claims . . . . . . . . . . . . . . . . . . . . . . . . . . . . . . . . . . . . . . . . . . . . . . . . . . . . 29
Appendix C - SITE Demonstration Results . . . . . . . . . . . . . . . . . . . . . . . . . . . . . . . . . . . . . . . . . . . . . . . . 31
C.1 Introduction ..............................................................C.2 Operating Conditions . . . . . . . . . . . . . . . . . . . . . . . . . . . . . . . . . . . . . . . . . . . . . . . . . . . . . . . . . .C.3 Contaminant Removal . . . . . . . . . . . . . . . . . . . . . . . . . . . . . . . . . . . . . . . . . . . . . . . . . . . . . . . . . .C.4 Washed Soils Recovery . . . . . . . . . . . . . . . . . . . . . . . . . . . . . . . . . . . . . . . . . . . . . . . . . . . . . . . . .C.5 Mass Balances ............................................................
C.5.1 Total Material ......................................................C.5.2 Dry Solids ........................................................C.5.3 PCPP . . . . . . . . . . . . . . . . . . . . . . . . . . . . . . . . . . . . . . . . . . . . . . . . . . . . . . . . . . . . . . . .C.5.4 PAHS .............................................................
C.6 Particle Size and Fines Distributions . . . . . . . . . . . . . . . . . . . . . . . . . . . . . . . . . . . . . . . . . . . . . .C.7 Water Treatment Effectiveness ................................................C.8 References ................................................................
313132333434343636373742
Appendix D - Case Studies . . . . . . . . . . . . . . . . . . . . . . . . . . . . . . . . . . . . . . . . . . . . . . . . . . . . . . . . . . 43
D.l Bench-and Pilot-Scale Treatment of Soil from a Wood Treating Facility .................... 43D.2 Pilot-Scale Treatment of Pesticide-Contaminated Soil . . . . . . . . . . . . . . . . . . . . . . . . . . . . . . . . . . 43
vii

Tables
Number
1
2
3
4
5
6
7
8
9
10
11
12
13
14
15
16
17
18
19
20
VRU SITE Demonstration Test Results . . . . . . . . . . . . . . . . . . . . . . . . . . . . . . . . . . . . . . . . . . . . .
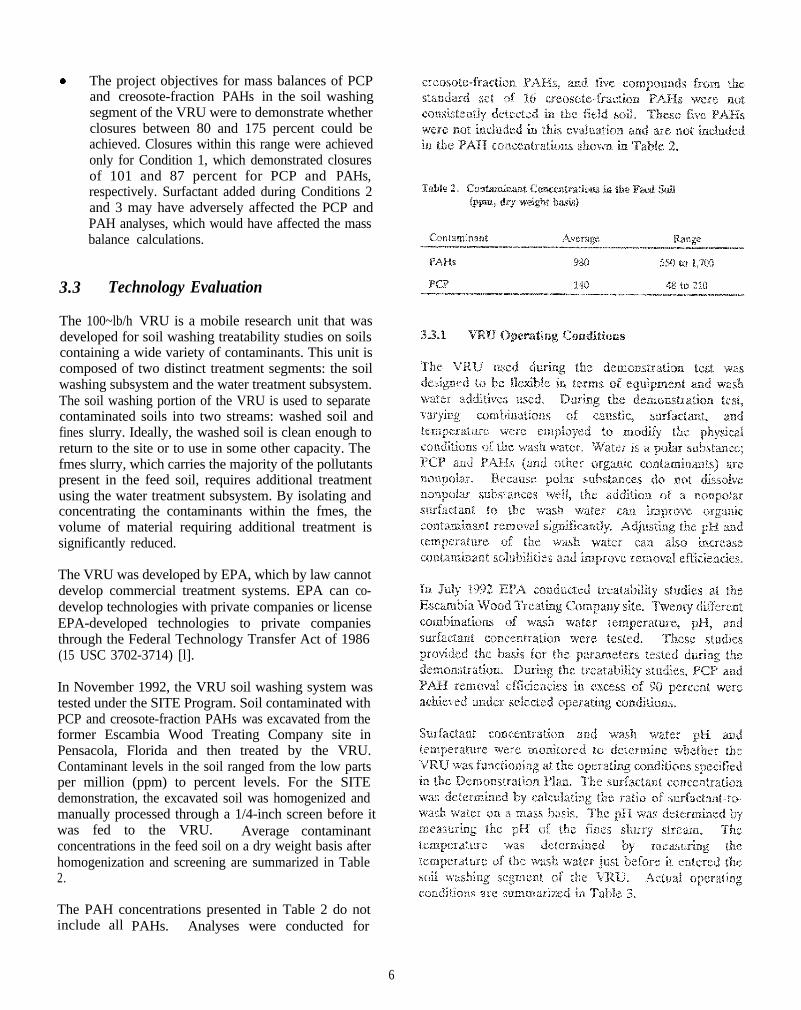
Contaminant Concentrations in the Feed Soil . . . . . . . . . . . . . . . . . . . . . . . . . . . . . . . . . . . . . . . . .
VRU SITE Demonstration Operating Conditions . . . . . . . . . . . . . . . . . . . . . . . . . . . . . . . . . . . . . .
PCP Reductions from Feed Soil to Washed Soil . . . . . . . . . . . . . . . . . . . . . . . . . . . . . . . . . . . . . . .
PAH Reductions from Feed Soil to Washed Soil ....................................
Washed Soil Residual Contaminant Concentrations ...................................
Feed Soil Recovered as Washed Soil .............................................
Average Mass Balance Closures . . . . . . . . . . . . . . . . . . . . . . . . . . . . . . . . . . . . . . . . . . . . . . . . . . .
Distribution of Fines & Coarse Gravel and Sand . . . . . . . . . . . . . . . . . . . . . . . . . . . . . . . . . . . . . .
Average PCP and PAH Concentrations in CPI Underflow & Floc/Clarifier Solids .............
Water Treatment Subsystem Effluent Quality ........................................
Proportional Costs of Major Fixed Capital Investment Components ........................
Excavation Costs . . . . . . . . . . . . . . . . . . . . . . . . . . . . . . . . . . . . . . . . . . . . . . . . . . . . . . . . . . . . . . . .
Fully Burdened Salaries for Onsite Personnel Using lo-tph VRU . . . . . . . . . . . . . . . . . . . . . . . . . . . 2 0
Treatment Costs for lo-tph VRU Treating 20,000 Tons of Contaminated Soil .................
Treatment Costs as Percentages of Total Costs for lo-tph VRUTreating 20,000 Tons of Contaminated Soil ..........................................
Treatment Costs for lo-tph VRU Operating with a 90% On-line Factor ....................
Treatment Costs as % of Total Costs for lo-tph VRU Operating with a 90% On-line Factor ......
Treatment Costs for the Remediation of 200,000 Tons of Contaminated Soil Usingthe VRU Operating with a 90% On-line Factor .......................................
Trcatmcnt Costs as Percentages of Total Costs for VRUTreating 200,000 Tons of Contaminated Soil .......................................
viii
Page
2
6
7
8
8
8
9
9
10
10
11
17
18
222222
22
22
23
23
24
24

Tables (Continued)
Number
C-l
C-2
C-3
C-4
C-5
C-6
C-7
C-8
C-9
C-10
C-11
C-12
C-13
C-14
C- l5
C-16
D-l
D-2
Average Contaminant Concentrations in the Feed Soil . . . . . . . . . . . . . . . . . . . . . . . . . . . . . . . . . .
VRU SITE Demonstration Operating Conditions . . . . . . . . . . . . . . . . . . . . . . . . . . . . . . . . . . . . . .
Removal Efficiencies for PCP and PAHs . . . . . . . . . . . . . . . . . . . . . . . . . . . . . . . . . . . . . . . . . . .
Feed Soil Recovered as Washed Soil . . . . . . . . . . . . . . . . . . . . . . . . . . . . . . . . . . . . . . . . . . . . . . .
Total Material Mass Balance ...................................................
Dry Solids Mass Balance ......................................................
PCP Mass Balance ..........................................................
PAH Mass Balance ..........................................................
Particle Size Distribution within the Feed Soil,Washed Soil, and Fines Slurry ..................................................
Particle Size Distribution within the Underflow fromthe CPI and Floc Tankk . . . . . . . . . . . . . . . . . . . . . . . . . . . . . . . . . . . . . . . . . . . . . . . . . . . . . . .
Disposition of Fines ...........................................................
Disposition of Coarse Gravel and Sand ............................................
PCP Concentration in Fines Slurry Solids ...........................................
PAHs Concentration in Fines Slurry Solids ..........................................
TOC Levels in Water Streams . . . . . . . . . . . . . . . . . . . . . . . . . . . . . . . . . . . . . . . . . . . . . . . . . . . . .
TR Levels in Water Streams ....................................................
Heptachlor Results ...........................................................
DieldrinResults . . . . . . . . . . . . . . . . . . . . . . . . . . . . . . . . . . . . . . . . . . . . . . . . . . . . . . . . . . . . . . . .
Page
31
32
33
34
35
35
36
37
38
39
40
40
40
40
41
41
44
44
ix
x

Abbreviations
ASTM
CERCLA
cfm
CPI
CPR
CWA
DRE
EPA
gph
gpm
kWh
MCL
MSW
NAAQS
NPDES
ORD
Applications Analysis Report
Applicable or Relevant and AppropriateRequirements
American Society for Testing and Materials
Clean Air Act
Comprehensive Environmental Response,Compensation, and Liability Act
cubic feet per minute
Code of Federal Regulations
Corrugated Plate Interceptor
cardiopulmonary resuscitation
Clean Water Act
destruction and removal efficiency
U.S. Environmental Protection Agency
gallons per hour
gallons per minute
kilowatt hours
maximum contaminant level
Municipal Solid Waste
National Ambient Air Quality Standards
National Pollutant Discharge EliminationSystem
Office of Research and Development
osc
OSHA
OSWER
PAH
PCB
PCP
PPE
ppm
POTW
psi
psig
RCRA
RPM
RREL
SARA
SDWA
SITE
S V O C
TCLP
TDS
xi
On-scene Coordinator
Occupational Safety and Health Act
Office of Solid Waste and EmergencyResponse
polynuclear aromatic hydrocarbon
polychlorinated biphenyls
Pentachlorophenol
personal protective equipment
parts per million
Publicly-Owned Treatment Works
pounds per square inch
pounds per square inch gauge
Resource Conservation and Recovery Act
Remedial Project Manager
Risk Reduction Engineering Laboratory
Superfund Amendments ReauthorizationAct
Safe Drinking Water Act
Superfund Innovative TechnologyEvaluation
semi-volatile organic compound
Toxicity Characteristic Leaching Procedure
total dissolved solids

TER Technology Evaluation Report
TOC total organic carbon
tph tons per hour
tpd tons per day
TR total residue
Abbreviations (Continued)
TSD
TSS
V O C
VRU
Treatment, Storage, and Disposal
total suspended solids
volatile organic compounds
Volume Reduction Unit
xii

Acknowledgments
This report was prepared under the direction and coordination of Teri Richardson, U.S. Envimomental ProtectionAgency (EPA) Superfund Innovative Technology Evaluation (SITE) Program Manager in the Risk ReductionEngineering Laboratory (RREL), Cincinnati, Ohio. The EPA (RREL, Cincinnati) contributors and reviewers for thisreport were Ms. Laurel Staley and Mr. Jack Hubbard. The EPA (RREL, Edison) contributor and reviewer was Mr.Richard Griffith.
This report was prepared for EPA’s SITE Program by the Technology Evaluation Division of Science ApplicationsInternational Corporation (SAIC) in Cincinnati, Ohio for the U.S. EPA under Contract No. 68-CO-0048. The WorkAssignment Manager for this project was Ms. Margaret M. Groeber.
This report is dedicated to the memory of Mr. Patrick Augustin.
xiiix.xll

Section 1
Executive Summary
1.1 Introduction
This report summarizes the findings of an evaluation ofthe mobile Volume Reduction Unit (VRU) developed bythe U.S. Environmental Protection Agency (EPA) RiskReduction Engineering Laboratory (RREL). The studywas conducted under the Superfund Innovative TechnologyEvaluation (SITE) Program. A demonstration test and anevaluation of the VRU technology were performed byEPA as part of this study. The results of this test andsupporting data from other testing performed by RRELconstitute the basis for this report.
1.2 Conclusions
The demonstration took place at the former EscambiaWood Treating Company site in Pensacola, Floridabetween November 5 and November 13, 1992. The 26-acre facility, now closed, used pentachiorophenol (PCP)and creosote to treat wood products from 1943 to 1982.The site is currently undergoing a Superfund cleanup beingmanaged by EPA Region IV.
During the demonstration, the VRU operated at a feedrate of approximately 100 lbs/h with a wash water-to-feedratio of about 6 to 1. The physical condition of the washwater was modified during the demonstration as follows:
* Condition 1: no surfactant, no pH adjustment, notemperature adjustment
l Condition 2: surfactant addition, no pH adjustment,no temperature adjustment
Condition 3: surfactant addition, pH adjustment,temperature adjustment
The VRU soil washing system successfuliy separated thecontaminated soil into two unique streams: washed soiland fines slurry. The washed soil was safely returned tothe site following treatment. The fines slurry, which
carried the majority of the pollutants from the feed soil,underwent additional treatment to separate the fines andcontaminants from the water.
A review of the demonstration test data, as compared tothe established project objectives, indicates the followingresults:
One of the project objectives was to demonstrate theVRUs abilty to achieve an average PCP removalfrom the feed soil of 90 percent or greater. AveragePCP removals were 76, 92, and 97 percent forConditions 1, 2, and 3, respectively.
A second project objective was to demonstrate theVRUs abilty to achieve an average creosote-fractionpolynuclear aromatic hydrocarbon (PAH) removalfrom the feed soil of 90 percent or greater. AveragePAH removals were 70, 83, and 95 percent forConditions 1, 2, and 3, respectively.
The average percentages of feed soil returned aswashed soil on a normalized basis were 90, 88, and86 for Conditions 1, 2, and 3, respectively. Theremaining solids were contained in the fines slurryand underwent further treatment.
Total material balances in the soil washing segmentof the VRU achieved closures of 104, ll3, and 98percent for Conditions 1, 2, and 3, respectively. Theclosures obtained for Conditions 1 and 3 met theproject objective of total material balance closuresbetween 90 and 110 percent. Although a closure of113 percent was obtained for Condition 2, a samplingprocedure may have inflated this closure.
Mass balances of total dry solids in the soil washingsegment of the VRU achieved closures of 106, 108,and 94 percent for Conditions 1, 2, and 3,respectively. The project objective for this massbalance was closure between 85 and 115 percent.

l The project objectives for mass balances of PCP andcreosote-fraction PAHs in the soil washing segmentof the VRU were to demonstrate whether closuresbetween 80 and 175 percent could be achieved.Closures within this range were achieved only forCondition 1, which demonstrated closures of 101 and87 percent for PCP and PAHs, respectively.Surfactant added during Conditions 2 and 3 mayhave adversely affected the PCP and PAH analyses,which would have affected the mass balancecalculations.
0 The cost to remediate 20,000 tons of contaminatedsoils using a lo-ton-per-hour (tph) soil washer isestimated at $136.67 per ton when the system is on-line 90 percent of the time.
I.3 Results
with Applicable or Relevant and Appropriate Require-ments (ARARs) and to estimate the cost of using thistechnology to remediate a Superfund site. This analysisincludes determining percent removals of PCP andcreosote-fraction PAHs. Table 1 summarizes theperformance during the demonstration test.
EPA has established target cleanup levels for the soil atthe Escambia Wood Treating Company Superfund site.Although meeting these cleanup criteria was not a projectobjective for this demonstration, they can be used forcomparison purposes. The target cleanup levels are 30ppm PCP, 50 ppm carcinogenic creosote, and 100 ppmtotal creosote. The target cleanup level for PCP was easilymet during Conditions 2 and 3 but was not met duringCondition 1. The cleanup criteria for total creosote waseasily met during Condition 3 but was not met duringCondition 1 or Condition 2. The target cleanup level forcarcinogenic creosote was met by the washed soil producedduring all three conditions.
The objectives of this Applications Analysis Report (AAR)are to assess the ability of the VRU process to comply

Section 2
Introduction
2.1 The SITE Program
In 1986, the U.S. EPA Office of Solid Waste andEmergency Response (OSWER) and Office of Researchand Development (ORD) established the SuperfundInnovative Technology Evaluation (SITE) Program topromote the development and use of innovativetechnologies to clean up Superfund sites across thecountry. Now in its eighth year, the SITE Program ishelping to provide the treatment technologies necessary toimplement new Federal and State cleanup standards aimedat permanent remedies rather than quick fixes. The SITEProgram is composed of four major elements: theDemonstration Program, the Emerging TechnologiesProgram, the Measurement and Monitoring TechnologiesProgram, and the Technology Transfer Program.
The major focus has been on the Demonstration Program,which is designed to provide engineering and cost data forselected technologies. EPA and developers participatingin the program share the cost of the demonstration.Developers are responsible for mobilization, operation,and demobilization of their innovative systems at chosensites, usually Superfund sites. EPA is responsible forsampling, analyzing, and evaluating all test results. Theresult is an assessment of the technology’s performance,reliability, and costs. This information is used inconjunction with other data to select the most appropriatetechnologies for the cleanup of Superfund sites.
Developers of innovative technologies apply to theDemonstration Program by responding to EPA’s annualsolicitation. EPA also accepts proposals any time adeveloper has a Superfund waste treatment projectscheduled. To qualify for the program, a new technologymust be field-ready and offer some advantage over existingtechnologies. Mobile technologies are of particularinterest to EPA.
Once EPA has accepted a proposal, EPA and thedeveloper work with the EPA regional offices and Stateagencies to identify a site containing waste suitable for
testing the capabilities of the technology. EPA preparesa detailed sampling and analysis plan designed to evaluatethe technology thoroughly and to ensure that the resultingdata are reliable. The duration of a demonstration variesfrom a few days to several years, depending on the lengthof time and quantity of waste needed to assess thetechnology. After the completion of a technologydemonstration, EPA prepares two reports, which areexplained in more detail in the following subsections.Ultimately, the Demonstration Program leads to ananalysis of the technology’s overall applicability toSuperfund problems.
The second principal element of the SITE Program is theEmerging Technologies Program, which fosters the furtherinvestigation and development of treatment technologiesthat are still at the bench- and pilot-scale. Successfulvalidation of these technologies can lead to thedevelopment of a system ready for field demonstration andparticipation in the Demonstration Program. The thirdelement of the SITE Program, the Measurement andMonitoring Technologies Program, provides assistance inthe development and demonstration of innovativetechnologies that can be used to characterize Superfundsites better. Technical information is disseminated to thepublic and private sectors through the Technology TransferProgram.
2.2 SITE Program Reports
The analysis of a technology participating in theDemonstration Program is contained in two documents: aTechnology Evaluation Report (TER) and an AAR. TheTER contains a comprehensive description of the demon-stration sponsored by the SITE Program and its results. Itgives detailed descriptions of the technology, the wasteused for the demonstration, sampling and analysis duringthe test, the data generated, and the Quality AssuranceProgram.
The scope of the AAR is broader than the TER's scope;it encompasses estimations of Superfund applications and
3

costs of a technology based on all available data. Thisreport compiles and summarizes the results of the SITEdemonstration, the developer’s design and test data, andother laboratory and field applications of the technology.It discusses the advantages, disadvantages, and limitationsof the technology.
Costs of the technology for different applications areestimated based on available data on pilot- and full-scaleapplications. The AAR discusses the factors, such as siteand waste characteristics, that have a major impact oncosts and performance.
The amount of available data for the evaluation of aninnovative technology varies widely. Data may be limitedto laboratory tests on synthetic waste or may includeperformance data on actual wastes treated at the pilot- orfull-scale level. In addition, there are limits to conclusionsregarding Superfund applications that can be drawn froma single field demonstration. A successful fielddemonstration does not necessarily ensure that atechnology will be widely applicable or fully developed tothe commercial scale. The AAR attempts to synthesizethe information that is available and draw reasonableconclusions. This document is very useful to thoseconsidering a technology for Superfund cleanups andrepresents a critical step in the development andcommercialization of the treatment technology.
2.3 Key Contacts
For more information on the VRU demonstration, pleasecontact:
1. EPA Project Manager for the SITEDemonstration Test:
Ms. Teri RichardsonU.S. Environmental Protection AgencyRisk Reduction Engineering Laboratory26 W. Martin Luther King DriveCincinnati, Ohio 45268(513) 569-7949
2. Process Developer:
Mr. Richard GriffithU.S. Environmental Protection AgencyRisk Reduction Engineering LaboratoryWoodbridge Ave., Building 10Edison, New Jersey 08837(908) 321-6629
4
Section 3
Technology Applications Analysis
3.I Introduction
This section addresses the applicability of soil washing tosoils contaminated with PCP and creosote-fractionPAHs. Recommendations are based on the resultsobtained from the SITE demonstration of the VRU aswell as additional data provided by the developer. Theresults of the demonstration provide the most extensivedatabase, conclusions on the technology’s effectiveness,and information regarding its applicability to otherpotential cleanups. A thorough description of the VRUtechnology is provided in Appendix A. The developer’sclaims are presented in Appendix B, a summary of thedemonstration results is provided in Appendix C, andother case studies are presented in Appendix D.
3.2 Conclusions
The soil washing segment of the VRU successfullyseparated the contaminated soil into two unique streams:washed soil and fines slurry. The washed soil was safelyreturned to the site following treatment, while the finesslurry, which carried the majority of the pollutants fromthe feed soil, underwent additional treatment to separatethe fines from the water. The water was further polishedand then discharged onsite, while the fines were disposedin a secure area of the site.
In order to address system performance thoroughlyunder a number of operating conditions, varyingcombinations of caustic, surfactant, and temperaturewere used to modify the physical conditions of the washwater as follows:
l Condition 1: no surfactant, no pH adjustment, notemperature adjustment
l Condition 2: surfactant addition, no pHadjustment, no temperature adjustment
l Condition 3: surfactant addition, pH adjustment,temperature adjustment
Three runs, 4 hours in duration, were performed for eachof Conditions 1 and 2. Two runs, 6 hours in duration,were performed under Condition 3.
A review of the demonstration test indicates the followingresults:
l
l
l
l
0
5
One of the project objectives was to demonstrate theVRU’s abiity to achieve an average PCP removalfrom the feed soil of 90 percent or greater. AveragePCP removals were 76, 92, and 97 percent forConditions 1, 2, and 3, respectively.
A second project objective was to demonstrate theVRU’s ability to achieve an average creosote-fractionPAH removal from the feed soil of 90 percent orgreater. Average PAH removals were 70, 83, and 95percent for Conditions 1, 5 and 3, respectively.
The average percentages of feed soil returned aswashed soil on a normalized basis were 90, 88, and86 for Conditions 1, 2, and 3, respectively. Theremaining solids were contained in the fines slurryand underwent further treatment.
Total material balances in the soil washing segmentof the VRU achieved closures of 104, 113, and 98percent for Conditions 1, 2, and 3, respectively. Theclosures obtained for Conditions 1 and 3 met theproject objective of total material balance closuresbetween 90 and 110 percent. Although a closure of113 percent was obtained for Condition 2, a samplingprocedure may have inflated this closure.
Mass balances of total dry solids in the soil washingsegment of the VRU achieved closures of 106, 108,and 94 percent for Conditions 1, 2, and 3,respectively. The project objective for this massbalance was closure between 85 and 115 percent.
0 The project objectives for mass balances of PCPand creosote-fraction PAHs in the soil washingsegment of the VRU were to demonstrate whetherclosures between 80 and 175 percent could beachieved. Closures within this range were achievedonly for Condition 1, which demonstrated closuresof 101 and 87 percent for PCP and PAHs,respectively. Surfactant added during Conditions 2and 3 may have adversely affected the PCP andPAH analyses, which would have affected the massbalance calculations.
3.3 Technology Evaluation
The 100~lb/h VRU is a mobile research unit that wasdeveloped for soil washing treatability studies on soilscontaining a wide variety of contaminants. This unit iscomposed of two distinct treatment segments: the soilwashing subsystem and the water treatment subsystem.The soil washing portion of the VRU is used to separatecontaminated soils into two streams: washed soil andfines slurry. Ideally, the washed soil is clean enough toreturn to the site or to use in some other capacity. Thefmes slurry, which carries the majority of the pollutantspresent in the feed soil, requires additional treatmentusing the water treatment subsystem. By isolating andconcentrating the contaminants within the fmes, thevolume of material requiring additional treatment issignificantly reduced.
The VRU was developed by EPA, which by law cannotdevelop commercial treatment systems. EPA can co-develop technologies with private companies or licenseEPA-developed technologies to private companiesthrough the Federal Technology Transfer Act of 1986(15 USC 3702-3714) [l].
In November 1992, the VRU soil washing system wastested under the SITE Program. Soil contaminated withPCP and creosote-fraction PAHs was excavated from theformer Escambia Wood Treating Company site inPensacola, Florida and then treated by the VRU.Contaminant levels in the soil ranged from the low partsper million (ppm) to percent levels. For the SITEdemonstration, the excavated soil was homogenized andmanually processed through a 1/4-inch screen before itwas fed to the VRU. Average contaminantconcentrations in the feed soil on a dry weight basis afterhomogenization and screening are summarized in Table2.
The PAH concentrations presented in Table 2 do notinclude all PAHs. Analyses were conducted for
6

3.33 Contaminant Removal Efficiencies
Most organic and inorganic contaminants present in soilbind to fine-sized clay and silt particles (fines) primarilyby physical processes. Washing processes that separatethe fine particles from the coarser soil particleseffectively concentrate the contaminants into a smallervolume. The clean larger fraction can be returned to thesite for continued use. This process can also removesome contaminants by dissolving or suspending them inthe wash water.
One of the main objectives of the demonstration test wasto assess the VRU technology’s ability to achievecontaminant removals of 90 percent for PCP andcreosote-fraction PAHs.
PCP removal efficiencies were calculated for Conditions 1,2, and 3. Under Condition 3, which employed surfactantaddition and pH and temperature adjustment, an averageof 97 percent of the PCP was removed. UnderCondition 2, which employed surfactant addition only, anaverage of 92 percent of the PCP was removed. Theseremoval efficiencies achieve the project objective ofdemonstrating that the unit is capable of removing anaverage of 90 percent of the PCP from the bulk of thefeed soil. An average of only 76 percent of the PCP wasremoved from the feed soil treated under Condition 1.These data, which illustrate the impact of surfactantaddition and pH and temperature adjustment on PCPremoval efficiencies, are listed in Table 4. PCP removalefficiency is clearly enhanced by surfactant addition andpH and temperature adjustment.
Removal efficiencies for PCP and PAHs weredetermined by comparing the total mass of eachcontaminant, on a dry weight basis, detected in thewashed soil with the total in the feed soil. Removalefficiencies are calculated using the following equation:
Creosote-fraction PAH removal efficiencies werecalculated for Conditions 1, 2, and 3. Under Condition 3,which employed surfactant addition and pH andtemperature adjustment, an average of 95 percent of thePAHs were removed. This removal efficiency achieves the
% removal= [ Concentration of contaminant in feed - concentration of contaminant in washed soilconcentration of contaminant in feed
] x loo

project objective of demonstrating that the unit iscapable of removing an average of 90 percent of thePAHs from the bulk of the feed soil. Average PAHremovals of only 70 percent and 83 percent wereobtained for Conditions 1 and 2, respectively. Thesedata, which illustrate the impact of surfactant additionand pH and temperature adjustment on PAH removaleffkiencies, are listed in Table 5. PAH removalefficiency is clearly dependent on surfactant addition andpH and temperature adjustment.
EPA has established target cleanup levels for the soil atthe Escambia Wood Treating Company Superfund Site.Although meeting these cleanup criteria was not aproject objective for this demonstration, they can be usedfor comparison purposes. The target cleanup levels are30 ppm PCP, 50 ppm carcinogenic creosote, and 100ppm total creosote; the concentrations of thesecontaminants in the washed soil on a dry weight basisare presented in Table 6.
For all three conditions, the average concentration ofPCP in the washed soil was below the target cleanuplevel of 30 ppm. This target was, however, exceeded forRun 3 of Condition 1. The cleanup criteria for totalcreosote was easily met during Condition 3 but was notmet during Condition 1 or Condition 2. The targetcleanup level for carcinogenic creosote was met by thewashed soil produced during all three conditions.
3 .3 .3 Washed Soils Recovery
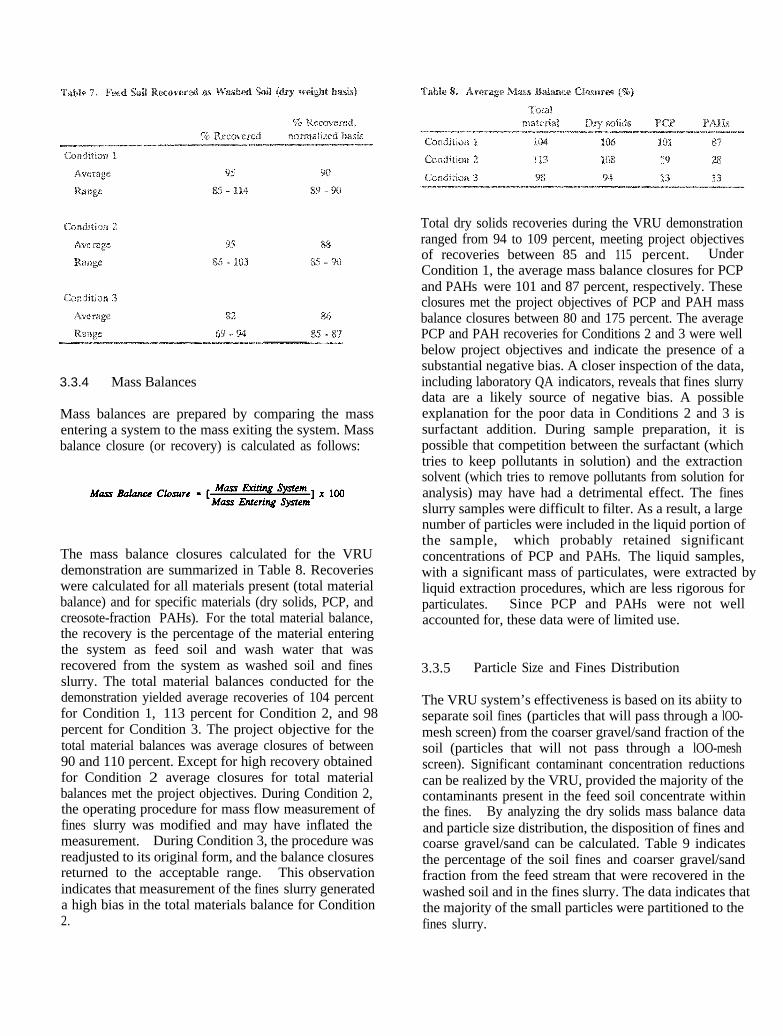
As soil travels through the VRU system, the sand andgravel fraction of the soil are separated from thecontaminated fines (i.e., fine clay and silt particles).The relatively nonhazardous sand and gravel fraction exitsthe system as washed soil. By comparing the mass of drysolids in the feed soil with the mass of dry solids in thewashed soil, average solids recoveries of 96, 95, and 81percent were calculated for soils treated under Conditions1 through 3. Also calculated were normalized recoveries,which were determined by dividing the mass of dry solidsin the washed soil by the total mass of dry solids exitingthe system (in the washed soil and fines slurry). Therecoveries shown in Table 7 achieve the project objectiveof demonstrating that an average of at least 80 percent ofthe solids present in the feed soil would be returned to thesite as washed soil.
8
3.3.4 Mass Balances
Mass balances are prepared by comparing the massentering a system to the mass exiting the system. Massbalance closure (or recovery) is calculated as follows:
The mass balance closures calculated for the VRUdemonstration are summarized in Table 8. Recoverieswere calculated for all materials present (total materialbalance) and for specific materials (dry solids, PCP, andcreosote-fraction PAHs). For the total material balance,the recovery is the percentage of the material enteringthe system as feed soil and wash water that wasrecovered from the system as washed soil and finesslurry. The total material balances conducted for thedemonstration yielded average recoveries of 104 percentfor Condition 1, 113 percent for Condition 2, and 98percent for Condition 3. The project objective for thetotal material balances was average closures of between90 and 110 percent. Except for high recovery obtainedfor Condition 2 average closures for total materialbalances met the project objectives. During Condition 2,the operating procedure for mass flow measurement offines slurry was modified and may have inflated themeasurement. During Condition 3, the procedure wasreadjusted to its original form, and the balance closuresreturned to the acceptable range. This observationindicates that measurement of the fines slurry generateda high bias in the total materials balance for Condition2.
Total dry solids recoveries during the VRU demonstrationranged from 94 to 109 percent, meeting project objectivesof recoveries between 85 and 115 percent. UnderCondition 1, the average mass balance closures for PCPand PAHs were 101 and 87 percent, respectively. Theseclosures met the project objectives of PCP and PAH massbalance closures between 80 and 175 percent. The averagePCP and PAH recoveries for Conditions 2 and 3 were wellbelow project objectives and indicate the presence of asubstantial negative bias. A closer inspection of the data,including laboratory QA indicators, reveals that fines slurrydata are a likely source of negative bias. A possibleexplanation for the poor data in Conditions 2 and 3 issurfactant addition. During sample preparation, it ispossible that competition between the surfactant (whichtries to keep pollutants in solution) and the extractionsolvent (which tries to remove pollutants from solution foranalysis) may have had a detrimental effect. The finesslurry samples were difficult to filter. As a result, a largenumber of particles were included in the liquid portion ofthe sample, which probably retained significantconcentrations of PCP and PAHs. The liquid samples,with a significant mass of particulates, were extracted byliquid extraction procedures, which are less rigorous forparticulates. Since PCP and PAHs were not wellaccounted for, these data were of limited use.
3.3.5 Particle Size and Fines Distribution
The VRU system’s effectiveness is based on its abiity toseparate soil fines (particles that will pass through a lOO-mesh screen) from the coarser gravel/sand fraction of thesoil (particles that will not pass through a lOO-meshscreen). Significant contaminant concentration reductionscan be realized by the VRU, provided the majority of thecontaminants present in the feed soil concentrate withinthe fines. By analyzing the dry solids mass balance dataand particle size distribution, the disposition of fines andcoarse gravel/sand can be calculated. Table 9 indicatesthe percentage of the soil fines and coarser gravel/sandfraction from the feed stream that were recovered in thewashed soil and in the fines slurry. The data indicates thatthe majority of the small particles were partitioned to thefines slurry.
29

The partitioning of the coarser gravel/sand fraction tothe washed soil stream was excellent. Only 1 to 2percent of the coarser gravel/sand particles from thefeed stream were detected in the fines slurry. Thepartitioning of the soil fines to the fines slurry was lesscomplete, although the majority of these small particlesdid partition to the fines slurry. As shown in Table 8, 31to 54 percent of the soil fines from the feed stream wererecovered in the washed soil. A more completepartitioning of the soil fines to the fines slurry would,theoretically, lead to increased contaminant removalsfrom the washed soil.
3.3.6 Water Treatment Effectiveness
Pollutants were removed from the fines slurry stream bya water treatment sequence consisting of settling,flocculation, filtration, and carbon adsorption. Followingtreatment in the Corrugated Plate Interceptor (CPI),where the fines were separated by gravity, the overflowwas pumped to a flocculation/clarification system foradditional fines partitioning. Table 10 lists ranges ofPCP and PAH concentrations in the CPI andfloe/clarifier solids on a dry weight basis. As previouslydiscussed in Subsection 3.3.4, these samples were difticultto filter and the analytical methods were inadequate,which resulted in questionable data.
Clarified water was then pumped from the floe overflowtank through cartridge polishing filters operated in parallelto remove soil lines that would not pass through a 4 x lOAinch (lo-micron) screen. Water exiting these filters thenpassed through activated carbon drums for hydrocarbonremoval. The claritied water was analyzed for totalorganic carbon (TOC) and total residue (IX), which is thesum of total suspended solids (TSS) and total dissolvedsolids (TDS). Table 10 lists the TOC and TR levels fromthe floe tank overflow, effluent from the filters, activatedcarbon, and wash water into the VRU.
The TR reduction from the filter unit was minimal,indicating that a finer-sized filter is needed. The TOCreduction decreased significantly when surfactant wasintroduced into the system during Conditions 2 and 3.The efficiency was affected because surfactant wasadsorbed on the carbon along with the contaminants.TOC efficiency could be improved by removing thesurfactant before it enters the carbon canisters or byutilizing another TOC removal technology.
The VRU was designed with the ability to recycle watertreatment subsystem effluent to the mini-washer. Thisoption was not evaluated during the demonstrationbecause the developer chose to operate the system withoutrecycling. Because water quality criteria for recycling havenot been defined, it is not possible to determine whetherthe treated water produced during the demonstration wasappropriate for recycling. Based on the data presented inTable 11, the levels of both TOC and TB duringCondition 1 were potentially low enough to permitrecycling; however, much higher levels were detected inConditions 2 and 3. During these conditions, additionaltreatment may have been necessary to recycle the effluentfrom the carbon canisters.

3.4 Range of Site Chamcteristics Suitablefor the Technology
3.4.1 Site Selection
The VRU is a mobile research unit mounted on twoheavy-duty tractor trailers. The VRU is composed of anumber of subsystems (e.g., screening, gravity separation,flocculation/ clarification, filtration, and carbonadsorption). It is designed to be flexible, so that thecombination of subsystems and wash water additivesused can be modified to achieve cleanup goals cost-effectively, based on site requirements. The system canbe assembled within the contaminated soil area or placedoffsite so that soil can be transported to the unit. Thetreatment unit can be placed inside either a permanentor a temporary building or it can be operated in theopen. The pilot-scale unit can be barge mounted.TheVRU can be scaled to a full-scale unit for siteremediation. For purposes of this document, a full-scaleunit is based on a processing rate of 10 tons per hour(tph) of soil or sediment. Larger processing rates for afull-scale unit could be used. Additional details on thescale-up factors used and assumptions made foreconomic analyses are provided in Section 4.
3.4.2 Load, Surface, and Subsurface Requirements
A level, graded area that is capable of supporting ableto support the weight of the unit, which was determinedby the developer to be 3,500 pounds per square inch(psi) for both the pilot- and full-scale units. Additionalroad construction may be necessary to support oversizeand heavy equipment.Subsurface preparation is not required since all unitprocesses occur above the ground. If the soil is to beexcavated and treated onsite, however, all subsurfaceobstacles (underground cables, piping, etc.) must beremoved prior to excavation.
3.4.3 Clearance and Site Area Requirements
The site must be cleared to allow the unit to be assembledand operated. The extent of clearing is dependent uponthe operational configuration selected. Cleared areas forstockpiling, storage, and loading/unloading activities arerequired. Clearing, other than for excavation ofcontaminated soil, is not an issue if treatment is to beconducted offsite.
The surface area required for the VRU soil washingequipment is approximately 40 x 60 feet for the pilot-scaleunit and 300 x 400 feet for the full-scale unit. The verticalheight of the system is based on the height of the settlingtank as erected; 13.5 feet for the pilot-scale or 23 feet forthe full-scale unit. The system conliguration will dictatewhether or not a concrete pad is required to support theequipment. Additionally, separate areas should beprovided for storage for both feed materials and any wastegenerated during the treatment process. The shape of thesite should allow convenient access to the equipment.
3.4.4 Climate Characteristics
The critical climate requirements for the operation of thissystem include temperature range and wind conditions.Low ambient temperatures will either adversely affecttreatment efficiency (if the wash water is not heated) orincrease energy costs (if the wash water is heated).Temperatures below freezing would hinder the operatingcapabilities of the soil washing system because the systemuses a significant amount of water in the treatmentprocess. Also, the slurries created from the treatmentprocess are adversely affected by freezing temperatures.Windy conditions may affect the excavation, transport, andfeed of dry soils. Hazardous operating conditions wouldalso exist in severe storm conditions.

To diminish the effects of climate, the system may beerected in an enclosure. For the pilot-scale unit, thismay be a faed structure or a tent covering the system.The full-scale unit requires a fixed structure.
3.4.5 Geological and Topographical Characteristics
released from the soil. These are then collected andtreated by air stripping or some other treatment process.The amount of steam required for the pilot-scale unit is600 lbs/h at of 50 psi, which requires approximately 10cfm of natural gas or 4 gph of No. 2 fuel oil. Since nosubstantial quantity of VOCs was present, the steam jacketwas not used during the demonstration.
Except for soil-bearing capacity requirements applicableto any heavy machinery, there are no geologic character-istics that restrict the implementation of this technology.The treatment unit must be flat, level, and stable.Currently the unit has been used at land-based facilitiesonly.
3.4.7 Size of Operation
The capacity of the pilot-scale system used during thedemonstration test was 100 lbs/h. The processing rate forthe full-scale system is assumed to be 10 tph. Currently,the VRU Soil Washing System has only been tested as apilot-scale unit. No full-scale units exist at this time.
3.4.6 Utility Requirements
Electricity and water are required to operate the VRUsoil washing system. The pilot-scale system is equippedto operate using a generator to supply electrical power.Otherwise a 3-phase power supply from the local electriccompany is required. The full-scale system will requirea Iphase electrical system to operate. The pilot-scalesystem uses approximately 3.3 kilowatt hours (kWh) perton of soil processed during operation. This requirementincreases to 6.6 kWh/ton for the full-scale system.
Water required to operate the pilot-scale system isapproximately 80 gallons per hour (gph). This assumesa recycle rate of 0 percent and an operational rate of 100lbs/h process feed material. The full-scale systemrequires 1,600 gph. This assumes a 90 percent recyclerate and a process throughput of 10 tph of process feedmaterial. Au abundant water supply must be readilyavailable and accessible to operate the system. It is notrequired that the water be potable, but it must be free ofdebris. Water sources with debris may be used providedthe water is filtered prior to its use in the system. Waterneed not be obtained from the local utility but could befrom sources such as rivers, streams, lakes, or wells. Ifthe unit is operated with elevated wash watertemperatures, a water heater is required. Propane wasused to heat water in the pilot-scale unit; natural gascould be used for a full-scale unit. The full scale unitwould require approximately I20 cubic feet per minute(cfm) of natural gas.
Other utilities required include diesel fuel to operate thegenerator and natural gas or fuel oil for the steam boiler.The steam is required for the removal of volatile organiccompounds (VOCs) from the feed material prior to soilwashing. In this process, the steam is used to heat thescrew conveyor jacket, thereby increasing thetemperature to a point at which the volatile orga nics are
3.5 Applicable Wastes
This technology may be used to treat soil contaminatedprimarily with volatile and semivolatile organic compounds.When the system is used to treat soils with volatileorganics, steam stripping and vapor phase adsorptionequipment is used. The unit has not been tested onsediments, though it is potentially capable of treating them.
The contaminated soil or sediment should contain no morethan 30 to 40 percent fines, and maximum particlediameter should be no more than j/, inch. However,during the demonstration the pilot-scale was fed material1/4-inch or less. The process is also less cost effective whenthe surfactant concentration is high. A high surfactantconcentration also causes a foam problem that can inhibitthe ability of the unit to remove the contaminants from thesoil effectively.
The VRU soil washing system can be effectively used totreat organic compounds such as PAHs, PCP, andpesticides. In general, a wide variety of chemicalcontaminants can be removed or concentrated through soilwashing applications. It has been shown that soil washingis effective on coarse sand and gravel contaminated witha wide range of organic and inorganic contaminants.Based on other soil washing systems, potentialcontaminants that may be suitable for soil washing includepetroleum and fuel residues and cyanides.
3.6 Regulatory Requirements
Operation of the VRU for treatment of contaminated soilrequires compliance with certain Federal, State, and localregulatory standards and guidelines. Section 121 of the

Comprehensive Environmental Response, Compensation,and Liability Act of 1980 (CERCLA) requires that,subject to specified exceptions, remedial actions must beundertaken in compliance with ARARs, Federal laws,and more stringent promulgated State laws (m responseto release or threats of release of hazardous substances,pollutants, or contaminants) as necessary to protecthuman health and the environment.
The ARARs that must be followed in treatingcontaminated media onsite are outlined in the InterimGuidance on Compliance with ARARs, Federal Register,Vol. 52, pp. 32496 et seq [2]. These are:
l Performance, Design, or Action-SpecificRequirements. Examples include ResourceConservation and Recovery Act (RCRA) incinerationstandards and Clean Water Act (CWA) pretreatmentstandards for discharge to publicly-owned treatmentworks (POTWs). These requirements are triggeredby the particular remedial activity selected to clean asite.
l Ambient/Chemical-Specific Requirements. These sethealth-risk-based concentration limits based onpollutants and contaminants, e.g., emission limits andambient air quality standards. The most stringent
ARAR must be met.
l Locational Requirements. These set restrictions onactivities because of site locations and environs.
Deployment of the VRU will be affected by three mainlevels of regulation:
l Federal EPA air, water, and solid/hazardous wasteregulations
0 State air, water, and solid/hazardous wasteregulations #
0 Local regulations, particularly Air QualityManagement District requirements
These regulations govern the operation of alltechnologies. Other Federal, State, and local regulationsare discussed in detail in the following subsections asthey apply to the performance, emissions, and residuesevaluated from measurements taken during thedemonstration test.
3.6.1 Federal Regulations
3.6.1.1 Clean Air Act (CAA)
The CAA establishes primary and secondary ambient airquality standards for the protection of public health andemission limitations for certain hazardous air pollutants.Permitting requirements under the CAA are administeredby each state as part of the State Implementation Plansdeveloped to bring each state into compliance with theNational Ambient Air Quality Standards (NAAQS). Theambient air quality standards listed for specific pollutantsmay be applicable to operation of the VRU due topotential emissions when processing volatile compounds.When volatile compounds are present in the feed, an airpollution control device may be required. Other regulatedemissions may be produced, depending on the waste feed.The allowable emissions will be established on a case-by-case basis depending on whether the site is located in anarea that is in attainment with the NAAQS.
3.6.1.2 CERCLA
CERCLA, as amended by the Superfund Amendments andReauthorization Act (SARA) of 1986, provides for Federalfunding to respond to releases of hazardous substances toair, water, and land. Section 121 of SARA, CleanupStandards, states a strong statutory preference forremedies that are highly reliable and provide long-termprotection. It strongly recommends that remedial actionuse onsite treatment that *. ..permanently and significantlyreduces the volume, toxicity, or mobility of hazardoussubstances.” In addition, general factors that must be ad-dressed by CERCLA remedial actions include:
Overall protection of human health and theenvironment
Compliance with ARARs
Long-term effectiveness and permanence
Reduction of toxicity, mobility, or volume
Short-term effectiveness
Implementabiity
cost
State acceptance
Community acceptance.

The ability of the VRU to concentrate the organiccontaminants originally present in the feed, as demon-strated by removal efficiencies of 90 percent or greaterfor PCP and PAH contaminants, indicates the VRU iscapable of significantly reducing the quantity ofcontaminated waste requiring subsequent treatment ordisposal.
3.6.1.3 RCRA
The RCRA is the primary Federal legislation governinghazardous waste activities. Although a RCFL4 permit isnot required for onsite remedial actions at Superfundsites, the VRU must meet all of its substantiverequirements. Administrative RCRA requirements suchas reporting and recordkeeping, however, are notapplicable for onsite action. Subtitle C of RCRAcontains requirements for generation, transport,treatment, storage, and disposal of hazardous waste.Compliance with these requirements is mandatory forCERCLA sites producing hazardous waste onsite. Inorder to maintain compliance with RCRA, sitesemploying the VRU must obtain an EPA generatoridentification number and observe storage requirementsstipulated under 40 Code of Federal Regulations (CFR)262. Alternatively, a Part B Treatment, Storage, andDisposal (TSD) permit of interim status may beobtained. Invariably, a hazardous waste manifest mustaccompany offsite shipment of waste, and transport mustcomply with Federal Department of Transportationhazardous waste transportation regulations. Withoutexception, the receiving TSD facility must be permittedand in compliance with RCRA standards. Thetechnology or treatment standards applicable to themedia produced by the VRU will be determined by thecharacteristics of the material treated and the wastegenerated. The RCRA land disposal restrictions (40CFR 268) preclude the land disposal of hazardous wasteswhich fail to meet the stipulated treatment standards.Wastes which do not meet these standards must receiveadditional treatment to bring the wastes into compliancewith the standards prior to land disposal, unless avariance is granted.
3.6.1.4 CWA
The CWA regulates direct discharges to surface waterthrough the National Pollutant Discharge EliminationSystem (NPDES) regulations. These regulations requirepoint-source discharges of wastewater to meet estab-lished water quality standards. The discharge ofwastewater to the sanitary sewer requires a dischargepermit or, at least, concurrence from State and local
regulatory authorities that the wastewater is in compliancewith regulatory limits. .
If the treated water cannot be reused as wash water, thenit must be disposed. Disposal options include discharge toa local POTW, discharge to surface water, or onsitetreatment. Discharge to a POTW will typically beregulated according to the industrial wastewaterpretreatment standards of the POTW. These standardsare specified in the CFR for certain industries. Dependingon the site, the treated wash water may fall into one of thespecific industrial categories. If it does not, thepretreatment standards for the wash water will bedetermined by the POTW and depend on site-specificparameters such as the flow rate of the wash water, thecontaminants present, and the design of the POTW.Alternatively, the wash water can be treated onsite.Pursuant to the National Contingency Plan, theadministrative and permitting requirements of RCRA donot apply. However, substantive requirements of RCRAdo apply to onsite treatment facilities.
3.6.1.5 Safe Drinking Water Act (SDWA)
SDWA establishes primary and secondary nationaldriig water standards. CERCLA refers to thesestandards, and Section 121(d)(2) explicitly mentions two ofthese standards for surface water or groundwater:Maximum Contaminant Levels (MCLs) and Federal WaterQuality Criteria. Alternate Concentration Limits may beused when conditions of Section 121 (d)(2)(B) are met andcleanup to MCLs or other protective levels is notpracticable. Included in these sections is guidance on howthese requirements may be applied to Superfund remedialactions. The guidance, which is based on Federalrequirements and policies, may be superseded by morestringent promulgated State requirements, resulting in theapplication of even stricter standards than those specifiedin Federal regulations.
3.6.1.6 Toxic Substances Control Act (TSCA)
TSCA grants EPA the authority to prohibit or control themanufacturing, importing, processing, use, and disposal ofany chemical substance that presents an unreasonable riskof injury to human health or the environment. Theseregulations may be found in 40 CFR 761. With respect tohazardous waste regulation, TSCA focuses on the use,management, disposal, and cleanup of polychlorinatedbiphenyls (PCBs). Materials with less than 50 ppm PCBare classified as non-PCB; those with PCB concentrationsbetween 50 and 500 ppm are classified as PCB-contaminated, and those with PCB concentrations greater
14

than or equal to 500 ppm are classified as PCBs. StatePCB regulations may be more stringent than TSCA.
While the soil used for the demonstration did notcontain PCBs, it is reasonable to assume that the full-scale VRU could be utilized to clean soils that maycontain PCBs. The separation process could result inelevated PCB concentrations in some output streams. Ifthe concentrations of PCBs in an output stream are toohigh, the output stream will need to be handled as aTSCA-regulated waste.
3.6.2 State and Local Regulations
Compliance with ARARs may require meeting Statestandards that are more stringent than Federal standardsor that are the controlling standards in the case of non-CERCLA treatment activities. Several types of State andlocal regulations that may affect operation of the VRUinclude:
0 Permitting requirements forconstruction/operation
0 Limitations on emission levels
l Nuisance rules
3.7 Personnel Issues
3.7.1 Training
Since selected personnel involved with sampling orworking close to the VRU (especially the grizzly screenand feed hopper) are required to wear respiratoryprotection, 40 hours of Occupational Safety and HealthAct (OSHA) training covering personal protectiveequipment (PPE) application, safety and health emer-gency response procedures, and quality assurance/qualitycontrol are required. Additional training addressing thesite activities, procedures, monitoring, and equipmentassociated with the technology is also recommended.Personnel should also be briefed when new operationsare planned, work practices change, or if the site orenvironmental conditions change.
3.7.2 Health and Safety
Personnel should be instructed on the potential hazardsassociated with the operation of the VRU, recommendedsafe work practices, and standard emergency plans and
procedures. Health and safety training covering thepotential hazards and provisions for exposure, monitoring,and the use and care of PPE should be required. Whenappropriate, workers should have medical exams. Healthand safety monitoring and incident reports should beroutinely filed and records of occupational illnesses andinjuries (OSHA Forms 102 and 200) should be main-tained. Audits ensuring compliance with the health andsafety plan should be carried out.
Proper PPE should be available and properly utilized byall onsite personnel. Different levels of personalprotection will be required based on the potential hazardassociated with the site and the work activities.
Site monitoring should be conducted to identify the extentof hazards and to document exposures at the site. Themonitoring results should be maintained and posted.
3.7.3 Emergency Response
In the event of an accident, illness, explosion, hazardoussituation at the site, or intentional acts of harm, assistanceshould be immediately sought from the local emergencyresponse teams and first aid or decontamination should beemployed when appropriate. To ensure a timely responsein the case of an emergency, workers should review theevacuation plan, firefighting procedures, cardiopulmonaryresuscitation (CPR) techniques, emergency decon-tamination procedures, and routes to local hospitals beforeoperating the system. Fire extinguishers, spill cleanup kits,emergency eye washes, alarms, evacuation vehicles, and anextensive first aid kit should be onsite at all times.
3.8 References
1. Federal Technology Transfer Act of 1986. 15USC 3702-3714.
2. Interim Guidance on Compliance with ARARs -Federal Register, 52: pp.32496 et. seq.
Section 4
Economic Analysis
4.1 Introduction
The primary purpose of this economic analysis is toestimate costs (not including profits) for a commercialtreatment system utilizing the mobile VRU. This analysisis based on the results of a SITE demonstration whichutilized a pilot-scale soil washing system. The pilot-scaleunit operated at a feed rate of 100 lbs/h of contaminatedsoil. It is projected the commercial unit will be capable oftreating approximately 10 tph of contaminated soil.
4.2 Conclusions
The commercial-scale VRU proposed by EPA appears tobe suited to the remediation of soils and other solid wastescontaminated with organic compounds. Treatment costsappear to be competitive with other available technologies.The cost to remediate 20,000 tons of contaminated soilusing a lo-tph VRU is estimated at $137 per ton if thesystem is on-line 90 percent of the time. Treatment costsincrease as the percent on-line factor decreases. Projectedunit costs for a smaller site (10,006 tons of contaminatedsoil) are $171 per ton; projected unit costs for a larger site(200,000 tons) are $106 per ton.
4.3 Issues and Assumptions
Because the VRU appears to be capable of effectivelytreating soils contaminated with organics, it is consideredpotentially applicable to the remediation of Superfundsites. In the following economic analysis, the costsassociated with this technology are calculated based on thetreatment of a small-to-medium hazardous waste site thathas approximately 20,000 tons of contaminated soil suitablefor treatment by soil washing. Approximately 3,600pounds of contaminated soil were treated during the SITEdemonstration. While the pilot-scale VRU was designedfor the treatment of VOCs, the SITE demonstration didnot involve the treatment of VOCs. It is assumed that the
16
lo-tph VRU will have and use equipment designed for thetreatment of VOCs.
Costs that are assumed to be the obligation of theresponsible party or site owner have been omitted fromthis cost estimate and are indicated by a line (---) in alltables.
Important assumptions regarding operating conditions andtask responsibiities that could significantly affect the costestimates are presented in the following subsections.
4.3.1 Costs Excluded from Estimate
The cost estimates presented are representative of thecharges typically assessed to the client by the vendor butdo not include profit.
Many other actual or potential costs were not included aspart of this estimate. These costs were omitted becausesite-specific engineering designs are beyond the scope ofthis SITE project. Certain functions were assumed to bethe obligation of the responsible party or site owner andwere not included in this estimate.
Costs such as preliminary site preparation, permits,regulatory requirements, initiation of monitoring programs,waste disposal, sampling and analyses, and post-treatmentsite cleanup and restoration are considered to be the re-sponsible party’s (or site owner’s) obligation and are notincluded. These costs tend to be site-specific and it is leftto the reader to perform calculations relevant to eachspecific case. Whenever possible, applicable informationis provided on these topics so the reader may performcalculations to obtain relevant economic data.
4.3.2 Utilities
To support the operation of the 10-tph VRU, a site musthave clean water available at a flow rate of at least 24

gpm, assuming recycling with 10 percent blowdown. Thiswater will be used in the miniwasher and the floe clarifier.Other uses of the water include cooling and miscellaneousonsite applications such as cleaning and rinsing.
A natural gas source and the required piping must beavailable and accessible to accommodate a natural gasusage of approximately 7,800 cubic feet per hour atstandard conditions (60” F and 30 inches of mercury).Alternatively, provisions may be made for the use of oil asa supplemental fuel. The pilot-scale unit used for thedemonstration utilized propane as a fuel source for thewater heater. The steam boiler was not utilized sinceVOCs were not present in the feed soil.
Electrical power is required for the operation of thepumps, mixers, vibrating screens, and many smaller piecesof equipment. The pilot-scale unit utilized an electricalgenerator, but for the full-scale unit it is anticipated thatelectrical power will be supplied from offsite source. It isassumed that the cost of connecting the full-scale VRU toan outside electrical source, including the transformer, isthe responsibility of the site owner. Maximum electricalpower consumption is estimated to be 66 kWh per ton ofcontaminated soil treated.
For these cost calculations, it is assumed the site willsupport all of these requirements. The cost of preparinga site to meet these requirements can be high and is notincluded in this analysis.
4 .3 .3 Operating Times
It is assumed the treatment operations will be conducted24 hours per day, 5 days per week. It is further assumedthat site preparation will be conducted 8 hours per day, 5days per week. Assembly and disassembly are assumed tobe carried out 8 hours per day, 7 days per week. Startupand testing will be accomplished in one shift working 8hours per day, 5 days per week. Training will beconcurrent with startup activities and be conducted 8 hoursper day for 3 days. Excavation activities for sitepreparation will be concurrent with treatment (and may beconcurrent with assembly and shakedown and testing aswell). Assembly and disassembly are both assumed torequire 3 weeks. Shakedown, testing, and training areexpected to take 1 week. Except where noted, thesecalculations are based on the treatment of a total of 20,000tons of waste using a I0-tph system.
4.3.4 Labor Requirements
Treatment operations for a typical shift are assumed torequire five workers. These workers include a shiftsupervisor, a maintenance person, a nonlocal operator, andtwo local operators. With 3 shifts, there will be 24 hoursof coverage for those directly involved in operating thesystem. In addition, a project manager, safety oft&r, andlocal administrative person will each work a standard 40-hour schedule at the site. When the safety officer is off-duty, the shift supervisors will assume all safetyresponsibilities.
4.3.5 Capital Costs
The purchased equipment cost consists of the VRU andadditional equipment such as VOC treatment system,water heater, steam generator, and trailers. The fixedcapital investment (i.e., capital costs) consists of thepurchased equipment cost and other fixed costs such asfreight, sales tax installation, piping electricalinstrumentation, engineering, and supervision. Thepercentage of these major cost components are presentedin Table 12. Assumed proportions are based on ranges ofestimates given by Peters and Timmerhaus [l]. Since thetotal equaled less than 100 percent the items werenormalized. Once the purchased equipment costs(including freight and sales tax) are known, the total fixedcapital investment can be determined. Freight and salestax are estimated as percentages of the purchasedequipment cost, while the other fixed costs are estimatedas percentages of the total fixed capital investment.
17

4.3.6 Equipment and Fixed Costs
Annualized equipment costs and other fixed costs havebeen prorated for the duration of time that the equipmentis onsite. The costs for equipment, contingency, insurance,and taxes accrue during assembly, shakedown and testing,treatment, and disassembly; scheduled maintenance costsaccrue during treatment only.
4.4 Basis of Economic Analysis
The cost analysis was prepared by breaking down theoverall cost into 12 categories. The cost categories, someof which do not have costs associated with them for thisparticular technology, are:
Site preparationPermitting and regulatoryEquipmentStartup and fixedLaborSuppliesConsumablesEffluent treatment and disposalResiduals and waste shipping, handling, andtransportAnalyticalFacility modification, repair, and replacementSite demobilization
The 12 cost factors as they apply to the VRU and the as-sumptions employed are described in the followingsubsections.
4.4.1 Site Preparation Costs
It is assumed that preliminary site preparation will beperformed by the responsible party (or site owner). Theamount of preliminary site preparation will depend on thesite. Site preparation responsibilities include site designand layout, surveys and site logistics, legal searches, accessrights and roads, preparations for support anddecontamination facilities, utility connections, and auxiliarybuildings. Since these costs are site-specific, they are notincluded as part of the site preparation costs in this costestimate.
Certain site preparation activities, such as excavatinghazardous waste from the contaminated site, will berequired at all sites and are therefore included in this
estimate. Cost estimates for site preparation are based onrental costs for operated heavy equipment, labor charges,and equipment fuel costs. An excavation rate of 27 tph isassumed for all cleanup scenarios using the I0-tph VRU.It is assumed that the minimum rental equipment requiredto achieve an excavation rate of approximately 27 tphincludes nine excavators, three box dump trucks, and threebackhoes. The operation of this equipment will consumeapproximately 42 gph of diesel fuel. It is also assumedthat excavation activities will be conducted 8 hours perday, 5 days per week. Excavation costs are itemized inTable 13.
4.4.2 Permitting and Regulatory Costs
Permitting and regulatory costs are generally the obligationof the responsible party or site owner. These costs mayinclude actual permit costs, system monitoringrequirements, or the development of monitoring andanalytical protocols. Permitting and regulatory costs canvary greatly because they are site- and waste-specific. Nopermitting or regulatory costs are included in this analysis.Depending on the treatment site however, this may be asigniticant factor since permitting activities can be bothexpensive and time consuming.
4.4.3 Equipment Costs
The commercial-scale VRU will be capable of treating 10tph of contaminated soil. System accessories will includea steam generator for stripping volatile organics from thefeed soil, off-gas treatment system, and waste-watertreatment system. Major pieces of equipment include:
18

l Heated soil conveyorl Trommel screen miniwasherl Water heater0 Floe-clarifierl Steam boilerl Membrane filter press0 VOC treatment system
Miscellaneous equipment such as screens, pumps, mixers,and tanks are included in equipment costs.
The developer supplied equipment and utility costs for thepilot-scale and the lo-tph system. Total purchasedequipment cost for the lo-tph unit was estimated to be$1,24O,ooO, the total fixed capital investment (icludingfreight and sales tax, installation, instrumentation, piping,electrical, and engineering and supervision duringconstruction) was projected to be $3,110,000.
It is assumed that no rental equipment or purchasedsupport equipment will be required for operation (with theexception of trailers). Support equipment refers topurchased equipment necessary for operation but notintegral to the system.
The total equipment cost is calculated and annualizedusing the following formula:
A = C i(1 + i)(1 + 0” - 1
where: A = annualized cost, $C = capitalized cost, %i = interest rate, %n = useful life, years
The annualized cost (rather than depreciation) is used tocalculate equipment costs incurred by a site. It is assumedthat the interest rate will be 10 percent. For the lo-tphunit, a useful life of 10 years is assumed. The annualizedequipment cost is prorated to the actual time the unit iscommissioned to treat a hazardous waste (includingassembly, shakedown and testing, treatment, anddisassembly). The prorated annualized cost is estimatedto be $271,000. The prorated cost is then normalizedrelative to the tons of soil treated.
4.4.4 Startup and Fixed Costs
Mobilization includes both transportation and assembly.Transportation activities include moving the system andthe workers to and from the site. As a rough estimate, itis assumed that five oversize and one legal load size
tractor trailers will be required to transport thecommercial-scale soil washing system. In addition, onelegal load size tractor trailer will be required formiscellaneous equipment and spare parts. Travel costswere developed based on 1,300 road miles at a rate of$1.65 per mile per legal load and $3.30 per mile peroversized load (including drivers). Transportation costsfor the 11 nonlocal onsite workers are based on two $220one-way airfares per person. Two one-way airfares wereused instead of a round-trip airfare due to the restrictionsof a round-trip ticket and the difficulties in predictingwhen the project would end.
Assembly consists of unloading the system from the trucksand trailers and reassembling the VRU. It is assumed thatunloading the equipment will require the use of a 50-toncrane and operator for 3 weeks at a cost of $6,360 perweek. Assembly is assumed to require 10 people (8construction workers and 2 shift supervisors) working 8hours per day, 7 days per week, for 3 weeks. Table 14lists fully burdened salaries for all onsite personnelinvolved with assembly as well as other phases of theproject (e.g., startup and testing, training, treatment, anddisassembly). Labor charges during assembly consist ofwages and living expenses for nonlocal personnel (refer toSubsection 4.4.5) including two rental cars.
This cost estimate assumes that 1 week of shakedown andtesting will be required after assembly and prior to thecommencement of treatment. During this time, the systemcomponents are tested individually. It is estimated thateight workers will be required for 8 hours per day, 5 daysper week during shakedown and testing. The 8 workersinclude a project manager, shift supervisor, safety officer,maintenance worker, operator, administrator, and twolocal operators. In addition, the four local operators willbe trained for 3 days during this week. Labor costs consistof wages and living expenses for nonlocal personnel (referto subsection 4.4.5) including two rental cars.
Working capital consists of the amount of money currentlyinvested in supplies, energy, spare parts, and labor kept onhand [l]. The working capital for this system is based onmaintaining a l-month inventory of these items. For thecalculation of working capital, 1 month is defined as one-twelfth of 1 year, or approximately 21.8 working days.
For the purposes of this estimate, insurance is assumed tobe 6 percent of the total purchased equipment costs;property taxes are assumed to be 3 percent of the totalfixed capital investment [1]. These costs are annual andhave been prorated to the actual time the VRU iscommissioned to treat contaminated waste on a site(including assembly, shakedown and testing, treatment, anddisassembly).
19

Table 14. Fully Burdened Salaries for Ousite Persouuel UsiugIO- tph VRU
SalaryTitle Local (S/b)
Project Manager No 50
Shift Supervisor No 40
Safety Officer No 35
Non-local Operator No 30
Maintenance Worker No 20
Local Operator Yes 20
Construction Worker Yes 20
Administrative Personnel Yes 12
The cost for the initiation of monitoring programs has notbeen included in this estimate. Depending on the site,local authorities may impose specific guidelines formonitoring programs. The stringency and frequency ofmonitoring required may have a significant impact on theproject costs.
An annual contingency cost of 10 percent of theannualized equipment capital costs is allowed to coveradditional costs caused by unforeseen or unpredictableevents, such as strikes, storms, floods, and price variations[l]. The annual contingency cost has been prorated to theactual time the lo-tph VRU is commissioned to treathazardous waste (including assembly, shakedown andtesting, treatment, and disassembly).
4.4.5 Labor Costs
Labor costs consist of wages and living expenses.Personnel requirements are discussed in Subsection 4.3.4.Fully burdened rates are given in Table 14.
Living expenses depend on several factors: the duration ofthe project, the number of local workers hired, and thegeographical location of the project. Living expenses forall personnel who are not local hires consist of per diemand rental cars, both charged at 7 days per week for theduration of the treatment. Per diem varies by location,but for the purposes of this report, it is assumed to be $70per day per person. Four rental cars are required for 24hour operation and are available for $30 per day per car.Depending on the length of the project, it may be morepractical to hire only local personnel and train them in theoperation of the unit, eliminating living expenses.
4.4.6 Supplies Costs
For this estimate, supplies consist of chemicals and spareparts. Surfactant, alkali (sodium carbonate), alum,polyelectrolyte (flocculent), and sulfuric acid requirements
for the VRU are estimated to cost approximately $420,000for the entire project. Annual spare parts costs areestimated to be 5 percent of the total purchasedequipment cost or approximately $22,000 for the entireproject. Expenses for personal protective equipment areincluded in spare parts costs.
4.4.7 Consumables Costs
In order to heat wash water and steam strip VOCs fromthe feed, the VRU consumes natural gas at a rate ofapproximately 7.7 million Btu/h. The cost of natural gasis estimated as $4.00 per million Btu with no monthly fee,yielding a fuel cost of approximately $13,400 per month or$31 per hour of operation.
The electricity requirement for the screw conveyor, pumps,and mixers is approximately 66 kWh per ton of soiltreated. The estimated cost of electricity is $25,000 permonth or $48 per hour of operation. The cost estimateassumes that electricity can be obtained for a flat rate of$0.08 per kWh with no monthly charge.
The VRU has an estimated water requirement of 1,420gallons per ton of soil treated. It is assumed that 90percent of the water can be recovered and treated forreuse (i.e., only about 24 gpm of makeup is needed). Theother 10 percent is discarded as blowdown or lost withclean solids during separation processes. Water costs areestimated at $2 per 1,000 gallons. One month’s supply ofwater (667,000 gallons) costs about $1,330, and the costper hour of operation is $2.56.
4.4.8 Effluent Treatment and Disposal Costs
The clean solids generated during the SITE demonstrationremained onsite. It is assumed that clean solids from afull-scale cleanup will be used as fill material if found tobe nonhazardous. The fines will require further processingby another technology. Recovery of at least 80 percent ofthe solids present in the feed as washed soil is one of theproject objectives. The remainder (less than 20 percent)is incorporated into the fines slurry.
20

Most of the water from the water treatment system shouldbe suitable for recycling as wash water in the mini-washer.A fraction of this water will be removed as blowdown andrequire disposal or treatment. The responsible party or siteowner should obtain a discharge permit from the localmunicipality if possible. If no sewer service is available,the site owner or responsible party must obtain a directdischarge permit or arrange for disposal by other means.It should not be necessary to treat the blowdown waterprior to discharge, but this must be determined on a site-specific basis.
Onsite treatment and disposal costs are restricted to onsitestorage of the blowdown water (if necessary) and areassumed to be the obligation of the site owner orresponsible party. Offsite treatment and disposal costsconsist of wastewater disposal fees and are assumed to bethe obligation of the responsible party (or site owner).These costs may significantly add to the total cleanup cost.The cost of additional treatment of the tines is assumed tobe the obligation of the responsible party (or site owner).
4.4.9 Residuals and Waste Shipping, Handling, andTransport Costs
It is assumed that the residuals generated by this processwill include the clean solids, fmes, filters, spent carboncanisters, and spent PPE. Residuals will also be generatedwhen the unit is decontaminated. Potential waste disposalcosts include storage, transportation, and treatment costsand are assumed to be the obligation of the responsibleparty (or site owner). These costs could significantly addto the total cleanup cost.
4.4.10 Analytical Costs
No analytical costs are included in this cost estimate.Standard operating procedures do require sampling andanalytical activities to determine when breakthrough hasoccurred in equipment such as aqueous or vapor-phasecarbon absorption, reverse osmosis, or ultrafiltrationsystems. The client may elect or may be required by localauthorities to initiate a sampling and analytical program attheir own expense. If specific sampling and monitoringcriteria are imposed by local authorities, these analyticalrequirements could contribute significantly to the cost ofthe project.
4.4.11 Facility Modification, Repair, and Replacementcosts
Maintenance labor and material costs vary with the natureof the waste and the performance of the equipment. Forestimating purposes, total annual maintenance costs (laborand materials) are assumed to be 10 percent of annualequipment costs. Maintenance labor typically accounts fortwo-thirds of the total maintenance costs and has beendiscussed in Subsection 4.45. Maintenance material costsare estimated at one-third of the total maintenance costand are prorated to the entire period of treatment. Costsfor design adjustments, facility modifications, andequipment replacements are included in the maintenancecosts.
4.4.12 Site Demobilization Costs
Demobilization costs are limited to disassembly costs;transportation costs are included under mobilization.Disassembly consists of taking the VRU apart and loadingit onto trailers for transportation. It requires the use of a50-ton crane with operator, available at $6,360 per week,for 3 weeks. Additionally, disassembly requires a lo-person crew (8 construction workers and 2 shiftsupervisors) working 8 hours per day, 7 days per week, for3 weeks. Labor costs consist of wages (see Table 14) andliving expenses (refer to Subsection 4.45) including 2rental cars.
Site cleanup and restoration are limited to the removal ofall equipment from the site. These costs have beenpreviously incorporated in the disassembly costs.Requirements regarding t h e filling g r a d i n g o rrecompaction of the soil will vary depending on the futureuse of the site and are assumed to be the obligation of theresponsible party (or site owner).
4.5 Results of Economic Analysis
The costs associated with the operation of the VRU, aspresented in this economic analysis, are defined by 12 costcategories that reflect typical cleanup activitiesencountered on Superfund sites. Each of these cleanupactivities is defined and discussed; together they form thebasis for the cost analysis presented in Table 15. Thepercentage of the total cost contributed by each of the 12cost categories is shown in Table 16.
21

Table 15. Treatment Costs for lo-tpb VRU Treating 20,000 Tons ofContaminated soil
Cost ($/ton)
70% 8 0 % 9 0 %Item on-line on-line on-line
Site preparation
Permitting and regulatory
Equipment
Startup and fixed
Labor
Supplies
Consumables
Effluent treatmentand disposal
Residuals and wasteshipping, handling,and transport
Analytical
Facility modification,repair, and replacement
Site demobilization
34.61 34.61
- -
16.13 14.68
29.91 30.03
32.04 28.03
21.33 21.15
8.65 8.65
-
0.54
3.18 3.18 3.18
0.49
34.61
1356
30.29
24.92
21.01
8.65
-
-
0.45
Total operating costs 146.39 140.82 136.67
Table 16. Treatment Costs as Percentages of Total Costs for lo-tphVRU Treating 20,000 Tons of Contaminated Soil
Cost (as % of total cost)
Item 70% 80% 90%on-line on-line on-line
Site preparation
Permitting and regulatory
Equipment
Startup and fixed
Labor
Supplies
Consumables
Effluent treatment anddisposal
Residuals and wasteshipping, handling,and transport
Analytical
Facility modification,repair, and replacement
Site demobilization
Total operating costs
23.6 24.6
- -
11.0 10.4
20.4 21.3
21.9 19.9
14.6 15.0
5.9 6.1
- -
-
0.4
2.2
100
-
0.3
2.3 2.3
100 100
25.3
-
9.9
22.2
18.2
15.4
6.3
-
-
0.3
The developer claims that the VRU can operate with anon-line factor of over 90 percent. On-line factors of 90,80, and 70 percent were used in the cost calculations inorder to determine the impact of this parameter. The on-line factor is used to adjust the unit treatment cost tocompensate for the fact that the system is not on-lineconstantly because of maintenance requirements,breakdowns, and unforeseeable delays. Through the use ofthe on-line factor, costs incurred while the system is notoperating are incorporated in the unit cost.
The VRU is believed to be capable of operatingcontinuously (24 hours per day, 7 days per week) forextended periods of time; however, it was assumed that itwill be operated only 5 days per week. If the VRU is tobe to operated continuously, adjustments must be made toprorated cost estimates.
The feed rate during the SITE Demonstration Test wasapproximately 100 lb/h and the pilot-scale systemconsumed approximately 66 kWh per ton and 71 gph ofwater (no recycling). The pilot-scale unit used propane toheat the wash water; no steam was required since VOCswere not present in the feed soil. Based on the pilot-scalesystem, chemical usage rates per ton of soil for surfactant,alkali, alum, and polyelectrolyte were 24, l2, and 18 and0.18 lbs, respectively.
The developer provided cost and capacity information forboth the pilot- and full-scale (lo-tph) VRU units. Allcosts are for 1993. It is assumed the commercial-scale unitwill have a feed rate of 10 tph and will requireapproximately 24 gpm of water (assuming 90 percentrecycling), 66 kWh/ton of electricity, and 7.7 million Btu/hof natural gas. For this feed rate, the results of theanalysis show a unit cost ranging from $137 per ton to$147 per ton for 90 and 70 percent on-line conditions,respectively.
Based on the information provided by the developer, theestimated purchased equipment cost for a larger (100 tph)VRU unit was calculated using the following formula:
F = P(R)
where: F = Full-scale costP = Pilot-scale costR = Scale-up ratio (full-scale capacity/pilot-scale
capacity)n = Scale-up factor
22

This formula represents a typical cost verses capacity curve[2]. Knowing the cost and capacity of the pilot and lo-tphequipment, the scale-up factors were determined. Thesevalues ranged from 0.32 to 0.97, but were typically between0.4 and 0.7. Using the same factors and estimated scale-up ratios, equipment costs for the lOO-tph VRU unit werecalculated.
These costs are considered order-of-magnitude estimatesas defined by the American Association of Cost Engineers.The actual cost is expected to fall between 70 and 150percent of the estimated cost when scaling-up from a full-scale unit to a larger full-scale unit. Since these costs wereestimated from scaling-up a pilot-scale unit to a full-scaleunit, the range may actually be wider.
Table 17 compares estimated unit treatment costs for sitescontaining 10,000, 20,000, and 290,000 tons ofcontaminated soil, Table 18 shows the percentage of thetreatment costs contributed by each of the 12 costcategories. All variables except total amount ofcontaminated soil are held constant. In particular, allthree estimates utilize a lo-tph VRU and a 90 percent on-line factor. If the lo-tph VRU is used to remediate a sitecontaining less than 20,000 tons of contaminated soil (allother variables remaining constant), the startup and fxedcosts will become more of a factor. Unit costs derivedfrom startup, demobilization, and from fixed expenses willbe higher, but unit costs derived from operating expenseswill remain approximately the same.
For example, if this system is applied to a site containing10,000 tons of contaminated soil, the unit treatment costs(using a 90 percent on-line factor) are estimated at $171per ton of soil. If the lo-tph VFW is used at a sitecontaining over 20,000 tons of contaminated soil (all othervariables remaining constant), the startup, demobilization,and fured costs will become less of a factor. Unit costsderived from startup, demobilization, and fixed expenseswill be lower, but unit costs derived from operatingexpenses will remain approximately the same.
If this system is applied to the remediation of a sitecontaining 200,000 tons of contaminated soil, the unittreatment costs (using a 90 percent on-line factor) areestimated at $106 per ton of soil.
It will take nearly 4 years to remediate a site containing290,000 tons of contaminated soil with the lo-tph system.For this volume of soil, one or more larger units would bemore appropriate. In order to make a comparison, apreliminary cost estimate was prepared for a systemcapable of treating 100 tph of contaminated soil.
Table 17. Treatment Costs for IO-tph VRU Operating with a 90%On-line Factor
Item
Cost (S/ton)
10,ooo 20,000 200,000tons tons tons
Site preparation
Permitting andregulatory
Equipment
Startup and fuced
Labor
Supplies
Consumables
Effluent treatmentand disposal
Residuals and wasteshipping, handling,and transport
Analytical
Facility modification,repair, and replacement
Site demobilization
34.61
-
18.12
56.70
24.92
21.01
8.65
-
-
0.60
6.36
Total operating costs 170.97
34.61
-
34.61
1356 9.45
30.29 652
24.92 24.92
21.01 21.01
8.6.5 a.65
- -
-
0.45
-
0.31
3.18
136.67
0.32
105.79
Table 18. Treatment Costs as % of Total Costs for IO-tph VRUOperating With a 90% On-line Factor
Item
Cost (as % of total cost)
10,000 2 0 , 0 0 0 200,ooatons tons tons
Site preparation
Permitting and
regulatory
Equipment
Startup and fxed
Labor
Supplies
Consumables
Effluent treatment
and disposal
Residuals and wasteshipping, handling,and transport
Analytical costs
Facility modification,repair, and replacement
Site demobilization
Total operating costs
20.2 25.3 32.7
- - -
10.6 9.9 8.9
33.2 22.2 6.2
14.6 18.2 23.6
12.3 lg.4 19.9
5.1 6.3 8.2
- -
- - -
0.4 0.3 0.3
3.7 2.3 0.3
100 100 100
23

This formula represents a typical cost verses capacity curve[2]. Knowing the cost and capacity of the pilot and lo-tphequipment, the scale-up factors were determined. Thesevalues ranged from 0.32 to 0.97, but were typically between0.4 and 0.7. Using the same factors and estimated scale-up ratios, equipment costs for the lOO-tph VRU unit werecalculated.
These costs are considered order-of-magnitude estimatesas defmed by the American Association of Cost Engineers.The actual cost is expected to fall between 70 and 150.percent of the estimated cost when scaling-up from a full-scale unit to a larger full-scale unit. Since these costs wereestimated from scaling-up a pilot-scale unit to a full-scaleunit, the range may actually be wider.
Table 17 compares estimated unit treatment costs for sitescontaining 10,000, 20,000, and 200,000 tons ofcontaminated soil; Table 18 shows the percentage of thetreatment costs contributed by each of the 12 costcategories. All variables except total amount ofcontaminated soil are held constant. In particular, allthree estimates utilize a lo-tph VRU and a 90 percent on-line factor. If the lo-tph VFW is used to remediate a sitecontaining less than 20,000 tons of contaminated soil (allother variables remaining constant), the startup and fmedcosts will become more of a factor. Unit costs derivedfrom startup, demobilization, and from fixed expenses willbe higher, but unit costs derived from operating expenseswill remain approximately the same.
For example, if this system is applied to a site containing10,000 tons of contaminated soil, the unit treatment costs(using a 90 percent on-line factor) are estimated at $171per ton of soil. If the lo-tph VRU is used at a sitecontaining over 20,000 tons of contaminated soil (ail othervariables remaining constant), the startup, demobilization,and fixed costs will become less of a factor. Unit costsderived from startup, demobiition, and fixed expenseswiii be lower, but unit costs derived from operatingexpenses will remain approximately the same.
If this system is applied to the remediation of a sitecontaining 200,000 tons of contaminated soil, the unittreatment costs (using a 90 percent on-line factor) areestimated at $106 per ton of soil.
It wiil take nearly 4 years to remediate a site containing200,000 tons of contaminated soil with the lo-tph system.For this volume of soil, one or more larger units would bemore appropriate. In order to make a comparison, apreliminary cost estimate was prepared for a systemcapable of treating 100 tph of contaminated soil.
Table 17. Treatment Costs for lo-tpb VRU Operating with a 90%On-Iine Factor
Cost ($/ton)
10,000 20,ooo 200,oooItem tons tons tons
Site preparation
Permitting andregulatory
Startup and fuced
Labor
Supplies
Effluent treatmentand disposal
Residuals and wasteshipping, handling,and transport
Analytical
Facility modification,repair, and replacement
Site demobilization
34.61
-
18.12
56.70
24.92
21.01
8.65
-
-
0.60
6.36
34.61 34.61
- -
1356 9.45
30.29 652
24.92 24.92
21.01 21.01
8.65 8.65
- -
-
0.45
3.18
-
0.31
0.32
Total operating costs 170.97 136.67 105.79
Table 18. Treatment Costs as % of Total Costs for lo-tpb VRUOperating With a 90% On-line Factor
Item
Cost (as % of total cost)
10,000 2 0 , 0 0 0 200,cGotons tons tons
Site preparation
Permitting andregulatory
Equipment
Startup and fuced
Labor
Supplies
Consumables
Effluent treatmentand disposal
Residuals and wasteshipping, handling,and transport
Analytical costs
Facility modification,repair, and replacement
Site demobilization
Total otwating costs
20.2
-
10.6 9.9 8.9
33.2 22.2 6.2
14.6 18.2 23.6
12.3 15.4 19.9
5.1 6.3 8.2
- - -
-
0.4
3.7
100
25.3
-
-
0.3
2.3
100
32.7
-
-
-
0.3
0.3
100
23

Table 19 compares estimated unit treatment costs for theuse of lo-tph and lOO-tph systems at a site containing200,000 tons of contaminated soil; Table 20 shows thepercentage of the treatment costs contributed by each ofthe 12 cost categories. All process variables except feedrate are held constant. In particular, both estimates utilizea 90 percent on-line factor. This preliminary analysisindicates that it will cost $72 per ton to remediate a sitecontaining 200,000 tons of contaminated soil using the lOO-tph system (assuming a 90 percent on-line factor). Whenthe larger system is used, the treatment time isapproximately 0.4 years and the equipment is onsite forapproximately 0.54 years. Transportation and onsiteassembly of the larger unit, however, could presentdifficulties. More trailers and labor will be required formobilization and demobilization. It was assumed that oneextra local operator would be required per shift to operatethe larger unit. Scale-up to 100 tph from 10 tph wasaccomplished by either increasing the scale-up ratio or thenumber of units or a combination of both.
Table 19 . Treatment Costs for the Remediation of 200,000 Tons ofContaminated Soil Using the VRU Operating With a 90%On-line Factor
Item
Site preparation
Permitting and regulatory
Equipment
Startup and fixed
Labor
Supplies
Consumables
Effluent treatmentand disposal
Residuals and waste shipping,handling, and transport
Analytical
Facility modification,repair, and replacement
Site demobilization
Total operating costs
Cost (S/ton)
10-tph 1O0-tphSystem System
34.61 25.26
- -
9.45 2.35
6.52 11.90
24.92 2.71
21.01 20.40
86.5 8.65
- -
-
0.31 0.08
0.32 0.64
105.79 71.99
Table 20. Treatment Costs as Percentage s of Total Cast s for VRUTreating 200,000 Tons of Contaminated S&I
Cost (as % of total cost)
Item lO-tph NO-tphSystem System
Site preparation 32.7 35.1
Permitting and regulatory - -
Equipment 8.9 3.3
Startup and fixed 6.2 165
labor 23.6 3.8
Supplies 19.9 28.3
Consumables 8.2 12.0
Effluent treatment and disposal - -
Residuals and waste shipping,handling, and transport
Analytical costs
Facility modification, repair, andreplacement
Site demobilization
I Total operating costs
0.3 0.1
0.3 0.9
100 100
The costs excluded from this cost analysis are described inSubsections 4.3 and 4.4. This analysis does not includevalues for 4 of the 12 cost categories, so the actual cleanupcosts incurred by the site owner or responsible party maybe significantly higher than the costs shown in this analysis.While the volume of waste treated can be signikantlyreduced, the contaminants are not destroyed orimmobiid, so another treatment technology will berequired to treat the fines removed from the VRU.
4.6
1.
2.
References
Peters, M.S. and Timmerhaus, KD. Plant Designand Economics for Chemical Engineers; ThirdEdition; McGraw-Hill, Inc., New York, 1980.
Baasel, W. D. Preliminary Chemical EngineeringPlant Design; Elsevier Science Publishing Co.,Inc., New York, 1976.
24
Appendix A
Process Description
A.1 Introduction
Section 121(b) of CERCLA mandates EPA to selectremedies that “utilize permanent solutions and alternativetreatment technologies or resource recovery technologiesto the maximum extent practicable” and to prefer remedialactions in which treatment “permanently and signiticantlyreduces the volume, toxicity, or mobility of hazardoussubstances, pollutants, and contaminants as a principalelement.” The VRU was developed to meet thoseobjectives, as well as the objectives listed below:
To make available to members of the researchcommunity and the commercial sector the results ofgovernment research on a flexible, multi-step, mobile,pilot-scale soil washer capable of running treatabilitystudies on a wide variety of soils
To demonstrate the capabilities of soil washing
To provide data that facilitate scale-up tocommercial-size equipment
The VRU is a mobile, pilot-scale soil washing system forstand-alone field use in cleaning soil contaminated withhazardous substances. Removal eftkiencies depend on thecontaminant as well as the type of soil. In genera soilwashing is effective on coarse sand and gravelcontaminated with a wide range of organic and inorganiccontaminants.
A.2 Process Description
The VRU is a mobile research unit developed fortreatabiity studies on soils contaminated with a widevariety of contaminants. It was designed to be extremelyflexible in terms of equipment and wash water additivesused. It was not designed to be a commercial treatmentunit.
Soil washing is a water-based ex situ process formechanically scrubbing soils to remove undesirablecontaminants. The process removes contaminants fromsoils by either dissolving or suspending them in the washsolution (which is later treated by conventional wastewatertreatment methods) or by concentrating them into asmaller volume of soil through simple particle sizeseparation techniques. The concept of reducing soilcontamination through the use of particle size separationis based on the finding that most organic and inorganiccontaminants tend to bind to fine-sized clay and siltparticles primarily by physical processes [l]. Washingprocesses that separate fine clay and silt particles from thecoarser sand and gravel soil particles effectively separateand concentrate the contaminants into a smaller volume ofsoil that can be further treated. The clean larger fractioncan be returned to the site for continued use. This set ofassumptions forms the basis for the volume-reductionconcept upon which the VRU has been developed.
The VRU is designed to decontaminate certain soilfractions using state-of-the-art washing equipment.
The total system consists of process equipment andsupport utility systems mounted on two heavy-duty tractortrailers. The design capacity of the VRU is 100 lbs/h.The basic VRU system consists of the followingsubsystems:
Soil handling and conveying (grizzly)Soil washing and coarse screening trommel screen(miniwasher and vibrating screens)Fines/floatables gravity separation (CPI tank)Fines flocculation/water claritication and solidsdisposal (floc clarifier)Water treatment (filter, carbon drums,blowdown tank, and makeup water tank)Utilities (electric generator, steam boiler, water heaterand air compressor)

The electric generator, air compressor, water heater,filters/carbon drums, water recycling pump, and blowdowntank are located on the utility trailer. All remainingequipment is located on the process trailer. Figure A-l isa diagram of the typical VRU operational setup. (TheVRU setup at the Escambia Treating Company sitedemonstration was modified slightly from this typicalsetup.) The VRU system is controlled and monitored byconventional industrial process instrumentation andhardware including safety interlocks, alarms, and shutdownfeatures.
During the demonstration, feed soil was taken fromprepared test piles and manually processed through a %-inch screen. After screening, the demonstration wasconducted in accordance with the standard VRU operatingprocedure, a description of which follows.
site. From the feed surge bin, the soil less than % inch isconveyed through a screw conveyor to the miniwasher. Theconveyor flow is adjusted by a speed controller on theconveyor motor. The solids pass through a motor-operated rotary valve (which prevents air infiltration), andthen into the feed hopper of the miniwasher.
Soil is fed to the miniwasher at a controlled rate ofapproximately 100 lbs/h by the screw conveyor. Filteredwash water is added to the soil in the feed hopper andalso sprayed onto an internal slotted trommel screen [witha lo-mesh (2-mm) slot opening] miniwasher. Fivemanually controlled levers can adjust the flow up to anapproximately I3 to 1 overall water-to-soil ratio. Twovibrating screens continuously segregate soil into varioussize fractions. The screens can be set at a variety of meshsizes. For the demonstration, lo-mesh (2-mm) and lOO-mesh (0.150-mm) screens were used.
The screened soil is collected in a bucket for transfer tothe feed surge bin, and oversized soil is returned to the
“. .,..

Miniwasher overflow (the stream exiting the top of thewasher), which contains the coarser solids, falls onto thefirst lo-mesh (2-mm) vibrascreen. The first vibrascreenoverflow (less than % inch, greater than lo-mesh) solidsflow by gravity down to a recovery drum. The underflow(the stream exiting the bottom) is pumped at a controlledrate to the second lOO-mesh (O.l50-mm) vibrascreen whereit is joined by the miniwasher underflow.
The overflow from the second vibrascreen [less than lo-mesh (2-mm), greater than lOO-mesh (O.l50-mm)] isgravity fed to the same recovery drum containing the otherminiwashed coarse soil fraction. The second vibrascreenunderflow (a fines slurry) drains into a tank with a mixer.
Slurry from the lOO-mesh (0.150-mm) screen (fines slurry)tank is pumped to the CPI. Materials lighter than water(floatables such as oil) flow over an internal weir, collectin a compartment within the CPI, and drain by gravity toa drum for disposal. CPI-settled solids [particles whichwill pass through a lOO-mesh (O.l50-mm) screen] aredischarged by the bottom auger to a recovery drum.
An aqueous slurry, containing fines less thanapproximately 400 mesh (38 pm), overflows the CPI andgravity feeds into a tank with a mixer. The slurry is thenpumped to a static mixer located upstream of the floeclarifier’s mix tank. Flocculating chemicals, such as liquidalum and aqueous polyelectrolyte solutions, are meteredinto the static mixer tank to neutralize the repulsiveelectrostatic charges on colloidal particles (clay/humus)and promote coagulation. The slurry is then dischargedinto the floc chamber, which has a variable-speed agitatorfor controlled floe growth (sweep flocculation). Sweepflocculation refers to the adsorption of fine particles ontothe floe (colloid capture) and continuing floe growth topromote rapid settling of the floe. The floe slurryoverflows into the clarifier (another corrugated plate unit).Bottom solids are augured to a drum for disposal.
Clarified water is polished with the objective of reducingsuspended solids and organics to low levels that permitrecycling of spent wash water. Water is pumped from thefloc settler overflow tank at a controlled rate throughcartridge-type polishing filters operating in parallel inorder to remove soil fines greater than 4 x lo4 inch (10pm). Water leaving the cartridge filter flows throughactivated carbon drums for removal of hydrocarbons. Thecarbon drums may be operated either in series or parallel.Hydrocarbon breakthrough is monitored by sampling,drums are replaced when breakthrough has been detected.
In order to recycle water and maintain suitable dissolvedsolids and organic levels, aqueous bleed (blowdown) to theboiler blowdown tank may be initiated at a controlled rate.
A.3 References
1. Ballard, R.B., B.J. Losack, and T.M. Murphy.Treatment of Hydrocarbon and Lead Contaminationby Soil Washing at a Pipe Inspection Facility, PrudhoeBay, Alaska. Presented at the 86th Annual Meetingof the Air & Waste Management Association, June13-18, 1993.

Appendix B
Developer Claims
B.1 Introduction
The VRU is a mobile, pilot-scale soil washing system. Itwas designed to be a research platform to evaluate theeffectiveness of soil washing as a technology to removevolatile organics, semivolatile organics and metals fromsoils, sludges, and sediments. Soil washing is a water-based process which extracts and concentrates thehazardous constituents into a smaller volume of soil andsludge using chemical extraction and physical separationmethods.
The VRU is composed of two 40-foot trailers, a processtrailer, and a utilities trailer. The unit has a flexible designto enable the formulation of wash fluids composed ofdifferent combinations of water, surfactants, caustic, acids,and chelating agents. In addition to soil washing andphysical separation, there is an onboard steam generatorand a jacketed screw conveyor to enable the evaluationand use of steam stripping or low temperature thermaldesorption to remove volatile and semivolatile organ.&The VRU also has a solids separation and waterpurification system to enable the treatment and recyclingof the wash water and to evaluate the effectiveness ofdifferent water treatment chemicals (coagulants andflocculants) and equipment.
Several treatabiity studies have been performed inconjunction with EPA Regional staff and EPA’sEnvironmental Response Team (ERT). The VRU hastreated pentachlorophenol, creosotes, dioxin and furans atthe Escambia Wood Treating Sites and herbicides andpesticides at the Sand Creek Superfund Site. Thesestudies have been performed primarily to help theRemedial Project Managers (RPMs) and On-SceneCoordinators (OSCs) determine the feasibility of soilwashing for their particular sites. The studies also enableRREL staff to evaluate the effect of varying processparameters such as the wash fluid temperature and pH,liquid-solid ratio, the system contact time, and screen meshsize were varied to evaluate their effect on the extraction
effkiency of the system. Various wash formulations andsurfactant concentrations have also been explored. Workat several other sites will be performed this year lookingat contaminants such as diesel fuel, polychlorinatedbiphenyls (PCBs), and heavy metals.
The VRU is designed to easily accommodate the additionof other unit operations such as low temperature thermalsystems, chemical extraction processes, electron beamoxidizers, and biotreatment units. Previous studies haveevaluated these types of units for treating the effluent fromthe soil washing operation. RREL plans to publish theresearch and treatabiity findings so RPMs, OSCs, andproject managers can make informed decisions about theeffectiveness of soil washing technology on the particularsites.
B.2 SITE Demonstration Claims
During the spring of 1992, EPA’s ERT performed siteinvestigations at four wood treating facilities. These sites,located in the southeastern U.S., were contaminated withorganic (creosote and pentachlorophenol) and inorganic(copper, chromium, and arsenic) wood preservativecompounds. Bench-scale soil washing studies wereperformed on the soil from two of the sites. Aqueousbiodegradable surfactants were tested for their abiity toincrease the solubiity of PCP and creosote compounds,and 280 ppm carcinogenic creosote compounds showedremovals of greater than 99 percent, 92 percent, and 95percent after several washes with Tergitol NP-10 surfactantat elevated pH and temperature. Dioxin and furan levelswere also reduced more than 91 percent.
Pilot studies using the VRU were performed in July 1992by RREL and RBC at the Escambia Wood Treating Sitein Pensacola, Florida. Representative soil washomogenized and washed under varying pH, temperature,and surfactant concentrations. Twenty runs wereperformed over a Zweek period. Concentration levels

were reduced from an initial concentration of 150 ppm The SITE Demonstration also took place at the EscambiaPCP, 75 ppm carcinogenic creosote, and 1,250 ppm total Site. Thus, the project claims and tests conditions werecreosote to 1.7 ppm PCP, 3.5 ppm carcinogenic creosote, based on the results of the previous treatabiity studies.and 80 ppm total creosotes. Nondetectable levels (< 1 The specific claims and project objectives of this study areppm, > 99 percent removal) were achieved for PCP and as follows:carcinogenic creosote after a clean water rinse was appliedto the washed coarse samples. The total creosote residual l
was reduced to less than 32 ppm, greater than 97 percentremoval.
Analysis indicated that only 1 weight percent of the feedsoil was below 115 mesh (0.125 mm). Thus, the VRUused lOO-mesh (O.l50-mm) screens as the cut point. l
Theoretically, volume reductions of 97 to 98 percent couldbe achieved. Due to inefficiencies of the screening units,the unit achieved volume reductions of approximately 90to 93 percent.
The VRU will separate the coarse gravel and sand(material which will not pass through a lOO-meshscreen) from the finer silt and clay particles. Avolume reduction of at least 80 percent will beachieved.
The coarse soils exiting the VRU w=ill containresiduals of total creosote and pentachlorophenolcontaminants at least 90 percent lower than the initialvalues found in the feed soil.

Appendix C
SITE Demonstration Results
C.1 Introduction
This appendix summarizes the results of the SJTEDemonstration Test of the VRU developed by EPA.These results are also discussed in Sections 1 and 3 of thisreport. A more detailed account of the demonstrationmay be found in the TER.
The ability of the VRU to reduce the concentration oforganic contaminants in excavated soils was evaluated.Results from this demonstration include: percentreductions for PCP, percent reductions for PAHs; percentsolids returned to the site as washed soil, and massbalances for total material, dry solids, PCP, and PAHs.VRU operating conditions were verified and the watertreatment system effectiveness was assessed based on washwater quality before and after treatment by the VRUsystem.
PAH- and PCP-contaminated soil from the formerEscambia Treating Company site in Pensacola, Florida wastreated during the demonstration. Contaminant levels inthe excavated soil from the site ranged from the low partsper million to percent levels. For the SITE demonstration,the excavated soil was homogenized and manuallyprocessed through a Gnch screen before it was fed to theVRU.
Average contaminant concentrations in the feed soil on adry weight basis are summarized in Table C-l. Fivecompounds from the standard set of creosote-fractionPAHs were not detected in the feed soil samples. Thesecompounds [naphthalene, benzo(k)fluoranthene,ideno(l,2,3_cd)pyrene, dibenzo(a,h)anthracene, a n dbenzo(g,h,i)perylene] were not included as PAHs for thisevaluation.
Table C-l. Average Contaminant Concentrations in the Feed Soil (dryweight basis)
Contaminant @pm)
PAHS
Acenaphthylene 3
Acenaphthene 120
Fluorene 130
Phenanthrene 330
Anthracene 59
Fluoranthene 180
Pyrene 110
Benzo(a)anthracene 29
Chrysene 27
Benzo(b)fluoranthene 12
Benzo(a)pyrene 8
PCP 140
C.2 Operating Conditions
The target operating conditions were specified in theDemonstration Plan [l]. Three runs, each 4 hours induration, were performed for each of Conditions 1 and 2.Two runs, each 6 hours in duration, were performed underCondition 3. Sampling was conducted in accordance withthe procedures outlined in the Demonstration Plan [l].Surfactant concentration, and wash water pH andtemperatures were monitored to determine whether theVRU was functioning at the specified operating conditions.
31
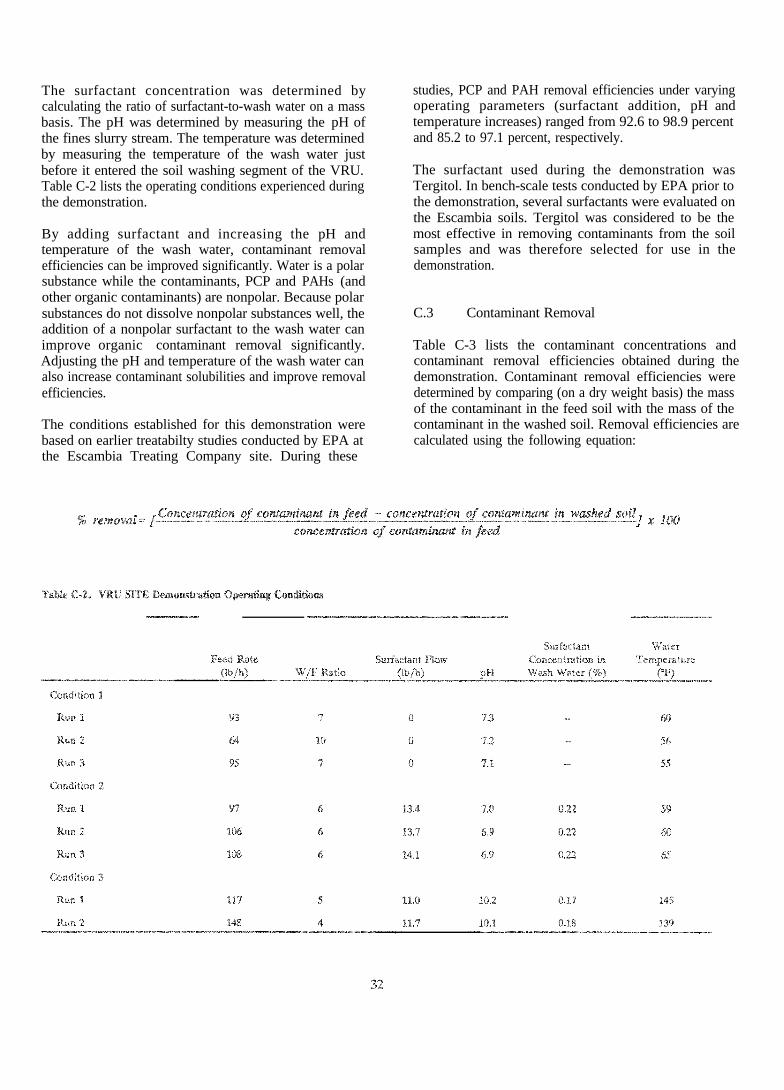
The surfactant concentration was determined bycalculating the ratio of surfactant-to-wash water on a massbasis. The pH was determined by measuring the pH ofthe fines slurry stream. The temperature was determinedby measuring the temperature of the wash water justbefore it entered the soil washing segment of the VRU.Table C-2 lists the operating conditions experienced duringthe demonstration.
By adding surfactant and increasing the pH andtemperature of the wash water, contaminant removalefficiencies can be improved significantly. Water is a polarsubstance while the contaminants, PCP and PAHs (andother organic contaminants) are nonpolar. Because polarsubstances do not dissolve nonpolar substances well, theaddition of a nonpolar surfactant to the wash water canimprove organic contaminant removal significantly.Adjusting the pH and temperature of the wash water canalso increase contaminant solubilities and improve removalefficiencies.
The conditions established for this demonstration werebased on earlier treatabilty studies conducted by EPA atthe Escambia Treating Company site. During these
studies, PCP and PAH removal efficiencies under varyingoperating parameters (surfactant addition, pH andtemperature increases) ranged from 92.6 to 98.9 percentand 85.2 to 97.1 percent, respectively.
The surfactant used during the demonstration wasTergitol. In bench-scale tests conducted by EPA prior tothe demonstration, several surfactants were evaluated onthe Escambia soils. Tergitol was considered to be themost effective in removing contaminants from the soilsamples and was therefore selected for use in thedemonstration.
C.3 Contaminant Removal
Table C-3 lists the contaminant concentrations andcontaminant removal efficiencies obtained during thedemonstration. Contaminant removal efficiencies weredetermined by comparing (on a dry weight basis) the massof the contaminant in the feed soil with the mass of thecontaminant in the washed soil. Removal efficiencies arecalculated using the following equation:

Table C-3. Removal Efficiencies for PCP and PAHS (dry weight basis)
ParameterFeed Soil
@pm)
PCP
Washed Soil@Pm)
% Feed SoilReduction @pm>
PAHS
Washed Soil@pm)
%Reduction
Condition 1
Run 1
Run 2
Run 3
Range
Condition 2
Run 1
Run 2
Run 3
Range
Condition 3
Run 1
Run 2
Range
lS0
170
140
130-180
170
180
160
150-210
100 2.4
110 3.5
48-190 2-5
28
36
43
21-52
15
13
14
8-19
81
78
69
91
93
91
98
97
l,@Jo 180
l,oocJ 160
830 130
900-1,200 120-220
1,100 44
960 46
550-1,700 29-65
240
310
350
200-520
7774
59
83
84
84
96
95
PCP removal efficiencies were calculated for Conditions 1,2, and 3. Under Condition 3, which employed surfactantaddition and pH and temperature adjustment, the averagePCP removal efficiency was 97 percent. UnderCondition 2, which employed surfactant addition only, theaverage PCP removal efficiency was 92 percent. Theseremoval efficiencies achieve the project objective ofdemonstrating that the unit is capable of removing 90percent of the PCP from the bulk of the feed soil. Theaverage PCP removal efficiency for Condition 1 was only76 percent. These data illustrate the impact of surfactantaddition and pH adjustment on PCP removal effkiencies.PCP removal efficiency is clearly surfactant-dependent andalso appears to be slightly pH- and temperature-dependent.
PAH removal effkiencies were calculated for Conditions1, 2, and 3. Under Condition 3, which employedsurfactant addition and pH adjustment, the average PAHremoval efficiency was 95 percent. This removal efficiencyachieves the project objective of demonstrating that theunit is capable of removing 90 percent of the PAHs fromthe bulk of the feed soil. The average PAH removal
effkiencies for Conditions 1 and 2 were only 70 percentand 83 percent, respectively. These results illustrate theimpact of surfactant addition and pH and temperatureadjustment on PAH removal efficiencies.
C.4 Washed Soils Recovery
The VRU system is designed to separate the sand andgravel fraction of the soil from the contaminated fines (i.e.,fine clay and silt particles). The larger sand and gravelfraction exits the system as washed soil. By comparing themass of dry solids in the feed soil with the mass of drysolids in the washed soil, solids recoveries of 95, 95, and 82percent were calculated for soils treated under Conditions1 through 3. These recoveries were also calculated on anormalized basis, yielding normalized recoveries of 90, 88, of8888,and 86 percent for Conditions 1, 2, and 3. Theserecoveries, shown in Table C-4, achieve the projectobjective of demonstrating that at least 80 percent of thesolids present in the feed soil would be returned to the siteas washed soil.
33

C.5 Mass Balances
Mass balances were performed to assess material andcontaminant fate as well as system efficiency. Massbalances were conducted for total materials, dry solids,PCP, and PAHs. These balances were obtained bycomparing the mass of a given substance entering thesystem (in all input streams) with the mass of thatsubstance exiting the system (in all output streams). Massbalance closure (or recovery) is calculated as follows:
II
C.5.1 Total Material
The total mass of all mater&I (feed soil and washwater)entering the VRU was compared to the total mass of allmaterial (cleaned soil and fines slurry) exiting the system.The mass balances for the total material are presented inTable C-5. Closures of 104, ll3, and 98 percent wereobtained during Conditions 1, 2, and 3, respectively.
During Condition 2, it was noted the mass flow ratemeasurement of the fines slurry may have been affected bysampling procedures employed during the demonstration.This resulted in inflated mass flow rates. The procedurewas modified and the percent closures dropped to theacceptable range. Except for this inflated closure of 113percent for Condition 2, average closures for total materialbalances met the project objectives of 90 to 110 percent.
C.5.2 Dry Solids
Dry solids mass balances were calculated by comparing thetotal dry weight of the solids entering soil washer per houras feed soil with the total dry weight of the solids exitingthe soil washer as washed soil and slurry fines. Except forRun 2 of Condition 1, Run 2 of Condition 2, and Run 2 ofCondition 3, the closures obtained during the demonstra-tion are consistent with project objectives specifyingclosures of between 85 and 115 percent for solids treatedwithin the soil washing portion of the VRU system. Eventhough closures for individual runs were outside of thespecified range, the average closures for Conditions 1, 2,and 3 met project objectives. The mass balances for drysolids are presented in Table C-6.


C.5.3 PCP C . 5 . 4 PAHS
At Condition 1, the average mass balance closure for PCPwas 101 percent, which meets the project objective of PCPmass balance closures between 80 and 175 percent. Theaverage PCP closures for Conditions 2 and 3 were below80 percent, and therefore did not meet the projectobjective.
Average PCP closures for Conditions 2 and 3 were 19percent and 13 percent, respectively. Because the lowPCP closures were experienced when surfactant was addedto the wash water, it seems probable that the surfactantinterfered with the PCP analyses. The PCP mass balancesare presented in Table C-7.
Like PCP, the majority of PAHs entering the VRU withinthe feed soil exited in the slurry fines. At Condition 1, theaverage mass balance closure for PAHs was 87 percent,which meets the project objective of PAH mass balanceclosures between 80 and 175 percent. The average PAHclosures for Conditions 2 and 3 were below 80 percent,and therefore did not meet the project objective. AveragePAH closures for Conditions 2 and 3 were 28 percent and13 percent, respectively. Like PCP the low PAH closureswere experienced when surfactant was added to the washwater, and it seems probable that the surfactant interferedwith the PAH analyses. The PAH mass balances arepresented in Table C-8.
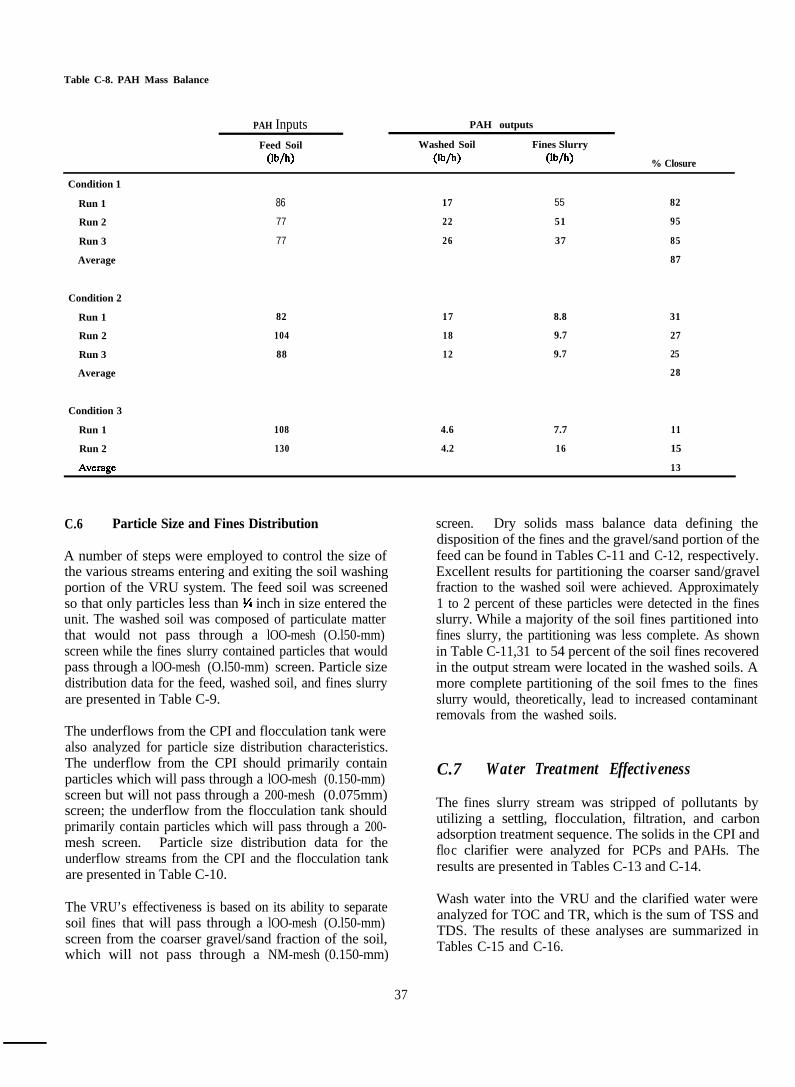
Table C-8. PAH Mass Balance
PAH Inputs PAH outputs
Feed Soil Washed Soil Fines Slurry
(lb/h) (lb/h) (lb/h) % Closure
Condition 1
Run 1
Run 2
Run 3
Average
Condition 2
Run 1
Run 2
Run 3
Average
Condition 3
Run 1
Run 2
86
77
77
82 17 8.8
104 18 9.7
88 12 9.7
108 4.6 7.7
130 4.2 16
17
22
26
55
51
37
82
95
85
87
31
27
25
28
11
15
13
C.6 Particle Size and Fines Distribution
A number of steps were employed to control the size ofthe various streams entering and exiting the soil washingportion of the VRU system. The feed soil was screenedso that only particles less than % inch in size entered theunit. The washed soil was composed of particulate matterthat would not pass through a lOO-mesh (O.l50-mm)screen while the fines slurry contained particles that wouldpass through a lOO-mesh (O.l50-mm) screen. Particle sizedistribution data for the feed, washed soil, and fines slurryare presented in Table C-9.
The underflows from the CPI and flocculation tank werealso analyzed for particle size distribution characteristics.The underflow from the CPI should primarily containparticles which will pass through a lOO-mesh (0.150-mm)screen but will not pass through a 200-mesh (0.075mm)screen; the underflow from the flocculation tank shouldprimarily contain particles which will pass through a 200-mesh screen. Particle size distribution data for theunderflow streams from the CPI and the flocculation tankare presented in Table C-10.
The VRU’s effectiveness is based on its ability to separatesoil fines that will pass through a lOO-mesh (O.l50-mm)screen from the coarser gravel/sand fraction of the soil,which will not pass through a NM-mesh (0.150-mm)
37
screen. Dry solids mass balance data defining thedisposition of the fines and the gravel/sand portion of thefeed can be found in Tables C-11 and C-12, respectively.Excellent results for partitioning the coarser sand/gravelfraction to the washed soil were achieved. Approximately1 to 2 percent of these particles were detected in the finesslurry. While a majority of the soil fines partitioned intofines slurry, the partitioning was less complete. As shownin Table C-11,31 to 54 percent of the soil fines recoveredin the output stream were located in the washed soils. Amore complete partitioning of the soil fmes to the finesslurry would, theoretically, lead to increased contaminantremovals from the washed soils.
C.7 Water Treatment Effectiveness
The fines slurry stream was stripped of pollutants byutilizing a settling, flocculation, filtration, and carbonadsorption treatment sequence. The solids in the CPI andfloc clarifier were analyzed for PCPs and PAHs. Theresults are presented in Tables C-13 and C-14.
Wash water into the VRU and the clarified water wereanalyzed for TOC and TR, which is the sum of TSS andTDS. The results of these analyses are summarized inTables C-15 and C-16.

3

d

Table C-11. Disposition of Pines (dry weight basis)
Feed Soil Washed Soil
Flow Rate Flow Rate Recoveredlb/h lb/h %
Fines Slurry
FIow Rate Recoveredlb/h %
Total %Recovered
Condition 1 11 3.4 31 8.2 75 106
Condition 2 12 4.9 41 10 83 124c
Condition 3 11 5.9 54 12 110 164
Table C-12. Disposition of Coarse Gravel and Sand (dry weight basis)
Feed Soil
Flow Ratelb/h
Washed Soil
Flow Rate Recoveredlb/h %
Fines Slurry
Flow Rate Recoveredlb/h %
Total %Recovered
Condition 1 68 71 104 1 1 105
Condition 2 87 89 102 2 2 104
Condition 3 10.5 86 82 2 2 84
Table C-13. Range of PCP Concentrations in Fines Slurry Solids (ppm)
CPI Undertlow Floc/CIaritier
Condition 1 51 - 69 92-6,500
Condition 2 46-85 NO-1300
Condition 3 l 83-150
l Unacceptable analysis resulted in questionable data.
Table C-14. PAH Concentration in Pines slurry Solids (ppm)
Condition 1
Condition 2
Condition 3
l Unacceptable analysis resulted in questionable data.
CPI Underflow
1,300 - 1,800
370 - 1,100l
Fioc/CIaritier
58 - 2,000
910 - 1,800
94O-1,200
40
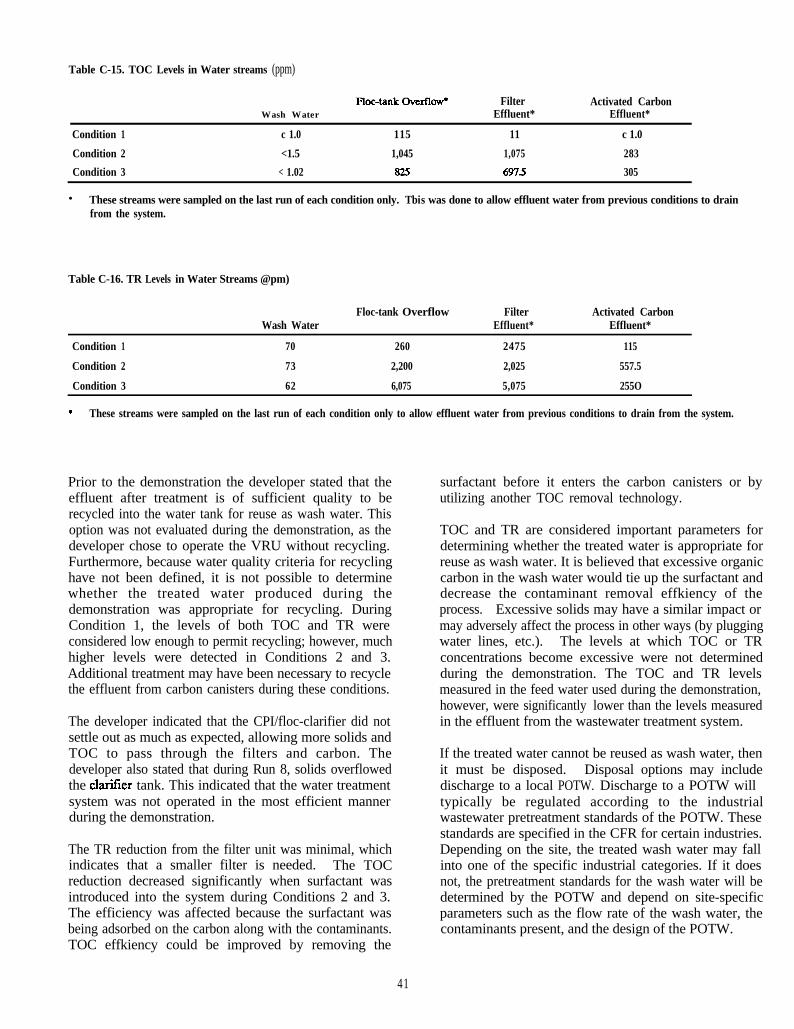
Table C-15. TOC Levels in Water streams (ppm)
Wash WaterF&-tank Overflod Filter
Effluent*Activated Carbon
Effluent*
Condition 1 c 1.0 115 11 c 1.0
Condition 2 <1.5 1,045 1,075 283
Condition 3 < 1.02 825 697.5 305
l These streams were sampled on the last run of each condition only. Tbis was done to allow effluent water from previous conditions to drainfrom the system.
Table C-16. TR Levels in Water Streams @pm)
Wash WaterFloc-tank Overflow Filter Activated Carbon
Effluent* Effluent*
Condition 1 70 260 2475 115
Condition 2 73 2,200 2,025 557.5
Condition 3 62 6,075 5,075 255O
. These streams were sampled on the last run of each condition only to allow effluent water from previous conditions to drain from the system.
Prior to the demonstration the developer stated that theeffluent after treatment is of sufficient quality to berecycled into the water tank for reuse as wash water. Thisoption was not evaluated during the demonstration, as thedeveloper chose to operate the VRU without recycling.Furthermore, because water quality criteria for recyclinghave not been defined, it is not possible to determinewhether the treated water produced during thedemonstration was appropriate for recycling. DuringCondition 1, the levels of both TOC and TR wereconsidered low enough to permit recycling; however, muchhigher levels were detected in Conditions 2 and 3.Additional treatment may have been necessary to recyclethe effluent from carbon canisters during these conditions.
The developer indicated that the CPI/floc-clarifier did notsettle out as much as expected, allowing more solids andTOC to pass through the filters and carbon. Thedeveloper also stated that during Run 8, solids overflowedthe chuitier tank. This indicated that the water treatmentsystem was not operated in the most efficient mannerduring the demonstration.
The TR reduction from the filter unit was minimal, whichindicates that a smaller filter is needed. The TOCreduction decreased significantly when surfactant wasintroduced into the system during Conditions 2 and 3.The efficiency was affected because the surfactant wasbeing adsorbed on the carbon along with the contaminants.TOC effkiency could be improved by removing the
41
surfactant before it enters the carbon canisters or byutilizing another TOC removal technology.
TOC and TR are considered important parameters fordetermining whether the treated water is appropriate forreuse as wash water. It is believed that excessive organiccarbon in the wash water would tie up the surfactant anddecrease the contaminant removal effkiency of theprocess. Excessive solids may have a similar impact ormay adversely affect the process in other ways (by pluggingwater lines, etc.). The levels at which TOC or TRconcentrations become excessive were not determinedduring the demonstration. The TOC and TR levelsmeasured in the feed water used during the demonstration,however, were significantly lower than the levels measuredin the effluent from the wastewater treatment system.
If the treated water cannot be reused as wash water, thenit must be disposed. Disposal options may includedischarge to a local POTW. Discharge to a POTW willtypically be regulated according to the industrialwastewater pretreatment standards of the POTW. Thesestandards are specified in the CFR for certain industries.Depending on the site, the treated wash water may fallinto one of the specific industrial categories. If it doesnot, the pretreatment standards for the wash water will bedetermined by the POTW and depend on site-specificparameters such as the flow rate of the wash water, thecontaminants present, and the design of the POTW.

C.8 References
1. Demonstration Plan for USEPA RREL’s MobileVolume Reduction Unit. Prepared by ScienceApplications International Corporation.

Appendix D
Case Studies
D.l Bench- and Pilot-Scale Treatment of Soilfrom a Wood Treating Facility
Bench-scale experimental studies were performed oncontaminated soil samples from wood treating facilities todetermine if soil washing was capable of removingcreosote and PCP from a soil matrix and collecting themin a water matrix.
The effectiveness of the study was based on soil cleanupcriteria set by EPA of 30 ppm PCP, 50 ppm carcinogeniccreosote compounds, and 100 ppm total creosotecompounds. Water-based biodegradable surfactants weretested for their ability to increase the solubiition of PCPand creosote compounds in water. Effects of elevatedtemperature and pH were also tested.
The bench-scale studies were performed on soil with initialcontamination levels of approximately 420 ppm PCP; 4,200ppm total creosote compounds, and 280 ppm carcinogeniccreosote compounds. During these studies, the soil wassubjected to three washes with Tergitol NP-100 surfactantat elevated pH and temperature. These studies achievedPCP, total creosote, and carcinogenic creosote removals ofgreater than 99, 92, and 95 percent, respectively. Dioxinand furan levels were also reduced more than 91 percent.
Due to the favorable results of the bench-scale studies, apilot-scale study was performed to test the applicability ofsoil washing further. Representative soil samples werewashed at various pHs, temperatures, and surfactantconcentrations a VRU soil washer. Twenty runs wereperformed over a 2-week period. Under the bestconditions, PCP concentrations were reduced from 120
ppm to less than 1 ppm (greater than 99.1 percentremoval), total creosote concentrations were reduced from2280 ppm to 2 ppm (greater than 99.9 percent removal),and carcinogenic creosote concentrations were reducedfrom 103 ppm to less than 1 ppm (greater than 99.0percent removal). Cleanup criteria for PCP andcarcinogenic creosote compounds were met during allpilot-scale runs; cleanup criteria for total creosotecompounds were met during all but 1 of the 20 pilot-scaleruns.
D.2 Pilot-Scale Treatment of Pesticide-Contaminated Soil
The VRU was used to perform a pilot-scale study toevaluate the abilty of soil washing to remediate soilsprimarily contaminated with organochlorine pesticides(e.g., dieldrin, heptachlor, chlordane, 4,4’-DDT), herbicide(2,4-D), and metals (chromium and arsenic). The Recordof Decision set cleanup levels of 0.155 ppm dieldrin and0.553 ppm heptachlor.
The pilot-scale study included 23 runs conducted undervaried conditions. Test variables included surfactant type,surfactant concentration, pH, temperature, liquid-to-soilratio, soil type, and number of washes. The concentrationsof heptachlor and dieldrin in the feed soil also variedwidely. The results of this pilot-scale study aresummarized in Tables D-l and D-2. Based on theseresults, it is not possible to determine conclusively whethersoil washing is capable of meeting the cleanup levels.Achieving cleanup levels may require a multistage washingprocess that is more efficient than the single-stage VRU.

Table D-l. Heptacblor Results
Heptachlor concentration in feed, ppm
Heptachlor concentration in coarse treated solids, ppm
Heptachlor concentration in fine treated solids, ppm
Removal of heptachlor from feed to coarse treated solids, %
Removal of heptachlor from feed to fine treated solids, %
Minimum Maximum Average
8 460 159
1.4 50 22
4.4 340 88
17 99 79
-107 97 34
Table D-Z. Dieldrin Results
Minimum Maximum Averagc
Dieldrin concentration in feed, ppm 2.7 27 16
Dieldrin concentration in coarse treated solids, ppm 1.5’ 6.8 3
Dieldrin concentration in fine treated solids, ppm OX? 37 11
Removal of dieldrin from feed to coarse treated solids, % 44 91 71
Removal of dieldrin from feed to fine treated solids, % -131 86 34
The coarse treated solids from two other runs had dieldrin concentrations below the detection limit of 1.6 ppm.The fine treated solids from one other run had a dieldrin concentration below the detection limit of 1.6 ppm.
44