Embed Size (px)
Citation preview

EORTC QLQ-C30 Reference Values
This manual presents reference data for the QLQ-C30 based upon data provided by EORTC Quality of Life Group Members and other users
of the QLQ-C30
July 2008
Neil W Scott, Peter M Fayers, Neil K Aaronson, Andrew Bottomley, Alexander de Graeff, Mogens Groenvold, Chad Gundy, Michael Koller, Morten A Petersen, Mirjam AG Sprangers on behalf of the EORTC Quality of Life Group
EORTC Quality
of Life Group
i
All rights reserved. No part of this manual covered by copyrights hereon may be reproduced or transmitted in any form or by any means without prior permission of the copyright holder.
The EORTC QLQ-C30 (in all versions), and the modules which supplement it, are copyrighted and may not be used without prior written consent of the EORTC Headquarters.
Requests for permission to use the EORTC QLQ-C30 or to reproduce or quote materials contained in this manual should be addressed to:
Quality of Life Department, EORTC Headquarters,
Avenue E Mounier 83 - B11, 1200 Brussels BELGIUM.
Tel: +32 2 779 1678. Fax: +32 2 779 4568.
This manual is based upon data contributed by members of the EORTC Groups, and by other users of the QLQ-C30.
It was prepared on behalf of the EORTC Quality of Life Group by:
Neil W Scott 1, Peter M Fayers 1,2, Neil K Aaronson 3, Andrew Bottomley 4, Alexander
de Graeff 5, Mogens Groenvold 6,7, Chad Gundy 3, Michael Koller 8, Morten A Petersen 6, Mirjam AG Sprangers 9
1 Department of Public Health, University of Aberdeen, UK 2 Department of Cancer Research and Molecular Medicine, Faculty of Medicine, Norwegian University of Science and Technology, Trondheim, Norway 3 Division of Psychosocial Research and Epidemiology, Netherlands Cancer Institute, Amsterdam, Netherlands 4 Quality of Life Department, European Organisation for Research and Treatment of Cancer Headquarters, Brussels, Belgium 5 Division of Medical Oncology, Department of Internal Medicine, University Medical Centre, Utrecht, Netherlands 6 Department of Palliative Medicine, Bispebjerg Hospital, Copenhagen, Denmark 7 Institute of Public Health, University of Copenhagen, Denmark 8 Centre for Clinical Studies, University Hospital Regensburg, Regensburg, Germany 9 Department of Medical Psychology, Academic Medical Centre, University of Amsterdam, Netherlands

ii
Members of the Quality of Life Cross-Cultural Meta-Analysis Group
Australia: M King, S Leutenegger, N Spry; Austria: E Greimel, B Holzner; Belgium: C Coens, K West; Brazil: G de Castro, C de Souza; Canada: A Bezjak, M Whitehead; Denmark: M Klee; France: A Brédart, T Conroy, C Rodary; Germany: M Berend, B Bestmann, O Krauß, T Küchler, B Malchow, R Schwarz, S Singer; Greece: K Mystakidou; Iran: A Montazeri; Italy: C Brunelli, M Tamburini; Japan: T Matsuoka, H Zhao; Netherlands: R de Leeuw, M Muller; Norway: K Bjordal, E Brenne, M Hjermstad, M Jordhøy, S Kaasa, P Klepstad, S Sundstrøm, F Wisløff; Singapore: YB Cheung, SB Tan, J Thumboo, HB Wong; South Korea: YH Yun; Spain: J Arraras; Sri Lanka: H Jayasekara, L Rajapakse; Sweden: M Ahlner-Elmqvist; Switzerland: P Ballabeni, J Bernhard; Taiwan: W-C Chie; Turkey: U Abacioglu; UK: J Blazeby, J Bruce, A Davies, L Friend, Z Krukowski, T Massett, J Nicklin, J Ramage, A Smyth-Cull, T Young; USA: D Cella, D-L Esseltine, C Gotay, I Pagano. Contributing Groups European Organisation for Research and Treatment of Cancer (EORTC) Brain Group, EORTC Breast Cancer Group, EORTC Chronotherapy Group, EORTC Gastro-Intestinal Group, EORTC Genito-Urinary Group, EORTC Gynaecological Group, EORTC Head and Neck Group, EORTC Leukaemia Group, EORTC Lung Group, EORTC Lymphoma Group, EORTC Melanoma Group, EORTC Quality of Life Group, EORTC Radiotherapy Group, EORTC Soft Tissue Group, National Cancer Institute Grant CA60068, National Cancer Institute of Canada (NCIC) Clinical Trials Group, Nordic Myeloma Study Group, Swiss Group for Clinical Cancer Research (SAKK)
iii
Contents
Page Introduction and background 1 Why reference data are important 2 Description of the tables 4 Sample size 6 References 11 EORTC QLQ-C30 Tables of Reference Values 14 All cancer patients: all stages 15 All cancer patients: males 19 All cancer patients: females 22 All cancer patients: <50 25 All cancer patients: 50-59 28 All cancer patients: 60-69 31 All cancer patients: >70 34 All cancer patients: stage I-II 37 All cancer patients: stage III-IV 40 All cancer patients: recurrent/metastatic 43 Brain cancer: all stages 46 Breast cancer: all stages 49 Breast cancer: <50 52 Breast cancer: 50-59 55 Breast cancer: 60-69 58 Breast cancer: >70 61 Breast cancer: stage I-II 64 Breast cancer: stage III-IV 67 Breast cancer: recurrent/metastatic 70 Colorectal cancer: all stages 73 Colorectal cancer: males 76 Colorectal cancer: females 79 Colorectal cancer: <50 82 Colorectal cancer: 50-59 85 Colorectal cancer: 60-69 88 Colorectal cancer: >70 91 Colorectal cancer: stage I-II 94 Colorectal cancer: stage III-IV 97 Colorectal cancer: recurrent/metastatic 100 Genito-urinary cancer: all stages 103 Gynaecological cancer (cervical): all stages 106 Gynaecological cancer (ovarian): all stages 109
iv
Gynaecological cancer (ovarian): stage I-II 112 Gynaecological cancer (ovarian): stage III-IV 115 Head and neck cancer: all stages 118 Head and neck cancer: males 121 Head and neck cancer: females 124 Head and neck cancer: <50 127 Head and neck cancer: 50-59 130 Head and neck cancer: 60-69 133 Head and neck cancer: >70 136 Head and neck cancer: stage I-II 139 Head and neck cancer: stage III-IV 142 Head and neck cancer: hypopharynx/larynx 145 Head and neck cancer: oral cavity/oropharynx 148 Acute myelogenous leukaemia: all stages 151 Liver/bile/pancreas cancer: all stages 154 Lung cancer: all stages 157 Lung cancer: males 160 Lung cancer: females 163 Lung cancer: <50 166 Lung cancer: 50-59 169 Lung cancer: 60-69 172 Lung cancer: >70 175 Lung cancer: stage I-II 178 Lung cancer: stage III-IV 181 Lung cancer: recurrent/metastatic 184 Small cell lung cancer: all stages 187 Small cell lung cancer: limited disease 190 Small cell lung cancer: extensive disease 193 Non-small cell lung cancer: all stages 196 Mesothelioma 199 Malignant lymphoma 202 Non-Hodgkin lymphoma 205 Malignant melanoma: all stages 208 Malignant melanoma: males 211 Malignant melanoma: females 214 Malignant melanoma: <50 217 Malignant melanoma: 50-59 220 Malignant melanoma: 60-69 223
226 Malignant melanoma: stage I-II Malignant melanoma: stage III-IV 229 Malignant melanoma: recurrent/metastatic 231Myeloma: all stages 232Myeloma: stage I-II 238 Myeloma: stage III-IV 241Oesophageal cancer: all stages 244 Oesophageal cancer: males 247 Oesophageal cancer: females 250Oesophageal cancer: <50 253

v
Oesophageal cancer: 50-59 256Oesophageal cancer: 60-69 259 Oesophageal cancer: >70Gastric cancer: all stages
262265
Prostate cancer: all stages 268 Prostate cancer: 50-59 271 Prostate cancer: 60-69 274 Prostate cancer: >70 277 Prostate cancer: stage I-II 280 Prostate cancer: stage III-IV 283 Prostate cancer: recurrent/metastatic 286 Testicular cancer 289 General population
292
QLQ-C30 Module Data
Breast module: all stages 295 Breast module: <50 299 Breast module: 50-59 301 Breast module: 60-69 304 Breast module: recurrent/metastatic 307 Head and neck module: all stages 310 Head and neck module: males 313 Head and neck module: females 316 Head and neck module: <50 319 Head and neck module: 50-59 322 Head and neck module: 60-69 325 Head and neck module: >70 328 Head and neck module: stage I-II 331 Head and neck module: stage III-IV 334 Head and neck module: hypopharynx/larynx 337 Head and neck module oral cavity/oropharynx 340 Lung module: all stages 343 Lung module: males 346 Lung module: females 349 Lung module: <50 352 Lung module: 50-59 355 Lung module: 60-69 358 Lung module: >70 361 Lung module: stage I-II 364 Lung module: stage III-IV 367 Lung module: recurrent/metastatic 370 Lung module: small cell lung cancer 373 Lung module: non-small cell lung cancer 376 Oesophageal module: all stages 379 Oesophageal module: males 382 Oesophageal module: females 385 Oesophageal module: 50-59 388 Oesophageal module: 60-69 391 Oesophageal module: >70 394

vi
Ovarian module: all stages 397 Ovarian module: stage I-II 400 Ovarian module: stage III-IV 403 EORTC QLQ-C30 Graphs 406 EORTC QLQ-C30 Correlation matrices 415 General population 416 Stage I-II 417 Stage III-IV 418 Recurrent/metastatic 419

vii
Acknowledgements
We wish to thank all those who contributed data to this reference manual. Without their collaboration, this manual would not have been possible. We also wish to thank the
thousands of patients who were willing to complete the EORTC QLQ-C30 in the varied studies embodied in this manual.
1
EORTC QLQ-C30
REFERENCE VALUES
Introduction The European Organization for Research and Treatment of Cancer quality of life questionnaire (EORTC QLQ-C30) is an integrated system for assessing the quality of life (QoL) of cancer patients participating in clinical trials and other types of research in which patient-reported outcomes are collected. The EORTC QLQ-C30 is designed for use with a wide range of cancer patient populations, and is intended to be supplemented by tumour-specific questionnaire modules or supplements such as those for lung cancer (QLQ-LC13) (Bergman et al., 1994), breast cancer (QLQ-BR23) (Sprangers et al., 1996), head and neck cancer (QLQ-H&N35) (Bjordal et al., 2000), oesophageal cancer (QLQ-OES18) (Blazeby et al., 1996) and ovarian cancer (QLQ-OV28) (Greimel et al., 2003).
Reference data may be useful for various reasons:
(1) comparisons of a group of patients with similar characteristics, perhaps to explain differences in clinical outcomes, such as death and progression
(2) to increase familiarity with the distribution of scores for each scale
(3) sample size calculation
(4) comparison of an individual patient‟s score with patients with similar characteristics
(5) quality control in translation procedures
This manual presents reference data for the EORTC QLQ-C30 when assessed in various cancer populations.
Background to the EORTC QLQ-C30 In 1986, the EORTC initiated a research program to develop an integrated, modular approach for evaluating the QoL of patients participating in international cancer clinical trials. This research resulted in the development of a core questionnaire which is referred to as the EORTC QLQ-C30 (Aaronson et al., 1993). The EORTC QLQ-C30 incorporates nine multi-item scales: five functional scales (Physical, Role, Cognitive, Emotional and Social Functioning); three symptom scales (Fatigue, Pain and Nausea/Vomiting); and a Global Health Status/QoL scale. Six single item scales are also included (Dyspnoea, Insomnia, Appetite Loss, Constipation, Diarrhoea and Financial Difficulties). The psychometric properties of the questionnaire were tested and in conclusion it was found to possess the required standards such as validity (measuring what it is intended to measure), reliability

2
(measuring with sufficient precision) and sensitivity (ability to detect changes) (Aaronson et al., 1993; Osoba et al., 1994; Kaasa et al., 1995). The questionnaire was initially tested in a population of lung cancer patients (Aaronson et al., 1993) and subsequently in a variety of cancer patient groups. A bibliography is contained in the EORTC QLQ-C30 Scoring Manual (Fayers et al., 2001).
There is a continuing programme of development for the EORTC QLQ-C30. There have been four versions of the questionnaire: the QLQ-C30 version 1.0, the interim version QLQ-C30 (+3), which introduced new questions for the Role Functioning and Global Health Status/QoL scales, the QLQ-C30 version 2.0, which was released after validation of the new questions, and the current version 3.0 of the QLQ-C30. Version 3.0 differs from version 2.0 only in that it has four-point scales for the first five items comprising the Physical Functioning scale. Data from all four versions are used in this manual, but only the current versions of the Global Health Status/QoL, Physical Functioning and Role Functioning scales are reported: this means that available sample sizes for these three scales will generally be lower. In previous publications the abbreviations QL2, RF2 and PF2 are often used to distinguish the revised versions of these scales from the original versions, but in this manual QL, RF and PF will instead be used to denote the current versions. The remaining 12 scales have remained unchanged throughout the history of the questionnaire.
Why reference data are important Comparisons of scores from groups of patients Reference data provide information about the distribution of QoL scores for given cancer populations with certain predefined characteristics, in particular stage and cancer site. They provide one potential reference point against which future populations may be compared. Also, if one has observed unexpected results with respect to clinical endpoints it may be useful to compare the baseline QoL scores of patients against those of a reference population to gain some insight with regard to some plausible explanations. For example, pre-randomisation scores in a randomised clinical trial might be compared against the reference values in an attempt to explain an unexpected response rate or median survival.
It has been shown that QoL at baseline may be of use as a prognostic factor for clinical outcomes. For example, it predicts survival (Coates et al., 1993; Gralla et al., 1995; Gotay et al., 2008; Tannock et al., 1996), response to treatment (Gralla et al., 1995) and nausea and vomiting (Osoba, Pater and Zee, 1994). In future cancer trials, it may be useful to include baseline QoL to further investigate its predictive value for the various endpoints under study, or as a stratifying factor for the treatment allocation process.
Familiarity with distribution of scores It is important in the design stage of clinical trials that the investigators involved in protocol development should have an idea of the distribution of QoL scores at baseline and the possible magnitude of changes over time in the particular group of patients under study. This enables development of realistic hypotheses. Information about the expected scores is also valuable when analysing and reporting the results of the trial. Knowledge about the distribution of the QLQ-C30 scores will develop as we become more familiar with it, and as more reference data become available. Possibly, a qualitative descriptive system could be developed for each of the scales (such as “good”, “moderate” and “poor”), to describe patients‟ position relative to „normal‟ values. This

3
will allow a clearer understanding of the results for non-QoL researchers while simplifying analyses and ensuring standardisation for other forms of analyses such as prognostic factor analyses.
Sample size calculation In a phase III clinical trial an adequate sample size is necessary to provide sufficient power to test the significance of treatment effects. Historically, in cancer clinical trials the main endpoint of the trial has been a biological outcome such as survival, disease free survival or response to therapy. Subsequently the sample size calculation was based on either a time to event analysis or a comparison of two proportions. However, in recent years several clinical trials have been initiated with a QoL outcome as the main endpoint. Even when QoL is a secondary endpoint it may be important to make power estimates to ensure that there is a reasonable likelihood of detecting realistic differences between the groups. A number of methods are available for sample size calculation in QoL studies, based on various assumptions about the distribution of the QoL measure: (1) Normal distribution, (2) binomial and (3) ordered categorical (Campbell, Julious and Altman, 1995; Julious and Campbell, 1996). Sample size calculations using these three alternative methods with a two sided significance level (=0.05) and a power of 80% ( = 0.20) are given below.
Comparison of an individual patient’s score Reference data provide clinicians with a guide to the average scores for the single items, which can facilitate communication with the patient about likely side effects of disease or treatment. The tables enable clinicians to know whether an individual patient‟s responses are very much higher or lower
than is usually expected. Reference data may also be used to obtain an indication of the most likely range of scale scores for patients. However, the interpretation of scores from individual patients requires additional research, and we do not at this stage recommend that the reference values be used for screening patients. It should be noted that individual-patient scale scores have large standard deviations and thus the confidence intervals are wide. This makes the scale scores unreliable for decision making.
Translation procedures The EORTC Quality of Life Study Group has developed procedures for translation of the EORTC QLQ-C30 and its cancer site specific modules (Cull et al., 2002; Koller et al., 2007). These procedures require repeated forward and backward translations of the questionnaire until a satisfactory translation is obtained, followed by field testing in a sample of patients. It may be useful to perform this field test on a sample population where reference data are available. Comparing the scores of the newly translated questionnaire with that of the original language could be used in the checking of the translation as it could highlight any obvious discrepancies.

4
Description of the tables Patients and methods All the data used in this report were originally supplied as part of a wider project (the EORTC Quality of Life Group‟s Cross-Cultural Analysis Project (Scott et al., 2006; Scott et al., 2007)). About a third of the respondents come from EORTC studies and these data were supplied with the permission of the relevant EORTC group. The other data were received from individuals and organisations from around the world. The main source of data was from cancer clinical trials and epidemiological studies, although some large studies of the general population were also received (Klee, Groenvold and Machin, 1997; Hjermstad et al., 1998; Schwarz and Hinz, 2001; Holzner et al., 2004). This manual is based on baseline (pre-treatment) QoL data only; data from patients currently receiving treatment or who are off treatment were excluded, although some data were included even when the treatment status of the patient was not known.
This manual first provides data for all cancer patients and then for specific disease sites. Finally, the data are presented for the general population sample. For each cancer site the data are first presented for all patients, if there are at least 100 patients available for that site. Provided there is sufficient sample size (≥100 patients), the same data are then presented for the following subgroups: males, females, those aged <50, 50-59, 60-69 and ≥70, and for those in three stage categories. Since stage was classified in different ways in different data sets, and TNM staging was often not available, patients have been divided into three broad stage categories (I-II, III-IV and recurrent/metastatic). Unfortunately data were not always available for performance status, and previous treatment was often difficult to assess.
Each section comprises three separate pages of tables:
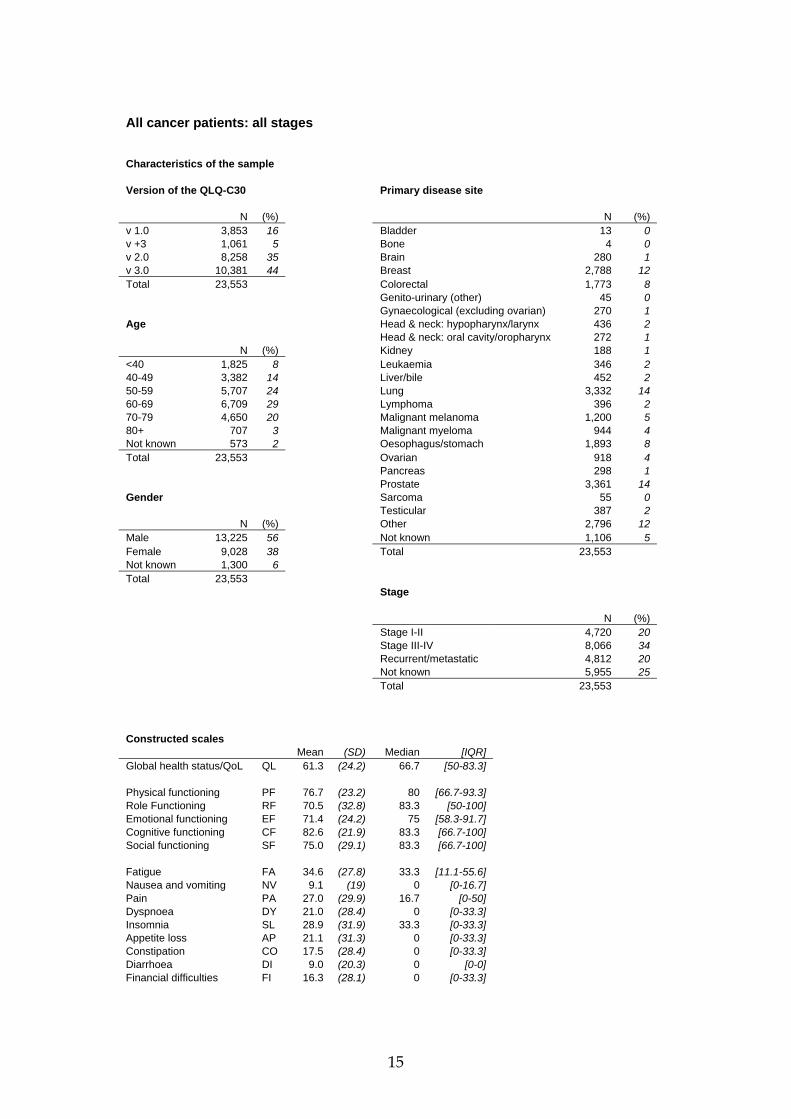
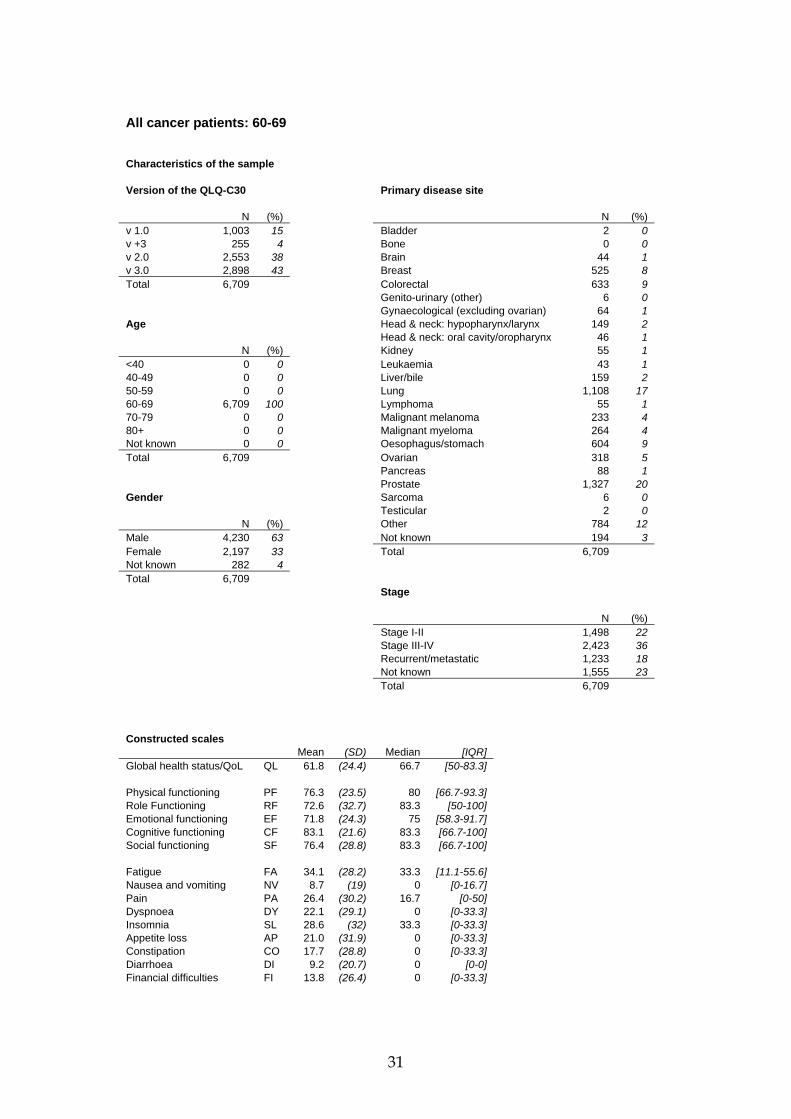
1) A description of the characteristics of the sample (e.g. the questionnaire version used, age band, gender, site and stage), followed by summary data (mean, standard deviation, median and inter-quartile range) for each of the 15 scale scores of the EORTC QLQ-C30 (version 3.0).
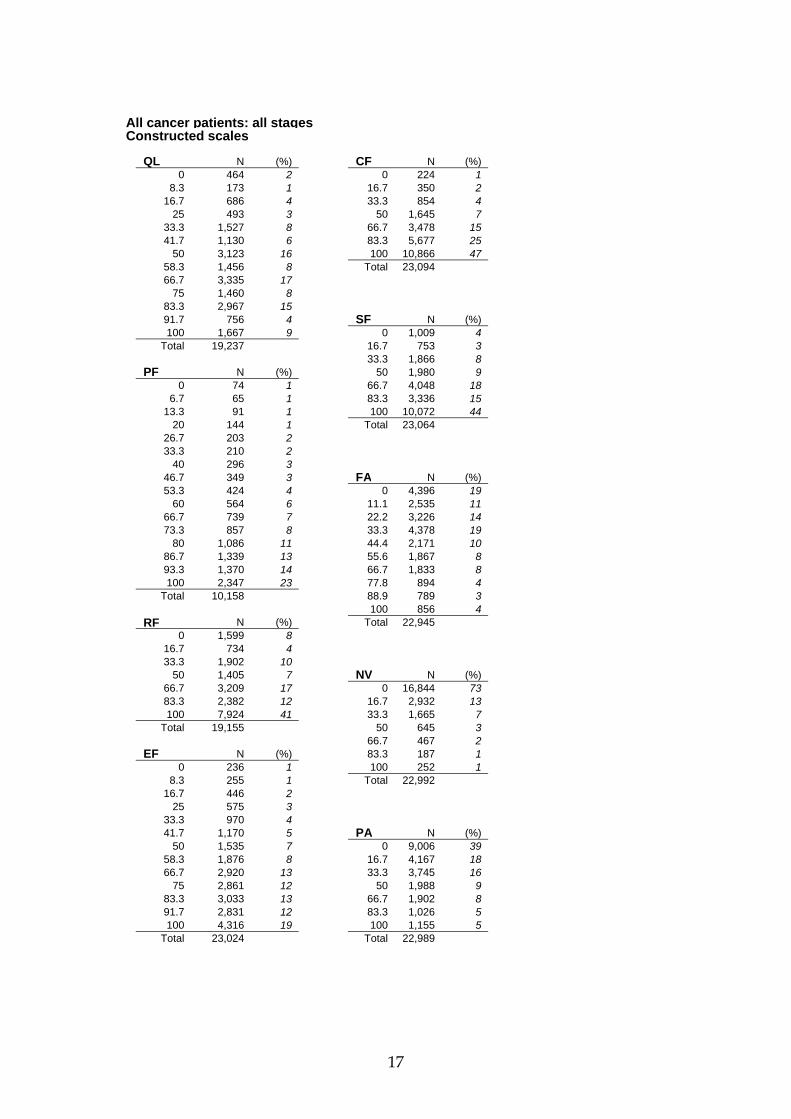
2) Frequency tables for each of the nine multi-item scale scores of the EORTC QLQ-C30.
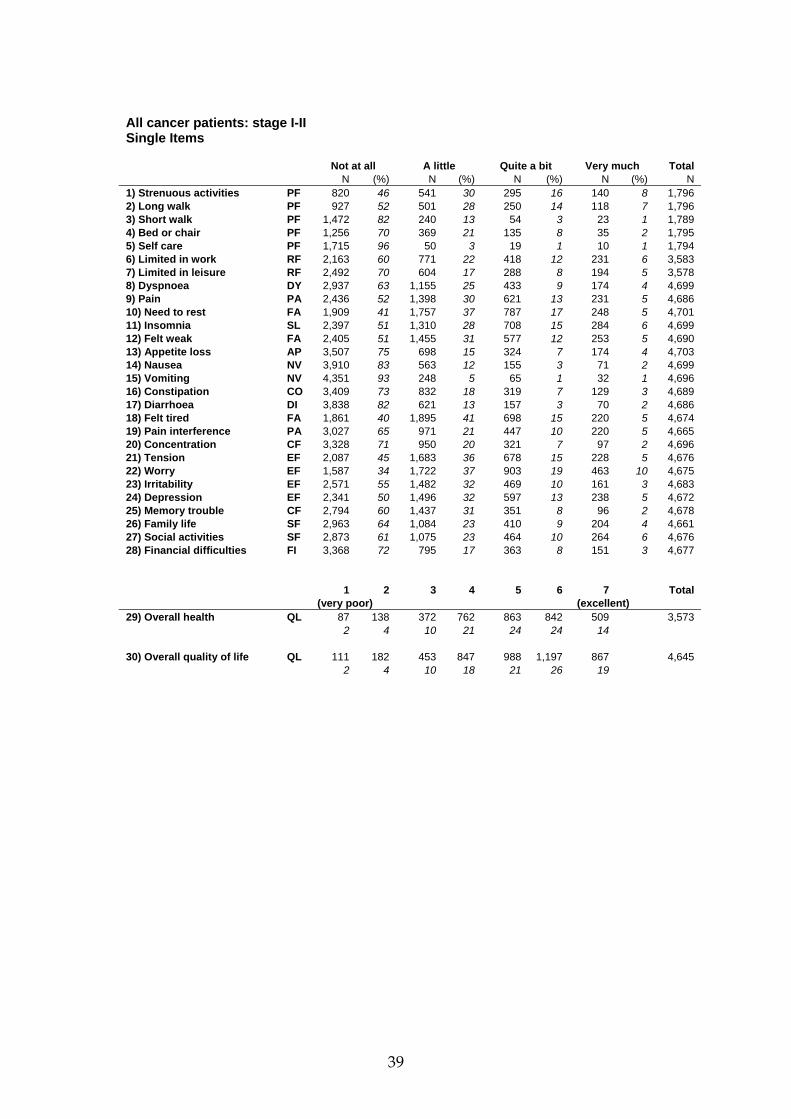
3) Frequency tables for each of the 30 items of the EORTC QLQ-C30.
Similar tables of data are then provided for five of the EORTC QLQ-C30 modules: the breast, head and neck, lung, oesophageal and ovarian modules.
Scoring procedures Scale scores were calculated by averaging items within scales and transforming average scores linearly. All of the scales range in score from 0 to 100. A high score for a functional scale represents a high/healthy level of functioning whereas a high score for a symptom scale or item represents a high level of symptomatology or problems. For more details on the scoring procedures see the EORTC QLQ-C30 Scoring Manual (Fayers et al., 2001).
Graphs Graphs of the mean scale score by age are then provided for all 15 subscales of the EORTC QLQ-C30. Separate graphs are presented for four stage categories (general population, Stage I-II, Stage

5
III-IV and recurrent/metastatic) with separate lines representing males and females. The graphs have been produced using Lowess (locally weighted least squares) smoothing techniques in order to more clearly show the underlying pattern of the data (Cleveland, 1979, Cleveland and Devlin, 1988). Note that sample sizes for the youngest and oldest age groups tend to be lower (see tables) and that the distribution of sites across the four stage categories differs, for example, the recurrent/metastatic group contains a relatively higher proportion of breast, colorectal and oesophageal/stomach cancers compared with other groups.
Correlation matrices Matrices of correlation coefficients are also provided for these four subgroups: the general population sample, Stage I-II, Stage III-IV and recurrent/metastatic. The age and gender distributions of these four groups are described in the tables. Due to the coding of the scales, positive correlation coefficients are expected between two functional scales or between two symptom scales; negative correlations are expected between a functional and a symptom scale.
Problems with interpretation of reference data Most of the data presented here come from clinical trials or epidemiological studies. Clinical trials may have some recruitment bias as parameters such as patient choice, clinician choice, choice of institution (for example, large, experienced) and eligibility criteria may contribute to the non-random selection of patients into a clinical trial. Other factors which may influence the results are non-compliance due to data collection procedures and patient non-compliance. It has frequently been noted that patients in randomised clinical trials may have different outcomes from other patients (Stiller, 1994; Stiller and Draper, 1989), and that specialist centres may also obtain different results from other centres (Stiller, 1995; Harding et al., 1993). Thus the results presented here are not necessarily representative of other groups of cancer patients with similar diagnoses. It is important to bear in mind the source of these data when interpreting them.
The QLQ-C30 was designed as a self assessment questionnaire. Thus the results presented here are applicable only for patients who completed the questionnaire independently. Other modes of administration, such as interview, telephone or computer-assisted, may provide different results. Timing of the questionnaire is also important, and a patient‟s responses may be affected according to
whether the assessment is made before or after the treatment has been allocated (that is, before or after randomisation), and before or after subsequent clinical consultations (Hurny et al., 1994; Fayers and Machin, 2007).

6
Sample size One of the important uses of reference data is the estimation of sample size requirements when planning a clinical trial. The following notes illustrate how this might be carried out using the reference data in this manual.
More detailed discussions of issues in sample size estimation are given in the book Sample Size
Tables for Clinical Studies, by Machin, Campbell, Fayers & Pinol (Machin et al., 1997) which also provides extensive tables and software for performing the calculations.
One problem when estimating sample size for QoL scales is that there are often many outcome measures of interest. This presents problems of analysis, too, since multiple testing will distort the nominal p-values. In practice, most investigators define one or two outcome measures as being of primary interest, and then design their study so that they have reasonable power for detecting relevant changes in each of these chosen outcome measures.
In many respects sample size estimation should reflect the intended analysis at the end of the study. If it is planned to carry out t-tests, then sample size is based upon the properties of the t-statistic. If it is planned to use a rank-sum test (Wilcoxon or Mann-Whitney), then sample size estimation is based upon that; and if a global test statistic is to be used, to avoid the problems of multiple testing, the estimates should reflect that.
The calculations that follow assume that all data are available at the time of analysis. However, many studies involving QoL assessment have experienced compliance problems resulting in missing data. Also, for some cancer studies, there may also be a number of early deaths. Therefore the estimates of sample size requirements should be increased to allow for missing or incomplete forms, and for deaths or other forms of drop-out.
The examples of sample size calculations that are given below assume a two sided significance level of =0.05 and a power of 80% ( = 0.20). For many studies a higher power (say, 90%) may be desired. It is also necessary to specify the target difference that we hope to be able to detect. Thus, based upon experience with the QLQ-C30, we have arbitrarily selected a change of 8 units in Global Health Status/QoL as being reasonable for the first example below. Other differences will be applicable in other studies, and the reference data will help suggest the magnitude of plausible differences corresponding to various patient groups. Effect sizes and clinically significant differences for the QLQ-C30 have been discussed in papers by King and Osoba (King, 1996; Osoba et al.; 1998; Osoba and King, 2005).
Normal distribution
Suppose we have selected Global Health Status/QoL score at two months as our main endpoint in a lung cancer trial. This is one of the relatively few scales of the QLQ-C30 which is often approximately Normally distributed, and so analysis of the trial results may use the t-test. Therefore it is appropriate to estimate sample size requirements using the Normal approximation.
Consider a two group comparison comparing the mean of the new treatment group, t, against the mean value of the controls, c, with between subject standard deviation of s. We wish to test for a difference between the two means, which may be conveniently expressed in terms of an effect size which is defined as:

7
t c
s
We represent the Normal deviate by Z, so that for a two-tailed test at the 5% level we have: 005 1961 2. .and Z and for 80% power 1 080 0841 . , .Z .
Then the total sample size for a two-group comparison is given by:
N
Z Z Z
4
2
1 2 1
2
2
1 2
2
/ /
Example
Suppose we assume that in the control group the mean score will be unchanged from baseline (c = 57 for the Global Health Status/QoL from the lung cancer reference data) and we want to see an improvement of 8 points in the mean score in the treatment group (t = 65). From the tables the standard deviation (s) of this scale is 24.3. The effect size is given by:
329.0
3.24
5765
s
ct
To detect a significant result at the 5% level, with 80% power, we would need:
293
2
96.1
329.0
84.096.142
2
2
N patients in total (147 in each treatment arm).
Binary data
One simple method of analysing categorical data is to define a cut-point or threshold for each scale of interest. For example, one might decide to design a study to test whether there is a change in levels of the Pain Scale, where we are interested in a cut-point of 50. From the tables showing the percentages in each Pain category it can be calculated that 30% of patients are expected to score 50 or more. The data can then be tested for evidence of a difference between the two groups, using a chi-squared test.
Assuming that the data have a binomial distribution, the effect size is given as || ct where t and c represent the proportion of patients below a certain score in both groups. The total number of cases required for the two-group comparison is given by:
N
Z Z B t t c c
2 1 11 2 1
2
2
/ (1)

8
Example
Using the Physical Functioning score and taking a cut-point of 50, c is 30%. Assuming an improvement to only 20 % having a score ≥ 50 in the treatment group 1.03.02.0 .
Thus
5801.0
7.03.08.02.084.096.122
2
N
Therefore 580 patients would be required (290 patients per treatment arm).
Published tables (Machin et al., 1998) provide more accurate methods of estimating the sample size.
Binary data - using odds ratio
The difference between two proportions can also be expressed as an odds ratio, and this leads to another method of analysing binary data. The odds ratio is defined as:
ORc t
t c
1
1
This leads to an alternative equation for the sample size, which does however give very similar results to equation (1). Writing t c 2 , we have for the sample size:
NZ Z ORB e
2
1
1 2 1
2 2
/ / (log ) (2)
Example
Using the same example as for the binary method, the odds ratio is given by:
714.17.02.0
8.03.0
1
1
ct
tcOR
57625.0125.0
)714.1(log84.096.14
25.02/2.03.0
22
eN
… which is very similar to the previous solution.
Ordered categorical data
The binary comparison, by selecting a single cut-point, ignores the detailed information in the data. An alternative approach is to use statistical tests which make full use of the ordered categorical data, such as the Wilcoxon or Mann-Whitney rank sum tests. The sample size requirements can be estimated by using a method based upon odds ratios, extending the method described in the previous section for binary data. We illustrate the approach below, but more comprehensive details are given in Campbell, Julious and Altman (1995) and Julious and Campbell (1996).
9
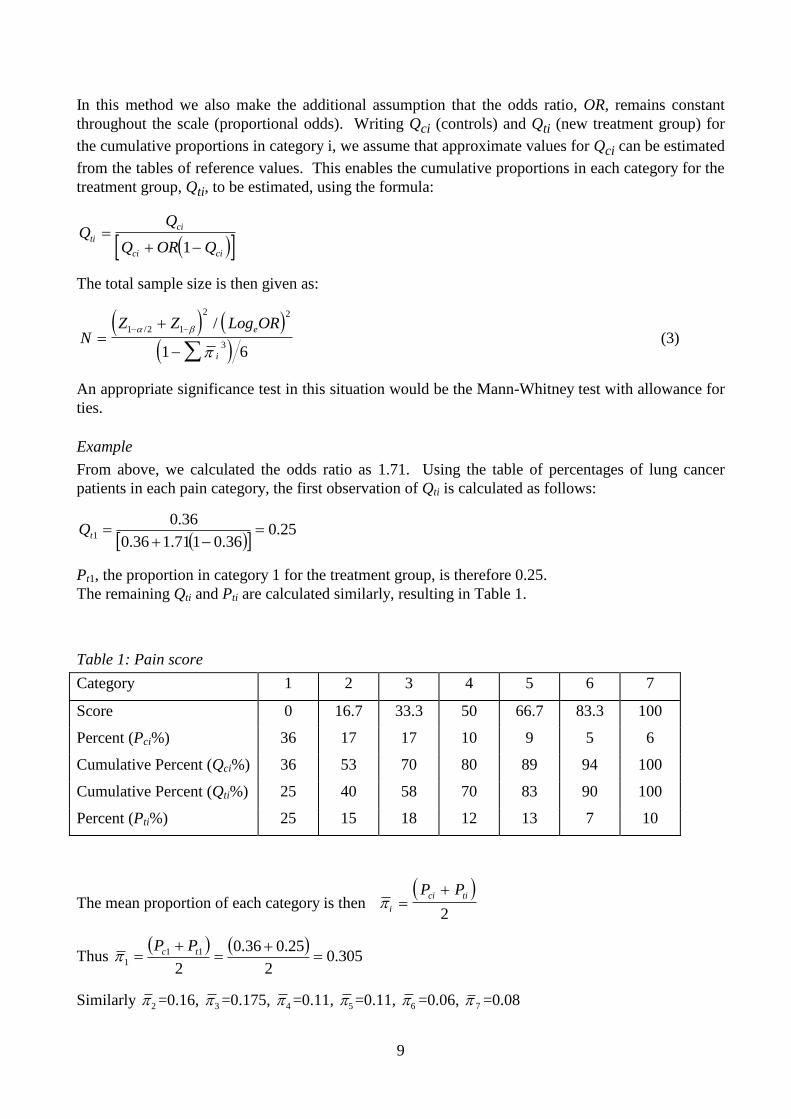
In this method we also make the additional assumption that the odds ratio, OR, remains constant throughout the scale (proportional odds). Writing Qci (controls) and Qti (new treatment group) for the cumulative proportions in category i, we assume that approximate values for Qci can be estimated from the tables of reference values. This enables the cumulative proportions in each category for the treatment group, Qti, to be estimated, using the formula:
Q
Q
Q OR Qti
ci
ci ci
1
The total sample size is then given as:
N
Z Z Log ORe
i
1 2 1
2 2
31 6
/ / (3)
An appropriate significance test in this situation would be the Mann-Whitney test with allowance for ties.
Example
From above, we calculated the odds ratio as 1.71. Using the table of percentages of lung cancer patients in each pain category, the first observation of Qti is calculated as follows:
25.0
36.0171.136.0
36.01
tQ
Pt1, the proportion in category 1 for the treatment group, is therefore 0.25. The remaining Qti and Pti are calculated similarly, resulting in Table 1.
Table 1: Pain score
Category 1 2 3 4 5 6 7
Score 0 16.7 33.3 50 66.7 83.3 100
Percent (Pci%) 36 17 17 10 9 5 6
Cumulative Percent (Qci%) 36 53 70 80 89 94 100
Cumulative Percent (Qti%) 25 40 58 70 83 90 100
Percent (Pti%) 25 15 18 12 13 7 10
The mean proportion of each category is then
i
ci tiP P
2
Thus
305.02
25.036.0
2
11
1
tc PP
Similarly 2 =0.16, 3 =0.175, 4 =0.11, 5 =0.11, 6 =0.06, 7 =0.08

10
Therefore 0.959=0.04111 3 i
From equation (3), the sample size is:
1696959.0
54.0/84.096.122
N
Note that this is substantially smaller than the estimate obtained for sample size when comparing percentages with a cut-point of 50 for the Pain subscale. A rank-sum test uses all seven levels of Pain, and is more powerful than testing for a difference in two proportions.
11
References Aaronson NK, Ahmedzai S, Bergman B, et al. The European Organization for Research and Treatment of Cancer QLQ-C30: A quality-of-life instrument for use in international clinical trials in oncology. J Natl Cancer Inst 1993; 85: 365-76.
Bergman B, Aaronson NK, Ahmedzai S, Kaasa S, Sullivan M. The EORTC QLQ-LC13: a modular supplement to the EORTC Core Quality of Life Questionnaire (QLQ-C30) for use in lung cancer clinical trials. EORTC Study Group on Quality of Life. Eur J Cancer, 1994; 30A: 635-642.
Bjordal K, De Graeff A, Fayers PM, et al. A 12 country field study of the EORTC QLQ-C30 (version 3.0) and the head and neck cancer specific module (EORTC QLQ-H&N35) in head and neck patients. Eur J Cancer, 2000; 36: 1796-1807.
Blazeby JM, Alderson D, Winstone K, et al. Development of an EORTC questionnaire module to be used in quality of life assessment for patients with oesophageal cancer. The EORTC Quality of Life Study Group. Eur J Cancer, 1996; 32A: 1912-1917.
Campbell MJ, Julious SA, Altman DG. Estimating sample sizes for binary, ordered categorical, and continuous outcomes in two group comparisons. Br Med J 1995; 311: 1145-7.
Coates A, Thomson D, McLeod GR, et al. Prognostic value of quality of life scores in a trial of chemotherapy with or without interferon in patients with metastatic malignant melanoma. Eur J Cancer 1993; 29A: 1731-4.
Cleveland WS. Robust locally weighted regression and smoothing scatterplots, Journal of the American Statistical Association, 1979; 74: 829-836.
Cleveland WS, Devlin SJ. Locally weighted regression: an approach to regression analysis by local fitting. Journal of the American Statistical Association. 1988; 83: 596-610.
Cull A, Sprangers M, Bjordal K, Aaronson N, West K, Bottomley A. EORTC Quality of Life Study Group Translation Procedure. Brussels: EORTC, 2002.
Fayers PM, Aaronson NK, Bjordal K, Groenvold M, Curran D, Bottomley A on behalf of the EORTC Quality of Life Group. EORTC QLQ-C30 Scoring Manual (3
rd edition). Brussels: EORTC, 2001.
Fayers PM, Machin D. Quality of life. The assessment, analysis and interpretation of patient-reported outcomes (2
nd ed). Chichester: John Wiley & Sons, 2007.
Gotay C, Kawamoto CT, Bottomley A, Efficace F. The prognostic significance of patient-reported outcomes in cancer clinical trials. J Clin Oncol, 2007. DOI:10.1200/JCO.2007.13.3439.
Gralla RJ, Hollen PJ, Eberley S, Cox C. Quality of life score predicts both response and survival in patients receiving chemotherapy for non-small cancer. Support Care Cancer 1995; 3: 378-9.

12
Greimel E, Bottomley A, Cull A, et al. An international field study of the reliability and validity of a disease-specific questionnaire module (the QLQ-OV28) in assessing the quality of life of patients with ovarian cancer. Eur J Cancer, 2003; 39: 1402-1408.
Harding MJ, Paul J, Gillis CR, Kaye SB. Management of malignant teratoma: does referral to a specialist unit matter? Lancet 1993; 341: 999-1002.
Hjermstad MJ, Fayers PM, Bjordal K, Kaasa S. Health-related quality of life in the general Norwegian population assessed by the European Organization for Research and Treatment of Cancer Core Quality-of-Life Questionnaire: the QLQ=C30 (+ 3). J Clin Oncol, 1998; 16, 1188-1196.
Holzner B, Kemmler G, Cella D, et al. Normative data for functional assessment of cancer therapy. Acta Oncologica, 2004; 43: 2,153-160.
Hurny C, Bernhard J, Coates A, et al. Timing of baseline quality of life assessment in an international adjuvant breast cancer trial: its effect on patient self-estimation. The International Breast Cancer Study Group. Ann Oncol 1994; 5: 65-74.
Julious SA, Campbell MJ. Sample sizes calculations for ordered categorical-data. Stat Med 1996; 15: 1065-6.
Kaasa S, Bjordal K, Aaronson N, et al. The EORTC core quality of life questionnaire (QLQ-C30): validity and reliability when analysed with patients treated with palliative radiotherapy. Eur J Cancer 1995; 31A: 2260-3.
King MT. The interpretation of scores from the EORTC quality of life questionnaire QLQ-C30. Qual Life Res 1996; 5: 555-67.
Klee M, Groenvold M, Machin D. Quality of life of Danish women: population-based norms of the EORTC QLQ-C30. Qual Life Res, 1997; 6: 27-34.
Koller M, Aaronson NK, Blazeby J, et al. Translation procedures for standardised quality of life questionnaires: The European Organisation for Research and Treatment of Cancer (EORTC) approach. Eur J Cancer, 2007; 43: 1810-1820.
Machin D, Campbell MJ, Fayers PM, Pinol A. Sample Size Tables for Clinical Studies. (2nd ed.) Oxford: Blackwell Science, 1997.
Osoba D, King M. Meaningful differences. In: Fayers PM, Hays R (eds). Assessing quality of life in clinical trials: methods and practice. Oxford University Press: Oxford, 2005.
Osoba D, Pater JL, Zee B. Effective anti-emetic therapy improves quality of life (QoL) after moderately emetogenic chemotherapy (MEC). Qual Life Res 1994; 4: 467-8.
Osoba D, Rodrigues G, Myles J, Zee B, Pater J. Interpreting the significance of changes in health-related quality of life scores. J Clin Oncol 1998; 16: 139-144.
Osoba D, Zee B, Pater J, Warr D, Kaizer L, Latreille J. Psychometric properties and responsiveness of the EORTC Quality of Life Questionnaire (QLQ-C30) in patients with breast, ovarian and lung cancer. Qual Life Res 1994; 3: 353-64.

13
Schwarz R, Hinz A. Reference data for the quality of life questionnaire EORTC QLQ-C30 in the general German population. Eur J Cancer. 2001; 37: 1345-1351.
Scott NW, Fayers PM, Aaronson NK, et al. The use of differential item functioning analyses to identify cultural differences in responses to the EORTC QLQ-C30. Qual Life Res, 2007; 16, 115-129.
Scott NW, Fayers PM, Bottomley A, et al. Comparing translations of the EORTC QLQ-C30 using differential item functioning analysis. Qual Life Res, 2006; 15: 1103-1115.
Sprangers MA, Groenvold M, Arraras JI, et al. The European Organization for Research and Treatment of Cancer breast cancer-specific quality-of-life questionnaire module: first results from a three-country field study. J Clin Oncol, 1996; 14: 2756-2768.
Stiller CA. Centralised treatment, entry to trials and survival. Br J Cancer 1994; 70: 352-62.
Stiller CA. Non-specialist units, clinical trials and survival from testicular cancer. Eur J Cancer 1995; 31A: 289-91.
Stiller CA, Draper GJ. Treatment centre size, entry to trials, and survival in acute lymphoblastic leukaemia. Arch Dis Child 1989; 64: 657-61.
Tannock IF, Osoba D, Stockler MR, et al. Chemotherapy with mitoxantrone plus prednisone or prednisone alone for symptomatic hormone-resistant prostate cancer: a Canadian randomized trial with palliative end points. J Clin Oncol 1996; 14: 1756-64.
14
EORTC QLQ-C30
Tables of Reference Values
15
All cancer patients: all stages Characteristics of the sample Version of the QLQ-C30 Primary disease site N (%) N (%) v 1.0 3,853 16 Bladder 13 0 v +3 1,061 5 Bone 4 0 v 2.0 8,258 35 Brain 280 1 v 3.0 10,381 44 Breast 2,788 12 Total 23,553 Colorectal 1,773 8 Genito-urinary (other) 45 0 Gynaecological (excluding ovarian) 270 1 Age Head & neck: hypopharynx/larynx 436 2 Head & neck: oral cavity/oropharynx 272 1 N (%) Kidney 188 1 <40 1,825 8 Leukaemia 346 2 40-49 3,382 14 Liver/bile 452 2 50-59 5,707 24 Lung 3,332 14 60-69 6,709 29 Lymphoma 396 2 70-79 4,650 20 Malignant melanoma 1,200 5 80+ 707 3 Malignant myeloma 944 4 Not known 573 2 Oesophagus/stomach 1,893 8 Total 23,553 Ovarian 918 4 Pancreas 298 1 Prostate 3,361 14 Gender Sarcoma 55 0 Testicular 387 2 N (%) Other 2,796 12 Male 13,225 56 Not known 1,106 5 Female 9,028 38 Total 23,553 Not known 1,300 6 Total 23,553 Stage N (%) Stage I-II 4,720 20 Stage III-IV 8,066 34 Recurrent/metastatic 4,812 20 Not known 5,955 25 Total 23,553 Constructed scales Mean (SD) Median [IQR] Global health status/QoL QL 61.3 (24.2) 66.7 [50-83.3] Physical functioning PF 76.7 (23.2) 80 [66.7-93.3] Role Functioning RF 70.5 (32.8) 83.3 [50-100] Emotional functioning EF 71.4 (24.2) 75 [58.3-91.7] Cognitive functioning CF 82.6 (21.9) 83.3 [66.7-100] Social functioning SF 75.0 (29.1) 83.3 [66.7-100] Fatigue FA 34.6 (27.8) 33.3 [11.1-55.6] Nausea and vomiting NV 9.1 (19) 0 [0-16.7] Pain PA 27.0 (29.9) 16.7 [0-50] Dyspnoea DY 21.0 (28.4) 0 [0-33.3] Insomnia SL 28.9 (31.9) 33.3 [0-33.3] Appetite loss AP 21.1 (31.3) 0 [0-33.3] Constipation CO 17.5 (28.4) 0 [0-33.3] Diarrhoea DI 9.0 (20.3) 0 [0-0] Financial difficulties FI 16.3 (28.1) 0 [0-33.3]
16
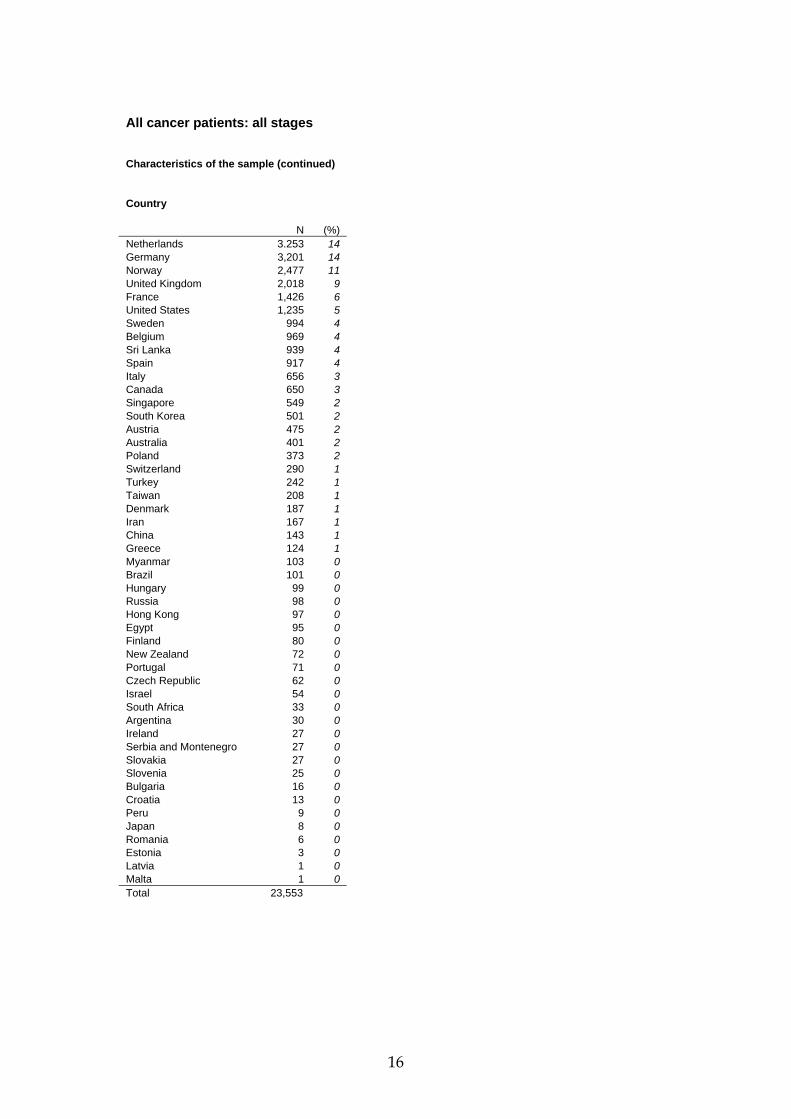
All cancer patients: all stages Characteristics of the sample (continued) Country N (%) Netherlands 3.253 14 Germany 3,201 14 Norway 2,477 11 United Kingdom 2,018 9 France 1,426 6 United States 1,235 5 Sweden 994 4 Belgium 969 4 Sri Lanka 939 4 Spain 917 4 Italy 656 3 Canada 650 3 Singapore 549 2 South Korea 501 2 Austria 475 2 Australia 401 2 Poland 373 2 Switzerland 290 1 Turkey 242 1 Taiwan 208 1 Denmark 187 1 Iran 167 1 China 143 1 Greece 124 1 Myanmar 103 0 Brazil 101 0 Hungary 99 0 Russia 98 0 Hong Kong 97 0 Egypt 95 0 Finland 80 0 New Zealand 72 0 Portugal 71 0 Czech Republic 62 0 Israel 54 0 South Africa 33 0 Argentina 30 0 Ireland 27 0 Serbia and Montenegro 27 0 Slovakia 27 0 Slovenia 25 0 Bulgaria 16 0 Croatia 13 0 Peru 9 0 Japan 8 0 Romania 6 0 Estonia 3 0 Latvia 1 0 Malta 1 0 Total 23,553
17
All cancer patients: all stages Constructed scales QL N (%) CF N (%) 0 464 2 0 224 1 8.3 173 1 16.7 350 2 16.7 686 4 33.3 854 4 25 493 3 50 1,645 7 33.3 1,527 8 66.7 3,478 15 41.7 1,130 6 83.3 5,677 25 50 3,123 16 100 10,866 47 58.3 1,456 8 Total 23,094 66.7 3,335 17 75 1,460 8 83.3 2,967 15 91.7 756 4 SF N (%) 100 1,667 9 0 1,009 4 Total 19,237 16.7 753 3 33.3 1,866 8 PF N (%) 50 1,980 9 0 74 1 66.7 4,048 18 6.7 65 1 83.3 3,336 15 13.3 91 1 100 10,072 44 20 144 1 Total 23,064 26.7 203 2 33.3 210 2 40 296 3 46.7 349 3 FA N (%) 53.3 424 4 0 4,396 19 60 564 6 11.1 2,535 11 66.7 739 7 22.2 3,226 14 73.3 857 8 33.3 4,378 19 80 1,086 11 44.4 2,171 10 86.7 1,339 13 55.6 1,867 8 93.3 1,370 14 66.7 1,833 8 100 2,347 23 77.8 894 4 Total 10,158 88.9 789 3 100 856 4 RF N (%) Total 22,945 0 1,599 8 16.7 734 4 33.3 1,902 10 50 1,405 7 NV N (%) 66.7 3,209 17 0 16,844 73 83.3 2,382 12 16.7 2,932 13 100 7,924 41 33.3 1,665 7 Total 19,155 50 645 3 66.7 467 2 EF N (%) 83.3 187 1 0 236 1 100 252 1 8.3 255 1 Total 22,992 16.7 446 2 25 575 3 33.3 970 4 41.7 1,170 5 PA N (%) 50 1,535 7 0 9,006 39 58.3 1,876 8 16.7 4,167 18 66.7 2,920 13 33.3 3,745 16 75 2,861 12 50 1,988 9 83.3 3,033 13 66.7 1,902 8 91.7 2,831 12 83.3 1,026 5 100 4,316 19 100 1,155 5 Total 23,024 Total 22,989

18
All cancer patients: all stages Single Items Not at all A little Quite a bit Very much Total N (%) N (%) N (%) N (%) N 1) Strenuous activities PF 3,367 33 3,291 32 2,120 21 1,521 15 10,299 2) Long walk PF 4,013 39 2,936 29 1,858 18 1,508 15 10,315 3) Short walk PF 7,410 72 1,832 18 674 7 401 4 10,317 4) Bed or chair PF 5,850 57 2,591 25 1,328 13 539 5 10,308 5) Self care PF 9,331 90 646 6 220 2 143 1 10,340 6) Limited in work RF 8,888 46 5,067 26 3,128 16 2,224 12 19,307 7) Limited in leisure RF 10,117 53 4,320 22 2,635 14 2,194 11 19,266 8) Dyspnoea DY 13,247 57 6,399 28 2,526 11 1,058 5 23,230 9) Pain PA 9,956 43 7,414 32 3,954 17 1,893 8 23,217 10) Need to rest FA 6,862 30 9,069 39 5,099 22 2,198 10 23,228 11) Insomnia SL 10,614 46 6,911 30 3,917 17 1,799 8 23,241 12) Felt weak FA 9,336 40 7,991 34 3,936 17 1,974 9 23,237 13) Appetite loss AP 14,436 62 4,594 20 2,580 11 1,652 7 23,262 14) Nausea NV 17,488 75 3,838 17 1,322 6 621 3 23,269 15) Vomiting NV 20,095 87 1,953 9 654 3 352 2 23,054 16) Constipation CO 15,415 67 4,538 20 2,086 9 1,150 5 23,189 17) Diarrhoea DI 18,569 80 3,343 14 876 4 385 2 23,173 18) Felt tired FA 6,879 30 9,838 43 4,517 20 1,916 8 23,150 19) Pain interference PA 13,074 57 5,309 23 2,903 13 1,833 8 23,119 20) Concentration CF 15,286 66 5,043 22 2,091 9 796 3 23,216 21) Tension EF 9,464 41 8,900 38 3,704 16 1,264 5 23,332 22) Worry EF 7,015 30 8,909 38 4,870 21 2,563 11 23,357 23) Irritability EF 12,062 52 7,803 33 2,623 11 842 4 23,330 24) Depression EF 10,793 46 7,997 34 3,249 14 1,256 5 23,295 25) Memory trouble CF 13,887 60 6,911 30 1,961 8 585 3 23,344 26) Family life SF 13,241 57 5,681 25 2,821 12 1,471 6 23,214 27) Social activities SF 11,777 51 5,850 25 3,375 15 2,215 10 23,217 28) Financial difficulties FI 16,005 69 4,034 17 1,959 9 1,126 5 23,124 1 2 3 4 5 6 7 Total (very poor) (excellent) 29) Overall health QL 792 1,043 2,401 4,594 4,766 3,856 2,023 19,475 4 5 12 24 25 20 10 30) Overall quality of life QL 877 1,285 2,823 4,795 5,280 4,941 3,043 23,044 4 6 12 21 23 21 13

19
All cancer patients: males Characteristics of the sample Version of the QLQ-C30 Primary disease site N (%) N (%) v 1.0 1,974 15 Bladder 13 0 v +3 568 4 Bone 3 0 v 2.0 5,215 39 Brain 164 1 v 3.0 5,468 41 Breast 4 0 Total 13,225 Colorectal 1,023 8 Genito-urinary (other) 37 0 Gynaecological (excluding ovarian) 0 0 Age Head & neck: hypopharynx/larynx 387 3 Head & neck: oral cavity/oropharynx 182 1 N (%) Kidney 125 1 <40 926 7 Leukaemia 103 1 40-49 1,421 11 Liver/bile 333 3 50-59 2,993 23 Lung 1,925 15 60-69 4,230 32 Lymphoma 220 2 70-79 3,194 24 Malignant melanoma 671 5 80+ 449 3 Malignant myeloma 561 4 Not known 12 0 Oesophagus/stomach 1,330 10 Total 13,225 Ovarian 0 0 Pancreas 130 1 Prostate 3,361 25 Sarcoma 29 0 Testicular 384 3 Other 2,030 15 Not known 210 2 Total 13,225 Stage N (%) Stage I-II 2,705 21 Stage III-IV 4,910 37 Recurrent/metastatic 2,524 19 Not known 3,086 23 Total 13,225 Constructed scales Mean (SD) Median [IQR] Global health status/QoL QL 62.9 (23.8) 66.7 [50-83.3] Physical functioning PF 78.5 (23) 86.7 [66.7-100] Role Functioning RF 73.4 (32.4) 83.3 [50-100] Emotional functioning EF 73.9 (23.6) 75 [58.3-91.7] Cognitive functioning CF 83.7 (21.1) 83.3 [66.7-100] Social functioning SF 76.3 (28.4) 83.3 [66.7-100] Fatigue FA 32.4 (27.4) 33.3 [11.1-44.4] Nausea and vomiting NV 7.7 (17.2) 0 [0-0] Pain PA 25.4 (29.6) 16.7 [0-33.3] Dyspnoea DY 21.1 (28.4) 0 [0-33.3] Insomnia SL 26.7 (31.3) 33.3 [0-33.3] Appetite loss AP 19.2 (30.2) 0 [0-33.3] Constipation CO 16.2 (27.7) 0 [0-33.3] Diarrhoea DI 8.7 (20) 0 [0-0] Financial difficulties FI 15.6 (27.9) 0 [0-33.3]

20
All cancer patients: males Constructed scales QL N (%) CF N (%) 0 212 2 0 105 1 8.3 86 1 16.7 154 1 16.7 340 3 33.3 426 3 25 256 2 50 910 7 33.3 799 7 66.7 1,834 14 41.7 611 6 83.3 3,139 24 50 1,721 16 100 6,351 49 58.3 824 8 Total 12,919 66.7 1,932 18 75 810 7 83.3 1,859 17 91.7 441 4 SF N (%) 100 1,024 9 0 506 4 Total 10,915 16.7 396 3 33.3 953 7 PF N (%) 50 1,091 8 0 34 1 66.7 2,226 17 6.7 33 1 83.3 1,920 15 13.3 44 1 100 5,904 45 20 75 1 Total 12,996 26.7 95 2 33.3 99 2 40 137 3 46.7 160 3 FA N (%) 53.3 201 4 0 2,849 22 60 301 6 11.1 1,471 12 66.7 363 7 22.2 1,781 14 73.3 403 8 33.3 2,378 19 80 502 9 44.4 1,184 9 86.7 673 13 55.6 981 8 93.3 745 14 66.7 974 8 100 1,487 28 77.8 417 3 Total 5,352 88.9 405 3 100 400 3 RF N (%) Total 12,840 0 832 8 16.7 369 3 33.3 975 9 50 695 6 NV N (%) 66.7 1,631 15 0 9,814 76 83.3 1,298 12 16.7 1,555 12 100 5,099 47 33.3 827 6 Total 10,899 50 288 2 66.7 216 2 EF N (%) 83.3 90 1 0 101 1 100 93 1 8.3 120 1 Total 12,883 16.7 213 2 25 281 2 33.3 476 4 41.7 567 4 PA N (%) 50 770 6 0 5,504 43 58.3 980 8 16.7 2,182 17 66.7 1,513 12 33.3 1,970 15 75 1,586 12 50 1,059 8 83.3 1,759 14 66.7 1,041 8 91.7 1,728 13 83.3 521 4 100 2,865 22 100 593 5 Total 12,959 Total 12,870

21
All cancer patients: males Single Items Not at all A little Quite a bit Very much Total N (%) N (%) N (%) N (%) N 1) Strenuous activities PF 2,120 39 1,574 29 1,073 20 668 12 5,435 2) Long walk PF 2,287 42 1,442 27 942 17 766 14 5,437 3) Short walk PF 4,004 74 906 17 325 6 195 4 5,430 4) Bed or chair PF 3,322 61 1,220 23 615 11 263 5 5,420 5) Self care PF 4,940 91 307 6 126 2 77 1 5,450 6) Limited in work RF 5,658 52 2,606 24 1,552 14 1,150 11 10,966 7) Limited in leisure RF 6,238 57 2,214 20 1,378 13 1,124 10 10,954 8) Dyspnoea DY 7,411 57 3,509 27 1,495 12 569 4 12,984 9) Pain PA 6,078 47 3,815 29 2,108 16 985 8 12,986 10) Need to rest FA 4,298 33 4,940 38 2,680 21 1,071 8 12,989 11) Insomnia SL 6,353 49 3,744 29 1,997 15 895 7 12,989 12) Felt weak FA 5,536 43 4,299 33 2,176 17 981 8 12,992 13) Appetite loss AP 8,471 65 2,374 18 1,344 10 805 6 12,994 14) Nausea NV 10,186 78 1,956 15 614 5 253 2 13,009 15) Vomiting NV 11,474 89 974 8 313 2 152 1 12,913 16) Constipation CO 8,943 69 2,329 18 1,122 9 580 5 12,974 17) Diarrhoea DI 10,452 81 1,836 14 492 4 195 2 12,975 18) Felt tired FA 4,316 33 5,396 42 2,339 18 885 7 12,936 19) Pain interference PA 7,597 59 2,801 22 1,589 12 942 7 12,929 20) Concentration CF 8,896 69 2,651 20 1,065 8 364 3 12,976 21) Tension EF 5,989 46 4,755 36 1,799 14 571 4 13,114 22) Worry EF 4,514 34 4,938 38 2,496 19 1,186 9 13,134 23) Irritability EF 6,921 53 4,370 33 1,411 11 414 3 13,116 24) Depression EF 6,705 51 4,199 32 1,627 12 575 4 13,106 25) Memory trouble CF 7,952 61 3,808 29 1,086 8 280 2 13,126 26) Family life SF 7,624 58 3,159 24 1,530 12 754 6 13,067 27) Social activities SF 6,931 53 3,261 25 1,773 14 1,109 9 13,074 28) Financial difficulties FI 9,259 71 2,101 16 1,071 8 620 5 13,051 1 2 3 4 5 6 7 Total (very poor) (excellent) 29) Overall health QL 425 551 1,266 2,543 2,725 2,379 1,235 11,124 4 5 11 23 25 21 11 30) Overall quality of life QL 427 666 1,495 2,675 3,054 2,842 1,713 12,872 3 5 12 21 24 22 13

22
All cancer patients: females Characteristics of the sample Version of the QLQ-C30 Primary disease site N (%) N (%) v 1.0 1,422 16 Bladder 0 0 v +3 394 4 Bone 1 0 v 2.0 2,563 28 Brain 112 1 v 3.0 4,649 52 Breast 2,782 31 Total 9,028 Colorectal 687 8 Genito-urinary (other) 8 0 Gynaecological (excluding ovarian) 270 3 Age Head & neck: hypopharynx/larynx 49 1 Head & neck: oral cavity/oropharynx 90 1 N (%) Kidney 60 1 <40 819 9 Leukaemia 243 3 40-49 1,784 20 Liver/bile 118 1 50-59 2,411 27 Lung 830 9 60-69 2,197 24 Lymphoma 176 2 70-79 1,291 14 Malignant melanoma 529 6 80+ 235 3 Malignant myeloma 381 4 Not known 291 3 Oesophagus/stomach 549 6 Total 9,028 Ovarian 917 10 Pancreas 110 1 Prostate 0 0 Sarcoma 26 0 Testicular 0 0 Other 729 8 Not known 361 4 Total 9,028 Stage N (%) Stage I-II 1,669 19 Stage III-IV 2,483 28 Recurrent/metastatic 2,131 24 Not known 2,745 30 Total 9,028 Constructed scales Mean (SD) Median [IQR] Global health status/QoL QL 59.3 (24.9) 58.3 [41.7-83.3] Physical functioning PF 74.7 (23.3) 80 [60-93.3] Role Functioning RF 67.1 (32.9) 66.7 [50-100] Emotional functioning EF 67.8 (24.7) 75 [50-83.3] Cognitive functioning CF 80.9 (23.1) 83.3 [66.7-100] Social functioning SF 72.9 (30.1) 83.3 [50-100] Fatigue FA 37.7 (28.2) 33.3 [11.1-55.6] Nausea and vomiting NV 11.1 (21.3) 0 [0-16.7] Pain PA 29.3 (30.3) 16.7 [0-50] Dyspnoea DY 20.3 (28.1) 0 [0-33.3] Insomnia SL 31.8 (32.6) 33.3 [0-66.7] Appetite loss AP 23.8 (32.6) 0 [0-33.3] Constipation CO 19.9 (29.8) 0 [0-33.3] Diarrhoea DI 9.3 (20.8) 0 [0-0] Financial difficulties FI 17.5 (28.5) 0 [0-33.3]

23
All cancer patients: females Constructed scales QL N (%) CF N (%) 0 233 3 0 114 1 8.3 79 1 16.7 183 2 16.7 319 4 33.3 384 4 25 219 3 50 658 7 33.3 647 9 66.7 1,466 17 41.7 469 6 83.3 2,141 24 50 1,251 17 100 3,948 44 58.3 560 8 Total 8,894 66.7 1,247 17 75 575 8 83.3 1,012 14 91.7 274 4 SF N (%) 100 605 8 0 450 5 Total 7,490 16.7 323 4 33.3 818 9 PF N (%) 50 762 9 0 40 1 66.7 1,595 18 6.7 32 1 83.3 1,220 14 13.3 45 1 100 3,624 41 20 67 2 Total 8,792 26.7 102 2 33.3 99 2 40 150 3 46.7 180 4 FA N (%) 53.3 209 5 0 1,348 15 60 243 5 11.1 931 11 66.7 356 8 22.2 1,224 14 73.3 432 10 33.3 1,737 20 80 556 12 44.4 861 10 86.7 631 14 55.6 781 9 93.3 595 13 66.7 762 9 100 811 18 77.8 436 5 Total 4,548 88.9 333 4 100 414 5 RF N (%) Total 8,827 0 681 9 16.7 326 4 33.3 799 11 50 639 9 NV N (%) 66.7 1,417 19 0 6,109 69 83.3 1,000 14 16.7 1,195 14 100 2,565 35 33.3 734 8 Total 7,427 50 311 4 66.7 234 3 EF N (%) 83.3 94 1 0 122 1 100 149 2 8.3 123 1 Total 8,826 16.7 210 2 25 263 3 33.3 451 5 41.7 536 6 PA N (%) 50 673 8 0 3,051 35 58.3 792 9 16.7 1,710 19 66.7 1,219 14 33.3 1,574 18 75 1,117 13 50 805 9 83.3 1,116 13 66.7 744 8 91.7 938 11 83.3 460 5 100 1,239 14 100 495 6 Total 8,799 Total 8,839

24
All cancer patients: females Single Items Not at all A little Quite a bit Very much Total N (%) N (%) N (%) N (%) N 1) Strenuous activities PF 1,171 25 1,639 36 990 22 802 17 4,602 2) Long walk PF 1,637 36 1,425 31 859 19 696 15 4,617 3) Short walk PF 3,223 70 879 19 319 7 202 4 4,623 4) Bed or chair PF 2,390 52 1,300 28 667 14 268 6 4,625 5) Self care PF 4,148 90 323 7 90 2 66 1 4,627 6) Limited in work RF 2,931 39 2,235 30 1,389 19 952 13 7,507 7) Limited in leisure RF 3,551 48 1,877 25 1,097 15 956 13 7,481 8) Dyspnoea DY 5,205 58 2,468 28 864 10 416 5 8,953 9) Pain PA 3,398 38 3,136 35 1,613 18 797 9 8,944 10) Need to rest FA 2,242 25 3,556 40 2,132 24 1,016 11 8,946 11) Insomnia SL 3,706 41 2,769 31 1,695 19 795 9 8,965 12) Felt weak FA 3,277 37 3,225 36 1,540 17 910 10 8,952 13) Appetite loss AP 5,183 58 1,942 22 1,087 12 766 9 8,978 14) Nausea NV 6,354 71 1,641 18 634 7 338 4 8,967 15) Vomiting NV 7,494 85 854 10 318 4 189 2 8,855 16) Constipation CO 5,548 62 1,960 22 893 10 530 6 8,931 17) Diarrhoea DI 7,103 80 1,303 15 336 4 170 2 8,912 18) Felt tired FA 2,252 25 3,828 43 1,944 22 906 10 8,930 19) Pain interference PA 4,743 53 2,205 25 1,153 13 800 9 8,901 20) Concentration CF 5,550 62 2,095 23 909 10 397 4 8,951 21) Tension EF 2,992 34 3,629 41 1,680 19 626 7 8,927 22) Worry EF 2,165 24 3,449 39 2,074 23 1,248 14 8,936 23) Irritability EF 4,498 50 2,972 33 1,078 12 389 4 8,937 24) Depression EF 3,504 39 3,314 37 1,458 16 629 7 8,905 25) Memory trouble CF 5,163 58 2,696 30 786 9 289 3 8,934 26) Family life SF 4,869 55 2,194 25 1,150 13 653 7 8,866 27) Social activities SF 4,224 48 2,261 26 1,381 16 993 11 8,859 28) Financial difficulties FI 5,846 67 1,705 19 796 9 442 5 8,789 1 2 3 4 5 6 7 Total (very poor) (excellent) 29) Overall health QL 338 447 1,025 1,829 1,813 1,331 733 7,516 5 6 14 24 24 18 10 30) Overall quality of life QL 425 566 1,182 1,881 1,927 1,796 1,109 8,886 5 6 13 21 22 20 13

25
All cancer patients: <50 Characteristics of the sample Version of the QLQ-C30 Primary disease site N (%) N (%) v 1.0 707 14 Bladder 1 0 v +3 190 4 Bone 1 0 v 2.0 1,971 38 Brain 150 3 v 3.0 2,339 45 Breast 936 18 Total 5,207 Colorectal 271 5 Genito-urinary (other) 4 0 Gynaecological (excluding ovarian) 105 2 Age Head & neck: hypopharynx/larynx 52 1 Head & neck: oral cavity/oropharynx 50 1 N (%) Kidney 51 1 <40 1,825 35 Leukaemia 185 4 40-49 3,382 65 Liver/bile 83 2 50-59 0 0 Lung 501 10 60-69 0 0 Lymphoma 201 4 70-79 0 0 Malignant melanoma 606 12 80+ 0 0 Malignant myeloma 121 2 Not known 0 0 Oesophagus/stomach 212 4 Total 5,207 Ovarian 180 4 Pancreas 63 1 Prostate 40 1 Gender Sarcoma 28 1 Testicular 375 7 N (%) Other 637 12 Male 2,347 45 Not known 354 7 Female 2,603 50 Total 5,207 Not known 257 5 Total 5,207 Stage N (%) Stage I-II 859 17 Stage III-IV 1,454 28 Recurrent/metastatic 1,187 23 Not known 1,707 33 Total 5,207 Constructed scales Mean (SD) Median [IQR] Global health status/QoL QL 61.4 (23.4) 66.7 [50-83.3] Physical functioning PF 80.2 (20.8) 86.7 [66.7-100] Role Functioning RF 68.6 (31.7) 66.7 [50-100] Emotional functioning EF 69.2 (24.4) 75 [58.3-91.7] Cognitive functioning CF 82.9 (21.6) 83.3 [66.7-100] Social functioning SF 72.1 (29.5) 83.3 [50-100] Fatigue FA 33.9 (26.1) 33.3 [11.1-55.6] Nausea and vomiting NV 9.4 (19.1) 0 [0-16.7] Pain PA 27.2 (28.8) 16.7 [0-50] Dyspnoea DY 17.1 (25.8) 0 [0-33.3] Insomnia SL 30.2 (32.2) 33.3 [0-66.7] Appetite loss AP 19.7 (29.1) 0 [0-33.3] Constipation CO 15.3 (26.5) 0 [0-33.3] Diarrhoea DI 9.0 (19.9) 0 [0-0] Financial difficulties FI 23.6 (32) 0 [0-33.3]

26
All cancer patients: <50 Constructed scales QL N (%) CF N (%) 0 85 2 0 40 1 8.3 26 1 16.7 78 2 16.7 143 3 33.3 170 3 25 106 3 50 361 7 33.3 360 8 66.7 770 15 41.7 274 6 83.3 1,188 24 50 670 16 100 2,391 48 58.3 356 8 Total 4,998 66.7 749 17 75 373 9 83.3 663 15 91.7 185 4 SF N (%) 100 314 7 0 251 5 Total 4,304 16.7 181 4 33.3 479 9 PF N (%) 50 456 9 0 12 1 66.7 1,062 21 6.7 9 0 83.3 748 15 13.3 14 1 100 1,945 38 20 13 1 Total 5,122 26.7 23 1 33.3 37 2 40 45 2 46.7 61 3 FA N (%) 53.3 88 4 0 872 18 60 131 6 11.1 552 11 66.7 143 6 22.2 731 15 73.3 199 9 33.3 1,089 22 80 263 12 44.4 491 10 86.7 328 14 55.6 411 8 93.3 299 13 66.7 385 8 100 630 28 77.8 173 4 Total 2,295 88.9 159 3 100 124 3 RF N (%) Total 4,987 0 329 8 16.7 164 4 33.3 459 11 50 374 9 NV N (%) 66.7 866 20 0 3,577 72 83.3 578 14 16.7 655 13 100 1,511 35 33.3 418 8 Total 4,281 50 116 2 66.7 116 2 EF N (%) 83.3 34 1 0 63 1 100 57 1 8.3 64 1 Total 4,973 16.7 126 3 25 136 3 33.3 238 5 41.7 266 5 PA N (%) 50 366 7 0 1,790 36 58.3 428 8 16.7 976 20 66.7 763 15 33.3 941 19 75 670 13 50 464 9 83.3 639 13 66.7 384 8 91.7 536 11 83.3 204 4 100 827 16 100 222 5 Total 5,122 Total 4,981

27
All cancer patients: <50 Single Items Not at all A little Quite a bit Very much Total N (%) N (%) N (%) N (%) N 1) Strenuous activities PF 864 37 800 34 436 19 224 10 2,324 2) Long walk PF 1,047 45 715 31 373 16 196 8 2,331 3) Short walk PF 1,796 77 375 16 111 5 48 2 2,330 4) Bed or chair PF 1,292 56 636 28 278 12 105 5 2,311 5) Self care PF 2,149 92 130 6 32 1 21 1 2,332 6) Limited in work RF 1,764 41 1,333 31 723 17 484 11 4,304 7) Limited in leisure RF 2,015 47 1,152 27 660 15 467 11 4,294 8) Dyspnoea DY 3,168 63 1,287 26 415 8 152 3 5,022 9) Pain PA 1,985 40 1,839 37 813 16 380 8 5,017 10) Need to rest FA 1,398 28 2,106 42 1,087 22 429 9 5,020 11) Insomnia SL 2,183 44 1,556 31 855 17 426 9 5,020 12) Felt weak FA 2,001 40 1,902 38 805 16 316 6 5,024 13) Appetite loss AP 3,108 62 1,114 22 554 11 249 5 5,025 14) Nausea NV 3,702 74 927 18 265 5 136 3 5,030 15) Vomiting NV 4,284 86 477 10 148 3 70 1 4,979 16) Constipation CO 3,477 69 984 20 358 7 200 4 5,019 17) Diarrhoea DI 3,983 80 783 16 172 3 75 2 5,013 18) Felt tired FA 1,394 28 2,292 46 993 20 335 7 5,014 19) Pain interference PA 2,721 54 1,326 27 613 12 344 7 5,004 20) Concentration CF 3,100 62 1,248 25 492 10 176 4 5,016 21) Tension EF 1,832 35 2,169 42 860 17 317 6 5,178 22) Worry EF 1,328 26 2,110 41 1,118 22 628 12 5,184 23) Irritability EF 2,386 46 1,904 37 646 13 231 5 5,167 24) Depression EF 2,241 43 1,940 38 714 14 273 5 5,168 25) Memory trouble CF 3,360 65 1,354 26 354 7 108 2 5,176 26) Family life SF 2,571 50 1,531 30 676 13 378 7 5,156 27) Social activities SF 2,358 46 1,474 29 806 16 505 10 5,143 28) Financial difficulties FI 2,908 57 1,192 23 604 12 405 8 5,109 1 2 3 4 5 6 7 Total (very poor) (excellent) 29) Overall health QL 220 256 564 1,009 1,105 906 410 4,470 5 6 13 23 25 20 9 30) Overall quality of life QL 145 255 628 992 1,199 1,147 641 5,007 3 5 13 20 24 23 13

28
All cancer patients: 50-59 Characteristics of the sample Version of the QLQ-C30 Primary disease site N (%) N (%) v 1.0 874 15 Bladder 1 0 v +3 287 5 Bone 1 0 v 2.0 1,777 31 Brain 86 2 v 3.0 2,769 49 Breast 788 14 Total 5,707 Colorectal 456 8 Genito-urinary (other) 6 0 Gynaecological (excluding ovarian) 66 1 Age Head & neck: hypopharynx/larynx 113 2 Head & neck: oral cavity/oropharynx 95 2 N (%) Kidney 68 1 <40 0 0 Leukaemia 97 2 40-49 0 0 Liver/bile 93 2 50-59 5,707 100 Lung 971 17 60-69 0 0 Lymphoma 90 2 70-79 0 0 Malignant melanoma 294 5 80+ 0 0 Malignant myeloma 314 6 Not known 0 0 Oesophagus/stomach 420 7 Total 5,707 Ovarian 255 5 Pancreas 82 1 Prostate 336 6 Gender Sarcoma 16 0 Testicular 9 0 N (%) Other 820 14 Male 2,993 52 Not known 230 4 Female 2,411 42 Total 5,707 Not known 303 5 Total 5,707 Stage N (%) Stage I-II 1,097 19 Stage III-IV 2,030 36 Recurrent/metastatic 961 17 Not known 1,619 28 Total 5,707 Constructed scales Mean (SD) Median [IQR] Global health status/QoL QL 61.2 (24.1) 66.7 [50-83.3] Physical functioning PF 78.0 (22.5) 86.7 [66.7-93.3] Role Functioning RF 69.4 (32.7) 83.3 [50-100] Emotional functioning EF 69.0 (24.2) 75 [50-91.7] Cognitive functioning CF 83.2 (21.9) 83.3 [66.7-100] Social functioning SF 73.5 (29.4) 83.3 [50-100] Fatigue FA 34.4 (27.7) 33.3 [11.1-55.6] Nausea and vomiting NV 8.9 (18.5) 0 [0-16.7] Pain PA 28.2 (30.1) 16.7 [0-50] Dyspnoea DY 20.4 (28) 0 [0-33.3] Insomnia SL 30.1 (32.1) 33.3 [0-66.7] Appetite loss AP 20.8 (30.4) 0 [0-33.3] Constipation CO 15.1 (26.3) 0 [0-33.3] Diarrhoea DI 8.9 (20.2) 0 [0-0] Financial difficulties FI 20.1 (30.1) 0 [0-33.3]

29
All cancer patients: 50-59 Constructed scales QL N (%) CF N (%) 0 111 2 0 55 1 8.3 43 1 16.7 88 2 16.7 173 4 33.3 199 4 25 116 2 50 395 7 33.3 384 8 66.7 819 15 41.7 268 6 83.3 1,290 23 50 791 17 100 2,783 49 58.3 373 8 Total 5,629 66.7 838 18 75 361 8 83.3 699 15 91.7 199 4 SF N (%) 100 404 9 0 258 5 Total 4,760 16.7 174 3 33.3 517 9 PF N (%) 50 532 10 0 12 0 66.7 1,013 18 6.7 13 1 83.3 803 14 13.3 19 1 100 2,303 41 20 40 2 Total 5,600 26.7 51 2 33.3 55 2 40 74 3 46.7 84 3 FA N (%) 53.3 120 4 0 1,094 20 60 140 5 11.1 607 11 66.7 176 7 22.2 740 13 73.3 210 8 33.3 1,157 21 80 308 11 44.4 541 10 86.7 369 14 55.6 405 7 93.3 391 14 66.7 430 8 100 661 24 77.8 232 4 Total 2,723 88.9 204 4 100 199 4 RF N (%) Total 5,609 0 395 8 16.7 182 4 33.3 514 11 50 370 8 NV N (%) 66.7 838 18 0 4,120 73 83.3 584 12 16.7 752 13 100 1,859 39 33.3 391 7 Total 4,742 50 172 3 66.7 101 2 EF N (%) 83.3 46 1 0 65 1 100 53 1 8.3 70 1 Total 5,635 16.7 113 2 25 158 3 33.3 263 5 41.7 314 6 PA N (%) 50 420 8 0 2,056 37 58.3 509 9 16.7 1,056 19 66.7 751 14 33.3 973 17 75 713 13 50 485 9 83.3 745 13 66.7 503 9 91.7 628 11 83.3 243 4 100 832 15 100 305 5 Total 5,581 Total 5,621

30
All cancer patients: 50-59 Single Items Not at all A little Quite a bit Very much Total N (%) N (%) N (%) N (%) N 1) Strenuous activities PF 924 34 857 31 566 21 402 15 2,749 2) Long walk PF 1,151 42 794 29 474 17 335 12 2,754 3) Short walk PF 2,052 74 434 16 182 7 92 3 2,760 4) Bed or chair PF 1,599 58 699 25 350 13 108 4 2,756 5) Self care PF 2,535 92 149 5 51 2 29 1 2,764 6) Limited in work RF 2,100 44 1,258 26 865 18 551 12 4,774 7) Limited in leisure RF 2,416 51 1,115 23 701 15 535 11 4,767 8) Dyspnoea DY 3,273 58 1,571 28 570 10 254 5 5,668 9) Pain PA 2,304 41 1,899 34 983 17 488 9 5,674 10) Need to rest FA 1,701 30 2,265 40 1,180 21 522 9 5,668 11) Insomnia SL 2,468 44 1,759 31 979 17 466 8 5,672 12) Felt weak FA 2,197 39 2,057 36 933 16 491 9 5,678 13) Appetite loss AP 3,475 61 1,213 21 626 11 357 6 5,671 14) Nausea NV 4,256 75 958 17 319 6 142 3 5,675 15) Vomiting NV 4,953 88 469 8 159 3 74 1 5,655 16) Constipation CO 3,936 70 1,094 19 404 7 220 4 5,654 17) Diarrhoea DI 4,533 80 811 14 220 4 87 2 5,651 18) Felt tired FA 1,684 30 2,442 43 1,062 19 465 8 5,653 19) Pain interference PA 3,052 54 1,395 25 734 13 461 8 5,642 20) Concentration CF 3,632 64 1,293 23 546 10 189 3 5,660 21) Tension EF 2,008 36 2,287 40 1,012 18 352 6 5,659 22) Worry EF 1,375 24 2,269 40 1,308 23 703 12 5,655 23) Irritability EF 2,785 49 1,984 35 681 12 205 4 5,655 24) Depression EF 2,433 43 2,055 36 818 15 347 6 5,653 25) Memory trouble CF 3,579 63 1,546 27 388 7 143 3 5,656 26) Family life SF 3,033 54 1,472 26 752 13 371 7 5,628 27) Social activities SF 2,709 48 1,472 26 927 17 527 9 5,635 28) Financial difficulties FI 3,486 62 1,173 21 580 10 345 6 5,584 1 2 3 4 5 6 7 Total (very poor) (excellent) 29) Overall health QL 172 258 610 1,099 1,201 937 506 4,783 4 5 13 23 25 20 11 30) Overall quality of life QL 195 320 716 1,140 1,333 1,175 741 5,620 4 6 13 20 24 21 13
31
All cancer patients: 60-69 Characteristics of the sample Version of the QLQ-C30 Primary disease site N (%) N (%) v 1.0 1,003 15 Bladder 2 0 v +3 255 4 Bone 0 0 v 2.0 2,553 38 Brain 44 1 v 3.0 2,898 43 Breast 525 8 Total 6,709 Colorectal 633 9 Genito-urinary (other) 6 0 Gynaecological (excluding ovarian) 64 1 Age Head & neck: hypopharynx/larynx 149 2 Head & neck: oral cavity/oropharynx 46 1 N (%) Kidney 55 1 <40 0 0 Leukaemia 43 1 40-49 0 0 Liver/bile 159 2 50-59 0 0 Lung 1,108 17 60-69 6,709 100 Lymphoma 55 1 70-79 0 0 Malignant melanoma 233 4 80+ 0 0 Malignant myeloma 264 4 Not known 0 0 Oesophagus/stomach 604 9 Total 6,709 Ovarian 318 5 Pancreas 88 1 Prostate 1,327 20 Gender Sarcoma 6 0 Testicular 2 0 N (%) Other 784 12 Male 4,230 63 Not known 194 3 Female 2,197 33 Total 6,709 Not known 282 4 Total 6,709 Stage N (%) Stage I-II 1,498 22 Stage III-IV 2,423 36 Recurrent/metastatic 1,233 18 Not known 1,555 23 Total 6,709 Constructed scales Mean (SD) Median [IQR] Global health status/QoL QL 61.8 (24.4) 66.7 [50-83.3] Physical functioning PF 76.3 (23.5) 80 [66.7-93.3] Role Functioning RF 72.6 (32.7) 83.3 [50-100] Emotional functioning EF 71.8 (24.3) 75 [58.3-91.7] Cognitive functioning CF 83.1 (21.6) 83.3 [66.7-100] Social functioning SF 76.4 (28.8) 83.3 [66.7-100] Fatigue FA 34.1 (28.2) 33.3 [11.1-55.6] Nausea and vomiting NV 8.7 (19) 0 [0-16.7] Pain PA 26.4 (30.2) 16.7 [0-50] Dyspnoea DY 22.1 (29.1) 0 [0-33.3] Insomnia SL 28.6 (32) 33.3 [0-33.3] Appetite loss AP 21.0 (31.9) 0 [0-33.3] Constipation CO 17.7 (28.8) 0 [0-33.3] Diarrhoea DI 9.2 (20.7) 0 [0-0] Financial difficulties FI 13.8 (26.4) 0 [0-33.3]

32
All cancer patients: 60-69 Constructed scales QL N (%) CF N (%) 0 133 2 0 62 1 8.3 54 1 16.7 92 1 16.7 186 3 33.3 251 4 25 144 3 50 433 7 33.3 437 8 66.7 974 15 41.7 328 6 83.3 1,625 25 50 921 16 100 3,191 48 58.3 409 7 Total 6,628 66.7 954 17 75 398 7 83.3 905 16 91.7 203 4 SF N (%) 100 539 10 0 273 4 Total 5,611 16.7 198 3 33.3 494 8 PF N (%) 50 536 8 0 21 1 66.7 1,070 16 6.7 15 1 83.3 939 14 13.3 24 1 100 3,059 47 20 43 2 Total 6,569 26.7 68 2 33.3 63 2 40 85 3 46.7 108 4 FA N (%) 53.3 110 4 0 1,364 21 60 148 5 11.1 729 11 66.7 233 8 22.2 915 14 73.3 238 8 33.3 1,144 17 80 284 10 44.4 612 9 86.7 345 12 55.6 562 9 93.3 373 13 66.7 521 8 100 667 24 77.8 260 4 Total 2,825 88.9 217 3 100 252 4 RF N (%) Total 6,576 0 443 8 16.7 215 4 33.3 501 9 50 353 6 NV N (%) 66.7 852 15 0 4,949 75 83.3 687 12 16.7 780 12 100 2,541 45 33.3 443 7 Total 5,592 50 177 3 66.7 123 2 EF N (%) 83.3 60 1 0 65 1 100 77 1 8.3 76 1 Total 6,609 16.7 122 2 25 163 3 33.3 274 4 41.7 343 5 PA N (%) 50 428 7 0 2,717 41 58.3 528 8 16.7 1,161 18 66.7 770 12 33.3 1,020 16 75 813 12 50 548 8 83.3 854 13 66.7 507 8 91.7 866 13 83.3 300 5 100 1,250 19 100 346 5 Total 6,552 Total 6,599

33
All cancer patients: 60-69 Single Items Not at all A little Quite a bit Very much Total N (%) N (%) N (%) N (%) N 1) Strenuous activities PF 933 33 850 30 636 22 449 16 2,868 2) Long walk PF 1,100 38 765 27 539 19 467 16 2,871 3) Short walk PF 2,052 72 503 18 201 7 115 4 2,871 4) Bed or chair PF 1,689 59 693 24 339 12 160 6 2,881 5) Self care PF 2,610 90 175 6 62 2 39 1 2,886 6) Limited in work RF 2,791 50 1,415 25 817 15 614 11 5,637 7) Limited in leisure RF 3,170 56 1,150 20 688 12 619 11 5,627 8) Dyspnoea DY 3,684 55 1,859 28 768 12 341 5 6,652 9) Pain PA 2,988 45 2,033 31 1,106 17 544 8 6,671 10) Need to rest FA 2,093 31 2,487 37 1,480 22 607 9 6,667 11) Insomnia SL 3,094 46 1,938 29 1,129 17 511 8 6,672 12) Felt weak FA 2,764 41 2,139 32 1,174 18 593 9 6,670 13) Appetite loss AP 4,242 64 1,202 18 715 11 523 8 6,682 14) Nausea NV 5,126 77 1,001 15 379 6 178 3 6,684 15) Vomiting NV 5,833 88 504 8 175 3 111 2 6,623 16) Constipation CO 4,429 67 1,252 19 619 9 346 5 6,646 17) Diarrhoea DI 5,313 80 956 14 254 4 122 2 6,645 18) Felt tired FA 2,104 32 2,695 41 1,288 19 547 8 6,634 19) Pain interference PA 3,857 58 1,414 21 803 12 555 8 6,629 20) Concentration CF 4,527 68 1,352 20 558 8 224 3 6,661 21) Tension EF 2,806 42 2,443 37 1,055 16 337 5 6,641 22) Worry EF 2,054 31 2,494 38 1,365 21 741 11 6,654 23) Irritability EF 3,500 53 2,152 32 745 11 246 4 6,643 24) Depression EF 3,121 47 2,181 33 964 15 364 6 6,630 25) Memory trouble CF 3,927 59 2,000 30 567 9 157 2 6,651 26) Family life SF 3,977 60 1,473 22 759 12 400 6 6,609 27) Social activities SF 3,531 53 1,591 24 889 13 604 9 6,615 28) Financial difficulties FI 4,877 74 962 15 509 8 252 4 6,600 1 2 3 4 5 6 7 Total (very poor) (excellent) 29) Overall health QL 197 278 671 1,367 1,362 1,124 637 5,636 4 5 12 24 24 20 11 30) Overall quality of life QL 259 368 782 1,429 1,445 1,430 888 6,601 4 6 12 22 22 22 14

34
All cancer patients: ≥70 Characteristics of the sample Version of the QLQ-C30 Primary disease site N (%) N (%) v 1.0 902 17 Bladder 9 0 v +3 229 4 Bone 2 0 v 2.0 1,947 36 Brain 0 0 v 3.0 2,279 43 Breast 253 5 Total 5,357 Colorectal 413 8 Genito-urinary (other) 29 1 Gynaecological (excluding ovarian) 34 1 Age Head & neck: hypopharynx/larynx 122 2 Head & neck: oral cavity/oropharynx 80 2 N (%) Kidney 14 0 <40 0 0 Leukaemia 21 0 40-49 0 0 Liver/bile 114 2 50-59 0 0 Lung 656 12 60-69 0 0 Lymphoma 50 1 70-79 4,650 87 Malignant melanoma 67 1 80+ 707 13 Malignant myeloma 243 5 Not known 0 0 Oesophagus/stomach 654 12 Total 5,357 Ovarian 164 3 Pancreas 65 1 Prostate 1,657 31 Gender Sarcoma 5 0 Testicular 1 0 N (%) Other 552 10 Male 3,643 68 Not known 152 3 Female 1,526 29 Total 5,357 Not known 188 4 Total 5,357 Stage N (%) Stage I-II 1,257 24 Stage III-IV 1,967 37 Recurrent/metastatic 1,142 21 Not known 991 19 Total 5,357 Constructed scales Mean (SD) Median [IQR] Global health status/QoL QL 60.6 (25.1) 66.7 [50-83.3] Physical functioning PF 72.1 (25.4) 80 [60-93.3] Role Functioning RF 70.7 (34.1) 83.3 [50-100] Emotional functioning EF 76.1 (23.2) 83.3 [66.7-100] Cognitive functioning CF 81.0 (22.4) 83.3 [66.7-100] Social functioning SF 78.2 (28.2) 83.3 [66.7-100] Fatigue FA 35.7 (29) 33.3 [11.1-55.6] Nausea and vomiting NV 9.1 (19.2) 0 [0-16.7] Pain PA 25.9 (30.5) 16.7 [0-50] Dyspnoea DY 23.1 (29.6) 0 [0-33.3] Insomnia SL 26.4 (31.3) 33.3 [0-33.3] Appetite loss AP 22.4 (33.2) 0 [0-33.3] Constipation CO 21.7 (31.2) 0 [0-33.3] Diarrhoea DI 8.9 (20.7) 0 [0-0] Financial difficulties FI 8.5 (20.6) 0 [0-0]

35
All cancer patients: ≥70 Constructed scales QL N (%) CF N (%) 0 132 3 0 64 1 8.3 47 1 16.7 85 2 16.7 180 4 33.3 211 4 25 123 3 50 418 8 33.3 333 8 66.7 831 16 41.7 245 6 83.3 1,435 27 50 704 16 100 2,230 42 58.3 303 7 Total 5,274 66.7 759 17 75 308 7 83.3 669 15 91.7 156 4 SF N (%) 100 398 9 0 197 4 Total 4,357 16.7 174 3 33.3 304 6 PF N (%) 50 406 8 0 29 1 66.7 783 15 6.7 28 1 83.3 763 15 13.3 34 2 100 2,581 50 20 47 2 Total 5,208 26.7 58 3 33.3 54 2 40 89 4 46.7 92 4 FA N (%) 53.3 101 5 0 997 19 60 136 6 11.1 599 12 66.7 178 8 22.2 742 14 73.3 199 9 33.3 863 17 80 225 10 44.4 472 9 86.7 282 13 55.6 436 8 93.3 295 13 66.7 445 9 100 376 17 77.8 200 4 Total 2,223 88.9 195 4 100 262 5 RF N (%) Total 5,211 0 421 10 16.7 168 4 33.3 412 10 50 295 7 NV N (%) 66.7 612 14 0 3,841 74 83.3 511 12 16.7 638 12 100 1,918 44 33.3 355 7 Total 4,337 50 163 3 66.7 111 2 EF N (%) 83.3 44 1 0 32 1 100 58 1 8.3 40 1 Total 5,210 16.7 74 1 25 106 2 33.3 173 3 41.7 213 4 PA N (%) 50 274 5 0 2,282 44 58.3 358 7 16.7 854 16 66.7 534 10 33.3 712 14 75 593 11 50 427 8 83.3 723 14 66.7 444 9 91.7 741 14 83.3 248 5 100 1,346 26 100 259 5 Total 5,207 Total 5,226

36
All cancer patients: ≥70 Single Items Not at all A little Quite a bit Very much Total N (%) N (%) N (%) N (%) N 1) Strenuous activities PF 620 27 752 33 462 20 431 19 2,265 2) Long walk PF 691 31 631 28 448 20 496 22 2,266 3) Short walk PF 1,444 64 501 22 171 8 144 6 2,260 4) Bed or chair PF 1,225 54 530 23 345 15 164 7 2,264 5) Self care PF 1,949 86 185 8 74 3 54 2 2,262 6) Limited in work RF 2,124 48 1,008 23 695 16 560 13 4,387 7) Limited in leisure RF 2,405 55 851 20 559 13 559 13 4,374 8) Dyspnoea DY 2,886 54 1,455 27 699 13 276 5 5,316 9) Pain PA 2,513 48 1,427 27 909 17 437 8 5,286 10) Need to rest FA 1,560 29 1,948 37 1,212 23 581 11 5,301 11) Insomnia SL 2,651 50 1,456 27 843 16 355 7 5,305 12) Felt weak FA 2,155 41 1,672 32 930 18 538 10 5,295 13) Appetite loss AP 3,319 62 908 17 608 11 482 9 5,317 14) Nausea NV 4,035 76 812 15 316 6 150 3 5,313 15) Vomiting NV 4,552 87 437 8 153 3 90 2 5,232 16) Constipation CO 3,212 61 1,089 21 648 12 355 7 5,304 17) Diarrhoea DI 4,284 81 703 13 213 4 97 2 5,297 18) Felt tired FA 1,591 30 2,126 40 1,053 20 515 10 5,285 19) Pain interference PA 3,142 60 1,038 20 669 13 429 8 5,278 20) Concentration CF 3,682 69 999 19 444 8 187 4 5,312 21) Tension EF 2,652 50 1,743 33 672 13 220 4 5,287 22) Worry EF 2,149 41 1,775 34 947 18 428 8 5,299 23) Irritability EF 3,138 59 1,534 29 490 9 137 3 5,299 24) Depression EF 2,790 53 1,578 30 671 13 241 5 5,280 25) Memory trouble CF 2,659 50 1,853 35 615 12 169 3 5,296 26) Family life SF 3,403 65 1,026 20 544 10 282 5 5,255 27) Social activities SF 2,961 56 1,144 22 641 12 512 10 5,258 28) Financial difficulties FI 4,337 82 603 12 236 5 90 2 5,266 1 2 3 4 5 6 7 Total (very poor) (excellent) 29) Overall health QL 197 245 533 1,063 1,050 842 450 4,380 5 6 12 24 24 19 10 30) Overall quality of life QL 254 304 607 1,101 1,190 1,070 718 5,244 5 6 12 21 23 20 14

37
All cancer patients: stage I-II Characteristics of the sample Version of the QLQ-C30 Primary disease site N (%) N (%) v 1.0 1,096 23 Bladder 13 0 v +3 386 8 Bone 3 0 v 2.0 1,437 30 Brain 0 0 v 3.0 1,801 38 Breast 465 10 Total 4,720 Colorectal 230 5 Genito-urinary (other) 6 0 Gynaecological (excluding ovarian) 132 3 Age Head & neck: hypopharynx/larynx 222 5 Head & neck: oral cavity/oropharynx 45 1 N (%) Kidney 2 0 <40 277 6 Leukaemia 48 1 40-49 582 12 Liver/bile 41 1 50-59 1,097 23 Lung 538 11 60-69 1,498 32 Lymphoma 33 1 70-79 1,113 24 Malignant melanoma 223 5 80+ 144 3 Malignant myeloma 295 6 Not known 9 0 Oesophagus/stomach 157 3 Total 4,720 Ovarian 214 5 Pancreas 0 0 Prostate 959 20 Gender Sarcoma 8 0 Testicular 27 1 N (%) Other 714 15 Male 2,705 57 Not known 345 7 Female 1,669 35 Total 4,720 Not known 346 7 Total 4,720 Constructed scales Mean (SD) Median [IQR] Global health status/QoL QL 65.8 (23.4) 66.7 [50-83.3] Physical functioning PF 84.5 (18.7) 93.3 [73.3-100] Role Functioning RF 81.2 (27.5) 100 [66.7-100] Emotional functioning EF 73.5 (23.9) 75 [58.3-91.7] Cognitive functioning CF 84.7 (20.3) 100 [83.3-100] Social functioning SF 81.1 (25.8) 100 [66.7-100] Fatigue FA 26.9 (25.5) 22.2 [0-44.4] Nausea and vomiting NV 5.5 (14.7) 0 [0-0] Pain PA 20.8 (26.6) 16.7 [0-33.3] Dyspnoea DY 18.0 (27) 0 [0-33.3] Insomnia SL 25.4 (30.7) 0 [0-33.3] Appetite loss AP 13.2 (25.8) 0 [0-33.3] Constipation CO 13.2 (24.5) 0 [0-33.3] Diarrhoea DI 8.1 (19.5) 0 [0-0] Financial difficulties FI 14.1 (25.7) 0 [0-33.3]

38
All cancer patients: stage I-II Constructed scales QL N (%) CF N (%) 0 50 1 0 36 1 8.3 20 1 16.7 41 1 16.7 98 3 33.3 141 3 25 59 2 50 279 6 33.3 243 7 66.7 655 14 41.7 166 5 83.3 1,162 25 50 508 14 100 2,356 50 58.3 245 7 Total 4,670 66.7 627 18 75 294 8 83.3 657 19 91.7 173 5 SF N (%) 100 417 12 0 119 3 Total 3,557 16.7 103 2 33.3 232 5 PF N (%) 50 323 7 0 5 0 66.7 737 16 6.7 7 0 83.3 670 14 13.3 2 0 100 2,466 53 20 9 1 Total 4,650 26.7 14 1 33.3 12 1 40 15 1 46.7 39 2 FA N (%) 53.3 59 3 0 1,291 28 60 65 4 11.1 634 14 66.7 102 6 22.2 687 15 73.3 132 7 33.3 818 18 80 193 11 44.4 377 8 86.7 208 12 55.6 299 6 93.3 255 14 66.7 235 5 100 658 37 77.8 112 2 Total 1,775 88.9 109 2 100 81 2 RF N (%) Total 4,643 0 139 4 16.7 75 2 33.3 204 6 50 174 5 NV N (%) 66.7 505 14 0 3,845 82 83.3 458 13 16.7 462 10 100 2,003 56 33.3 215 5 Total 3,558 50 72 2 66.7 47 1 EF N (%) 83.3 21 0 0 45 1 100 25 1 8.3 41 1 Total 4,687 16.7 88 2 25 107 2 33.3 155 3 41.7 209 5 PA N (%) 50 280 6 0 2,220 48 58.3 363 8 16.7 833 18 66.7 531 12 33.3 705 15 75 570 12 50 349 8 83.3 623 14 66.7 279 6 91.7 614 13 83.3 115 3 100 1,003 22 100 136 3 Total 4,629 Total 4,637
39
All cancer patients: stage I-II Single Items Not at all A little Quite a bit Very much Total N (%) N (%) N (%) N (%) N 1) Strenuous activities PF 820 46 541 30 295 16 140 8 1,796 2) Long walk PF 927 52 501 28 250 14 118 7 1,796 3) Short walk PF 1,472 82 240 13 54 3 23 1 1,789 4) Bed or chair PF 1,256 70 369 21 135 8 35 2 1,795 5) Self care PF 1,715 96 50 3 19 1 10 1 1,794 6) Limited in work RF 2,163 60 771 22 418 12 231 6 3,583 7) Limited in leisure RF 2,492 70 604 17 288 8 194 5 3,578 8) Dyspnoea DY 2,937 63 1,155 25 433 9 174 4 4,699 9) Pain PA 2,436 52 1,398 30 621 13 231 5 4,686 10) Need to rest FA 1,909 41 1,757 37 787 17 248 5 4,701 11) Insomnia SL 2,397 51 1,310 28 708 15 284 6 4,699 12) Felt weak FA 2,405 51 1,455 31 577 12 253 5 4,690 13) Appetite loss AP 3,507 75 698 15 324 7 174 4 4,703 14) Nausea NV 3,910 83 563 12 155 3 71 2 4,699 15) Vomiting NV 4,351 93 248 5 65 1 32 1 4,696 16) Constipation CO 3,409 73 832 18 319 7 129 3 4,689 17) Diarrhoea DI 3,838 82 621 13 157 3 70 2 4,686 18) Felt tired FA 1,861 40 1,895 41 698 15 220 5 4,674 19) Pain interference PA 3,027 65 971 21 447 10 220 5 4,665 20) Concentration CF 3,328 71 950 20 321 7 97 2 4,696 21) Tension EF 2,087 45 1,683 36 678 15 228 5 4,676 22) Worry EF 1,587 34 1,722 37 903 19 463 10 4,675 23) Irritability EF 2,571 55 1,482 32 469 10 161 3 4,683 24) Depression EF 2,341 50 1,496 32 597 13 238 5 4,672 25) Memory trouble CF 2,794 60 1,437 31 351 8 96 2 4,678 26) Family life SF 2,963 64 1,084 23 410 9 204 4 4,661 27) Social activities SF 2,873 61 1,075 23 464 10 264 6 4,676 28) Financial difficulties FI 3,368 72 795 17 363 8 151 3 4,677 1 2 3 4 5 6 7 Total (very poor) (excellent) 29) Overall health QL 87 138 372 762 863 842 509 3,573 2 4 10 21 24 24 14 30) Overall quality of life QL 111 182 453 847 988 1,197 867 4,645 2 4 10 18 21 26 19

40
All cancer patients: stage III-IV Characteristics of the sample Version of the QLQ-C30 Primary disease site N (%) N (%) v 1.0 981 12 Bladder 0 0 v +3 555 7 Bone 0 0 v 2.0 3,557 44 Brain 0 0 v 3.0 2,973 37 Breast 377 5 Total 8,066 Colorectal 281 4 Genito-urinary (other) 2 0 Gynaecological (excluding ovarian) 30 0 Age Head & neck: hypopharynx/larynx 210 3 Head & neck: oral cavity/oropharynx 224 3 N (%) Kidney 157 2 <40 379 5 Leukaemia 66 1 40-49 1,075 13 Liver/bile 197 2 50-59 2,030 25 Lung 1,313 16 60-69 2,423 30 Lymphoma 0 0 70-79 1,748 22 Malignant melanoma 585 7 80+ 219 3 Malignant myeloma 647 8 Not known 192 2 Oesophagus/stomach 234 3 Total 8,066 Ovarian 662 8 Pancreas 28 0 Prostate 1,511 19 Gender Sarcoma 1 0 Testicular 0 0 N (%) Other 1,404 17 Male 4,910 61 Not known 137 2 Female 2,483 31 Total 8,066 Not known 673 8 Total 8,066 Constructed scales Mean (SD) Median [IQR] Global health status/QoL QL 61.5 (23.6) 66.7 [50-83.3] Physical functioning PF 71.2 (25.8) 80 [53.3-93.3] Role Functioning RF 70.6 (32.8) 83.3 [50-100] Emotional functioning EF 71.5 (23.8) 75 [58.3-91.7] Cognitive functioning CF 83.2 (21.3) 83.3 [66.7-100] Social functioning SF 75.1 (28.9) 83.3 [66.7-100] Fatigue FA 34.7 (27.9) 33.3 [11.1-55.6] Nausea and vomiting NV 7.8 (17.3) 0 [0-0] Pain PA 29.2 (30.8) 16.7 [0-50] Dyspnoea DY 21.7 (28.7) 0 [0-33.3] Insomnia SL 28.5 (31.7) 33.3 [0-33.3] Appetite loss AP 20.8 (31) 0 [0-33.3] Constipation CO 17.0 (28.4) 0 [0-33.3] Diarrhoea DI 8.3 (19.5) 0 [0-0] Financial difficulties FI 15.4 (27.7) 0 [0-33.3]
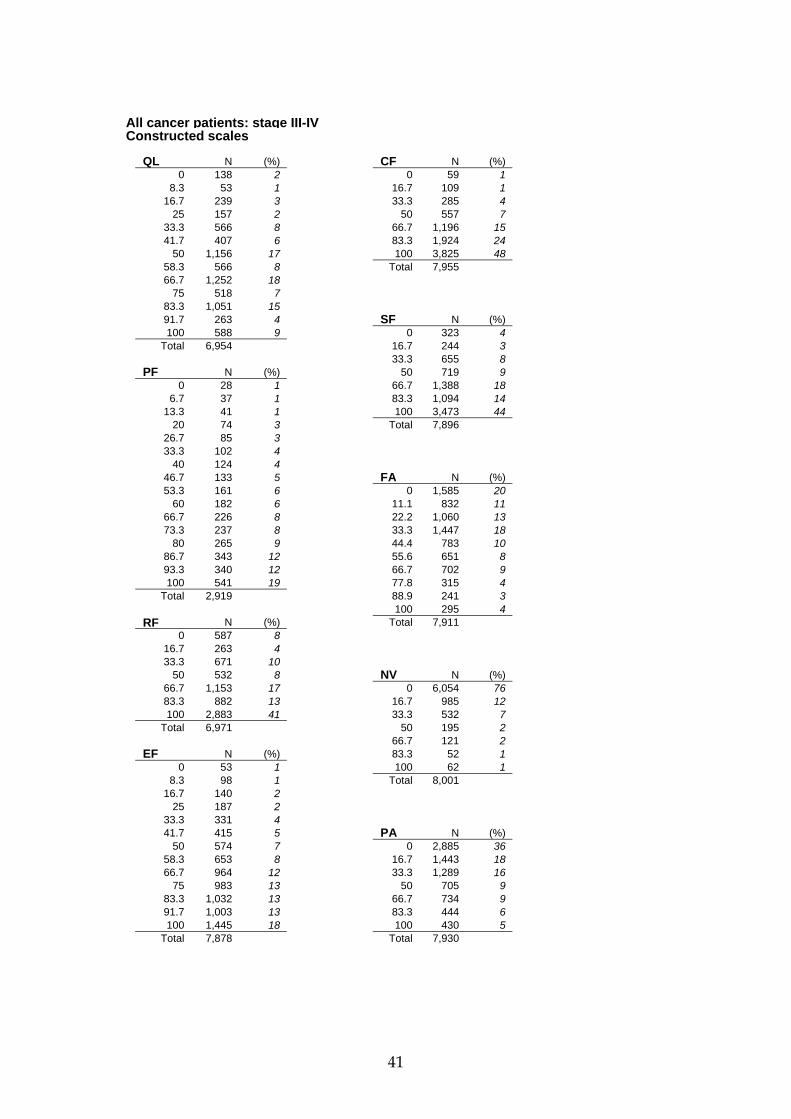
41
All cancer patients: stage III-IV Constructed scales QL N (%) CF N (%) 0 138 2 0 59 1 8.3 53 1 16.7 109 1 16.7 239 3 33.3 285 4 25 157 2 50 557 7 33.3 566 8 66.7 1,196 15 41.7 407 6 83.3 1,924 24 50 1,156 17 100 3,825 48 58.3 566 8 Total 7,955 66.7 1,252 18 75 518 7 83.3 1,051 15 91.7 263 4 SF N (%) 100 588 9 0 323 4 Total 6,954 16.7 244 3 33.3 655 8 PF N (%) 50 719 9 0 28 1 66.7 1,388 18 6.7 37 1 83.3 1,094 14 13.3 41 1 100 3,473 44 20 74 3 Total 7,896 26.7 85 3 33.3 102 4 40 124 4 46.7 133 5 FA N (%) 53.3 161 6 0 1,585 20 60 182 6 11.1 832 11 66.7 226 8 22.2 1,060 13 73.3 237 8 33.3 1,447 18 80 265 9 44.4 783 10 86.7 343 12 55.6 651 8 93.3 340 12 66.7 702 9 100 541 19 77.8 315 4 Total 2,919 88.9 241 3 100 295 4 RF N (%) Total 7,911 0 587 8 16.7 263 4 33.3 671 10 50 532 8 NV N (%) 66.7 1,153 17 0 6,054 76 83.3 882 13 16.7 985 12 100 2,883 41 33.3 532 7 Total 6,971 50 195 2 66.7 121 2 EF N (%) 83.3 52 1 0 53 1 100 62 1 8.3 98 1 Total 8,001 16.7 140 2 25 187 2 33.3 331 4 41.7 415 5 PA N (%) 50 574 7 0 2,885 36 58.3 653 8 16.7 1,443 18 66.7 964 12 33.3 1,289 16 75 983 13 50 705 9 83.3 1,032 13 66.7 734 9 91.7 1,003 13 83.3 444 6 100 1,445 18 100 430 5 Total 7,878 Total 7,930

42
All cancer patients: stage III-IV Single Items Not at all A little Quite a bit Very much Total N (%) N (%) N (%) N (%) N 1) Strenuous activities PF 813 28 810 27 726 25 605 21 2,954 2) Long walk PF 963 33 714 24 612 21 663 23 2,952 3) Short walk PF 1,877 64 610 21 283 10 187 6 2,957 4) Bed or chair PF 1,481 50 725 25 515 17 233 8 2,954 5) Self care PF 2,576 87 230 8 105 4 52 2 2,963 6) Limited in work RF 3,218 46 1,819 26 1,160 17 821 12 7,018 7) Limited in leisure RF 3,706 53 1,571 22 956 14 774 11 7,007 8) Dyspnoea DY 4,484 56 2,207 28 952 12 370 5 8,013 9) Pain PA 3,229 40 2,544 32 1,514 19 721 9 8,008 10) Need to rest FA 2,297 29 3,070 38 1,891 24 753 9 8,011 11) Insomnia SL 3,710 46 2,345 29 1,371 17 585 7 8,011 12) Felt weak FA 3,218 40 2,705 34 1,441 18 657 8 8,021 13) Appetite loss AP 5,012 62 1,579 20 895 11 545 7 8,031 14) Nausea NV 6,200 77 1,253 16 408 5 171 2 8,032 15) Vomiting NV 7,163 89 602 8 168 2 85 1 8,018 16) Constipation CO 5,417 68 1,476 19 699 9 399 5 7,991 17) Diarrhoea DI 6,515 82 1,078 14 291 4 109 1 7,993 18) Felt tired FA 2,531 32 3,233 41 1,574 20 642 8 7,980 19) Pain interference PA 4,277 54 1,864 23 1,130 14 710 9 7,981 20) Concentration CF 5,233 65 1,776 22 743 9 250 3 8,002 21) Tension EF 3,182 40 3,038 38 1,362 17 417 5 7,999 22) Worry EF 2,350 29 3,061 38 1,736 22 851 11 7,998 23) Irritability EF 4,239 53 2,603 33 887 11 252 3 7,981 24) Depression EF 3,736 47 2,718 34 1,134 14 390 5 7,978 25) Memory trouble CF 4,919 62 2,238 28 668 8 162 2 7,987 26) Family life SF 4,593 58 1,887 24 981 12 476 6 7,937 27) Social activities SF 4,009 50 1,984 25 1,237 16 728 9 7,958 28) Financial difficulties FI 5,649 71 1,322 17 591 7 391 5 7,953 1 2 3 4 5 6 7 Total (very poor) (excellent) 29) Overall health QL 216 341 852 1,716 1,784 1,370 702 6,981 3 5 12 25 26 20 10 30) Overall quality of life QL 284 445 1,007 1,674 1,944 1,612 959 7,925 4 6 13 21 25 20 12

43
All cancer patients: recurrent/metastatic Characteristics of the sample Version of the QLQ-C30 Primary disease site N (%) N (%) v 1.0 692 14 Bladder 0 0 v +3 22 1 Bone 1 0 v 2.0 2,088 43 Brain 2 0 v 3.0 2,010 42 Breast 1,147 24 Total 4,812 Colorectal 653 14 Genito-urinary (other) 22 1 Gynaecological (excluding ovarian) 30 1 Age Head & neck: hypopharynx/larynx 0 0 Head & neck: oral cavity/oropharynx 3 0 N (%) Kidney 29 1 <40 563 12 Leukaemia 16 0 40-49 624 13 Liver/bile 148 3 50-59 961 20 Lung 307 6 60-69 1,233 26 Lymphoma 11 0 70-79 946 20 Malignant melanoma 387 8 80+ 196 4 Malignant myeloma 2 0 Not known 289 6 Oesophagus/stomach 642 13 Total 4,812 Ovarian 19 0 Pancreas 188 4 Prostate 640 13 Gender Sarcoma 45 1 Testicular 359 8 N (%) Other 131 3 Male 2,524 53 Not known 30 1 Female 2,131 44 Total 4,812 Not known 157 3 Total 4,812 Stage N (%) Stage I-II 0 0 Stage III-IV 0 0 Recurrent/metastatic 4,812 100 Not known 0 0 Total 4,812 Constructed scales Mean (SD) Median [IQR] Global health status/QoL QL 56.3 (25.6) 58.3 [41.7-75] Physical functioning PF 75.8 (23.1) 80 [66.7-93.3] Role Functioning RF 60.7 (35.1) 66.7 [33.3-100] Emotional functioning EF 68.7 (24.8) 75 [50-91.7] Cognitive functioning CF 80.5 (23.2) 83.3 [66.7-100] Social functioning SF 70.5 (30.7) 83.3 [50-100] Fatigue FA 41.8 (29.4) 33.3 [22.2-66.7] Nausea and vomiting NV 13.1 (22.5) 0 [0-16.7] Pain PA 33.7 (32.4) 33.3 [0-50] Dyspnoea DY 23.4 (30.1) 0 [0-33.3] Insomnia SL 33.6 (33.4) 33.3 [0-66.7] Appetite loss AP 28.2 (34.9) 0 [0-66.7] Constipation CO 23.2 (32.3) 0 [0-33.3] Diarrhoea DI 10.7 (22.4) 0 [0-0] Financial difficulties FI 16.2 (27.7) 0 [0-33.3]
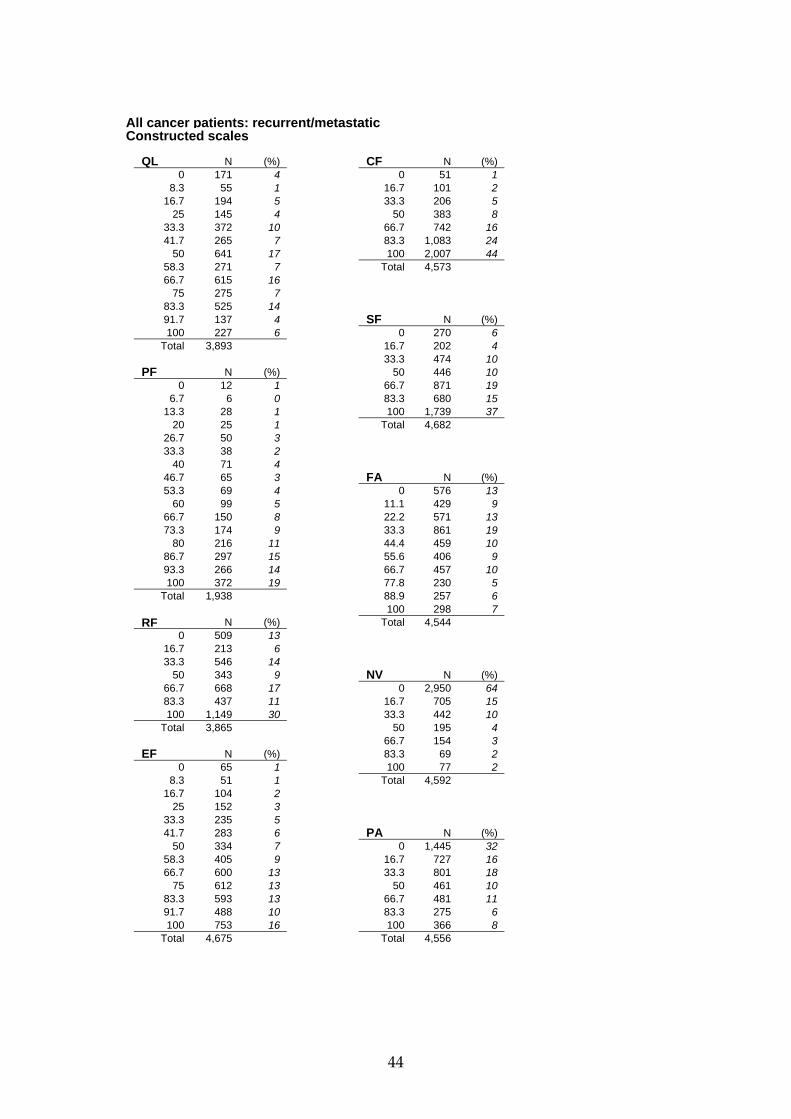
44
All cancer patients: recurrent/metastatic Constructed scales QL N (%) CF N (%) 0 171 4 0 51 1 8.3 55 1 16.7 101 2 16.7 194 5 33.3 206 5 25 145 4 50 383 8 33.3 372 10 66.7 742 16 41.7 265 7 83.3 1,083 24 50 641 17 100 2,007 44 58.3 271 7 Total 4,573 66.7 615 16 75 275 7 83.3 525 14 91.7 137 4 SF N (%) 100 227 6 0 270 6 Total 3,893 16.7 202 4 33.3 474 10 PF N (%) 50 446 10 0 12 1 66.7 871 19 6.7 6 0 83.3 680 15 13.3 28 1 100 1,739 37 20 25 1 Total 4,682 26.7 50 3 33.3 38 2 40 71 4 46.7 65 3 FA N (%) 53.3 69 4 0 576 13 60 99 5 11.1 429 9 66.7 150 8 22.2 571 13 73.3 174 9 33.3 861 19 80 216 11 44.4 459 10 86.7 297 15 55.6 406 9 93.3 266 14 66.7 457 10 100 372 19 77.8 230 5 Total 1,938 88.9 257 6 100 298 7 RF N (%) Total 4,544 0 509 13 16.7 213 6 33.3 546 14 50 343 9 NV N (%) 66.7 668 17 0 2,950 64 83.3 437 11 16.7 705 15 100 1,149 30 33.3 442 10 Total 3,865 50 195 4 66.7 154 3 EF N (%) 83.3 69 2 0 65 1 100 77 2 8.3 51 1 Total 4,592 16.7 104 2 25 152 3 33.3 235 5 41.7 283 6 PA N (%) 50 334 7 0 1,445 32 58.3 405 9 16.7 727 16 66.7 600 13 33.3 801 18 75 612 13 50 461 10 83.3 593 13 66.7 481 11 91.7 488 10 83.3 275 6 100 753 16 100 366 8 Total 4,675 Total 4,556
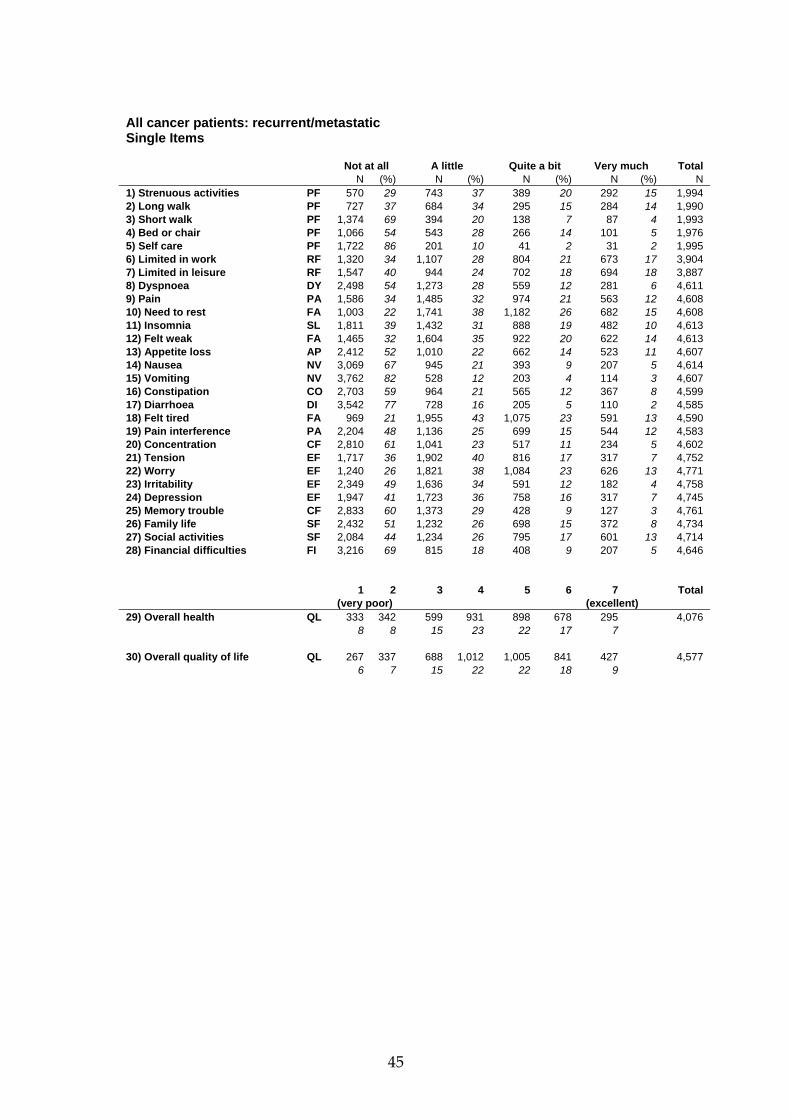
45
All cancer patients: recurrent/metastatic Single Items Not at all A little Quite a bit Very much Total N (%) N (%) N (%) N (%) N 1) Strenuous activities PF 570 29 743 37 389 20 292 15 1,994 2) Long walk PF 727 37 684 34 295 15 284 14 1,990 3) Short walk PF 1,374 69 394 20 138 7 87 4 1,993 4) Bed or chair PF 1,066 54 543 28 266 14 101 5 1,976 5) Self care PF 1,722 86 201 10 41 2 31 2 1,995 6) Limited in work RF 1,320 34 1,107 28 804 21 673 17 3,904 7) Limited in leisure RF 1,547 40 944 24 702 18 694 18 3,887 8) Dyspnoea DY 2,498 54 1,273 28 559 12 281 6 4,611 9) Pain PA 1,586 34 1,485 32 974 21 563 12 4,608 10) Need to rest FA 1,003 22 1,741 38 1,182 26 682 15 4,608 11) Insomnia SL 1,811 39 1,432 31 888 19 482 10 4,613 12) Felt weak FA 1,465 32 1,604 35 922 20 622 14 4,613 13) Appetite loss AP 2,412 52 1,010 22 662 14 523 11 4,607 14) Nausea NV 3,069 67 945 21 393 9 207 5 4,614 15) Vomiting NV 3,762 82 528 12 203 4 114 3 4,607 16) Constipation CO 2,703 59 964 21 565 12 367 8 4,599 17) Diarrhoea DI 3,542 77 728 16 205 5 110 2 4,585 18) Felt tired FA 969 21 1,955 43 1,075 23 591 13 4,590 19) Pain interference PA 2,204 48 1,136 25 699 15 544 12 4,583 20) Concentration CF 2,810 61 1,041 23 517 11 234 5 4,602 21) Tension EF 1,717 36 1,902 40 816 17 317 7 4,752 22) Worry EF 1,240 26 1,821 38 1,084 23 626 13 4,771 23) Irritability EF 2,349 49 1,636 34 591 12 182 4 4,758 24) Depression EF 1,947 41 1,723 36 758 16 317 7 4,745 25) Memory trouble CF 2,833 60 1,373 29 428 9 127 3 4,761 26) Family life SF 2,432 51 1,232 26 698 15 372 8 4,734 27) Social activities SF 2,084 44 1,234 26 795 17 601 13 4,714 28) Financial difficulties FI 3,216 69 815 18 408 9 207 5 4,646 1 2 3 4 5 6 7 Total (very poor) (excellent) 29) Overall health QL 333 342 599 931 898 678 295 4,076 8 8 15 23 22 17 7 30) Overall quality of life QL 267 337 688 1,012 1,005 841 427 4,577 6 7 15 22 22 18 9
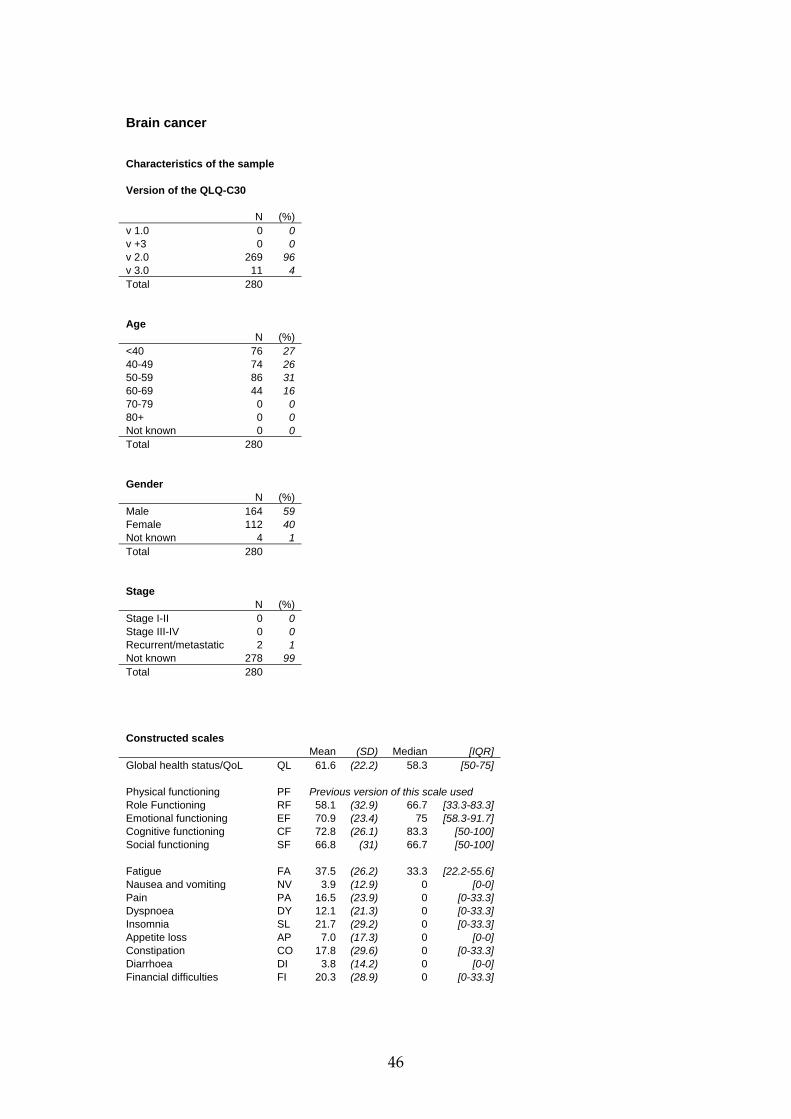
46
Brain cancer Characteristics of the sample Version of the QLQ-C30 N (%) v 1.0 0 0 v +3 0 0 v 2.0 269 96 v 3.0 11 4 Total 280 Age N (%) <40 76 27 40-49 74 26 50-59 86 31 60-69 44 16 70-79 0 0 80+ 0 0 Not known 0 0 Total 280 Gender N (%) Male 164 59 Female 112 40 Not known 4 1 Total 280 Stage N (%) Stage I-II 0 0 Stage III-IV 0 0 Recurrent/metastatic 2 1 Not known 278 99 Total 280 Constructed scales Mean (SD) Median [IQR] Global health status/QoL QL 61.6 (22.2) 58.3 [50-75] Physical functioning PF Previous version of this scale used Role Functioning RF 58.1 (32.9) 66.7 [33.3-83.3] Emotional functioning EF 70.9 (23.4) 75 [58.3-91.7] Cognitive functioning CF 72.8 (26.1) 83.3 [50-100] Social functioning SF 66.8 (31) 66.7 [50-100] Fatigue FA 37.5 (26.2) 33.3 [22.2-55.6] Nausea and vomiting NV 3.9 (12.9) 0 [0-0] Pain PA 16.5 (23.9) 0 [0-33.3] Dyspnoea DY 12.1 (21.3) 0 [0-33.3] Insomnia SL 21.7 (29.2) 0 [0-33.3] Appetite loss AP 7.0 (17.3) 0 [0-0] Constipation CO 17.8 (29.6) 0 [0-33.3] Diarrhoea DI 3.8 (14.2) 0 [0-0] Financial difficulties FI 20.3 (28.9) 0 [0-33.3]
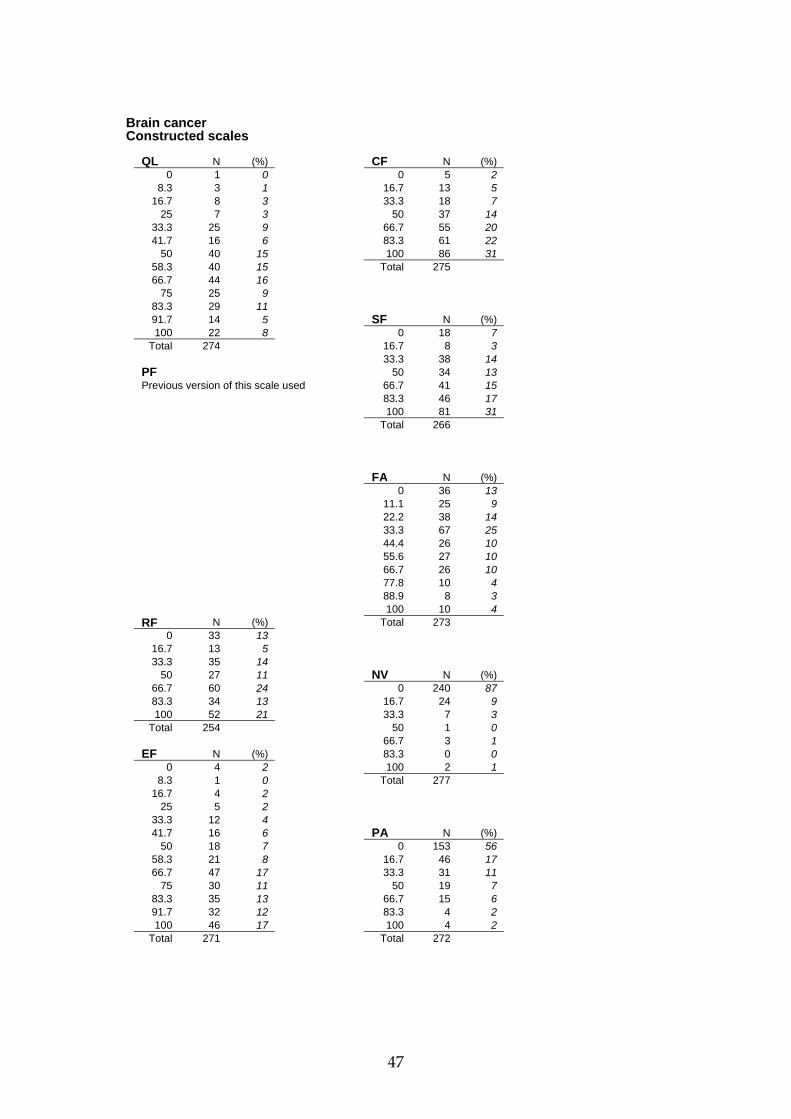
47
Brain cancer Constructed scales QL N (%) CF N (%) 0 1 0 0 5 2 8.3 3 1 16.7 13 5 16.7 8 3 33.3 18 7 25 7 3 50 37 14 33.3 25 9 66.7 55 20 41.7 16 6 83.3 61 22 50 40 15 100 86 31 58.3 40 15 Total 275 66.7 44 16 75 25 9 83.3 29 11 91.7 14 5 SF N (%) 100 22 8 0 18 7 Total 274 16.7 8 3 33.3 38 14 PF 50 34 13 Previous version of this scale used 66.7 41 15 83.3 46 17 100 81 31 Total 266 FA N (%) 0 36 13 11.1 25 9 22.2 38 14 33.3 67 25 44.4 26 10 55.6 27 10 66.7 26 10 77.8 10 4 88.9 8 3 100 10 4 RF N (%) Total 273 0 33 13 16.7 13 5 33.3 35 14 50 27 11 NV N (%) 66.7 60 24 0 240 87 83.3 34 13 16.7 24 9 100 52 21 33.3 7 3 Total 254 50 1 0 66.7 3 1 EF N (%) 83.3 0 0 0 4 2 100 2 1 8.3 1 0 Total 277 16.7 4 2 25 5 2 33.3 12 4 41.7 16 6 PA N (%) 50 18 7 0 153 56 58.3 21 8 16.7 46 17 66.7 47 17 33.3 31 11 75 30 11 50 19 7 83.3 35 13 66.7 15 6 91.7 32 12 83.3 4 2 100 46 17 100 4 2 Total 271 Total 272

48
Brain cancer Single Items Not at all A little Quite a bit Very much Total N (%) N (%) N (%) N (%) N 1) Strenuous activities PF Previous version of this scale used 2) Long walk PF Previous version of this scale used 3) Short walk PF Previous version of this scale used 4) Bed or chair PF Previous version of this scale used 5) Self care PF Previous version of this scale used 6) Limited in work RF 68 26 104 40 49 19 41 16 262 7) Limited in leisure RF 79 30 85 33 51 20 46 18 261 8) Dyspnoea DY 197 71 61 22 15 5 3 1 276 9) Pain PA 172 63 74 27 23 8 6 2 275 10) Need to rest FA 54 20 126 46 66 24 31 11 277 11) Insomnia SL 160 57 68 24 39 14 12 4 279 12) Felt weak FA 95 34 117 42 46 17 19 7 277 13) Appetite loss AP 233 84 34 12 11 4 1 0 279 14) Nausea NV 243 88 24 9 8 3 2 1 277 15) Vomiting NV 268 96 7 3 3 1 2 1 280 16) Constipation CO 189 68 47 17 27 10 16 6 279 17) Diarrhoea DI 255 91 19 7 2 1 3 1 279 18) Felt tired FA 63 23 133 48 62 22 20 7 278 19) Pain interference PA 188 68 52 19 25 9 10 4 275 20) Concentration CF 130 47 89 32 38 14 21 8 278 21) Tension EF 115 42 104 38 41 15 15 6 275 22) Worry EF 68 25 109 39 70 25 31 11 278 23) Irritability EF 137 50 101 37 27 10 12 4 277 24) Depression EF 139 50 90 33 32 12 16 6 277 25) Memory trouble CF 119 43 103 37 39 14 15 5 276 26) Family life SF 125 46 80 29 45 17 22 8 272 27) Social activities SF 104 39 65 24 59 22 40 15 268 28) Financial difficulties FI 166 61 59 22 37 14 11 4 273 1 2 3 4 5 6 7 Total (very poor) (excellent) 29) Overall health QL 5 9 36 69 77 50 30 276 2 3 13 25 28 18 11 30) Overall quality of life QL 7 15 32 68 75 48 31 276 3 5 12 25 27 17 11

49
Breast cancer: all stages Characteristics of the sample Version of the QLQ-C30 N (%) v 1.0 559 20 v +3 95 3 v 2.0 583 21 v 3.0 1,545 56 Total 2,782 Age N (%) <40 246 9 40-49 690 25 50-59 786 28 60-69 523 19 70-79 223 8 80+ 28 1 Not known 286 10 Total 2,782 Gender N (%) Male 0 0 Female 2,782 100 Not known 0 0 Total 2,782 Stage N (%) Stage I-II 464 17 Stage III-IV 376 14 Recurrent/metastatic 1,147 41 Not known 795 29 Total 2,782 Constructed scales Mean (SD) Median [IQR] Global health status/QoL QL 61.8 (24.6) 66.7 [50-83.3] Physical functioning PF 78.4 (21.3) 86.7 [66.7-93.3] Role Functioning RF 70.9 (29.9) 83.3 [50-100] Emotional functioning EF 68.6 (23.8) 75 [50-83.3] Cognitive functioning CF 81.5 (21.8) 83.3 [66.7-100] Social functioning SF 77.0 (27.1) 83.3 [66.7-100] Fatigue FA 33.3 (26.2) 33.3 [11.1-44.4] Nausea and vomiting NV 7.7 (17.3) 0 [0-0] Pain PA 28.7 (28.7) 16.7 [0-50] Dyspnoea DY 18.1 (26.8) 0 [0-33.3] Insomnia SL 29.8 (31.6) 33.3 [0-33.3] Appetite loss AP 18.5 (28.9) 0 [0-33.3] Constipation CO 17.4 (27.2) 0 [0-33.3] Diarrhoea DI 5.9 (15.4) 0 [0-0] Financial difficulties FI 18.3 (27.8) 0 [0-33.3]

50
Breast cancer: all stages Constructed scales QL N (%) CF N (%) 0 65 3 0 17 1 8.3 18 1 16.7 46 2 16.7 70 3 33.3 123 5 25 49 2 50 196 7 33.3 172 8 66.7 467 17 41.7 137 6 83.3 692 25 50 338 15 100 1,198 44 58.3 142 7 Total 2,739 66.7 406 19 75 178 8 83.3 326 15 91.7 88 4 SF N (%) 100 211 10 0 76 3 Total 2,200 16.7 68 3 33.3 226 8 PF N (%) 50 195 7 0 4 0 66.7 534 20 6.7 7 1 83.3 394 15 13.3 12 1 100 1,228 45 20 18 1 Total 2,721 26.7 19 1 33.3 31 2 40 46 3 46.7 44 3 FA N (%) 53.3 46 3 0 471 17 60 66 4 11.1 331 12 66.7 100 7 22.2 440 16 73.3 149 10 33.3 576 21 80 197 13 44.4 247 9 86.7 211 14 55.6 237 9 93.3 256 17 66.7 176 6 100 304 20 77.8 90 3 Total 1,510 88.9 80 3 100 81 3 RF N (%) Total 2,729 0 127 6 16.7 73 3 33.3 209 10 50 203 9 NV N (%) 66.7 451 21 0 2,100 76 83.3 349 16 16.7 331 12 100 781 36 33.3 176 6 Total 2,193 50 65 2 66.7 45 2 EF N (%) 83.3 20 1 0 32 1 100 20 1 8.3 31 1 Total 2,757 16.7 51 2 25 75 3 33.3 120 4 41.7 171 6 PA N (%) 50 220 8 0 871 32 58.3 253 9 16.7 589 22 66.7 370 14 33.3 552 20 75 377 14 50 255 9 83.3 342 13 66.7 221 8 91.7 291 11 83.3 118 4 100 385 14 100 129 5 Total 2,718 Total 2,735

51
Breast cancer: all stages Single Items Not at all A little Quite a bit Very much Total N (%) N (%) N (%) N (%) N 1) Strenuous activities PF 406 27 571 37 333 22 217 14 1,527 2) Long walk PF 693 45 462 30 207 14 172 11 1,534 3) Short walk PF 1,191 77 222 14 81 5 45 3 1,539 4) Bed or chair PF 864 56 410 27 196 13 68 4 1,538 5) Self care PF 1,419 92 89 6 24 2 7 1 1,539 6) Limited in work RF 917 42 694 31 399 18 201 9 2,211 7) Limited in leisure RF 1,117 51 614 28 278 13 190 9 2,199 8) Dyspnoea DY 1,707 62 729 26 223 8 110 4 2,769 9) Pain PA 972 35 1,085 39 503 18 205 7 2,765 10) Need to rest FA 759 28 1,167 42 589 21 248 9 2,763 11) Insomnia SL 1,188 43 903 33 457 17 218 8 2,766 12) Felt weak FA 1,185 43 1,069 39 349 13 160 6 2,763 13) Appetite loss AP 1,791 65 564 20 274 10 142 5 2,771 14) Nausea NV 2,132 77 440 16 135 5 59 2 2,766 15) Vomiting NV 2,482 90 187 7 68 3 27 1 2,764 16) Constipation CO 1,779 65 628 23 244 9 109 4 2,760 17) Diarrhoea DI 2,348 85 344 13 48 2 15 1 2,755 18) Felt tired FA 772 28 1,259 46 510 19 214 8 2,755 19) Pain interference PA 1,453 53 759 28 335 12 201 7 2,748 20) Concentration CF 1,715 62 672 24 271 10 100 4 2,758 21) Tension EF 870 32 1,175 43 545 20 162 6 2,752 22) Worry EF 690 25 1,104 40 654 24 312 11 2,760 23) Irritability EF 1,386 50 944 34 323 12 104 4 2,757 24) Depression EF 1,051 38 1,132 41 420 15 141 5 2,744 25) Memory trouble CF 1,575 57 877 32 227 8 69 3 2,748 26) Family life SF 1,605 59 705 26 315 12 117 4 2,742 27) Social activities SF 1,409 52 736 27 400 15 188 7 2,733 28) Financial difficulties FI 1,708 63 615 23 263 10 114 4 2,700 1 2 3 4 5 6 7 Total (very poor) (excellent) 29) Overall health QL 87 98 271 519 576 407 247 2,205 4 4 12 24 26 19 11 30) Overall quality of life QL 111 135 341 564 607 614 382 2,754 4 5 12 21 22 22 14

52
Breast cancer: <50 Characteristics of the sample Version of the QLQ-C30 N (%) v 1.0 89 10 v +3 41 4 v 2.0 261 28 v 3.0 545 58 Total 936 Age N (%) <40 246 26 40-49 690 74 50-59 0 0 60-69 0 0 70-79 0 0 80+ 0 0 Not known 0 0 Total 936 Gender N (%) Male 0 0 Female 936 100 Not known 0 0 Total 936 Stage N (%) Stage I-II 217 23 Stage III-IV 135 14 Recurrent/metastatic 289 31 Not known 295 32 Total 936 Constructed scales Mean (SD) Median [IQR] Global health status/QoL QL 61.3 (24.5) 66.7 [50-83.3] Physical functioning PF 81.8 (19) 86.7 [73.3-100] Role Functioning RF 72.2 (28.1) 83.3 [50-100] Emotional functioning EF 65.5 (24.5) 66.7 [50-83.3] Cognitive functioning CF 80.4 (22.1) 83.3 [66.7-100] Social functioning SF 76.0 (27.5) 83.3 [66.7-100] Fatigue FA 30.7 (24.6) 33.3 [11.1-44.4] Nausea and vomiting NV 6.1 (14.6) 0 [0-0] Pain PA 24.8 (27) 16.7 [0-33.3] Dyspnoea DY 14.3 (23.9) 0 [0-33.3] Insomnia SL 30.0 (31.7) 33.3 [0-66.7] Appetite loss AP 16.0 (26.3) 0 [0-33.3] Constipation CO 15.4 (24.7) 0 [0-33.3] Diarrhoea DI 5.7 (14.2) 0 [0-0] Financial difficulties FI 22.9 (30) 0 [0-33.3]

53
Breast cancer: <50 Constructed scales QL N (%) CF N (%) 0 25 3 0 7 1 8.3 5 1 16.7 16 2 16.7 37 4 33.3 43 5 25 15 2 50 71 8 33.3 64 8 66.7 178 19 41.7 50 6 83.3 230 25 50 127 15 100 383 41 58.3 49 6 Total 928 66.7 171 20 75 72 9 83.3 122 15 91.7 29 3 SF N (%) 100 75 9 0 33 4 Total 841 16.7 22 2 33.3 77 8 PF N (%) 50 59 6 0 1 0 66.7 196 21 6.7 1 0 83.3 146 16 13.3 4 1 100 391 42 20 2 0 Total 924 26.7 1 0 33.3 11 2 40 13 2 46.7 13 2 FA N (%) 53.3 10 2 0 174 19 60 21 4 11.1 123 13 66.7 22 4 22.2 144 16 73.3 58 11 33.3 210 23 80 72 14 44.4 87 9 86.7 87 16 55.6 76 8 93.3 83 16 66.7 46 5 100 136 25 77.8 29 3 Total 535 88.9 20 2 100 17 2 RF N (%) Total 926 0 33 4 16.7 25 3 33.3 81 10 50 80 10 NV N (%) 66.7 185 22 0 742 80 83.3 141 17 16.7 95 10 100 294 35 33.3 54 6 Total 839 50 22 2 66.7 11 1 EF N (%) 83.3 3 0 0 10 1 100 2 0 8.3 17 2 Total 929 16.7 33 4 25 24 3 33.3 49 5 41.7 62 7 PA N (%) 50 77 8 0 331 36 58.3 89 10 16.7 225 24 66.7 134 15 33.3 166 18 75 133 14 50 81 9 83.3 101 11 66.7 59 6 91.7 88 10 83.3 27 3 100 104 11 100 34 4 Total 921 Total 923

54
Breast cancer: <50 Single Items Not at all A little Quite a bit Very much Total N (%) N (%) N (%) N (%) N 1) Strenuous activities PF 172 32 199 37 113 21 55 10 539 2) Long walk PF 278 51 164 30 66 12 34 6 542 3) Short walk PF 442 82 68 13 25 5 7 1 542 4) Bed or chair PF 327 61 138 26 54 10 21 4 540 5) Self care PF 512 94 28 5 3 1 1 0 544 6) Limited in work RF 359 43 279 33 141 17 64 8 843 7) Limited in leisure RF 412 49 262 31 113 14 53 6 840 8) Dyspnoea DY 639 68 211 23 65 7 20 2 935 9) Pain PA 365 39 374 40 146 16 47 5 932 10) Need to rest FA 278 30 403 43 177 19 71 8 929 11) Insomnia SL 400 43 292 31 167 18 70 8 929 12) Felt weak FA 424 46 364 39 108 12 35 4 931 13) Appetite loss AP 632 68 181 19 93 10 27 3 933 14) Nausea NV 751 81 133 14 39 4 10 1 933 15) Vomiting NV 856 92 50 5 21 2 3 0 930 16) Constipation CO 617 66 222 24 70 8 23 3 932 17) Diarrhoea DI 788 85 126 14 13 1 2 0 929 18) Felt tired FA 290 31 417 45 174 19 51 6 932 19) Pain interference PA 545 59 242 26 84 9 55 6 926 20) Concentration CF 532 57 237 25 124 13 38 4 931 21) Tension EF 258 28 412 44 196 21 65 7 931 22) Worry EF 208 22 353 38 225 24 146 16 932 23) Irritability EF 413 44 335 36 136 15 46 5 930 24) Depression EF 321 35 400 43 150 16 56 6 927 25) Memory trouble CF 548 59 285 31 82 9 16 2 931 26) Family life SF 508 55 262 28 111 12 49 5 930 27) Social activities SF 473 51 264 29 118 13 71 8 926 28) Financial difficulties FI 506 56 233 26 123 14 49 5 911 1 2 3 4 5 6 7 Total (very poor) (excellent) 29) Overall health QL 33 46 101 184 237 155 85 841 4 6 12 22 28 18 10 30) Overall quality of life QL 37 51 98 181 221 218 124 930 4 6 11 20 24 23 13

55
Breast cancer: 50-59 Characteristics of the sample Version of the QLQ-C30 N (%) v 1.0 96 12 v +3 25 3 v 2.0 145 18 v 3.0 520 66 Total 786 Age N (%) <40 0 0 40-49 0 0 50-59 786 100 60-69 0 0 70-79 0 0 80+ 0 0 Not known 0 0 Total 786 Gender N (%) Male 0 0 Female 786 100 Not known 0 0 Total 786 Stage N (%) Stage I-II 140 18 Stage III-IV 109 14 Recurrent/metastatic 267 34 Not known 270 34 Total 786 Constructed scales Mean (SD) Median [IQR] Global health status/QoL QL 63.3 (24.4) 66.7 [50-83.3] Physical functioning PF 78.5 (21.5) 86.7 [66.7-93.3] Role Functioning RF 70.3 (30.5) 66.7 [50-100] Emotional functioning EF 70.5 (22.3) 75 [58.3-91.7] Cognitive functioning CF 82.4 (21.2) 83.3 [66.7-100] Social functioning SF 78.2 (26.5) 83.3 [66.7-100] Fatigue FA 32.6 (27) 33.3 [11.1-44.4] Nausea and vomiting NV 7.3 (16.8) 0 [0-0] Pain PA 28.8 (28.8) 16.7 [0-33.3] Dyspnoea DY 17.8 (26.7) 0 [0-33.3] Insomnia SL 30.1 (31.9) 33.3 [0-33.3] Appetite loss AP 16.5 (27.9) 0 [0-33.3] Constipation CO 15.4 (26.2) 0 [0-33.3] Diarrhoea DI 5.5 (14.3) 0 [0-0] Financial difficulties FI 18.8 (27.4) 0 [0-33.3]

56
Breast cancer: 50-59 Constructed scales QL N (%) CF N (%) 0 14 2 0 2 0 8.3 9 1 16.7 14 2 16.7 17 3 33.3 32 4 25 20 3 50 53 7 33.3 48 7 66.7 121 16 41.7 39 6 83.3 202 26 50 101 15 100 346 45 58.3 47 7 Total 770 66.7 126 18 75 49 7 83.3 105 15 91.7 39 6 SF N (%) 100 70 10 0 18 2 Total 684 16.7 18 2 33.3 59 8 PF N (%) 50 61 8 0 0 0 66.7 140 18 6.7 4 1 83.3 108 14 13.3 4 1 100 363 47 20 8 2 Total 767 26.7 12 2 33.3 9 2 40 9 2 46.7 10 2 FA N (%) 53.3 17 3 0 147 19 60 27 5 11.1 106 14 66.7 28 6 22.2 106 14 73.3 49 10 33.3 166 22 80 70 14 44.4 61 8 86.7 70 14 55.6 57 7 93.3 91 18 66.7 48 6 100 102 20 77.8 27 4 Total 510 88.9 27 4 100 24 3 RF N (%) Total 769 0 47 7 16.7 17 3 33.3 67 10 50 65 10 NV N (%) 66.7 149 22 0 606 77 83.3 91 13 16.7 86 11 100 249 36 33.3 52 7 Total 685 50 18 2 66.7 10 1 EF N (%) 83.3 6 1 0 6 1 100 5 1 8.3 4 1 Total 783 16.7 7 1 25 24 3 33.3 29 4 41.7 44 6 PA N (%) 50 56 7 0 245 32 58.3 75 10 16.7 155 20 66.7 108 14 33.3 184 24 75 106 14 50 65 8 83.3 111 15 66.7 52 7 91.7 90 12 83.3 34 4 100 108 14 100 41 5 Total 768 Total 776

57
Breast cancer: 50-59 Single Items Not at all A little Quite a bit Very much Total N (%) N (%) N (%) N (%) N 1) Strenuous activities PF 135 26 188 37 108 21 82 16 513 2) Long walk PF 242 47 151 29 69 13 56 11 518 3) Short walk PF 414 80 59 11 25 5 20 4 518 4) Bed or chair PF 287 55 150 29 63 12 19 4 519 5) Self care PF 475 91 31 6 12 2 2 0 520 6) Limited in work RF 284 41 211 31 124 18 70 10 689 7) Limited in leisure RF 348 51 186 27 87 13 64 9 685 8) Dyspnoea DY 487 62 201 26 63 8 30 4 781 9) Pain PA 276 35 327 42 115 15 66 8 784 10) Need to rest FA 238 30 316 40 158 20 70 9 782 11) Insomnia SL 333 43 259 33 124 16 66 8 782 12) Felt weak FA 322 41 310 40 100 13 50 6 782 13) Appetite loss AP 536 68 147 19 65 8 37 5 785 14) Nausea NV 616 79 116 15 35 5 18 2 785 15) Vomiting NV 704 90 60 8 12 2 8 1 784 16) Constipation CO 532 68 165 21 51 7 31 4 779 17) Diarrhoea DI 664 86 99 13 12 2 2 0 777 18) Felt tired FA 246 32 344 44 128 17 58 8 776 19) Pain interference PA 390 50 239 31 89 11 60 8 778 20) Concentration CF 500 64 192 25 62 8 24 3 778 21) Tension EF 249 32 341 44 153 20 32 4 775 22) Worry EF 206 26 327 42 188 24 58 7 779 23) Irritability EF 420 54 258 33 79 10 22 3 779 24) Depression EF 307 40 328 42 108 14 35 5 778 25) Memory trouble CF 443 57 253 33 54 7 23 3 773 26) Family life SF 479 62 184 24 78 10 31 4 772 27) Social activities SF 400 52 204 26 121 16 47 6 772 28) Financial difficulties FI 460 61 200 26 66 9 32 4 758 1 2 3 4 5 6 7 Total (very poor) (excellent) 29) Overall health QL 22 31 78 161 170 134 89 685 3 5 11 24 25 20 13 30) Overall quality of life QL 20 35 95 147 175 173 129 774 3 5 12 19 23 22 17

58
Breast cancer: 60-69 Characteristics of the sample Version of the QLQ-C30 N (%) v 1.0 70 13 v +3 24 5 v 2.0 124 24 v 3.0 305 58 Total 523 Age N (%) <40 0 0 40-49 0 0 50-59 0 0 60-69 523 100 70-79 0 0 80+ 0 0 Not known 0 0 Total 523 Gender N (%) Male 0 0 Female 523 100 Not known 0 0 Total 523 Stage N (%) Stage I-II 77 15 Stage III-IV 73 14 Recurrent/metastatic 193 37 Not known 180 34 Total 523 Constructed scales Mean (SD) Median [IQR] Global health status/QoL QL 62.2 (24.4) 66.7 [50-83.3] Physical functioning PF 76.9 (21.6) 80 [66.7-93.3] Role Functioning RF 71.0 (31.1) 83.3 [50-100] Emotional functioning EF 71.0 (23.4) 75 [50-91.7] Cognitive functioning CF 82.6 (21.1) 83.3 [66.7-100] Social functioning SF 81.5 (25) 100 [66.7-100] Fatigue FA 33.4 (26.1) 33.3 [11.1-44.4] Nausea and vomiting NV 7.6 (18.3) 0 [0-0] Pain PA 28.7 (29.5) 16.7 [0-50] Dyspnoea DY 19.0 (28.5) 0 [0-33.3] Insomnia SL 28.1 (32.3) 33.3 [0-33.3] Appetite loss AP 17.6 (28.5) 0 [0-33.3] Constipation CO 17.4 (27.4) 0 [0-33.3] Diarrhoea DI 6.2 (17.5) 0 [0-0] Financial difficulties FI 14.3 (25.5) 0 [0-33.3]

59
Breast cancer: 60-69 Constructed scales QL N (%) CF N (%) 0 15 3 0 3 1 8.3 4 1 16.7 5 1 16.7 7 2 33.3 23 5 25 10 2 50 34 7 33.3 34 8 66.7 88 17 41.7 34 8 83.3 126 24 50 64 14 100 237 46 58.3 35 8 Total 516 66.7 73 16 75 37 8 83.3 74 17 91.7 16 4 SF N (%) 100 42 9 0 6 1 Total 445 16.7 11 2 33.3 34 7 PF N (%) 50 37 7 0 2 1 66.7 83 16 6.7 0 0 83.3 58 11 13.3 2 1 100 278 55 20 4 1 Total 507 26.7 3 1 33.3 7 2 40 10 3 46.7 13 4 FA N (%) 53.3 11 4 0 84 16 60 12 4 11.1 63 12 66.7 28 9 22.2 95 18 73.3 25 8 33.3 95 18 80 36 12 44.4 51 10 86.7 40 13 55.6 49 10 93.3 54 18 66.7 32 6 100 51 17 77.8 13 3 Total 298 88.9 18 4 100 15 3 RF N (%) Total 515 0 27 6 16.7 24 5 33.3 36 8 50 40 9 NV N (%) 66.7 79 18 0 402 78 83.3 71 16 16.7 60 12 100 169 38 33.3 27 5 Total 446 50 9 2 66.7 8 2 EF N (%) 83.3 4 1 0 2 0 100 7 1 8.3 5 1 Total 517 16.7 5 1 25 14 3 33.3 21 4 41.7 37 7 PA N (%) 50 49 10 0 173 34 58.3 40 8 16.7 101 20 66.7 48 9 33.3 97 19 75 70 14 50 50 10 83.3 66 13 66.7 40 8 91.7 62 12 83.3 24 5 100 90 18 100 26 5 Total 509 Total 511

60
Breast cancer: 60-69 Single Items Not at all A little Quite a bit Very much Total N (%) N (%) N (%) N (%) N 1) Strenuous activities PF 68 23 119 40 69 23 45 15 301 2) Long walk PF 127 42 94 31 38 13 43 14 302 3) Short walk PF 232 76 46 15 20 7 7 2 305 4) Bed or chair PF 168 55 77 25 44 15 15 5 304 5) Self care PF 281 92 18 6 4 1 2 1 305 6) Limited in work RF 192 43 131 29 85 19 43 10 451 7) Limited in leisure RF 239 53 114 25 49 11 46 10 448 8) Dyspnoea DY 316 61 139 27 32 6 31 6 518 9) Pain PA 190 37 190 37 98 19 39 8 517 10) Need to rest FA 137 26 226 44 115 22 42 8 520 11) Insomnia SL 241 46 170 33 59 11 50 10 520 12) Felt weak FA 232 45 196 38 57 11 35 7 520 13) Appetite loss AP 345 66 108 21 42 8 28 5 523 14) Nausea NV 407 78 75 15 24 5 13 3 519 15) Vomiting NV 471 90 30 6 11 2 9 2 521 16) Constipation CO 338 65 114 22 47 9 21 4 520 17) Diarrhoea DI 448 86 51 10 14 3 6 1 519 18) Felt tired FA 139 27 241 46 95 18 45 9 520 19) Pain interference PA 276 54 133 26 65 13 41 8 515 20) Concentration CF 348 67 121 23 39 8 12 2 520 21) Tension EF 181 35 200 39 109 21 28 5 518 22) Worry EF 153 29 198 38 121 23 48 9 520 23) Irritability EF 279 54 166 32 61 12 13 3 519 24) Depression EF 224 44 194 38 80 16 16 3 514 25) Memory trouble CF 287 55 168 32 50 10 13 3 518 26) Family life SF 337 66 112 22 53 10 10 2 512 27) Social activities SF 308 60 110 22 70 14 23 5 511 28) Financial difficulties FI 362 72 84 17 47 9 13 3 506 1 2 3 4 5 6 7 Total (very poor) (excellent) 29) Overall health QL 20 13 56 107 114 90 48 448 5 3 13 24 25 20 11 30) Overall quality of life QL 23 17 61 109 106 126 74 516 5 3 12 21 21 24 14

61
Breast cancer: ≥70 Characteristics of the sample Version of the QLQ-C30 N (%) v 1.0 18 7 v +3 5 2 v 2.0 53 21 v 3.0 175 70 Total 251 Age N (%) <40 0 0 40-49 0 0 50-59 0 0 60-69 0 0 70-79 223 89 80+ 28 11 Not known 0 0 Total 251 Gender N (%) Male 0 0 Female 251 100 Not known 0 0 Total 251 Stage N (%) Stage I-II 30 12 Stage III-IV 59 24 Recurrent/metastatic 112 45 Not known 50 20 Total 251 Constructed scales Mean (SD) Median [IQR] Global health status/QoL QL 58.2 (25.6) 58.3 [41.7-75] Physical functioning PF 69.5 (23.9) 73.3 [53.3-93.3] Role Functioning RF 67.8 (32.1) 83.3 [50-100] Emotional functioning EF 73.5 (24.8) 75 [58.3-91.7] Cognitive functioning CF 81.0 (23.5) 83.3 [66.7-100] Social functioning SF 81.7 (22.9) 83.3 [66.7-100] Fatigue FA 36.4 (28.7) 33.3 [11.1-55.6] Nausea and vomiting NV 7.0 (17.9) 0 [0-0] Pain PA 31.9 (29.7) 33.3 [0-50] Dyspnoea DY 18.1 (27.4) 0 [0-33.3] Insomnia SL 27.3 (31.4) 33.3 [0-66.7] Appetite loss AP 22.5 (33.5) 0 [0-33.3] Constipation CO 23.3 (31.1) 0 [0-33.3] Diarrhoea DI 6.8 (18) 0 [0-0] Financial difficulties FI 9.8 (19.6) 0 [0-0]

62
Breast cancer: ≥70 Constructed scales QL N (%) CF N (%) 0 11 5 0 4 2 8.3 0 0 16.7 5 2 16.7 9 4 33.3 13 5 25 4 2 50 15 6 33.3 26 11 66.7 31 13 41.7 14 6 83.3 73 30 50 46 20 100 106 43 58.3 11 5 Total 247 66.7 36 16 75 20 9 83.3 25 11 91.7 4 2 SF N (%) 100 24 10 0 3 1 Total 230 16.7 2 1 33.3 13 5 PF N (%) 50 17 7 0 1 1 66.7 48 20 6.7 2 1 83.3 40 17 13.3 2 1 100 120 49 20 4 2 Total 243 26.7 3 2 33.3 4 2 40 14 8 46.7 8 5 FA N (%) 53.3 8 5 0 44 18 60 6 4 11.1 20 8 66.7 22 13 22.2 38 16 73.3 17 10 33.3 50 21 80 19 11 44.4 19 8 86.7 14 8 55.6 23 10 93.3 28 17 66.7 22 9 100 15 9 77.8 5 2 Total 167 88.9 6 3 100 16 7 RF N (%) Total 243 0 20 9 16.7 7 3 33.3 25 11 50 18 8 NV N (%) 66.7 38 17 0 198 80 83.3 46 21 16.7 28 11 100 69 31 33.3 9 4 Total 223 50 5 2 66.7 3 1 EF N (%) 83.3 4 2 0 5 2 100 2 1 8.3 1 0 Total 249 16.7 1 0 25 9 4 33.3 8 3 41.7 12 5 PA N (%) 50 15 6 0 70 28 58.3 21 9 16.7 51 21 66.7 23 10 33.3 46 19 75 29 12 50 28 11 83.3 30 12 66.7 27 11 91.7 30 12 83.3 12 5 100 59 24 100 13 5 Total 243 Total 247

63
Breast cancer: ≥70 Single Items Not at all A little Quite a bit Very much Total N (%) N (%) N (%) N (%) N 1) Strenuous activities PF 31 18 65 37 43 25 35 20 174 2) Long walk PF 46 27 53 31 34 20 39 23 172 3) Short walk PF 103 59 49 28 11 6 11 6 174 4) Bed or chair PF 82 47 45 26 35 20 13 7 175 5) Self care PF 151 89 12 7 5 3 2 1 170 6) Limited in work RF 82 36 73 32 49 22 24 11 228 7) Limited in leisure RF 118 52 52 23 29 13 27 12 226 8) Dyspnoea DY 158 64 56 23 26 10 9 4 249 9) Pain PA 86 35 81 33 58 23 23 9 248 10) Need to rest FA 64 26 93 38 63 26 27 11 247 11) Insomnia SL 123 49 63 25 50 20 14 6 250 12) Felt weak FA 95 39 89 36 39 16 24 10 247 13) Appetite loss AP 155 62 45 18 26 10 24 10 250 14) Nausea NV 202 81 33 13 6 2 8 3 249 15) Vomiting NV 227 91 13 5 7 3 3 1 250 16) Constipation CO 142 57 55 22 37 15 15 6 249 17) Diarrhoea DI 211 84 31 12 4 2 4 2 250 18) Felt tired FA 66 27 112 45 42 17 29 12 249 19) Pain interference PA 120 48 68 27 44 18 17 7 249 20) Concentration CF 175 70 46 18 17 7 11 4 249 21) Tension EF 113 46 87 35 35 14 13 5 248 22) Worry EF 82 33 86 34 55 22 27 11 250 23) Irritability EF 156 63 67 27 17 7 9 4 249 24) Depression EF 118 48 75 30 40 16 14 6 247 25) Memory trouble CF 129 52 84 34 21 9 14 6 248 26) Family life SF 167 67 54 22 20 8 7 3 248 27) Social activities SF 136 56 69 28 28 12 11 5 244 28) Financial difficulties FI 190 77 41 17 14 6 1 0 246 1 2 3 4 5 6 7 Total (very poor) (excellent) 29) Overall health QL 12 8 36 67 55 28 25 231 5 4 16 29 24 12 11 30) Overall quality of life QL 14 10 35 59 47 46 37 248 6 4 14 24 19 19 15

64
Breast cancer: stage I-II Characteristics of the sample Version of the QLQ-C30 N (%) v 1.0 66 14 v +3 58 13 v 2.0 81 18 v 3.0 259 56 Total 464 Age N (%) <40 50 11 40-49 167 36 50-59 140 30 60-69 77 17 70-79 28 6 80+ 2 0 Not known 0 0 Total 464 Gender N (%) Male 0 0 Female 464 100 Not known 0 0 Total 464 Constructed scales Mean (SD) Median [IQR] Global health status/QoL QL 64.6 (22.7) 66.7 [50-83.3] Physical functioning PF 83.2 (14.7) 83.3 [73.3-93.3] Role Functioning RF 78.9 (22.8) 83.3 [66.7-100] Emotional functioning EF 72.5 (21.6) 75 [58.3-91.7] Cognitive functioning CF 84.1 (18.7) 83.3 [66.7-100] Social functioning SF 83.7 (21.1) 100 [66.7-100] Fatigue FA 25.8 (21.8) 22.2 [0-33.3] Nausea and vomiting NV 3.6 (11.8) 0 [0-0] Pain PA 19.4 (20.9) 16.7 [0-33.3] Dyspnoea DY 11.6 (20) 0 [0-33.3] Insomnia SL 24.8 (28.9) 33.3 [0-33.3] Appetite loss AP 10.7 (21.2) 0 [0-0] Constipation CO 12.8 (21.1) 0 [0-33.3] Diarrhoea DI 6.2 (14.7) 0 [0-0] Financial difficulties FI 16.0 (24.4) 0 [0-33.3]

65
Breast cancer: stage I-II Constructed scales QL N (%) CF N (%) 0 5 1 0 1 0 8.3 1 0 16.7 3 1 16.7 13 3 33.3 12 3 25 7 2 50 28 6 33.3 27 7 66.7 78 17 41.7 25 6 83.3 129 28 50 51 13 100 207 45 58.3 27 7 Total 458 66.7 70 18 75 48 12 83.3 66 17 91.7 18 5 SF N (%) 100 35 9 0 5 1 Total 393 16.7 3 1 33.3 15 3 PF N (%) 50 18 4 0 0 0 66.7 113 25 6.7 0 0 83.3 64 14 13.3 0 0 100 240 52 20 0 0 Total 458 26.7 0 0 33.3 4 2 40 1 0 46.7 4 2 FA N (%) 53.3 4 2 0 115 25 60 10 4 11.1 64 14 66.7 14 6 22.2 62 14 73.3 36 14 33.3 113 25 80 55 22 44.4 40 9 86.7 32 13 55.6 33 7 93.3 34 13 66.7 19 4 100 62 24 77.8 7 2 Total 256 88.9 5 1 100 1 0 RF N (%) Total 459 0 6 2 16.7 3 1 33.3 21 5 50 24 6 NV N (%) 66.7 118 30 0 404 88 83.3 57 14 16.7 34 7 100 166 42 33.3 11 2 Total 395 50 6 1 66.7 2 0 EF N (%) 83.3 2 0 0 1 0 100 1 0 8.3 4 1 Total 460 16.7 4 1 25 10 2 33.3 12 3 41.7 27 6 PA N (%) 50 29 6 0 186 40 58.3 42 9 16.7 106 23 66.7 65 14 33.3 112 24 75 69 15 50 33 7 83.3 69 15 66.7 16 4 91.7 43 10 83.3 4 1 100 80 18 100 4 1 Total 455 Total 461

66
Breast cancer: stage I-II Single Items Not at all A little Quite a bit Very much Total N (%) N (%) N (%) N (%) N 1) Strenuous activities PF 81 31 115 45 50 19 12 5 258 2) Long walk PF 116 45 107 42 27 11 7 3 257 3) Short walk PF 219 85 34 13 6 2 0 0 259 4) Bed or chair PF 129 50 98 38 27 10 5 2 259 5) Self care PF 253 98 6 2 0 0 0 0 259 6) Limited in work RF 192 49 125 32 67 17 12 3 396 7) Limited in leisure RF 240 61 114 29 32 8 9 2 395 8) Dyspnoea DY 330 71 111 24 19 4 4 1 464 9) Pain PA 206 45 199 43 49 11 9 2 463 10) Need to rest FA 165 36 210 46 76 17 10 2 461 11) Insomnia SL 226 49 152 33 63 14 22 5 463 12) Felt weak FA 209 45 208 45 39 8 7 2 463 13) Appetite loss AP 354 77 74 16 31 7 4 1 463 14) Nausea NV 409 88 39 8 10 2 5 1 463 15) Vomiting NV 443 96 12 3 4 1 2 0 461 16) Constipation CO 316 68 120 26 20 4 6 1 462 17) Diarrhoea DI 384 83 72 16 4 1 2 0 462 18) Felt tired FA 182 39 205 44 61 13 14 3 462 19) Pain interference PA 283 61 148 32 27 6 4 1 462 20) Concentration CF 317 69 112 24 29 6 5 1 463 21) Tension EF 158 34 194 42 90 20 18 4 460 22) Worry EF 130 28 202 44 101 22 27 6 460 23) Irritability EF 267 58 150 33 33 7 9 2 459 24) Depression EF 184 40 201 44 60 13 16 4 461 25) Memory trouble CF 251 55 168 37 31 7 8 2 458 26) Family life SF 282 62 141 31 29 6 6 1 458 27) Social activities SF 275 60 143 31 33 7 9 2 460 28) Financial difficulties FI 297 64 116 25 39 9 9 2 461 1 2 3 4 5 6 7 Total (very poor) (excellent) 29) Overall health QL 11 11 43 103 107 81 38 394 3 3 11 26 27 21 10 30) Overall quality of life QL 9 16 45 79 80 137 93 459 2 4 10 17 17 30 20
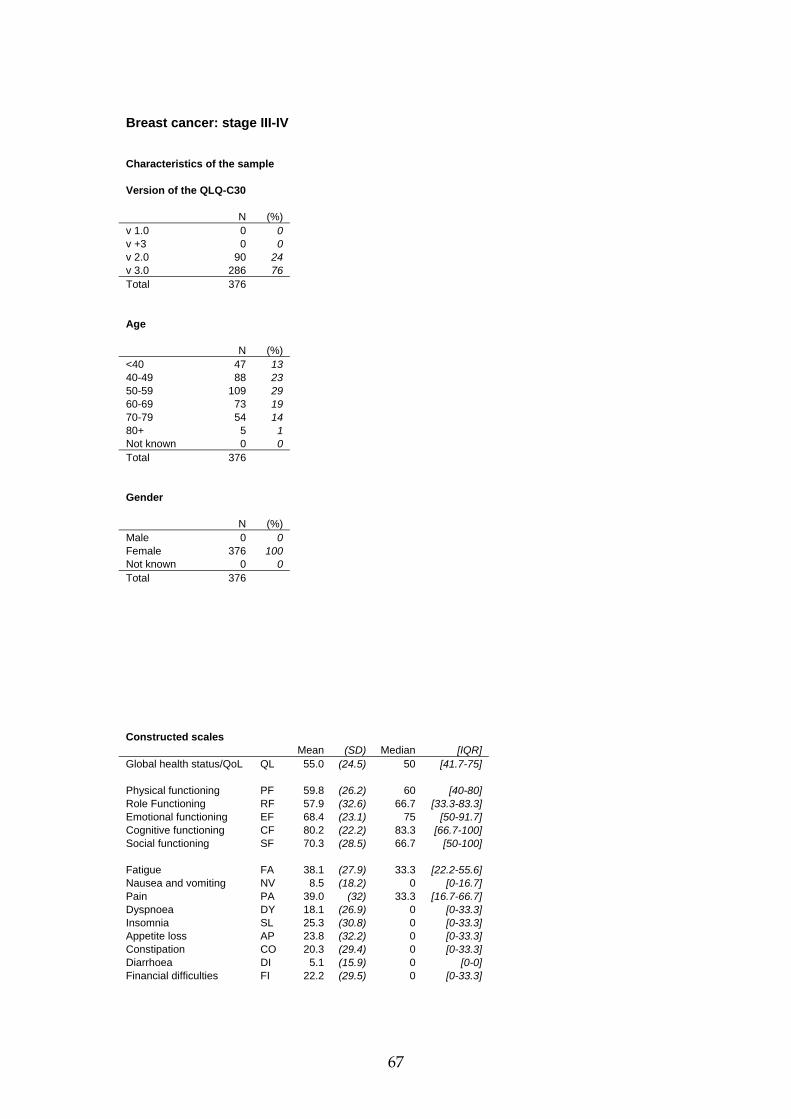
67
Breast cancer: stage III-IV Characteristics of the sample Version of the QLQ-C30 N (%) v 1.0 0 0 v +3 0 0 v 2.0 90 24 v 3.0 286 76 Total 376 Age N (%) <40 47 13 40-49 88 23 50-59 109 29 60-69 73 19 70-79 54 14 80+ 5 1 Not known 0 0 Total 376 Gender N (%) Male 0 0 Female 376 100 Not known 0 0 Total 376 Constructed scales Mean (SD) Median [IQR] Global health status/QoL QL 55.0 (24.5) 50 [41.7-75] Physical functioning PF 59.8 (26.2) 60 [40-80] Role Functioning RF 57.9 (32.6) 66.7 [33.3-83.3] Emotional functioning EF 68.4 (23.1) 75 [50-91.7] Cognitive functioning CF 80.2 (22.2) 83.3 [66.7-100] Social functioning SF 70.3 (28.5) 66.7 [50-100] Fatigue FA 38.1 (27.9) 33.3 [22.2-55.6] Nausea and vomiting NV 8.5 (18.2) 0 [0-16.7] Pain PA 39.0 (32) 33.3 [16.7-66.7] Dyspnoea DY 18.1 (26.9) 0 [0-33.3] Insomnia SL 25.3 (30.8) 0 [0-33.3] Appetite loss AP 23.8 (32.2) 0 [0-33.3] Constipation CO 20.3 (29.4) 0 [0-33.3] Diarrhoea DI 5.1 (15.9) 0 [0-0] Financial difficulties FI 22.2 (29.5) 0 [0-33.3]

68
Breast cancer: stage III-IV Constructed scales QL N (%) CF N (%) 0 12 3 0 0 0 8.3 5 1 16.7 9 2 16.7 22 6 33.3 28 8 25 11 3 50 16 4 33.3 39 11 66.7 63 17 41.7 32 9 83.3 110 30 50 72 20 100 146 39 58.3 21 6 Total 372 66.7 60 16 75 25 7 83.3 40 11 91.7 8 2 SF N (%) 100 22 6 0 11 3 Total 369 16.7 11 3 33.3 48 13 PF N (%) 50 56 15 0 2 1 66.7 69 19 6.7 7 3 83.3 42 11 13.3 8 3 100 134 36 20 12 4 Total 371 26.7 13 5 33.3 23 8 40 20 7 46.7 17 6 FA N (%) 53.3 19 7 0 51 14 60 22 8 11.1 41 11 66.7 23 8 22.2 48 13 73.3 29 10 33.3 80 22 80 20 7 44.4 34 9 86.7 23 8 55.6 44 12 93.3 27 10 66.7 27 7 100 16 6 77.8 13 4 Total 281 88.9 11 3 100 22 6 RF N (%) Total 371 0 52 14 16.7 14 4 33.3 46 12 50 47 13 NV N (%) 66.7 87 23 0 279 75 83.3 58 16 16.7 47 13 100 68 18 33.3 24 6 Total 372 50 10 3 66.7 6 2 EF N (%) 83.3 7 2 0 4 1 100 1 0 8.3 3 1 Total 374 16.7 4 1 25 9 2 33.3 13 4 41.7 31 8 PA N (%) 50 44 12 0 76 20 58.3 39 10 16.7 79 21 66.7 33 9 33.3 67 18 75 58 16 50 43 12 83.3 41 11 66.7 46 12 91.7 47 13 83.3 29 8 100 48 13 100 34 9 Total 374 Total 374

69
Breast cancer: stage III-IV Single Items Not at all A little Quite a bit Very much Total N (%) N (%) N (%) N (%) N 1) Strenuous activities PF 34 12 75 27 85 30 88 31 282 2) Long walk PF 63 22 59 21 57 20 104 37 283 3) Short walk PF 134 47 76 27 47 17 28 10 285 4) Bed or chair PF 57 20 101 36 85 30 41 14 284 5) Self care PF 238 83 28 10 16 6 4 1 286 6) Limited in work RF 84 23 129 35 81 22 79 21 373 7) Limited in leisure RF 137 37 120 32 58 16 59 16 374 8) Dyspnoea DY 231 62 98 26 30 8 15 4 374 9) Pain PA 95 25 142 38 89 24 50 13 376 10) Need to rest FA 75 20 144 39 108 29 45 12 372 11) Insomnia SL 194 52 102 27 57 15 23 6 376 12) Felt weak FA 124 33 158 42 60 16 34 9 376 13) Appetite loss AP 215 57 84 22 47 13 30 8 376 14) Nausea NV 282 75 63 17 19 5 11 3 375 15) Vomiting NV 330 88 32 9 11 3 2 1 375 16) Constipation CO 224 60 90 24 37 10 21 6 372 17) Diarrhoea DI 330 89 33 9 6 2 4 1 373 18) Felt tired FA 114 31 150 40 67 18 43 12 374 19) Pain interference PA 144 39 104 28 72 19 54 14 374 20) Concentration CF 215 58 107 29 37 10 15 4 374 21) Tension EF 110 29 164 44 88 24 12 3 374 22) Worry EF 105 28 124 33 110 29 36 10 375 23) Irritability EF 204 54 109 29 46 12 16 4 375 24) Depression EF 132 35 158 42 70 19 15 4 375 25) Memory trouble CF 215 58 110 30 36 10 11 3 372 26) Family life SF 195 53 87 24 73 20 16 4 371 27) Social activities SF 150 40 103 28 80 21 40 11 373 28) Financial difficulties FI 204 55 112 30 32 9 24 7 372 1 2 3 4 5 6 7 Total (very poor) (excellent) 29) Overall health QL 16 33 67 93 91 47 23 370 4 9 18 25 25 13 6 30) Overall quality of life QL 20 29 54 86 79 66 36 370 5 8 15 23 21 18 10
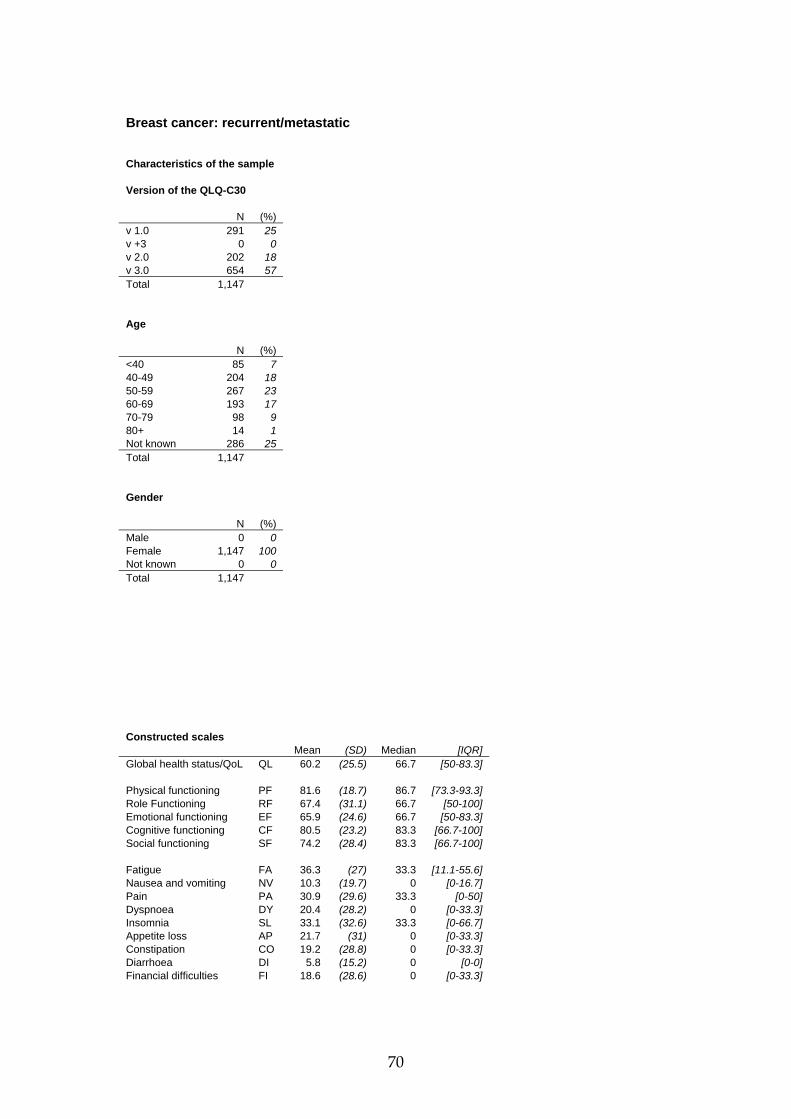
70
Breast cancer: recurrent/metastatic Characteristics of the sample Version of the QLQ-C30 N (%) v 1.0 291 25 v +3 0 0 v 2.0 202 18 v 3.0 654 57 Total 1,147 Age N (%) <40 85 7 40-49 204 18 50-59 267 23 60-69 193 17 70-79 98 9 80+ 14 1 Not known 286 25 Total 1,147 Gender N (%) Male 0 0 Female 1,147 100 Not known 0 0 Total 1,147 Constructed scales Mean (SD) Median [IQR] Global health status/QoL QL 60.2 (25.5) 66.7 [50-83.3] Physical functioning PF 81.6 (18.7) 86.7 [73.3-93.3] Role Functioning RF 67.4 (31.1) 66.7 [50-100] Emotional functioning EF 65.9 (24.6) 66.7 [50-83.3] Cognitive functioning CF 80.5 (23.2) 83.3 [66.7-100] Social functioning SF 74.2 (28.4) 83.3 [66.7-100] Fatigue FA 36.3 (27) 33.3 [11.1-55.6] Nausea and vomiting NV 10.3 (19.7) 0 [0-16.7] Pain PA 30.9 (29.6) 33.3 [0-50] Dyspnoea DY 20.4 (28.2) 0 [0-33.3] Insomnia SL 33.1 (32.6) 33.3 [0-66.7] Appetite loss AP 21.7 (31) 0 [0-33.3] Constipation CO 19.2 (28.8) 0 [0-33.3] Diarrhoea DI 5.8 (15.2) 0 [0-0] Financial difficulties FI 18.6 (28.6) 0 [0-33.3]

71
Breast cancer: recurrent/metastatic Constructed scales QL N (%) CF N (%) 0 38 5 0 9 1 8.3 8 1 16.7 25 2 16.7 26 3 33.3 53 5 25 21 3 50 102 9 33.3 73 9 66.7 188 17 41.7 44 5 83.3 244 22 50 127 15 100 505 45 58.3 55 7 Total 1,126 66.7 170 20 75 61 7 83.3 114 14 91.7 37 4 SF N (%) 100 73 9 0 42 4 Total 847 16.7 34 3 33.3 110 10 PF N (%) 50 81 7 0 1 0 66.7 226 20 6.7 0 0 83.3 179 16 13.3 4 1 100 449 40 20 5 1 Total 1,121 26.7 5 1 33.3 2 0 40 20 3 46.7 20 3 FA N (%) 53.3 14 2 0 152 14 60 19 3 11.1 131 12 66.7 41 6 22.2 189 17 73.3 58 9 33.3 231 21 80 79 12 44.4 107 10 86.7 104 16 55.6 100 9 93.3 130 20 66.7 75 7 100 137 21 77.8 47 4 Total 639 88.9 44 4 100 44 4 RF N (%) Total 1,120 0 55 7 16.7 41 5 33.3 99 12 50 88 11 NV N (%) 66.7 154 18 0 786 69 83.3 144 17 16.7 162 14 100 260 31 33.3 99 9 Total 841 50 36 3 66.7 28 3 EF N (%) 83.3 10 1 0 20 2 100 12 1 8.3 12 1 Total 1,133 16.7 30 3 25 39 4 33.3 59 5 41.7 74 7 PA N (%) 50 83 7 0 337 30 58.3 116 10 16.7 213 19 66.7 162 15 33.3 240 21 75 153 14 50 113 10 83.3 138 12 66.7 105 9 91.7 95 9 83.3 53 5 100 135 12 100 61 5 Total 1,116 Total 1,122

72
Breast cancer: recurrent/metastatic Single Items Not at all A little Quite a bit Very much Total N (%) N (%) N (%) N (%) N 1) Strenuous activities PF 186 29 267 41 131 20 67 10 651 2) Long walk PF 317 49 216 33 72 11 45 7 650 3) Short walk PF 533 82 85 13 19 3 15 2 652 4) Bed or chair PF 416 64 149 23 68 11 17 3 650 5) Self care PF 593 91 49 8 6 1 2 0 650 6) Limited in work RF 304 36 290 34 172 20 87 10 853 7) Limited in leisure RF 393 47 229 27 134 16 87 10 843 8) Dyspnoea DY 663 58 318 28 108 9 55 5 1,144 9) Pain PA 359 32 440 39 241 21 97 9 1,137 10) Need to rest FA 276 24 480 42 257 23 129 11 1,142 11) Insomnia SL 436 38 387 34 203 18 113 10 1,139 12) Felt weak FA 465 41 430 38 154 14 86 8 1,135 13) Appetite loss AP 684 60 248 22 131 12 77 7 1,140 14) Nausea NV 799 70 226 20 80 7 32 3 1,137 15) Vomiting NV 982 86 98 9 40 4 16 1 1,136 16) Constipation CO 711 63 253 22 118 10 56 5 1,138 17) Diarrhoea DI 964 85 142 13 18 2 6 1 1,130 18) Felt tired FA 253 22 535 47 237 21 107 10 1,132 19) Pain interference PA 576 51 313 28 149 13 92 8 1,130 20) Concentration CF 666 59 270 24 141 12 58 5 1,135 21) Tension EF 312 28 510 45 226 20 85 8 1,133 22) Worry EF 230 20 459 40 283 25 163 14 1,135 23) Irritability EF 533 47 402 35 148 13 51 5 1,134 24) Depression EF 412 37 453 40 189 17 73 7 1,127 25) Memory trouble CF 679 60 329 29 94 8 28 3 1,130 26) Family life SF 615 54 318 28 136 12 64 6 1,133 27) Social activities SF 534 48 306 27 186 17 97 9 1,123 28) Financial difficulties FI 693 64 231 21 112 10 51 5 1,087 1 2 3 4 5 6 7 Total (very poor) (excellent) 29) Overall health QL 46 36 108 192 229 145 93 849 5 4 13 23 27 17 11 30) Overall quality of life QL 63 66 151 234 277 219 128 1,138 6 6 13 21 24 19 11

73
Colorectal cancer: all stages Characteristics of the sample Version of the QLQ-C30 N (%) v 1.0 0 0 v +3 45 3 v 2.0 1,158 65 v 3.0 570 32 Total 1,773 Age N (%) <40 62 4 40-49 209 12 50-59 456 26 60-69 633 36 70-79 374 21 80+ 39 2 Not known 0 0 Total 1,773 Gender N (%) Male 1,023 58 Female 687 39 Not known 63 4 Total 1,773 Stage N (%) Stage I-II 230 13 Stage III-IV 281 16 Recurrent/metastatic 653 37 Not known 609 34 Total 1,773 Constructed scales Mean (SD) Median [IQR] Global health status/QoL QL 60.7 (23.4) 66.7 [50-83.3] Physical functioning PF 79.2 (21.1) 86.7 [66.7-100] Role Functioning RF 70.4 (32.8) 83.3 [50-100] Emotional functioning EF 68.9 (24.5) 75 [50-91.7] Cognitive functioning CF 85.2 (20.4) 100 [83.3-100] Social functioning SF 76.0 (28.6) 83.3 [66.7-100] Fatigue FA 34.7 (28.4) 33.3 [11.1-55.6] Nausea and vomiting NV 7.3 (17.2) 0 [0-0] Pain PA 24.0 (29.6) 16.7 [0-33.3] Dyspnoea DY 17.4 (26.3) 0 [0-33.3] Insomnia SL 30.5 (32.6) 33.3 [0-66.7] Appetite loss AP 19.1 (30.2) 0 [0-33.3] Constipation CO 15.8 (27.9) 0 [0-33.3] Diarrhoea DI 16.6 (27.6) 0 [0-33.3] Financial difficulties FI 13.6 (26.3) 0 [0-33.3]

74
Colorectal cancer: all stages Constructed scales QL N (%) CF N (%) 0 44 3 0 11 1 8.3 14 1 16.7 22 1 16.7 48 3 33.3 44 3 25 35 2 50 112 6 33.3 142 8 66.7 244 14 41.7 104 6 83.3 383 22 50 318 18 100 936 53 58.3 123 7 Total 1,752 66.7 335 19 75 125 7 83.3 256 15 91.7 50 3 SF N (%) 100 133 8 0 65 4 Total 1,727 16.7 58 3 33.3 125 7 PF N (%) 50 155 9 0 0 0 66.7 297 17 6.7 1 0 83.3 235 14 13.3 2 0 100 785 46 20 3 1 Total 1,720 26.7 12 2 33.3 16 3 40 12 2 46.7 22 4 FA N (%) 53.3 24 4 0 349 20 60 26 5 11.1 183 11 66.7 34 6 22.2 223 13 73.3 46 8 33.3 328 19 80 59 11 44.4 154 9 86.7 79 14 55.6 133 8 93.3 81 15 66.7 131 8 100 142 25 77.8 86 5 Total 559 88.9 57 3 100 68 4 RF N (%) Total 1,712 0 139 8 16.7 61 4 33.3 189 11 50 126 7 NV N (%) 66.7 257 15 0 1,355 78 83.3 230 14 16.7 201 12 100 695 41 33.3 99 6 Total 1,697 50 34 2 66.7 26 2 EF N (%) 83.3 16 1 0 16 1 100 13 1 8.3 25 2 Total 1,744 16.7 42 2 25 53 3 33.3 91 5 41.7 89 5 PA N (%) 50 120 7 0 789 46 58.3 150 9 16.7 272 16 66.7 230 13 33.3 284 17 75 221 13 50 108 6 83.3 231 13 66.7 124 7 91.7 198 12 83.3 56 3 100 256 15 100 90 5 Total 1,722 Total 1,723

75
Colorectal cancer: all stages Single Items Not at all A little Quite a bit Very much Total N (%) N (%) N (%) N (%) N 1) Strenuous activities PF 197 35 173 31 112 20 85 15 567 2) Long walk PF 243 43 150 27 96 17 77 14 566 3) Short walk PF 423 75 97 17 35 6 11 2 566 4) Bed or chair PF 355 63 129 23 66 12 16 3 566 5) Self care PF 539 95 22 4 7 1 0 0 568 6) Limited in work RF 771 45 475 28 296 17 183 11 1,725 7) Limited in leisure RF 911 53 356 21 251 15 194 11 1,712 8) Dyspnoea DY 1,109 63 417 24 170 10 52 3 1,748 9) Pain PA 853 49 521 30 237 14 133 8 1,744 10) Need to rest FA 552 32 652 37 374 21 169 10 1,747 11) Insomnia SL 772 44 499 29 336 19 144 8 1,751 12) Felt weak FA 676 39 588 34 333 19 153 9 1,750 13) Appetite loss AP 1,142 65 329 19 174 10 110 6 1,755 14) Nausea NV 1,383 79 233 13 93 5 46 3 1,755 15) Vomiting NV 1,608 92 90 5 32 2 23 1 1,753 16) Constipation CO 1,221 70 304 17 132 8 87 5 1,744 17) Diarrhoea DI 1,174 67 366 21 127 7 85 5 1,752 18) Felt tired FA 532 31 727 42 341 20 145 8 1,745 19) Pain interference PA 1,062 61 372 21 183 11 128 7 1,745 20) Concentration CF 1,230 70 341 19 144 8 46 3 1,761 21) Tension EF 702 40 676 39 267 15 108 6 1,753 22) Worry EF 404 23 634 36 405 23 303 17 1,746 23) Irritability EF 919 53 600 34 182 10 49 3 1,750 24) Depression EF 761 44 561 32 295 17 134 8 1,751 25) Memory trouble CF 1,146 65 453 26 126 7 33 2 1,758 26) Family life SF 997 58 434 25 207 12 97 6 1,735 27) Social activities SF 919 53 425 24 235 14 163 9 1,742 28) Financial difficulties FI 1,278 74 253 15 121 7 69 4 1,721 1 2 3 4 5 6 7 Total (very poor) (excellent) 29) Overall health QL 57 61 210 452 471 320 164 1,735 3 4 12 26 27 18 10 30) Overall quality of life QL 65 82 213 399 443 345 186 1,733 4 5 12 23 26 20 11

76
Colorectal cancer: males Characteristics of the sample Version of the QLQ-C30 N (%) v 1.0 0 0 v +3 30 3 v 2.0 668 65 v 3.0 325 32 Total 1,023 Age N (%) <40 35 3 40-49 98 10 50-59 264 26 60-69 402 39 70-79 208 20 80+ 16 2 Not known 0 0 Total 1,023 Stage N (%) Stage I-II 112 11 Stage III-IV 169 17 Recurrent/metastatic 352 34 Not known 390 38 Total 1,023 Constructed scales Mean (SD) Median [IQR] Global health status/QoL QL 62.1 (23) 66.7 [50-83.3] Physical functioning PF 83.0 (18.4) 86.7 [73.3-100] Role Functioning RF 72.3 (32.2) 83.3 [50-100] Emotional functioning EF 70.8 (24.1) 75 [58.3-91.7] Cognitive functioning CF 86.7 (19.4) 100 [83.3-100] Social functioning SF 76.7 (28.2) 83.3 [66.7-100] Fatigue FA 30.9 (26.7) 33.3 [11.1-44.4] Nausea and vomiting NV 5.4 (15) 0 [0-0] Pain PA 22.3 (28.4) 16.7 [0-33.3] Dyspnoea DY 16.1 (25.2) 0 [0-33.3] Insomnia SL 27.9 (31.7) 33.3 [0-33.3] Appetite loss AP 16.4 (28.2) 0 [0-33.3] Constipation CO 14.3 (26.4) 0 [0-33.3] Diarrhoea DI 15.8 (27) 0 [0-33.3] Financial difficulties FI 14.4 (26.8) 0 [0-33.3]

77
Colorectal cancer: males Constructed scales QL N (%) CF N (%) 0 23 2 0 5 1 8.3 8 1 16.7 9 1 16.7 25 3 33.3 20 2 25 20 2 50 67 7 33.3 69 7 66.7 116 12 41.7 55 6 83.3 219 22 50 175 18 100 574 57 58.3 73 7 Total 1,010 66.7 210 21 75 74 7 83.3 160 16 91.7 24 2 SF N (%) 100 84 8 0 36 4 Total 1,000 16.7 28 3 33.3 75 8 PF N (%) 50 85 9 0 0 0 66.7 172 17 6.7 1 0 83.3 131 13 13.3 0 0 100 466 47 20 0 0 Total 993 26.7 4 1 33.3 5 2 40 5 2 46.7 9 3 FA N (%) 53.3 9 3 0 230 23 60 12 4 11.1 118 12 66.7 21 7 22.2 135 14 73.3 26 8 33.3 199 20 80 30 9 44.4 92 9 86.7 48 15 55.6 71 7 93.3 60 19 66.7 57 6 100 89 28 77.8 33 3 Total 319 88.9 33 3 100 24 2 RF N (%) Total 992 0 74 8 16.7 31 3 33.3 101 10 50 68 7 NV N (%) 66.7 143 15 0 836 83 83.3 142 14 16.7 101 10 100 425 43 33.3 37 4 Total 984 50 14 1 66.7 13 1 EF N (%) 83.3 5 1 0 7 1 100 6 1 8.3 11 1 Total 1,012 16.7 23 2 25 27 3 33.3 50 5 41.7 49 5 PA N (%) 50 64 6 0 476 48 58.3 81 8 16.7 158 16 66.7 131 13 33.3 165 17 75 125 13 50 57 6 83.3 135 14 66.7 71 7 91.7 123 12 83.3 26 3 100 172 17 100 43 4 Total 998 Total 996

78
Colorectal cancer: males Single Items Not at all A little Quite a bit Very much Total N (%) N (%) N (%) N (%) N 1) Strenuous activities PF 128 39 101 31 63 19 33 10 325 2) Long walk PF 153 47 94 29 49 15 27 8 323 3) Short walk PF 266 82 45 14 11 3 3 1 325 4) Bed or chair PF 219 68 70 22 27 8 5 2 321 5) Self care PF 313 97 7 2 4 1 0 0 324 6) Limited in work RF 481 48 268 27 154 16 92 9 995 7) Limited in leisure RF 544 55 203 21 141 14 103 10 991 8) Dyspnoea DY 660 65 238 24 88 9 25 3 1,011 9) Pain PA 520 52 293 29 127 13 68 7 1,008 10) Need to rest FA 366 36 381 38 186 18 76 8 1,009 11) Insomnia SL 482 48 288 28 172 17 73 7 1,015 12) Felt weak FA 425 42 350 35 171 17 69 7 1,015 13) Appetite loss AP 701 69 174 17 88 9 49 5 1,012 14) Nausea NV 850 84 112 11 35 3 19 2 1,016 15) Vomiting NV 952 94 41 4 15 2 9 1 1,017 16) Constipation CO 728 72 172 17 67 7 42 4 1,009 17) Diarrhoea DI 695 69 202 20 74 7 44 4 1,015 18) Felt tired FA 350 35 437 43 160 16 61 6 1,008 19) Pain interference PA 632 63 215 21 100 10 62 6 1,009 20) Concentration CF 732 72 189 19 73 7 23 2 1,017 21) Tension EF 447 44 371 37 142 14 53 5 1,013 22) Worry EF 255 25 377 37 227 23 151 15 1,010 23) Irritability EF 530 52 356 35 104 10 24 2 1,014 24) Depression EF 487 48 301 30 165 16 61 6 1,014 25) Memory trouble CF 699 69 237 23 60 6 17 2 1,013 26) Family life SF 566 57 265 27 118 12 51 5 1,000 27) Social activities SF 553 55 233 23 137 14 84 8 1,007 28) Financial difficulties FI 723 73 153 15 77 8 41 4 994 1 2 3 4 5 6 7 Total (very poor) (excellent) 29) Overall health QL 27 33 109 247 293 196 98 1,003 3 3 11 25 29 20 10 30) Overall quality of life QL 35 44 108 226 270 206 114 1,003 4 4 11 23 27 21 11

79
Colorectal cancer: females Characteristics of the sample Version of the QLQ-C30 N (%) v 1.0 0 0 v +3 15 2 v 2.0 490 71 v 3.0 182 27 Total 687 Age N (%) <40 23 3 40-49 99 14 50-59 169 25 60-69 216 31 70-79 157 23 80+ 23 3 Not known 0 0 Total 687 Stage N (%) Stage I-II 118 17 Stage III-IV 112 16 Recurrent/metastatic 238 35 Not known 219 32 Total 687 Constructed scales Mean (SD) Median [IQR] Global health status/QoL QL 58.8 (23.6) 58.3 [41.7-75] Physical functioning PF 75.2 (23.1) 80 [60-93.3] Role Functioning RF 68.4 (33.2) 83.3 [50-100] Emotional functioning EF 65.7 (24.5) 66.7 [50-83.3] Cognitive functioning CF 83.7 (21.4) 100 [66.7-100] Social functioning SF 75.8 (29) 83.3 [66.7-100] Fatigue FA 39.1 (29.5) 33.3 [11.1-66.7] Nausea and vomiting NV 9.6 (19.6) 0 [0-16.7] Pain PA 25.8 (30.5) 16.7 [0-33.3] Dyspnoea DY 18.5 (27.3) 0 [0-33.3] Insomnia SL 34.5 (33.1) 33.3 [0-66.7] Appetite loss AP 23.2 (32.6) 0 [0-33.3] Constipation CO 18.8 (30.4) 0 [0-33.3] Diarrhoea DI 16.7 (27.8) 0 [0-33.3] Financial difficulties FI 12.2 (25.4) 0 [0-0]

80
Colorectal cancer: females Constructed scales QL N (%) CF N (%) 0 20 3 0 6 1 8.3 5 1 16.7 11 2 16.7 18 3 33.3 21 3 25 15 2 50 36 5 33.3 66 10 66.7 117 17 41.7 46 7 83.3 146 22 50 133 20 100 342 50 58.3 48 7 Total 679 66.7 113 17 75 43 7 83.3 90 14 91.7 24 4 SF N (%) 100 43 7 0 26 4 Total 664 16.7 27 4 33.3 47 7 PF N (%) 50 57 9 0 0 0 66.7 112 17 6.7 0 0 83.3 92 14 13.3 2 1 100 303 46 20 2 1 Total 664 26.7 6 3 33.3 6 3 40 6 3 46.7 9 5 FA N (%) 53.3 8 5 0 109 17 60 10 6 11.1 64 10 66.7 10 6 22.2 81 12 73.3 16 9 33.3 118 18 80 21 12 44.4 60 9 86.7 25 14 55.6 57 9 93.3 17 10 66.7 67 10 100 40 23 77.8 46 7 Total 178 88.9 15 2 100 41 6 RF N (%) Total 658 0 56 9 16.7 27 4 33.3 79 12 50 54 8 NV N (%) 66.7 99 15 0 483 72 83.3 88 14 16.7 86 13 100 248 38 33.3 57 9 Total 651 50 16 2 66.7 10 2 EF N (%) 83.3 11 2 0 7 1 100 7 1 8.3 12 2 Total 670 16.7 18 3 25 26 4 33.3 40 6 41.7 36 5 PA N (%) 50 54 8 0 290 44 58.3 65 10 16.7 101 15 66.7 88 13 33.3 112 17 75 91 14 50 48 7 83.3 90 14 66.7 46 7 91.7 67 10 83.3 29 4 100 67 10 100 38 6 Total 661 Total 664

81
Colorectal cancer: females Single Items Not at all A little Quite a bit Very much Total N (%) N (%) N (%) N (%) N 1) Strenuous activities PF 54 30 55 31 35 20 35 20 179 2) Long walk PF 69 38 45 25 34 19 32 18 180 3) Short walk PF 119 67 37 21 15 8 7 4 178 4) Bed or chair PF 102 56 47 26 25 14 8 4 182 5) Self care PF 168 92 11 6 3 2 0 0 182 6) Limited in work RF 268 40 191 29 129 19 79 12 667 7) Limited in leisure RF 344 52 134 20 101 15 80 12 659 8) Dyspnoea DY 417 62 164 24 68 10 25 4 674 9) Pain PA 310 46 207 31 101 15 55 8 673 10) Need to rest FA 173 26 252 37 170 25 80 12 675 11) Insomnia SL 257 38 200 30 152 23 64 10 673 12) Felt weak FA 232 35 221 33 142 21 77 12 672 13) Appetite loss AP 400 59 144 21 78 12 58 9 680 14) Nausea NV 497 74 105 16 51 8 23 3 676 15) Vomiting NV 599 89 47 7 14 2 14 2 674 16) Constipation CO 444 66 122 18 61 9 45 7 672 17) Diarrhoea DI 450 67 147 22 41 6 36 5 674 18) Felt tired FA 171 25 273 40 164 24 67 10 675 19) Pain interference PA 394 59 147 22 76 11 56 8 673 20) Concentration CF 459 67 137 20 64 9 21 3 681 21) Tension EF 226 33 281 42 118 17 52 8 677 22) Worry EF 122 18 235 35 170 25 146 22 673 23) Irritability EF 358 53 222 33 72 11 21 3 673 24) Depression EF 247 37 236 35 124 18 67 10 674 25) Memory trouble CF 424 62 189 28 54 8 15 2 682 26) Family life SF 403 60 150 22 76 11 43 6 672 27) Social activities SF 345 51 169 25 86 13 72 11 672 28) Financial difficulties FI 511 77 89 13 38 6 26 4 664 1 2 3 4 5 6 7 Total (very poor) (excellent) 29) Overall health QL 28 22 90 196 156 117 60 669 4 3 14 29 23 18 9 30) Overall quality of life QL 29 32 95 167 156 125 63 667 4 5 14 25 23 19 9

82
Colorectal cancer: <50 Characteristics of the sample Version of the QLQ-C30 N (%) v 1.0 0 0 v +3 7 3 v 2.0 146 54 v 3.0 118 44 Total 271 Age N (%) <40 62 23 40-49 209 77 50-59 0 0 60-69 0 0 70-79 0 0 80+ 0 0 Not known 0 0 Total 271 Gender N (%) Male 133 49 Female 122 45 Not known 16 6 Total 271 Stage N (%) Stage I-II 18 7 Stage III-IV 40 15 Recurrent/metastatic 110 41 Not known 103 38 Total 271 Constructed scales Mean (SD) Median [IQR] Global health status/QoL QL 59.8 (23.7) 58.3 [50-83.3] Physical functioning PF 80.2 (20.1) 86.7 [66.7-100] Role Functioning RF 68.1 (32.6) 83.3 [33.3-100] Emotional functioning EF 65.6 (26.3) 66.7 [50-83.3] Cognitive functioning CF 85.0 (20.5) 100 [66.7-100] Social functioning SF 68.9 (31.4) 66.7 [50-100] Fatigue FA 37.3 (28.1) 33.3 [22.2-55.6] Nausea and vomiting NV 9.5 (19.3) 0 [0-16.7] Pain PA 30.2 (33.3) 16.7 [0-50] Dyspnoea DY 20.7 (29) 0 [0-33.3] Insomnia SL 33.8 (34.4) 33.3 [0-66.7] Appetite loss AP 21.9 (30.4) 0 [0-33.3] Constipation CO 17.7 (30) 0 [0-33.3] Diarrhoea DI 18.5 (28.1) 0 [0-33.3] Financial difficulties FI 23.8 (32.7) 0 [0-33.3]

83
Colorectal cancer: <50 Constructed scales QL N (%) CF N (%) 0 9 3 0 1 0 8.3 1 0 16.7 5 2 16.7 6 2 33.3 5 2 25 6 2 50 19 7 33.3 25 9 66.7 38 14 41.7 19 7 83.3 58 22 50 50 19 100 142 53 58.3 20 8 Total 268 66.7 43 16 75 19 7 83.3 43 16 91.7 8 3 SF N (%) 100 18 7 0 16 6 Total 267 16.7 13 5 33.3 27 10 PF N (%) 50 31 12 0 0 0 66.7 51 20 6.7 0 0 83.3 25 10 13.3 1 1 100 99 38 20 0 0 Total 262 26.7 1 1 33.3 3 3 40 4 3 46.7 4 3 FA N (%) 53.3 3 3 0 46 18 60 4 3 11.1 19 7 66.7 11 9 22.2 38 14 73.3 8 7 33.3 53 20 80 15 13 44.4 34 13 86.7 20 17 55.6 15 6 93.3 9 8 66.7 20 8 100 34 29 77.8 18 7 Total 117 88.9 9 3 100 11 4 RF N (%) Total 263 0 19 7 16.7 10 4 33.3 42 16 50 21 8 NV N (%) 66.7 35 13 0 191 72 83.3 42 16 16.7 35 13 100 96 36 33.3 22 8 Total 265 50 7 3 66.7 7 3 EF N (%) 83.3 0 0 0 5 2 100 4 2 8.3 7 3 Total 266 16.7 8 3 25 11 4 33.3 16 6 41.7 12 5 PA N (%) 50 19 7 0 103 39 58.3 25 9 16.7 36 14 66.7 41 15 33.3 51 19 75 32 12 50 19 7 83.3 32 12 66.7 17 6 91.7 21 8 83.3 12 5 100 40 15 100 26 10 Total 269 Total 264

84
Colorectal cancer: <50
Single Items Not at all A little Quite a bit Very much Total N (%) N (%) N (%) N (%) N
1) Strenuous activities PF 39 33 43 36 23 20 13 11 1182) Long walk PF 54 46 35 30 17 14 12 10 1183) Short walk PF 87 74 23 20 7 6 1 1 1184) Bed or chair PF 67 57 34 29 13 11 4 3 1185) Self care PF 109 93 6 5 2 2 0 0 1176) Limited in work RF 109 41 81 30 51 19 27 10 2687) Limited in leisure RF 130 49 53 20 54 20 30 11 2678) Dyspnoea DY 161 60 61 23 37 14 11 4 2709) Pain PA 108 40 90 34 33 12 37 14 26810) Need to rest FA 74 28 104 39 64 24 26 10 26811) Insomnia SL 110 41 77 29 52 19 31 12 27012) Felt weak FA 95 36 97 37 51 19 22 8 26513) Appetite loss AP 157 59 62 23 33 12 16 6 26814) Nausea NV 194 72 44 16 19 7 11 4 26815) Vomiting NV 241 90 16 6 7 3 4 2 26816) Constipation CO 185 69 44 16 24 9 17 6 27017) Diarrhoea DI 169 63 64 24 23 9 13 5 26918) Felt tired FA 61 23 121 45 61 23 25 9 26819) Pain interference PA 140 53 69 26 24 9 33 12 26620) Concentration CF 176 65 64 24 21 8 9 3 27021) Tension EF 81 30 119 44 44 16 27 10 27122) Worry EF 61 23 105 39 64 24 41 15 27123) Irritability EF 117 44 105 39 33 12 14 5 26924) Depression EF 102 38 95 35 48 18 25 9 27025) Memory trouble CF 180 67 69 26 16 6 4 2 26926) Family life SF 116 44 77 29 50 19 23 9 26627) Social activities SF 122 46 68 26 45 17 32 12 26728) Financial difficulties FI 154 58 56 21 34 13 22 8 266
1 2 3 4 5 6 7 Total (very poor) (excellent)
29) Overall health QL 10 7 41 65 66 59 19 267 4 3 15 24 25 22 7
30) Overall quality of life QL 12 11 37 66 57 57 27 267 5 4 14 25 21 21 10

85
Colorectal cancer: 50-59 Characteristics of the sample Version of the QLQ-C30 N (%) v 1.0 0 0 v +3 14 3 v 2.0 278 61 v 3.0 164 36 Total 456 Age N (%) <40 0 0 40-49 0 0 50-59 456 100 60-69 0 0 70-79 0 0 80+ 0 0 Not known 0 0 Total 456 Gender N (%) Male 264 58 Female 169 37 Not known 23 5 Total 456 Stage N (%) Stage I-II 35 8 Stage III-IV 70 15 Recurrent/metastatic 172 38 Not known 179 39 Total 456 Constructed scales Mean (SD) Median [IQR] Global health status/QoL QL 61.6 (24.3) 66.7 [50-83.3] Physical functioning PF 78.1 (23) 86.7 [60-100] Role Functioning RF 68.7 (33.4) 83.3 [50-100] Emotional functioning EF 68.4 (24.6) 75 [50-91.7] Cognitive functioning CF 85.8 (19.3) 100 [83.3-100] Social functioning SF 73.7 (29.6) 83.3 [50-100] Fatigue FA 33.5 (29) 33.3 [11.1-55.6] Nausea and vomiting NV 7.3 (16.9) 0 [0-0] Pain PA 24.8 (29.6) 16.7 [0-33.3] Dyspnoea DY 16.2 (25.6) 0 [0-33.3] Insomnia SL 30.6 (33.2) 33.3 [0-66.7] Appetite loss AP 17.5 (28.9) 0 [0-33.3] Constipation CO 12.3 (24.6) 0 [0-0] Diarrhoea DI 16.1 (27) 0 [0-33.3] Financial difficulties FI 16.2 (28) 0 [0-33.3]

86
Colorectal cancer: 50-59 Constructed scales QL N (%) CF N (%) 0 13 3 0 1 0 8.3 3 1 16.7 5 1 16.7 16 4 33.3 11 2 25 10 2 50 25 6 33.3 31 7 66.7 70 15 41.7 26 6 83.3 96 21 50 76 17 100 246 54 58.3 33 7 Total 454 66.7 78 17 75 35 8 83.3 73 16 91.7 15 3 SF N (%) 100 40 9 0 21 5 Total 449 16.7 16 4 33.3 36 8 PF N (%) 50 45 10 0 0 0 66.7 80 18 6.7 1 1 83.3 60 13 13.3 1 1 100 189 42 20 1 1 Total 447 26.7 3 2 33.3 6 4 40 2 1 46.7 10 6 FA N (%) 53.3 12 7 0 111 25 60 5 3 11.1 42 9 66.7 8 5 22.2 53 12 73.3 12 7 33.3 81 18 80 14 9 44.4 43 10 86.7 18 11 55.6 34 8 93.3 21 13 66.7 32 7 100 48 30 77.8 21 5 Total 162 88.9 17 4 100 17 4 RF N (%) Total 451 0 44 10 16.7 13 3 33.3 46 10 50 39 9 NV N (%) 66.7 74 17 0 347 76 83.3 55 12 16.7 60 13 100 173 39 33.3 25 6 Total 444 50 9 2 66.7 5 1 EF N (%) 83.3 5 1 0 4 1 100 3 1 8.3 8 2 Total 454 16.7 11 3 25 12 3 33.3 24 5 41.7 27 6 PA N (%) 50 33 7 0 203 45 58.3 39 9 16.7 59 13 66.7 58 13 33.3 85 19 75 48 11 50 30 7 83.3 69 15 66.7 35 8 91.7 56 13 83.3 14 3 100 59 13 100 23 5 Total 448 Total 449

87
Colorectal cancer: 50-59 Single Items Not at all A little Quite a bit Very much Total N (%) N (%) N (%) N (%) N1) Strenuous activities PF 58 35 43 26 29 18 34 21 1642) Long walk PF 74 45 35 22 30 18 24 15 1633) Short walk PF 121 74 29 18 8 5 6 4 1644) Bed or chair PF 105 64 29 18 24 15 5 3 1635) Self care PF 158 96 5 3 1 1 0 0 1646) Limited in work RF 195 43 125 28 72 16 57 13 4497) Limited in leisure RF 221 50 101 23 68 15 55 12 4458) Dyspnoea DY 298 66 101 22 41 9 12 3 4529) Pain PA 219 49 132 29 71 16 30 7 45210) Need to rest FA 155 34 163 36 98 22 40 9 45611) Insomnia SL 201 44 133 29 76 17 44 10 45412) Felt weak FA 179 39 155 34 81 18 39 9 45413) Appetite loss AP 304 67 86 19 39 9 25 6 45414) Nausea NV 355 78 65 14 22 5 13 3 45515) Vomiting NV 418 92 24 5 9 2 4 1 45516) Constipation CO 338 75 74 16 22 5 16 4 45017) Diarrhoea DI 306 68 94 21 32 7 20 4 45218) Felt tired FA 152 34 182 40 79 17 40 9 45319) Pain interference PA 262 58 105 23 52 12 33 7 45220) Concentration CF 307 68 97 21 43 10 7 2 45421) Tension EF 181 40 169 37 78 17 25 6 45322) Worry EF 96 21 179 40 91 20 86 19 45223) Irritability EF 232 51 163 36 48 11 11 2 45424) Depression EF 201 44 142 31 72 16 39 9 45425) Memory trouble CF 313 69 106 23 32 7 4 1 45526) Family life SF 241 54 119 26 58 13 32 7 45027) Social activities SF 221 49 120 27 67 15 42 9 45028) Financial difficulties FI 305 70 76 17 37 8 21 5 439 1 2 3 4 5 6 7 Total (very poor) (excellent) 29) Overall health QL 15 19 49 115 113 87 52 450 3 4 11 26 25 19 12 30) Overall quality of life QL 16 26 54 91 110 100 53 450 4 6 12 20 24 22 12

88
Colorectal cancer: 60-69 Characteristics of the sample Version of the QLQ-C30 N (%) v 1.0 0 0 v +3 14 2 v 2.0 427 68 v 3.0 192 30 Total 633 Age N (%) <40 0 0 40-49 0 0 50-59 0 0 60-69 633 100 70-79 0 0 80+ 0 0 Not known 0 0 Total 633 Gender N (%) Male 402 64 Female 216 34 Not known 15 2 Total 633 Stage N (%) Stage I-II 83 13 Stage III-IV 82 13 Recurrent/metastatic 245 39 Not known 223 35 Total 633 Constructed scales Mean (SD) Median [IQR] Global health status/QoL QL 61.7 (22) 66.7 [50-75] Physical functioning PF 79.3 (21) 86.7 [66.7-93.3] Role Functioning RF 72.3 (33.1) 83.3 [50-100] Emotional functioning EF 69.5 (23.4) 75 [58.3-91.7] Cognitive functioning CF 85.8 (20.3) 100 [83.3-100] Social functioning SF 77.6 (27.9) 83.3 [66.7-100] Fatigue FA 33.4 (27.2) 33.3 [11.1-55.6] Nausea and vomiting NV 6.9 (17.1) 0 [0-0] Pain PA 22.4 (28.2) 16.7 [0-33.3] Dyspnoea DY 17.1 (25.7) 0 [0-33.3] Insomnia SL 29.8 (31.6) 33.3 [0-66.7] Appetite loss AP 18.3 (30.5) 0 [0-33.3] Constipation CO 15.8 (27.1) 0 [0-33.3] Diarrhoea DI 15.6 (27.2) 0 [0-33.3] Financial difficulties FI 11.8 (25.2) 0 [0-0]

89
Colorectal cancer: 60-69 Constructed scales QL N (%) CF N (%) 0 8 1 0 6 1 8.3 5 1 16.7 5 1 16.7 16 3 33.3 15 2 25 9 2 50 40 6 33.3 48 8 66.7 74 12 41.7 37 6 83.3 143 23 50 123 20 100 343 55 58.3 44 7 Total 626 66.7 132 21 75 50 8 83.3 79 13 91.7 17 3 SF N (%) 100 52 8 0 21 3 Total 620 16.7 18 3 33.3 41 7 PF N (%) 50 53 9 0 0 0 66.7 101 16 6.7 0 0 83.3 85 14 13.3 0 0 100 295 48 20 1 1 Total 614 26.7 6 3 33.3 7 4 40 3 2 46.7 6 3 FA N (%) 53.3 5 3 0 121 20 60 10 5 11.1 77 13 66.7 10 5 22.2 76 13 73.3 18 10 33.3 123 20 80 18 10 44.4 49 8 86.7 27 15 55.6 56 9 93.3 30 16 66.7 43 7 100 45 24 77.8 30 5 Total 186 88.9 17 3 100 17 3 RF N (%) Total 609 0 48 8 16.7 22 4 33.3 66 11 50 30 5 NV N (%) 66.7 91 15 0 496 79 83.3 67 11 16.7 68 11 100 278 46 33.3 28 5 Total 602 50 13 2 66.7 7 1 EF N (%) 83.3 10 2 0 4 1 100 3 1 8.3 6 1 Total 625 16.7 13 2 25 20 3 33.3 27 4 41.7 33 5 PA N (%) 50 44 7 0 290 47 58.3 56 9 16.7 103 17 66.7 78 13 33.3 99 16 75 88 14 50 40 7 83.3 86 14 66.7 43 7 91.7 74 12 83.3 19 3 100 83 14 100 24 4 Total 612 Total 618

90
Colorectal cancer: 60-69
Single Items Not at all A little Quite a bit Very much Total N (%) N (%) N (%) N (%) N
1) Strenuous activities PF 70 37 51 27 41 22 27 14 1892) Long walk PF 82 43 48 25 33 18 26 14 1893) Short walk PF 144 76 28 15 14 7 3 2 1894) Bed or chair PF 119 63 43 23 22 12 6 3 1905) Self care PF 181 95 8 4 2 1 0 0 1916) Limited in work RF 300 49 158 26 96 16 60 10 6147) Limited in leisure RF 343 57 115 19 78 13 71 12 6078) Dyspnoea DY 392 63 158 25 53 9 18 3 6219) Pain PA 315 50 188 30 81 13 41 7 62510) Need to rest FA 199 32 239 38 125 20 59 10 62211) Insomnia SL 277 44 178 29 130 21 40 6 62512) Felt weak FA 249 40 210 34 122 20 45 7 62613) Appetite loss AP 426 68 98 16 62 10 41 7 62714) Nausea NV 507 81 76 12 34 5 12 2 62915) Vomiting NV 578 92 28 5 11 2 10 2 62716) Constipation CO 427 69 124 20 44 7 28 5 62317) Diarrhoea DI 432 69 123 20 40 6 30 5 62518) Felt tired FA 203 33 257 41 122 20 39 6 62119) Pain interference PA 392 63 129 21 66 11 38 6 62520) Concentration CF 457 73 108 17 46 7 19 3 63021) Tension EF 255 41 253 41 82 13 34 5 62422) Worry EF 135 22 225 36 160 26 105 17 62523) Irritability EF 344 55 201 32 62 10 17 3 62424) Depression EF 275 44 199 32 111 18 38 6 62325) Memory trouble CF 411 66 169 27 32 5 15 2 62726) Family life SF 375 61 147 24 66 11 32 5 62027) Social activities SF 344 55 146 24 74 12 58 9 62228) Financial difficulties FI 486 78 74 12 40 6 22 4 622
1 2 3 4 5 6 7 Total (very poor) (excellent)
29) Overall health QL 13 20 65 171 187 102 64 622 2 3 11 28 30 16 10
30) Overall quality of life QL 17 26 73 151 174 110 73 624 3 4 12 24 28 18 12
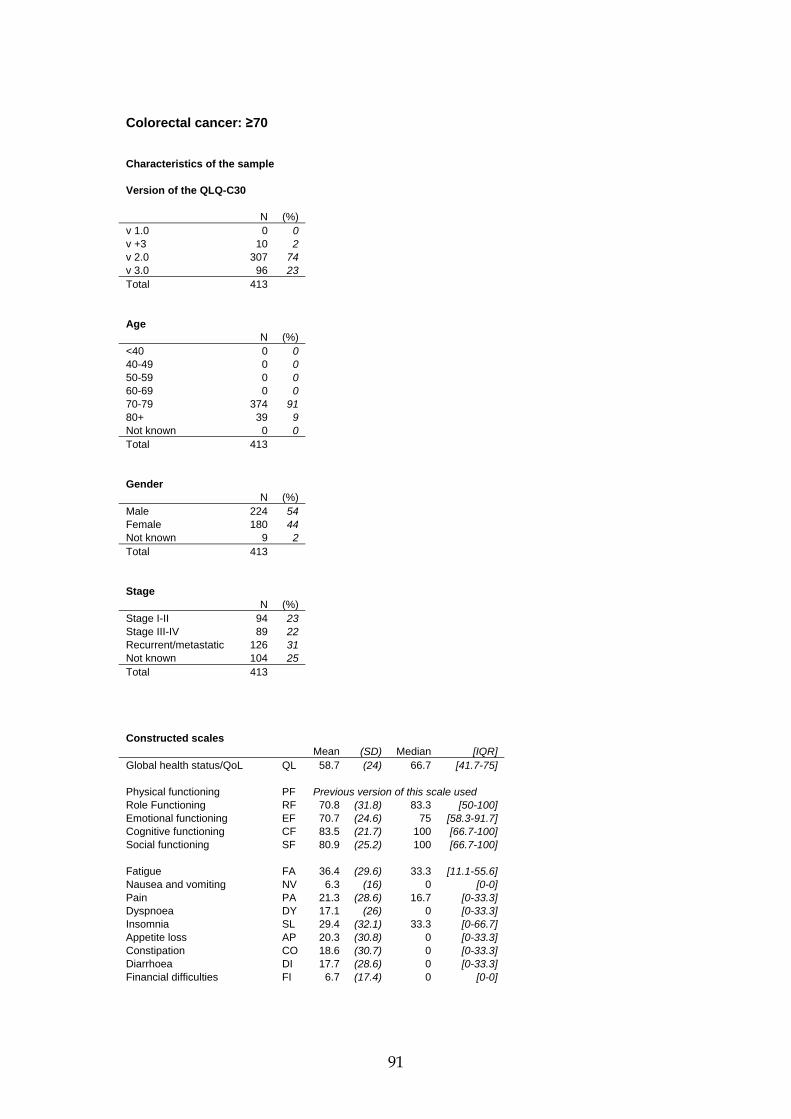
91
Colorectal cancer: ≥70 Characteristics of the sample Version of the QLQ-C30 N (%) v 1.0 0 0 v +3 10 2 v 2.0 307 74 v 3.0 96 23 Total 413 Age N (%) <40 0 0 40-49 0 0 50-59 0 0 60-69 0 0 70-79 374 91 80+ 39 9 Not known 0 0 Total 413 Gender N (%) Male 224 54 Female 180 44 Not known 9 2 Total 413 Stage N (%) Stage I-II 94 23 Stage III-IV 89 22 Recurrent/metastatic 126 31 Not known 104 25 Total 413 Constructed scales Mean (SD) Median [IQR] Global health status/QoL QL 58.7 (24) 66.7 [41.7-75] Physical functioning PF Previous version of this scale used Role Functioning RF 70.8 (31.8) 83.3 [50-100] Emotional functioning EF 70.7 (24.6) 75 [58.3-91.7] Cognitive functioning CF 83.5 (21.7) 100 [66.7-100] Social functioning SF 80.9 (25.2) 100 [66.7-100] Fatigue FA 36.4 (29.6) 33.3 [11.1-55.6] Nausea and vomiting NV 6.3 (16) 0 [0-0] Pain PA 21.3 (28.6) 16.7 [0-33.3] Dyspnoea DY 17.1 (26) 0 [0-33.3] Insomnia SL 29.4 (32.1) 33.3 [0-66.7] Appetite loss AP 20.3 (30.8) 0 [0-33.3] Constipation CO 18.6 (30.7) 0 [0-33.3] Diarrhoea DI 17.7 (28.6) 0 [0-33.3] Financial difficulties FI 6.7 (17.4) 0 [0-0]

92
Colorectal cancer: ≥70 Constructed scales QL N (%) CF N (%) 0 14 4 0 3 1 8.3 5 1 16.7 7 2 16.7 10 3 33.3 13 3 25 10 3 50 28 7 33.3 38 10 66.7 62 15 41.7 22 6 83.3 86 21 50 69 18 100 205 51 58.3 26 7 Total 404 66.7 82 21 75 21 5 83.3 61 16 91.7 10 3 SF N (%) 100 23 6 0 7 2 Total 391 16.7 11 3 33.3 21 5 PF 50 26 7 Previous version of this scale used 66.7 65 16 83.3 65 16 100 202 51 Total 397 FA N (%) 0 71 18 11.1 45 12 22.2 56 14 33.3 71 18 44.4 28 7 55.6 28 7 66.7 36 9 77.8 17 4 88.9 14 4 100 23 6 RF N (%) Total 389 0 28 7 16.7 16 4 33.3 35 9 50 36 9 NV N (%) 66.7 57 15 0 321 81 83.3 66 17 16.7 38 10 100 148 38 33.3 24 6 Total 386 50 5 1 66.7 7 2 EF N (%) 83.3 1 0 0 3 1 100 3 1 8.3 4 1 Total 399 16.7 10 3 25 10 3 33.3 24 6 41.7 17 4 PA N (%) 50 24 6 0 193 49 58.3 30 8 16.7 74 19 66.7 53 14 33.3 49 13 75 53 14 50 19 5 83.3 44 11 66.7 29 7 91.7 47 12 83.3 11 3 100 74 19 100 17 4 Total 393 Total 392

93
Colorectal cancer: ≥70
Single Items Not at all A little Quite a bit Very much Total N (%) N (%) N (%) N (%) N
1) Strenuous activities PF Previous version of this scale used 2) Long walk PF Previous version of this scale used 3) Short walk PF Previous version of this scale used 4) Bed or chair PF Previous version of this scale used 5) Self care PF Previous version of this scale used 6) Limited in work RF 167 42 111 28 77 20 39 10 3947) Limited in leisure RF 217 55 87 22 51 13 38 10 3938) Dyspnoea DY 258 64 97 24 39 10 11 3 4059) Pain PA 211 53 111 28 52 13 25 6 39910) Need to rest FA 124 31 146 36 87 22 44 11 40111) Insomnia SL 184 46 111 28 78 19 29 7 40212) Felt weak FA 153 38 126 31 79 20 47 12 40513) Appetite loss AP 255 63 83 20 40 10 28 7 40614) Nausea NV 327 81 48 12 18 5 10 3 40315) Vomiting NV 371 92 22 6 5 1 5 1 40316) Constipation CO 271 68 62 16 42 11 26 7 40117) Diarrhoea DI 267 66 85 21 32 8 22 5 40618) Felt tired FA 116 29 167 41 79 20 41 10 40319) Pain interference PA 268 67 69 17 41 10 24 6 40220) Concentration CF 290 71 72 18 34 8 11 3 40721) Tension EF 185 46 135 33 63 16 22 5 40522) Worry EF 112 28 125 31 90 23 71 18 39823) Irritability EF 226 56 131 33 39 10 7 2 40324) Depression EF 183 45 125 31 64 16 32 8 40425) Memory trouble CF 242 60 109 27 46 11 10 3 40726) Family life SF 265 66 91 23 33 8 10 3 39927) Social activities SF 232 58 91 23 49 12 31 8 40328) Financial difficulties FI 333 85 47 12 10 3 4 1 394
1 2 3 4 5 6 7 Total (very poor) (excellent)
29) Overall health QL 19 15 55 101 105 72 29 396 5 4 14 26 27 18 7
30) Overall quality of life QL 20 19 49 91 102 78 33 392 5 5 13 23 26 20 8
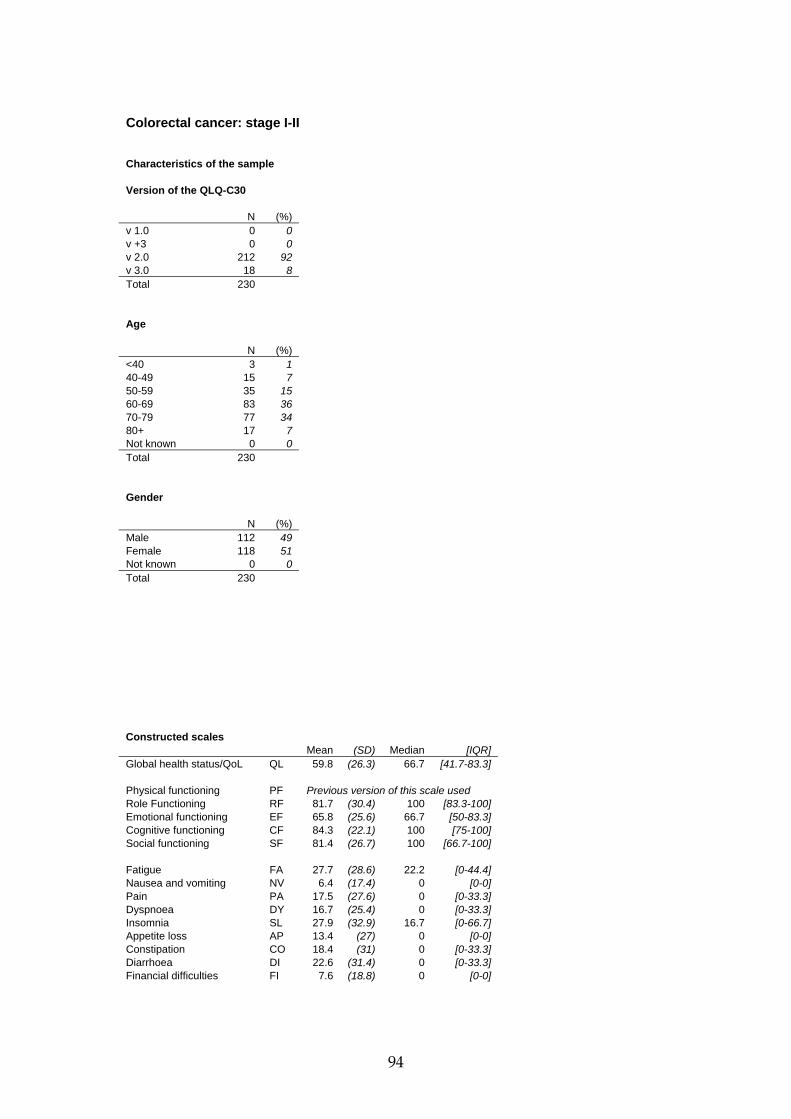
94
Colorectal cancer: stage I-II Characteristics of the sample Version of the QLQ-C30 N (%) v 1.0 0 0 v +3 0 0 v 2.0 212 92 v 3.0 18 8 Total 230 Age N (%) <40 3 1 40-49 15 7 50-59 35 15 60-69 83 36 70-79 77 34 80+ 17 7 Not known 0 0 Total 230 Gender N (%) Male 112 49 Female 118 51 Not known 0 0 Total 230 Constructed scales Mean (SD) Median [IQR] Global health status/QoL QL 59.8 (26.3) 66.7 [41.7-83.3] Physical functioning PF Previous version of this scale used Role Functioning RF 81.7 (30.4) 100 [83.3-100] Emotional functioning EF 65.8 (25.6) 66.7 [50-83.3] Cognitive functioning CF 84.3 (22.1) 100 [75-100] Social functioning SF 81.4 (26.7) 100 [66.7-100] Fatigue FA 27.7 (28.6) 22.2 [0-44.4] Nausea and vomiting NV 6.4 (17.4) 0 [0-0] Pain PA 17.5 (27.6) 0 [0-33.3] Dyspnoea DY 16.7 (25.4) 0 [0-33.3] Insomnia SL 27.9 (32.9) 16.7 [0-66.7] Appetite loss AP 13.4 (27) 0 [0-0] Constipation CO 18.4 (31) 0 [0-33.3] Diarrhoea DI 22.6 (31.4) 0 [0-33.3] Financial difficulties FI 7.6 (18.8) 0 [0-0]
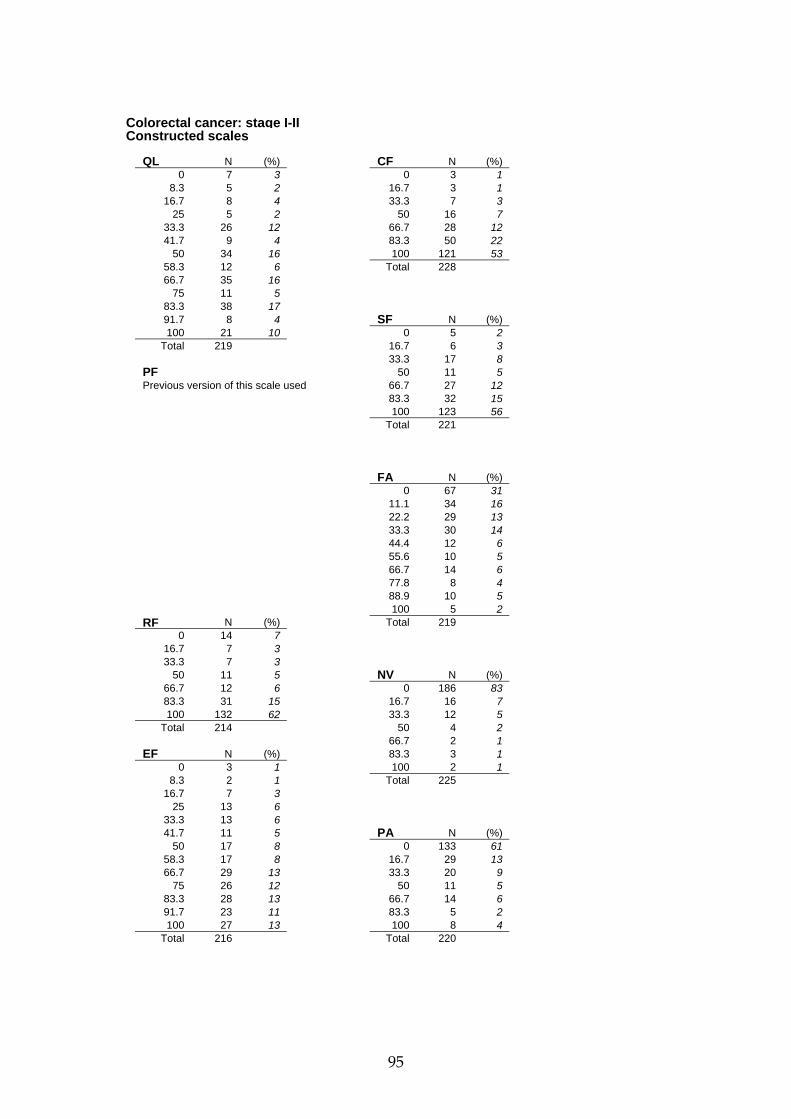
95
Colorectal cancer: stage I-II Constructed scales QL N (%) CF N (%) 0 7 3 0 3 1 8.3 5 2 16.7 3 1 16.7 8 4 33.3 7 3 25 5 2 50 16 7 33.3 26 12 66.7 28 12 41.7 9 4 83.3 50 22 50 34 16 100 121 53 58.3 12 6 Total 228 66.7 35 16 75 11 5 83.3 38 17 91.7 8 4 SF N (%) 100 21 10 0 5 2 Total 219 16.7 6 3 33.3 17 8 PF 50 11 5 Previous version of this scale used 66.7 27 12 83.3 32 15 100 123 56 Total 221 FA N (%) 0 67 31 11.1 34 16 22.2 29 13 33.3 30 14 44.4 12 6 55.6 10 5 66.7 14 6 77.8 8 4 88.9 10 5 100 5 2 RF N (%) Total 219 0 14 7 16.7 7 3 33.3 7 3 50 11 5 NV N (%) 66.7 12 6 0 186 83 83.3 31 15 16.7 16 7 100 132 62 33.3 12 5 Total 214 50 4 2 66.7 2 1 EF N (%) 83.3 3 1 0 3 1 100 2 1 8.3 2 1 Total 225 16.7 7 3 25 13 6 33.3 13 6 41.7 11 5 PA N (%) 50 17 8 0 133 61 58.3 17 8 16.7 29 13 66.7 29 13 33.3 20 9 75 26 12 50 11 5 83.3 28 13 66.7 14 6 91.7 23 11 83.3 5 2 100 27 13 100 8 4 Total 216 Total 220

96
Colorectal cancer: stage I-II
Single Items Not at all A little Quite a bit Very much Total N (%) N (%) N (%) N (%) N
1) Strenuous activities PF Previous version of this scale used 2) Long walk PF Previous version of this scale used 3) Short walk PF Previous version of this scale used 4) Bed or chair PF Previous version of this scale used 5) Self care PF Previous version of this scale used 6) Limited in work RF 139 64 33 15 25 11 22 10 2197) Limited in leisure RF 172 79 17 8 15 7 15 7 2198) Dyspnoea DY 145 64 54 24 22 10 5 2 2269) Pain PA 143 64 41 18 29 13 12 5 22510) Need to rest FA 102 45 76 34 34 15 15 7 22711) Insomnia SL 113 50 55 24 40 18 18 8 22612) Felt weak FA 122 54 43 19 42 19 18 8 22513) Appetite loss AP 172 76 30 13 14 6 11 5 22714) Nausea NV 187 83 22 10 11 5 6 3 22615) Vomiting NV 210 93 8 4 3 1 4 2 22516) Constipation CO 154 68 34 15 21 9 16 7 22517) Diarrhoea DI 132 58 57 25 22 10 18 8 22918) Felt tired FA 96 43 74 33 39 17 15 7 22419) Pain interference PA 164 73 26 12 24 11 10 5 22420) Concentration CF 163 71 37 16 23 10 6 3 22921) Tension EF 90 40 72 32 40 18 23 10 22522) Worry EF 47 21 54 25 66 30 53 24 22023) Irritability EF 118 53 73 33 27 12 6 3 22424) Depression EF 100 44 63 28 38 17 24 11 22525) Memory trouble CF 145 63 58 25 20 9 6 3 22926) Family life SF 139 62 52 23 21 9 11 5 22327) Social activities SF 148 66 39 17 25 11 14 6 22628) Financial difficulties FI 187 83 28 12 7 3 3 1 225
1 2 3 4 5 6 7 Total (very poor) (excellent)
29) Overall health QL 12 9 30 50 44 49 27 221 5 4 14 23 20 22 12
30) Overall quality of life QL 13 18 27 48 43 45 28 222 6 8 12 22 19 20 13

97
Colorectal cancer: stage III-IV Characteristics of the sample Version of the QLQ-C30 N (%) v 1.0 0 0 v +3 0 0 v 2.0 225 80 v 3.0 56 20 Total 281 Age N (%) <40 8 3 40-49 32 11 50-59 70 25 60-69 82 29 70-79 74 26 80+ 15 5 Not known 0 0 Total 281 Gender N (%) Male 169 60 Female 112 40 Not known 0 0 Total 281 Constructed scales Mean (SD) Median [IQR] Global health status/QoL QL 60.7 (21.9) 66.7 [50-75] Physical functioning PF Previous version of this scale used Role Functioning RF 80.0 (28.2) 100 [66.7-100] Emotional functioning EF 67.1 (25.3) 66.7 [50-91.7] Cognitive functioning CF 86.5 (18.8) 100 [83.3-100] Social functioning SF 76.7 (27.5) 83.3 [66.7-100] Fatigue FA 30.7 (28.5) 22.2 [0-55.6] Nausea and vomiting NV 4.7 (14.1) 0 [0-0] Pain PA 22.3 (30) 8.3 [0-33.3] Dyspnoea DY 15.8 (26) 0 [0-33.3] Insomnia SL 29.8 (32) 33.3 [0-66.7] Appetite loss AP 14.3 (26.3) 0 [0-33.3] Constipation CO 16.2 (29.3) 0 [0-33.3] Diarrhoea DI 23.8 (32.9) 0 [0-33.3] Financial difficulties FI 10.8 (24.9) 0 [0-0]
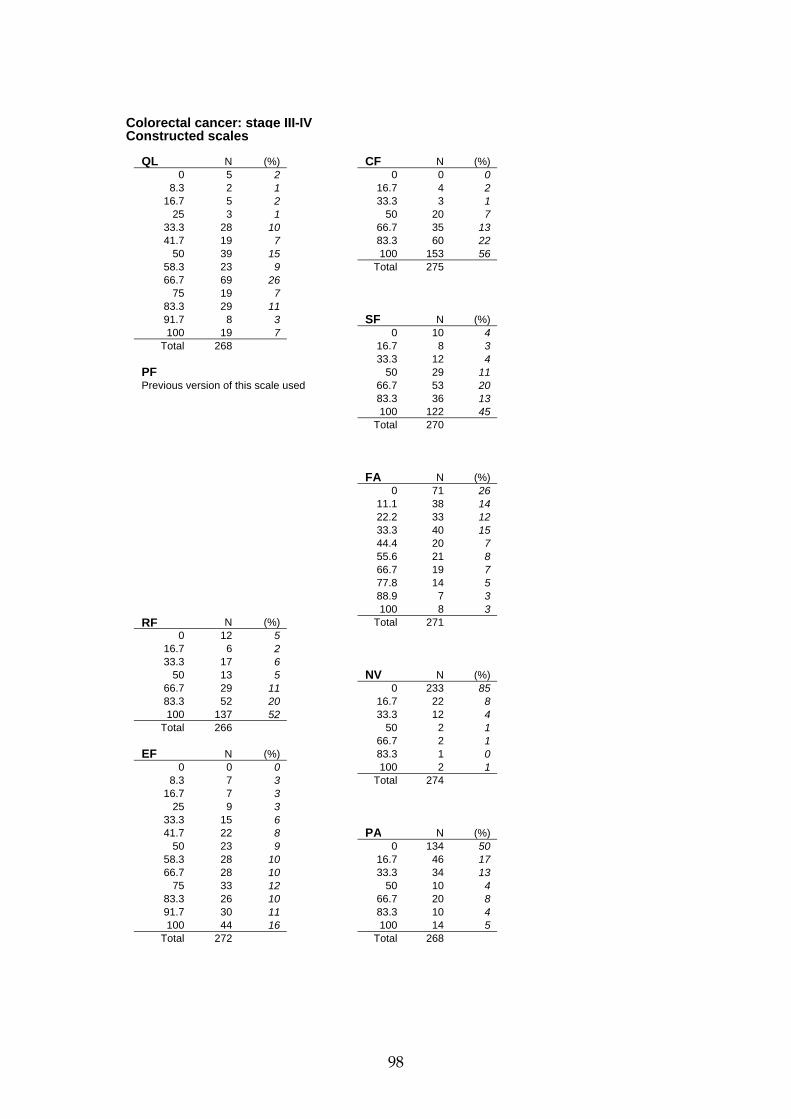
98
Colorectal cancer: stage III-IV Constructed scales QL N (%) CF N (%) 0 5 2 0 0 0 8.3 2 1 16.7 4 2 16.7 5 2 33.3 3 1 25 3 1 50 20 7 33.3 28 10 66.7 35 13 41.7 19 7 83.3 60 22 50 39 15 100 153 56 58.3 23 9 Total 275 66.7 69 26 75 19 7 83.3 29 11 91.7 8 3 SF N (%) 100 19 7 0 10 4 Total 268 16.7 8 3 33.3 12 4 PF 50 29 11 Previous version of this scale used 66.7 53 20 83.3 36 13 100 122 45 Total 270 FA N (%) 0 71 26 11.1 38 14 22.2 33 12 33.3 40 15 44.4 20 7 55.6 21 8 66.7 19 7 77.8 14 5 88.9 7 3 100 8 3 RF N (%) Total 271 0 12 5 16.7 6 2 33.3 17 6 50 13 5 NV N (%) 66.7 29 11 0 233 85 83.3 52 20 16.7 22 8 100 137 52 33.3 12 4 Total 266 50 2 1 66.7 2 1 EF N (%) 83.3 1 0 0 0 0 100 2 1 8.3 7 3 Total 274 16.7 7 3 25 9 3 33.3 15 6 41.7 22 8 PA N (%) 50 23 9 0 134 50 58.3 28 10 16.7 46 17 66.7 28 10 33.3 34 13 75 33 12 50 10 4 83.3 26 10 66.7 20 8 91.7 30 11 83.3 10 4 100 44 16 100 14 5 Total 272 Total 268

99
Colorectal cancer: stage III-IV
Single Items Not at all A little Quite a bit Very much Total N (%) N (%) N (%) N (%) N
1) Strenuous activities PF Previous version of this scale used 2) Long walk PF Previous version of this scale used 3) Short walk PF Previous version of this scale used 4) Bed or chair PF Previous version of this scale used 5) Self care PF Previous version of this scale used 6) Limited in work RF 148 55 66 24 40 15 17 6 2717) Limited in leisure RF 195 73 35 13 23 9 15 6 2688) Dyspnoea DY 187 68 53 19 28 10 7 3 2759) Pain PA 144 53 66 24 37 14 23 9 27010) Need to rest FA 122 45 79 29 52 19 20 7 27311) Insomnia SL 124 45 74 27 59 22 18 7 27512) Felt weak FA 126 46 78 28 49 18 23 8 27613) Appetite loss AP 200 72 45 16 22 8 10 4 27714) Nausea NV 237 86 26 9 8 3 5 2 27615) Vomiting NV 261 95 9 3 2 1 4 1 27616) Constipation CO 195 71 39 14 23 8 16 6 27317) Diarrhoea DI 159 57 64 23 28 10 26 9 27718) Felt tired FA 104 37 101 36 51 18 22 8 27819) Pain interference PA 186 67 45 16 26 9 19 7 27620) Concentration CF 200 72 51 18 17 6 10 4 27821) Tension EF 119 43 95 34 49 18 16 6 27922) Worry EF 62 23 74 27 72 26 66 24 27423) Irritability EF 151 54 88 32 35 13 4 1 27824) Depression EF 116 42 78 28 56 20 25 9 27525) Memory trouble CF 185 67 75 27 15 5 1 0 27626) Family life SF 154 57 74 27 26 10 17 6 27127) Social activities SF 147 54 69 25 40 15 19 7 27528) Financial difficulties FI 218 80 32 12 10 4 12 4 272
1 2 3 4 5 6 7 Total (very poor) (excellent)
29) Overall health QL 7 7 38 65 87 41 24 269 3 3 14 24 32 15 9
30) Overall quality of life QL 8 9 41 51 86 48 26 269 3 3 15 19 32 18 10

100
Colorectal cancer: recurrent/metastatic Characteristics of the sample Version of the QLQ-C30 N (%) v 1.0 0 0 v +3 17 3 v 2.0 534 82 v 3.0 102 16 Total 653 Age N (%) <40 29 4 40-49 81 12 50-59 172 26 60-69 245 38 70-79 122 19 80+ 4 1 Not known 0 0 Total 653 Gender N (%) Male 352 54 Female 238 36 Not known 63 10 Total 653 Constructed scales Mean (SD) Median [IQR] Global health status/QoL QL 60.7 (22.9) 66.7 [50-75] Physical functioning PF 73.3 (23.3) 80 [53.3-93.3] Role Functioning RF 64.8 (33.4) 66.7 [33.3-100] Emotional functioning EF 70.7 (23.7) 75 [58.3-91.7] Cognitive functioning CF 83.4 (20.9) 83.3 [66.7-100] Social functioning SF 74.3 (28.6) 83.3 [50-100] Fatigue FA 38.9 (28) 33.3 [22.2-55.6] Nausea and vomiting NV 9.8 (19.2) 0 [0-16.7] Pain PA 25.2 (28.9) 16.7 [0-33.3] Dyspnoea DY 18.6 (27.3) 0 [0-33.3] Insomnia SL 30.5 (31.8) 33.3 [0-66.7] Appetite loss AP 22.6 (31.6) 0 [0-33.3] Constipation CO 16.3 (27.1) 0 [0-33.3] Diarrhoea DI 15.4 (25.6) 0 [0-33.3] Financial difficulties FI 13.8 (26.4) 0 [0-33.3]

101
Colorectal cancer: recurrent/metastatic Constructed scales QL N (%) CF N (%) 0 15 2 0 5 1 8.3 3 1 16.7 8 1 16.7 21 3 33.3 18 3 25 12 2 50 48 7 33.3 48 8 66.7 100 16 41.7 48 8 83.3 156 24 50 120 19 100 311 48 58.3 40 6 Total 646 66.7 117 18 75 61 10 83.3 96 15 91.7 22 3 SF N (%) 100 40 6 0 22 4 Total 643 16.7 24 4 33.3 54 9 PF N (%) 50 65 10 0 0 0 66.7 109 17 6.7 0 0 83.3 96 15 13.3 0 0 100 264 42 20 1 1 Total 634 26.7 4 4 33.3 5 5 40 1 1 46.7 9 9 FA N (%) 53.3 8 8 0 92 15 60 7 7 11.1 52 8 66.7 5 5 22.2 82 13 73.3 7 7 33.3 147 23 80 11 11 44.4 67 11 86.7 10 10 55.6 49 8 93.3 10 10 66.7 62 10 100 22 22 77.8 27 4 Total 100 88.9 24 4 100 34 5 RF N (%) Total 636 0 61 10 16.7 27 4 33.3 93 15 50 51 8 NV N (%) 66.7 121 19 0 450 70 83.3 70 11 16.7 107 17 100 210 33 33.3 39 6 Total 633 50 21 3 66.7 16 3 EF N (%) 83.3 9 1 0 10 2 100 4 1 8.3 5 1 Total 646 16.7 11 2 25 16 3 33.3 27 4 41.7 33 5 PA N (%) 50 38 6 0 262 41 58.3 44 7 16.7 113 18 66.7 95 15 33.3 127 20 75 92 14 50 42 7 83.3 92 14 66.7 46 7 91.7 83 13 83.3 19 3 100 92 14 100 33 5 Total 638 Total 642

102
Colorectal cancer: recurrent/metastatic
Single Items Not at all A little Quite a bit Very much Total N (%) N (%) N (%) N (%) N
1) Strenuous activities PF 27 27 28 28 22 22 25 25 1022) Long walk PF 38 38 16 16 20 20 27 27 1013) Short walk PF 68 67 21 21 10 10 3 3 1024) Bed or chair PF 54 53 28 28 17 17 3 3 1025) Self care PF 96 95 5 5 0 0 0 0 1016) Limited in work RF 234 37 204 32 123 19 80 13 6417) Limited in leisure RF 268 42 168 26 113 18 88 14 6378) Dyspnoea DY 399 62 159 25 65 10 24 4 6479) Pain PA 277 43 244 38 77 12 49 8 64710) Need to rest FA 148 23 271 42 153 24 73 11 64511) Insomnia SL 274 42 207 32 117 18 51 8 64912) Felt weak FA 198 30 261 40 131 20 61 9 65113) Appetite loss AP 382 59 140 22 79 12 47 7 64814) Nausea NV 464 71 118 18 45 7 24 4 65115) Vomiting NV 576 89 46 7 18 3 8 1 64816) Constipation CO 436 68 132 20 51 8 27 4 64617) Diarrhoea DI 438 68 138 21 50 8 20 3 64618) Felt tired FA 148 23 295 46 135 21 67 10 64519) Pain interference PA 374 58 157 24 70 11 46 7 64720) Concentration CF 435 67 139 21 58 9 18 3 65021) Tension EF 233 36 285 44 92 14 37 6 64722) Worry EF 153 24 305 47 126 19 66 10 65023) Irritability EF 331 51 233 36 62 10 19 3 64524) Depression EF 284 44 232 36 93 14 39 6 64825) Memory trouble CF 391 60 191 30 52 8 14 2 64826) Family life SF 356 56 174 27 84 13 27 4 64127) Social activities SF 309 48 165 26 91 14 76 12 64128) Financial difficulties FI 458 74 98 16 39 6 27 4 622
1 2 3 4 5 6 7 Total (very poor) (excellent)
29) Overall health QL 17 25 83 167 184 117 52 645 3 4 13 26 29 18 8
30) Overall quality of life QL 21 30 80 150 157 137 68 643 3 5 12 23 24 21 11

103
Genito-urinary cancer Characteristics of the sample Version of the QLQ-C30 Primary disease site N (%) N (%) v 1.0 18 7 Bladder 13 5 v +3 1 0 Genito-urinary (other) 45 18 v 2.0 178 72 Kidney 188 76 v 3.0 49 20 Total 246 Total 246 Age N (%) <40 19 8 40-49 37 15 50-59 75 31 60-69 63 26 70-79 44 18 80+ 8 3 Not known 0 0 Total 246 Gender N (%) Male 175 71 Female 68 28 Not known 3 1 Total 246 Stage N (%) Stage I-II 21 9 Stage III-IV 159 65 Recurrent/metastatic 51 21 Not known 15 6 Total 246 Constructed scales Mean (SD) Median [IQR] Global health status/QoL QL 62.6 (22.2) 66.7 [50-83.3] Physical functioning PF Previous version of this scale used Role Functioning RF 56.8 (33.5) 66.7 [33.3-83.3] Emotional functioning EF 74.7 (22.9) 83.3 [66.7-91.7] Cognitive functioning CF 86.6 (18.2) 100 [83.3-100] Social functioning SF 71.7 (28.2) 83.3 [50-100] Fatigue FA 35.7 (28.6) 33.3 [11.1-55.6] Nausea and vomiting NV 6.0 (13.5) 0 [0-0] Pain PA 27.0 (29.7) 16.7 [0-50] Dyspnoea DY 16.5 (25) 0 [0-33.3] Insomnia SL 26.3 (29.2) 33.3 [0-33.3] Appetite loss AP 16.5 (27.6) 0 [0-33.3] Constipation CO 18.9 (30) 0 [0-33.3] Diarrhoea DI 8.3 (19.8) 0 [0-0] Financial difficulties FI 15.1 (26.1) 0 [0-33.3]

104
Genito-urinary cancer Constructed scales QL N (%) CF N (%) 0 2 1 0 0 0 8.3 2 1 16.7 2 1 16.7 4 2 33.3 7 3 25 3 1 50 9 4 33.3 21 9 66.7 37 15 41.7 16 7 83.3 57 24 50 39 17 100 131 54 58.3 25 11 Total 243 66.7 28 12 75 23 10 83.3 34 15 91.7 9 4 SF N (%) 100 19 8 0 8 3 Total 225 16.7 3 1 33.3 34 14 PF 50 27 11 Previous version of this scale used 66.7 45 19 83.3 34 14 100 87 37 Total 238 FA N (%) 0 44 18 11.1 26 11 22.2 33 14 33.3 46 19 44.4 25 10 55.6 22 9 66.7 17 7 77.8 8 3 88.9 4 2 100 16 7 RF N (%) Total 241 0 25 11 16.7 19 9 33.3 38 17 50 21 10 NV N (%) 66.7 44 20 0 190 78 83.3 25 11 16.7 34 14 100 49 22 33.3 10 4 Total 221 50 6 3 66.7 4 2 EF N (%) 83.3 0 0 0 3 1 100 0 0 8.3 1 0 Total 244 16.7 4 2 25 6 3 33.3 6 3 41.7 8 3 PA N (%) 50 9 4 0 94 39 58.3 21 9 16.7 38 16 66.7 34 14 33.3 46 19 75 26 11 50 25 10 83.3 37 15 66.7 14 6 91.7 37 15 83.3 10 4 100 48 20 100 13 5 Total 240 Total 240

105
Genito-urinary cancer Single Items Not at all A little Quite a bit Very much Total N (%) N (%) N (%) N (%) N 1) Strenuous activities PF Previous version of this scale used 2) Long walk PF Previous version of this scale used 3) Short walk PF Previous version of this scale used 4) Bed or chair PF Previous version of this scale used 5) Self care PF Previous version of this scale used 6) Limited in work RF 61 27 69 31 60 27 33 15 223 7) Limited in leisure RF 69 31 62 28 53 24 41 18 225 8) Dyspnoea DY 155 63 66 27 17 7 7 3 245 9) Pain PA 102 42 88 36 33 14 22 9 245 10) Need to rest FA 66 27 101 41 53 22 25 10 245 11) Insomnia SL 113 46 83 34 37 15 12 5 245 12) Felt weak FA 93 38 89 36 39 16 24 10 245 13) Appetite loss AP 165 68 48 20 20 8 11 5 244 14) Nausea NV 193 79 41 17 10 4 2 1 246 15) Vomiting NV 227 93 12 5 5 2 0 0 244 16) Constipation CO 160 65 46 19 24 10 15 6 245 17) Diarrhoea DI 200 82 30 12 11 5 3 1 244 18) Felt tired FA 71 29 104 43 44 18 24 10 243 19) Pain interference PA 129 54 65 27 27 11 20 8 241 20) Concentration CF 176 72 44 18 18 7 6 2 244 21) Tension EF 106 43 95 39 32 13 11 5 244 22) Worry EF 79 32 112 46 37 15 17 7 245 23) Irritability EF 140 58 75 31 23 10 5 2 243 24) Depression EF 119 49 88 36 21 9 15 6 243 25) Memory trouble CF 165 68 61 25 17 7 1 0 244 26) Family life SF 124 51 66 27 41 17 11 5 242 27) Social activities SF 103 43 60 25 62 26 16 7 241 28) Financial difficulties FI 169 70 42 17 23 10 7 3 241 1 2 3 4 5 6 7 Total (very poor) (excellent) 29) Overall health QL 5 4 31 62 55 48 22 227 2 2 14 27 24 21 10 30) Overall quality of life QL 5 7 33 53 50 57 37 242 2 3 14 22 21 24 15

106
Gynaecological cancer (cervical) Characteristics of the sample Version of the QLQ-C30 N (%) v 1.0 27 24 v +3 0 0 v 2.0 72 63 v 3.0 15 13 Total 114 Age N (%) <40 31 27 40-49 26 23 50-59 23 20 60-69 20 18 70-79 10 9 80+ 3 3 Not known 1 1 Total 114 Constructed scales Mean (SD) Median [IQR] Global health status/QoL QL Previous version of this scale used Physical functioning PF Previous version of this scale used Role Functioning RF Previous version of this scale used Emotional functioning EF 64.2 (26) 66.7 [50-83.3] Cognitive functioning CF 86.0 (20.5) 100 [66.7-100] Social functioning SF 77.1 (25.6) 83.3 [66.7-100] Fatigue FA 33.8 (33.4) 22.2 [0-55.6] Nausea and vomiting NV 8.7 (22.8) 0 [0-0] Pain PA 29.4 (37.1) 16.7 [0-66.7] Dyspnoea DY 16.2 (25.2) 0 [0-33.3] Insomnia SL 36.6 (35.6) 33.3 [0-66.7] Appetite loss AP 15.9 (30.2) 0 [0-33.3] Constipation CO 20.2 (33.6) 0 [0-33.3] Diarrhoea DI 7.1 (18.6) 0 [0-0] Financial difficulties FI 9.9 (20.9) 0 [0-0]

107
Gynaecological cancer (cervical) Constructed scales QL CF N (%) Previous version of this scale used 0 0 0 16.7 3 3 33.3 1 1 50 7 6 66.7 20 18 83.3 15 13 100 67 59 Total 113 SF N (%) 0 1 1 16.7 1 1 33.3 13 12 PF 50 12 11 Previous version of this scale used 66.7 21 19 83.3 13 12 100 51 46 Total 112 FA N (%) 0 31 27 11.1 19 17 22.2 7 6 33.3 17 15 44.4 7 6 55.6 6 5 66.7 5 4 77.8 4 4 88.9 9 8 100 8 7 RF Total 113 Previous version of this scale used NV N (%) 0 93 82 16.7 6 5 33.3 5 4 50 1 1 66.7 3 3 EF N (%) 83.3 2 2 0 1 1 100 3 3 8.3 4 4 Total 113 16.7 4 4 25 2 2 33.3 8 7 41.7 7 6 PA N (%) 50 11 10 0 56 50 58.3 12 11 16.7 13 12 66.7 16 14 33.3 11 10 75 10 9 50 4 4 83.3 11 10 66.7 5 4 91.7 12 11 83.3 12 11 100 14 13 100 12 11 Total 112 Total 113
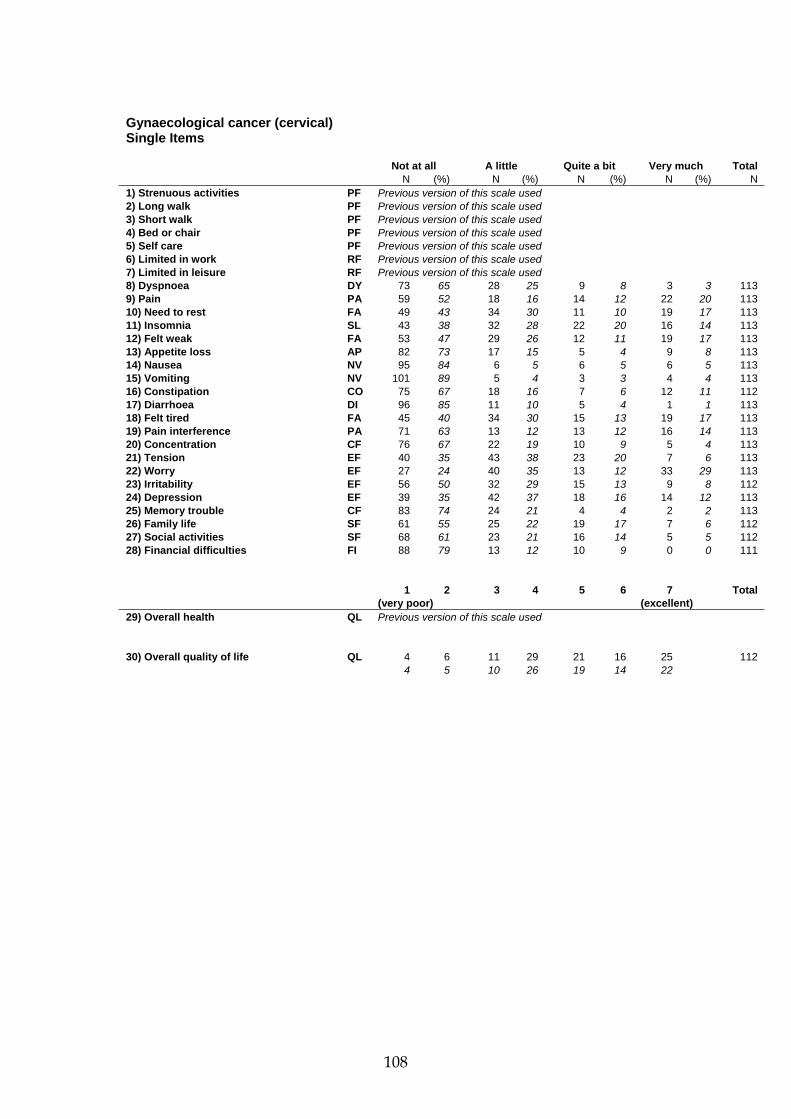
108
Gynaecological cancer (cervical) Single Items Not at all A little Quite a bit Very much Total N (%) N (%) N (%) N (%) N 1) Strenuous activities PF Previous version of this scale used 2) Long walk PF Previous version of this scale used 3) Short walk PF Previous version of this scale used 4) Bed or chair PF Previous version of this scale used 5) Self care PF Previous version of this scale used 6) Limited in work RF Previous version of this scale used 7) Limited in leisure RF Previous version of this scale used 8) Dyspnoea DY 73 65 28 25 9 8 3 3 113 9) Pain PA 59 52 18 16 14 12 22 20 113 10) Need to rest FA 49 43 34 30 11 10 19 17 113 11) Insomnia SL 43 38 32 28 22 20 16 14 113 12) Felt weak FA 53 47 29 26 12 11 19 17 113 13) Appetite loss AP 82 73 17 15 5 4 9 8 113 14) Nausea NV 95 84 6 5 6 5 6 5 113 15) Vomiting NV 101 89 5 4 3 3 4 4 113 16) Constipation CO 75 67 18 16 7 6 12 11 112 17) Diarrhoea DI 96 85 11 10 5 4 1 1 113 18) Felt tired FA 45 40 34 30 15 13 19 17 113 19) Pain interference PA 71 63 13 12 13 12 16 14 113 20) Concentration CF 76 67 22 19 10 9 5 4 113 21) Tension EF 40 35 43 38 23 20 7 6 113 22) Worry EF 27 24 40 35 13 12 33 29 113 23) Irritability EF 56 50 32 29 15 13 9 8 112 24) Depression EF 39 35 42 37 18 16 14 12 113 25) Memory trouble CF 83 74 24 21 4 4 2 2 113 26) Family life SF 61 55 25 22 19 17 7 6 112 27) Social activities SF 68 61 23 21 16 14 5 5 112 28) Financial difficulties FI 88 79 13 12 10 9 0 0 111 1 2 3 4 5 6 7 Total (very poor) (excellent) 29) Overall health QL Previous version of this scale used 30) Overall quality of life QL 4 6 11 29 21 16 25 112 4 5 10 26 19 14 22

109
Gynaecological cancer (ovarian): all stages Characteristics of the sample Version of the QLQ-C30 N (%) v 1.0 10 1 v +3 64 7 v 2.0 109 12 v 3.0 734 80 Total 917 Age N (%) <40 44 5 40-49 136 15 50-59 255 28 60-69 317 35 70-79 156 17 80+ 8 1 Not known 1 0 Total 917 Stage N (%) Stage I-II 214 23 Stage III-IV 662 72 Recurrent/metastatic 18 2 Not known 23 3 Total 917 Constructed scales Mean (SD) Median [IQR] Global health status/QoL QL 60.0 (25.2) 62.5 [50-83.3] Physical functioning PF 77.5 (21.8) 80 [66.7-93.3] Role Functioning RF 66.0 (33.5) 66.7 [33.3-100] Emotional functioning EF 67.9 (25.3) 75 [50-91.7] Cognitive functioning CF 81.6 (22.4) 83.3 [66.7-100] Social functioning SF 72.1 (31.2) 83.3 [50-100] Fatigue FA 37.6 (28.8) 33.3 [11.1-55.6] Nausea and vomiting NV 11.2 (21.5) 0 [0-16.7] Pain PA 26.7 (28.7) 16.7 [0-50] Dyspnoea DY 19.4 (27.6) 0 [0-33.3] Insomnia SL 34.5 (33.7) 33.3 [0-66.7] Appetite loss AP 25.7 (34.2) 0 [0-33.3] Constipation CO 22.0 (30.6) 0 [0-33.3] Diarrhoea DI 10.8 (22.6) 0 [0-0] Financial difficulties FI 13.2 (26.1) 0 [0-33.3]

110
Gynaecological cancer (ovarian): all stagesConstructed scales QL N (%) CF N (%) 0 19 2 0 11 1 8.3 14 2 16.7 16 2 16.7 45 5 33.3 37 4 25 36 4 50 52 6 33.3 64 7 66.7 159 18 41.7 42 5 83.3 223 25 50 158 18 100 402 45 58.3 68 8 Total 900 66.7 138 16 75 70 8 83.3 119 13 91.7 36 4 SF N (%) 100 83 9 0 57 6 Total 892 16.7 30 3 33.3 91 10 PF N (%) 50 75 8 0 0 0 66.7 147 16 6.7 6 1 83.3 122 14 13.3 2 0 100 373 42 20 5 1 Total 895 26.7 16 2 33.3 14 2 40 26 4 46.7 25 4 FA N (%) 53.3 38 5 0 149 17 60 30 4 11.1 92 10 66.7 58 8 22.2 127 14 73.3 67 9 33.3 168 19 80 76 11 44.4 78 9 86.7 84 12 55.6 73 8 93.3 108 15 66.7 83 9 100 165 23 77.8 53 6 Total 720 88.9 34 4 100 42 5 RF N (%) Total 899 0 84 9 16.7 46 5 33.3 104 12 50 73 8 NV N (%) 66.7 174 20 0 624 68 83.3 100 11 16.7 134 15 100 310 35 33.3 78 9 Total 891 50 30 3 66.7 20 2 EF N (%) 83.3 7 1 0 15 2 100 20 2 8.3 11 1 Total 913 16.7 22 2 25 25 3 33.3 50 6 41.7 66 7 PA N (%) 50 66 7 0 335 37 58.3 71 8 16.7 176 20 66.7 106 12 33.3 161 18 75 120 13 50 73 8 83.3 110 12 66.7 81 9 91.7 105 12 83.3 41 5 100 134 15 100 33 4 Total 901 Total 900

111
Gynaecological cancer (ovarian): all stages Single Items Not at all A little Quite a bit Very much Total N (%) N (%) N (%) N (%) N 1) Strenuous activities PF 233 32 218 30 159 22 121 17 731 2) Long walk PF 274 38 197 27 153 21 106 15 730 3) Short walk PF 528 72 130 18 57 8 17 2 732 4) Bed or chair PF 461 63 170 23 78 11 22 3 731 5) Self care PF 675 93 41 6 10 1 4 1 730 6) Limited in work RF 349 39 257 29 173 19 120 13 899 7) Limited in leisure RF 408 46 223 25 144 16 121 14 896 8) Dyspnoea DY 549 60 231 25 97 11 35 4 912 9) Pain PA 376 41 323 35 156 17 58 6 913 10) Need to rest FA 250 27 347 38 210 23 106 12 913 11) Insomnia SL 356 39 270 29 195 21 96 11 917 12) Felt weak FA 339 37 305 33 184 20 86 9 914 13) Appetite loss AP 516 56 187 20 119 13 94 10 916 14) Nausea NV 637 70 174 19 70 8 33 4 914 15) Vomiting NV 789 86 75 8 29 3 23 3 916 16) Constipation CO 522 58 225 25 92 10 62 7 901 17) Diarrhoea DI 701 78 135 15 49 5 20 2 905 18) Felt tired FA 233 26 375 41 198 22 99 11 905 19) Pain interference PA 510 56 206 23 120 13 68 8 904 20) Concentration CF 545 60 229 25 99 11 37 4 910 21) Tension EF 301 33 358 39 176 19 74 8 909 22) Worry EF 220 24 335 37 215 24 140 15 910 23) Irritability EF 497 55 273 30 104 11 35 4 909 24) Depression EF 403 45 280 31 155 17 68 8 906 25) Memory trouble CF 554 62 262 29 58 6 27 3 901 26) Family life SF 487 54 215 24 118 13 84 9 904 27) Social activities SF 438 49 214 24 145 16 100 11 897 28) Financial difficulties FI 672 75 131 15 57 6 37 4 897 1 2 3 4 5 6 7 Total (very poor) (excellent) 29) Overall health QL 29 68 110 215 210 157 104 893 3 8 12 24 24 18 12 30) Overall quality of life QL 32 79 104 181 194 194 119 903 4 9 12 20 22 22 13

112
Gynaecological cancer (ovarian): stage I-II Characteristics of the sample Version of the QLQ-C30 N (%) v 1.0 9 4 v +3 3 1 v 2.0 23 11 v 3.0 179 84 Total 214 Age N (%) <40 25 12 40-49 37 17 50-59 64 30 60-69 57 27 70-79 29 14 80+ 1 1 Not known 1 1 Total 214 Constructed scales Mean (SD) Median [IQR] Global health status/QoL QL 72.6 (22.7) 75 [58.3-91.7] Physical functioning PF 86.4 (17.5) 93.3 [80-100] Role Functioning RF 84.1 (25.3) 100 [66.7-100] Emotional functioning EF 71.5 (26.1) 75 [58.3-91.7] Cognitive functioning CF 83.8 (23.5) 100 [83.3-100] Social functioning SF 84.2 (25.2) 100 [83.3-100] Fatigue FA 24.4 (25.4) 22.2 [0-33.3] Nausea and vomiting NV 7.2 (17.7) 0 [0-0] Pain PA 17.6 (24.2) 0 [0-33.3] Dyspnoea DY 10.7 (20.5) 0 [0-33.3] Insomnia SL 34.7 (35) 33.3 [0-66.7] Appetite loss AP 10.0 (22.2) 0 [0-0] Constipation CO 18.5 (27.5) 0 [0-33.3] Diarrhoea DI 6.6 (19) 0 [0-0] Financial difficulties FI 11.7 (25.4) 0 [0-0]

113
Gynaecological cancer (ovarian): stage I-II Constructed scales QL N (%) CF N (%) 0 2 1 0 4 2 8.3 3 2 16.7 6 3 16.7 3 2 33.3 6 3 25 2 1 50 8 4 33.3 8 4 66.7 24 11 41.7 1 1 83.3 54 26 50 25 12 100 108 51 58.3 8 4 Total 210 66.7 32 16 75 22 11 83.3 44 22 91.7 16 8 SF N (%) 100 36 18 0 6 3 Total 202 16.7 5 2 33.3 7 3 PF N (%) 50 9 4 0 0 0 66.7 25 12 6.7 1 1 83.3 33 16 13.3 0 0 100 125 60 20 1 1 Total 210 26.7 2 1 33.3 0 0 40 3 2 46.7 1 1 FA N (%) 53.3 4 2 0 63 30 60 4 2 11.1 32 16 66.7 10 6 22.2 35 17 73.3 11 6 33.3 33 16 80 20 11 44.4 13 6 86.7 18 10 55.6 13 6 93.3 33 19 66.7 5 2 100 68 39 77.8 4 2 Total 176 88.9 2 1 100 7 3 RF N (%) Total 207 0 7 3 16.7 4 2 33.3 7 3 50 3 2 NV N (%) 66.7 34 17 0 169 79 83.3 28 14 16.7 21 10 100 122 60 33.3 15 7 Total 205 50 2 1 66.7 3 1 EF N (%) 83.3 1 1 0 7 3 100 3 1 8.3 1 1 Total 214 16.7 7 3 25 4 2 33.3 6 3 41.7 9 4 PA N (%) 50 8 4 0 110 52 58.3 12 6 16.7 38 18 66.7 28 14 33.3 31 15 75 32 16 50 13 6 83.3 24 12 66.7 12 6 91.7 31 15 83.3 1 1 100 38 18 100 5 2 Total 207 Total 210
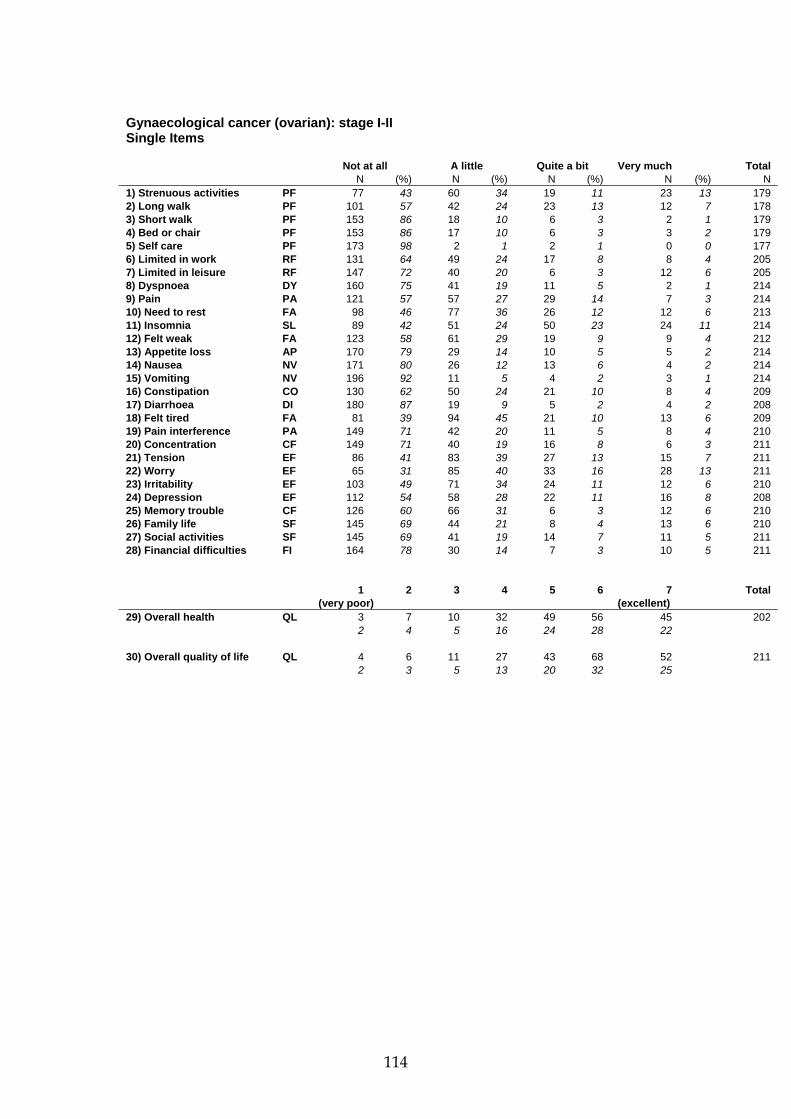
114
Gynaecological cancer (ovarian): stage I-II Single Items Not at all A little Quite a bit Very much Total N (%) N (%) N (%) N (%) N 1) Strenuous activities PF 77 43 60 34 19 11 23 13 179 2) Long walk PF 101 57 42 24 23 13 12 7 178 3) Short walk PF 153 86 18 10 6 3 2 1 179 4) Bed or chair PF 153 86 17 10 6 3 3 2 179 5) Self care PF 173 98 2 1 2 1 0 0 177 6) Limited in work RF 131 64 49 24 17 8 8 4 205 7) Limited in leisure RF 147 72 40 20 6 3 12 6 205 8) Dyspnoea DY 160 75 41 19 11 5 2 1 214 9) Pain PA 121 57 57 27 29 14 7 3 214 10) Need to rest FA 98 46 77 36 26 12 12 6 213 11) Insomnia SL 89 42 51 24 50 23 24 11 214 12) Felt weak FA 123 58 61 29 19 9 9 4 212 13) Appetite loss AP 170 79 29 14 10 5 5 2 214 14) Nausea NV 171 80 26 12 13 6 4 2 214 15) Vomiting NV 196 92 11 5 4 2 3 1 214 16) Constipation CO 130 62 50 24 21 10 8 4 209 17) Diarrhoea DI 180 87 19 9 5 2 4 2 208 18) Felt tired FA 81 39 94 45 21 10 13 6 209 19) Pain interference PA 149 71 42 20 11 5 8 4 210 20) Concentration CF 149 71 40 19 16 8 6 3 211 21) Tension EF 86 41 83 39 27 13 15 7 211 22) Worry EF 65 31 85 40 33 16 28 13 211 23) Irritability EF 103 49 71 34 24 11 12 6 210 24) Depression EF 112 54 58 28 22 11 16 8 208 25) Memory trouble CF 126 60 66 31 6 3 12 6 210 26) Family life SF 145 69 44 21 8 4 13 6 210 27) Social activities SF 145 69 41 19 14 7 11 5 211 28) Financial difficulties FI 164 78 30 14 7 3 10 5 211 1 2 3 4 5 6 7 Total (very poor) (excellent) 29) Overall health QL 3 7 10 32 49 56 45 202 2 4 5 16 24 28 22 30) Overall quality of life QL 4 6 11 27 43 68 52 211 2 3 5 13 20 32 25

115
Gynaecological cancer (ovarian): stage III-IV Characteristics of the sample Version of the QLQ-C30 N (%) v 1.0 0 0 v +3 61 9 v 2.0 79 12 v 3.0 522 79 Total 662 Age N (%) <40 19 3 40-49 92 14 50-59 181 27 60-69 249 38 70-79 114 17 80+ 7 1 Not known 0 0 Total 662 Constructed scales Mean (SD) Median [IQR] Global health status/QoL QL 56.3 (24.5) 58.3 [41.7-75] Physical functioning PF 74.9 (21.9) 80 [60-93.3] Role Functioning RF 60.8 (33.6) 66.7 [33.3-100] Emotional functioning EF 66.7 (25.1) 66.7 [50-83.3] Cognitive functioning CF 81.3 (21.7) 83.3 [66.7-100] Social functioning SF 68.3 (32.2) 66.7 [50-100] Fatigue FA 41.2 (28.1) 33.3 [22.2-66.7] Nausea and vomiting NV 12.2 (21.8) 0 [0-16.7] Pain PA 29.0 (29) 16.7 [0-50] Dyspnoea DY 21.9 (28.8) 0 [0-33.3] Insomnia SL 34.6 (33.2) 33.3 [0-66.7] Appetite loss AP 30.8 (35.5) 33.3 [0-66.7] Constipation CO 22.6 (31.1) 0 [0-33.3] Diarrhoea DI 12.0 (23.4) 0 [0-33.3] Financial difficulties FI 13.5 (26.3) 0 [0-33.3]

116
Gynaecological cancer (ovarian): stage III-IVConstructed scales
QL N (%) CF N (%)
0 15 2 0 5 1 8.3 11 2 16.7 9 1 16.7 36 6 33.3 30 5 25 34 5 50 42 7 33.3 52 8 66.7 123 19 41.7 41 6 83.3 161 25 50 129 20 100 280 43
58.3 56 9 Total 650 66.7 98 15 75 43 7 83.3 72 11 91.7 19 3 SF N (%)
100 44 7 0 50 8Total 650 16.7 24 4
33.3 77 12 PF N (%) 50 61 10
0 0 0 66.7 116 18 6.7 5 1 83.3 83 13 13.3 1 0 100 233 36
20 4 1 Total 644 26.7 10 2 33.3 14 3 40 20 4 46.7 24 5 FA N (%)
53.3 32 6 0 80 12 60 26 5 11.1 58 9 66.7 43 8 22.2 86 13 73.3 54 11 33.3 128 20 80 55 11 44.4 62 10 86.7 63 12 55.6 60 9 93.3 70 14 66.7 75 12 100 90 18 77.8 46 7
Total 511 88.9 26 4 100 30 5RF N (%) Total 651
0 72 11 16.7 40 6 33.3 86 13 50 68 11 NV N (%)
66.7 134 21 0 428 65 83.3 70 11 16.7 108 16 100 176 27 33.3 60 9
Total 646 50 27 4 66.7 16 2 EF N (%) 83.3 5 1
0 8 1 100 14 28.3 10 2 Total 658
16.7 14 2 25 20 3 33.3 42 6 41.7 55 8 PA N (%)
50 51 8 0 213 33 58.3 56 9 16.7 131 20 66.7 74 11 33.3 125 19 75 84 13 50 56 9 83.3 80 12 66.7 64 10 91.7 67 10 83.3 35 5 100 92 14 100 25 4
Total 653 Total 649

117
Gynaecological cancer (ovarian): stage III-IV Single Items Not at all A little Quite a bit Very much Total N (%) N (%) N (%) N (%) N 1) Strenuous activities PF 147 28 149 29 133 26 90 17 519 2) Long walk PF 160 31 149 29 122 24 88 17 519 3) Short walk PF 355 68 107 21 46 9 12 2 520 4) Bed or chair PF 290 56 146 28 65 13 18 4 519 5) Self care PF 476 92 34 7 7 1 3 1 520 6) Limited in work RF 206 32 199 30 146 22 103 16 654 7) Limited in leisure RF 247 38 173 27 128 20 103 16 651 8) Dyspnoea DY 366 56 182 28 78 12 31 5 657 9) Pain PA 242 37 255 39 117 18 44 7 658 10) Need to rest FA 141 21 259 39 177 27 82 12 659 11) Insomnia SL 249 38 205 31 142 22 66 10 662 12) Felt weak FA 206 31 230 35 159 24 66 10 661 13) Appetite loss AP 321 49 151 23 108 16 81 12 661 14) Nausea NV 438 67 142 22 54 8 25 4 659 15) Vomiting NV 561 85 60 9 23 4 17 3 661 16) Constipation CO 374 58 161 25 68 10 48 7 651 17) Diarrhoea DI 490 75 110 17 41 6 15 2 656 18) Felt tired FA 144 22 265 41 169 26 77 12 655 19) Pain interference PA 339 52 161 25 98 15 55 8 653 20) Concentration CF 375 57 176 27 79 12 28 4 658 21) Tension EF 199 30 262 40 139 21 57 9 657 22) Worry EF 142 22 236 36 171 26 109 17 658 23) Irritability EF 374 57 187 28 75 11 22 3 658 24) Depression EF 276 42 206 31 128 20 47 7 657 25) Memory trouble CF 407 63 186 29 46 7 12 2 651 26) Family life SF 323 50 161 25 103 16 66 10 653 27) Social activities SF 273 42 161 25 125 19 86 13 645 28) Financial difficulties FI 480 74 94 15 45 7 26 4 645 1 2 3 4 5 6 7 Total (very poor) (excellent) 29) Overall health QL 23 55 96 174 151 97 55 651 4 8 15 27 23 15 8 30) Overall quality of life QL 26 67 90 150 140 114 64 651 4 10 14 23 22 18 10

118
Head and neck cancer: all stages Characteristics of the sample Version of the QLQ-C30 Primary disease site N (%) N (%) v 1.0 23 1 Head and neck: oral cavity 189 6 v +3 688 24 Head and neck: oropharynx 80 3 v 2.0 489 17 Head and neck: hypopharynx 74 3 v 3.0 1,729 59 Head and neck: larynx 362 12 Total 2,929 Head and neck: oral cavity/larynx 1 0 Head and neck: oral cavity/oropharynx 2 0 Ophthalmic 2 0 Age Thyroid 5 0 N (%) Maxilla 1 0 <40 110 4 Head and neck: not known 2,213 76 40-49 480 16 Total 2,929 50-59 919 31 60-69 832 28 70-79 489 17 80+ 97 3 Not known 2 0 Total 2,929 Gender N (%) Male 2,318 79 Female 589 20 Not known 22 1 Total 2,929 Stage N (%) Stage I-II 946 32 Stage III-IV 1,722 59 Recurrent/metastatic 37 1 Not known 224 8 Total 2,929 Constructed scales Mean (SD) Median [IQR] Global health status/QoL QL 64.1 (22.7) 66.7 [50-83.3] Physical functioning PF 81.2 (20.4) 86.7 [66.7-100] Role Functioning RF 78.9 (28.1) 100 [66.7-100] Emotional functioning EF 72.5 (24.1) 75 [58.3-91.7] Cognitive functioning CF 85.9 (19.7) 100 [83.3-100] Social functioning SF 82.6 (24.7) 100 [66.7-100] Fatigue FA 26.9 (24.9) 22.2 [0-44.4] Nausea and vomiting NV 5.3 (13.7) 0 [0-0] Pain PA 23.2 (26.1) 16.7 [0-33.3] Dyspnoea DY 18.2 (26.9) 0 [0-33.3] Insomnia SL 27.3 (31.8) 33.3 [0-33.3] Appetite loss AP 17.7 (28.2) 0 [0-33.3] Constipation CO 11.1 (22.6) 0 [0-0] Diarrhoea DI 6.1 (16.9) 0 [0-0] Financial difficulties FI 18.2 (29.6) 0 [0-33.3]

119
Head and neck cancer: all stages Constructed scales QL N (%) CF N (%) 0 31 1 0 17 1 8.3 10 0 16.7 22 1 16.7 89 3 33.3 66 2 25 53 2 50 193 7 33.3 202 7 66.7 375 13 41.7 166 6 83.3 643 22 50 433 15 100 1,579 55 58.3 241 8 Total 2,895 66.7 529 19 75 239 8 83.3 454 16 91.7 118 4 SF N (%) 100 291 10 0 57 2 Total 2,856 16.7 55 2 33.3 139 5 PF N (%) 50 187 7 0 5 0 66.7 449 16 6.7 6 0 83.3 402 14 13.3 4 0 100 1,610 56 20 17 1 Total 2,899 26.7 18 1 33.3 21 1 40 29 2 46.7 44 3 FA N (%) 53.3 73 4 0 779 27 60 89 5 11.1 381 13 66.7 124 7 22.2 451 16 73.3 124 7 33.3 520 18 80 180 11 44.4 249 9 86.7 208 12 55.6 193 7 93.3 254 15 66.7 150 5 100 505 30 77.8 52 2 Total 1,701 88.9 54 2 100 53 2 RF N (%) Total 2,882 0 111 4 16.7 68 2 33.3 203 7 50 178 6 NV N (%) 66.7 467 16 0 2,394 82 83.3 350 12 16.7 284 10 100 1,500 52 33.3 147 5 Total 2,877 50 52 2 66.7 25 1 EF N (%) 83.3 9 0 0 26 1 100 8 0 8.3 43 2 Total 2,919 16.7 58 2 25 52 2 33.3 98 3 41.7 143 5 PA N (%) 50 180 6 0 1,144 40 58.3 232 8 16.7 660 23 66.7 368 13 33.3 487 17 75 338 12 50 259 9 83.3 403 14 66.7 182 6 91.7 368 13 83.3 99 3 100 579 20 100 66 2 Total 2,888 Total 2,897

120
Head and neck cancer: all stages Single Items Not at all A little Quite a bit Very much Total N (%) N (%) N (%) N (%) N 1) Strenuous activities PF 685 40 466 27 370 22 200 12 1,721 2) Long walk PF 804 47 427 25 313 18 178 10 1,722 3) Short walk PF 1,365 80 242 14 72 4 37 2 1,716 4) Bed or chair PF 1,160 67 374 22 142 8 45 3 1,721 5) Self care PF 1,611 93 65 4 29 2 19 1 1,724 6) Limited in work RF 1,657 57 679 24 372 13 183 6 2,891 7) Limited in leisure RF 1,823 63 607 21 299 10 158 6 2,887 8) Dyspnoea DY 1,808 62 744 26 262 9 109 4 2,923 9) Pain PA 1,293 44 981 34 488 17 155 5 2,917 10) Need to rest FA 1,120 38 1,154 40 492 17 151 5 2,917 11) Insomnia SL 1,438 49 775 27 507 17 200 7 2,920 12) Felt weak FA 1,489 51 919 32 381 13 130 5 2,919 13) Appetite loss AP 1,927 66 564 19 300 10 128 4 2,919 14) Nausea NV 2,453 84 346 12 99 3 27 1 2,925 15) Vomiting NV 2,687 92 181 6 41 1 14 1 2,923 16) Constipation CO 2,224 76 462 16 169 6 58 2 2,913 17) Diarrhoea DI 2,514 86 295 10 82 3 25 1 2,916 18) Felt tired FA 1,153 40 1,222 42 408 14 119 4 2,902 19) Pain interference PA 1,803 62 691 24 300 10 113 4 2,907 20) Concentration CF 2,049 70 603 21 207 7 51 2 2,910 21) Tension EF 1,175 40 1,124 39 460 16 153 5 2,912 22) Worry EF 916 31 1,151 39 575 20 276 10 2,918 23) Irritability EF 1,514 52 958 33 324 11 117 4 2,913 24) Depression EF 1,482 51 956 33 358 12 116 4 2,912 25) Memory trouble CF 1,928 66 720 25 214 7 47 2 2,909 26) Family life SF 1,970 68 605 21 234 8 95 3 2,904 27) Social activities SF 1,800 62 673 23 293 10 143 5 2,909 28) Financial difficulties FI 1,938 67 522 18 274 9 171 6 2,905 1 2 3 4 5 6 7 Total (very poor) (excellent) 29) Overall health QL 51 136 327 676 744 580 353 2,867 2 5 11 24 26 20 12 30) Overall quality of life QL 59 115 322 549 715 689 429 2,878 2 4 11 19 25 24 15
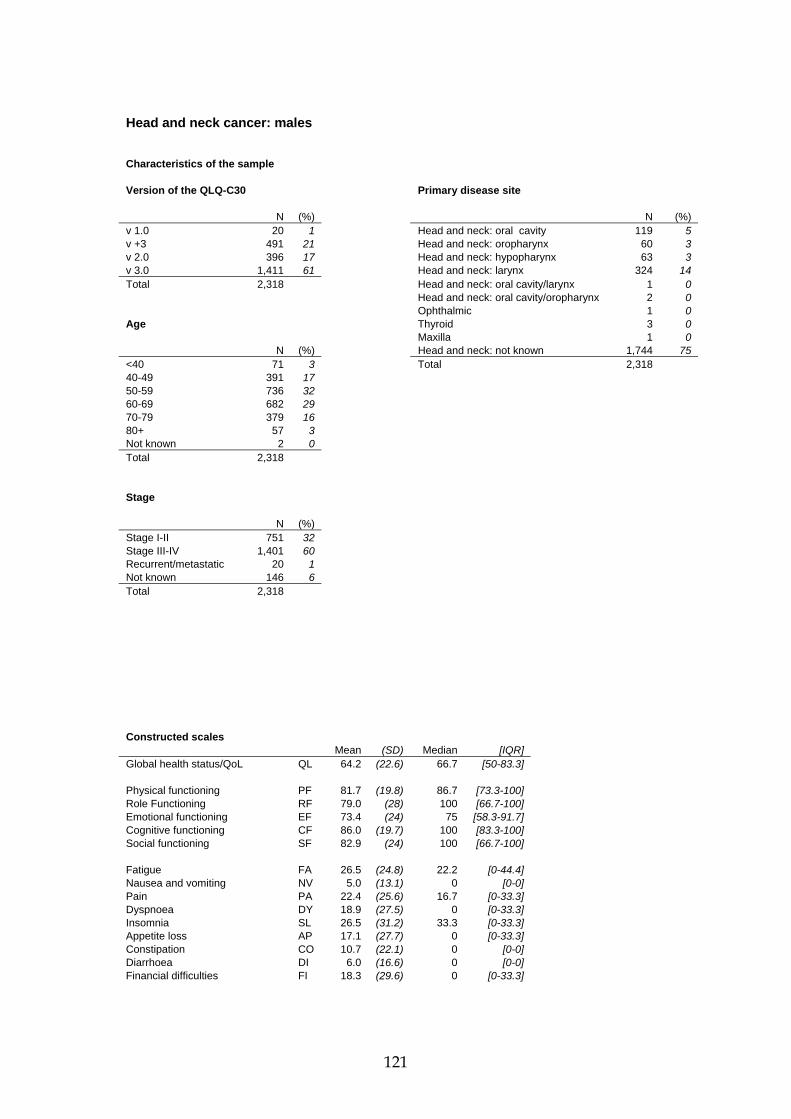
121
Head and neck cancer: males Characteristics of the sample Version of the QLQ-C30 Primary disease site N (%) N (%) v 1.0 20 1 Head and neck: oral cavity 119 5 v +3 491 21 Head and neck: oropharynx 60 3 v 2.0 396 17 Head and neck: hypopharynx 63 3 v 3.0 1,411 61 Head and neck: larynx 324 14 Total 2,318 Head and neck: oral cavity/larynx 1 0 Head and neck: oral cavity/oropharynx 2 0 Ophthalmic 1 0 Age Thyroid 3 0 Maxilla 1 0 N (%) Head and neck: not known 1,744 75 <40 71 3 Total 2,318 40-49 391 17 50-59 736 32 60-69 682 29 70-79 379 16 80+ 57 3 Not known 2 0 Total 2,318 Stage N (%) Stage I-II 751 32 Stage III-IV 1,401 60 Recurrent/metastatic 20 1 Not known 146 6 Total 2,318 Constructed scales Mean (SD) Median [IQR] Global health status/QoL QL 64.2 (22.6) 66.7 [50-83.3] Physical functioning PF 81.7 (19.8) 86.7 [73.3-100] Role Functioning RF 79.0 (28) 100 [66.7-100] Emotional functioning EF 73.4 (24) 75 [58.3-91.7] Cognitive functioning CF 86.0 (19.7) 100 [83.3-100] Social functioning SF 82.9 (24) 100 [66.7-100] Fatigue FA 26.5 (24.8) 22.2 [0-44.4] Nausea and vomiting NV 5.0 (13.1) 0 [0-0] Pain PA 22.4 (25.6) 16.7 [0-33.3] Dyspnoea DY 18.9 (27.5) 0 [0-33.3] Insomnia SL 26.5 (31.2) 33.3 [0-33.3] Appetite loss AP 17.1 (27.7) 0 [0-33.3] Constipation CO 10.7 (22.1) 0 [0-0] Diarrhoea DI 6.0 (16.6) 0 [0-0] Financial difficulties FI 18.3 (29.6) 0 [0-33.3]

122
Head and neck cancer: males Constructed scales QL N (%) CF N (%) 0 22 1 0 15 1 8.3 9 0 16.7 16 1 16.7 68 3 33.3 50 2 25 42 2 50 152 7 33.3 156 7 66.7 302 13 41.7 131 6 83.3 501 22 50 358 16 100 1,259 55 58.3 190 8 Total 2,295 66.7 404 18 75 186 8 83.3 362 16 91.7 95 4 SF N (%) 100 230 10 0 37 2 Total 2,253 16.7 42 2 33.3 101 4 PF N (%) 50 152 7 0 2 0 66.7 366 16 6.7 4 0 83.3 328 14 13.3 3 0 100 1,267 55 20 15 1 Total 2,293 26.7 13 1 33.3 13 1 40 24 2 46.7 35 3 FA N (%) 53.3 54 4 0 635 28 60 79 6 11.1 308 14 66.7 98 7 22.2 343 15 73.3 104 8 33.3 406 18 80 142 10 44.4 200 9 86.7 168 12 55.6 160 7 93.3 215 16 66.7 116 5 100 422 30 77.8 37 2 Total 1,391 88.9 40 2 100 40 2 RF N (%) Total 2,285 0 80 4 16.7 56 3 33.3 173 8 50 140 6 NV N (%) 66.7 363 16 0 1,913 83 83.3 264 12 16.7 214 9 100 1,200 53 33.3 115 5 Total 2,276 50 39 2 66.7 15 1 EF N (%) 83.3 7 0 0 20 1 100 5 0 8.3 36 2 Total 2,308 16.7 45 2 25 38 2 33.3 72 3 41.7 100 4 PA N (%) 50 138 6 0 921 40 58.3 173 8 16.7 541 24 66.7 276 12 33.3 373 16 75 274 12 50 205 9 83.3 330 14 66.7 138 6 91.7 301 13 83.3 70 3 100 482 21 100 48 2 Total 2,285 Total 2,296
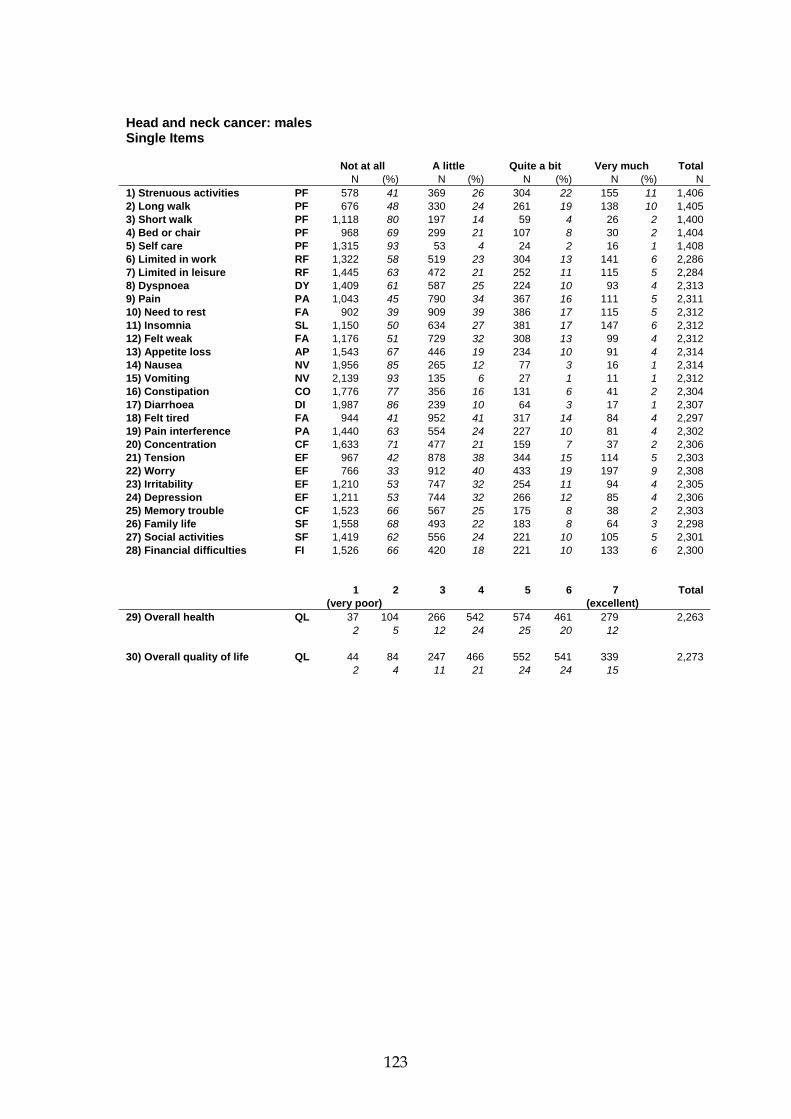
123
Head and neck cancer: males Single Items Not at all A little Quite a bit Very much Total N (%) N (%) N (%) N (%) N 1) Strenuous activities PF 578 41 369 26 304 22 155 11 1,406 2) Long walk PF 676 48 330 24 261 19 138 10 1,405 3) Short walk PF 1,118 80 197 14 59 4 26 2 1,400 4) Bed or chair PF 968 69 299 21 107 8 30 2 1,404 5) Self care PF 1,315 93 53 4 24 2 16 1 1,408 6) Limited in work RF 1,322 58 519 23 304 13 141 6 2,286 7) Limited in leisure RF 1,445 63 472 21 252 11 115 5 2,284 8) Dyspnoea DY 1,409 61 587 25 224 10 93 4 2,313 9) Pain PA 1,043 45 790 34 367 16 111 5 2,311 10) Need to rest FA 902 39 909 39 386 17 115 5 2,312 11) Insomnia SL 1,150 50 634 27 381 17 147 6 2,312 12) Felt weak FA 1,176 51 729 32 308 13 99 4 2,312 13) Appetite loss AP 1,543 67 446 19 234 10 91 4 2,314 14) Nausea NV 1,956 85 265 12 77 3 16 1 2,314 15) Vomiting NV 2,139 93 135 6 27 1 11 1 2,312 16) Constipation CO 1,776 77 356 16 131 6 41 2 2,304 17) Diarrhoea DI 1,987 86 239 10 64 3 17 1 2,307 18) Felt tired FA 944 41 952 41 317 14 84 4 2,297 19) Pain interference PA 1,440 63 554 24 227 10 81 4 2,302 20) Concentration CF 1,633 71 477 21 159 7 37 2 2,306 21) Tension EF 967 42 878 38 344 15 114 5 2,303 22) Worry EF 766 33 912 40 433 19 197 9 2,308 23) Irritability EF 1,210 53 747 32 254 11 94 4 2,305 24) Depression EF 1,211 53 744 32 266 12 85 4 2,306 25) Memory trouble CF 1,523 66 567 25 175 8 38 2 2,303 26) Family life SF 1,558 68 493 22 183 8 64 3 2,298 27) Social activities SF 1,419 62 556 24 221 10 105 5 2,301 28) Financial difficulties FI 1,526 66 420 18 221 10 133 6 2,300 1 2 3 4 5 6 7 Total (very poor) (excellent) 29) Overall health QL 37 104 266 542 574 461 279 2,263 2 5 12 24 25 20 12 30) Overall quality of life QL 44 84 247 466 552 541 339 2,273 2 4 11 21 24 24 15

124
Head and neck cancer: females Characteristics of the sample Version of the QLQ-C30 Primary disease site N (%) N (%) v 1.0 3 1 Head and neck: oral cavity 70 12 v +3 197 33 Head and neck: oropharynx 20 3 v 2.0 82 14 Head and neck: hypopharynx 11 2 v 3.0 307 52 Head and neck: larynx 38 6 Total 589 Ophthalmic 1 0 Thyroid 2 0 Head and neck: not known 447 76 Age Total 589 N (%) <40 38 7 40-49 85 14 50-59 176 30 60-69 143 24 70-79 107 18 80+ 40 7 Not known 0 0 Total 589 Stage N (%) Stage I-II 195 33 Stage III-IV 316 54 Recurrent/metastatic 17 3 Not known 61 10 Total 589 Constructed scales Mean (SD) Median [IQR] Global health status/QoL QL 63.9 (23.2) 66.7 [50-83.3] Physical functioning PF 78.1 (22.6) 86.7 [66.7-100] Role Functioning RF 78.6 (28.5) 100 [66.7-100] Emotional functioning EF 68.7 (24.3) 66.7 [50-91.7] Cognitive functioning CF 85.4 (19.9) 100 [83.3-100] Social functioning SF 81.3 (27.3) 100 [66.7-100] Fatigue FA 28.6 (25.6) 22.2 [11.1-44.4] Nausea and vomiting NV 6.6 (15.8) 0 [0-0] Pain PA 26.0 (27.9) 16.7 [0-33.3] Dyspnoea DY 15.5 (24.5) 0 [0-33.3] Insomnia SL 30.5 (34) 33.3 [0-66.7] Appetite loss AP 20.0 (30.5) 0 [0-33.3] Constipation CO 12.7 (24.2) 0 [0-33.3] Diarrhoea DI 6.3 (18.1) 0 [0-0] Financial difficulties FI 17.8 (29.9) 0 [0-33.3]
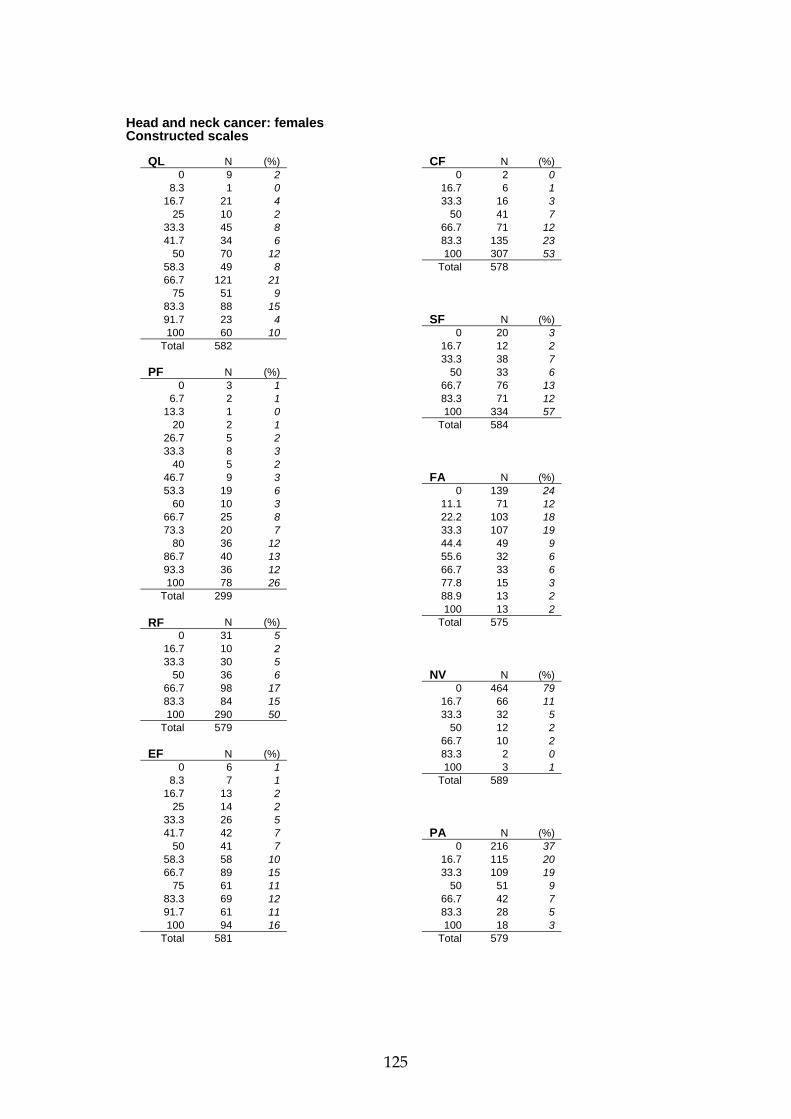
125
Head and neck cancer: females Constructed scales QL N (%) CF N (%) 0 9 2 0 2 0 8.3 1 0 16.7 6 1 16.7 21 4 33.3 16 3 25 10 2 50 41 7 33.3 45 8 66.7 71 12 41.7 34 6 83.3 135 23 50 70 12 100 307 53 58.3 49 8 Total 578 66.7 121 21 75 51 9 83.3 88 15 91.7 23 4 SF N (%) 100 60 10 0 20 3 Total 582 16.7 12 2 33.3 38 7 PF N (%) 50 33 6 0 3 1 66.7 76 13 6.7 2 1 83.3 71 12 13.3 1 0 100 334 57 20 2 1 Total 584 26.7 5 2 33.3 8 3 40 5 2 46.7 9 3 FA N (%) 53.3 19 6 0 139 24 60 10 3 11.1 71 12 66.7 25 8 22.2 103 18 73.3 20 7 33.3 107 19 80 36 12 44.4 49 9 86.7 40 13 55.6 32 6 93.3 36 12 66.7 33 6 100 78 26 77.8 15 3 Total 299 88.9 13 2 100 13 2 RF N (%) Total 575 0 31 5 16.7 10 2 33.3 30 5 50 36 6 NV N (%) 66.7 98 17 0 464 79 83.3 84 15 16.7 66 11 100 290 50 33.3 32 5 Total 579 50 12 2 66.7 10 2 EF N (%) 83.3 2 0 0 6 1 100 3 1 8.3 7 1 Total 589 16.7 13 2 25 14 2 33.3 26 5 41.7 42 7 PA N (%) 50 41 7 0 216 37 58.3 58 10 16.7 115 20 66.7 89 15 33.3 109 19 75 61 11 50 51 9 83.3 69 12 66.7 42 7 91.7 61 11 83.3 28 5 100 94 16 100 18 3 Total 581 Total 579

126
Head and neck cancer: females Single Items Not at all A little Quite a bit Very much Total N (%) N (%) N (%) N (%) N 1) Strenuous activities PF 100 33 95 31 65 21 44 15 304 2) Long walk PF 121 40 94 31 51 17 40 13 306 3) Short walk PF 236 77 45 15 13 4 11 4 305 4) Bed or chair PF 183 60 73 24 35 11 15 5 306 5) Self care PF 285 93 12 4 5 2 3 1 305 6) Limited in work RF 325 56 151 26 67 12 40 7 583 7) Limited in leisure RF 366 63 128 22 44 8 43 7 581 8) Dyspnoea DY 384 65 150 26 38 7 16 3 588 9) Pain PA 241 41 184 32 117 20 42 7 584 10) Need to rest FA 213 37 230 40 105 18 35 6 583 11) Insomnia SL 278 47 133 23 122 21 53 9 586 12) Felt weak FA 301 52 183 31 70 12 31 5 585 13) Appetite loss AP 370 64 112 19 65 11 36 6 583 14) Nausea NV 478 81 78 13 22 4 11 2 589 15) Vomiting NV 529 90 44 8 13 2 3 1 589 16) Constipation CO 433 74 101 17 37 6 16 3 587 17) Diarrhoea DI 509 87 53 9 17 3 8 1 587 18) Felt tired FA 202 35 258 44 89 15 34 6 583 19) Pain interference PA 354 61 126 22 71 12 32 6 583 20) Concentration CF 397 68 123 21 48 8 14 2 582 21) Tension EF 195 33 239 41 114 19 39 7 587 22) Worry EF 145 25 227 39 137 23 79 13 588 23) Irritability EF 292 50 203 35 68 12 23 4 586 24) Depression EF 256 44 206 35 91 16 31 5 584 25) Memory trouble CF 391 67 145 25 39 7 9 2 584 26) Family life SF 399 68 106 18 48 8 31 5 584 27) Social activities SF 371 63 108 18 70 12 37 6 586 28) Financial difficulties FI 396 68 99 17 51 9 37 6 583 1 2 3 4 5 6 7 Total (very poor) (excellent) 29) Overall health QL 14 31 59 129 163 114 73 583 2 5 10 22 28 20 13 30) Overall quality of life QL 15 31 71 79 156 143 89 584 3 5 12 14 27 25 15

127
Head and neck cancer: <50 Characteristics of the sample Version of the QLQ-C30 Primary disease site N (%) N (%) v 1.0 8 1 Head and neck: oral cavity 31 5 v +3 113 19 Head and neck: oropharynx 17 3 v 2.0 116 20 Head and neck: hypopharynx 19 3 v 3.0 353 60 Head and neck: larynx 33 6 Total 590 Head and neck: oral cavity/oropharynx 2 0 Thyroid 1 0 Head and neck: not known 487 83 Age Total 590 N (%) <40 110 19 40-49 480 81 50-59 0 0 60-69 0 0 70-79 0 0 80+ 0 0 Not known 0 0 Total 590 Gender N (%) Male 462 78 Female 123 21 Not known 5 1 Total 590 Stage N (%) Stage I-II 122 21 Stage III-IV 391 66 Recurrent/metastatic 4 1 Not known 73 12 Total 590 Constructed scales Mean (SD) Median [IQR] Global health status/QoL QL 64.5 (20.8) 66.7 [50-83.3] Physical functioning PF 86.6 (16.3) 93.3 [80-100] Role Functioning RF 79.4 (26.3) 100 [66.7-100] Emotional functioning EF 69.6 (22.6) 75 [58.3-83.3] Cognitive functioning CF 85.1 (19.4) 100 [83.3-100] Social functioning SF 80.7 (23.7) 83.3 [66.7-100] Fatigue FA 27.7 (23.6) 22.2 [11.1-38.9] Nausea and vomiting NV 5.8 (14.1) 0 [0-0] Pain PA 25.7 (25.2) 16.7 [0-33.3] Dyspnoea DY 14.2 (23) 0 [0-33.3] Insomnia SL 29.6 (30.9) 33.3 [0-33.3] Appetite loss AP 17.1 (26.8) 0 [0-33.3] Constipation CO 10.0 (21.6) 0 [0-0] Diarrhoea DI 6.6 (15.9) 0 [0-0] Financial difficulties FI 25.5 (33.2) 0 [0-33.3]

128
Head and neck cancer: <50 Constructed scales QL N (%) CF N (%) 0 3 1 0 2 0 8.3 0 0 16.7 5 1 16.7 12 2 33.3 12 2 25 8 1 50 46 8 33.3 39 7 66.7 80 14 41.7 44 8 83.3 142 24 50 94 16 100 299 51 58.3 47 8 Total 586 66.7 107 19 75 57 10 83.3 101 17 91.7 21 4 SF N (%) 100 46 8 0 7 1 Total 579 16.7 6 1 33.3 38 7 PF N (%) 50 43 7 0 0 0 66.7 124 21 6.7 0 0 83.3 80 14 13.3 0 0 100 290 49 20 1 0 Total 588 26.7 3 1 33.3 1 0 40 5 1 46.7 3 1 FA N (%) 53.3 7 2 0 139 24 60 21 6 11.1 69 12 66.7 17 5 22.2 99 17 73.3 16 5 33.3 134 23 80 31 9 44.4 48 8 86.7 56 16 55.6 35 6 93.3 59 17 66.7 40 7 100 133 38 77.8 8 1 Total 353 88.9 8 1 100 8 1 RF N (%) Total 588 0 14 2 16.7 15 3 33.3 38 7 50 28 5 NV N (%) 66.7 131 23 0 477 81 83.3 59 10 16.7 55 9 100 294 51 33.3 36 6 Total 579 50 9 2 66.7 10 2 EF N (%) 83.3 2 0 0 2 0 100 0 0 8.3 6 1 Total 589 16.7 17 3 25 10 2 33.3 25 4 41.7 31 5 PA N (%) 50 38 7 0 185 32 58.3 55 9 16.7 147 25 66.7 95 16 33.3 121 21 75 84 14 50 66 11 83.3 89 15 66.7 34 6 91.7 51 9 83.3 26 4 100 82 14 100 9 2 Total 585 Total 588

129
Head and neck cancer: <50 Single Items Not at all A little Quite a bit Very much Total N (%) N (%) N (%) N (%) N 1) Strenuous activities PF 172 49 103 29 56 16 22 6 353 2) Long walk PF 197 56 93 26 47 13 16 5 353 3) Short walk PF 311 88 31 9 10 3 1 0 353 4) Bed or chair PF 257 73 70 20 25 7 1 0 353 5) Self care PF 338 96 12 3 2 1 1 0 353 6) Limited in work RF 327 56 147 25 77 13 29 5 580 7) Limited in leisure RF 353 61 153 26 47 8 27 5 580 8) Dyspnoea DY 394 67 151 26 32 5 12 2 589 9) Pain PA 204 35 245 42 111 19 28 5 588 10) Need to rest FA 206 35 259 44 99 17 25 4 589 11) Insomnia SL 249 42 193 33 106 18 39 7 587 12) Felt weak FA 268 45 220 37 87 15 15 3 590 13) Appetite loss AP 383 65 128 22 59 10 19 3 589 14) Nausea NV 493 84 68 12 24 4 5 1 590 15) Vomiting NV 530 90 46 8 12 2 1 0 589 16) Constipation CO 460 78 91 16 25 4 12 2 588 17) Diarrhoea DI 489 83 83 14 14 2 2 0 588 18) Felt tired FA 203 35 285 49 85 15 15 3 588 19) Pain interference PA 343 58 158 27 69 12 20 3 590 20) Concentration CF 379 65 142 24 57 10 10 2 588 21) Tension EF 186 32 266 45 101 17 36 6 589 22) Worry EF 132 22 268 45 137 23 53 9 590 23) Irritability EF 251 43 243 41 72 12 22 4 588 24) Depression EF 273 47 230 39 68 12 16 3 587 25) Memory trouble CF 397 68 149 25 35 6 7 1 588 26) Family life SF 356 61 169 29 45 8 18 3 588 27) Social activities SF 329 56 175 30 64 11 22 4 590 28) Financial difficulties FI 324 55 130 22 82 14 52 9 588 1 2 3 4 5 6 7 Total (very poor) (excellent) 29) Overall health QL 5 17 71 144 152 127 63 579 1 3 12 25 26 22 11 30) Overall quality of life QL 6 16 71 123 155 149 66 586 1 3 12 21 27 25 11

130
Head and neck cancer: 50-59 Characteristics of the sample Version of the QLQ-C30 Primary disease site N (%) N (%) v 1.0 8 1 Head and neck: oral cavity 58 6 v +3 219 24 Head and neck: oropharynx 37 4 v 2.0 185 20 Head and neck: hypopharynx 30 3 v 3.0 507 55 Head and neck: larynx 83 9 Total 919 Ophthalmic 1 0 Thyroid 2 0 Head and neck: not known 708 77 Age Total 919 N (%) <40 0 0 40-49 0 0 50-59 919 100 60-69 0 0 70-79 0 0 80+ 0 0 Not known 0 0 Total 919 Gender N (%) Male 736 80 Female 176 19 Not known 7 1 Total 919 Stage N (%) Stage I-II 247 27 Stage III-IV 599 65 Recurrent/metastatic 9 1 Not known 64 7 Total 919 Constructed scales Mean (SD) Median [IQR] Global health status/QoL QL 63.6 (22.9) 66.7 [50-83.3] Physical functioning PF 83.3 (19.1) 93.3 [73.3-100] Role Functioning RF 79.5 (28.4) 100 [66.7-100] Emotional functioning EF 70.5 (25.1) 75 [58.3-91.7] Cognitive functioning CF 86.4 (20.3) 100 [83.3-100] Social functioning SF 81.7 (25.4) 100 [66.7-100] Fatigue FA 25.5 (25.3) 22.2 [0-33.3] Nausea and vomiting NV 5.8 (14.7) 0 [0-0] Pain PA 23.5 (26.5) 16.7 [0-33.3] Dyspnoea DY 17.3 (26.4) 0 [0-33.3] Insomnia SL 29.4 (32.5) 33.3 [0-66.7] Appetite loss AP 18.9 (28.3) 0 [0-33.3] Constipation CO 9.2 (20) 0 [0-0] Diarrhoea DI 6.2 (17.3) 0 [0-0] Financial difficulties FI 20.4 (31.2) 0 [0-33.3]

131
Head and neck cancer: 50-59 Constructed scales QL N (%) CF N (%) 0 17 2 0 7 1 8.3 3 0 16.7 9 1 16.7 27 3 33.3 19 2 25 13 2 50 63 7 33.3 64 7 66.7 107 12 41.7 38 4 83.3 175 19 50 149 17 100 531 58 58.3 81 9 Total 911 66.7 171 19 75 71 8 83.3 138 15 91.7 41 5 SF N (%) 100 83 9 0 18 2 Total 896 16.7 19 2 33.3 51 6 PF N (%) 50 71 8 0 0 0 66.7 129 14 6.7 0 0 83.3 126 14 13.3 1 0 100 499 55 20 4 1 Total 913 26.7 7 1 33.3 5 1 40 6 1 46.7 11 2 FA N (%) 53.3 20 4 0 284 31 60 26 5 11.1 108 12 66.7 31 6 22.2 131 15 73.3 31 6 33.3 170 19 80 55 11 44.4 67 7 86.7 53 11 55.6 47 5 93.3 80 16 66.7 43 5 100 171 34 77.8 19 2 Total 501 88.9 16 2 100 19 2 RF N (%) Total 904 0 39 4 16.7 20 2 33.3 61 7 50 48 5 NV N (%) 66.7 140 16 0 746 82 83.3 109 12 16.7 85 9 100 486 54 33.3 43 5 Total 903 50 23 3 66.7 11 1 EF N (%) 83.3 3 0 0 12 1 100 3 0 8.3 21 2 Total 914 16.7 24 3 25 14 2 33.3 32 4 41.7 44 5 PA N (%) 50 62 7 0 357 39 58.3 80 9 16.7 209 23 66.7 112 12 33.3 152 17 75 110 12 50 75 8 83.3 131 14 66.7 68 8 91.7 105 12 83.3 25 3 100 162 18 100 25 3 Total 909 Total 911

132
Head and neck cancer: 50-59 Single Items Not at all A little Quite a bit Very much Total N (%) N (%) N (%) N (%) N 1) Strenuous activities PF 219 43 129 26 103 20 55 11 506 2) Long walk PF 263 52 124 25 79 16 39 8 505 3) Short walk PF 415 82 62 12 22 4 7 1 506 4) Bed or chair PF 355 71 106 21 29 6 13 3 503 5) Self care PF 474 94 22 4 8 2 1 0 505 6) Limited in work RF 539 59 199 22 111 12 59 7 908 7) Limited in leisure RF 587 65 174 19 94 10 51 6 906 8) Dyspnoea DY 580 63 234 26 71 8 34 4 919 9) Pain PA 399 44 312 34 150 16 55 6 916 10) Need to rest FA 376 41 350 38 137 15 49 5 912 11) Insomnia SL 422 46 255 28 167 18 74 8 918 12) Felt weak FA 492 54 288 31 91 10 47 5 918 13) Appetite loss AP 575 63 197 22 104 11 38 4 914 14) Nausea NV 760 83 111 12 36 4 9 1 916 15) Vomiting NV 838 91 55 6 17 2 7 1 917 16) Constipation CO 717 79 148 16 31 3 14 2 910 17) Diarrhoea DI 790 86 89 10 29 3 8 1 916 18) Felt tired FA 395 43 360 40 117 13 40 4 912 19) Pain interference PA 559 61 229 25 93 10 33 4 914 20) Concentration CF 641 70 184 20 66 7 22 2 913 21) Tension EF 325 35 383 42 145 16 64 7 917 22) Worry EF 246 27 379 41 183 20 108 12 916 23) Irritability EF 458 50 304 33 107 12 44 5 913 24) Depression EF 461 50 302 33 104 11 50 6 917 25) Memory trouble CF 652 71 187 20 58 6 19 2 916 26) Family life SF 600 66 200 22 85 9 30 3 915 27) Social activities SF 567 62 195 21 105 12 47 5 914 28) Financial difficulties FI 577 64 176 19 89 10 67 7 909 1 2 3 4 5 6 7 Total (very poor) (excellent) 29) Overall health QL 23 45 97 209 235 189 104 902 3 5 11 23 26 21 12 30) Overall quality of life QL 26 32 92 187 231 204 133 905 3 4 10 21 26 23 15

133
Head and neck cancer: 60-69 Characteristics of the sample Version of the QLQ-C30 Primary disease site N (%) N (%) v 1.0 3 0 Head and neck: oral cavity 35 4 v +3 161 19 Head and neck: oropharynx 10 1 v 2.0 138 17 Head and neck: hypopharynx 16 2 v 3.0 530 64 Head and neck: larynx 133 16 Total 832 Head and neck: oral cavity/larynx 1 0 Ophthalmic 1 0 Maxilla 1 0 Age Head and neck: not known 635 76 N (%) Total 832 <40 0 0 40-49 0 0 50-59 0 0 60-69 832 100 70-79 0 0 80+ 0 0 Not known 0 0 Total 832 Gender N (%) Male 682 82 Female 143 17 Not known 7 1 Total 832 Stage N (%) Stage I-II 327 39 Stage III-IV 437 53 Recurrent/metastatic 12 1 Not known 56 7 Total 832 Constructed scales Mean (SD) Median [IQR] Global health status/QoL QL 64.9 (23.6) 66.7 [50-83.3] Physical functioning PF 79.5 (21) 86.7 [66.7-100] Role Functioning RF 78.9 (28.1) 100 [66.7-100] Emotional functioning EF 72.8 (24.4) 75 [58.3-91.7] Cognitive functioning CF 86.3 (19.5) 100 [83.3-100] Social functioning SF 83.5 (25.1) 100 [66.7-100] Fatigue FA 27.2 (25.6) 22.2 [0-44.4] Nausea and vomiting NV 4.9 (13.5) 0 [0-0] Pain PA 22.8 (26.7) 16.7 [0-33.3] Dyspnoea DY 20.1 (28.4) 0 [0-33.3] Insomnia SL 24.9 (31.1) 0 [0-33.3] Appetite loss AP 17.8 (29.4) 0 [0-33.3] Constipation CO 11.8 (23.4) 0 [0-0] Diarrhoea DI 6.3 (17.6) 0 [0-0] Financial difficulties FI 15.7 (27.7) 0 [0-33.3]

134
Head and neck cancer: 60-69 Constructed scales QL N (%) CF N (%) 0 9 1 0 5 1 8.3 3 0 16.7 6 1 16.7 26 3 33.3 21 3 25 14 2 50 44 5 33.3 62 8 66.7 108 13 41.7 55 7 83.3 186 23 50 110 14 100 453 55 58.3 59 7 Total 823 66.7 143 18 75 59 7 83.3 133 16 91.7 38 5 SF N (%) 100 100 12 0 21 3 Total 811 16.7 20 2 33.3 30 4 PF N (%) 50 36 4 0 2 0 66.7 123 15 6.7 3 1 83.3 112 14 13.3 2 0 100 480 58 20 7 1 Total 822 26.7 4 1 33.3 9 2 40 10 2 46.7 12 2 FA N (%) 53.3 21 4 0 226 28 60 19 4 11.1 106 13 66.7 55 11 22.2 129 16 73.3 44 9 33.3 135 17 80 58 11 44.4 69 8 86.7 59 12 55.6 66 8 93.3 81 16 66.7 41 5 100 129 25 77.8 15 2 Total 515 88.9 12 2 100 21 3 RF N (%) Total 820 0 34 4 16.7 18 2 33.3 52 6 50 58 7 NV N (%) 66.7 122 15 0 690 83 83.3 117 14 16.7 78 9 100 418 51 33.3 44 5 Total 819 50 9 1 66.7 3 0 EF N (%) 83.3 2 0 0 12 2 100 5 1 8.3 11 1 Total 831 16.7 10 1 25 16 2 33.3 24 3 41.7 46 6 PA N (%) 50 57 7 0 342 42 58.3 65 8 16.7 179 22 66.7 99 12 33.3 136 17 75 90 11 50 69 8 83.3 91 11 66.7 47 6 91.7 137 17 83.3 28 3 100 163 20 100 24 3 Total 821 Total 825

135
Head and neck cancer: 60-69 Single Items Not at all A little Quite a bit Very much Total N (%) N (%) N (%) N (%) N 1) Strenuous activities PF 184 35 151 29 129 25 61 12 525 2) Long walk PF 233 44 132 25 99 19 62 12 526 3) Short walk PF 411 79 73 14 20 4 18 3 522 4) Bed or chair PF 331 63 132 25 44 8 19 4 526 5) Self care PF 495 94 12 2 13 3 8 2 528 6) Limited in work RF 461 56 217 26 89 11 56 7 823 7) Limited in leisure RF 517 63 175 21 89 11 42 5 823 8) Dyspnoea DY 495 60 204 25 94 11 36 4 829 9) Pain PA 390 47 264 32 129 16 46 6 829 10) Need to rest FA 326 39 320 39 141 17 43 5 830 11) Insomnia SL 446 54 195 24 142 17 47 6 830 12) Felt weak FA 422 51 237 29 124 15 46 6 829 13) Appetite loss AP 558 67 144 17 80 10 46 6 828 14) Nausea NV 707 85 92 11 26 3 7 1 832 15) Vomiting NV 771 93 46 6 8 1 6 1 831 16) Constipation CO 628 76 127 15 56 7 18 2 829 17) Diarrhoea DI 715 86 80 10 27 3 8 1 830 18) Felt tired FA 337 41 333 40 114 14 41 5 825 19) Pain interference PA 516 62 186 23 86 10 40 5 828 20) Concentration CF 600 72 165 20 51 6 13 2 829 21) Tension EF 364 44 292 35 138 17 32 4 826 22) Worry EF 284 34 299 36 165 20 82 10 830 23) Irritability EF 434 52 270 33 86 10 39 5 829 24) Depression EF 410 49 271 33 114 14 35 4 830 25) Memory trouble CF 540 65 212 26 57 7 17 2 826 26) Family life SF 588 71 145 18 58 7 32 4 823 27) Social activities SF 527 64 186 23 67 8 46 6 826 28) Financial difficulties FI 583 71 136 16 71 9 37 5 827 1 2 3 4 5 6 7 Total (very poor) (excellent) 29) Overall health QL 15 40 98 181 197 165 118 814 2 5 12 22 24 20 15 30) Overall quality of life QL 15 34 98 145 178 203 141 814 2 4 12 18 22 25 17

136
Head and neck cancer: ≥70 Characteristics of the sample Version of the QLQ-C30 Primary disease site N (%) N (%) v 1.0 4 1 Head and neck: oral cavity 65 11 v +3 194 33 Head and neck: oropharynx 15 3 v 2.0 50 9 Head and neck: hypopharynx 9 2 v 3.0 338 58 Head and neck: larynx 113 19 Total 586 Thyroid 2 0 Head and neck: not known 382 65 Total 586 Age N (%) <40 0 0 40-49 0 0 50-59 0 0 60-69 0 0 70-79 489 83 80+ 97 17 Not known 0 0 Total 586 Gender N (%) Male 436 74 Female 147 25 Not known 3 1 Total 586 Stage N (%) Stage I-II 250 43 Stage III-IV 294 50 Recurrent/metastatic 12 2 Not known 30 5 Total 586 Constructed scales Mean (SD) Median [IQR] Global health status/QoL QL 63.6 (23) 66.7 [50-83.3] Physical functioning PF 74.8 (23) 80 [60-93.3] Role Functioning RF 77.7 (29.4) 100 [66.7-100] Emotional functioning EF 78.4 (22.3) 83.3 [66.7-100] Cognitive functioning CF 85.4 (19.2) 100 [83.3-100] Social functioning SF 84.5 (23.8) 100 [66.7-100] Fatigue FA 27.7 (24.6) 22.2 [11.1-44.4] Nausea and vomiting NV 4.6 (11.6) 0 [0-0] Pain PA 20.6 (25.3) 16.7 [0-33.3] Dyspnoea DY 20.7 (28.5) 0 [0-33.3] Insomnia SL 24.9 (31.9) 0 [0-33.3] Appetite loss AP 16.2 (27.9) 0 [0-33.3] Constipation CO 14.4 (25.5) 0 [0-33.3] Diarrhoea DI 5.1 (16.4) 0 [0-0] Financial difficulties FI 10.9 (23.3) 0 [0-0]
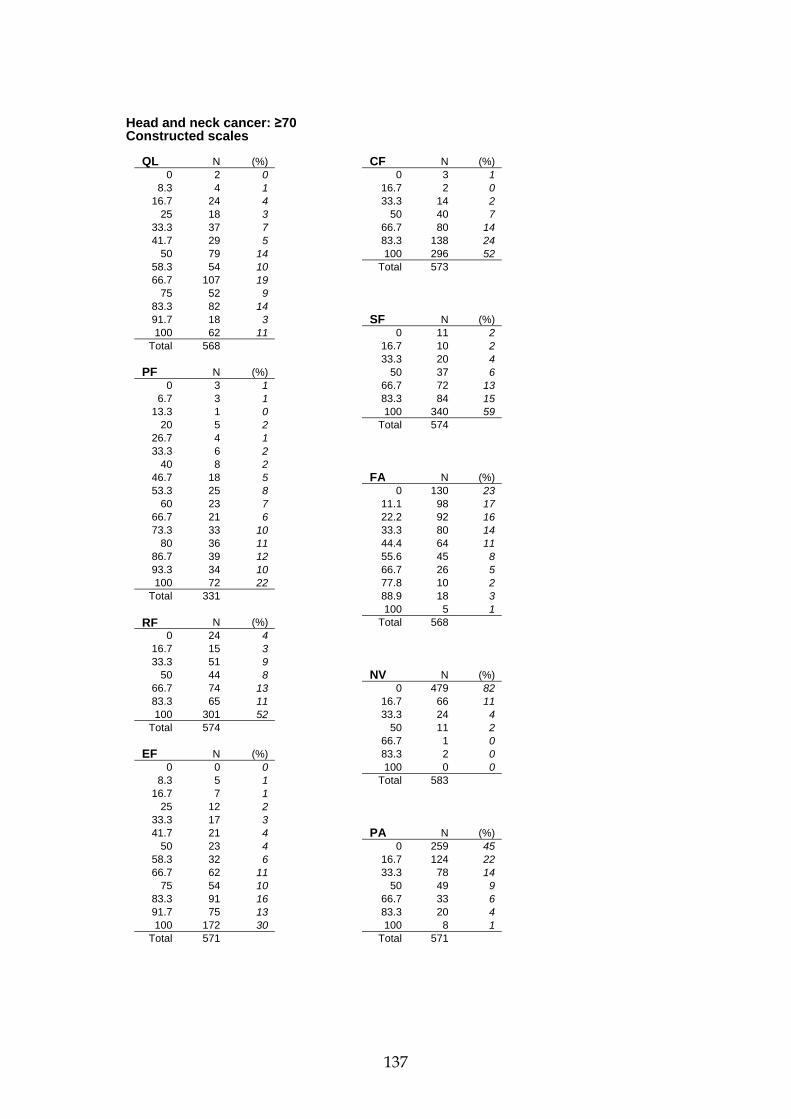
137
Head and neck cancer: ≥70 Constructed scales QL N (%) CF N (%) 0 2 0 0 3 1 8.3 4 1 16.7 2 0 16.7 24 4 33.3 14 2 25 18 3 50 40 7 33.3 37 7 66.7 80 14 41.7 29 5 83.3 138 24 50 79 14 100 296 52 58.3 54 10 Total 573 66.7 107 19 75 52 9 83.3 82 14 91.7 18 3 SF N (%) 100 62 11 0 11 2 Total 568 16.7 10 2 33.3 20 4 PF N (%) 50 37 6 0 3 1 66.7 72 13 6.7 3 1 83.3 84 15 13.3 1 0 100 340 59 20 5 2 Total 574 26.7 4 1 33.3 6 2 40 8 2 46.7 18 5 FA N (%) 53.3 25 8 0 130 23 60 23 7 11.1 98 17 66.7 21 6 22.2 92 16 73.3 33 10 33.3 80 14 80 36 11 44.4 64 11 86.7 39 12 55.6 45 8 93.3 34 10 66.7 26 5 100 72 22 77.8 10 2 Total 331 88.9 18 3 100 5 1 RF N (%) Total 568 0 24 4 16.7 15 3 33.3 51 9 50 44 8 NV N (%) 66.7 74 13 0 479 82 83.3 65 11 16.7 66 11 100 301 52 33.3 24 4 Total 574 50 11 2 66.7 1 0 EF N (%) 83.3 2 0 0 0 0 100 0 0 8.3 5 1 Total 583 16.7 7 1 25 12 2 33.3 17 3 41.7 21 4 PA N (%) 50 23 4 0 259 45 58.3 32 6 16.7 124 22 66.7 62 11 33.3 78 14 75 54 10 50 49 9 83.3 91 16 66.7 33 6 91.7 75 13 83.3 20 4 100 172 30 100 8 1 Total 571 Total 571

138
Head and neck cancer: ≥70 Single Items Not at all A little Quite a bit Very much Total N (%) N (%) N (%) N (%) N 1) Strenuous activities PF 110 33 83 25 81 24 62 19 336 2) Long walk PF 110 33 78 23 88 26 61 18 337 3) Short walk PF 227 68 76 23 20 6 11 3 334 4) Bed or chair PF 216 64 66 20 44 13 12 4 338 5) Self care PF 303 90 19 6 6 2 9 3 337 6) Limited in work RF 329 57 116 20 94 16 39 7 578 7) Limited in leisure RF 365 63 105 18 68 12 38 7 576 8) Dyspnoea DY 339 58 154 26 64 11 27 5 584 9) Pain PA 299 51 159 27 98 17 26 5 582 10) Need to rest FA 212 36 224 38 114 20 34 6 584 11) Insomnia SL 320 55 131 23 92 16 40 7 583 12) Felt weak FA 307 53 172 30 79 14 22 4 580 13) Appetite loss AP 409 70 95 16 57 10 25 4 586 14) Nausea NV 491 84 75 13 13 2 6 1 585 15) Vomiting NV 546 94 34 6 4 1 0 0 584 16) Constipation CO 417 71 96 16 57 10 14 2 584 17) Diarrhoea DI 518 89 43 7 12 2 7 1 580 18) Felt tired FA 218 38 242 42 92 16 23 4 575 19) Pain interference PA 383 67 118 21 52 9 20 4 573 20) Concentration CF 427 74 112 19 33 6 6 1 578 21) Tension EF 299 52 182 32 76 13 21 4 578 22) Worry EF 254 44 204 35 89 15 33 6 580 23) Irritability EF 371 64 140 24 58 10 12 2 581 24) Depression EF 337 59 153 27 71 12 15 3 576 25) Memory trouble CF 339 59 170 30 64 11 4 1 577 26) Family life SF 425 74 90 16 46 8 15 3 576 27) Social activities SF 376 65 116 20 57 10 28 5 577 28) Financial difficulties FI 452 78 80 14 32 6 15 3 579 1 2 3 4 5 6 7 Total (very poor) (excellent) 29) Overall health QL 8 34 61 140 160 99 68 570 1 6 11 25 28 17 12 30) Overall quality of life QL 12 33 61 93 151 132 89 571 2 6 11 16 26 23 16
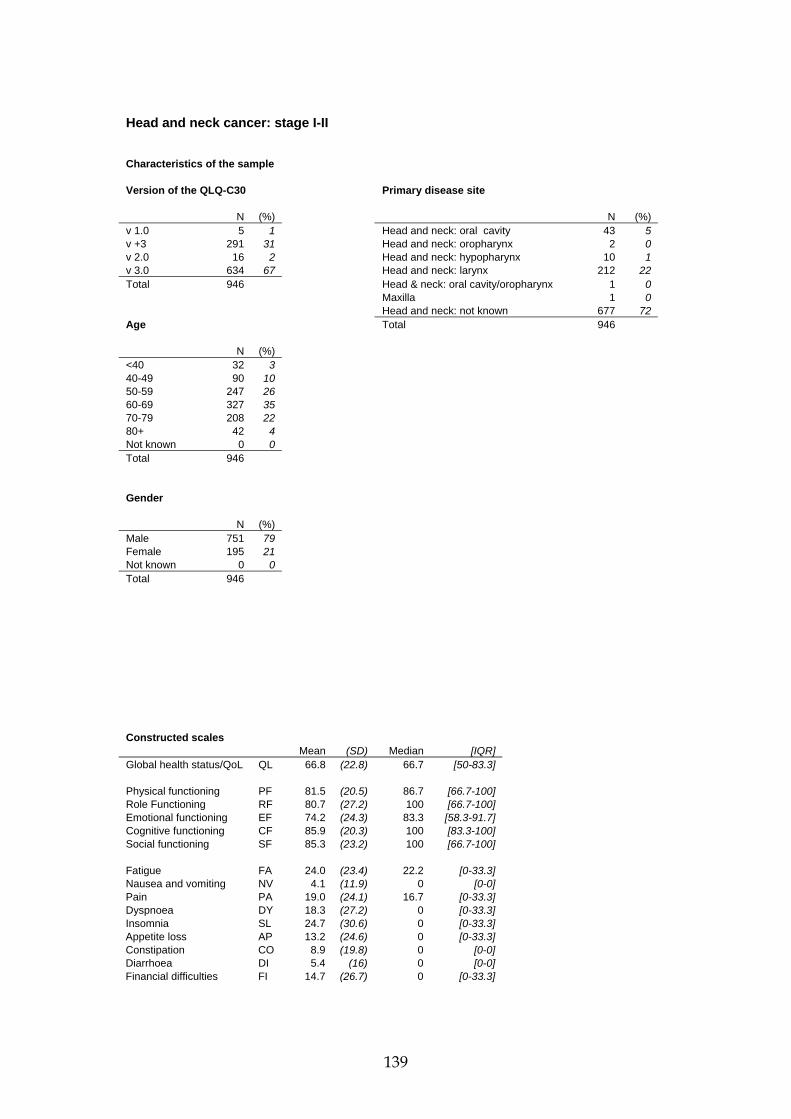
139
Head and neck cancer: stage I-II Characteristics of the sample Version of the QLQ-C30 Primary disease site N (%) N (%) v 1.0 5 1 Head and neck: oral cavity 43 5 v +3 291 31 Head and neck: oropharynx 2 0 v 2.0 16 2 Head and neck: hypopharynx 10 1 v 3.0 634 67 Head and neck: larynx 212 22 Total 946 Head & neck: oral cavity/oropharynx 1 0 Maxilla 1 0 Head and neck: not known 677 72 Age Total 946 N (%) <40 32 3 40-49 90 10 50-59 247 26 60-69 327 35 70-79 208 22 80+ 42 4 Not known 0 0 Total 946 Gender N (%) Male 751 79 Female 195 21 Not known 0 0 Total 946 Constructed scales Mean (SD) Median [IQR] Global health status/QoL QL 66.8 (22.8) 66.7 [50-83.3] Physical functioning PF 81.5 (20.5) 86.7 [66.7-100] Role Functioning RF 80.7 (27.2) 100 [66.7-100] Emotional functioning EF 74.2 (24.3) 83.3 [58.3-91.7] Cognitive functioning CF 85.9 (20.3) 100 [83.3-100] Social functioning SF 85.3 (23.2) 100 [66.7-100] Fatigue FA 24.0 (23.4) 22.2 [0-33.3] Nausea and vomiting NV 4.1 (11.9) 0 [0-0] Pain PA 19.0 (24.1) 16.7 [0-33.3] Dyspnoea DY 18.3 (27.2) 0 [0-33.3] Insomnia SL 24.7 (30.6) 0 [0-33.3] Appetite loss AP 13.2 (24.6) 0 [0-33.3] Constipation CO 8.9 (19.8) 0 [0-0] Diarrhoea DI 5.4 (16) 0 [0-0] Financial difficulties FI 14.7 (26.7) 0 [0-33.3]
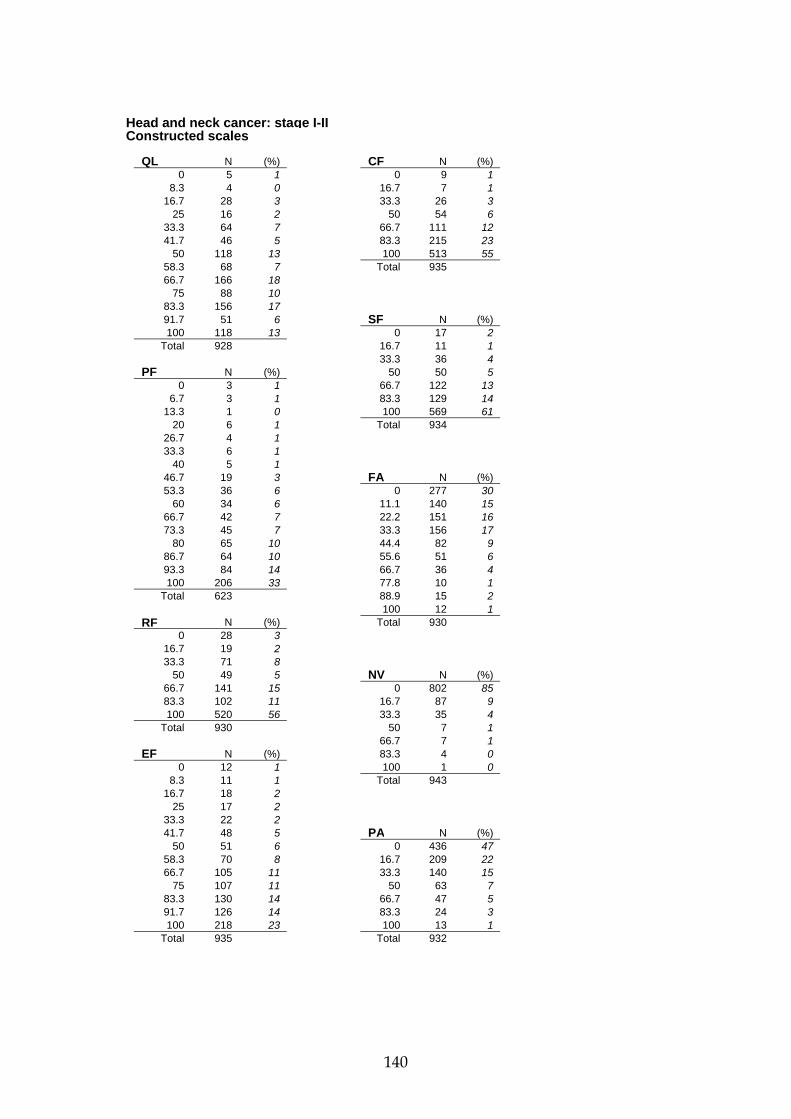
140
Head and neck cancer: stage I-II Constructed scales QL N (%) CF N (%) 0 5 1 0 9 1 8.3 4 0 16.7 7 1 16.7 28 3 33.3 26 3 25 16 2 50 54 6 33.3 64 7 66.7 111 12 41.7 46 5 83.3 215 23 50 118 13 100 513 55 58.3 68 7 Total 935 66.7 166 18 75 88 10 83.3 156 17 91.7 51 6 SF N (%) 100 118 13 0 17 2 Total 928 16.7 11 1 33.3 36 4 PF N (%) 50 50 5 0 3 1 66.7 122 13 6.7 3 1 83.3 129 14 13.3 1 0 100 569 61 20 6 1 Total 934 26.7 4 1 33.3 6 1 40 5 1 46.7 19 3 FA N (%) 53.3 36 6 0 277 30 60 34 6 11.1 140 15 66.7 42 7 22.2 151 16 73.3 45 7 33.3 156 17 80 65 10 44.4 82 9 86.7 64 10 55.6 51 6 93.3 84 14 66.7 36 4 100 206 33 77.8 10 1 Total 623 88.9 15 2 100 12 1 RF N (%) Total 930 0 28 3 16.7 19 2 33.3 71 8 50 49 5 NV N (%) 66.7 141 15 0 802 85 83.3 102 11 16.7 87 9 100 520 56 33.3 35 4 Total 930 50 7 1 66.7 7 1 EF N (%) 83.3 4 0 0 12 1 100 1 0 8.3 11 1 Total 943 16.7 18 2 25 17 2 33.3 22 2 41.7 48 5 PA N (%) 50 51 6 0 436 47 58.3 70 8 16.7 209 22 66.7 105 11 33.3 140 15 75 107 11 50 63 7 83.3 130 14 66.7 47 5 91.7 126 14 83.3 24 3 100 218 23 100 13 1 Total 935 Total 932

141
Head and neck cancer: stage I-II Single Items Not at all A little Quite a bit Very much Total N (%) N (%) N (%) N (%) N 1) Strenuous activities PF 261 41 170 27 133 21 68 11 632 2) Long walk PF 301 48 147 23 115 18 69 11 632 3) Short walk PF 493 79 95 15 24 4 13 2 625 4) Bed or chair PF 417 66 142 23 57 9 15 2 631 5) Self care PF 607 96 12 2 7 1 6 1 632 6) Limited in work RF 560 60 203 22 121 13 52 6 936 7) Limited in leisure RF 628 67 169 18 91 10 45 5 933 8) Dyspnoea DY 588 62 229 24 92 10 35 4 944 9) Pain PA 494 53 298 32 119 13 30 3 941 10) Need to rest FA 410 43 354 38 146 15 35 4 945 11) Insomnia SL 501 53 235 25 156 17 50 5 942 12) Felt weak FA 538 57 273 29 100 11 33 4 944 13) Appetite loss AP 695 74 147 16 82 9 21 2 945 14) Nausea NV 815 86 100 11 23 2 7 1 945 15) Vomiting NV 893 95 38 4 12 1 1 0 944 16) Constipation CO 753 80 138 15 41 4 11 1 943 17) Diarrhoea DI 829 88 80 9 27 3 6 1 942 18) Felt tired FA 389 42 396 42 123 13 25 3 933 19) Pain interference PA 637 68 184 20 85 9 30 3 936 20) Concentration CF 672 71 188 20 67 7 14 1 941 21) Tension EF 389 42 353 38 149 16 47 5 938 22) Worry EF 343 37 341 36 183 19 74 8 941 23) Irritability EF 529 56 288 31 89 9 36 4 942 24) Depression EF 507 54 286 30 111 12 36 4 940 25) Memory trouble CF 616 66 230 25 70 8 21 2 937 26) Family life SF 677 72 171 18 60 6 27 3 935 27) Social activities SF 635 68 186 20 82 9 36 4 939 28) Financial difficulties FI 676 72 151 16 78 8 36 4 941 1 2 3 4 5 6 7 Total (very poor) (excellent) 29) Overall health QL 9 48 107 184 234 208 141 931 1 5 12 20 25 22 15 30) Overall quality of life QL 12 34 101 151 207 251 176 932 1 4 11 16 22 27 19

142
Head and neck cancer: stage III-IV Characteristics of the sample Version of the QLQ-C30 Primary disease site N (%) N (%) v 1.0 17 1 Head and neck: oral cavity 143 8 v +3 395 23 Head and neck: oropharynx 78 5 v 2.0 381 22 Head and neck: hypopharynx 64 4 v 3.0 929 54 Head and neck: larynx 146 8 Total 1,722 Head and neck: oral cavity/larynx 1 0 Head & neck: oral cavity/oropharynx 2 0 Maxilla 1 0 Age Head and neck: not known 1,287 75 Total 1,722 N (%) <40 54 3 40-49 337 20 50-59 599 35 60-69 437 25 70-79 243 14 80+ 51 3 Not known 1 0 Total 1,722 Gender N (%) Male 1,401 81 Female 316 18 Not known 5 0 Total 1,722 Constructed scales Mean (SD) Median [IQR] Global health status/QoL QL 63.1 (22.4) 66.7 [50-83.3] Physical functioning PF 81.2 (20.2) 86.7 [73.3-100] Role Functioning RF 78.8 (27.9) 100 [66.7-100] Emotional functioning EF 71.2 (24.1) 75 [58.3-91.7] Cognitive functioning CF 86.4 (19.1) 100 [83.3-100] Social functioning SF 82.2 (24.7) 100 [66.7-100] Fatigue FA 27.6 (25) 22.2 [0-44.4] Nausea and vomiting NV 5.2 (13.3) 0 [0-0] Pain PA 24.9 (26.3) 16.7 [0-33.3] Dyspnoea DY 18.0 (26.6) 0 [0-33.3] Insomnia SL 28.5 (32.4) 33.3 [0-66.7] Appetite loss AP 19.4 (29.3) 0 [0-33.3] Constipation CO 11.7 (23.2) 0 [0-0] Diarrhoea DI 6.1 (16.7) 0 [0-0] Financial difficulties FI 18.8 (30.2) 0 [0-33.3]
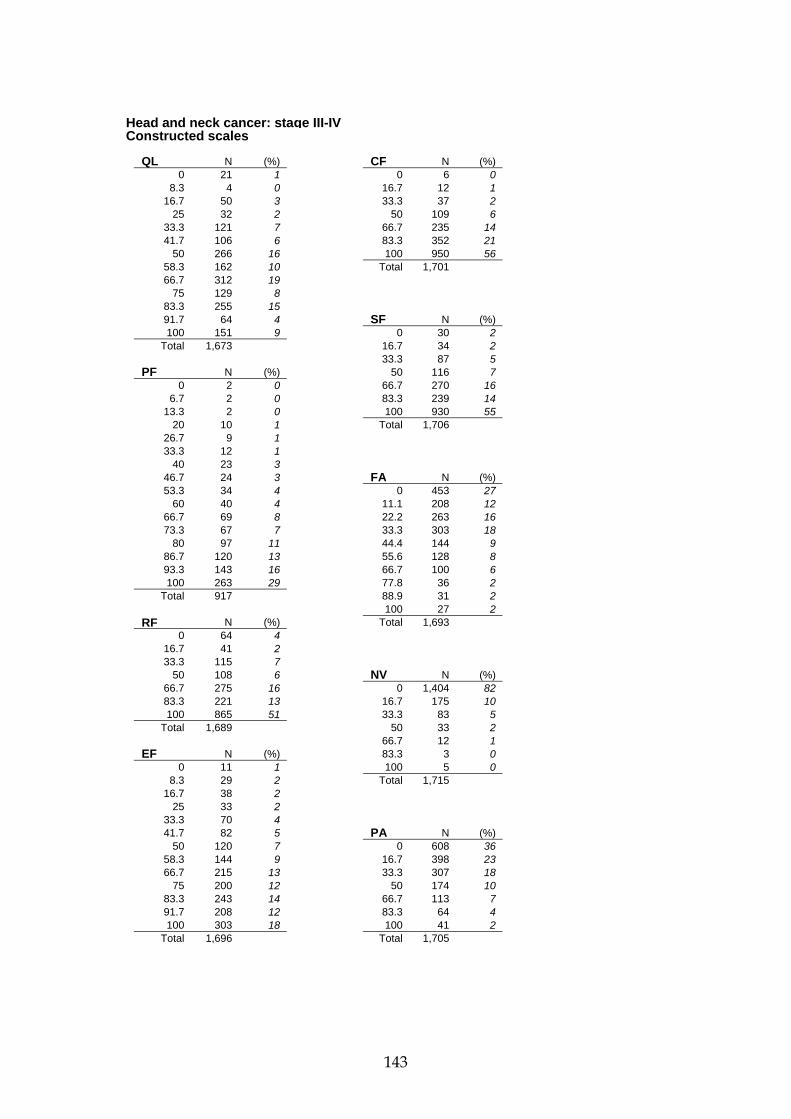
143
Head and neck cancer: stage III-IV Constructed scales QL N (%) CF N (%) 0 21 1 0 6 0 8.3 4 0 16.7 12 1 16.7 50 3 33.3 37 2 25 32 2 50 109 6 33.3 121 7 66.7 235 14 41.7 106 6 83.3 352 21 50 266 16 100 950 56 58.3 162 10 Total 1,701 66.7 312 19 75 129 8 83.3 255 15 91.7 64 4 SF N (%) 100 151 9 0 30 2 Total 1,673 16.7 34 2 33.3 87 5 PF N (%) 50 116 7 0 2 0 66.7 270 16 6.7 2 0 83.3 239 14 13.3 2 0 100 930 55 20 10 1 Total 1,706 26.7 9 1 33.3 12 1 40 23 3 46.7 24 3 FA N (%) 53.3 34 4 0 453 27 60 40 4 11.1 208 12 66.7 69 8 22.2 263 16 73.3 67 7 33.3 303 18 80 97 11 44.4 144 9 86.7 120 13 55.6 128 8 93.3 143 16 66.7 100 6 100 263 29 77.8 36 2 Total 917 88.9 31 2 100 27 2 RF N (%) Total 1,693 0 64 4 16.7 41 2 33.3 115 7 50 108 6 NV N (%) 66.7 275 16 0 1,404 82 83.3 221 13 16.7 175 10 100 865 51 33.3 83 5 Total 1,689 50 33 2 66.7 12 1 EF N (%) 83.3 3 0 0 11 1 100 5 0 8.3 29 2 Total 1,715 16.7 38 2 25 33 2 33.3 70 4 41.7 82 5 PA N (%) 50 120 7 0 608 36 58.3 144 9 16.7 398 23 66.7 215 13 33.3 307 18 75 200 12 50 174 10 83.3 243 14 66.7 113 7 91.7 208 12 83.3 64 4 100 303 18 100 41 2 Total 1,696 Total 1,705

144
Head and neck cancer: stage III-IV Single Items Not at all A little Quite a bit Very much Total N (%) N (%) N (%) N (%) N 1) Strenuous activities PF 371 40 248 27 198 21 110 12 927 2) Long walk PF 433 47 229 25 165 18 97 11 924 3) Short walk PF 737 80 127 14 43 5 18 2 925 4) Bed or chair PF 636 69 194 21 72 8 22 2 924 5) Self care PF 850 92 45 5 21 2 11 1 927 6) Limited in work RF 968 57 404 24 222 13 101 6 1,695 7) Limited in leisure RF 1,058 62 368 22 180 11 90 5 1,696 8) Dyspnoea DY 1,061 62 445 26 152 9 60 4 1,718 9) Pain PA 684 40 604 35 324 19 104 6 1,716 10) Need to rest FA 631 37 689 40 304 18 89 5 1,713 11) Insomnia SL 818 48 465 27 300 18 134 8 1,717 12) Felt weak FA 844 49 549 32 246 14 75 4 1,714 13) Appetite loss AP 1,081 63 357 21 187 11 89 5 1,714 14) Nausea NV 1,446 84 204 12 56 3 13 1 1,719 15) Vomiting NV 1,575 92 115 7 18 1 10 1 1,718 16) Constipation CO 1,294 76 270 16 109 6 37 2 1,710 17) Diarrhoea DI 1,475 86 177 10 48 3 13 1 1,713 18) Felt tired FA 686 40 705 41 247 15 70 4 1,708 19) Pain interference PA 1,023 60 436 26 188 11 63 4 1,710 20) Concentration CF 1,200 70 357 21 123 7 30 2 1,710 21) Tension EF 659 38 667 39 289 17 99 6 1,714 22) Worry EF 479 28 699 41 350 20 188 11 1,716 23) Irritability EF 862 50 571 33 209 12 70 4 1,712 24) Depression EF 856 50 568 33 219 13 69 4 1,712 25) Memory trouble CF 1,169 68 399 23 123 7 20 1 1,711 26) Family life SF 1,146 67 362 21 148 9 54 3 1,710 27) Social activities SF 1,043 61 407 24 179 11 82 5 1,711 28) Financial difficulties FI 1,124 66 315 19 158 9 110 6 1,707 1 2 3 4 5 6 7 Total (very poor) (excellent) 29) Overall health QL 34 73 193 424 443 324 188 1,679 2 4 12 25 26 19 11 30) Overall quality of life QL 39 70 186 351 446 373 225 1,690 2 4 11 21 26 22 13

145
Head and neck cancer: hypopharynx/larynx Characteristics of the sample Version of the QLQ-C30 N (%) v 1.0 5 1 v +3 150 34 v 2.0 0 0 v 3.0 281 64 Total 436 Age N (%) <40 7 2 40-49 45 10 50-59 113 26 60-69 149 34 70-79 103 24 80+ 19 4 Not known 0 0 Total 436 Gender N (%) Male 387 89 Female 49 11 Not known 0 0 Total 436 Stage N (%) Stage I-II 222 51 Stage III-IV 210 48 Recurrent/metastatic 0 0 Not known 4 1 Total 436 Constructed scales Mean (SD) Median [IQR] Global health status/QoL QL 62.3 (23.1) 66.7 [50-83.3] Physical functioning PF 73.0 (22) 73.3 [60-93.3] Role Functioning RF 72.8 (30.9) 83.3 [50-100] Emotional functioning EF 69.4 (26) 75 [50-91.7] Cognitive functioning CF 83.7 (20.5) 83.3 [66.7-100] Social functioning SF 78.5 (27.4) 83.3 [66.7-100] Fatigue FA 32.0 (26.8) 33.3 [11.1-44.4] Nausea and vomiting NV 5.3 (13.7) 0 [0-0] Pain PA 22.3 (27.6) 16.7 [0-33.3] Dyspnoea DY 28.4 (32.8) 33.3 [0-66.7] Insomnia SL 27.7 (34.5) 0 [0-66.7] Appetite loss AP 15.4 (26.9) 0 [0-33.3] Constipation CO 7.5 (19.3) 0 [0-0] Diarrhoea DI 7.6 (19.8) 0 [0-0] Financial difficulties FI 24.8 (34.8) 0 [0-33.3]

146
Head and neck cancer: hypopharynx/larynx Constructed scales QL N (%) CF N (%) 0 5 1 0 2 1 8.3 2 1 16.7 6 1 16.7 15 4 33.3 11 3 25 5 1 50 33 8 33.3 40 10 66.7 68 16 41.7 22 5 83.3 103 24 50 73 18 100 211 49 58.3 33 8 Total 434 66.7 79 19 75 27 7 83.3 58 14 91.7 17 4 SF N (%) 100 40 10 0 16 4 Total 416 16.7 10 2 33.3 25 6 PF N (%) 50 35 8 0 3 1 66.7 68 16 6.7 1 0 83.3 70 16 13.3 1 0 100 208 48 20 2 1 Total 432 26.7 5 2 33.3 6 2 40 11 4 46.7 11 4 FA N (%) 53.3 20 7 0 99 23 60 19 7 11.1 41 10 66.7 33 12 22.2 60 14 73.3 32 12 33.3 81 19 80 33 12 44.4 56 13 86.7 23 8 55.6 32 7 93.3 33 12 66.7 28 7 100 44 16 77.8 11 3 Total 277 88.9 10 2 100 15 4 RF N (%) Total 433 0 23 5 16.7 18 4 33.3 42 10 50 33 8 NV N (%) 66.7 76 18 0 351 81 83.3 49 12 16.7 53 12 100 185 43 33.3 19 4 Total 426 50 6 1 66.7 2 1 EF N (%) 83.3 2 1 0 5 1 100 2 1 8.3 11 3 Total 435 16.7 15 4 25 9 2 33.3 13 3 41.7 25 6 PA N (%) 50 36 8 0 196 45 58.3 34 8 16.7 83 19 66.7 53 12 33.3 61 14 75 41 10 50 39 9 83.3 58 14 66.7 23 5 91.7 51 12 83.3 15 4 100 79 18 100 15 4 Total 430 Total 432

147
Head and neck cancer: hypopharynx/larynx Single Items Not at all A little Quite a bit Very much Total N (%) N (%) N (%) N (%) N 1) Strenuous activities PF 64 23 56 20 83 30 78 28 281 2) Long walk PF 92 33 58 21 76 27 55 20 281 3) Short walk PF 193 69 53 19 25 9 8 3 279 4) Bed or chair PF 196 71 51 18 20 7 11 4 278 5) Self care PF 251 89 12 4 9 3 9 3 281 6) Limited in work RF 208 49 115 27 71 17 35 8 429 7) Limited in leisure RF 228 53 97 23 68 16 35 8 428 8) Dyspnoea DY 213 49 110 25 78 18 35 8 436 9) Pain PA 230 53 115 26 67 15 23 5 435 10) Need to rest FA 137 31 157 36 109 25 33 8 436 11) Insomnia SL 234 54 83 19 76 18 42 10 435 12) Felt weak FA 202 46 129 30 68 16 37 9 436 13) Appetite loss AP 308 71 69 16 45 10 14 3 436 14) Nausea NV 359 83 60 14 9 2 7 2 435 15) Vomiting NV 406 93 22 5 5 1 3 1 436 16) Constipation CO 366 84 43 10 20 5 5 1 434 17) Diarrhoea DI 369 85 39 9 23 5 5 1 436 18) Felt tired FA 158 37 172 40 79 18 24 6 433 19) Pain interference PA 266 61 97 22 44 10 26 6 433 20) Concentration CF 302 69 90 21 36 8 8 2 436 21) Tension EF 168 39 161 37 77 18 29 7 435 22) Worry EF 142 33 145 33 94 22 54 12 435 23) Irritability EF 186 43 150 35 66 15 32 7 434 24) Depression EF 218 50 133 31 58 13 25 6 434 25) Memory trouble CF 261 60 115 27 49 11 9 2 434 26) Family life SF 272 63 95 22 42 10 24 6 433 27) Social activities SF 239 55 108 25 55 13 30 7 432 28) Financial difficulties FI 258 59 76 18 53 12 47 11 434 1 2 3 4 5 6 7 Total (very poor) (excellent) 29) Overall health QL 7 24 52 106 105 75 49 418 2 6 12 25 25 18 12 30) Overall quality of life QL 11 15 54 98 99 86 58 421 3 4 13 23 24 20 14

148
Head and neck cancer: oral cavity/oropharynx Characteristics of the sample Version of the QLQ-C30 N (%) v 1.0 14 5 v +3 244 90 v 2.0 0 0 v 3.0 14 5 Total 272 Age N (%) <40 10 4 40-49 40 15 50-59 95 35 60-69 46 17 70-79 59 22 80+ 21 8 Not known 1 0 Total 272 Gender N (%) Male 182 67 Female 90 33 Not known 0 0 Total 272 Stage N (%) Stage I-II 45 17 Stage III-IV 224 82 Recurrent/metastatic 3 1 Not known 0 0 Total 272 Constructed scales Mean (SD) Median [IQR] Global health status/QoL QL 64.4 (23.6) 66.7 [50-83.3] Physical functioning PF Previous version of this scale used Role Functioning RF 78.1 (29) 100 [66.7-100] Emotional functioning EF 66.9 (23.6) 66.7 [50-83.3] Cognitive functioning CF 85.3 (21.1) 100 [66.7-100] Social functioning SF 83.8 (24.2) 100 [66.7-100] Fatigue FA 26.9 (27.1) 22.2 [0-44.4] Nausea and vomiting NV 4.8 (13.7) 0 [0-0] Pain PA 28.5 (27.2) 16.7 [0-50] Dyspnoea DY 13.0 (22.2) 0 [0-33.3] Insomnia SL 29.7 (33.3) 33.3 [0-66.7] Appetite loss AP 17.4 (28.9) 0 [0-33.3] Constipation CO 8.8 (21.7) 0 [0-0] Diarrhoea DI 5.9 (17.8) 0 [0-0] Financial difficulties FI 12.5 (26.4) 0 [0-0]

149
Head and neck cancer: oral cavity/oropharynx Constructed scales QL N (%) CF N (%) 0 5 2 0 2 1 8.3 1 0 16.7 2 1 16.7 7 3 33.3 9 3 25 8 3 50 20 7 33.3 13 5 66.7 38 14 41.7 18 7 83.3 45 17 50 32 13 100 155 57 58.3 25 10 Total 271 66.7 41 16 75 24 9 83.3 44 17 91.7 13 5 SF N (%) 100 26 10 0 5 2 Total 257 16.7 6 2 33.3 11 4 PF 50 13 5 Previous version of this scale used 66.7 41 15 83.3 38 14 100 156 58 Total 270 FA N (%) 0 80 30 11.1 38 14 22.2 42 16 33.3 35 13 44.4 22 8 55.6 20 7 66.7 12 5 77.8 2 1 88.9 11 4 100 7 3 RF N (%) Total 269 0 12 5 16.7 3 1 33.3 26 10 50 11 4 NV N (%) 66.7 40 16 0 229 84 83.3 33 13 16.7 27 10 100 132 51 33.3 4 2 Total 257 50 7 3 66.7 4 2 EF N (%) 83.3 0 0 0 2 1 100 1 0 8.3 4 2 Total 272 16.7 5 2 25 9 3 33.3 19 7 41.7 14 5 PA N (%) 50 16 6 0 72 27 58.3 33 12 16.7 81 30 66.7 39 14 33.3 47 17 75 38 14 50 23 9 83.3 35 13 66.7 25 9 91.7 26 10 83.3 15 6 100 31 11 100 7 3 Total 271 Total 270

150
Head and neck cancer: oral cavity/oropharynx Single Items Not at all A little Quite a bit Very much Total N (%) N (%) N (%) N (%) N 1) Strenuous activities PF Previous version of this scale used 2) Long walk PF Previous version of this scale used 3) Short walk PF Previous version of this scale used 4) Bed or chair PF Previous version of this scale used 5) Self care PF Previous version of this scale used 6) Limited in work RF 146 57 59 23 39 15 14 5 258 7) Limited in leisure RF 160 62 51 20 30 12 16 6 257 8) Dyspnoea DY 189 70 65 24 13 5 5 2 272 9) Pain PA 80 29 110 40 59 22 23 9 272 10) Need to rest FA 106 39 100 37 46 17 19 7 271 11) Insomnia SL 129 47 67 25 53 20 23 9 272 12) Felt weak FA 159 59 68 25 28 10 16 6 271 13) Appetite loss AP 183 67 51 19 23 9 15 6 272 14) Nausea NV 235 86 24 9 10 4 3 1 272 15) Vomiting NV 254 93 12 4 5 2 1 0 272 16) Constipation CO 225 83 28 10 13 5 6 2 272 17) Diarrhoea DI 239 88 22 8 7 3 4 2 272 18) Felt tired FA 113 42 100 37 39 14 19 7 271 19) Pain interference PA 163 60 60 22 35 13 12 4 270 20) Concentration CF 177 65 60 22 28 10 6 2 271 21) Tension EF 72 27 110 40 67 25 23 9 272 22) Worry EF 46 17 112 41 78 29 35 13 271 23) Irritability EF 146 54 89 33 26 10 11 4 272 24) Depression EF 122 45 96 35 42 15 12 4 272 25) Memory trouble CF 193 71 56 21 19 7 4 2 272 26) Family life SF 193 72 46 17 23 9 8 3 270 27) Social activities SF 174 64 61 22 24 9 13 5 272 28) Financial difficulties FI 211 78 32 12 17 6 12 4 272 1 2 3 4 5 6 7 Total (very poor) (excellent) 29) Overall health QL 10 14 19 55 68 58 33 257 4 5 7 21 27 23 13 30) Overall quality of life QL 7 12 25 53 67 65 41 270 3 4 9 20 25 24 15

151
Acute myelogenous leukaemia Characteristics of the sample Version of the QLQ-C30 N (%) v 1.0 155 100 v +3 0 0 v 2.0 0 0 v 3.0 0 0 Total 155 Age N (%) <40 79 51 40-49 30 19 50-59 40 26 60-69 6 4 70-79 0 0 80+ 0 0 Not known 0 0 Total 155 Gender N (%) Male 73 47 Female 82 53 Not known 0 0 Total 155 Stage N (%) Stage I-II 0 0 Stage III-IV 0 0 Recurrent/metastatic 0 0 Not known 155 100 Total 155 Constructed scales Mean (SD) Median [IQR] Global health status/QoL QL Previous version of this scale used Physical functioning PF Previous version of this scale used Role Functioning RF Previous version of this scale used Emotional functioning EF 82.2 (18.9) 83.3 [75-100] Cognitive functioning CF 86.1 (18.5) 100 [83.3-100] Social functioning SF 66.1 (31) 66.7 [33.3-100] Fatigue FA 36.2 (22.7) 33.3 [22.2-55.6] Nausea and vomiting NV 9.0 (18.3) 0 [0-16.7] Pain PA 13.7 (20.4) 0 [0-16.7] Dyspnoea DY 11.3 (17.1) 0 [0-33.3] Insomnia SL 20.4 (26.1) 0 [0-33.3] Appetite loss AP 18.0 (30.5) 0 [0-33.3] Constipation CO 7.9 (19.1) 0 [0-0] Diarrhoea DI 12.6 (25.1) 0 [0-33.3] Financial difficulties FI 18.7 (28.8) 0 [0-33.3]
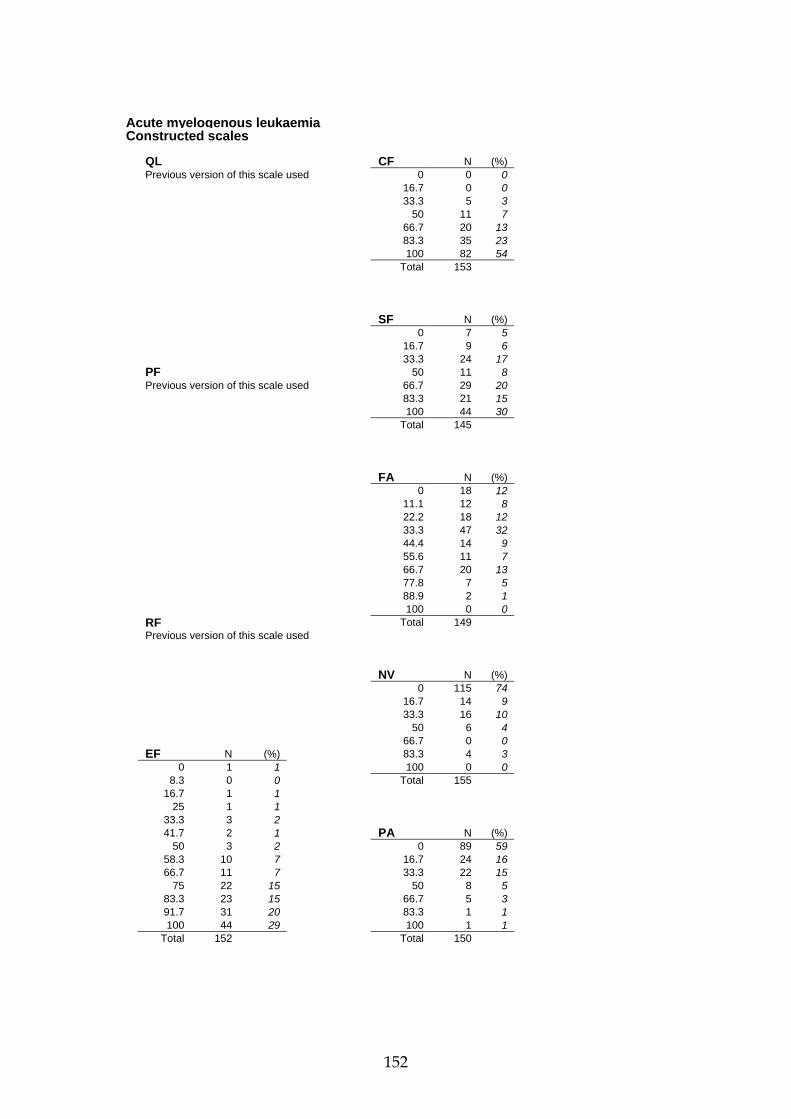
152
Acute myelogenous leukaemia Constructed scales QL CF N (%) Previous version of this scale used 0 0 0 16.7 0 0 33.3 5 3 50 11 7 66.7 20 13 83.3 35 23 100 82 54 Total 153 SF N (%) 0 7 5 16.7 9 6 33.3 24 17 PF 50 11 8 Previous version of this scale used 66.7 29 20 83.3 21 15 100 44 30 Total 145 FA N (%) 0 18 12 11.1 12 8 22.2 18 12 33.3 47 32 44.4 14 9 55.6 11 7 66.7 20 13 77.8 7 5 88.9 2 1 100 0 0 RF Total 149 Previous version of this scale used NV N (%) 0 115 74 16.7 14 9 33.3 16 10 50 6 4 66.7 0 0 EF N (%) 83.3 4 3 0 1 1 100 0 0 8.3 0 0 Total 155 16.7 1 1 25 1 1 33.3 3 2 41.7 2 1 PA N (%) 50 3 2 0 89 59 58.3 10 7 16.7 24 16 66.7 11 7 33.3 22 15 75 22 15 50 8 5 83.3 23 15 66.7 5 3 91.7 31 20 83.3 1 1 100 44 29 100 1 1 Total 152 Total 150

153
Acute myelogenous leukaemia Single Items Not at all A little Quite a bit Very much Total N (%) N (%) N (%) N (%) N 1) Strenuous activities PF Previous version of this scale used 2) Long walk PF Previous version of this scale used 3) Short walk PF Previous version of this scale used 4) Bed or chair PF Previous version of this scale used 5) Self care PF Previous version of this scale used 6) Limited in work RF Previous version of this scale used 7) Limited in leisure RF Previous version of this scale used 8) Dyspnoea DY 105 68 46 30 3 2 0 0 154 9) Pain PA 99 64 40 26 13 8 3 2 155 10) Need to rest FA 21 14 76 50 44 29 11 7 152 11) Insomnia SL 85 55 49 32 17 11 4 3 155 12) Felt weak FA 50 32 70 45 31 20 4 3 155 13) Appetite loss AP 105 68 26 17 12 8 11 7 154 14) Nausea NV 116 75 26 17 9 6 4 3 155 15) Vomiting NV 133 86 17 11 4 3 1 1 155 16) Constipation CO 126 83 17 11 8 5 1 1 152 17) Diarrhoea DI 114 75 26 17 7 5 6 4 153 18) Felt tired FA 38 25 77 51 34 22 3 2 152 19) Pain interference PA 112 75 28 19 8 5 2 1 150 20) Concentration CF 99 65 38 25 16 11 0 0 153 21) Tension EF 89 59 49 32 10 7 4 3 152 22) Worry EF 61 40 66 43 21 14 5 3 153 23) Irritability EF 101 66 42 28 9 6 1 1 153 24) Depression EF 102 67 44 29 3 2 3 2 152 25) Memory trouble CF 103 67 43 28 6 4 1 1 153 26) Family life SF 66 44 47 31 25 17 12 8 150 27) Social activities SF 57 39 40 27 22 15 27 19 146 28) Financial difficulties FI 93 64 31 21 15 10 7 5 146 1 2 3 4 5 6 7 Total (very poor) (excellent) 29) Overall health QL Previous version of this scale used 30) Overall quality of life QL 2 0 10 26 39 49 25 151 1 0 7 17 26 33 17

154
Liver/bile/pancreas cancer Characteristics of the sample Version of the QLQ-C30 Primary disease site N (%) N (%) v 1.0 14 2 Liver/bile 452 60 v +3 0 0 Pancreas 298 40 v 2.0 487 65 Total 750 v 3.0 249 33 Total 750 Age N (%) <40 58 8 40-49 88 12 50-59 175 23 60-69 247 33 70-79 161 22 80+ 18 2 Not known 3 0 Total 750 Gender N (%) Male 463 62 Female 228 30 Not known 59 8 Total 750 Stage N (%) Stage I-II 41 6 Stage III-IV 225 30 Recurrent/metastatic 336 45 Not known 148 20 Total 750 Constructed scales Mean (SD) Median [IQR] Global health status/QoL QL 55.9 (25.1) 58.3 [41.7-75] Physical functioning PF 74.1 (25.7) 80 [60-93.3] Role Functioning RF 65.2 (36.3) 83.3 [33.3-100] Emotional functioning EF 69.8 (25.5) 75 [50-91.7] Cognitive functioning CF 79.0 (23.1) 83.3 [66.7-100] Social functioning SF 69.0 (31.7) 83.3 [50-100] Fatigue FA 41.2 (30) 33.3 [22.2-66.7] Nausea and vomiting NV 12.4 (22.5) 0 [0-16.7] Pain PA 29.6 (32.8) 16.7 [0-50] Dyspnoea DY 20.8 (28.7) 0 [0-33.3] Insomnia SL 32.2 (34.4) 33.3 [0-66.7] Appetite loss AP 32.3 (37.2) 33.3 [0-66.7] Constipation CO 20.4 (31.3) 0 [0-33.3] Diarrhoea DI 11.1 (23.9) 0 [0-0] Financial difficulties FI 21.9 (32.5) 0 [0-33.3]

155
Liver/bile/pancreas cancer Constructed scales QL N (%) CF N (%) 0 24 3 0 9 1 8.3 12 2 16.7 18 2 16.7 52 7 33.3 27 4 25 24 3 50 75 10 33.3 61 8 66.7 128 17 41.7 48 7 83.3 196 27 50 122 17 100 286 39 58.3 58 8 Total 739 66.7 130 18 75 44 6 83.3 89 12 91.7 23 3 SF N (%) 100 42 6 0 56 8 Total 729 16.7 33 5 33.3 59 8 PF N (%) 50 80 11 0 1 0 66.7 131 18 6.7 2 1 83.3 115 16 13.3 7 3 100 253 35 20 2 1 Total 727 26.7 9 4 33.3 6 3 40 13 5 46.7 7 3 FA N (%) 53.3 10 4 0 92 13 60 16 7 11.1 90 12 66.7 14 6 22.2 97 13 73.3 11 5 33.3 122 17 80 29 12 44.4 71 10 86.7 34 14 55.6 58 8 93.3 24 10 66.7 70 10 100 59 24 77.8 41 6 Total 244 88.9 49 7 100 45 6 RF N (%) Total 735 0 105 15 16.7 25 4 33.3 74 10 50 51 7 NV N (%) 66.7 101 14 0 494 66 83.3 97 14 16.7 109 15 100 267 37 33.3 67 9 Total 720 50 32 4 66.7 18 2 EF N (%) 83.3 10 1 0 8 1 100 16 2 8.3 9 1 Total 746 16.7 17 2 25 27 4 33.3 40 6 41.7 44 6 PA N (%) 50 54 7 0 291 39 58.3 51 7 16.7 126 17 66.7 72 10 33.3 100 14 75 91 12 50 57 8 83.3 91 12 66.7 62 8 91.7 98 13 83.3 49 7 100 131 18 100 54 7 Total 733 Total 739

156
Liver/bile/pancreas cancer Single Items Not at all A little Quite a bit Very much Total N (%) N (%) N (%) N (%) N 1) Strenuous activities PF 87 35 68 28 40 16 51 21 246 2) Long walk PF 100 40 53 21 46 19 49 20 248 3) Short walk PF 189 76 27 11 21 8 12 5 249 4) Bed or chair PF 131 53 47 19 46 19 24 10 248 5) Self care PF 219 88 16 6 12 5 2 1 249 6) Limited in work RF 306 42 168 23 119 16 131 18 724 7) Limited in leisure RF 362 50 140 19 102 14 124 17 728 8) Dyspnoea DY 430 58 196 26 80 11 36 5 742 9) Pain PA 313 42 232 31 112 15 88 12 745 10) Need to rest FA 186 25 261 35 183 25 113 15 743 11) Insomnia SL 325 44 207 28 129 17 85 11 746 12) Felt weak FA 232 31 256 34 148 20 111 15 747 13) Appetite loss AP 362 49 160 21 109 15 115 15 746 14) Nausea NV 504 67 147 20 58 8 39 5 748 15) Vomiting NV 630 85 71 10 25 3 20 3 746 16) Constipation CO 474 64 137 18 80 11 53 7 744 17) Diarrhoea DI 578 78 109 15 30 4 26 4 743 18) Felt tired FA 199 27 284 38 146 20 113 15 742 19) Pain interference PA 418 56 134 18 108 15 84 11 744 20) Concentration CF 432 58 173 23 92 12 48 6 745 21) Tension EF 330 44 237 32 127 17 50 7 744 22) Worry EF 230 31 240 32 162 22 111 15 743 23) Irritability EF 346 47 251 34 119 16 26 4 742 24) Depression EF 355 48 224 30 103 14 59 8 741 25) Memory trouble CF 410 55 249 34 60 8 22 3 741 26) Family life SF 359 49 195 27 98 13 82 11 734 27) Social activities SF 330 45 187 26 112 15 105 14 734 28) Financial difficulties FI 454 62 140 19 76 10 63 9 733 1 2 3 4 5 6 7 Total (very poor) (excellent) 29) Overall health QL 40 67 97 188 174 115 51 732 6 9 13 26 24 16 7 30) Overall quality of life QL 40 63 101 172 162 123 82 743 5 9 14 23 22 17 11
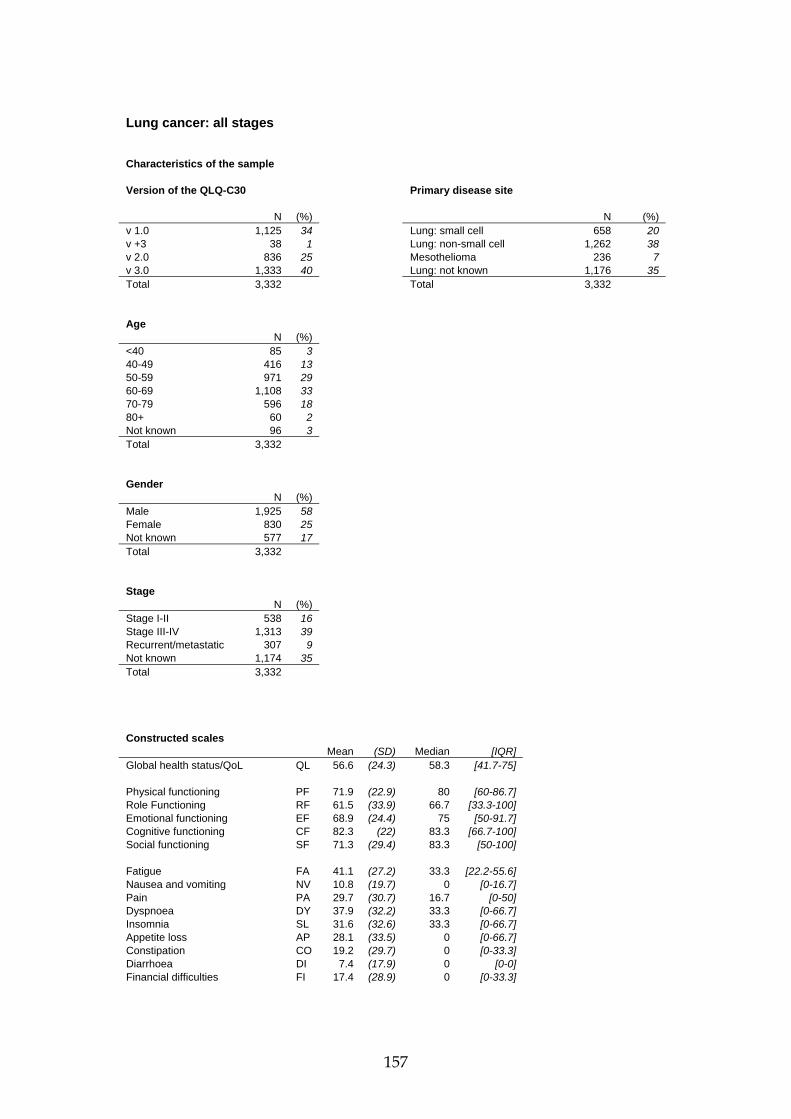
157
Lung cancer: all stages Characteristics of the sample Version of the QLQ-C30 Primary disease site N (%) N (%) v 1.0 1,125 34 Lung: small cell 658 20 v +3 38 1 Lung: non-small cell 1,262 38 v 2.0 836 25 Mesothelioma 236 7 v 3.0 1,333 40 Lung: not known 1,176 35 Total 3,332 Total 3,332 Age N (%) <40 85 3 40-49 416 13 50-59 971 29 60-69 1,108 33 70-79 596 18 80+ 60 2 Not known 96 3 Total 3,332 Gender N (%) Male 1,925 58 Female 830 25 Not known 577 17 Total 3,332 Stage N (%) Stage I-II 538 16 Stage III-IV 1,313 39 Recurrent/metastatic 307 9 Not known 1,174 35 Total 3,332 Constructed scales Mean (SD) Median [IQR] Global health status/QoL QL 56.6 (24.3) 58.3 [41.7-75] Physical functioning PF 71.9 (22.9) 80 [60-86.7] Role Functioning RF 61.5 (33.9) 66.7 [33.3-100] Emotional functioning EF 68.9 (24.4) 75 [50-91.7] Cognitive functioning CF 82.3 (22) 83.3 [66.7-100] Social functioning SF 71.3 (29.4) 83.3 [50-100] Fatigue FA 41.1 (27.2) 33.3 [22.2-55.6] Nausea and vomiting NV 10.8 (19.7) 0 [0-16.7] Pain PA 29.7 (30.7) 16.7 [0-50] Dyspnoea DY 37.9 (32.2) 33.3 [0-66.7] Insomnia SL 31.6 (32.6) 33.3 [0-66.7] Appetite loss AP 28.1 (33.5) 0 [0-66.7] Constipation CO 19.2 (29.7) 0 [0-33.3] Diarrhoea DI 7.4 (17.9) 0 [0-0] Financial difficulties FI 17.4 (28.9) 0 [0-33.3]

158
Lung cancer: all stages Constructed scales QL N (%) CF N (%) 0 80 4 0 32 1 8.3 31 1 16.7 50 2 16.7 95 4 33.3 136 4 25 59 3 50 229 7 33.3 221 10 66.7 496 15 41.7 121 6 83.3 822 25 50 412 19 100 1,517 46 58.3 185 9 Total 3,282 66.7 371 17 75 147 7 83.3 264 12 91.7 79 4 SF N (%) 100 110 5 0 154 5 Total 2,175 16.7 117 4 33.3 312 10 PF N (%) 50 354 11 0 5 0 66.7 650 20 6.7 12 1 83.3 475 15 13.3 12 1 100 1,188 37 20 26 2 Total 3,250 26.7 44 3 33.3 27 2 40 40 3 46.7 47 4 FA N (%) 53.3 83 6 0 358 11 60 99 8 11.1 270 8 66.7 125 10 22.2 437 13 73.3 128 10 33.3 692 21 80 150 12 44.4 390 12 86.7 197 15 55.6 344 11 93.3 157 12 66.7 314 10 100 156 12 77.8 157 5 Total 1,308 88.9 141 4 100 161 5 RF N (%) Total 3,264 0 249 12 16.7 111 5 33.3 302 14 50 207 10 NV N (%) 66.7 417 19 0 2,227 68 83.3 255 12 16.7 491 15 100 609 28 33.3 315 10 Total 2,150 50 118 4 66.7 76 2 EF N (%) 83.3 23 1 0 35 1 100 38 1 8.3 38 1 Total 3,288 16.7 72 2 25 93 3 33.3 158 5 41.7 173 5 PA N (%) 50 272 8 0 1,171 36 58.3 279 9 16.7 561 17 66.7 444 14 33.3 548 17 75 405 13 50 337 10 83.3 399 12 66.7 306 9 91.7 338 11 83.3 157 5 100 519 16 100 191 6 Total 3,225 Total 3,271

159
Lung cancer: all stages Single Items Not at all A little Quite a bit Very much Total N (%) N (%) N (%) N (%) N 1) Strenuous activities PF 257 20 498 38 346 26 219 17 1,320 2) Long walk PF 341 26 435 33 342 26 208 16 1,326 3) Short walk PF 818 62 340 26 124 9 46 4 1,328 4) Bed or chair PF 654 49 395 30 201 15 80 6 1,330 5) Self care PF 1,174 88 103 8 39 3 15 1 1,331 6) Limited in work RF 716 33 613 28 490 23 355 16 2,174 7) Limited in leisure RF 850 39 584 27 403 19 327 15 2,164 8) Dyspnoea DY 972 30 1,264 38 692 21 368 11 3,296 9) Pain PA 1,311 40 1,079 33 605 18 308 9 3,303 10) Need to rest FA 651 20 1,408 43 852 26 389 12 3,300 11) Insomnia SL 1,370 42 1,019 31 611 19 292 9 3,292 12) Felt weak FA 938 28 1,229 37 769 23 366 11 3,302 13) Appetite loss AP 1,663 50 811 25 519 16 311 9 3,304 14) Nausea NV 2,307 70 659 20 245 7 96 3 3,307 15) Vomiting NV 2,789 85 373 11 92 3 48 2 3,302 16) Constipation CO 2,105 64 671 20 324 10 193 6 3,293 17) Diarrhoea DI 2,719 83 436 13 104 3 29 1 3,288 18) Felt tired FA 684 21 1,489 45 801 24 325 10 3,299 19) Pain interference PA 1,706 52 800 24 487 15 294 9 3,287 20) Concentration CF 2,097 63 740 22 343 10 125 4 3,305 21) Tension EF 1,168 35 1,324 40 585 18 223 7 3,300 22) Worry EF 908 28 1,220 37 775 24 388 12 3,291 23) Irritability EF 1,603 49 1,143 35 415 13 117 4 3,278 24) Depression EF 1,315 40 1,265 39 484 15 214 7 3,278 25) Memory trouble CF 2,003 61 949 29 263 8 76 2 3,291 26) Family life SF 1,734 53 856 26 458 14 226 7 3,274 27) Social activities SF 1,394 43 923 28 601 18 357 11 3,275 28) Financial difficulties FI 2,217 68 579 18 309 9 171 5 3,276 1 2 3 4 5 6 7 Total (very poor) (excellent) 29) Overall health QL 115 138 318 573 538 370 130 2,182 5 6 15 26 25 17 6 30) Overall quality of life QL 164 217 473 761 767 579 317 3,278 5 7 14 23 23 18 10

160
Lung cancer: males Characteristics of the sample Version of the QLQ-C30 Primary disease site N (%) N (%) v 1.0 807 42 Lung: small cell 407 21 v +3 30 2 Lung: non-small cell 514 27 v 2.0 241 13 Mesothelioma 183 10 v 3.0 847 44 Lung: not known 821 43 Total 1,925 Total 1,925 Age N (%) <40 36 2 40-49 188 10 50-59 548 29 60-69 692 36 70-79 416 22 80+ 41 2 Not known 4 0 Total 1,925 Stage N (%) Stage I-II 385 20 Stage III-IV 580 30 Recurrent/metastatic 197 10 Not known 763 40 Total 1,925 Constructed scales Mean (SD) Median [IQR] Global health status/QoL QL 56.9 (24.5) 58.3 [41.7-75] Physical functioning PF 72.9 (23.1) 80 [60-93.3] Role Functioning RF 63.6 (33.5) 66.7 [33.3-100] Emotional functioning EF 71.6 (23.5) 75 [58.3-91.7] Cognitive functioning CF 82.7 (21.6) 83.3 [66.7-100] Social functioning SF 72.7 (28.3) 83.3 [50-100] Fatigue FA 39.8 (26.7) 33.3 [22.2-55.6] Nausea and vomiting NV 9.5 (18.3) 0 [0-16.7] Pain PA 27.4 (29.6) 16.7 [0-50] Dyspnoea DY 38.2 (32.1) 33.3 [0-66.7] Insomnia SL 29.7 (31.9) 33.3 [0-66.7] Appetite loss AP 26.8 (33.1) 0 [0-33.3] Constipation CO 20.1 (30.2) 0 [0-33.3] Diarrhoea DI 7.3 (17.7) 0 [0-0] Financial difficulties FI 18.2 (29.4) 0 [0-33.3]

161
Lung cancer: males Constructed scales QL N (%) CF N (%) 0 39 4 0 16 1 8.3 18 2 16.7 24 1 16.7 55 5 33.3 78 4 25 23 2 50 134 7 33.3 105 10 66.7 284 15 41.7 61 6 83.3 484 25 50 209 19 100 885 47 58.3 96 9 Total 1,905 66.7 182 17 75 77 7 83.3 148 13 91.7 31 3 SF N (%) 100 61 6 0 73 4 Total 1,105 16.7 60 3 33.3 168 9 PF N (%) 50 211 11 0 4 1 66.7 375 20 6.7 7 1 83.3 298 16 13.3 10 1 100 699 37 20 18 2 Total 1,884 26.7 27 3 33.3 12 1 40 25 3 46.7 24 3 FA N (%) 53.3 48 6 0 214 11 60 53 6 11.1 166 9 66.7 79 10 22.2 255 14 73.3 85 10 33.3 417 22 80 104 13 44.4 245 13 86.7 117 14 55.6 192 10 93.3 110 13 66.7 165 9 100 109 13 77.8 78 4 Total 832 88.9 76 4 100 85 5 RF N (%) Total 1,893 0 118 11 16.7 48 4 33.3 133 12 50 110 10 NV N (%) 66.7 220 20 0 1,342 70 83.3 126 12 16.7 278 15 100 334 31 33.3 164 9 Total 1,089 50 56 3 66.7 40 2 EF N (%) 83.3 13 1 0 21 1 100 14 1 8.3 12 1 Total 1,907 16.7 32 2 25 36 2 33.3 83 4 41.7 84 5 PA N (%) 50 150 8 0 730 38 58.3 161 9 16.7 319 17 66.7 242 13 33.3 340 18 75 248 13 50 185 10 83.3 240 13 66.7 161 9 91.7 224 12 83.3 70 4 100 347 19 100 96 5 Total 1,880 Total 1,901

162
Lung cancer: males Single Items Not at all A little Quite a bit Very much Total N (%) N (%) N (%) N (%) N 1) Strenuous activities PF 181 22 308 37 224 27 129 15 842 2) Long walk PF 236 28 284 34 197 23 126 15 843 3) Short walk PF 532 63 213 25 71 8 28 3 844 4) Bed or chair PF 435 52 237 28 120 14 53 6 845 5) Self care PF 747 88 60 7 28 3 11 1 846 6) Limited in work RF 395 36 307 28 230 21 169 15 1,101 7) Limited in leisure RF 454 41 307 28 185 17 150 14 1,096 8) Dyspnoea DY 558 29 717 38 425 22 205 11 1,905 9) Pain PA 818 43 627 33 323 17 148 8 1,916 10) Need to rest FA 403 21 824 43 476 25 206 11 1,909 11) Insomnia SL 839 44 583 31 337 18 147 8 1,906 12) Felt weak FA 538 28 735 38 448 23 191 10 1,912 13) Appetite loss AP 998 52 454 24 294 15 166 9 1,912 14) Nausea NV 1,387 72 359 19 128 7 43 2 1,917 15) Vomiting NV 1,657 87 184 10 51 3 20 1 1,912 16) Constipation CO 1,195 63 390 20 209 11 115 6 1,909 17) Diarrhoea DI 1,583 83 253 13 58 3 16 1 1,910 18) Felt tired FA 423 22 888 46 437 23 166 9 1,914 19) Pain interference PA 1,030 54 471 25 257 14 148 8 1,906 20) Concentration CF 1,255 66 412 22 185 10 62 3 1,914 21) Tension EF 774 41 768 40 278 15 92 5 1,912 22) Worry EF 620 33 727 38 394 21 168 9 1,909 23) Irritability EF 923 49 683 36 238 13 59 3 1,903 24) Depression EF 829 44 711 37 257 14 106 6 1,903 25) Memory trouble CF 1,138 60 568 30 161 8 43 2 1,910 26) Family life SF 1,011 53 504 27 271 14 113 6 1,899 27) Social activities SF 837 44 561 30 323 17 175 9 1,896 28) Financial difficulties FI 1,261 66 343 18 192 10 104 6 1,900 1 2 3 4 5 6 7 Total (very poor) (excellent) 29) Overall health QL 60 73 151 284 276 194 69 1,107 5 7 14 26 25 18 6 30) Overall quality of life QL 83 130 261 444 436 361 186 1,901 4 7 14 23 23 19 10
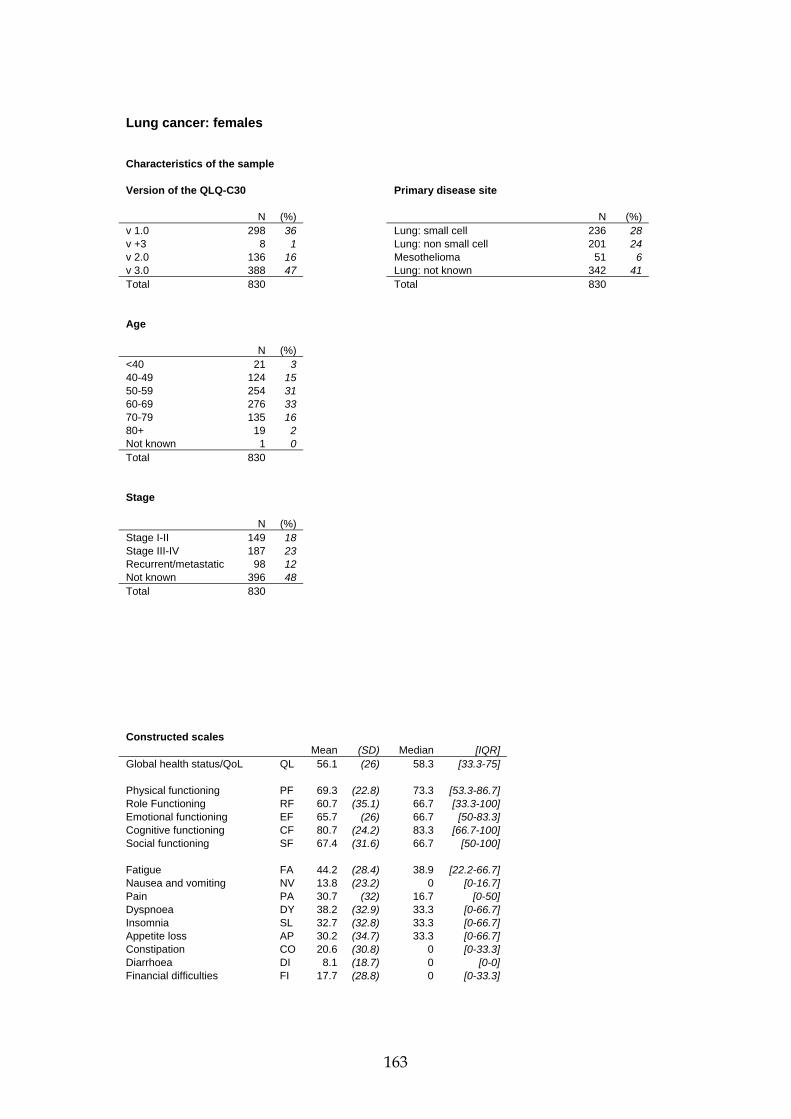
163
Lung cancer: females Characteristics of the sample Version of the QLQ-C30 Primary disease site N (%) N (%) v 1.0 298 36 Lung: small cell 236 28 v +3 8 1 Lung: non small cell 201 24 v 2.0 136 16 Mesothelioma 51 6 v 3.0 388 47 Lung: not known 342 41 Total 830 Total 830 Age N (%) <40 21 3 40-49 124 15 50-59 254 31 60-69 276 33 70-79 135 16 80+ 19 2 Not known 1 0 Total 830 Stage N (%) Stage I-II 149 18 Stage III-IV 187 23 Recurrent/metastatic 98 12 Not known 396 48 Total 830 Constructed scales Mean (SD) Median [IQR] Global health status/QoL QL 56.1 (26) 58.3 [33.3-75] Physical functioning PF 69.3 (22.8) 73.3 [53.3-86.7] Role Functioning RF 60.7 (35.1) 66.7 [33.3-100] Emotional functioning EF 65.7 (26) 66.7 [50-83.3] Cognitive functioning CF 80.7 (24.2) 83.3 [66.7-100] Social functioning SF 67.4 (31.6) 66.7 [50-100] Fatigue FA 44.2 (28.4) 38.9 [22.2-66.7] Nausea and vomiting NV 13.8 (23.2) 0 [0-16.7] Pain PA 30.7 (32) 16.7 [0-50] Dyspnoea DY 38.2 (32.9) 33.3 [0-66.7] Insomnia SL 32.7 (32.8) 33.3 [0-66.7] Appetite loss AP 30.2 (34.7) 33.3 [0-66.7] Constipation CO 20.6 (30.8) 0 [0-33.3] Diarrhoea DI 8.1 (18.7) 0 [0-0] Financial difficulties FI 17.7 (28.8) 0 [0-33.3]
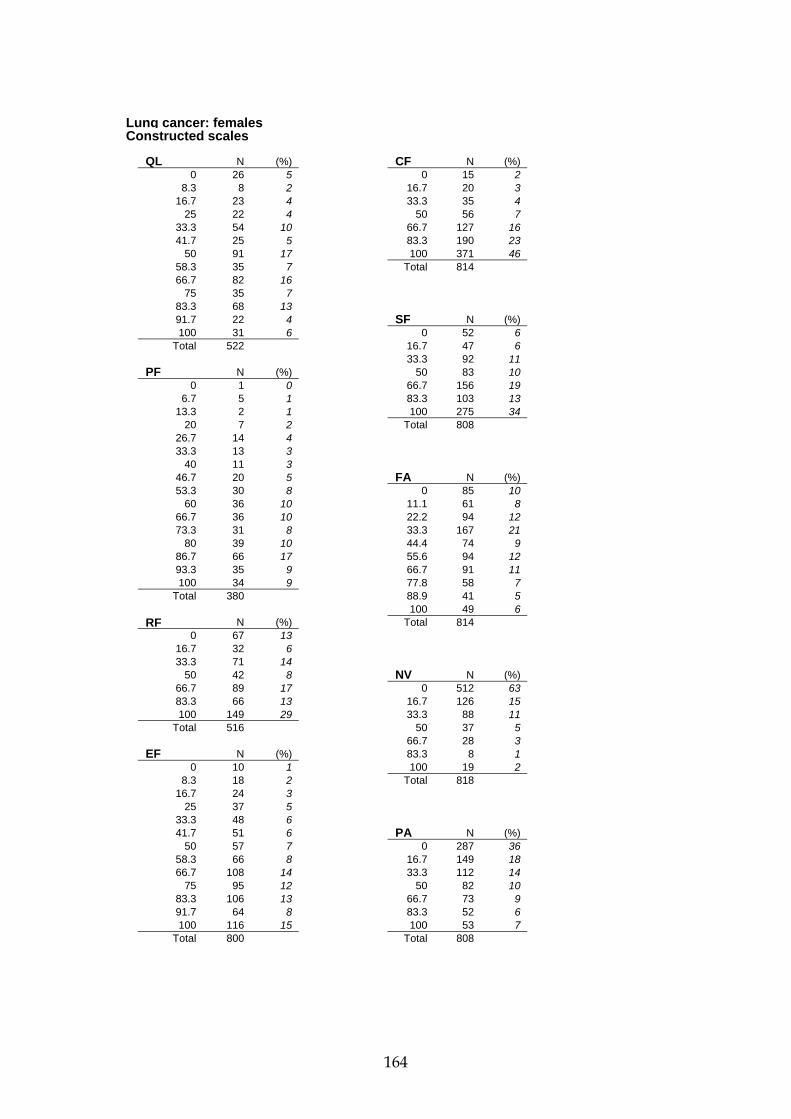
164
Lung cancer: females Constructed scales QL N (%) CF N (%) 0 26 5 0 15 2 8.3 8 2 16.7 20 3 16.7 23 4 33.3 35 4 25 22 4 50 56 7 33.3 54 10 66.7 127 16 41.7 25 5 83.3 190 23 50 91 17 100 371 46 58.3 35 7 Total 814 66.7 82 16 75 35 7 83.3 68 13 91.7 22 4 SF N (%) 100 31 6 0 52 6 Total 522 16.7 47 6 33.3 92 11 PF N (%) 50 83 10 0 1 0 66.7 156 19 6.7 5 1 83.3 103 13 13.3 2 1 100 275 34 20 7 2 Total 808 26.7 14 4 33.3 13 3 40 11 3 46.7 20 5 FA N (%) 53.3 30 8 0 85 10 60 36 10 11.1 61 8 66.7 36 10 22.2 94 12 73.3 31 8 33.3 167 21 80 39 10 44.4 74 9 86.7 66 17 55.6 94 12 93.3 35 9 66.7 91 11 100 34 9 77.8 58 7 Total 380 88.9 41 5 100 49 6 RF N (%) Total 814 0 67 13 16.7 32 6 33.3 71 14 50 42 8 NV N (%) 66.7 89 17 0 512 63 83.3 66 13 16.7 126 15 100 149 29 33.3 88 11 Total 516 50 37 5 66.7 28 3 EF N (%) 83.3 8 1 0 10 1 100 19 2 8.3 18 2 Total 818 16.7 24 3 25 37 5 33.3 48 6 41.7 51 6 PA N (%) 50 57 7 0 287 36 58.3 66 8 16.7 149 18 66.7 108 14 33.3 112 14 75 95 12 50 82 10 83.3 106 13 66.7 73 9 91.7 64 8 83.3 52 6 100 116 15 100 53 7 Total 800 Total 808

165
Lung cancer: females Single Items Not at all A little Quite a bit Very much Total N (%) N (%) N (%) N (%) N 1) Strenuous activities PF 50 13 158 41 102 27 72 19 382 2) Long walk PF 81 21 120 31 118 31 67 17 386 3) Short walk PF 222 58 105 27 43 11 16 4 386 4) Bed or chair PF 173 45 123 32 66 17 25 7 387 5) Self care PF 337 87 36 9 10 3 4 1 387 6) Limited in work RF 169 32 147 28 116 22 93 18 525 7) Limited in leisure RF 217 42 115 22 99 19 90 17 521 8) Dyspnoea DY 244 30 316 39 157 19 104 13 821 9) Pain PA 323 39 268 33 142 17 86 11 819 10) Need to rest FA 143 17 334 41 228 28 116 14 821 11) Insomnia SL 326 40 263 32 155 19 78 10 822 12) Felt weak FA 217 27 284 35 192 23 127 16 820 13) Appetite loss AP 394 48 205 25 130 16 93 11 822 14) Nausea NV 530 65 177 22 74 9 39 5 820 15) Vomiting NV 657 80 116 14 29 4 22 3 824 16) Constipation CO 508 62 174 21 81 10 57 7 820 17) Diarrhoea DI 664 82 112 14 32 4 7 1 815 18) Felt tired FA 156 19 342 42 232 28 92 11 822 19) Pain interference PA 426 52 175 22 123 15 90 11 814 20) Concentration CF 512 62 187 23 84 10 40 5 823 21) Tension EF 258 32 323 39 151 18 88 11 820 22) Worry EF 204 25 296 36 183 22 134 16 817 23) Irritability EF 407 50 264 32 106 13 42 5 819 24) Depression EF 284 35 317 39 133 16 80 10 814 25) Memory trouble CF 472 58 245 30 72 9 28 3 817 26) Family life SF 404 50 202 25 125 15 82 10 813 27) Social activities SF 320 39 218 27 154 19 125 15 817 28) Financial difficulties FI 542 67 155 19 74 9 43 5 814 1 2 3 4 5 6 7 Total (very poor) (excellent) 29) Overall health QL 33 36 86 121 117 97 35 525 6 7 16 23 22 19 7 30) Overall quality of life QL 63 56 120 180 171 134 88 812 8 7 15 22 21 17 11

166
Lung cancer: <50 Characteristics of the sample Version of the QLQ-C30 Primary disease site N (%) N (%) v 1.0 105 21 Lung: small cell 84 17 v +3 3 1 Lung: non small cell 200 40 v 2.0 188 38 Mesothelioma 46 9 v 3.0 205 41 Lung: not known 171 34 Total 501 Total 501 Age N (%) <40 85 17 40-49 416 83 50-59 0 0 60-69 0 0 70-79 0 0 80+ 0 0 Not known 0 0 Total 501 Gender N (%) Male 224 45 Female 145 29 Not known 132 26 Total 501 Stage N (%) Stage I-II 65 13 Stage III-IV 176 35 Recurrent/metastatic 44 9 Not known 216 43 Total 501 Constructed scales Mean (SD) Median [IQR] Global health status/QoL QL 57.6 (22.2) 58.3 [41.7-75] Physical functioning PF 74.3 (21.1) 80 [60-93.3] Role Functioning RF 62.6 (31.6) 66.7 [33.3-83.3] Emotional functioning EF 65.2 (25.1) 66.7 [50-83.3] Cognitive functioning CF 83.1 (20.7) 83.3 [66.7-100] Social functioning SF 67.8 (28.3) 66.7 [50-100] Fatigue FA 39.5 (25.2) 33.3 [22.2-55.6] Nausea and vomiting NV 11.4 (19.5) 0 [0-16.7] Pain PA 32.3 (29.1) 33.3 [0-50] Dyspnoea DY 33.9 (30.5) 33.3 [0-66.7] Insomnia SL 36.4 (32.9) 33.3 [0-66.7] Appetite loss AP 24.8 (30.3) 0 [0-33.3] Constipation CO 14.5 (26.3) 0 [0-33.3] Diarrhoea DI 7.5 (17.8) 0 [0-0] Financial difficulties FI 25.2 (32.1) 0 [0-33.3]

167
Lung cancer: <50 Constructed scales QL N (%) CF N (%) 0 8 2 0 4 1 8.3 1 0 16.7 6 1 16.7 14 4 33.3 16 3 25 11 3 50 28 6 33.3 47 12 66.7 83 17 41.7 22 6 83.3 130 27 50 77 20 100 224 46 58.3 38 10 Total 491 66.7 65 17 75 28 7 83.3 51 13 91.7 14 4 SF N (%) 100 15 4 0 18 4 Total 391 16.7 20 4 33.3 61 13 PF N (%) 50 63 13 0 0 0 66.7 120 25 6.7 4 2 83.3 64 13 13.3 1 1 100 143 29 20 0 0 Total 489 26.7 4 2 33.3 2 1 40 4 2 46.7 6 3 FA N (%) 53.3 14 7 0 52 11 60 23 11 11.1 39 8 66.7 17 8 22.2 70 14 73.3 25 12 33.3 114 23 80 22 11 44.4 54 11 86.7 27 13 55.6 59 12 93.3 21 10 66.7 55 11 100 32 16 77.8 16 3 Total 202 88.9 23 5 100 10 2 RF N (%) Total 492 0 36 9 16.7 15 4 33.3 54 14 50 50 13 NV N (%) 66.7 79 20 0 319 65 83.3 59 15 16.7 78 16 100 96 25 33.3 64 13 Total 389 50 12 2 66.7 14 3 EF N (%) 83.3 1 0 0 11 2 100 6 1 8.3 5 1 Total 494 16.7 10 2 25 17 4 33.3 32 7 41.7 27 6 PA N (%) 50 48 10 0 138 28 58.3 43 9 16.7 94 19 66.7 80 17 33.3 99 20 75 57 12 50 59 12 83.3 42 9 66.7 60 12 91.7 45 9 83.3 25 5 100 64 13 100 21 4 Total 481 Total 496

168
Lung cancer: <50 Single Items Not at all A little Quite a bit Very much Total N (%) N (%) N (%) N (%) N 1) Strenuous activities PF 43 21 84 41 57 28 19 9 203 2) Long walk PF 62 30 64 31 62 30 17 8 205 3) Short walk PF 132 64 55 27 13 6 5 2 205 4) Bed or chair PF 93 46 71 35 28 14 12 6 204 5) Self care PF 183 89 16 8 4 2 2 1 205 6) Limited in work RF 116 30 134 34 89 23 53 14 392 7) Limited in leisure RF 152 39 113 29 79 20 47 12 391 8) Dyspnoea DY 164 33 202 41 92 19 40 8 498 9) Pain PA 166 33 188 38 102 20 43 9 499 10) Need to rest FA 93 19 229 46 137 28 39 8 498 11) Insomnia SL 165 34 172 35 102 21 54 11 493 12) Felt weak FA 151 30 187 38 124 25 36 7 498 13) Appetite loss AP 256 51 142 29 71 14 29 6 498 14) Nausea NV 336 67 121 24 30 6 13 3 500 15) Vomiting NV 400 81 75 15 11 2 8 2 494 16) Constipation CO 352 71 93 19 30 6 21 4 496 17) Diarrhoea DI 405 82 69 14 15 3 4 1 493 18) Felt tired FA 98 20 229 46 129 26 41 8 497 19) Pain interference PA 215 43 151 30 101 20 31 6 498 20) Concentration CF 282 57 141 28 54 11 18 4 495 21) Tension EF 144 29 218 44 97 20 39 8 498 22) Worry EF 105 21 192 39 133 27 67 14 497 23) Irritability EF 197 40 192 39 71 15 28 6 488 24) Depression EF 172 35 207 42 84 17 28 6 491 25) Memory trouble CF 333 67 130 26 22 5 9 2 494 26) Family life SF 222 45 153 31 84 17 33 7 492 27) Social activities SF 169 34 163 33 114 23 46 9 492 28) Financial difficulties FI 261 54 123 25 64 13 39 8 487 1 2 3 4 5 6 7 Total (very poor) (excellent) 29) Overall health QL 10 18 65 105 101 74 18 391 3 5 17 27 26 19 5 30) Overall quality of life QL 15 27 85 113 123 87 44 494 3 6 17 23 25 18 9

169
Lung cancer: 50-59 Characteristics of the sample Version of the QLQ-C30 Primary disease site N (%) N (%) v 1.0 280 29 Lung: small cell 227 23 v +3 5 1 Lung: non small cell 340 35 v 2.0 259 27 Mesothelioma 92 9 v 3.0 427 44 Lung: not known 312 32 Total 971 Total 971 Age N (%) <40 0 0 40-49 0 0 50-59 971 100 60-69 0 0 70-79 0 0 80+ 0 0 Not known 0 0 Total 971 Gender N (%) Male 548 56 Female 254 26 Not known 169 17 Total 971 Stage N (%) Stage I-II 130 13 Stage III-IV 362 37 Recurrent/metastatic 76 8 Not known 403 42 Total 971 Constructed scales Mean (SD) Median [IQR] Global health status/QoL QL 57.7 (23.5) 58.3 [41.7-75] Physical functioning PF 73.9 (21.2) 80 [60-86.7] Role Functioning RF 60.6 (33.8) 66.7 [33.3-100] Emotional functioning EF 67.2 (24) 66.7 [50-83.3] Cognitive functioning CF 82.9 (22.3) 83.3 [66.7-100] Social functioning SF 68.6 (29.9) 66.7 [50-100] Fatigue FA 40.0 (26.9) 33.3 [22.2-55.6] Nausea and vomiting NV 11.3 (19.8) 0 [0-16.7] Pain PA 31.3 (31.6) 16.7 [0-50] Dyspnoea DY 34.5 (32) 33.3 [0-66.7] Insomnia SL 32.4 (32.1) 33.3 [0-66.7] Appetite loss AP 27.0 (32.2) 0 [0-33.3] Constipation CO 16.3 (27.1) 0 [0-33.3] Diarrhoea DI 7.6 (17.9) 0 [0-0] Financial difficulties FI 22.0 (31.6) 0 [0-33.3]
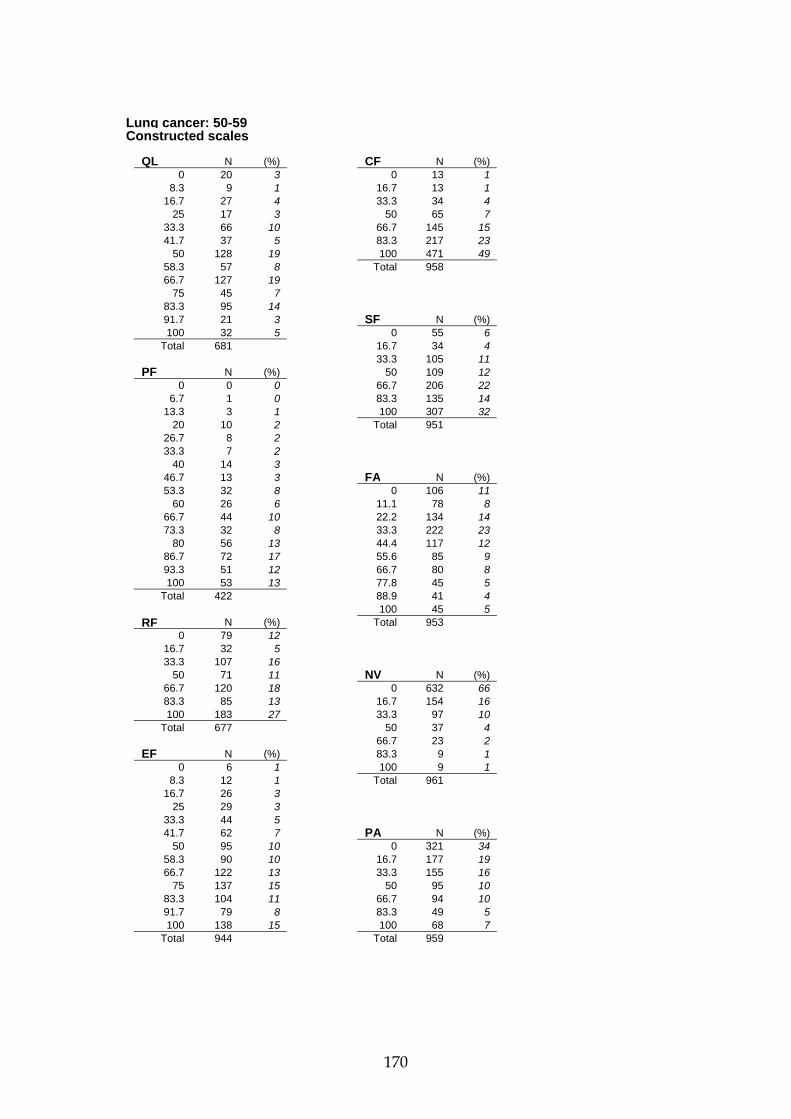
170
Lung cancer: 50-59 Constructed scales QL N (%) CF N (%) 0 20 3 0 13 1 8.3 9 1 16.7 13 1 16.7 27 4 33.3 34 4 25 17 3 50 65 7 33.3 66 10 66.7 145 15 41.7 37 5 83.3 217 23 50 128 19 100 471 49 58.3 57 8 Total 958 66.7 127 19 75 45 7 83.3 95 14 91.7 21 3 SF N (%) 100 32 5 0 55 6 Total 681 16.7 34 4 33.3 105 11 PF N (%) 50 109 12 0 0 0 66.7 206 22 6.7 1 0 83.3 135 14 13.3 3 1 100 307 32 20 10 2 Total 951 26.7 8 2 33.3 7 2 40 14 3 46.7 13 3 FA N (%) 53.3 32 8 0 106 11 60 26 6 11.1 78 8 66.7 44 10 22.2 134 14 73.3 32 8 33.3 222 23 80 56 13 44.4 117 12 86.7 72 17 55.6 85 9 93.3 51 12 66.7 80 8 100 53 13 77.8 45 5 Total 422 88.9 41 4 100 45 5 RF N (%) Total 953 0 79 12 16.7 32 5 33.3 107 16 50 71 11 NV N (%) 66.7 120 18 0 632 66 83.3 85 13 16.7 154 16 100 183 27 33.3 97 10 Total 677 50 37 4 66.7 23 2 EF N (%) 83.3 9 1 0 6 1 100 9 1 8.3 12 1 Total 961 16.7 26 3 25 29 3 33.3 44 5 41.7 62 7 PA N (%) 50 95 10 0 321 34 58.3 90 10 16.7 177 19 66.7 122 13 33.3 155 16 75 137 15 50 95 10 83.3 104 11 66.7 94 10 91.7 79 8 83.3 49 5 100 138 15 100 68 7 Total 944 Total 959

171
Lung cancer: 50-59 Single Items Not at all A little Quite a bit Very much Total N (%) N (%) N (%) N (%) N 1) Strenuous activities PF 83 20 159 37 119 28 64 15 425 2) Long walk PF 118 28 148 35 106 25 52 12 424 3) Short walk PF 277 65 97 23 44 10 8 2 426 4) Bed or chair PF 216 51 135 32 62 15 12 3 425 5) Self care PF 391 92 24 6 9 2 2 1 426 6) Limited in work RF 209 31 187 27 174 26 113 17 683 7) Limited in leisure RF 268 39 181 27 132 19 99 15 680 8) Dyspnoea DY 326 34 374 39 162 17 99 10 961 9) Pain PA 364 38 318 33 180 19 104 11 966 10) Need to rest FA 199 21 441 46 222 23 102 11 964 11) Insomnia SL 379 40 309 32 191 20 80 8 959 12) Felt weak FA 272 28 384 40 195 20 112 12 963 13) Appetite loss AP 486 51 242 25 162 17 71 7 961 14) Nausea NV 655 68 209 22 73 8 27 3 964 15) Vomiting NV 809 84 112 12 34 4 12 1 967 16) Constipation CO 651 68 193 20 80 8 39 4 963 17) Diarrhoea DI 785 82 135 14 32 3 7 1 959 18) Felt tired FA 191 20 470 49 208 22 93 10 962 19) Pain interference PA 485 51 237 25 137 14 101 11 960 20) Concentration CF 592 61 227 23 111 12 36 4 966 21) Tension EF 314 33 386 40 196 20 69 7 965 22) Worry EF 216 23 358 37 253 26 130 14 957 23) Irritability EF 455 47 347 36 132 14 26 3 960 24) Depression EF 364 38 385 40 145 15 63 7 957 25) Memory trouble CF 633 66 247 26 56 6 23 2 959 26) Family life SF 462 48 263 28 152 16 77 8 954 27) Social activities SF 369 39 283 30 194 20 113 12 959 28) Financial difficulties FI 575 60 206 22 103 11 73 8 957 1 2 3 4 5 6 7 Total (very poor) (excellent) 29) Overall health QL 29 45 107 160 181 121 41 684 4 7 16 23 27 18 6 30) Overall quality of life QL 40 60 136 201 244 187 89 957 4 6 14 21 26 20 9

172
Lung cancer: 60-69 Characteristics of the sample Version of the QLQ-C30 Primary disease site N (%) N (%) v 1.0 430 39 Lung: small cell 238 21 v +3 19 2 Lung: non small cell 380 34 v 2.0 245 22 Mesothelioma 79 7 v 3.0 414 37 Lung: not known 411 37 Total 1,108 Total 1,108 Age N (%) <40 0 0 40-49 0 0 50-59 0 0 60-69 1,108 100 70-79 0 0 80+ 0 0 Not known 0 0 Total 1,108 Gender N (%) Male 692 63 Female 276 25 Not known 140 13 Total 1,108 Stage N (%) Stage I-II 183 17 Stage III-IV 418 38 Recurrent/metastatic 110 10 Not known 397 36 Total 1,108 Constructed scales Mean (SD) Median [IQR] Global health status/QoL QL 56.3 (25.2) 58.3 [41.7-75] Physical functioning PF 69.9 (24.1) 73.3 [53.3-86.7] Role Functioning RF 61.4 (35.6) 66.7 [33.3-100] Emotional functioning EF 70.2 (23.9) 75 [58.3-91.7] Cognitive functioning CF 82.6 (21.9) 83.3 [66.7-100] Social functioning SF 73.2 (29.4) 83.3 [50-100] Fatigue FA 41.6 (27.6) 33.3 [22.2-55.6] Nausea and vomiting NV 10.5 (19.9) 0 [0-16.7] Pain PA 29.2 (31) 16.7 [0-50] Dyspnoea DY 39.9 (32.5) 33.3 [0-66.7] Insomnia SL 29.9 (32.5) 33.3 [0-66.7] Appetite loss AP 29.6 (34.6) 33.3 [0-66.7] Constipation CO 20.7 (30.9) 0 [0-33.3] Diarrhoea DI 7.7 (18.5) 0 [0-0] Financial difficulties FI 14.9 (27.3) 0 [0-33.3]

173
Lung cancer: 60-69 Constructed scales QL N (%) CF N (%) 0 29 4 0 10 1 8.3 11 2 16.7 16 2 16.7 33 5 33.3 48 4 25 14 2 50 70 6 33.3 68 10 66.7 160 15 41.7 36 5 83.3 275 25 50 132 20 100 513 47 58.3 54 8 Total 1,092 66.7 105 16 75 45 7 83.3 78 12 91.7 24 4 SF N (%) 100 42 6 0 53 5 Total 671 16.7 36 3 33.3 93 9 PF N (%) 50 106 10 0 2 1 66.7 197 18 6.7 4 1 83.3 167 15 13.3 5 1 100 436 40 20 10 3 Total 1,088 26.7 20 5 33.3 10 3 40 12 3 46.7 18 5 FA N (%) 53.3 24 6 0 128 12 60 30 7 11.1 86 8 66.7 33 8 22.2 134 12 73.3 44 11 33.3 216 20 80 43 11 44.4 133 12 86.7 56 14 55.6 118 11 93.3 49 12 66.7 110 10 100 43 11 77.8 59 5 Total 403 88.9 48 4 100 54 5 RF N (%) Total 1,086 0 90 14 16.7 36 5 33.3 92 14 50 43 7 NV N (%) 66.7 123 19 0 755 69 83.3 67 10 16.7 153 14 100 210 32 33.3 94 9 Total 661 50 45 4 66.7 22 2 EF N (%) 83.3 11 1 0 13 1 100 12 1 8.3 13 1 Total 1,092 16.7 19 2 25 28 3 33.3 49 5 41.7 51 5 PA N (%) 50 74 7 0 404 37 58.3 94 9 16.7 179 17 66.7 148 14 33.3 185 17 75 141 13 50 106 10 83.3 156 15 66.7 93 9 91.7 120 11 83.3 54 5 100 170 16 100 66 6 Total 1,076 Total 1,087

174
Lung cancer: 60-69 Single Items Not at all A little Quite a bit Very much Total N (%) N (%) N (%) N (%) N 1) Strenuous activities PF 79 19 142 35 102 25 85 21 408 2) Long walk PF 91 22 132 32 101 25 88 21 412 3) Short walk PF 239 58 111 27 41 10 20 5 411 4) Bed or chair PF 211 51 108 26 62 15 33 8 414 5) Self care PF 362 87 36 9 12 3 4 1 414 6) Limited in work RF 245 37 166 25 134 20 120 18 665 7) Limited in leisure RF 270 41 160 24 118 18 118 18 666 8) Dyspnoea DY 303 28 404 37 255 23 131 12 1,093 9) Pain PA 450 41 347 32 199 18 104 10 1,100 10) Need to rest FA 228 21 424 39 310 28 137 13 1,099 11) Insomnia SL 492 45 321 29 196 18 92 8 1,101 12) Felt weak FA 313 28 387 35 271 25 130 12 1,101 13) Appetite loss AP 543 49 257 23 183 17 119 11 1,102 14) Nausea NV 778 71 203 19 82 8 36 3 1,099 15) Vomiting NV 933 85 117 11 29 3 16 2 1,095 16) Constipation CO 681 62 221 20 117 11 75 7 1,094 17) Diarrhoea DI 900 82 148 14 33 3 13 1 1,094 18) Felt tired FA 238 22 471 43 287 26 101 9 1,097 19) Pain interference PA 582 53 255 23 154 14 102 9 1,093 20) Concentration CF 723 66 231 21 103 9 42 4 1,099 21) Tension EF 396 36 454 41 181 17 66 6 1,097 22) Worry EF 327 30 419 38 235 22 114 10 1,095 23) Irritability EF 556 51 375 34 122 11 40 4 1,093 24) Depression EF 447 41 416 38 155 14 73 7 1,091 25) Memory trouble CF 659 60 316 29 95 9 24 2 1,094 26) Family life SF 623 57 266 24 135 12 71 7 1,095 27) Social activities SF 503 46 290 27 174 16 125 11 1,092 28) Financial difficulties FI 793 72 160 15 97 9 45 4 1,095 1 2 3 4 5 6 7 Total (very poor) (excellent) 29) Overall health QL 40 47 78 202 152 107 46 672 6 7 12 30 23 16 7 30) Overall quality of life QL 57 75 156 276 220 198 107 1,089 5 7 14 25 20 18 10

175
Lung cancer: ≥70 Characteristics of the sample Version of the QLQ-C30 Primary disease site N (%) N (%) v 1.0 308 47 Lung: small cell 109 17 v +3 11 2 Lung: non small cell 252 38 v 2.0 140 21 Mesothelioma 19 3 v 3.0 197 30 Lung: not known 276 42 Total 656 Total 656 Age N (%) <40 0 0 40-49 0 0 50-59 0 0 60-69 0 0 70-79 596 91 80+ 60 9 Not known 0 0 Total 656 Gender N (%) Male 457 70 Female 154 24 Not known 45 7 Total 656 Stage N (%) Stage I-II 154 24 Stage III-IV 267 41 Recurrent/metastatic 77 12 Not known 158 24 Total 656 Constructed scales Mean (SD) Median [IQR] Global health status/QoL QL 54.4 (26.7) 58.3 [33.3-75] Physical functioning PF 68.2 (25.6) 73.3 [53.3-86.7] Role Functioning RF 61.3 (33.9) 66.7 [33.3-100] Emotional functioning EF 72.9 (24.8) 75 [58.3-91.7] Cognitive functioning CF 79.8 (23) 83.3 [66.7-100] Social functioning SF 74.9 (28.8) 83.3 [58.3-100] Fatigue FA 43.0 (28.7) 33.3 [22.2-66.7] Nausea and vomiting NV 9.9 (19.8) 0 [0-16.7] Pain PA 25.4 (30.6) 16.7 [0-50] Dyspnoea DY 42.4 (32.5) 33.3 [33.3-66.7] Insomnia SL 28.9 (32.7) 33.3 [0-33.3] Appetite loss AP 29.4 (36) 0 [0-66.7] Constipation CO 25.5 (33) 0 [0-33.3] Diarrhoea DI 6.4 (17) 0 [0-0] Financial difficulties FI 8.7 (21) 0 [0-0]

176
Lung cancer: ≥70 Constructed scales QL N (%) CF N (%) 0 21 6 0 5 1 8.3 8 2 16.7 15 2 16.7 18 5 33.3 33 5 25 15 4 50 60 9 33.3 29 9 66.7 94 15 41.7 16 5 83.3 176 27 50 54 16 100 262 41 58.3 28 8 Total 645 66.7 58 17 75 25 7 83.3 33 10 91.7 15 4 SF N (%) 100 18 5 0 25 4 Total 338 16.7 24 4 33.3 44 7 PF N (%) 50 64 10 0 3 2 66.7 104 17 6.7 3 2 83.3 98 16 13.3 3 2 100 269 43 20 5 3 Total 628 26.7 9 5 33.3 7 4 40 7 4 46.7 7 4 FA N (%) 53.3 8 4 0 67 11 60 11 6 11.1 58 9 66.7 22 11 22.2 81 13 73.3 16 8 33.3 114 18 80 23 12 44.4 78 12 86.7 28 15 55.6 71 11 93.3 26 14 66.7 62 10 100 15 8 77.8 31 5 Total 193 88.9 28 4 100 47 7 RF N (%) Total 637 0 36 11 16.7 24 7 33.3 39 12 50 35 11 NV N (%) 66.7 69 21 0 462 72 83.3 32 10 16.7 82 13 100 95 29 33.3 52 8 Total 330 50 22 3 66.7 15 2 EF N (%) 83.3 2 0 0 5 1 100 10 2 8.3 8 1 Total 645 16.7 14 2 25 16 3 33.3 30 5 41.7 25 4 PA N (%) 50 40 6 0 290 46 58.3 43 7 16.7 89 14 66.7 72 11 33.3 87 14 75 62 10 50 58 9 83.3 91 15 66.7 50 8 91.7 84 13 83.3 25 4 100 139 22 100 34 5 Total 629 Total 633

177
Lung cancer: ≥70 Single Items Not at all A little Quite a bit Very much Total N (%) N (%) N (%) N (%) N 1) Strenuous activities PF 27 14 83 42 50 26 36 18 196 2) Long walk PF 48 25 61 31 49 25 38 19 196 3) Short walk PF 109 56 58 30 18 9 11 6 196 4) Bed or chair PF 93 47 49 25 34 17 21 11 197 5) Self care PF 155 79 21 11 13 7 7 4 196 6) Limited in work RF 114 33 93 27 76 22 58 17 341 7) Limited in leisure RF 126 38 97 29 58 17 52 16 333 8) Dyspnoea DY 158 24 242 37 162 25 86 13 648 9) Pain PA 313 49 181 28 93 15 55 9 642 10) Need to rest FA 118 18 260 40 164 26 101 16 643 11) Insomnia SL 302 47 181 28 104 16 56 9 643 12) Felt weak FA 175 27 229 36 159 25 81 13 644 13) Appetite loss AP 336 52 134 21 94 15 83 13 647 14) Nausea NV 476 74 100 15 55 9 17 3 648 15) Vomiting NV 563 87 59 9 17 3 11 2 650 16) Constipation CO 354 55 145 23 90 14 56 9 645 17) Diarrhoea DI 551 85 71 11 19 3 5 1 646 18) Felt tired FA 144 22 266 41 156 24 81 13 647 19) Pain interference PA 381 60 123 19 82 13 54 8 640 20) Concentration CF 439 68 117 18 66 10 27 4 649 21) Tension EF 289 45 223 35 88 14 44 7 644 22) Worry EF 248 38 211 33 123 19 64 10 646 23) Irritability EF 359 56 184 29 77 12 22 3 642 24) Depression EF 304 47 209 33 86 13 45 7 644 25) Memory trouble CF 320 49 222 34 86 13 20 3 648 26) Family life SF 385 60 134 21 79 12 40 6 638 27) Social activities SF 316 50 156 25 100 16 65 10 637 28) Financial difficulties FI 530 83 65 10 38 6 9 1 642 1 2 3 4 5 6 7 Total (very poor) (excellent) 29) Overall health QL 32 24 51 74 84 54 22 341 9 7 15 22 25 16 7 30) Overall quality of life QL 49 48 82 142 156 96 69 642 8 8 13 22 24 15 11

178
Lung cancer: stage I-II
Characteristics of the sample
Version of the QLQ-C30 Primary disease site N (%) N (%)
v 1.0 242 45 Lung: small cell 4 1 v +3 2 0 Lung: non small cell 17 3 v 2.0 249 46 Lung: not known 517 96 v 3.0 45 8 Total 538 Total 538
Age N (%)
<40 13 2 40-49 52 10 50-59 130 24 60-69 183 34 70-79 140 26 80+ 14 3 Not known 6 1 Total 538
Gender N (%)
Male 385 72 Female 149 28 Not known 4 1 Total 538
Constructed scales Mean (SD) Median [IQR]
Global health status/QoL QL 52.1 (25.9) 50 [33.3-66.7]
Physical functioning PF Previous version of this scale used Role Functioning RF 64.9 (35.8) 66.7 [33.3-100] Emotional functioning EF 66.3 (26.4) 66.7 [50-91.7] Cognitive functioning CF 81.5 (21.8) 83.3 [66.7-100] Social functioning SF 71.0 (30.3) 83.3 [50-100]
Fatigue FA 38.6 (28) 33.3 [16.7-55.6] Nausea and vomiting NV 8.6 (19.2) 0 [0-0] Pain PA 28.3 (31) 16.7 [0-50] Dyspnoea DY 42.7 (34.4) 33.3 [0-66.7] Insomnia SL 31.6 (33.9) 33.3 [0-66.7] Appetite loss AP 24.1 (33.7) 0 [0-33.3] Constipation CO 15.0 (26.9) 0 [0-33.3] Diarrhoea DI 6.7 (17.1) 0 [0-0] Financial difficulties FI 16.5 (28.1) 0 [0-33.3]

179
Lung cancer: stage I-II Constructed scales QL N (%) CF N (%) 0 17 6 0 4 1 8.3 3 1 16.7 7 1 16.7 18 6 33.3 21 4 25 13 5 50 49 9 33.3 39 14 66.7 86 16 41.7 17 6 83.3 129 24 50 47 16 100 237 45 58.3 27 9 Total 533 66.7 42 15 75 12 4 83.3 27 9 91.7 10 4 SF N (%) 100 15 5 0 28 5 Total 287 16.7 26 5 33.3 40 8 PF 50 65 12 Previous version of this scale used 66.7 95 18 83.3 75 14 100 198 38 Total 527 FA N (%) 0 79 15 11.1 53 10 22.2 70 13 33.3 99 19 44.4 50 10 55.6 55 10 66.7 48 9 77.8 31 6 88.9 25 5 100 18 3 RF N (%) Total 528 0 34 12 16.7 19 7 33.3 23 8 50 27 10 NV N (%) 66.7 37 13 0 405 76 83.3 35 13 16.7 63 12 100 101 37 33.3 28 5 Total 276 50 17 3 66.7 10 2 EF N (%) 83.3 6 1 0 8 2 100 6 1 8.3 10 2 Total 535 16.7 15 3 25 23 4 33.3 32 6 41.7 31 6 PA N (%) 50 45 9 0 211 40 58.3 53 10 16.7 78 15 66.7 45 9 33.3 79 15 75 59 11 50 54 10 83.3 64 12 66.7 48 9 91.7 58 11 83.3 25 5 100 79 15 100 29 6 Total 522 Total 524

180
Lung cancer: stage I-II Single Items Not at all A little Quite a bit Very much Total N (%) N (%) N (%) N (%) N 1) Strenuous activities PF 1 2 16 36 15 34 12 27 44 2) Long walk PF 4 9 18 40 14 31 9 20 45 3) Short walk PF 14 32 24 55 4 9 2 5 44 4) Bed or chair PF 8 18 17 38 16 36 4 9 45 5) Self care PF 33 73 6 13 6 13 0 0 45 6) Limited in work RF 110 39 57 20 61 21 57 20 285 7) Limited in leisure RF 148 53 50 18 43 15 39 14 280 8) Dyspnoea DY 147 28 169 32 133 25 82 15 531 9) Pain PA 241 45 148 28 98 18 45 9 532 10) Need to rest FA 133 25 204 38 131 25 65 12 533 11) Insomnia SL 235 44 144 27 99 19 54 10 532 12) Felt weak FA 196 37 150 28 123 23 61 12 530 13) Appetite loss AP 314 59 106 20 60 11 53 10 533 14) Nausea NV 418 78 73 14 24 5 21 4 536 15) Vomiting NV 473 88 42 8 13 2 8 2 536 16) Constipation CO 384 72 81 15 51 10 19 4 535 17) Diarrhoea DI 450 84 65 12 15 3 4 1 534 18) Felt tired FA 143 27 220 41 129 24 44 8 536 19) Pain interference PA 288 54 110 21 83 16 48 9 529 20) Concentration CF 332 62 123 23 61 11 21 4 537 21) Tension EF 220 41 167 31 97 18 48 9 532 22) Worry EF 132 25 174 33 127 24 99 19 532 23) Irritability EF 257 48 169 32 79 15 28 5 533 24) Depression EF 218 41 162 31 95 18 55 10 530 25) Memory trouble CF 317 59 162 30 42 8 13 2 534 26) Family life SF 276 52 129 24 81 15 45 9 531 27) Social activities SF 245 46 137 26 85 16 64 12 531 28) Financial difficulties FI 367 69 83 16 58 11 21 4 529 1 2 3 4 5 6 7 Total (very poor) (excellent) 29) Overall health QL 23 23 56 69 56 45 17 289 8 8 19 24 19 16 6 30) Overall quality of life QL 30 43 85 123 113 79 53 526 6 8 16 23 22 15 10

181
Lung cancer: stage III-IV Characteristics of the sample Version of the QLQ-C30 Primary disease N (%) N (%)v 1.0 498 38 Lung: small cell 1 0v +3 0 0 Lung: non small cell 1,046 80v 2.0 472 36 Lung: not known 266 20v 3.0 343 26 Total 1,313 Total 1,313 Age N (%) <40 34 3 40-49 142 11 50-59 362 28 60-69 418 32 70-79 238 18 80+ 29 2 Not known 90 7 Total 1,313 Gender N (%) Male 580 44 Female 187 14 Not known 546 42 Total 1,313 Constructed scales Mean (SD) Median [IQR] Global health status/QoL QL 54.7 (23.8) 58.3 [41.7-66.7] Physical functioning PF 65.9 (25.6) 73.3 [46.7-86.7] Role Functioning RF 55.5 (34.5) 66.7 [33.3-83.3] Emotional functioning EF 67.3 (24.1) 66.7 [50-83.3] Cognitive functioning CF 81.6 (22.7) 83.3 [66.7-100] Social functioning SF 69.8 (30.3) 66.7 [50-100] Fatigue FA 44.2 (27.5) 44.4 [22.2-66.7] Nausea and vomiting NV 10.8 (19.1) 0 [0-16.7] Pain PA 34.7 (32.3) 33.3 [0-66.7] Dyspnoea DY 40.7 (32.2) 33.3 [0-66.7] Insomnia SL 34.8 (33.4) 33.3 [0-66.7] Appetite loss AP 31.1 (34.6) 33.3 [0-66.7] Constipation CO 22.2 (31.7) 0 [0-33.3] Diarrhoea DI 7.3 (18.1) 0 [0-0] Financial difficulties FI 15.0 (27.9) 0 [0-33.3]

182
Lung cancer: stage III-IV Constructed scales QL N (%) CF N (%) 0 30 4 0 11 1 8.3 11 1 16.7 24 2 16.7 38 5 33.3 65 5 25 23 3 50 95 7 33.3 96 12 66.7 193 15 41.7 49 6 83.3 310 24 50 152 19 100 593 46 58.3 76 10 Total 1,291 66.7 140 18 75 49 6 83.3 78 10 91.7 28 4 SF N (%) 100 32 4 0 69 5 Total 802 16.7 50 4 33.3 139 11 PF N (%) 50 146 11 0 2 1 66.7 244 19 6.7 4 1 83.3 170 13 13.3 6 2 100 459 36 20 14 4 Total 1,277 26.7 21 6 33.3 8 2 40 17 5 46.7 13 4 FA N (%) 53.3 26 8 0 120 9 60 28 8 11.1 93 7 66.7 27 8 22.2 150 12 73.3 34 10 33.3 245 19 80 32 10 44.4 177 14 86.7 41 12 55.6 142 11 93.3 30 9 66.7 148 12 100 35 10 77.8 68 5 Total 338 88.9 66 5 100 74 6 RF N (%) Total 1,283 0 121 15 16.7 48 6 33.3 135 17 50 83 10 NV N (%) 66.7 152 19 0 871 67 83.3 84 11 16.7 179 14 100 179 22 33.3 151 12 Total 802 50 52 4 66.7 21 2 EF N (%) 83.3 9 1 0 10 1 100 12 1 8.3 18 1 Total 1,295 16.7 29 2 25 39 3 33.3 66 5 41.7 72 6 PA N (%) 50 133 11 0 391 30 58.3 117 9 16.7 205 16 66.7 173 14 33.3 209 16 75 153 12 50 148 12 83.3 142 11 66.7 154 12 91.7 138 11 83.3 84 7 100 169 13 100 96 8 Total 1,259 Total 1,287

183
Lung cancer: stage III-IV Single Items Not at all A little Quite a bit Very much Total N (%) N (%) N (%) N (%) N 1) Strenuous activities PF 62 18 101 30 100 29 78 23 341 2) Long walk PF 71 21 87 26 100 29 83 24 341 3) Short walk PF 174 51 102 30 45 13 21 6 342 4) Bed or chair PF 150 44 82 24 80 23 31 9 343 5) Self care PF 281 82 39 11 18 5 4 1 342 6) Limited in work RF 213 27 216 27 207 26 169 21 805 7) Limited in leisure RF 257 32 229 28 165 21 154 19 805 8) Dyspnoea DY 341 26 490 38 315 24 156 12 1,302 9) Pain PA 445 34 404 31 294 23 160 12 1,303 10) Need to rest FA 209 16 530 41 378 29 188 14 1,305 11) Insomnia SL 486 38 405 31 268 21 137 11 1,296 12) Felt weak FA 332 25 481 37 337 26 155 12 1,305 13) Appetite loss AP 610 47 315 24 241 19 140 11 1,306 14) Nausea NV 901 69 270 21 100 8 34 3 1,305 15) Vomiting NV 1,092 84 157 12 30 2 18 1 1,297 16) Constipation CO 779 60 266 21 155 12 95 7 1,295 17) Diarrhoea DI 1,079 83 163 13 41 3 13 1 1,296 18) Felt tired FA 238 18 551 43 354 27 151 12 1,294 19) Pain interference PA 589 46 326 25 234 18 146 11 1,295 20) Concentration CF 798 61 291 22 161 12 51 4 1,301 21) Tension EF 405 31 508 39 293 23 95 7 1,301 22) Worry EF 323 25 458 35 361 28 154 12 1,296 23) Irritability EF 628 49 454 35 165 13 36 3 1,283 24) Depression EF 474 37 525 41 209 16 80 6 1,288 25) Memory trouble CF 804 62 342 26 114 9 34 3 1,294 26) Family life SF 683 53 319 25 192 15 93 7 1,287 27) Social activities SF 525 41 326 25 282 22 157 12 1,290 28) Financial difficulties FI 941 73 186 14 103 8 63 5 1,293 1 2 3 4 5 6 7 Total (very poor) (excellent) 29) Overall health QL 43 58 128 224 196 114 42 805 5 7 16 28 24 14 5 30) Overall quality of life QL 66 92 213 291 323 202 106 1,293 5 7 17 23 25 16 8

184
Lung cancer: recurrent/metastatic
Characteristics of the sample
Version of the QLQ-C30 Primary disease site N (%) N (%)
v 1.0 116 38 Lung: small cell 115 37 v +3 5 2 Lung: non small cell 11 4 v 2.0 89 29 Mesothelioma 6 2 v 3.0 97 32 Lung: not known 175 57 Total 307 307
Age N (%)
<40 4 1 40-49 40 13 50-59 76 25 60-69 110 36 70-79 68 22 80+ 9 3 Not known 0 0 Total 307
Gender N (%)
Male 197 64 Female 98 32 Not known 12 4 Total 307
Constructed scales Mean (SD) Median [IQR]
Global health status/QoL QL 43.5 (28.2) 50 [16.7-66.7]
Physical functioning PF Previous version of this scale used Role Functioning RF 47.0 (33.9) 50 [16.7-66.7] Emotional functioning EF 64.7 (25.7) 66.7 [50-83.3] Cognitive functioning CF 74.6 (26.6) 83.3 [66.7-100] Social functioning SF 64.6 (31.4) 66.7 [33.3-100]
Fatigue FA 51.6 (28.7) 44.4 [33.3-66.7] Nausea and vomiting NV 16.1 (26.2) 0 [0-16.7] Pain PA 40.5 (33.5) 33.3 [16.7-66.7] Dyspnoea DY 42.8 (34.3) 33.3 [0-66.7] Insomnia SL 36.4 (32.8) 33.3 [0-66.7] Appetite loss AP 34.7 (37) 33.3 [0-66.7] Constipation CO 34.0 (36.5) 33.3 [0-66.7] Diarrhoea DI 12.4 (23.4) 0 [0-33.3] Financial difficulties FI 22.3 (31.3) 0 [0-33.3]

185
Lung cancer: recurrent/metastatic Constructed scales QL N (%) CF N (%) 0 22 12 0 9 3 8.3 10 5 16.7 9 3 16.7 17 9 33.3 21 7 25 7 4 50 35 12 33.3 22 12 66.7 48 16 41.7 12 7 83.3 77 25 50 40 22 100 104 34 58.3 7 4 Total 303 66.7 13 7 75 10 5 83.3 12 7 91.7 6 3 SF N (%) 100 7 4 0 21 7 Total 185 16.7 14 5 33.3 42 14 PF 50 39 13 Previous version of this scale used 66.7 53 18 83.3 43 15 100 85 29 Total 297 FA N (%) 0 15 5 11.1 17 6 22.2 29 10 33.3 59 20 44.4 35 12 55.6 28 9 66.7 43 14 77.8 19 6 88.9 20 7 100 34 11 RF N (%) Total 299 0 39 21 16.7 12 7 33.3 35 19 50 22 12 NV N (%) 66.7 35 19 0 180 60 83.3 15 8 16.7 45 15 100 26 14 33.3 35 12 Total 184 50 12 4 66.7 11 4 EF N (%) 83.3 3 1 0 8 3 100 13 4 8.3 3 1 Total 299 16.7 9 3 25 10 3 33.3 22 7 41.7 17 6 PA N (%) 50 30 10 0 68 23 58.3 21 7 16.7 51 17 66.7 32 11 33.3 53 18 75 45 15 50 35 12 83.3 46 15 66.7 36 12 91.7 21 7 83.3 23 8 100 35 12 100 35 12 Total 299 Total 301

186
Lung cancer: recurrent/metastatic Single Items Not at all A little Quite a bit Very much Total N (%) N (%) N (%) N (%) N 1) Strenuous activities PF Previous version of this scale used 2) Long walk PF Previous version of this scale used 3) Short walk PF Previous version of this scale used 4) Bed or chair PF Previous version of this scale used 5) Self care PF Previous version of this scale used 6) Limited in work RF 35 19 57 30 45 24 51 27 188 7) Limited in leisure RF 43 23 46 25 43 23 54 29 186 8) Dyspnoea DY 79 26 109 36 65 22 50 17 303 9) Pain PA 81 27 104 34 70 23 48 16 303 10) Need to rest FA 30 10 119 40 96 32 55 18 300 11) Insomnia SL 102 34 101 33 68 23 31 10 302 12) Felt weak FA 45 15 105 35 89 29 64 21 303 13) Appetite loss AP 131 43 78 26 45 15 49 16 303 14) Nausea NV 186 62 63 21 34 11 19 6 302 15) Vomiting NV 238 79 38 13 11 4 15 5 302 16) Constipation CO 133 44 75 25 49 16 45 15 302 17) Diarrhoea DI 222 74 52 17 21 7 6 2 301 18) Felt tired FA 48 16 113 37 84 28 58 19 303 19) Pain interference PA 116 39 82 27 47 16 56 19 301 20) Concentration CF 169 56 71 23 38 13 26 9 304 21) Tension EF 85 28 137 45 54 18 27 9 303 22) Worry EF 83 28 103 34 76 25 40 13 302 23) Irritability EF 130 43 97 32 54 18 20 7 301 24) Depression EF 103 34 118 39 49 16 33 11 303 25) Memory trouble CF 136 45 112 37 41 14 14 5 303 26) Family life SF 137 46 74 25 57 19 31 10 299 27) Social activities SF 101 34 95 32 52 17 51 17 299 28) Financial difficulties FI 176 59 69 23 33 11 22 7 300 1 2 3 4 5 6 7 Total (very poor) (excellent) 29) Overall health QL 30 25 33 45 25 20 8 186 16 13 18 24 13 11 4 30) Overall quality of life QL 39 34 50 76 42 33 23 297 13 11 17 26 14 11 8
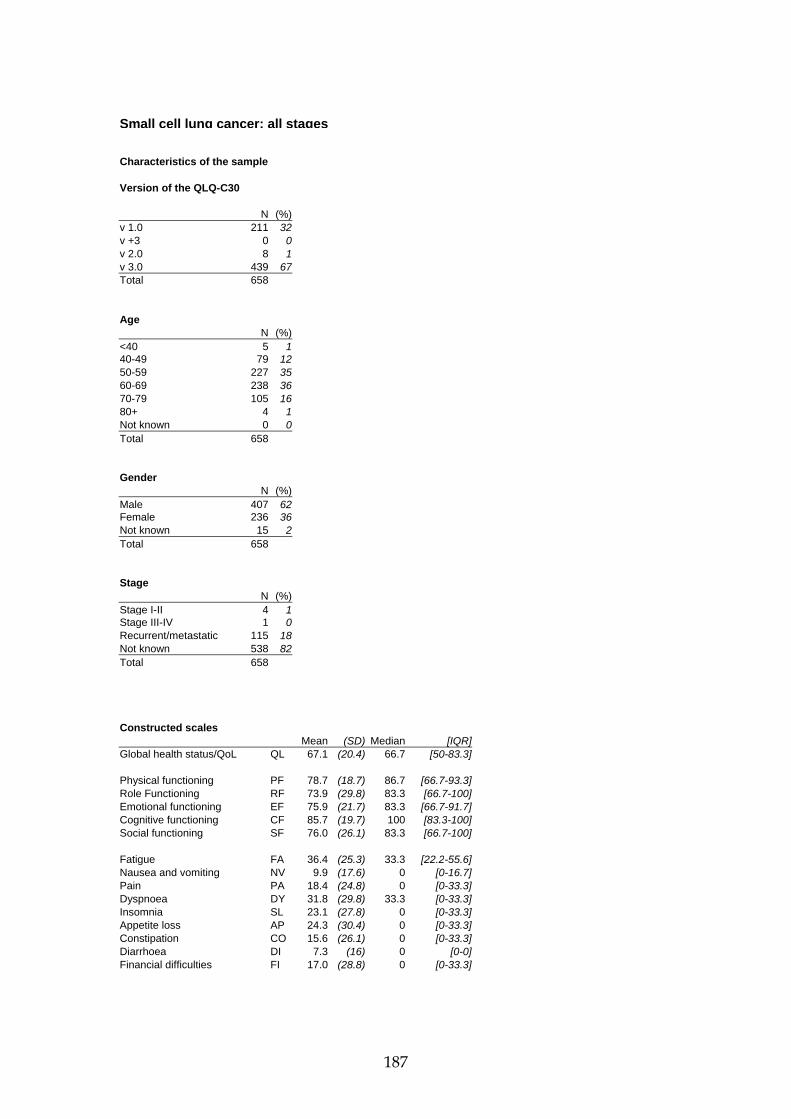
187
Small cell lung cancer: all stages Characteristics of the sample Version of the QLQ-C30 N (%) v 1.0 211 32 v +3 0 0 v 2.0 8 1 v 3.0 439 67 Total 658 Age N (%) <40 5 1 40-49 79 12 50-59 227 35 60-69 238 36 70-79 105 16 80+ 4 1 Not known 0 0 Total 658 Gender N (%) Male 407 62 Female 236 36 Not known 15 2 Total 658 Stage N (%) Stage I-II 4 1 Stage III-IV 1 0 Recurrent/metastatic 115 18 Not known 538 82 Total 658 Constructed scales Mean (SD) Median [IQR]Global health status/QoL QL 67.1 (20.4) 66.7 [50-83.3] Physical functioning PF 78.7 (18.7) 86.7 [66.7-93.3]Role Functioning RF 73.9 (29.8) 83.3 [66.7-100]Emotional functioning EF 75.9 (21.7) 83.3 [66.7-91.7]Cognitive functioning CF 85.7 (19.7) 100 [83.3-100]Social functioning SF 76.0 (26.1) 83.3 [66.7-100] Fatigue FA 36.4 (25.3) 33.3 [22.2-55.6]Nausea and vomiting NV 9.9 (17.6) 0 [0-16.7]Pain PA 18.4 (24.8) 0 [0-33.3]Dyspnoea DY 31.8 (29.8) 33.3 [0-33.3]Insomnia SL 23.1 (27.8) 0 [0-33.3]Appetite loss AP 24.3 (30.4) 0 [0-33.3]Constipation CO 15.6 (26.1) 0 [0-33.3]Diarrhoea DI 7.3 (16) 0 [0-0]Financial difficulties FI 17.0 (28.8) 0 [0-33.3]

188
Small cell lung cancer: all stages Constructed scales QL N (%) CF N (%) 0 1 0 0 6 1 8.3 1 0 16.7 5 1 16.7 11 3 33.3 16 3 25 3 1 50 29 5 33.3 23 5 66.7 86 13 41.7 20 5 83.3 171 27 50 69 16 100 332 52 58.3 32 7 Total 645 66.7 94 21 75 39 9 83.3 92 21 91.7 22 5 SF N (%) 100 38 9 0 18 3 Total 445 16.7 18 3 33.3 38 6 PF N (%) 50 57 9 0 0 0 66.7 141 22 6.7 0 0 83.3 120 19 13.3 1 0 100 250 39 20 3 1 Total 642 26.7 5 1 33.3 7 2 40 8 2 46.7 16 4 FA N (%) 53.3 20 5 0 82 13 60 23 5 11.1 60 9 66.7 40 9 22.2 87 14 73.3 35 8 33.3 180 28 80 51 12 44.4 67 11 86.7 76 18 55.6 54 8 93.3 78 18 66.7 49 8 100 68 16 77.8 21 3 Total 431 88.9 18 3 100 22 3 RF N (%) Total 640 0 25 6 16.7 11 3 33.3 38 9 50 33 8 NV N (%) 66.7 80 18 0 427 66 83.3 70 16 16.7 121 19 100 181 41 33.3 56 9 Total 438 50 23 4 66.7 10 2 EF N (%) 83.3 2 0 0 6 1 100 5 1 8.3 2 0 Total 644 16.7 11 2 25 9 1 33.3 10 2 41.7 21 3 PA N (%) 50 33 5 0 334 52 58.3 43 7 16.7 109 17 66.7 94 15 33.3 97 15 75 84 13 50 46 7 83.3 100 16 66.7 35 5 91.7 85 13 83.3 8 1 100 137 22 100 15 2 Total 635 Total 644
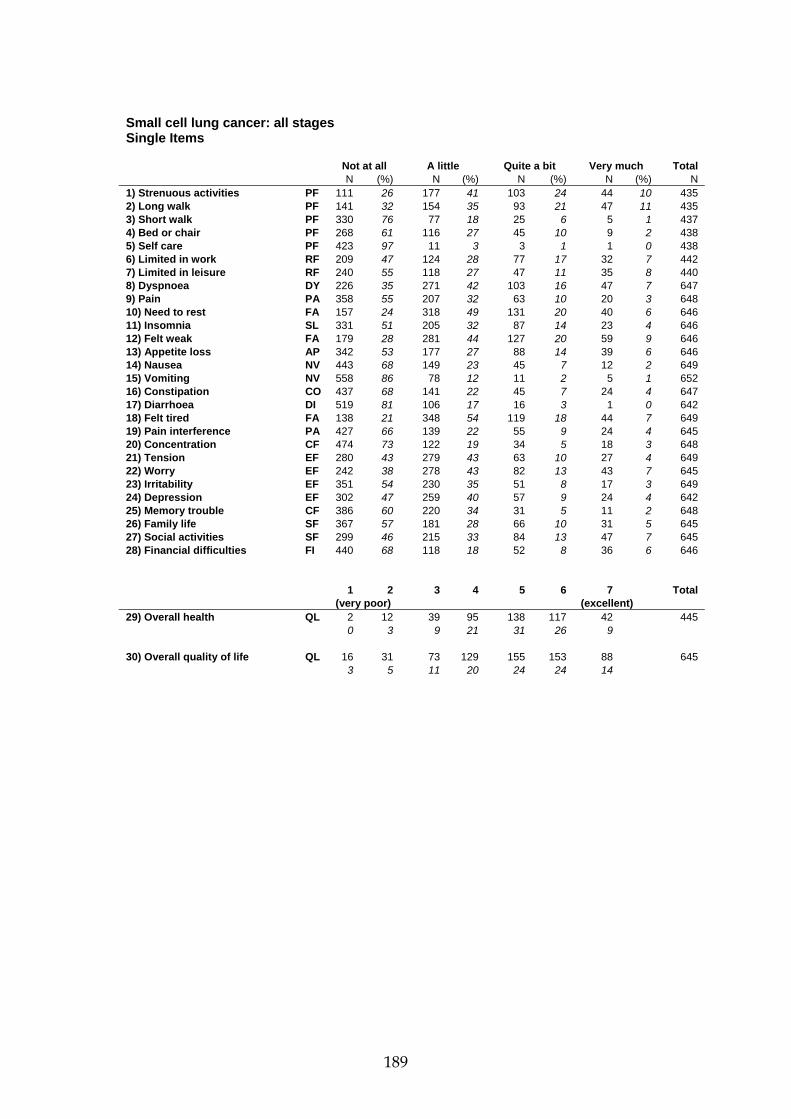
189
Small cell lung cancer: all stages Single Items Not at all A little Quite a bit Very much Total N (%) N (%) N (%) N (%) N 1) Strenuous activities PF 111 26 177 41 103 24 44 10 435 2) Long walk PF 141 32 154 35 93 21 47 11 435 3) Short walk PF 330 76 77 18 25 6 5 1 437 4) Bed or chair PF 268 61 116 27 45 10 9 2 438 5) Self care PF 423 97 11 3 3 1 1 0 438 6) Limited in work RF 209 47 124 28 77 17 32 7 442 7) Limited in leisure RF 240 55 118 27 47 11 35 8 440 8) Dyspnoea DY 226 35 271 42 103 16 47 7 647 9) Pain PA 358 55 207 32 63 10 20 3 648 10) Need to rest FA 157 24 318 49 131 20 40 6 646 11) Insomnia SL 331 51 205 32 87 14 23 4 646 12) Felt weak FA 179 28 281 44 127 20 59 9 646 13) Appetite loss AP 342 53 177 27 88 14 39 6 646 14) Nausea NV 443 68 149 23 45 7 12 2 649 15) Vomiting NV 558 86 78 12 11 2 5 1 652 16) Constipation CO 437 68 141 22 45 7 24 4 647 17) Diarrhoea DI 519 81 106 17 16 3 1 0 642 18) Felt tired FA 138 21 348 54 119 18 44 7 649 19) Pain interference PA 427 66 139 22 55 9 24 4 645 20) Concentration CF 474 73 122 19 34 5 18 3 648 21) Tension EF 280 43 279 43 63 10 27 4 649 22) Worry EF 242 38 278 43 82 13 43 7 645 23) Irritability EF 351 54 230 35 51 8 17 3 649 24) Depression EF 302 47 259 40 57 9 24 4 642 25) Memory trouble CF 386 60 220 34 31 5 11 2 648 26) Family life SF 367 57 181 28 66 10 31 5 645 27) Social activities SF 299 46 215 33 84 13 47 7 645 28) Financial difficulties FI 440 68 118 18 52 8 36 6 646 1 2 3 4 5 6 7 Total (very poor) (excellent) 29) Overall health QL 2 12 39 95 138 117 42 445 0 3 9 21 31 26 9 30) Overall quality of life QL 16 31 73 129 155 153 88 645 3 5 11 20 24 24 14

190
Small cell lung cancer: limited disease
Characteristics of the sample
Version of the QLQ-C30 N (%)
v 1.0 97 18 v +3 0 0 v 2.0 0 0 v 3.0 439 82 Total 536
Age N (%)
<40 5 1 40-49 72 13 50-59 195 36 60-69 184 34 70-79 77 14 80+ 3 1 Not known 0 0 Total 536
Gender
N (%) Male 328 61 Female 197 37 Not known 11 2 Total 536 Stage
N (%) Stage I-II 0 0 Stage III-IV 0 0 Recurrent/metastatic 0 0 Not known 536 100 Total 536
Constructed scales Mean (SD) Median [IQR]
Global health status/QoL QL 67.0 (20.3) 66.7 [50-83.3]
Physical functioning PF 78.7 (18.7) 86.7 [66.7-93.3] Role Functioning RF 73.9 (29.5) 83.3 [66.7-100] Emotional functioning EF 76.9 (21.4) 83.3 [66.7-91.7] Cognitive functioning CF 86.3 (19.1) 100 [83.3-100] Social functioning SF 76.2 (26.2) 83.3 [66.7-100]
Fatigue FA 34.9 (25.2) 33.3 [22.2-44.4] Nausea and vomiting NV 9.6 (17.4) 0 [0-16.7] Pain PA 15.1 (22.6) 0 [0-33.3] Dyspnoea DY 29.1 (29.2) 33.3 [0-33.3] Insomnia SL 21.5 (27.4) 0 [0-33.3] Appetite loss AP 22.8 (29.9) 0 [0-33.3] Constipation CO 12.8 (23.9) 0 [0-33.3] Diarrhoea DI 6.1 (14.8) 0 [0-0] Financial difficulties FI 18.0 (29.4) 0 [0-33.3]

191
Small cell lung cancer: limited disease Constructed scales QL N (%) CF N (%) 0 1 0 0 5 1 8.3 1 0 16.7 4 1 16.7 11 3 33.3 10 2 25 3 1 50 20 4 33.3 22 5 66.7 71 14 41.7 20 5 83.3 138 26 50 68 16 100 277 53 58.3 32 7 Total 525 66.7 92 21 75 39 9 83.3 91 21 91.7 21 5 SF N (%) 100 36 8 0 16 3 Total 437 16.7 13 3 33.3 30 6 PF N (%) 50 47 9 0 0 0 66.7 115 22 6.7 0 0 83.3 96 18 13.3 1 0 100 207 40 20 3 1 Total 524 26.7 5 1 33.3 7 2 40 8 2 46.7 16 4 FA N (%) 53.3 20 5 0 75 14 60 23 5 11.1 49 9 66.7 40 9 22.2 77 15 73.3 35 8 33.3 146 28 80 51 12 44.4 51 10 86.7 76 18 55.6 45 9 93.3 78 18 66.7 34 7 100 68 16 77.8 15 3 Total 431 88.9 13 3 100 18 3 RF N (%) Total 523 0 23 5 16.7 11 3 33.3 38 9 50 33 8 NV N (%) 66.7 80 19 0 354 67 83.3 69 16 16.7 95 18 100 176 41 33.3 42 8 Total 430 50 20 4 66.7 9 2 EF N (%) 83.3 2 0 0 4 1 100 3 1 8.3 2 0 Total 525 16.7 9 2 25 8 2 33.3 6 1 41.7 14 3 PA N (%) 50 22 4 0 303 58 58.3 38 7 16.7 88 17 66.7 79 15 33.3 70 13 75 61 12 50 33 6 83.3 79 15 66.7 20 4 91.7 75 15 83.3 2 0 100 120 23 100 10 2 Total 517 Total 526

192
Small cell lung cancer: limited disease Single Items Not at all A little Quite a bit Very much Total N (%) N (%) N (%) N (%) N 1) Strenuous activities PF 111 26 177 41 103 24 44 10 435 2) Long walk PF 141 32 154 35 93 21 47 11 435 3) Short walk PF 330 76 77 18 25 6 5 1 437 4) Bed or chair PF 268 61 116 27 45 10 9 2 438 5) Self care PF 423 97 11 3 3 1 1 0 438 6) Limited in work RF 204 47 123 28 77 18 30 7 434 7) Limited in leisure RF 234 54 118 27 47 11 33 8 432 8) Dyspnoea DY 206 39 215 41 73 14 33 6 527 9) Pain PA 326 62 156 30 34 6 13 3 529 10) Need to rest FA 143 27 258 49 95 18 32 6 528 11) Insomnia SL 287 55 156 30 66 13 17 3 526 12) Felt weak FA 161 31 228 43 91 17 47 9 527 13) Appetite loss AP 292 56 138 26 67 13 29 6 526 14) Nausea NV 366 69 116 22 37 7 10 2 529 15) Vomiting NV 458 86 60 11 10 2 3 1 531 16) Constipation CO 383 73 104 20 25 5 16 3 528 17) Diarrhoea DI 439 84 75 14 9 2 1 0 524 18) Felt tired FA 114 22 289 55 93 18 34 6 530 19) Pain interference PA 375 71 101 19 38 7 13 3 527 20) Concentration CF 392 74 98 19 25 5 13 2 528 21) Tension EF 244 46 220 42 45 9 20 4 529 22) Worry EF 204 39 225 43 61 12 35 7 525 23) Irritability EF 290 55 189 36 39 7 12 2 530 24) Depression EF 256 49 205 39 42 8 20 4 523 25) Memory trouble CF 322 61 173 33 25 5 8 2 528 26) Family life SF 301 57 150 29 49 9 27 5 527 27) Social activities SF 249 47 168 32 72 14 38 7 527 28) Financial difficulties FI 350 66 100 19 46 9 31 6 527 1 2 3 4 5 6 7 Total (very poor) (excellent) 29) Overall health QL 2 12 38 95 136 114 40 437 1 3 9 22 31 26 9 30) Overall quality of life QL 7 20 50 101 135 137 78 528 1 4 10 19 26 26 15

193
Small cell lung cancer: extensive disease
Characteristics of the sample
Version of the QLQ-C30 N (%)
v 1.0 114 100 v +3 0 0 v 2.0 0 0 v 3.0 0 0 Total 114
Age N (%)
<40 0 0 40-49 7 6 50-59 29 25 60-69 52 46 70-79 26 23 80+ 0 0 Not known 0 0 Total 114
Gender
N (%) Male 74 65 Female 36 32 Not known 4 4 Total 114 Stage
N (%) Stage I-II 0 0 Stage III-IV 0 0 Recurrent/metastatic 114 100 Not known 0 0 Total 114
Constructed scales Mean (SD) Median [IQR]
Global health status/QoL QL Previous version of this scale used
Physical functioning PF Previous version of this scale used Role Functioning RF Previous version of this scale used Emotional functioning EF 71.4 (22.4) 75 [58.3-83.3] Cognitive functioning CF 82.9 (21.2) 83.3 [66.7-100] Social functioning SF 74.8 (25.4) 83.3 [66.7-100]
Fatigue FA 43.5 (24.2) 33.3 [33.3-66.7] Nausea and vomiting NV 10.8 (18.2) 0 [0-16.7] Pain PA 33.3 (28.1) 33.3 [16.7-50] Dyspnoea DY 44.0 (28.7) 33.3 [33.3-66.7] Insomnia SL 29.8 (28.8) 33.3 [0-33.3] Appetite loss AP 31.5 (32.2) 33.3 [0-66.7] Constipation CO 29.7 (31.6) 33.3 [0-66.7] Diarrhoea DI 12.1 (20.1) 0 [0-33.3] Financial difficulties FI 12.3 (25) 0 [0-0]

194
Small cell lung cancer: extensive disease Constructed scales QL CF N (%) Previous version of this scale used 0 1 1 16.7 1 1 33.3 4 4 50 9 8 66.7 15 13 83.3 31 28 100 51 46 Total 112 SF N (%) 0 1 1 16.7 5 5 33.3 8 7 PF 50 10 9 Previous version of this scale used 66.7 26 24 83.3 21 19 100 39 36 Total 110 FA N (%) 0 6 6 11.1 8 7 22.2 9 8 33.3 33 30 44.4 16 15 55.6 9 8 66.7 14 13 77.8 6 6 88.9 5 5 100 3 3 RF Total 109 Previous version of this scale used NV N (%) 0 68 61 16.7 25 23 33.3 14 13 50 1 1 66.7 1 1 EF N (%) 83.3 0 0 0 2 2 100 2 2 8.3 0 0 Total 111 16.7 2 2 25 1 1 33.3 3 3 41.7 7 6 PA N (%) 50 10 9 0 27 25 58.3 5 5 16.7 20 18 66.7 14 13 33.3 26 24 75 21 19 50 13 12 83.3 20 18 66.7 15 14 91.7 8 7 83.3 5 5 100 17 16 100 4 4 Total 110 Total 110

195
Small cell lung cancer: extensive disease Single Items Not at all A little Quite a bit Very much Total N (%) N (%) N (%) N (%) N 1) Strenuous activities PF Previous version of this scale used 2) Long walk PF Previous version of this scale used 3) Short walk PF Previous version of this scale used 4) Bed or chair PF Previous version of this scale used 5) Self care PF Previous version of this scale used 6) Limited in work RF Previous version of this scale used 7) Limited in leisure RF Previous version of this scale used 8) Dyspnoea DY 17 15 54 48 29 26 12 11 112 9) Pain PA 28 25 50 45 27 24 6 5 111 10) Need to rest FA 10 9 58 53 35 32 7 6 110 11) Insomnia SL 43 38 43 38 21 19 5 5 112 12) Felt weak FA 13 12 52 47 35 32 11 10 111 13) Appetite loss AP 45 40 38 34 19 17 10 9 112 14) Nausea NV 71 63 33 30 6 5 2 2 112 15) Vomiting NV 95 84 15 13 1 1 2 2 113 16) Constipation CO 48 43 35 32 20 18 8 7 111 17) Diarrhoea DI 77 70 26 24 7 6 0 0 110 18) Felt tired FA 23 21 54 49 25 23 9 8 111 19) Pain interference PA 46 42 38 35 17 16 9 8 110 20) Concentration CF 76 68 24 21 8 7 4 4 112 21) Tension EF 33 30 56 50 16 14 7 6 112 22) Worry EF 37 33 48 43 20 18 7 6 112 23) Irritability EF 57 51 38 34 11 10 5 5 111 24) Depression EF 43 39 50 45 14 13 4 4 111 25) Memory trouble CF 60 54 44 39 5 5 3 3 112 26) Family life SF 59 54 31 28 17 16 3 3 110 27) Social activities SF 46 42 44 40 12 11 8 7 110 28) Financial difficulties FI 84 76 17 15 6 5 4 4 111 1 2 3 4 5 6 7 Total (very poor) (excellent) 29) Overall health QL Previous version of this scale used 30) Overall quality of life QL 9 10 22 28 18 15 7 109 8 9 20 26 17 14 6

196
Non-small cell lung cancer: all stages
Characteristics of the sample
Version of the QLQ-C30 N (%)
v 1.0 556 44 v +3 0 0 v 2.0 516 41 v 3.0 190 15 Total 1,262
Age N (%)
<40 37 3 40-49 163 13 50-59 340 27 60-69 380 30 70-79 225 18 80+ 27 2 Not known 90 7 Total 1,262
Gender
N (%) Male 514 41 Female 201 16 Not known 547 43 Total 1,262 Stage
N (%) Stage I-II 17 1 Stage III-IV 1,046 83 Recurrent/metastatic 11 1 Not known 188 15 Total 1,262
Constructed scales Mean (SD) Median [IQR]
Global health status/QoL QL 58.8 (22.5) 58.3 [50-75]
Physical functioning PF 78.4 (19.3) 86.7 [66.7-93.3] Role Functioning RF 60.7 (33.1) 66.7 [33.3-100] Emotional functioning EF 68.1 (24.2) 66.7 [50-91.7] Cognitive functioning CF 84.0 (21.1) 100 [66.7-100] Social functioning SF 73.6 (28.9) 83.3 [50-100]
Fatigue FA 40.4 (27) 33.3 [22.2-55.6] Nausea and vomiting NV 9.7 (18.3) 0 [0-16.7] Pain PA 29.7 (30.3) 16.7 [0-50] Dyspnoea DY 38.5 (31.7) 33.3 [0-66.7] Insomnia SL 32.4 (32.7) 33.3 [0-66.7] Appetite loss AP 27.9 (33.5) 0 [0-66.7] Constipation CO 17.4 (27.9) 0 [0-33.3] Diarrhoea DI 6.8 (17.4) 0 [0-0] Financial difficulties FI 12.8 (25.8) 0 [0-0]

197
Non-small cell lung cancer: all stages Constructed scales QL N (%) CF N (%) 0 18 3 0 7 1 8.3 6 1 16.7 17 1 16.7 15 2 33.3 48 4 25 19 3 50 80 6 33.3 69 10 66.7 165 13 41.7 41 6 83.3 302 24 50 129 19 100 623 50 58.3 67 10 Total 1,242 66.7 136 20 75 52 8 83.3 82 12 91.7 29 4 SF N (%) 100 33 5 0 49 4 Total 696 16.7 42 3 33.3 107 9 PF N (%) 50 124 10 0 0 0 66.7 233 19 6.7 0 0 83.3 169 14 13.3 1 1 100 502 41 20 2 1 Total 1,226 26.7 3 2 33.3 1 1 40 4 2 46.7 4 2 FA N (%) 53.3 9 5 0 143 12 60 15 8 11.1 100 8 66.7 16 9 22.2 172 14 73.3 19 10 33.3 244 20 80 17 9 44.4 162 13 86.7 35 19 55.6 131 11 93.3 25 13 66.7 119 10 100 35 19 77.8 54 4 Total 186 88.9 51 4 100 56 5 RF N (%) Total 1,232 0 73 11 16.7 38 6 33.3 110 16 50 63 9 NV N (%) 66.7 150 22 0 872 70 83.3 76 11 16.7 173 14 100 182 26 33.3 115 9 Total 692 50 42 3 66.7 28 2 EF N (%) 83.3 7 1 0 10 1 100 8 1 8.3 17 1 Total 1,245 16.7 26 2 25 39 3 33.3 62 5 41.7 62 5 PA N (%) 50 116 10 0 430 35 58.3 109 9 16.7 225 18 66.7 173 14 33.3 211 17 75 152 13 50 124 10 83.3 136 11 66.7 123 10 91.7 131 11 83.3 60 5 100 181 15 100 66 5 Total 1,214 Total 1,239

198
Non-small cell lung cancer: all stages Single Items Not at all A little Quite a bit Very much Total N (%) N (%) N (%) N (%) N 1) Strenuous activities PF 54 29 72 39 42 23 19 10 187 2) Long walk PF 60 32 56 30 50 27 22 12 188 3) Short walk PF 135 71 38 20 14 7 3 2 190 4) Bed or chair PF 126 66 44 23 18 10 2 1 190 5) Self care PF 180 95 7 4 3 2 0 0 190 6) Limited in work RF 210 30 214 31 166 24 105 15 695 7) Limited in leisure RF 249 36 210 30 134 19 103 15 696 8) Dyspnoea DY 351 28 491 39 278 22 134 11 1,254 9) Pain PA 479 38 412 33 243 19 119 10 1,253 10) Need to rest FA 248 20 543 43 320 26 142 11 1,253 11) Insomnia SL 501 40 393 32 237 19 115 9 1,246 12) Felt weak FA 379 30 463 37 296 24 115 9 1,253 13) Appetite loss AP 638 51 294 23 211 17 112 9 1,255 14) Nausea NV 905 72 231 18 93 7 25 2 1,254 15) Vomiting NV 1,070 86 127 10 38 3 11 1 1,246 16) Constipation CO 819 66 256 21 113 9 56 5 1,244 17) Diarrhoea DI 1,048 84 153 12 35 3 11 1 1,247 18) Felt tired FA 258 21 563 45 299 24 125 10 1,245 19) Pain interference PA 650 52 310 25 196 16 90 7 1,246 20) Concentration CF 816 65 263 21 132 11 40 3 1,251 21) Tension EF 394 32 493 39 274 22 90 7 1,251 22) Worry EF 300 24 446 36 345 28 155 12 1,246 23) Irritability EF 645 52 406 33 151 12 33 3 1,235 24) Depression EF 497 40 504 41 172 14 69 6 1,242 25) Memory trouble CF 830 67 299 24 93 8 23 2 1,245 26) Family life SF 721 58 295 24 154 12 68 6 1,238 27) Social activities SF 561 45 315 26 240 19 120 10 1,236 28) Financial difficulties FI 944 76 165 13 85 7 47 4 1,241 1 2 3 4 5 6 7 Total (very poor) (excellent) 29) Overall health QL 27 31 93 203 185 117 42 698 4 4 13 29 27 17 6 30) Overall quality of life QL 45 63 186 271 328 235 117 1,245 4 5 15 22 26 19 9

199
Mesothelioma
Characteristics of the sample
Version of the QLQ-C30 N (%)
v 1.0 0 0 v +3 0 0 v 2.0 0 0 v 3.0 236 100 Total 236
Age N (%)
<40 10 4 40-49 36 15 50-59 92 39 60-69 79 34 70-79 18 8 80+ 1 0 Not known 0 0 Total 236
Gender
N (%) Male 183 78 Female 51 22 Not known 2 1 Total 236 Stage
N (%) Stage I-II 0 0 Stage III-IV 0 0 Recurrent/metastatic 6 3 Not known 230 98 Total 236
Constructed scales Mean (SD) Median [IQR]
Global health status/QoL QL 55.0 (22) 50 [50-66.7]
Physical functioning PF 71.5 (22.1) 73.3 [60-86.7] Role Functioning RF 58.6 (31.7) 66.7 [33.3-83.3] Emotional functioning EF 68.3 (25.1) 66.7 [50-91.7] Cognitive functioning CF 87.2 (18.6) 100 [83.3-100] Social functioning SF 67.7 (29) 66.7 [50-100]
Fatigue FA 38.5 (25.4) 33.3 [22.2-55.6] Nausea and vomiting NV 8.8 (16.1) 0 [0-16.7] Pain PA 36.5 (28.9) 33.3 [16.7-50] Dyspnoea DY 39.5 (30.4) 33.3 [33.3-66.7] Insomnia SL 31.5 (32.4) 33.3 [0-66.7] Appetite loss AP 27.5 (31) 33.3 [0-33.3] Constipation CO 16.3 (24.9) 0 [0-33.3] Diarrhoea DI 5.3 (16) 0 [0-0] Financial difficulties FI 22.5 (29.8) 0 [0-33.3]

200
Mesothelioma Constructed scales QL N (%) CF N (%) 0 6 3 0 0 0 8.3 6 3 16.7 3 1 16.7 7 3 33.3 7 3 25 6 3 50 8 3 33.3 22 9 66.7 27 12 41.7 9 4 83.3 58 25 50 68 29 100 130 56 58.3 22 9 Total 233 66.7 41 17 75 13 6 83.3 20 9 91.7 7 3 SF N (%) 100 8 3 0 13 6 Total 235 16.7 7 3 33.3 26 11 PF N (%) 50 25 11 0 1 0 66.7 60 26 6.7 2 1 83.3 34 15 13.3 0 0 100 65 28 20 6 3 Total 230 26.7 3 1 33.3 7 3 40 7 3 46.7 11 5 FA N (%) 53.3 18 8 0 27 12 60 21 9 11.1 18 8 66.7 24 10 22.2 37 16 73.3 16 7 33.3 50 22 80 35 15 44.4 28 12 86.7 28 12 55.6 31 13 93.3 22 10 66.7 16 7 100 30 13 77.8 13 6 Total 231 88.9 6 3 100 7 3 RF N (%) Total 233 0 22 10 16.7 10 4 33.3 47 20 50 23 10 NV N (%) 66.7 56 24 0 160 69 83.3 20 9 16.7 42 18 100 52 23 33.3 19 8 Total 230 50 7 3 66.7 4 2 EF N (%) 83.3 0 0 0 2 1 100 1 0 8.3 3 1 Total 233 16.7 7 3 25 4 2 33.3 11 5 41.7 21 9 PA N (%) 50 18 8 0 45 19 58.3 16 7 16.7 49 21 66.7 34 15 33.3 50 21 75 28 12 50 37 16 83.3 22 10 66.7 25 11 91.7 17 8 83.3 15 6 100 45 20 100 13 6 Total 228 Total 234

201
Mesothelioma Single Items Not at all A little Quite a bit Very much Total N (%) N (%) N (%) N (%) N 1) Strenuous activities PF 43 18 84 36 66 28 41 18 234 2) Long walk PF 60 26 71 30 70 30 34 15 235 3) Short walk PF 129 55 74 32 25 11 7 3 235 4) Bed or chair PF 113 48 82 35 26 11 14 6 235 5) Self care PF 214 91 17 7 3 1 2 1 236 6) Limited in work RF 57 24 82 35 64 27 31 13 234 7) Limited in leisure RF 74 32 66 29 63 27 28 12 231 8) Dyspnoea DY 55 24 101 44 52 23 23 10 231 9) Pain PA 52 22 100 43 56 24 27 12 235 10) Need to rest FA 44 19 105 45 64 27 21 9 234 11) Insomnia SL 96 41 79 34 39 17 22 9 236 12) Felt weak FA 76 32 98 42 47 20 15 6 236 13) Appetite loss AP 109 47 73 31 36 15 16 7 234 14) Nausea NV 166 71 50 21 14 6 4 2 234 15) Vomiting NV 206 88 26 11 2 1 1 0 235 16) Constipation CO 151 64 58 25 21 9 5 2 235 17) Diarrhoea DI 204 88 21 9 5 2 2 1 232 18) Felt tired FA 47 20 111 47 63 27 14 6 235 19) Pain interference PA 92 39 83 35 40 17 20 9 235 20) Concentration CF 158 67 52 22 19 8 7 3 236 21) Tension EF 80 34 104 44 37 16 13 6 234 22) Worry EF 61 26 87 37 56 24 32 14 236 23) Irritability EF 102 44 92 40 29 13 7 3 230 24) Depression EF 96 41 83 36 42 18 12 5 233 25) Memory trouble CF 178 76 43 19 11 5 1 0 233 26) Family life SF 99 43 80 35 34 15 19 8 232 27) Social activities SF 77 33 87 38 47 20 21 9 232 28) Financial difficulties FI 128 56 62 27 27 12 13 6 230 1 2 3 4 5 6 7 Total (very poor) (excellent) 29) Overall health QL 9 12 31 84 61 28 10 235 4 5 13 36 26 12 4 30) Overall quality of life QL 10 16 28 78 55 33 15 235 4 7 12 33 23 14 6

202
Malignant lymphoma
Characteristics of the sample
Version of the QLQ-C30 N (%)
v 1.0 162 41 v +3 4 1 v 2.0 198 50 v 3.0 32 8 Total 396
Age N (%)
<40 122 31 40-49 79 20 50-59 90 23 60-69 55 14 70-79 45 11 80+ 5 1 Not known 0 0 Total 396
Gender
N (%) Male 220 56 Female 176 44 Not known 0 0 Total 396 Stage
N (%) Stage I-II 33 8 Stage III-IV 0 0 Recurrent/metastatic 11 3 Not known 352 89 Total 396
Constructed scales Mean (SD) Median [IQR]
Global health status/QoL QL 58.0 (26.8) 58.3 [41.7-83.3]
Physical functioning PF Previous version of this scale used Role Functioning RF 59.8 (36.1) 66.7 [33.3-100] Emotional functioning EF 70.4 (24.6) 75 [58.3-91.7] Cognitive functioning CF 73.5 (28.9) 83.3 [50-100] Social functioning SF 64.4 (33.1) 66.7 [33.3-100]
Fatigue FA 39.5 (28.4) 33.3 [22.2-55.6] Nausea and vomiting NV 9.0 (19) 0 [0-16.7] Pain PA 23.8 (29.8) 16.7 [0-33.3] Dyspnoea DY 18.7 (25.9) 0 [0-33.3] Insomnia SL 29.5 (31.5) 33.3 [0-33.3] Appetite loss AP 18.3 (28.9) 0 [0-33.3] Constipation CO 17.5 (28.1) 0 [0-33.3] Diarrhoea DI 10.1 (19.7) 0 [0-0] Financial difficulties FI 19.5 (29.9) 0 [0-33.3]

203
Malignant lymphoma Constructed scales QL N (%) CF N (%) 0 6 3 0 18 5 8.3 6 3 16.7 14 4 16.7 18 8 33.3 31 8 25 9 4 50 42 11 33.3 15 7 66.7 54 14 41.7 12 5 83.3 91 23 50 34 15 100 145 37 58.3 22 10 Total 395 66.7 27 12 75 23 10 83.3 29 13 91.7 7 3 SF N (%) 100 22 10 0 33 8 Total 230 16.7 26 7 33.3 53 14 PF 50 38 10 Previous version of this scale used 66.7 63 16 83.3 58 15 100 121 31 Total 392 FA N (%) 0 58 15 11.1 31 8 22.2 47 12 33.3 92 24 44.4 39 10 55.6 29 7 66.7 34 9 77.8 20 5 88.9 25 6 100 16 4 RF N (%) Total 391 0 31 14 16.7 16 7 33.3 37 16 50 9 4 NV N (%) 66.7 42 19 0 290 73 83.3 22 10 16.7 50 13 100 70 31 33.3 28 7 Total 227 50 13 3 66.7 5 1 EF N (%) 83.3 5 1 0 3 1 100 4 1 8.3 2 1 Total 395 16.7 16 4 25 9 2 33.3 19 5 41.7 19 5 PA N (%) 50 21 5 0 177 45 58.3 37 10 16.7 73 19 66.7 42 11 33.3 55 14 75 53 14 50 28 7 83.3 56 15 66.7 24 6 91.7 38 10 83.3 13 3 100 71 18 100 22 6 Total 386 Total 392

204
Malignant lymphoma Single Items Not at all A little Quite a bit Very much Total N (%) N (%) N (%) N (%) N 1) Strenuous activities PF Previous version of this scale used 2) Long walk PF Previous version of this scale used 3) Short walk PF Previous version of this scale used 4) Bed or chair PF Previous version of this scale used 5) Self care PF Previous version of this scale used 6) Limited in work RF 78 34 66 29 41 18 42 19 227 7) Limited in leisure RF 86 38 58 25 39 17 46 20 229 8) Dyspnoea DY 231 59 118 30 34 9 12 3 395 9) Pain PA 191 49 123 31 46 12 32 8 392 10) Need to rest FA 96 24 148 38 99 25 52 13 395 11) Insomnia SL 168 43 137 35 57 14 33 8 395 12) Felt weak FA 118 30 162 41 71 18 43 11 394 13) Appetite loss AP 255 65 85 22 33 8 22 6 395 14) Nausea NV 293 74 71 18 21 5 10 3 395 15) Vomiting NV 348 88 30 8 10 3 7 2 395 16) Constipation CO 261 66 79 20 37 9 18 5 395 17) Diarrhoea DI 296 76 76 19 15 4 4 1 391 18) Felt tired FA 86 22 182 46 84 21 41 10 393 19) Pain interference PA 247 63 74 19 44 11 30 8 395 20) Concentration CF 206 52 100 25 60 15 29 7 395 21) Tension EF 140 36 162 41 67 17 25 6 394 22) Worry EF 110 28 154 39 91 23 36 9 391 23) Irritability EF 192 49 142 36 44 11 12 3 390 24) Depression EF 168 43 148 38 50 13 25 6 391 25) Memory trouble CF 196 50 113 29 52 13 35 9 396 26) Family life SF 179 46 94 24 80 20 40 10 393 27) Social activities SF 147 37 101 26 69 18 77 20 394 28) Financial difficulties FI 237 63 81 22 33 9 24 6 375 1 2 3 4 5 6 7 Total (very poor) (excellent) 29) Overall health QL 10 17 36 43 57 43 24 230 4 7 16 19 25 19 10 30) Overall quality of life QL 18 40 32 66 88 79 69 392 5 10 8 17 22 20 18

205
Non-Hodgkin lymphoma
Characteristics of the sample
Version of the QLQ-C30 N (%)
v 1.0 84 32 v +3 3 1 v 2.0 180 67 v 3.0 0 0 Total 267
Age N (%)
<40 57 21 40-49 54 20 50-59 74 28 60-69 42 16 70-79 38 14 80+ 2 1 Not known 0 0 Total 267
Gender
N (%) Male 146 55 Female 121 45 Not known 0 0 Total 267 Stage
N (%) Stage I-II 5 2 Stage III-IV 0 0 Recurrent/metastatic 1 0 Not known 261 98 Total 267
Constructed scales Mean (SD) Median [IQR]
Global health status/QoL QL 56.1 (27.1) 58.3 [33.3-75]
Physical functioning PF Previous version of this scale used Role Functioning RF 57.3 (36.2) 66.7 [33.3-100] Emotional functioning EF 66.8 (25.2) 75 [50-83.3] Cognitive functioning CF 68.5 (30.8) 83.3 [50-100] Social functioning SF 60.4 (34.1) 66.7 [33.3-100]
Fatigue FA 41.9 (28.9) 33.3 [22.2-66.7] Nausea and vomiting NV 10.0 (19.7) 0 [0-16.7] Pain PA 24.5 (30.1) 16.7 [0-33.3] Dyspnoea DY 16.9 (24.6) 0 [0-33.3] Insomnia SL 30.7 (31.5) 33.3 [0-33.3] Appetite loss AP 19.9 (29.4) 0 [0-33.3] Constipation CO 18.2 (27.8) 0 [0-33.3] Diarrhoea DI 9.5 (19.1) 0 [0-0] Financial difficulties FI 17.8 (28.8) 0 [0-33.3]

206
Non-Hodgkin lymphoma Constructed scales QL N (%) CF N (%) 0 6 3 0 17 6 8.3 4 2 16.7 12 5 16.7 17 9 33.3 26 10 25 8 4 50 36 14 33.3 13 7 66.7 35 13 41.7 9 5 83.3 58 22 50 24 13 100 82 31 58.3 19 11 Total 266 66.7 20 11 75 17 9 83.3 23 13 91.7 7 4 SF N (%) 100 13 7 0 30 11 Total 180 16.7 17 7 33.3 40 15 PF 50 25 10 Previous version of this scale used 66.7 43 16 83.3 39 15 100 69 26 Total 263 FA N (%) 0 36 14 11.1 15 6 22.2 35 13 33.3 54 21 44.4 31 12 55.6 20 8 66.7 24 9 77.8 15 6 88.9 19 7 100 13 5 RF N (%) Total 262 0 26 15 16.7 13 7 33.3 32 18 50 7 4 NV N (%) 66.7 32 18 0 188 71 83.3 17 10 16.7 36 14 100 49 28 33.3 22 8 Total 176 50 9 3 66.7 5 2 EF N (%) 83.3 3 1 0 3 1 100 3 1 8.3 2 1 Total 266 16.7 12 5 25 7 3 33.3 17 7 41.7 15 6 PA N (%) 50 15 6 0 117 44 58.3 29 11 16.7 48 18 66.7 23 9 33.3 38 14 75 40 16 50 21 8 83.3 41 16 66.7 14 5 91.7 16 6 83.3 11 4 100 38 15 100 15 6 Total 258 Total 264

207
Non-Hodgkin lymphoma Single Items Not at all A little Quite a bit Very much Total N (%) N (%) N (%) N (%) N 1) Strenuous activities PF Previous version of this scale used 2) Long walk PF Previous version of this scale used 3) Short walk PF Previous version of this scale used 4) Bed or chair PF Previous version of this scale used 5) Self care PF Previous version of this scale used 6) Limited in work RF 54 31 50 28 36 21 36 21 176 7) Limited in leisure RF 62 35 46 26 34 19 36 20 178 8) Dyspnoea DY 164 62 75 28 21 8 6 2 266 9) Pain PA 127 48 82 31 32 12 23 9 264 10) Need to rest FA 58 22 89 34 77 29 42 16 266 11) Insomnia SL 107 40 96 36 40 15 23 9 266 12) Felt weak FA 75 28 109 41 49 19 32 12 265 13) Appetite loss AP 162 61 65 24 23 9 16 6 266 14) Nausea NV 191 72 52 20 16 6 7 3 266 15) Vomiting NV 229 86 24 9 8 3 5 2 266 16) Constipation CO 170 64 57 21 29 11 10 4 266 17) Diarrhoea DI 201 76 52 20 7 3 3 1 263 18) Felt tired FA 54 21 119 45 57 22 34 13 264 19) Pain interference PA 163 61 53 20 29 11 21 8 266 20) Concentration CF 116 44 74 28 51 19 25 9 266 21) Tension EF 81 31 115 43 52 20 17 6 265 22) Worry EF 54 21 105 40 72 28 31 12 262 23) Irritability EF 120 46 96 37 33 13 12 5 261 24) Depression EF 101 38 99 38 41 16 22 8 263 25) Memory trouble CF 121 45 72 27 41 15 33 12 267 26) Family life SF 112 42 62 24 55 21 35 13 264 27) Social activities SF 84 32 70 26 49 19 62 23 265 28) Financial difficulties FI 162 66 52 21 19 8 14 6 247 1 2 3 4 5 6 7 Total (very poor) (excellent) 29) Overall health QL 8 15 30 32 45 35 15 180 4 8 17 18 25 19 8 30) Overall quality of life QL 17 34 28 40 61 49 35 264 6 13 11 15 23 19 13
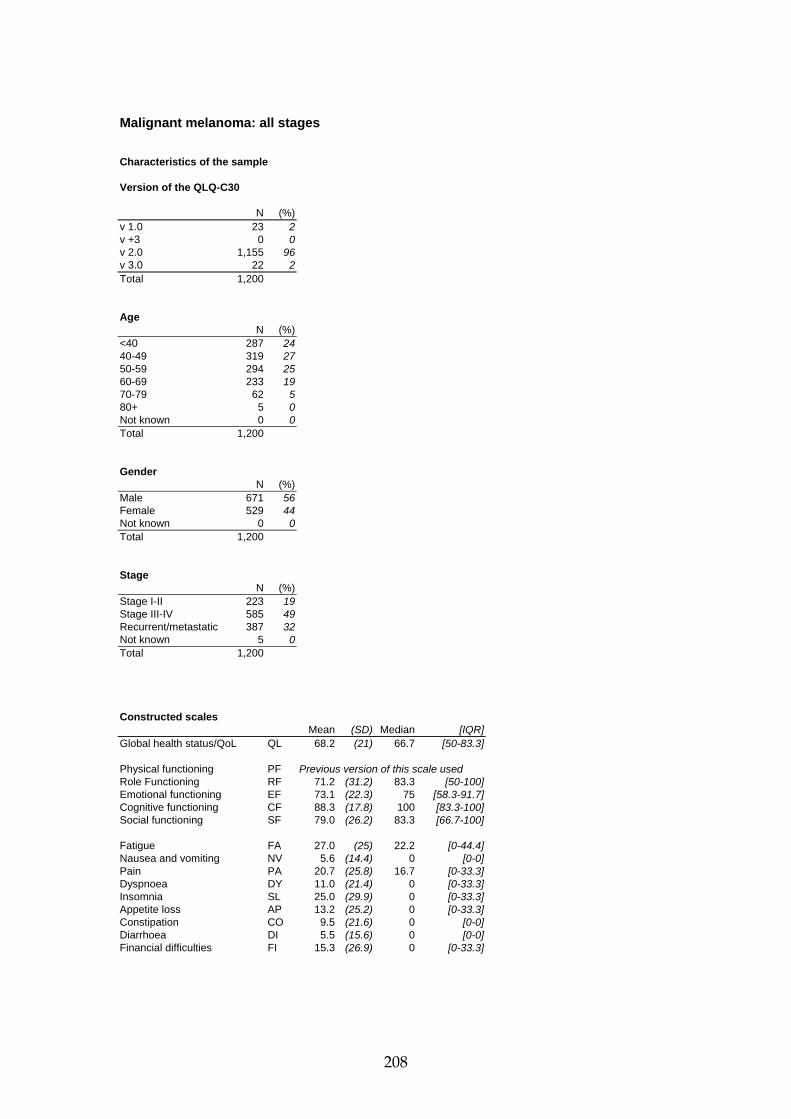
208
Malignant melanoma: all stages
Characteristics of the sample
Version of the QLQ-C30 N (%)
v 1.0 23 2 v +3 0 0 v 2.0 1,155 96 v 3.0 22 2 Total 1,200
Age N (%)
<40 287 24 40-49 319 27 50-59 294 25 60-69 233 19 70-79 62 5 80+ 5 0 Not known 0 0 Total 1,200
Gender
N (%) Male 671 56 Female 529 44 Not known 0 0 Total 1,200 Stage
N (%) Stage I-II 223 19 Stage III-IV 585 49 Recurrent/metastatic 387 32 Not known 5 0 Total 1,200
Constructed scales Mean (SD) Median [IQR]
Global health status/QoL QL 68.2 (21) 66.7 [50-83.3]
Physical functioning PF Previous version of this scale used Role Functioning RF 71.2 (31.2) 83.3 [50-100] Emotional functioning EF 73.1 (22.3) 75 [58.3-91.7] Cognitive functioning CF 88.3 (17.8) 100 [83.3-100] Social functioning SF 79.0 (26.2) 83.3 [66.7-100]
Fatigue FA 27.0 (25) 22.2 [0-44.4] Nausea and vomiting NV 5.6 (14.4) 0 [0-0] Pain PA 20.7 (25.8) 16.7 [0-33.3] Dyspnoea DY 11.0 (21.4) 0 [0-33.3] Insomnia SL 25.0 (29.9) 0 [0-33.3] Appetite loss AP 13.2 (25.2) 0 [0-33.3] Constipation CO 9.5 (21.6) 0 [0-0] Diarrhoea DI 5.5 (15.6) 0 [0-0] Financial difficulties FI 15.3 (26.9) 0 [0-33.3]

209
Malignant melanoma: all stages Constructed scales
QL N (%) CF N (%)
0 14 1 0 4 0 8.3 1 0 16.7 6 1 16.7 12 1 33.3 21 2 25 18 2 50 53 5 33.3 55 5 66.7 145 12 41.7 51 4 83.3 239 20 50 148 13 100 708 60
58.3 92 8 Total 1,176 66.7 238 21 75 103 9 83.3 245 21 91.7 60 5 SF N (%)
100 122 11 0 29 3Total 1,159 16.7 30 3
33.3 75 6 PF 50 83 7 Previous version of this scale used 66.7 213 18 83.3 187 16 100 563 48
Total 1,180 FA N (%)
0 310 26 11.1 164 14 22.2 186 16 33.3 222 19 44.4 95 8 55.6 57 5 66.7 76 7 77.8 24 2 88.9 23 2 100 20 2RF N (%) Total 1,177
0 76 7 16.7 37 3 33.3 125 11 50 90 8 NV N (%)
66.7 220 19 0 967 81 83.3 143 12 16.7 125 11 100 462 40 33.3 56 5
Total 1,153 50 18 2 66.7 16 1 EF N (%) 83.3 6 1
0 8 1 100 3 08.3 7 1 Total 1,191
16.7 17 2 25 25 2 33.3 39 3 41.7 60 5 PA N (%)
50 64 6 0 553 47 58.3 79 7 16.7 198 17 66.7 171 15 33.3 216 18 75 166 14 50 86 7 83.3 176 15 66.7 62 5 91.7 159 14 83.3 28 2 100 198 17 100 30 3
Total 1,169 Total 1,173

210
Malignant melanoma: all stages Single Items Not at all A little Quite a bit Very much Total N (%) N (%) N (%) N (%) N 1) Strenuous activities PF Previous version of this scale used 2) Long walk PF Previous version of this scale used 3) Short walk PF Previous version of this scale used 4) Bed or chair PF Previous version of this scale used 5) Self care PF Previous version of this scale used 6) Limited in work RF 509 44 380 33 173 15 104 9 1,166 7) Limited in leisure RF 584 50 288 25 167 14 120 10 1,159 8) Dyspnoea DY 892 75 227 19 54 5 20 2 1,193 9) Pain PA 619 52 385 32 135 11 50 4 1,189 10) Need to rest FA 427 36 495 42 200 17 72 6 1,194 11) Insomnia SL 600 50 358 30 172 14 65 5 1,195 12) Felt weak FA 621 52 395 33 123 10 54 5 1,193 13) Appetite loss AP 881 74 190 16 86 7 37 3 1,194 14) Nausea NV 982 82 160 13 33 3 19 2 1,194 15) Vomiting NV 1,100 92 71 6 18 2 5 0 1,194 16) Constipation CO 954 80 163 14 50 4 26 2 1,193 17) Diarrhoea DI 1,031 87 128 11 21 2 9 1 1,189 18) Felt tired FA 456 38 527 44 159 13 45 4 1,187 19) Pain interference PA 713 60 315 27 107 9 49 4 1,184 20) Concentration CF 864 73 222 19 76 6 18 2 1,180 21) Tension EF 489 41 484 41 167 14 46 4 1,186 22) Worry EF 289 24 514 43 263 22 122 10 1,188 23) Irritability EF 656 55 405 34 95 8 30 3 1,186 24) Depression EF 602 51 415 35 126 11 43 4 1,186 25) Memory trouble CF 860 72 266 22 49 4 15 1 1,190 26) Family life SF 720 61 312 26 102 9 50 4 1,184 27) Social activities SF 652 55 316 27 150 13 71 6 1,189 28) Financial difficulties FI 822 70 212 18 91 8 48 4 1,173 1 2 3 4 5 6 7 Total (very poor) (excellent) 29) Overall health QL 17 17 85 233 333 324 153 1,162 2 2 7 20 29 28 13 30) Overall quality of life QL 24 23 96 204 330 322 184 1,183 2 2 8 17 28 27 16

211
Malignant melanoma: males
Characteristics of the sample
Version of the QLQ-C30 N (%)
v 1.0 12 2 v +3 0 0 v 2.0 648 97 v 3.0 11 2 Total 671
Age N (%)
<40 155 23 40-49 174 26 50-59 170 25 60-69 133 20 70-79 38 6 80+ 1 0 Not known 0 0 Total 671
Stage N (%)
Stage I-II 114 17 Stage III-IV 336 50 Recurrent/metastatic 220 33 Not known 1 0 Total 671
Constructed scales Mean (SD) Median [IQR]
Global health status/QoL QL 68.7 (21.5) 66.7 [58.3-83.3]
Physical functioning PF Previous version of this scale used Role Functioning RF 70.2 (31.6) 83.3 [50-100] Emotional functioning EF 74.5 (22.7) 75 [66.7-91.7] Cognitive functioning CF 89.4 (16.9) 100 [83.3-100] Social functioning SF 78.8 (26.1) 83.3 [66.7-100]
Fatigue FA 26.0 (25.4) 22.2 [0-33.3] Nausea and vomiting NV 5.0 (13.3) 0 [0-0] Pain PA 20.7 (26.2) 16.7 [0-33.3] Dyspnoea DY 12.1 (22.8) 0 [0-33.3] Insomnia SL 22.1 (28.7) 0 [0-33.3] Appetite loss AP 12.4 (24.8) 0 [0-0] Constipation CO 8.0 (20.6) 0 [0-0] Diarrhoea DI 5.9 (16.3) 0 [0-0] Financial difficulties FI 15.0 (26.5) 0 [0-33.3]

212
Malignant melanoma: males Constructed scales QL N (%) CF N (%) 0 9 1 0 3 1 8.3 1 0 16.7 2 0 16.7 6 1 33.3 6 1 25 10 2 50 32 5 33.3 33 5 66.7 67 10 41.7 31 5 83.3 139 21 50 72 11 100 410 62 58.3 48 7 Total 659 66.7 133 20 75 56 9 83.3 141 22 91.7 40 6 SF N (%) 100 71 11 0 16 2 Total 651 16.7 18 3 33.3 40 6 PF 50 46 7 Previous version of this scale used 66.7 122 19 83.3 112 17 100 307 46 Total 661 FA N (%) 0 191 29 11.1 96 15 22.2 95 14 33.3 120 18 44.4 46 7 55.6 26 4 66.7 45 7 77.8 14 2 88.9 14 2 100 11 2 RF N (%) Total 658 0 47 7 16.7 21 3 33.3 71 11 50 51 8 NV N (%) 66.7 127 20 0 551 82 83.3 82 13 16.7 69 10 100 250 39 33.3 30 5 Total 649 50 8 1 66.7 8 1 EF N (%) 83.3 1 0 0 4 1 100 2 0 8.3 5 1 Total 669 16.7 8 1 25 12 2 33.3 22 3 41.7 36 6 PA N (%) 50 33 5 0 315 48 58.3 39 6 16.7 108 16 66.7 90 14 33.3 118 18 75 86 13 50 47 7 83.3 89 14 66.7 35 5 91.7 93 14 83.3 16 2 100 138 21 100 19 3 Total 655 Total 658

213
Malignant melanoma: males Single Items Not at all A little Quite a bit Very much Total N (%) N (%) N (%) N (%) N 1) Strenuous activities PF Previous version of this scale used 2) Long walk PF Previous version of this scale used 3) Short walk PF Previous version of this scale used 4) Bed or chair PF Previous version of this scale used 5) Self care PF Previous version of this scale used 6) Limited in work RF 281 43 214 33 94 14 66 10 655 7) Limited in leisure RF 318 49 164 25 98 15 71 11 651 8) Dyspnoea DY 490 73 130 19 34 5 15 2 669 9) Pain PA 355 53 212 32 68 10 31 5 666 10) Need to rest FA 261 39 263 39 106 16 38 6 668 11) Insomnia SL 364 55 199 30 71 11 34 5 668 12) Felt weak FA 360 54 202 30 75 11 31 5 668 13) Appetite loss AP 507 76 94 14 47 7 20 3 668 14) Nausea NV 559 83 88 13 17 3 6 1 670 15) Vomiting NV 621 93 37 6 8 1 3 0 669 16) Constipation CO 557 84 74 11 21 3 15 2 667 17) Diarrhoea DI 573 86 71 11 16 2 5 1 665 18) Felt tired FA 275 42 280 42 82 12 26 4 663 19) Pain interference PA 397 60 172 26 66 10 28 4 663 20) Concentration CF 497 75 117 18 35 5 11 2 660 21) Tension EF 309 47 229 35 95 14 29 4 662 22) Worry EF 185 28 274 41 142 22 61 9 662 23) Irritability EF 373 56 228 34 50 8 13 2 664 24) Depression EF 359 54 214 32 69 10 21 3 663 25) Memory trouble CF 494 74 141 21 24 4 5 1 664 26) Family life SF 388 59 193 29 55 8 26 4 662 27) Social activities SF 366 55 177 27 83 13 40 6 666 28) Financial difficulties FI 466 71 114 17 57 9 23 4 660 1 2 3 4 5 6 7 Total (very poor) (excellent) 29) Overall health QL 10 9 52 119 183 186 94 653 2 1 8 18 28 29 14 30) Overall quality of life QL 16 10 58 107 180 188 105 664 2 2 9 16 27 28 16

214
Malignant melanoma: females
Characteristics of the sample
Version of the QLQ-C30 N (%)
v 1.0 11 2 v +3 0 0 v 2.0 507 96 v 3.0 11 2 Total 529
Age N (%)
<40 132 25 40-49 145 27 50-59 124 23 60-69 100 19 70-79 24 5 80+ 4 1 Not known 0 0 Total 529
Stage N (%)
Stage I-II 109 21 Stage III-IV 249 47 Recurrent/metastatic 167 32 Not known 4 1 Total 529
Constructed scales Mean (SD) Median [IQR]
Global health status/QoL QL 67.6 (20.5) 66.7 [50-83.3]
Physical functioning PF Previous version of this scale used Role Functioning RF 72.4 (30.7) 83.3 [50-100] Emotional functioning EF 71.3 (21.7) 75 [58.3-83.3] Cognitive functioning CF 86.9 (18.8) 100 [83.3-100] Social functioning SF 79.3 (26.4) 83.3 [66.7-100]
Fatigue FA 28.2 (24.3) 22.2 [11.1-44.4] Nausea and vomiting NV 6.4 (15.7) 0 [0-0] Pain PA 20.6 (25.2) 16.7 [0-33.3] Dyspnoea DY 9.7 (19.4) 0 [0-0] Insomnia SL 28.7 (30.9) 33.3 [0-66.7] Appetite loss AP 14.3 (25.6) 0 [0-33.3] Constipation CO 11.4 (22.6) 0 [0-0] Diarrhoea DI 5.0 (14.7) 0 [0-0] Financial difficulties FI 15.7 (27.4) 0 [0-33.3]

215
Malignant melanoma: females Constructed scales QL N (%) CF N (%) 0 5 1 0 1 0 8.3 0 0 16.7 4 1 16.7 6 1 33.3 15 3 25 8 2 50 21 4 33.3 22 4 66.7 78 15 41.7 20 4 83.3 100 19 50 76 15 100 298 58 58.3 44 9 Total 517 66.7 105 21 75 47 9 83.3 104 21 91.7 20 4 SF N (%) 100 51 10 0 13 3 Total 508 16.7 12 2 33.3 35 7 PF 50 37 7 Previous version of this scale used 66.7 91 18 83.3 75 15 100 256 49 Total 519 FA N (%) 0 119 23 11.1 68 13 22.2 91 18 33.3 102 20 44.4 49 9 55.6 31 6 66.7 31 6 77.8 10 2 88.9 9 2 100 9 2 RF N (%) Total 519 0 29 6 16.7 16 3 33.3 54 11 50 39 8 NV N (%) 66.7 93 19 0 416 80 83.3 61 12 16.7 56 11 100 212 42 33.3 26 5 Total 504 50 10 2 66.7 8 2 EF N (%) 83.3 5 1 0 4 1 100 1 0 8.3 2 0 Total 522 16.7 9 2 25 13 3 33.3 17 3 41.7 24 5 PA N (%) 50 31 6 0 238 46 58.3 40 8 16.7 90 18 66.7 81 16 33.3 98 19 75 80 16 50 39 8 83.3 87 17 66.7 27 5 91.7 66 13 83.3 12 2 100 60 12 100 11 2 Total 514 Total 515

216
Malignant melanoma: females
Single Items Not at all A little Quite a bit Very much Total N (%) N (%) N (%) N (%) N
1) Strenuous activities PF Previous version of this scale used 2) Long walk PF Previous version of this scale used 3) Short walk PF Previous version of this scale used 4) Bed or chair PF Previous version of this scale used 5) Self care PF Previous version of this scale used 6) Limited in work RF 228 45 166 33 79 16 38 7 5117) Limited in leisure RF 266 52 124 24 69 14 49 10 5088) Dyspnoea DY 402 77 97 19 20 4 5 1 5249) Pain PA 264 51 173 33 67 13 19 4 52310) Need to rest FA 166 32 232 44 94 18 34 7 52611) Insomnia SL 236 45 159 30 101 19 31 6 52712) Felt weak FA 261 50 193 37 48 9 23 4 52513) Appetite loss AP 374 71 96 18 39 7 17 3 52614) Nausea NV 423 81 72 14 16 3 13 3 52415) Vomiting NV 479 91 34 7 10 2 2 0 52516) Constipation CO 397 76 89 17 29 6 11 2 52617) Diarrhoea DI 458 87 57 11 5 1 4 1 52418) Felt tired FA 181 35 247 47 77 15 19 4 52419) Pain interference PA 316 61 143 27 41 8 21 4 52120) Concentration CF 367 71 105 20 41 8 7 1 52021) Tension EF 180 34 255 49 72 14 17 3 52422) Worry EF 104 20 240 46 121 23 61 12 52623) Irritability EF 283 54 177 34 45 9 17 3 52224) Depression EF 243 47 201 38 57 11 22 4 52325) Memory trouble CF 366 70 125 24 25 5 10 2 52626) Family life SF 332 64 119 23 47 9 24 5 52227) Social activities SF 286 55 139 27 67 13 31 6 52328) Financial difficulties FI 356 69 98 19 34 7 25 5 513
1 2 3 4 5 6 7 Total (very poor) (excellent)
29) Overall health QL 7 8 33 114 150 138 59 509 1 2 7 22 30 27 12
30) Overall quality of life QL 8 13 38 97 150 134 79 519 2 3 7 19 29 26 15

217
Malignant melanoma: <50
Characteristics of the sample
Version of the QLQ-C30 N (%)
v 1.0 4 1 v +3 0 0 v 2.0 600 99 v 3.0 2 0 Total 606
Age N (%)
<40 287 47 40-49 319 53 50-59 0 0 60-69 0 0 70-79 0 0 80+ 0 0 Not known 0 0 Total 606
Gender
N (%) Male 329 54 Female 277 46 Not known 0 0 Total 606 Stage
N (%) Stage I-II 106 18 Stage III-IV 309 51 Recurrent/metastatic 189 31 Not known 2 0 Total 606
Constructed scales Mean (SD) Median [IQR]
Global health status/QoL QL 68.5 (20.5) 66.7 [50-83.3]
Physical functioning PF Previous version of this scale used Role Functioning RF 69.8 (31.8) 83.3 [50-100] Emotional functioning EF 73.1 (21.8) 75 [66.7-91.7] Cognitive functioning CF 89.4 (17.1) 100 [83.3-100] Social functioning SF 77.5 (26.5) 83.3 [66.7-100]
Fatigue FA 27.1 (24.4) 22.2 [0-33.3] Nausea and vomiting NV 5.6 (14) 0 [0-0] Pain PA 21.1 (24.7) 16.7 [0-33.3] Dyspnoea DY 10.2 (21.3) 0 [0-0] Insomnia SL 25.6 (30.7) 0 [0-33.3] Appetite loss AP 12.9 (24.5) 0 [0-33.3] Constipation CO 8.5 (20.3) 0 [0-0] Diarrhoea DI 6.1 (15.6) 0 [0-0] Financial difficulties FI 18.4 (28.4) 0 [0-33.3]

218
Malignant melanoma: <50 Constructed scales QL N (%) CF N (%) 0 4 1 0 1 0 8.3 0 0 16.7 3 1 16.7 8 1 33.3 9 2 25 10 2 50 27 5 33.3 28 5 66.7 67 11 41.7 27 5 83.3 108 18 50 75 13 100 385 64 58.3 47 8 Total 600 66.7 119 20 75 54 9 83.3 137 23 91.7 28 5 SF N (%) 100 59 10 0 16 3 Total 596 16.7 16 3 33.3 45 8 PF 50 37 6 Previous version of this scale used 66.7 126 21 83.3 98 16 100 266 44 Total 604 FA N (%) 0 151 25 11.1 81 14 22.2 99 17 33.3 122 20 44.4 49 8 55.6 32 5 66.7 32 5 77.8 14 2 88.9 13 2 100 8 1 RF N (%) Total 601 0 43 7 16.7 23 4 33.3 64 11 50 48 8 NV N (%) 66.7 110 19 0 489 81 83.3 83 14 16.7 63 10 100 222 37 33.3 34 6 Total 593 50 7 1 66.7 6 1 EF N (%) 83.3 4 1 0 4 1 100 1 0 8.3 4 1 Total 604 16.7 9 2 25 12 2 33.3 15 3 41.7 31 5 PA N (%) 50 29 5 0 262 44 58.3 45 8 16.7 105 18 66.7 93 16 33.3 128 22 75 84 14 50 44 7 83.3 100 17 66.7 30 5 91.7 80 13 83.3 15 3 100 93 16 100 11 2 Total 599 Total 595
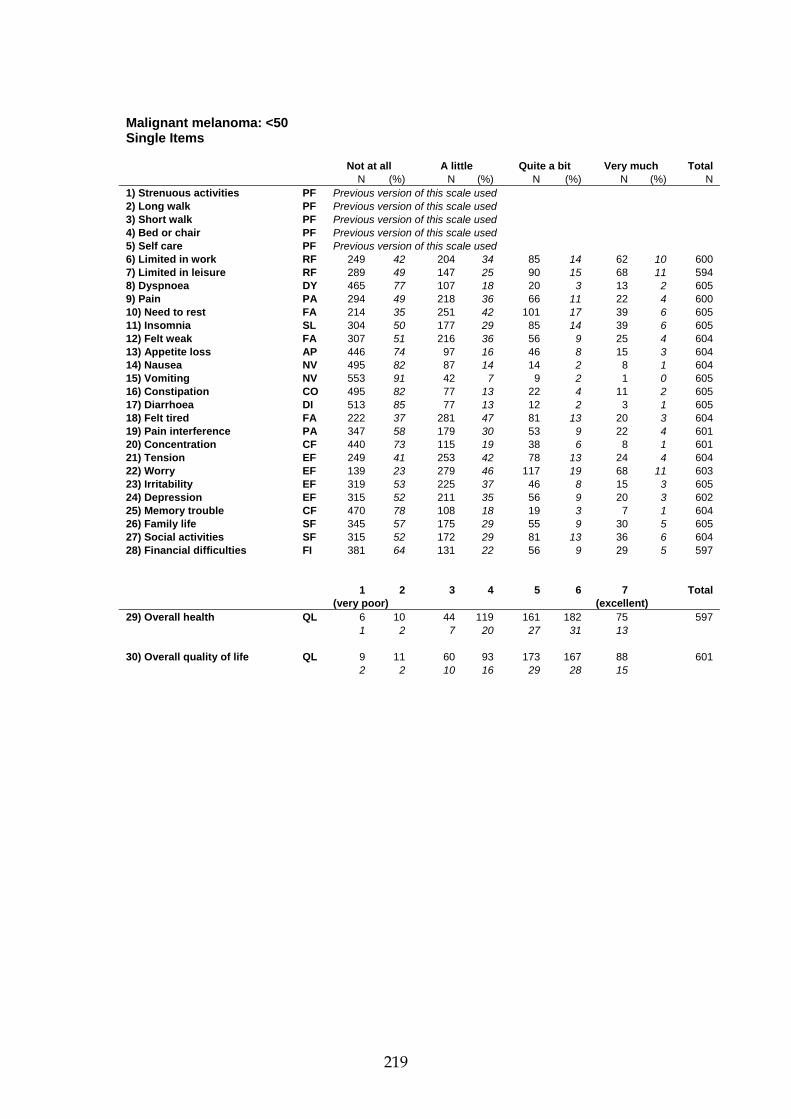
219
Malignant melanoma: <50 Single Items Not at all A little Quite a bit Very much Total N (%) N (%) N (%) N (%) N 1) Strenuous activities PF Previous version of this scale used 2) Long walk PF Previous version of this scale used 3) Short walk PF Previous version of this scale used 4) Bed or chair PF Previous version of this scale used 5) Self care PF Previous version of this scale used 6) Limited in work RF 249 42 204 34 85 14 62 10 600 7) Limited in leisure RF 289 49 147 25 90 15 68 11 594 8) Dyspnoea DY 465 77 107 18 20 3 13 2 605 9) Pain PA 294 49 218 36 66 11 22 4 600 10) Need to rest FA 214 35 251 42 101 17 39 6 605 11) Insomnia SL 304 50 177 29 85 14 39 6 605 12) Felt weak FA 307 51 216 36 56 9 25 4 604 13) Appetite loss AP 446 74 97 16 46 8 15 3 604 14) Nausea NV 495 82 87 14 14 2 8 1 604 15) Vomiting NV 553 91 42 7 9 2 1 0 605 16) Constipation CO 495 82 77 13 22 4 11 2 605 17) Diarrhoea DI 513 85 77 13 12 2 3 1 605 18) Felt tired FA 222 37 281 47 81 13 20 3 604 19) Pain interference PA 347 58 179 30 53 9 22 4 601 20) Concentration CF 440 73 115 19 38 6 8 1 601 21) Tension EF 249 41 253 42 78 13 24 4 604 22) Worry EF 139 23 279 46 117 19 68 11 603 23) Irritability EF 319 53 225 37 46 8 15 3 605 24) Depression EF 315 52 211 35 56 9 20 3 602 25) Memory trouble CF 470 78 108 18 19 3 7 1 604 26) Family life SF 345 57 175 29 55 9 30 5 605 27) Social activities SF 315 52 172 29 81 13 36 6 604 28) Financial difficulties FI 381 64 131 22 56 9 29 5 597 1 2 3 4 5 6 7 Total (very poor) (excellent) 29) Overall health QL 6 10 44 119 161 182 75 597 1 2 7 20 27 31 13 30) Overall quality of life QL 9 11 60 93 173 167 88 601 2 2 10 16 29 28 15

220
Malignant melanoma: 50-59
Characteristics of the sample
Version of the QLQ-C30 N (%)
v 1.0 8 3 v +3 0 0 v 2.0 280 95 v 3.0 6 2 Total 294
Age N (%)
<40 0 0 40-49 0 0 50-59 294 100 60-69 0 0 70-79 0 0 80+ 0 0 Not known 0 0 Total 294
Gender
N (%) Male 170 58 Female 124 42 Not known 0 0 Total 294 Stage
N (%) Stage I-II 53 18 Stage III-IV 134 46 Recurrent/metastatic 107 36 Not known 0 0 Total 294
Constructed scales Mean (SD) Median [IQR]
Global health status/QoL QL 68.6 (19.5) 66.7 [58.3-83.3]
Physical functioning PF Previous version of this scale used Role Functioning RF 72.8 (30) 83.3 [50-100] Emotional functioning EF 71.0 (22.4) 75 [58.3-91.7] Cognitive functioning CF 87.8 (18) 100 [83.3-100] Social functioning SF 80.2 (25.1) 83.3 [66.7-100]
Fatigue FA 25.3 (24.1) 22.2 [0-33.3] Nausea and vomiting NV 4.3 (12.1) 0 [0-0] Pain PA 20.3 (25.4) 16.7 [0-33.3] Dyspnoea DY 10.5 (20.4) 0 [0-0] Insomnia SL 24.3 (28.6) 33.3 [0-33.3] Appetite loss AP 11.5 (22.6) 0 [0-0] Constipation CO 7.6 (17.8) 0 [0-0] Diarrhoea DI 5.1 (14.9) 0 [0-0] Financial difficulties FI 11.7 (24.1) 0 [0-0]

221
Malignant melanoma: 50-59 Constructed scales QL N (%) CF N (%) 0 1 0 0 1 0 8.3 0 0 16.7 3 1 16.7 1 0 33.3 5 2 25 3 1 50 10 4 33.3 17 6 66.7 33 12 41.7 13 5 83.3 73 26 50 33 12 100 161 56 58.3 25 9 Total 286 66.7 64 23 75 26 9 83.3 51 18 91.7 21 8 SF N (%) 100 25 9 0 6 2 Total 280 16.7 6 2 33.3 13 5 PF 50 28 10 Previous version of this scale used 66.7 46 16 83.3 49 17 100 141 49 Total 289 FA N (%) 0 81 28 11.1 43 15 22.2 48 17 33.3 51 18 44.4 18 6 55.6 13 5 66.7 21 7 77.8 6 2 88.9 5 2 100 2 1 RF N (%) Total 288 0 14 5 16.7 8 3 33.3 29 11 50 21 8 NV N (%) 66.7 62 22 0 241 83 83.3 25 9 16.7 36 12 100 118 43 33.3 7 2 Total 277 50 4 1 66.7 0 0 EF N (%) 83.3 0 0 0 2 1 100 2 1 8.3 1 0 Total 290 16.7 3 1 25 9 3 33.3 15 5 41.7 13 5 PA N (%) 50 18 6 0 139 48 58.3 17 6 16.7 48 17 66.7 50 18 33.3 47 16 75 35 13 50 26 9 83.3 43 15 66.7 15 5 91.7 38 14 83.3 8 3 100 37 13 100 5 2 Total 281 Total 288
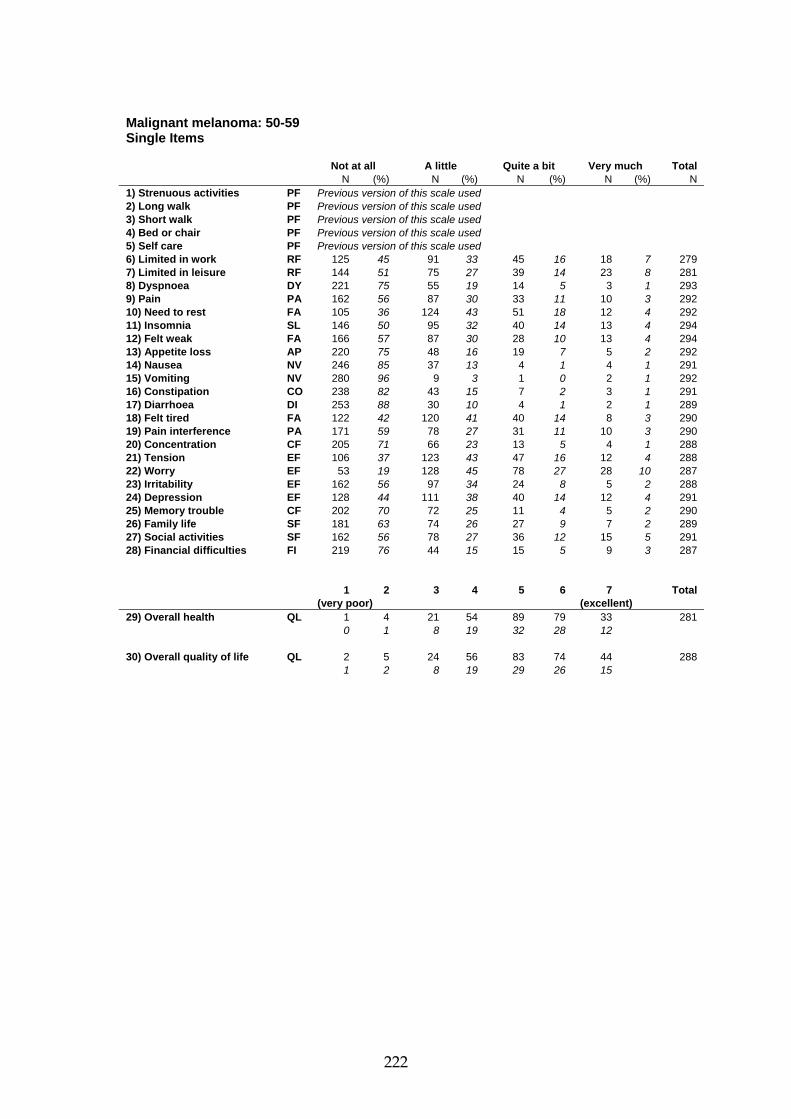
222
Malignant melanoma: 50-59 Single Items Not at all A little Quite a bit Very much Total N (%) N (%) N (%) N (%) N 1) Strenuous activities PF Previous version of this scale used 2) Long walk PF Previous version of this scale used 3) Short walk PF Previous version of this scale used 4) Bed or chair PF Previous version of this scale used 5) Self care PF Previous version of this scale used 6) Limited in work RF 125 45 91 33 45 16 18 7 279 7) Limited in leisure RF 144 51 75 27 39 14 23 8 281 8) Dyspnoea DY 221 75 55 19 14 5 3 1 293 9) Pain PA 162 56 87 30 33 11 10 3 292 10) Need to rest FA 105 36 124 43 51 18 12 4 292 11) Insomnia SL 146 50 95 32 40 14 13 4 294 12) Felt weak FA 166 57 87 30 28 10 13 4 294 13) Appetite loss AP 220 75 48 16 19 7 5 2 292 14) Nausea NV 246 85 37 13 4 1 4 1 291 15) Vomiting NV 280 96 9 3 1 0 2 1 292 16) Constipation CO 238 82 43 15 7 2 3 1 291 17) Diarrhoea DI 253 88 30 10 4 1 2 1 289 18) Felt tired FA 122 42 120 41 40 14 8 3 290 19) Pain interference PA 171 59 78 27 31 11 10 3 290 20) Concentration CF 205 71 66 23 13 5 4 1 288 21) Tension EF 106 37 123 43 47 16 12 4 288 22) Worry EF 53 19 128 45 78 27 28 10 287 23) Irritability EF 162 56 97 34 24 8 5 2 288 24) Depression EF 128 44 111 38 40 14 12 4 291 25) Memory trouble CF 202 70 72 25 11 4 5 2 290 26) Family life SF 181 63 74 26 27 9 7 2 289 27) Social activities SF 162 56 78 27 36 12 15 5 291 28) Financial difficulties FI 219 76 44 15 15 5 9 3 287 1 2 3 4 5 6 7 Total (very poor) (excellent) 29) Overall health QL 1 4 21 54 89 79 33 281 0 1 8 19 32 28 12 30) Overall quality of life QL 2 5 24 56 83 74 44 288 1 2 8 19 29 26 15

223
Malignant melanoma: 60-69
Characteristics of the sample
Version of the QLQ-C30 N (%)
v 1.0 6 3 v +3 0 0 v 2.0 225 97 v 3.0 2 1 Total 233
Age N (%)
<40 0 0 40-49 0 0 50-59 0 0 60-69 233 100 70-79 0 0 80+ 0 0 Not known 0 0 Total 233
Gender
N (%) Male 133 57 Female 100 43 Not known 0 0 Total 233 Stage
N (%) Stage I-II 50 22 Stage III-IV 106 46 Recurrent/metastatic 75 32 Not known 2 1 Total 233
Constructed scales Mean (SD) Median [IQR]
Global health status/QoL QL 68.4 (22.8) 66.7 [50-83.3]
Physical functioning PF Previous version of this scale used Role Functioning RF 74.6 (29.8) 83.3 [50-100] Emotional functioning EF 74.7 (22.6) 75 [58.3-91.7] Cognitive functioning CF 88.4 (17) 100 [83.3-100] Social functioning SF 81.5 (26.5) 100 [66.7-100]
Fatigue FA 27.4 (26.4) 22.2 [0-44.4] Nausea and vomiting NV 5.6 (14.4) 0 [0-0] Pain PA 19.0 (27.8) 0 [0-33.3] Dyspnoea DY 13.1 (22.6) 0 [0-33.3] Insomnia SL 25.4 (30.2) 0 [0-33.3] Appetite loss AP 11.6 (24.1) 0 [0-0] Constipation CO 12.6 (25.8) 0 [0-0] Diarrhoea DI 4.4 (15) 0 [0-0] Financial difficulties FI 11.5 (24.5) 0 [0-0]

224
Malignant melanoma: 60-69 Constructed scales QL N (%) CF N (%) 0 7 3 0 1 0 8.3 0 0 16.7 0 0 16.7 2 1 33.3 2 1 25 3 1 50 11 5 33.3 7 3 66.7 33 15 41.7 8 4 83.3 44 20 50 30 14 100 135 60 58.3 16 7 Total 226 66.7 45 20 75 19 9 83.3 48 22 91.7 9 4 SF N (%) 100 29 13 0 6 3 Total 223 16.7 6 3 33.3 11 5 PF 50 15 7 Previous version of this scale used 66.7 32 14 83.3 28 13 100 124 56 Total 222 FA N (%) 0 64 28 11.1 30 13 22.2 33 15 33.3 36 16 44.4 24 11 55.6 7 3 66.7 19 8 77.8 2 1 88.9 4 2 100 7 3 RF N (%) Total 226 0 10 5 16.7 5 2 33.3 27 12 50 15 7 NV N (%) 66.7 39 17 0 191 83 83.3 25 11 16.7 18 8 100 103 46 33.3 12 5 Total 224 50 4 2 66.7 6 3 EF N (%) 83.3 0 0 0 1 0 100 0 0 8.3 2 1 Total 231 16.7 3 1 25 2 1 33.3 6 3 41.7 16 7 PA N (%) 50 14 6 0 126 56 58.3 15 7 16.7 30 13 66.7 23 10 33.3 33 15 75 36 16 50 10 4 83.3 24 11 66.7 13 6 91.7 32 14 83.3 4 2 100 50 22 100 10 4 Total 224 Total 226

225
Malignant melanoma: 60-69 Single Items Not at all A little Quite a bit Very much Total N (%) N (%) N (%) N (%) N 1) Strenuous activities PF Previous version of this scale used 2) Long walk PF Previous version of this scale used 3) Short walk PF Previous version of this scale used 4) Bed or chair PF Previous version of this scale used 5) Self care PF Previous version of this scale used 6) Limited in work RF 113 50 65 29 34 15 14 6 226 7) Limited in leisure RF 124 55 50 22 32 14 18 8 224 8) Dyspnoea DY 161 70 49 21 16 7 3 1 229 9) Pain PA 133 58 60 26 24 10 14 6 231 10) Need to rest FA 83 36 92 40 41 18 14 6 230 11) Insomnia SL 116 50 65 28 37 16 12 5 230 12) Felt weak FA 125 54 66 29 28 12 11 5 230 13) Appetite loss AP 178 77 34 15 13 6 7 3 232 14) Nausea NV 194 83 27 12 10 4 2 1 233 15) Vomiting NV 211 91 14 6 5 2 1 0 231 16) Constipation CO 176 76 33 14 12 5 10 4 231 17) Diarrhoea DI 207 90 16 7 4 2 2 1 229 18) Felt tired FA 87 38 103 45 28 12 12 5 230 19) Pain interference PA 154 68 44 19 18 8 12 5 228 20) Concentration CF 175 77 31 14 17 8 4 2 227 21) Tension EF 103 45 82 36 37 16 7 3 229 22) Worry EF 64 28 87 38 60 26 21 9 232 23) Irritability EF 138 61 66 29 19 8 5 2 228 24) Depression EF 123 54 74 33 23 10 8 4 228 25) Memory trouble CF 159 69 61 26 10 4 1 0 231 26) Family life SF 152 68 49 22 13 6 11 5 225 27) Social activities SF 138 61 49 22 25 11 16 7 228 28) Financial difficulties FI 175 78 28 13 14 6 7 3 224 1 2 3 4 5 6 7 Total (very poor) (excellent) 29) Overall health QL 7 0 16 44 69 53 34 223 3 0 7 20 31 24 15 30) Overall quality of life QL 9 4 11 42 57 67 39 229 4 2 5 18 25 29 17

226
Malignant melanoma: stage I-II
Characteristics of the sample
Version of the QLQ-C30 N (%)
v 1.0 17 8 v +3 0 0 v 2.0 205 92 v 3.0 1 0 Total 223
Age N (%)
<40 55 25 40-49 51 23 50-59 53 24 60-69 50 22 70-79 12 5 80+ 2 1 Not known 0 0 Total 223
Gender N (%)
Male 114 51 Female 109 49 Not known 0 0 Total 223
Constructed scales Mean (SD) Median [IQR]
Global health status/QoL QL 73.2 (18.1) 75 [66.7-83.3]
Physical functioning PF Previous version of this scale used Role Functioning RF 81.2 (27.4) 100 [66.7-100] Emotional functioning EF 77.5 (21.4) 83.3 [66.7-91.7] Cognitive functioning CF 91.6 (14.8) 100 [83.3-100] Social functioning SF 85.7 (21.4) 100 [66.7-100]
Fatigue FA 20.7 (22.1) 22.2 [0-33.3] Nausea and vomiting NV 3.3 (11.4) 0 [0-0] Pain PA 15.1 (20.5) 0 [0-33.3] Dyspnoea DY 6.6 (16.1) 0 [0-0] Insomnia SL 20.9 (27.2) 0 [0-33.3] Appetite loss AP 9.0 (21.2) 0 [0-0] Constipation CO 8.3 (18.7) 0 [0-0] Diarrhoea DI 5.9 (15.9) 0 [0-0] Financial difficulties FI 13.9 (25.1) 0 [0-33.3]

227
Malignant melanoma: stage I-II Constructed scales QL N (%) CF N (%) 0 0 0 0 0 0 8.3 0 0 16.7 0 0 16.7 1 1 33.3 3 1 25 0 0 50 6 3 33.3 8 4 66.7 22 10 41.7 3 2 83.3 35 16 50 23 11 100 151 70 58.3 15 7 Total 217 66.7 47 23 75 14 7 83.3 52 26 91.7 12 6 SF N (%) 100 28 14 0 1 1 Total 203 16.7 3 1 33.3 10 5 PF 50 10 5 Previous version of this scale used 66.7 32 15 83.3 34 16 100 130 59 Total 220 FA N (%) 0 73 34 11.1 35 16 22.2 41 19 33.3 35 16 44.4 12 6 55.6 7 3 66.7 5 2 77.8 4 2 88.9 3 1 100 2 1 RF N (%) Total 217 0 8 4 16.7 2 1 33.3 13 7 50 12 6 NV N (%) 66.7 29 15 0 194 88 83.3 22 11 16.7 18 8 100 114 57 33.3 3 1 Total 200 50 1 1 66.7 3 1 EF N (%) 83.3 1 1 0 1 1 100 0 0 8.3 1 1 Total 220 16.7 4 2 25 3 1 33.3 6 3 41.7 8 4 PA N (%) 50 6 3 0 115 54 58.3 11 5 16.7 39 18 66.7 25 11 33.3 37 17 75 28 13 50 13 6 83.3 40 18 66.7 5 2 91.7 41 19 83.3 3 1 100 45 21 100 1 1 Total 219 Total 213

228
Malignant melanoma: stage I-II Single Items Not at all A little Quite a bit Very much Total N (%) N (%) N (%) N (%) N 1) Strenuous activities PF Previous version of this scale used 2) Long walk PF Previous version of this scale used 3) Short walk PF Previous version of this scale used 4) Bed or chair PF Previous version of this scale used 5) Self care PF Previous version of this scale used 6) Limited in work RF 122 61 49 24 19 10 11 6 201 7) Limited in leisure RF 137 67 35 17 19 9 13 6 204 8) Dyspnoea DY 185 83 31 14 5 2 1 1 222 9) Pain PA 129 59 72 33 12 6 6 3 219 10) Need to rest FA 101 46 89 40 22 10 10 5 222 11) Insomnia SL 122 55 71 32 21 9 9 4 223 12) Felt weak FA 132 60 71 32 11 5 7 3 221 13) Appetite loss AP 182 82 26 12 11 5 4 2 223 14) Nausea NV 196 89 18 8 5 2 2 1 221 15) Vomiting NV 214 97 4 2 3 1 0 0 221 16) Constipation CO 179 81 33 15 8 4 2 1 222 17) Diarrhoea DI 190 86 27 12 3 1 2 1 222 18) Felt tired FA 109 50 90 41 17 8 4 2 220 19) Pain interference PA 148 68 52 24 13 6 4 2 217 20) Concentration CF 179 82 32 15 8 4 0 0 219 21) Tension EF 117 53 74 34 24 11 6 3 221 22) Worry EF 74 34 97 44 32 15 18 8 221 23) Irritability EF 130 59 71 32 15 7 4 2 220 24) Depression EF 124 56 72 33 16 7 8 4 220 25) Memory trouble CF 166 76 46 21 5 2 2 1 219 26) Family life SF 160 72 45 20 10 5 6 3 221 27) Social activities SF 144 66 53 24 16 7 7 3 220 28) Financial difficulties FI 156 71 42 19 14 6 7 3 219 1 2 3 4 5 6 7 Total (very poor) (excellent) 29) Overall health QL 0 1 9 34 58 65 36 203 0 1 4 17 29 32 18 30) Overall quality of life QL 0 2 12 34 61 67 44 220 0 1 6 16 28 31 20

229
Malignant melanoma: stage III-IV
Characteristics of the sample
Version of the QLQ-C30 N (%)
v 1.0 0 0 v +3 0 0 v 2.0 580 99 v 3.0 5 1 Total 585
Age N (%)
<40 155 27 40-49 154 26 50-59 134 23 60-69 106 18 70-79 35 6 80+ 1 0 Not known 0 0 Total 585
Gender N (%)
Male 336 57 Female 249 43 Not known 0 0 Total 585
Constructed scales Mean (SD) Median [IQR]
Global health status/QoL QL 69.7 (19.9) 66.7 [58.3-83.3]
Physical functioning PF Previous version of this scale used Role Functioning RF 71.1 (30.1) 83.3 [50-100] Emotional functioning EF 75.0 (21.3) 75 [66.7-91.7] Cognitive functioning CF 88.8 (16.6) 100 [83.3-100] Social functioning SF 81.5 (24) 100 [66.7-100]
Fatigue FA 25.1 (23) 22.2 [0-33.3] Nausea and vomiting NV 3.2 (9.6) 0 [0-0] Pain PA 20.8 (24.1) 16.7 [0-33.3] Dyspnoea DY 7.6 (16.6) 0 [0-0] Insomnia SL 23.9 (29.1) 0 [0-33.3] Appetite loss AP 8.2 (18) 0 [0-0] Constipation CO 7.7 (19.2) 0 [0-0] Diarrhoea DI 4.6 (14) 0 [0-0] Financial difficulties FI 15.0 (26.9) 0 [0-33.3]

230
Malignant melanoma: stage III-IV Constructed scales QL N (%) CF N (%) 0 4 1 0 1 0 8.3 0 0 16.7 4 1 16.7 5 1 33.3 3 1 25 6 1 50 26 5 33.3 19 3 66.7 70 12 41.7 25 4 83.3 126 22 50 80 14 100 341 60 58.3 40 7 Total 571 66.7 131 23 75 53 9 83.3 111 19 91.7 36 6 SF N (%) 100 67 12 0 8 1 Total 577 16.7 14 2 33.3 26 5 PF 50 35 6 Previous version of this scale used 66.7 108 19 83.3 95 17 100 289 50 Total 575 FA N (%) 0 160 28 11.1 79 14 22.2 85 15 33.3 122 21 44.4 48 8 55.6 21 4 66.7 38 7 77.8 9 2 88.9 8 1 100 3 1 RF N (%) Total 573 0 34 6 16.7 14 2 33.3 65 11 50 49 9 NV N (%) 66.7 116 20 0 504 87 83.3 87 15 16.7 54 9 100 212 37 33.3 17 3 Total 577 50 3 1 66.7 4 1 EF N (%) 83.3 0 0 0 3 1 100 0 0 8.3 2 0 Total 582 16.7 8 1 25 10 2 33.3 15 3 41.7 20 4 PA N (%) 50 34 6 0 249 43 58.3 34 6 16.7 110 19 66.7 86 15 33.3 122 21 75 84 15 50 40 7 83.3 92 16 66.7 34 6 91.7 71 12 83.3 9 2 100 112 20 100 10 2 Total 571 Total 574

231
Malignant melanoma: stage III-IV Single Items Not at all A little Quite a bit Very much Total N (%) N (%) N (%) N (%) N 1) Strenuous activities PF Previous version of this scale used 2) Long walk PF Previous version of this scale used 3) Short walk PF Previous version of this scale used 4) Bed or chair PF Previous version of this scale used 5) Self care PF Previous version of this scale used 6) Limited in work RF 236 40 211 36 89 15 48 8 584 7) Limited in leisure RF 285 49 158 27 82 14 52 9 577 8) Dyspnoea DY 466 80 102 18 9 2 4 1 581 9) Pain PA 288 50 211 36 67 12 13 2 579 10) Need to rest FA 213 37 250 43 93 16 24 4 580 11) Insomnia SL 298 51 176 30 78 13 28 5 580 12) Felt weak FA 315 54 196 34 56 10 15 3 582 13) Appetite loss AP 469 80 87 15 25 4 2 0 583 14) Nausea NV 509 87 64 11 9 2 2 0 584 15) Vomiting NV 559 96 19 3 4 1 0 0 582 16) Constipation CO 482 83 75 13 15 3 10 2 582 17) Diarrhoea DI 516 89 52 9 11 2 2 0 581 18) Felt tired FA 232 40 262 45 70 12 14 2 578 19) Pain interference PA 332 57 177 31 53 9 18 3 580 20) Concentration CF 430 75 101 18 36 6 6 1 573 21) Tension EF 247 43 249 43 67 12 16 3 579 22) Worry EF 154 27 264 46 115 20 46 8 579 23) Irritability EF 326 56 192 33 43 7 17 3 578 24) Depression EF 312 54 200 35 47 8 19 3 578 25) Memory trouble CF 416 72 135 23 23 4 6 1 580 26) Family life SF 367 64 155 27 39 7 15 3 576 27) Social activities SF 329 57 167 29 57 10 28 5 581 28) Financial difficulties FI 409 71 103 18 41 7 25 4 578 1 2 3 4 5 6 7 Total (very poor) (excellent) 29) Overall health QL 6 2 33 123 183 152 79 578 1 0 6 21 32 26 14 30) Overall quality of life QL 9 9 35 101 172 149 102 577 2 2 6 18 30 26 18

232
Malignant melanoma: recurrent/metastatic
Characteristics of the sample
Version of the QLQ-C30 N (%)
v 1.0 1 0 v +3 0 0 v 2.0 370 96 v 3.0 16 4 Total 387
Age N (%)
<40 75 19 40-49 114 30 50-59 107 28 60-69 75 19 70-79 14 4 80+ 2 1 Not known 0 0 Total 387
Gender N (%)
Male 220 57 Female 167 43 Not known 0 0 Total 387
Constructed scales Mean (SD) Median [IQR]
Global health status/QoL QL 63.4 (23.2) 66.7 [50-83.3]
Physical functioning PF Previous version of this scale used Role Functioning RF 66.0 (33.6) 66.7 [33.3-100] Emotional functioning EF 67.5 (23.3) 66.7 [50-83.3] Cognitive functioning CF 85.7 (20.6) 100 [83.3-100] Social functioning SF 71.3 (30) 83.3 [50-100]
Fatigue FA 33.3 (27.9) 33.3 [11.1-55.6] Nausea and vomiting NV 10.7 (19.8) 0 [0-16.7] Pain PA 23.5 (30) 16.7 [0-33.3] Dyspnoea DY 18.7 (27.7) 0 [0-33.3] Insomnia SL 29.3 (32) 33.3 [0-66.7] Appetite loss AP 23.4 (32.6) 0 [0-33.3] Constipation CO 12.9 (25.7) 0 [0-0] Diarrhoea DI 6.7 (17.6) 0 [0-0] Financial difficulties FI 16.6 (28) 0 [0-33.3]

233
Malignant melanoma: recurrent/metastatic Constructed scales QL N (%) CF N (%) 0 10 3 0 3 1 8.3 1 0 16.7 2 1 16.7 6 2 33.3 15 4 25 12 3 50 20 5 33.3 28 7 66.7 53 14 41.7 23 6 83.3 75 20 50 45 12 100 215 56 58.3 37 10 Total 383 66.7 60 16 75 36 10 83.3 82 22 91.7 12 3 SF N (%) 100 27 7 0 20 5 Total 379 16.7 13 3 33.3 39 10 PF 50 38 10 Previous version of this scale used 66.7 71 19 83.3 58 15 100 141 37 Total 380 FA N (%) 0 76 20 11.1 48 13 22.2 60 16 33.3 64 17 44.4 35 9 55.6 28 7 66.7 33 9 77.8 11 3 88.9 12 3 100 15 4 RF N (%) Total 382 0 34 9 16.7 21 6 33.3 47 13 50 29 8 NV N (%) 66.7 75 20 0 264 69 83.3 34 9 16.7 53 14 100 136 36 33.3 36 9 Total 376 50 14 4 66.7 9 2 EF N (%) 83.3 5 1 0 4 1 100 3 1 8.3 4 1 Total 384 16.7 5 1 25 12 3 33.3 18 5 41.7 32 9 PA N (%) 50 24 6 0 188 49 58.3 34 9 16.7 48 13 66.7 59 16 33.3 55 14 75 52 14 50 33 9 83.3 44 12 66.7 23 6 91.7 46 12 83.3 15 4 100 40 11 100 19 5 Total 374 Total 381
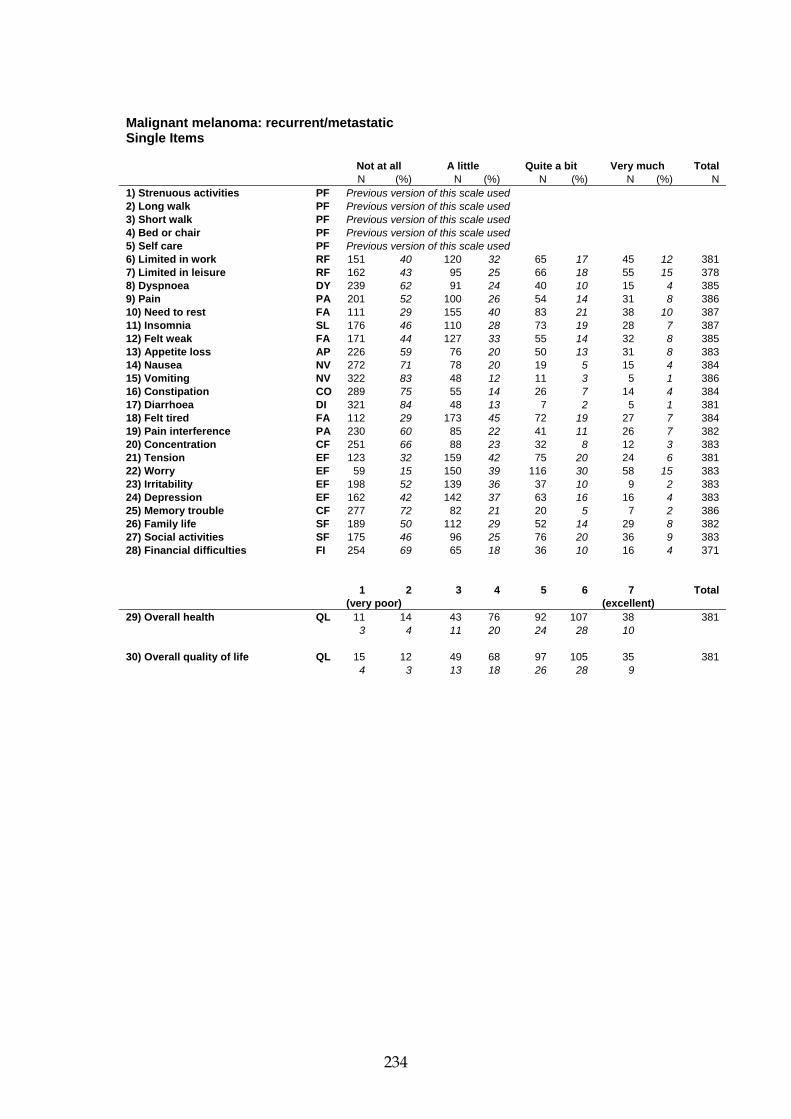
234
Malignant melanoma: recurrent/metastatic Single Items Not at all A little Quite a bit Very much Total N (%) N (%) N (%) N (%) N 1) Strenuous activities PF Previous version of this scale used 2) Long walk PF Previous version of this scale used 3) Short walk PF Previous version of this scale used 4) Bed or chair PF Previous version of this scale used 5) Self care PF Previous version of this scale used 6) Limited in work RF 151 40 120 32 65 17 45 12 381 7) Limited in leisure RF 162 43 95 25 66 18 55 15 378 8) Dyspnoea DY 239 62 91 24 40 10 15 4 385 9) Pain PA 201 52 100 26 54 14 31 8 386 10) Need to rest FA 111 29 155 40 83 21 38 10 387 11) Insomnia SL 176 46 110 28 73 19 28 7 387 12) Felt weak FA 171 44 127 33 55 14 32 8 385 13) Appetite loss AP 226 59 76 20 50 13 31 8 383 14) Nausea NV 272 71 78 20 19 5 15 4 384 15) Vomiting NV 322 83 48 12 11 3 5 1 386 16) Constipation CO 289 75 55 14 26 7 14 4 384 17) Diarrhoea DI 321 84 48 13 7 2 5 1 381 18) Felt tired FA 112 29 173 45 72 19 27 7 384 19) Pain interference PA 230 60 85 22 41 11 26 7 382 20) Concentration CF 251 66 88 23 32 8 12 3 383 21) Tension EF 123 32 159 42 75 20 24 6 381 22) Worry EF 59 15 150 39 116 30 58 15 383 23) Irritability EF 198 52 139 36 37 10 9 2 383 24) Depression EF 162 42 142 37 63 16 16 4 383 25) Memory trouble CF 277 72 82 21 20 5 7 2 386 26) Family life SF 189 50 112 29 52 14 29 8 382 27) Social activities SF 175 46 96 25 76 20 36 9 383 28) Financial difficulties FI 254 69 65 18 36 10 16 4 371 1 2 3 4 5 6 7 Total (very poor) (excellent) 29) Overall health QL 11 14 43 76 92 107 38 381 3 4 11 20 24 28 10 30) Overall quality of life QL 15 12 49 68 97 105 35 381 4 3 13 18 26 28 9

235
Myeloma: all stages
Characteristics of the sample
Version of the QLQ-C30 N (%)
v 1.0 744 79 v +3 0 0 v 2.0 2 0 v 3.0 198 21 Total 944
Age N (%)
<40 15 2 40-49 106 11 50-59 314 33 60-69 264 28 70-79 226 24 80+ 17 2 Not known 2 0 Total 944
Gender
N (%) Male 561 59 Female 381 40 Not known 2 0 Total 944 Stage
N (%) Stage I-II 295 31 Stage III-IV 647 69 Recurrent/metastatic 2 0 Not known 0 0 Total 944
Constructed scales Mean (SD) Median [IQR]
Global health status/QoL QL 55.7 (22.8) 58.3 [41.7-75]
Physical functioning PF 67.7 (23.4) 73.3 [53.3-86.7] Role Functioning RF 60.1 (33.4) 66.7 [33.3-83.3] Emotional functioning EF 71.3 (22.7) 75 [58.3-91.7] Cognitive functioning CF 78.1 (23.8) 83.3 [66.7-100] Social functioning SF 63.2 (31) 66.7 [33.3-83.3]
Fatigue FA 48.7 (26.7) 44.4 [33.3-66.7] Nausea and vomiting NV 10.5 (19.2) 0 [0-16.7] Pain PA 47.1 (33.6) 50 [16.7-66.7] Dyspnoea DY 26.0 (27.3) 33.3 [0-33.3] Insomnia SL 28.9 (30.6) 33.3 [0-33.3] Appetite loss AP 23.2 (30.2) 0 [0-33.3] Constipation CO 23.2 (29.9) 0 [0-33.3] Diarrhoea DI 9.6 (19.4) 0 [0-0] Financial difficulties FI 16.1 (26.6) 0 [0-33.3]

236
Myeloma: all stages Constructed scales QL N (%) CF N (%) 0 5 3 0 16 2 8.3 0 0 16.7 15 2 16.7 9 5 33.3 56 6 25 6 3 50 80 9 33.3 28 14 66.7 175 19 41.7 18 9 83.3 241 26 50 33 17 100 352 38 58.3 16 8 Total 935 66.7 31 16 75 15 8 83.3 24 12 91.7 9 5 SF N (%) 100 5 3 0 73 8 Total 199 16.7 45 5 33.3 117 13 PF N (%) 50 115 13 0 0 0 66.7 199 22 6.7 1 1 83.3 138 15 13.3 3 2 100 223 25 20 5 3 Total 910 26.7 4 2 33.3 10 5 40 9 5 46.7 15 8 FA N (%) 53.3 13 7 0 56 6 60 15 8 11.1 57 6 66.7 18 9 22.2 67 7 73.3 19 10 33.3 202 22 80 18 9 44.4 126 14 86.7 25 13 55.6 107 12 93.3 15 8 66.7 126 14 100 21 11 77.8 68 7 Total 191 88.9 57 6 100 59 6 RF N (%) Total 925 0 24 12 16.7 11 6 33.3 28 14 50 16 8 NV N (%) 66.7 45 23 0 618 67 83.3 28 14 16.7 170 18 100 47 24 33.3 79 9 Total 199 50 24 3 66.7 21 2 EF N (%) 83.3 8 1 0 3 0 100 10 1 8.3 11 1 Total 930 16.7 14 2 25 25 3 33.3 43 5 41.7 36 4 PA N (%) 50 51 6 0 167 18 58.3 84 9 16.7 111 12 66.7 135 15 33.3 170 18 75 134 15 50 92 10 83.3 128 14 66.7 158 17 91.7 107 12 83.3 105 11 100 144 16 100 121 13 Total 915 Total 924

237
Myeloma: all stages Single Items Not at all A little Quite a bit Very much Total N (%) N (%) N (%) N (%) N 1) Strenuous activities PF 30 15 68 35 46 24 51 26 195 2) Long walk PF 42 22 52 27 47 24 54 28 195 3) Short walk PF 110 56 57 29 21 11 9 5 197 4) Bed or chair PF 88 45 65 33 33 17 9 5 195 5) Self care PF 172 88 19 10 3 2 2 1 196 6) Limited in work RF 66 33 65 33 35 18 33 17 199 7) Limited in leisure RF 60 30 63 32 48 24 28 14 199 8) Dyspnoea DY 406 43 367 39 130 14 35 4 938 9) Pain PA 184 20 305 33 266 28 183 20 938 10) Need to rest FA 104 11 363 39 320 34 153 16 940 11) Insomnia SL 395 42 344 37 131 14 70 7 940 12) Felt weak FA 165 18 385 41 247 26 140 15 937 13) Appetite loss AP 512 54 264 28 105 11 60 6 941 14) Nausea NV 632 67 216 23 65 7 24 3 937 15) Vomiting NV 809 87 90 10 25 3 10 1 934 16) Constipation CO 502 54 271 29 105 11 57 6 935 17) Diarrhoea DI 709 77 172 19 32 4 10 1 923 18) Felt tired FA 125 13 396 42 288 31 124 13 933 19) Pain interference PA 280 30 236 25 230 25 184 20 930 20) Concentration CF 508 54 262 28 118 13 47 5 935 21) Tension EF 359 39 377 41 145 16 49 5 930 22) Worry EF 263 28 405 44 187 20 75 8 930 23) Irritability EF 503 54 331 35 81 9 20 2 935 24) Depression EF 335 36 399 43 144 16 53 6 931 25) Memory trouble CF 494 53 325 35 95 10 25 3 939 26) Family life SF 366 40 308 34 156 17 87 10 917 27) Social activities SF 287 31 267 29 217 24 153 17 924 28) Financial difficulties FI 627 67 192 21 77 8 34 4 930 1 2 3 4 5 6 7 Total (very poor) (excellent) 29) Overall health QL 7 12 43 44 56 32 5 199 4 6 22 22 28 16 3 30) Overall quality of life QL 67 92 172 223 195 109 63 921 7 10 19 24 21 12 7

238
Myeloma: stage I-II
Characteristics of the sample
Version of the QLQ-C30 N (%)
v 1.0 295 100 v +3 0 0 v 2.0 0 0 v 3.0 0 0 Total 295
Age N (%)
<40 3 1 40-49 27 9 50-59 92 31 60-69 89 30 70-79 80 27 80+ 4 1 Not known 0 0 Total 295
Gender N (%)
Male 172 58 Female 123 42 Not known 0 0 Total 295
Constructed scales Mean (SD) Median [IQR]
Global health status/QoL QL Previous version of this scale used
Physical functioning PF Previous version of this scale used Role Functioning RF Previous version of this scale used Emotional functioning EF 71.1 (22.7) 75 [58.3-91.7] Cognitive functioning CF 81.1 (22.5) 83.3 [66.7-100] Social functioning SF 68.6 (30.1) 66.7 [50-100]
Fatigue FA 44.1 (26.5) 44.4 [22.2-66.7] Nausea and vomiting NV 9.9 (17.8) 0 [0-16.7] Pain PA 43.1 (32.9) 33.3 [16.7-66.7] Dyspnoea DY 24.8 (26.5) 33.3 [0-33.3] Insomnia SL 28.0 (30.7) 33.3 [0-33.3] Appetite loss AP 21.3 (29.4) 0 [0-33.3] Constipation CO 22.5 (30) 0 [0-33.3] Diarrhoea DI 10.0 (20.8) 0 [0-0] Financial difficulties FI 12.9 (23.5) 0 [0-33.3]

239
Myeloma: stage I-II Constructed scales QL CF N (%) Previous version of this scale used 0 6 2 16.7 2 1 33.3 11 4 50 19 7 66.7 55 19 83.3 75 26 100 125 43 Total 293 SF N (%) 0 17 6 16.7 15 5 33.3 25 9 PF 50 28 10 Previous version of this scale used 66.7 69 24 83.3 43 15 100 91 32 Total 288 FA N (%) 0 22 8 11.1 29 10 22.2 23 8 33.3 69 24 44.4 29 10 55.6 39 13 66.7 35 12 77.8 15 5 88.9 19 7 100 10 3 RF Total 290 Previous version of this scale used NV N (%) 0 193 67 16.7 53 18 33.3 26 9 50 9 3 66.7 6 2 EF N (%) 83.3 1 0 0 1 0 100 2 1 8.3 3 1 Total 290 16.7 4 1 25 10 4 33.3 14 5 41.7 9 3 PA N (%) 50 17 6 0 62 22 58.3 27 9 16.7 30 10 66.7 39 14 33.3 64 22 75 45 16 50 29 10 83.3 43 15 66.7 51 18 91.7 30 11 83.3 20 7 100 45 16 100 33 11 Total 287 Total 289

240
Myeloma: stage I-II Single Items Not at all A little Quite a bit Very much Total N (%) N (%) N (%) N (%) N 1) Strenuous activities PF Previous version of this scale used 2) Long walk PF Previous version of this scale used 3) Short walk PF Previous version of this scale used 4) Bed or chair PF Previous version of this scale used 5) Self care PF Previous version of this scale used 6) Limited in work RF Previous version of this scale used 7) Limited in leisure RF Previous version of this scale used 8) Dyspnoea DY 129 44 122 42 32 11 11 4 294 9) Pain PA 65 22 105 36 78 27 45 15 293 10) Need to rest FA 45 15 120 41 95 32 35 12 295 11) Insomnia SL 130 44 104 35 39 13 22 8 295 12) Felt weak FA 63 22 124 43 71 24 34 12 292 13) Appetite loss AP 168 57 82 28 26 9 18 6 294 14) Nausea NV 198 68 66 23 22 8 6 2 292 15) Vomiting NV 253 87 33 11 4 1 2 1 292 16) Constipation CO 164 56 76 26 35 12 17 6 292 17) Diarrhoea DI 224 77 50 17 11 4 5 2 290 18) Felt tired FA 53 18 128 44 78 27 32 11 291 19) Pain interference PA 94 32 83 29 66 23 48 17 291 20) Concentration CF 171 58 81 28 27 9 14 5 293 21) Tension EF 108 37 121 42 43 15 18 6 290 22) Worry EF 85 29 121 42 64 22 20 7 290 23) Irritability EF 165 56 97 33 23 8 8 3 293 24) Depression EF 99 34 125 43 48 17 19 7 291 25) Memory trouble CF 170 58 98 33 18 6 7 2 293 26) Family life SF 135 47 100 35 32 11 22 8 289 27) Social activities SF 115 40 80 28 56 19 40 14 291 28) Financial difficulties FI 211 72 58 20 17 6 7 2 293 1 2 3 4 5 6 7 Total (very poor) (excellent) 29) Overall health QL Previous version of this scale used 30) Overall quality of life QL 21 27 46 65 63 44 21 287 7 9 16 23 22 15 7

241
Myeloma: stage III-IV
Characteristics of the sample
Version of the QLQ-C30 N (%)
v 1.0 449 69 v +3 0 0 v 2.0 0 0 v 3.0 198 31 Total 647
Age N (%)
<40 12 2 40-49 79 12 50-59 222 34 60-69 174 27 70-79 145 22 80+ 13 2 Not known 2 0 Total 647
Gender N (%)
Male 388 60 Female 257 40 Not known 2 0 Total 647
Constructed scales Mean (SD) Median [IQR]
Global health status/QoL QL 55.8 (22.9) 58.3 [41.7-75]
Physical functioning PF 67.7 (23.4) 73.3 [53.3-86.7] Role Functioning RF 60.7 (33) 66.7 [33.3-83.3] Emotional functioning EF 71.5 (22.7) 75 [58.3-91.7] Cognitive functioning CF 76.9 (24.2) 83.3 [66.7-100] Social functioning SF 60.8 (31) 66.7 [33.3-83.3]
Fatigue FA 50.7 (26.6) 44.4 [33.3-66.7] Nausea and vomiting NV 10.7 (19.8) 0 [0-16.7] Pain PA 48.8 (33.8) 50 [16.7-83.3] Dyspnoea DY 26.3 (27.4) 33.3 [0-33.3] Insomnia SL 29.4 (30.5) 33.3 [0-33.3] Appetite loss AP 23.9 (30.4) 0 [0-33.3] Constipation CO 23.6 (29.8) 0 [0-33.3] Diarrhoea DI 9.5 (18.8) 0 [0-0] Financial difficulties FI 17.6 (27.8) 0 [0-33.3]
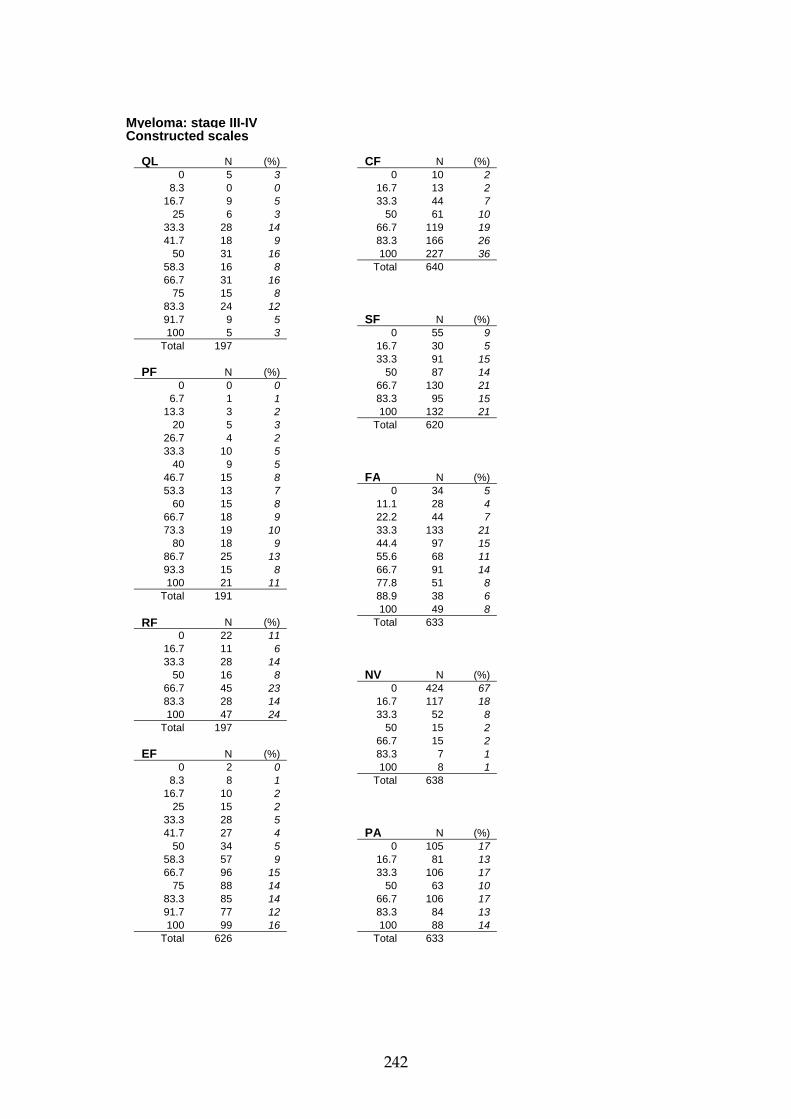
242
Myeloma: stage III-IV Constructed scales QL N (%) CF N (%) 0 5 3 0 10 2 8.3 0 0 16.7 13 2 16.7 9 5 33.3 44 7 25 6 3 50 61 10 33.3 28 14 66.7 119 19 41.7 18 9 83.3 166 26 50 31 16 100 227 36 58.3 16 8 Total 640 66.7 31 16 75 15 8 83.3 24 12 91.7 9 5 SF N (%) 100 5 3 0 55 9 Total 197 16.7 30 5 33.3 91 15 PF N (%) 50 87 14 0 0 0 66.7 130 21 6.7 1 1 83.3 95 15 13.3 3 2 100 132 21 20 5 3 Total 620 26.7 4 2 33.3 10 5 40 9 5 46.7 15 8 FA N (%) 53.3 13 7 0 34 5 60 15 8 11.1 28 4 66.7 18 9 22.2 44 7 73.3 19 10 33.3 133 21 80 18 9 44.4 97 15 86.7 25 13 55.6 68 11 93.3 15 8 66.7 91 14 100 21 11 77.8 51 8 Total 191 88.9 38 6 100 49 8 RF N (%) Total 633 0 22 11 16.7 11 6 33.3 28 14 50 16 8 NV N (%) 66.7 45 23 0 424 67 83.3 28 14 16.7 117 18 100 47 24 33.3 52 8 Total 197 50 15 2 66.7 15 2 EF N (%) 83.3 7 1 0 2 0 100 8 1 8.3 8 1 Total 638 16.7 10 2 25 15 2 33.3 28 5 41.7 27 4 PA N (%) 50 34 5 0 105 17 58.3 57 9 16.7 81 13 66.7 96 15 33.3 106 17 75 88 14 50 63 10 83.3 85 14 66.7 106 17 91.7 77 12 83.3 84 13 100 99 16 100 88 14 Total 626 Total 633

243
Myeloma: stage III-IV Single Items Not at all A little Quite a bit Very much Total N (%) N (%) N (%) N (%) N 1) Strenuous activities PF 30 15 68 35 46 24 51 26 195 2) Long walk PF 42 22 52 27 47 24 54 28 195 3) Short walk PF 110 56 57 29 21 11 9 5 197 4) Bed or chair PF 88 45 65 33 33 17 9 5 195 5) Self care PF 172 88 19 10 3 2 2 1 196 6) Limited in work RF 66 34 65 33 35 18 31 16 197 7) Limited in leisure RF 60 31 63 32 48 24 26 13 197 8) Dyspnoea DY 277 43 245 38 98 15 22 3 642 9) Pain PA 119 19 200 31 187 29 137 21 643 10) Need to rest FA 59 9 243 38 224 35 117 18 643 11) Insomnia SL 263 41 240 37 92 14 48 8 643 12) Felt weak FA 102 16 261 41 174 27 106 17 643 13) Appetite loss AP 343 53 182 28 79 12 41 6 645 14) Nausea NV 433 67 149 23 43 7 18 3 643 15) Vomiting NV 555 87 56 9 21 3 8 1 640 16) Constipation CO 337 53 195 30 69 11 40 6 641 17) Diarrhoea DI 483 77 122 19 21 3 5 1 631 18) Felt tired FA 72 11 268 42 209 33 91 14 640 19) Pain interference PA 186 29 153 24 162 25 136 21 637 20) Concentration CF 337 53 181 28 89 14 33 5 640 21) Tension EF 250 39 256 40 101 16 31 5 638 22) Worry EF 177 28 284 45 123 19 54 9 638 23) Irritability EF 338 53 232 36 58 9 12 2 640 24) Depression EF 236 37 274 43 94 15 34 5 638 25) Memory trouble CF 323 50 227 35 76 12 18 3 644 26) Family life SF 231 37 208 33 123 20 64 10 626 27) Social activities SF 172 27 187 30 160 25 112 18 631 28) Financial difficulties FI 414 65 134 21 60 9 27 4 635 1 2 3 4 5 6 7 Total (very poor) (excellent) 29) Overall health QL 7 12 42 43 56 32 5 197 4 6 21 22 28 16 3 30) Overall quality of life QL 46 65 126 157 131 65 42 632 7 10 20 25 21 10 7

244
Oesophageal cancer
Characteristics of the sample
Version of the QLQ-C30 N (%)
v 1.0 56 5 v +3 0 0 v 2.0 71 7 v 3.0 904 88 Total 1,031
Age N (%)
<40 9 1 40-49 101 10 50-59 237 23 60-69 346 34 70-79 270 26 80+ 68 7 Not known 0 0 Total 1,031
Gender
N (%) Male 772 75 Female 248 24 Not known 11 1 Total 1,031 Stage
N (%) Stage I-II 118 11 Stage III-IV 47 5 Recurrent/metastatic 347 34 Not known 519 50 Total 1,031
Constructed scales Mean (SD) Median [IQR]
Global health status/QoL QL 55.6 (24.1) 50 [41.7-75]
Physical functioning PF 77.3 (23.9) 86.7 [66.7-93.3] Role Functioning RF 69.0 (33.5) 83.3 [50-100] Emotional functioning EF 70.6 (24.2) 75 [58.3-91.7] Cognitive functioning CF 83.3 (21.5) 83.3 [66.7-100] Social functioning SF 75.6 (28) 83.3 [66.7-100]
Fatigue FA 36.6 (26.6) 33.3 [22.2-55.6] Nausea and vomiting NV 16.8 (23.3) 0 [0-33.3] Pain PA 26.5 (27) 16.7 [0-33.3] Dyspnoea DY 19.2 (27.3) 0 [0-33.3] Insomnia SL 29.8 (32.8) 33.3 [0-66.7] Appetite loss AP 33.7 (37.4) 33.3 [0-66.7] Constipation CO 25.5 (31.1) 0 [0-33.3] Diarrhoea DI 7.3 (18.9) 0 [0-0] Financial difficulties FI 15.4 (27.7) 0 [0-33.3]
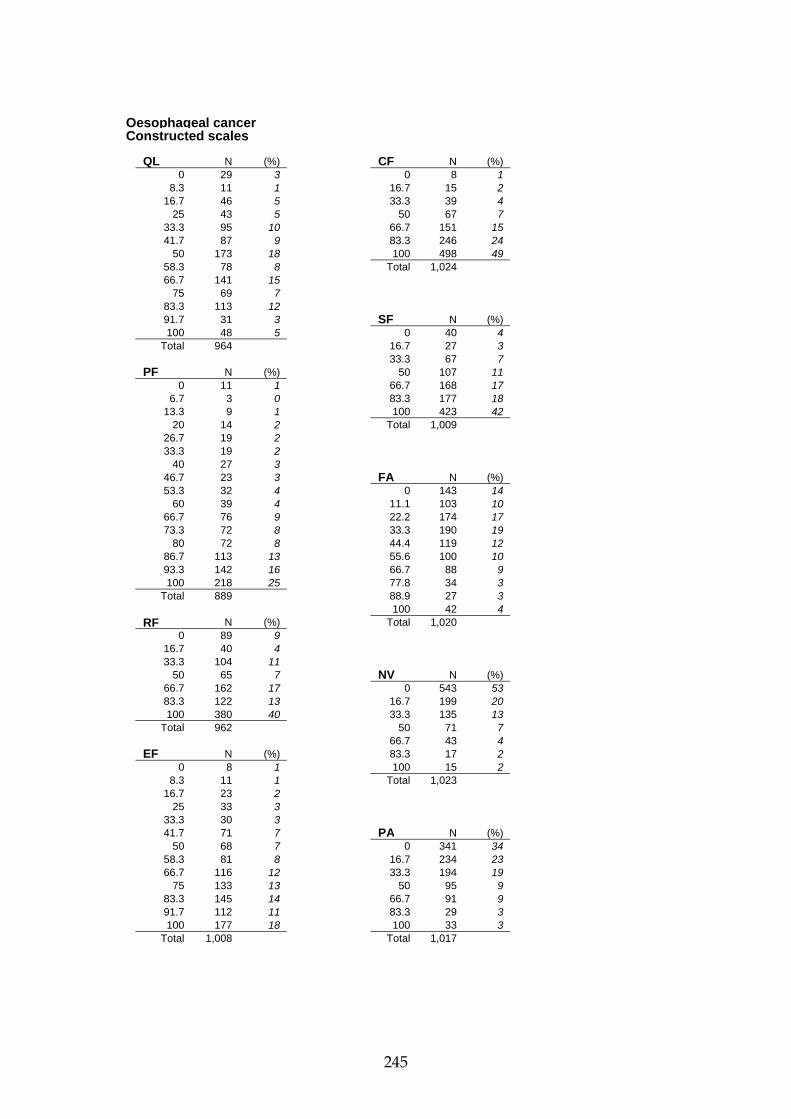
245
Oesophageal cancer Constructed scales QL N (%) CF N (%) 0 29 3 0 8 1 8.3 11 1 16.7 15 2 16.7 46 5 33.3 39 4 25 43 5 50 67 7 33.3 95 10 66.7 151 15 41.7 87 9 83.3 246 24 50 173 18 100 498 49 58.3 78 8 Total 1,024 66.7 141 15 75 69 7 83.3 113 12 91.7 31 3 SF N (%) 100 48 5 0 40 4 Total 964 16.7 27 3 33.3 67 7 PF N (%) 50 107 11 0 11 1 66.7 168 17 6.7 3 0 83.3 177 18 13.3 9 1 100 423 42 20 14 2 Total 1,009 26.7 19 2 33.3 19 2 40 27 3 46.7 23 3 FA N (%) 53.3 32 4 0 143 14 60 39 4 11.1 103 10 66.7 76 9 22.2 174 17 73.3 72 8 33.3 190 19 80 72 8 44.4 119 12 86.7 113 13 55.6 100 10 93.3 142 16 66.7 88 9 100 218 25 77.8 34 3 Total 889 88.9 27 3 100 42 4 RF N (%) Total 1,020 0 89 9 16.7 40 4 33.3 104 11 50 65 7 NV N (%) 66.7 162 17 0 543 53 83.3 122 13 16.7 199 20 100 380 40 33.3 135 13 Total 962 50 71 7 66.7 43 4 EF N (%) 83.3 17 2 0 8 1 100 15 2 8.3 11 1 Total 1,023 16.7 23 2 25 33 3 33.3 30 3 41.7 71 7 PA N (%) 50 68 7 0 341 34 58.3 81 8 16.7 234 23 66.7 116 12 33.3 194 19 75 133 13 50 95 9 83.3 145 14 66.7 91 9 91.7 112 11 83.3 29 3 100 177 18 100 33 3 Total 1,008 Total 1,017
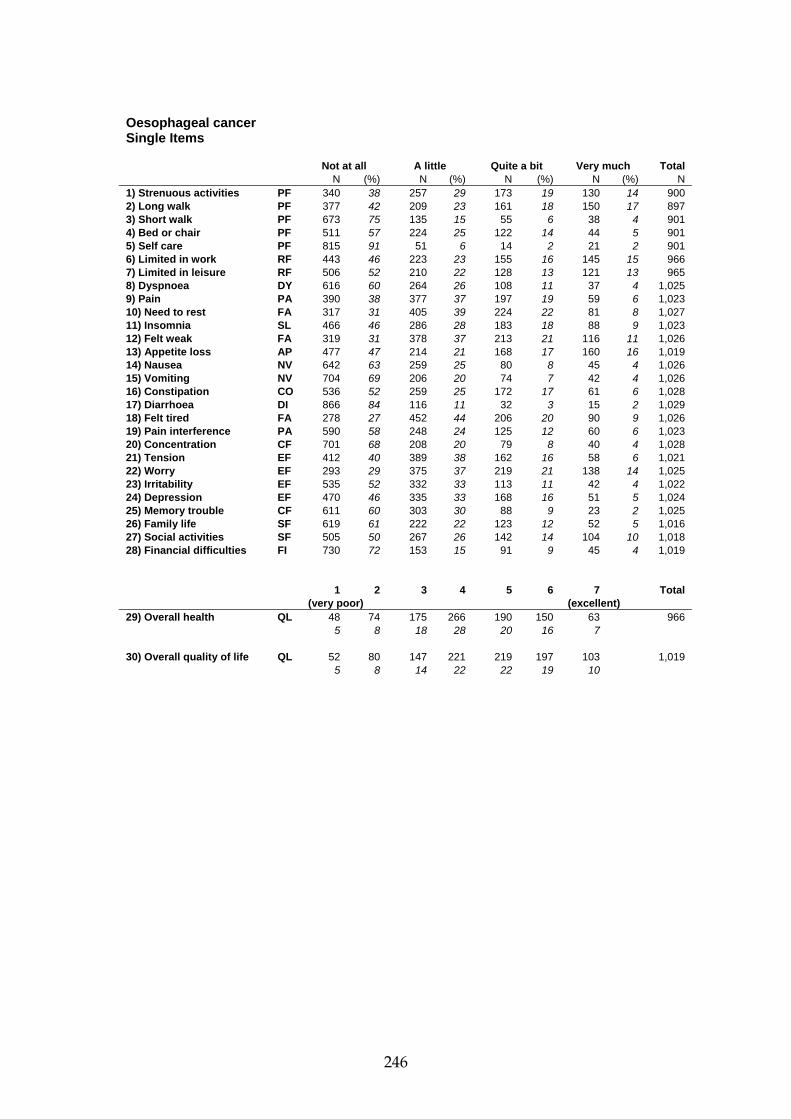
246
Oesophageal cancer Single Items Not at all A little Quite a bit Very much Total N (%) N (%) N (%) N (%) N 1) Strenuous activities PF 340 38 257 29 173 19 130 14 900 2) Long walk PF 377 42 209 23 161 18 150 17 897 3) Short walk PF 673 75 135 15 55 6 38 4 901 4) Bed or chair PF 511 57 224 25 122 14 44 5 901 5) Self care PF 815 91 51 6 14 2 21 2 901 6) Limited in work RF 443 46 223 23 155 16 145 15 966 7) Limited in leisure RF 506 52 210 22 128 13 121 13 965 8) Dyspnoea DY 616 60 264 26 108 11 37 4 1,025 9) Pain PA 390 38 377 37 197 19 59 6 1,023 10) Need to rest FA 317 31 405 39 224 22 81 8 1,027 11) Insomnia SL 466 46 286 28 183 18 88 9 1,023 12) Felt weak FA 319 31 378 37 213 21 116 11 1,026 13) Appetite loss AP 477 47 214 21 168 17 160 16 1,019 14) Nausea NV 642 63 259 25 80 8 45 4 1,026 15) Vomiting NV 704 69 206 20 74 7 42 4 1,026 16) Constipation CO 536 52 259 25 172 17 61 6 1,028 17) Diarrhoea DI 866 84 116 11 32 3 15 2 1,029 18) Felt tired FA 278 27 452 44 206 20 90 9 1,026 19) Pain interference PA 590 58 248 24 125 12 60 6 1,023 20) Concentration CF 701 68 208 20 79 8 40 4 1,028 21) Tension EF 412 40 389 38 162 16 58 6 1,021 22) Worry EF 293 29 375 37 219 21 138 14 1,025 23) Irritability EF 535 52 332 33 113 11 42 4 1,022 24) Depression EF 470 46 335 33 168 16 51 5 1,024 25) Memory trouble CF 611 60 303 30 88 9 23 2 1,025 26) Family life SF 619 61 222 22 123 12 52 5 1,016 27) Social activities SF 505 50 267 26 142 14 104 10 1,018 28) Financial difficulties FI 730 72 153 15 91 9 45 4 1,019 1 2 3 4 5 6 7 Total (very poor) (excellent) 29) Overall health QL 48 74 175 266 190 150 63 966 5 8 18 28 20 16 7 30) Overall quality of life QL 52 80 147 221 219 197 103 1,019 5 8 14 22 22 19 10

247
Oesophageal cancer: males
Characteristics of the sample
Version of the QLQ-C30 N (%)
v 1.0 51 7 v +3 0 0 v 2.0 58 8 v 3.0 663 86 Total 772
Age N (%)
<40 8 1 40-49 79 10 50-59 182 24 60-69 280 36 70-79 178 23 80+ 45 6 Not known 0 0 Total 772
Stage N (%)
Stage I-II 78 10 Stage III-IV 32 4 Recurrent/metastatic 268 35 Not known 394 51 Total 772
Constructed scales Mean (SD) Median [IQR]
Global health status/QoL QL 57.4 (23.5) 58.3 [41.7-75]
Physical functioning PF 80.0 (22.8) 86.7 [66.7-100] Role Functioning RF 71.3 (32.9) 83.3 [50-100] Emotional functioning EF 72.3 (23.2) 75 [58.3-91.7] Cognitive functioning CF 84.5 (20.3) 100 [66.7-100] Social functioning SF 76.8 (27.5) 83.3 [66.7-100]
Fatigue FA 34.1 (26.4) 33.3 [11.1-55.6] Nausea and vomiting NV 15.8 (22.8) 0 [0-33.3] Pain PA 25.0 (26.5) 16.7 [0-33.3] Dyspnoea DY 18.5 (26.6) 0 [0-33.3] Insomnia SL 28.9 (32.8) 33.3 [0-66.7] Appetite loss AP 32.0 (37.2) 33.3 [0-66.7] Constipation CO 23.8 (30.6) 0 [0-33.3] Diarrhoea DI 7.0 (18.2) 0 [0-0] Financial difficulties FI 14.9 (27.6) 0 [0-33.3]

248
Oesophageal cancer: males Constructed scales QL N (%) CF N (%) 0 17 2 0 5 1 8.3 7 1 16.7 7 1 16.7 28 4 33.3 26 3 25 28 4 50 44 6 33.3 65 9 66.7 110 14 41.7 60 8 83.3 190 25 50 128 18 100 384 50 58.3 60 8 Total 766 66.7 118 17 75 50 7 83.3 86 12 91.7 28 4 SF N (%) 100 37 5 0 26 3 Total 712 16.7 19 3 33.3 55 7 PF N (%) 50 69 9 0 7 1 66.7 119 16 6.7 2 0 83.3 136 18 13.3 5 1 100 333 44 20 5 1 Total 757 26.7 11 2 33.3 19 3 40 13 2 46.7 15 2 FA N (%) 53.3 20 3 0 123 16 60 23 4 11.1 87 11 66.7 52 8 22.2 138 18 73.3 45 7 33.3 150 20 80 51 8 44.4 73 10 86.7 85 13 55.6 66 9 93.3 111 17 66.7 59 8 100 188 29 77.8 20 3 Total 652 88.9 19 3 100 29 4 RF N (%) Total 764 0 62 9 16.7 27 4 33.3 63 9 50 44 6 NV N (%) 66.7 121 17 0 424 55 83.3 94 13 16.7 145 19 100 301 42 33.3 94 12 Total 712 50 50 7 66.7 28 4 EF N (%) 83.3 15 2 0 2 0 100 9 1 8.3 6 1 Total 765 16.7 19 3 25 22 3 33.3 17 2 41.7 48 6 PA N (%) 50 44 6 0 273 36 58.3 61 8 16.7 173 23 66.7 88 12 33.3 142 19 75 111 15 50 66 9 83.3 105 14 66.7 65 9 91.7 89 12 83.3 17 2 100 142 19 100 23 3 Total 754 Total 759

249
Oesophageal cancer: males Single Items Not at all A little Quite a bit Very much Total N (%) N (%) N (%) N (%) N 1) Strenuous activities PF 294 45 177 27 113 17 75 11 659 2) Long walk PF 297 45 167 25 95 14 100 15 659 3) Short walk PF 516 78 88 13 33 5 23 4 660 4) Bed or chair PF 397 60 158 24 77 12 28 4 660 5) Self care PF 605 92 34 5 8 1 14 2 661 6) Limited in work RF 353 49 165 23 103 14 95 13 716 7) Limited in leisure RF 393 55 153 21 83 12 86 12 715 8) Dyspnoea DY 468 61 196 26 81 11 23 3 768 9) Pain PA 315 41 270 35 144 19 36 5 765 10) Need to rest FA 259 34 309 40 147 19 55 7 770 11) Insomnia SL 361 47 211 28 128 17 66 9 766 12) Felt weak FA 268 35 276 36 149 19 76 10 769 13) Appetite loss AP 375 49 159 21 114 15 115 15 763 14) Nausea NV 504 66 173 23 59 8 32 4 768 15) Vomiting NV 537 70 149 19 53 7 29 4 768 16) Constipation CO 420 55 195 25 110 14 45 6 770 17) Diarrhoea DI 651 85 86 11 24 3 9 1 770 18) Felt tired FA 225 29 353 46 132 17 57 7 767 19) Pain interference PA 453 59 181 24 87 11 43 6 764 20) Concentration CF 538 70 148 19 58 8 25 3 769 21) Tension EF 323 42 300 39 109 14 32 4 764 22) Worry EF 234 30 292 38 153 20 90 12 769 23) Irritability EF 395 52 261 34 81 11 26 3 763 24) Depression EF 367 48 257 34 111 15 31 4 766 25) Memory trouble CF 475 62 221 29 56 7 15 2 767 26) Family life SF 472 62 157 21 97 13 35 5 761 27) Social activities SF 398 52 193 25 107 14 64 8 762 28) Financial difficulties FI 551 72 117 15 58 8 36 5 762 1 2 3 4 5 6 7 Total (very poor) (excellent) 29) Overall health QL 32 47 112 200 157 114 52 714 5 7 16 28 22 16 7 30) Overall quality of life QL 30 53 109 166 171 149 83 761 4 7 14 22 23 20 11

250
Oesophageal cancer: females
Characteristics of the sample
Version of the QLQ-C30 N (%)
v 1.0 5 2 v +3 0 0 v 2.0 12 5 v 3.0 231 93 Total 248
Age N (%)
<40 1 0 40-49 21 9 50-59 53 21 60-69 61 25 70-79 90 36 80+ 22 9 Not known 0 0 Total 248
Stage N (%)
Stage I-II 39 16 Stage III-IV 15 6 Recurrent/metastatic 76 31 Not known 118 48 Total 248
Constructed scales Mean (SD) Median [IQR]
Global health status/QoL QL 50.4 (25.3) 50 [33.3-66.7]
Physical functioning PF 69.7 (25.6) 73.3 [53.3-93.3] Role Functioning RF 61.3 (34.5) 66.7 [33.3-100] Emotional functioning EF 65.2 (26.6) 66.7 [41.7-83.3] Cognitive functioning CF 79.4 (24.8) 83.3 [66.7-100] Social functioning SF 71.3 (29.3) 83.3 [50-100]
Fatigue FA 44.4 (25.7) 44.4 [22.2-66.7] Nausea and vomiting NV 20.3 (24.7) 16.7 [0-33.3] Pain PA 31.0 (28) 33.3 [0-50] Dyspnoea DY 21.4 (29.7) 0 [0-33.3] Insomnia SL 32.8 (32.7) 33.3 [0-66.7] Appetite loss AP 38.9 (37.9) 33.3 [0-66.7] Constipation CO 30.4 (32) 33.3 [0-66.7] Diarrhoea DI 8.6 (21.2) 0 [0-0] Financial difficulties FI 16.9 (28.5) 0 [0-33.3]
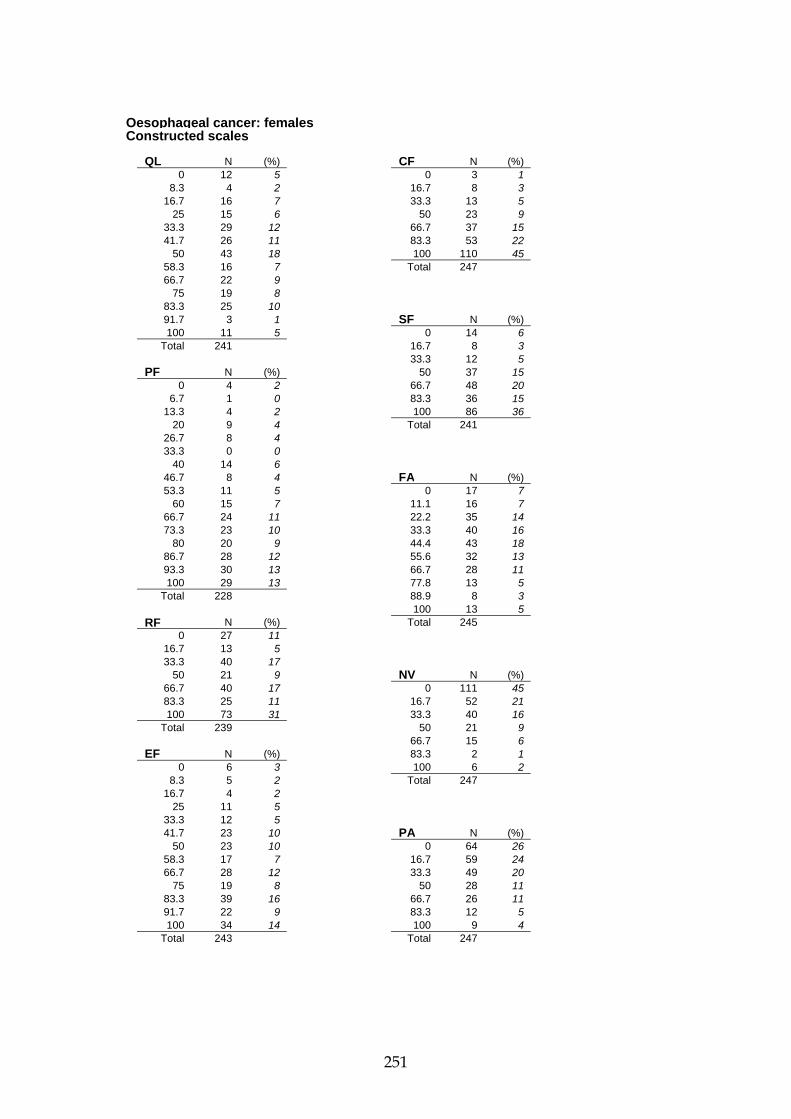
251
Oesophageal cancer: females Constructed scales QL N (%) CF N (%) 0 12 5 0 3 1 8.3 4 2 16.7 8 3 16.7 16 7 33.3 13 5 25 15 6 50 23 9 33.3 29 12 66.7 37 15 41.7 26 11 83.3 53 22 50 43 18 100 110 45 58.3 16 7 Total 247 66.7 22 9 75 19 8 83.3 25 10 91.7 3 1 SF N (%) 100 11 5 0 14 6 Total 241 16.7 8 3 33.3 12 5 PF N (%) 50 37 15 0 4 2 66.7 48 20 6.7 1 0 83.3 36 15 13.3 4 2 100 86 36 20 9 4 Total 241 26.7 8 4 33.3 0 0 40 14 6 46.7 8 4 FA N (%) 53.3 11 5 0 17 7 60 15 7 11.1 16 7 66.7 24 11 22.2 35 14 73.3 23 10 33.3 40 16 80 20 9 44.4 43 18 86.7 28 12 55.6 32 13 93.3 30 13 66.7 28 11 100 29 13 77.8 13 5 Total 228 88.9 8 3 100 13 5 RF N (%) Total 245 0 27 11 16.7 13 5 33.3 40 17 50 21 9 NV N (%) 66.7 40 17 0 111 45 83.3 25 11 16.7 52 21 100 73 31 33.3 40 16 Total 239 50 21 9 66.7 15 6 EF N (%) 83.3 2 1 0 6 3 100 6 2 8.3 5 2 Total 247 16.7 4 2 25 11 5 33.3 12 5 41.7 23 10 PA N (%) 50 23 10 0 64 26 58.3 17 7 16.7 59 24 66.7 28 12 33.3 49 20 75 19 8 50 28 11 83.3 39 16 66.7 26 11 91.7 22 9 83.3 12 5 100 34 14 100 9 4 Total 243 Total 247

252
Oesophageal cancer: females Single Items Not at all A little Quite a bit Very much Total N (%) N (%) N (%) N (%) N 1) Strenuous activities PF 43 19 78 34 56 24 54 23 231 2) Long walk PF 77 34 42 18 61 27 49 21 229 3) Short walk PF 149 65 46 20 21 9 15 7 231 4) Bed or chair PF 109 47 61 26 45 20 16 7 231 5) Self care PF 200 87 17 7 6 3 7 3 230 6) Limited in work RF 83 35 55 23 51 21 50 21 239 7) Limited in leisure RF 105 44 55 23 44 18 35 15 239 8) Dyspnoea DY 143 58 62 25 27 11 14 6 246 9) Pain PA 71 29 104 42 50 20 22 9 247 10) Need to rest FA 55 22 90 37 75 31 26 11 246 11) Insomnia SL 99 40 73 30 53 22 21 9 246 12) Felt weak FA 48 20 100 41 58 24 40 16 246 13) Appetite loss AP 98 40 52 21 53 22 43 18 246 14) Nausea NV 130 53 83 34 21 9 13 5 247 15) Vomiting NV 157 64 56 23 21 9 13 5 247 16) Constipation CO 111 45 61 25 61 25 14 6 247 17) Diarrhoea DI 204 82 30 12 8 3 6 2 248 18) Felt tired FA 49 20 96 39 72 29 31 13 248 19) Pain interference PA 129 52 65 26 38 15 16 7 248 20) Concentration CF 157 63 56 23 20 8 15 6 248 21) Tension EF 88 36 83 34 50 20 25 10 246 22) Worry EF 56 23 79 32 63 26 47 19 245 23) Irritability EF 134 54 67 27 32 13 15 6 248 24) Depression EF 97 39 74 30 56 23 20 8 247 25) Memory trouble CF 130 53 77 31 32 13 8 3 247 26) Family life SF 140 57 61 25 26 11 17 7 244 27) Social activities SF 101 41 70 29 34 14 40 16 245 28) Financial difficulties FI 171 70 34 14 32 13 9 4 246 1 2 3 4 5 6 7 Total (very poor) (excellent) 29) Overall health QL 16 25 62 62 31 34 11 241 7 10 26 26 13 14 5 30) Overall quality of life QL 22 24 38 51 46 46 20 247 9 10 15 21 19 19 8

253
Oesophageal cancer: <50
Characteristics of the sample
Version of the QLQ-C30 N (%)
v 1.0 13 12 v +3 0 0 v 2.0 4 4 v 3.0 93 85 Total 110
Age N (%)
<40 9 8 40-49 101 92 50-59 0 0 60-69 0 0 70-79 0 0 80+ 0 0 Not known 0 0 Total 110
Gender
N (%) Male 87 79 Female 22 20 Not known 1 1 Total 110 Stage
N (%) Stage I-II 16 15 Stage III-IV 7 6 Recurrent/metastatic 28 26 Not known 59 54 Total 110
Constructed scales Mean (SD) Median [IQR]
Global health status/QoL QL Previous version of this scale used
Physical functioning PF Previous version of this scale used Role Functioning RF Previous version of this scale used Emotional functioning EF 62.0 (26.6) 66.7 [50-83.3] Cognitive functioning CF 85.6 (21.8) 100 [83.3-100] Social functioning SF 73.9 (29.9) 83.3 [50-100]
Fatigue FA 34.1 (22.5) 33.3 [22.2-44.4] Nausea and vomiting NV 15.0 (21.7) 0 [0-33.3] Pain PA 33.9 (25.8) 33.3 [16.7-50] Dyspnoea DY 13.9 (21.4) 0 [0-33.3] Insomnia SL 36.7 (36.4) 33.3 [0-66.7] Appetite loss AP 30.9 (35.8) 33.3 [0-66.7] Constipation CO 22.0 (28.4) 0 [0-33.3] Diarrhoea DI 6.4 (17.2) 0 [0-0] Financial difficulties FI 21.2 (30.2) 0 [0-33.3]
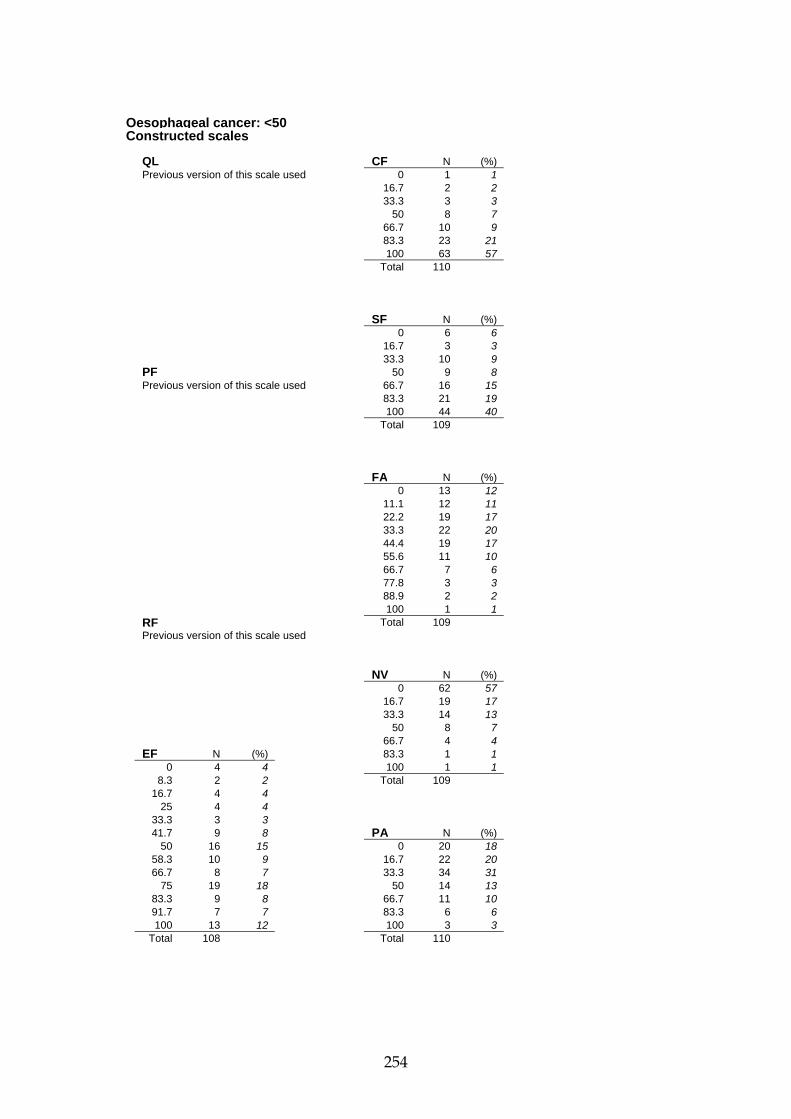
254
Oesophageal cancer: <50 Constructed scales QL CF N (%) Previous version of this scale used 0 1 1 16.7 2 2 33.3 3 3 50 8 7 66.7 10 9 83.3 23 21 100 63 57 Total 110 SF N (%) 0 6 6 16.7 3 3 33.3 10 9 PF 50 9 8 Previous version of this scale used 66.7 16 15 83.3 21 19 100 44 40 Total 109 FA N (%) 0 13 12 11.1 12 11 22.2 19 17 33.3 22 20 44.4 19 17 55.6 11 10 66.7 7 6 77.8 3 3 88.9 2 2 100 1 1 RF Total 109 Previous version of this scale used NV N (%) 0 62 57 16.7 19 17 33.3 14 13 50 8 7 66.7 4 4 EF N (%) 83.3 1 1 0 4 4 100 1 1 8.3 2 2 Total 109 16.7 4 4 25 4 4 33.3 3 3 41.7 9 8 PA N (%) 50 16 15 0 20 18 58.3 10 9 16.7 22 20 66.7 8 7 33.3 34 31 75 19 18 50 14 13 83.3 9 8 66.7 11 10 91.7 7 7 83.3 6 6 100 13 12 100 3 3 Total 108 Total 110

255
Oesophageal cancer: <50 Single Items Not at all A little Quite a bit Very much Total N (%) N (%) N (%) N (%) N 1) Strenuous activities PF Previous version of this scale used 2) Long walk PF Previous version of this scale used 3) Short walk PF Previous version of this scale used 4) Bed or chair PF Previous version of this scale used 5) Self care PF Previous version of this scale used 6) Limited in work RF Previous version of this scale used 7) Limited in leisure RF Previous version of this scale used 8) Dyspnoea DY 72 66 31 28 6 6 1 1 110 9) Pain PA 28 26 41 37 31 28 10 9 110 10) Need to rest FA 39 36 44 40 19 17 8 7 110 11) Insomnia SL 43 39 30 27 20 18 17 16 110 12) Felt weak FA 30 27 50 46 20 18 10 9 110 13) Appetite loss AP 52 47 29 26 14 13 15 14 110 14) Nausea NV 73 66 26 24 7 6 4 4 110 15) Vomiting NV 74 68 25 23 7 6 3 3 109 16) Constipation CO 59 54 33 30 12 11 5 5 109 17) Diarrhoea DI 94 86 12 11 3 3 1 1 110 18) Felt tired FA 31 28 50 46 19 17 9 8 109 19) Pain interference PA 45 41 45 41 14 13 6 6 110 20) Concentration CF 78 71 20 18 6 6 6 5 110 21) Tension EF 31 28 46 42 22 20 11 10 110 22) Worry EF 22 20 35 32 28 26 25 23 110 23) Irritability EF 45 42 34 32 17 16 12 11 108 24) Depression EF 43 39 39 36 17 16 11 10 110 25) Memory trouble CF 76 69 27 25 3 3 4 4 110 26) Family life SF 57 52 30 27 14 13 9 8 110 27) Social activities SF 55 51 30 28 15 14 9 8 109 28) Financial difficulties FI 66 60 24 22 14 13 6 6 110 1 2 3 4 5 6 7 Total (very poor) (excellent) 29) Overall health QL Previous version of this scale used 30) Overall quality of life QL 1 7 22 25 23 21 11 110 1 6 20 23 21 19 10

256
Oesophageal cancer: 50-59
Characteristics of the sample
Version of the QLQ-C30 N (%)
v 1.0 19 8 v +3 0 0 v 2.0 20 8 v 3.0 198 84 Total 237
Age N (%)
<40 0 0 40-49 0 0 50-59 237 100 60-69 0 0 70-79 0 0 80+ 0 0 Not known 0 0 Total 237
Gender
N (%) Male 182 77 Female 53 22 Not known 2 1 Total 237 Stage
N (%) Stage I-II 37 16 Stage III-IV 6 3 Recurrent/metastatic 75 32 Not known 119 50 Total 237
Constructed scales Mean (SD) Median [IQR]
Global health status/QoL QL 58.4 (21.4) 50 [41.7-75]
Physical functioning PF 82.3 (19.8) 86.7 [73.3-100] Role Functioning RF 70.0 (33.6) 83.3 [50-100] Emotional functioning EF 69.5 (22.4) 75 [58.3-91.7] Cognitive functioning CF 86.7 (19.1) 100 [83.3-100] Social functioning SF 77.4 (28.2) 83.3 [66.7-100]
Fatigue FA 33.8 (25.8) 33.3 [11.1-55.6] Nausea and vomiting NV 14.6 (22.5) 0 [0-16.7] Pain PA 26.1 (28) 16.7 [0-33.3] Dyspnoea DY 18.6 (27) 0 [0-33.3] Insomnia SL 29.1 (32.6) 33.3 [0-66.7] Appetite loss AP 31.3 (35.9) 33.3 [0-66.7] Constipation CO 20.1 (28.5) 0 [0-33.3] Diarrhoea DI 7.3 (18.7) 0 [0-0] Financial difficulties FI 21.6 (31.1) 0 [0-33.3]

257
Oesophageal cancer: 50-59 Constructed scales QL N (%) CF N (%) 0 2 1 0 1 0 8.3 1 1 16.7 0 0 16.7 4 2 33.3 9 4 25 5 2 50 9 4 33.3 25 12 66.7 39 17 41.7 23 11 83.3 40 17 50 49 23 100 136 58 58.3 13 6 Total 234 66.7 34 16 75 12 6 83.3 29 13 91.7 9 4 SF N (%) 100 10 5 0 8 3 Total 216 16.7 7 3 33.3 16 7 PF N (%) 50 22 10 0 1 1 66.7 34 15 6.7 0 0 83.3 33 14 13.3 1 1 100 112 48 20 1 1 Total 232 26.7 2 1 33.3 2 1 40 5 3 46.7 4 2 FA N (%) 53.3 7 4 0 47 20 60 6 3 11.1 20 9 66.7 13 7 22.2 31 13 73.3 14 7 33.3 52 22 80 17 9 44.4 26 11 86.7 34 18 55.6 18 8 93.3 30 16 66.7 20 9 100 57 29 77.8 14 6 Total 194 88.9 5 2 100 3 1 RF N (%) Total 236 0 19 9 16.7 9 4 33.3 22 10 50 16 8 NV N (%) 66.7 31 15 0 133 56 83.3 28 13 16.7 52 22 100 89 42 33.3 28 12 Total 214 50 10 4 66.7 4 2 EF N (%) 83.3 6 3 0 1 0 100 4 2 8.3 1 0 Total 237 16.7 2 1 25 12 5 33.3 9 4 41.7 14 6 PA N (%) 50 17 7 0 83 36 58.3 19 8 16.7 55 24 66.7 38 16 33.3 42 18 75 31 13 50 13 6 83.3 28 12 66.7 27 12 91.7 38 16 83.3 4 2 100 24 10 100 10 4 Total 234 Total 234

258
Oesophageal cancer: 50-59 Single Items Not at all A little Quite a bit Very much Total N (%) N (%) N (%) N (%) N 1) Strenuous activities PF 81 41 61 31 33 17 22 11 197 2) Long walk PF 99 51 48 25 29 15 19 10 195 3) Short walk PF 162 82 24 12 8 4 3 2 197 4) Bed or chair PF 130 66 44 22 23 12 1 1 198 5) Self care PF 184 93 9 5 3 2 2 1 198 6) Limited in work RF 100 47 41 19 40 19 33 15 214 7) Limited in leisure RF 125 58 42 19 24 11 25 12 216 8) Dyspnoea DY 145 61 57 24 27 11 7 3 236 9) Pain PA 100 42 77 33 46 20 13 6 236 10) Need to rest FA 83 35 84 36 59 25 10 4 236 11) Insomnia SL 109 46 67 29 39 17 20 9 235 12) Felt weak FA 79 33 88 37 50 21 20 8 237 13) Appetite loss AP 111 48 56 24 35 15 31 13 233 14) Nausea NV 158 67 57 24 11 5 11 5 237 15) Vomiting NV 171 72 42 18 18 8 6 3 237 16) Constipation CO 142 60 57 24 28 12 10 4 237 17) Diarrhoea DI 200 84 24 10 11 5 2 1 237 18) Felt tired FA 77 33 91 38 59 25 10 4 237 19) Pain interference PA 138 59 49 21 34 15 14 6 235 20) Concentration CF 160 68 50 21 20 9 6 3 236 21) Tension EF 87 37 93 40 46 20 9 4 235 22) Worry EF 56 24 92 39 58 25 31 13 237 23) Irritability EF 114 48 89 38 25 11 8 3 236 24) Depression EF 105 44 81 34 43 18 8 3 237 25) Memory trouble CF 169 72 52 22 12 5 2 1 235 26) Family life SF 142 61 48 21 31 13 11 5 232 27) Social activities SF 133 57 49 21 33 14 20 9 235 28) Financial difficulties FI 143 61 47 20 30 13 15 6 235 1 2 3 4 5 6 7 Total (very poor) (excellent) 29) Overall health QL 9 5 47 64 35 41 15 216 4 2 22 30 16 19 7 30) Overall quality of life QL 4 13 34 59 52 51 21 234 2 6 15 25 22 22 9

259
Oesophageal cancer: 60-69
Characteristics of the sample
Version of the QLQ-C30 N (%)
v 1.0 16 5 v +3 0 0 v 2.0 32 9 v 3.0 298 86 Total 346
Age N (%)
<40 0 0 40-49 0 0 50-59 0 0 60-69 346 100 70-79 0 0 80+ 0 0 Not known 0 0 Total 346
Gender
N (%) Male 280 81 Female 61 18 Not known 5 1 Total 346 Stage
N (%) Stage I-II 42 12 Stage III-IV 21 6 Recurrent/metastatic 106 31 Not known 177 51 Total 346
Constructed scales Mean (SD) Median [IQR]
Global health status/QoL QL 55.2 (25.7) 58.3 [33.3-75]
Physical functioning PF 77.7 (24) 86.7 [66.7-100] Role Functioning RF 72.2 (31.9) 83.3 [50-100] Emotional functioning EF 69.9 (25.3) 75 [58.3-91.7] Cognitive functioning CF 82.0 (22.9) 83.3 [66.7-100] Social functioning SF 75.5 (28) 83.3 [66.7-100]
Fatigue FA 35.9 (27.5) 33.3 [22.2-55.6] Nausea and vomiting NV 16.5 (23.4) 0 [0-33.3] Pain PA 27.4 (27.9) 16.7 [0-50] Dyspnoea DY 20.4 (28.2) 0 [0-33.3] Insomnia SL 30.4 (32.3) 33.3 [0-66.7] Appetite loss AP 33.0 (38.1) 33.3 [0-66.7] Constipation CO 24.0 (30.8) 0 [0-33.3] Diarrhoea DI 8.3 (20.8) 0 [0-0] Financial difficulties FI 15.3 (29.1) 0 [0-33.3]

260
Oesophageal cancer: 60-69 Constructed scales QL N (%) CF N (%) 0 15 5 0 3 1 8.3 3 1 16.7 9 3 16.7 17 5 33.3 14 4 25 19 6 50 24 7 33.3 32 10 66.7 49 14 41.7 21 7 83.3 83 24 50 48 15 100 163 47 58.3 29 9 Total 345 66.7 49 15 75 25 8 83.3 39 12 91.7 8 3 SF N (%) 100 20 6 0 14 4 Total 325 16.7 9 3 33.3 23 7 PF N (%) 50 31 9 0 1 0 66.7 62 18 6.7 1 0 83.3 60 18 13.3 5 2 100 140 41 20 5 2 Total 339 26.7 7 2 33.3 6 2 40 9 3 46.7 8 3 FA N (%) 53.3 12 4 0 52 15 60 14 5 11.1 33 10 66.7 25 9 22.2 65 19 73.3 20 7 33.3 62 18 80 19 7 44.4 39 11 86.7 34 12 55.6 34 10 93.3 47 16 66.7 18 5 100 80 27 77.8 10 3 Total 293 88.9 9 3 100 20 6 RF N (%) Total 342 0 21 6 16.7 16 5 33.3 31 10 50 18 6 NV N (%) 66.7 61 19 0 188 55 83.3 37 11 16.7 65 19 100 142 44 33.3 36 11 Total 326 50 30 9 66.7 15 4 EF N (%) 83.3 6 2 0 3 1 100 4 1 8.3 6 2 Total 344 16.7 11 3 25 9 3 33.3 13 4 41.7 29 9 PA N (%) 50 12 4 0 111 33 58.3 26 8 16.7 81 24 66.7 37 11 33.3 62 18 75 43 13 50 31 9 83.3 60 18 66.7 31 9 91.7 29 9 83.3 12 4 100 62 18 100 13 4 Total 340 Total 341

261
Oesophageal cancer: 60-69 Single Items Not at all A little Quite a bit Very much Total N (%) N (%) N (%) N (%) N 1) Strenuous activities PF 116 39 79 27 66 22 37 12 298 2) Long walk PF 128 43 62 21 56 19 50 17 296 3) Short walk PF 221 74 43 15 20 7 13 4 297 4) Bed or chair PF 176 59 72 24 34 11 15 5 297 5) Self care PF 264 89 21 7 6 2 6 2 297 6) Limited in work RF 162 49 75 23 51 16 40 12 328 7) Limited in leisure RF 184 56 69 21 42 13 32 10 327 8) Dyspnoea DY 200 58 92 27 37 11 15 4 344 9) Pain PA 126 37 133 39 65 19 20 6 344 10) Need to rest FA 111 32 143 41 64 19 27 8 345 11) Insomnia SL 149 43 104 30 63 18 28 8 344 12) Felt weak FA 111 32 121 35 68 20 45 13 345 13) Appetite loss AP 171 50 60 17 58 17 55 16 344 14) Nausea NV 218 63 81 24 29 8 17 5 345 15) Vomiting NV 242 70 67 19 24 7 12 4 345 16) Constipation CO 189 55 84 24 52 15 20 6 345 17) Diarrhoea DI 286 83 43 12 8 2 9 3 346 18) Felt tired FA 96 28 161 47 52 15 34 10 343 19) Pain interference PA 201 59 71 21 43 13 28 8 343 20) Concentration CF 229 66 73 21 27 8 17 5 346 21) Tension EF 137 40 131 38 55 16 23 7 346 22) Worry EF 90 26 134 39 68 20 52 15 344 23) Irritability EF 185 54 107 31 37 11 15 4 344 24) Depression EF 155 45 112 33 54 16 22 6 343 25) Memory trouble CF 200 58 102 30 34 10 9 3 345 26) Family life SF 203 59 77 22 45 13 18 5 343 27) Social activities SF 170 50 93 27 45 13 33 10 341 28) Financial difficulties FI 250 74 45 13 24 7 21 6 340 1 2 3 4 5 6 7 Total (very poor) (excellent) 29) Overall health QL 19 32 50 85 68 46 26 326 6 10 15 26 21 14 8 30) Overall quality of life QL 21 29 49 66 76 64 37 342 6 9 14 19 22 19 11

262
Oesophageal cancer:≥70
Characteristics of the sample
Version of the QLQ-C30
N (%) v 1.0 8 2 v +3 0 0 v 2.0 15 4 v 3.0 315 93 Total 338
Age N (%)
<40 0 0 40-49 0 0 50-59 0 0 60-69 0 0 70-79 270 80 80+ 68 20 Not known 0 0 Total 338
Gender
N (%) Male 223 66 Female 112 33 Not known 3 1 Total 338 Stage
N (%) Stage I-II 23 7 Stage III-IV 13 4 Recurrent/metastatic 138 41 Not known 164 49 Total 338
Constructed scales Mean (SD) Median [IQR]
Global health status/QoL QL 53.6 (25.2) 50 [33.3-75]
Physical functioning PF 70.9 (26.4) 73.3 [60-93.3] Role Functioning RF 64.5 (36) 66.7 [33.3-100] Emotional functioning EF 74.9 (22.6) 83.3 [58.3-91.7] Cognitive functioning CF 81.4 (21.3) 83.3 [66.7-100] Social functioning SF 75.0 (27.1) 83.3 [50-100]
Fatigue FA 40.0 (27.1) 33.3 [22.2-55.6] Nausea and vomiting NV 19.1 (24.1) 16.7 [0-33.3] Pain PA 23.3 (25.3) 16.7 [0-33.3] Dyspnoea DY 20.1 (28.3) 0 [0-33.3] Insomnia SL 27.5 (32.1) 33.3 [0-66.7] Appetite loss AP 36.9 (38.3) 33.3 [0-66.7] Constipation CO 31.9 (33) 33.3 [0-66.7] Diarrhoea DI 6.5 (17.4) 0 [0-0] Financial difficulties FI 9.2 (20.9) 0 [0-0]
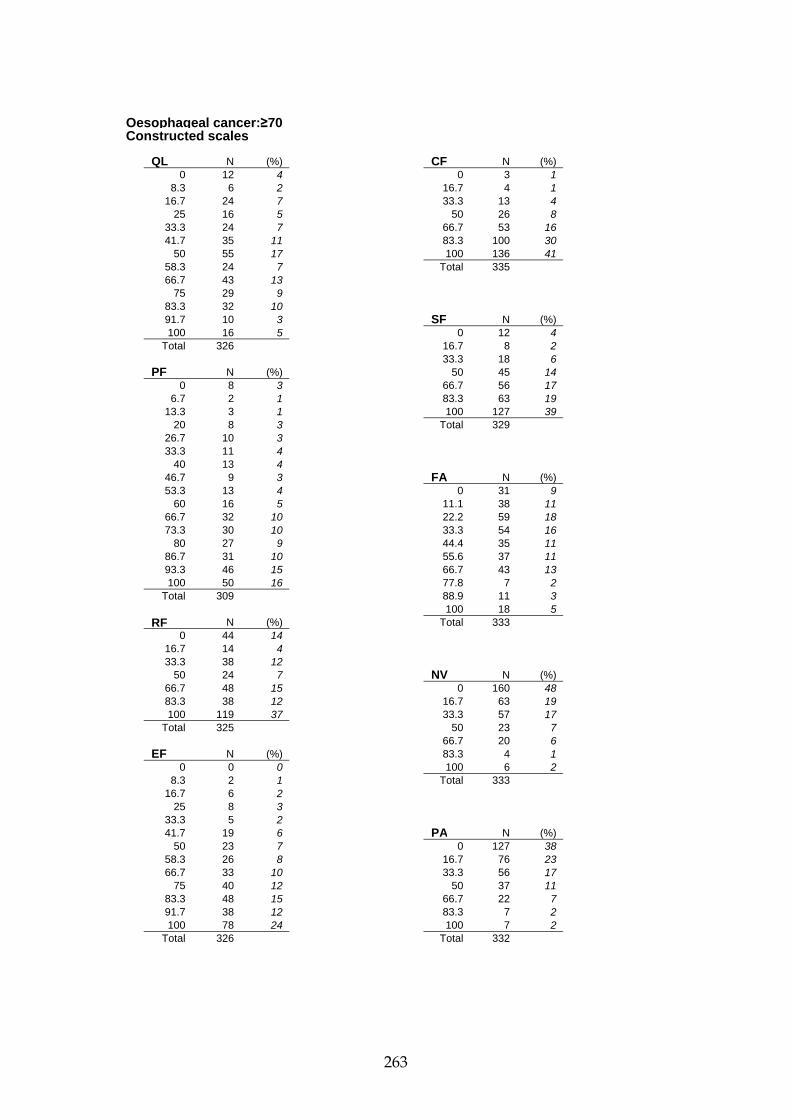
263
Oesophageal cancer:≥70 Constructed scales QL N (%) CF N (%) 0 12 4 0 3 1 8.3 6 2 16.7 4 1 16.7 24 7 33.3 13 4 25 16 5 50 26 8 33.3 24 7 66.7 53 16 41.7 35 11 83.3 100 30 50 55 17 100 136 41 58.3 24 7 Total 335 66.7 43 13 75 29 9 83.3 32 10 91.7 10 3 SF N (%) 100 16 5 0 12 4 Total 326 16.7 8 2 33.3 18 6 PF N (%) 50 45 14 0 8 3 66.7 56 17 6.7 2 1 83.3 63 19 13.3 3 1 100 127 39 20 8 3 Total 329 26.7 10 3 33.3 11 4 40 13 4 46.7 9 3 FA N (%) 53.3 13 4 0 31 9 60 16 5 11.1 38 11 66.7 32 10 22.2 59 18 73.3 30 10 33.3 54 16 80 27 9 44.4 35 11 86.7 31 10 55.6 37 11 93.3 46 15 66.7 43 13 100 50 16 77.8 7 2 Total 309 88.9 11 3 100 18 5 RF N (%) Total 333 0 44 14 16.7 14 4 33.3 38 12 50 24 7 NV N (%) 66.7 48 15 0 160 48 83.3 38 12 16.7 63 19 100 119 37 33.3 57 17 Total 325 50 23 7 66.7 20 6 EF N (%) 83.3 4 1 0 0 0 100 6 2 8.3 2 1 Total 333 16.7 6 2 25 8 3 33.3 5 2 41.7 19 6 PA N (%) 50 23 7 0 127 38 58.3 26 8 16.7 76 23 66.7 33 10 33.3 56 17 75 40 12 50 37 11 83.3 48 15 66.7 22 7 91.7 38 12 83.3 7 2 100 78 24 100 7 2 Total 326 Total 332
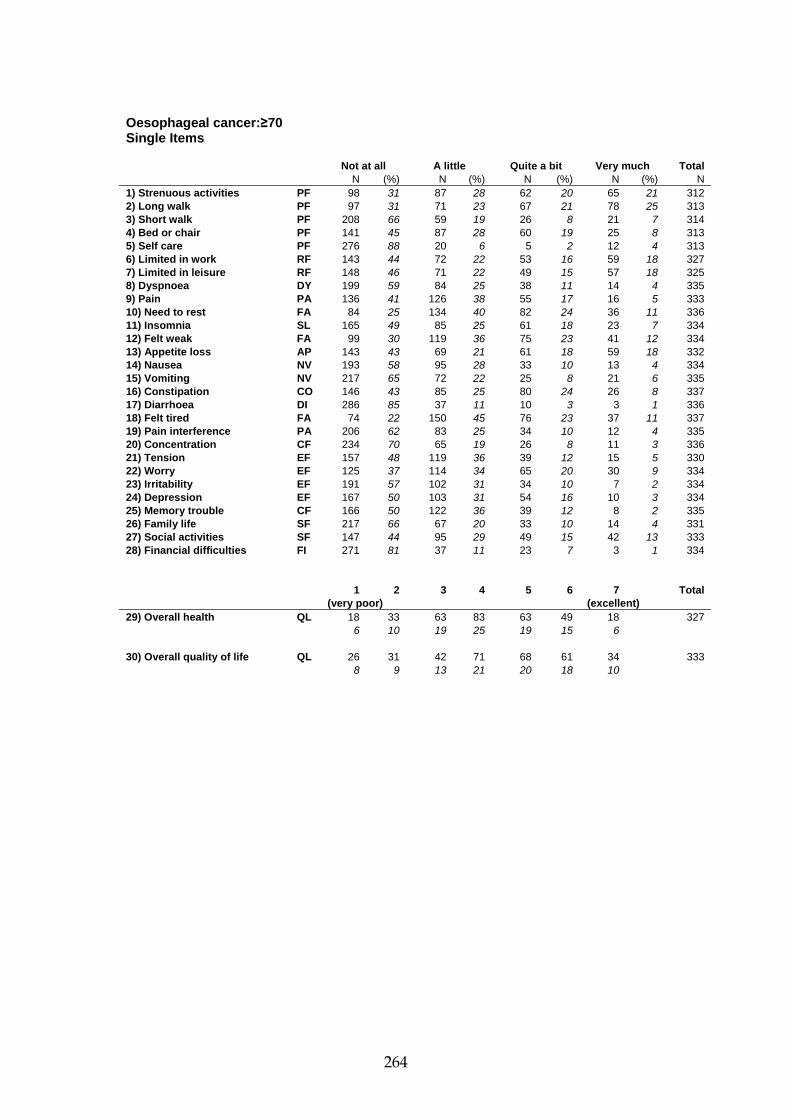
264
Oesophageal cancer:≥70 Single Items Not at all A little Quite a bit Very much Total N (%) N (%) N (%) N (%) N 1) Strenuous activities PF 98 31 87 28 62 20 65 21 312 2) Long walk PF 97 31 71 23 67 21 78 25 313 3) Short walk PF 208 66 59 19 26 8 21 7 314 4) Bed or chair PF 141 45 87 28 60 19 25 8 313 5) Self care PF 276 88 20 6 5 2 12 4 313 6) Limited in work RF 143 44 72 22 53 16 59 18 327 7) Limited in leisure RF 148 46 71 22 49 15 57 18 325 8) Dyspnoea DY 199 59 84 25 38 11 14 4 335 9) Pain PA 136 41 126 38 55 17 16 5 333 10) Need to rest FA 84 25 134 40 82 24 36 11 336 11) Insomnia SL 165 49 85 25 61 18 23 7 334 12) Felt weak FA 99 30 119 36 75 23 41 12 334 13) Appetite loss AP 143 43 69 21 61 18 59 18 332 14) Nausea NV 193 58 95 28 33 10 13 4 334 15) Vomiting NV 217 65 72 22 25 8 21 6 335 16) Constipation CO 146 43 85 25 80 24 26 8 337 17) Diarrhoea DI 286 85 37 11 10 3 3 1 336 18) Felt tired FA 74 22 150 45 76 23 37 11 337 19) Pain interference PA 206 62 83 25 34 10 12 4 335 20) Concentration CF 234 70 65 19 26 8 11 3 336 21) Tension EF 157 48 119 36 39 12 15 5 330 22) Worry EF 125 37 114 34 65 20 30 9 334 23) Irritability EF 191 57 102 31 34 10 7 2 334 24) Depression EF 167 50 103 31 54 16 10 3 334 25) Memory trouble CF 166 50 122 36 39 12 8 2 335 26) Family life SF 217 66 67 20 33 10 14 4 331 27) Social activities SF 147 44 95 29 49 15 42 13 333 28) Financial difficulties FI 271 81 37 11 23 7 3 1 334 1 2 3 4 5 6 7 Total (very poor) (excellent) 29) Overall health QL 18 33 63 83 63 49 18 327 6 10 19 25 19 15 6 30) Overall quality of life QL 26 31 42 71 68 61 34 333 8 9 13 21 20 18 10

265
Gastric cancer: all stages
Characteristics of the sample
Version of the QLQ-C30 N (%)
v 1.0 0 0 v +3 1 0 v 2.0 50 7 v 3.0 713 93 Total 764
Age N (%)
<40 15 2 40-49 83 11 50-59 159 21 60-69 226 30 70-79 188 25 80+ 92 12 Not known 1 0 Total 764
Gender
N (%) Male 485 64 Female 276 36 Not known 3 0 Total 764 Stage
N (%) Stage I-II 39 5 Stage III-IV 187 25 Recurrent/metastatic 295 39 Not known 243 32 Total 764
Constructed scales Mean (SD) Median [IQR]
Global health status/QoL QL 53.1 (26.5) 50 [33.3-66.7]
Physical functioning PF 79.6 (21.8) 86.7 [66.7-100] Role Functioning RF 58.7 (37.4) 66.7 [33.3-100] Emotional functioning EF 68.8 (25.4) 75 [50-91.7] Cognitive functioning CF 80.1 (23.7) 83.3 [66.7-100] Social functioning SF 66.8 (33.3) 66.7 [50-100]
Fatigue FA 44.5 (31.2) 44.4 [22.2-66.7] Nausea and vomiting NV 18.8 (27.4) 0 [0-33.3] Pain PA 31.4 (31.7) 16.7 [0-50] Dyspnoea DY 20.9 (29.7) 0 [0-33.3] Insomnia SL 31.7 (33.6) 33.3 [0-66.7] Appetite loss AP 37.6 (38.3) 33.3 [0-66.7] Constipation CO 26.4 (33.6) 0 [0-33.3] Diarrhoea DI 15.9 (27.6) 0 [0-33.3] Financial difficulties FI 12.6 (26.4) 0 [0-0]

266
Gastric cancer: all stages Constructed scales QL N (%) CF N (%) 0 45 6 0 8 1 8.3 8 1 16.7 20 3 16.7 48 7 33.3 34 5 25 38 5 50 65 9 33.3 74 10 66.7 132 18 41.7 55 7 83.3 160 21 50 129 17 100 336 45 58.3 48 7 Total 755 66.7 114 15 75 42 6 83.3 73 10 91.7 22 3 SF N (%) 100 48 7 0 65 9 Total 744 16.7 45 6 33.3 73 10 PF N (%) 50 75 10 0 8 1 66.7 118 16 6.7 2 0 83.3 107 14 13.3 5 1 100 258 35 20 3 0 Total 741 26.7 8 1 33.3 15 2 40 12 2 46.7 27 4 FA N (%) 53.3 14 2 0 101 14 60 36 5 11.1 71 10 66.7 47 7 22.2 80 11 73.3 57 8 33.3 113 15 80 70 10 44.4 69 9 86.7 123 18 55.6 57 8 93.3 79 11 66.7 96 13 100 187 27 77.8 51 7 Total 693 88.9 41 6 100 65 9 RF N (%) Total 744 0 129 17 16.7 48 6 33.3 93 13 50 51 7 NV N (%) 66.7 114 15 0 405 54 83.3 83 11 16.7 141 19 100 228 31 33.3 82 11 Total 746 50 41 5 66.7 35 5 EF N (%) 83.3 18 2 0 10 1 100 32 4 8.3 13 2 Total 754 16.7 18 2 25 19 3 33.3 40 5 41.7 45 6 PA N (%) 50 51 7 0 254 34 58.3 73 10 16.7 138 19 66.7 82 11 33.3 109 15 75 93 13 50 76 10 83.3 79 11 66.7 73 10 91.7 102 14 83.3 51 7 100 119 16 100 46 6 Total 744 Total 747

267
Gastric cancer: all stages Single Items Not at all A little Quite a bit Very much Total N (%) N (%) N (%) N (%) N 1) Strenuous activities PF 267 38 254 36 101 14 84 12 706 2) Long walk PF 284 40 240 34 105 15 78 11 707 3) Short walk PF 521 74 126 18 39 6 20 3 706 4) Bed or chair PF 431 61 181 26 68 10 30 4 710 5) Self care PF 635 90 51 7 13 2 10 1 709 6) Limited in work RF 265 35 176 23 145 19 167 22 753 7) Limited in leisure RF 303 40 157 21 131 17 162 22 753 8) Dyspnoea DY 456 60 167 22 97 13 38 5 758 9) Pain PA 281 37 246 33 158 21 72 10 757 10) Need to rest FA 181 24 245 33 213 28 115 15 754 11) Insomnia SL 325 43 220 29 135 18 77 10 757 12) Felt weak FA 221 29 222 29 168 22 144 19 755 13) Appetite loss AP 319 42 162 21 138 18 139 18 758 14) Nausea NV 447 59 171 23 85 11 54 7 757 15) Vomiting NV 549 73 108 14 57 8 43 6 757 16) Constipation CO 410 54 163 22 114 15 69 9 756 17) Diarrhoea DI 522 69 141 19 56 7 36 5 755 18) Felt tired FA 175 23 259 34 211 28 110 15 755 19) Pain interference PA 389 52 171 23 103 14 90 12 753 20) Concentration CF 472 62 145 19 95 13 46 6 758 21) Tension EF 302 40 246 33 147 20 58 8 753 22) Worry EF 234 31 224 30 176 23 121 16 755 23) Irritability EF 379 50 260 34 93 12 27 4 759 24) Depression EF 328 43 247 33 125 17 58 8 758 25) Memory trouble CF 440 58 220 29 81 11 17 2 758 26) Family life SF 365 49 166 22 123 17 90 12 744 27) Social activities SF 326 44 174 23 110 15 140 19 750 28) Financial difficulties FI 587 78 82 11 57 8 30 4 756 1 2 3 4 5 6 7 Total (very poor) (excellent) 29) Overall health QL 63 60 121 191 157 102 57 751 8 8 16 25 21 14 8 30) Overall quality of life QL 57 65 123 169 146 111 75 746 8 9 17 23 20 15 10

268
Prostate cancer: all stages
Characteristics of the sample
Version of the QLQ-C30 N (%)
v 1.0 313 9 v +3 7 0 v 2.0 2,193 65 v 3.0 848 25 Total 3,361
Age N (%)
<40 1 0 40-49 39 1 50-59 336 10 60-69 1,327 40 70-79 1,480 44 80+ 177 5 Not known 1 0 Total 3,361
Stage N (%)
Stage I-II 959 29 Stage III-IV 1,511 45 Recurrent/metastatic 640 19 Not known 251 8 Total 3,361
Constructed scales Mean (SD) Median [IQR]
Global health status/QoL QL 68.4 (22.2) 66.7 [50-83.3]
Physical functioning PF 80.2 (25.6) 93.3 [66.7-100] Role Functioning RF 82.7 (28.2) 100 [66.7-100] Emotional functioning EF 76.6 (23) 83.3 [66.7-100] Cognitive functioning CF 83.2 (20.8) 83.3 [66.7-100] Social functioning SF 80.2 (27.2) 100 [66.7-100]
Fatigue FA 26.9 (26.6) 22.2 [0-44.4] Nausea and vomiting NV 5.1 (14.2) 0 [0-0] Pain PA 23.3 (30.3) 0 [0-33.3] Dyspnoea DY 16.8 (25.7) 0 [0-33.3] Insomnia SL 24.5 (30.5) 0 [0-33.3] Appetite loss AP 10.4 (23.6) 0 [0-0] Constipation CO 14.6 (27.2) 0 [0-33.3] Diarrhoea DI 8.4 (19.4) 0 [0-0] Financial difficulties FI 9.0 (21.5) 0 [0-0]

269
Prostate cancer: all stages Constructed scales QL N (%) CF N (%) 0 32 1 0 27 1 8.3 11 0 16.7 40 1 16.7 48 2 33.3 101 3 25 36 1 50 236 7 33.3 180 6 66.7 479 14 41.7 109 4 83.3 910 27 50 443 15 100 1,528 46 58.3 178 6 Total 3,321 66.7 554 18 75 213 7 83.3 677 23 91.7 135 5 SF N (%) 100 387 13 0 107 3 Total 3,003 16.7 89 3 33.3 198 6 PF N (%) 50 205 6 0 7 1 66.7 497 15 6.7 12 1 83.3 452 14 13.3 12 1 100 1,771 53 20 14 2 Total 3,319 26.7 14 2 33.3 15 2 40 23 3 46.7 23 3 FA N (%) 53.3 19 2 0 1,031 31 60 49 6 11.1 395 12 66.7 36 4 22.2 476 14 73.3 37 4 33.3 488 15 80 52 6 44.4 264 8 86.7 79 10 55.6 199 6 93.3 110 13 66.7 224 7 100 332 40 77.8 83 3 Total 834 88.9 77 2 100 66 2 RF N (%) Total 3,303 0 141 5 16.7 65 2 33.3 157 5 50 119 4 NV N (%) 66.7 302 10 0 2,798 84 83.3 367 12 16.7 292 9 100 1,867 62 33.3 145 4 Total 3,018 50 44 1 66.7 32 1 EF N (%) 83.3 17 1 0 21 1 100 15 0 8.3 23 1 Total 3,343 16.7 39 1 25 68 2 33.3 104 3 41.7 122 4 PA N (%) 50 189 6 0 1,696 51 58.3 235 7 16.7 424 13 66.7 331 10 33.3 379 11 75 358 11 50 251 8 83.3 445 14 66.7 285 9 91.7 488 15 83.3 132 4 100 875 27 100 149 5 Total 3,298 Total 3,316

270
Prostate cancer: all stages Single Items Not at all A little Quite a bit Very much Total N (%) N (%) N (%) N (%) N 1) Strenuous activities PF 432 51 184 22 133 16 95 11 844 2) Long walk PF 416 49 179 21 98 12 151 18 844 3) Short walk PF 622 74 111 13 58 7 51 6 842 4) Bed or chair PF 573 68 127 15 85 10 54 6 839 5) Self care PF 766 91 45 5 23 3 10 1 844 6) Limited in work RF 1,978 65 598 20 273 9 182 6 3,031 7) Limited in leisure RF 2,189 72 421 14 220 7 200 7 3,030 8) Dyspnoea DY 2,138 64 812 24 304 9 90 3 3,344 9) Pain PA 1,834 55 709 21 558 17 246 7 3,347 10) Need to rest FA 1,383 41 1,145 34 620 19 199 6 3,347 11) Insomnia SL 1,758 53 909 27 480 14 198 6 3,345 12) Felt weak FA 1,836 55 932 28 412 12 164 5 3,344 13) Appetite loss AP 2,687 80 381 11 182 5 100 3 3,350 14) Nausea NV 2,829 85 356 11 120 4 44 1 3,349 15) Vomiting NV 3,141 94 141 4 46 1 21 1 3,349 16) Constipation CO 2,435 73 498 15 264 8 146 4 3,343 17) Diarrhoea DI 2,708 81 466 14 128 4 40 1 3,342 18) Felt tired FA 1,365 41 1,228 37 551 17 179 5 3,323 19) Pain interference PA 2,097 63 593 18 401 12 238 7 3,329 20) Concentration CF 2,404 72 641 19 230 7 66 2 3,341 21) Tension EF 1,699 51 1,135 34 402 12 96 3 3,332 22) Worry EF 1,303 39 1,227 37 567 17 245 7 3,342 23) Irritability EF 1,838 55 1,042 31 350 11 104 3 3,334 24) Depression EF 1,875 56 948 29 389 12 111 3 3,323 25) Memory trouble CF 1,765 53 1,153 35 329 10 82 3 3,329 26) Family life SF 2,116 64 696 21 333 10 186 6 3,331 27) Social activities SF 2,057 62 721 22 344 10 212 6 3,334 28) Financial difficulties FI 2,726 82 388 12 153 5 70 2 3,337 1 2 3 4 5 6 7 Total (very poor) (excellent) 29) Overall health QL 48 82 240 620 742 835 451 3,018 2 3 8 21 25 28 15 30) Overall quality of life QL 60 103 299 656 788 888 526 3,320 2 3 9 20 24 27 16
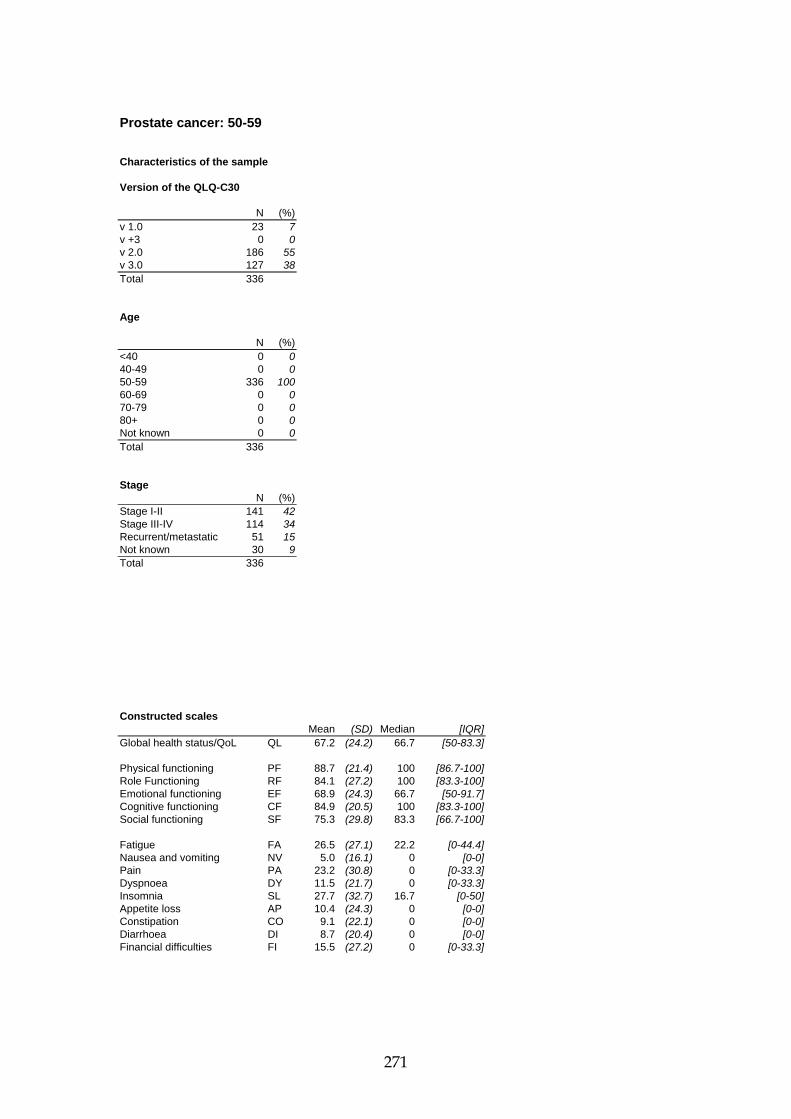
271
Prostate cancer: 50-59
Characteristics of the sample
Version of the QLQ-C30 N (%)
v 1.0 23 7 v +3 0 0 v 2.0 186 55 v 3.0 127 38 Total 336
Age N (%)
<40 0 0 40-49 0 0 50-59 336 100 60-69 0 0 70-79 0 0 80+ 0 0 Not known 0 0 Total 336
Stage N (%)
Stage I-II 141 42 Stage III-IV 114 34 Recurrent/metastatic 51 15 Not known 30 9 Total 336
Constructed scales Mean (SD) Median [IQR]
Global health status/QoL QL 67.2 (24.2) 66.7 [50-83.3]
Physical functioning PF 88.7 (21.4) 100 [86.7-100] Role Functioning RF 84.1 (27.2) 100 [83.3-100] Emotional functioning EF 68.9 (24.3) 66.7 [50-91.7] Cognitive functioning CF 84.9 (20.5) 100 [83.3-100] Social functioning SF 75.3 (29.8) 83.3 [66.7-100]
Fatigue FA 26.5 (27.1) 22.2 [0-44.4] Nausea and vomiting NV 5.0 (16.1) 0 [0-0] Pain PA 23.2 (30.8) 0 [0-33.3] Dyspnoea DY 11.5 (21.7) 0 [0-33.3] Insomnia SL 27.7 (32.7) 16.7 [0-50] Appetite loss AP 10.4 (24.3) 0 [0-0] Constipation CO 9.1 (22.1) 0 [0-0] Diarrhoea DI 8.7 (20.4) 0 [0-0] Financial difficulties FI 15.5 (27.2) 0 [0-33.3]

272
Prostate cancer: 50-59 Constructed scales QL N (%) CF N (%) 0 8 3 0 4 1 8.3 1 0 16.7 2 1 16.7 5 2 33.3 7 2 25 3 1 50 23 7 33.3 22 7 66.7 47 14 41.7 15 5 83.3 77 23 50 39 13 100 174 52 58.3 20 7 Total 334 66.7 55 18 75 23 7 83.3 59 19 91.7 14 5 SF N (%) 100 46 15 0 16 5 Total 310 16.7 11 3 33.3 30 9 PF N (%) 50 22 7 0 2 2 66.7 56 17 6.7 1 1 83.3 47 14 13.3 0 0 100 153 46 20 1 1 Total 335 26.7 0 0 33.3 2 2 40 0 0 46.7 1 1 FA N (%) 53.3 4 3 0 112 34 60 6 5 11.1 36 11 66.7 3 2 22.2 43 13 73.3 2 2 33.3 48 15 80 2 2 44.4 29 9 86.7 10 8 55.6 21 6 93.3 17 14 66.7 18 5 100 75 60 77.8 10 3 Total 126 88.9 7 2 100 8 2 RF N (%) Total 332 0 13 4 16.7 9 3 33.3 11 4 50 12 4 NV N (%) 66.7 20 6 0 287 86 83.3 53 17 16.7 25 8 100 193 62 33.3 6 2 Total 311 50 7 2 66.7 2 1 EF N (%) 83.3 2 1 0 7 2 100 4 1 8.3 2 1 Total 333 16.7 5 2 25 7 2 33.3 16 5 41.7 17 5 PA N (%) 50 29 9 0 174 52 58.3 33 10 16.7 39 12 66.7 49 15 33.3 38 11 75 37 11 50 22 7 83.3 42 13 66.7 30 9 91.7 31 9 83.3 13 4 100 54 16 100 16 5 Total 329 Total 332

273
Prostate cancer: 50-59 Single Items Not at all A little Quite a bit Very much Total N (%) N (%) N (%) N (%) N 1) Strenuous activities PF 92 73 15 12 13 10 6 5 126 2) Long walk PF 86 68 21 17 9 7 10 8 126 3) Short walk PF 111 88 7 6 4 3 4 3 126 4) Bed or chair PF 99 79 12 10 9 7 6 5 126 5) Self care PF 120 95 3 2 2 2 2 2 127 6) Limited in work RF 206 66 61 20 27 9 17 6 311 7) Limited in leisure RF 241 77 34 11 18 6 20 6 313 8) Dyspnoea DY 247 74 64 19 18 5 5 2 334 9) Pain PA 186 56 65 19 61 18 23 7 335 10) Need to rest FA 152 45 115 34 47 14 21 6 335 11) Insomnia SL 168 50 84 25 57 17 27 8 336 12) Felt weak FA 185 55 93 28 39 12 18 5 335 13) Appetite loss AP 270 81 37 11 14 4 13 4 334 14) Nausea NV 288 86 28 8 11 3 7 2 334 15) Vomiting NV 317 95 8 2 5 2 4 1 334 16) Constipation CO 274 82 41 12 10 3 10 3 335 17) Diarrhoea DI 271 81 45 14 12 4 6 2 334 18) Felt tired FA 135 41 115 35 62 19 21 6 333 19) Pain interference PA 210 63 62 19 34 10 27 8 333 20) Concentration CF 230 69 75 22 24 7 6 2 335 21) Tension EF 115 34 147 44 57 17 16 5 335 22) Worry EF 75 22 135 40 83 25 42 13 335 23) Irritability EF 144 43 132 40 43 13 14 4 333 24) Depression EF 151 46 115 35 49 15 16 5 331 25) Memory trouble CF 214 64 88 26 23 7 9 3 334 26) Family life SF 174 52 92 28 44 13 25 8 335 27) Social activities SF 189 56 79 24 39 12 28 8 335 28) Financial difficulties FI 235 70 56 17 30 9 13 4 334 1 2 3 4 5 6 7 Total (very poor) (excellent) 29) Overall health QL 10 9 29 55 72 78 58 311 3 3 9 18 23 25 19 30) Overall quality of life QL 9 9 40 54 84 78 59 333 3 3 12 16 25 23 18

274
Prostate cancer: 60-69
Characteristics of the sample
Version of the QLQ-C30 N (%)
v 1.0 117 9 v +3 6 1 v 2.0 915 69 v 3.0 289 22 Total 1,327
Age N (%)
<40 0 0 40-49 0 0 50-59 0 0 60-69 1,327 100 70-79 0 0 80+ 0 0 Not known 0 0 Total 1,327
Stage N (%)
Stage I-II 418 32 Stage III-IV 608 46 Recurrent/metastatic 205 15 Not known 96 7 Total 1,327
Constructed scales Mean (SD) Median [IQR]
Global health status/QoL QL 69.8 (21.6) 75 [50-83.3]
Physical functioning PF 85.2 (22.5) 100 [80-100] Role Functioning RF 86.1 (24.8) 100 [83.3-100] Emotional functioning EF 75.5 (23.8) 83.3 [58.3-100] Cognitive functioning CF 84.5 (20.3) 83.3 [83.3-100] Social functioning SF 80.2 (26.8) 100 [66.7-100]
Fatigue FA 25.2 (26.1) 22.2 [0-44.4] Nausea and vomiting NV 4.3 (13.2) 0 [0-0] Pain PA 21.1 (29.2) 0 [0-33.3] Dyspnoea DY 15.3 (24.2) 0 [0-33.3] Insomnia SL 25.2 (31) 0 [0-33.3] Appetite loss AP 8.4 (20.8) 0 [0-0] Constipation CO 12.6 (25.7) 0 [0-0] Diarrhoea DI 8.6 (19.7) 0 [0-0] Financial difficulties FI 10.4 (23) 0 [0-0]

275
Prostate cancer: 60-69 Constructed scales QL N (%) CF N (%) 0 10 1 0 7 1 8.3 2 0 16.7 17 1 16.7 18 2 33.3 41 3 25 13 1 50 77 6 33.3 58 5 66.7 179 14 41.7 42 4 83.3 345 26 50 173 15 100 647 49 58.3 73 6 Total 1,313 66.7 202 17 75 89 8 83.3 298 25 91.7 50 4 SF N (%) 100 166 14 0 36 3 Total 1,194 16.7 35 3 33.3 84 6 PF N (%) 50 82 6 0 2 1 66.7 196 15 6.7 1 0 83.3 189 14 13.3 1 0 100 688 53 20 4 1 Total 1,310 26.7 3 1 33.3 4 1 40 10 4 46.7 6 2 FA N (%) 53.3 1 0 0 444 34 60 14 5 11.1 157 12 66.7 10 4 22.2 191 15 73.3 14 5 33.3 182 14 80 16 6 44.4 98 8 86.7 17 6 55.6 66 5 93.3 34 12 66.7 92 7 100 147 52 77.8 31 2 Total 284 88.9 22 2 100 23 2 RF N (%) Total 1,306 0 37 3 16.7 17 1 33.3 44 4 50 43 4 NV N (%) 66.7 121 10 0 1,138 86 83.3 147 12 16.7 100 8 100 790 66 33.3 54 4 Total 1,199 50 7 1 66.7 12 1 EF N (%) 83.3 5 0 0 7 1 100 6 1 8.3 9 1 Total 1,322 16.7 19 2 25 38 3 33.3 49 4 41.7 49 4 PA N (%) 50 76 6 0 704 54 58.3 100 8 16.7 180 14 66.7 131 10 33.3 141 11 75 131 10 50 89 7 83.3 170 13 66.7 104 8 91.7 184 14 83.3 40 3 100 343 26 100 53 4 Total 1,306 Total 1,311

276
Prostate cancer: 60-69 Single Items Not at all A little Quite a bit Very much Total N (%) N (%) N (%) N (%) N 1) Strenuous activities PF 172 60 51 18 39 14 24 8 286 2) Long walk PF 172 60 52 18 31 11 32 11 287 3) Short walk PF 229 80 33 12 14 5 11 4 287 4) Bed or chair PF 218 77 34 12 25 9 8 3 285 5) Self care PF 268 93 15 5 2 1 2 1 287 6) Limited in work RF 829 69 241 20 88 7 47 4 1,205 7) Limited in leisure RF 922 77 164 14 62 5 55 5 1,203 8) Dyspnoea DY 871 66 324 25 99 8 28 2 1,322 9) Pain PA 756 57 287 22 200 15 81 6 1,324 10) Need to rest FA 594 45 427 32 235 18 66 5 1,322 11) Insomnia SL 681 52 363 28 189 14 86 7 1,319 12) Felt weak FA 758 57 347 26 163 12 55 4 1,323 13) Appetite loss AP 1,101 83 142 11 56 4 26 2 1,325 14) Nausea NV 1,145 86 129 10 36 3 15 1 1,325 15) Vomiting NV 1,259 95 42 3 15 1 7 1 1,323 16) Constipation CO 1,008 76 174 13 89 7 49 4 1,320 17) Diarrhoea DI 1,069 81 184 14 51 4 18 1 1,322 18) Felt tired FA 574 44 483 37 195 15 60 5 1,312 19) Pain interference PA 870 66 217 17 143 11 83 6 1,313 20) Concentration CF 964 73 241 18 95 7 20 2 1,320 21) Tension EF 675 51 427 33 175 13 37 3 1,314 22) Worry EF 491 37 496 38 217 16 116 9 1,320 23) Irritability EF 704 54 394 30 170 13 48 4 1,316 24) Depression EF 731 56 370 28 167 13 48 4 1,316 25) Memory trouble CF 747 57 424 32 114 9 29 2 1,314 26) Family life SF 817 62 287 22 138 11 74 6 1,316 27) Social activities SF 807 61 304 23 136 10 67 5 1,314 28) Financial difficulties FI 1,042 79 173 13 69 5 34 3 1,318 1 2 3 4 5 6 7 Total (very poor) (excellent) 29) Overall health QL 16 24 85 238 281 362 195 1,201 1 2 7 20 23 30 16 30) Overall quality of life QL 23 43 96 264 290 382 214 1,312 2 3 7 20 22 29 16

277
Prostate cancer: ≥70
Characteristics of the sample
Version of the QLQ-C30 N (%)
v 1.0 165 10 v +3 1 0 v 2.0 1,075 65 v 3.0 416 25 Total 1,657
Age N (%)
<40 0 0 40-49 0 0 50-59 0 0 60-69 0 0 70-79 1,480 89 80+ 177 11 Not known 0 0 Total 1,657
Stage N (%)
Stage I-II 385 23 Stage III-IV 779 47 Recurrent/metastatic 375 23 Not known 118 7 Total 1,657
Constructed scales Mean (SD) Median [IQR]
Global health status/QoL QL 67.4 (22.2) 66.7 [50-83.3]
Physical functioning PF 73.7 (27.4) 86.7 [60-96.7] Role Functioning RF 79.6 (30.6) 100 [66.7-100] Emotional functioning EF 79.2 (21.6) 83.3 [66.7-100] Cognitive functioning CF 81.9 (21.1) 83.3 [66.7-100] Social functioning SF 81.4 (26.8) 100 [66.7-100]
Fatigue FA 28.3 (26.8) 22.2 [0-44.4] Nausea and vomiting NV 5.7 (14.6) 0 [0-0] Pain PA 24.8 (30.8) 16.7 [0-50] Dyspnoea DY 19.5 (27.4) 0 [0-33.3] Insomnia SL 23.2 (29.4) 0 [0-33.3] Appetite loss AP 12.1 (25.4) 0 [0-0] Constipation CO 17.3 (29.1) 0 [0-33.3] Diarrhoea DI 8.2 (18.8) 0 [0-0] Financial difficulties FI 6.3 (17.8) 0 [0-0]

278
Prostate cancer: ≥70 Constructed scales QL N (%) CF N (%) 0 14 1 0 15 1 8.3 8 1 16.7 19 1 16.7 25 2 33.3 53 3 25 20 1 50 135 8 33.3 95 7 66.7 247 15 41.7 52 4 83.3 480 29 50 227 16 100 684 42 58.3 83 6 Total 1,633 66.7 291 20 75 98 7 83.3 317 22 91.7 64 4 SF N (%) 100 172 12 0 52 3 Total 1,466 16.7 42 3 33.3 80 5 PF N (%) 50 99 6 0 3 1 66.7 238 15 6.7 10 3 83.3 207 13 13.3 11 3 100 915 56 20 9 2 Total 1,633 26.7 11 3 33.3 9 2 40 13 3 46.7 15 4 FA N (%) 53.3 14 3 0 465 29 60 29 7 11.1 194 12 66.7 23 6 22.2 238 15 73.3 21 5 33.3 252 16 80 34 8 44.4 133 8 86.7 50 12 55.6 110 7 93.3 54 13 66.7 112 7 100 102 25 77.8 42 3 Total 408 88.9 45 3 100 34 2 RF N (%) Total 1,625 0 90 6 16.7 39 3 33.3 101 7 50 62 4 NV N (%) 66.7 159 11 0 1,338 81 83.3 165 11 16.7 164 10 100 859 58 33.3 83 5 Total 1,475 50 30 2 66.7 18 1 EF N (%) 83.3 9 1 0 6 0 100 5 0 8.3 11 1 Total 1,647 16.7 14 1 25 22 1 33.3 36 2 41.7 56 4 PA N (%) 50 82 5 0 799 49 58.3 99 6 16.7 199 12 66.7 145 9 33.3 199 12 75 185 11 50 138 9 83.3 226 14 66.7 146 9 91.7 266 16 83.3 74 5 100 474 29 100 77 5 Total 1,622 Total 1,632

279
Prostate cancer: ≥70 Single Items Not at all A little Quite a bit Very much Total N (%) N (%) N (%) N (%) N 1) Strenuous activities PF 155 37 116 28 81 20 64 15 416 2) Long walk PF 147 35 102 25 58 14 108 26 415 3) Short walk PF 267 65 71 17 39 9 36 9 413 4) Bed or chair PF 242 59 80 19 50 12 40 10 412 5) Self care PF 362 87 27 7 19 5 6 1 414 6) Limited in work RF 917 62 292 20 156 11 117 8 1,482 7) Limited in leisure RF 1,000 68 219 15 138 9 124 8 1,481 8) Dyspnoea DY 985 60 419 25 186 11 57 4 1,647 9) Pain PA 872 53 350 21 289 18 136 8 1,647 10) Need to rest FA 620 38 589 36 331 20 109 7 1,649 11) Insomnia SL 889 54 451 27 230 14 79 5 1,649 12) Felt weak FA 873 53 480 29 204 12 89 5 1,646 13) Appetite loss AP 1,282 78 199 12 109 7 60 4 1,650 14) Nausea NV 1,360 83 195 12 73 4 21 1 1,649 15) Vomiting NV 1,527 93 90 6 24 2 10 1 1,651 16) Constipation CO 1,126 68 273 17 162 10 86 5 1,647 17) Diarrhoea DI 1,335 81 231 14 64 4 15 1 1,645 18) Felt tired FA 639 39 617 38 287 18 94 6 1,637 19) Pain interference PA 993 61 309 19 219 13 121 7 1,642 20) Concentration CF 1,182 72 316 19 109 7 38 2 1,645 21) Tension EF 897 55 539 33 166 10 40 2 1,642 22) Worry EF 728 44 574 35 262 16 82 5 1,646 23) Irritability EF 973 59 499 30 133 8 39 2 1,644 24) Depression EF 974 60 450 28 166 10 45 3 1,635 25) Memory trouble CF 777 47 631 39 190 12 42 3 1,640 26) Family life SF 1,107 68 301 18 148 9 83 5 1,639 27) Social activities SF 1,040 63 328 20 163 10 113 7 1,644 28) Financial difficulties FI 1,419 86 156 10 50 3 19 1 1,644 1 2 3 4 5 6 7 Total (very poor) (excellent) 29) Overall health QL 22 48 121 322 383 387 190 1,473 2 3 8 22 26 26 13 30) Overall quality of life QL 28 50 154 334 403 418 247 1,634 2 3 9 20 25 26 15

280
Prostate cancer: stage I-II Characteristics of the sample Version of the QLQ-C30 N (%) v 1.0 5 1 v +3 7 1 v 2.0 448 47 v 3.0 499 52 Total 959 Age N (%) <40 0 0 40-49 14 2 50-59 141 15 60-69 418 44 70-79 368 38 80+ 17 2 Not known 1 0 Total 959 Constructed scales Mean (SD) Median [IQR] Global health status/QoL QL 70.8 (20.5) 75 [58.3-83.3] Physical functioning PF 93.0 (12) 100 [93.3-100] Role Functioning RF 90.6 (20.3) 100 [83.3-100] Emotional functioning EF 78.0 (22.8) 83.3 [66.7-100] Cognitive functioning CF 86.1 (19.3) 100 [83.3-100] Social functioning SF 83.9 (25) 100 [66.7-100] Fatigue FA 18.9 (22.7) 11.1 [0-33.3] Nausea and vomiting NV 2.4 (9.1) 0 [0-0] Pain PA 14.6 (24.5) 0 [0-16.7] Dyspnoea DY 12.2 (22.6) 0 [0-33.3] Insomnia SL 20.9 (28.8) 0 [0-33.3] Appetite loss AP 4.9 (16.3) 0 [0-0] Constipation CO 8.8 (20.3) 0 [0-0] Diarrhoea DI 8.5 (20.2) 0 [0-0] Financial difficulties FI 8.5 (21.2) 0 [0-0]

281
Prostate cancer: stage I-II Constructed scales QL N (%) CF N (%) 0 6 1 0 5 1 8.3 0 0 16.7 7 1 16.7 7 1 33.3 25 3 25 8 1 50 50 5 33.3 39 4 66.7 123 13 41.7 38 4 83.3 231 24 50 136 14 100 508 54 58.3 52 6 Total 949 66.7 180 19 75 72 8 83.3 227 24 91.7 40 4 SF N (%) 100 137 15 0 27 3 Total 942 16.7 14 2 33.3 38 4 PF N (%) 50 50 5 0 0 0 66.7 127 13 6.7 0 0 83.3 131 14 13.3 0 0 100 565 59 20 1 0 Total 952 26.7 0 0 33.3 0 0 40 3 1 46.7 4 1 FA N (%) 53.3 1 0 0 409 43 60 12 2 11.1 133 14 66.7 10 2 22.2 126 13 73.3 16 3 33.3 120 13 80 27 5 44.4 61 6 86.7 45 9 55.6 35 4 93.3 85 17 66.7 37 4 100 292 59 77.8 12 1 Total 496 88.9 9 1 100 8 1 RF N (%) Total 950 0 17 2 16.7 6 1 33.3 25 3 50 20 2 NV N (%) 66.7 59 6 0 866 91 83.3 124 13 16.7 54 6 100 699 74 33.3 27 3 Total 950 50 3 0 66.7 1 0 EF N (%) 83.3 1 0 0 8 1 100 2 0 8.3 2 0 Total 954 16.7 13 1 25 18 2 33.3 25 3 41.7 33 4 PA N (%) 50 50 5 0 615 65 58.3 60 6 16.7 101 11 66.7 94 10 33.3 97 10 75 94 10 50 59 6 83.3 123 13 66.7 43 5 91.7 146 15 83.3 14 2 100 279 30 100 20 2 Total 945 Total 949

282
Prostate cancer: stage I-II Single Items Not at all A little Quite a bit Very much Total N (%) N (%) N (%) N (%) N 1) Strenuous activities PF 359 72 86 17 41 8 12 2 498 2) Long walk PF 350 70 92 18 43 9 14 3 499 3) Short walk PF 467 94 23 5 5 1 3 1 498 4) Bed or chair PF 452 91 37 7 7 1 1 0 497 5) Self care PF 492 99 5 1 1 0 0 0 498 6) Limited in work RF 732 77 152 16 40 4 27 3 951 7) Limited in leisure RF 810 85 88 9 30 3 25 3 953 8) Dyspnoea DY 697 73 188 20 54 6 18 2 957 9) Pain PA 661 69 162 17 99 10 34 4 956 10) Need to rest FA 531 55 296 31 108 11 23 2 958 11) Insomnia SL 561 59 232 24 123 13 41 4 957 12) Felt weak FA 636 67 224 24 74 8 21 2 955 13) Appetite loss AP 859 90 69 7 16 2 13 1 957 14) Nausea NV 872 91 64 7 13 1 6 1 955 15) Vomiting NV 932 98 19 2 3 0 2 0 956 16) Constipation CO 774 81 122 13 45 5 13 1 954 17) Diarrhoea DI 776 81 127 13 33 4 17 2 953 18) Felt tired FA 514 54 299 31 110 12 30 3 953 19) Pain interference PA 709 75 139 15 71 8 32 3 951 20) Concentration CF 735 77 164 17 45 5 11 1 955 21) Tension EF 510 54 322 34 93 10 28 3 953 22) Worry EF 411 43 320 34 155 16 68 7 954 23) Irritability EF 542 57 274 29 103 11 35 4 954 24) Depression EF 582 61 243 26 94 10 30 3 949 25) Memory trouble CF 563 59 287 30 81 9 19 2 950 26) Family life SF 635 67 193 20 83 9 43 5 954 27) Social activities SF 662 69 189 20 64 7 39 4 954 28) Financial difficulties FI 798 84 91 10 49 5 18 2 956 1 2 3 4 5 6 7 Total (very poor) (excellent) 29) Overall health QL 9 12 63 188 237 273 166 948 1 1 7 20 25 29 18 30) Overall quality of life QL 10 10 60 184 220 293 170 947 1 1 6 19 23 31 18

283
Prostate cancer: stage III-IV Characteristics of the sample Version of the QLQ-C30 N (%) v 1.0 0 0 v +3 0 0 v 2.0 1,293 86 v 3.0 218 14 Total 1,511 Age N (%) <40 0 0 40-49 10 1 50-59 114 8 60-69 608 40 70-79 704 47 80+ 75 5 Not known 0 0 Total 1,511 Constructed scales Mean (SD) Median [IQR] Global health status/QoL QL 68.3 (22.4) 66.7 [50-83.3] Physical functioning PF 53.2 (28.8) 53.3 [33.3-80] Role Functioning RF 81.4 (29.3) 100 [66.7-100] Emotional functioning EF 77.7 (22.5) 83.3 [66.7-100] Cognitive functioning CF 82.8 (21.3) 83.3 [66.7-100] Social functioning SF 81.5 (26.5) 100 [66.7-100] Fatigue FA 26.2 (26.5) 22.2 [0-44.4] Nausea and vomiting NV 4.7 (13.8) 0 [0-0] Pain PA 20.4 (29.1) 0 [0-33.3] Dyspnoea DY 17.6 (26.7) 0 [0-33.3] Insomnia SL 23.0 (29.6) 0 [0-33.3] Appetite loss AP 8.8 (22) 0 [0-0] Constipation CO 13.0 (26) 0 [0-0] Diarrhoea DI 7.8 (18.5) 0 [0-0] Financial difficulties FI 8.3 (20.5) 0 [0-0]
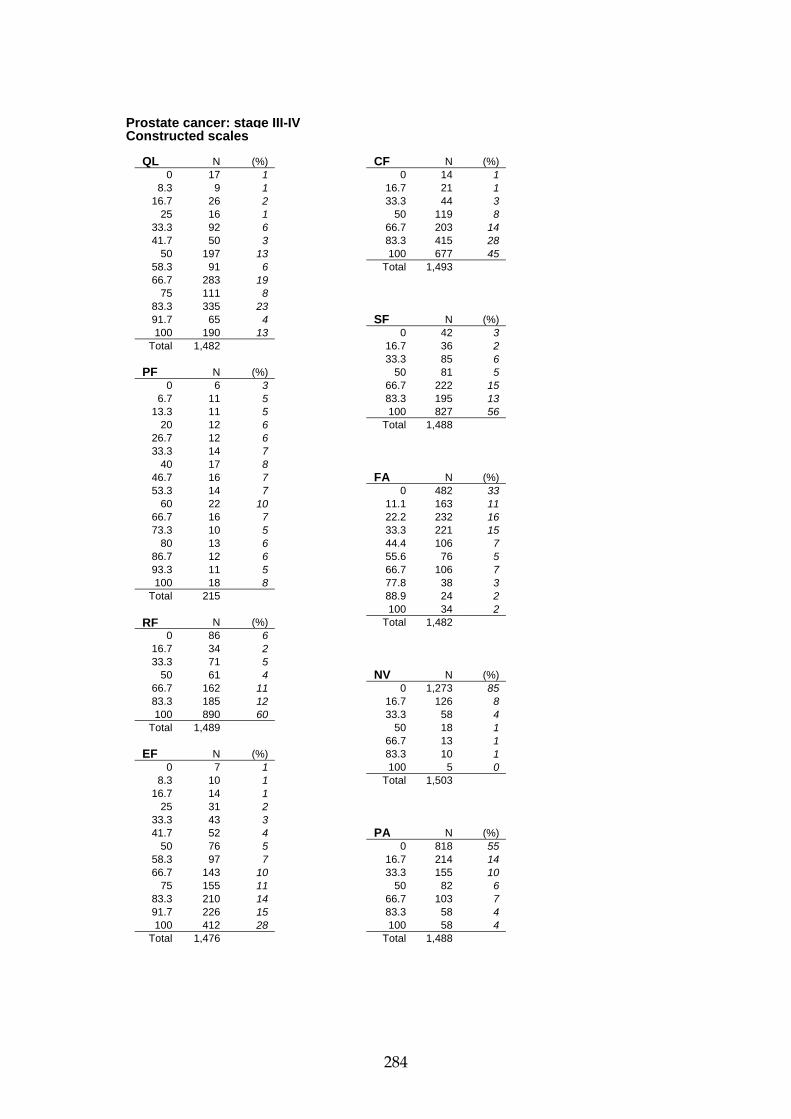
284
Prostate cancer: stage III-IV Constructed scales QL N (%) CF N (%) 0 17 1 0 14 1 8.3 9 1 16.7 21 1 16.7 26 2 33.3 44 3 25 16 1 50 119 8 33.3 92 6 66.7 203 14 41.7 50 3 83.3 415 28 50 197 13 100 677 45 58.3 91 6 Total 1,493 66.7 283 19 75 111 8 83.3 335 23 91.7 65 4 SF N (%) 100 190 13 0 42 3 Total 1,482 16.7 36 2 33.3 85 6 PF N (%) 50 81 5 0 6 3 66.7 222 15 6.7 11 5 83.3 195 13 13.3 11 5 100 827 56 20 12 6 Total 1,488 26.7 12 6 33.3 14 7 40 17 8 46.7 16 7 FA N (%) 53.3 14 7 0 482 33 60 22 10 11.1 163 11 66.7 16 7 22.2 232 16 73.3 10 5 33.3 221 15 80 13 6 44.4 106 7 86.7 12 6 55.6 76 5 93.3 11 5 66.7 106 7 100 18 8 77.8 38 3 Total 215 88.9 24 2 100 34 2 RF N (%) Total 1,482 0 86 6 16.7 34 2 33.3 71 5 50 61 4 NV N (%) 66.7 162 11 0 1,273 85 83.3 185 12 16.7 126 8 100 890 60 33.3 58 4 Total 1,489 50 18 1 66.7 13 1 EF N (%) 83.3 10 1 0 7 1 100 5 0 8.3 10 1 Total 1,503 16.7 14 1 25 31 2 33.3 43 3 41.7 52 4 PA N (%) 50 76 5 0 818 55 58.3 97 7 16.7 214 14 66.7 143 10 33.3 155 10 75 155 11 50 82 6 83.3 210 14 66.7 103 7 91.7 226 15 83.3 58 4 100 412 28 100 58 4 Total 1,476 Total 1,488

285
Prostate cancer: stage III-IV Single Items Not at all A little Quite a bit Very much Total N (%) N (%) N (%) N (%) N 1) Strenuous activities PF 37 17 45 21 67 31 68 31 217 2) Long walk PF 35 16 29 13 35 16 117 54 216 3) Short walk PF 78 36 50 23 46 21 43 20 217 4) Bed or chair PF 50 23 46 21 73 34 48 22 217 5) Self care PF 162 75 25 12 21 10 9 4 217 6) Limited in work RF 946 63 311 21 136 9 106 7 1,499 7) Limited in leisure RF 1,052 70 223 15 110 7 112 8 1,497 8) Dyspnoea DY 956 64 349 23 148 10 49 3 1,502 9) Pain PA 887 59 320 21 207 14 88 6 1,502 10) Need to rest FA 610 41 532 35 275 18 85 6 1,502 11) Insomnia SL 819 55 405 27 199 13 77 5 1,500 12) Felt weak FA 839 56 421 28 172 12 70 5 1,502 13) Appetite loss AP 1,248 83 152 10 65 4 39 3 1,504 14) Nausea NV 1,285 85 149 10 52 4 20 1 1,506 15) Vomiting NV 1,423 95 56 4 19 1 8 1 1,506 16) Constipation CO 1,136 76 214 14 94 6 61 4 1,505 17) Diarrhoea DI 1,235 82 201 13 54 4 14 1 1,504 18) Felt tired FA 645 43 543 36 226 15 78 5 1,492 19) Pain interference PA 1,009 67 238 16 150 10 100 7 1,497 20) Concentration CF 1,076 72 282 19 113 8 32 2 1,503 21) Tension EF 775 52 493 33 189 13 38 3 1,495 22) Worry EF 604 40 556 37 245 16 95 6 1,500 23) Irritability EF 843 56 469 31 142 10 40 3 1,494 24) Depression EF 894 60 401 27 151 10 47 3 1,493 25) Memory trouble CF 779 52 521 35 156 10 39 3 1,495 26) Family life SF 983 66 297 20 135 9 79 5 1,494 27) Social activities SF 953 64 311 21 147 10 85 6 1,496 28) Financial difficulties FI 1,237 83 175 12 54 4 30 2 1,496 1 2 3 4 5 6 7 Total (very poor) (excellent) 29) Overall health QL 29 43 116 287 384 418 213 1,490 2 3 8 19 26 28 14 30) Overall quality of life QL 29 42 116 251 373 417 260 1,488 2 3 8 17 25 28 18

286
Prostate cancer: recurrent/metastatic Characteristics of the sample Version of the QLQ-C30 N (%) v 1.0 202 32 v +3 0 0 v 2.0 317 50 v 3.0 121 19 Total 640 Age N (%) <40 1 0 40-49 8 1 50-59 51 8 60-69 205 32 70-79 307 48 80+ 68 11 Not known 0 0 Total 640 Constructed scales Mean (SD) Median [IQR] Global health status/QoL QL 62.1 (24.3) 66.7 [50-83.3] Physical functioning PF 74.9 (21.9) 80 [60-93.3] Role Functioning RF 67.0 (34.3) 66.7 [33.3-100] Emotional functioning EF 72.6 (22.9) 75 [58.3-91.7] Cognitive functioning CF 80.5 (21.1) 83.3 [66.7-100] Social functioning SF 73.2 (29.8) 83.3 [50-100] Fatigue FA 38.3 (27.7) 33.3 [11.1-55.6] Nausea and vomiting NV 9.2 (18.1) 0 [0-16.7] Pain PA 38.6 (32.7) 33.3 [0-66.7] Dyspnoea DY 21.5 (26.4) 0 [0-33.3] Insomnia SL 30.7 (32.1) 33.3 [0-66.7] Appetite loss AP 21.3 (30.7) 0 [0-33.3] Constipation CO 27.1 (34.4) 0 [0-66.7] Diarrhoea DI 9.5 (20) 0 [0-0] Financial difficulties FI 11.1 (23.3) 0 [0-0]

287
Prostate cancer: recurrent/metastatic Constructed scales QL N (%) CF N (%) 0 8 2 0 4 1 8.3 2 1 16.7 9 1 16.7 14 3 33.3 27 4 25 12 3 50 47 8 33.3 44 10 66.7 113 18 41.7 17 4 83.3 192 31 50 85 20 100 238 38 58.3 24 6 Total 630 66.7 68 16 75 21 5 83.3 76 18 91.7 21 5 SF N (%) 100 42 10 0 27 4 Total 434 16.7 26 4 33.3 62 10 PF N (%) 50 54 9 0 1 1 66.7 117 19 6.7 1 1 83.3 80 13 13.3 1 1 100 265 42 20 1 1 Total 631 26.7 2 2 33.3 1 1 40 3 3 46.7 3 3 FA N (%) 53.3 4 4 0 93 15 60 14 12 11.1 68 11 66.7 9 8 22.2 78 12 73.3 11 10 33.3 111 18 80 12 11 44.4 71 11 86.7 20 18 55.6 63 10 93.3 11 10 66.7 68 11 100 19 17 77.8 22 4 Total 113 88.9 34 5 100 19 3 RF N (%) Total 627 0 38 9 16.7 25 6 33.3 59 14 50 34 8 NV N (%) 66.7 65 15 0 455 72 83.3 39 9 16.7 88 14 100 174 40 33.3 52 8 Total 434 50 18 3 66.7 15 2 EF N (%) 83.3 4 1 0 2 0 100 4 1 8.3 6 1 Total 636 16.7 10 2 25 13 2 33.3 24 4 41.7 29 5 PA N (%) 50 44 7 0 169 27 58.3 63 10 16.7 87 14 66.7 75 12 33.3 99 16 75 82 13 50 79 13 83.3 79 13 66.7 100 16 91.7 82 13 83.3 46 7 100 120 19 100 52 8 Total 629 Total 632

288
Prostate cancer: recurrent/metastatic Single Items Not at all A little Quite a bit Very much Total N (%) N (%) N (%) N (%) N 1) Strenuous activities PF 29 24 52 44 23 19 15 13 119 2) Long walk PF 28 24 54 45 18 15 19 16 119 3) Short walk PF 68 58 37 32 7 6 5 4 117 4) Bed or chair PF 62 54 43 37 5 4 5 4 115 5) Self care PF 102 86 15 13 1 1 1 1 119 6) Limited in work RF 195 45 100 23 92 21 49 11 436 7) Limited in leisure RF 205 47 90 21 77 18 63 15 435 8) Dyspnoea DY 336 53 210 33 75 12 17 3 638 9) Pain PA 186 29 181 28 184 29 89 14 640 10) Need to rest FA 166 26 222 35 183 29 66 10 637 11) Insomnia SL 271 43 197 31 118 19 51 8 637 12) Felt weak FA 233 37 216 34 127 20 62 10 638 13) Appetite loss AP 387 61 135 21 77 12 40 6 639 14) Nausea NV 465 73 115 18 45 7 13 2 638 15) Vomiting NV 555 87 60 9 17 3 5 1 637 16) Constipation CO 349 55 116 18 110 17 60 9 635 17) Diarrhoea DI 495 78 107 17 25 4 8 1 635 18) Felt tired FA 139 22 282 45 163 26 48 8 632 19) Pain interference PA 261 41 162 26 130 21 79 13 632 20) Concentration CF 419 66 144 23 53 8 18 3 634 21) Tension EF 285 45 240 38 89 14 21 3 635 22) Worry EF 196 31 263 41 124 19 55 9 638 23) Irritability EF 328 52 221 35 71 11 16 3 636 24) Depression EF 265 42 235 37 108 17 24 4 632 25) Memory trouble CF 298 47 249 39 76 12 11 2 634 26) Family life SF 346 55 153 24 91 14 45 7 635 27) Social activities SF 306 48 162 26 105 17 61 10 634 28) Financial difficulties FI 492 78 91 14 36 6 16 3 635 1 2 3 4 5 6 7 Total (very poor) (excellent) 29) Overall health QL 9 25 54 109 90 97 51 435 2 6 12 25 21 22 12 30) Overall quality of life QL 16 36 102 163 135 116 66 634 3 6 16 26 21 18 10

289
Testicular cancer Characteristics of the sample Version of the QLQ-C30 N (%) v 1.0 26 7 v +3 1 0 v 2.0 170 44 v 3.0 187 49 Total 384 Age N (%) <40 322 84 40-49 50 13 50-59 9 2 60-69 2 1 70-79 1 0 80+ 0 0 Not known 0 0 Total 384 Stage N (%) Stage I-II 27 7 Stage III-IV 0 0 Recurrent/metastatic 356 93 Not known 1 0 Total 384 Constructed scales Mean (SD) Median [IQR] Global health status/QoL QL 58.4 (23.5) 58.3 [41.7-83.3] Physical functioning PF 81.6 (23.3) 93.3 [66.7-100] Role Functioning RF 55.4 (36.2) 50 [33.3-100] Emotional functioning EF 82.4 (22.9) 91.7 [66.7-100] Cognitive functioning CF 86.8 (19.5) 100 [83.3-100] Social functioning SF 72.7 (31.4) 83.3 [50-100] Fatigue FA 37.7 (29.1) 33.3 [11.1-55.6] Nausea and vomiting NV 10.4 (17.4) 0 [0-16.7] Pain PA 39.7 (35.3) 33.3 [0-66.7] Dyspnoea DY 18.3 (27.1) 0 [0-33.3] Insomnia SL 32.4 (34.5) 33.3 [0-66.7] Appetite loss AP 27.8 (32.4) 33.3 [0-33.3] Constipation CO 16.4 (27.9) 0 [0-33.3] Diarrhoea DI 8.7 (19.3) 0 [0-0] Financial difficulties FI 14.5 (27) 0 [0-33.3]

290
Testicular cancer Constructed scales QL N (%) CF N (%) 0 3 2 0 1 1 8.3 2 1 16.7 2 1 16.7 5 3 33.3 6 3 25 12 6 50 11 5 33.3 17 9 66.7 25 12 41.7 19 10 83.3 47 22 50 27 14 100 122 57 58.3 17 9 Total 214 66.7 19 10 75 17 9 83.3 33 18 91.7 13 7 SF N (%) 100 4 2 0 24 7 Total 188 16.7 18 5 33.3 25 7 PF N (%) 50 29 8 0 1 1 66.7 67 18 6.7 0 0 83.3 47 13 13.3 2 1 100 158 43 20 2 1 Total 368 26.7 4 2 33.3 1 1 40 3 2 46.7 6 4 FA N (%) 53.3 9 5 0 41 19 60 7 4 11.1 21 10 66.7 8 5 22.2 21 10 73.3 9 5 33.3 39 18 80 10 6 44.4 18 9 86.7 15 9 55.6 23 11 93.3 23 14 66.7 21 10 100 66 40 77.8 11 5 Total 166 88.9 10 5 100 8 4 RF N (%) Total 213 0 28 15 16.7 17 9 33.3 30 16 50 19 10 NV N (%) 66.7 29 16 0 139 65 83.3 12 6 16.7 37 17 100 52 28 33.3 26 12 Total 187 50 5 2 66.7 5 2 EF N (%) 83.3 2 1 0 3 1 100 0 0 8.3 2 1 Total 214 16.7 1 0 25 8 2 33.3 11 3 41.7 11 3 PA N (%) 50 16 4 0 62 29 58.3 9 2 16.7 28 13 66.7 37 10 33.3 33 15 75 30 8 50 18 8 83.3 35 9 66.7 28 13 91.7 40 11 83.3 20 9 100 172 46 100 25 12 Total 375 Total 214
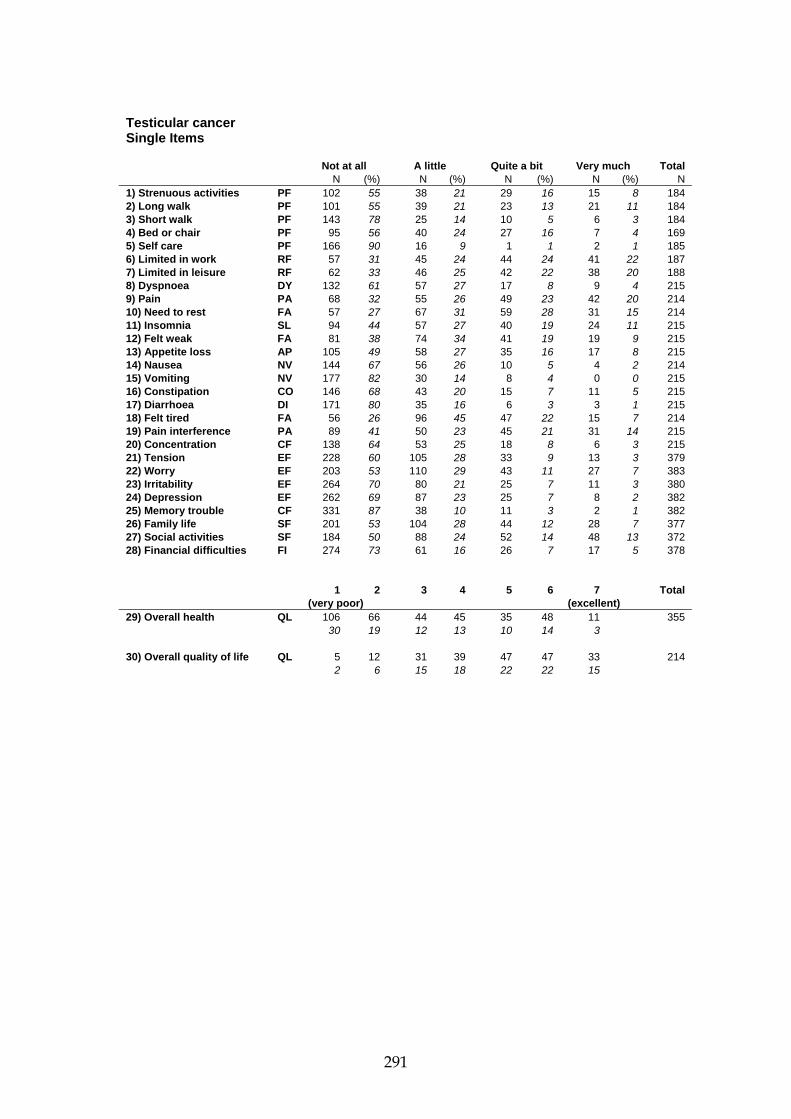
291
Testicular cancer Single Items Not at all A little Quite a bit Very much Total N (%) N (%) N (%) N (%) N 1) Strenuous activities PF 102 55 38 21 29 16 15 8 184 2) Long walk PF 101 55 39 21 23 13 21 11 184 3) Short walk PF 143 78 25 14 10 5 6 3 184 4) Bed or chair PF 95 56 40 24 27 16 7 4 169 5) Self care PF 166 90 16 9 1 1 2 1 185 6) Limited in work RF 57 31 45 24 44 24 41 22 187 7) Limited in leisure RF 62 33 46 25 42 22 38 20 188 8) Dyspnoea DY 132 61 57 27 17 8 9 4 215 9) Pain PA 68 32 55 26 49 23 42 20 214 10) Need to rest FA 57 27 67 31 59 28 31 15 214 11) Insomnia SL 94 44 57 27 40 19 24 11 215 12) Felt weak FA 81 38 74 34 41 19 19 9 215 13) Appetite loss AP 105 49 58 27 35 16 17 8 215 14) Nausea NV 144 67 56 26 10 5 4 2 214 15) Vomiting NV 177 82 30 14 8 4 0 0 215 16) Constipation CO 146 68 43 20 15 7 11 5 215 17) Diarrhoea DI 171 80 35 16 6 3 3 1 215 18) Felt tired FA 56 26 96 45 47 22 15 7 214 19) Pain interference PA 89 41 50 23 45 21 31 14 215 20) Concentration CF 138 64 53 25 18 8 6 3 215 21) Tension EF 228 60 105 28 33 9 13 3 379 22) Worry EF 203 53 110 29 43 11 27 7 383 23) Irritability EF 264 70 80 21 25 7 11 3 380 24) Depression EF 262 69 87 23 25 7 8 2 382 25) Memory trouble CF 331 87 38 10 11 3 2 1 382 26) Family life SF 201 53 104 28 44 12 28 7 377 27) Social activities SF 184 50 88 24 52 14 48 13 372 28) Financial difficulties FI 274 73 61 16 26 7 17 5 378 1 2 3 4 5 6 7 Total (very poor) (excellent) 29) Overall health QL 106 66 44 45 35 48 11 355 30 19 12 13 10 14 3 30) Overall quality of life QL 5 12 31 39 47 47 33 214 2 6 15 18 22 22 15
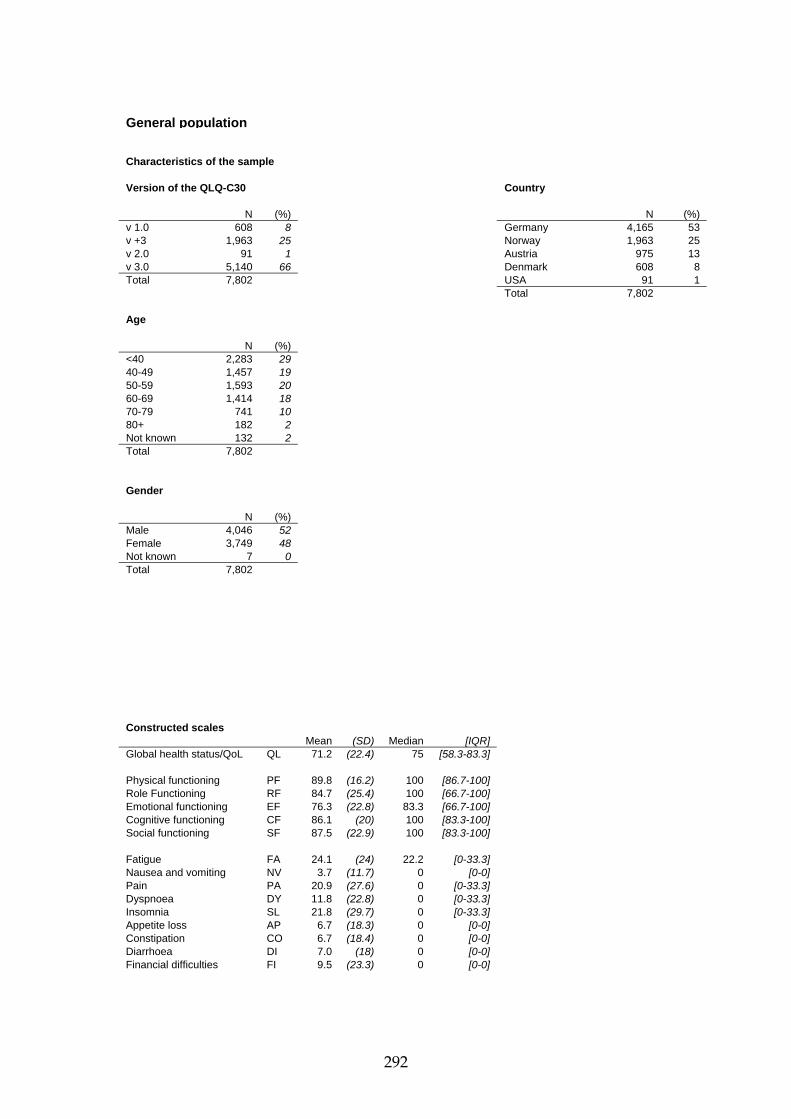
292
General population Characteristics of the sample Version of the QLQ-C30 Country N (%) N (%) v 1.0 608 8 Germany 4,165 53 v +3 1,963 25 Norway 1,963 25 v 2.0 91 1 Austria 975 13 v 3.0 5,140 66 Denmark 608 8 Total 7,802 USA 91 1 Total 7,802 Age N (%) <40 2,283 29 40-49 1,457 19 50-59 1,593 20 60-69 1,414 18 70-79 741 10 80+ 182 2 Not known 132 2 Total 7,802 Gender N (%) Male 4,046 52 Female 3,749 48 Not known 7 0 Total 7,802 Constructed scales Mean (SD) Median [IQR] Global health status/QoL QL 71.2 (22.4) 75 [58.3-83.3] Physical functioning PF 89.8 (16.2) 100 [86.7-100] Role Functioning RF 84.7 (25.4) 100 [66.7-100] Emotional functioning EF 76.3 (22.8) 83.3 [66.7-100] Cognitive functioning CF 86.1 (20) 100 [83.3-100] Social functioning SF 87.5 (22.9) 100 [83.3-100] Fatigue FA 24.1 (24) 22.2 [0-33.3] Nausea and vomiting NV 3.7 (11.7) 0 [0-0] Pain PA 20.9 (27.6) 0 [0-33.3] Dyspnoea DY 11.8 (22.8) 0 [0-33.3] Insomnia SL 21.8 (29.7) 0 [0-33.3] Appetite loss AP 6.7 (18.3) 0 [0-0] Constipation CO 6.7 (18.4) 0 [0-0] Diarrhoea DI 7.0 (18) 0 [0-0] Financial difficulties FI 9.5 (23.3) 0 [0-0]

293
General population Constructed scales QL N (%) CF N (%) 0 57 1 0 45 1 8.3 34 1 16.7 95 1 16.7 129 2 33.3 206 3 25 93 1 50 412 5 33.3 352 5 66.7 948 12 41.7 276 4 83.3 1,741 23 50 753 11 100 4,275 55 58.3 432 6 Total 7,722 66.7 1,059 15 75 721 10 83.3 1,495 21 91.7 649 9 SF N (%) 100 1,086 15 0 121 2 Total 7,136 16.7 115 2 33.3 304 4 PF N (%) 50 289 4 0 6 0 66.7 869 11 6.7 5 0 83.3 666 9 13.3 10 0 100 5,324 69 20 19 0 Total 7,688 26.7 15 0 33.3 33 1 40 47 1 46.7 73 1 FA N (%) 53.3 87 2 0 2,294 30 60 111 2 11.1 1,219 16 66.7 176 4 22.2 1,294 17 73.3 209 4 33.3 1,164 15 80 329 7 44.4 542 7 86.7 509 10 55.6 436 6 93.3 794 16 66.7 350 5 100 2,664 52 77.8 172 2 Total 5,087 88.9 115 2 100 90 1 RF N (%) Total 7,676 0 189 3 16.7 115 2 33.3 358 5 50 309 4 NV N (%) 66.7 826 12 0 6,701 87 83.3 742 11 16.7 617 8 100 4,480 64 33.3 242 3 Total 7,019 50 74 1 66.7 48 1 EF N (%) 83.3 21 0 0 49 1 100 17 0 8.3 49 1 Total 7,720 16.7 108 1 25 154 2 33.3 249 3 41.7 276 4 PA N (%) 50 395 5 0 3,938 51 58.3 461 6 16.7 1,116 15 66.7 886 12 33.3 1,069 14 75 939 12 50 547 7 83.3 1,084 14 66.7 570 7 91.7 1,061 14 83.3 221 3 100 1,945 25 100 229 3 Total 7,656 Total 7,690

294
General population Single Items Not at all A little Quite a bit Very much Total N (%) N (%) N (%) N (%) N 1) Strenuous activities PF 2,888 56 1,165 23 698 14 374 7 5,125 2) Long walk PF 3,668 72 765 15 426 8 267 5 5,126 3) Short walk PF 4,467 87 418 8 165 3 66 1 5,116 4) Bed or chair PF 4,604 90 343 7 122 2 39 1 5,108 5) Self care PF 4,995 98 77 2 36 1 15 0 5,123 6) Limited in work RF 4,892 69 1,281 18 625 9 283 4 7,081 7) Limited in leisure RF 5,030 71 1,191 17 564 8 307 4 7,092 8) Dyspnoea DY 5,781 75 1,303 17 501 7 142 2 7,727 9) Pain PA 4,289 56 1,935 25 1,123 15 383 5 7,730 10) Need to rest FA 3,679 48 2,680 35 1,045 14 325 4 7,729 11) Insomnia SL 4,467 58 1,914 25 951 12 415 5 7,747 12) Felt weak FA 4,557 59 2,164 28 788 10 234 3 7,743 13) Appetite loss AP 6,627 86 761 10 262 3 94 1 7,744 14) Nausea NV 6,747 87 740 10 192 3 60 1 7,739 15) Vomiting NV 7,422 96 201 3 72 1 32 0 7,727 16) Constipation CO 6,635 86 759 10 239 3 106 1 7,739 17) Diarrhoea DI 6,512 84 885 12 237 3 84 1 7,718 18) Felt tired FA 3,036 39 3,099 40 1,222 16 385 5 7,742 19) Pain interference PA 4,912 63 1,621 21 842 11 370 5 7,745 20) Concentration CF 5,828 75 1,365 18 406 5 144 2 7,743 21) Tension EF 3,891 50 2,650 34 912 12 272 4 7,725 22) Worry EF 3,443 45 2,628 34 1,165 15 499 7 7,735 23) Irritability EF 3,528 46 3,009 39 930 12 264 3 7,731 24) Depression EF 4,404 57 2,248 29 787 10 290 4 7,729 25) Memory trouble CF 4,806 62 2,168 28 621 8 155 2 7,750 26) Family life SF 5,770 75 1,278 17 473 6 190 3 7,711 27) Social activities SF 5,718 74 1,233 16 507 7 269 4 7,727 28) Financial difficulties FI 6,381 83 725 9 379 5 242 3 7,727 1 2 3 4 5 6 7 Total (very poor) (excellent) 29) Overall health QL 90 228 618 1,106 1,491 2,076 1,542 7,151 1 3 9 16 21 29 22 30) Overall quality of life QL 109 204 549 1,143 1,696 2,378 1,658 7,737 1 3 7 15 22 31 21
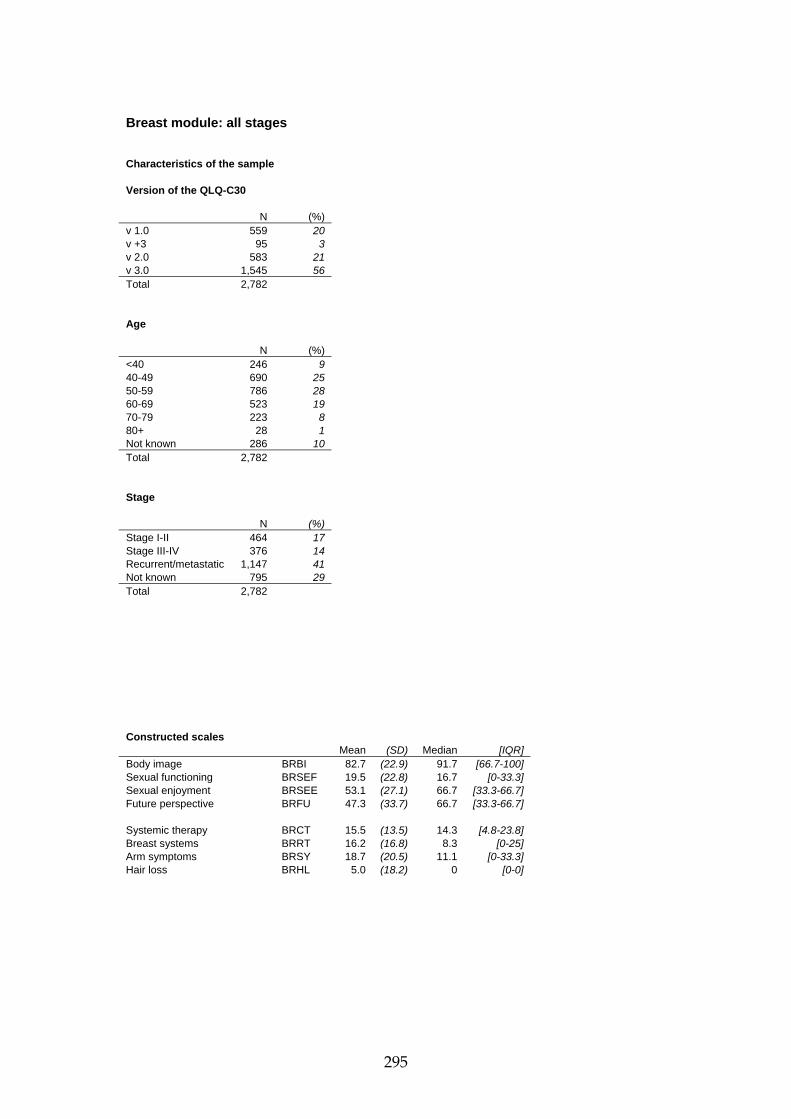
295
Breast module: all stages Characteristics of the sample Version of the QLQ-C30 N (%) v 1.0 559 20 v +3 95 3 v 2.0 583 21 v 3.0 1,545 56 Total 2,782 Age N (%) <40 246 9 40-49 690 25 50-59 786 28 60-69 523 19 70-79 223 8 80+ 28 1 Not known 286 10 Total 2,782 Stage N (%) Stage I-II 464 17 Stage III-IV 376 14 Recurrent/metastatic 1,147 41 Not known 795 29 Total 2,782 Constructed scales Mean (SD) Median [IQR] Body image BRBI 82.7 (22.9) 91.7 [66.7-100] Sexual functioning BRSEF 19.5 (22.8) 16.7 [0-33.3] Sexual enjoyment BRSEE 53.1 (27.1) 66.7 [33.3-66.7] Future perspective BRFU 47.3 (33.7) 66.7 [33.3-66.7] Systemic therapy BRCT 15.5 (13.5) 14.3 [4.8-23.8] Breast systems BRRT 16.2 (16.8) 8.3 [0-25] Arm symptoms BRSY 18.7 (20.5) 11.1 [0-33.3] Hair loss BRHL 5.0 (18.2) 0 [0-0]

296
Breast module: all stages Constructed scales BRBI N (%) BRRT N (%)
0 11 1 0 269 28 8.3 5 1 8.3 220 23
16.7 14 1 16.7 189 19 25 7 1 25 127 13
33.3 23 2 33.3 67 7 41.7 13 1 41.7 37 4
50 43 4 50 27 3 58.3 46 5 58.3 18 2 66.7 89 9 66.7 6 1
75 78 8 75 5 1 83.3 83 9 83.3 2 0 91.7 115 12 91.7 3 0 100 450 46 100 2 0
Total 977 Total 972 BRSEF N (%) BRSY N (%)
0 433 49 0 337 34 16.7 77 9 11.1 225 22 33.3 248 28 22.2 189 19
50 44 5 33.3 112 11 66.7 67 8 44.4 51 5 83.3 5 1 55.6 40 4 100 5 1 66.7 26 3
Total 879 77.8 9 1 88.9 9 1 BRCT N (%) 100 6 1
0 142 15 Total 1,004 4.8 160 17 9.5 150 16
14.3 133 14 19 121 13
23.8 81 8 28.6 64 7 33.3 35 4 38.1 32 3 42.9 17 2 47.6 9 1 52.4 4 0 57.1 6 1 61.9 2 0 66.7 1 0 71.4 3 0 76.2 2 0
81 0 0 85.7 1 0 90.5 1 0 95.2 0 0 100 0 0
Total 964

297
Breast module: all stages Single Items Not at all A little Quite a bit Very much Total N (%) N (%) N (%) N (%) N 1) Dry mouth BRCT 522 52 320 32 136 13 34 3 1,012 2) Food and drink BRCT 831 82 130 13 42 4 11 1 1,014 3) Painful eyes BRCT 762 75 197 20 41 4 10 1 1,010 4) Lost hair BRCT 852 85 99 10 25 3 28 3 1,004 5) Upset by hair loss BRHL 116 52 58 26 19 9 29 13 222 6) Feel ill or unwell BRCT 563 57 299 30 111 11 18 2 991 7) Hot flushes BRCT 508 51 289 29 158 16 48 5 1,003 8) Headaches BRCT 609 61 304 30 70 7 23 2 1,006 9) Less attractive BRBI 625 63 244 24 93 9 36 4 998 10 Less feminine BRBI 667 67 193 19 104 10 34 3 998 11) Look at self naked BRBI 667 66 218 22 79 8 43 4 1,007 12) Dissatisfied with body BRBI 621 62 244 24 95 10 38 4 998 13) Worried about health BRFU 150 15 364 36 253 25 241 24 1,008 14) Interested in sex BRSEF 497 55 305 34 92 10 10 1 904 15) Sexually active BRSEF 468 53 313 36 90 10 9 1 880 16) Sex enjoyable BRSEE 26 7 152 41 143 38 52 14 373 17) Pain in arm or shoulder BRSY 411 41 417 41 140 14 42 4 1,010 18) Swollen arm or hand BRSY 777 77 159 16 51 5 24 2 1,011 19) Difficulty raising arm BRSY 619 61 273 27 77 8 42 4 1,011 20) Pain in breast BRRT 457 46 444 44 80 8 22 2 1,003 21) Breast swollen BRRT 697 70 221 22 59 6 18 2 995 22) Breast oversensitive BRRT 545 55 336 34 91 9 21 2 993 23) Skin problems BRRT 775 77 159 16 55 6 14 1 1,003

298
Breast module: <50 Characteristics of the sample Version of the QLQ-C30 N (%) v 1.0 89 10 v +3 41 4 v 2.0 261 28 v 3.0 545 58 Total 936 Age N (%) <40 246 26 40-49 690 74 50-59 0 0 60-69 0 0 70-79 0 0 80+ 0 0 Not known 0 0 Total 936 Stage N (%) Stage I-II 217 23 Stage III-IV 135 14 Recurrent/metastatic 289 31 Not known 295 32 Total 936 Constructed scales Mean (SD) Median [IQR] Body image BRBI 81.3 (23.3) 91.7 [66.7-100] Sexual functioning BRSEF 26.7 (24.2) 33.3 [0-33.3] Sexual enjoyment BRSEE 55.2 (27.1) 66.7 [33.3-66.7] Future perspective BRFU 37.9 (33.2) 33.3 [0-66.7] Systemic therapy BRCT 15.3 (13) 14.3 [4.8-23.8] Breast systems BRRT 14.9 (15.4) 8.3 [0-25] Arm symptoms BRSY 15.7 (17.9) 11.1 [0-22.2] Hair loss BRHL 4.3 (16.7) 0 [0-0]

299
Breast module: <50 Constructed scales BRBI N (%) BRRT N (%)
0 5 1 0 98 28 8.3 1 0 8.3 90 25
16.7 5 1 16.7 72 20 25 4 1 25 42 12
33.3 6 2 33.3 23 7 41.7 9 3 41.7 12 3
50 17 5 50 9 3 58.3 23 6 58.3 3 1 66.7 29 8 66.7 2 1
75 30 8 75 1 0 83.3 37 10 83.3 1 0 91.7 40 11 91.7 0 0 100 152 43 100 1 0
Total 358 Total 354 BRSEF N (%) BRSY N (%)
0 118 35 0 141 39 16.7 26 8 11.1 82 23 33.3 123 37 22.2 71 20
50 20 6 33.3 31 9 66.7 44 13 44.4 14 4 83.3 4 1 55.6 17 5 100 2 1 66.7 6 2
Total 337 77.8 2 1 88.9 1 0 BRCT N (%) 100 0 0
0 51 15 Total 365 4.8 63 18 9.5 55 16
14.3 45 13 19 43 12
23.8 28 8 28.6 28 8 33.3 13 4 38.1 12 3 42.9 5 1 47.6 4 1 52.4 0 0 57.1 2 1 61.9 1 0 66.7 0 0 71.4 1 0 76.2 1 0
81 0 0 85.7 0 0 90.5 0 0 95.2 0 0 100 0 0
Total 352

300
Breast module: <50 Single Items Not at all A little Quite a bit Very much Total N (%) N (%) N (%) N (%) N 1) Dry mouth BRCT 196 54 108 30 54 15 6 2 364 2) Food and drink BRCT 294 80 53 15 16 4 3 1 366 3) Painful eyes BRCT 298 82 54 15 11 3 1 0 364 4) Lost hair BRCT 311 86 35 10 11 3 6 2 363 5) Upset by hair loss BRHL Insufficient data available 6) Feel ill or unwell BRCT 189 53 115 32 50 14 5 1 359 7) Hot flushes BRCT 192 53 96 26 64 18 11 3 363 8) Headaches BRCT 204 56 128 35 29 8 2 1 363 9) Less attractive BRBI 216 60 93 26 41 11 12 3 362 10 Less feminine BRBI 220 60 75 21 55 15 14 4 364 11) Look at self naked BRBI 243 67 80 22 26 7 16 4 365 12) Dissatisfied with body BRBI 222 61 90 25 34 9 16 4 362 13) Worried about health BRFU 32 9 113 31 93 26 127 35 365 14) Interested in sex BRSEF 138 40 144 42 56 16 6 2 344 15) Sexually active BRSEF 130 39 150 45 52 15 5 2 337 16) Sex enjoyable BRSEE 10 5 79 41 74 38 32 16 195 17) Pain in arm or shoulder BRSY 165 45 152 42 38 10 10 3 365 18) Swollen arm or hand BRSY 292 80 55 15 15 4 3 1 365 19) Difficulty raising arm BRSY 242 66 90 25 25 7 8 2 365 20) Pain in breast BRRT 162 45 168 46 25 7 7 2 362 21) Breast swollen BRRT 254 71 84 23 18 5 3 1 359 22) Breast oversensitive BRRT 215 60 110 31 27 8 5 1 357 23) Skin problems BRRT 284 78 61 17 12 3 7 2 364

301
Breast module: 50-59 Characteristics of the sample Version of the QLQ-C30 N (%) v 1.0 96 12 v +3 25 3 v 2.0 145 18 v 3.0 520 66 Total 786 Stage N (%) Stage I-II 140 18 Stage III-IV 109 14 Recurrent/metastatic 267 34 Not known 270 34 Total 786 Constructed scales Mean (SD) Median [IQR] Body image BRBI 80.5 (24) 91.7 [66.7-100] Sexual functioning BRSEF 20.7 (22.6) 16.7 [0-33.3] Sexual enjoyment BRSEE 51.9 (26.8) 66.7 [33.3-66.7] Future perspective BRFU 49.4 (31.8) 66.7 [33.3-66.7] Systemic therapy BRCT 16.0 (12.9) 14.3 [4.8-23.8] Breast systems BRRT 17.1 (17.2) 16.7 [4.2-25] Arm symptoms BRSY 21.1 (22.2) 11.1 [0-33.3] Hair loss BRHL 4.5 (17.5) 0 [0-0]

302
Breast module: 50-59 Constructed scales BRBI N (%) BRRT N (%)
0 5 2 0 75 25 8.3 2 1 8.3 69 23
16.7 5 2 16.7 57 19 25 3 1 25 47 16
33.3 9 3 33.3 22 7 41.7 2 1 41.7 9 3
50 15 5 50 7 2 58.3 15 5 58.3 7 2 66.7 31 10 66.7 2 1
75 26 9 75 2 1 83.3 29 10 83.3 1 0 91.7 40 13 91.7 2 1 100 122 40 100 0 0
Total 304 Total 300 BRSEF N (%) BRSY N (%)
0 123 45 0 94 30 16.7 32 12 11.1 66 21 33.3 81 29 22.2 57 18
50 16 6 33.3 37 12 66.7 21 8 44.4 21 7 83.3 1 0 55.6 12 4 100 2 1 66.7 12 4
Total 276 77.8 3 1 88.9 4 1 BRCT N (%) 100 3 1
0 36 12 Total 309 4.8 50 17 9.5 44 15
14.3 45 15 19 42 14
23.8 29 10 28.6 21 7 33.3 12 4 38.1 7 2 42.9 4 1 47.6 2 1 52.4 3 1 57.1 3 1 61.9 1 0 66.7 0 0 71.4 0 0 76.2 1 0
81 0 0 85.7 0 0 90.5 0 0 95.2 0 0 100 0 0
Total 300

303
Breast module: 50-59 Single Items Not at all A little Quite a bit Very much Total N (%) N (%) N (%) N (%) N 1) Dry mouth BRCT 163 52 104 33 37 12 9 3 313 2) Food and drink BRCT 266 86 31 10 10 3 4 1 311 3) Painful eyes BRCT 227 73 69 22 10 3 6 2 312 4) Lost hair BRCT 263 85 31 10 7 2 9 3 310 5) Upset by hair loss BRHL Insufficient data available 6) Feel ill or unwell BRCT 175 57 98 32 26 9 6 2 305 7) Hot flushes BRCT 130 42 109 35 49 16 23 7 311 8) Headaches BRCT 183 59 100 32 17 6 11 4 311 9) Less attractive BRBI 189 62 80 26 23 8 15 5 307 10 Less feminine BRBI 202 65 68 22 26 8 14 5 310 11) Look at self naked BRBI 184 60 75 24 32 10 18 6 309 12) Dissatisfied with body BRBI 173 56 83 27 40 13 13 4 309 13) Worried about health BRFU 42 14 126 41 83 27 60 19 311 14) Interested in sex BRSEF 145 51 109 38 28 10 3 1 285 15) Sexually active BRSEF 138 50 105 38 32 12 2 1 277 16) Sex enjoyable BRSEE 9 7 51 42 47 39 15 12 122 17) Pain in arm or shoulder BRSY 114 37 125 40 57 18 14 5 310 18) Swollen arm or hand BRSY 231 75 51 17 18 6 10 3 310 19) Difficulty raising arm BRSY 177 57 86 28 32 10 16 5 311 20) Pain in breast BRRT 135 44 136 44 28 9 9 3 308 21) Breast swollen BRRT 212 69 68 22 21 7 8 3 309 22) Breast oversensitive BRRT 162 53 105 34 33 11 6 2 306 23) Skin problems BRRT 240 78 45 15 18 6 3 1 306

304
Breast module: 60-69 Characteristics of the sample Version of the QLQ-C30 N (%) v 1.0 70 13 v +3 24 5 v 2.0 124 24 v 3.0 305 58 Total 523 Stage N (%) Stage I-II 77 15 Stage III-IV 73 14 Recurrent/metastatic 193 37 Not known 180 34 Total 523 Constructed scales Mean (SD) Median [IQR] Body image BRBI 85.0 (21.7) 100 [75-100] Sexual functioning BRSEF 11.3 (17.8) 0 [0-33.3] Sexual enjoyment BRSEE 49.1 (25.8) 33.3 [33.3-66.7] Future perspective BRFU 52.4 (34.3) 66.7 [33.3-66.7] Systemic therapy BRCT 16.0 (14.6) 14.3 [4.8-23.8] Breast systems BRRT 16.2 (16.9) 8.3 [0-25] Arm symptoms BRSY 20.8 (21.9) 11.1 [0-33.3] Hair loss BRHL 7.3 (21.6) 0 [0-0]

305
Breast module: 60-69 Constructed scales BRBI N (%) BRRT N (%)
0 1 0 0 73 32 8.3 2 1 8.3 42 18
16.7 2 1 16.7 37 16 25 0 0 25 32 14
33.3 7 3 33.3 17 8 41.7 2 1 41.7 12 5
50 10 4 50 7 3 58.3 8 4 58.3 6 3 66.7 22 10 66.7 0 0
75 15 7 75 1 0 83.3 14 6 83.3 0 0 91.7 23 10 91.7 1 0 100 120 53 100 0 0
Total 226 Total 228 BRSEF N (%) BRSY N (%)
0 130 66 0 69 29 16.7 15 8 11.1 60 25 33.3 42 21 22.2 38 16
50 7 4 33.3 31 13 66.7 2 1 44.4 14 6 83.3 0 0 55.6 10 4 100 1 1 66.7 8 3
Total 197 77.8 3 1 88.9 3 1 BRCT N (%) 100 2 1
0 34 15 Total 238 4.8 31 14 9.5 41 18
14.3 32 14 19 28 12
23.8 18 8 28.6 13 6 33.3 7 3 38.1 9 4 42.9 6 3 47.6 3 1 52.4 0 0 57.1 0 0 61.9 0 0 66.7 1 0 71.4 1 0 76.2 0 0
81 0 0 85.7 1 0 90.5 1 0 95.2 0 0 100 0 0
Total 226

306
Breast module: 60-69 Single Items Not at all A little Quite a bit Very much Total N (%) N (%) N (%) N (%) N 1) Dry mouth BRCT 118 49 80 33 32 13 12 5 242 2) Food and drink BRCT 199 82 31 13 11 5 3 1 244 3) Painful eyes BRCT 170 70 55 23 15 6 2 1 242 4) Lost hair BRCT 199 83 22 9 6 3 12 5 239 5) Upset by hair loss BRHL Insufficient data available 6) Feel ill or unwell BRCT 134 57 67 28 31 13 5 2 237 7) Hot flushes BRCT 132 55 64 27 31 13 13 5 240 8) Headaches BRCT 154 64 60 25 19 8 8 3 241 9) Less attractive BRBI 150 63 53 22 27 11 8 3 238 10 Less feminine BRBI 169 72 39 17 21 9 5 2 234 11) Look at self naked BRBI 168 69 50 21 18 7 6 3 242 12) Dissatisfied with body BRBI 159 67 56 24 16 7 6 3 237 13) Worried about health BRFU 51 21 81 34 62 26 46 19 240 14) Interested in sex BRSEF 148 72 50 24 7 3 1 1 206 15) Sexually active BRSEF 138 70 51 26 6 3 2 1 197 16) Sex enjoyable BRSEE Insufficient data available 17) Pain in arm or shoulder BRSY 90 37 105 43 31 13 17 7 243 18) Swollen arm or hand BRSY 179 74 44 18 12 5 8 3 243 19) Difficulty raising arm BRSY 143 59 68 28 15 6 16 7 242 20) Pain in breast BRRT 117 49 100 42 19 8 4 2 240 21) Breast swollen BRRT 166 71 52 22 15 6 2 1 235 22) Breast oversensitive BRRT 123 52 84 35 26 11 6 3 239 23) Skin problems BRRT 183 76 39 16 16 7 2 1 240

307
Breast module: recurrent/metastatic Characteristics of the sample Version of the QLQ-C30 N (%) v 1.0 291 25 v +3 0 0 v 2.0 202 18 v 3.0 654 57 Total 1,147 Age N (%) <40 85 7 40-49 204 18 50-59 267 23 60-69 193 17 70-79 98 9 80+ 14 1 Not known 286 25 Total 1,147 Constructed scales Mean (SD) Median [IQR] Body image BRBI 81.9 (22.6) 91.7 [66.7-100] Sexual functioning BRSEF 19.2 (23.2) 0 [0-33.3] Sexual enjoyment BRSEE 55.1 (25.6) 66.7 [33.3-66.7] Future perspective BRFU 47.6 (34.1) 66.7 [33.3-66.7] Systemic therapy BRCT 15.8 (14.3) 14.3 [4.8-23.8] Breast systems BRRT 17.6 (17.4) 16.7 [0-25] Arm symptoms BRSY 21.0 (21.1) 22.2 [0-33.3] Hair loss BRHL 5.3 (19.3) 0 [0-0]
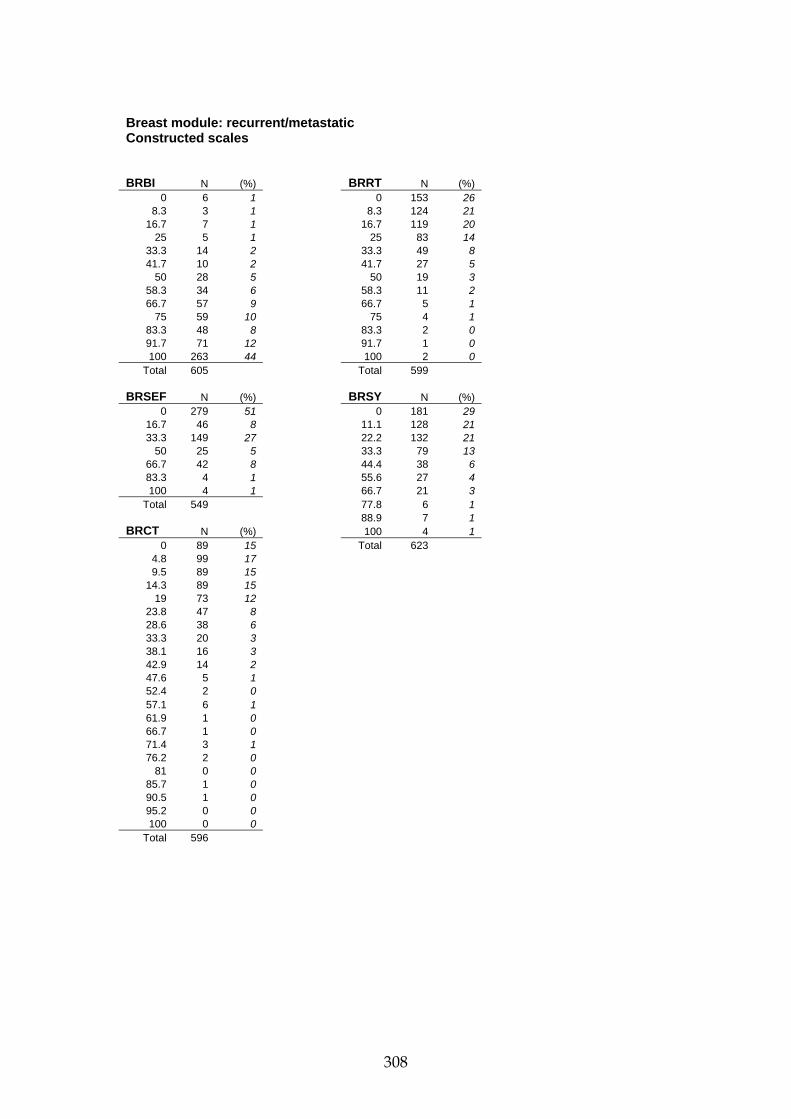
308
Breast module: recurrent/metastatic Constructed scales BRBI N (%) BRRT N (%)
0 6 1 0 153 26 8.3 3 1 8.3 124 21
16.7 7 1 16.7 119 20 25 5 1 25 83 14
33.3 14 2 33.3 49 8 41.7 10 2 41.7 27 5
50 28 5 50 19 3 58.3 34 6 58.3 11 2 66.7 57 9 66.7 5 1
75 59 10 75 4 1 83.3 48 8 83.3 2 0 91.7 71 12 91.7 1 0 100 263 44 100 2 0
Total 605 Total 599 BRSEF N (%) BRSY N (%)
0 279 51 0 181 29 16.7 46 8 11.1 128 21 33.3 149 27 22.2 132 21
50 25 5 33.3 79 13 66.7 42 8 44.4 38 6 83.3 4 1 55.6 27 4 100 4 1 66.7 21 3
Total 549 77.8 6 1 88.9 7 1 BRCT N (%) 100 4 1
0 89 15 Total 623 4.8 99 17 9.5 89 15
14.3 89 15 19 73 12
23.8 47 8 28.6 38 6 33.3 20 3 38.1 16 3 42.9 14 2 47.6 5 1 52.4 2 0 57.1 6 1 61.9 1 0 66.7 1 0 71.4 3 1 76.2 2 0
81 0 0 85.7 1 0 90.5 1 0 95.2 0 0 100 0 0
Total 596
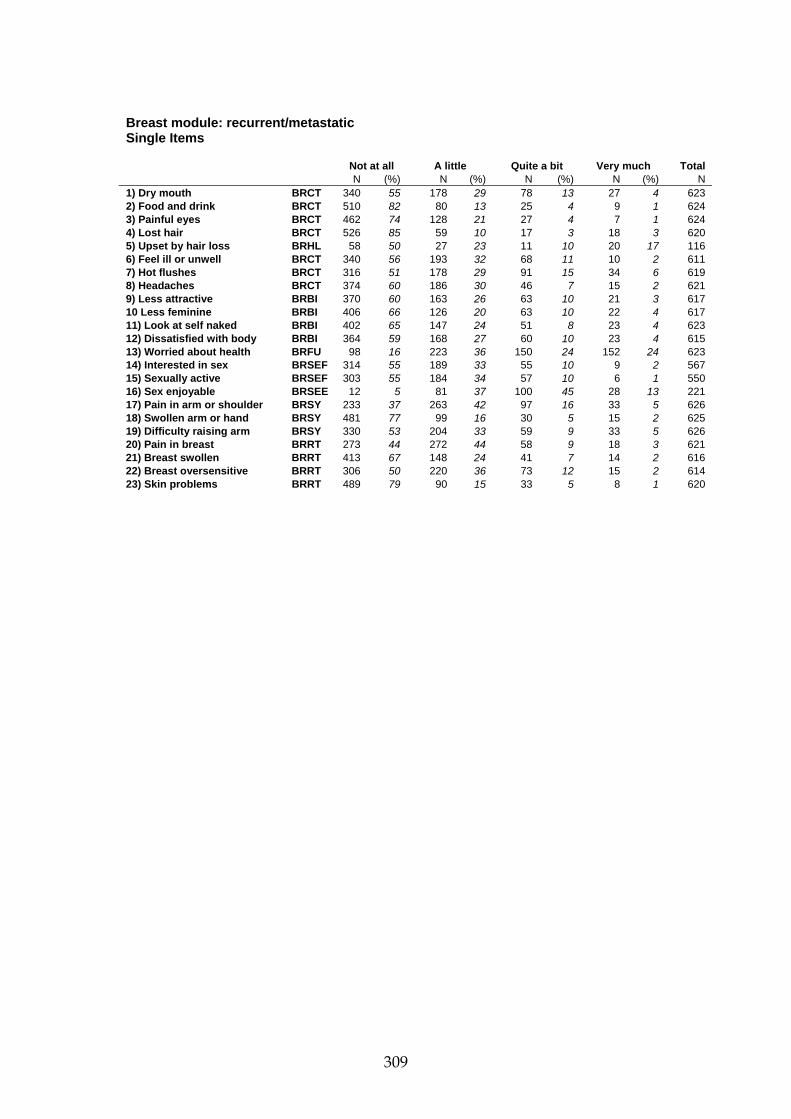
309
Breast module: recurrent/metastatic Single Items Not at all A little Quite a bit Very much Total N (%) N (%) N (%) N (%) N 1) Dry mouth BRCT 340 55 178 29 78 13 27 4 623 2) Food and drink BRCT 510 82 80 13 25 4 9 1 624 3) Painful eyes BRCT 462 74 128 21 27 4 7 1 624 4) Lost hair BRCT 526 85 59 10 17 3 18 3 620 5) Upset by hair loss BRHL 58 50 27 23 11 10 20 17 116 6) Feel ill or unwell BRCT 340 56 193 32 68 11 10 2 611 7) Hot flushes BRCT 316 51 178 29 91 15 34 6 619 8) Headaches BRCT 374 60 186 30 46 7 15 2 621 9) Less attractive BRBI 370 60 163 26 63 10 21 3 617 10 Less feminine BRBI 406 66 126 20 63 10 22 4 617 11) Look at self naked BRBI 402 65 147 24 51 8 23 4 623 12) Dissatisfied with body BRBI 364 59 168 27 60 10 23 4 615 13) Worried about health BRFU 98 16 223 36 150 24 152 24 623 14) Interested in sex BRSEF 314 55 189 33 55 10 9 2 567 15) Sexually active BRSEF 303 55 184 34 57 10 6 1 550 16) Sex enjoyable BRSEE 12 5 81 37 100 45 28 13 221 17) Pain in arm or shoulder BRSY 233 37 263 42 97 16 33 5 626 18) Swollen arm or hand BRSY 481 77 99 16 30 5 15 2 625 19) Difficulty raising arm BRSY 330 53 204 33 59 9 33 5 626 20) Pain in breast BRRT 273 44 272 44 58 9 18 3 621 21) Breast swollen BRRT 413 67 148 24 41 7 14 2 616 22) Breast oversensitive BRRT 306 50 220 36 73 12 15 2 614 23) Skin problems BRRT 489 79 90 15 33 5 8 1 620

310
Head and neck module: all stages Characteristics of the sample Version of the QLQ-C30 N (%) v 1.0 23 1 v +3 688 24 v 2.0 489 17 v 3.0 1,729 59 Total 2,929 Age N (%) <40 110 4 40-49 480 16 50-59 919 31 60-69 832 28 70-79 489 17 80+ 97 3 Not known 2 0 Total 2,929 Gender N (%) Male 2,318 79 Female 589 20 Not known 22 1 Total 2,929 Stage N (%) Stage I-II 946 32 Stage III-IV 1,722 59 Recurrent/metastatic 37 1 Not known 224 8 Total 2,929 Constructed scales Mean (SD) Median [IQR] Pain HNPA 27.1 (24) 25 [8.3-41.7] Swallowing HNSW 23.9 (25.3) 16.7 [0-41.7] Senses HNSE 19.3 (28.8) 0 [0-33.3] Speech HNSP 28.0 (27.6) 22.2 [0-44.4] Social eating HNSO 20.9 (25.1) 8.3 [0-33.3] Social contact HNSC 13.0 (18.9) 0 [0-20] Sexuality HNSX 31.3 (35.2) 16.7 [0-66.7] Teeth HNTE 25.5 (33.2) 0 [0-33.3] Opening mouth HNOM 19.5 (29.5) 0 [0-33.3] Dry mouth HNDR 30.7 (33.4) 33.3 [0-66.7] Sticky saliva HNSS 30.5 (33.9) 33.3 [0-66.7] Coughed HNCO 33.9 (32.2) 33.3 [0-66.7] Felt ill HNFI 21.6 (28.9) 0 [0-33.3] Pain killers HNPK 49.5 (50) 0 [0-100] Nutritional supp HNNU 26.7 (44.2) 0 [0-100] Feeding tube HNFE 19.7 (39.8) 0 [0-0] Weight loss HNWL 38.9 (48.8) 0 [0-100] Weight gain HNWG 27.3 (44.6) 0 [0-100]

311
Head and neck module: all stages Constructed scales
HNPA N (%) HNSO N (%)0 438 20 0 865 39
8.3 341 15 8.3 275 1216.7 297 13 16.7 222 10
25 232 10 25 136 633.3 338 15 33.3 299 1341.7 144 6 41.7 103 5
50 134 6 50 91 458.3 92 4 58.3 53 266.7 91 4 66.7 42 2
75 54 2 75 45 283.3 39 2 83.3 35 291.7 23 1 91.7 22 1100 25 1 100 43 2
Total 2,248 Total 2,231
HNSW N (%) HNSC N (%)0 761 34 0 1114 51
8.3 250 11 6.7 274 1316.7 192 9 13.3 176 8
25 174 8 20 96 433.3 287 13 26.7 78 441.7 135 6 33.3 219 10
50 129 6 40 67 358.3 91 4 46.7 51 266.7 63 3 53.3 33 2
75 81 4 60 22 183.3 31 1 66.7 22 191.7 15 1 73.3 13 1100 26 1 80 17 1
Total 2,235 0 86.7 9 0 93.3 2 0
HNSE N (%) 100 2 00 1,325 59 Total 2,195
16.7 212 9 33.3 300 13 HNSX N (%)
50 142 6 0 881 4566.7 117 5 16.7 113 683.3 57 3 33.3 376 19100 105 5 50 90 5
Total 2,258 66.7 241 12 83.3 40 2
HNSP N (%) 100 236 120 616 28 Total 1,977
11.1 401 18 22.2 279 13 33.3 260 12 44.4 188 9 55.6 138 6 66.7 130 6 77.8 110 5 88.9 47 2 100 54 2
Total 2,223

312
Head and neck module: all stages Single Items Not at all A little Quite a bit Very much Total N (%) N (%) N (%) N (%) N 1) Pain in mouth HNPA 1,036 45 762 33 323 14 160 7 2,281 2) Pain in jaw HNPA 1,273 56 663 29 217 10 124 5 2,277 3) Soreness in mouth HNPA 1,009 44 799 35 313 14 151 7 2,272 4) Painful throat HNPA 857 38 841 37 368 16 204 9 2,270 5) Problems swallowing liquids HNSW 1,210 53 652 29 260 11 159 7 2,281 6) Problems swallowing pureed food HNSW 1,324 58 613 27 206 9 124 6 2,267 7) Problems swallowing solid food HNSW 919 40 645 28 331 15 378 17 2,273 8) Choked when swallowing HNSW 1,513 67 532 23 139 6 86 4 2,270 9) Problems with teeth HNTE 1,209 54 541 24 257 12 215 10 2,222 10) Problems opening mouth wide HNOM 1,414 62 532 23 185 8 143 6 2,274 11) Dry mouth HNDR 1,002 44 691 30 345 15 239 11 2,277 12) Sticky saliva HNSS 1,026 45 647 29 342 15 247 11 2,262 13) Sense of smell HNSE 1,584 70 331 15 128 6 226 10 2,269 14) Sense of taste HNSE 1,428 63 475 21 207 9 164 7 2,274 15) Coughed HNCO 808 36 862 38 370 16 237 10 2,277 16) Been hoarse HNSP 915 41 647 29 363 16 318 14 2,243 17) Felt ill HNFI 1,265 56 673 30 208 9 128 6 2,274 18) Appearance bothered you HNSC 1,512 67 513 23 162 7 83 4 2,270 19) Trouble eating HNSO 1,020 45 680 30 323 14 250 11 2,273 20) Eating in front of family HNSO 1,651 73 436 19 97 4 72 3 2,256 21) Eating in front of other people HNSO 1,491 66 465 21 158 7 144 6 2,258 22) Trouble enjoying meals HNSO 1,235 55 612 27 241 11 177 8 2,265 23) Trouble talking to people HNSP 1,286 57 568 25 251 11 169 7 2,274 24) Trouble talking on telephone HNSP 1,205 53 522 23 294 13 249 11 2,270 25) Social contact with family HNSC 1,666 74 469 21 98 4 34 2 2,267 26) Social contact with friends HNSC 1,582 70 511 23 131 6 47 2 2,271 27) Trouble going out in public HNSC 1,620 71 439 19 144 6 73 3 2,276 28) Trouble with physical contact HNSC 1,672 75 416 19 95 4 46 2 2,229 29) Less interest in sex HNSX 940 46 494 24 325 16 280 14 2,039 30) Less sexual enjoyment HNSX 987 50 435 22 282 14 277 14 1,981 No Yes Total N (%) N (%) N 31) Used pain-killers HNPK 1,098 51 1,077 50 2,175 32) Taken nutritional supplements HNNU 1,645 73 598 27 2,243 33) Used feeding tube HNFE 1,808 80 443 20 2,251 34) Lost weight HNWL 1,345 61 855 39 2,200 35) Gained weight HNWG 1,555 73 584 27 2,139
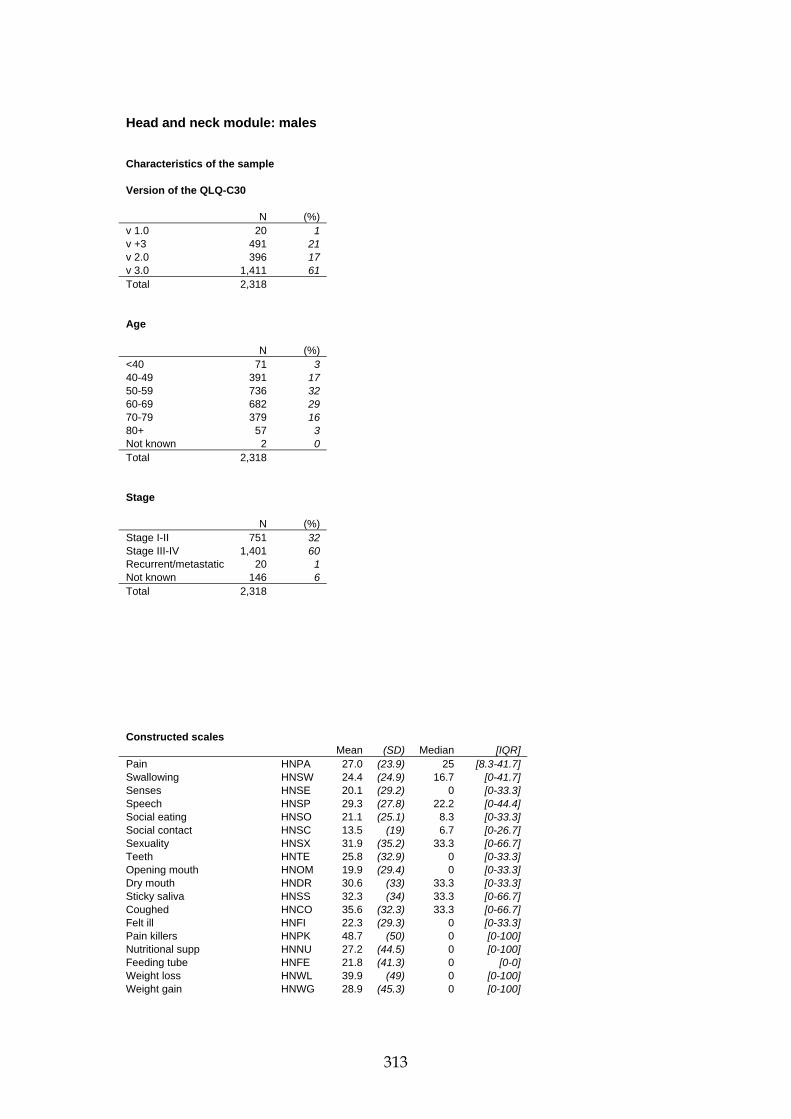
313
Head and neck module: males Characteristics of the sample Version of the QLQ-C30 N (%) v 1.0 20 1 v +3 491 21 v 2.0 396 17 v 3.0 1,411 61 Total 2,318 Age N (%) <40 71 3 40-49 391 17 50-59 736 32 60-69 682 29 70-79 379 16 80+ 57 3 Not known 2 0 Total 2,318 Stage N (%) Stage I-II 751 32 Stage III-IV 1,401 60 Recurrent/metastatic 20 1 Not known 146 6 Total 2,318 Constructed scales Mean (SD) Median [IQR] Pain HNPA 27.0 (23.9) 25 [8.3-41.7] Swallowing HNSW 24.4 (24.9) 16.7 [0-41.7] Senses HNSE 20.1 (29.2) 0 [0-33.3] Speech HNSP 29.3 (27.8) 22.2 [0-44.4] Social eating HNSO 21.1 (25.1) 8.3 [0-33.3] Social contact HNSC 13.5 (19) 6.7 [0-26.7] Sexuality HNSX 31.9 (35.2) 33.3 [0-66.7] Teeth HNTE 25.8 (32.9) 0 [0-33.3] Opening mouth HNOM 19.9 (29.4) 0 [0-33.3] Dry mouth HNDR 30.6 (33) 33.3 [0-33.3] Sticky saliva HNSS 32.3 (34) 33.3 [0-66.7] Coughed HNCO 35.6 (32.3) 33.3 [0-66.7] Felt ill HNFI 22.3 (29.3) 0 [0-33.3] Pain killers HNPK 48.7 (50) 0 [0-100] Nutritional supp HNNU 27.2 (44.5) 0 [0-100] Feeding tube HNFE 21.8 (41.3) 0 [0-0] Weight loss HNWL 39.9 (49) 0 [0-100] Weight gain HNWG 28.9 (45.3) 0 [0-100]

314
Head and neck module: males Constructed scales HNPA N (%) HNSO N (%)
0 353 20 0 691 39 8.3 279 16 8.3 222 12
16.7 228 13 16.7 172 10 25 178 10 25 106 6
33.3 275 15 33.3 253 14 41.7 116 7 41.7 82 5
50 117 7 50 76 4 58.3 66 4 58.3 43 2 66.7 78 4 66.7 36 2
75 41 2 75 35 2 83.3 32 2 83.3 26 1 91.7 17 1 91.7 19 1 100 18 1 100 34 2
Total 1,798 Total 1,795 HNSW N (%) HNSC N (%)
0 583 33 0 877 50 8.3 198 11 6.7 211 12
16.7 151 8 13.3 147 8 25 145 8 20 78 4
33.3 246 14 26.7 62 4 41.7 112 6 33.3 190 11
50 112 6 40 52 3 58.3 75 4 46.7 41 2 66.7 48 3 53.3 32 2
75 68 4 60 18 1 83.3 24 1 66.7 22 1 91.7 13 1 73.3 10 1 100 16 1 80 13 1
Total 1,791 0 86.7 6 0 93.3 1 0 HNSE N (%) 100 2 0
0 1,037 57 Total 1,762 16.7 176 10 33.3 244 14 HNSX N (%)
50 113 6 0 708 43 66.7 101 6 16.7 99 6 83.3 49 3 33.3 314 19 100 88 5 50 74 5
Total 1,808 66.7 203 12 83.3 38 2 HNSP N (%) 100 196 12
0 455 26 Total 1,632 11.1 314 18 22.2 225 13 33.3 216 12 44.4 158 9 55.6 118 7 66.7 111 6 77.8 96 5 88.9 43 2 100 42 2
Total 1,778

315
Head and neck module: males Single Items Not at all A little Quite a bit Very much Total N (%) N (%) N (%) N (%) N 1) Pain in mouth HNPA 838 46 615 34 256 14 115 6 1,824 2) Pain in jaw HNPA 1,014 56 537 30 176 10 94 5 1,821 3) Soreness in mouth HNPA 818 45 650 36 241 13 106 6 1,815 4) Painful throat HNPA 643 35 704 39 301 17 170 9 1,818 5) Problems swallowing liquids HNSW 929 51 559 31 216 12 121 7 1,825 6) Problems swallowing pureed food HNSW 1,029 57 527 29 168 9 92 5 1,816 7) Problems swallowing solid food HNSW 709 39 540 30 275 15 297 16 1,821 8) Choked when swallowing HNSW 1,188 65 443 24 117 6 69 4 1,817 9) Problems with teeth HNTE 946 53 461 26 206 12 168 9 1,781 10) Problems opening mouth wide HNOM 1,111 61 441 24 157 9 111 6 1,820 11) Dry mouth HNDR 790 43 578 32 271 15 184 10 1,823 12) Sticky saliva HNSS 765 42 544 30 293 16 207 11 1,809 13) Sense of smell HNSE 1,233 68 280 15 109 6 195 11 1,817 14) Sense of taste HNSE 1,126 62 401 22 160 9 132 7 1,819 15) Coughed HNCO 594 33 712 39 312 17 202 11 1,820 16) Been hoarse HNSP 675 38 548 31 307 17 263 15 1,793 17) Felt ill HNFI 991 55 547 30 171 9 110 6 1,819 18) Appearance bothered you HNSC 1,203 66 432 24 129 7 55 3 1,819 19) Trouble eating HNSO 811 45 564 31 259 14 188 10 1,822 20) Eating in front of family HNSO 1,301 72 375 21 76 4 60 3 1,812 21) Eating in front of other people HNSO 1,176 65 393 22 128 7 115 6 1,812 22) Trouble enjoying meals HNSO 983 54 515 28 189 10 131 7 1,818 23) Trouble talking to people HNSP 998 55 467 26 215 12 140 8 1,820 24) Trouble talking on telephone HNSP 923 51 440 24 244 13 209 12 1,816 25) Social contact with family HNSC 1,294 71 411 23 80 4 28 2 1,813 26) Social contact with friends HNSC 1,224 67 440 24 115 6 38 2 1,817 27) Trouble going out in public HNSC 1,281 70 372 20 110 6 57 3 1,820 28) Trouble with physical contact HNSC 1,308 73 359 20 84 5 37 2 1,788 29) Less interest in sex HNSX 759 45 422 25 268 16 233 14 1,682 30) Less sexual enjoyment HNSX 799 49 362 22 239 15 236 14 1,636 No Yes Total N (%) N (%) N 31) Used pain-killers HNPK 890 51 844 49 1,734 32) Taken nutritional supplements HNNU 1,306 73 487 27 1,793 33) Used feeding tube HNFE 1,408 78 392 22 1,800 34) Lost weight HNWL 1,055 60 701 40 1,756 35) Gained weight HNWG 1,216 71 494 29 1,710

316
Head and neck module: females Characteristics of the sample Version of the QLQ-C30 N (%) v 1.0 3 1 v +3 197 33 v 2.0 82 14 v 3.0 307 52 Total 589 Age N (%) <40 38 7 40-49 85 14 50-59 176 30 60-69 143 24 70-79 107 18 80+ 40 7 Not known 0 0 Total 589 Stage N (%) Stage I-II 195 33 Stage III-IV 316 54 Recurrent/metastatic 17 3 Not known 61 10 Total 589 Constructed scales Mean (SD) Median [IQR] Pain HNPA 27.6 (24.6) 25 [8.3-41.7] Swallowing HNSW 21.7 (26.4) 8.3 [0-33.3] Senses HNSE 16.0 (26.6) 0 [0-33.3] Speech HNSP 22.5 (26.4) 11.1 [0-33.3] Social eating HNSO 20.2 (25.1) 8.3 [0-33.3] Social contact HNSC 11.5 (18.4) 0 [0-16.7] Sexuality HNSX 28.1 (34.6) 0 [0-50] Teeth HNTE 24.9 (34.7) 0 [0-33.3] Opening mouth HNOM 18.0 (29.9) 0 [0-33.3] Dry mouth HNDR 31.6 (35.5) 33.3 [0-66.7] Sticky saliva HNSS 23.2 (32.4) 0 [0-33.3] Coughed HNCO 27.4 (31.2) 33.3 [0-33.3] Felt ill HNFI 18.5 (26.8) 0 [0-33.3] Pain killers HNPK 52.4 (50) 100 [0-100] Nutritional supp HNNU 24.3 (42.9) 0 [0-0] Feeding tube HNFE 11.4 (31.8) 0 [0-0] Weight loss HNWL 35.1 (47.8) 0 [0-100] Weight gain HNWG 20.8 (40.7) 0 [0-0]

317
Head and neck module: females Constructed scales HNPA N (%) HNSO N (%)
0 83 19 0 165 40 8.3 54 13 8.3 51 12
16.7 65 15 16.7 49 12 25 53 12 25 29 7
33.3 62 15 33.3 44 11 41.7 26 6 41.7 20 5
50 16 4 50 14 3 58.3 25 6 58.3 9 2 66.7 13 3 66.7 6 1
75 13 3 75 10 2 83.3 7 2 83.3 7 2 91.7 5 1 91.7 3 1 100 7 2 100 9 2
Total 429 Total 416 HNSW N (%) HNSC N (%)
0 171 40 0 223 54 8.3 48 11 6.7 58 14
16.7 40 10 13.3 28 7 25 27 6 20 18 4
33.3 41 10 26.7 15 4 41.7 21 5 33.3 29 7
50 16 4 40 15 4 58.3 16 4 46.7 10 2 66.7 14 3 53.3 1 0
75 10 2 60 4 1 83.3 7 2 66.7 0 0 91.7 2 1 73.3 3 1 100 10 2 80 4 1
Total 423 0 86.7 3 1 93.3 1 0 HNSE N (%) 100 0 0
0 276 65 Total 412 16.7 35 8 33.3 52 12 HNSX N (%)
50 26 6 0 164 51 66.7 16 4 16.7 12 4 83.3 7 2 33.3 58 18 100 16 4 50 16 5
Total 428 66.7 36 11 83.3 2 1 HNSP N (%) 100 36 11
0 156 37 Total 324 11.1 81 19 22.2 48 11 33.3 42 10 44.4 29 7 55.6 19 5 66.7 19 5 77.8 14 3 88.9 3 1 100 12 3
Total 423

318
Head and neck module: females Single Items Not at all A little Quite a bit Very much Total N (%) N (%) N (%) N (%) N 1) Pain in mouth HNPA 187 43 140 32 64 15 44 10 435 2) Pain in jaw HNPA 244 56 123 28 38 9 29 7 434 3) Soreness in mouth HNPA 178 41 144 33 69 16 44 10 435 4) Painful throat HNPA 207 48 128 30 63 15 33 8 431 5) Problems swallowing liquids HNSW 269 62 89 21 41 9 35 8 434 6) Problems swallowing pureed food HNSW 284 66 81 19 35 8 29 7 429 7) Problems swallowing solid food HNSW 199 46 103 24 54 13 75 17 431 8) Choked when swallowing HNSW 306 71 88 20 20 5 17 4 431 9) Problems with teeth HNTE 248 59 76 18 50 12 46 11 420 10) Problems opening mouth wide HNOM 288 67 86 20 27 6 31 7 432 11) Dry mouth HNDR 202 47 104 24 72 17 54 13 432 12) Sticky saliva HNSS 251 58 97 23 46 11 37 9 431 13) Sense of smell HNSE 337 78 46 11 19 4 28 7 430 14) Sense of taste HNSE 289 67 70 16 43 10 31 7 433 15) Coughed HNCO 202 46 143 33 57 13 34 8 436 16) Been hoarse HNSP 231 54 91 21 52 12 54 13 428 17) Felt ill HNFI 262 60 120 28 35 8 17 4 434 18) Appearance bothered you HNSC 290 68 78 18 33 8 28 7 429 19) Trouble eating HNSO 199 46 112 26 61 14 57 13 429 20) Eating in front of family HNSO 331 78 61 14 19 5 12 3 423 21) Eating in front of other people HNSO 298 70 71 17 27 6 28 7 424 22) Trouble enjoying meals HNSO 240 56 93 22 50 12 43 10 426 23) Trouble talking to people HNSP 273 63 95 22 35 8 29 7 432 24) Trouble talking on telephone HNSP 268 62 78 18 48 11 38 9 432 25) Social contact with family HNSC 350 81 58 13 18 4 6 1 432 26) Social contact with friends HNSC 339 78 69 16 16 4 9 2 433 27) Trouble going out in public HNSC 319 74 66 15 33 8 16 4 434 28) Trouble with physical contact HNSC 346 82 54 13 11 3 9 2 420 29) Less interest in sex HNSX 172 51 66 20 55 16 43 13 336 30) Less sexual enjoyment HNSX 177 55 69 21 41 13 37 11 324 No Yes Total N (%) N (%) N 31) Used pain-killers HNPK 200 48 220 52 420 32) Taken nutritional supplements HNNU 324 76 104 24 428 33) Used feeding tube HNFE 380 89 49 11 429 34) Lost weight HNWL 274 65 148 35 422 35) Gained weight HNWG 323 79 85 21 408

319
Head and neck module: <50 Characteristics of the sample Version of the QLQ-C30 N (%) v 1.0 8 1 v +3 113 19 v 2.0 116 20 v 3.0 353 60 Total 590 Age N (%) <40 110 19 40-49 480 81 50-59 0 0 60-69 0 0 70-79 0 0 80+ 0 0 Not known 0 0 Total 590 Gender N (%) Male 462 78 Female 123 21 Not known 5 1 Total 590 Stage N (%) Stage I-II 122 21 Stage III-IV 391 66 Recurrent/metastatic 4 1 Not known 73 12 Total 590 Constructed scales Mean (SD) Median [IQR] Pain HNPA 27.9 (24) 25 [8.3-41.7] Swallowing HNSW 25.6 (25.2) 16.7 [0-41.7] Senses HNSE 15.0 (25.4) 0 [0-16.7] Speech HNSP 22.9 (25.1) 11.1 [0-33.3] Social eating HNSO 21.4 (24.6) 16.7 [0-33.3] Social contact HNSC 11.4 (16.9) 6.7 [0-13.3] Sexuality HNSX 24.2 (31.4) 0 [0-33.3] Teeth HNTE 24.6 (32.5) 0 [0-33.3] Opening mouth HNOM 23.5 (31.4) 0 [0-33.3] Dry mouth HNDR 25.5 (31.7) 0 [0-33.3] Sticky saliva HNSS 29.2 (34.1) 33.3 [0-66.7] Coughed HNCO 32.1 (29.6) 33.3 [0-33.3] Felt ill HNFI 19.9 (26.5) 0 [0-33.3] Pain killers HNPK 46.0 (49.9) 0 [0-100] Nutritional supp HNNU 21.9 (41.4) 0 [0-0] Feeding tube HNFE 12.7 (33.4) 0 [0-0] Weight loss HNWL 34.8 (47.7) 0 [0-100] Weight gain HNWG 26.9 (44.4) 0 [0-100]

320
Head and neck module: <50 Constructed scales HNPA N (%) HNSO N (%)
0 60 15 0 139 34 8.3 66 16 8.3 60 15
16.7 75 18 16.7 51 12 25 50 12 25 41 10
33.3 47 11 33.3 44 11 41.7 35 9 41.7 20 5
50 14 3 50 12 3 58.3 18 4 58.3 8 2 66.7 20 5 66.7 10 2
75 12 3 75 11 3 83.3 3 1 83.3 8 2 91.7 8 2 91.7 4 1 100 5 1 100 6 1
Total 413 Total 414 HNSW N (%) HNSC N (%)
0 116 28 0 203 49 8.3 48 12 6.7 62 15
16.7 48 12 13.3 47 11 25 37 9 20 26 6
33.3 50 12 26.7 20 5 41.7 24 6 33.3 17 4
50 20 5 40 9 2 58.3 22 5 46.7 8 2 66.7 13 3 53.3 9 2
75 15 4 60 4 1 83.3 11 3 66.7 4 1 91.7 3 1 73.3 0 0 100 2 1 80 3 1
Total 409 0 86.7 1 0 93.3 0 0 HNSE N (%) 100 0 0
0 266 64 Total 413 16.7 45 11 33.3 47 11 HNSX N (%)
50 24 6 0 203 52 66.7 11 3 16.7 33 8 83.3 8 2 33.3 70 18 100 13 3 50 15 4
Total 414 66.7 41 10 83.3 3 1 HNSP N (%) 100 29 7
0 125 31 Total 394 11.1 92 22 22.2 68 17 33.3 38 9 44.4 24 6 55.6 17 4 66.7 22 5 77.8 9 2 88.9 8 2 100 7 2
Total 410

321
Head and neck module: <50 Single Items Not at all A little Quite a bit Very much Total N (%) N (%) N (%) N (%) N 1) Pain in mouth HNPA 195 47 129 31 61 15 32 8 417 2) Pain in jaw HNPA 232 56 119 29 46 11 21 5 418 3) Soreness in mouth HNPA 187 45 149 36 53 13 27 7 416 4) Painful throat HNPA 135 32 167 40 81 19 35 8 418 5) Problems swallowing liquids HNSW 210 50 116 28 61 15 31 7 418 6) Problems swallowing pureed food HNSW 242 58 102 25 50 12 21 5 415 7) Problems swallowing solid food HNSW 145 35 117 28 76 18 77 19 415 8) Choked when swallowing HNSW 284 68 102 25 16 4 15 4 417 9) Problems with teeth HNTE 224 55 107 26 41 10 38 9 410 10) Problems opening mouth wide HNOM 233 56 107 26 46 11 32 8 418 11) Dry mouth HNDR 217 52 114 27 55 13 32 8 418 12) Sticky saliva HNSS 201 48 110 27 59 14 45 11 415 13) Sense of smell HNSE 317 76 57 14 13 3 29 7 416 14) Sense of taste HNSE 280 67 85 20 34 8 18 4 417 15) Coughed HNCO 143 34 175 42 70 17 29 7 417 16) Been hoarse HNSP 193 47 118 29 60 15 40 10 411 17) Felt ill HNFI 237 57 125 30 43 10 13 3 418 18) Appearance bothered you HNSC 276 66 87 21 40 10 15 4 418 19) Trouble eating HNSO 167 40 140 34 64 15 47 11 418 20) Eating in front of family HNSO 325 78 64 15 15 4 14 3 418 21) Eating in front of other people HNSO 281 67 79 19 24 6 33 8 417 22) Trouble enjoying meals HNSO 220 53 112 27 56 14 28 7 416 23) Trouble talking to people HNSP 264 63 93 22 38 9 24 6 419 24) Trouble talking on telephone HNSP 254 61 88 21 43 10 32 8 417 25) Social contact with family HNSC 324 77 74 18 16 4 5 1 419 26) Social contact with friends HNSC 301 72 78 19 30 7 8 2 417 27) Trouble going out in public HNSC 326 78 62 15 23 6 6 1 417 28) Trouble with physical contact HNSC 338 81 51 12 20 5 7 2 416 29) Less interest in sex HNSX 216 53 103 25 55 14 31 8 405 30) Less sexual enjoyment HNSX 229 58 83 21 49 12 33 8 394 No Yes Total N (%) N (%) N 31) Used pain-killers HNPK 222 54 189 46 411 32) Taken nutritional supplements HNNU 325 78 91 22 416 33) Used feeding tube HNFE 363 87 53 13 416 34) Lost weight HNWL 270 65 144 35 414 35) Gained weight HNWG 296 73 109 27 405

322
Head and neck module: 50-59 Characteristics of the sample Version of the QLQ-C30 N (%) v 1.0 8 1 v +3 219 24 v 2.0 185 20 v 3.0 507 55 Total 919 Age N (%) <40 0 0 40-49 0 0 50-59 919 100 60-69 0 0 70-79 0 0 80+ 0 0 Not known 0 0 Total 919 Gender N (%) Male 736 80 Female 176 19 Not known 7 1 Total 919 Stage N (%) Stage I-II 247 27 Stage III-IV 599 65 Recurrent/metastatic 9 1 Not known 64 7 Total 919 Constructed scales Mean (SD) Median [IQR] Pain HNPA 27.0 (23.9) 25 [8.3-41.7] Swallowing HNSW 24.2 (25.5) 16.7 [0-41.7] Senses HNSE 18.1 (27.8) 0 [0-33.3] Speech HNSP 25.6 (26.8) 22.2 [0-44.4] Social eating HNSO 20.8 (26) 8.3 [0-33.3] Social contact HNSC 11.7 (18.1) 0 [0-13.3] Sexuality HNSX 28.4 (34.4) 16.7 [0-50] Teeth HNTE 24.2 (33) 0 [0-33.3] Opening mouth HNOM 19.2 (31.1) 0 [0-33.3] Dry mouth HNDR 27.5 (33.1) 33.3 [0-33.3] Sticky saliva HNSS 29.5 (34.3) 33.3 [0-66.7] Coughed HNCO 31.9 (30.7) 33.3 [0-33.3] Felt ill HNFI 21.2 (29.7) 0 [0-33.3] Pain killers HNPK 50.3 (50) 100 [0-100] Nutritional supp HNNU 24.6 (43.1) 0 [0-0] Feeding tube HNFE 15.5 (36.3) 0 [0-0] Weight loss HNWL 36.2 (48.1) 0 [0-100] Weight gain HNWG 24.1 (42.8) 0 [0-0]

323
Head and neck module: 50-59 Constructed scales HNPA N (%) HNSO N (%)
0 130 19 0 278 40 8.3 110 16 8.3 98 14
16.7 94 14 16.7 63 9 25 85 12 25 43 6
33.3 94 14 33.3 75 11 41.7 38 6 41.7 29 4
50 46 7 50 30 4 58.3 30 4 58.3 16 2 66.7 24 3 66.7 12 2
75 18 3 75 20 3 83.3 13 2 83.3 12 2 91.7 5 1 91.7 6 1 100 9 1 100 16 2
Total 696 Total 698 HNSW N (%) HNSC N (%)
0 241 34 0 359 53 8.3 75 11 6.7 96 14
16.7 54 8 13.3 61 9 25 72 10 20 24 4
33.3 72 10 26.7 28 4 41.7 43 6 33.3 49 7
50 38 5 40 19 3 58.3 33 5 46.7 12 2 66.7 23 3 53.3 10 2
75 32 5 60 8 1 83.3 7 1 66.7 6 1 91.7 2 0 73.3 4 1 100 9 1 80 4 1
Total 701 0 86.7 3 0 93.3 1 0 HNSE N (%) 100 0 0
0 419 60 Total 684 16.7 82 12 33.3 77 11 HNSX N (%)
50 40 6 0 312 49 66.7 38 5 16.7 33 5 83.3 22 3 33.3 109 17 100 24 3 50 28 4
Total 702 66.7 74 12 83.3 10 2 HNSP N (%) 100 66 10
0 222 32 Total 632 11.1 118 17 22.2 83 12 33.3 80 12 44.4 55 8 55.6 40 6 66.7 38 6 77.8 31 5 88.9 8 1 100 15 2
Total 690

324
Head and neck module: 50-59 Single Items Not at all A little Quite a bit Very much Total N (%) N (%) N (%) N (%) N 1) Pain in mouth HNPA 327 46 233 33 107 15 45 6 712 2) Pain in jaw HNPA 399 56 196 28 80 11 36 5 711 3) Soreness in mouth HNPA 331 47 218 31 106 15 52 7 707 4) Painful throat HNPA 274 39 241 34 121 17 71 10 707 5) Problems swallowing liquids HNSW 387 54 194 27 86 12 45 6 712 6) Problems swallowing pureed food HNSW 411 58 182 26 74 10 43 6 710 7) Problems swallowing solid food HNSW 281 39 200 28 107 15 125 18 713 8) Choked when swallowing HNSW 489 69 145 20 49 7 27 4 710 9) Problems with teeth HNTE 399 58 146 21 87 13 61 9 693 10) Problems opening mouth wide HNOM 469 66 131 18 55 8 56 8 711 11) Dry mouth HNDR 351 49 207 29 82 12 72 10 712 12) Sticky saliva HNSS 341 48 184 26 103 15 78 11 706 13) Sense of smell HNSE 516 73 87 12 43 6 59 8 705 14) Sense of taste HNSE 460 65 127 18 73 10 50 7 710 15) Coughed HNCO 260 37 283 40 111 16 59 8 713 16) Been hoarse HNSP 325 47 180 26 103 15 90 13 698 17) Felt ill HNFI 405 57 201 29 51 7 49 7 706 18) Appearance bothered you HNSC 484 68 146 21 59 8 20 3 709 19) Trouble eating HNSO 324 46 197 28 108 15 80 11 709 20) Eating in front of family HNSO 532 76 107 15 39 6 27 4 705 21) Eating in front of other people HNSO 496 71 114 16 55 8 39 6 704 22) Trouble enjoying meals HNSO 393 56 165 23 85 12 62 9 705 23) Trouble talking to people HNSP 419 59 174 25 71 10 44 6 708 24) Trouble talking on telephone HNSP 398 56 150 21 88 12 72 10 708 25) Social contact with family HNSC 541 77 122 17 30 4 13 2 706 26) Social contact with friends HNSC 512 72 145 21 35 5 15 2 707 27) Trouble going out in public HNSC 530 75 112 16 42 6 24 3 708 28) Trouble with physical contact HNSC 546 79 111 16 25 4 10 1 692 29) Less interest in sex HNSX 326 50 146 22 101 16 80 12 653 30) Less sexual enjoyment HNSX 345 54 127 20 86 14 77 12 635 No Yes Total N (%) N (%) N 31) Used pain-killers HNPK 339 50 343 50 682 32) Taken nutritional supplements HNNU 529 75 173 25 702 33) Used feeding tube HNFE 592 85 109 16 701 34) Lost weight HNWL 440 64 250 36 690 35) Gained weight HNWG 511 76 162 24 673

325
Head and neck module: 60-69 Characteristics of the sample Version of the QLQ-C30 N (%) v 1.0 3 0 v +3 161 19 v 2.0 138 17 v 3.0 530 64 Total 832 Age N (%) <40 0 0 40-49 0 0 50-59 0 0 60-69 832 100 70-79 0 0 80+ 0 0 Not known 0 0 Total 832 Gender N (%) Male 682 82 Female 143 17 Not known 7 1 Total 832 Stage N (%) Stage I-II 327 39 Stage III-IV 437 53 Recurrent/metastatic 12 1 Not known 56 7 Total 832 Constructed scales Mean (SD) Median [IQR] Pain HNPA 25.8 (23.7) 25 [8.3-41.7] Swallowing HNSW 23.6 (26.1) 16.7 [0-41.7] Senses HNSE 21.3 (30.4) 0 [0-33.3] Speech HNSP 31.1 (28.4) 22.2 [11.1-44.4] Social eating HNSO 21.3 (26.2) 8.3 [0-33.3] Social contact HNSC 14.9 (20.7) 6.7 [0-33.3] Sexuality HNSX 34.2 (35.3) 33.3 [0-66.7] Teeth HNTE 26.6 (34.3) 0 [0-33.3] Opening mouth HNOM 18.2 (27.9) 0 [0-33.3] Dry mouth HNDR 33.1 (34.1) 33.3 [0-66.7] Sticky saliva HNSS 30.5 (33.2) 33.3 [0-66.7] Coughed HNCO 36.0 (34) 33.3 [0-66.7] Felt ill HNFI 22.8 (29.9) 0 [0-33.3] Pain killers HNPK 48.2 (50) 0 [0-100] Nutritional supp HNNU 28.9 (45.4) 0 [0-100] Feeding tube HNFE 25.1 (43.4) 0 [0-100] Weight loss HNWL 40.9 (49.2) 0 [0-100] Weight gain HNWG 29.8 (45.8) 0 [0-100]

326
Head and neck module: 60-69 Constructed scales HNPA N (%) HNSO N (%)
0 143 22 0 269 42 8.3 101 16 8.3 56 9
16.7 72 11 16.7 60 9 25 61 10 25 31 5
33.3 104 16 33.3 97 15 41.7 35 5 41.7 27 4
50 49 8 50 29 5 58.3 21 3 58.3 16 3 66.7 18 3 66.7 11 2
75 16 3 75 8 1 83.3 12 2 83.3 8 1 91.7 6 1 91.7 9 1 100 5 1 100 18 3
Total 643 Total 639 HNSW N (%) HNSC N (%)
0 244 38 0 313 50 8.3 62 10 6.7 68 11
16.7 44 7 13.3 36 6 25 37 6 20 30 5
33.3 84 13 26.7 18 3 41.7 38 6 33.3 81 13
50 47 7 40 23 4 58.3 23 4 46.7 19 3 66.7 15 2 53.3 9 1
75 17 3 60 7 1 83.3 10 2 66.7 6 1 91.7 9 1 73.3 6 1 100 9 1 80 6 1
Total 639 0 86.7 5 1 93.3 0 0 HNSE N (%) 100 2 0
0 375 58 Total 629 16.7 40 6 33.3 94 15 HNSX N (%)
50 37 6 0 233 40 66.7 46 7 16.7 32 6 83.3 18 3 33.3 113 20 100 35 5 50 33 6
Total 645 66.7 81 14 83.3 18 3 HNSP N (%) 100 70 12
0 154 24 Total 580 11.1 110 17 22.2 66 10 33.3 89 14 44.4 61 10 55.6 49 8 66.7 38 6 77.8 35 6 88.9 18 3 100 19 3
Total 639

327
Head and neck module: 60-69 Single Items Not at all A little Quite a bit Very much Total N (%) N (%) N (%) N (%) N 1) Pain in mouth HNPA 308 47 227 35 76 12 42 6 653 2) Pain in jaw HNPA 366 56 198 31 51 8 35 5 650 3) Soreness in mouth HNPA 303 47 241 37 78 12 29 5 651 4) Painful throat HNPA 239 37 255 39 88 14 66 10 648 5) Problems swallowing liquids HNSW 351 54 188 29 66 10 47 7 652 6) Problems swallowing pureed food HNSW 383 59 176 27 54 8 34 5 647 7) Problems swallowing solid food HNSW 291 45 166 26 86 13 107 17 650 8) Choked when swallowing HNSW 414 64 160 25 42 7 32 5 648 9) Problems with teeth HNTE 339 53 160 25 63 10 74 12 636 10) Problems opening mouth wide HNOM 407 63 164 25 42 7 35 5 648 11) Dry mouth HNDR 268 41 194 30 113 17 75 12 650 12) Sticky saliva HNSS 289 45 190 29 108 17 63 10 650 13) Sense of smell HNSE 433 67 96 15 43 7 78 12 650 14) Sense of taste HNSE 398 61 136 21 65 10 50 8 649 15) Coughed HNCO 226 35 229 35 106 16 86 13 647 16) Been hoarse HNSP 202 31 214 33 116 18 112 17 644 17) Felt ill HNFI 355 54 192 29 62 10 43 7 652 18) Appearance bothered you HNSC 413 64 160 25 44 7 33 5 650 19) Trouble eating HNSO 308 47 188 29 85 13 71 11 652 20) Eating in front of family HNSO 449 69 140 22 33 5 25 4 647 21) Eating in front of other people HNSO 409 63 139 22 48 7 50 8 646 22) Trouble enjoying meals HNSO 358 55 189 29 49 8 53 8 649 23) Trouble talking to people HNSP 359 55 164 25 72 11 57 9 652 24) Trouble talking on telephone HNSP 330 51 152 23 93 14 76 12 651 25) Social contact with family HNSC 454 70 158 24 32 5 8 1 652 26) Social contact with friends HNSC 435 67 156 24 47 7 15 2 653 27) Trouble going out in public HNSC 444 68 140 21 44 7 28 4 656 28) Trouble with physical contact HNSC 452 71 136 21 31 5 20 3 639 29) Less interest in sex HNSX 252 43 143 24 109 18 88 15 592 30) Less sexual enjoyment HNSX 265 46 135 23 95 16 86 15 581 No Yes Total N (%) N (%) N 31) Used pain-killers HNPK 320 52 298 48 618 32) Taken nutritional supplements HNNU 453 71 184 29 637 33) Used feeding tube HNFE 484 75 162 25 646 34) Lost weight HNWL 367 59 254 41 621 35) Gained weight HNWG 425 70 180 30 605

328
Head and neck module: ≥70 Characteristics of the sample Version of the QLQ-C30 N (%) v 1.0 4 1 v +3 194 33 v 2.0 50 9 v 3.0 338 58 Total 586 Age N (%) <40 0 0 40-49 0 0 50-59 0 0 60-69 0 0 70-79 489 83 80+ 97 17 Not known 0 0 Total 586 Gender N (%) Male 436 74 Female 147 25 Not known 3 1 Total 586 Stage N (%) Stage I-II 250 43 Stage III-IV 294 50 Recurrent/metastatic 12 2 Not known 30 5 Total 586 Constructed scales Mean (SD) Median [IQR] Pain HNPA 28.2 (24.6) 25 [8.3-41.7] Swallowing HNSW 22.5 (23.8) 16.7 [0-33.3] Senses HNSE 22.1 (30) 0 [0-33.3] Speech HNSP 31.5 (28.7) 22.2 [11.1-55.6] Social eating HNSO 20.1 (22.6) 8.3 [0-33.3] Social contact HNSC 13.7 (18.8) 0 [0-33.3] Sexuality HNSX 39.1 (37.8) 33.3 [0-66.7] Teeth HNTE 26.7 (32.7) 0 [0-33.3] Opening mouth HNOM 18.4 (27.1) 0 [0-33.3] Dry mouth HNDR 36.7 (33.4) 33.3 [0-66.7] Sticky saliva HNSS 33.3 (34.1) 33.3 [0-66.7] Coughed HNCO 35.4 (33.8) 33.3 [0-66.7] Felt ill HNFI 21.9 (28.2) 0 [0-33.3] Pain killers HNPK 53.2 (49.9) 100 [0-100] Nutritional supp HNNU 30.7 (46.2) 0 [0-100] Feeding tube HNFE 24.3 (42.9) 0 [0-0] Weight loss HNWL 43.6 (49.6) 0 [0-100] Weight gain HNWG 29.2 (45.5) 0 [0-100]
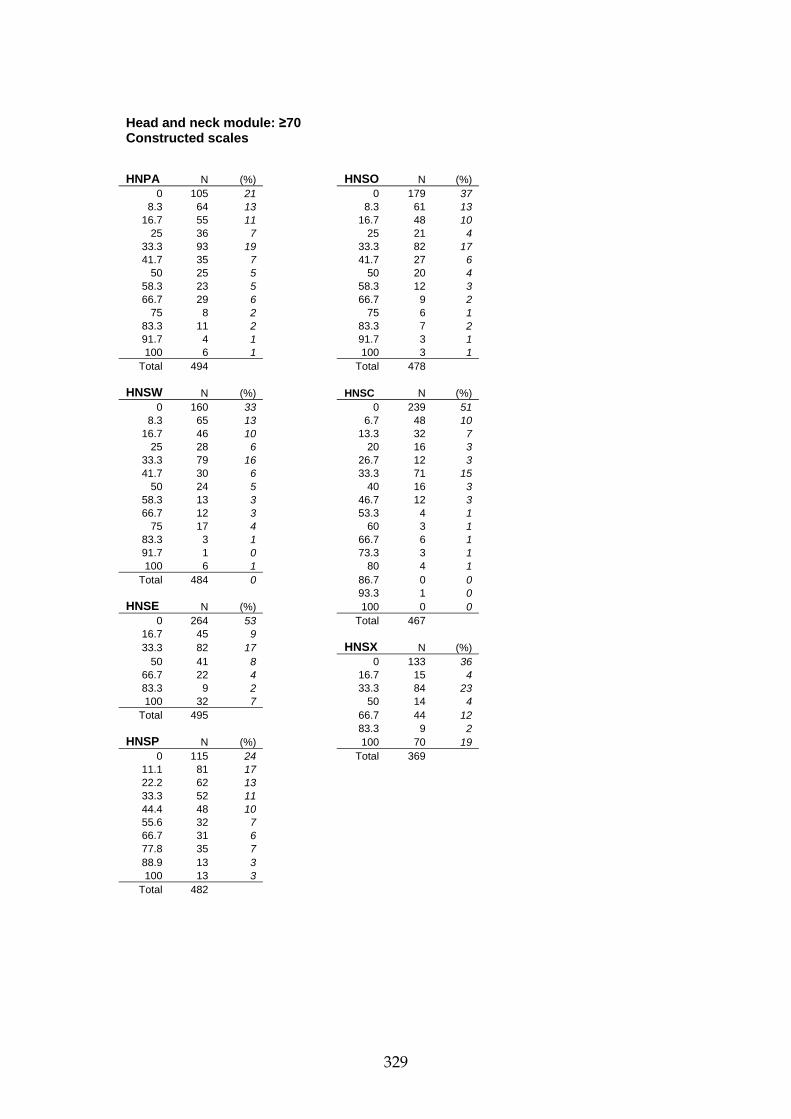
329
Head and neck module: ≥70 Constructed scales HNPA N (%) HNSO N (%)
0 105 21 0 179 37 8.3 64 13 8.3 61 13
16.7 55 11 16.7 48 10 25 36 7 25 21 4
33.3 93 19 33.3 82 17 41.7 35 7 41.7 27 6
50 25 5 50 20 4 58.3 23 5 58.3 12 3 66.7 29 6 66.7 9 2
75 8 2 75 6 1 83.3 11 2 83.3 7 2 91.7 4 1 91.7 3 1 100 6 1 100 3 1
Total 494 Total 478 HNSW N (%) HNSC N (%)
0 160 33 0 239 51 8.3 65 13 6.7 48 10
16.7 46 10 13.3 32 7 25 28 6 20 16 3
33.3 79 16 26.7 12 3 41.7 30 6 33.3 71 15
50 24 5 40 16 3 58.3 13 3 46.7 12 3 66.7 12 3 53.3 4 1
75 17 4 60 3 1 83.3 3 1 66.7 6 1 91.7 1 0 73.3 3 1 100 6 1 80 4 1
Total 484 0 86.7 0 0 93.3 1 0 HNSE N (%) 100 0 0
0 264 53 Total 467 16.7 45 9 33.3 82 17 HNSX N (%)
50 41 8 0 133 36 66.7 22 4 16.7 15 4 83.3 9 2 33.3 84 23 100 32 7 50 14 4
Total 495 66.7 44 12 83.3 9 2 HNSP N (%) 100 70 19
0 115 24 Total 369 11.1 81 17 22.2 62 13 33.3 52 11 44.4 48 10 55.6 32 7 66.7 31 6 77.8 35 7 88.9 13 3 100 13 3
Total 482

330
Head and neck module: ≥70 Single Items Not at all A little Quite a bit Very much Total N (%) N (%) N (%) N (%) N 1) Pain in mouth HNPA 205 41 172 35 79 16 41 8 497 2) Pain in jaw HNPA 275 55 150 30 39 8 32 7 496 3) Soreness in mouth HNPA 187 38 190 38 76 15 43 9 496 4) Painful throat HNPA 209 42 177 36 77 16 32 7 495 5) Problems swallowing liquids HNSW 262 53 152 31 47 10 36 7 497 6) Problems swallowing pureed food HNSW 288 58 151 31 28 6 26 5 493 7) Problems swallowing solid food HNSW 202 41 161 33 61 12 69 14 493 8) Choked when swallowing HNSW 325 66 124 25 32 7 12 2 493 9) Problems with teeth HNTE 246 51 127 26 66 14 42 9 481 10) Problems opening mouth wide HNOM 304 61 129 26 42 9 20 4 495 11) Dry mouth HNDR 165 33 175 35 95 19 60 12 495 12) Sticky saliva HNSS 194 40 162 33 72 15 61 13 489 13) Sense of smell HNSE 317 64 91 18 29 6 59 12 496 14) Sense of taste HNSE 289 58 127 26 35 7 45 9 496 15) Coughed HNCO 178 36 174 35 83 17 63 13 498 16) Been hoarse HNSP 195 40 134 28 83 17 76 16 488 17) Felt ill HNFI 268 54 153 31 52 11 23 5 496 18) Appearance bothered you HNSC 338 69 119 24 19 4 15 3 491 19) Trouble eating HNSO 221 45 154 31 66 13 51 10 492 20) Eating in front of family HNSO 345 71 123 25 10 2 6 1 484 21) Eating in front of other people HNSO 305 62 132 27 30 6 22 5 489 22) Trouble enjoying meals HNSO 264 54 144 29 51 10 34 7 493 23) Trouble talking to people HNSP 244 50 136 28 69 14 44 9 493 24) Trouble talking on telephone HNSP 223 45 131 27 69 14 69 14 492 25) Social contact with family HNSC 347 71 114 23 19 4 8 2 488 26) Social contact with friends HNSC 334 68 131 27 18 4 9 2 492 27) Trouble going out in public HNSC 320 65 124 25 34 7 15 3 493 28) Trouble with physical contact HNSC 336 70 117 24 18 4 9 2 480 29) Less interest in sex HNSX 146 38 102 26 59 15 80 21 387 30) Less sexual enjoyment HNSX 148 40 90 24 51 14 80 22 369 No Yes Total N (%) N (%) N 31) Used pain-killers HNPK 216 47 246 53 462 32) Taken nutritional supplements HNNU 337 69 149 31 486 33) Used feeding tube HNFE 368 76 118 24 486 34) Lost weight HNWL 267 56 206 44 473 35) Gained weight HNWG 322 71 133 29 455

331
Head and neck module: stage I-II Characteristics of the sample Version of the QLQ-C30 N (%) v 1.0 5 1 v +3 291 31 v 2.0 16 2 v 3.0 634 67 Total 946 Age N (%) <40 32 3 40-49 90 10 50-59 247 26 60-69 327 35 70-79 208 22 80+ 42 4 Not known 0 0 Total 946 Gender N (%) Male 751 79 Female 195 21 Not known 0 0 Total 946 Constructed scales Mean (SD) Median [IQR] Pain HNPA 21.6 (21) 16.7 [0-33.3] Swallowing HNSW 16.8 (22) 8.3 [0-33.3] Senses HNSE 16.2 (24.6) 0 [0-33.3] Speech HNSP 28.8 (28.1) 22.2 [0-44.4] Social eating HNSO 15.0 (20.7) 0 [0-33.3] Social contact HNSC 11.9 (17.8) 0 [0-20] Sexuality HNSX 28.4 (32.9) 16.7 [0-50] Teeth HNTE 20.7 (29.1) 0 [0-33.3] Opening mouth HNOM 13.7 (23.6) 0 [0-33.3] Dry mouth HNDR 29.7 (32.4) 33.3 [0-33.3] Sticky saliva HNSS 26.5 (30.7) 33.3 [0-33.3] Coughed HNCO 31.1 (31.7) 33.3 [0-33.3] Felt ill HNFI 20.2 (27.6) 0 [0-33.3] Pain killers HNPK 41.8 (49.4) 0 [0-100] Nutritional supp HNNU 24.1 (42.8) 0 [0-0] Feeding tube HNFE 20.3 (40.3) 0 [0-0] Weight loss HNWL 33.1 (47.1) 0 [0-100] Weight gain HNWG 28.6 (45.2) 0 [0-100]

332
Head and neck module: stage I-II Constructed scales HNPA N (%) HNSO N (%)
0 206 26 0 394 50 8.3 130 17 8.3 90 12
16.7 106 14 16.7 48 6 25 69 9 25 39 5
33.3 130 17 33.3 126 16 41.7 39 5 41.7 30 4
50 38 5 50 15 2 58.3 20 3 58.3 9 1 66.7 20 3 66.7 5 1
75 11 1 75 10 1 83.3 8 1 83.3 6 1 91.7 1 0 91.7 2 0 100 4 1 100 7 1
Total 782 Total 781 HNSW N (%) HNSC N (%)
0 383 49 0 425 56 8.3 74 10 6.7 73 10
16.7 44 6 13.3 53 7 25 45 6 20 27 4
33.3 107 14 26.7 15 2 41.7 33 4 33.3 89 12
50 35 5 40 26 3 58.3 20 3 46.7 25 3 66.7 11 1 53.3 10 1
75 12 2 60 4 1 83.3 6 1 66.7 3 0 91.7 1 0 73.3 5 1 100 5 1 80 1 0
Total 776 0 86.7 4 1 93.3 0 0 HNSE N (%) 100 0 0
0 473 61 Total 760 16.7 71 9 33.3 135 17 HNSX N (%)
50 36 5 0 311 46 66.7 37 5 16.7 40 6 83.3 15 2 33.3 145 21 100 15 2 50 32 5
Total 782 66.7 81 12 83.3 7 1 HNSP N (%) 100 62 9
0 225 29 Total 678 11.1 118 15 22.2 92 12 33.3 93 12 44.4 69 9 55.6 60 8 66.7 43 6 77.8 41 5 88.9 16 2 100 21 3
Total 778

333
Head and neck module: stage I-II Single Items Not at all A little Quite a bit Very much Total N (%) N (%) N (%) N (%) N 1) Pain in mouth HNPA 399 51 272 35 91 12 27 3 789 2) Pain in jaw HNPA 499 63 220 28 48 6 20 3 787 3) Soreness in mouth HNPA 381 48 296 38 83 11 29 4 789 4) Painful throat HNPA 361 46 289 37 98 13 37 5 785 5) Problems swallowing liquids HNSW 497 63 208 26 55 7 28 4 788 6) Problems swallowing pureed food HNSW 532 68 198 25 38 5 19 2 787 7) Problems swallowing solid food HNSW 432 55 223 28 72 9 58 7 785 8) Choked when swallowing HNSW 565 72 155 20 47 6 22 3 789 9) Problems with teeth HNTE 459 59 198 25 81 10 41 5 779 10) Problems opening mouth wide HNOM 543 69 185 24 36 5 22 3 786 11) Dry mouth HNDR 349 44 247 31 123 16 70 9 789 12) Sticky saliva HNSS 376 48 245 31 110 14 53 7 784 13) Sense of smell HNSE 546 70 151 19 42 5 45 6 784 14) Sense of taste HNSE 513 65 181 23 62 8 31 4 787 15) Coughed HNCO 310 39 297 38 108 14 75 10 790 16) Been hoarse HNSP 297 38 199 25 151 19 137 18 784 17) Felt ill HNFI 450 57 236 30 65 8 37 5 788 18) Appearance bothered you HNSC 557 71 162 21 38 5 26 3 783 19) Trouble eating HNSO 450 57 233 30 63 8 41 5 787 20) Eating in front of family HNSO 594 76 160 20 17 2 12 2 783 21) Eating in front of other people HNSO 560 71 162 21 36 5 26 3 784 22) Trouble enjoying meals HNSO 495 63 220 28 44 6 28 4 787 23) Trouble talking to people HNSP 445 57 210 27 86 11 46 6 787 24) Trouble talking on telephone HNSP 417 53 194 25 109 14 67 9 787 25) Social contact with family HNSC 572 73 181 23 26 3 5 1 784 26) Social contact with friends HNSC 533 68 204 26 43 6 5 1 785 27) Trouble going out in public HNSC 564 72 156 20 49 6 18 2 787 28) Trouble with physical contact HNSC 572 74 162 21 26 3 10 1 770 29) Less interest in sex HNSX 335 47 182 26 110 16 81 11 708 30) Less sexual enjoyment HNSX 350 52 164 24 97 14 68 10 679 No Yes Total N (%) N (%) N 31) Used pain-killers HNPK 429 58 308 42 737 32) Taken nutritional supplements HNNU 586 76 186 24 772 33) Used feeding tube HNFE 620 80 158 20 778 34) Lost weight HNWL 509 67 252 33 761 35) Gained weight HNWG 521 71 209 29 730

334
Head and neck module: stage III-IV Characteristics of the sample Version of the QLQ-C30 N (%) v 1.0 17 1 v +3 395 23 v 2.0 381 22 v 3.0 929 54 Total 1,722 Age N (%) <40 54 3 40-49 337 20 50-59 599 35 60-69 437 25 70-79 243 14 80+ 51 3 Not known 1 0 Total 1,722 Gender N (%) Male 1,401 81 Female 316 18 Not known 5 0 Total 1,722 Constructed scales Mean (SD) Median [IQR] Pain HNPA 29.9 (25.1) 25 [8.3-41.7] Swallowing HNSW 27.5 (26.1) 25 [0-41.7] Senses HNSE 20.0 (30) 0 [0-33.3] Speech HNSP 27.1 (27.2) 22.2 [0-44.4] Social eating HNSO 23.9 (26.7) 16.7 [0-33.3] Social contact HNSC 13.2 (19.1) 6.7 [0-20] Sexuality HNSX 32.3 (36.1) 16.7 [0-66.7] Teeth HNTE 27.8 (35) 0 [0-33.3] Opening mouth HNOM 22.4 (31.9) 0 [0-33.3] Dry mouth HNDR 31.1 (34.2) 33.3 [0-66.7] Sticky saliva HNSS 32.4 (35.4) 33.3 [0-66.7] Coughed HNCO 34.9 (32.1) 33.3 [0-66.7] Felt ill HNFI 21.7 (29.2) 0 [0-33.3] Pain killers HNPK 52.8 (49.9) 100 [0-100] Nutritional supp HNNU 27.0 (44.4) 0 [0-100] Feeding tube HNFE 18.3 (38.7) 0 [0-0] Weight loss HNWL 41.3 (49.2) 0 [0-100] Weight gain HNWG 25.9 (43.8) 0 [0-100]

335
Head and neck module: stage III-IV Constructed scales HNPA N (%) HNSO N (%)
0 230 16 0 462 33 8.3 204 14 8.3 183 13
16.7 186 13 16.7 172 12 25 162 11 25 97 7
33.3 192 14 33.3 159 11 41.7 101 7 41.7 69 5
50 92 7 50 70 5 58.3 68 5 58.3 43 3 66.7 70 5 66.7 36 3
75 43 3 75 35 3 83.3 31 2 83.3 26 2 91.7 21 2 91.7 20 1 100 20 1 100 36 3
Total 1,420 Total 1,408 HNSW N (%) HNSC N (%)
0 372 26 0 676 49 8.3 170 12 6.7 196 14
16.7 147 10 13.3 122 9 25 127 9 20 68 5
33.3 164 12 26.7 62 5 41.7 97 7 33.3 119 9
50 90 6 40 39 3 58.3 70 5 46.7 23 2 66.7 51 4 53.3 23 2
75 67 5 60 17 1 83.3 25 2 66.7 14 1 91.7 14 1 73.3 8 1 100 19 1 80 15 1
Total 1,413 0 86.7 5 0 93.3 2 0 HNSE N (%) 100 2 0
0 841 59 Total 1,391 16.7 139 10 33.3 157 11 HNSX N (%)
50 103 7 0 561 45 66.7 71 5 16.7 71 6 83.3 35 2 33.3 220 18 100 83 6 50 54 4
Total 1,429 66.7 154 12 83.3 31 3 HNSP N (%) 100 165 13
0 386 28 Total 1,256 11.1 277 20 22.2 182 13 33.3 159 11 44.4 115 8 55.6 76 5 66.7 86 6 77.8 61 4 88.9 30 2 100 32 2
Total 1,404
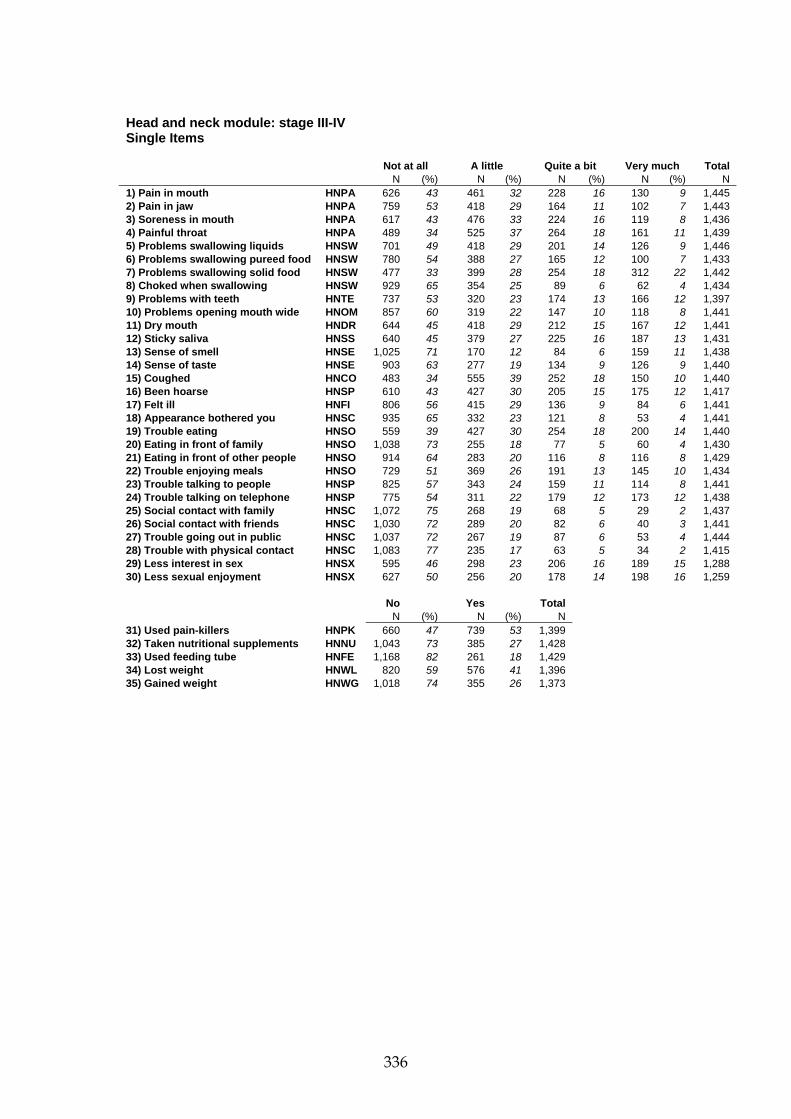
336
Head and neck module: stage III-IV Single Items Not at all A little Quite a bit Very much Total N (%) N (%) N (%) N (%) N 1) Pain in mouth HNPA 626 43 461 32 228 16 130 9 1,445 2) Pain in jaw HNPA 759 53 418 29 164 11 102 7 1,443 3) Soreness in mouth HNPA 617 43 476 33 224 16 119 8 1,436 4) Painful throat HNPA 489 34 525 37 264 18 161 11 1,439 5) Problems swallowing liquids HNSW 701 49 418 29 201 14 126 9 1,446 6) Problems swallowing pureed food HNSW 780 54 388 27 165 12 100 7 1,433 7) Problems swallowing solid food HNSW 477 33 399 28 254 18 312 22 1,442 8) Choked when swallowing HNSW 929 65 354 25 89 6 62 4 1,434 9) Problems with teeth HNTE 737 53 320 23 174 13 166 12 1,397 10) Problems opening mouth wide HNOM 857 60 319 22 147 10 118 8 1,441 11) Dry mouth HNDR 644 45 418 29 212 15 167 12 1,441 12) Sticky saliva HNSS 640 45 379 27 225 16 187 13 1,431 13) Sense of smell HNSE 1,025 71 170 12 84 6 159 11 1,438 14) Sense of taste HNSE 903 63 277 19 134 9 126 9 1,440 15) Coughed HNCO 483 34 555 39 252 18 150 10 1,440 16) Been hoarse HNSP 610 43 427 30 205 15 175 12 1,417 17) Felt ill HNFI 806 56 415 29 136 9 84 6 1,441 18) Appearance bothered you HNSC 935 65 332 23 121 8 53 4 1,441 19) Trouble eating HNSO 559 39 427 30 254 18 200 14 1,440 20) Eating in front of family HNSO 1,038 73 255 18 77 5 60 4 1,430 21) Eating in front of other people HNSO 914 64 283 20 116 8 116 8 1,429 22) Trouble enjoying meals HNSO 729 51 369 26 191 13 145 10 1,434 23) Trouble talking to people HNSP 825 57 343 24 159 11 114 8 1,441 24) Trouble talking on telephone HNSP 775 54 311 22 179 12 173 12 1,438 25) Social contact with family HNSC 1,072 75 268 19 68 5 29 2 1,437 26) Social contact with friends HNSC 1,030 72 289 20 82 6 40 3 1,441 27) Trouble going out in public HNSC 1,037 72 267 19 87 6 53 4 1,444 28) Trouble with physical contact HNSC 1,083 77 235 17 63 5 34 2 1,415 29) Less interest in sex HNSX 595 46 298 23 206 16 189 15 1,288 30) Less sexual enjoyment HNSX 627 50 256 20 178 14 198 16 1,259 No Yes Total N (%) N (%) N 31) Used pain-killers HNPK 660 47 739 53 1,399 32) Taken nutritional supplements HNNU 1,043 73 385 27 1,428 33) Used feeding tube HNFE 1,168 82 261 18 1,429 34) Lost weight HNWL 820 59 576 41 1,396 35) Gained weight HNWG 1,018 74 355 26 1,373

337
Head and neck module:hypopharynx/larynx Characteristics of the sample Version of the QLQ-C30 N (%) v 1.0 5 1 v +3 150 34 v 2.0 0 0 v 3.0 281 64 Total 436 Age N (%) <40 7 2 40-49 45 10 50-59 113 26 60-69 149 34 70-79 103 24 80+ 19 4 Not known 0 0 Total 436 Gender N (%) Male 387 89 Female 49 11 Not known 0 0 Total 436 Stage N (%) Stage I-II 222 51 Stage III-IV 210 48 Recurrent/metastatic 0 0 Not known 4 1 Total 436 Constructed scales Mean (SD) Median [IQR] Pain HNPA 35.3 (21) 33.3 [25-50] Swallowing HNSW 36.7 (24.2) 33.3 [25-50] Senses HNSE 38.7 (33.7) 33.3 [0-66.7] Speech HNSP 50.0 (25.5) 44.4 [33.3-66.7] Social eating HNSO 32.4 (24.9) 33.3 [8.3-41.7] Social contact HNSC 28.3 (22.1) 33.3 [6.7-40] Sexuality HNSX 46.8 (35.2) 33.3 [33.3-66.7] Teeth HNTE 36.5 (31.4) 33.3 [0-66.7] Opening mouth HNOM 30.5 (28.6) 33.3 [0-33.3] Dry mouth HNDR 44.1 (33.5) 33.3 [33.3-66.7] Sticky saliva HNSS 45.0 (33.9) 33.3 [33.3-66.7] Coughed HNCO 54.8 (35.3) 66.7 [33.3-100] Felt ill HNFI 40.9 (31.3) 33.3 [33.3-66.7] Pain killers HNPK 71.5 (45.2) 100 [0-100] Nutritional supp HNNU 61.0 (48.8) 100 [0-100] Feeding tube HNFE 58.0 (49.4) 100 [0-100] Weight loss HNWL 67.1 (47) 100 [0-100] Weight gain HNWG 58.0 (49.4) 100 [0-100]

338
Head and neck module:hypopharynx/larynx Constructed scales HNPA N (%) HNSO N (%)
0 33 8 0 84 20 8.3 32 8 8.3 29 7
16.7 31 8 16.7 11 3 25 28 7 25 15 4
33.3 146 35 33.3 159 38 41.7 38 9 41.7 24 6
50 41 10 50 29 7 58.3 17 4 58.3 15 4 66.7 18 4 66.7 15 4
75 13 3 75 9 2 83.3 11 3 83.3 10 2 91.7 4 1 91.7 6 1 100 2 1 100 10 2
Total 414 Total 416 HNSW N (%) HNSC N (%)
0 64 15 0 101 25 8.3 16 4 6.7 18 4
16.7 18 4 13.3 20 5 25 13 3 20 12 3
33.3 136 33 26.7 3 1 41.7 44 11 33.3 138 34
50 41 10 40 35 9 58.3 23 6 46.7 29 7 66.7 23 6 53.3 13 3
75 12 3 60 8 2 83.3 12 3 66.7 11 3 91.7 3 1 73.3 9 2 100 10 2 80 5 1
Total 415 0 86.7 5 1 93.3 1 0 HNSE N (%) 100 0 0
0 125 30 Total 408 16.7 16 4 33.3 119 29 HNSX N (%)
50 32 8 0 87 23 66.7 51 12 16.7 5 1 83.3 26 6 33.3 121 32 100 47 11 50 16 4
Total 416 66.7 66 17 83.3 14 4 HNSP N (%) 100 75 20
0 17 4 Total 384 11.1 19 5 22.2 36 9 33.3 82 20 44.4 58 15 55.6 56 14 66.7 39 10 77.8 53 13 88.9 19 5 100 22 6
Total 401

339
Head and neck module:hypopharynx/larynx Single Items Not at all A little Quite a bit Very much Total N (%) N (%) N (%) N (%) N 1) Pain in mouth HNPA 110 26 233 56 50 12 25 6 418 2) Pain in jaw HNPA 115 28 233 56 47 11 23 6 418 3) Soreness in mouth HNPA 94 23 251 60 53 13 19 5 417 4) Painful throat HNPA 57 14 220 53 85 20 56 13 418 5) Problems swallowing liquids HNSW 85 20 243 58 52 12 39 9 419 6) Problems swallowing pureed food HNSW 104 25 239 57 46 11 30 7 419 7) Problems swallowing solid food HNSW 79 19 198 47 68 16 73 18 418 8) Choked when swallowing HNSW 130 31 201 48 50 12 35 8 416 9) Problems with teeth HNTE 116 28 193 47 56 14 50 12 415 10) Problems opening mouth wide HNOM 140 34 207 50 38 9 33 8 418 11) Dry mouth HNDR 95 23 162 39 90 22 70 17 417 12) Sticky saliva HNSS 88 21 171 41 77 19 78 19 414 13) Sense of smell HNSE 143 34 131 31 37 9 106 25 417 14) Sense of taste HNSE 139 33 167 40 52 12 60 14 418 15) Coughed HNCO 68 16 131 31 102 24 118 28 419 16) Been hoarse HNSP 32 8 150 37 101 25 121 30 404 17) Felt ill HNFI 91 22 199 48 72 17 57 14 419 18) Appearance bothered you HNSC 139 33 200 48 51 12 27 7 417 19) Trouble eating HNSO 100 24 205 49 53 13 60 14 418 20) Eating in front of family HNSO 148 35 231 55 23 6 16 4 418 21) Eating in front of other people HNSO 139 33 205 49 34 8 40 10 418 22) Trouble enjoying meals HNSO 117 28 223 53 40 10 39 9 419 23) Trouble talking to people HNSP 97 23 180 43 70 17 70 17 417 24) Trouble talking on telephone HNSP 78 19 147 35 96 23 95 23 416 25) Social contact with family HNSC 147 35 229 55 32 8 7 2 415 26) Social contact with friends HNSC 141 34 213 51 51 12 12 3 417 27) Trouble going out in public HNSC 140 33 197 47 51 12 31 7 419 28) Trouble with physical contact HNSC 150 36 211 51 36 9 16 4 413 29) Less interest in sex HNSX 91 23 137 35 79 20 86 22 393 30) Less sexual enjoyment HNSX 92 24 132 34 72 19 89 23 385 No Yes Total N (%) N (%) N 31) Used pain-killers HNPK 100 29 251 72 351 32) Taken nutritional supplements HNNU 157 39 246 61 403 33) Used feeding tube HNFE 169 42 233 58 402 34) Lost weight HNWL 123 33 251 67 374 35) Gained weight HNWG 144 42 199 58 343

340
Head and neck module:oral cavity/oropharynx Characteristics of the sample Version of the QLQ-C30 N (%) v 1.0 14 5 v +3 244 90 v 2.0 0 0 v 3.0 14 5 Total 272 Age N (%) <40 10 4 40-49 40 15 50-59 95 35 60-69 46 17 70-79 59 22 80+ 21 8 Not known 1 0 Total 272 Gender N (%) Male 182 67 Female 90 33 Not known 0 0 Total 272 Stage N (%) Stage I-II 45 17 Stage III-IV 224 82 Recurrent/metastatic 3 1 Not known 0 0 Total 272 Constructed scales Mean (SD) Median [IQR] Pain HNPA 36.9 (25.5) 33.3 [16.7-58.3] Swallowing HNSW 20.5 (25.1) 8.3 [0-33.3] Senses HNSE 10.8 (20.6) 0 [0-16.7] Speech HNSP 13.9 (20.5) 0 [0-22.2] Social eating HNSO 18.0 (21) 8.3 [0-25] Social contact HNSC 7.6 (14.2) 0 [0-13.3] Sexuality HNSX 27.8 (36) 0 [0-50] Teeth HNTE 32.2 (35.6) 33.3 [0-66.7] Opening mouth HNOM 17.9 (30.8) 0 [0-33.3] Dry mouth HNDR 22.0 (29.2) 0 [0-33.3] Sticky saliva HNSS 21.2 (30.9) 0 [0-33.3] Coughed HNCO 19.6 (26.6) 0 [0-33.3] Felt ill HNFI 18.0 (26.6) 0 [0-33.3] Pain killers HNPK 50.7 (50.1) 100 [0-100] Nutritional supp HNNU 14.9 (35.6) 0 [0-0] Feeding tube HNFE 4.0 (19.6) 0 [0-0] Weight loss HNWL 37.0 (48.4) 0 [0-100] Weight gain HNWG 9.1 (28.8) 0 [0-0]

341
Head and neck module:oral cavity/oropharynx Constructed scales HNPA N (%) HNSO N (%)
0 25 10 0 81 33 8.3 13 5 8.3 47 19
16.7 39 16 16.7 40 16 25 39 16 25 19 8
33.3 30 12 33.3 20 8 41.7 13 5 41.7 14 6
50 26 10 50 8 3 58.3 18 7 58.3 8 3 66.7 17 7 66.7 1 0
75 11 4 75 2 1 83.3 9 4 83.3 2 1 91.7 4 2 91.7 1 0 100 5 2 100 3 1
Total 249 Total 246 HNSW N (%) HNSC N (%)
0 106 43 0 153 64 8.3 26 11 6.7 26 11
16.7 21 9 13.3 22 9 25 22 9 20 11 5
33.3 12 5 26.7 12 5 41.7 15 6 33.3 5 2
50 13 5 40 3 1 58.3 8 3 46.7 3 1 66.7 6 2 53.3 1 0
75 13 5 60 2 1 83.3 3 1 66.7 1 0 91.7 1 0 73.3 0 0 100 1 0 80 2 1
Total 247 0 86.7 0 0 93.3 0 0 HNSE N (%) 100 0 0
0 178 72 Total 241 16.7 22 9 33.3 25 10 HNSX N (%)
50 14 6 0 99 52 66.7 5 2 16.7 17 9 83.3 2 1 33.3 23 12 100 3 1 50 6 3
Total 249 66.7 21 11 83.3 1 1 HNSP N (%) 100 25 13
0 132 53 Total 192 11.1 41 16 22.2 34 14 33.3 11 4 44.4 12 5 55.6 7 3 66.7 8 3 77.8 3 1 88.9 0 0 100 2 1
Total 250

342
Head and neck module:oral cavity/oropharynx Single Items Not at all A little Quite a bit Very much Total N (%) N (%) N (%) N (%) N 1) Pain in mouth HNPA 55 22 92 37 65 26 38 15 250 2) Pain in jaw HNPA 119 48 66 26 40 16 25 10 250 3) Soreness in mouth HNPA 46 18 101 40 64 26 39 16 250 4) Painful throat HNPA 122 49 62 25 48 19 17 7 249 5) Problems swallowing liquids HNSW 147 59 52 21 32 13 19 8 250 6) Problems swallowing pureed food HNSW 157 63 49 20 25 10 17 7 248 7) Problems swallowing solid food HNSW 123 50 45 18 37 15 43 17 248 8) Choked when swallowing HNSW 214 86 26 10 7 3 2 1 249 9) Problems with teeth HNTE 113 46 56 23 45 18 30 12 244 10) Problems opening mouth wide HNOM 173 70 35 14 24 10 17 7 249 11) Dry mouth HNDR 141 57 63 25 34 14 11 4 249 12) Sticky saliva HNSS 153 61 51 20 30 12 16 6 250 13) Sense of smell HNSE 214 86 20 8 11 4 5 2 250 14) Sense of taste HNSE 181 73 40 16 19 8 9 4 249 15) Coughed HNCO 143 57 76 30 22 9 9 4 250 16) Been hoarse HNSP 203 81 31 12 12 5 4 2 250 17) Felt ill HNFI 154 62 66 26 21 8 9 4 250 18) Appearance bothered you HNSC 208 84 24 10 9 4 8 3 249 19) Trouble eating HNSO 91 37 84 34 50 20 24 10 249 20) Eating in front of family HNSO 218 89 16 7 8 3 4 2 246 21) Eating in front of other people HNSO 193 78 30 12 16 7 8 3 247 22) Trouble enjoying meals HNSO 150 61 49 20 37 15 12 5 248 23) Trouble talking to people HNSP 176 70 45 18 19 8 10 4 250 24) Trouble talking on telephone HNSP 169 68 44 18 23 9 14 6 250 25) Social contact with family HNSC 206 83 29 12 9 4 5 2 249 26) Social contact with friends HNSC 208 84 29 12 7 3 5 2 249 27) Trouble going out in public HNSC 209 84 24 10 11 4 5 2 249 28) Trouble with physical contact HNSC 217 89 14 6 7 3 5 2 243 29) Less interest in sex HNSX 108 53 34 17 32 16 29 14 203 30) Less sexual enjoyment HNSX 116 60 25 13 24 13 27 14 192 No Yes Total N (%) N (%) N 31) Used pain-killers HNPK 113 49 116 51 229 32) Taken nutritional supplements HNNU 212 85 37 15 249 33) Used feeding tube HNFE 240 96 10 4 250 34) Lost weight HNWL 153 63 90 37 243 35) Gained weight HNWG 221 91 22 9 243

343
Lung module: all stages Characteristics of the sample Version of the QLQ-C30 Primary disease site N (%) N (%) v 1.0 1,125 34 Lung: small cell 658 20 v +3 38 1 Lung: non-small cell 1,262 38 v 2.0 836 25 Mesothelioma 236 7 v 3.0 1,333 40 Lung: not known 1,176 35 Total 3,332 Total 3,332 Age N (%) <40 85 3 40-49 416 13 50-59 971 29 60-69 1,108 33 70-79 596 18 80+ 60 2 Not known 96 3 Total 3,332 Gender N (%) Male 1,925 58 Female 830 25 Not known 577 17 Total 3,332 Stage N (%) Stage I-II 538 16 Stage III-IV 1,313 39 Recurrent/metastatic 307 9 Not known 1,174 35 Total 3,332 Constructed scales Mean (SD) Median [IQR] Dyspnoea LCDY 29.5 (24.6) 22.2 [11.1-44.4] Coughing LCCO 37.4 (27) 33.3 [33.3-66.7] Haemoptysis LCHA 5.7 (15.4) 0 [0-0] Sore mouth LCSM 5.3 (15.8) 0 [0-0] Dysphagia LCDS 7.7 (19) 0 [0-0] Periph neuropathy LCPN 11.3 (22.9) 0 [0-0] Alopecia LCPR 14.9 (32.6) 0 [0-0] Pain in chest LCPC 19.7 (26.4) 0 [0-33.3] Pain in arm LCPA 19.0 (27.9) 0 [0-33.3] Pain other LCPO 20.5 (29) 0 [0-33.3]

344
Lung module: all stages Constructed scales LCDY N (%)
0 492 19 11.1 385 15 22.2 534 21 33.3 428 17 44.4 222 9 55.6 195 8 66.7 145 6 77.8 94 4 88.9 46 2 100 40 2
Total 2,581
Lung module: all stages Single Items Not at all A little Quite a bit Very much Total N (%) N (%) N (%) N (%) N 1) How much did you cough LCCO 570 21 1,396 52 558 21 170 6 2,694 2) Cough blood LCHA 2,317 86 311 12 59 2 12 0 2,699 3) Short of breath when rest LCDY 1,840 69 625 23 164 6 51 2 2,680 4) Short of breath when walk LCDY 936 35 1,100 41 445 17 191 7 2,672 5) Short of breath when climb stairs LCDY 576 22 1,032 39 631 24 383 15 2,622 6) Sore mouth or tongue LCSM 2,371 88 251 9 59 2 21 1 2,702 7) Trouble swallowing LCDS 2,231 83 338 13 90 3 36 1 2,695 8) Tingling hands or feet LCPN 2,047 76 450 17 129 5 68 3 2,694 9) Had hair loss LCHR 2,137 80 152 6 93 4 284 11 2,666 10) Pain in chest LCPC 1,513 57 823 31 236 9 93 4 2,665 11) Pain in arm or shoulder LCPA 1,634 61 660 25 252 10 119 5 2,665 12) Pain in other parts of body LCPO 1,498 60 564 23 321 13 109 4 2,492 13) Did pain medicine help - 272 23 274 23 394 34 234 20 1,174

345

346
Lung module: males Characteristics of the sample Version of the QLQ-C30 Primary disease site N (%) N (%) v 1.0 807 42 Lung: small cell 407 21 v +3 30 2 Lung: non-small cell 514 27 v 2.0 241 13 Mesothelioma 183 10 v 3.0 847 44 Lung: not known 821 43 Total 1,925 Total 1,925 Age N (%) <40 36 2 40-49 188 10 50-59 548 29 60-69 692 36 70-79 416 22 80+ 41 2 Not known 4 0 Total 1,925 Stage N (%) Stage I-II 385 20 Stage III-IV 580 30 Recurrent/metastatic 197 10 Not known 763 40 Total 1,925 Constructed scales Mean (SD) Median [IQR] Dyspnoea LCDY 29.4 (24.5) 22.2 [11.1-44.4] Coughing LCCO 37.6 (26.5) 33.3 [33.3-66.7] Haemoptysis LCHA 6.5 (15.8) 0 [0-0] Sore mouth LCSM 4.9 (15) 0 [0-0] Dysphagia LCDS 7.0 (18.2) 0 [0-0] Periph neuropathy LCPN 11.6 (22.9) 0 [0-16.7] Alopecia LCPR 14.7 (32.3) 0 [0-0] Pain in chest LCPC 19.6 (26) 0 [0-33.3] Pain in arm LCPA 16.4 (25.9) 0 [0-33.3] Pain other LCPO 17.2 (26.4) 0 [0-33.3]

347
Lung module: males Constructed scales LCDY N (%)
0 282 20 11.1 214 15 22.2 286 20 33.3 241 17 44.4 128 9 55.6 112 8 66.7 82 6 77.8 48 3 88.9 30 2 100 18 1
Total 1,441
Lung module: males Single Items Not at all A little Quite a bit Very much Total N (%) N (%) N (%) N (%) N 1) How much did you cough LCCO 296 20 813 54 301 20 94 6 1,504 2) Cough blood LCHA 1,259 84 202 13 37 3 5 0 1,503 3) Short of breath when rest LCDY 1,022 68 352 24 95 6 25 2 1,494 4) Short of breath when walk LCDY 526 35 605 41 256 17 99 7 1,486 5) Short of breath when climb stairs LCDY 334 23 554 38 369 25 208 14 1,465 6) Sore mouth or tongue LCSM 1,331 89 133 9 28 2 10 1 1,502 7) Trouble swallowing LCDS 1,266 84 174 12 44 3 18 1 1,502 8) Tingling hands or feet LCPN 1,125 75 263 18 76 5 36 2 1,500 9) Had hair loss LCHR 1,190 80 90 6 49 3 155 10 1,484 10) Pain in chest LCPC 834 56 477 32 126 9 48 3 1,485 11) Pain in arm or shoulder LCPA 971 65 348 23 119 8 48 3 1,486 12) Pain in other parts of body LCPO 909 65 314 22 147 10 40 3 1,410 13) Did pain medicine help - 160 29 104 19 175 32 109 20 548

348

349
Lung module: females Characteristics of the sample Version of the QLQ-C30 Primary disease site N (%) N (%) v 1.0 298 36 Lung: small cell 236 28 v +3 8 1 Lung: non small cell 201 24 v 2.0 136 16 Mesothelioma 51 6 v 3.0 388 47 Lung: not known 342 41 Total 830 Total 830 Age N (%) <40 21 3 40-49 124 15 50-59 254 31 60-69 276 33 70-79 135 16 80+ 19 2 Not known 1 0 Total 830 Stage N (%) Stage I-II 149 18 Stage III-IV 187 23 Recurrent/metastatic 98 12 Not known 396 48 Total 830 Constructed scales Mean (SD) Median [IQR] Dyspnoea LCDY 30.0 (24.6) 22.2 [11.1-44.4] Coughing LCCO 36.2 (28.5) 33.3 [0-66.7] Haemoptysis LCHA 4.2 (13.9) 0 [0-0] Sore mouth LCSM 6.4 (17.7) 0 [0-0] Dysphagia LCDS 10.5 (22) 0 [0-0] Periph neuropathy LCPN 12.8 (25.4) 0 [0-33.3] Alopecia LCPR 22.5 (38.5) 0 [0-33.3] Pain in chest LCPC 18.7 (27.2) 0 [0-33.3] Pain in arm LCPA 19.2 (27.1) 0 [0-33.3] Pain other LCPO 21.1 (28.8) 0 [0-33.3]

350
Lung module: females Constructed scales LCDY N (%)
0 98 16 11.1 107 17 22.2 144 23 33.3 95 15 44.4 46 7 55.6 49 8 66.7 30 5 77.8 28 5 88.9 12 2 100 10 2
Total 619
Lung module: females Single Items Not at all A little Quite a bit Very much Total N (%) N (%) N (%) N (%) N 1) How much did you cough LCCO 163 25 308 48 127 20 46 7 644 2) Cough blood LCHA 581 90 54 8 6 1 5 1 646 3) Short of breath when rest LCDY 455 71 131 21 42 7 12 2 640 4) Short of breath when walk LCDY 220 34 259 40 106 17 58 9 643 5) Short of breath when climb stairs LCDY 116 19 270 43 143 23 99 16 628 6) Sore mouth or tongue LCSM 557 86 67 10 17 3 8 1 649 7) Trouble swallowing LCDS 497 77 104 16 28 4 14 2 643 8) Tingling hands or feet LCPN 483 75 104 16 33 5 26 4 646 9) Had hair loss LCHR 450 71 44 7 31 5 107 17 632 10) Pain in chest LCPC 383 61 170 27 54 9 26 4 633 11) Pain in arm or shoulder LCPA 375 59 171 27 62 10 23 4 631 12) Pain in other parts of body LCPO 348 59 136 23 86 15 22 4 592 13) Did pain medicine help - 66 24 63 23 88 32 56 21 273

351
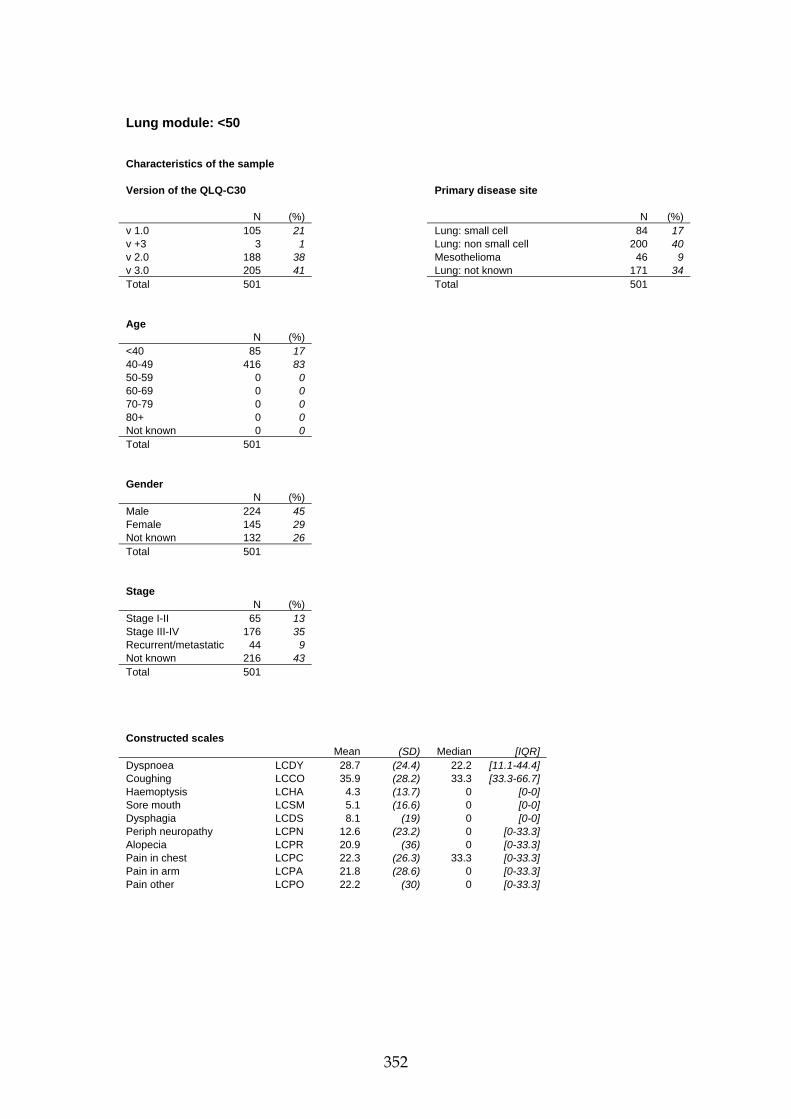
352
Lung module: <50 Characteristics of the sample Version of the QLQ-C30 Primary disease site N (%) N (%) v 1.0 105 21 Lung: small cell 84 17 v +3 3 1 Lung: non small cell 200 40 v 2.0 188 38 Mesothelioma 46 9 v 3.0 205 41 Lung: not known 171 34 Total 501 Total 501 Age N (%) <40 85 17 40-49 416 83 50-59 0 0 60-69 0 0 70-79 0 0 80+ 0 0 Not known 0 0 Total 501 Gender N (%) Male 224 45 Female 145 29 Not known 132 26 Total 501 Stage N (%) Stage I-II 65 13 Stage III-IV 176 35 Recurrent/metastatic 44 9 Not known 216 43 Total 501 Constructed scales Mean (SD) Median [IQR] Dyspnoea LCDY 28.7 (24.4) 22.2 [11.1-44.4] Coughing LCCO 35.9 (28.2) 33.3 [33.3-66.7] Haemoptysis LCHA 4.3 (13.7) 0 [0-0] Sore mouth LCSM 5.1 (16.6) 0 [0-0] Dysphagia LCDS 8.1 (19) 0 [0-0] Periph neuropathy LCPN 12.6 (23.2) 0 [0-33.3] Alopecia LCPR 20.9 (36) 0 [0-33.3] Pain in chest LCPC 22.3 (26.3) 33.3 [0-33.3] Pain in arm LCPA 21.8 (28.6) 0 [0-33.3] Pain other LCPO 22.2 (30) 0 [0-33.3]

353
Lung module: <50 Constructed scales LCDY N (%)
0 91 24 11.1 44 12 22.2 72 19 33.3 63 17 44.4 26 7 55.6 37 10 66.7 30 8 77.8 11 3 88.9 3 1 100 4 1
Total 381
Lung module: <50 Single Items Not at all A little Quite a bit Very much Total N (%) N (%) N (%) N (%) N 1) How much did you cough LCCO 98 25 195 50 72 18 28 7 393 2) Cough blood LCHA 352 89 35 9 5 1 2 1 394 3) Short of breath when rest LCDY 264 67 103 26 22 6 5 1 394 4) Short of breath when walk LCDY 151 39 154 39 71 18 16 4 392 5) Short of breath when climb stairs LCDY 100 26 132 34 98 25 56 15 386 6) Sore mouth or tongue LCSM 353 89 30 8 8 2 5 1 396 7) Trouble swallowing LCDS 324 82 49 12 19 5 3 1 395 8) Tingling hands or feet LCPN 288 73 73 18 28 7 7 2 396 9) Had hair loss LCHR 277 71 34 9 29 7 51 13 391 10) Pain in chest LCPC 197 50 145 37 40 10 13 3 395 11) Pain in arm or shoulder LCPA 217 56 108 28 48 12 17 4 390 12) Pain in other parts of body LCPO 208 58 81 23 54 15 17 5 360 13) Did pain medicine help - 51 23 67 30 61 28 41 19 220

354

355
Lung module: 50-59 Characteristics of the sample Version of the QLQ-C30 Primary disease site N (%) N (%) v 1.0 280 29 Lung: small cell 227 23 v +3 5 1 Lung: non small cell 340 35 v 2.0 259 27 Mesothelioma 92 9 v 3.0 427 44 Lung: not known 312 32 Total 971 Total 971 Age N (%) <40 0 0 40-49 0 0 50-59 971 100 60-69 0 0 70-79 0 0 80+ 0 0 Not known 0 0 Total 971 Gender N (%) Male 548 56 Female 254 26 Not known 169 17 Total 971 Stage N (%) Stage I-II 130 13 Stage III-IV 362 37 Recurrent/metastatic 76 8 Not known 403 42 Total 971 Constructed scales Mean (SD) Median [IQR] Dyspnoea LCDY 27.2 (24.2) 22.2 [11.1-33.3] Coughing LCCO 35.1 (26.8) 33.3 [33.3-33.3] Haemoptysis LCHA 4.5 (13.3) 0 [0-0] Sore mouth LCSM 4.2 (13.3) 0 [0-0] Dysphagia LCDS 7.1 (18.5) 0 [0-0] Periph neuropathy LCPN 12.3 (24.9) 0 [0-0] Alopecia LCPR 17.9 (35.6) 0 [0-0] Pain in chest LCPC 19.7 (26.6) 0 [0-33.3] Pain in arm LCPA 19.1 (28.5) 0 [0-33.3] Pain other LCPO 22.3 (30.5) 0 [0-33.3]

356
Lung module: 50-59 Constructed scales LCDY N (%)
0 169 22 11.1 125 16 22.2 172 22 33.3 123 16 44.4 61 8 55.6 44 6 66.7 38 5 77.8 23 3 88.9 13 2 100 13 2
Total 781
Lung module: 50-59 Single Items Not at all A little Quite a bit Very much Total N (%) N (%) N (%) N (%) N 1) How much did you cough LCCO 195 24 409 51 152 19 43 5 799 2) Cough blood LCHA 708 89 74 9 17 2 0 0 799 3) Short of breath when rest LCDY 583 73 163 20 39 5 14 2 799 4) Short of breath when walk LCDY 316 40 322 41 106 13 51 6 795 5) Short of breath when climb stairs LCDY 187 24 324 41 178 23 101 13 790 6) Sore mouth or tongue LCSM 718 90 70 9 11 1 3 0 802 7) Trouble swallowing LCDS 674 84 92 12 23 3 11 1 800 8) Tingling hands or feet LCPN 603 76 127 16 39 5 30 4 799 9) Had hair loss LCHR 608 77 43 6 27 3 108 14 786 10) Pain in chest LCPC 448 57 248 31 63 8 31 4 790 11) Pain in arm or shoulder LCPA 493 62 188 24 74 9 40 5 795 12) Pain in other parts of body LCPO 438 59 156 21 115 15 38 5 747 13) Did pain medicine help - 88 23 80 21 138 36 78 20 384

357

358
Lung module: 60-69 Characteristics of the sample Version of the QLQ-C30 Primary disease site N (%) N (%) v 1.0 430 39 Lung: small cell 238 21 v +3 19 2 Lung: non small cell 380 34 v 2.0 245 22 Mesothelioma 79 7 v 3.0 414 37 Lung: not known 411 37 Total 1,108 Total 1,108 Age N (%) <40 0 0 40-49 0 0 50-59 0 0 60-69 1,108 100 70-79 0 0 80+ 0 0 Not known 0 0 Total 1,108 Gender N (%) Male 692 63 Female 276 25 Not known 140 13 Total 1,108 Stage N (%) Stage I-II 183 17 Stage III-IV 418 38 Recurrent/metastatic 110 10 Not known 397 36 Total 1,108 Constructed scales Mean (SD) Median [IQR] Dyspnoea LCDY 30.3 (24.8) 22.2 [11.1-44.4] Coughing LCCO 39.8 (27) 33.3 [33.3-66.7] Haemoptysis LCHA 6.3 (16.5) 0 [0-0] Sore mouth LCSM 6.3 (16.9) 0 [0-0] Dysphagia LCDS 7.9 (18.8) 0 [0-0] Periph neuropathy LCPN 11.5 (22.9) 0 [0-0] Alopecia LCPR 14.2 (32.2) 0 [0-0] Pain in chest LCPC 18.9 (25.8) 0 [0-33.3] Pain in arm LCPA 18.7 (27.1) 0 [0-33.3] Pain other LCPO 20.5 (28.7) 0 [0-33.3]

359
Lung module: 60-69 Constructed scales LCDY N (%)
0 148 18 11.1 135 16 22.2 162 19 33.3 139 17 44.4 80 10 55.6 54 7 66.7 51 6 77.8 39 5 88.9 19 2 100 9 1
Total 836
Lung module: 60-69 Single Items Not at all A little Quite a bit Very much Total N (%) N (%) N (%) N (%) N 1) How much did you cough LCCO 157 18 462 52 203 23 63 7 885 2) Cough blood LCHA 753 85 104 12 23 3 6 1 886 3) Short of breath when rest LCDY 591 68 203 23 65 7 16 2 875 4) Short of breath when walk LCDY 296 34 355 41 154 18 70 8 875 5) Short of breath when climb stairs LCDY 180 21 334 39 203 24 134 16 851 6) Sore mouth or tongue LCSM 755 85 100 11 22 3 8 1 885 7) Trouble swallowing LCDS 724 82 120 14 30 3 10 1 884 8) Tingling hands or feet LCPN 664 75 152 17 43 5 22 3 881 9) Had hair loss LCHR 712 81 49 6 22 3 93 11 876 10) Pain in chest LCPC 507 58 258 30 81 9 24 3 870 11) Pain in arm or shoulder LCPA 531 61 228 26 82 9 33 4 874 12) Pain in other parts of body LCPO 483 60 190 23 105 13 33 4 811 13) Did pain medicine help - 80 23 84 24 111 31 79 22 354

360

361
Lung module: ≥70 Characteristics of the sample Version of the QLQ-C30 Primary disease site N (%) N (%) v 1.0 308 47 Lung: small cell 109 17 v +3 11 2 Lung: non small cell 252 38 v 2.0 140 21 Mesothelioma 19 3 v 3.0 197 30 Lung: not known 276 42 Total 656 Total 656 Age N (%) <40 0 0 40-49 0 0 50-59 0 0 60-69 0 0 70-79 596 91 80+ 60 9 Not known 0 0 Total 656 Gender N (%) Male 457 70 Female 154 24 Not known 45 7 Total 656 Stage N (%) Stage I-II 154 24 Stage III-IV 267 41 Recurrent/metastatic 77 12 Not known 158 24 Total 656 Constructed scales Mean (SD) Median [IQR] Dyspnoea LCDY 32.2 (24.9) 33.3 [11.1-44.4] Coughing LCCO 37.5 (26.4) 33.3 [33.3-66.7] Haemoptysis LCHA 7.4 (17.1) 0 [0-0] Sore mouth LCSM 5.5 (16.4) 0 [0-0] Dysphagia LCDS 8.1 (20) 0 [0-0] Periph neuropathy LCPN 8.9 (20) 0 [0-0] Alopecia LCPR 9.6 (26.3) 0 [0-0] Pain in chest LCPC 17.6 (26.7) 0 [0-33.3] Pain in arm LCPA 15.9 (26.9) 0 [0-33.3] Pain other LCPO 14.8 (25.4) 0 [0-33.3]

362
Lung module: ≥70 Constructed scales LCDY N (%)
0 71 15 11.1 72 15 22.2 101 21 33.3 87 18 44.4 46 9 55.6 50 10 66.7 22 5 77.8 18 4 88.9 9 2 100 13 3
Total 489
Lung module: ≥70 Single Items Not at all A little Quite a bit Very much Total N (%) N (%) N (%) N (%) N 1) How much did you cough LCCO 103 20 283 54 104 20 32 6 522 2) Cough blood LCHA 426 81 83 16 11 2 4 1 524 3) Short of breath when rest LCDY 339 66 130 25 33 6 15 3 517 4) Short of breath when walk LCDY 149 29 221 43 97 19 47 9 514 5) Short of breath when climb stairs LCDY 95 19 195 39 129 26 81 16 500 6) Sore mouth or tongue LCSM 459 88 45 9 15 3 4 1 523 7) Trouble swallowing LCDS 431 83 64 12 16 3 10 2 521 8) Tingling hands or feet LCPN 416 80 81 16 16 3 9 2 522 9) Had hair loss LCHR 445 86 26 5 15 3 31 6 517 10) Pain in chest LCPC 324 63 130 25 41 8 20 4 515 11) Pain in arm or shoulder LCPA 348 68 106 21 36 7 22 4 512 12) Pain in other parts of body LCPO 332 69 103 21 32 7 16 3 483 13) Did pain medicine help - 47 31 32 21 50 33 22 15 151

363

364
Lung module: stage I-II Characteristics of the sample Version of the QLQ-C30 Primary disease site N (%) N (%) v 1.0 242 45 Lung: small cell 4 1 v +3 2 0 Lung: non small cell 17 3 v 2.0 249 46 Lung: not known 517 96 v 3.0 45 8 Total 538 Total 538 Age N (%) <40 13 2 40-49 52 10 50-59 130 24 60-69 183 34 70-79 140 26 80+ 14 3 Not known 6 1 Total 538 Gender N (%) Male 385 72 Female 149 28 Not known 4 1 Total 538 Constructed scales Mean (SD) Median [IQR] Dyspnoea LCDY 33.2 (27.9) 27.8 [11.1-55.6] Coughing LCCO 44.3 (30.8) 33.3 [33.3-66.7] Haemoptysis LCHA 6.4 (17.4) 0 [0-0] Sore mouth LCSM 6.1 (18.9) 0 [0-0] Dysphagia LCDS 8.7 (21.7) 0 [0-0] Periph neuropathy LCPN 11.2 (23.2) 0 [0-0] Alopecia LCPR 8.8 (25.1) 0 [0-0] Pain in chest LCPC 22.7 (30.7) 0 [0-33.3] Pain in arm LCPA 20.0 (29.8) 0 [0-33.3] Pain other LCPO 17.9 (29.3) 0 [0-33.3]

365
Lung module: stage I-II Constructed scales LCDY N (%)
0 89 20 11.1 55 13 22.2 75 17 33.3 59 14 44.4 45 10 55.6 37 8 66.7 31 7 77.8 18 4 88.9 13 3 100 16 4
Total 438
Lung module: stage I-II Single Items Not at all A little Quite a bit Very much Total N (%) N (%) N (%) N (%) N 1) How much did you cough LCCO 88 19 190 41 126 27 57 12 461 2) Cough blood LCHA 398 86 50 11 12 3 5 1 465 3) Short of breath when rest LCDY 305 67 87 19 45 10 21 5 458 4) Short of breath when walk LCDY 175 38 134 29 98 21 50 11 457 5) Short of breath when climb stairs LCDY 101 22 123 27 127 28 101 22 452 6) Sore mouth or tongue LCSM 412 88 33 7 13 3 9 2 467 7) Trouble swallowing LCDS 383 82 55 12 14 3 13 3 465 8) Tingling hands or feet LCPN 356 77 68 15 27 6 11 2 462 9) Had hair loss LCHR 398 87 22 5 13 3 24 5 457 10) Pain in chest LCPC 251 57 106 24 55 13 28 6 440 11) Pain in arm or shoulder LCPA 276 62 92 21 51 12 24 5 443 12) Pain in other parts of body LCPO 283 68 66 16 49 12 20 5 418 13) Did pain medicine help - 41 19 39 18 70 33 65 30 215

366

367
Lung module: stage III-IV Characteristics of the sample Version of the QLQ-C30 Primary disease site N (%) N (%) v 1.0 498 38 Lung: small cell 1 0 v +3 0 0 Lung: non small cell 1,046 80 v 2.0 472 36 Lung: not known 266 20 v 3.0 343 26 Total 1,313 Total 1,313 Age N (%) <40 34 3 40-49 142 11 50-59 362 28 60-69 418 32 70-79 238 18 80+ 29 2 Not known 90 7 Total 1,313 Gender N (%) Male 580 44 Female 187 14 Not known 546 42 Total 1,313 Constructed scales Mean (SD) Median [IQR] Dyspnoea LCDY 31.5 (24.6) 22.2 [11.1-44.4] Coughing LCCO 38.4 (26.6) 33.3 [33.3-66.7] Haemoptysis LCHA 7.7 (17) 0 [0-0] Sore mouth LCSM 5.1 (14.9) 0 [0-0] Dysphagia LCDS 6.8 (17.8) 0 [0-0] Periph neuropathy LCPN 8.9 (19.8) 0 [0-0] Alopecia LCPR 5.2 (19.1) 0 [0-0] Pain in chest LCPC 20.8 (26.6) 0 [0-33.3] Pain in arm LCPA 22.4 (30.1) 0 [0-33.3] Pain other LCPO 23.8 (30.9) 0 [0-33.3]
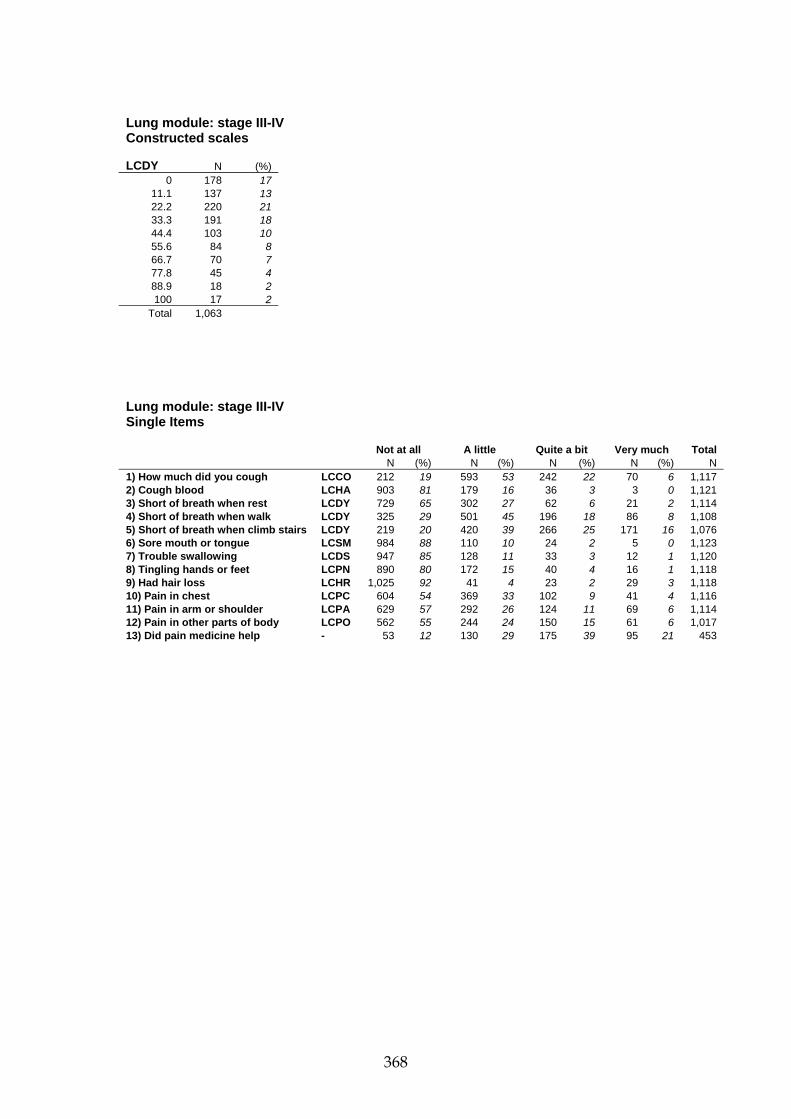
368
Lung module: stage III-IV Constructed scales LCDY N (%)
0 178 17 11.1 137 13 22.2 220 21 33.3 191 18 44.4 103 10 55.6 84 8 66.7 70 7 77.8 45 4 88.9 18 2 100 17 2
Total 1,063
Lung module: stage III-IV Single Items Not at all A little Quite a bit Very much Total N (%) N (%) N (%) N (%) N 1) How much did you cough LCCO 212 19 593 53 242 22 70 6 1,117 2) Cough blood LCHA 903 81 179 16 36 3 3 0 1,121 3) Short of breath when rest LCDY 729 65 302 27 62 6 21 2 1,114 4) Short of breath when walk LCDY 325 29 501 45 196 18 86 8 1,108 5) Short of breath when climb stairs LCDY 219 20 420 39 266 25 171 16 1,076 6) Sore mouth or tongue LCSM 984 88 110 10 24 2 5 0 1,123 7) Trouble swallowing LCDS 947 85 128 11 33 3 12 1 1,120 8) Tingling hands or feet LCPN 890 80 172 15 40 4 16 1 1,118 9) Had hair loss LCHR 1,025 92 41 4 23 2 29 3 1,118 10) Pain in chest LCPC 604 54 369 33 102 9 41 4 1,116 11) Pain in arm or shoulder LCPA 629 57 292 26 124 11 69 6 1,114 12) Pain in other parts of body LCPO 562 55 244 24 150 15 61 6 1,017 13) Did pain medicine help - 53 12 130 29 175 39 95 21 453

369

370
Lung module: recurrent/metastatic Characteristics of the sample Version of the QLQ-C30 Primary disease site N (%) N (%) v 1.0 116 38 Lung: small cell 115 37 v +3 5 2 Lung: non small cell 11 4 v 2.0 89 29 Mesothelioma 6 2 v 3.0 97 32 Lung: not known 175 57 Total 307 307 Age N (%) <40 4 1 40-49 40 13 50-59 76 25 60-69 110 36 70-79 68 22 80+ 9 3 Not known 0 0 Total 307 Gender N (%) Male 197 64 Female 98 32 Not known 12 4 Total 307 Constructed scales Mean (SD) Median [IQR] Dyspnoea LCDY 38.3 (25) 33.3 [22.2-55.6] Coughing LCCO 36.3 (23.9) 33.3 [33.3-33.3] Haemoptysis LCHA 7.4 (17.7) 0 [0-0] Sore mouth LCSM 4.8 (13.4) 0 [0-0] Dysphagia LCDS 7.4 (15.3) 0 [0-0] Periph neuropathy LCPN 9.0 (19.6) 0 [0-0] Alopecia LCPR 2.7 (12.8) 0 [0-0] Pain in chest LCPC 25.6 (24.9) 33.3 [0-33.3] Pain in arm LCPA 20.5 (28.7) 0 [0-33.3] Pain other LCPO 25.4 (29.4) 33.3 [0-33.3]

371
Lung module: recurrent/metastaticConstructed scales LCDY N (%)
0 8 8 11.1 15 14 22.2 18 17 33.3 20 19 44.4 10 9 55.6 15 14 66.7 8 8 77.8 7 7 88.9 3 3 100 2 2
Total 106
Lung module: recurrent/metastatic Single Items Not at all A little Quite a bit Very much Total N (%) N (%) N (%) N (%) N 1) How much did you cough LCCO 19 17 69 62 19 17 5 5 112 2) Cough blood LCHA 92 82 16 14 3 3 1 1 112 3) Short of breath when rest LCDY 55 50 46 41 8 7 2 2 111 4) Short of breath when walk LCDY 22 20 51 46 23 21 15 14 111 5) Short of breath when climb stairs LCDY 12 11 42 40 32 30 20 19 106 6) Sore mouth or tongue LCSM 96 87 12 11 2 2 0 0 110 7) Trouble swallowing LCDS 89 80 21 19 2 2 0 0 112 8) Tingling hands or feet LCPN 87 78 20 18 2 2 2 2 111 9) Had hair loss LCHR 105 95 4 4 1 1 1 1 111 10) Pain in chest LCPC 44 39 53 47 12 11 3 3 112 11) Pain in arm or shoulder LCPA 66 59 28 25 13 12 5 5 112 12) Pain in other parts of body LCPO 53 49 34 31 17 16 5 5 109 13) Did pain medicine help - No data available

372

373
Lung module: small cell lung cancer Characteristics of the sample Version of the QLQ-C30 N (%) v 1.0 211 32 v +3 0 0 v 2.0 8 1 v 3.0 439 67 Total 658 Age N (%) <40 5 1 40-49 79 12 50-59 227 35 60-69 238 36 70-79 105 16 80+ 4 1 Not known 0 0 Total 658 Gender N (%) Male 407 62 Female 236 36 Not known 15 2 Total 658 Stage N (%) Stage I-II 4 1 Stage III-IV 1 0 Recurrent/metastatic 115 18 Not known 538 82 Total 658 Constructed scales Mean (SD) Median [IQR] Dyspnoea LCDY 25.8 (22.4) 22.2 [11.1-33.3] Coughing LCCO 34.2 (23.9) 33.3 [33.3-33.3] Haemoptysis LCHA 3.1 (12) 0 [0-0] Sore mouth LCSM 5.2 (15.6) 0 [0-0] Dysphagia LCDS 9.8 (20.4) 0 [0-0] Periph neuropathy LCPN 16.9 (28.4) 0 [0-33.3] Alopecia LCPR 36.6 (46) 0 [0-100] Pain in chest LCPC 16.0 (22.9) 0 [0-33.3] Pain in arm LCPA 12.7 (23.3) 0 [0-33.3] Pain other LCPO 17.8 (27) 0 [0-33.3]

374
Lung module: small cell lung cancerConstructed scales LCDY N (%)
0 124 20 11.1 120 19 22.2 148 24 33.3 95 15 44.4 39 6 55.6 44 7 66.7 26 4 77.8 16 3 88.9 6 1 100 6 1
Total 624
Lung module: small cell lung cancer Single Items Not at all A little Quite a bit Very much Total N (%) N (%) N (%) N (%) N 1) How much did you cough LCCO 135 21 377 59 107 17 22 3 641 2) Cough blood LCHA 591 92 41 6 5 1 3 0 640 3) Short of breath when rest LCDY 477 75 127 20 25 4 7 1 636 4) Short of breath when walk LCDY 255 40 261 41 90 14 33 5 639 5) Short of breath when climb stairs LCDY 142 23 294 47 134 21 61 10 631 6) Sore mouth or tongue LCSM 560 88 61 10 10 2 6 1 637 7) Trouble swallowing LCDS 493 77 111 17 23 4 10 2 637 8) Tingling hands or feet LCPN 431 68 127 20 44 7 36 6 638 9) Had hair loss LCHR 363 59 31 5 27 4 198 32 619 10) Pain in chest LCPC 390 61 199 31 35 6 12 2 636 11) Pain in arm or shoulder LCPA 459 72 127 20 35 6 15 2 636 12) Pain in other parts of body LCPO 390 64 138 23 65 11 20 3 613 13) Did pain medicine help - 24 17 36 26 51 36 30 21 141

375

376
Lung module: non-small cell lung cancer Characteristics of the sample Version of the QLQ-C30 N (%) v 1.0 556 44 v +3 0 0 v 2.0 516 41 v 3.0 190 15 Total 1,262 Age N (%) <40 37 3 40-49 163 13 50-59 340 27 60-69 380 30 70-79 225 18 80+ 27 2 Not known 90 7 Total 1,262 Gender N (%) Male 514 41 Female 201 16 Not known 547 43 Total 1,262 Stage N (%) Stage I-II 17 1 Stage III-IV 1,046 83 Recurrent/metastatic 11 1 Not known 188 15 Total 1,262 Constructed scales Mean (SD) Median [IQR] Dyspnoea LCDY 29.9 (24.2) 22.2 [11.1-44.4] Coughing LCCO 38.4 (26.6) 33.3 [33.3-66.7] Haemoptysis LCHA 7.6 (16.7) 0 [0-0] Sore mouth LCSM 5.2 (15.1) 0 [0-0] Dysphagia LCDS 6.5 (17.4) 0 [0-0] Periph neuropathy LCPN 9.0 (19.8) 0 [0-0] Alopecia LCPR 7.3 (22.9) 0 [0-0] Pain in chest LCPC 19.5 (25.6) 0 [0-33.3] Pain in arm LCPA 21.4 (29.4) 0 [0-33.3] Pain other LCPO 23.1 (30.3) 0 [0-33.3]

377
Lung module: non-small cell lung cancer Constructed scales LCDY N (%)
0 202 18 11.1 155 14 22.2 235 21 33.3 191 17 44.4 95 9 55.6 87 8 66.7 65 6 77.8 46 4 88.9 14 1 100 16 1
Total 1,106
Lung module: non-small cell lung cancer Single Items Not at all A little Quite a bit Very much Total N (%) N (%) N (%) N (%) N 1) How much did you cough LCCO 220 19 620 53 249 21 74 6 1,163 2) Cough blood LCHA 941 81 185 16 37 3 2 0 1,165 3) Short of breath when rest LCDY 779 67 303 26 58 5 19 2 1,159 4) Short of breath when walk LCDY 368 32 512 45 189 16 81 7 1,150 5) Short of breath when climb stairs LCDY 240 21 463 41 258 23 161 14 1,122 6) Sore mouth or tongue LCSM 1,024 88 114 10 27 2 5 0 1,170 7) Trouble swallowing LCDS 996 86 120 10 38 3 10 1 1,164 8) Tingling hands or feet LCPN 924 79 182 16 43 4 16 1 1,165 9) Had hair loss LCHR 1,038 89 45 4 32 3 48 4 1,163 10) Pain in chest LCPC 648 56 381 33 98 8 34 3 1,161 11) Pain in arm or shoulder LCPA 666 58 305 26 122 11 65 6 1,158 12) Pain in other parts of body LCPO 595 56 252 24 160 15 55 5 1,062 13) Did pain medicine help - 125 24 132 25 182 34 90 17 529

378

379
Oesophageal module: all stages Characteristics of the sample Version of the QLQ-C30 N (%) v 1.0 56 5 v +3 0 0 v 2.0 71 7 v 3.0 904 88 Total 1,031 Age N (%) <40 9 1 40-49 101 10 50-59 237 23 60-69 346 34 70-79 270 26 80+ 68 7 Not known 0 0 Total 1,031 Gender N (%) Male 772 75 Female 248 24 Not known 11 1 Total 1,031 Stage N (%) Stage I-II 118 11 Stage III-IV 47 5 Recurrent/metastatic 347 34 Not known 519 50 Total 1,031 Constructed scales Mean (SD) Median [IQR] Swallow OESW 41.7 (28.4) 44.4 [22.2-66.7] Eating OEEA 42.6 (28.7) 41.7 [16.7-66.7] Reflux OERX 17.4 (24.8) 0 [0-33.3] Pain OEPA 26.5 (24.4) 22.2 [11.1-44.4] Saliva OESV 23.1 (32.6) 0 [0-33.3] Choking OECH 18.3 (28.6) 0 [0-33.3] Dry mouth OEDM 27.6 (34) 0 [0-33.3] Taste OETA 30.9 (36.5) 0 [0-66.7] Cough OECO 20.1 (29.3) 0 [0-33.3] Talking OESP 12.1 (25.1) 0 [0-0]
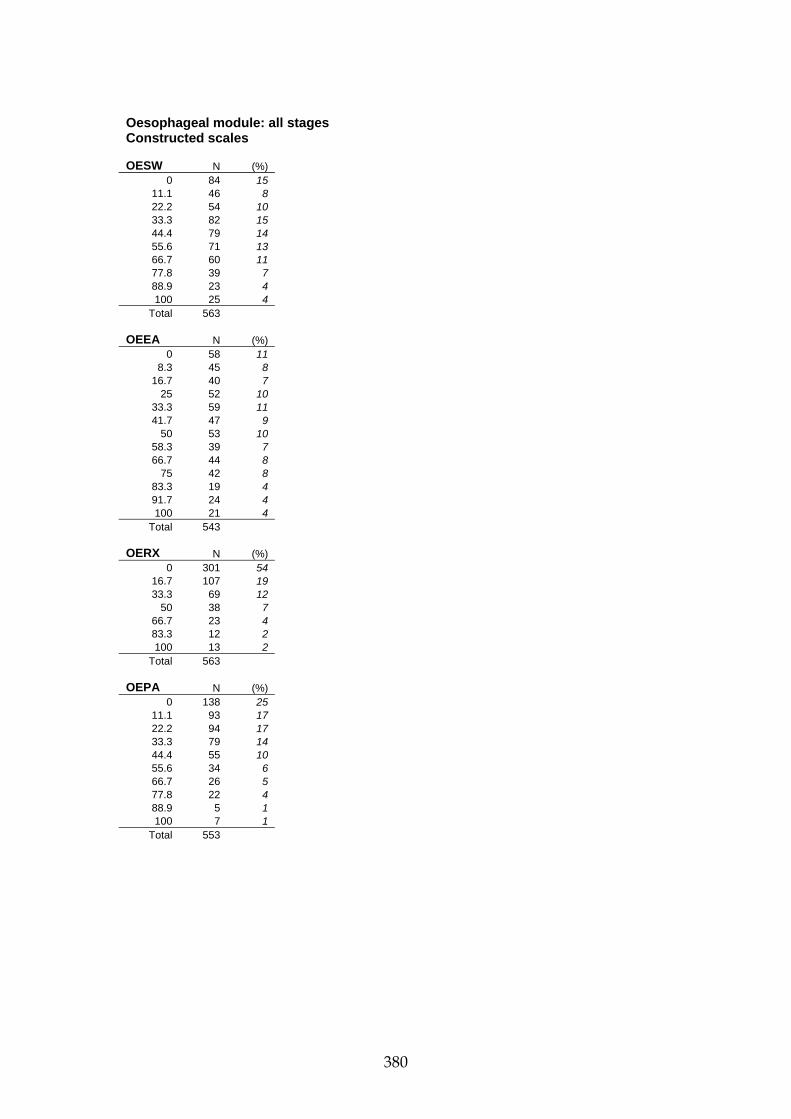
380
Oesophageal module: all stagesConstructed scales OESW N (%)
0 84 15 11.1 46 8 22.2 54 10 33.3 82 15 44.4 79 14 55.6 71 13 66.7 60 11 77.8 39 7 88.9 23 4 100 25 4
Total 563 OEEA N (%)
0 58 11 8.3 45 8
16.7 40 7 25 52 10
33.3 59 11 41.7 47 9
50 53 10 58.3 39 7 66.7 44 8
75 42 8 83.3 19 4 91.7 24 4 100 21 4
Total 543 OERX N (%)
0 301 54 16.7 107 19 33.3 69 12
50 38 7 66.7 23 4 83.3 12 2 100 13 2
Total 563 OEPA N (%)
0 138 25 11.1 93 17 22.2 94 17 33.3 79 14 44.4 55 10 55.6 34 6 66.7 26 5 77.8 22 4 88.9 5 1 100 7 1
Total 553

381
Oesophageal module: all stages Single Items Not at all A little Quite a bit Very much Total N (%) N (%) N (%) N (%) N 1) Problems eating solid foods OESW 263 47 119 21 96 17 88 16 566 2) Problems eating soft foods OESW 93 17 106 19 162 29 203 36 564 3) Problems drinking liquids OESW 37 7 47 8 140 25 342 60 566 4) Trouble swallowing saliva OESV 332 59 114 20 66 12 47 8 559 5) Choked when swallowing OECH 362 65 114 20 58 10 26 5 560 6) Trouble enjoying meals OEEA 167 30 117 21 120 22 154 28 558 7) Felt full too quickly OEEA 209 38 131 24 128 23 85 15 553 8) Trouble eating OEEA 118 21 119 21 144 26 179 32 560 9) Eating in front of people OEEA 332 60 74 13 58 10 93 17 557 10) Dry mouth OEDM 292 52 134 24 81 14 57 10 564 11) Sense of taste OETA 283 51 109 20 94 17 74 13 560 12) Trouble with coughing OECO 341 61 136 24 54 10 32 6 563 13) Trouble with talking OESP 432 77 83 15 26 5 23 4 564 14) Acid indigestion or heartburn OERX 376 66 114 20 44 8 32 6 566 15) Acid or bile in mouth OERX 381 68 106 19 43 8 33 6 563 16) Pain when eat OEPA 243 44 154 28 94 17 68 12 559 17) Pain in chest OEPA 262 47 170 30 84 15 48 9 564 18) Pain in stomach OEPA 354 63 132 23 55 10 23 4 564

382
Oesophageal module: males Characteristics of the sample Version of the QLQ-C30 N (%) v 1.0 51 7 v +3 0 0 v 2.0 58 8 v 3.0 663 86 Total 772 Age N (%) <40 8 1 40-49 79 10 50-59 182 24 60-69 280 36 70-79 178 23 80+ 45 6 Not known 0 0 Total 772 Stage N (%) Stage I-II 78 10 Stage III-IV 32 4 Recurrent/metastatic 268 35 Not known 394 51 Total 772 Constructed scales Mean (SD) Median [IQR] Swallow OESW 40.8 (28.3) 44.4 [22.2-55.6] Eating OEEA 41.2 (28.7) 41.7 [16.7-66.7] Reflux OERX 17.2 (24.8) 0 [0-33.3] Pain OEPA 25.7 (23.6) 22.2 [11.1-38.9] Saliva OESV 23.7 (33.2) 0 [0-33.3] Choking OECH 18.3 (28.2) 0 [0-33.3] Dry mouth OEDM 25.3 (32.7) 0 [0-33.3] Taste OETA 31.9 (36.3) 33.3 [0-66.7] Cough OECO 19.7 (28.7) 0 [0-33.3] Talking OESP 11.6 (24.8) 0 [0-0]

383
Oesophageal module: males Constructed scales OESW N (%)
0 68 16 11.1 34 8 22.2 44 10 33.3 64 15 44.4 65 15 55.6 58 13 66.7 39 9 77.8 27 6 88.9 15 3 100 21 5
Total 435 OEEA N (%)
0 50 12 8.3 35 8
16.7 32 8 25 40 10
33.3 48 12 41.7 36 9
50 42 10 58.3 31 7 66.7 27 6
75 32 8 83.3 11 3 91.7 20 5 100 15 4
Total 419 OERX N (%)
0 231 53 16.7 90 21 33.3 50 12
50 28 6 66.7 15 3 83.3 10 2 100 11 3
Total 435 OEPA N (%)
0 105 25 11.1 77 18 22.2 73 17 33.3 66 15 44.4 41 10 55.6 26 6 66.7 18 4 77.8 13 3 88.9 4 1 100 5 1
Total 428

384
Oesophageal module: males Single Items Not at all A little Quite a bit Very much Total N (%) N (%) N (%) N (%) N 1) Problems eating solid foods OESW 187 43 101 23 80 18 70 16 438 2) Problems eating soft foods OESW 66 15 75 17 138 32 156 36 435 3) Problems drinking liquids OESW 31 7 31 7 116 27 259 59 437 4) Trouble swallowing saliva OESV 254 59 86 20 52 12 39 9 431 5) Choked when swallowing OECH 276 64 92 21 44 10 19 4 431 6) Trouble enjoying meals OEEA 136 32 95 22 91 21 108 25 430 7) Felt full too quickly OEEA 164 38 99 23 102 24 64 15 429 8) Trouble eating OEEA 96 22 92 21 115 27 128 30 431 9) Eating in front of people OEEA 260 61 63 15 38 9 68 16 429 10) Dry mouth OEDM 237 55 103 24 58 13 37 9 435 11) Sense of taste OETA 211 49 82 19 84 20 54 13 431 12) Trouble with coughing OECO 264 61 106 24 42 10 22 5 434 13) Trouble with talking OESP 337 78 61 14 20 5 17 4 435 14) Acid indigestion or heartburn OERX 289 66 92 21 34 8 22 5 437 15) Acid or bile in mouth OERX 295 68 82 19 32 7 26 6 435 16) Pain when eat OEPA 192 44 123 28 72 17 46 11 433 17) Pain in chest OEPA 208 48 140 32 60 14 28 6 436 18) Pain in stomach OEPA 261 60 110 25 45 10 19 4 435

385
Oesophageal module: females Characteristics of the sample Version of the QLQ-C30 N (%) v 1.0 5 2 v +3 0 0 v 2.0 12 5 v 3.0 231 93 Total 248 Age N (%) <40 1 0 40-49 21 9 50-59 53 21 60-69 61 25 70-79 90 36 80+ 22 9 Not known 0 0 Total 248 Stage N (%) Stage I-II 39 16 Stage III-IV 15 6 Recurrent/metastatic 76 31 Not known 118 48 Total 248 Constructed scales Mean (SD) Median [IQR] Swallow OESW 44.7 (28.6) 44.4 [22.2-66.7] Eating OEEA 49.0 (28.3) 50 [25-66.7] Reflux OERX 17.2 (24.6) 0 [0-33.3] Pain OEPA 29.7 (27) 22.2 [0-44.4] Saliva OESV 21.3 (30.9) 0 [0-33.3] Choking OECH 18.5 (30.3) 0 [0-33.3] Dry mouth OEDM 35.9 (37.1) 33.3 [0-66.7] Taste OETA 27.7 (36.9) 0 [0-33.3] Cough OECO 21.6 (32.1) 0 [0-33.3] Talking OESP 12.6 (25.7) 0 [0-0]

386
Oesophageal module: females Constructed scales OESW N (%)
0 15 13 11.1 11 9 22.2 9 8 33.3 16 14 44.4 13 11 55.6 13 11 66.7 20 17 77.8 10 9 88.9 8 7 100 3 3
Total 118 OEEA N (%)
0 6 5 8.3 9 8
16.7 8 7 25 10 9
33.3 10 9 41.7 9 8
50 11 10 58.3 8 7 66.7 16 14
75 10 9 83.3 8 7 91.7 4 4 100 6 5
Total 115 OERX N (%)
0 66 56 16.7 17 14 33.3 16 14
50 9 8 66.7 6 5 83.3 2 2 100 2 2
Total 118 OEPA N (%)
0 30 26 11.1 15 13 22.2 20 17 33.3 11 10 44.4 13 11 55.6 8 7 66.7 8 7 77.8 8 7 88.9 1 1 100 2 2
Total 116

387
Oesophageal module: females Single Items Not at all A little Quite a bit Very much Total N (%) N (%) N (%) N (%) N 1) Problems eating solid foods OESW 71 60 15 13 15 13 17 14 118 2) Problems eating soft foods OESW 26 22 28 24 23 19 42 35 119 3) Problems drinking liquids OESW 4 3 14 12 24 20 77 65 119 4) Trouble swallowing saliva OESV 72 61 26 22 13 11 8 7 119 5) Choked when swallowing OECH 80 67 19 16 13 11 7 6 119 6) Trouble enjoying meals OEEA 26 22 20 17 29 24 44 37 119 7) Felt full too quickly OEEA 40 35 31 27 23 20 21 18 115 8) Trouble eating OEEA 18 15 24 20 28 24 49 41 119 9) Eating in front of people OEEA 65 55 11 9 19 16 23 20 118 10) Dry mouth OEDM 50 42 29 24 21 18 19 16 119 11) Sense of taste OETA 66 56 25 21 10 8 18 15 119 12) Trouble with coughing OECO 73 61 25 21 11 9 10 8 119 13) Trouble with talking OESP 90 76 18 15 6 5 5 4 119 14) Acid indigestion or heartburn OERX 82 69 19 16 9 8 9 8 119 15) Acid or bile in mouth OERX 82 70 21 18 8 7 7 6 118 16) Pain when eat OEPA 45 39 30 26 21 18 21 18 117 17) Pain in chest OEPA 50 42 27 23 23 20 18 15 118 18) Pain in stomach OEPA 86 72 19 16 10 8 4 3 119

388
Oesophageal module: 50-59 Characteristics of the sample Version of the QLQ-C30 N (%) v 1.0 19 8 v +3 0 0 v 2.0 20 8 v 3.0 198 84 Total 237 Age N (%) <40 0 0 40-49 0 0 50-59 237 100 60-69 0 0 70-79 0 0 80+ 0 0 Not known 0 0 Total 237 Gender N (%) Male 182 77 Female 53 22 Not known 2 1 Total 237 Stage N (%) Stage I-II 37 16 Stage III-IV 6 3 Recurrent/metastatic 75 32 Not known 119 50 Total 237 Constructed scales Mean (SD) Median [IQR] Swallow OESW 39.3 (28.8) 33.3 [11.1-55.6] Eating OEEA 40.8 (29.7) 41.7 [16.7-66.7] Reflux OERX 17.2 (25.5) 0 [0-33.3] Pain OEPA 24.9 (22.6) 22.2 [0-33.3] Saliva OESV 23.2 (34.9) 0 [0-33.3] Choking OECH 16.9 (27.4) 0 [0-33.3] Dry mouth OEDM 23.3 (31.6) 0 [0-33.3] Taste OETA 34.6 (37) 33.3 [0-66.7] Cough OECO 18.3 (26.3) 0 [0-33.3] Talking OESP 15.4 (26.8) 0 [0-33.3]
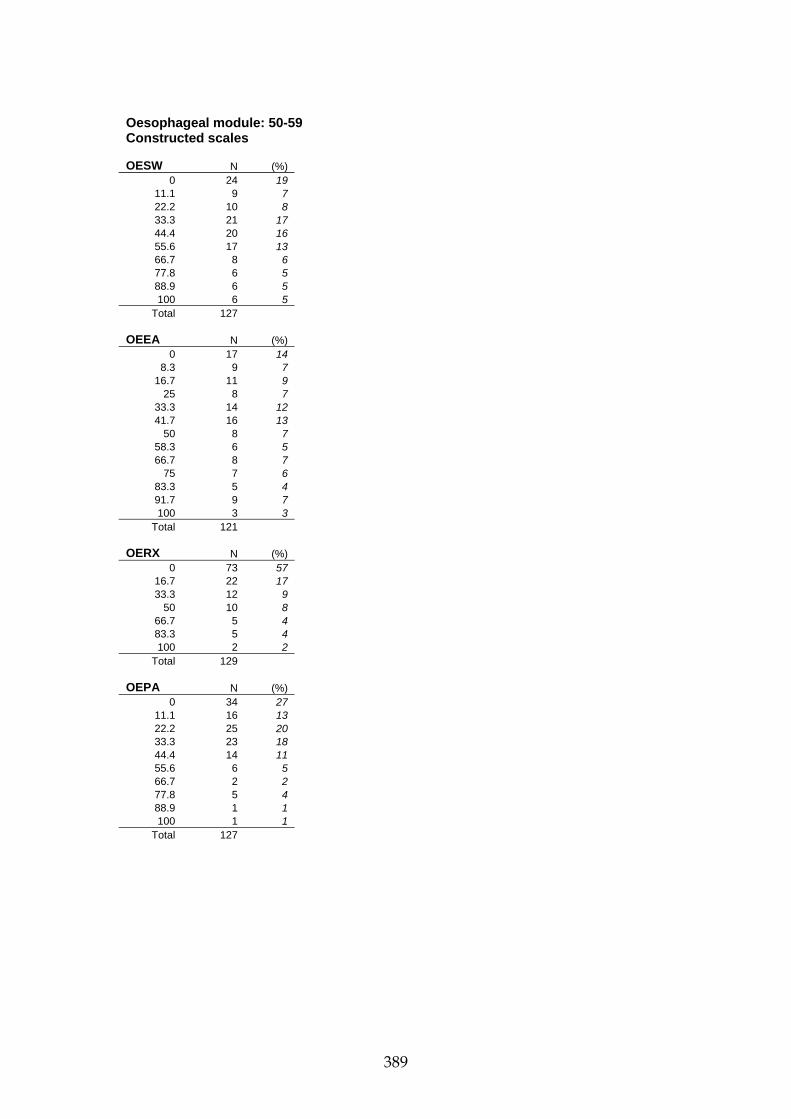
389
Oesophageal module: 50-59 Constructed scales OESW N (%)
0 24 19 11.1 9 7 22.2 10 8 33.3 21 17 44.4 20 16 55.6 17 13 66.7 8 6 77.8 6 5 88.9 6 5 100 6 5
Total 127 OEEA N (%)
0 17 14 8.3 9 7
16.7 11 9 25 8 7
33.3 14 12 41.7 16 13
50 8 7 58.3 6 5 66.7 8 7
75 7 6 83.3 5 4 91.7 9 7 100 3 3
Total 121 OERX N (%)
0 73 57 16.7 22 17 33.3 12 9
50 10 8 66.7 5 4 83.3 5 4 100 2 2
Total 129 OEPA N (%)
0 34 27 11.1 16 13 22.2 25 20 33.3 23 18 44.4 14 11 55.6 6 5 66.7 2 2 77.8 5 4 88.9 1 1 100 1 1
Total 127

390
Oesophageal module: 50-59 Single Items Not at all A little Quite a bit Very much Total N (%) N (%) N (%) N (%) N 1) Problems eating solid foods OESW 59 46 25 20 20 16 24 19 128 2) Problems eating soft foods OESW 20 16 16 13 40 31 52 41 128 3) Problems drinking liquids OESW 9 7 8 6 32 25 80 62 129 4) Trouble swallowing saliva OESV 82 64 16 13 17 13 13 10 128 5) Choked when swallowing OECH 85 66 26 20 12 9 5 4 128 6) Trouble enjoying meals OEEA 39 31 31 24 24 19 33 26 127 7) Felt full too quickly OEEA 49 40 30 24 29 23 16 13 124 8) Trouble eating OEEA 32 26 27 22 30 24 36 29 125 9) Eating in front of people OEEA 76 61 12 10 14 11 23 18 125 10) Dry mouth OEDM 72 56 35 27 11 9 11 9 129 11) Sense of taste OETA 57 45 28 22 24 19 19 15 128 12) Trouble with coughing OECO 78 61 35 27 12 9 4 3 129 13) Trouble with talking OESP 89 70 24 19 10 8 5 4 128 14) Acid indigestion or heartburn OERX 86 67 24 19 10 8 9 7 129 15) Acid or bile in mouth OERX 92 71 19 15 11 9 7 5 129 16) Pain when eat OEPA 57 45 33 26 24 19 14 11 128 17) Pain in chest OEPA 63 49 43 34 15 12 7 6 128 18) Pain in stomach OEPA 82 64 32 25 8 6 7 5 129
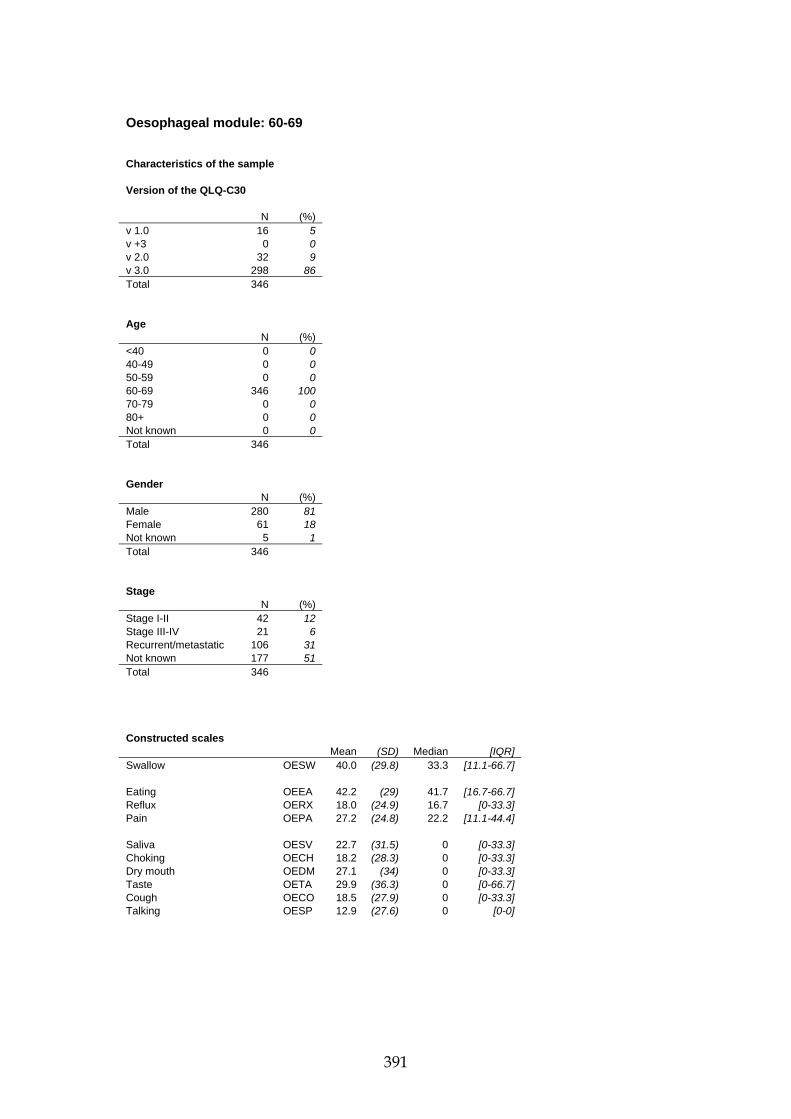
391
Oesophageal module: 60-69 Characteristics of the sample Version of the QLQ-C30 N (%) v 1.0 16 5 v +3 0 0 v 2.0 32 9 v 3.0 298 86 Total 346 Age N (%) <40 0 0 40-49 0 0 50-59 0 0 60-69 346 100 70-79 0 0 80+ 0 0 Not known 0 0 Total 346 Gender N (%) Male 280 81 Female 61 18 Not known 5 1 Total 346 Stage N (%) Stage I-II 42 12 Stage III-IV 21 6 Recurrent/metastatic 106 31 Not known 177 51 Total 346 Constructed scales Mean (SD) Median [IQR] Swallow OESW 40.0 (29.8) 33.3 [11.1-66.7] Eating OEEA 42.2 (29) 41.7 [16.7-66.7] Reflux OERX 18.0 (24.9) 16.7 [0-33.3] Pain OEPA 27.2 (24.8) 22.2 [11.1-44.4] Saliva OESV 22.7 (31.5) 0 [0-33.3] Choking OECH 18.2 (28.3) 0 [0-33.3] Dry mouth OEDM 27.1 (34) 0 [0-33.3] Taste OETA 29.9 (36.3) 0 [0-66.7] Cough OECO 18.5 (27.9) 0 [0-33.3] Talking OESP 12.9 (27.6) 0 [0-0]

392
Oesophageal module: 60-69 Constructed scales OESW N (%)
0 37 19 11.1 19 10 22.2 17 9 33.3 26 13 44.4 20 10 55.6 24 12 66.7 26 13 77.8 10 5 88.9 9 5 100 9 5
Total 197 OEEA N (%)
0 21 11 8.3 18 9
16.7 12 6 25 16 8
33.3 28 15 41.7 12 6
50 18 9 58.3 16 8 66.7 11 6
75 17 9 83.3 7 4 91.7 6 3 100 9 5
Total 191 OERX N (%)
0 97 50 16.7 44 23 33.3 27 14
50 11 6 66.7 6 3 83.3 4 2 100 6 3
Total 195 OEPA N (%)
0 48 25 11.1 34 17 22.2 29 15 33.3 32 16 44.4 13 7 55.6 14 7 66.7 13 7 77.8 9 5 88.9 1 1 100 2 1
Total 195

393
Oesophageal module: 60-69 Single Items Not at all A little Quite a bit Very much Total N (%) N (%) N (%) N (%) N 1) Problems eating solid foods OESW 84 42 40 20 36 18 38 19 198 2) Problems eating soft foods OESW 31 16 42 21 46 23 78 40 197 3) Problems drinking liquids OESW 13 7 17 9 46 23 122 62 198 4) Trouble swallowing saliva OESV 113 57 50 25 18 9 16 8 197 5) Choked when swallowing OECH 126 64 42 21 19 10 9 5 196 6) Trouble enjoying meals OEEA 66 34 38 20 33 17 57 29 194 7) Felt full too quickly OEEA 70 36 49 25 47 24 28 14 194 8) Trouble eating OEEA 43 22 45 23 48 24 61 31 197 9) Eating in front of people OEEA 115 59 33 17 13 7 34 17 195 10) Dry mouth OEDM 103 52 49 25 24 12 21 11 197 11) Sense of taste OETA 100 52 38 20 30 16 25 13 193 12) Trouble with coughing OECO 123 63 45 23 20 10 8 4 196 13) Trouble with talking OESP 152 77 27 14 5 3 13 7 197 14) Acid indigestion or heartburn OERX 130 66 43 22 13 7 11 6 197 15) Acid or bile in mouth OERX 125 64 46 24 9 5 15 8 195 16) Pain when eat OEPA 87 44 57 29 30 15 22 11 196 17) Pain in chest OEPA 89 45 58 29 34 17 18 9 199 18) Pain in stomach OEPA 119 60 45 23 25 13 8 4 197
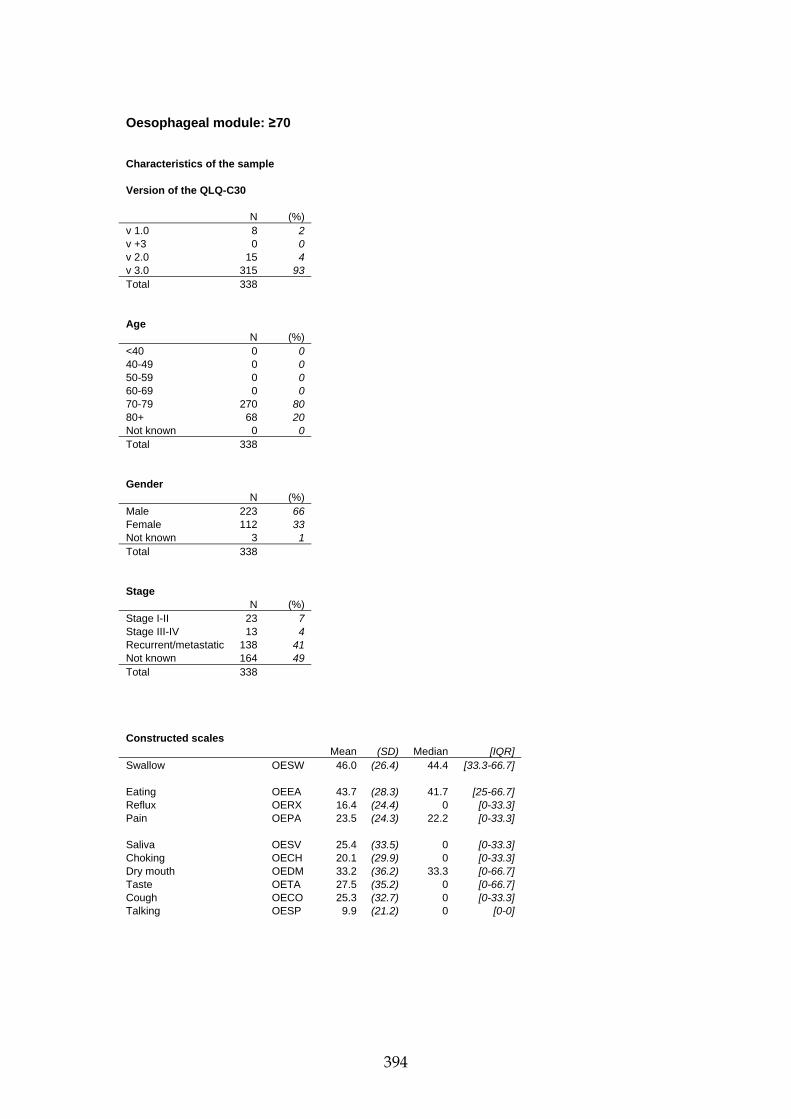
394
Oesophageal module: ≥70 Characteristics of the sample Version of the QLQ-C30 N (%) v 1.0 8 2 v +3 0 0 v 2.0 15 4 v 3.0 315 93 Total 338 Age N (%) <40 0 0 40-49 0 0 50-59 0 0 60-69 0 0 70-79 270 80 80+ 68 20 Not known 0 0 Total 338 Gender N (%) Male 223 66 Female 112 33 Not known 3 1 Total 338 Stage N (%) Stage I-II 23 7 Stage III-IV 13 4 Recurrent/metastatic 138 41 Not known 164 49 Total 338 Constructed scales Mean (SD) Median [IQR] Swallow OESW 46.0 (26.4) 44.4 [33.3-66.7] Eating OEEA 43.7 (28.3) 41.7 [25-66.7] Reflux OERX 16.4 (24.4) 0 [0-33.3] Pain OEPA 23.5 (24.3) 22.2 [0-33.3] Saliva OESV 25.4 (33.5) 0 [0-33.3] Choking OECH 20.1 (29.9) 0 [0-33.3] Dry mouth OEDM 33.2 (36.2) 33.3 [0-66.7] Taste OETA 27.5 (35.2) 0 [0-66.7] Cough OECO 25.3 (32.7) 0 [0-33.3] Talking OESP 9.9 (21.2) 0 [0-0]

395
Oesophageal module: ≥70 Constructed scales OESW N (%)
0 16 9 11.1 14 8 22.2 16 9 33.3 28 15 44.4 29 16 55.6 26 14 66.7 22 12 77.8 20 11 88.9 8 4 100 6 3
Total 185 OEEA N (%)
0 16 9 8.3 14 8
16.7 12 7 25 25 14
33.3 11 6 41.7 14 8
50 19 11 58.3 14 8 66.7 19 11
75 13 7 83.3 6 3 91.7 7 4 100 7 4
Total 177 OERX N (%)
0 106 58 16.7 27 15 33.3 24 13
50 13 7 66.7 7 4 83.3 3 2 100 4 2
Total 184 OEPA N (%)
0 50 28 11.1 38 22 22.2 31 18 33.3 16 9 44.4 18 10 55.6 7 4 66.7 7 4 77.8 5 3 88.9 2 1 100 3 2
Total 177

396
Oesophageal module: ≥70 Single Items Not at all A little Quite a bit Very much Total N (%) N (%) N (%) N (%) N 1) Problems eating solid foods OESW 99 54 35 19 32 17 19 10 185 2) Problems eating soft foods OESW 34 18 41 22 59 32 51 28 185 3) Problems drinking liquids OESW 11 6 20 11 51 28 103 56 185 4) Trouble swallowing saliva OESV 102 57 34 19 29 16 15 8 180 5) Choked when swallowing OECH 114 63 35 19 24 13 9 5 182 6) Trouble enjoying meals OEEA 47 26 35 19 51 28 49 27 182 7) Felt full too quickly OEEA 72 40 36 20 40 22 33 18 181 8) Trouble eating OEEA 34 19 36 20 49 27 64 35 183 9) Eating in front of people OEEA 111 61 20 11 24 13 27 15 182 10) Dry mouth OEDM 85 46 37 20 38 21 23 13 183 11) Sense of taste OETA 100 54 37 20 26 14 21 11 184 12) Trouble with coughing OECO 98 54 48 26 20 11 17 9 183 13) Trouble with talking OESP 145 78 28 15 9 5 3 2 185 14) Acid indigestion or heartburn OERX 128 69 34 18 15 8 8 4 185 15) Acid or bile in mouth OERX 128 70 28 15 19 10 9 5 184 16) Pain when eat OEPA 85 47 49 27 27 15 19 11 180 17) Pain in chest OEPA 95 52 49 27 21 12 17 9 182 18) Pain in stomach OEPA 124 67 43 23 11 6 6 3 184

397
Ovarian module: all stages Characteristics of the sample Version of the QLQ-C30 N (%) v 1.0 10 1 v +3 64 7 v 2.0 109 12 v 3.0 734 80 Total 917 Age N (%) <40 44 5 40-49 136 15 50-59 255 28 60-69 317 35 70-79 156 17 80+ 8 1 Not known 1 0 Total 917 Stage N (%) Stage I-II 214 23 Stage III-IV 662 72 Recurrent/metastatic 18 2 Not known 23 3 Total 917 Constructed scales Mean (SD) Median [IQR] Abdominal/GI OVAG 21.9 (22.1) 16.7 [5.6-33.3] Peripheral neuropathy OVPN 17.1 (27.2) 0 [0-33.3] Hormonal OVHO 25.8 (30.3) 16.7 [0-33.3] Body image OVBI 22.2 (27.4) 16.7 [0-33.3] Attitude to disease/treatment OVAT 42.3 (30.6) 44.4 [22.2-66.7] Chemotherapy side effects OVCH 19.5 (20.5) 13.3 [0-26.7] Other single items OVOT 28.5 (23.7) 25 [8.3-41.7]

398
Ovarian module: all stages Constructed scales OVAG N (%) OVAT N (%)
0 53 20 0 40 16 5.6 34 13 11.1 23 9
11.1 33 13 22.2 28 11 16.7 36 14 33.3 36 14 22.2 16 6 44.4 30 12 27.8 18 7 55.6 20 8 33.3 12 5 66.7 29 11 38.9 12 5 77.8 19 8 44.4 8 3 88.9 13 5
50 7 3 100 17 7 55.6 8 3 Total 255 61.1 6 2 66.7 7 3 OVCH N (%) 72.2 2 1 0 68 26 77.8 1 0 6.7 34 13 83.3 4 2 13.3 40 16 88.9 1 0 20 31 12 94.4 0 0 26.7 29 11 100 2 1 33.3 10 4
Total 260 40 14 5 46.7 7 3 OVPN N (%) 53.3 9 4
0 159 61 60 6 2 16.7 30 12 66.7 1 0 33.3 32 12 73.3 2 1
50 12 5 80 3 1 66.7 13 5 86.7 1 0 83.3 4 2 93.3 2 1 100 11 4 100 1 0
Total 261 Total 258 OVHO N (%)
0 111 42 16.7 46 18 33.3 41 16
50 21 8 66.7 21 8 83.3 6 2 100 17 7
Total 263 OVBI N (%)
0 126 48 16.7 38 14 33.3 40 15
50 26 10 66.7 18 7 83.3 8 3 100 7 3
Total 263
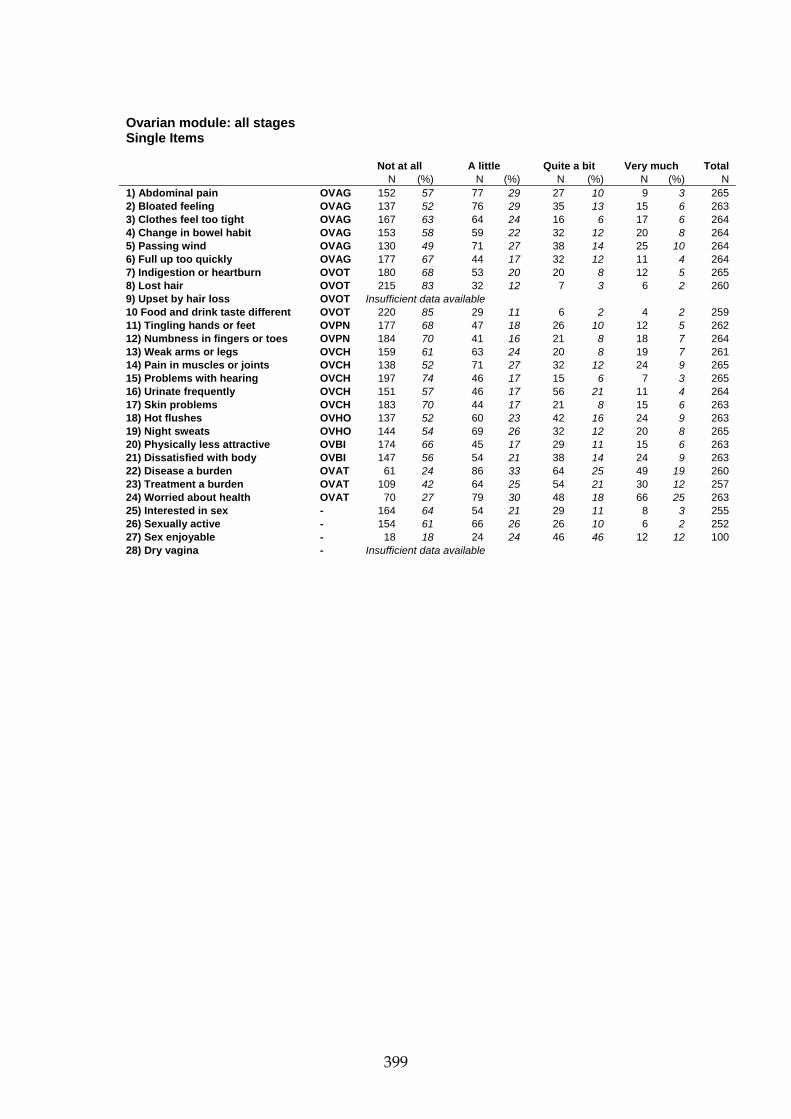
399
Ovarian module: all stages Single Items Not at all A little Quite a bit Very much Total N (%) N (%) N (%) N (%) N 1) Abdominal pain OVAG 152 57 77 29 27 10 9 3 265 2) Bloated feeling OVAG 137 52 76 29 35 13 15 6 263 3) Clothes feel too tight OVAG 167 63 64 24 16 6 17 6 264 4) Change in bowel habit OVAG 153 58 59 22 32 12 20 8 264 5) Passing wind OVAG 130 49 71 27 38 14 25 10 264 6) Full up too quickly OVAG 177 67 44 17 32 12 11 4 264 7) Indigestion or heartburn OVOT 180 68 53 20 20 8 12 5 265 8) Lost hair OVOT 215 83 32 12 7 3 6 2 260 9) Upset by hair loss OVOT Insufficient data available 10 Food and drink taste different OVOT 220 85 29 11 6 2 4 2 259 11) Tingling hands or feet OVPN 177 68 47 18 26 10 12 5 262 12) Numbness in fingers or toes OVPN 184 70 41 16 21 8 18 7 264 13) Weak arms or legs OVCH 159 61 63 24 20 8 19 7 261 14) Pain in muscles or joints OVCH 138 52 71 27 32 12 24 9 265 15) Problems with hearing OVCH 197 74 46 17 15 6 7 3 265 16) Urinate frequently OVCH 151 57 46 17 56 21 11 4 264 17) Skin problems OVCH 183 70 44 17 21 8 15 6 263 18) Hot flushes OVHO 137 52 60 23 42 16 24 9 263 19) Night sweats OVHO 144 54 69 26 32 12 20 8 265 20) Physically less attractive OVBI 174 66 45 17 29 11 15 6 263 21) Dissatisfied with body OVBI 147 56 54 21 38 14 24 9 263 22) Disease a burden OVAT 61 24 86 33 64 25 49 19 260 23) Treatment a burden OVAT 109 42 64 25 54 21 30 12 257 24) Worried about health OVAT 70 27 79 30 48 18 66 25 263 25) Interested in sex - 164 64 54 21 29 11 8 3 255 26) Sexually active - 154 61 66 26 26 10 6 2 252 27) Sex enjoyable - 18 18 24 24 46 46 12 12 100 28) Dry vagina - Insufficient data available

400
Ovarian module: stage I-II Characteristics of the sample Version of the QLQ-C30 N (%) v 1.0 9 4 v +3 3 1 v 2.0 23 11 v 3.0 179 84 Total 214 Age N (%) <40 25 12 40-49 37 17 50-59 64 30 60-69 57 27 70-79 29 14 80+ 1 1 Not known 1 1 Total 214 Constructed scales Mean (SD) Median [IQR] Abdominal/GI OVAG 17.9 (20.9) 11.1 [0-22.2] Peripheral neuropathy OVPN 15.5 (26.8) 0 [0-16.7] Hormonal OVHO 30.8 (33.4) 16.7 [0-50] Body image OVBI 20.4 (26.8) 0 [0-33.3] Attitude to disease/treatment OVAT 36.6 (29.7) 33.3 [11.1-66.7] Chemotherapy side effects OVCH 19.5 (21.2) 13.3 [0-26.7] Other single items OVOT 28.7 (26.3) 25 [12.5-41.7]

401
Ovarian module: stage I-II Constructed scales OVAG N (%) OVAT N (%)
0 32 26 0 24 20 5.6 19 16 11.1 13 11
11.1 16 13 22.2 22 18 16.7 15 12 33.3 12 10 22.2 10 8 44.4 11 9 27.8 6 5 55.6 10 8 33.3 5 4 66.7 13 11 38.9 1 1 77.8 10 8 44.4 5 4 88.9 2 2
50 1 1 100 6 5 55.6 4 3 Total 123 61.1 1 1 66.7 2 2 OVCH N (%) 72.2 1 1 0 34 28 77.8 0 0 6.7 19 15 83.3 1 1 13.3 13 11 88.9 1 1 20 17 14 94.4 0 0 26.7 14 11 100 1 1 33.3 2 2
Total 121 40 8 7 46.7 5 4 OVPN N (%) 53.3 5 4
0 79 63 60 1 1 16.7 19 15 66.7 0 0 33.3 9 7 73.3 0 0
50 6 5 80 2 2 66.7 4 3 86.7 1 1 83.3 3 2 93.3 2 2 100 5 4 100 0 0
Total 125 Total 123 OVHO N (%)
0 48 39 16.7 18 15 33.3 19 15
50 11 9 66.7 12 10 83.3 4 3 100 12 10
Total 124 OVBI N (%)
0 66 53 16.7 13 11 33.3 18 15
50 14 11 66.7 6 5 83.3 5 4 100 2 2
Total 124
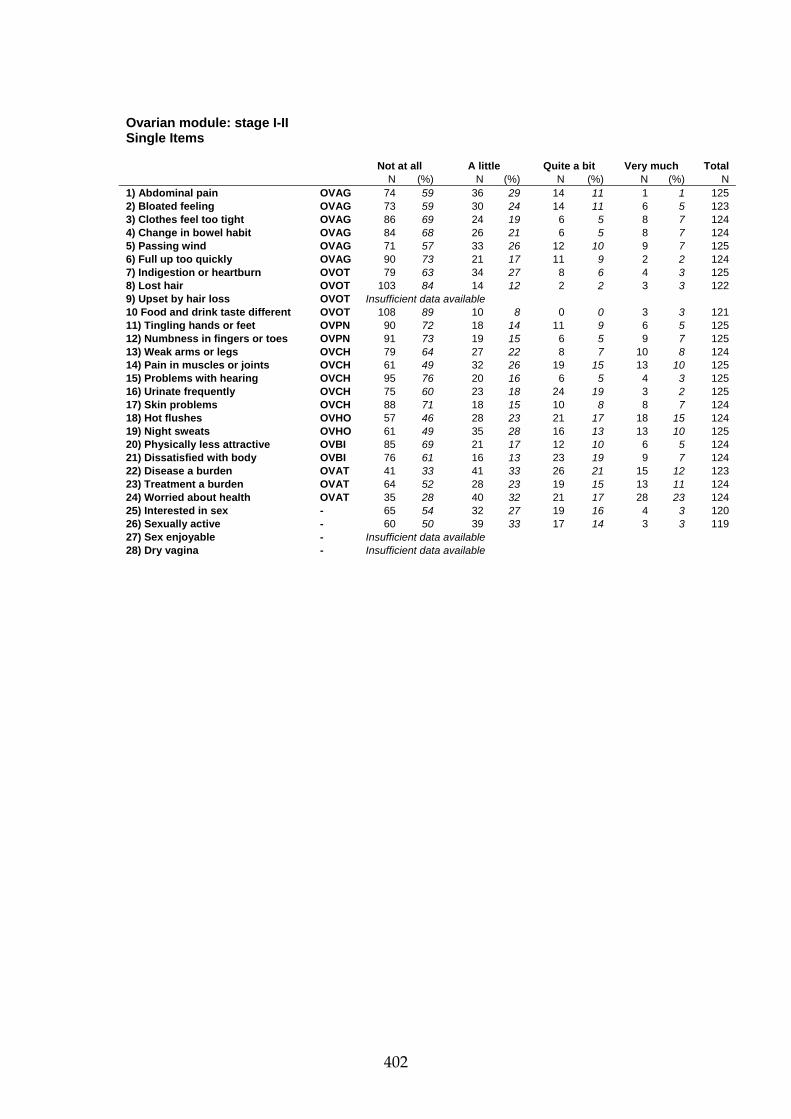
402
Ovarian module: stage I-II Single Items Not at all A little Quite a bit Very much Total N (%) N (%) N (%) N (%) N 1) Abdominal pain OVAG 74 59 36 29 14 11 1 1 125 2) Bloated feeling OVAG 73 59 30 24 14 11 6 5 123 3) Clothes feel too tight OVAG 86 69 24 19 6 5 8 7 124 4) Change in bowel habit OVAG 84 68 26 21 6 5 8 7 124 5) Passing wind OVAG 71 57 33 26 12 10 9 7 125 6) Full up too quickly OVAG 90 73 21 17 11 9 2 2 124 7) Indigestion or heartburn OVOT 79 63 34 27 8 6 4 3 125 8) Lost hair OVOT 103 84 14 12 2 2 3 3 122 9) Upset by hair loss OVOT Insufficient data available 10 Food and drink taste different OVOT 108 89 10 8 0 0 3 3 121 11) Tingling hands or feet OVPN 90 72 18 14 11 9 6 5 125 12) Numbness in fingers or toes OVPN 91 73 19 15 6 5 9 7 125 13) Weak arms or legs OVCH 79 64 27 22 8 7 10 8 124 14) Pain in muscles or joints OVCH 61 49 32 26 19 15 13 10 125 15) Problems with hearing OVCH 95 76 20 16 6 5 4 3 125 16) Urinate frequently OVCH 75 60 23 18 24 19 3 2 125 17) Skin problems OVCH 88 71 18 15 10 8 8 7 124 18) Hot flushes OVHO 57 46 28 23 21 17 18 15 124 19) Night sweats OVHO 61 49 35 28 16 13 13 10 125 20) Physically less attractive OVBI 85 69 21 17 12 10 6 5 124 21) Dissatisfied with body OVBI 76 61 16 13 23 19 9 7 124 22) Disease a burden OVAT 41 33 41 33 26 21 15 12 123 23) Treatment a burden OVAT 64 52 28 23 19 15 13 11 124 24) Worried about health OVAT 35 28 40 32 21 17 28 23 124 25) Interested in sex - 65 54 32 27 19 16 4 3 120 26) Sexually active - 60 50 39 33 17 14 3 3 119 27) Sex enjoyable - Insufficient data available 28) Dry vagina - Insufficient data available

403
Ovarian module: stage III-IV Characteristics of the sample Version of the QLQ-C30 N (%) v 1.0 0 0 v +3 61 9 v 2.0 79 12 v 3.0 522 79 Total 662 Age N (%) <40 19 3 40-49 92 14 50-59 181 27 60-69 249 38 70-79 114 17 80+ 7 1 Not known 0 0 Total 662 Constructed scales Mean (SD) Median [IQR] Abdominal/GI OVAG 26.7 (23.4) 16.7 [5.6-38.9] Peripheral neuropathy OVPN 18.7 (28.8) 0 [0-33.3] Hormonal OVHO 21.2 (26.6) 16.7 [0-33.3] Body image OVBI 23.9 (27.9) 16.7 [0-33.3] Attitude to disease/treatment OVAT 49.8 (30.6) 44.4 [33.3-77.8] Chemotherapy side effects OVCH 20.2 (20.6) 13.3 [6.7-26.7] Other single items OVOT 28.8 (22.9) 25 [8.3-41.7]

404
Ovarian module: stage III-IV Constructed scales OVAG N (%) OVAT N (%)
0 19 16 0 12 11 5.6 11 9 11.1 8 7
11.1 12 10 22.2 5 5 16.7 18 15 33.3 18 16 22.2 5 4 44.4 16 14 27.8 10 9 55.6 9 8 33.3 7 6 66.7 14 13 38.9 8 7 77.8 9 8 44.4 3 3 88.9 10 9
50 6 5 100 10 9 55.6 4 3 Total 111 61.1 5 4 66.7 5 4 OVCH N (%) 72.2 0 0 0 27 24 77.8 1 1 6.7 12 11 83.3 3 3 13.3 24 21 88.9 0 0 20 13 11 94.4 0 0 26.7 14 12 100 1 1 33.3 5 4
Total 118 40 4 4 46.7 2 2 OVPN N (%) 53.3 3 3
0 71 62 60 5 4 16.7 6 5 66.7 1 1 33.3 18 16 73.3 2 2
50 6 5 80 1 1 66.7 7 6 86.7 0 0 83.3 1 1 93.3 0 0 100 6 5 100 1 1
Total 115 Total 114 OVHO N (%)
0 55 47 16.7 21 18 33.3 20 17
50 9 8 66.7 7 6 83.3 2 2 100 4 3
Total 118 OVBI N (%)
0 50 42 16.7 23 20 33.3 17 14
50 11 9 66.7 11 9 83.3 1 1 100 5 4
Total 118

405
Ovarian module: stage III-IV Single Items Not at all A little Quite a bit Very much Total N (%) N (%) N (%) N (%) N 1) Abdominal pain OVAG 61 51 37 31 13 11 8 7 119 2) Bloated feeling OVAG 55 46 36 30 20 17 8 7 119 3) Clothes feel too tight OVAG 69 58 33 28 8 7 9 8 119 4) Change in bowel habit OVAG 56 47 28 24 24 20 11 9 119 5) Passing wind OVAG 51 43 31 26 23 20 13 11 118 6) Full up too quickly OVAG 70 59 21 18 20 17 8 7 119 7) Indigestion or heartburn OVOT 82 69 18 15 11 9 8 7 119 8) Lost hair OVOT 94 80 16 14 5 4 3 3 118 9) Upset by hair loss OVOT Insufficient data available 10 Food and drink taste different OVOT 94 80 16 14 6 5 1 1 117 11) Tingling hands or feet OVPN 75 65 24 21 11 10 6 5 116 12) Numbness in fingers or toes OVPN 80 68 16 14 13 11 9 8 118 13) Weak arms or legs OVCH 68 59 29 25 12 10 7 6 116 14) Pain in muscles or joints OVCH 65 55 34 29 11 9 9 8 119 15) Problems with hearing OVCH 85 71 23 19 8 7 3 3 119 16) Urinate frequently OVCH 65 55 17 14 29 25 7 6 118 17) Skin problems OVCH 77 65 23 20 11 9 7 6 118 18) Hot flushes OVHO 67 57 27 23 19 16 5 4 118 19) Night sweats OVHO 72 61 28 24 14 12 5 4 119 20) Physically less attractive OVBI 76 64 19 16 15 13 8 7 118 21) Dissatisfied with body OVBI 60 51 33 28 12 10 13 11 118 22) Disease a burden OVAT 15 13 38 33 33 28 30 26 116 23) Treatment a burden OVAT 34 30 30 27 33 30 15 13 112 24) Worried about health OVAT 28 24 31 26 24 20 35 30 118 25) Interested in sex - 85 73 18 16 9 8 4 3 116 26) Sexually active - 80 70 23 20 8 7 3 3 114 27) Sex enjoyable - Insufficient data available 28) Dry vagina - Insufficient data available

EORTC QLQ-C30
Graphs
406 406

Global health status/QoL (QL)
5060
7080
9010
0
30 40 50 60 70 80Age
Males Females
General population
5060
7080
9010
0
30 40 50 60 70 80Age
Males Females
Stage I-II50
6070
8090
100
30 40 50 60 70 80Age
Males Females
Stage III-IV
5060
7080
9010
0
30 40 50 60 70 80Age
Males Females
Recurrent/metastatic
Physical functioning (PF)
5060
7080
9010
0
30 40 50 60 70 80Age
Males Females
General population
5060
7080
9010
0
30 40 50 60 70 80Age
Males Females
Stage I-II
5060
7080
9010
0
30 40 50 60 70 80Age
Males Females
Stage III-IV
5060
7080
9010
0
30 40 50 60 70 80Age
Males Females
Recurrent/metastatic
407 407

Role functioning (RF)
5060
7080
9010
0
30 40 50 60 70 80Age
Males Females
General population
5060
7080
9010
0
30 40 50 60 70 80Age
Males Females
Stage I-II50
6070
8090
100
30 40 50 60 70 80Age
Males Females
Stage III-IV
5060
7080
9010
0
30 40 50 60 70 80Age
Males Females
Recurrent/metastatic
Emotional functioning (EF)
5060
7080
9010
0
30 40 50 60 70 80Age
Males Females
General population
5060
7080
9010
0
30 40 50 60 70 80Age
Males Females
Stage I-II
5060
7080
9010
0
30 40 50 60 70 80Age
Males Females
Stage III-IV
5060
7080
9010
0
30 40 50 60 70 80Age
Males Females
Recurrent/metastatic
408 408

Cognitive functioning (CF)
5060
7080
9010
0
30 40 50 60 70 80Age
Males Females
General population
5060
7080
9010
0
30 40 50 60 70 80Age
Males Females
Stage I-II50
6070
8090
100
30 40 50 60 70 80Age
Males Females
Stage III-IV
5060
7080
9010
0
30 40 50 60 70 80Age
Males Females
Recurrent/metastatic
Social functioning (SF)
5060
7080
9010
0
30 40 50 60 70 80Age
Males Females
General population
5060
7080
9010
0
30 40 50 60 70 80Age
Males Females
Stage I-II
5060
7080
9010
0
30 40 50 60 70 80Age
Males Females
Stage III-IV
5060
7080
9010
0
30 40 50 60 70 80Age
Males Females
Recurrent/metastatic
409 409

Fatigue (FA)
010
2030
4050
30 40 50 60 70 80Age
Males Females
General population
010
2030
4050
30 40 50 60 70 80Age
Males Females
Stage I-II0
1020
3040
50
30 40 50 60 70 80Age
Males Females
Stage III-IV
010
2030
4050
30 40 50 60 70 80Age
Males Females
Recurrent/metastatic
Nausea and vomiting (NV)
010
2030
4050
30 40 50 60 70 80Age
Males Females
General population
010
2030
4050
30 40 50 60 70 80Age
Males Females
Stage I-II
010
2030
4050
30 40 50 60 70 80Age
Males Females
Stage III-IV
010
2030
4050
30 40 50 60 70 80Age
Males Females
Recurrent/metastatic
410 410

Pain (PA)
010
2030
4050
30 40 50 60 70 80Age
Males Females
General population
010
2030
4050
30 40 50 60 70 80Age
Males Females
Stage I-II0
1020
3040
50
30 40 50 60 70 80Age
Males Females
Stage III-IV
010
2030
4050
30 40 50 60 70 80Age
Males Females
Recurrent/metastatic
Dyspnoea (DY)
010
2030
4050
30 40 50 60 70 80Age
Males Females
General population
010
2030
4050
30 40 50 60 70 80Age
Males Females
Stage I-II
010
2030
4050
30 40 50 60 70 80Age
Males Females
Stage III-IV
010
2030
4050
30 40 50 60 70 80Age
Males Females
Recurrent/metastatic
411 411

Insomnia (SL)
010
2030
4050
30 40 50 60 70 80Age
Males Females
General population
010
2030
4050
30 40 50 60 70 80Age
Males Females
Stage I-II0
1020
3040
50
30 40 50 60 70 80Age
Males Females
Stage III-IV
010
2030
4050
30 40 50 60 70 80Age
Males Females
Recurrent/metastatic
Appetite loss (AP)
010
2030
4050
30 40 50 60 70 80Age
Males Females
General population
010
2030
4050
30 40 50 60 70 80Age
Males Females
Stage I-II
010
2030
4050
30 40 50 60 70 80Age
Males Females
Stage III-IV
010
2030
4050
30 40 50 60 70 80Age
Males Females
Recurrent/metastatic
412 412
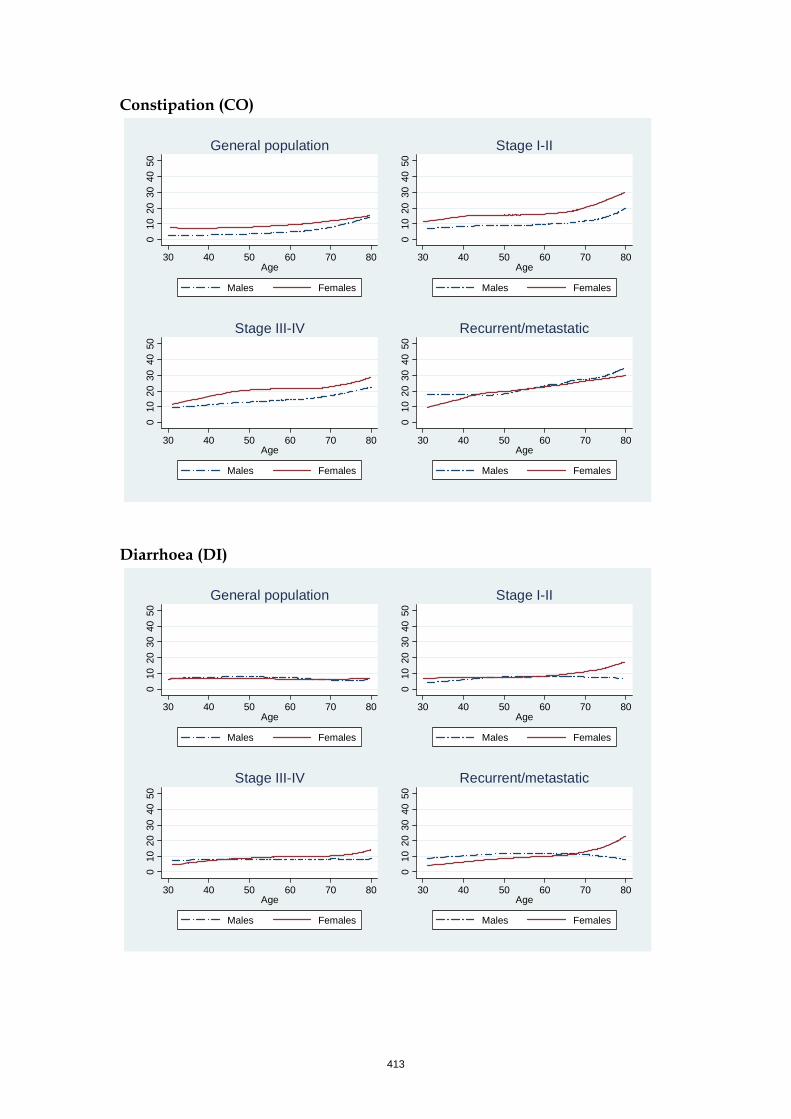
Constipation (CO)
010
2030
4050
30 40 50 60 70 80Age
Males Females
General population
010
2030
4050
30 40 50 60 70 80Age
Males Females
Stage I-II0
1020
3040
50
30 40 50 60 70 80Age
Males Females
Stage III-IV
010
2030
4050
30 40 50 60 70 80Age
Males Females
Recurrent/metastatic
Diarrhoea (DI)
010
2030
4050
30 40 50 60 70 80Age
Males Females
General population
010
2030
4050
30 40 50 60 70 80Age
Males Females
Stage I-II
010
2030
4050
30 40 50 60 70 80Age
Males Females
Stage III-IV
010
2030
4050
30 40 50 60 70 80Age
Males Females
Recurrent/metastatic
413 413
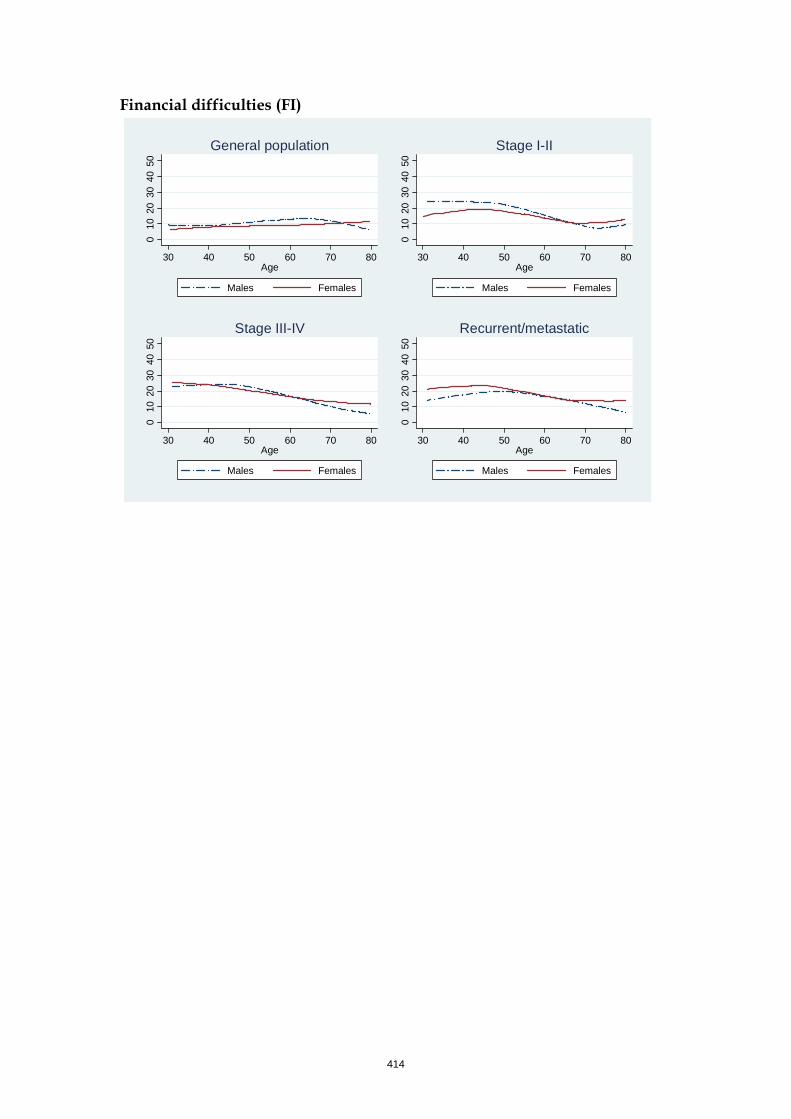
Financial difficulties (FI)
010
2030
4050
30 40 50 60 70 80Age
Males Females
General population
010
2030
4050
30 40 50 60 70 80Age
Males Females
Stage I-II0
1020
3040
50
30 40 50 60 70 80Age
Males Females
Stage III-IV
010
2030
4050
30 40 50 60 70 80Age
Males Females
Recurrent/metastatic
414 414

EORTC QLQ-C30
Correlation Matrices
415 415

Correlations General population
QL PF RF EF CF SF FA NV PA DY SL AP CO DI FI QL 1.00 PF 0.54 1.00 RF 0.59 0.67 1.00 EF 0.54 0.38 0.46 1.00 CF 0.46 0.44 0.49 0.54 1.00 SF 0.57 0.57 0.68 0.54 0.52 1.00 FA -0.59 -0.63 -0.66 -0.60 -0.56 -0.60 1.00 NV -0.28 -0.23 -0.29 -0.32 -0.29 -0.33 0.40 1.00 PA -0.59 -0.60 -0.68 -0.49 -0.45 -0.60 0.66 0.32 1.00 DY -0.40 -0.49 -0.43 -0.31 -0.37 -0.40 0.50 0.24 0.39 1.00 SL -0.44 -0.39 -0.43 -0.49 -0.44 -0.41 0.56 0.27 0.47 0.33 1.00 AP -0.35 -0.30 -0.37 -0.38 -0.36 -0.37 0.48 0.47 0.36 0.30 0.37 1.00 CO -0.21 -0.24 -0.24 -0.22 -0.29 -0.25 0.29 0.22 0.24 0.21 0.22 0.23 1.00 DI -0.21 -0.16 -0.22 -0.23 -0.24 -0.25 0.31 0.34 0.22 0.20 0.21 0.27 0.12 1.00 FI -0.41 -0.45 -0.47 -0.38 -0.38 -0.56 0.42 0.22 0.46 0.31 0.32 0.28 0.20 0.20 1.00
416 416

Correlations Stage I-II QL PF RF EF CF SF FA NV PA DY SL AP CO DI FI QL 1.00 PF 0.51 1.00 RF 0.52 0.63 1.00 EF 0.49 0.33 0.39 1.00 CF 0.42 0.43 0.41 0.49 1.00 SF 0.49 0.45 0.54 0.51 0.46 1.00 FA -0.60 -0.65 -0.66 -0.53 -0.51 -0.54 1.00 NV -0.35 -0.35 -0.40 -0.29 -0.29 -0.31 0.46 1.00 PA -0.50 -0.56 -0.52 -0.40 -0.41 -0.48 0.62 0.37 1.00 DY -0.35 -0.48 -0.40 -0.29 -0.29 -0.31 0.52 0.26 0.31 1.00 SL -0.36 -0.33 -0.34 -0.44 -0.37 -0.33 0.46 0.26 0.38 0.24 1.00 AP -0.40 -0.37 -0.44 -0.36 -0.32 -0.34 0.53 0.50 0.43 0.26 0.34 1.00 CO -0.25 -0.27 -0.22 -0.17 -0.23 -0.18 0.32 0.27 0.32 0.16 0.23 0.28 1.00 DI -0.20 -0.14 -0.21 -0.19 -0.19 -0.22 0.27 0.25 0.22 0.16 0.17 0.21 0.06 1.00 FI -0.30 -0.35 -0.30 -0.31 -0.26 -0.37 0.30 0.20 0.29 0.19 0.19 0.24 0.16 0.11 1.00
417 417
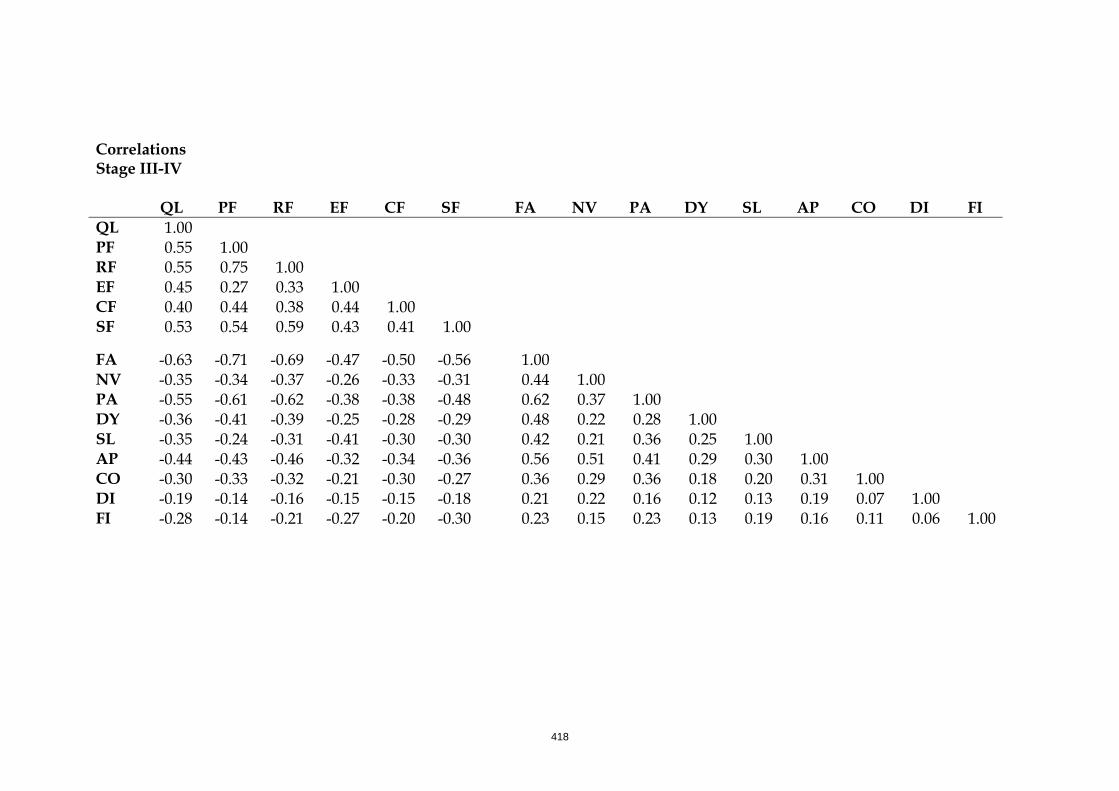
Correlations Stage III-IV
QL PF RF EF CF SF FA NV PA DY SL AP CO DI FI QL 1.00 PF 0.55 1.00 RF 0.55 0.75 1.00 EF 0.45 0.27 0.33 1.00 CF 0.40 0.44 0.38 0.44 1.00 SF 0.53 0.54 0.59 0.43 0.41 1.00 FA -0.63 -0.71 -0.69 -0.47 -0.50 -0.56 1.00 NV -0.35 -0.34 -0.37 -0.26 -0.33 -0.31 0.44 1.00 PA -0.55 -0.61 -0.62 -0.38 -0.38 -0.48 0.62 0.37 1.00 DY -0.36 -0.41 -0.39 -0.25 -0.28 -0.29 0.48 0.22 0.28 1.00 SL -0.35 -0.24 -0.31 -0.41 -0.30 -0.30 0.42 0.21 0.36 0.25 1.00 AP -0.44 -0.43 -0.46 -0.32 -0.34 -0.36 0.56 0.51 0.41 0.29 0.30 1.00 CO -0.30 -0.33 -0.32 -0.21 -0.30 -0.27 0.36 0.29 0.36 0.18 0.20 0.31 1.00 DI -0.19 -0.14 -0.16 -0.15 -0.15 -0.18 0.21 0.22 0.16 0.12 0.13 0.19 0.07 1.00 FI -0.28 -0.14 -0.21 -0.27 -0.20 -0.30 0.23 0.15 0.23 0.13 0.19 0.16 0.11 0.06 1.00
418 418

Correlations Recurrent/metastatic
QL PF RF EF CF SF FA NV PA DY SL AP CO DI FI QL 1.00 PF 0.54 1.00 RF 0.63 0.59 1.00 EF 0.51 0.34 0.40 1.00 CF 0.46 0.42 0.43 0.49 1.00 SF 0.57 0.47 0.63 0.46 0.47 1.00 FA -0.69 -0.65 -0.72 -0.47 -0.50 -0.60 1.00 NV -0.42 -0.33 -0.39 -0.30 -0.33 -0.36 0.49 1.00 PA -0.56 -0.52 -0.56 -0.42 -0.39 -0.50 0.62 0.38 1.00 DY -0.41 -0.39 -0.43 -0.25 -0.28 -0.34 0.48 0.27 0.31 1.00 SL -0.38 -0.30 -0.35 -0.43 -0.34 -0.31 0.42 0.27 0.39 0.23 1.00 AP -0.52 -0.38 -0.49 -0.33 -0.36 -0.43 0.59 0.52 0.43 0.30 0.31 1.00 CO -0.35 -0.29 -0.33 -0.23 -0.27 -0.29 0.39 0.33 0.39 0.22 0.23 0.36 1.00 DI -0.18 -0.11 -0.20 -0.13 -0.17 -0.19 0.22 0.24 0.13 0.16 0.12 0.17 0.01 1.00 FI -0.27 -0.26 -0.23 -0.31 -0.24 -0.32 0.26 0.16 0.26 0.15 0.19 0.14 0.14 0.08 1.00
419 419