Embed Size (px)
Citation preview
EO – 24/06/2008 1
Département Energie
Workshop on Information, Energy and Environment
Princeton University, Supélec, Ecole Centrale Paris and Alcatel-Lucent Bell Labs
Workshop on Information, Energy and Environment
Environmental Applications of Environmental Applications of Atmospheric Pressure Atmospheric Pressure Non-Thermal PlasmasNon-Thermal Plasmas
Emmanuel Odic, Michael J. Kirkpatrick, Ange MfoparaPower & Energy Systems Department, SUPELEC, Gif-sur-Yvette

EO – 24/06/2008 2
Département Energie
Workshop on Information, Energy and Environment
St-Elmo’s fireLightning
Atmospheric phenomena
Introduction
EO – 24/06/2008 3
Département Energie
Workshop on Information, Energy and Environment
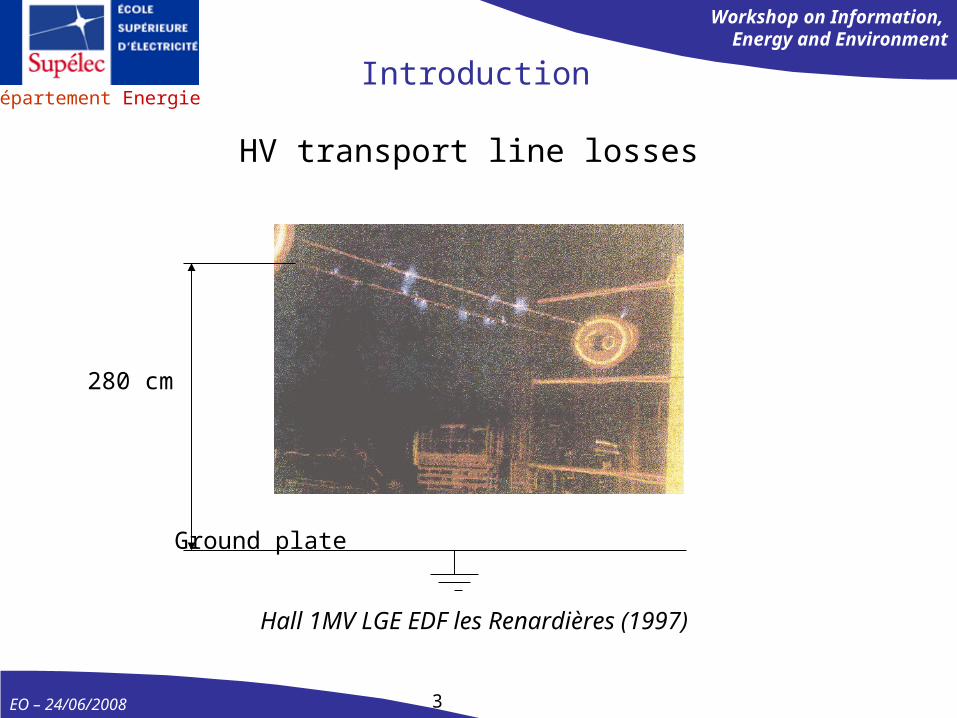
Hall 1MV LGE EDF les Renardières (1997)
280 cm
Ground plate
HV transport line losses
Introduction
EO – 24/06/2008 4
Département Energie
Workshop on Information, Energy and Environment
Introduction
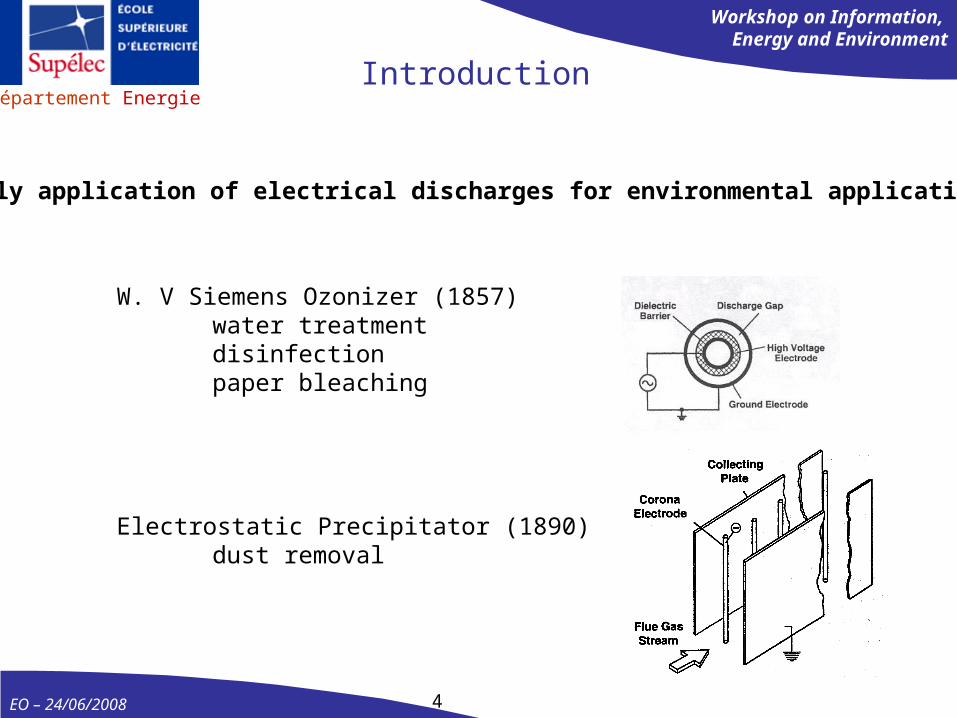
W. V Siemens Ozonizer (1857)water treatmentdisinfection paper bleaching
Electrostatic Precipitator (1890)dust removal
Early application of electrical discharges for environmental applications
EO – 24/06/2008 5
Département Energie
Workshop on Information, Energy and Environment
1. Fundamentals on non-thermal plasmasElectrical dischargePlasma typesSource of active species
2. Flue gas treatmentdilute VOC treatment
Energy cost considerationsSolid by-product treatment
3. Surface treatmentbio-decontamination / sterilization
Outline
Environmental Applications of Atmospheric Pressure Non-Thermal Plasmas

EO – 24/06/2008 6
Département Energie
Workshop on Information, Energy and Environment
E+
+
-
E
E
+
*
+
Ionizationavalanche
Electron attachment
Photo-ionizationSecondary electrons
d EV
Air, atm. press., room temp. ne ~ 106 m-3 N ~ 2.1025 m-3 ~ 1 µm
d = 1 cm V = 32 kVEq
Mean electron energy
Electrons density ne
Eqnj e
1. Electrical discharges : fundamentals
EO – 24/06/2008 7
Département Energie
Workshop on Information, Energy and Environment
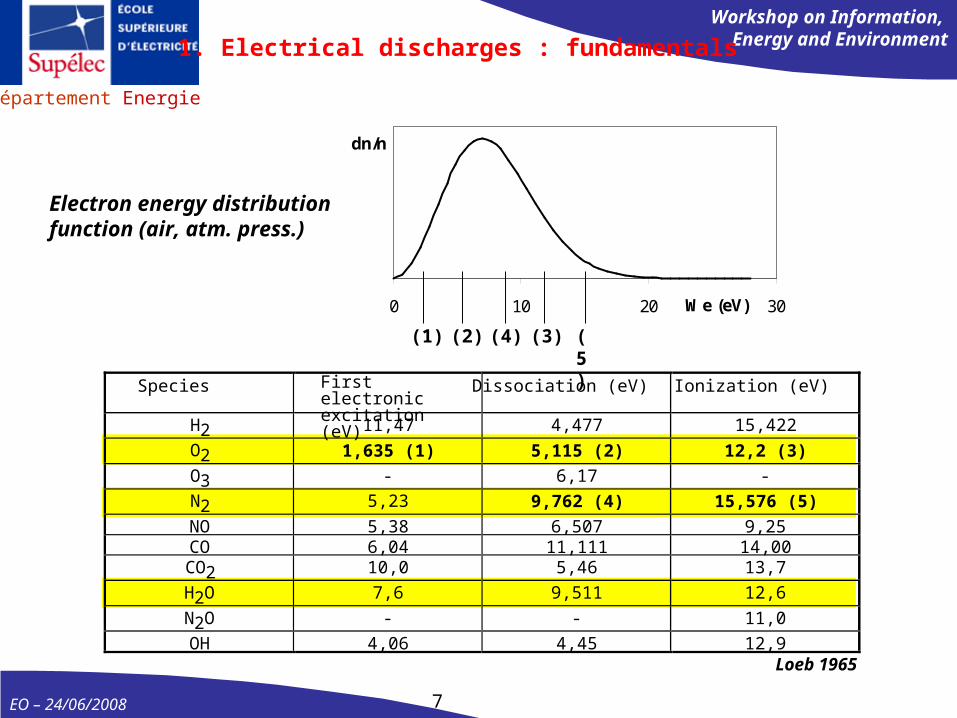
0 10 20 30We (eV)
dn/n
(2)(1) (3) (5)(4)
Electron energy distribution function (air, atm. press.)
Species First electronic excitation (eV)
Dissociation (eV) Ionization (eV)
H2 11,47 4,477 15,422
O2 1,635 (1) 5,115 (2) 12,2 (3)
O3 - 6,17 -
N2 5,23 9,762 (4) 15,576 (5)
NO 5,38 6,507 9,25CO 6,04 11,111 14,00CO2 10,0 5,46 13,7
H2O 7,6 9,511 12,6
N2O - - 11,0
OH 4,06 4,45 12,9Loeb 1965
1. Electrical discharges : fundamentals
EO – 24/06/2008 8
Département Energie
Workshop on Information, Energy and Environment
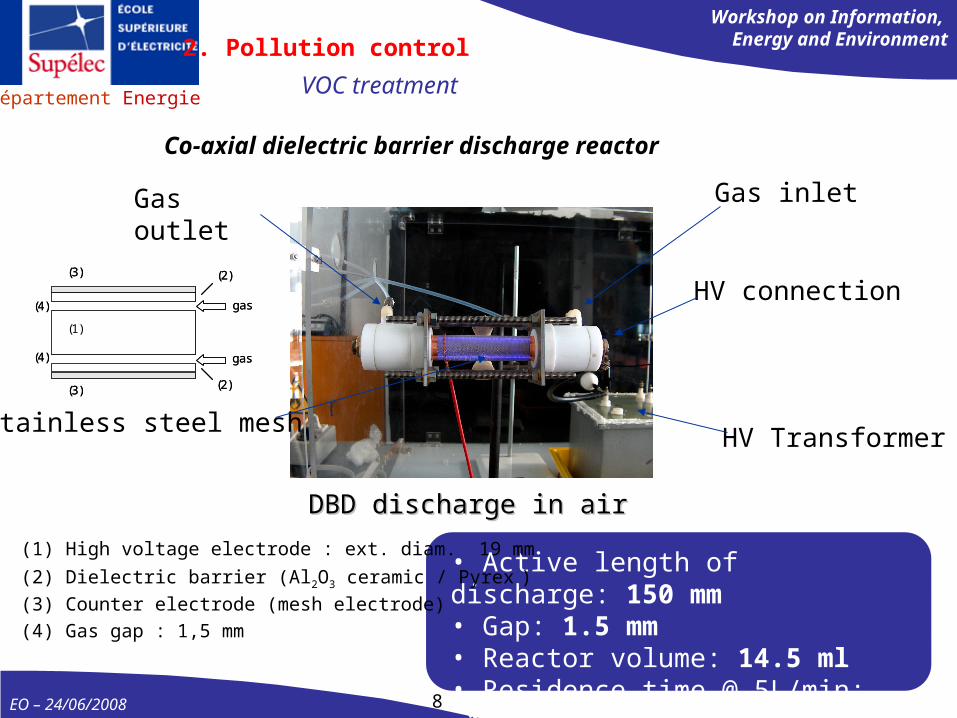
HV Transformer
Gas inletGas outlet
HV connection
Stainless steel mesh
DBD discharge in airDBD discharge in air
• Active length of discharge: 150 mm• Gap: 1.5 mm• Reactor volume: 14.5 ml• Residence time @ 5L/min: ~170 µs
Co-axial dielectric barrier discharge reactor
(1)
(3)
(2)
(2)
(3)
(4)
(4) gas
gas
(1)
(3)
(2)
(2)
(3)
(4)
(4) gas
gas
(1) High voltage electrode : ext. diam. 19 mm
(2) Dielectric barrier (Al2O3 ceramic / Pyrex )
(3) Counter electrode (mesh electrode)
(4) Gas gap : 1,5 mm
2. Pollution control
VOC treatment
EO – 24/06/2008 9
Département Energie
Workshop on Information, Energy and Environment
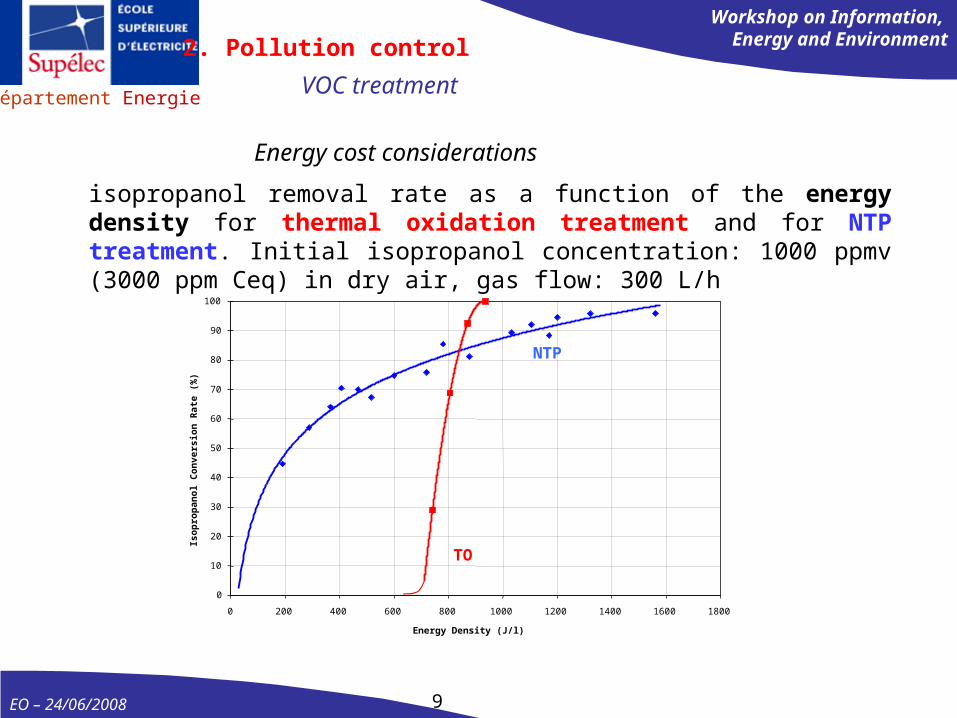
isopropanol removal rate as a function of the energy density for thermal oxidation treatment and for NTP treatment. Initial isopropanol concentration: 1000 ppmv (3000 ppm Ceq) in dry air, gas flow: 300 L/h
Energy cost considerations
0
10
20
30
40
50
60
70
80
90
100
0 200 400 600 800 1000 1200 1400 1600 1800
Energy Density (J/l)
Isop
ropa
nol C
onve
rsio
n R
ate
(%)
TO
NTP
2. Pollution control
VOC treatment

EO – 24/06/2008 10
Département Energie
Workshop on Information, Energy and Environment
Non-thermal plasma : low temperature oxidation
ISOPROPANOL BY-PRODUCTS (ppmv)
CH4 C2H4 C3H6 CH3CHO CH3CO CH3 CH3CHOHCH3 CO CO2
42 30 64 26 182 222 1139 399
- - traces traces 214 146 1298 622
Example 1 : Isopropanol (3000 ppm Ceq)thermal oxidation treatment of 1000 ppmv isopropanol in air at 650°C (tr = 1 s ; R = 78% ; S = 26%)NTP treatment of 1000 ppmv isopropanol in air ( tr ~ 10 ms ; R = 85.5% ; S = 32.5%)
TOLUENE BY-PRODUCTS (ppmv)
CH4 C2H4 C3H6 C4H8 C4H10 HCOOH C6H6 C7H8 C6H5OH C6H5CHO CO CO2
75 139 21 3.6 2.6 139 9 363 28 26 2022 630
- - - - - traces 8 255 traces traces 2894 2223
Example 2 : Toluene (7000-9100 ppm Ceq)thermal oxidation treatment of 1000 ppmv toluene in air at 650°C (tr = 0.5 s ; R = 64% ; S = 24%) NTP treatment of 1300 ppmv toluene in air ( tr ~ 10 ms ; R = 80.5% ; S = 43.5%)
Parissi L., Odic E., Goldman A., Goldman M., Borra J-P.: "Temperature effects on plasma chemical reaction. Application to VOC removal ", contribution for a chapter 11 to "Electrical Discharges for Environmental purposes : background and
applications", E.V. Veldhuizen ed., Nova Science Publisher, New York, 2000, pp. 279-313.
2. Pollution control
VOC treatment
EO – 24/06/2008 11
Département Energie
Workshop on Information, Energy and Environment
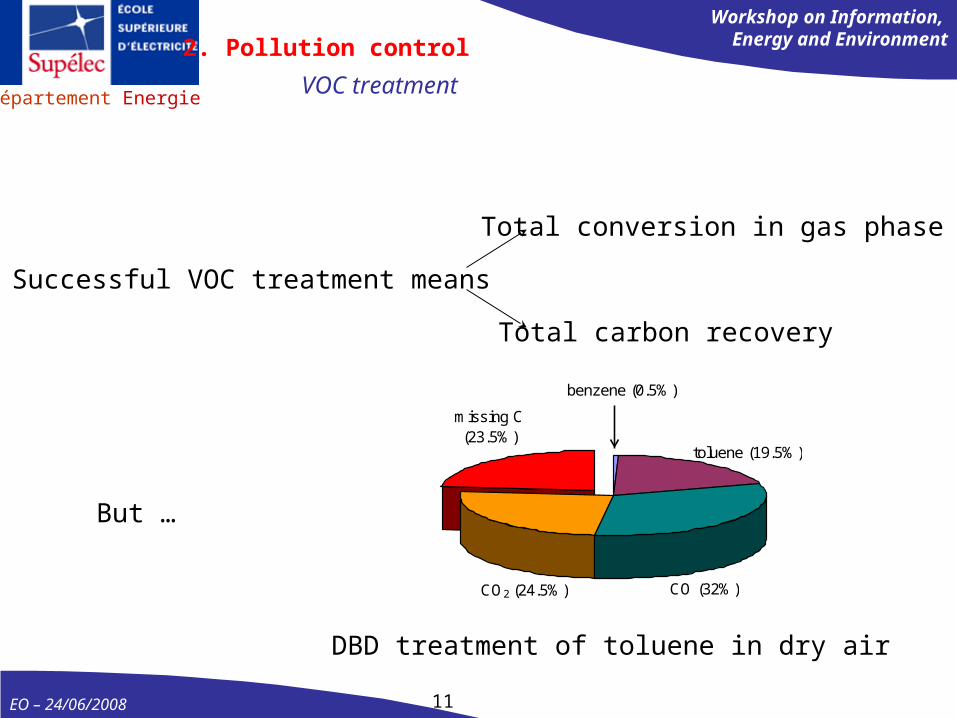
Successful VOC treatment means
Total conversion in gas phase
Total carbon recovery
But …
Background2. Pollution control
VOC treatment
benzene (0.5%)
toluene (19.5%)
CO (32%)CO2 (24.5%)
missing C(23.5%)
DBD treatment of toluene in dry air
EO – 24/06/2008 12
Département Energie
Workshop on Information, Energy and Environment
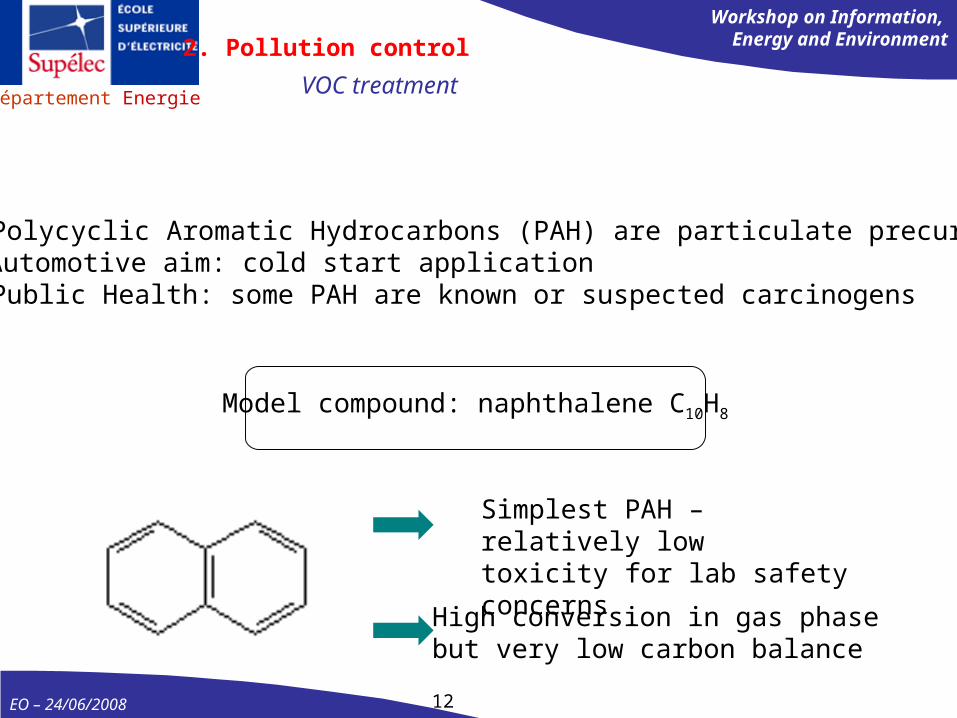
Simplest PAH – relatively lowtoxicity for lab safety concerns
High conversion in gas phasebut very low carbon balance
Model compound: naphthalene C10H8
Polycyclic Aromatic Hydrocarbons (PAH) are particulate precursors Automotive aim: cold start application Public Health: some PAH are known or suspected carcinogens
2. Pollution control
VOC treatment

EO – 24/06/2008 13
Département Energie
Workshop on Information, Energy and Environment
Naphthalene removal
0
10
20
30
40
50
60
0 50 100 150Specific Energy Density [J/L]
Nap
hth
alen
e [p
pm
]
0
50
100
150
200
250
300
CO
, CO
2 [
pp
m]
Naphthalene CO2 CO
0
20
40
60
80
100
120
140
160
180
0 50 100 150 200
Specific Energy Density [J/L]
Nap
hth
alen
e [p
pm
]
0
40
80
120
160
200
240
280
320
360
CO
2, C
O [
pp
m]
Naphthalene CO2 CO
90% conversion @ 100J/L
90% conversion @ 60J/L
[C10H8]in = 50 ppm [C10H8]in = 160 ppm
• Major byproducts: CO and CO2
• CO below the detection limit for lower naphthalene concentration• Minor byproducts: phthalic anhydride and naphthalenedione
2. Pollution control
VOC treatment
A. Mfopara Ph.D. 2006-2008

EO – 24/06/2008 14
Département Energie
Workshop on Information, Energy and Environment
Carbon recovery
0
20
40
60
80
100
0 50 100 150 200Specific Energy Density [J/L]
Co
ut/
Cin
[%
]
160 ppm 50 ppm
100*][*10
][*10][][%
810
8102
in
outoutin HC
HCCOCOCC
• Better carbon balance with less naphthalene• Deposit located at gas inlet
HV electrode after 2h of C10H8 introduction
Gas inlet Gas outlet
2. Pollution control
VOC treatment
A. Mfopara Ph.D. 2006-2008
EO – 24/06/2008 15
Département Energie
Workshop on Information, Energy and Environment
0
10
20
30
40
50
60
0 25 50 75 100 125 150
Time [min]
Nap
hth
alen
e [p
pm
]
0
20
40
60
80
100
120
CO
2, C
O [
pp
m]
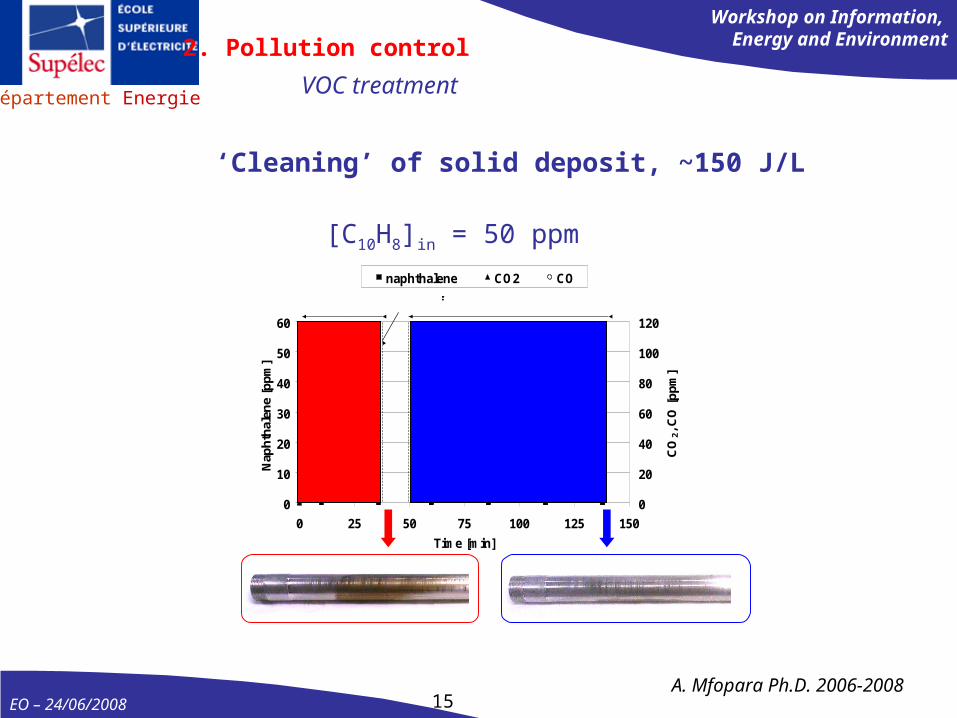
naphthalene CO2 CO
Rea
cto
r o
pen
C10H8 offdischarge on discharge on
‘Cleaning’ of solid deposit, ~150 J/L
[C10H8]in = 50 ppm
2. Pollution control
VOC treatment
A. Mfopara Ph.D. 2006-2008
EO – 24/06/2008 16
Département Energie
Workshop on Information, Energy and Environment
Concluding remarks
• DBD reactor effective for HCs removal from gas phase• Two major byproducts : CO2 and CO• Low carbon balance explained by deposit formation• Possible storage and post-treatment of solid by-products
Industrial applicationsautomotive application (cold start)paint industrystationary emission source (factory, …)
2. Pollution control
VOC treatment

EO – 24/06/2008 17
Département Energie
Workshop on Information, Energy and Environment3. Surface treatment
Bio-decontamination
More and more polymeric parts in surgical / medical tools (e.g. endoscope) Wet heat (reference treatment : 121-134°C - 2.2 bar) treatment not applicable
for sterilization Need of a « low » temperature sterilization process
Potential technology: non-thermal plasma process
Atmospheric pressure non-thermal plasmas for surface sterilization

EO – 24/06/2008 18
Département Energie
Workshop on Information, Energy and Environment
Droplets (dried or not) containing bacteria: 10μL, 104-107 bacteria total
Quantified using a direct plate counting method
Pyrex ®
Gas mixture
HV
Non-thermal plasma source
Treated surface
3. Surface treatment
Bio-decontamination
B. Dodet Ph.D. 2003-2005

EO – 24/06/2008 19
Département Energie
Workshop on Information, Energy and Environment
a. Dried spore samples submitted to a wet air discharge effluentb. Liquid spore samples submitted to a dry air discharge effluentc. Dried spore samples submitted to a dry air discharge effluent
1,E+00
1,E+01
1,E+02
1,E+03
1,E+04
1,E+05
1,E+06
1,E+07
0 2 4 6 8 10Time (minutes)
Surv
ivor
s
(a) Dried spore samples submitted to awet air discharge effluent (90% RH)(b) Liquid spore samples submitted to adry air discharge effluent (RH<15%)
(c) Less than 1 Log population reduction after a 10 minute treatment time
Only wet samples efficiently decontaminated
B. Subtilis
3. Surface treatment
Bio-decontamination
B. Dodet Ph.D. 2003-2005

EO – 24/06/2008 20
Département Energie
Workshop on Information, Energy and Environment
1 – 1.5 µm
Exosporium
Core
Coats
CortexDNA
Protein shell
nucleic acid
model DNA : plasmid PET9SnI (ring double string molecule – 4285 base pairs)
protein
model protein : RNAse A (thermo resistant, 124 AA, 13.7 kDa)
Interaction of the DBD effluents with
Scanning electron micrograph of Bacillus Subtilis spores
3. Surface treatment
Bio-decontamination
EO – 24/06/2008 21
Département Energie
Workshop on Information, Energy and Environment
10 min
C C C CCM
Dry gas
5 min 20 min 5 min2 min
Humid gasDry gas
1 85 76432 9 10 11
Dried sampleLiquid sample
10 min
C C C CCM
Dry gas
5 min 20 min 5 min2 min
Humid gasDry gas
1 85 76432 9 10 11
Dried sampleLiquid sample
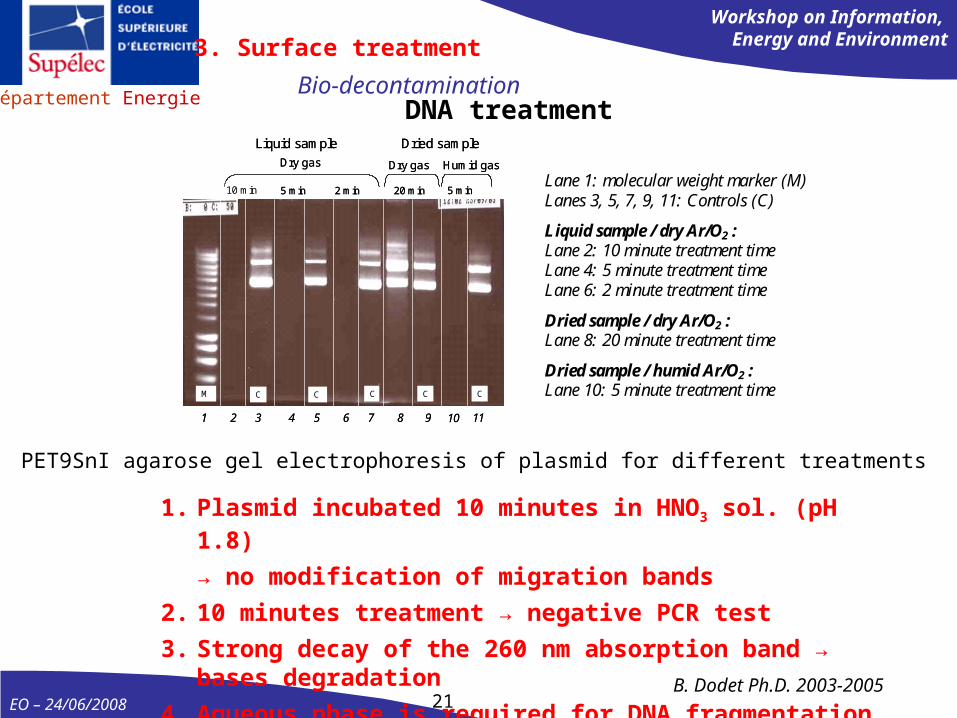
Lane 1: molecular weight marker (M) Lanes 3, 5, 7, 9, 11: Controls (C)
Liquid sample / dry Ar/O2 : Lane 2: 10 minute treatment time Lane 4: 5 minute treatment time Lane 6: 2 minute treatment time
Dried sample / dry Ar/O2 : Lane 8: 20 minute treatment time
Dried sample / humid Ar/O2 : Lane 10: 5 minute treatment time
PET9SnI agarose gel electrophoresis of plasmid for different treatments
DNA treatment
1. Plasmid incubated 10 minutes in HNO3 sol. (pH 1.8)
→ no modification of migration bands
2. 10 minutes treatment → negative PCR test
3. Strong decay of the 260 nm absorption band → bases degradation
4. Aqueous phase is required for DNA fragmentation
3. Surface treatment
Bio-decontamination
B. Dodet Ph.D. 2003-2005
EO – 24/06/2008 22
Département Energie
Workshop on Information, Energy and Environment
C M
N2 / O2 Ar / O2Acid
1 85 76432
C M
N2 / O2 Ar / O2Acid
1 85 76432
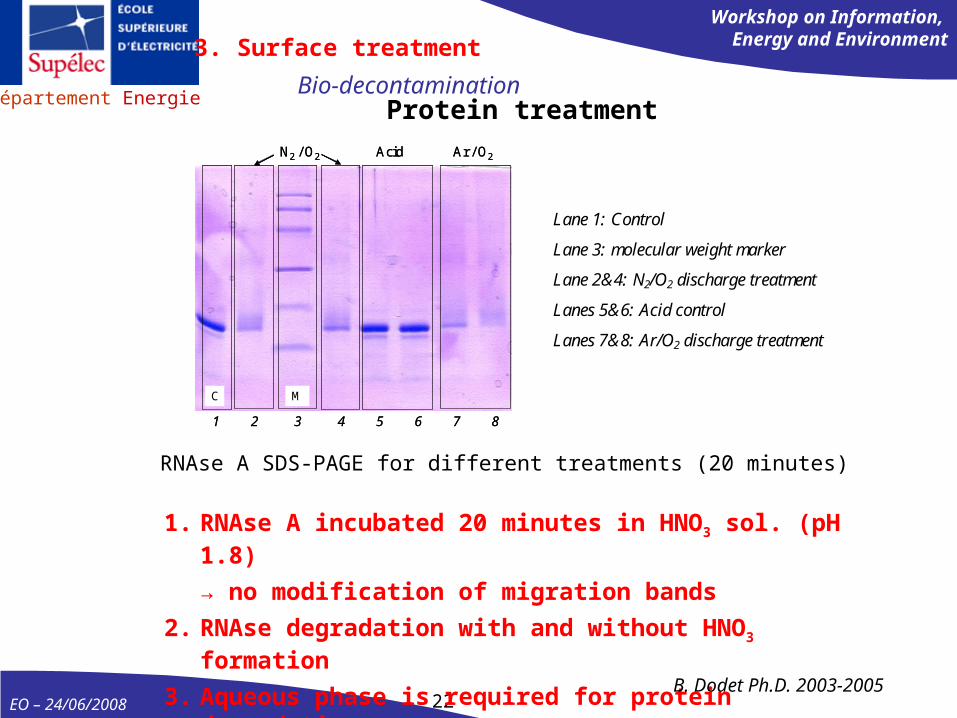
Lane 1: Control
Lane 3: molecular weight marker
Lane 2&4: N2/O2 discharge treatment
Lanes 5&6: Acid control
Lanes 7&8: Ar/O2 discharge treatment
RNAse A SDS-PAGE for different treatments (20 minutes)
Protein treatment
1. RNAse A incubated 20 minutes in HNO3 sol. (pH 1.8)
→ no modification of migration bands
2. RNAse degradation with and without HNO3 formation
3. Aqueous phase is required for protein degradation
3. Surface treatment
Bio-decontamination
B. Dodet Ph.D. 2003-2005

EO – 24/06/2008 23
Département Energie
Workshop on Information, Energy and Environment
CONCLUSION
For the plasma process under investigation i.e. interaction of the biologic material with an atmospheric pressure DBD effluent :
Spore bacteria D = 1 (12 minute sterilization time) for B. SubtilisD = 2.3 (28.6 minute sterilization time) for B. Stearothermophilus
Work in progress : application to biofilmssearch for “soft” operating conditionsapplication to Prion
3. Surface treatment
Bio-decontamination
THANK YOU