Embed Size (px)
Citation preview

Faculty of Natural Resources and
Agricultural Sciences
Enzymatic treatment to increase
resistant starch in oat flour – An investigation for industrial use
Enzymbehandling för att öka resistent stärkelse i havremjöl
– En undersökning för industriell användning
Ida Collinius
Department of Molecular Sciences
Master’s thesis • 30 hec • Second cycle, A2E
Agricultural Programme – Food Science
Molecular Sciences, 2018:1
Uppsala, 2018


Enzymatic treatment to increase resistant starch in oat flour – An
investigation for industrial use
Enzymbehandling för att öka resistent stärkelse i havremjöl – En undersökning av industriell
potential
Ida Collinius
Supervisor: Roger Andersson, Swedish University of Agricultural Sciences,
Department of Molecular Sciences
Assistant Supervisor: Christian Malmberg, Lantmännen
Examiner: Annica Andersson, Swedish University of Agricultural Sciences,
Department of Molecular Sciences
Credits: 30 hec
Level: Second cycle, A2E
Course title: Independent project/degree project in Food Science – Master’s thesis
Course code: EX0425
Programme/education: Agricultural Programme – Food Science
Place of publication: Uppsala
Year of publication: 2018
Title of series: Molecular Sciences
Part number: 2018:1
Online publication: http://stud.epsilon.slu.se
Keywords: resistant starch, pullulanase, amylopectin, amylose, rapid visco analyser


Oat has been established as a useful crop hundreds of years ago all over the world. Oat contains starch which are compound polyhedral granules built out of amylose and amylopectin. Some of the starch can be resistant depending on type of crop, grade of maturation etc. Starch can be modified by heat and moisture treatment or enzy-matic treatments to increase the yield of resistant starch. Resistant starch is defined as starch, or products from starch that is resistant towards digestion and absorption in the small intestine in healthy humans. Instead it can be fermented in the large in-testine. Resistant starch occurs in four types depending on process or origin and these are known to have beneficial health effects. The food production enzyme pullulanase derived from microorganisms such as bacillus species has the function of breaking the 1,6-glyosidic linkage in amylopectin, debranching the molecule into straight chains that gives the starch larger opportunity to be converted to resistant starch. The aim of this study was to increase the yield of resistant starch in an oat flour from the company Lantmännen to be able to use it as a food product with a healthy approach. The method was performed on two different materials; oat starch and oat flour and the time setting was 60 minutes and the amount of material was 3 grams or 4 grams. The enzyme pullulanase was used at 50 µl or 100 µl. A rapid visco analyzer (RVA) was set at different temperature and time settings to figure out a good range to give a high resistant starch yield. The method design was divided into 3 programs, first the gelatinization program at 95°C for 15 minutes, second the enzymatic treatment, add-ing the enzyme pullulanase at 50°C. Finally, the last program was aimed to kill of the enzyme at 95°C. The samples were put in fridge for 12h and then into freezer before freeze-dried and then analyzed with “Megazyme resistant starch assay kit”. The sam-ples were analyzed in a light microscope and the results were calculated in excel. The results showed that the parameters for increasing resistant starch was not as clear as expected. The oat starch samples showed a decisive increase in resistant starch in comparison to oat flour. The results did not show any specific trend for amount of sample or amount of enzyme in the oat flour samples since the resistant starch content was too low to see any trend. In oat starch samples, there was higher yield of resistant starch with more enzyme added. The amount of material used did not show any spe-cific trend. Further research is needed to see if it is possible to increase the resistant starch yield in an industrial process for oat flour.
keywords: oat, starch, amylose, amylopectin, resistant starch, pullulanase, rapid visco analyzer
Abstract

Havre har varit en användbar gröda i flera hundra år i världen över. Havre innehåller stärkelse som består av polyhedralt formade granuler som är uppbyggda av amylo-pektin- och amylosmolekyler. En andel av stärkelsen är resistent, där mängden av resistent stärkelse beror på typ av gröda, mognadsfas osv. Stärkelse kan modifieras så att omvandlingen till resistent stärkelse ökar. Definitionen för resistent stärkelse är den stärkelse, eller den produkt från stärkelse, som är resistent mot digestionssy-stemet i tarmen. Den resistenta stärkelsen kan inte absorberas hos friska individer i tunntarmen utan fermenteras istället i tjocktarmen av mikroorganismer. Resistent stärkelse finns i fyra typer indelade efter framställningsprocess eller ursprung och dessa är kända för att ha hälsofrämjande effekter. Livsmedelsproduktionsenzymet pullulanase, framställt från mikroorganismer så som släktet bacillus, har funktionen att bryta ned 1,6-glykosidbindningar hos amylopektin. Pullulanaset avgrenar amylo-pektin till kortare, raka kedjor som i sin tur har lättare att bilda resistent stärkelse. Syftet med den här studien var att försöka öka halten resistent stärkelse i ett havremjöl från Lantmännen för att kunna använda detta mjöl i en livsmedelsprodukt med större hälsonytta. Metoden utfördes på två olika material; havrestärkelse och havremjöl och mängden var 3 gram eller 4 gram. Enzymet pullulanase tillsattes i 50 µl eller 100 µl. En rapid visco analyzer (RVA) användes och ställdes in på olika program med vari-erande temperatur- och tidsinställningar för att hitta ett optimum som ökar halten resistent stärkelse i havre. Metoddesignen delades in i 3 program, först ett gelatinise-ringsprogram vid 95°C under 15 minuter, sedan ett enzymbehandlingsprogram där enzymet pullulanase adderades och var aktivt under 60 minuter. Slutligen avdödades enzymet genom ett program vid 95°C. Proverna kyldes därefter ned 12 timmar i kyl-skåp för att sedan läggas i frysen innan frystorkning. Proverna analyserades i ljus-mikroskop och halten resistent stärkelse bestämdes med ett ”Megazyme resistant starch assay kit”. Resultatet visade att parametrarna som varierades för att öka halten resistent stärkelse var svårtolkade. Havrestärkelseproverna visade tydligt en högre halt resistent stärkelse än havremjölproverna. Resultaten visade inte någon som helst specifik trend för mängd prov eller mängd tillsatt enzym bland havremjölproverna eftersom halten resistent stärkelse var för låg för att kunna dra någon slutsats. För havrestärkelseproverna fanns en trend som visade att större mängd enzym gav större mängd resistent stärkelse. Mängden material visade ingen trend. Mer forskning be-hövs för att ta reda på om det finns en potential att öka halten resistent stärkelse under en industriellt hållbar process på ett havremjöl.
Nyckelord: havre, stärkelse, amylos, amylopektin, resistent stärkelse, pullulanase, ra-pid visco analyzer
Sammanfattning

This report has been written on request of Lantmännen. The work has been performed at the facilities of SLU. I would like to thank Lantmännen for the experience and opportunity to learn about my subject. Thank you, Christian Malmberg, Food and R&D project manager at Lantmännen who has been my contact person. I am very grateful to professor Roger Andersson, department of molecular sciences at SLU who has been my supervisor and helped to guide me through the project with his great knowledge.
Ida Collinius January 2018 Department of Molecular Sciences, Swedish University of Agricultural Sci-ences
Preface


List of tables
List of figures
Abbreviations
1 Introduction 1
2 Background 3 2.1 Oat 3 2.2 Starch 4
2.2.1 Gelatinization and pasting 6 2.2.2 Retrogradation and gelation 7 2.2.3 Annealing/Heat Moisture Treatment and RVA 7 2.2.4 Starch in food production 8
2.3 Dietary fibers and Resistant starch 9
3 Materials and methods 11 3.1 Material 11 3.2 Enzymatic side effects 11
3.2.1 b-Glucan molecular weight analysis 11 3.3 RVA Oat Starch oat starch standard method 12 3.4 RVA oat flour standard method 14 3.5 Oat resistant starch analysis method 15 3.6 Enzyme treatment to increase RS content 15 3.7 Microscopy 17 3.8 Dietary fiber analysis 17 3.9 Statistical analysis 17
4 Results and Discussion 18 4.1 Enzymatic side activities 18 4.2 RVA viscosity 18 4.3 RS determination for the standard method 22 4.4 Method design for increased RS content 23 4.5 Microscope analysis 25 4.6 Dietary fiber analysis 28
Table of contents

5 Final Discussion 30
6 Conclusion 32
References 33
Appendix 1: RVA treatment figures 35
Appendix 2: Pullulanase enzymes 41
Appendix 3: Oat flour composition 43
Appendix 4: Megazyme resistant starch assay procedure 44
Appendix 5: Popular scientific summary 49

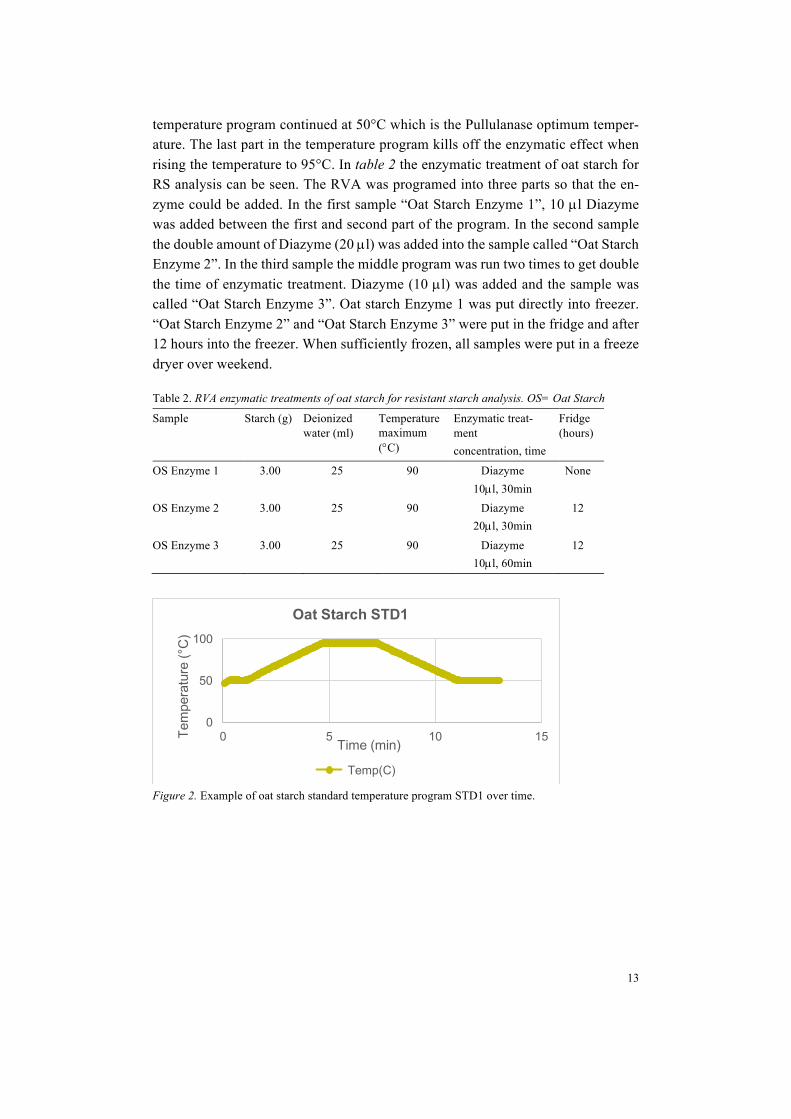
Table 1. RVA standard treatments of oat starch for RS analysis. OS=Oat Starch, STD=Standard program 12
Table 2. RVA enzymatic treatments of oat starch for resistant starch analysis. OS= Oat Starch 13
Table 3. RVA standard treatments of oat flour for RS analysis. OF= Oat Flour, STD=Standard program 14
Table 4. RVA enzymatic treatments of oat flour for RS analysis. OF= Oat Flour 15 Table 5. RVA enzymatic treatments of oat starch for increase in RS. OS=Oat Starch
16 Table 6. RVA enzymatic treatments of oat flour for increase in RS. OF=Oat Flour 16 Table 7. Average mean value of b-glucan content (%) calculated from HPSEC
results on barley flour sample treated with enzymes 18 Table 8. Treatment of oat starch standard samples and oat flour standard samples.
OS: oat starch, OF: oat flour, STD1: standard treatment at different temperatures 19
Table 9. Treatment of oat starch samples, showing viscosity decrease during enzymatic treatment at different conditions. OS: oat starch, n.d: not detected 20
Table 10. Treatment of oat flour samples, showing viscosity decrease during enzymatic treatment at different conditions. OF: oat flour 20
Table 11. Average value of RS (%) calculated from absorbance gained from spectrophotometric measurement on oat starch samples and oat flour samples without enzymatic treatment. OS: oat starch, OF: oat flour 22
Table 12. Average value of RS (%) calculated from absorbance gained from spectrophotometric measurement on oat starch samples and oat flour samples with enzymatic treatment. OS:oat starch, OF:oat flour 23
Table 13. Average value of RS (%) calculated from Absorbance gained from spectrophotometric measurement on oat starch samples and oat flour samples with enzymatic treatment. OS:oat starch, OF:oat flour 23
Table 14. Results from dietary fibre analysis in oat flour (OF) and oat starch (OS) sample treated with enzymatic treatment 6 (sugar residues as % of DM). Rha:D-rhamnose, fuc:D-fucose, ara:L-arabinose, xyl:D-xylose, gal:D-galactose, glc:D-glucose, n.d:not detected 28
List of tables


Figure 1. An overview of amylose and amylopectin ordered into starch granules, modified from: (Buléon et al., 1998). 5
Figure 2. Example of oat starch standard temperature program STD1 over time. 13 Figure 3. Example of temperature program enzymatic treatment over time. 14 Figure 4. Example of temperature program for enzymatic treatment over time. 17 Figure 5. Temperature program at 95°C for 30 minutes, part 1 showing viscosity
before adding enzyme in oat flour. The number 2565 is the final viscosity before adding enzyme. 20
Figure 6. Temperature program at 95°C for 15 minutes, part 1 showing viscosity before adding enzyme in oat flour. The number 2713 is the final viscosity before adding enzyme. 21
Figure 7. Temperature program at 95°C for 12 minutes, part 1 showing viscosity before adding enzyme in oat flour. The number 3274 is the final viscosity before adding enzyme. 21
Figure 8. Temperature program at 95°C for 3 minutes, part 1 showing viscosity before adding enzyme in oat flour. The number 3533 is the final viscosity before adding enzyme. 21
Figure 9. Analysis of variance in RS% content gained from RS analysis, showing p-value and significance level of the samples. 24
Figure 10. microscopy pictures of gelatinized oat starch. 26 Figure 11. microscopy pictures of gelatinized oat flour. 26 Figure 12. Enzymatic treatment 6 on oat starch samples showing sample directly
taken from the RVA of starch granules colored with iodine. 27 Figure 13. Enzymatic treatment 6 on oat flour samples showing sample directly
taken from the RVA of starch granules colored with iodine. 28
List of figures


ANN: Annealing
HMT: High moisture treatment NSP: Non-starch polysaccharides RS: Resistant starch RVA: Rapid visco analyzer SCFA: Short chained fatty acids
Abbreviations


1
Starch is a macromolecule that exists in a variety of cereal grains. The focus in this study is on oat, which has unique properties such as high fat and high protein content (Delcour & Hoseney, 2010). Oat is already used in products that are proven to have health beneficial effects where b-glucan is important for the healthiness (Kulp, 2000).
Resistant starch (RS) is a dietary fiber that is defined as the starch and/or prod-ucts from starch that cannot get digested and absorbed in the small intestine. On the other hand, RS can be fermented in the large intestine by microorganisms creating several health beneficial short chain fatty acids (SCFA) (Eliasson & Gudmundsson, 2006). Examples of these SCFA are butyric acid, propionic acid and acetic acid, which are proved, due to several medical studies and in vitro studies, to lower the blood pressure and also to lower the bad cholesterol in the blood (Topping & Clifton, 2001). The RS, which is not absorbed is also responsible for a positive bulk effect in the intestines, in the same manner as several other dietary fibers such as non-starch polysaccharides (NSP) (Topping & Clifton, 2001).
There are four types of RS that have different origin. Treatments with heat and moisture together with storage where gelatinization and retrogradation can occur can increase the RS content. Also, enzymatic treatments are proved to have RS in-creasing effects (Milašinović et al., 2010). Lantmännen has an interest in using flour residues for foods instead of for bioethanol industry. The aim is to increase the healthiness in a flour through increasing the yield of RS and therefore gain interest for the consumers and for use as ingredients in commercial food products.
The problem description is to investigate if there are possibilities to treat the product of interest, which is an oat flour residue from Lantmännen, so that its value may be enhanced through improving the RS yield. The aim of this study was to create a method using a Rapid Visco Analyzer (RVA) to be able to increase the yield of RS. The RVA can give controlled temperature programs and shear rates during controlled time periods and is suitable to translate to an industrial process.
1 Introduction

2
Questions: Is it possible to increase RS value in oat starch and oat flours through heat and cooling cycles? Which parameters are of interest when increasing RS in an oat starch/oat flour? Is it possible to increase RS and not decreasing other substances of interest in the oat flour?

3
2.1 Oat In the early seventh century oat was established in western Europe as a cereal grain, and A.D. 1000-1500 oat became an important crop in northern Europe due to a new agricultural system with crop rotation and utilization of horses. Oat probably evolved and got established simultaneously in other regions over the world. Chinese historical records show the farming of oats in A.D. 1000. In the United states oats were first planted in 1602 and grew in importance over time (Kulp, 2000).
The breakthrough for oats rise with the development of milling in the 1850’s, which reduced cooking time and increased the demand as a food for humans. This was therefore a starting point for the industrial development of milling oat products (Kulp, 2000).
The oat plant is a grass plant with leaf consisting of blade, sheath and ligule. The mature internode stems have hollow centers and the nodes are solid. The inflo-rescence is a panicle composed of rachis, rachis branches and spikelets, where each rachis branch is terminated in a pedicellate spikelet. The spikelets have two empty glumes and 1-3 fertile florets. A floret contains rachilla segments, lemma, palea and sexual organs, later on the mature caryopsis (Kulp, 2000).
The harvest of oat is similar to barley and rice, whereas the caryopsis enclosed in a floral envelope is harvested. The caryopsis, also called “groat” is similar to a kernel in other grains except it is covered with several hair-like structures called trichomes. The oat hull constitutes 25 % of the oat kernel total weight and the groat consist of seed coat, pericarp, nucellar epidermis, germ and endosperm (Delcour & Hoseney, 2010). Starch is the major component of groat and can approximately be 60 % of the dry weight (Zhu, 2017). Groat has higher fat and protein content than other cereal grains (MacArthur & D'appolonia, 1979), this promote oat to short shelf life due to oxidation of fatty acids (Delcour & Hoseney, 2010).
2 Background

4
b-Glucan is a non-starch polysaccharide in oats which is viscous when dissolved in water, and is found in the subaleurone layer of oats. b-Glucan is linear, large, and consists of 1,4- and1,3-linked b-D-glucopyranosyl units. b-Glucan has beneficial health effects which makes it interesting for human consumption (Kulp, 2000; Beer et al., 1996). The health effects are lowering serum blood cholesterol and moderat-ing the glucose metabolism for diabetics (Kulp, 2000).
2.2 Starch Starch molecules are polymers of glucose in an complex semi-crystalline structure, and occur in cereal grains (Smith, 2001). The glucose units of starch can be from 50 units up to several thousand (Hii et al., 2012). The photosynthesis of crops creates sucrose which is synthesized into starch in the cytosol. The sucrose is then trans-ported to the endosperm where it is stored as starch. The synthesis is occurring in the amyloplast organelle where the sucrose is converted to glucose 6-phosphate. Glucose 1-phosphate is developed and the enzyme ADPglucose pyrophosphorylase convert it to ADPglucose. ADPglucose is key substrate for starch synthases, which are enzymes that synthesize starch (Smith, 2001).
Starch is the second most abundant heterogeneous polysaccharide after cellulose and has the shape of water insoluble granule (Hii et al., 2012). The granules are organized and have a great variety in size and shape. A granule consist of tightly packed chains of amylose and amylopectin that respectively consists of monomers of glucose (Hii et al., 2012; Zavareze & Dias, 2011), where each starch molecule has a reducing end, a hemiacetal group (Delcour & Hoseney, 2010). The structure in which the amylose and amylopectin are ordered, regular or irregular, affects the shape and size of the granule, which depend on the plant origin of the starch. A cereal granule can vary within range 1 to 100 µm (Zavareze & Dias, 2011). In figure 1 there is an overview of the structure and composition of starch granules.

5
Figure 1. An overview of amylose and amylopectin ordered into starch granules, modified from: (Buléon et al., 1998).
The amylose is mainly composed of 1,4-linked a-D-glucose (a-D-glucopyra-nosyl) units in a linear shape. Only small branches on amylose make the behaviour of the molecule dominantly linear (Hii et al., 2012; Zavareze & Dias, 2011). The molecular weight differs depending on the maturation of the grain and also depend-ing on species. For common starches it is estimated that amylose constitutes 18-33 % of the starch (Delcour & Hoseney, 2010).
Amylopectin is a branched molecule composed of short straight chains and longer sidechains of 1,4-linked a-D-glucose units. Some of these chains carries 1,6 linkages that create branching points (Hii et al., 2012; Zavareze & Dias, 2011). There are 3 types of amylopectin chains (A-, B- and C-chains). The A-chains has only 1,4-linkages, B-chains have 1,4-linked chains attached by 1,6-linked branches, and C chains have a reducing end (Delcour & Hoseney, 2010).
The oat starch has compound granules, similar to rice, with several granules in an amyloplast in contrast to other cereal grain that have one granule in each amylo-plast. The oat granules are small (3-10 µm) with a polygonal, irregular shape (Zavareze & Dias, 2011; Hoover & Vasanthan, 1992). Gelatinization temperature range at 53-59°C (Zavareze & Dias, 2011). According to a study on oat starch pastes, the pastes and gels of oat are more translucent and less susceptible to retro-gradation compared to maize and wheat (Doublier et al., 1987). Also, amylose and amylopectin were determined to be co-leached from the oat starch granules in some trials under the influence of internally bound starch lipids (Hoover & Vasanthan, 1992; Doublier et al., 1987).

6
There are mainly four types of enzymes acting on starch; (i) endoamylases, (ii) exoamylases, (iii) debranching enzymes and (iv) transferases (Hii et al., 2012). In general the amylases are acting on amylose and the debranching enzymes acting on amylopectin (Delcour & Hoseney, 2010). (i) Endoamylases, mainly found in micro-organisms, are endo-acting enzymes that cleave 1,4-glucosidic bonds in the inner parts of amylose or amylopectin chains. This randomized hydrolysis gives products of a mixture of oligosaccharides called a-limit dextrin. (ii) Exoamylases such as a-glucosidases and b-amylases are cleaving external glucose residues of amylase and amylopectin. a-Glucosidases cleave 1,4- and 1,6-bonds and produce only glucose (Hii et al., 2012). b-Amylase attacks the non-reducing ends of the amylose in starch and create maltose units when breaking every second 1,4-bond. The b-amylase can-not pass an 1,6 branching point therefore it gives b-limit dextrin as product (Delcour & Hoseney, 2010). (iii) Debranching enzymes of starch hydrolyze the 1,6-gluco-sidic bonds in amylopectin and are divided into two major groups; indirect- and direct debranching enzymes. The indirect debranching enzymes such as amylo-1,6-glucosidase, can only release a single 1,6-linked glucose residue and thus need a modified starch substrate to be able to act. The direct debranching enzymes such as pullulanase and isoamylase can directly hydrolyse amylopectin (Hii et al., 2012). Pullulanase is an enzyme of importance that is utilized to hydrolyze pullulan, oligo-saccharides and amylopectin (Hii et al., 2012). Amylopectin is hydrolyzed at the 1,6-bonds which results in products of free A- and B-chains with reducing ends making oligosaccharides as end products (Delcour & Hoseney, 2010). (iv) Trans-ferases cleave 1,4-glucosidic linkage of a donor molecule and transfer this to a glu-cosidic acceptor molecule which forms a new bond (Hii et al., 2012).
2.2.1 Gelatinization and pasting
The glass transition temperature, Tg, is when a substance changes from a glassy state into a rubbery state. This can be caused by several parameters, moisture, tem-perature and/or additives. Additives such as sugar binds water and lead to less water accessible for the granules. Granules reaches Tg before gelatinization, at which point the amorphous region of the granules changes and the crystallinity start to fade (Delcour & Hoseney, 2010).
Gelatinization state occur in an interval after the glass transition temperature is reached, when starch is exposed to water so that the granules swell due to uptake of water in the amorphous regions and the intercrystalline regions disrupting the crys-tallinity of the granule (Delcour & Hoseney, 2010). This swelling give increased molecular interaction and leads to leaking of amylose from the granules. When this occur, there is a loss in birefringence, T0, in the granules which is followed by ad-ditional water uptake until the crystalline structure in all granules are lost, Tc. When

7
Tc is reached the gelatinization is finished. Pasting occurs during continued heating but after gelatinization, when the birefringence is lost and excess water give addi-tional increase in viscosity and the starch continues to get solubilized. Not until 120°C all starch can be solubilized (Delcour & Hoseney, 2010).
2.2.2 Retrogradation and gelation
Retrogradation is when starch develops from an amorphous state to a more crystal-line state. This will change the starch rheological properties into an increased firm-ness (Eliasson & Gudmundsson, 2006). More specific, retrogradation is when amy-lopectin forms a crystalline state after gelatinization. The concentration of starch, the shear rate and the temperature determine the grade of retrogradation. The crys-talline state of amylopectin has a melting point at 50-60°C (Delcour & Hoseney, 2010).
Gelation of amylose is after gelatinization when the sample is cooled down. Am-ylose that is solubilized is forming helixes with another free amylose creating a con-tinuous network. When the amylose has become crystalline after some hours, the amylose has a melting point at 150°C (Delcour & Hoseney, 2010).
The water content and storage temperature are important for the rate of retrogra-dation. Starch cannot retrograde without a certain amount of water. Lipids and sur-factants are substances that can interfere with the retrogradation process (Eliasson & Gudmundsson, 2006).
2.2.3 Annealing/Heat Moisture Treatment and RVA
Annealing (ANN) and Heat moisture treatment (HMT) are methods that physically modify starch granules without gelatinizing or damaging the granules. This is done through controlled heat and moisture that is determined regarding the shape, size and birefringence of the starch granules (Stute, 1992). The amount of water needed for gelatinization to occur to starch depends on the temperature. Annealing is a pro-cess that increases the crystallinity of starch through treatment with high water con-ditions and low temperature (Delcour & Hoseney, 2010; Lehmann & Robin, 2007; Eliasson & Gudmundsson, 2006). The temperature is too low for gelatinization to occur. The annealing temperature TA must be below the onset of gelation T0 to coun-teract crystallites to melt at glass transition temperature Tg (Eliasson & Gudmundsson, 2006). Annealing will move gelatinization temperature to a higher and more narrow range (Eliasson & Gudmundsson, 2006; Krueger et al., 1987).
HMT is done to change properties of starch. HMT is when the water content is lower than the content that is required for gelatinization to occur and the temperature is high (Delcour & Hoseney, 2010; Lehmann & Robin, 2007; Eliasson &

8
Gudmundsson, 2006). This semidry condition moves the onset of gelatinization (T0) and the completion of gelatinization (Tc) to higher temperatures after treatment and also swelling power and solubility change (Eliasson & Gudmundsson, 2006).
Starch is a non-newtonian system meaning that it can exhibit both fluid charac-teristics and gel characteristics depending on shear rate and temperature. This can be measured with a RVA (Zhou et al., 1998). The RVA measures the relative vis-cosity of starch in water when exposed to shear, controlled heating/cooling and holding periods at constant temperature (Delcour & Hoseney, 2010). The benefits of RVA are that it has a small sample size which can be set at several temperature profiles and shear rates. Also that it measures peak viscosity, peak area, time-to-peak, drop off and final viscosity (Zhou et al., 1998). Autoclaving (140-145°C) is another heat treatment that is approved as a suitable process for increasing RS yield (Dundar & Gocmen, 2013; Sievert & Pomeranz, 1989).
2.2.4 Starch in food production
The starch content in a product may be problematic since starch is a non-stabile system over time. Starch is very sensitive to exposure of heat, moisture, cooling and shearing. After gelatinization have occurred, the crystalline structure of the amylo-pectin is destroyed, though the starch will recrystallize over time during the retro-gradation phase (Zavareze & Dias, 2011). Crystalline amylose is a good source of thermally RS (type 3), which is useful for food applications (Haralampu, 2000).
Other factors affecting the stability of starch in food products are other compo-nents in the product, such as lipids and protein. These substances create physical modification and may form complexes with the starch and change the properties, such as a great decrease in stickiness. Since starch is a sensitive substance, chemi-cally modifications can be needed in the food production systems where for example low pH, high shearing rates and temperature changes are common. Adding polar lipids such as mono-glycerides and/or proteins are possibilities to make starch less affected (Zavareze & Dias, 2011).
RS is small in particle size, has a low water holding capacity and has a mild flavor. RS has therefore potential to be incorporated into different foods and bever-ages (Jyothsna & Hymavathi, 2017; Sharma et al., 2008). The high amylose starches are the most commonly used for the production of RS (Lehmann & Robin, 2007). Some studies have shown that RS has improved textural properties in foods. The problem with the research on RS is that many studies are different in method, dosage and/or sources (Sharma et al., 2008).

9
2.3 Dietary fibers and Resistant starch Dietary fiber (DF) is a material that is indigestible in the small intestine, therefore includes parts of foods that are not degraded in the stomach nor by the enzymes in the colon (Mudgil & Barak, 2013; Fuentes-Zaragoza et al., 2010). DF can be clas-sified according to their fermentability, solubility, source and physiological effect. DF includes non-starch polysaccharides, oligosaccharides, lignin and other plant substances. Resistant starch is included by some researchers as a DF since it is not digested in the small intestine (Mudgil & Barak, 2013; Sharma et al., 2008). Others think that the health claims for DF is insufficient and that RS should be separated from DF and divided as a functional ingredient using specific health or function claims. This is to be able to properly inform consumers with labelling (Englyst et al., 2007). Some of the health benefits gained from RS is likewise traditional DF, while some benefits are unique to RS (Haralampu, 2000).
The definition of RS is the starch, or the product from starch, that is not digested in the small intestine of healthy individuals and is instead fermented in the large intestine (Brumovsky et al., 2009; Sharma et al., 2008; Cummings & Englyst, 1991). RS was described in 1982 as starch that after gelatinization was not hydro-lyzed by incubation with a-amylase and pullulanase (Cummings & Englyst, 1991). RS can be divided into subgroups after characteristics. RS type 1 (RS1) is starch that is physically inaccessible for the enzymes in the column, for example due to thick cell wall or protein matrices. RS1 is the type less resistant towards digestion in comparison to following types. RS type 2 (RS2) are starches that are protected from digestion through crystalline structure. RS type 3 (RS3) are starches that are retrograded, for example through have been cooked and then cooled down (Eliasson & Gudmundsson, 2006; Thompson, 2000). RS3 has the greatest potential for food industry among the RS types since it is thermostable through many food processing conditions (Milašinović et al., 2010). RS type 4 (RS4) are chemically modified starches, for example by esterification or crosslinking (Eliasson & Gudmundsson, 2006; Thompson, 2000). Debranching of starch has been shown to produce linear chains that contribute to a higher RS yield. This has shown to be effective in a vari-ety of starches (Milašinović et al., 2010).
According to a study of RS content in Chinese diets, oat flour contains 1.82±0.63g RS/100g DM and oat meal flakes contain 4.76±0.50 RS g/100g DM (Chen et al., 2010). RS has health promoting effects in the human body (Jyothsna & Hymavathi, 2017; Topping & Clifton, 2001). Colonic bacteria ferment RS and non-starch polysaccharides (NSP) into short chained fatty acids (SCFA) such as bu-tyrate, propionate and acetate. These SCFA are proven to stimulate the blood flow in the colon, gives energy to the cells in the intestine and also stimulate the electro-lyte uptake. Butyrate is the SCFA that is favoured by RS. RS may enhance stool

10
bulking, though not as effectively as NSP (Topping & Clifton, 2001). An important factor is that the increase in SCFA production in the intestine is significantly inter-individually varied in response (Lockyer & Nugent, 2017). One study on lipid oxi-dation as a result of RS consumption showed that a replacement of 5.4 % of the total dietary carbohydrate intake with RS could decrease fat accumulation in long term. This is due to that the study showed that a replacement significantly increased post-prandial lipid oxidation (Higgins et al., 2004). Studies in mice also show that RS is positive for the gut health, producing SCFA and reduced abdominal fat and in hu-man subjects the feeding with RS increased insulin sensitivity (Keenan et al., 2015).
RS directly affects the large intestine in humans through decreasing pH value making hurdles for pathogenic microorganism growth. This also gives an increasing possibility for mineral absorption and other nutritional absorption. RS have also, through application tests showed to enhance flavor, crispiness, colour and mouthfeel in food products in comparison to products with traditional insoluble fibres (Milašinović et al., 2010).
An in vitro study mimicking physiological conditions for starch digestion shows that different food processing techniques produce different amounts of RS. The study showed that the amount of RS decreased with increased chewing (Muir & O'dea, 1992). According to Eliasson & Gudmundsson, 2006 RS can be produced from starch during storage after going through gelatinization and retrogradation. To be able to increase RS further, the existing starch content can be enzymatically treated, hydrolyzing amylopectin into smaller molecules which through gelation and storage can create thermostable RS (Milašinović et al., 2010).
According to one study where the thermostability of pullulanase derived from bacillus subtilis was tested, it was shown that the pullulanase is active up to temper-ature at approximately 60°C and has an optimum at 50°C (Silano et al., 2017). An-other study on maize starch showed that the RS yield after debranching with pullu-lanase at 50°C and retrogradation was 10.2 to 25.5 %. It took 5 hours for 70 % of the maize starch to be hydrolyzed (Milašinović et al., 2010). The storage time and temperature are important since resistant starch is developed in different range var-ying these factors (Niba, 2003).

11
3 Materials and methods
3.1 Material Barley from Swedish University of Agricultural Science (SLU) was used. A pullu-lanase “Diazyme P10” from the company Danisco produced by the microorganism Bacillus subtilis (appendix 2) was also used as well as another pullulanase from the company Novozyme produced by the microorganism Bacillus lichenformis (appen-dix 2). The oat starch used in this study had approximately 90 % pure oat starch and derived from Kristianstad (no specification). The oat flour used was from Lantmän-nen with 72 % pure starch content (appendix 3). The analyzing was done using a Megazyme Resistant Starch Assay Procedure KIT (Megazyme, Bray Buisness Park, Bray, Co. Wicklow, A98 YV29, Ireland) (AOAC Method 2002.02, AACC Method 32-40.01, Codex Type II Method) (appendix 4). Also a spectrophotometer was used for analyzation.
3.2 Enzymatic side effects
3.2.1 b-Glucan molecular weight analysis
High Performance Size Exclusion Chromatography (HPSEC) is used to estimate the b-glucan content and molecular size distribution of b-glucan. Solutions needed for the determination was calciumchlorid-dihydrat and NaNO3 with 0.02 % NaN3 and calcofluor.
NaNO3 (0.1 M) with 0.02 % NaN3, as well as 25 mg/l calcofluor in 0.1 M Tris-buffer, pH 8 was prepared. The calcofluor solution was put in a dark bottle and the solutions were inserted in the flow for the HPSEC. The analysis was performed essentially according to Rimsten et al. (2003) but with some modifications as de-scribed below.
Extraction with thermostable a-amylase was done in triplicates for each type of enzyme. Pullulanase from Novozymes and Diazyme P10 from Danisco were used for enzymatic treatment and control samples were also prepared. Barley flour (100 mg ± 5mg) was weighed and 7.5 ml aqueous ethanol (50 %) was added and incu-bated in a boiling water bath for 15 minutes. Another 5 ml 50 % ethanol was added and the samples were centrifuged (1000g 10 minutes). The supernatant was dis-carded carefully and additional 10 ml 50 % ethanol was added. The samples were mixed and centrifuged (1000g 10 min). The supernatant was discarded and the tubes were turned upside-down for 5 minutes. Distilled water (20 ml) with 0.30 mg/ml

12
CaCl2 was added to the samples and also 50 µl a-amylase. The tubes were put di-rectly in boiling water bath for 1.5 hour and the tubes were mixed 3 times during the time. The extract was cooled down to 50 degrees and 50 µl pullulanase was added. The tubes were incubated in room temperature for two hours then the tubes were put in boiling water bath for 30 minutes. The tubes were cooled down and centrifuged (1500 g, 15 min). The supernatants were filtrated (45 µm) into HPSEC vials and were run in the HPSEC overnight. The molecular weight and b-glucan content in the samples were calculated in MatLab.
This method was done to investigate if pullulanase had any enzymatic side ef-fects such as b-glucanase that would degrade b-glucan. This would not be desirable due to the health effects of b-glucan.
3.3 RVA Oat Starch oat starch standard method Different programs were set on the RVA to get a standard program (STD1) at dif-ferent temperatures which can be seen in figure 2. The RVA was divided into three programs (i) gelatinization program, (ii) enzymatic treatment and (iii) kill off en-zyme. The RVA treatments of oat starch for RS analysis can be seen in Table 1. Samples were run at a maximum temperature of respectively 95°C, 90°C, 88°C and 85°C. Oat starch (3.00 g) and 25 ml deionized water was used in each run. The samples were put in the fridge and after cooling down into the freezer. Additional one sample at 90°C was prepared the following day and was put into the freezer directly.
Table 1. RVA standard treatments of oat starch for RS analysis. OS=Oat Starch, STD=Standard pro-gram
Sample Starch (g) Deionized water (ml)
Temperature maximum (°C)
Enzymatic treatment
Fridge (hours)
OS STD95 3.00 25 95 None 12 OS STD90A OS STD90B
3.00 3.00
25 25
90 90
None None
12 None
OS STD88 3.00 25 88 None 12
OS STD85 3.00 25 85 None 12
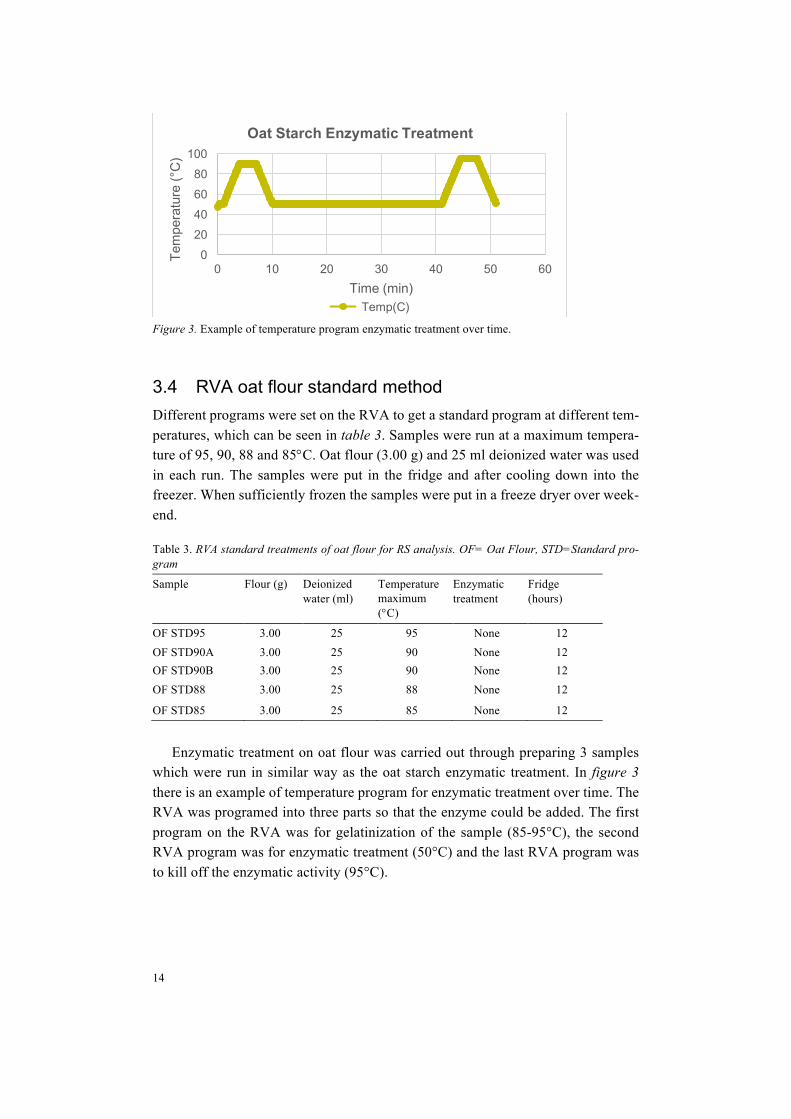
Enzymatic treatment was carried out through preparing 3 samples which were
run at maximum temperature 90°C before the enzyme was added. In figure 3 there is an example of temperature program with enzymatic treatment over time. This temperature maximum at 90°C was estimated from the standard RVA results, esti-mated from pasting curve and the look of the sample, concerning viscosity. The
13
temperature program continued at 50°C which is the Pullulanase optimum temper-ature. The last part in the temperature program kills off the enzymatic effect when rising the temperature to 95°C. In table 2 the enzymatic treatment of oat starch for RS analysis can be seen. The RVA was programed into three parts so that the en-zyme could be added. In the first sample “Oat Starch Enzyme 1”, 10 µl Diazyme was added between the first and second part of the program. In the second sample the double amount of Diazyme (20 µl) was added into the sample called “Oat Starch Enzyme 2”. In the third sample the middle program was run two times to get double the time of enzymatic treatment. Diazyme (10 µl) was added and the sample was called “Oat Starch Enzyme 3”. Oat starch Enzyme 1 was put directly into freezer. “Oat Starch Enzyme 2” and “Oat Starch Enzyme 3” were put in the fridge and after 12 hours into the freezer. When sufficiently frozen, all samples were put in a freeze dryer over weekend.
Table 2. RVA enzymatic treatments of oat starch for resistant starch analysis. OS= Oat Starch
Sample Starch (g) Deionized water (ml)
Temperature maximum (°C)
Enzymatic treat-ment concentration, time
Fridge (hours)
OS Enzyme 1 3.00 25 90 Diazyme 10µl, 30min
None
OS Enzyme 2 3.00 25 90 Diazyme 20µl, 30min
12
OS Enzyme 3 3.00 25 90 Diazyme 10µl, 60min
12
Figure 2. Example of oat starch standard temperature program STD1 over time.
0
50
100
0 5 10 15Tem
pera
ture
(°C
)
Time (min)
Oat Starch STD1
Temp(C)
14
Figure 3. Example of temperature program enzymatic treatment over time.
3.4 RVA oat flour standard method Different programs were set on the RVA to get a standard program at different tem-peratures, which can be seen in table 3. Samples were run at a maximum tempera-ture of 95, 90, 88 and 85°C. Oat flour (3.00 g) and 25 ml deionized water was used in each run. The samples were put in the fridge and after cooling down into the freezer. When sufficiently frozen the samples were put in a freeze dryer over week-end.
Table 3. RVA standard treatments of oat flour for RS analysis. OF= Oat Flour, STD=Standard pro-gram
Sample Flour (g) Deionized water (ml)
Temperature maximum (°C)
Enzymatic treatment
Fridge (hours)
OF STD95 3.00 25 95 None 12 OF STD90A OF STD90B
3.00 3.00
25 25
90 90
None None
12 12
OF STD88 3.00 25 88 None 12
OF STD85 3.00 25 85 None 12
Enzymatic treatment on oat flour was carried out through preparing 3 samples
which were run in similar way as the oat starch enzymatic treatment. In figure 3 there is an example of temperature program for enzymatic treatment over time. The RVA was programed into three parts so that the enzyme could be added. The first program on the RVA was for gelatinization of the sample (85-95°C), the second RVA program was for enzymatic treatment (50°C) and the last RVA program was to kill off the enzymatic activity (95°C).
020406080
100
0 10 20 30 40 50 60
Tem
pera
ture
(°C
)
Time (min)
Oat Starch Enzymatic Treatment
Temp(C)

15
In table 4 the enzymatic treatment of oat flour can be seen. In the first sample “Oat flour Enzyme 1”, 20 µl Diazyme was added between the first and second part of the program. In the second sample 10 µl Diazyme was added into the sample called “Oat flour Enzyme 2” and the treatment was run for 60 minutes. In the third sample, 4 grams of oat flour together with 10 µl Diazyme was added for 30 minutes and the sample was called “Oat flour Enzyme 3”. The samples were put in the fridge and after 12 hours into the freezer. When sufficiently frozen, all samples were put in a freeze dryer over weekend.
Table 4. RVA enzymatic treatments of oat flour for RS analysis. OF= Oat Flour
Sample Flour (g) Deionized water (ml)
Temperature maximum (°C)
Enzymatic treat-ment concentration, time
Fridge (hours)
OF Enzyme 1 3.00 25 90 Diazyme 20µl, 30min
12
OF Enzyme 2 3.00 25 90 Diazyme 10µl, 60min
12
OF Enzyme 3 4.00 25 90 Diazyme 10µl, 30min
12
3.5 Oat resistant starch analysis method The samples were removed from the freeze-dryer and were carefully mashed into a powder with a spoon before weighed into analysis. The Megazyme Resistant Starch Assay Procedure (Megazyme, Bray Buisness Park, Bray, Co. Wicklow, A98 YV29, Ireland) was followed (AOAC Method 2002.02, AACC Method 32-40.01, Codex Type II Method). The spectrophotometer was set at 510 nm and the results were calculated in excel.
3.6 Enzyme treatment to increase RS content RVA was run with 4.00 grams oat flour at 95°C during different time experiments to be able to see a complete gelatinization on the RVA viscosity curve, to use before enzymatic treatment. The time set 15 minutes was chosen as a suitable time period due to that it showed complete gelatinization and a decrease in viscosity that was steep in comparison to shorter time settings. The decision of time set was made regarding the percentage reduction in viscosity which showed that the longer time sets didn’t show that much difference. It was also appreciated from the look of the viscosity curve, where the 15 minutes treatment looked completely gelatinized.

16
The results from the RVA standard treatments and the RVA enzymatic treat-ments were used to produce a new method focusing on parameters of interest to increase the level of RS in the samples. The RVA treatments applied on oat starch and oat flour for RS analysis can be seen in table 5-6, showing the RVA temperature maximum before enzymatic treatment, concentration of enzyme, amount of sample and fridge storage time.
Table 5. RVA enzymatic treatments of oat starch for increase in RS. OS=Oat Starch
Sample Starch (g) Deionized water (ml)
Temperature maximum (°C)
Enzymatic treatment concentration, time
Fridge (hours)
OS Enzyme 4 3.00 25 95 Diazyme 50µl, 60min
12
OS Enzyme 5 4.00 25 95 Diazyme 50µl, 60min
12
OS Enzyme 6 3.00 25 95 Diazyme 100µl, 60min
12
OS Enzyme 7 4.00 25 95 Diazyme 100µl, 60min
12
Table 6. RVA enzymatic treatments of oat flour for increase in RS. OF=Oat Flour
Sample Flour (g) Deionized water (ml)
Temperature maximum (°C)
Enzymatic treatment concentration, time
Fridge (hours)
OF Enzyme 4 3.00 25 95 Diazyme 50µl, 60min
12
OF Enzyme 5 4.00 25 95 Diazyme 50µl, 60min
12
OF Enzyme 6 3.00 25 95 Diazyme 100µl, 60min
12
OF Enzyme 7 4.00 25 95 Diazyme 100µl, 60min
12
The programs set on the RVA were changed with a prolonged heating period to make the viscosity to be lower when the enzyme is added. To conclude what time set that was suitable tests were made at 3, 12, 15 and 30 minutes. The tests were run at oat flour since it was proven earlier that oat flour gelatinized slower than the oat starch. When running tests the RVA viscosity diagrams showed a decrease in vis-cosity when the gelatinization heating period was longer. The temperature program for enzyme treatment can be seen in figure 4.

17
Figure 4. Example of temperature program for enzymatic treatment over time.
3.7 Microscopy Microscopy was done on the samples “oat starch enzyme 6” and “oat flour enzyme 6” (see table 5 and table 6). The samples were analysed after a complete treatment and also before enzymatic treatment, after gelatinization program. Samples were suspended in diluted iodine solution and studied by light microscopy at 20X and 40X magnification. Scale bars were printed into the microscopy pictures.
3.8 Dietary fiber analysis A dietary fiber determination test was done to measure RS type 3 in the sample to compare to the total RS analyzed by an AOAC method according to Theander et al. 1995.
3.9 Statistical analysis The statistical analysis was performed using Minitab. A factorial design was made to see the effect on RS comparing the interaction between material, sample amount and enzyme concentration. An analysis of variance was made to see the relation between the parameters at 95 % significance level.
020406080
100120
0 20 40 60 80 100
Tem
pera
ture
(!C)
Time (min)
Temperature Program Enzymatic Treatment
Temp(C)

18
4.1 Enzymatic side activities The results from the b-glucan analysis showed that the pullulanase from Novozyme have definitive enzymatic side activities breaking down b-glucan. The pullulanase Diazyme P10 from Danisco showed increased concentration in extractable b-glucan compared to the control. This can be seen in table 7, which show the average mean value of b-glucan (%), calculated from HPSEC results on barley flour treated with the different enzymes.
Table 7. Average mean value of b-glucan content (%) calculated from HPSEC results on barley flour sample treated with enzymes
Sample b-glucan %
Blank Diazyme
3,39 3,91
Novozyme 0,20
The increased concentration in b-glucan may be due to that the enzyme had a small side effect increasing the extractability. Diazyme P10 had a limited effect on the b-glucan molecular weight, while the enzyme preparation from Novozyme de-graded the majority of b-glucan to fragments smaller than 10000Da.
4.2 RVA viscosity The results from the RVA run without enzymatic treatment showed that the oat starch had in general a higher viscosity than oat flour. The results also showed that higher temperatures on the standard treatments (STD1) showed higher final viscos-ity in comparison to lower temperatures. The high final viscosity may be due to that the granules are gelatinized at a greater extent at the higher temperatures, though the
4 Results and Discussion

19
short period of time treated at this temperature may have left some granules unaf-fected. The maximum temperature and the final viscosity in the oat starch and oat flour standard treatments can be seen in table 8.
Table 8. Treatment of oat starch standard samples and oat flour standard samples. OS: oat starch, OF: oat flour, STD1: standard treatment at different temperatures
Sample Maximum temp (°C) Final viscosity (cP)
OS STD1 95 95 3303
OS STD1 90 90 1721 OS STD1 88 88 950
OS STD1 85 85 319 OF STD1 95 95 2704 OF STD1 90 90 1736
OF STD1 88 88 782 OF STD1 85 85 80
Enzymatic treatments 1-3 were run at 90°C estimated from the gelatinization
temperature interval and look of the standard samples. The results showed that the enzymatic treated samples had lower RS content than standard samples and there-fore a new maximum temperature at 95°C was set for following enzymatic treated samples. The hypothesis was at start that the granules shouldn’t be heated too much and be swelled but not ruptured to give the enzyme highest affinity. Without evi-dence, it was supposed that the enzyme has higher affinity to the long chains rather than the short crystalline chains. This would lead to that, when the temperature rise, the short chains take more place and gets more active and gets prioritized by the enzyme. Therefore, the temperature shouldn’t be too high so that the longer chains will be prioritized by the enzyme. In the second hypothesis, the temperature wasn’t high enough for the first hypothesis to work. The granules did need to rupture com-pletely and the enzyme should be added after the viscosity decreased. In table 9 and table 10 the enzymatic treatments and the effect on viscosity can be seen on oat starch and oat flour. The viscosity decreased in all samples which indicate that the enzyme was active. The tables also suggest that more enzyme, higher temperature and longer treatment time give larger decrease in viscosity. Though, if all of these parameters take part in the decrease in viscosity is hard to tell. The amount of sample doesn’t suggest any effect on the viscosity. The oat starch samples suggest more stable trends that oat flour.
Figures of the RVA treatment in the method design can be seen below in figures 5-8, which shows viscosity before adding enzyme after 95°C gelatinization treat-ment at different time sets. This test was done to conclude the parameters before the method design was set.

20
Table 9. Treatment of oat starch samples, showing viscosity decrease during enzymatic treatment at different conditions. OS: oat starch, n.d: not detected
Sample Amount sample (g)
Maximum temp (°C)
Enzyme treat-ment time (min)
Diazyme (µl) Viscosity de-crease (cP) dur-ing enzymatic treatment
OS Enzyme 1 3 90 30 10 n.d. OS Enzyme 2 3 90 30 20 459-235
OS Enzyme 3 3 90 60 10 1339-213 OS Enzyme 4 3 95 60 50 1124-51
OS Enzyme 5 4 95 60 50 1454-221
OS Enzyme 6 3 95 60 100 1817-56
OS Enzyme 7 4 95 60 100 4544-195
Table 10. Treatment of oat flour samples, showing viscosity decrease during enzymatic treatment at different conditions. OF: oat flour
Sample Amount sample (g)
Maximum temp (°C)
Enzyme treat-ment time (min)
Diazyme (µl) Viscosity de-crease (cP) dur-ing enzymatic treatment
OF Enzyme 1 3 90 30 20 1390-120 OF Enzyme 2 OF Enzyme 3
3 4
90 90
60 30
10 10
1599-117 3281-767
OF Enzyme 4 3 95 60 50 1594-4
OF Enzyme 5 4 95 60 50 1509-36 OF Enzyme 6 3 95 60 100 1579-18
OF Enzyme 7 4 95 60 100 1223-52
Figure 5. Temperature program at 95°C for 30 minutes, part 1 showing viscosity before adding enzyme in oat flour. The number 2565 is the final viscosity before adding enzyme.
2565
0
50
100
150
0
2000
4000
6000
0 20 40 Tem
pera
ture
(°C
)
Visc
osity
(cP)
Time (min)
95°C30 min
Visc(cP) Temp(C)

21
Figure 6. Temperature program at 95°C for 15 minutes, part 1 showing viscosity before adding enzyme in oat flour. The number 2713 is the final viscosity before adding enzyme.
Figure 7. Temperature program at 95°C for 12 minutes, part 1 showing viscosity before adding enzyme in oat flour. The number 3274 is the final viscosity before adding enzyme.
Figure 8. Temperature program at 95°C for 3 minutes, part 1 showing viscosity before adding enzyme in oat flour. The number 3533 is the final viscosity before adding enzyme.
2713
0
50
100
150
0
2000
4000
6000
0 20 40
Tem
pera
ture
(°C
)
Visc
osity
(cP)
Time (min)
95°C15 min
Visc(cP) Temp©
3274
0
50
100
150
0
2000
4000
6000
0 10 20 Tem
pera
ture
(°C
)
Visc
osity
(cP)
Time (min)
95°C12 min
Visc(cP) Temp(C)
3533
0
50
100
150
0
2000
4000
6000
0 5 10 15 Tem
pera
ture
(°C
)
Visc
osity
(cP)
Time (min)
95°C 3 min
Visc(cP) Temp(C)

22
When analyzing the figures 5-8 it is clear that the treatment of 30 minutes gave a lower viscosity (2565 cP) in comparison to 15, 12 and 3 minutes (2713, 3274 and 3533 cP respectively). Though, the percentage reduction in relation to time was re-garded and therefore the decision was taken that 15 minutes treatment was more suitable for further experiments.
4.3 RS determination for the standard method The results from RS determination on oat starch samples showed an increase in concentration with increased temperature. The oat starch had a higher concentration of RS than oat flour. In table 11, the average value of RS calculated from absorbance gained from spectrophotometric measurements on samples without enzymatic treat-ment can be seen.
Table 11. Average value of RS (%) calculated from absorbance gained from spectrophotometric meas-urement on oat starch samples and oat flour samples without enzymatic treatment. OS: oat starch, OF: oat flour
Sample RS%
OS STD1 95°C 2,86
OS STD1 90°C (A) OS STD1 90°C (B)
1,57 1,52
OS STD1 88°C 0,92
OS STD1 85°C 0,31 OF STD1 95°C 0,18
OF STD1 90°C 0,11 OF STD1 88°C 0,14 OF STD1 85°C 0,13
For oat starch, it increased from 0.31% at 85°C to 2.86% at 95°C, and for oat flour from 0.13% at 85°C to 0.18% at 95°C.
In table 12 the average value of RS calculated from absorbance gained from spectrophotometric measurement on samples with enzymatic treatment can be seen. According to these results it is indicating that OS Enzyme 2 with higher enzyme concentration and OS Enzyme 3 with longer time treatment give higher RS values. Also, OF Enzyme 1 with higher enzyme concentration and OF Enzyme 2 with the longest time treatment gave the highest results. Though, the difference is too small between samples to draw any conclusions. The RS contents are very low which proposes that something in the treatment didn’t work.

23
Table 12. Average value of RS (%) calculated from absorbance gained from spectrophotometric meas-urement on oat starch samples and oat flour samples with enzymatic treatment. OS:oat starch, OF:oat flour
Sample RS%
OS Enzyme 1 a OS Enzyme 1 b
1,47 1,42
OS Enzyme 2 a OS Enzyme 2 b
1,71 1,65
OS Enzyme 3 1,99 OF Enzyme 1 0,28
OF Enzyme 2 0,24 OF Enzyme 3 0,23
4.4 Method design for increased RS content A method design was estimated from earlier results. The gelatinization was com-pleted to a greater extent at high temperature and longer time of treatment. Since the enzymatic affinity was poor after gelatinization at 90°C, it is suggested that the en-zyme will have higher affinity if the sample is fully gelatinized at 95°C. Also, a longer gelatinization treatment gave lower viscosity when the enzyme was added which was expected to be good for the enzymatic affinity.
In table 13 you can see the average value of RS calculated from absorbance gained from spectrophotometric measurement on oat flour and oat starch samples with enzymatic treatment is shown.
Table 13. Average value of RS (%) calculated from Absorbance gained from spectrophotometric meas-urement on oat starch samples and oat flour samples with enzymatic treatment. OS:oat starch, OF:oat flour
Sample RS%
OS Enzyme 4 OS Enzyme 5
4,42 4,02
OS Enzyme 6 4,62 OS Enzyme 7 5,77
OF Enzyme 4 0,31 OF Enzyme 5 0,44
OF Enzyme 6 0,20 OF Enzyme 7 0,51
As can be seen the results from the method design was more successful for the oat starch samples than in oat flour samples. The oat flour sample results are indicating that the treatment did not work. The oat flour samples have less starch and more

24
fatty acids and protein than the oat starch samples, which may have interfered with the results when analyzing the RS content. One theory is that the treatment did work, though not the analysis since the amylose might be encapsulated between other sub-stances such as proteins and fatty acids. Therefore, it would be hard for the amylose to form complexes with another free amylose, forming helixes, which can be meas-ured as RS. The literature supports the formation of RS in this way, that free amylose creates helixes, which are thermostable (Eerlingen & Delcour, 1995).
After determining statistical analyses significant results could be seen only for different materials used (oat starch and oat flour). The p-values for enzyme level and sample amount showed that there was no evidence that these factors affect the formation of RS (figure 9). Analysis of Variance
Source DF AdjSS AdjMS F-Value P-Value
Model 6 76.6219 12.7703 58.82 0.000
Linear 3 75.1719 25.0573 115.41 0.000
Material 1 73.8318 73.8318 340.05 0.000
Enzyme 1 1.0877 1.0877 5.01 0.052
Amount 1 0.2524 0.2524 1.16 0.309
2-WayInteractions 3 1.4500 0.4833 2.23 0.155
Material*Enzyme 1 0.7961 0.7961 3.67 0.088
Material*Amount 1 0.0626 0.0626 0.29 0.604
Enzyme*Amount 1 0.5912 0.5912 2.72 0.133
Error 9 1.9541 0.2171
Lack-of-Fit 1 0.6116 0.6116 3.64 0.093
PureError 8 1.3424 0.1678
Total 15 78.5760
Figure 9. Analysis of variance in RS% content gained from RS analysis, showing p-value and signif-icance level of the samples.
The results from the statistical analysis showed insignificant results for most param-eters. The p-values were high and insignificant at a 95 % significance level. None of the relationships between parameters has an effect when relying on the statistics. Though, when the experimental was done, there was a trend showing that high en-zyme concentration at complete gelatinized sample did show an increasing RS con-tent in comparison to the other tests. As can be seen the p-value for enzyme is almost

25
significant. Also, the interaction between material*enzyme is quite close to the sig-nificance level, though it is not significant enough to draw a conclusion. The exper-imental was done at a limited time span, so the analysis and experiments was only done in duplicates. The p-value should be lowered if the analysis was done in more replicates and the relation between enzyme and material could in that case be sig-nificant.
Concerning material, it is clear that the experiment did work on oat starch, though not on oat flour. The reason for this is not clear and can only be hypotheti-cally discussed. The literature show that oat flour has high amounts of components such as proteins, fats and minerals (Delcour & Hoseney, 2010). These components may have interfered with the enzyme or hurdled the retrogradation process in some way. It may be that these substances are preventing amylose to create helices with another free amylose.
The reason for the in general low RS in oat starch, which doesn’t have that many components other than pure starch, may be that the method is not suitable for this type of starch. The literature show that oat has small granular starch granules which also may take part in the difficulty of transforming regular starch into RS.
The time of treatment is another factor that is important for the development of RS, according to studies (Milašinović et al., 2010). The time of the enzymatic treat-ment and/or the time in storage may be insufficient for the RS to develop during the current method.
The Megazyme Resistant Starch Assay Kit is not a precise analysis method which is more statistical reliable for high RS contents rather than low RS. The low values of RS in the oat flour were not therefore the ultimate sample for analyzing with this method. Even though the work was thorough there are always sources of error in the method. In the analysis of RS in the control samples it differed between every run which indicates that the analysis method isn’t that precise. Another source of variability between RS determinations could be inhomogeneties in the freezedried samples.
4.5 Microscope analysis The pictures gained from the microscope analysis were difficult to comprehend. The oat starch show much less structure than many other starch types do after similar treatment (Paes et al., 2008). This is indicating that the granules are broken and the starch is evenly suspended in the mixture. The oat flour samples show some parti-cles that are difficult to identify but there are no obvious swollen granules visible. There is a clear difference in color between the oat flour samples and oat starch

26
samples. In figure 10 there are gelatinized oat starch samples. In figure 11 there are gelatinized oat flour samples.
Figure 10. microscopy pictures of gelatinized oat starch.
Figure 11. microscopy pictures of gelatinized oat flour.
Not much can be seen in the gelatinized oat starch and oat flour samples in figure 10 and figure 11, although, there are more particles visible in the oat flour samples than in oat starch samples as expected. Otherwise, both samples look broken down, which indicate gelatinized starch granules. The color differs between oat starch and oat flour where oat starch is redder and oat flour more purple. It is hard to know the reason for this though it may be due to more leaked amylose in the oat starch sam-ples. Since the color is not clearly separated in either of the samples this may be due to that the amylose and amylopectin have co-leached from the granules due to in-ternally bound lipids. In figure 12 there are pictures of oat starch samples treated with enzymatic treatment 6. In figure 13 there are pictures of oat flour samples treated with enzymatic treatment 6 (see method in table 5 and table 6).

27
Figure 12. Enzymatic treatment 6 on oat starch samples showing sample directly taken from the RVA of starch granules colored with iodine.
In the enzymatic treated samples in figure 12 and figure 13 it is difficult to actually understand what you see. It is a clear difference in color where the oat starch samples are red in contrast to dark purple oat flour samples. Also, other particles such as fiber and/or protein can be seen in the oat flour samples. There is no clear explana-tion for the results in the enzymatic treated samples more than that the microscopy could have been performed with more phase separation. It is also strange that the samples didn’t get more homogenized during the longer treatment in comparison to the non-enzymatic treated samples.

28
Figure 13. Enzymatic treatment 6 on oat flour samples showing sample directly taken from the RVA of starch granules colored with iodine.
It appears that even though a lot of iodine was added to the samples, it seems to be hard for the samples to absorb it. This may be due to the great viscosity of the sam-ples. Considerably deeper investigation for these mysterious pictures and the behav-ior of RS formation is needed.
4.6 Dietary fiber analysis The results from the DF analysis showed that the RS3 (seen as glucose) in the oat starch sample is 0.4 % as can be seen in table 14. It shows the oat flour and oat starch samples treated with enzymatic treatment 6 (see method table 5 and table 6).
Table 14. Results from dietary fibre analysis in oat flour (OF) and oat starch (OS) sample treated with enzymatic treatment 6 (sugar residues as % of DM). Rha:D-rhamnose, fuc:D-fucose, ara:L-arabinose, xyl:D-xylose, gal:D-galactose, glc:D-glucose, n.d:not detected
Rha fuc ara xyl man gal glc
OF Enz 6 n.d. n.d.
n.d. n.d.
0.36 0.36
0.39 0.41
0.31 0.31
0.20 0.20
1.45 1.44
OS Enz 6 n.d. n.d.
n.d. n.d.
n.d. n.d.
n.d. n.d.
0.24 0.23
n.d. n.d.
0.40 0.41
OF n.a. n.a.
n.a. n.a.
0.33 0.33
0.36 0.36
0.28 0.30
0.19 0.20
1.34 1.32
In the oat flour, it is impossible to grasp what value that is RS3 in an enzymatic treated oat flour sample (OF Enz 6) until a control oat flour is analysed to compare with (OF). This is due to that oat flour has some cell walls with b-glucan and cellu-lose that can be confused for RS3. In pure oat starch these components does not exist, therefore the glucose residues in the enzyme treated sample (OS Enz 6) show only pure RS3. There is no reason to believe that the actual content of RS3 is higher in the oat flour than in the oat starch, which is confirmed by the results above. The pure oat flour analysed for dietary fibre show that the RS3 in the oat flour is approx-imately 0.1 % while the RS3 in the oat starch is approximately 0.4 %. These values were calculated from the table, where OS Enz 6 has a value at ~0.4 %. The OF Enz

29
6 with a D-glucose value at ~1.4 % was subtracted from the pure OF sample with a value at ~1.3 %, resulting in a value at approximately 0.1 %. This means that the RS3 is not developed in the oat flour in the same extent as in oat flour and since the results only show the RS3 that can stand high temperatures, the rest of the amount of RS can be assumed to be other types of RS.

30
To increase the RS yield it is possible to use autoclaving and the temperature for autoclaving that is most optimal depends on the material (Eerlingen & Delcour, 1995). The aim in this study is to treat the flour in an industrial process and this is the reason for not using autoclaving at 120°C for 20 minutes since it is an expensive method to use. In this method, no color defect or other defect could be visualized in the flour which makes it worthwhile to study further, trying the parameters time, material amount and enzyme concentration.
The RVA method in this study shows that the yield is possible to increase when using higher temperatures, in this case 95°C is more successful than 85, 88, and 90 °C. The parameters of interest for increasing RS yield are definitely temperature, enzymatic treatment time and also storage time. When it comes to material, this study and the literature confirms, that the higher concentration of pure starch makes it easier to increase the RS yield. Also, enzyme concentration is suggesting better results with increased amount. The downside with using a lot of enzyme is that it is too expensive to use in an industrial process. Therefore, it is good to use as small amount of enzyme as possible that still shows a positive increasing effect on the RS yield. Water is another parameter that is expensive and needs to be minimized as much as possible. In this study, the water amount was high in relation to sample which is not suitable for the industry.
The mixing while using the RVA was hypothesized to be positive for the enzyme affinity, to be able to reach all material. It may be that the mixing was in a too great extent for the RS to be able to form. In a study trying to form RS by a twin-screw extruder, they could see that the RS formation had a negative correlation with in-creased screw speed (Unlu & Faller, 1998).
Another important factor to keep in mind is enzymatic treatment time. In one study 70 % of the RS formation was developed during the first 7h of enzymatic treatment (Milašinović et al., 2010). In this study only one hour enzymatic treatment was performed. The enzymatic treatment can be prolonged for further studies, even
5 Final Discussion

31
though the results should have shown the largest increase in the start of the treatment showing a trend for this to be possible.
The dietary fiber analysis showed a low amount of RS type 3 in comparison to the total RS. This may be due to that it is true in this case or that it is hard to get a representative sample from the freeze-drying method that was used.
The oat flour needs to be studied to recognize the preventing factors in this method. In further studies, it is possible to use proteases acting on protein in the flour to see if this can be a possible hurdle for RS development.
It is important to keep in mind that a risk using an enzyme is that some have side effects on other substances in the flour. In this study, the Novozyme enzyme had a degrading side effect on b-glucan, while the Diazyme enzyme only had a very small degrading side effect. Since it was a difference between Novozyme and Di-azyme pullulanase while acting on b-glucan there may be differences in the action on the starch as well. Other pullulanases derived from other microorganism can be compared in further studies to see if the action on oat starch differs.
The pure starch content in the oat starch samples (~90 %) was higher than in the oat flour samples (~72 %). Even though the RS difference between materials is too large to explain. Repeatability and preparation of samples differs too much and therefore more trials need to be performed to get more exact results of RS, even though the aim in this study was to develop a method and not to get exact values of RS.
Oat is a promising crop to the use for resistant starch production, though the methodology to develop RS is strongly dependent varying between botanical origin of the grain. According to studies oat starch does not differ much from other cereal starches when it comes to thermal properties but oat starch retrogrades faster though not in the same extent as other cereals (Chu, 2013). When doing further studies it would be useful to do treatments on wheat starch and oat starch simultaneously to be able to compare. In that case it would be possible to analyze if the results are depending on the complexity of oat or if it depends on the method.

32
It is possible to increase the RS value in oat starch and oat flour through using mois-ture, heat and cooling cycles according to this study and according to literature. The parameters of interests are temperature, enzymatic treatment time and storage time. It is important to try the enzyme for side effect since it may breakdown other sub-stances of importance.
It is clear to conclude that there is a need for more studies on oat starch and oat flour to increase the yield of RS. Enzymatic treatment with RVA gave oat flour unreliable results, therefore more studies are suggested on pure oat starch and when these show stabile results, the oat flour can be tested in regard that the values will be much lower. The prevention factors in oat flour should be tested further to figure out the mechanism behind why the RS yield was much lower than in oat starch.
When using enzymatic treatment with pullulanase on oat flour, the starch gran-ules in the samples needs to be fully gelatinized for the RS yield to increase. High enzyme concentration gives high RS yield in pure oat starch. More replicates in this study would have given more reliable results. Oat flour samples needs to be studied further regarding the preventing factors that hurdles the enzyme to degrade the reg-ular starch and create more RS.
6 Conclusion

33
Beer, M.U., Arrigoni, E. & Amado, R. (1996). Extraction of Oat Gum from Oat Bran: Effects of Process on Yield, Molecular Weight Distribution, Viscosity and (1--> 3)(1--> 4)-b-D-Glucan Content of the Gum. Cereal Chemistry, 73(1), pp. 58-62.
Brumovsky, L., Brumovsky, J., Fretes, M. & Peralta, J. (2009). Quantification of resistant starch in several starch sources treated thermally. International Journal of Food Properties, 12(3), pp. 451-460.
Buléon, A., Colonna, P., Planchot, V. & Ball, S. (1998). Starch granules: structure and biosynthesis. International Journal of Biological Macromolecules, 23(2), pp. 85-112.
Chen, L., Liu, R., Qin, C., Meng, Y. & Zhang, J. (2010). Sources and intake of resistant starch in the Chinese diet. Asia Pac J Clin Nutr, 19(2), pp. 274-282.
Chu, Y. (2013). Oats nutrition and technology: John Wiley & Sons. Cummings, J.H. & Englyst, H.N. (1991). What is dietary fibre? Trends in Food Science &
Technology, 2, pp. 99-103. Delcour, J.A. & Hoseney, R.C. (2010). Principles of Cereal Science and Technology Authors
Provide Insight into the Current State of Cereal Processing. Cereal Foods World, 55(1), pp. 21-22.
Doublier, J., Paton, D. & Llamas, G. (1987). A rheological investigation of oat starch pastes. Cereal Chemistry, 64(1), pp. 21-26.
Dundar, A.N. & Gocmen, D. (2013). Effects of autoclaving temperature and storing time on resistant starch formation and its functional and physicochemical properties. Carbohydrate Polymers, 97(2), pp. 764-771.
Eerlingen, R. & Delcour, J. (1995). Formation, analysis, structure and properties of type III enzyme resistant starch. Journal of Cereal Science, 22(2), pp. 129-138.
Eliasson, A.-C. & Gudmundsson, M. (2006). 10 Starch. Carbohydrates in food, 159, p. 391. Englyst, K., Liu, S. & Englyst, H. (2007). Nutritional characterization and measurement of dietary
carbohydrates. European Journal of Clinical Nutrition, 61, pp. S19-S39. Fuentes-Zaragoza, E., Riquelme-Navarrete, M., Sánchez-Zapata, E. & Pérez-Álvarez, J. (2010).
Resistant starch as functional ingredient: A review. Food Research International, 43(4), pp. 931-942.
Haralampu, S. (2000). Resistant starch—a review of the physical properties and biological impact of RS 3. Carbohydrate Polymers, 41(3), pp. 285-292.
Higgins, J.A., Higbee, D.R., Donahoo, W.T., Brown, I.L., Bell, M.L. & Bessesen, D.H. (2004). Resistant starch consumption promotes lipid oxidation. Nutrition & Metabolism, 1(1), p. 8.
Hii, S.L., Tan, J.S., Ling, T.C. & Ariff, A.B. (2012). Pullulanase: role in starch hydrolysis and potential industrial applications. Enzyme Research, 2012.
Hoover, R. & Vasanthan, T. (1992). Studies on isolation and characterization of starch from oat (Avena nuda) grains. Carbohydrate Polymers, 19(4), pp. 285-297.
Jyothsna, E. & Hymavathi, T. (2017). Resistant starch: Importance, categories, food sources and physiological effects. Journal of Pharmacognosy and Phytochemistry, 6(2), pp. 67-69.
Keenan, M.J., Zhou, J., Hegsted, M., Pelkman, C., Durham, H.A., Coulon, D.B. & Martin, R.J. (2015). Role of resistant starch in improving gut health, adiposity, and insulin resistance. Advances in Nutrition: An International Review Journal, 6(2), pp. 198-205.
References

34
Krueger, B., Knutson, C., Inglett, G. & Walker, C. (1987). A differential scanning calorimetry study on the effect of annealing on gelatinization behavior of corn starch. Journal of Food Science, 52(3), pp. 715-718.
Kulp, K. (2000). Handbook of Cereal Science and Technology, Second Edition, Revised and Expanded: Taylor & Francis. Available from: https://books.google.se/books?id=gtqEWcA73BEC.
Lehmann, U. & Robin, F. (2007). Slowly digestible starch–its structure and health implications: a review. Trends in Food Science & Technology, 18(7), pp. 346-355.
Lockyer, S. & Nugent, A. (2017). Health effects of resistant starch. Nutrition Bulletin. MacArthur, L. & D'appolonia, B. (1979). Comparison of oat and wheat carbohydrates. II. Starch.
Cereal Chemistry, 56(5), pp. 458-461. Milašinović, M.S., Radosavljević, M.M. & Dokić, L.P. (2010). Effects of autoclaving and
pullulanase debranching on the resistant starch yield of normal maize starch. Journal of the Serbian Chemical Society, 75(4), pp. 449-458.
Mudgil, D. & Barak, S. (2013). Composition, properties and health benefits of indigestible carbohydrate polymers as dietary fiber: a review. International Journal of Biological Macromolecules, 61, pp. 1-6.
Muir, J.G. & O'dea, K. (1992). Measurement of resistant starch: factors affecting the amount of starch escaping digestion in vitro. The American Journal of Clinical Nutrition, 56(1), pp. 123-127.
Niba, L.L. (2003). Effect of storage period and temperature on resistant starch and β-glucan content in cornbread. Food Chemistry, 83(4), pp. 493-498.
Paes, S.S., Yakimets, I. & Mitchell, J.R. (2008). Influence of gelatinization process on functional properties of cassava starch films. Food Hydrocolloids, 22(5), pp. 788-797.
Sharma, A., Yadav, B.S. & Ritika (2008). Resistant starch: physiological roles and food applications. Food Reviews International, 24(2), pp. 193-234.
Sievert, D. & Pomeranz, Y. (1989). Enzyme-resistant starch. I. Characterization and evaluation by enzymatic, thermoanalytical, and microscopic methods. Cereal Chemistry, 66(4), pp. 342-347.
Silano, V., Bolognesi, C., Castle, L., Cravedi, J.P., Fowler, P., Franz, R., Grob, K., Gürtler, R., Husøy, T. & Kärenlampi, S. (2017). Safety evaluation of the food enzyme pullulanase from genetically modified Bacillus subtilis strain NZYM-AK. EFSA Journal, 15(8).
Smith, A.M. (2001). The biosynthesis of starch granules. Biomacromolecules, 2(2), pp. 335-341. Stute, R. (1992). Hydrothermal Modification of Starches - the Difference between Annealing and
Heat Moisture-Treatment. Starch-Starke, 44(6), pp. 205-214. Thompson, D.B. (2000). Strategies for the manufacture of resistant starch. Trends in Food Science &
Technology, 11(7), pp. 245-253. Topping, D.L. & Clifton, P.M. (2001). Short-chain fatty acids and human colonic function: Roles of
resistant starch and nonstarch polysaccharides. Physiological Reviews, 81(3), pp. 1031-1064.
Unlu, E. & Faller, J.F. (1998). Formation of resistant starch by a twin-screw extruder. Cereal Chemistry, 75(3), pp. 346-350.
Zavareze, E.D. & Dias, A.R.G. (2011). Impact of heat-moisture treatment and annealing in starches A review. Carbohydrate Polymers, 83(2), pp. 317-328.
Zhou, M.X., Robards, K., Glennie-Holmes, M. & Helliwell, S. (1998). Structure and pasting properties of oat starch. Cereal Chemistry, 75(3), pp. 273-281.
Zhu, F. (2017). Structures, properties, modifications, and uses of oat starch. Food Chemistry.

35
020406080100
-1000 0
1000200030004000
0 5 10 15Te
mpe
ratu
re (°
C)
Visc
osity
(cP)
Time (min)
Oat Starch STD1 95°C
Visc(cP) Temp(C)
0
50
100
150
0
1000
2000
3000
0 5 10 15
Tem
pere
atur
e (°
C)
Visc
osity
(cP)
Time (min)
Oat Flour STD1 95°C
Visc(cP) Temp(C)
0
20
40
60
80
100
-500 0
5001000150020002500
0 10 20 Tem
pera
ture
(°C
)
Visc
osity
(cP)
Time (min)
Oat Starch STD 1 90 (A)
Visc(cP) Temp©
0
50
100
0500
100015002000
0 5 10 15
Tem
pera
ture
(°C
)
Visc
osity
(cP)
Time (sec)
Oat flour STD1 90°C
Visc(cP) Temp(C)
020406080100
0
1000
2000
3000
0 10 20 Tem
pera
ture
(°C
)
Visc
osity
(cP)
Time (min)
Oat Starch STD1 90°C (B)
Visc(cP) Temp(C)
Appendix 1: RVA treatment figures

36
0
20
40
60
80
100
-500
0
500
1000
1500
0 10 20 Tem
pera
ture
(°C
)
Visc
osity
(cP)
Time (min)
Oat Starch STD1 88°C
Visc(cP) Temp(C)
0
20
40
60
80
100
-500
0
500
1000
0 20
Tem
pera
ture
(°C
)
Visc
osity
(cP)
Time (min)
Oat Flour STD1 88°C
Visc(cP) Temp(C)
0
20
40
60
80
100
-100 0
100
200
300
400
0 10 20 Tem
pera
ture
(°C
)
Visc
osity
(cP)
Time (min)
Oat starch STD1 85°C
Visc(cP) Temp(C)
020406080100
0
50
100
150
200
0 10 20
Viis
cosi
ty (c
P)
Time (min)
Oat flour STD1 85°C
Visc(cP) Temp(C)
020406080100
0500
1000150020002500
0 10 20 30 40 50 60
Tem
pera
ture
(°C
)
Visc
osity
(cP)
Time (min)
Oat Starch Enzyme 2
Visc(cP) Temp(C)

37
020406080100
0
1000
2000
3000
0 50 100
Tem
pera
ture
(°C)
Visc
osity
(cP)
Time (min)
Oat Starch Enzyme 3
Visc(cP) Temp(C)
0
50
100
150
-2000
0
2000
4000
6000
0 20 40 60 80 100
Tem
pera
ture
(°C)
Visc
osity
(cP)
Time (min)
Oat Starch Enzyme 4
Visc(cP) Temp(C)
0
50
100
150
0
2000
4000
6000
8000
0 50 100 Tem
pera
ture
(°C)
Visc
osity
(cP)
Time (min)
Oat Strach Enzyme 5
Visc(cP) Temp(C)

38
020406080100120
-1000 0
10002000300040005000
0 50 100 Tem
pera
ture
(°C)
Visc
osity
(cP)
Time (min)
Oat Starch Enzyme 6
Visc(cP) Temp(C)
050100150
0200040006000
0 20 40 60 80 100
Tem
pera
ture
(°C)
Visc
osity
(cP)
Time (min)
Oat Starch Enzyme 7
Serie1 Serie2
020406080100
0500
10001500200025003000
0 20 40 60 Tem
pera
ture
(°C
)
Visc
osity
(cP)
Time (min)
Oat Flour Enzyme 1
Visc(cP) Temp(C)

39
0
50
100
0
1000
2000
3000
0 50 100 150
Tem
pera
ture
(°C)
Visc
osity
(cP)
Time (min)
Oat Flour Enzyme 2
Visc(cP) Temp(C)
020406080100120
0100020003000400050006000
0 20 40 60
Tem
pera
ture
(°C
)
Visc
osity
(cp)
Time (min)
Oat Flour Enzyme 3
Visc(cP) Temp(C)
0
50
100
150
-1000 0
1000200030004000
0 50 100 Tem
pera
ture
(°C)
Visc
osity
(cP)
Time (min)
Oat Flour Enzyme 4
Visc(cP) Temp(C)

40
0
50
100
150
02000400060008000
0 50 100 Tem
pera
ture
(°C)
Visc
osity
(cP)
Time (min)
Oat Flour Enzyme 5
Visc(cP) Temp(C)
0
50
100
150
0
1000
2000
3000
0 50 100
Tem
pera
ture
(°C)
Visc
osity
(cP)
Time (min)
Oat Flour Enzyme 6
Visc(cP) Temp(C)
0
50
100
150
0
2000
4000
6000
0 50 100 Tem
pere
atur
e (°
C)
Visc
osity
(cP)
Time (min)
Oat Flour Enzyme 7
Visc(cP) Temp(C)

41
Appendix 2: Pullulanase enzymes

42

43
Appendix 3: Oat flour composition
44
Appendix 4: Megazyme resistant starch assay procedure

45

46

47

48
49
Appendix 5: Popular scientific summary Enzymatic treatment to increase resistant starch in oat flour – an investigation for industrial use Oat has been established as a useful crop hundreds of years ago all over the world. Oat contains starch which consists of compound shaped like balls built out of am-ylose and amylopectin. Some of the starch can be resistant depending on grain, grade of maturation etc. Starch can be modified by heat and moisture treatment or enzymatic treatments to increase the yield of resistant starch. The food production enzyme pullulanase has the function of debranching the starch molecules into straight chains that have larger opportunity to be transformed into resistant starch. Resistant starch is defined as starch, or products from starch that is resistant towards digestion and absorption in the small intestine in healthy humans and instead it can be fermented in the large intestine. Resistant starch occurs in 4 types depending on process or origin and these are known to have beneficial health effects. When re-sistant starch is fermented in the large intestine short chain fatty acids, such as bu-tyrate, propionate and acetate are created as a product. These short chained fatty acids are proved to stimulate the blood flow in the colon, gives energy to the cells in the intestine and also stimulate electrolyte uptake etc. The aim of this study was to increase the yield of resistant starch in an oat flour residue from the company Lantmännen to be able to use it as a food product with a healthy approach. To be able to adapt the method in an industrial scale, a Rapid visco analyzer (RVA) was used since it is suitable for experiments on small sample size that can be translated into larger scale. The RVA measures the relative viscosity of starch in water when exposed to controlled shear rates, controlled heating/cooling and controlled time settings. The results were analyzed in a light microscope and the RS content was analyzed with a Megazyme Resistant Starch Assay Procedure. The results showed that the parameters for increasing resistant starch using a RVA was difficult to comprehend. The oat starch samples showed a decisive increase in resistant starch in comparison to oat flour. The method did not show any specific trend in the oat flour samples since the resistant starch content was too low to conclude anything. In oat starch samples, it was indicated a trend that the more enzyme added the higher yield of resistant starch you get. The amount of material didn’t show any trend. Further re-search is needed to see if it is potential to increase the resistant starch yield in oat flour.

50